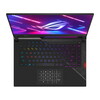
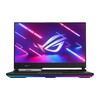
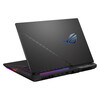
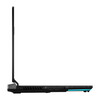
Asus ROG Strix Scar 15 G533zm incelemesi: Birçok güçlü yöne sahip modern RTX 3060 dizüstü oyun bilgisayarı

Şu anda test için elimizde Asus ROG Strix Scar 15'in iki modeli mevcut. Bu makale şu konulara odaklanacaktır RTX 3060 versiyonu incelenirken RTX 3070 Ti modeli paralel olarak yayınlanacaktır. RTX 3060'ın yanı sıra SKU'muz güçlü bir Alder Lake ile donatılmıştır i9-12900H CPU, 16 GB RAM ve 240Hz QHD ekran.
Geçen yıl, bir önceki raporu gözden geçirdik Yara 15 bir RTX 3080bu nedenle inceleme birimimizi RTX 3070 Ti kardeşiyle karşılaştırmak daha mantıklı. Ayrıca, karşılaştırmamıza aynı GPU'ya sahip diğer 15 inç oyun dizüstü bilgisayarlarını da dahil etmeyi tercih ettik, örneğin Asus TUF Gaming F15, the MSI Pulse GL66 ve Alienware m15 R5. Her ne kadar karşılaştırma aynı zamanda Lenovo Legion 5 ile Radeon RX6600Mbu dizüstü bilgisayar Strix Scar ile aynı fiyat aralığında değildir, çünkü inceleme konfigürasyonumuzun fiyatı yaklaşık 2.000 € (2.170 ABD Doları) iken Legion 1.000 €'nun (1.085 ABD Doları) biraz üzerindedir.
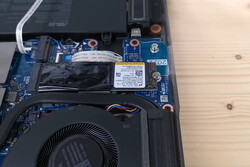
Şasi, bakım, giriş cihazları ve daha fazlası hakkında bölümler için lütfen rTX 3070 Ti ile Asus ROG Strix Scar'ın ana incelemesi.
Karşılaştırılan olası alternatifler
Derecelendirme | Tarih | Modeli | Ağırlık | Yükseklik | Boyut | Çözünürlük | Fiyat |
|---|---|---|---|---|---|---|---|
| 89.2 % v7 (old) | 11/2024 | Asus ROG Strix Scar 15 G533zm i9-12900H, GeForce RTX 3060 Laptop GPU | 2.3 kg | 27.2 mm | 15.60" | 2560x1440 | |
| 86.3 % v7 (old) | 05/2022 | Asus ROG Strix Scar 15 G533ZW-LN106WS i9-12900H, GeForce RTX 3070 Ti Laptop GPU | 2.3 kg | 27.2 mm | 15.60" | 2560x1440 | |
| 87.2 % v7 (old) | 06/2022 | Asus TUF Gaming F15 FX507ZM i7-12700H, GeForce RTX 3060 Laptop GPU | 2.1 kg | 24.95 mm | 15.60" | 1920x1080 | |
| 80.7 % v7 (old) | 09/2022 | MSI Pulse GL66 12UEK i9-12900H, GeForce RTX 3060 Laptop GPU | 2.3 kg | 25 mm | 15.60" | 1920x1080 | |
| 84.7 % v7 (old) | Alienware m15 R5 Ryzen Edition R7 5800H, GeForce RTX 3060 Laptop GPU | 2.5 kg | 22.85 mm | 15.60" | 1920x1080 | ||
| 82.6 % v7 (old) | Lenovo Legion 5 15ACH6A-82NW0010GE R5 5600H, Radeon RX 6600M | 2.5 kg | 25.75 mm | 15.60" | 1920x1080 |
Top 10
» Top 10 Multimedia Notebook listesi
» Top 10 oyun notebooku
» Top 10 bütçeye uygun Ofis/İş Notebook Listesi
» Top 10 Premium Ofis/İş notebookları
» Top 10 Çalışma istasyonu laptopları
» Top 10 Subnotebook listesi
» Top 10 Ultrabooklar
» En iyi 10 dönüştürülebilir modeli
» Seçimi en iyi 10 tablet
» Notebookcheck Top 10 Windows Tabletleri
» Top 10 Subnotebook listesi
» NotebookCheck tarafından incelenen en iyi Notebook ekranları
» Notebookcheck'in 500 Euro altındaki en iyi 10 Notebook listesi
» NotebookCheck tarafından seçilen 300 Euro altındaki en iyi 10 Notebook
» Notebookcheck'in 500 Euro altındaki en iyi 10 Notebook listesi
» Notebookcheck'in Top 10 akıllı telefon listesi
» Notebookcheck'in Top 10 hafif oyun notebookları
Kasa - Çekici dizüstü oyun bilgisayarı tasarımı
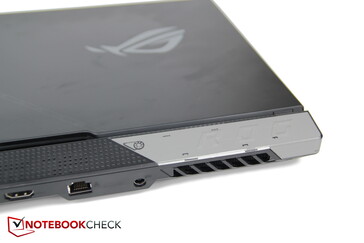
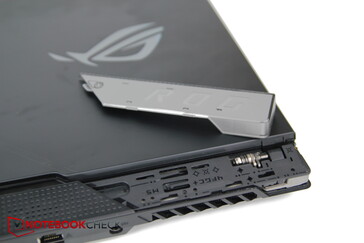
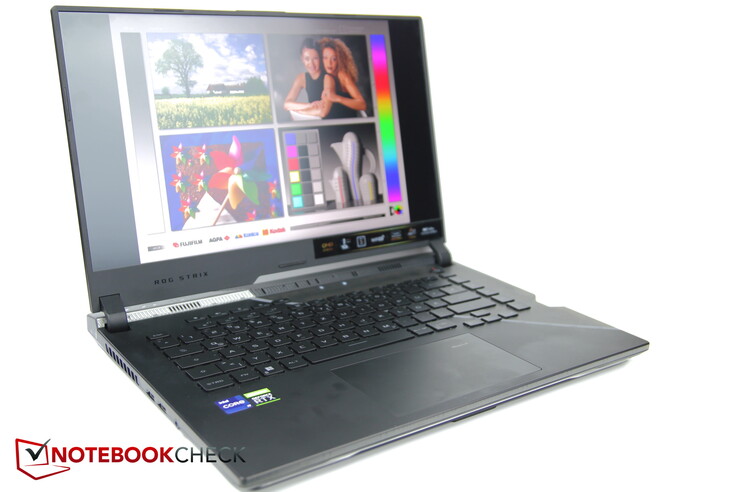
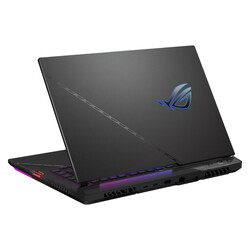
Oldukça benzersiz bir tasarım felsefesi ROG Scar'ın tamamına nüfuz ederek onu oyuncular için çekici bir dizüstü bilgisayar haline getiriyor. Çapraz çizgiler, arka kapakta değiştirilebilir bir plaka, ince renk vurguları ve RGB öğeleri ile üretici, yanıp sönen ve parlayan aşırı cafcaflı aydınlatma olmadan farklı bir oyun stili yarattı.
Örneğin, tüm ön kısım boyunca uzanan bir ışık şeridi var, ancak hafifçe girintili olduğundan daha az belirgin hissettiriyor. Bu ışık şeridi aynı zamanda klavye ve üst taraftaki ROG logosu ile senkronize edilebiliyor.
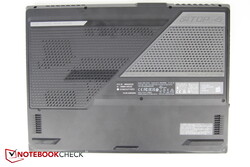
Alt kısımda, ağırlıklı olarak siyah olan kasaya kontrast katan geniş, parlak renkli kauçuk ayaklar bulunuyor.
Neredeyse tamamen plastik yapısına rağmen Strix Scar 15 oldukça sağlam bir his veriyor. Ekran büküldüğünde herhangi bir ses çıkarmazken, taban bölümü sadece hafifçe gıcırdıyor.
Ekran iki menteşe tarafından güvenli bir şekilde yerinde tutuluyor ve hareket ettirildiğinde neredeyse hiç sallanmıyor.
Boyut karşılaştırması
Genel olarak, Scar 15 marjinal olarak daha kalındır, ancak bazı rakiplerinden bir miktar daha küçüktür. Ayrıca nispeten hafiftir; örneğin, Alienware ve Legion modelleri daha ağırdır ve yalnızca TUF Gaming F15 biraz daha hafiftir.
Özellikler - Thunderbolt 4, Keystone, ancak Web Kamerası yok
Strix, biri Thunderbolt 4'ü destekleyen ve diğeri USB 3.2 Gen 2 hızlarına sahip iki USB-C bağlantı noktası ile donatılmıştır; her ikisi de DisplayPort işlevselliği sunar. Bu da dizüstü bilgisayarın oldukça modern özelliklere sahip olduğunu gösteriyor. G/Ç'ler cihazın sol tarafına ve arkasına iyi bir şekilde dağıtılmış.
Sağ tarafta yalnızca bir Keystone yuvası bulunuyor. Keystone bir nevi küçük bir depolama cihazı ve anahtar gibidir. Örneğin, ayarları saklamak ve bu özelliği destekleyen dizüstü bilgisayarlara aktarmak için kullanılabilir (uyumlu modellerin bir listesi Asus tarafından sağlanmıştır). Ayrıca Strix Scar'da bir güvenlik anahtarı olarak da işlev görebilir: yapılandırıldıktan sonra dizüstü bilgisayar yalnızca Keystone takılıyken açılır. Bir başka uygulama da programlara hızlı erişim sağlamaktır. Kullanıcılar, Keystone takılı olduğunda dizüstü bilgisayara oyun gibi belirli bir programı otomatik olarak açması talimatını verebilir. Dizüstü bilgisayar ayrıca yüksek performanslı fan moduna geçmek ve Cyberpunk'ı aynı anda başlatmak gibi bir dizi eylemi bir arada gerçekleştirecek şekilde programlanabilir. Seçim kullanıcının elindedir.
Bununla birlikte, Asus cihazında bir şey eksik - bir web kamerası. Bu da Scar Strix'i web kamerası olmayan birkaç (oyun) dizüstü bilgisayardan biri yapıyor.
Bağlanabilirlik
| Networking | |
| iperf3 transmit AX12 | |
| Alienware m15 R5 Ryzen Edition | |
| Ortalama Intel Wi-Fi 6E AX211 (1003 - 1501, n=4) | |
| Asus TUF Gaming F15 FX507ZM | |
| Lenovo Legion 5 15ACH6A-82NW0010GE | |
| MSI Pulse GL66 12UEK | |
| iperf3 receive AX12 | |
| Asus TUF Gaming F15 FX507ZM | |
| Ortalama Intel Wi-Fi 6E AX211 (1178 - 1623, n=4) | |
| Alienware m15 R5 Ryzen Edition | |
| Lenovo Legion 5 15ACH6A-82NW0010GE | |
| MSI Pulse GL66 12UEK | |
| iperf3 receive AXE11000 6GHz | |
| Asus ROG Strix Scar 15 G533ZW-LN106WS | |
| Asus ROG Strix Scar 15 G533zm | |
| Ortalama Intel Wi-Fi 6E AX211 (700 - 1857, n=217) | |
| Sınıf ortalaması Gaming (853 - 1788, n=56, son 2 yıl) | |
| iperf3 transmit AXE11000 6GHz | |
| Asus ROG Strix Scar 15 G533ZW-LN106WS | |
| Sınıf ortalaması Gaming (648 - 2355, n=56, son 2 yıl) | |
| Asus ROG Strix Scar 15 G533zm | |
| Ortalama Intel Wi-Fi 6E AX211 (385 - 1851, n=217) | |
Giriş aygıtları - Touchpad düğmesi hafifçe sıkışabilir
Dokunmatik yüzey
Ekran - 240Hz ve Dolby Vision Atmos özellikli QHD
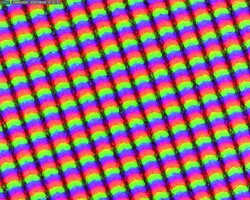
BOE tarafından üretilen QHD IPS ekran (2.560 x 1.440 piksel) oldukça hızlı tepki sürelerine, 240Hz'lik yüksek yenileme hızına ve neredeyse tüm sRGB ve AdobeRGB gamlarını yeniden üretebilen mükemmel renk kapsamına sahiptir.
Panel ortalama 300 nit tepe parlaklığına ve %89 gibi oldukça iyi bir parlaklık dağılımına sahip. Bununla birlikte, siyah seviyesi ve kontrastı oldukça ortalama.
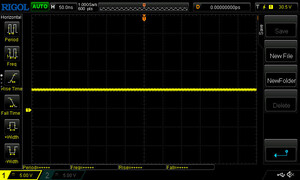
Dizüstü bilgisayar parlaklığı ayarlamak için PWM kullanmıyor ve sadece çok az miktarda ekran akması var.
| |||||||||||||||||||||||||
Aydınlatma: 89 %
Batarya modunda parlaklık: 357 cd/m²
Kontrast: 1026:1 (Siyah: 0.34 cd/m²)
ΔE Color 3.44 | 0.5-29.43 Ø4.87, calibrated: 2.43
ΔE Greyscale 3.34 | 0.5-98 Ø5.1
84.1% AdobeRGB 1998 (Argyll 2.2.0 3D)
99.6% sRGB (Argyll 2.2.0 3D)
95% Display P3 (Argyll 2.2.0 3D)
Gamma: 2.5
| Asus ROG Strix Scar 15 G533zm BOE CQ NE156QHM-NZ2 (BOE0A55), IPS, 2560x1440, 15.6" | Asus ROG Strix Scar 15 G533ZW-LN106WS BOE CQ NE156QHM-NZ2, IPS-level, 2560x1440, 15.6" | Asus TUF Gaming F15 FX507ZM TL156VDXP0101, IPS, 1920x1080, 15.6" | MSI Pulse GL66 12UEK AU Optronics B156HAN08.4 (AUOAF90), IPS, 1920x1080, 15.6" | Alienware m15 R5 Ryzen Edition B156HAN, IPS, 1920x1080, 15.6" | Lenovo Legion 5 15ACH6A-82NW0010GE LGD06A5, IPS, 1920x1080, 15.6" | |
|---|---|---|---|---|---|---|
| Display | 0% | -17% | -51% | -13% | ||
| Display P3 Coverage | 95 | 96.2 1% | 66.4 -30% | 39 -59% | 71.1 -25% | |
| sRGB Coverage | 99.6 | 99.9 0% | 97 -3% | 58.4 -41% | 99.1 -1% | |
| AdobeRGB 1998 Coverage | 84.1 | 84.5 0% | 68.5 -19% | 40.3 -52% | 72.3 -14% | |
| Response Times | 14% | -4% | -333% | 30% | -45% | |
| Response Time Grey 50% / Grey 80% * | 6.4 ? | 7.86 ? -23% 4.21 ? 34% | 5.6 ? 12% | 38.8 ? -506% | 4 ? 37% | 15 ? -134% |
| Response Time Black / White * | 10.8 ? | 7.5 ? 31% | 12.8 ? -19% | 28 ? -159% | 8.4 ? 22% | 6 ? 44% |
| PWM Frequency | ||||||
| Screen | -14% | 23% | 15% | 14% | 2% | |
| Brightness middle | 349 | 346 -1% | 353.7 1% | 248 -29% | 329 -6% | 371 6% |
| Brightness | 333 | 329 -1% | 340 2% | 245 -26% | 321 -4% | 328 -2% |
| Brightness Distribution | 89 | 91 2% | 89 0% | 86 -3% | 92 3% | 85 -4% |
| Black Level * | 0.34 | 0.59 -74% | 0.34 -0% | 0.13 62% | 0.27 21% | 0.32 6% |
| Contrast | 1026 | 586 -43% | 1040 1% | 1908 86% | 1219 19% | 1159 13% |
| Colorchecker dE 2000 * | 3.44 | 3.06 11% | 1.74 49% | 3.14 9% | 2.78 19% | 3.25 6% |
| Colorchecker dE 2000 max. * | 5.78 | 5.81 -1% | 3.63 37% | 5.82 -1% | 4.88 16% | 6.33 -10% |
| Colorchecker dE 2000 calibrated * | 2.43 | 2.57 -6% | 0.5 79% | 3.14 -29% | 1.63 33% | 1.11 54% |
| Greyscale dE 2000 * | 3.34 | 2.1 37% | 1.2 64% | 2.5 25% | 4.94 -48% | |
| Gamma | 2.5 88% | 2.12 104% | 2.3 96% | 2.49 88% | 2.106 104% | 2.45 90% |
| CCT | 6641 98% | 7021 93% | 6257 104% | 6468 100% | 6201 105% | 6064 107% |
| Color Space (Percent of AdobeRGB 1998) | 76 | |||||
| Color Space (Percent of sRGB) | 99 | |||||
| Toplam Ortalama (Program / Ayarlar) | 0% /
-5% | 1% /
11% | -123% /
-49% | 22% /
17% | -19% /
-8% |
* ... daha küçük daha iyidir
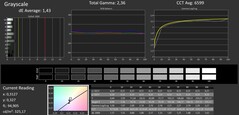
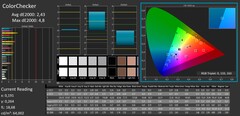
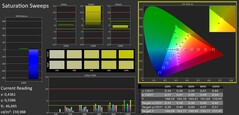
Portrait Displays'in Calman renk kalibrasyon aracını kullanarak, ekranın daha turuncumsu bir renk tonuna sahip olduğu, kutudan çıkar çıkmaz normal ila orta dereceli renk farklılıkları ölçtük. Kalibrasyonumuz sayesinde renk farklılıklarını önemli ölçüde azaltmayı başardık.
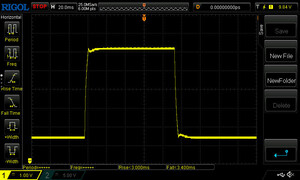
Yanıt Sürelerini Görüntüle
| ↔ Tepki Süresi Siyahtan Beyaza | ||
|---|---|---|
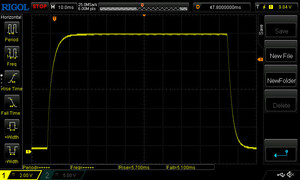
| 10.8 ms ... yükseliş ↗ ve sonbahar↘ birleşimi | ↗ 5.7 ms yükseliş | |
| ↘ 5.1 ms sonbahar | ||
| Ekran, testlerimizde iyi yanıt oranları gösteriyor ancak rekabetçi oyuncular için çok yavaş olabilir. Karşılaştırıldığında, test edilen tüm cihazlar 0.1 (minimum) ile 240 (maksimum) ms arasında değişir. » Tüm cihazların 26 %'si daha iyi. Bu, ölçülen yanıt süresinin test edilen tüm cihazların ortalamasından (20.8 ms) daha iyi olduğu anlamına gelir. | ||
| ↔ Tepki Süresi %50 Griden %80 Griye | ||
| 6.4 ms ... yükseliş ↗ ve sonbahar↘ birleşimi | ↗ 3 ms yükseliş | |
| ↘ 3.4 ms sonbahar | ||
| Ekran, testlerimizde çok hızlı yanıt oranları gösteriyor ve hızlı oyun oynamaya çok uygun olmalı. Karşılaştırıldığında, test edilen tüm cihazlar 0.165 (minimum) ile 636 (maksimum) ms arasında değişir. » Tüm cihazların 16 %'si daha iyi. Bu, ölçülen yanıt süresinin test edilen tüm cihazların ortalamasından (32.5 ms) daha iyi olduğu anlamına gelir. | ||
Ekran Titremesi / PWM (Darbe Genişliği Modülasyonu)
| Ekran titriyor / PWM algılanmadı | |||
Karşılaştırıldığında: Test edilen tüm cihazların %53 %'si ekranı karartmak için PWM kullanmıyor. PWM tespit edilirse, ortalama 8516 (minimum: 5 - maksimum: 343500) Hz ölçüldü. | |||
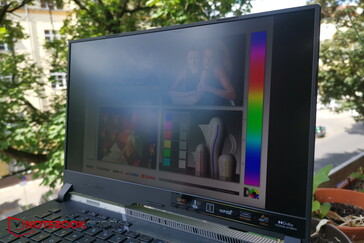
Ekranın mat yüzeyi ve sağlam parlaklık seviyeleri sayesinde, ekran içerikleri dış mekanda gölgede bile okunabilir. Bununla birlikte, ideal olarak doğrudan güneş ışığından kaçınmalı ve ekranı başınızın üzerinde görmeye çalışmalısınız.
Performans - 140W RTX 3060 ile iyi oyun performansı
Bu Core i9-12900H donanım sınıfının en iyileri arasındadır. Her ne kadar RTX 3060 fHD'de tüm oyunların üstesinden gelebilmelidir, ancak ekranın doğal QHD çözünürlüğünde çok zorlu oyunlarla mücadele edebilir. Asus ayrıca yüksek hızlı DDR5 RAM de eklemiştir. Genel olarak Strix Scar, bazı fotoğraf ve video editörlerinin de çekici bulabileceği üst orta sınıf bir oyun dizüstü bilgisayarıdır.
Test koşulları
Bize göre Asus yazılım konusunda aşırıya kaçmış durumda. Asus oyun dizüstü bilgisayarları, normal dizüstü bilgisayarlarında da önceden yüklenmiş olan MyASUS programının üzerine Armoury Crate yazılımı ile birlikte gönderilir. Armoury Crate fan ve performans profillerini ayarlamanıza olanak tanıyor ve testlerimizde mümkün olan en iyi benchmark sonuçlarını elde etmek için Turbo modunu kullandık. Öte yandan MyASUS, pilin şarj davranışı, Wi-Fi seçenekleri ve müşteri desteğiyle iletişim kurma yolları için ayarlar içeriyor. Asus'un müşterileri için gereksiz yazılım yükünden kaçınmak için iki programı birleştirmeyi düşünmesi faydalı olabilir.
İşlemci
Asus, modellerin çoğunu üst düzey teknolojiyle donatmayı tercih etti Intel Core i9-12900Haynı anda 20 iş parçacığını idare edebilen 6 Performans (P) ve 8 Verimlilik (E) çekirdeğine sahiptir. Her bir P-çekirdeği 5 GHz'e kadar çalışabilir. Hem Strix G533zm hem de G533zw biraz daha az güçlü olan i7-12700H.
Cinebench R15 döngü testimizde, CPU beklendiği gibi mükemmel performans gösterdi ve hem Asus TUF Gaming F15'teki i7-12700H'yi hem de önceki nesil Ryzen yongalarını geride bıraktı. Sadece Cinebench R20'de tekrarlanabilir bir şekilde geride kaldı.
Pil gücüne geçmek Cinebench R15 skorunun 1.752'ye düşmesine neden oldu.
Cinebench R15 Multi sustained load
Cinebench R23: Multi Core | Single Core
Cinebench R20: CPU (Multi Core) | CPU (Single Core)
Cinebench R15: CPU Multi 64Bit | CPU Single 64Bit
Blender: v2.79 BMW27 CPU
7-Zip 18.03: 7z b 4 | 7z b 4 -mmt1
Geekbench 5.5: Multi-Core | Single-Core
HWBOT x265 Benchmark v2.2: 4k Preset
LibreOffice : 20 Documents To PDF
R Benchmark 2.5: Overall mean
| CPU Performance Rating | |
| Sınıf ortalaması Gaming | |
| Asus ROG Strix Scar 15 G533ZW-LN106WS | |
| Asus ROG Strix Scar 15 G533zm | |
| MSI Pulse GL66 12UEK | |
| Asus TUF Gaming F15 FX507ZM | |
| Ortalama Intel Core i9-12900H | |
| Alienware m15 R5 Ryzen Edition | |
| Lenovo Legion 5 15ACH6A-82NW0010GE | |
| Cinebench R23 / Multi Core | |
| Sınıf ortalaması Gaming (5668 - 39652, n=152, son 2 yıl) | |
| Asus ROG Strix Scar 15 G533ZW-LN106WS | |
| Asus TUF Gaming F15 FX507ZM | |
| MSI Pulse GL66 12UEK | |
| Asus ROG Strix Scar 15 G533zm | |
| Ortalama Intel Core i9-12900H (7359 - 19648, n=28) | |
| Alienware m15 R5 Ryzen Edition | |
| Lenovo Legion 5 15ACH6A-82NW0010GE | |
| Cinebench R23 / Single Core | |
| Asus ROG Strix Scar 15 G533ZW-LN106WS | |
| MSI Pulse GL66 12UEK | |
| Sınıf ortalaması Gaming (1136 - 2252, n=152, son 2 yıl) | |
| Ortalama Intel Core i9-12900H (1634 - 1930, n=28) | |
| Asus ROG Strix Scar 15 G533zm | |
| Asus TUF Gaming F15 FX507ZM | |
| Alienware m15 R5 Ryzen Edition | |
| Lenovo Legion 5 15ACH6A-82NW0010GE | |
| Cinebench R20 / CPU (Multi Core) | |
| Sınıf ortalaması Gaming (2179 - 15517, n=152, son 2 yıl) | |
| Asus ROG Strix Scar 15 G533ZW-LN106WS | |
| Asus TUF Gaming F15 FX507ZM | |
| MSI Pulse GL66 12UEK | |
| Ortalama Intel Core i9-12900H (2681 - 7471, n=28) | |
| Asus ROG Strix Scar 15 G533zm | |
| Alienware m15 R5 Ryzen Edition | |
| Lenovo Legion 5 15ACH6A-82NW0010GE | |
| Cinebench R20 / CPU (Single Core) | |
| MSI Pulse GL66 12UEK | |
| Asus ROG Strix Scar 15 G533zm | |
| Asus ROG Strix Scar 15 G533ZW-LN106WS | |
| Sınıf ortalaması Gaming (439 - 866, n=152, son 2 yıl) | |
| Ortalama Intel Core i9-12900H (624 - 738, n=28) | |
| Asus TUF Gaming F15 FX507ZM | |
| Alienware m15 R5 Ryzen Edition | |
| Lenovo Legion 5 15ACH6A-82NW0010GE | |
| Cinebench R15 / CPU Multi 64Bit | |
| Sınıf ortalaması Gaming (905 - 6074, n=155, son 2 yıl) | |
| Asus ROG Strix Scar 15 G533zm | |
| Asus ROG Strix Scar 15 G533ZW-LN106WS | |
| Asus TUF Gaming F15 FX507ZM | |
| MSI Pulse GL66 12UEK | |
| Ortalama Intel Core i9-12900H (1395 - 3077, n=28) | |
| Alienware m15 R5 Ryzen Edition | |
| Lenovo Legion 5 15ACH6A-82NW0010GE | |
| Cinebench R15 / CPU Single 64Bit | |
| MSI Pulse GL66 12UEK | |
| Sınıf ortalaması Gaming (191.9 - 343, n=152, son 2 yıl) | |
| Asus ROG Strix Scar 15 G533zm | |
| Asus ROG Strix Scar 15 G533ZW-LN106WS | |
| Ortalama Intel Core i9-12900H (235 - 277, n=29) | |
| Asus TUF Gaming F15 FX507ZM | |
| Alienware m15 R5 Ryzen Edition | |
| Lenovo Legion 5 15ACH6A-82NW0010GE | |
| Blender / v2.79 BMW27 CPU | |
| Lenovo Legion 5 15ACH6A-82NW0010GE | |
| Alienware m15 R5 Ryzen Edition | |
| Ortalama Intel Core i9-12900H (160 - 451, n=28) | |
| MSI Pulse GL66 12UEK | |
| Asus TUF Gaming F15 FX507ZM | |
| Sınıf ortalaması Gaming (81 - 555, n=145, son 2 yıl) | |
| Asus ROG Strix Scar 15 G533ZW-LN106WS | |
| Asus ROG Strix Scar 15 G533zm | |
| 7-Zip 18.03 / 7z b 4 | |
| Sınıf ortalaması Gaming (23795 - 144064, n=150, son 2 yıl) | |
| Asus ROG Strix Scar 15 G533zm | |
| Asus ROG Strix Scar 15 G533ZW-LN106WS | |
| Asus TUF Gaming F15 FX507ZM | |
| MSI Pulse GL66 12UEK | |
| Ortalama Intel Core i9-12900H (34684 - 76677, n=28) | |
| Alienware m15 R5 Ryzen Edition | |
| Lenovo Legion 5 15ACH6A-82NW0010GE | |
| 7-Zip 18.03 / 7z b 4 -mmt1 | |
| Sınıf ortalaması Gaming (4199 - 7573, n=150, son 2 yıl) | |
| MSI Pulse GL66 12UEK | |
| Asus ROG Strix Scar 15 G533zm | |
| Asus ROG Strix Scar 15 G533ZW-LN106WS | |
| Ortalama Intel Core i9-12900H (5302 - 6289, n=28) | |
| Alienware m15 R5 Ryzen Edition | |
| Asus TUF Gaming F15 FX507ZM | |
| Lenovo Legion 5 15ACH6A-82NW0010GE | |
| Geekbench 5.5 / Multi-Core | |
| Sınıf ortalaması Gaming (4557 - 25855, n=149, son 2 yıl) | |
| Asus ROG Strix Scar 15 G533ZW-LN106WS | |
| Asus ROG Strix Scar 15 G533zm | |
| Asus TUF Gaming F15 FX507ZM | |
| Ortalama Intel Core i9-12900H (8519 - 14376, n=31) | |
| MSI Pulse GL66 12UEK | |
| Alienware m15 R5 Ryzen Edition | |
| Lenovo Legion 5 15ACH6A-82NW0010GE | |
| Geekbench 5.5 / Single-Core | |
| Sınıf ortalaması Gaming (986 - 2423, n=149, son 2 yıl) | |
| Asus ROG Strix Scar 15 G533ZW-LN106WS | |
| MSI Pulse GL66 12UEK | |
| Asus ROG Strix Scar 15 G533zm | |
| Ortalama Intel Core i9-12900H (1631 - 1897, n=31) | |
| Asus TUF Gaming F15 FX507ZM | |
| Alienware m15 R5 Ryzen Edition | |
| Lenovo Legion 5 15ACH6A-82NW0010GE | |
| HWBOT x265 Benchmark v2.2 / 4k Preset | |
| Sınıf ortalaması Gaming (6.72 - 42.9, n=149, son 2 yıl) | |
| Asus ROG Strix Scar 15 G533zm | |
| Asus ROG Strix Scar 15 G533ZW-LN106WS | |
| Asus TUF Gaming F15 FX507ZM | |
| MSI Pulse GL66 12UEK | |
| Ortalama Intel Core i9-12900H (8.05 - 22.5, n=28) | |
| Alienware m15 R5 Ryzen Edition | |
| Lenovo Legion 5 15ACH6A-82NW0010GE | |
| LibreOffice / 20 Documents To PDF | |
| Alienware m15 R5 Ryzen Edition | |
| Lenovo Legion 5 15ACH6A-82NW0010GE | |
| Asus TUF Gaming F15 FX507ZM | |
| Sınıf ortalaması Gaming (19 - 96.6, n=148, son 2 yıl) | |
| Ortalama Intel Core i9-12900H (36.8 - 59.8, n=28) | |
| MSI Pulse GL66 12UEK | |
| Asus ROG Strix Scar 15 G533zm | |
| Asus ROG Strix Scar 15 G533ZW-LN106WS | |
| R Benchmark 2.5 / Overall mean | |
| Lenovo Legion 5 15ACH6A-82NW0010GE | |
| Alienware m15 R5 Ryzen Edition | |
| Asus TUF Gaming F15 FX507ZM | |
| Ortalama Intel Core i9-12900H (0.4218 - 0.506, n=28) | |
| Sınıf ortalaması Gaming (0.3609 - 0.759, n=151, son 2 yıl) | |
| Asus ROG Strix Scar 15 G533zm | |
| Asus ROG Strix Scar 15 G533ZW-LN106WS | |
| MSI Pulse GL66 12UEK | |
* ... daha küçük daha iyidir
AIDA64: FP32 Ray-Trace | FPU Julia | CPU SHA3 | CPU Queen | FPU SinJulia | FPU Mandel | CPU AES | CPU ZLib | FP64 Ray-Trace | CPU PhotoWorxx
| Performance Rating | |
| Sınıf ortalaması Gaming | |
| Alienware m15 R5 Ryzen Edition | |
| Asus ROG Strix Scar 15 G533zm | |
| Asus ROG Strix Scar 15 G533ZW-LN106WS | |
| Ortalama Intel Core i9-12900H | |
| Asus TUF Gaming F15 FX507ZM | |
| MSI Pulse GL66 12UEK | |
| Lenovo Legion 5 15ACH6A-82NW0010GE | |
| AIDA64 / FP32 Ray-Trace | |
| Sınıf ortalaması Gaming (4986 - 81639, n=148, son 2 yıl) | |
| Alienware m15 R5 Ryzen Edition | |
| Lenovo Legion 5 15ACH6A-82NW0010GE | |
| Ortalama Intel Core i9-12900H (4074 - 18289, n=28) | |
| Asus ROG Strix Scar 15 G533zm | |
| Asus ROG Strix Scar 15 G533ZW-LN106WS | |
| Asus TUF Gaming F15 FX507ZM | |
| MSI Pulse GL66 12UEK | |
| AIDA64 / FPU Julia | |
| Sınıf ortalaması Gaming (25360 - 252486, n=148, son 2 yıl) | |
| Alienware m15 R5 Ryzen Edition | |
| Lenovo Legion 5 15ACH6A-82NW0010GE | |
| Ortalama Intel Core i9-12900H (22307 - 93236, n=28) | |
| Asus ROG Strix Scar 15 G533zm | |
| Asus ROG Strix Scar 15 G533ZW-LN106WS | |
| Asus TUF Gaming F15 FX507ZM | |
| MSI Pulse GL66 12UEK | |
| AIDA64 / CPU SHA3 | |
| Sınıf ortalaması Gaming (1339 - 10389, n=148, son 2 yıl) | |
| Asus ROG Strix Scar 15 G533zm | |
| Asus ROG Strix Scar 15 G533ZW-LN106WS | |
| Asus TUF Gaming F15 FX507ZM | |
| MSI Pulse GL66 12UEK | |
| Alienware m15 R5 Ryzen Edition | |
| Ortalama Intel Core i9-12900H (1378 - 4215, n=28) | |
| Lenovo Legion 5 15ACH6A-82NW0010GE | |
| AIDA64 / CPU Queen | |
| Sınıf ortalaması Gaming (50699 - 200651, n=148, son 2 yıl) | |
| Asus ROG Strix Scar 15 G533zm | |
| MSI Pulse GL66 12UEK | |
| Asus ROG Strix Scar 15 G533ZW-LN106WS | |
| Ortalama Intel Core i9-12900H (78172 - 111241, n=28) | |
| Asus TUF Gaming F15 FX507ZM | |
| Alienware m15 R5 Ryzen Edition | |
| Lenovo Legion 5 15ACH6A-82NW0010GE | |
| AIDA64 / FPU SinJulia | |
| Sınıf ortalaması Gaming (4800 - 32988, n=148, son 2 yıl) | |
| Alienware m15 R5 Ryzen Edition | |
| Asus ROG Strix Scar 15 G533zm | |
| Asus ROG Strix Scar 15 G533ZW-LN106WS | |
| MSI Pulse GL66 12UEK | |
| Asus TUF Gaming F15 FX507ZM | |
| Ortalama Intel Core i9-12900H (5709 - 10410, n=28) | |
| Lenovo Legion 5 15ACH6A-82NW0010GE | |
| AIDA64 / FPU Mandel | |
| Sınıf ortalaması Gaming (12321 - 134044, n=148, son 2 yıl) | |
| Alienware m15 R5 Ryzen Edition | |
| Lenovo Legion 5 15ACH6A-82NW0010GE | |
| Ortalama Intel Core i9-12900H (11257 - 45581, n=28) | |
| Asus ROG Strix Scar 15 G533zm | |
| Asus TUF Gaming F15 FX507ZM | |
| Asus ROG Strix Scar 15 G533ZW-LN106WS | |
| MSI Pulse GL66 12UEK | |
| AIDA64 / CPU AES | |
| Alienware m15 R5 Ryzen Edition | |
| Asus ROG Strix Scar 15 G533zm | |
| Sınıf ortalaması Gaming (19065 - 328679, n=148, son 2 yıl) | |
| Asus ROG Strix Scar 15 G533ZW-LN106WS | |
| MSI Pulse GL66 12UEK | |
| Lenovo Legion 5 15ACH6A-82NW0010GE | |
| Ortalama Intel Core i9-12900H (31935 - 151546, n=28) | |
| Asus TUF Gaming F15 FX507ZM | |
| AIDA64 / CPU ZLib | |
| Sınıf ortalaması Gaming (373 - 2531, n=148, son 2 yıl) | |
| Asus ROG Strix Scar 15 G533ZW-LN106WS | |
| Asus ROG Strix Scar 15 G533zm | |
| Asus TUF Gaming F15 FX507ZM | |
| MSI Pulse GL66 12UEK | |
| Ortalama Intel Core i9-12900H (449 - 1193, n=28) | |
| Alienware m15 R5 Ryzen Edition | |
| Lenovo Legion 5 15ACH6A-82NW0010GE | |
| AIDA64 / FP64 Ray-Trace | |
| Sınıf ortalaması Gaming (2540 - 43430, n=148, son 2 yıl) | |
| Alienware m15 R5 Ryzen Edition | |
| Lenovo Legion 5 15ACH6A-82NW0010GE | |
| Ortalama Intel Core i9-12900H (2235 - 10511, n=28) | |
| Asus ROG Strix Scar 15 G533zm | |
| Asus ROG Strix Scar 15 G533ZW-LN106WS | |
| Asus TUF Gaming F15 FX507ZM | |
| MSI Pulse GL66 12UEK | |
| AIDA64 / CPU PhotoWorxx | |
| Sınıf ortalaması Gaming (10805 - 60161, n=148, son 2 yıl) | |
| Asus ROG Strix Scar 15 G533ZW-LN106WS | |
| Ortalama Intel Core i9-12900H (20960 - 48269, n=29) | |
| Asus ROG Strix Scar 15 G533zm | |
| Asus TUF Gaming F15 FX507ZM | |
| MSI Pulse GL66 12UEK | |
| Lenovo Legion 5 15ACH6A-82NW0010GE | |
| Alienware m15 R5 Ryzen Edition | |
Sistem performansı
CrossMark: Overall | Productivity | Creativity | Responsiveness
| PCMark 10 / Score | |
| Asus ROG Strix Scar 15 G533ZW-LN106WS | |
| Asus ROG Strix Scar 15 G533zm | |
| Sınıf ortalaması Gaming (5776 - 9852, n=133, son 2 yıl) | |
| Ortalama Intel Core i9-12900H, NVIDIA GeForce RTX 3060 Laptop GPU (7135 - 7861, n=4) | |
| Asus TUF Gaming F15 FX507ZM | |
| MSI Pulse GL66 12UEK | |
| Lenovo Legion 5 15ACH6A-82NW0010GE | |
| Alienware m15 R5 Ryzen Edition | |
| PCMark 10 / Essentials | |
| Asus ROG Strix Scar 15 G533zm | |
| Ortalama Intel Core i9-12900H, NVIDIA GeForce RTX 3060 Laptop GPU (10380 - 11198, n=4) | |
| Sınıf ortalaması Gaming (9057 - 12600, n=133, son 2 yıl) | |
| Asus ROG Strix Scar 15 G533ZW-LN106WS | |
| Lenovo Legion 5 15ACH6A-82NW0010GE | |
| Asus TUF Gaming F15 FX507ZM | |
| MSI Pulse GL66 12UEK | |
| Alienware m15 R5 Ryzen Edition | |
| PCMark 10 / Productivity | |
| Asus ROG Strix Scar 15 G533zm | |
| Asus ROG Strix Scar 15 G533ZW-LN106WS | |
| Ortalama Intel Core i9-12900H, NVIDIA GeForce RTX 3060 Laptop GPU (9751 - 10486, n=4) | |
| Sınıf ortalaması Gaming (6662 - 14612, n=133, son 2 yıl) | |
| MSI Pulse GL66 12UEK | |
| Lenovo Legion 5 15ACH6A-82NW0010GE | |
| Asus TUF Gaming F15 FX507ZM | |
| Alienware m15 R5 Ryzen Edition | |
| PCMark 10 / Digital Content Creation | |
| Sınıf ortalaması Gaming (6807 - 18475, n=133, son 2 yıl) | |
| Asus ROG Strix Scar 15 G533ZW-LN106WS | |
| Asus TUF Gaming F15 FX507ZM | |
| Asus ROG Strix Scar 15 G533zm | |
| Ortalama Intel Core i9-12900H, NVIDIA GeForce RTX 3060 Laptop GPU (9741 - 11226, n=4) | |
| Lenovo Legion 5 15ACH6A-82NW0010GE | |
| MSI Pulse GL66 12UEK | |
| Alienware m15 R5 Ryzen Edition | |
| CrossMark / Overall | |
| MSI Pulse GL66 12UEK | |
| Asus ROG Strix Scar 15 G533ZW-LN106WS | |
| Asus ROG Strix Scar 15 G533zm | |
| Ortalama Intel Core i9-12900H, NVIDIA GeForce RTX 3060 Laptop GPU (1789 - 2096, n=4) | |
| Sınıf ortalaması Gaming (1247 - 2344, n=114, son 2 yıl) | |
| CrossMark / Productivity | |
| MSI Pulse GL66 12UEK | |
| Asus ROG Strix Scar 15 G533ZW-LN106WS | |
| Asus ROG Strix Scar 15 G533zm | |
| Ortalama Intel Core i9-12900H, NVIDIA GeForce RTX 3060 Laptop GPU (1677 - 2062, n=4) | |
| Sınıf ortalaması Gaming (1299 - 2204, n=114, son 2 yıl) | |
| CrossMark / Creativity | |
| Asus ROG Strix Scar 15 G533zm | |
| Asus ROG Strix Scar 15 G533ZW-LN106WS | |
| Ortalama Intel Core i9-12900H, NVIDIA GeForce RTX 3060 Laptop GPU (2032 - 2125, n=4) | |
| MSI Pulse GL66 12UEK | |
| Sınıf ortalaması Gaming (1275 - 2660, n=114, son 2 yıl) | |
| CrossMark / Responsiveness | |
| MSI Pulse GL66 12UEK | |
| Asus ROG Strix Scar 15 G533ZW-LN106WS | |
| Asus ROG Strix Scar 15 G533zm | |
| Ortalama Intel Core i9-12900H, NVIDIA GeForce RTX 3060 Laptop GPU (1486 - 2230, n=4) | |
| Sınıf ortalaması Gaming (1030 - 2330, n=114, son 2 yıl) | |
| PCMark 10 Score | 7861 puan | |
Yardım | ||
| AIDA64 / Memory Copy | |
| Sınıf ortalaması Gaming (21750 - 97515, n=148, son 2 yıl) | |
| Asus ROG Strix Scar 15 G533ZW-LN106WS | |
| Ortalama Intel Core i9-12900H (34438 - 74264, n=28) | |
| Asus TUF Gaming F15 FX507ZM | |
| Asus ROG Strix Scar 15 G533zm | |
| MSI Pulse GL66 12UEK | |
| Alienware m15 R5 Ryzen Edition | |
| Lenovo Legion 5 15ACH6A-82NW0010GE | |
| AIDA64 / Memory Read | |
| Sınıf ortalaması Gaming (22956 - 102937, n=148, son 2 yıl) | |
| Asus ROG Strix Scar 15 G533ZW-LN106WS | |
| Ortalama Intel Core i9-12900H (36365 - 74642, n=28) | |
| Asus TUF Gaming F15 FX507ZM | |
| Asus ROG Strix Scar 15 G533zm | |
| MSI Pulse GL66 12UEK | |
| Alienware m15 R5 Ryzen Edition | |
| Lenovo Legion 5 15ACH6A-82NW0010GE | |
| AIDA64 / Memory Write | |
| Sınıf ortalaması Gaming (22297 - 108954, n=148, son 2 yıl) | |
| Asus ROG Strix Scar 15 G533ZW-LN106WS | |
| Ortalama Intel Core i9-12900H (32276 - 67858, n=28) | |
| Asus ROG Strix Scar 15 G533zm | |
| Asus TUF Gaming F15 FX507ZM | |
| MSI Pulse GL66 12UEK | |
| Alienware m15 R5 Ryzen Edition | |
| Lenovo Legion 5 15ACH6A-82NW0010GE | |
| AIDA64 / Memory Latency | |
| Asus ROG Strix Scar 15 G533zm | |
| Asus ROG Strix Scar 15 G533ZW-LN106WS | |
| Sınıf ortalaması Gaming (59.5 - 259, n=148, son 2 yıl) | |
| MSI Pulse GL66 12UEK | |
| Lenovo Legion 5 15ACH6A-82NW0010GE | |
| Ortalama Intel Core i9-12900H (74.7 - 118.1, n=27) | |
| Alienware m15 R5 Ryzen Edition | |
| Asus TUF Gaming F15 FX507ZM | |
* ... daha küçük daha iyidir
DPC gecikme süresi
LatencyMon, bir tarayıcı başlatıldığında hemen sorun bildirdi. Birkaç sekme açmak sorunları daha da kötüleştirdi. YouTube test videomuzun 4K ve 60 fps'de oynatılması sırasında gecikme değerleri daha da arttı. Bununla birlikte, video herhangi bir kare düşmesi olmadan çalıştı.
| DPC Latencies / LatencyMon - interrupt to process latency (max), Web, Youtube, Prime95 | |
| Asus ROG Strix Scar 15 G533zm | |
| MSI Pulse GL66 12UEK | |
| Asus ROG Strix Scar 15 G533ZW-LN106WS | |
| Lenovo Legion 5 15ACH6A-82NW0010GE | |
| Asus TUF Gaming F15 FX507ZM | |
| Alienware m15 R5 Ryzen Edition | |
* ... daha küçük daha iyidir
Yığın depolama
Asus, Micron tarafından üretilen oldukça yeni bir 1TB PCIe 4.0 NVMe SSD takmıştır. Mükemmel aktarım hızları sağlamasına rağmen sürücü, nispeten yeni standardın sunduğu hızlardan tam olarak yararlanamadı. Bununla birlikte, rakip dizüstü bilgisayarlardaki depolama sürücülerine kıyasla çoğunlukla en iyi performansı sağladı. Sürekli yük altında da performansı mükemmel.
| Drive Performance Rating - Percent | |
| Asus ROG Strix Scar 15 G533ZW-LN106WS | |
| Asus ROG Strix Scar 15 G533zm | |
| Sınıf ortalaması Gaming | |
| MSI Pulse GL66 12UEK | |
| Asus TUF Gaming F15 FX507ZM | |
| Lenovo Legion 5 15ACH6A-82NW0010GE | |
| Alienware m15 R5 Ryzen Edition | |
| Global Average -3 | |
* ... daha küçük daha iyidir
Sustained load Read: DiskSpd Read Loop, Queue Depth 8
Grafik kartı
Bu Nividia GeForce RTX 3060 orta seviye ile üst seviye arasındaki boşluğu doldurur. TGP'si 60 ila 115 watt arasında değişebilir ve güç yapılandırması kartın 3D performansı üzerinde kalıcı bir etkiye sahiptir. Strix Scar'daki RTX 3060, 115 watt'ın tamamına erişebiliyor ve 25 watt'lık Dinamik Güçlendirme ile 140 watt'a kadar çıkabiliyor.
Sentetik 3D kıyaslamalarda GPU, veritabanımızdaki ortalama bir RTX 3060'tan biraz daha iyi performans gösterdi, ancak Lenovo Legion 5 ve Asus TUF Gaming F15, Strix Scar'dan marjinal olarak daha hızlı. Scar 15 G533zw'deki RTX 3070 Ti yaklaşık %35 daha güçlü.
Pil gücüyle, dizüstü bilgisayarın 3D performansı yeni bir Fire Strike test çalışmasında yaklaşık %67 oranında düştü ve normal 21.671 yerine sadece 7.168 grafik puanıyla sonuçlandı.
| 3DMark Performance Rating - Percent | |
| Sınıf ortalaması Gaming | |
| Asus ROG Strix Scar 15 G533ZW-LN106WS | |
| Lenovo Legion 5 15ACH6A-82NW0010GE | |
| Asus TUF Gaming F15 FX507ZM | |
| Asus ROG Strix Scar 15 G533zm | |
| Alienware m15 R5 Ryzen Edition | |
| Ortalama NVIDIA GeForce RTX 3060 Laptop GPU | |
| MSI Pulse GL66 12UEK | |
| 3DMark 11 - 1280x720 Performance GPU | |
| Sınıf ortalaması Gaming (10741 - 72178, n=143, son 2 yıl) | |
| Asus ROG Strix Scar 15 G533ZW-LN106WS | |
| Lenovo Legion 5 15ACH6A-82NW0010GE | |
| Asus TUF Gaming F15 FX507ZM | |
| Asus ROG Strix Scar 15 G533zm | |
| Alienware m15 R5 Ryzen Edition | |
| Ortalama NVIDIA GeForce RTX 3060 Laptop GPU (13799 - 30772, n=43) | |
| MSI Pulse GL66 12UEK | |
| 3DMark | |
| 1920x1080 Fire Strike Graphics | |
| Sınıf ortalaması Gaming (2913 - 56116, n=155, son 2 yıl) | |
| Asus ROG Strix Scar 15 G533ZW-LN106WS | |
| Lenovo Legion 5 15ACH6A-82NW0010GE | |
| Asus TUF Gaming F15 FX507ZM | |
| Asus ROG Strix Scar 15 G533zm | |
| Ortalama NVIDIA GeForce RTX 3060 Laptop GPU (16354 - 23109, n=49) | |
| Alienware m15 R5 Ryzen Edition | |
| MSI Pulse GL66 12UEK | |
| 2560x1440 Time Spy Graphics | |
| Sınıf ortalaması Gaming (2295 - 24599, n=151, son 2 yıl) | |
| Asus ROG Strix Scar 15 G533ZW-LN106WS | |
| Asus TUF Gaming F15 FX507ZM | |
| Alienware m15 R5 Ryzen Edition | |
| Lenovo Legion 5 15ACH6A-82NW0010GE | |
| Asus ROG Strix Scar 15 G533zm | |
| Ortalama NVIDIA GeForce RTX 3060 Laptop GPU (6285 - 9235, n=49) | |
| MSI Pulse GL66 12UEK | |
| 3DMark 11 Performance | 27156 puan | |
| 3DMark Fire Strike Score | 19296 puan | |
| 3DMark Time Spy Score | 8606 puan | |
Yardım | ||
Oyun performansı
Ne yazık ki Optimus, Strix'i DirectX 11 oyunlarını sadece 60 fps'de çalıştırmakla sınırlıyor. Bu, Optimus'lu bazı dizüstü bilgisayarları etkileyen genel bir sorundur. Bu oyunları harici bir monitörde oynamak dışında, tek çözüm MUX anahtarını etkinleştirmek ve dGPU'yu doğrudan kullanmaktır.
Strix 15, karşılaştırmamızdaki cihazlar arasında çoğunlukla en iyi performansı sunuyor. Sadece TUF Gaming F15 bazı oyunlarda marjinal olarak daha hızlı.
Strix'in fişini çekmek, kare hızlarının 30 fps'de sabitlenmesine neden oldu Witcher 3 ultra'da çalışıyordu ve fanlar tüm süre boyunca hoş bir sessizlik içindeydi.
| Far Cry 5 | |
| 1920x1080 Medium Preset AA:T | |
| Sınıf ortalaması Gaming (38 - 248, n=66, son 2 yıl) | |
| Asus ROG Strix Scar 15 G533ZW-LN106WS | |
| Asus ROG Strix Scar 15 G533zm | |
| MSI Pulse GL66 12UEK | |
| Asus TUF Gaming F15 FX507ZM | |
| Ortalama NVIDIA GeForce RTX 3060 Laptop GPU (88 - 135, n=25) | |
| Alienware m15 R5 Ryzen Edition | |
| Lenovo Legion 5 15ACH6A-82NW0010GE | |
| 1920x1080 High Preset AA:T | |
| Asus ROG Strix Scar 15 G533ZW-LN106WS | |
| Sınıf ortalaması Gaming (35 - 232, n=74, son 2 yıl) | |
| Asus ROG Strix Scar 15 G533zm | |
| MSI Pulse GL66 12UEK | |
| Asus TUF Gaming F15 FX507ZM | |
| Ortalama NVIDIA GeForce RTX 3060 Laptop GPU (85 - 129, n=29) | |
| Alienware m15 R5 Ryzen Edition | |
| Lenovo Legion 5 15ACH6A-82NW0010GE | |
| 1920x1080 Ultra Preset AA:T | |
| Asus ROG Strix Scar 15 G533ZW-LN106WS | |
| Sınıf ortalaması Gaming (34 - 218, n=76, son 2 yıl) | |
| Asus ROG Strix Scar 15 G533zm | |
| Asus TUF Gaming F15 FX507ZM | |
| MSI Pulse GL66 12UEK | |
| Ortalama NVIDIA GeForce RTX 3060 Laptop GPU (80 - 120, n=31) | |
| Alienware m15 R5 Ryzen Edition | |
| Lenovo Legion 5 15ACH6A-82NW0010GE | |
| GTA V | |
| 1920x1080 Normal/Off AF:4x | |
| Asus TUF Gaming F15 FX507ZM | |
| Asus ROG Strix Scar 15 G533zm | |
| Asus ROG Strix Scar 15 G533ZW-LN106WS | |
| Sınıf ortalaması Gaming (101.7 - 187.7, n=86, son 2 yıl) | |
| Ortalama NVIDIA GeForce RTX 3060 Laptop GPU (146 - 183.7, n=33) | |
| Alienware m15 R5 Ryzen Edition | |
| Lenovo Legion 5 15ACH6A-82NW0010GE | |
| 1920x1080 High/On (Advanced Graphics Off) AA:2xMSAA + FX AF:8x | |
| Asus ROG Strix Scar 15 G533ZW-LN106WS | |
| Sınıf ortalaması Gaming (24.2 - 187.1, n=112, son 2 yıl) | |
| Asus ROG Strix Scar 15 G533zm | |
| Asus TUF Gaming F15 FX507ZM | |
| Ortalama NVIDIA GeForce RTX 3060 Laptop GPU (120 - 179.4, n=42) | |
| Alienware m15 R5 Ryzen Edition | |
| Lenovo Legion 5 15ACH6A-82NW0010GE | |
| 1920x1080 Highest Settings possible AA:4xMSAA + FX AF:16x | |
| Asus ROG Strix Scar 15 G533ZW-LN106WS | |
| Sınıf ortalaması Gaming (12.1 - 168.2, n=132, son 2 yıl) | |
| Asus ROG Strix Scar 15 G533zm | |
| Asus TUF Gaming F15 FX507ZM | |
| Ortalama NVIDIA GeForce RTX 3060 Laptop GPU (69.2 - 109.8, n=46) | |
| Alienware m15 R5 Ryzen Edition | |
| Lenovo Legion 5 15ACH6A-82NW0010GE | |
| Final Fantasy XV Benchmark | |
| 1920x1080 Standard Quality | |
| Sınıf ortalaması Gaming (33.5 - 232, n=119, son 2 yıl) | |
| Asus ROG Strix Scar 15 G533ZW-LN106WS | |
| Asus TUF Gaming F15 FX507ZM | |
| Asus ROG Strix Scar 15 G533zm | |
| Ortalama NVIDIA GeForce RTX 3060 Laptop GPU (70.4 - 133.5, n=37) | |
| Lenovo Legion 5 15ACH6A-82NW0010GE | |
| Alienware m15 R5 Ryzen Edition | |
| 1920x1080 High Quality | |
| Sınıf ortalaması Gaming (19.2 - 201, n=144, son 2 yıl) | |
| Asus ROG Strix Scar 15 G533ZW-LN106WS | |
| Asus TUF Gaming F15 FX507ZM | |
| Asus ROG Strix Scar 15 G533zm | |
| Ortalama NVIDIA GeForce RTX 3060 Laptop GPU (55 - 100.9, n=42) | |
| Lenovo Legion 5 15ACH6A-82NW0010GE | |
| Alienware m15 R5 Ryzen Edition | |
| 2560x1440 High Quality | |
| Sınıf ortalaması Gaming (32.5 - 169.2, n=100, son 2 yıl) | |
| Asus ROG Strix Scar 15 G533ZW-LN106WS | |
| Asus ROG Strix Scar 15 G533zm | |
| Ortalama NVIDIA GeForce RTX 3060 Laptop GPU (41.1 - 73.7, n=25) | |
| X-Plane 11.11 | |
| 1280x720 low (fps_test=1) | |
| Asus TUF Gaming F15 FX507ZM | |
| Sınıf ortalaması Gaming (39 - 221, n=147, son 2 yıl) | |
| Asus ROG Strix Scar 15 G533zm | |
| MSI Pulse GL66 12UEK | |
| Ortalama NVIDIA GeForce RTX 3060 Laptop GPU (83.6 - 157.1, n=48) | |
| Alienware m15 R5 Ryzen Edition | |
| Lenovo Legion 5 15ACH6A-82NW0010GE | |
| 1920x1080 med (fps_test=2) | |
| Asus TUF Gaming F15 FX507ZM | |
| Sınıf ortalaması Gaming (38.9 - 193.1, n=147, son 2 yıl) | |
| Asus ROG Strix Scar 15 G533zm | |
| MSI Pulse GL66 12UEK | |
| Ortalama NVIDIA GeForce RTX 3060 Laptop GPU (73 - 138.3, n=48) | |
| Alienware m15 R5 Ryzen Edition | |
| Lenovo Legion 5 15ACH6A-82NW0010GE | |
| 1920x1080 high (fps_test=3) | |
| Asus TUF Gaming F15 FX507ZM | |
| Sınıf ortalaması Gaming (32.8 - 166.2, n=151, son 2 yıl) | |
| MSI Pulse GL66 12UEK | |
| Asus ROG Strix Scar 15 G533zm | |
| Ortalama NVIDIA GeForce RTX 3060 Laptop GPU (61.9 - 109.3, n=48) | |
| Alienware m15 R5 Ryzen Edition | |
| Lenovo Legion 5 15ACH6A-82NW0010GE | |
Witcher 3 bir saatlik test süresi boyunca oldukça istikrarlı bir şekilde çalıştı ve kare hızında yalnızca hafif bir düşüş oldu.
Witcher 3 FPS chart
| düşük | orta | yüksek | ultra | QHD | |
|---|---|---|---|---|---|
| GTA V (2015) | 186.2 | 181.6 | 166.9 | 105 | 80.5 |
| The Witcher 3 (2015) | 400 | 290 | 165 | 88.7 | |
| Dota 2 Reborn (2015) | 182.6 | 167.7 | 159.1 | 151.4 | |
| Final Fantasy XV Benchmark (2018) | 178.9 | 117.2 | 87.5 | 65.1 | |
| X-Plane 11.11 (2018) | 145.8 | 123.9 | 99.8 | ||
| Far Cry 5 (2018) | 160 | 129 | 123 | 117 | 92 |
| Strange Brigade (2018) | 398 | 216 | 176.4 | 153 | |
| Cyberpunk 2077 1.6 (2022) | 120 | 118 | 63 | 63 |
Emisyonlar - Havalı, ancak sessiz olması şart değil
Gürültü emisyonları
Turbo modunda, içerideki fanlar rölantiye dönmeden önce birkaç saniye boyunca düzenli olarak oldukça yüksek sesle dönüyor. Asus, gelecekteki bir güncellemede soğutma sistemini daha az agresif hale getirmeyi düşünebilir. Bununla birlikte, fanlar genellikle Sessiz modda dönmüyor.
Asus Strix Scar'ın yük altında da sessiz olduğu söylenemez. Oyun ve stres testi sırasında Asus TUF ve MSI Pulse benzer şekilde yüksek ses çıkarırken, Lenovo Legion ve Alienware daha sessiz kaldı.
Belirli yükleri başlatırken (örn. Witcher 3), cihazdan gelen yumuşak elektronik bipleme seslerini de fark ettik, ancak bunlar yalnızca geçici olarak mevcuttu.
Ses yüksekliği
| Boşta |
| 23 / 23 / 37.75 dB |
| Çalışırken |
| 45.35 / 56.22 dB |
 | ||
30 dB sessiz 40 dB(A) duyulabilirlik 50 dB(A) gürültülü |
||
min: | ||
| Asus ROG Strix Scar 15 G533zm GeForce RTX 3060 Laptop GPU, i9-12900H | Asus ROG Strix Scar 15 G533ZW-LN106WS GeForce RTX 3070 Ti Laptop GPU, i9-12900H, Samsung PM9A1 MZVL22T0HBLB | Asus TUF Gaming F15 FX507ZM GeForce RTX 3060 Laptop GPU, i7-12700H, SK Hynix HFM001TD3JX013N | MSI Pulse GL66 12UEK GeForce RTX 3060 Laptop GPU, i9-12900H, Micron 2450 512GB MTFDKBA512TFK | Alienware m15 R5 Ryzen Edition GeForce RTX 3060 Laptop GPU, R7 5800H, Toshiba KBG40ZNS512G NVMe | Lenovo Legion 5 15ACH6A-82NW0010GE Radeon RX 6600M, R5 5600H, Micron 2210 MTFDHBA512QFD | |
|---|---|---|---|---|---|---|
| Noise | -26% | 6% | 0% | 2% | -4% | |
| kapalı / ortam * | 23 | 26.86 -17% | 23.2 -1% | 23 -0% | 24 -4% | 25 -9% |
| Idle Minimum * | 23 | 39.07 -70% | 23.6 -3% | 23 -0% | 24 -4% | 25 -9% |
| Idle Average * | 23 | 39.07 -70% | 23.6 -3% | 27 -17% | 25 -9% | 25 -9% |
| Idle Maximum * | 37.75 | 39.07 -3% | 25.4 33% | 27 28% | 35 7% | 34.5 9% |
| Load Average * | 45.35 | 53.34 -18% | 38 16% | 48.2 -6% | 44 3% | 51.1 -13% |
| Witcher 3 ultra * | 55.48 | 56.6 -2% | 54.1 2% | 56.9 -3% | 48 13% | |
| Load Maximum * | 56.22 | 56.6 -1% | 57.2 -2% | 56.94 -1% | 50 11% | 51.3 9% |
* ... daha küçük daha iyidir
Sıcaklık
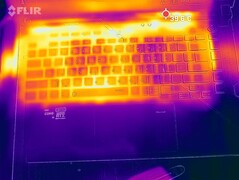
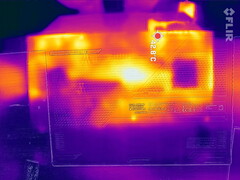
Asus oyun dizüstü bilgisayarı hem boşta hem de yük altında nispeten serin kalabiliyor. Örneğin, Alienware çıkıntılı soğutma sistemine rağmen çok daha sıcak çalışıyor. Strix Scar'ın duyulabilir şekilde daha agresif bir fan eğrisine sahip olması, yüzey sıcaklıklarının makul bir seviyede kalmasına yardımcı oluyor.
(±) Üst taraftaki maksimum sıcaklık, 40.4 °C / 105 F ortalamasına kıyasla 43 °C / 109 F'dir. , Gaming sınıfı için 21.2 ile 68.8 °C arasında değişir.
(-) Alt kısım, 43.2 °C / 110 F ortalamasına kıyasla maksimum 47 °C / 117 F'ye kadar ısınır
(+) Boşta kullanımda, üst tarafın ortalama sıcaklığı 29.2 °C / 85 F olup, cihazın 33.9 °C / 93 F.
(±) The Witcher 3 oynarken, üst tarafın ortalama sıcaklığı 32.9 °C / 91 F olup, cihazın 33.9 °C / 93 F.
(+) Avuç içi dayanakları ve dokunmatik yüzey, maksimum 25 °C / 77 F ile cilt sıcaklığından daha soğuktur ve bu nedenle dokunulduğunda soğuktur.
(+) Benzer cihazların avuç içi dayanağı alanının ortalama sıcaklığı 28.9 °C / 84 F (+3.9 °C / 7 F) idi.
| Asus ROG Strix Scar 15 G533zm Intel Core i9-12900H, NVIDIA GeForce RTX 3060 Laptop GPU | Asus ROG Strix Scar 15 G533ZW-LN106WS Intel Core i9-12900H, NVIDIA GeForce RTX 3070 Ti Laptop GPU | Asus TUF Gaming F15 FX507ZM Intel Core i7-12700H, NVIDIA GeForce RTX 3060 Laptop GPU | MSI Pulse GL66 12UEK Intel Core i9-12900H, NVIDIA GeForce RTX 3060 Laptop GPU | Alienware m15 R5 Ryzen Edition AMD Ryzen 7 5800H, NVIDIA GeForce RTX 3060 Laptop GPU | Lenovo Legion 5 15ACH6A-82NW0010GE AMD Ryzen 5 5600H, AMD Radeon RX 6600M | |
|---|---|---|---|---|---|---|
| Heat | -10% | -11% | -11% | -22% | 3% | |
| Maximum Upper Side * | 43 | 42.6 1% | 44.4 -3% | 50 -16% | 62 -44% | 39.9 7% |
| Maximum Bottom * | 47 | 50.2 -7% | 48.8 -4% | 47 -0% | 61 -30% | 43.8 7% |
| Idle Upper Side * | 32 | 36.2 -13% | 37.8 -18% | 36 -13% | 36 -13% | 34.1 -7% |
| Idle Bottom * | 33 | 40.2 -22% | 39.6 -20% | 38 -15% | 33 -0% | 31.7 4% |
* ... daha küçük daha iyidir
Stres testi
Stres testi sırasında, TDP nominal 45 watt'a düşmeden önce birkaç saniye boyunca yaklaşık 95 watt'a ulaştı. Aynı zamanda, CPU'nun saat hızı ortalama 2,3 GHz'e düştü ve çekirdek sıcaklıkları 76°C (168,8°F) civarında seyretti.
GPU'nun saati sadece küçük dalgalanmalarla yaklaşık 1,6 GHz'de çalıştı. Bellek saati kesinlikle sabit 1.750 MHz'de çalıştı. Bununla birlikte, GPU sıcaklıkları yaklaşık 81°C (177,8°F) ile nispeten yüksekti, ancak bu yine de güvenli bir aralıkta yer alıyor ve boşluğun iyi kullanıldığını gösteriyor. Kartın tamamı ortalama 109 watt çekti.
| CPU Saati (GHz) | GPU Saati (MHz) | Ortalama CPU Sıcaklığı (°C) | Ortalama GPU Sıcaklığı (°C) | |
| Prime95 + FurMark Stres | 2.3 | 1.600 | 76 | 81 |
Konuşmacılar
Hoparlörler maksimum ses seviyesinde bile yeterince yüksek ses vermiyor. Bununla birlikte, en azından dizüstü bilgisayar hoparlörleri için iyi bas üretebiliyorlar. Öte yandan, tizler rakip cihazlardaki kadar etkileyici değil.
Kullanıcıların harici analog ses cihazlarını takabilmeleri için birleşik bir ses jakı vardır.
Asus ROG Strix Scar 15 G533zm ses analizi
(±) | hoparlör ses yüksekliği ortalama ama iyi (79.48 dB)
Bas 100 - 315Hz
(+) | iyi bas - medyandan yalnızca 3.5% uzakta
(+) | bas doğrusaldır (4.6% delta ile önceki frekans)
Ortalar 400 - 2000 Hz
(±) | daha yüksek ortalar - ortalama olarak medyandan 5.6% daha yüksek
(+) | orta frekanslar doğrusaldır (4.8% deltadan önceki frekansa)
Yüksekler 2 - 16 kHz
(±) | azaltılmış yüksekler - ortalama olarak medyandan 6.8% daha düşük
(±) | Yükseklerin doğrusallığı ortalamadır (8.2% delta - önceki frekans)
Toplam 100 - 16.000 Hz
(+) | genel ses doğrusaldır (14.7% ortancaya göre fark)
Aynı sınıfla karşılaştırıldığında
» Bu sınıftaki tüm test edilen cihazların %27%'si daha iyi, 7% benzer, 66% daha kötüydü
» En iyisinin deltası 6% idi, ortalama 18% idi, en kötüsü 132% idi
Test edilen tüm cihazlarla karşılaştırıldığında
» Test edilen tüm cihazların %17'si daha iyi, 4 benzer, % 79 daha kötüydü
» En iyisinin deltası 4% idi, ortalama 24% idi, en kötüsü 134% idi
Asus TUF Gaming F15 FX507ZM ses analizi
(±) | hoparlör ses yüksekliği ortalama ama iyi (76.7 dB)
Bas 100 - 315Hz
(±) | azaltılmış bas - ortalama olarak medyandan 13.7% daha düşük
(±) | Bas doğrusallığı ortalamadır (10.1% delta - önceki frekans)
Ortalar 400 - 2000 Hz
(±) | daha yüksek ortalar - ortalama olarak medyandan 5.2% daha yüksek
(+) | orta frekanslar doğrusaldır (4.9% deltadan önceki frekansa)
Yüksekler 2 - 16 kHz
(+) | dengeli yüksekler - medyandan yalnızca 4.1% uzakta
(±) | Yükseklerin doğrusallığı ortalamadır (8.6% delta - önceki frekans)
Toplam 100 - 16.000 Hz
(±) | Genel sesin doğrusallığı ortalamadır (15.9% ortancaya göre fark)
Aynı sınıfla karşılaştırıldığında
» Bu sınıftaki tüm test edilen cihazların %36%'si daha iyi, 7% benzer, 58% daha kötüydü
» En iyisinin deltası 6% idi, ortalama 18% idi, en kötüsü 132% idi
Test edilen tüm cihazlarla karşılaştırıldığında
» Test edilen tüm cihazların %23'si daha iyi, 5 benzer, % 72 daha kötüydü
» En iyisinin deltası 4% idi, ortalama 24% idi, en kötüsü 134% idi
Güç yönetimi - İyi pil ömrü
Güç tüketimi
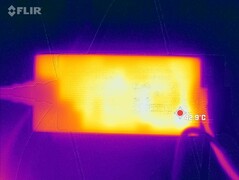
Genel olarak, özellikle güç tasarruflu olmamasına rağmen, Asus Strix Scar 15 de bu konuda çok sorunlu değildir. Enerji tasarrufu sağlayan rölanti modunda ve oyun sırasında rakiplerinden biraz daha fazla güç tüketiyor. Bununla birlikte, 221 watt'lık geçici tepe kullanımı rakiplerinden daha yüksek değildir ve 240 watt'lık şarj cihazının olanakları dahilindedir.
| Boşta | |
| Çalışırken |
|
Key:
min: | |
| Asus ROG Strix Scar 15 G533zm i9-12900H, GeForce RTX 3060 Laptop GPU, , IPS, 2560x1440, 15.6" | Asus ROG Strix Scar 15 G533ZW-LN106WS i9-12900H, GeForce RTX 3070 Ti Laptop GPU, Samsung PM9A1 MZVL22T0HBLB, IPS-level, 2560x1440, 15.6" | Asus TUF Gaming F15 FX507ZM i7-12700H, GeForce RTX 3060 Laptop GPU, SK Hynix HFM001TD3JX013N, IPS, 1920x1080, 15.6" | MSI Pulse GL66 12UEK i9-12900H, GeForce RTX 3060 Laptop GPU, Micron 2450 512GB MTFDKBA512TFK, IPS, 1920x1080, 15.6" | Alienware m15 R5 Ryzen Edition R7 5800H, GeForce RTX 3060 Laptop GPU, Toshiba KBG40ZNS512G NVMe, IPS, 1920x1080, 15.6" | Lenovo Legion 5 15ACH6A-82NW0010GE R5 5600H, Radeon RX 6600M, Micron 2210 MTFDHBA512QFD, IPS, 1920x1080, 15.6" | Ortalama NVIDIA GeForce RTX 3060 Laptop GPU | Sınıf ortalaması Gaming | |
|---|---|---|---|---|---|---|---|---|
| Power Consumption | 7% | 9% | 28% | 1% | 8% | 7% | -11% | |
| Idle Minimum * | 13 | 7.56 42% | 6.3 52% | 7 46% | 11 15% | 10 23% | 10.4 ? 20% | 13.4 ? -3% |
| Idle Average * | 17 | 13.5 21% | 9.8 42% | 13 24% | 14 18% | 13.2 22% | 14.5 ? 15% | 18.9 ? -11% |
| Idle Maximum * | 17 | 16.87 1% | 26.5 -56% | 13.7 19% | 25 -47% | 15.6 8% | 21.4 ? -26% | 26.3 ? -55% |
| Load Average * | 135 | 128.9 5% | 103.8 23% | 48.4 64% | 123 9% | 178 -32% | 109.3 ? 19% | 102.7 ? 24% |
| Witcher 3 ultra * | 195 | 196.2 -1% | 189 3% | 148 24% | 176 10% | 181 7% | ||
| Load Maximum * | 221 | 274.86 -24% | 241.9 -9% | 244 -10% | 226 -2% | 180 19% | 206 ? 7% | 244 ? -10% |
* ... daha küçük daha iyidir
Power consumption Witcher 3 / stress test
Power consumption with external monitor
Pil ömrü
Asus, dizüstü bilgisayarı, düşük ekran parlaklığı ile yapılan testlerimizde 8,5 saat video oynatma ve 9 saat internette gezinme sunabilen büyük bir 90Wh pil ile donattı.
| Asus ROG Strix Scar 15 G533zm i9-12900H, GeForce RTX 3060 Laptop GPU, 90 Wh | Asus ROG Strix Scar 15 G533ZW-LN106WS i9-12900H, GeForce RTX 3070 Ti Laptop GPU, 90 Wh | Asus TUF Gaming F15 FX507ZM i7-12700H, GeForce RTX 3060 Laptop GPU, 90 Wh | MSI Pulse GL66 12UEK i9-12900H, GeForce RTX 3060 Laptop GPU, 53.5 Wh | Alienware m15 R5 Ryzen Edition R7 5800H, GeForce RTX 3060 Laptop GPU, 86 Wh | Lenovo Legion 5 15ACH6A-82NW0010GE R5 5600H, Radeon RX 6600M, 80 Wh | Sınıf ortalaması Gaming | |
|---|---|---|---|---|---|---|---|
| Pil Çalışma Süresi | -17% | -40% | -16% | -16% | 12% | -16% | |
| H.264 | 518 | 510 -2% | 237 -54% | 525 1% | 447 ? -14% | ||
| WiFi v1.3 | 551 | 501.4 -9% | 285 -48% | 306 -44% | 552 0% | 387 ? -30% | |
| Witcher 3 ultra | 80 | 70 -12% | 96 20% | 74.7 ? -7% | |||
| Load | 95 | 52 -45% | 66 -31% | 116 22% | 55 -42% | 118 24% | 84.5 ? -11% |
| Reader / Idle | 947 | 881 | 770 | 585 ? |
Artılar
Eksiler
Karar - 1.999 € karşılığında etkileyici oyun dizüstü bilgisayarı
RTX 3060'a sahip Asus ROG Strix Scar 15'in G533zm modeli de aynı şekilde üstün yapı kalitesine sahip, son derece yetkin ve harika bir oyun dizüstü bilgisayarıdır. Modern I/O'lar, harika bir yazma deneyimi, güçlü donanım ve özelleştirme seçenekleri sunuyor. Ayrıca, ekranı mükemmel tepki süresi, mükemmel renk kapsamı ve sağlam kontrast ve parlaklık ile öne çıkıyor. RTX 3070 Ti modeli (G533zw) ve doğrudan rakipleri ile karşılaştırıldığında, G533zm nispeten serin çalışıyor.
Dizüstü bilgisayar hakkında gerçek bir şikayetimiz yok. Gürültü seviyesi biraz optimize edilebilir ama onun dışında oldukça makul. Bu arada, bir i7-12700H muhtemelen işinizi görecekken, RTX 3060'ı hızlı ama sıcak i9-12900H ile eşleştirmenin gerekli olup olmadığını kendinize sorabilirsiniz. İnceleme ünitemizde, sol dokunmatik yüzey düğmesi zaman zaman biraz takılıyordu, ancak diğer Scar modelinde bu sorun yoktu.
Oyuncular, yaklaşık 2.000 € (2.170 ABD Doları) karşılığında harika performansa, çok sayıda güçlü özelliğe ve birkaç dezavantaja sahip mükemmel bir dizüstü bilgisayar alıyor.
Bir RTX 3060 oyun dizüstü bilgisayarı için çalıntı olmasa da, birçok olumlu yönü ve neredeyse var olmayan dezavantajları göz önüne alındığında 2.000 € (2.170 ABD Doları) fiyat etiketi oldukça makul. Daha az para yatırmak isteyenler Asus TUF Gaming F15'i de düşünebilirler. Bu dizüstü bilgisayar daha az özelliğe sahiptir ancak yaklaşık 400 € (U
Fiyat ve bulunabilirlik
İnceleme konfigürasyonu şu anda Cyberport adresinden 1.999 € (2.166 ABD Doları) karşılığında temin edilebilir. Daha az belleğe ve FHD ekrana sahip daha düşük özellikli bir modeli de Amazon'da yaklaşık 1.600 ABD Doları karşılığında bulabilirsiniz.
Asus ROG Strix Scar 15 G533zm
- 04/30/2024 v7 (old)
Christian Hintze


