Dell XPS 13 9340 dizüstü bilgisayar incelemesi - Uzun çalışma sürelerine ve pek çok kusura sahip kompakt alt dizüstü bilgisayar
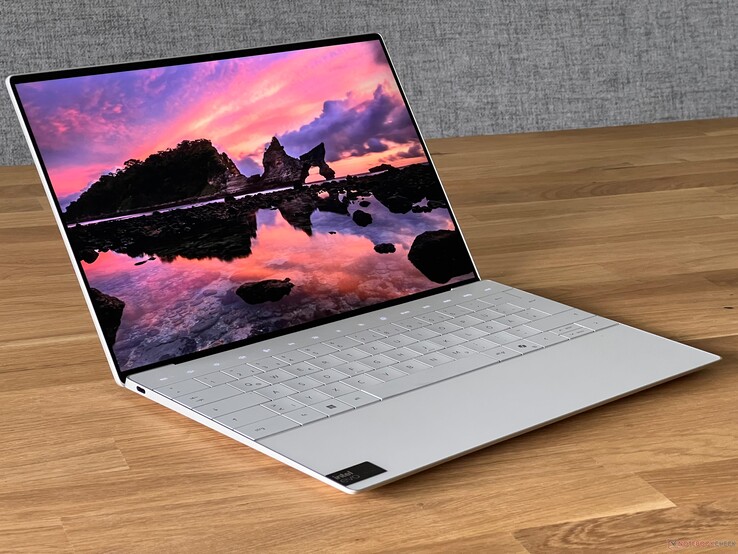
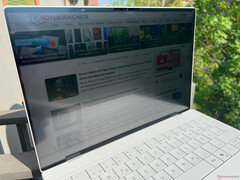
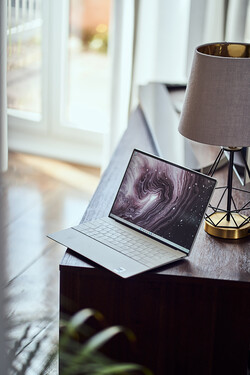
Daha önce en yeni XPS serisinin hem yeni 14 inç hem de 16 inç modellerini test ettikten sonra, şimdi kompakt Dell XPS 13 9340'a bir göz atmanın zamanı geldi. Eski XPS 13 Plusyeni modellerin tasarımına ilham veren bu model artık mevcut değil. Ancak, Dell inceltilmiş bir model sunuyor XPS 13 9315 eski Alder Lake işlemcilerin yanı sıra geleneksel giriş aygıtlarıyla da aynı kasaya sahiptir.
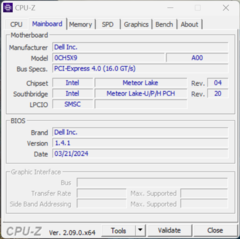
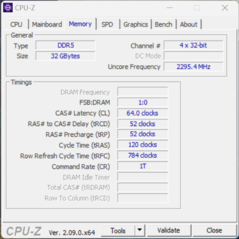
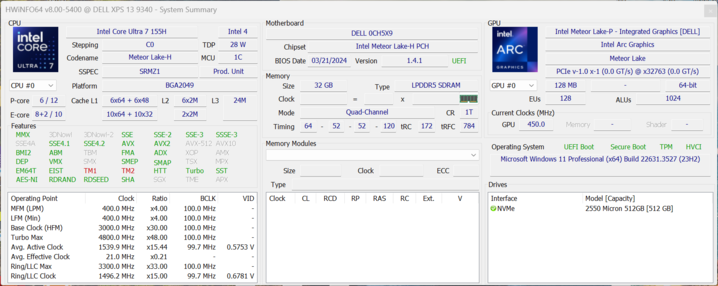
Test cihazımız yeni Meteor Lake işlemci olan Core Ultra 7 155Hile birlikte 32 GB RAM, 512 GB PCIe SSD ve Full HD panel ile donatılmıştır. Dell'in bu konfigürasyon için istediği fiyat 1.599 ABD dolarıdır (Core Ultra 5 ve 16 GB RAM ile tanıtım fiyatı 1.149 ABD dolarıdır). Bu fiyatı maksimum 2.659 ABD dolarına (Core Ultra 7, 64 GB RAM, 2 TB SSD, QHD+) yükseltebilirsiniz.
Karşılaştırmalı olarak olası rakipler
Derecelendirme | Tarih | Modeli | Ağırlık | Yükseklik | Boyut | Çözünürlük | Fiyat |
|---|---|---|---|---|---|---|---|
| 86.5 % v7 (old) | 05/2024 | Dell XPS 13 9340 Core Ultra 7 Ultra 7 155H, Arc 8-Core | 1.2 kg | 15.3 mm | 13.40" | 1920x1200 | |
| 92.4 % v7 (old) | 03/2024 | Apple MacBook Air 13 M3 10C GPU M3, M3 10-Core GPU | 1.2 kg | 11.3 mm | 13.60" | 2560x1664 | |
| 85.4 % v7 (old) | 05/2023 | Asus ZenBook S13 OLED UX5304 i7-1355U, Iris Xe G7 96EUs | 1 kg | 11.8 mm | 13.30" | 2880x1800 | |
| 89.5 % v7 (old) | 01/2024 | Lenovo ThinkPad Z13 Gen 2 R7 PRO 7840U, Radeon 780M | 1.2 kg | 13.99 mm | 13.30" | 2880x1800 | |
| 91.9 % v7 (old) | HP Dragonfly G4 i7-1365U, Iris Xe G7 96EUs | 1.1 kg | 16.3 mm | 13.50" | 1920x1280 |
Top 10
» Top 10 Multimedia Notebook listesi
» Top 10 oyun notebooku
» Top 10 bütçeye uygun Ofis/İş Notebook Listesi
» Top 10 Premium Ofis/İş notebookları
» Top 10 Çalışma istasyonu laptopları
» Top 10 Subnotebook listesi
» Top 10 Ultrabooklar
» En iyi 10 dönüştürülebilir modeli
» Seçimi en iyi 10 tablet
» Notebookcheck Top 10 Windows Tabletleri
» Top 10 Subnotebook listesi
» NotebookCheck tarafından incelenen en iyi Notebook ekranları
» Notebookcheck'in 500 Euro altındaki en iyi 10 Notebook listesi
» NotebookCheck tarafından seçilen 300 Euro altındaki en iyi 10 Notebook
» Notebookcheck'in 500 Euro altındaki en iyi 10 Notebook listesi
» Notebookcheck'in Top 10 akıllı telefon listesi
» Notebookcheck'in Top 10 hafif oyun notebookları
Kasa - Sağlam alüminyum
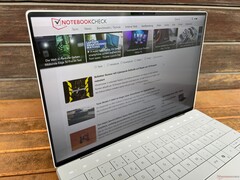
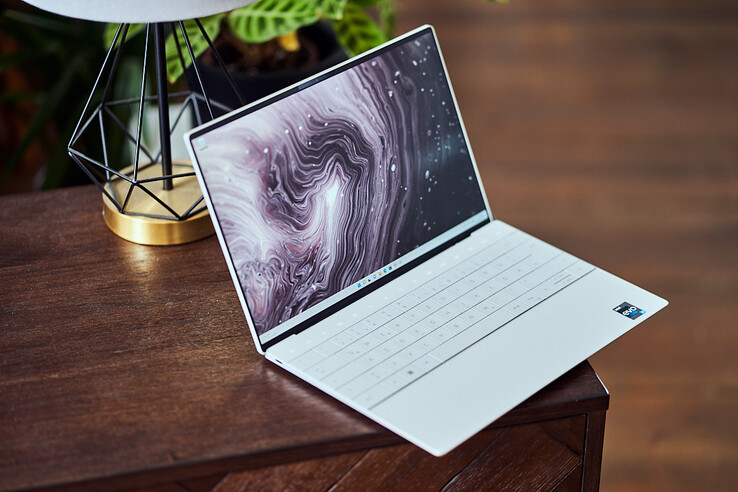
Dell, mevcut XPS tasarımını bir süre önce XPS 13 Plus'ta tanıttı ve şimdi tüm seri için kullanıyor. Tasarımın en iyi küçük XPS 13 9340'ta işe yaradığına inanıyoruz, çünkü cihaz son derece kompakt bir his veriyor (özellikle hantal XPS 14). Üretici, gümüş varyantın yanı sıra koyu gri bir model de sunuyor. Cihaz yüksek kaliteli görünüyor ve herhangi bir yapı sorunu tespit etmedik. Ayrıca, parmak izi mıknatısı gibi de görünmüyor.
Ekran kapağı tek elle kolayca açılabiliyor ve benzersiz giriş aygıtlarının yanı sıra (daha sonra değineceğiz) dizüstü bilgisayarın ince çerçeveleri hemen göze çarpıyor. Menteşeler iyi ayarlanmış, ancak ekranın maksimum açılma açısı ~135 derece ile sınırlı. Ana ünitenin stabilitesi harika ve çok fazla basınç kullanırken bile klavyeyi sadece hafifçe ezebildik. Aynı şey, herhangi bir görüntü hatası elde edemediğimiz ekran kapağı için de söylenebilir.
XPS 13 9340 karşılaştırma grubumuzdaki en kompakt cihazdır ve çok fazla yer kaplamaz. Bu, örneğin seyahat ediyorsanız (tren, uçak) kullanışlıdır. Ancak 1,2 kg'ın biraz üzerindeki ağırlığıyla en hafif model değil. Birlikte verilen 60 watt'lık güç kaynağı da oldukça kompakt ve USB-C kablosuyla birlikte tartıya 256 gram daha ekliyor.
Bağlanabilirlik - Ses girişi olmayan XPS 13
İki büyük kardeşiyle karşılaştırıldığında XPS 13, hem kart okuyucu hem de ses jakı kaldırıldığı için bağlantı noktaları söz konusu olduğunda çok fazla yer açmak zorunda. Her iki tarafta Thunderbolt 4 ile yalnızca bir USB-C bağlantı noktası var. Pratikte, güç kaynağını her iki tarafa da bağlayabilmeniz güzel, ancak bu genellikle yalnızca bir bağlantı noktasını kullanmak için boş bırakır.
İletişim
Intel BE200 WLAN modülü Wi-Fi 7'nin yanı sıra Bluetooth 5.4'ü de destekliyor. WLAN testimiz sırasında, Asus referans yönlendiricimizle birlikte genel olarak yüksek ve istikrarlı aktarım hızları sağladı. Test aşamamızın tamamında herhangi bir sorunla karşılaşmadık.
| Networking | |
| Dell XPS 13 9340 Core Ultra 7 | |
| iperf3 transmit AXE11000 | |
| iperf3 receive AXE11000 | |
| Apple MacBook Air 13 M3 10C GPU | |
| iperf3 transmit AXE11000 | |
| iperf3 receive AXE11000 | |
| Asus ZenBook S13 OLED UX5304 | |
| iperf3 transmit AXE11000 | |
| iperf3 receive AXE11000 | |
| Lenovo ThinkPad Z13 Gen 2 | |
| iperf3 transmit AXE11000 | |
| iperf3 receive AXE11000 | |
| iperf3 transmit AXE11000 6GHz | |
| iperf3 receive AXE11000 6GHz | |
| HP Dragonfly G4 | |
| iperf3 transmit AXE11000 | |
| iperf3 receive AXE11000 | |
| iperf3 transmit AXE11000 6GHz | |
| iperf3 receive AXE11000 6GHz | |
| Dell XPS 13 Plus 9320 Core i7-1360P | |
| iperf3 transmit AXE11000 | |
| iperf3 receive AXE11000 | |
| iperf3 transmit AXE11000 6GHz | |
| iperf3 receive AXE11000 6GHz | |
Web kamerası
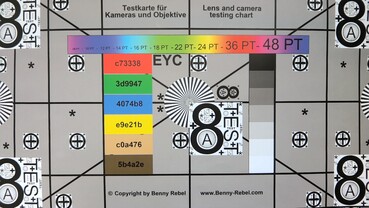
Üst ekran kenarına yerleştirilen 1080p kamera iyi fotoğraflar çekiyor ve Meteor Lake işlemciyle birlikte dizüstü bilgisayarın işletim sisteminin bir parçası olarak stüdyo efektleri (arka plan yumuşak odak gibi) varsayılıyor. Buna ek olarak, cihaz Windows Hello aracılığıyla yüz tanıma için bir IR kamera kullanabilir.
Bakım
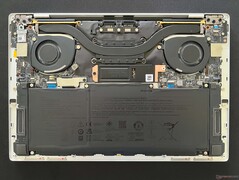
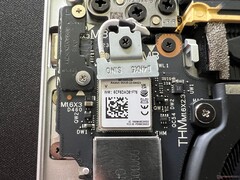
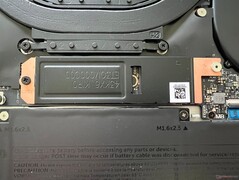
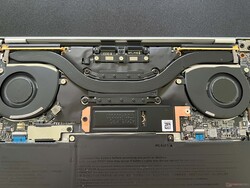
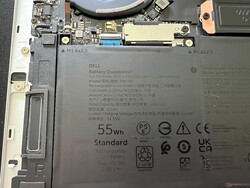
Alt kapak Torx vidalarla (T5) sabitlenmiştir ve kolayca çıkarılabilir. İç kısımda ise bakım seçenekleriniz fanları temizlemek ve ek bir kapağın altında bulunan M.2-2280 SSD'yi değiştirmekle sınırlıdır. Pil vidalıdır ve gerektiğinde değiştirilebilir.
Giriş aygıtları - Klavyeye alışmak biraz zaman alıyor ve rahatsız edici işlev tuşları
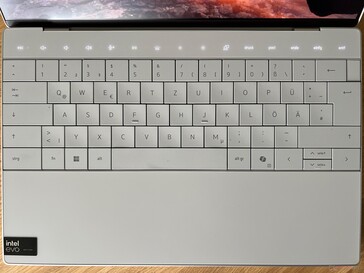
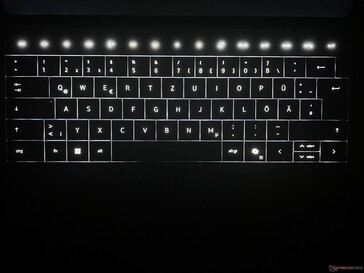
Eski XPS 13 Plus'ta olduğu gibi, bu modelin klavye tasarımında da tek tek tuşlar arasında herhangi bir boşluk bulunmuyor. Tuşların kendileri hafif içbükeydir ve tuş vuruşları hassas olduğu için genel olarak yazması rahattır. Bununla birlikte, birkaç sorun tespit ettik, yani çoğu zaman yanlışlıkla yanlış tuşa bastık ve kesinlikle klavyeye alışmanız gerekiyor. Ayrıca, büyük parmaklarla zar zor vurabileceğiniz küçük dikey ok tuşlarını da biraz can sıkıcı bulduk. Ayrıca, daha büyük tuşların (boşluk çubuğu, enter) sesi oldukça yüksek. Güç düğmesi (parmak izi tarayıcısı dahil) sağ üstte, genellikle Esc tuşunun olmasını beklediğiniz yerde bulunuyor ve bu da bizi bir sonraki sorunumuza getiriyor.
Fonksiyon tuşları, pratikte kullanıcılara herhangi bir ek değer katmayan, aksine oldukça can sıkıcı olan bir dokunmatik çubuk olarak yerleştirilmiştir. Bu, Esc tuşuna körlemesine bile basamayacağınız ve her seferinde tuşlara bakmanız gerektiği anlamına geliyor. Arka aydınlatması da biraz sorunlu, çünkü hareketsizlik dönemlerinde hemen kapanıyor, oysa hiçbir giriş olmadan saatlerce video oynatma sırasında bunu yapmadı. Dahası, klavyenin arka aydınlatmasını devre dışı bırakırsanız, nereye basmanız gerektiğini bilemezsiniz, bu da kullanıcıların arka aydınlatma tekrar açılmadan önce yanlış tuşlara basmasına neden olabilir. Beyaz arka aydınlatmanın kendisi bir sensör aracılığıyla sürekli olarak ayarlanır ve yoğunluğunu hiç değiştiremezsiniz - en azından biz bunu yapmak için bir seçenek bulamadık. Sensör ayrıca kısa bir süre önce arka aydınlatmayı devre dışı bırakıp bırakmadığınızla da ilgilenmiyor çünkü ortam aydınlatma koşulları değişir değişmez arka aydınlatma yeniden etkinleştiriliyor.
Dokunmatik yüzey avuç içi dayanağına tamamen entegre edilmiştir ve görünür bir sınırı yoktur. Dokunmatik yüzey avuç içi dayanağının tüm yüksekliğini kullanıyor ve genişliği sol Alt tuşunun ortasından yeni Copilot tuşunun hemen altına kadar uzanıyor. Genel olarak iyi çalışıyor, güzel ve pürüzsüz ve dokunsal pedin tıklama hissi güzel. Buna karşılık, alanı terk ederseniz veya gerçek dokunmatik yüzey alanının biraz yanında hareketlere başlarsanız zaman zaman sorunlarla karşılaştık. Ancak touchbar'ın aksine bu sadece küçük bir eleştiri noktası.
Ekran - 120 Hz yenileme hızına sahip temel XPS
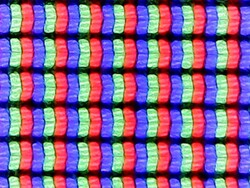
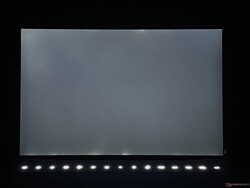
Yeni XPS 13 9340, üç farklı 13,4 inç IPS ekranla sunuluyor. İsteğe bağlı olarak 60 Hz yenileme hızına sahip bir 3K panel (400 cd/m², 300 ABD doları ek ücret) ve 120 Hz yenileme hızına sahip bir QHD+ dokunmatik ekran (500 cd/m², 300 ABD doları ek ücret) seçebilirsiniz. Ancak test örneğimiz, 1.920 x 1.200 çözünürlüğe sahip ve dokunmatik işlevi olmayan temel panelle donatılmıştır. Öznel olarak, görüntü kalitesi daha yüksek 120 Hz frekansından yararlanıyor ve hareketlerin çok düzgün görünmesini sağlıyor. Buna ek olarak, içerik yeterince keskin gösteriliyor, ancak renkler OLED panellerdeki kadar canlı görünmüyor. Dahası, ışıklı alanlar biraz grenli görünüyor. Ekran PWM titremesi kullanmıyor, ancak tepki süreleri biraz yavaş. Arka ışık akması çok büyük bir sorun değil ve parlaklığı bir sensör aracılığıyla otomatik olarak ayarlanıyor.
Dell, test örneğimizin ulaşamadığı 500 cd/m²'lik bir parlaklık belirtiyor. Maksimum 429 cd/m² ve ortalama 400 cd/m²'nin biraz üzerinde bir değer ölçtük. Siyah değeri 0,28 ile makul ve bu en azından ~1.500:1 gibi çok iyi bir maksimum kontrast oranına yol açıyor. Bir diğer sorun ise neredeyse 45 cd/m² olan minimum parlaklığı ki bu çok yüksek.
| |||||||||||||||||||||||||
Aydınlatma: 90 %
Batarya modunda parlaklık: 429 cd/m²
Kontrast: 1532:1 (Siyah: 0.28 cd/m²)
ΔE Color 2.6 | 0.5-29.43 Ø4.87, calibrated: 1.4
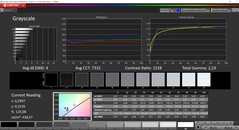
ΔE Greyscale 4 | 0.5-98 Ø5.1
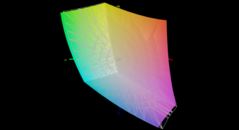
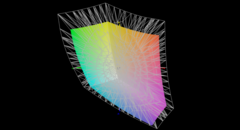
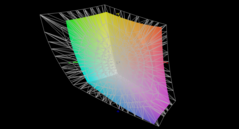
71.7% AdobeRGB 1998 (Argyll 2.2.0 3D)
97.8% sRGB (Argyll 2.2.0 3D)
69.4% Display P3 (Argyll 2.2.0 3D)
Gamma: 2.23
| Dell XPS 13 9340 Core Ultra 7 SHP1593, IPS, 1920x1200, 13.4" | Apple MacBook Air 13 M3 10C GPU IPS, 2560x1664, 13.6" | Asus ZenBook S13 OLED UX5304 SDC417B, OLED, 2880x1800, 13.3" | Lenovo ThinkPad Z13 Gen 2 ATNA33AA02-0, OLED, 2880x1800, 13.3" | HP Dragonfly G4 Chi Mei CMN13C0, IPS, 1920x1280, 13.5" | Dell XPS 13 Plus 9320 Core i7-1360P Samsung 134XK04, OLED, 3456x2160, 13.4" | |
|---|---|---|---|---|---|---|
| Display | 22% | 27% | 27% | -1% | 27% | |
| Display P3 Coverage | 69.4 | 98.4 42% | 99.7 44% | 99.7 44% | 68.4 -1% | 99.7 44% |
| sRGB Coverage | 97.8 | 99.9 2% | 100 2% | 100 2% | 98.3 1% | 100 2% |
| AdobeRGB 1998 Coverage | 71.7 | 87.9 23% | 96.9 35% | 97.3 36% | 70.4 -2% | 96.8 35% |
| Response Times | 11% | 95% | 94% | -13% | 94% | |
| Response Time Grey 50% / Grey 80% * | 43.2 ? | 34.5 ? 20% | 2 ? 95% | 2.1 ? 95% | 48.8 ? -13% | 2.18 ? 95% |
| Response Time Black / White * | 27.6 ? | 27.2 ? 1% | 1.6 ? 94% | 2.2 ? 92% | 31.3 ? -13% | 2.08 ? 92% |
| PWM Frequency | 240 ? | 60.1 ? | 238.6 ? | |||
| Screen | 17% | 30% | 29% | 14% | -39% | |
| Brightness middle | 429 | 525 22% | 361 -16% | 372 -13% | 408.8 -5% | 361.7 -16% |
| Brightness | 407 | 506 24% | 365 -10% | 375 -8% | 399 -2% | 367 -10% |
| Brightness Distribution | 90 | 92 2% | 98 9% | 99 10% | 90 0% | 96 7% |
| Black Level * | 0.28 | 0.42 -50% | 0.32 -14% | |||
| Contrast | 1532 | 1250 -18% | 1278 -17% | |||
| Colorchecker dE 2000 * | 2.6 | 1.4 46% | 1.2 54% | 0.88 66% | 2.02 22% | 4.83 -86% |
| Colorchecker dE 2000 max. * | 6.6 | 2.8 58% | 1.9 71% | 3.22 51% | 3.84 42% | 9.34 -42% |
| Colorchecker dE 2000 calibrated * | 1.4 | 0.61 56% | 3.97 -184% | |||
| Greyscale dE 2000 * | 4 | 2 50% | 1.2 70% | 1.2 70% | 2.3 42% | 1.8 55% |
| Gamma | 2.23 99% | 2.2 100% | 2.27 97% | 2.18 101% | 2.2 100% | 2.33 94% |
| CCT | 7332 89% | 6876 95% | 6486 100% | 6326 103% | 6203 105% | 6438 101% |
| Toplam Ortalama (Program / Ayarlar) | 17% /
17% | 51% /
41% | 50% /
40% | 0% /
7% | 27% /
-1% |
* ... daha küçük daha iyidir
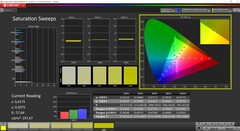
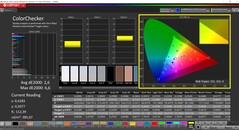
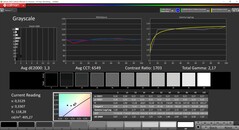
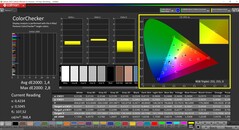
Paneli profesyonel CalMAN yazılımını (X-Rite i1 Pro 2) kullanarak ölçtük ve kutudan çıkar çıkmaz kalibrasyonunun pek de iyi olmadığını gördük. Kayda değer bir mavi renk tonu olduğunu ve renk sıcaklığının çok soğuk olduğunu gördük. Ayrıca, gri tonlama sapmaları ve epeyce renk sapması hedef değer olan 3'ün üzerinde. Kendi kalibrasyonumuzu kullanarak (profil yukarıda ücretsiz olarak indirilebilir), tasvirini önemli ölçüde iyileştirebildik, ancak bu, ekranın maksimum parlaklığını yaklaşık 25 cd/m² azaltıyor. Küçük sRGB renk alanı neredeyse tamamen kaplıdır, bu nedenle paneli resimleri düzenlemek için de kullanabilirsiniz.
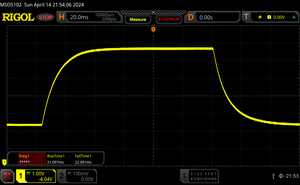
Yanıt Sürelerini Görüntüle
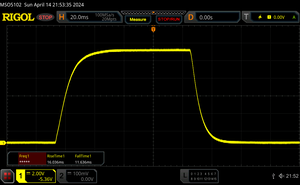
| ↔ Tepki Süresi Siyahtan Beyaza | ||
|---|---|---|
| 27.6 ms ... yükseliş ↗ ve sonbahar↘ birleşimi | ↗ 16 ms yükseliş | |
| ↘ 11.6 ms sonbahar | ||
| Ekran, testlerimizde nispeten yavaş yanıt oranları gösteriyor ve oyuncular için çok yavaş olabilir. Karşılaştırıldığında, test edilen tüm cihazlar 0.1 (minimum) ile 240 (maksimum) ms arasında değişir. » Tüm cihazların 68 %'si daha iyi. Bu, ölçülen yanıt süresinin test edilen tüm cihazların ortalamasından (20.7 ms) daha kötü olduğu anlamına gelir. | ||
| ↔ Tepki Süresi %50 Griden %80 Griye | ||
| 43.2 ms ... yükseliş ↗ ve sonbahar↘ birleşimi | ↗ 21.1 ms yükseliş | |
| ↘ 22.1 ms sonbahar | ||
| Ekran, testlerimizde yavaş yanıt oranları gösteriyor ve oyuncular için yetersiz olacaktır. Karşılaştırıldığında, test edilen tüm cihazlar 0.165 (minimum) ile 636 (maksimum) ms arasında değişir. » Tüm cihazların 70 %'si daha iyi. Bu, ölçülen yanıt süresinin test edilen tüm cihazların ortalamasından (32.5 ms) daha kötü olduğu anlamına gelir. | ||
Ekran Titremesi / PWM (Darbe Genişliği Modülasyonu)
| Ekran titriyor / PWM algılanmadı | |||
Karşılaştırıldığında: Test edilen tüm cihazların %53 %'si ekranı karartmak için PWM kullanmıyor. PWM tespit edilirse, ortalama 8492 (minimum: 5 - maksimum: 343500) Hz ölçüldü. | |||
Performans - 64 GB'a kadar RAM'e sahip XPS 13
Dell, yeni XPS 13 9340'ı yalnızca Intel'in Meteor Lake işlemcileriyle (Core Ultra 5/7) sunuyor ve özel bir grafik kartı yok. 8, 16, 32 veya 64 GB RAM seçenekleri vardır (8 GB yalnızca Core Ultra 7 155H ile, Core Ultra 5 125H yalnızca 16 GB ile kullanılabilir).
Test koşulları
MyDell yazılımı içinde çeşitli performans modları mevcuttur, ancak bunlar arasında bir tuş kombinasyonu ile geçiş yapılamaz. Aşağıdaki testler için optimize edilmiş modu kullandık.
İşlemci - Core Ultra 7 155H
Bu Core Ultra 7 155H intel'in mevcut Meteor Lake nesline aittir ve eski Intel'in halefidir Core i7-13700H. XPS 13'te, işlemci kısa patlamalarda maksimum 45 watt tüketebilir, ancak sürekli yük altında, 5 dakika sonra yaklaşık 24 watt'ta dengelenir (~% 40 daha az performans). Çok çekirdekli testlerin başlangıcında, performansı iyiydi, ancak eskisinden çok daha iyi değildi Core i7-1360P i̇ki performans çekirdeği daha az. Ayrıca, tek çekirdek performansı da eski XPS 13'e göre daha kötü. Apple's M3 SoC tek çekirdekli testlerde de çok daha hızlıydı ancak çok çekirdekli testlerde daha yavaştı. Pil kullanımında işlemci kısa bir süre için 42 watt tükettikten sonra hemen 20 watt'a düşebiliyor. Bu da prizden uzakta çok çekirdekli performansının yaklaşık %43 azaldığı anlamına geliyor. Diğer CPU kıyaslamalarını şurada bulabilirsiniz teknoloji̇ bölümümüz.
Cinebench R15 Multi continuous test
Cinebench R23: Multi Core | Single Core
Cinebench R20: CPU (Multi Core) | CPU (Single Core)
Cinebench R15: CPU Multi 64Bit | CPU Single 64Bit
Blender: v2.79 BMW27 CPU
7-Zip 18.03: 7z b 4 | 7z b 4 -mmt1
Geekbench 6.4: Multi-Core | Single-Core
Geekbench 5.5: Multi-Core | Single-Core
HWBOT x265 Benchmark v2.2: 4k Preset
LibreOffice : 20 Documents To PDF
R Benchmark 2.5: Overall mean
| CPU Performance Rating | |
| Ortalama Intel Core Ultra 7 155H | |
| Lenovo ThinkPad Z13 Gen 2 | |
| Apple MacBook Air 13 M3 10C GPU -9! | |
| Dell XPS 13 9340 Core Ultra 7 | |
| Dell XPS 13 Plus 9320 Core i7-1360P -2! | |
| Sınıf ortalaması Subnotebook | |
| HP Dragonfly G4 -2! | |
| Asus ZenBook S13 OLED UX5304 -2! | |
| Cinebench R23 / Multi Core | |
| Ortalama Intel Core Ultra 7 155H (9769 - 19007, n=52) | |
| Lenovo ThinkPad Z13 Gen 2 | |
| Dell XPS 13 9340 Core Ultra 7 | |
| Sınıf ortalaması Subnotebook (1555 - 21812, n=74, son 2 yıl) | |
| Dell XPS 13 Plus 9320 Core i7-1360P | |
| Apple MacBook Air 13 M3 10C GPU | |
| HP Dragonfly G4 | |
| Asus ZenBook S13 OLED UX5304 | |
| Cinebench R23 / Single Core | |
| Apple MacBook Air 13 M3 10C GPU | |
| HP Dragonfly G4 | |
| Dell XPS 13 Plus 9320 Core i7-1360P | |
| Asus ZenBook S13 OLED UX5304 | |
| Ortalama Intel Core Ultra 7 155H (1496 - 1815, n=52) | |
| Lenovo ThinkPad Z13 Gen 2 | |
| Dell XPS 13 9340 Core Ultra 7 | |
| Sınıf ortalaması Subnotebook (358 - 2165, n=74, son 2 yıl) | |
| Cinebench R20 / CPU (Multi Core) | |
| Ortalama Intel Core Ultra 7 155H (3798 - 7409, n=50) | |
| Lenovo ThinkPad Z13 Gen 2 | |
| Dell XPS 13 9340 Core Ultra 7 | |
| Sınıf ortalaması Subnotebook (579 - 8541, n=69, son 2 yıl) | |
| Dell XPS 13 Plus 9320 Core i7-1360P | |
| HP Dragonfly G4 | |
| Asus ZenBook S13 OLED UX5304 | |
| Cinebench R20 / CPU (Single Core) | |
| Dell XPS 13 Plus 9320 Core i7-1360P | |
| HP Dragonfly G4 | |
| Asus ZenBook S13 OLED UX5304 | |
| Lenovo ThinkPad Z13 Gen 2 | |
| Ortalama Intel Core Ultra 7 155H (601 - 696, n=50) | |
| Dell XPS 13 9340 Core Ultra 7 | |
| Sınıf ortalaması Subnotebook (128 - 826, n=69, son 2 yıl) | |
| Cinebench R15 / CPU Multi 64Bit | |
| Ortalama Intel Core Ultra 7 155H (1932 - 2880, n=56) | |
| Dell XPS 13 9340 Core Ultra 7 | |
| Lenovo ThinkPad Z13 Gen 2 | |
| Dell XPS 13 Plus 9320 Core i7-1360P | |
| Sınıf ortalaması Subnotebook (327 - 3345, n=74, son 2 yıl) | |
| Asus ZenBook S13 OLED UX5304 | |
| HP Dragonfly G4 | |
| Cinebench R15 / CPU Single 64Bit | |
| Dell XPS 13 Plus 9320 Core i7-1360P | |
| Lenovo ThinkPad Z13 Gen 2 | |
| HP Dragonfly G4 | |
| Dell XPS 13 9340 Core Ultra 7 | |
| Sınıf ortalaması Subnotebook (72.4 - 322, n=70, son 2 yıl) | |
| Ortalama Intel Core Ultra 7 155H (99.6 - 268, n=52) | |
| Asus ZenBook S13 OLED UX5304 | |
| Blender / v2.79 BMW27 CPU | |
| Apple MacBook Air 13 M3 10C GPU | |
| Asus ZenBook S13 OLED UX5304 | |
| Asus ZenBook S13 OLED UX5304 | |
| HP Dragonfly G4 | |
| Sınıf ortalaması Subnotebook (159 - 2271, n=72, son 2 yıl) | |
| Dell XPS 13 Plus 9320 Core i7-1360P | |
| Dell XPS 13 9340 Core Ultra 7 | |
| Lenovo ThinkPad Z13 Gen 2 | |
| Ortalama Intel Core Ultra 7 155H (175 - 381, n=47) | |
| 7-Zip 18.03 / 7z b 4 | |
| Ortalama Intel Core Ultra 7 155H (41739 - 70254, n=50) | |
| Lenovo ThinkPad Z13 Gen 2 | |
| Dell XPS 13 9340 Core Ultra 7 | |
| Dell XPS 13 Plus 9320 Core i7-1360P | |
| Sınıf ortalaması Subnotebook (11668 - 77867, n=65, son 2 yıl) | |
| HP Dragonfly G4 | |
| Asus ZenBook S13 OLED UX5304 | |
| 7-Zip 18.03 / 7z b 4 -mmt1 | |
| HP Dragonfly G4 | |
| Asus ZenBook S13 OLED UX5304 | |
| Lenovo ThinkPad Z13 Gen 2 | |
| Dell XPS 13 Plus 9320 Core i7-1360P | |
| Sınıf ortalaması Subnotebook (2643 - 6442, n=67, son 2 yıl) | |
| Dell XPS 13 9340 Core Ultra 7 | |
| Ortalama Intel Core Ultra 7 155H (4594 - 5621, n=50) | |
| Geekbench 6.4 / Multi-Core | |
| Ortalama Intel Core Ultra 7 155H (7732 - 13656, n=55) | |
| Lenovo ThinkPad Z13 Gen 2 | |
| Apple MacBook Air 13 M3 10C GPU | |
| Dell XPS 13 9340 Core Ultra 7 | |
| Sınıf ortalaması Subnotebook (2244 - 17489, n=74, son 2 yıl) | |
| Geekbench 6.4 / Single-Core | |
| Apple MacBook Air 13 M3 10C GPU | |
| Sınıf ortalaması Subnotebook (960 - 3820, n=69, son 2 yıl) | |
| Lenovo ThinkPad Z13 Gen 2 | |
| Dell XPS 13 9340 Core Ultra 7 | |
| Ortalama Intel Core Ultra 7 155H (1901 - 2473, n=52) | |
| Geekbench 5.5 / Multi-Core | |
| Ortalama Intel Core Ultra 7 155H (10017 - 13556, n=52) | |
| Dell XPS 13 9340 Core Ultra 7 | |
| Lenovo ThinkPad Z13 Gen 2 | |
| Dell XPS 13 Plus 9320 Core i7-1360P | |
| Apple MacBook Air 13 M3 10C GPU | |
| Sınıf ortalaması Subnotebook (2557 - 17218, n=66, son 2 yıl) | |
| HP Dragonfly G4 | |
| Asus ZenBook S13 OLED UX5304 | |
| Geekbench 5.5 / Single-Core | |
| Apple MacBook Air 13 M3 10C GPU | |
| HP Dragonfly G4 | |
| Lenovo ThinkPad Z13 Gen 2 | |
| Sınıf ortalaması Subnotebook (726 - 2350, n=66, son 2 yıl) | |
| Dell XPS 13 Plus 9320 Core i7-1360P | |
| Asus ZenBook S13 OLED UX5304 | |
| Dell XPS 13 9340 Core Ultra 7 | |
| Ortalama Intel Core Ultra 7 155H (1462 - 1824, n=52) | |
| HWBOT x265 Benchmark v2.2 / 4k Preset | |
| Lenovo ThinkPad Z13 Gen 2 | |
| Ortalama Intel Core Ultra 7 155H (9.93 - 21.2, n=50) | |
| Dell XPS 13 9340 Core Ultra 7 | |
| Dell XPS 13 Plus 9320 Core i7-1360P | |
| Sınıf ortalaması Subnotebook (0.97 - 25.1, n=68, son 2 yıl) | |
| HP Dragonfly G4 | |
| Asus ZenBook S13 OLED UX5304 | |
| LibreOffice / 20 Documents To PDF | |
| Sınıf ortalaması Subnotebook (38.5 - 220, n=66, son 2 yıl) | |
| Ortalama Intel Core Ultra 7 155H (37.5 - 79.2, n=49) | |
| Lenovo ThinkPad Z13 Gen 2 | |
| Dell XPS 13 9340 Core Ultra 7 | |
| Asus ZenBook S13 OLED UX5304 | |
| Dell XPS 13 Plus 9320 Core i7-1360P | |
| HP Dragonfly G4 | |
| R Benchmark 2.5 / Overall mean | |
| Sınıf ortalaması Subnotebook (0.403 - 1.456, n=68, son 2 yıl) | |
| Dell XPS 13 9340 Core Ultra 7 | |
| Ortalama Intel Core Ultra 7 155H (0.4457 - 0.53, n=49) | |
| Lenovo ThinkPad Z13 Gen 2 | |
| Asus ZenBook S13 OLED UX5304 | |
| Dell XPS 13 Plus 9320 Core i7-1360P | |
| HP Dragonfly G4 | |
* ... daha küçük daha iyidir
AIDA64: FP32 Ray-Trace | FPU Julia | CPU SHA3 | CPU Queen | FPU SinJulia | FPU Mandel | CPU AES | CPU ZLib | FP64 Ray-Trace | CPU PhotoWorxx
| Performance Rating | |
| Lenovo ThinkPad Z13 Gen 2 | |
| Ortalama Intel Core Ultra 7 155H | |
| Dell XPS 13 9340 Core Ultra 7 | |
| Sınıf ortalaması Subnotebook | |
| Dell XPS 13 Plus 9320 Core i7-1360P | |
| HP Dragonfly G4 | |
| Asus ZenBook S13 OLED UX5304 | |
| AIDA64 / FP32 Ray-Trace | |
| Lenovo ThinkPad Z13 Gen 2 | |
| Ortalama Intel Core Ultra 7 155H (6670 - 18470, n=50) | |
| Sınıf ortalaması Subnotebook (1135 - 32888, n=68, son 2 yıl) | |
| Dell XPS 13 9340 Core Ultra 7 | |
| Dell XPS 13 Plus 9320 Core i7-1360P | |
| HP Dragonfly G4 | |
| Asus ZenBook S13 OLED UX5304 | |
| AIDA64 / FPU Julia | |
| Lenovo ThinkPad Z13 Gen 2 | |
| Ortalama Intel Core Ultra 7 155H (40905 - 93181, n=50) | |
| Dell XPS 13 9340 Core Ultra 7 | |
| Sınıf ortalaması Subnotebook (5218 - 123315, n=68, son 2 yıl) | |
| Dell XPS 13 Plus 9320 Core i7-1360P | |
| HP Dragonfly G4 | |
| Asus ZenBook S13 OLED UX5304 | |
| AIDA64 / CPU SHA3 | |
| Lenovo ThinkPad Z13 Gen 2 | |
| Ortalama Intel Core Ultra 7 155H (1940 - 4436, n=50) | |
| Dell XPS 13 9340 Core Ultra 7 | |
| Sınıf ortalaması Subnotebook (444 - 5287, n=68, son 2 yıl) | |
| Dell XPS 13 Plus 9320 Core i7-1360P | |
| HP Dragonfly G4 | |
| Asus ZenBook S13 OLED UX5304 | |
| AIDA64 / CPU Queen | |
| Lenovo ThinkPad Z13 Gen 2 | |
| Dell XPS 13 Plus 9320 Core i7-1360P | |
| Ortalama Intel Core Ultra 7 155H (64698 - 94181, n=50) | |
| Dell XPS 13 9340 Core Ultra 7 | |
| Sınıf ortalaması Subnotebook (10579 - 115682, n=68, son 2 yıl) | |
| HP Dragonfly G4 | |
| Asus ZenBook S13 OLED UX5304 | |
| AIDA64 / FPU SinJulia | |
| Lenovo ThinkPad Z13 Gen 2 | |
| Ortalama Intel Core Ultra 7 155H (5639 - 10647, n=50) | |
| Dell XPS 13 9340 Core Ultra 7 | |
| Sınıf ortalaması Subnotebook (744 - 18418, n=68, son 2 yıl) | |
| Dell XPS 13 Plus 9320 Core i7-1360P | |
| HP Dragonfly G4 | |
| Asus ZenBook S13 OLED UX5304 | |
| AIDA64 / FPU Mandel | |
| Lenovo ThinkPad Z13 Gen 2 | |
| Ortalama Intel Core Ultra 7 155H (18236 - 47685, n=50) | |
| Sınıf ortalaması Subnotebook (3341 - 65433, n=68, son 2 yıl) | |
| Dell XPS 13 9340 Core Ultra 7 | |
| Dell XPS 13 Plus 9320 Core i7-1360P | |
| HP Dragonfly G4 | |
| Asus ZenBook S13 OLED UX5304 | |
| AIDA64 / CPU AES | |
| Ortalama Intel Core Ultra 7 155H (45713 - 152179, n=50) | |
| Lenovo ThinkPad Z13 Gen 2 | |
| Dell XPS 13 9340 Core Ultra 7 | |
| Sınıf ortalaması Subnotebook (638 - 161430, n=68, son 2 yıl) | |
| Dell XPS 13 Plus 9320 Core i7-1360P | |
| HP Dragonfly G4 | |
| Asus ZenBook S13 OLED UX5304 | |
| AIDA64 / CPU ZLib | |
| Ortalama Intel Core Ultra 7 155H (557 - 1250, n=50) | |
| Lenovo ThinkPad Z13 Gen 2 | |
| Dell XPS 13 9340 Core Ultra 7 | |
| Dell XPS 13 Plus 9320 Core i7-1360P | |
| Sınıf ortalaması Subnotebook (164.9 - 1379, n=68, son 2 yıl) | |
| HP Dragonfly G4 | |
| Asus ZenBook S13 OLED UX5304 | |
| AIDA64 / FP64 Ray-Trace | |
| Lenovo ThinkPad Z13 Gen 2 | |
| Sınıf ortalaması Subnotebook (610 - 17495, n=68, son 2 yıl) | |
| Ortalama Intel Core Ultra 7 155H (3569 - 9802, n=50) | |
| Dell XPS 13 9340 Core Ultra 7 | |
| Dell XPS 13 Plus 9320 Core i7-1360P | |
| HP Dragonfly G4 | |
| Asus ZenBook S13 OLED UX5304 | |
| AIDA64 / CPU PhotoWorxx | |
| Dell XPS 13 9340 Core Ultra 7 | |
| Dell XPS 13 Plus 9320 Core i7-1360P | |
| Ortalama Intel Core Ultra 7 155H (32719 - 54223, n=50) | |
| Sınıf ortalaması Subnotebook (6569 - 64588, n=68, son 2 yıl) | |
| Asus ZenBook S13 OLED UX5304 | |
| Lenovo ThinkPad Z13 Gen 2 | |
| HP Dragonfly G4 | |
Sistem performansı
XPS 13 günlük kullanımda duyarlı bir cihaz ve kıyaslama sonuçları da iyiydi. Testimiz sırasında herhangi bir stabilite sorunu tespit edemedik.
CrossMark: Overall | Productivity | Creativity | Responsiveness
WebXPRT 3: Overall
WebXPRT 4: Overall
Mozilla Kraken 1.1: Total
| PCMark 10 / Score | |
| Lenovo ThinkPad Z13 Gen 2 | |
| Ortalama Intel Core Ultra 7 155H, Intel Arc 8-Core iGPU (4809 - 7529, n=34) | |
| Sınıf ortalaması Subnotebook (4993 - 7788, n=57, son 2 yıl) | |
| Dell XPS 13 9340 Core Ultra 7 | |
| Dell XPS 13 Plus 9320 Core i7-1360P | |
| HP Dragonfly G4 | |
| Asus ZenBook S13 OLED UX5304 | |
| PCMark 10 / Essentials | |
| Dell XPS 13 Plus 9320 Core i7-1360P | |
| Lenovo ThinkPad Z13 Gen 2 | |
| HP Dragonfly G4 | |
| Dell XPS 13 9340 Core Ultra 7 | |
| Asus ZenBook S13 OLED UX5304 | |
| Sınıf ortalaması Subnotebook (9363 - 11331, n=57, son 2 yıl) | |
| Ortalama Intel Core Ultra 7 155H, Intel Arc 8-Core iGPU (7605 - 11289, n=34) | |
| PCMark 10 / Productivity | |
| Lenovo ThinkPad Z13 Gen 2 | |
| Sınıf ortalaması Subnotebook (5435 - 10623, n=57, son 2 yıl) | |
| Ortalama Intel Core Ultra 7 155H, Intel Arc 8-Core iGPU (6042 - 10591, n=34) | |
| Dell XPS 13 9340 Core Ultra 7 | |
| Dell XPS 13 Plus 9320 Core i7-1360P | |
| HP Dragonfly G4 | |
| Asus ZenBook S13 OLED UX5304 | |
| PCMark 10 / Digital Content Creation | |
| Ortalama Intel Core Ultra 7 155H, Intel Arc 8-Core iGPU (4985 - 10709, n=34) | |
| Lenovo ThinkPad Z13 Gen 2 | |
| Sınıf ortalaması Subnotebook (5305 - 12442, n=57, son 2 yıl) | |
| Dell XPS 13 9340 Core Ultra 7 | |
| Dell XPS 13 Plus 9320 Core i7-1360P | |
| HP Dragonfly G4 | |
| Asus ZenBook S13 OLED UX5304 | |
| CrossMark / Overall | |
| Apple MacBook Air 13 M3 10C GPU | |
| Dell XPS 13 Plus 9320 Core i7-1360P | |
| Dell XPS 13 9340 Core Ultra 7 | |
| Ortalama Intel Core Ultra 7 155H, Intel Arc 8-Core iGPU (1366 - 1903, n=34) | |
| HP Dragonfly G4 | |
| Sınıf ortalaması Subnotebook (365 - 2038, n=67, son 2 yıl) | |
| Asus ZenBook S13 OLED UX5304 | |
| Lenovo ThinkPad Z13 Gen 2 | |
| CrossMark / Productivity | |
| Apple MacBook Air 13 M3 10C GPU | |
| Dell XPS 13 Plus 9320 Core i7-1360P | |
| HP Dragonfly G4 | |
| Dell XPS 13 9340 Core Ultra 7 | |
| Ortalama Intel Core Ultra 7 155H, Intel Arc 8-Core iGPU (1291 - 1798, n=33) | |
| Asus ZenBook S13 OLED UX5304 | |
| Sınıf ortalaması Subnotebook (364 - 1918, n=67, son 2 yıl) | |
| Lenovo ThinkPad Z13 Gen 2 | |
| CrossMark / Creativity | |
| Apple MacBook Air 13 M3 10C GPU | |
| Dell XPS 13 Plus 9320 Core i7-1360P | |
| Dell XPS 13 9340 Core Ultra 7 | |
| Lenovo ThinkPad Z13 Gen 2 | |
| Ortalama Intel Core Ultra 7 155H, Intel Arc 8-Core iGPU (1519 - 1929, n=33) | |
| Sınıf ortalaması Subnotebook (372 - 2396, n=67, son 2 yıl) | |
| HP Dragonfly G4 | |
| Asus ZenBook S13 OLED UX5304 | |
| CrossMark / Responsiveness | |
| Dell XPS 13 Plus 9320 Core i7-1360P | |
| Ortalama Intel Core Ultra 7 155H, Intel Arc 8-Core iGPU (939 - 1802, n=33) | |
| Dell XPS 13 9340 Core Ultra 7 | |
| Asus ZenBook S13 OLED UX5304 | |
| HP Dragonfly G4 | |
| Apple MacBook Air 13 M3 10C GPU | |
| Sınıf ortalaması Subnotebook (312 - 1899, n=67, son 2 yıl) | |
| Lenovo ThinkPad Z13 Gen 2 | |
| WebXPRT 3 / Overall | |
| Apple MacBook Air 13 M3 10C GPU | |
| Sınıf ortalaması Subnotebook (156 - 482, n=66, son 2 yıl) | |
| Dell XPS 13 Plus 9320 Core i7-1360P | |
| HP Dragonfly G4 | |
| Lenovo ThinkPad Z13 Gen 2 | |
| Asus ZenBook S13 OLED UX5304 | |
| Ortalama Intel Core Ultra 7 155H, Intel Arc 8-Core iGPU (252 - 299, n=34) | |
| Dell XPS 13 9340 Core Ultra 7 | |
| WebXPRT 4 / Overall | |
| Apple MacBook Air 13 M3 10C GPU | |
| Dell XPS 13 Plus 9320 Core i7-1360P | |
| HP Dragonfly G4 | |
| Sınıf ortalaması Subnotebook (132 - 348, n=67, son 2 yıl) | |
| Dell XPS 13 9340 Core Ultra 7 | |
| Asus ZenBook S13 OLED UX5304 | |
| Ortalama Intel Core Ultra 7 155H, Intel Arc 8-Core iGPU (166.4 - 309, n=29) | |
| Lenovo ThinkPad Z13 Gen 2 | |
| Mozilla Kraken 1.1 / Total | |
| Lenovo ThinkPad Z13 Gen 2 | |
| Ortalama Intel Core Ultra 7 155H, Intel Arc 8-Core iGPU (517 - 614, n=35) | |
| Dell XPS 13 9340 Core Ultra 7 | |
| Asus ZenBook S13 OLED UX5304 | |
| Sınıf ortalaması Subnotebook (265 - 1104, n=75, son 2 yıl) | |
| Dell XPS 13 Plus 9320 Core i7-1360P | |
| HP Dragonfly G4 | |
| Apple MacBook Air 13 M3 10C GPU | |
* ... daha küçük daha iyidir
| PCMark 10 Score | 6555 puan | |
Yardım | ||
| AIDA64 / Memory Copy | |
| Dell XPS 13 9340 Core Ultra 7 | |
| Ortalama Intel Core Ultra 7 155H (62397 - 96791, n=50) | |
| Sınıf ortalaması Subnotebook (14554 - 109035, n=68, son 2 yıl) | |
| Dell XPS 13 Plus 9320 Core i7-1360P | |
| Lenovo ThinkPad Z13 Gen 2 | |
| Asus ZenBook S13 OLED UX5304 | |
| HP Dragonfly G4 | |
| AIDA64 / Memory Read | |
| Dell XPS 13 9340 Core Ultra 7 | |
| Ortalama Intel Core Ultra 7 155H (60544 - 90647, n=50) | |
| Sınıf ortalaması Subnotebook (15948 - 122210, n=68, son 2 yıl) | |
| Dell XPS 13 Plus 9320 Core i7-1360P | |
| Lenovo ThinkPad Z13 Gen 2 | |
| Asus ZenBook S13 OLED UX5304 | |
| HP Dragonfly G4 | |
| AIDA64 / Memory Write | |
| Lenovo ThinkPad Z13 Gen 2 | |
| Dell XPS 13 Plus 9320 Core i7-1360P | |
| Sınıf ortalaması Subnotebook (15709 - 117898, n=68, son 2 yıl) | |
| Dell XPS 13 9340 Core Ultra 7 | |
| Ortalama Intel Core Ultra 7 155H (58692 - 93451, n=50) | |
| Asus ZenBook S13 OLED UX5304 | |
| HP Dragonfly G4 | |
| AIDA64 / Memory Latency | |
| Ortalama Intel Core Ultra 7 155H (116.2 - 233, n=50) | |
| Lenovo ThinkPad Z13 Gen 2 | |
| Dell XPS 13 9340 Core Ultra 7 | |
| Sınıf ortalaması Subnotebook (7.2 - 187.8, n=67, son 2 yıl) | |
| Dell XPS 13 Plus 9320 Core i7-1360P | |
| HP Dragonfly G4 | |
| Asus ZenBook S13 OLED UX5304 | |
* ... daha küçük daha iyidir
DPC gecikme süreleri
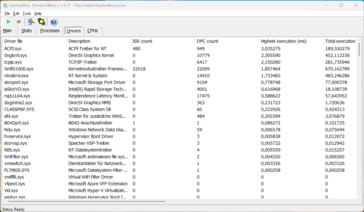
Standartlaştırılmış gecikme testimizde (internette gezinme, 4K YouTube oynatma, CPU yükü), mevcut BIOS sürümüne sahip test cihazı, gerçek zamanlı ses uygulamalarını kullanırken hiçbir sınırlama göstermedi. Bir sürücü sapma gösterse de, önemli "kesme-işlem gecikmesi" değeri çok düşüktü.
| DPC Latencies / LatencyMon - interrupt to process latency (max), Web, Youtube, Prime95 | |
| Dell XPS 13 Plus 9320 Core i7-1360P | |
| Lenovo ThinkPad Z13 Gen 2 | |
| Asus ZenBook S13 OLED UX5304 | |
| HP Dragonfly G4 | |
| Dell XPS 13 9340 Core Ultra 7 | |
* ... daha küçük daha iyidir
Depolama cihazı
Test cihazımız 512 GB kapasiteli PCIe 4.0 SSD Micron 2550 ile donatılmıştır ve bunun 371 GB'ı ilk çalıştırmadan sonra hala kullanılabilir durumdadır. Aktarım hızları, maksimum 4 GB/s'den fazla olacak şekilde mükemmeldir ve uzun süreli yük altında bile performansta gözle görülür bir düşüş yoktur. Diğer SSD kıyaslamaları listelenmiştir burada.
| Drive Performance Rating - Percent | |
| Dell XPS 13 Plus 9320 Core i7-1360P | |
| Asus ZenBook S13 OLED UX5304 | |
| Sınıf ortalaması Subnotebook | |
| Dell XPS 13 9340 Core Ultra 7 | |
| HP Dragonfly G4 | |
| Ortalama Micron 2550 512GB | |
| Lenovo ThinkPad Z13 Gen 2 | |
* ... daha küçük daha iyidir
Reading continuous performance: DiskSpd Read Loop, Queue Depth 8
Grafik kartı
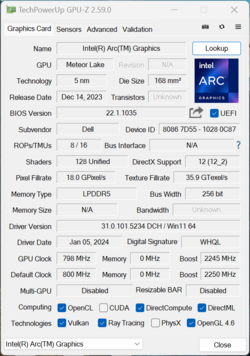
Grafik hesaplamaları yeni Intel Ark Grafikleriile birlikte 8 Xe çekirdeğine sahip daha hızlı sürüm olan Core Ultra 7 155H. GPU'nun performansı genellikle eskisine göre önemli ölçüde daha yüksektir Iris Xe Graphics G7ve AMD'nin hızlı Radeon 780M çoğu kıyaslamada da geçilebildi. Öte yandan, oyun testleri sırasında AMD'nin iGPU'su genellikle önde geldi; Intel'in burada sürücüleri üzerinde biraz çalışması gerekiyor.
Prensip olarak, oyun performansı orta ila yüksek ayrıntılara sahip birçok eski oyun için yeterince iyi ve performansı sabit kalmasa da hiçbir kare düşüşü gözlemlemedik. Sadece %70'e ulaşarak Time Spy stres testini geçemedi ve bizim Witcher 3 testi de birkaç dakika sonra önemli bir performans kaybı gösterdi. GPU'nun performansı pil modunda minimum düzeyde düşüyor (%8). Daha fazla GPU kıyaslaması mevcuttur burada.
| 3DMark 11 - 1280x720 Performance GPU | |
| Lenovo ThinkPad Z13 Gen 2 | |
| Ortalama Intel Arc 8-Core iGPU (8064 - 13716, n=38) | |
| Dell XPS 13 9340 Core Ultra 7 | |
| Sınıf ortalaması Subnotebook (995 - 16296, n=66, son 2 yıl) | |
| Dell XPS 13 Plus 9320 Core i7-1360P | |
| HP Dragonfly G4 | |
| Asus ZenBook S13 OLED UX5304 | |
| 3DMark 11 Performance | 9575 puan | |
| 3DMark Fire Strike Score | 6900 puan | |
| 3DMark Time Spy Score | 3106 puan | |
Yardım | ||
* ... daha küçük daha iyidir
| Performance Rating - Percent | |
| Lenovo ThinkPad Z13 Gen 2 -1! | |
| Sınıf ortalaması Subnotebook | |
| Dell XPS 13 9340 Core Ultra 7 | |
| Dell XPS 13 Plus 9320 Core i7-1360P | |
| HP Dragonfly G4 | |
| Asus ZenBook S13 OLED UX5304 | |
| The Witcher 3 - 1920x1080 Ultra Graphics & Postprocessing (HBAO+) | |
| Lenovo ThinkPad Z13 Gen 2 | |
| Sınıf ortalaması Subnotebook (8.5 - 43.7, n=47, son 2 yıl) | |
| Dell XPS 13 9340 Core Ultra 7 | |
| Dell XPS 13 Plus 9320 Core i7-1360P | |
| HP Dragonfly G4 | |
| Asus ZenBook S13 OLED UX5304 | |
| GTA V - 1920x1080 Highest Settings possible AA:4xMSAA + FX AF:16x | |
| Sınıf ortalaması Subnotebook (7.81 - 53, n=65, son 2 yıl) | |
| Dell XPS 13 9340 Core Ultra 7 | |
| Dell XPS 13 Plus 9320 Core i7-1360P | |
| HP Dragonfly G4 | |
| Asus ZenBook S13 OLED UX5304 | |
| Final Fantasy XV Benchmark - 1920x1080 High Quality | |
| Lenovo ThinkPad Z13 Gen 2 | |
| Dell XPS 13 9340 Core Ultra 7 | |
| Sınıf ortalaması Subnotebook (11.9 - 44.2, n=71, son 2 yıl) | |
| Dell XPS 13 Plus 9320 Core i7-1360P | |
| HP Dragonfly G4 | |
| Asus ZenBook S13 OLED UX5304 | |
| Strange Brigade - 1920x1080 ultra AA:ultra AF:16 | |
| Lenovo ThinkPad Z13 Gen 2 | |
| Sınıf ortalaması Subnotebook (17.7 - 70.7, n=68, son 2 yıl) | |
| Dell XPS 13 9340 Core Ultra 7 | |
| Dell XPS 13 Plus 9320 Core i7-1360P | |
| HP Dragonfly G4 | |
| Asus ZenBook S13 OLED UX5304 | |
| Dota 2 Reborn - 1920x1080 ultra (3/3) best looking | |
| Lenovo ThinkPad Z13 Gen 2 | |
| Dell XPS 13 9340 Core Ultra 7 | |
| Sınıf ortalaması Subnotebook (13 - 99.5, n=73, son 2 yıl) | |
| Dell XPS 13 Plus 9320 Core i7-1360P | |
| HP Dragonfly G4 | |
| Asus ZenBook S13 OLED UX5304 | |
| X-Plane 11.11 - 1920x1080 high (fps_test=3) | |
| Sınıf ortalaması Subnotebook (20.7 - 97.1, n=62, son 2 yıl) | |
| Dell XPS 13 Plus 9320 Core i7-1360P | |
| Dell XPS 13 9340 Core Ultra 7 | |
| HP Dragonfly G4 | |
| Asus ZenBook S13 OLED UX5304 | |
| Lenovo ThinkPad Z13 Gen 2 | |
Witcher 3 FPS diagram
| düşük | orta | yüksek | ultra | |
|---|---|---|---|---|
| GTA V (2015) | 157.8 | 129.8 | 32.8 | 14.7 |
| The Witcher 3 (2015) | 152 | 89 | 47 | 20.8 |
| Dota 2 Reborn (2015) | 106.2 | 89.8 | 72 | 65.2 |
| Final Fantasy XV Benchmark (2018) | 61.3 | 36.2 | 26.4 | |
| X-Plane 11.11 (2018) | 53 | 40.7 | 30.8 | |
| Far Cry 5 (2018) | 57 | 33 | 30 | 28 |
| Strange Brigade (2018) | 156 | 68 | 54 | 41 |
| F1 23 (2023) | 67.9 | 60.5 | 39.5 | 10.7 |
Emisyonlar - Günlük kullanımda genellikle sessizdir
Gürültü emisyonları
XPS 13'ün soğutma ünitesi iki fan ve bir ısı borusundan oluşuyor. Boş modda ve basit görevler sırasında dizüstü bilgisayar genellikle sessiz veya çok sessiz kalır. İşlemciden veya iGPU'dan daha fazlasını talep ettiğiniz anda, soğutma hızlı bir şekilde duyulabilir hale gelir. 37-42 dB(A) arasında ölçüm yaptık, ancak tiz sesler yoktu. Sonuç olarak, XPS 13 bu açıdan selefine benzer bir performans sergiliyor ve karşılaştırma alanındaki en yüksek sesli modellerden biri. İsteğe bağlı performans modu ultra kullanıldığında, gürültü emisyonları 47 dB(A)'ya yükseliyor ve sessiz modu kullanarak 32 dB(A) kaydettik. Test cihazımızdan başka hiçbir elektronik ses gelmedi.
Ses yüksekliği
| Boşta |
| 25.1 / 25.1 / 25.1 dB |
| Çalışırken |
| 37.4 / 42.5 dB |
 | ||
30 dB sessiz 40 dB(A) duyulabilirlik 50 dB(A) gürültülü |
||
min: | ||
| Dell XPS 13 9340 Core Ultra 7 Arc 8-Core, Ultra 7 155H, Micron 2550 512GB | Apple MacBook Air 13 M3 10C GPU M3 10-Core GPU, M3, Apple SSD AP0512Z | Asus ZenBook S13 OLED UX5304 Iris Xe G7 96EUs, i7-1355U, Samsung PM9A1 MZVL21T0HCLR | Lenovo ThinkPad Z13 Gen 2 Radeon 780M, R7 PRO 7840U, SK hynix BC901 HFS001TEJ4X164N | HP Dragonfly G4 Iris Xe G7 96EUs, i7-1365U, Micron 3400 MTFDKBA512TFH 512GB | Dell XPS 13 Plus 9320 Core i7-1360P Iris Xe G7 96EUs, i7-1360P, Samsung PM9A1 MZVL2512HCJQ | |
|---|---|---|---|---|---|---|
| Noise | 6% | -1% | 11% | 3% | ||
| kapalı / ortam * | 25.1 | 23.3 7% | 25.1 -0% | 23.3 7% | 23.7 6% | |
| Idle Minimum * | 25.1 | 23.3 7% | 25.8 -3% | 23.5 6% | 24 4% | |
| Idle Average * | 25.1 | 23.3 7% | 25.8 -3% | 23.5 6% | 24 4% | |
| Idle Maximum * | 25.1 | 23.3 7% | 28.3 -13% | 26.8 -7% | 24.4 3% | |
| Load Average * | 37.4 | 37.7 -1% | 28.3 24% | 27.2 27% | 37 1% | |
| Witcher 3 ultra * | 42.5 | 40.1 6% | 44.8 -5% | 32.7 23% | 42.1 1% | |
| Load Maximum * | 42.5 | 40.1 6% | 44.8 -5% | 35 18% | 42 1% |
* ... daha küçük daha iyidir
Sıcaklık
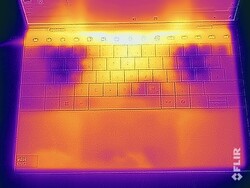
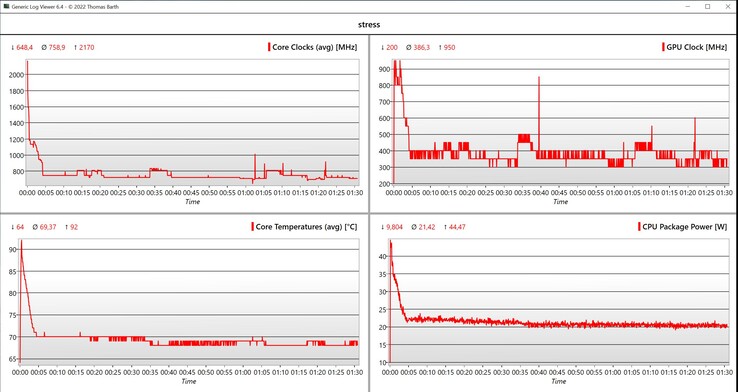
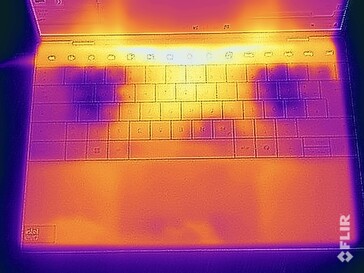
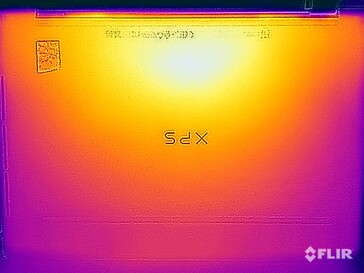
XPS 13'ün yüzeyleri boş modda ve basit görevler sırasında çok serin kalıyor ve hiçbir sorun yaşamadık. Oyun oynarken veya yüksek yük altındayken, özellikle dizüstü bilgisayarın alt tarafı yaklaşık 110 °F (44 ° C) ile fark edilir derecede ısınır. Bununla birlikte, cihazı kullanırken herhangi bir sınırlama yoktur ve klavye için de endişelenmenize gerek yoktur. Sadece dokunmatik çubuğun orta kısmı çok ısınıyor. Stres testi sırasında, işlemci kısa bir süre 45 watt'a kadar tüketti ve ardından hızla yaklaşık 24 watt'a düştü. XPS daha sonra bir süre bu aralıkta kaldı ve sonunda değer yaklaşık 21 watt'ta dengelendi.
(±) Üst taraftaki maksimum sıcaklık, 35.9 °C / 97 F ortalamasına kıyasla 41 °C / 106 F'dir. , Subnotebook sınıfı için 21.4 ile 59 °C arasında değişir.
(±) Alt kısım, 39.3 °C / 103 F ortalamasına kıyasla maksimum 43.5 °C / 110 F'ye kadar ısınır
(+) Boşta kullanımda, üst tarafın ortalama sıcaklığı 24.6 °C / 76 F olup, cihazın 30.8 °C / 87 F.
(±) The Witcher 3 oynarken, üst tarafın ortalama sıcaklığı 33.3 °C / 92 F olup, cihazın 30.8 °C / 87 F.
(+) Avuç içi dayanakları ve dokunmatik yüzey maksimum (32.5 °C / 90.5 F) cilt sıcaklığına ulaşıyor ve bu nedenle sıcak değil.
(-) Benzer cihazların avuç içi dayanağı alanının ortalama sıcaklığı 28.2 °C / 82.8 F (-4.3 °C / -7.7 F) idi.
| Dell XPS 13 9340 Core Ultra 7 Intel Core Ultra 7 155H, Intel Arc 8-Core iGPU | Apple MacBook Air 13 M3 10C GPU Apple M3, Apple M3 10-Core GPU | Asus ZenBook S13 OLED UX5304 Intel Core i7-1355U, Intel Iris Xe Graphics G7 96EUs | Lenovo ThinkPad Z13 Gen 2 AMD Ryzen 7 PRO 7840U, AMD Radeon 780M | HP Dragonfly G4 Intel Core i7-1365U, Intel Iris Xe Graphics G7 96EUs | Dell XPS 13 Plus 9320 Core i7-1360P Intel Core i7-1360P, Intel Iris Xe Graphics G7 96EUs | |
|---|---|---|---|---|---|---|
| Heat | 4% | -6% | -2% | -3% | -1% | |
| Maximum Upper Side * | 41 | 44.3 -8% | 43.1 -5% | 46.2 -13% | 38.6 6% | 43.8 -7% |
| Maximum Bottom * | 43.5 | 43.4 -0% | 45 -3% | 48.4 -11% | 40.4 7% | 44.4 -2% |
| Idle Upper Side * | 25.3 | 22.3 12% | 27.3 -8% | 23.2 8% | 28.2 -11% | 24 5% |
| Idle Bottom * | 25.5 | 22.1 13% | 27.8 -9% | 23 10% | 29 -14% | 25.2 1% |
* ... daha küçük daha iyidir
Konuşmacılar
XPS, dört hoparlörlü bir ses sistemine sahiptir ve genel performansı oldukça iyidir, modüller yalnızca bas söz konusu olduğunda biraz yetersiz kalır. Yine de, hoparlörler genellikle arka planda müzik dinlemek veya Netflix'ten yayın izlemek için yeterlidir.
Dell XPS 13 9340 Core Ultra 7 ses analizi
(+) | hoparlörler nispeten yüksek sesle çalabilir (83.2 dB)
Bas 100 - 315Hz
(-) | neredeyse hiç bas yok - ortalama olarak medyandan 17% daha düşük
(±) | Bas doğrusallığı ortalamadır (9.3% delta - önceki frekans)
Ortalar 400 - 2000 Hz
(+) | dengeli ortalar - medyandan yalnızca 2.1% uzakta
(+) | orta frekanslar doğrusaldır (4.7% deltadan önceki frekansa)
Yüksekler 2 - 16 kHz
(+) | dengeli yüksekler - medyandan yalnızca 2.5% uzakta
(+) | yüksekler doğrusaldır (4.6% deltadan önceki frekansa)
Toplam 100 - 16.000 Hz
(+) | genel ses doğrusaldır (11.6% ortancaya göre fark)
Aynı sınıfla karşılaştırıldığında
» Bu sınıftaki tüm test edilen cihazların %12%'si daha iyi, 3% benzer, 85% daha kötüydü
» En iyisinin deltası 5% idi, ortalama 19% idi, en kötüsü 53% idi
Test edilen tüm cihazlarla karşılaştırıldığında
» Test edilen tüm cihazların %7'si daha iyi, 2 benzer, % 91 daha kötüydü
» En iyisinin deltası 4% idi, ortalama 24% idi, en kötüsü 134% idi
Apple MacBook Air 13 M3 10C GPU ses analizi
(+) | hoparlörler nispeten yüksek sesle çalabilir (83.2 dB)
Bas 100 - 315Hz
(±) | azaltılmış bas - ortalama olarak medyandan 13.3% daha düşük
(±) | Bas doğrusallığı ortalamadır (11.3% delta - önceki frekans)
Ortalar 400 - 2000 Hz
(+) | dengeli ortalar - medyandan yalnızca 0.4% uzakta
(+) | orta frekanslar doğrusaldır (1.6% deltadan önceki frekansa)
Yüksekler 2 - 16 kHz
(+) | dengeli yüksekler - medyandan yalnızca 4.5% uzakta
(+) | yüksekler doğrusaldır (1.9% deltadan önceki frekansa)
Toplam 100 - 16.000 Hz
(+) | genel ses doğrusaldır (10.7% ortancaya göre fark)
Aynı sınıfla karşılaştırıldığında
» Bu sınıftaki tüm test edilen cihazların %8%'si daha iyi, 3% benzer, 89% daha kötüydü
» En iyisinin deltası 5% idi, ortalama 19% idi, en kötüsü 53% idi
Test edilen tüm cihazlarla karşılaştırıldığında
» Test edilen tüm cihazların %5'si daha iyi, 1 benzer, % 94 daha kötüydü
» En iyisinin deltası 4% idi, ortalama 24% idi, en kötüsü 134% idi
Güç yönetimi - 60 Hz'de uzun çalışma süreleri
Güç tüketimi
Maksimum 8 watt'ın altındaki boşta çalışma tüketimi ile yeni XPS 13 çok tutumlu. Maksimum 62,7 watt ölçtük, ancak bu 60 watt'lık güç kaynağının sınırı. Dizüstü bilgisayarın tüketimi kısa bir süre sonra tekrar düşebilir, ancak bu arada pil bu farkı telafi etmek zorundadır. Test süresince tüketim 37 watt civarında sabitlendi.
| Kapalı / Bekleme modu | |
| Boşta | |
| Çalışırken |
|
Key:
min: | |
| Dell XPS 13 9340 Core Ultra 7 Ultra 7 155H, Arc 8-Core, Micron 2550 512GB, IPS, 1920x1200, 13.4" | Apple MacBook Air 13 M3 10C GPU M3, M3 10-Core GPU, Apple SSD AP0512Z, IPS, 2560x1664, 13.6" | Asus ZenBook S13 OLED UX5304 i7-1355U, Iris Xe G7 96EUs, Samsung PM9A1 MZVL21T0HCLR, OLED, 2880x1800, 13.3" | Lenovo ThinkPad Z13 Gen 2 R7 PRO 7840U, Radeon 780M, SK hynix BC901 HFS001TEJ4X164N, OLED, 2880x1800, 13.3" | HP Dragonfly G4 i7-1365U, Iris Xe G7 96EUs, Micron 3400 MTFDKBA512TFH 512GB, IPS, 1920x1280, 13.5" | Dell XPS 13 Plus 9320 Core i7-1360P i7-1360P, Iris Xe G7 96EUs, Samsung PM9A1 MZVL2512HCJQ, OLED, 3456x2160, 13.4" | Ortalama Intel Arc 8-Core iGPU | Sınıf ortalaması Subnotebook | |
|---|---|---|---|---|---|---|---|---|
| Power Consumption | 18% | -5% | -18% | 0% | -31% | -33% | -7% | |
| Idle Minimum * | 3.8 | 1.95 49% | 5.8 -53% | 5.8 -53% | 4.1 -8% | 6.9 -82% | 5.34 ? -41% | 4.24 ? -12% |
| Idle Average * | 7 | 8.7 -24% | 8.5 -21% | 6.2 11% | 7.5 -7% | 7.4 -6% | 8.54 ? -22% | 7.34 ? -5% |
| Idle Maximum * | 7.3 | 8.9 -22% | 8.8 -21% | 12.7 -74% | 8.2 -12% | 13.6 -86% | 11.9 ? -63% | 9.03 ? -24% |
| Load Average * | 52.6 | 34.3 35% | 35.1 33% | 27.2 48% | 35.5 33% | 43.5 17% | 54 ? -3% | 45.1 ? 14% |
| Witcher 3 ultra * | 38.3 | 28.6 25% | 27.6 28% | 54.1 -41% | 37.5 2% | 48 -25% | ||
| Load Maximum * | 62.7 | 35.4 44% | 59.5 5% | 61.4 2% | 66.5 -6% | 63.3 -1% | 84.9 ? -35% | 68.5 ? -9% |
* ... daha küçük daha iyidir
Power consumption Witcher 3 / stress test
Power consumption with external monitor
Çalışma Zamanları
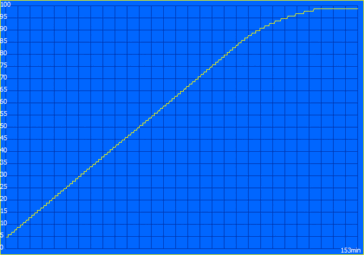
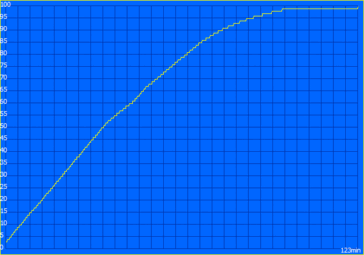
Cihazın 55 Wh bataryası iyi çalışma süreleri sağlıyor. WLAN testimizde 150 cd/m²'de (test cihazımızın maksimum parlaklığının %51'ine karşılık gelir), 60 Hz'de neredeyse 13 saatlik çok iyi bir çalışma süresi ölçtük (120 Hz'de 11 saatin biraz altında), bu da XPS 13'ün yalnızca MacBook Air 13 M3 ve HP Dragonfly G4 tarafından geçilebileceği anlamına geliyor. Yüksek çözünürlüklü OLED panelli eski XPS 13, 7 saatin biraz üzerinde bir süre elde etti. Maksimum parlaklıkta WLAN testi neredeyse 9 saat sürdü (60 Hz) ve daha yüksek yenileme hızı sonuçları neredeyse hiç etkilemedi (120 Hz'de sadece 10 dakika daha az). Video testi sırasında 150 cd/m²'de, SoC karosundaki iki verimlilik çekirdeği burada tüm işi yaptığı için karo tasarımlı yeni Meteor Lake işlemci kendini bir kez daha fark ettirdi. Sonuç, MacBook Air 13'ü bile kıl payı geride bırakan olağanüstü bir 17,5 saattir. En kötü senaryoda, dizüstü bilgisayar 2 saatten biraz fazla bir süre sonra sönebilir.
| Dell XPS 13 9340 Core Ultra 7 Ultra 7 155H, Arc 8-Core, 55 Wh | Apple MacBook Air 13 M3 10C GPU M3, M3 10-Core GPU, 52.6 Wh | Asus ZenBook S13 OLED UX5304 i7-1355U, Iris Xe G7 96EUs, 63 Wh | Lenovo ThinkPad Z13 Gen 2 R7 PRO 7840U, Radeon 780M, 51.5 Wh | HP Dragonfly G4 i7-1365U, Iris Xe G7 96EUs, 68 Wh | Dell XPS 13 Plus 9320 Core i7-1360P i7-1360P, Iris Xe G7 96EUs, 55 Wh | Sınıf ortalaması Subnotebook | |
|---|---|---|---|---|---|---|---|
| Pil Çalışma Süresi | 16% | -7% | -39% | 36% | -43% | -5% | |
| H.264 | 1053 | 1044 -1% | 829 -21% | 968 ? -8% | |||
| WiFi v1.3 | 769 | 914 19% | 678 -12% | 469 -39% | 954 24% | 436 -43% | 762 ? -1% |
| Load | 131 | 171 31% | 146 11% | 192 47% | 121.9 ? -7% |
Artılar
Eksiler
Karar - XPS 13 kompakt bir yol arkadaşı olmaya devam ediyor, ancak temel ekran ve dokunmatik çubuk hayal kırıklığı yaratıyor
Yeni XPS 13, Dell'in şu anda daha büyük XPS 14 ve XPS 16'da da kullandığı eski XPS 13 Plus'ın tasarımını kullanıyor. Özellikle iri XPS 14 ile karşılaştırıldığında, 13 inçlik model çok kompakt bir his veriyor ve ince çerçeveleriyle de karşılaştırma alanındaki en ince cihazlardan biri. Kalite açısından şikayet edecek bir şeyimiz yok, ancak 1,2 kg ile özellikle hafif değil. Diğer bir artı noktası da, en azından temel ekranla birlikte harika pil ömrüdür.
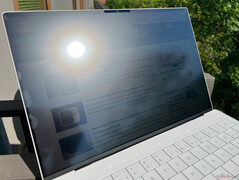
Bu noktada XPS 13 için işler biraz daha zorlaşıyor, çünkü temel panel hiç de etkileyici değil. Mat IPS panelin görüntüsü iyi görünse ve 120 Hz yenileme hızı harekete yardımcı olsa da, test cihazının paneli testimiz sırasında üreticinin belirttiği 500 cd/m² parlaklığı açıkça kaçırdı, ayrıca çok iyi kalibre edilmedi (teslim durumunda mavi renk tonu). Daha yüksek parlaklık değerleri özellikle dışarıda faydalı olacaktır. Sadece 2x USB-C'ye sahip olduğu için bağlantı durumu da bir o kadar zor. RAM yükseltilemiyor ama en azından 64 GB'a kadar RAM'e sahip XPS'i seçebilirsiniz.
XPS 13 9340, kompakt boyutu ve uzun çalışma süreleriyle -en azından temel ekranla birlikte- etkileyicidir. Bununla birlikte, yetersiz bağlantı seçenekleri ve işlev tuşlarıyla can sıkıcı dokunmatik çubuğu bir sorundur.
Dizüstü bilgisayarın giriş aygıtları biraz daha sorunlu. Çerçevesiz dokunmatik yüzey pratikte iyi çalışıyor, ancak klavye daha büyük bir sorun. Tuşlar arasında boşluk bırakmayan tasarımı nedeniyle tuşları iyi hissedemiyorsunuz ve bu da birçok yanlışlıkla yazım hatasına neden oluyor. Bu utanç verici bir durum, çünkü klavye bunun dışında yazmak için oldukça rahat hissettiriyor. Ayrıca, arka aydınlatmanın yoğunluğu ayarlanamıyor ve sensör en küçük ışık değişikliklerinde - siz isteseniz de istemeseniz de - aydınlatmayı etkinleştiriyor. Buna karşılık, günlük kullanımda can sıkıcı olduğu için cihazın dokunmatik çubuğu hakkında olumlu bir şey söyleyemeyiz. Görmeden kullanamazsınız, arka aydınlatma devre dışı bırakıldığında hangi tuşun hangisi olduğunu anlayamazsınız (genellikle yanlışlıkla yanlış tuşa basmanıza neden olur) ve testimiz sırasında video oynatırken işlev tuşları sürekli yanık kaldı, bu da çok can sıkıcı.
Yeni Meteor Lake işlemcinin CPU performansı selefinden sadece kısa aralıklarla daha iyi. Grafik performansı da bir gelişme gösteriyor, ancak örneğin oyun oynarken sabit kalmıyor. Buna rağmen, performansı günlük işler için elbette tamamen yeterli. Ancak rakipleriyle karşılaştırıldığında yeni XPS 13'ün işi hiç de kolay değil. Başlıca rakiplerinden biri MacBook Air pasif soğutması ve daha fazla sayıda bağlantı noktası ile etkilemeye devam ediyor. Bu ThinkPad Z13 aMD işlemcisi ile daha yüksek ve daha istikrarlı bir performans sunuyor. Ayrıca, şu anda XPS 13'ün bir diğer rakibi olan ve yüksek çözünürlüklü IPS ekrana sahip yeni ThinkBook 13x G4'ü test ediyoruz.
Fiyat ve bulunabilirlik
Yeni XPS 13 9340 doğrudan Dell'in web sitesi üzerinden satın alınabilir. Fiyatlar temel varyant için 1.149 ABD dolarından başlıyor.
Dell XPS 13 9340 Core Ultra 7
- 05/14/2024 v7 (old)
Andreas Osthoff
Şeffaflık
İncelenecek cihazların seçimi editör ekibimiz tarafından yapılır. Test örneği, bu incelemenin amacı doğrultusunda üretici veya perakendeci tarafından yazara ödünç olarak sağlanmıştır. Borç verenin bu inceleme üzerinde herhangi bir etkisi olmadığı gibi, üretici de yayınlanmadan önce bu incelemenin bir kopyasını almamıştır. Bu incelemeyi yayınlama zorunluluğu yoktu. İncelemelerimiz karşılığında asla tazminat veya ödeme kabul etmiyoruz. Bağımsız bir medya şirketi olarak Notebookcheck, üreticilerin, perakendecilerin veya yayıncıların otoritesine tabi değildir.
Notebookcheck bu şekilde test yapıyor
Notebookcheck, tüm sonuçların karşılaştırılabilir olmasını sağlamak için her yıl yüzlerce dizüstü bilgisayarı ve akıllı telefonu standart prosedürler kullanarak bağımsız olarak inceliyor. Yaklaşık 20 yıldır test yöntemlerimizi sürekli olarak geliştirdik ve bu süreçte endüstri standartlarını belirledik. Test laboratuvarlarımızda deneyimli teknisyenler ve editörler tarafından yüksek kaliteli ölçüm ekipmanları kullanılmaktadır. Bu testler çok aşamalı bir doğrulama sürecini içerir. Karmaşık derecelendirme sistemimiz, nesnelliği koruyan yüzlerce sağlam temellere dayanan ölçüm ve kıyaslamaya dayanmaktadır.


