

Geekom XT13 Pro incelemesi: NUC mini-PC, Meteor Lake olmadan çalışıyor ve yalnızca Intel Core i9-13900H alıyor
Geekom XT13 Pro'nun mirası Geekom XT12 Pro ve üst konfigürasyonda bir Intel Core i9-13900H donanımlı. Ayrıca 32 GB DDR4 RAM ve 2 TB SSD de var, ancak bunun bir bedeli var. Fiyat 999 avro, yani gerçekten pazarlık yok. Geekom XT13 Pro, 769 avro karşılığında bir Intel Core i7-13620H ve 1 TB SSD. Geekom yeni Meteor Lake işlemcileri kullanmamaya karar verdi ve daha eski Raptor Lake işlemcileri kullanmaya devam ediyor. Bu test, rekabete karşı durmak için doğru yolun bu olup olmadığını gösterecektir.
Ayrıca bu fiyatlandırmanın haklı olup olmadığı sorusu da ortaya çıkıyor. Bu önemli noktaya da performans analizinden sonra özel olarak değineceğiz. Her durumda, üreticinin kendisi çıtayı çok yükseğe koyuyor.
Karşılaştırmalı olarak olası rakipler
Derecelendirme | Sürüm | Tarih | Modeli | Hafıza | Ağırlık | Yükseklik |
|---|---|---|---|---|---|---|
| 72.4 % | v8 | 08/2024 | Geekom XT13 Pro i9-13900H, Iris Xe G7 96EUs | 32768 MB | 555 g | 37 mm |
| 80.8 % | v8 | 06/2024 | Aoostar GEM12 R7 8845HS, Radeon 780M | 32768 MB | 653 g | 60 mm |
| 87.5 % v7 (old) | v7 (old) | 05/2024 | Minisforum AtomMan X7 Ti Ultra 9 185H, Arc 8-Core | 32768 MB | 863 g | 48.6 mm |
| 83.4 % v7 (old) | v7 (old) | 04/2024 | Acemagic F2A Ultra 7 155H, Arc 8-Core | 32768 MB | 768 g | 57 mm |
| 84.1 % | v8 | 04/2024 | Geekom XT12 Pro i9-12900H, Iris Xe G7 96EUs | 32768 MB | 545 g | 37 mm |
| 82.6 % v7 (old) | v7 (old) | 03/2024 | Geekom A7 R9 7940HS, Radeon 780M | 32768 MB | 417 g | 38 mm |
Not: Derecelendirme sistemimizi güncelledik ve 8. versiyonun sonuçları mevcut 7. versiyonun sonuçları ile karşılaştırılamaz burada.

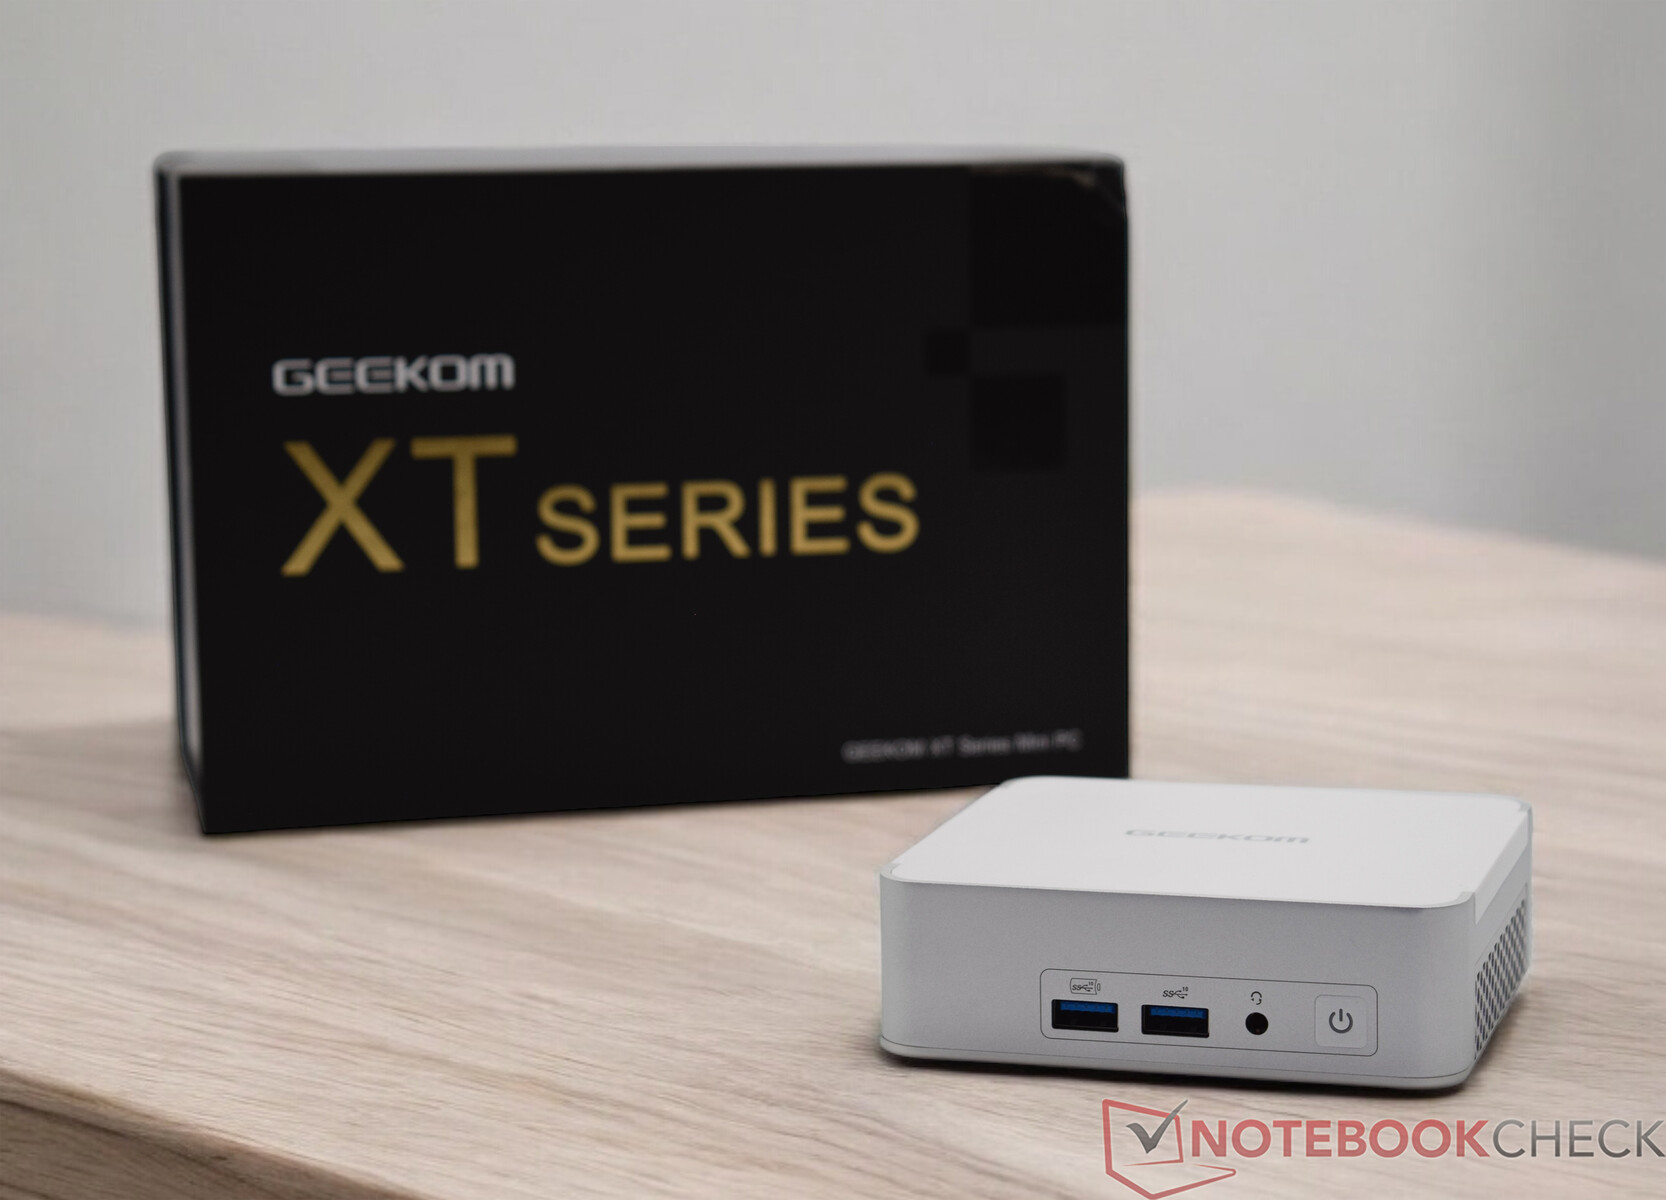
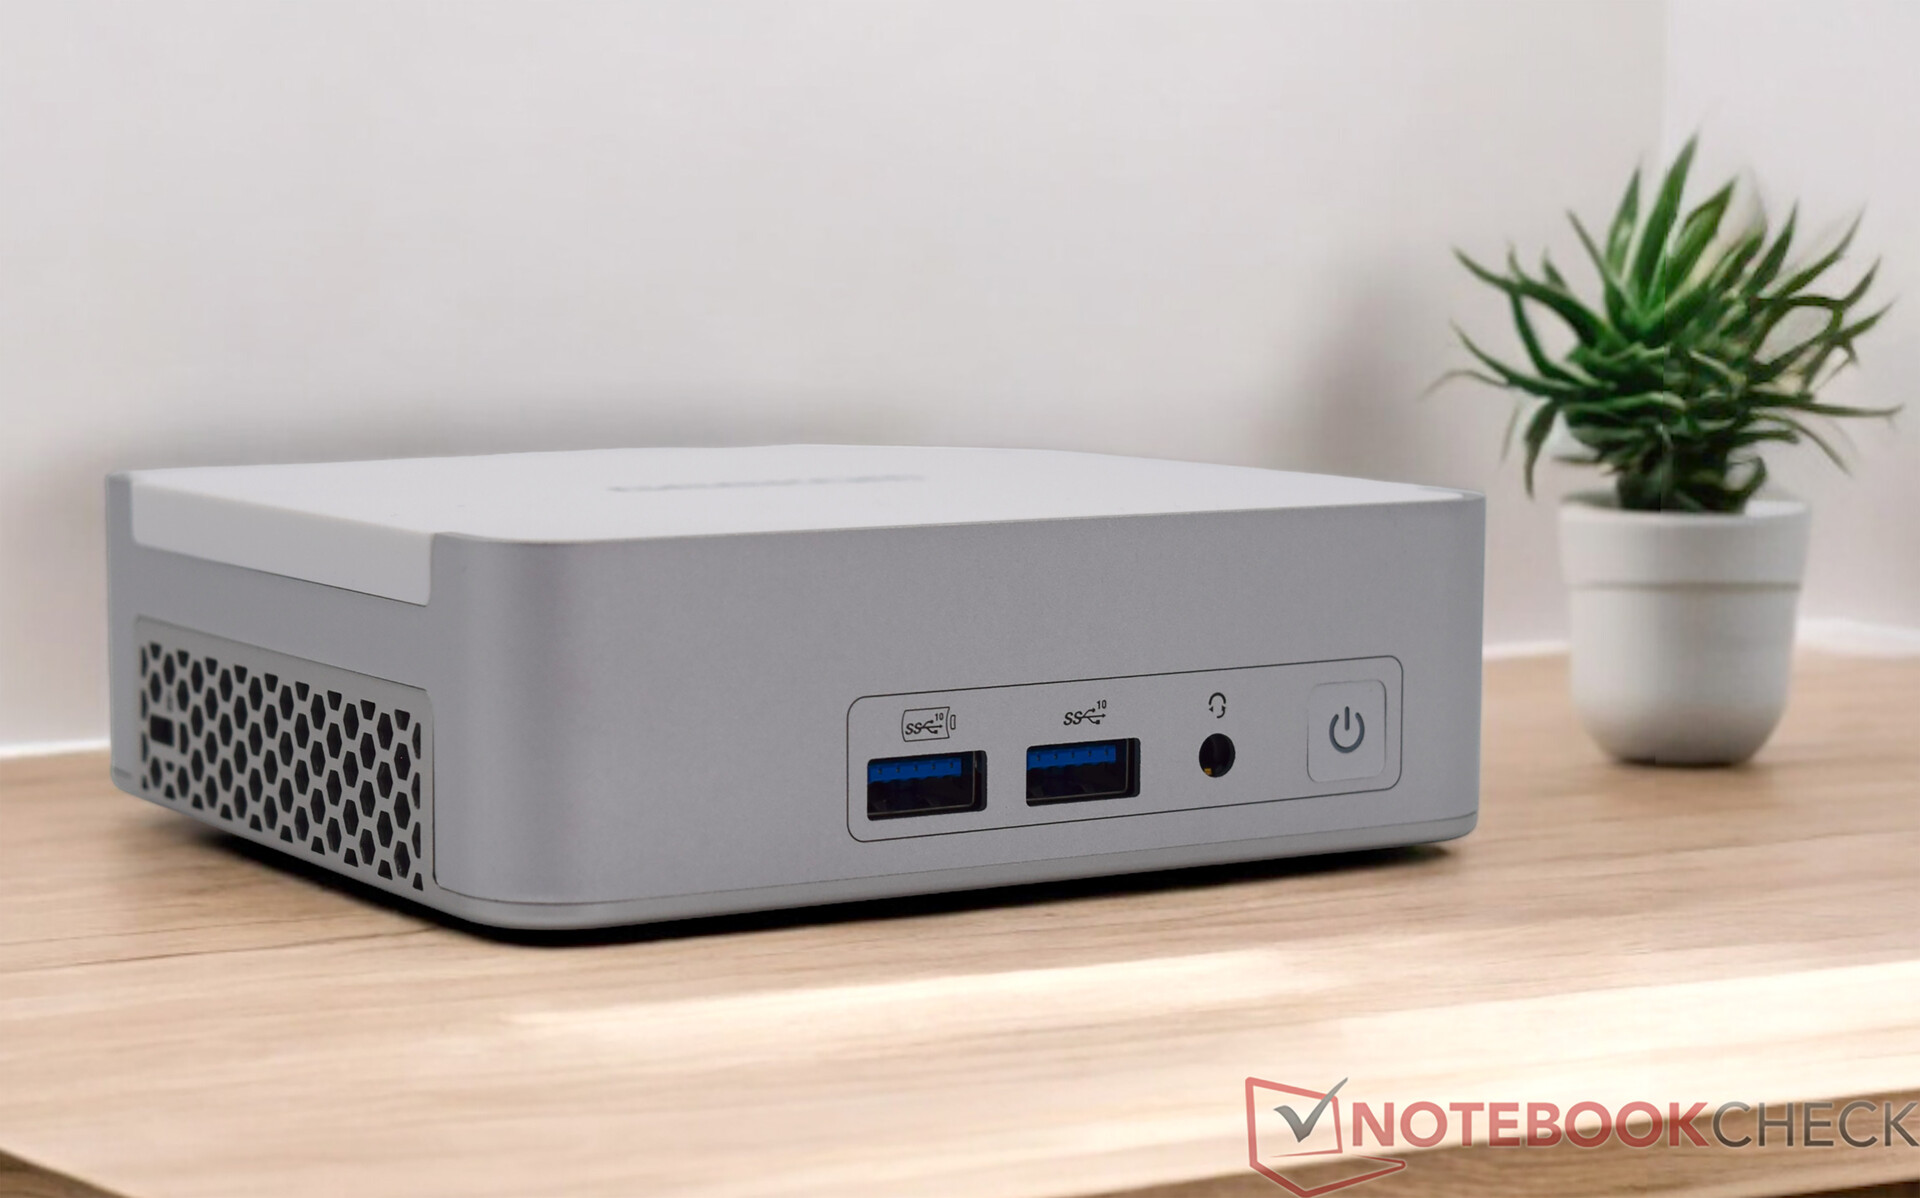
Kasa - Metal ve plastiğin mükemmel işlenmesi
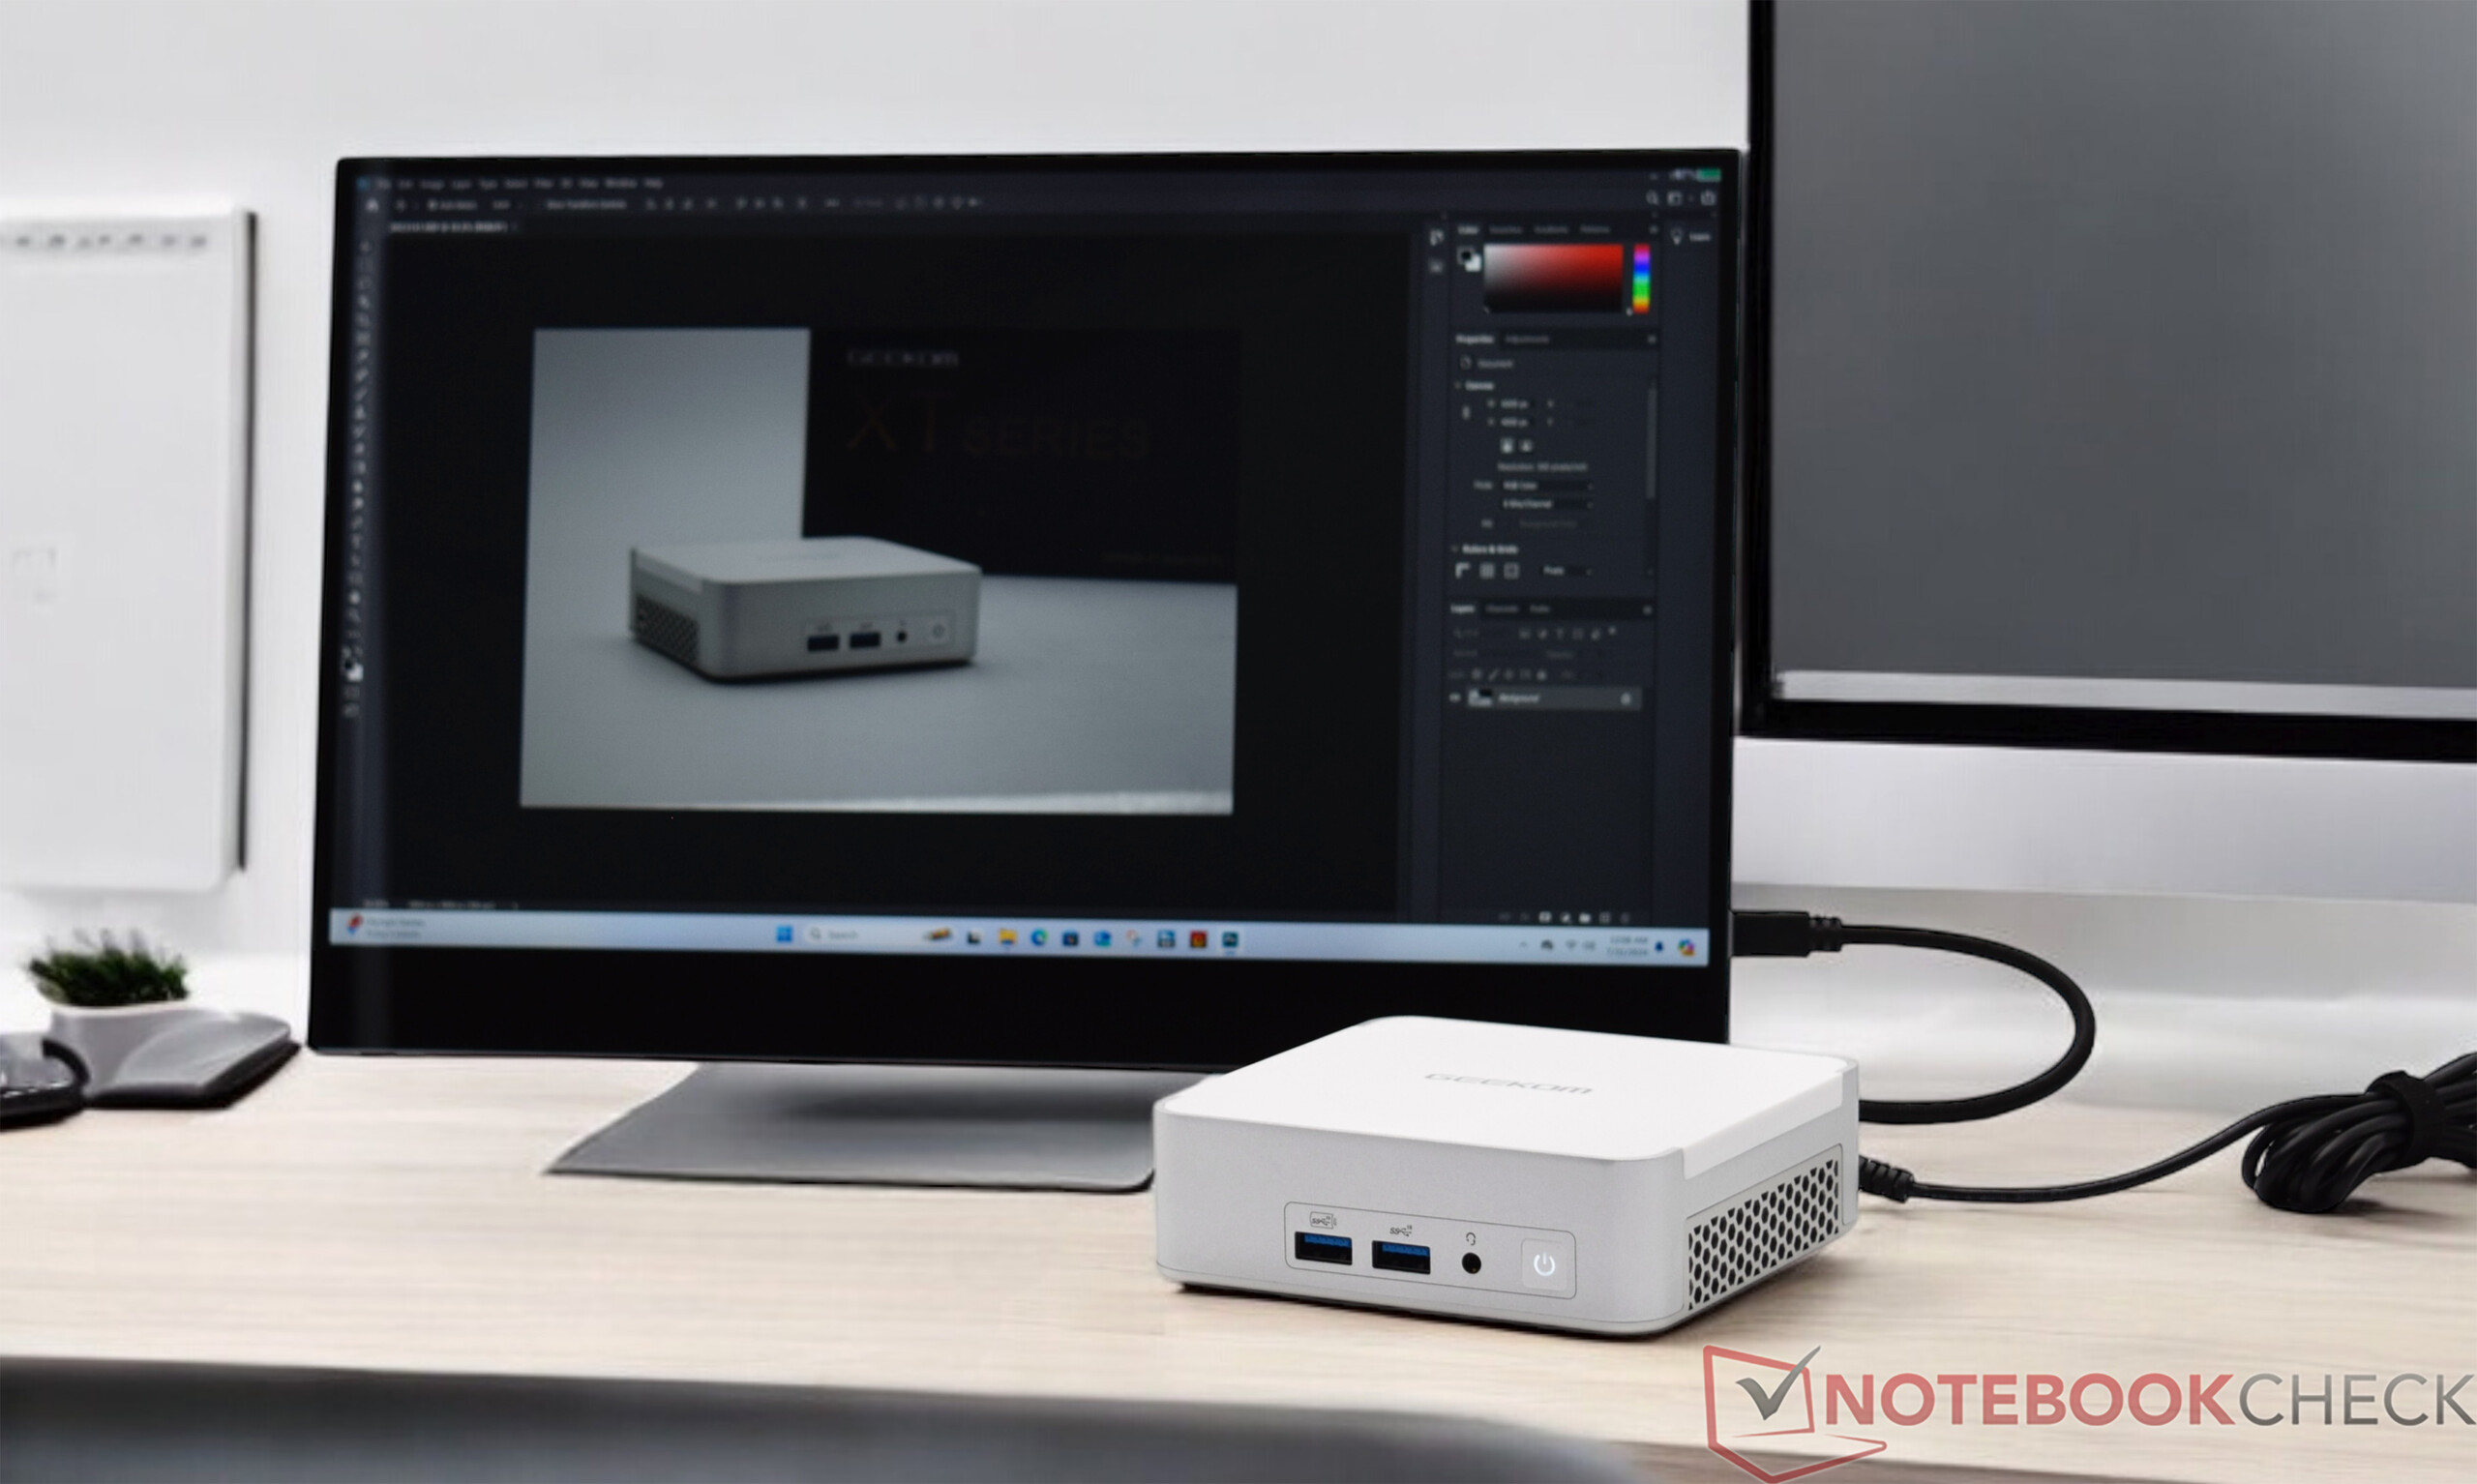
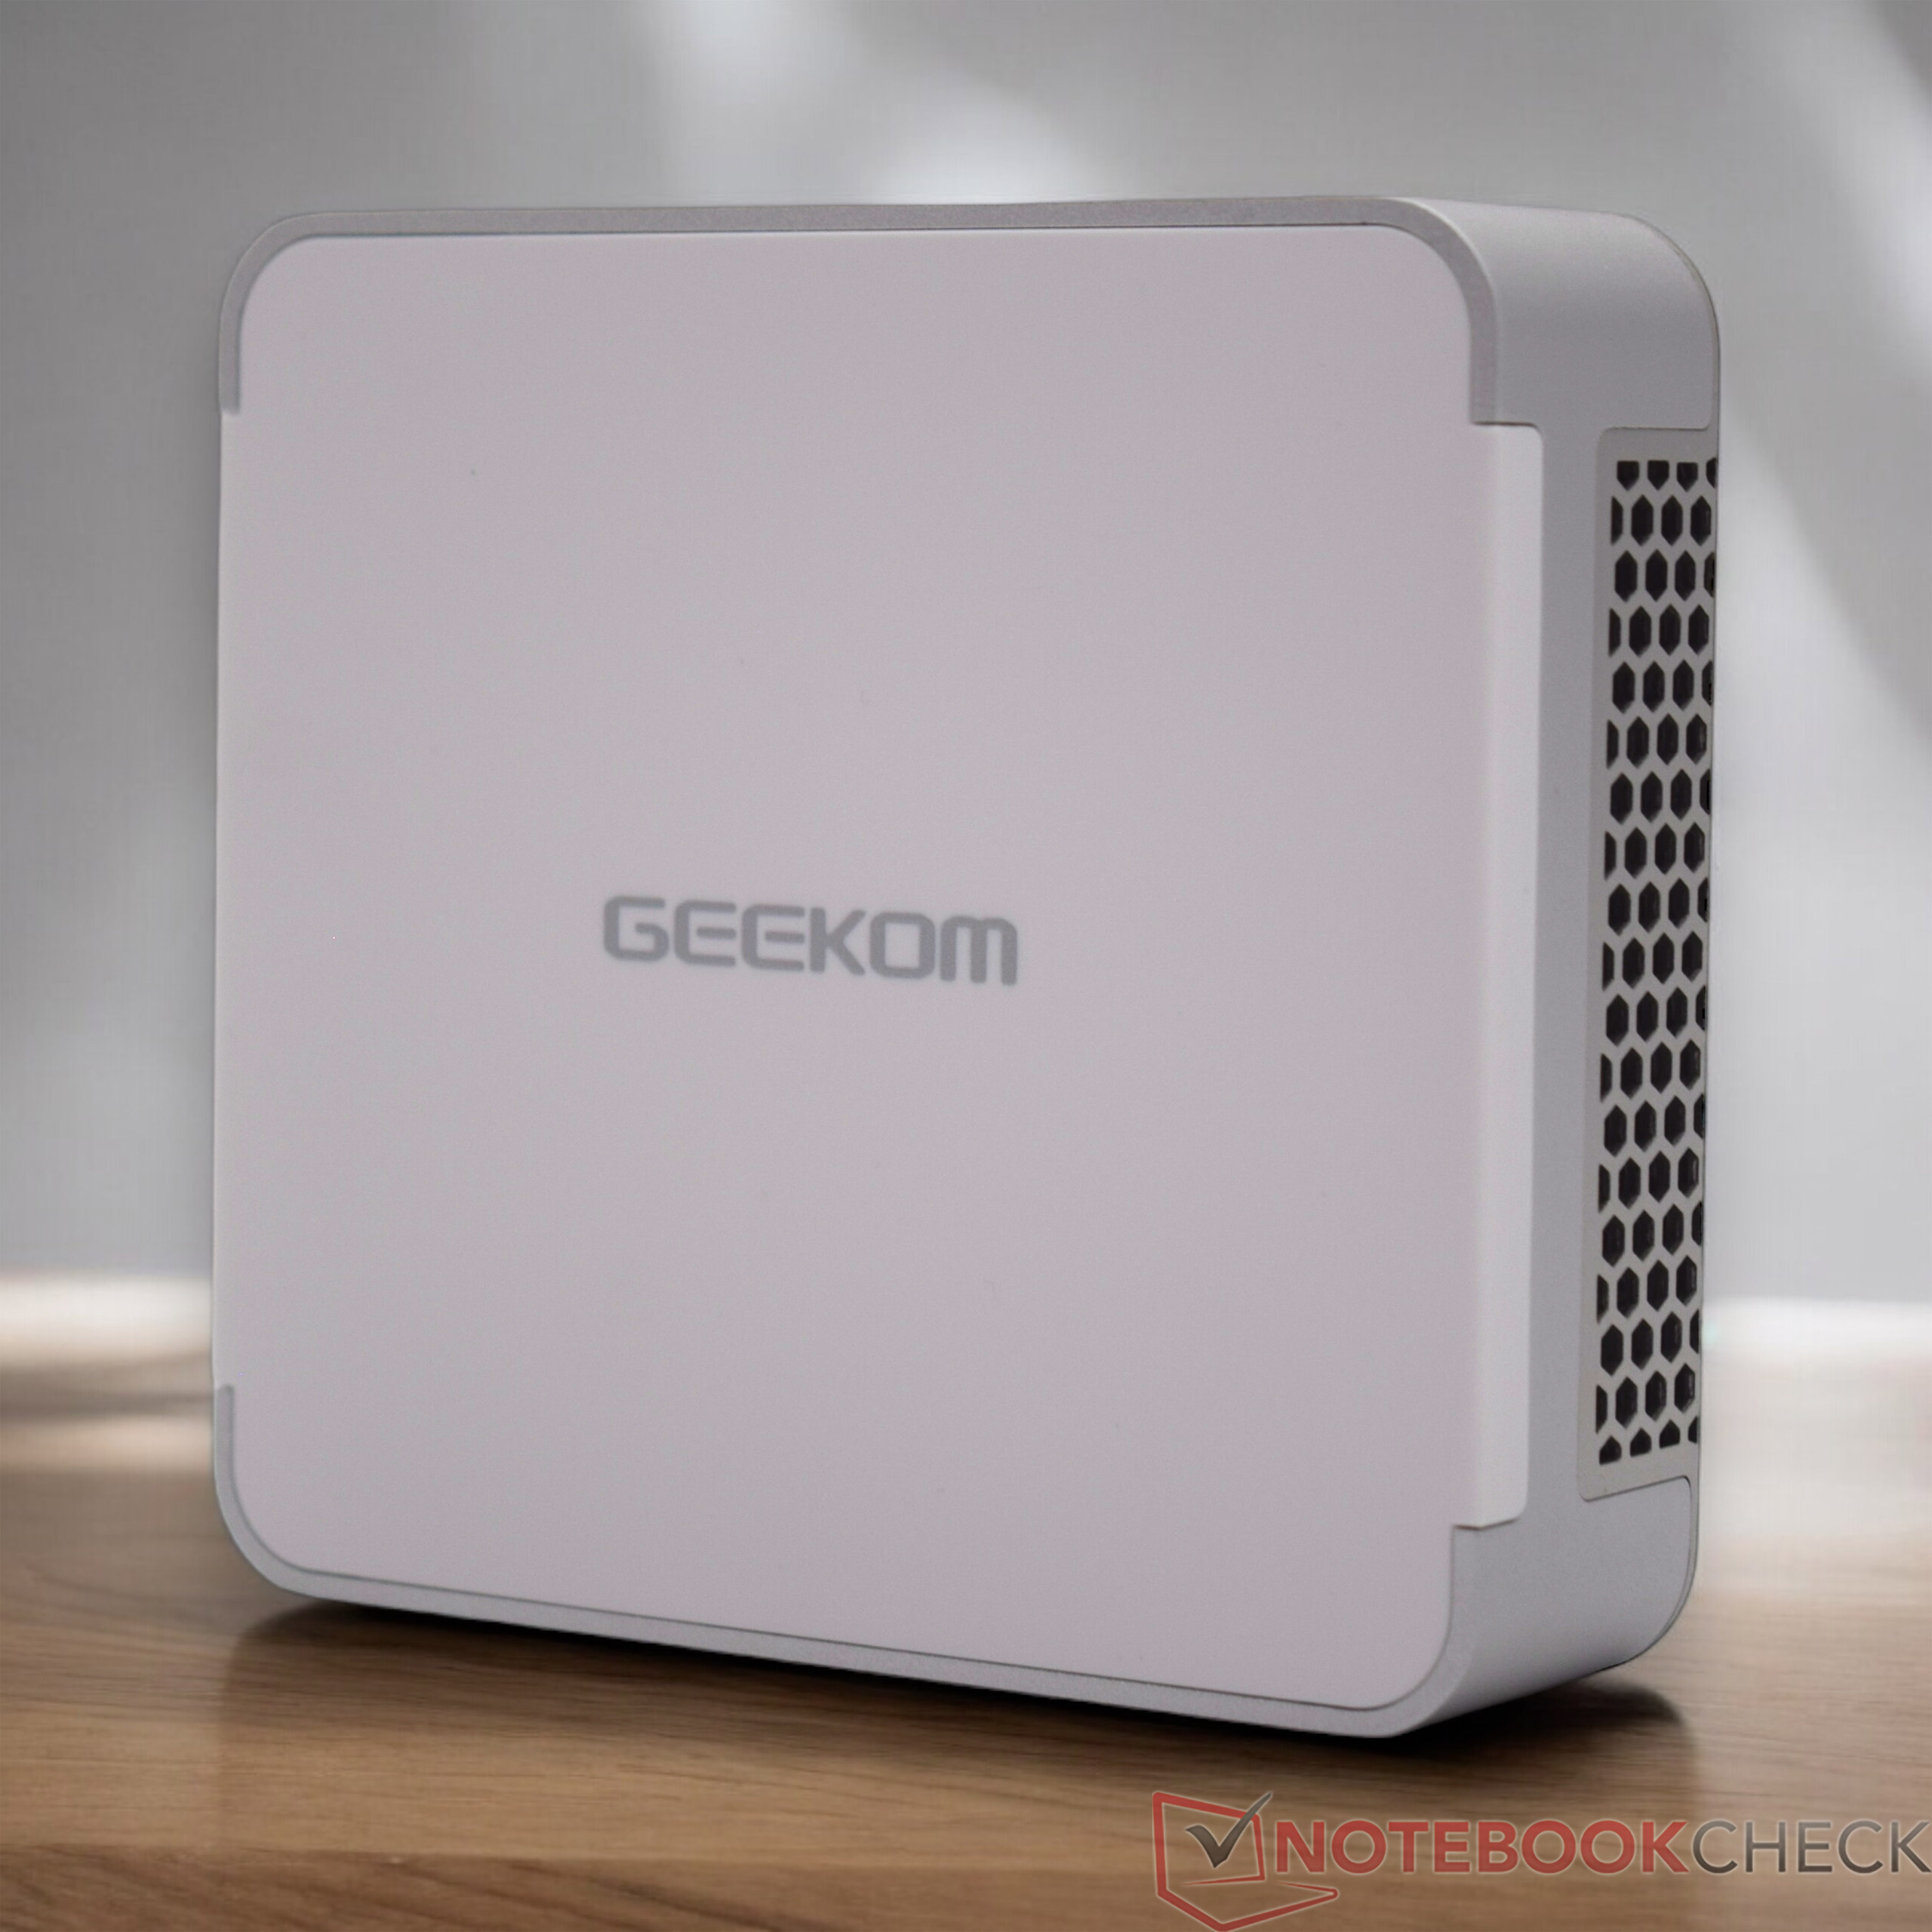
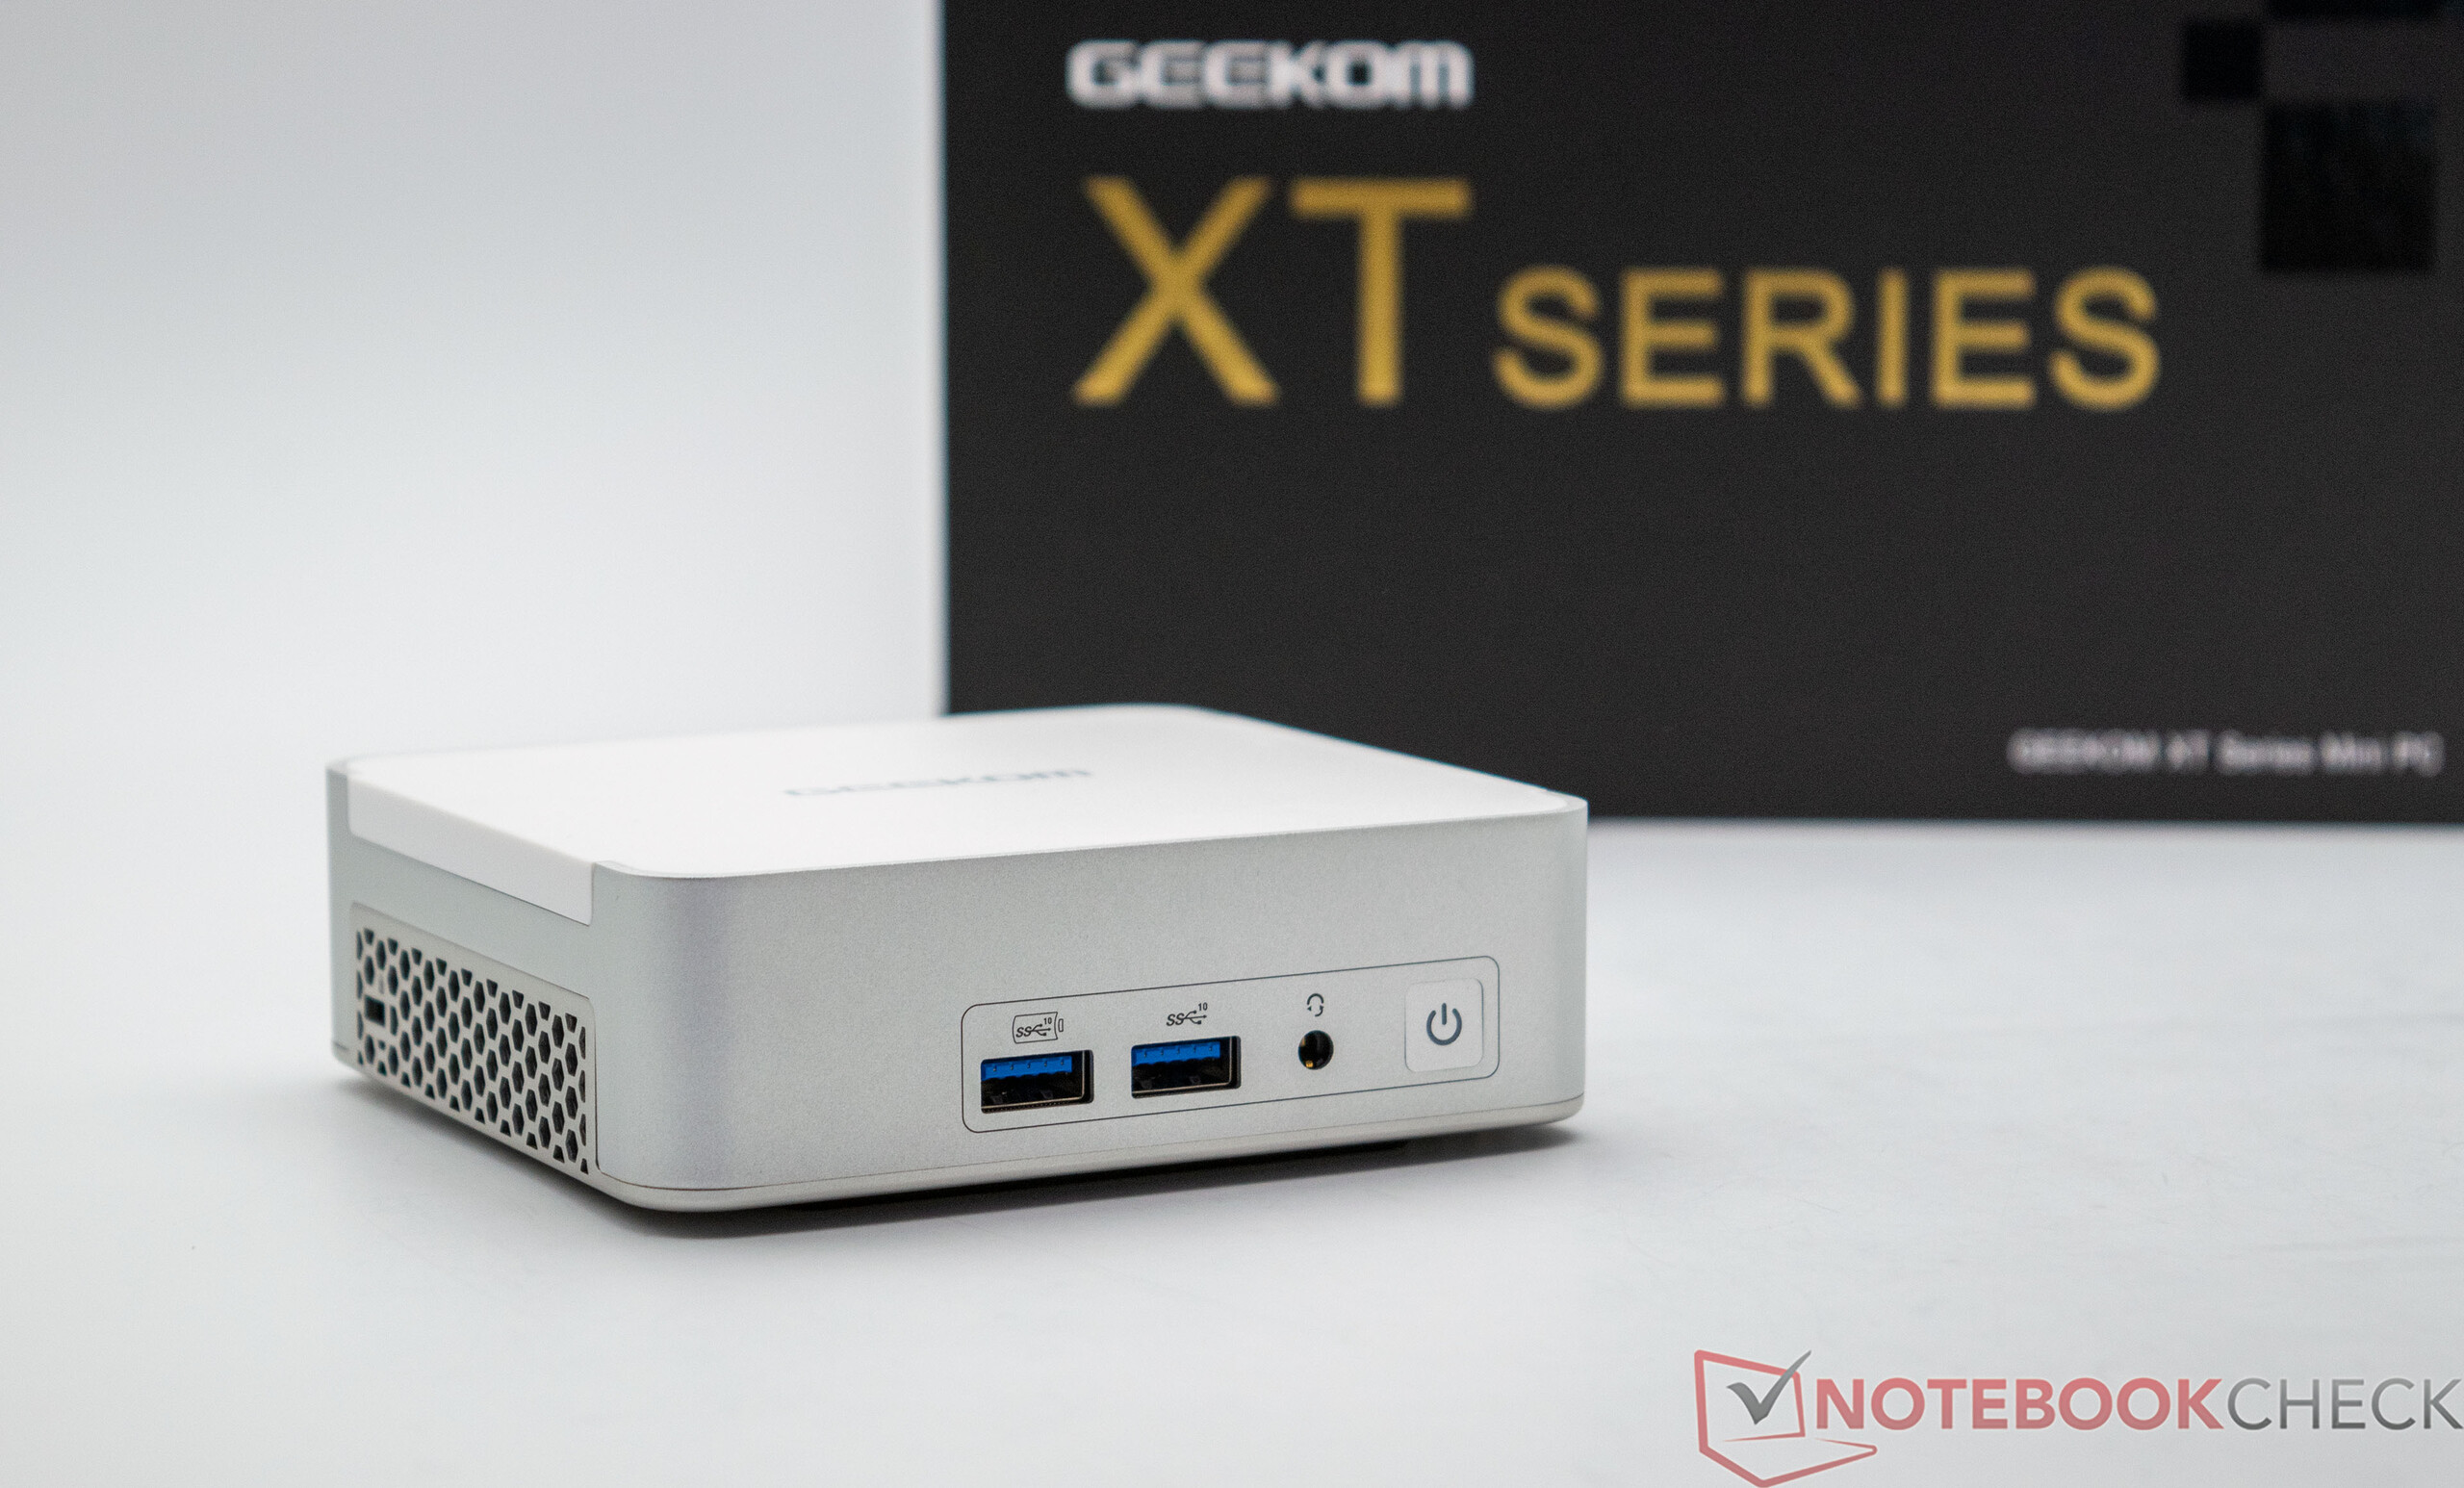
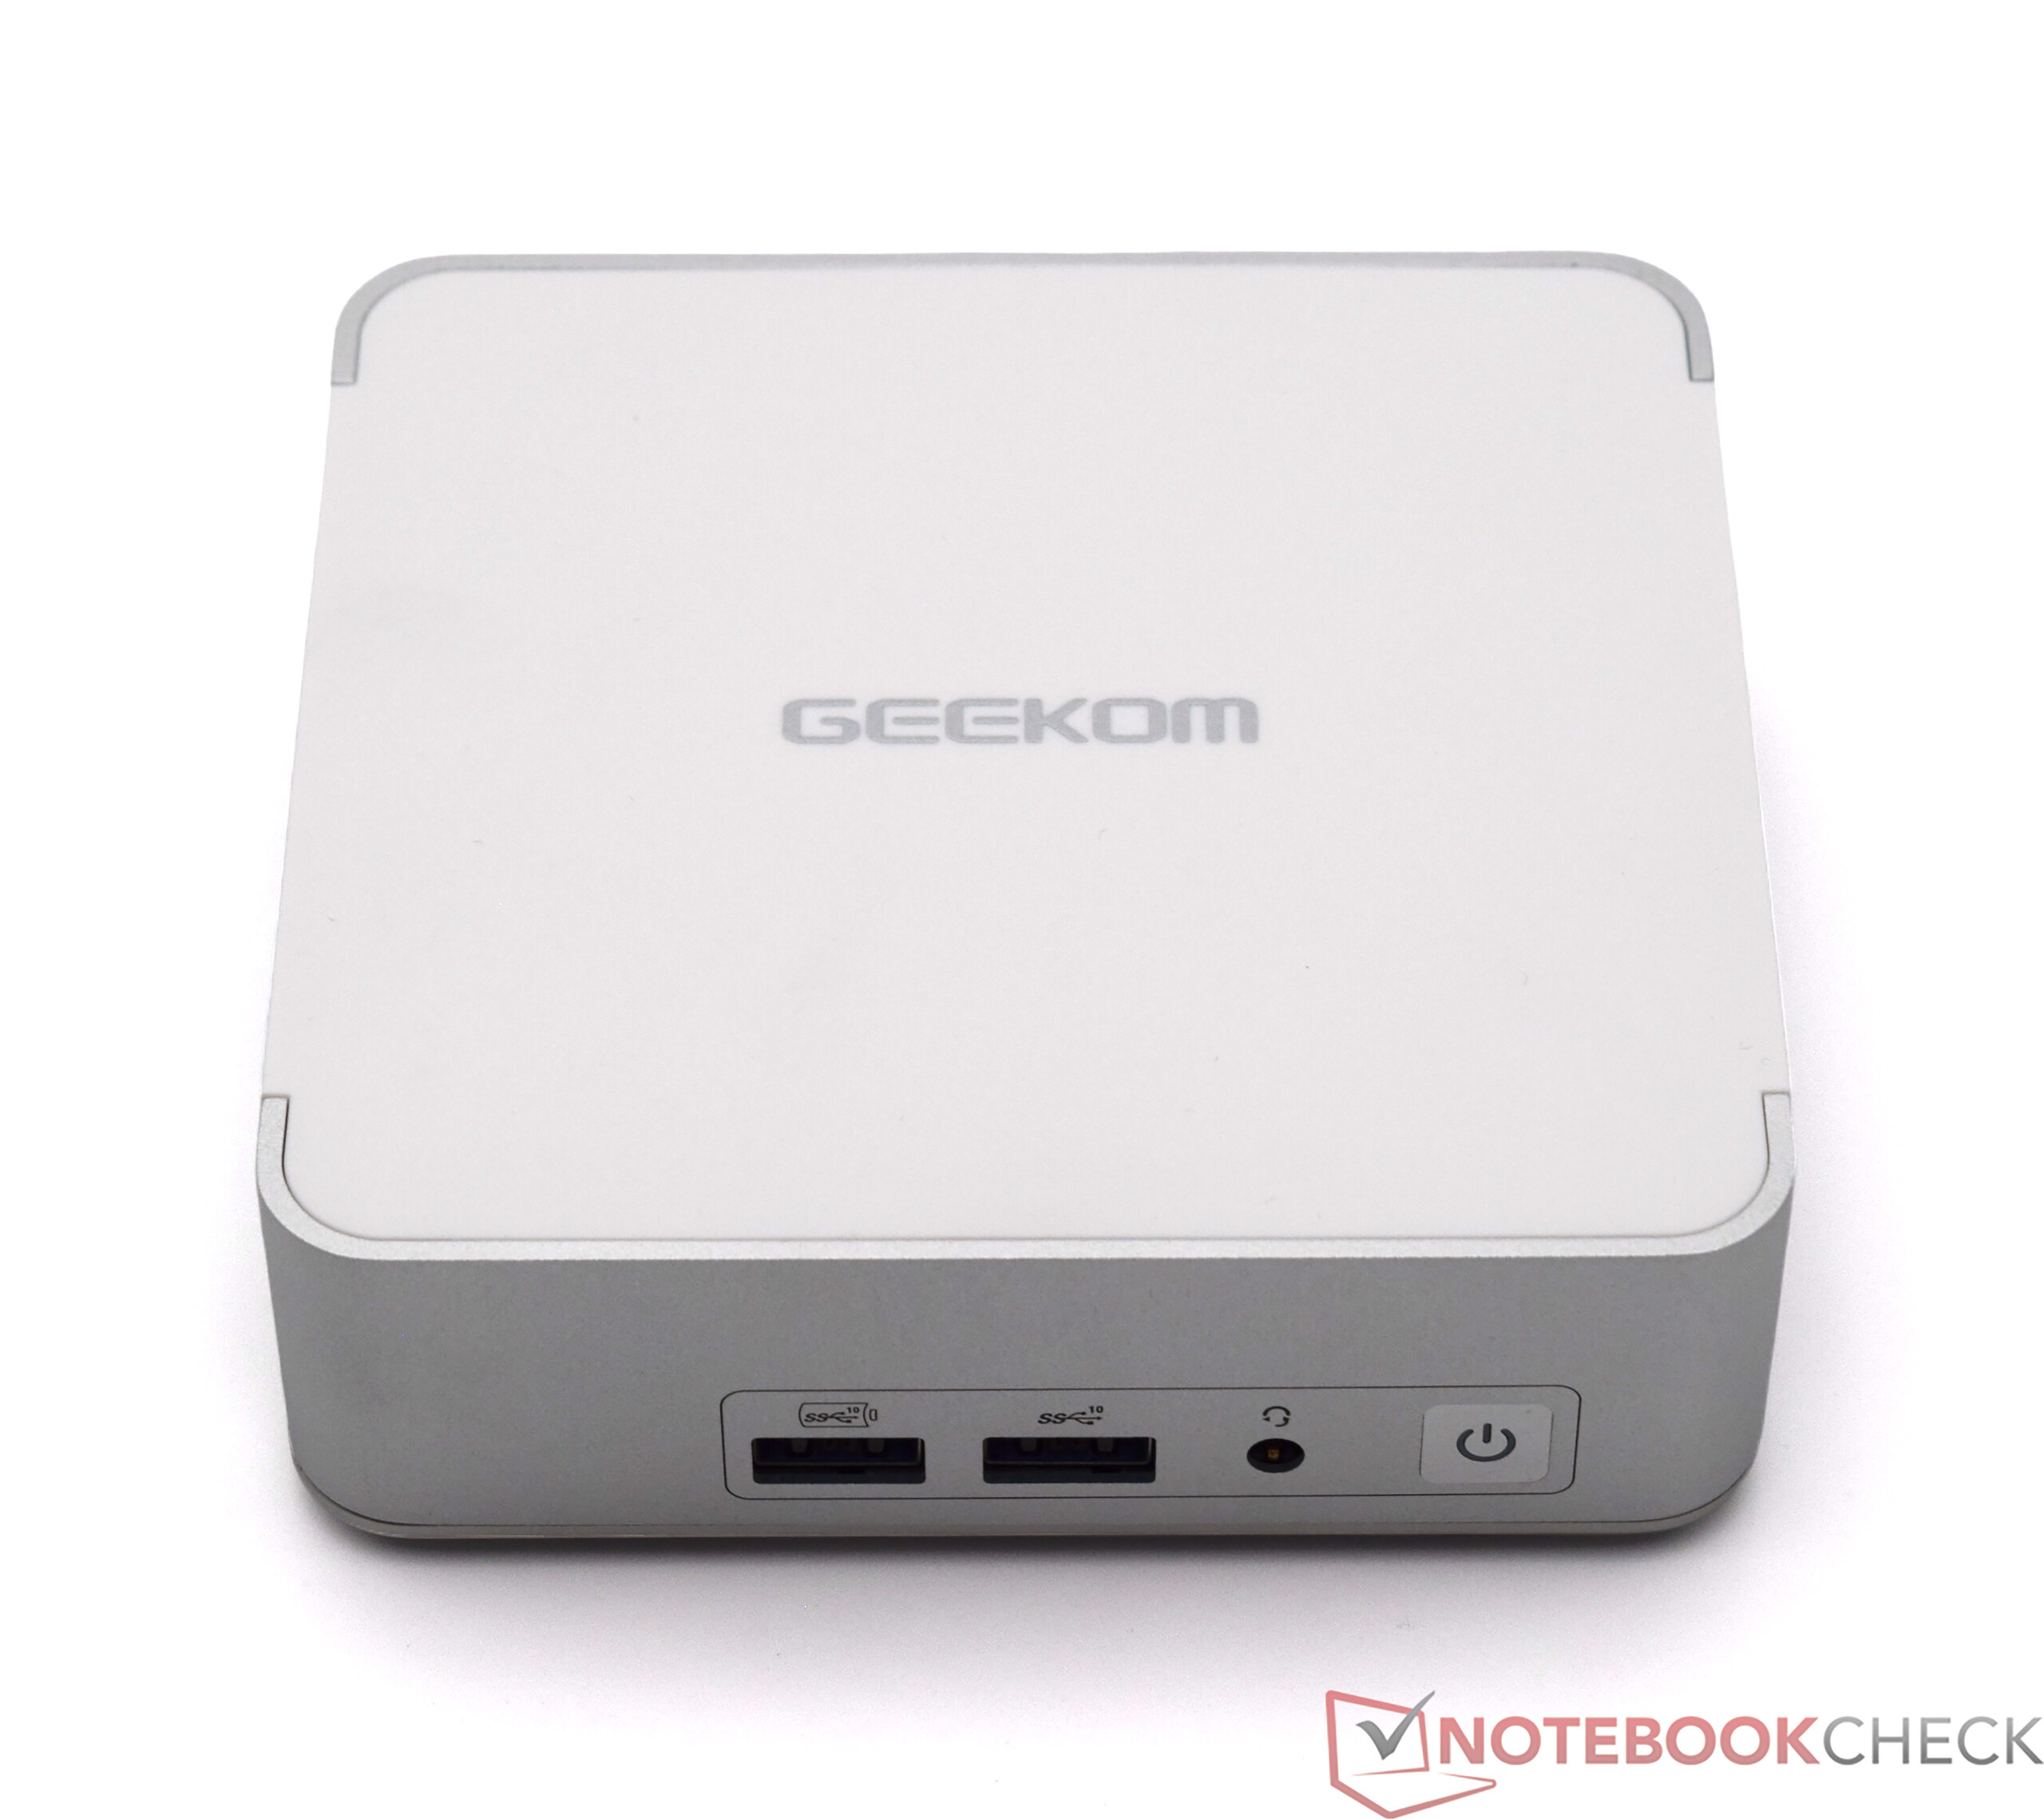
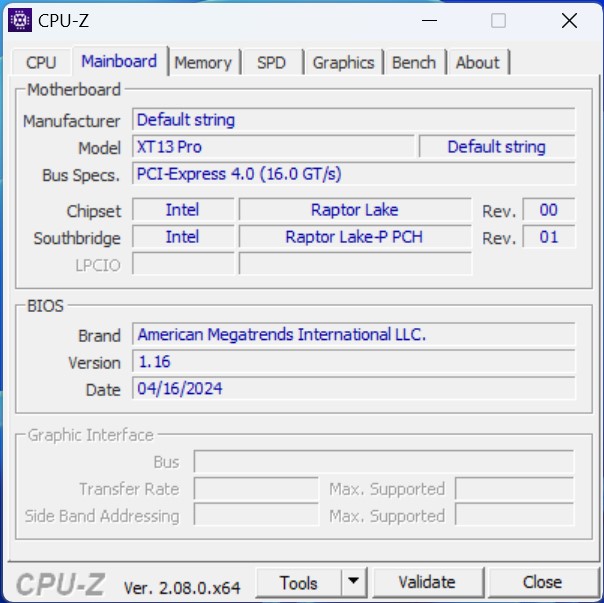
Geekom XT13 Pro'nun gövdesi tanıdık, Geekom XT12 Pro için kullanılmıştı. Intel NUC 13 Pro Desk Edition Kit ile benzerliği de inkar edilemez. Temel olarak, görünümde yanlış bir şey yok. Test örneğimiz bir kez daha mükemmel bir şekilde tamamlanmış ve her şey birbirine harika bir şekilde uyuyor. Bununla birlikte, onu dahili rekabetten biraz farklılaştırmak için yeni bir kasa görmek isterdik. Mini-PC masa üzerinde yalnızca 11,7 x 11,2 santimetre yer kaplıyor ve bu da onu daha kompakt cihazlardan biri yapıyor. Geekom XT13 Pro, birlikte verilen VESA montaj aparatı kullanılarak doğrudan bir monitöre de takılabilir.
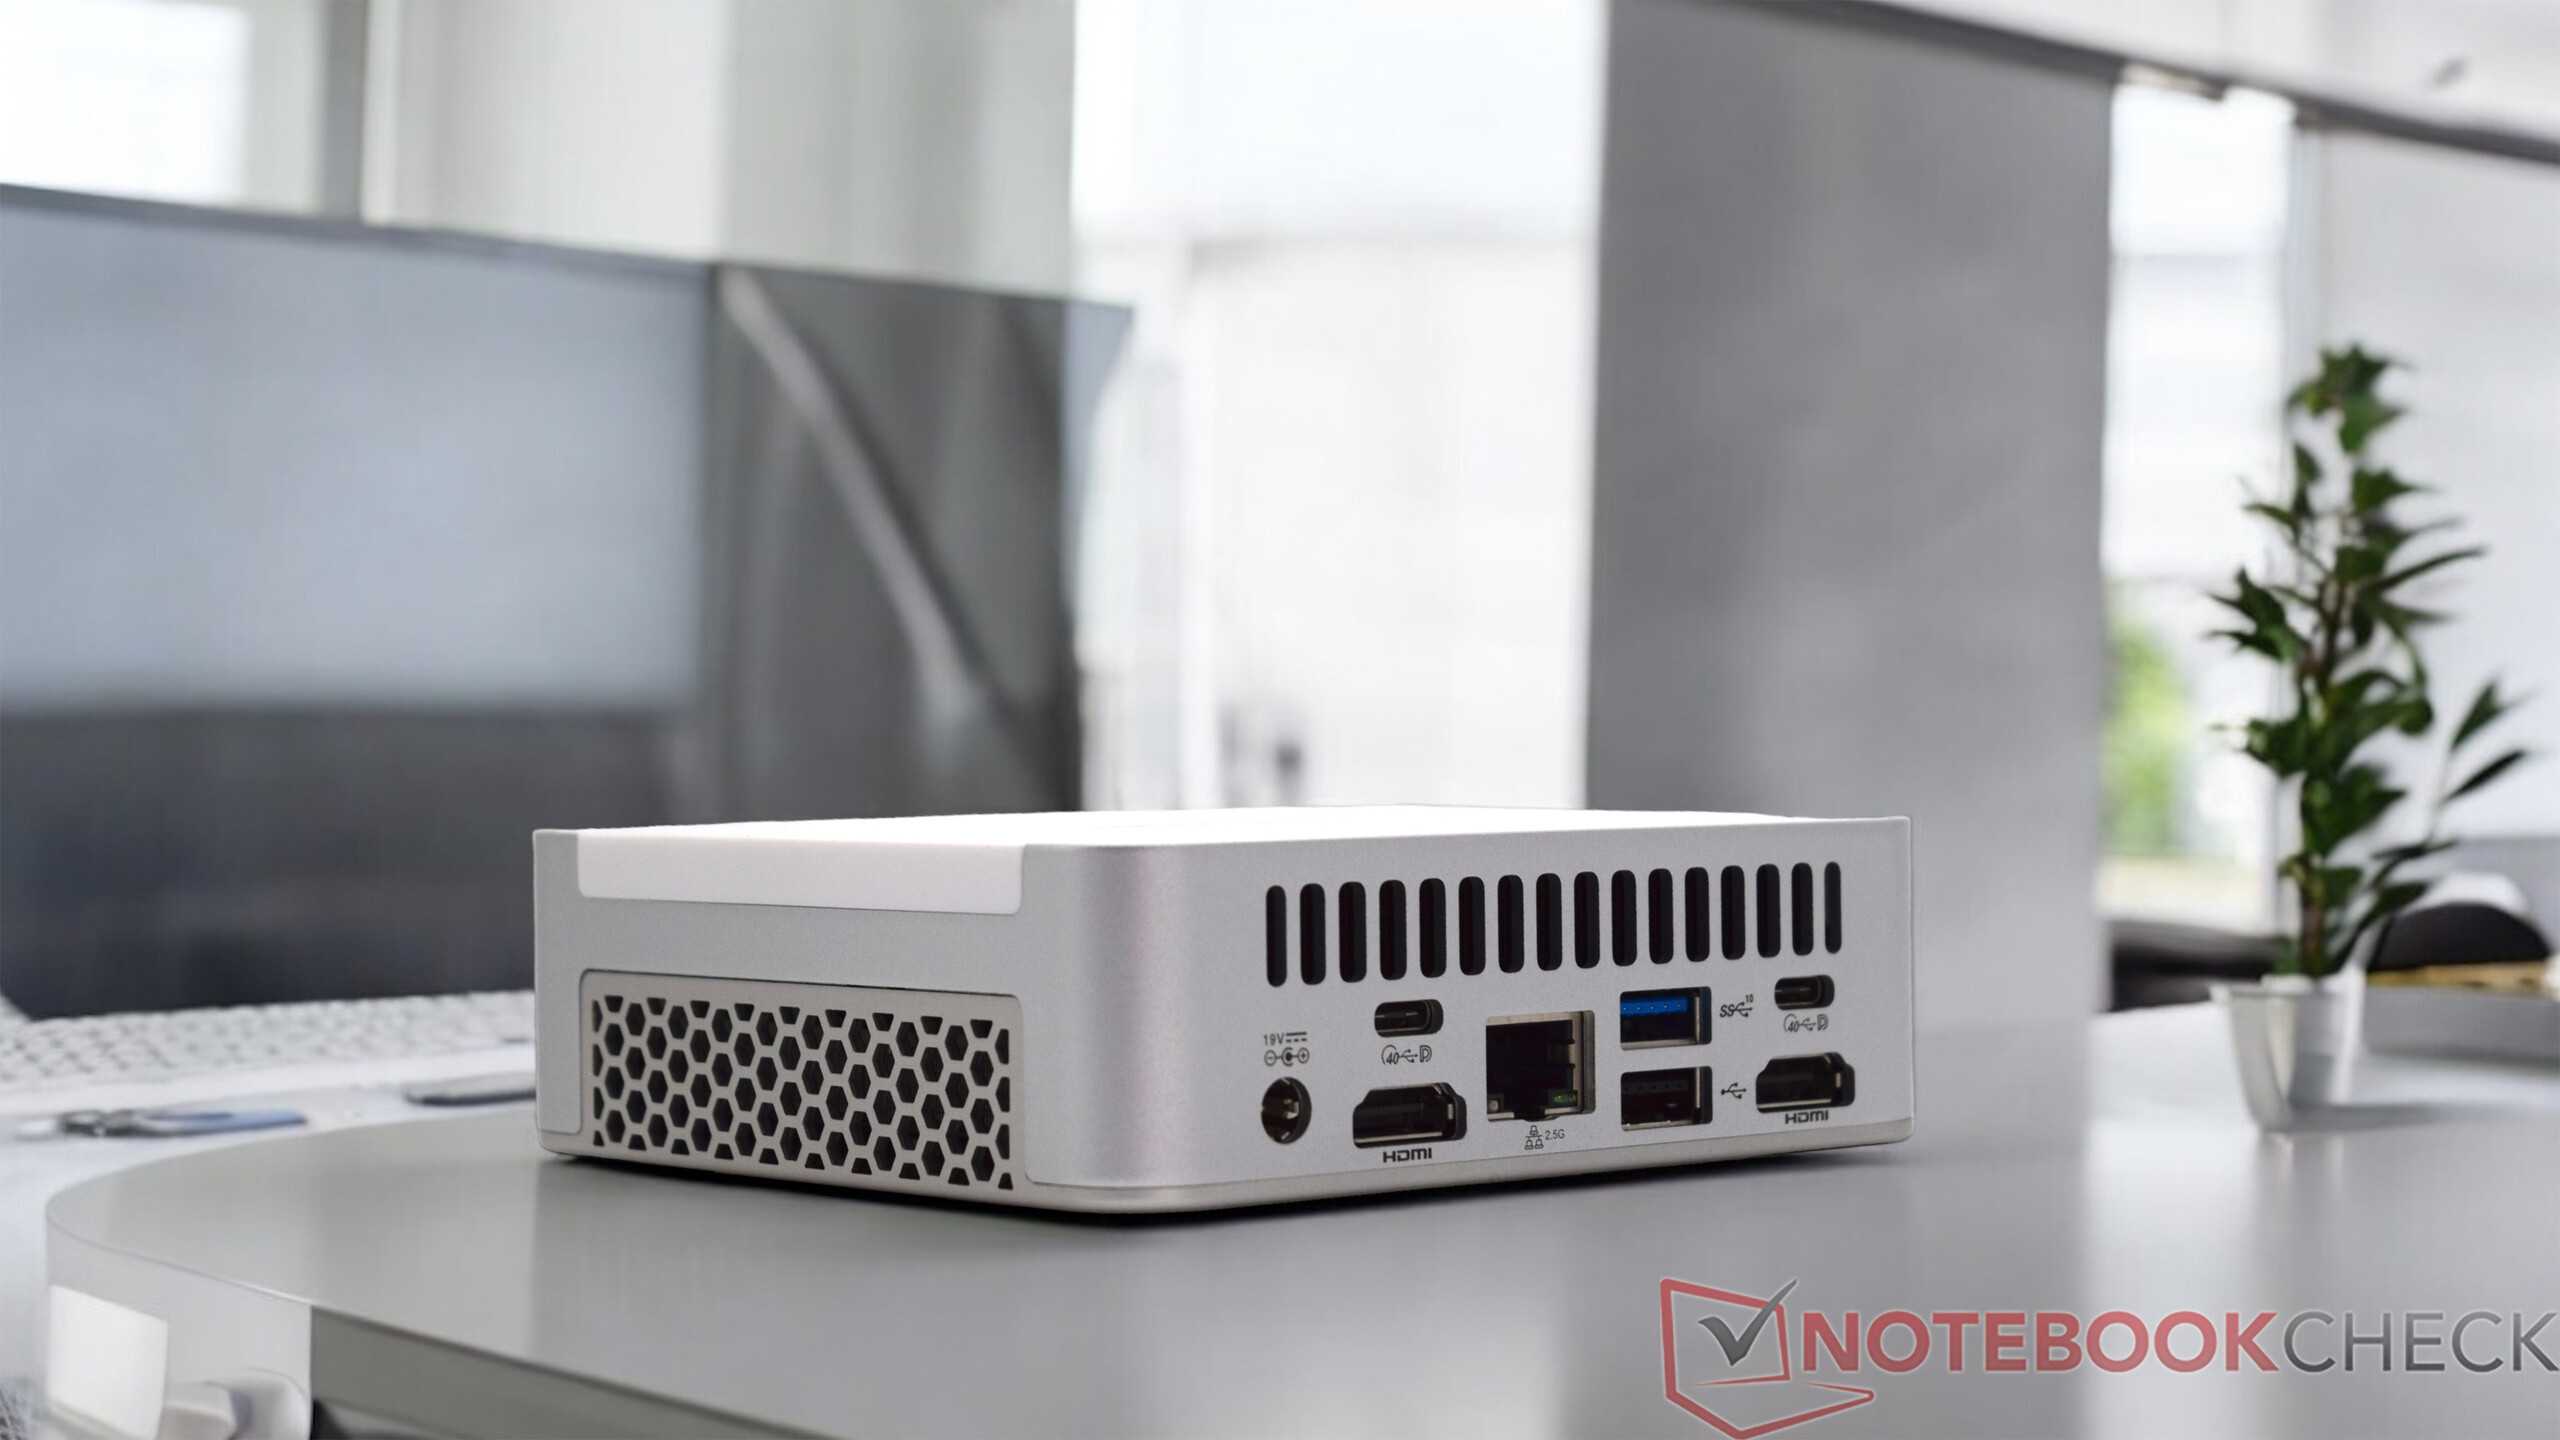
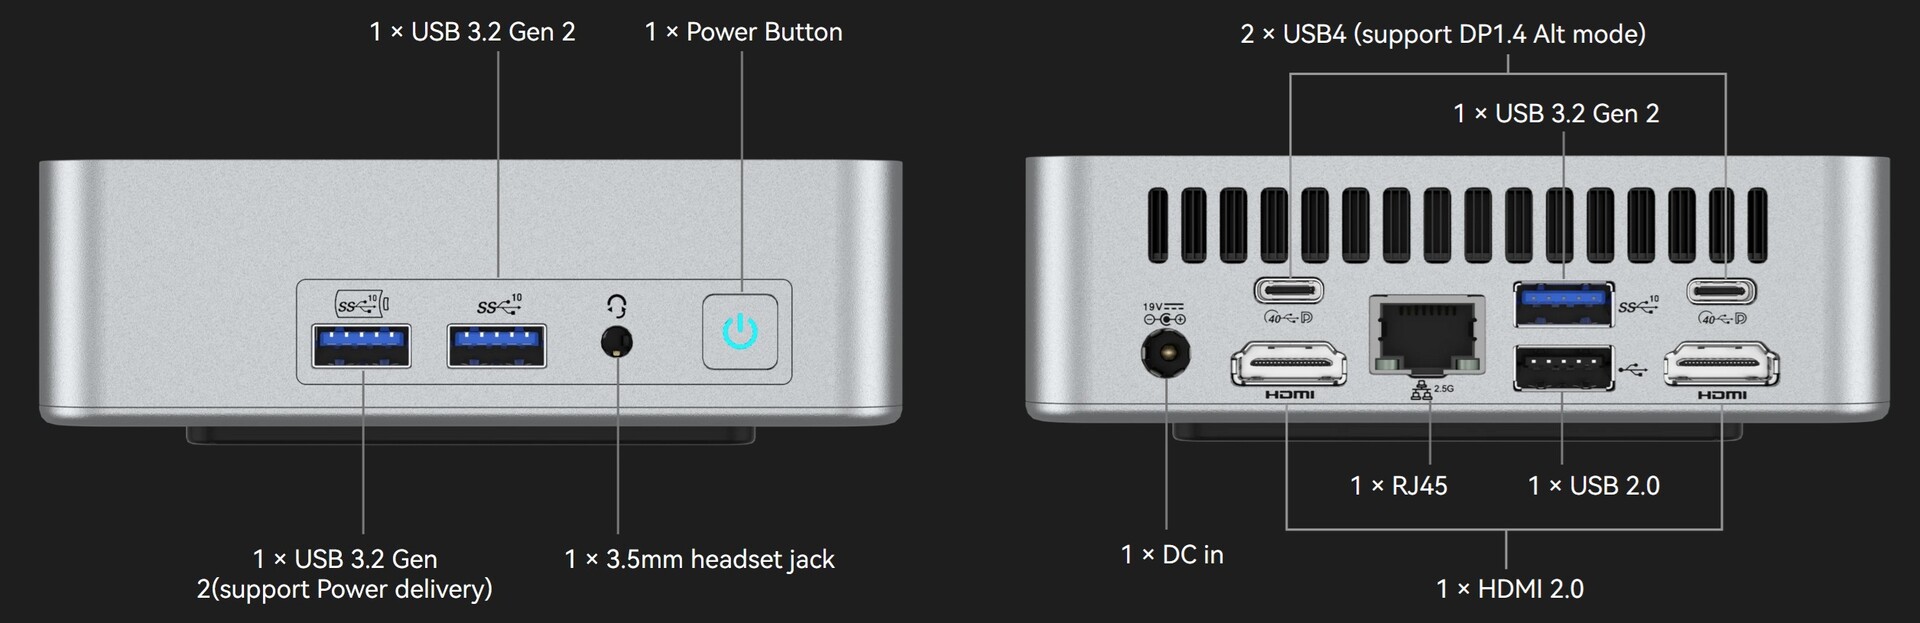
Ekipman - İyi seçim ve 2x USB4
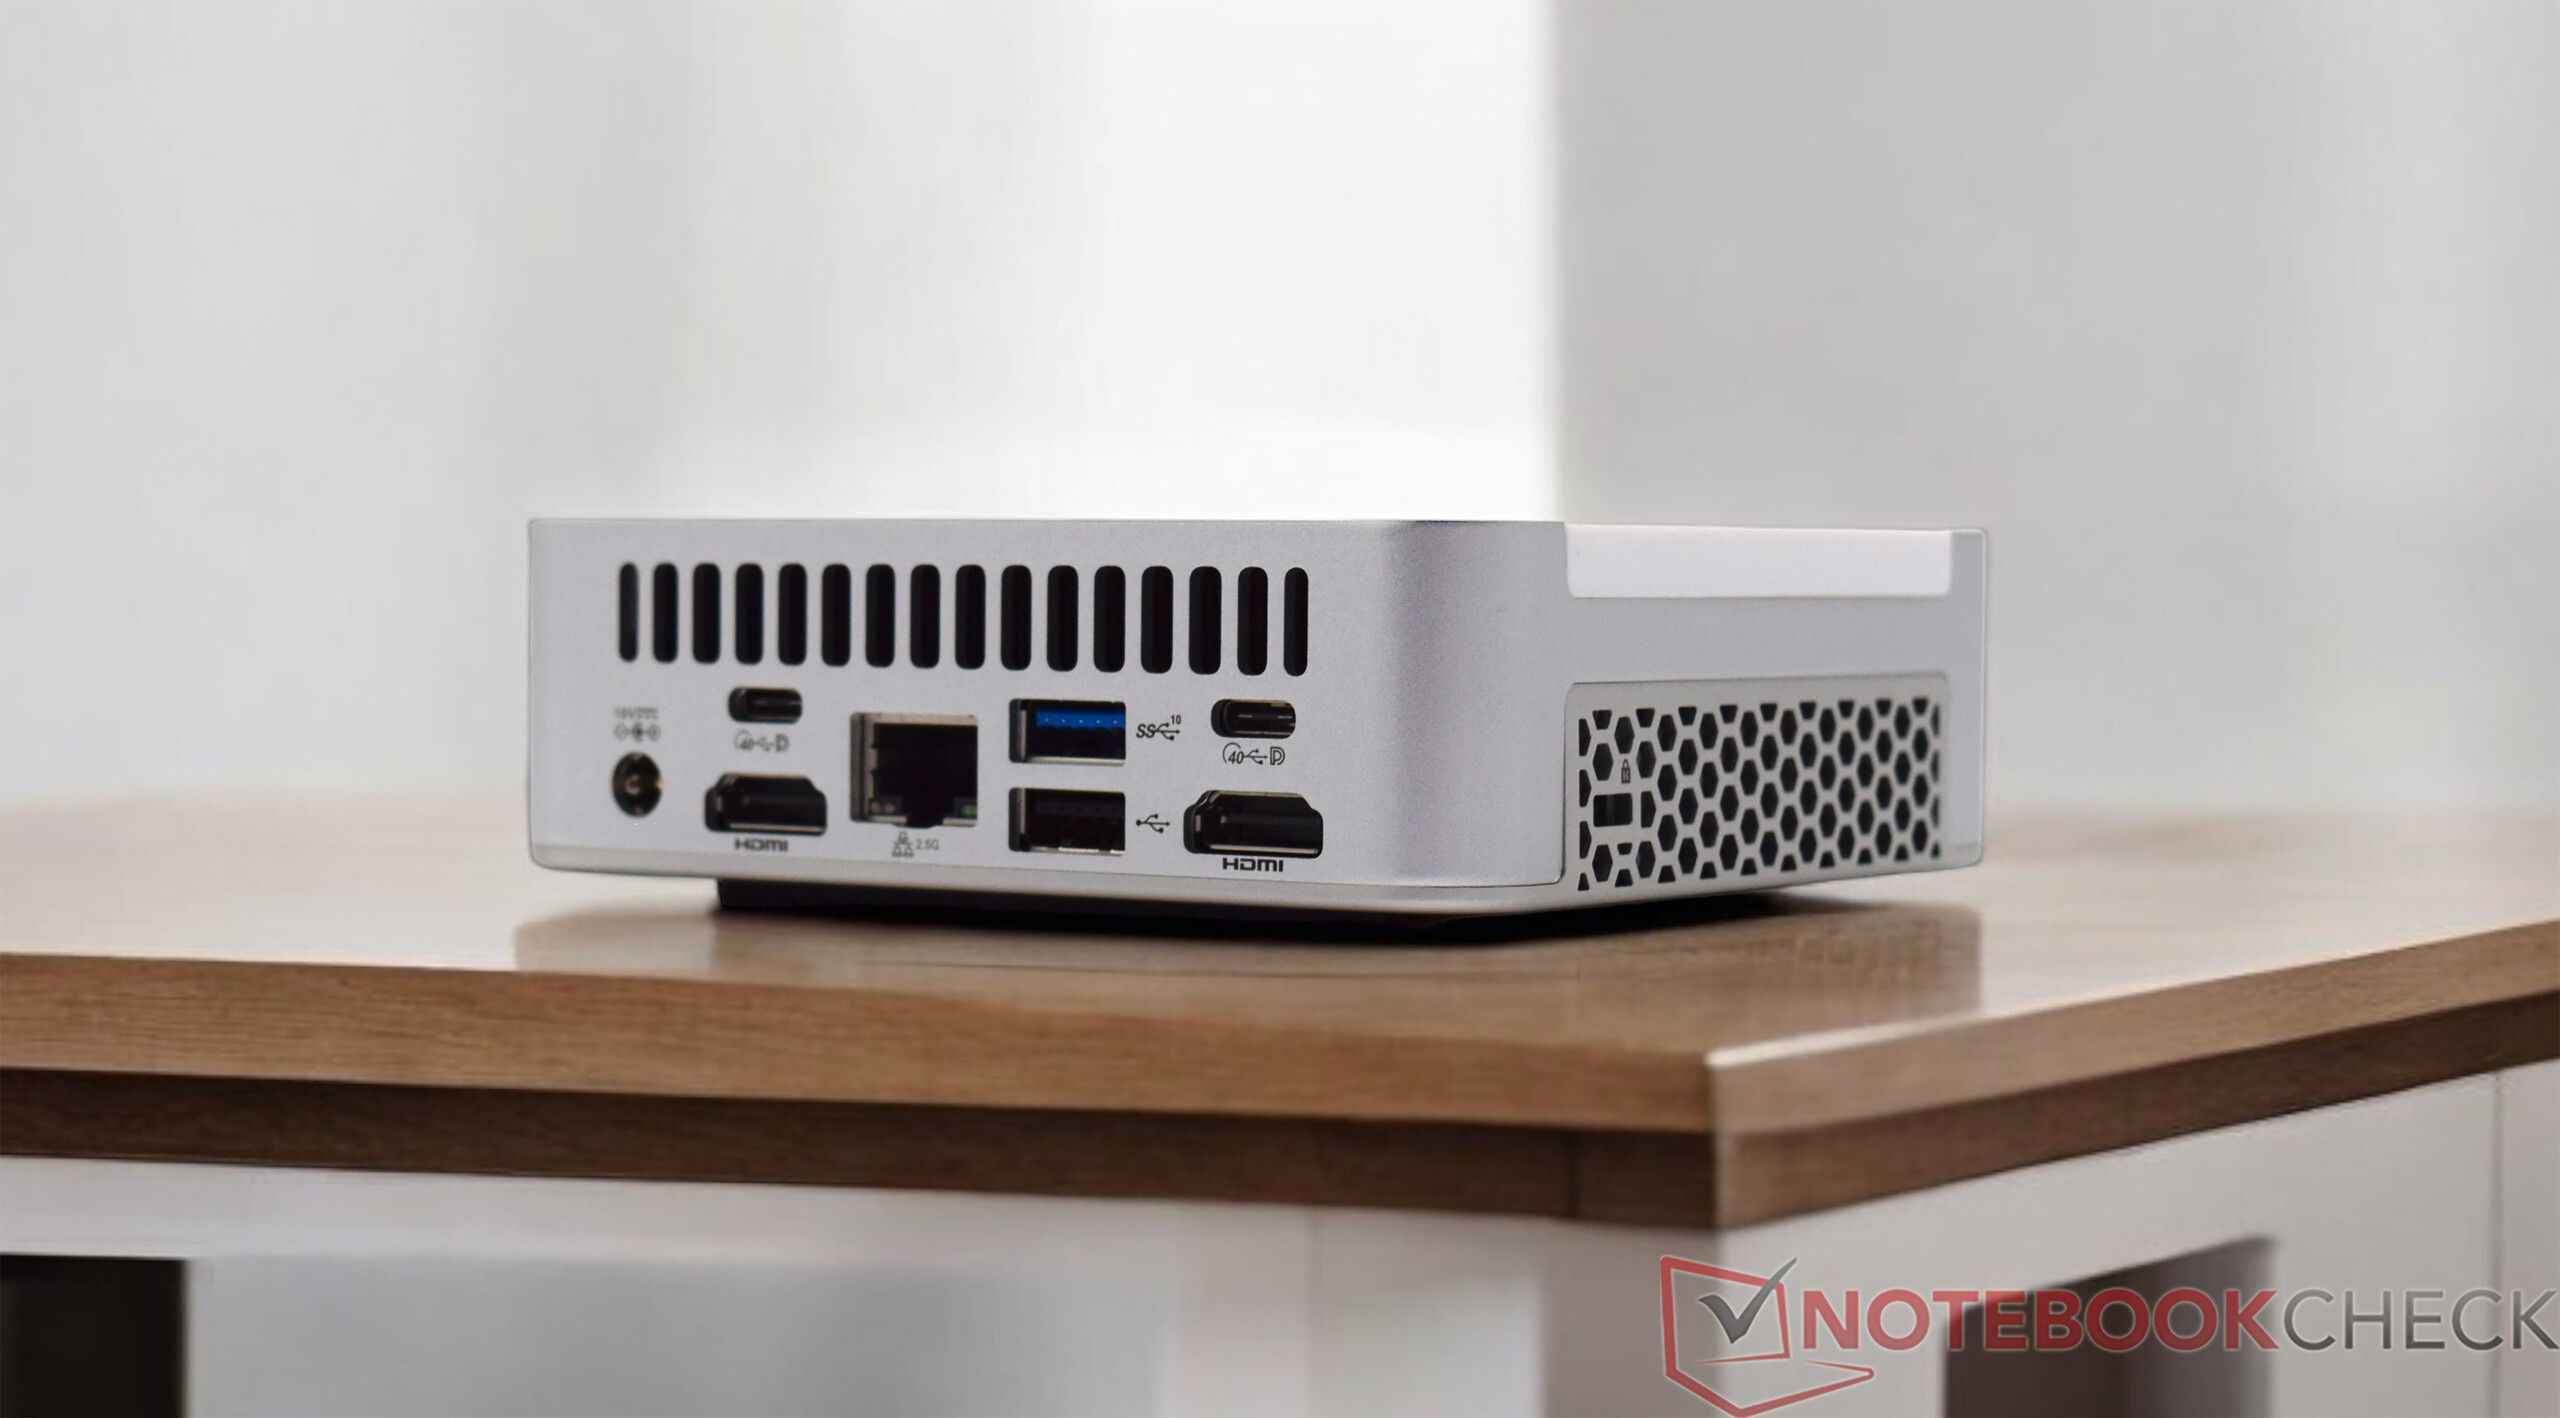
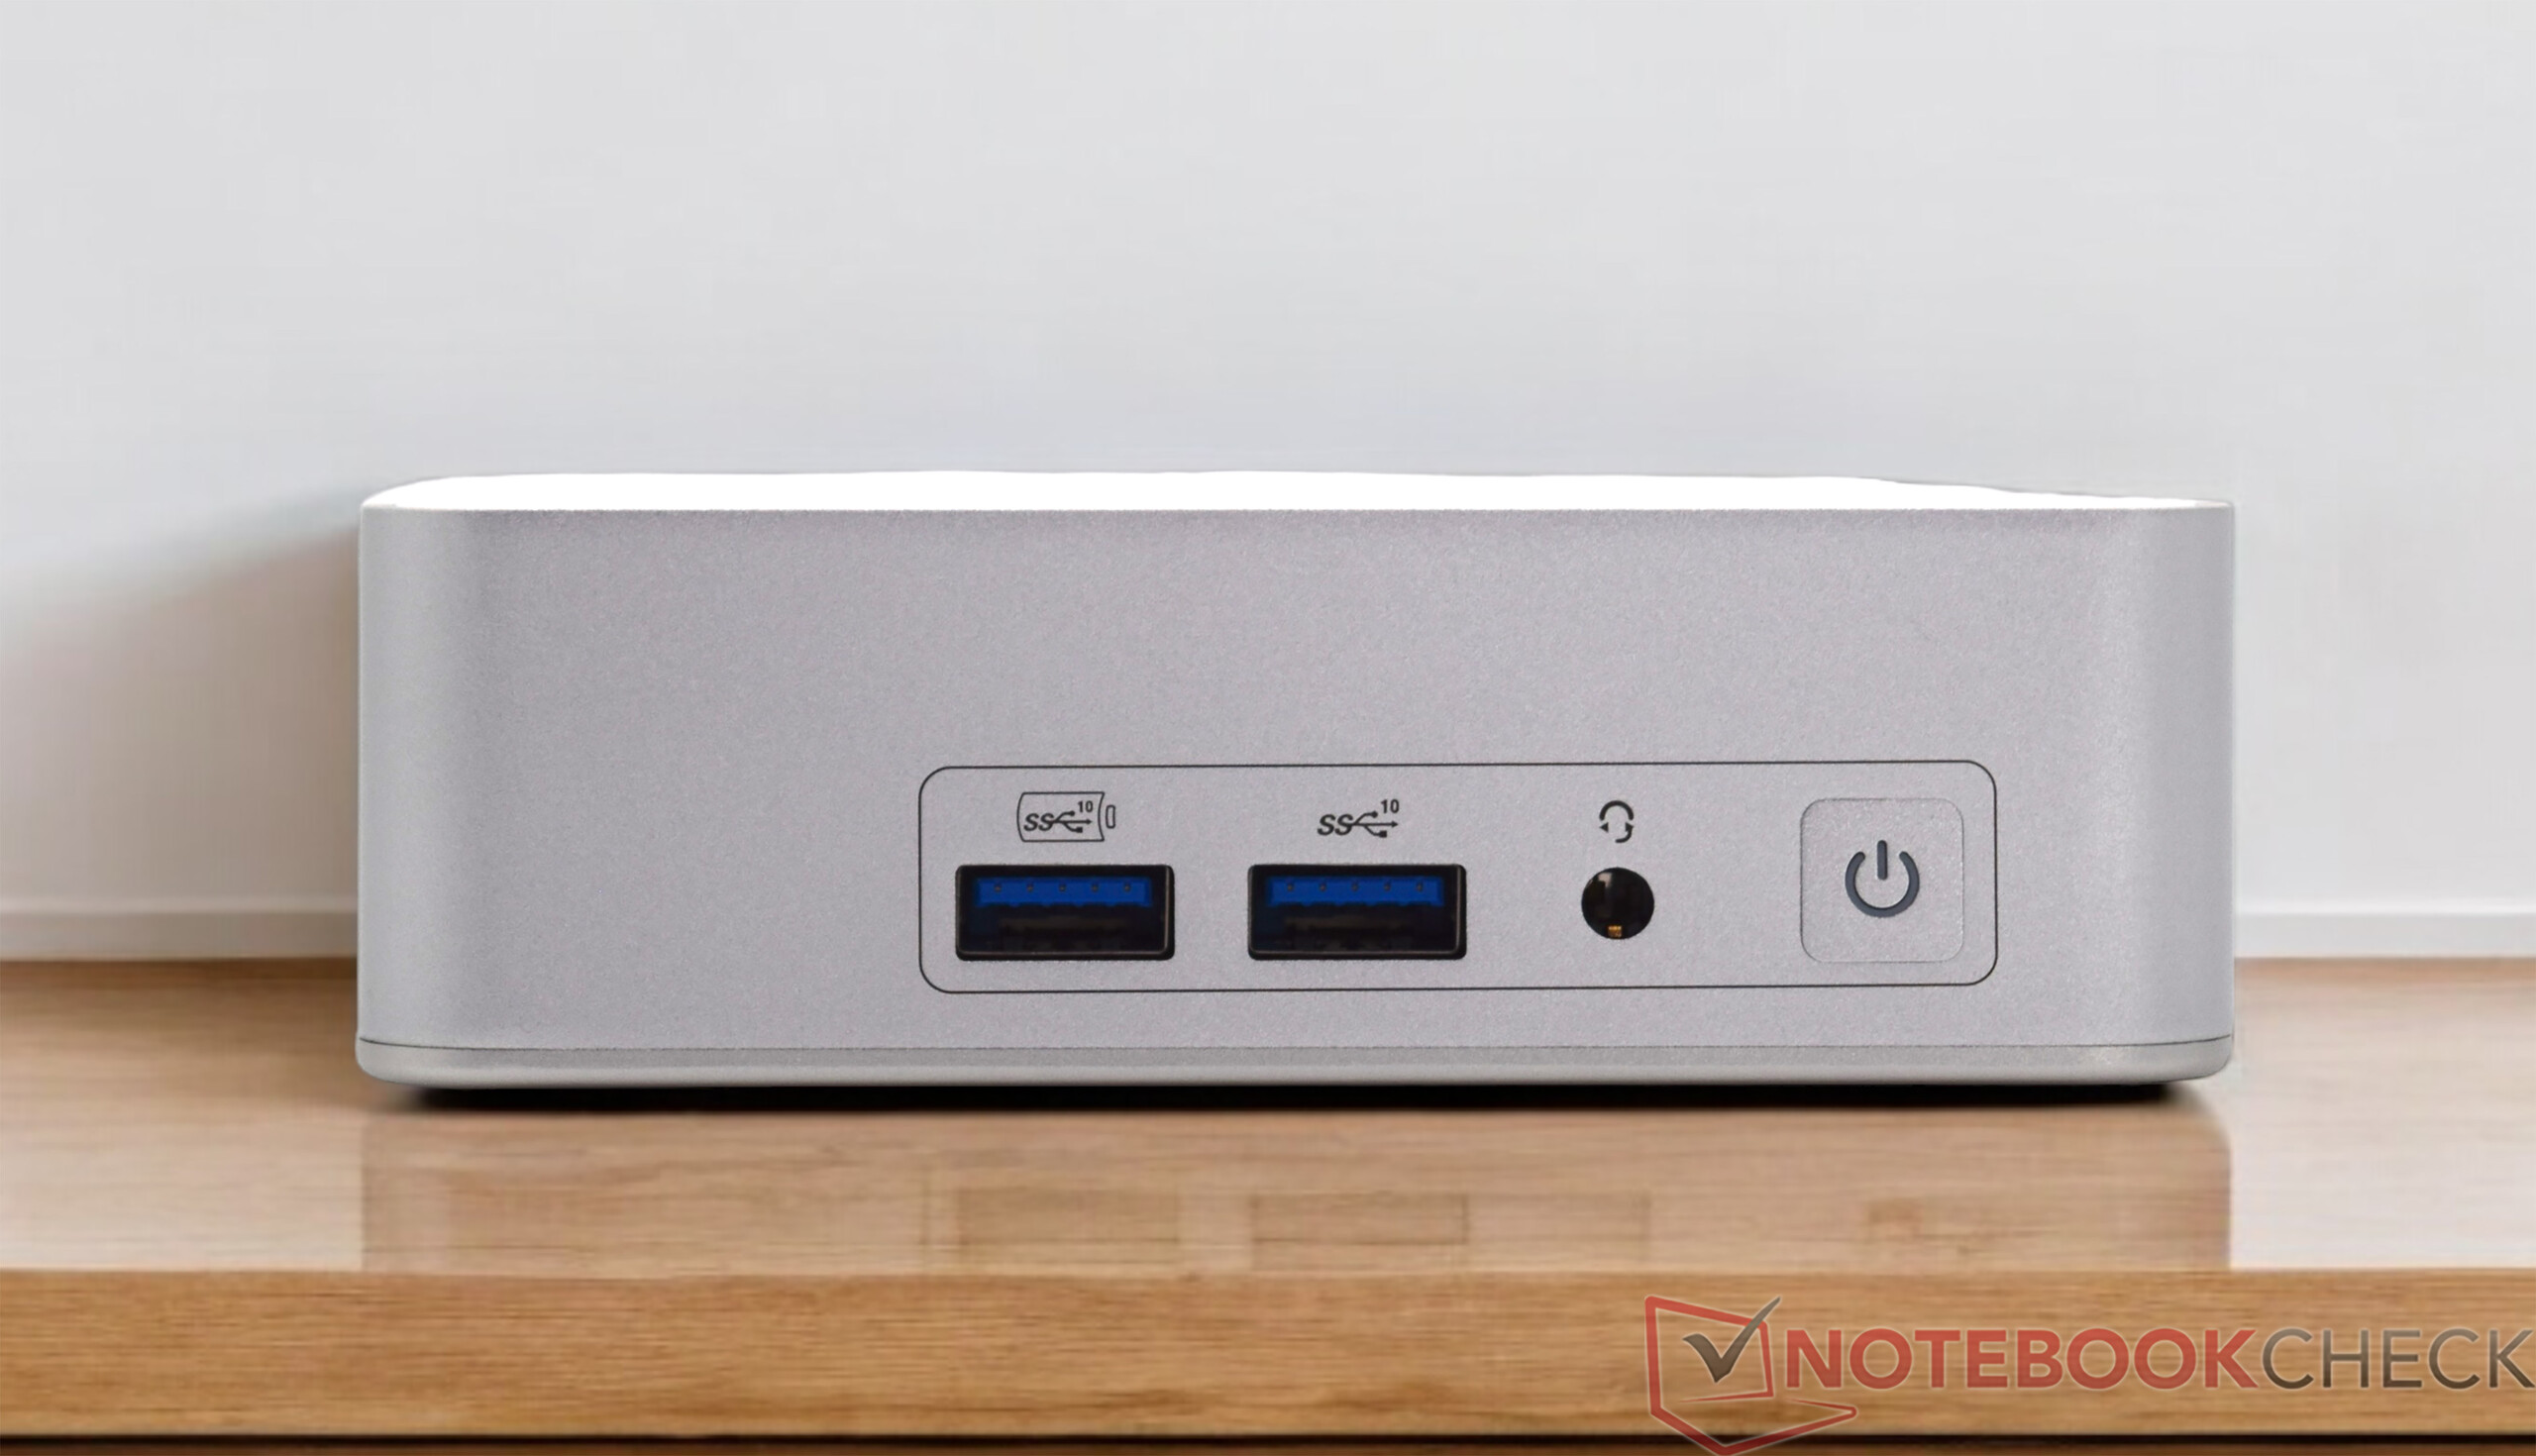
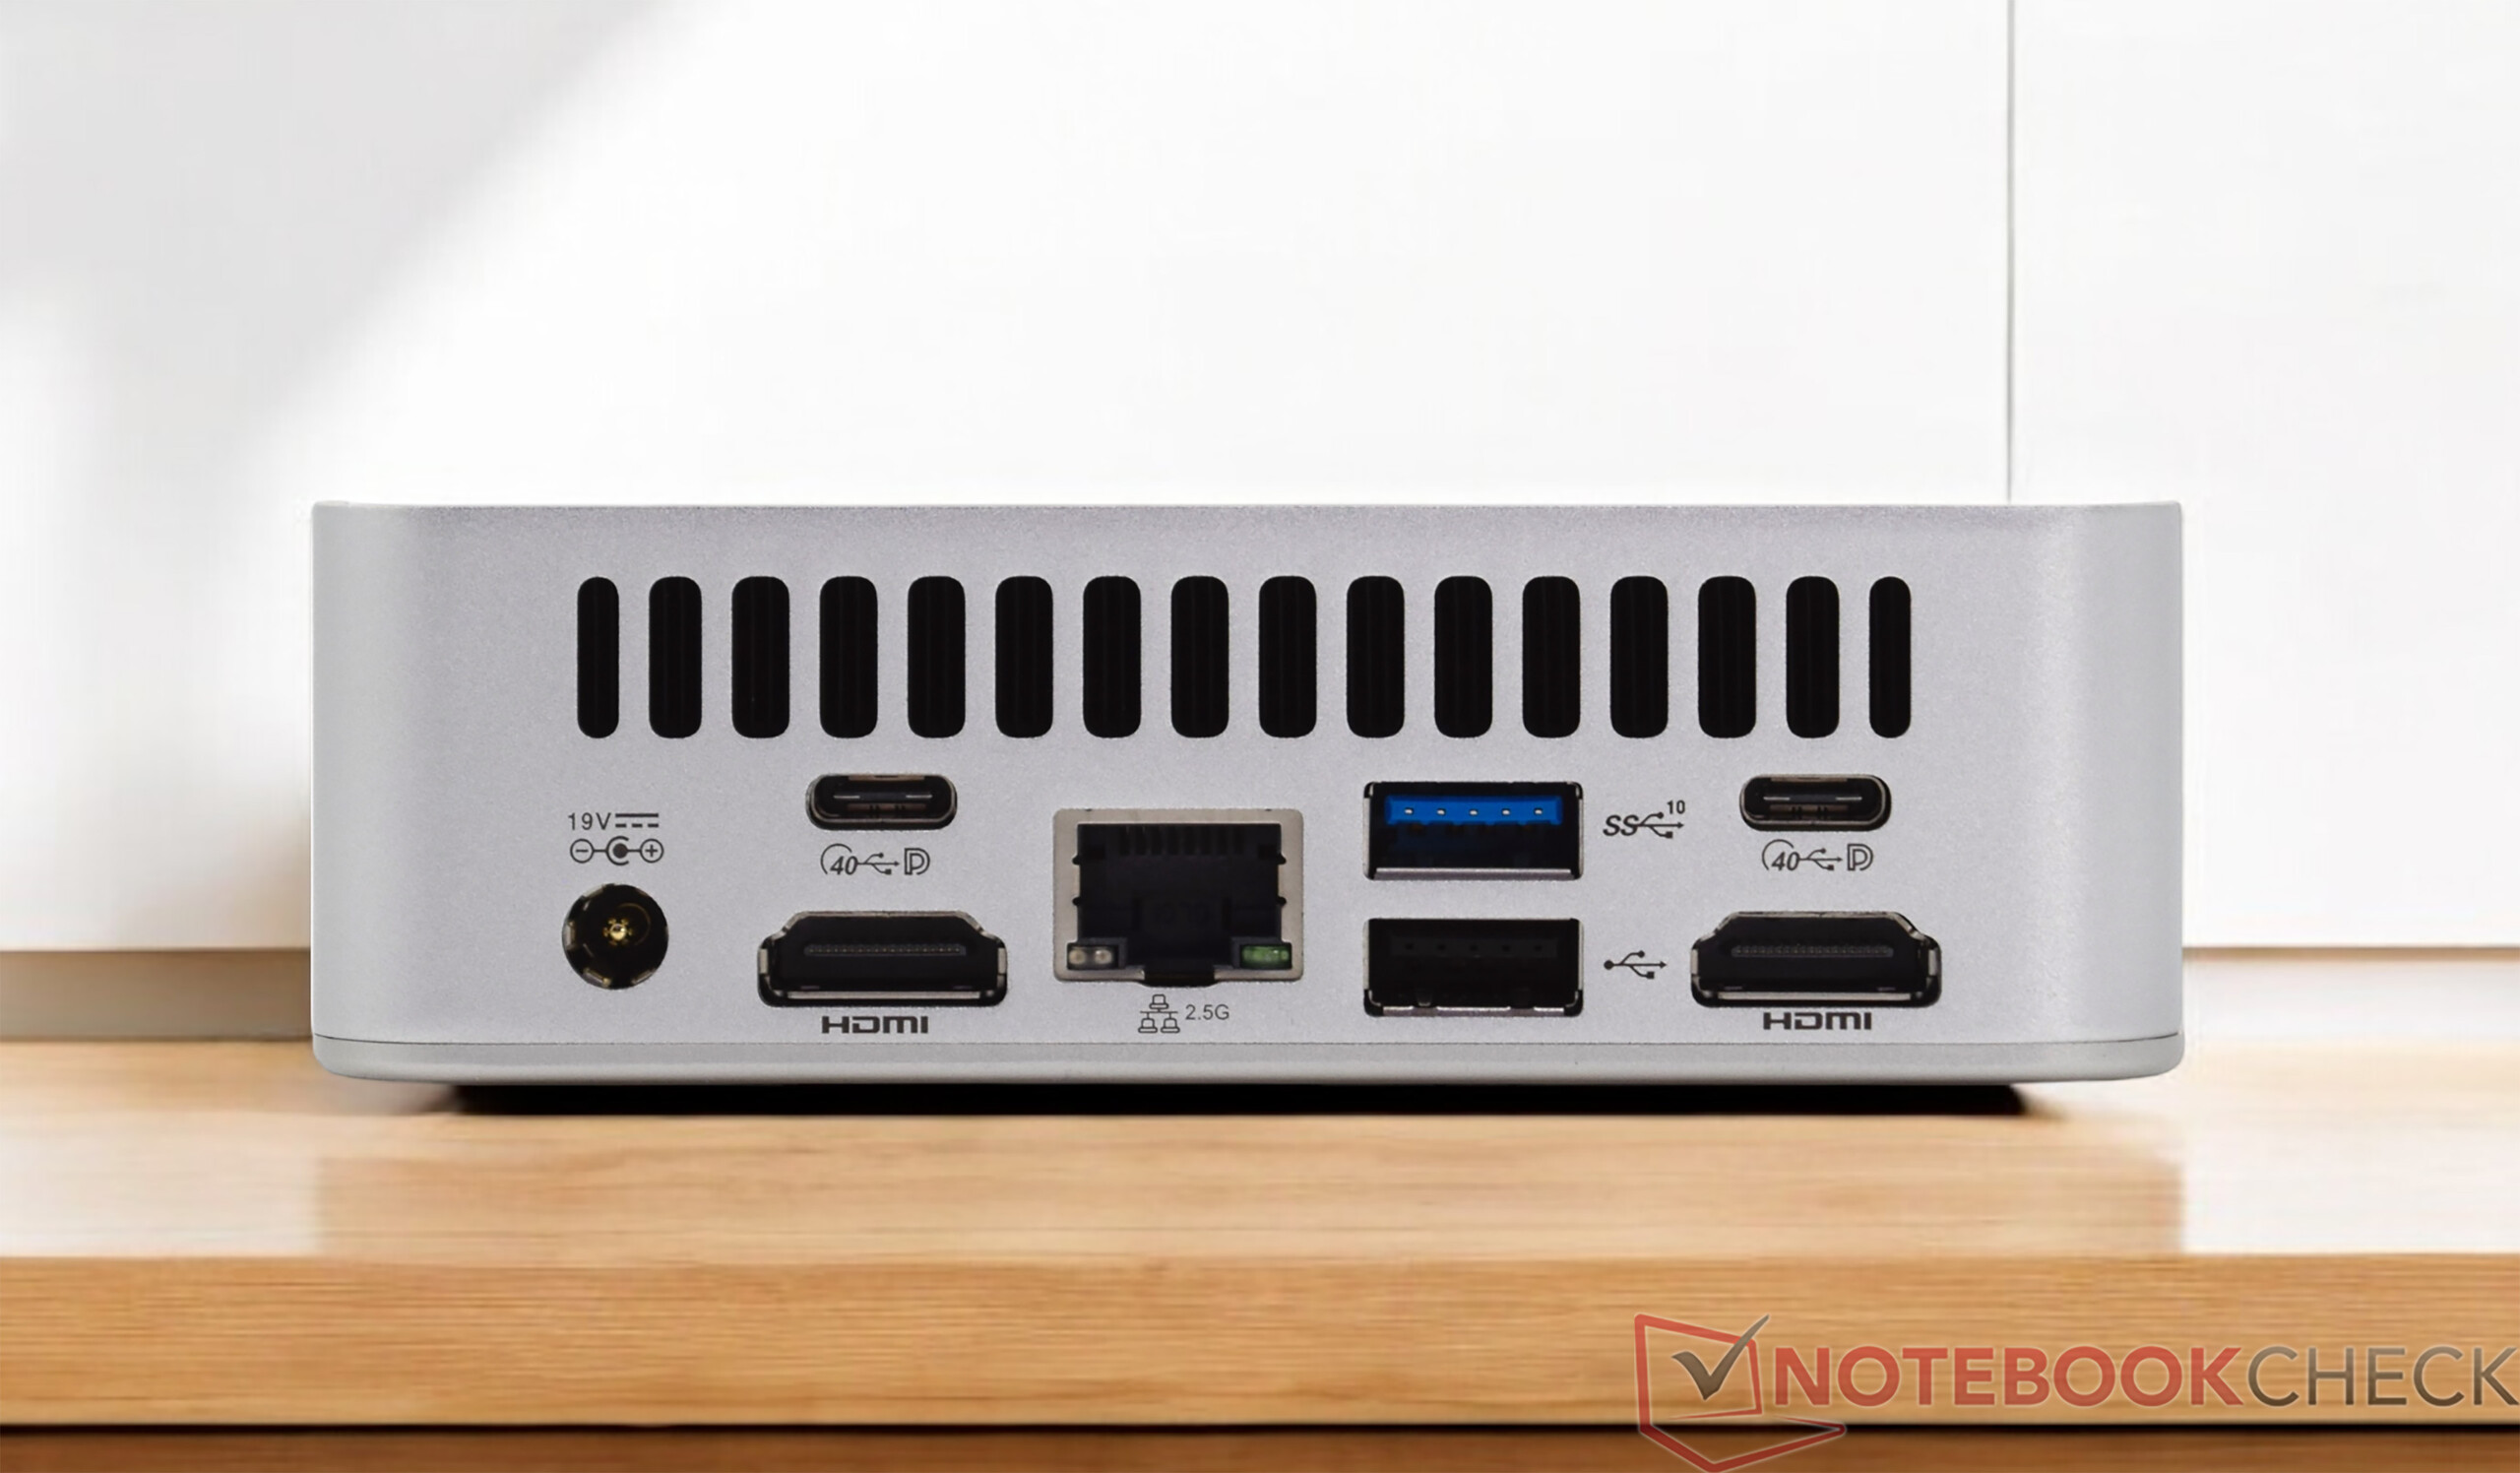
Harici arayüzler açısından Geekom XT13 Pro, Geekom XT12 Pro ile aynı seçeneklere sahip. Cihaz çok kompakt olmasına rağmen, birçok farklı bağlantı var. Arka taraftaki iki USB-C soketi, doğru aksesuarlarla uygulama yelpazesini büyük ölçüde genişleten modern USB4 bağlantı noktalarıdır. Toplam dört ekran aynı anda çalıştırılabilir ve ayrıca bir LAN bağlantısı da vardır.
İletişim
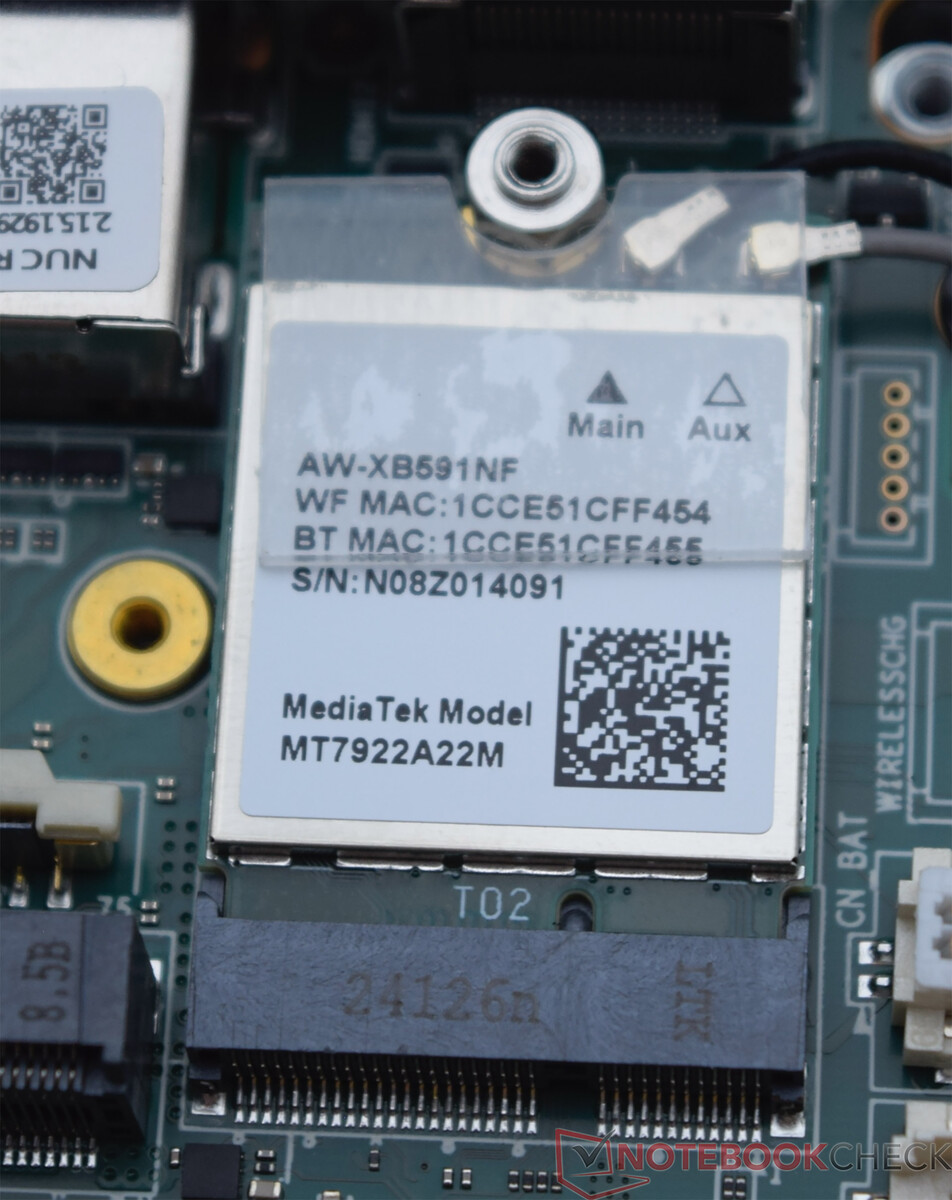
Geekom XT13 Pro, Geekom'un birçok cihazına yüklediği iyi bilinen bir kablosuz modül kullanıyor. MediaTek Wi-Fi 6E MT7922 WLAN modülü test cihazımızda yeterli performans sağlayabilir. Ancak mümkünse öncelikle 6 GHz frekans aralığı kullanılmalıdır. Alternatif olarak kablo bağlantısı da kullanılabilir. Bu durumda 2,5 GBit/s'ye varan veri hızları bile mümkündür.
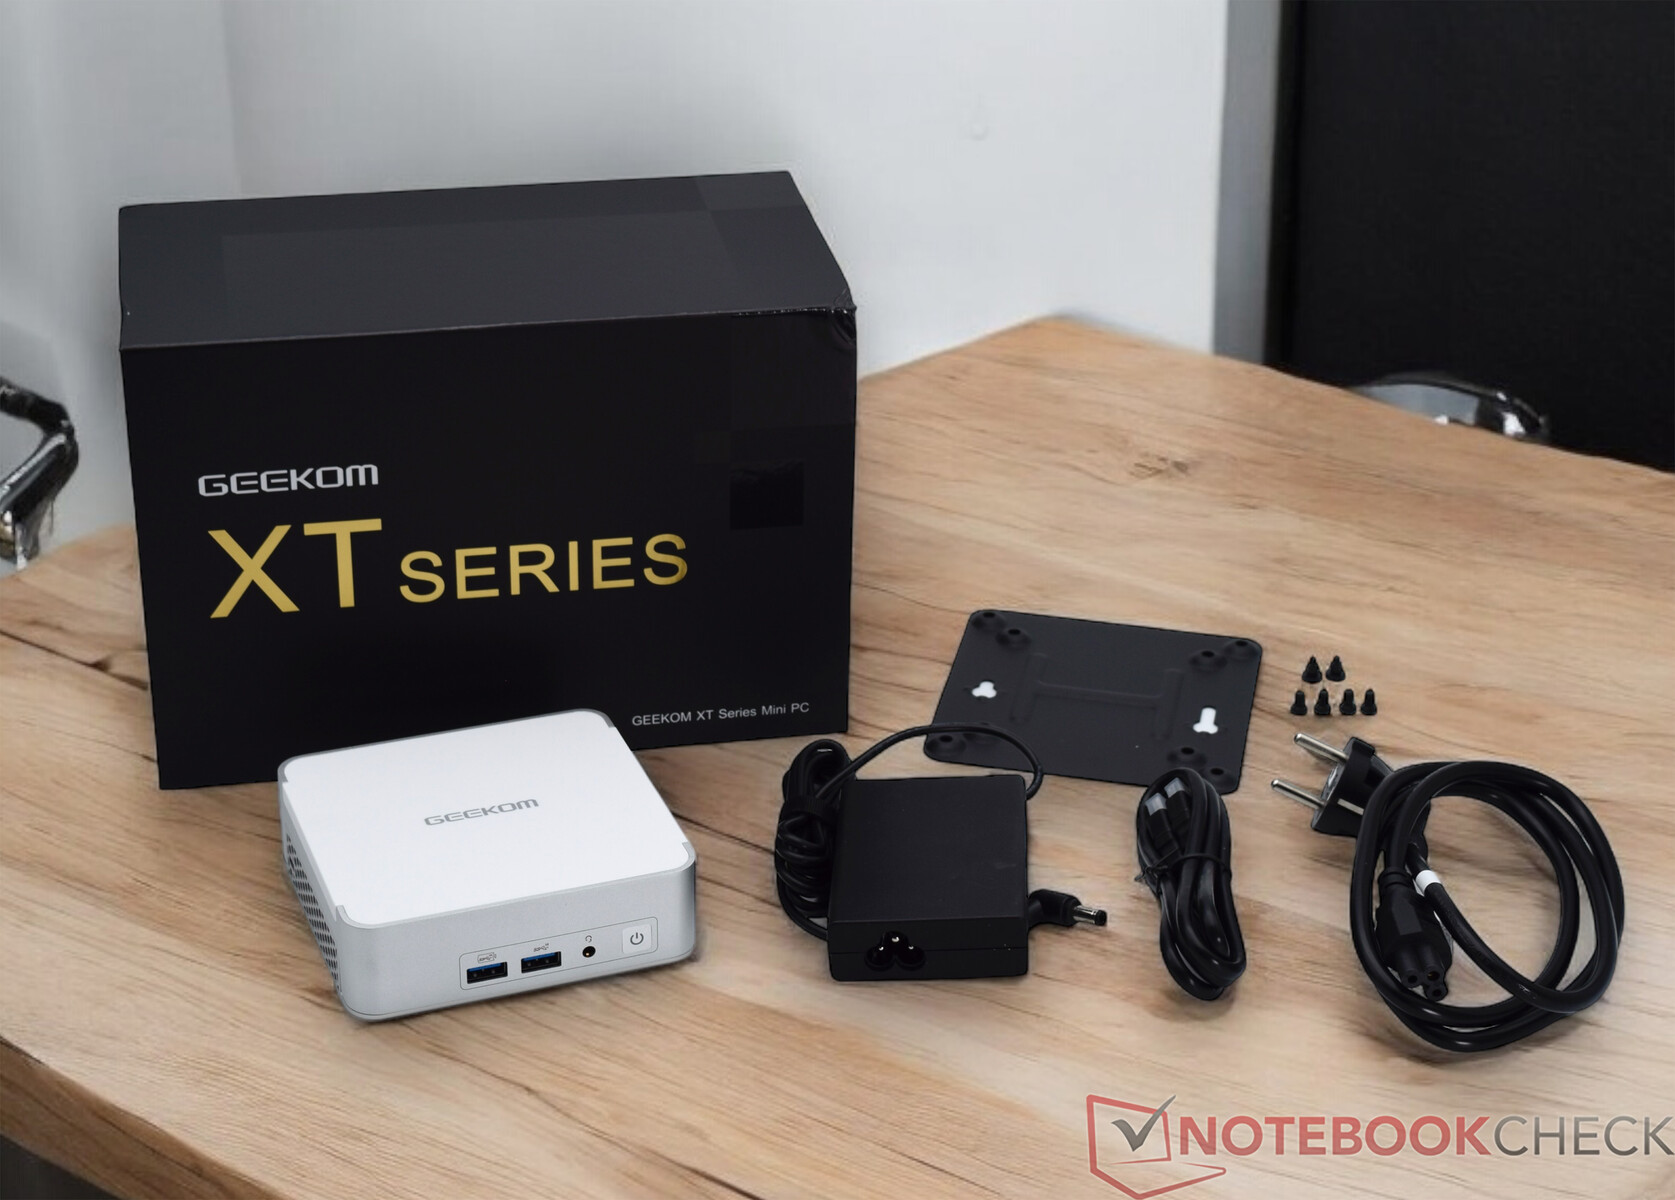
Aksesuarlar
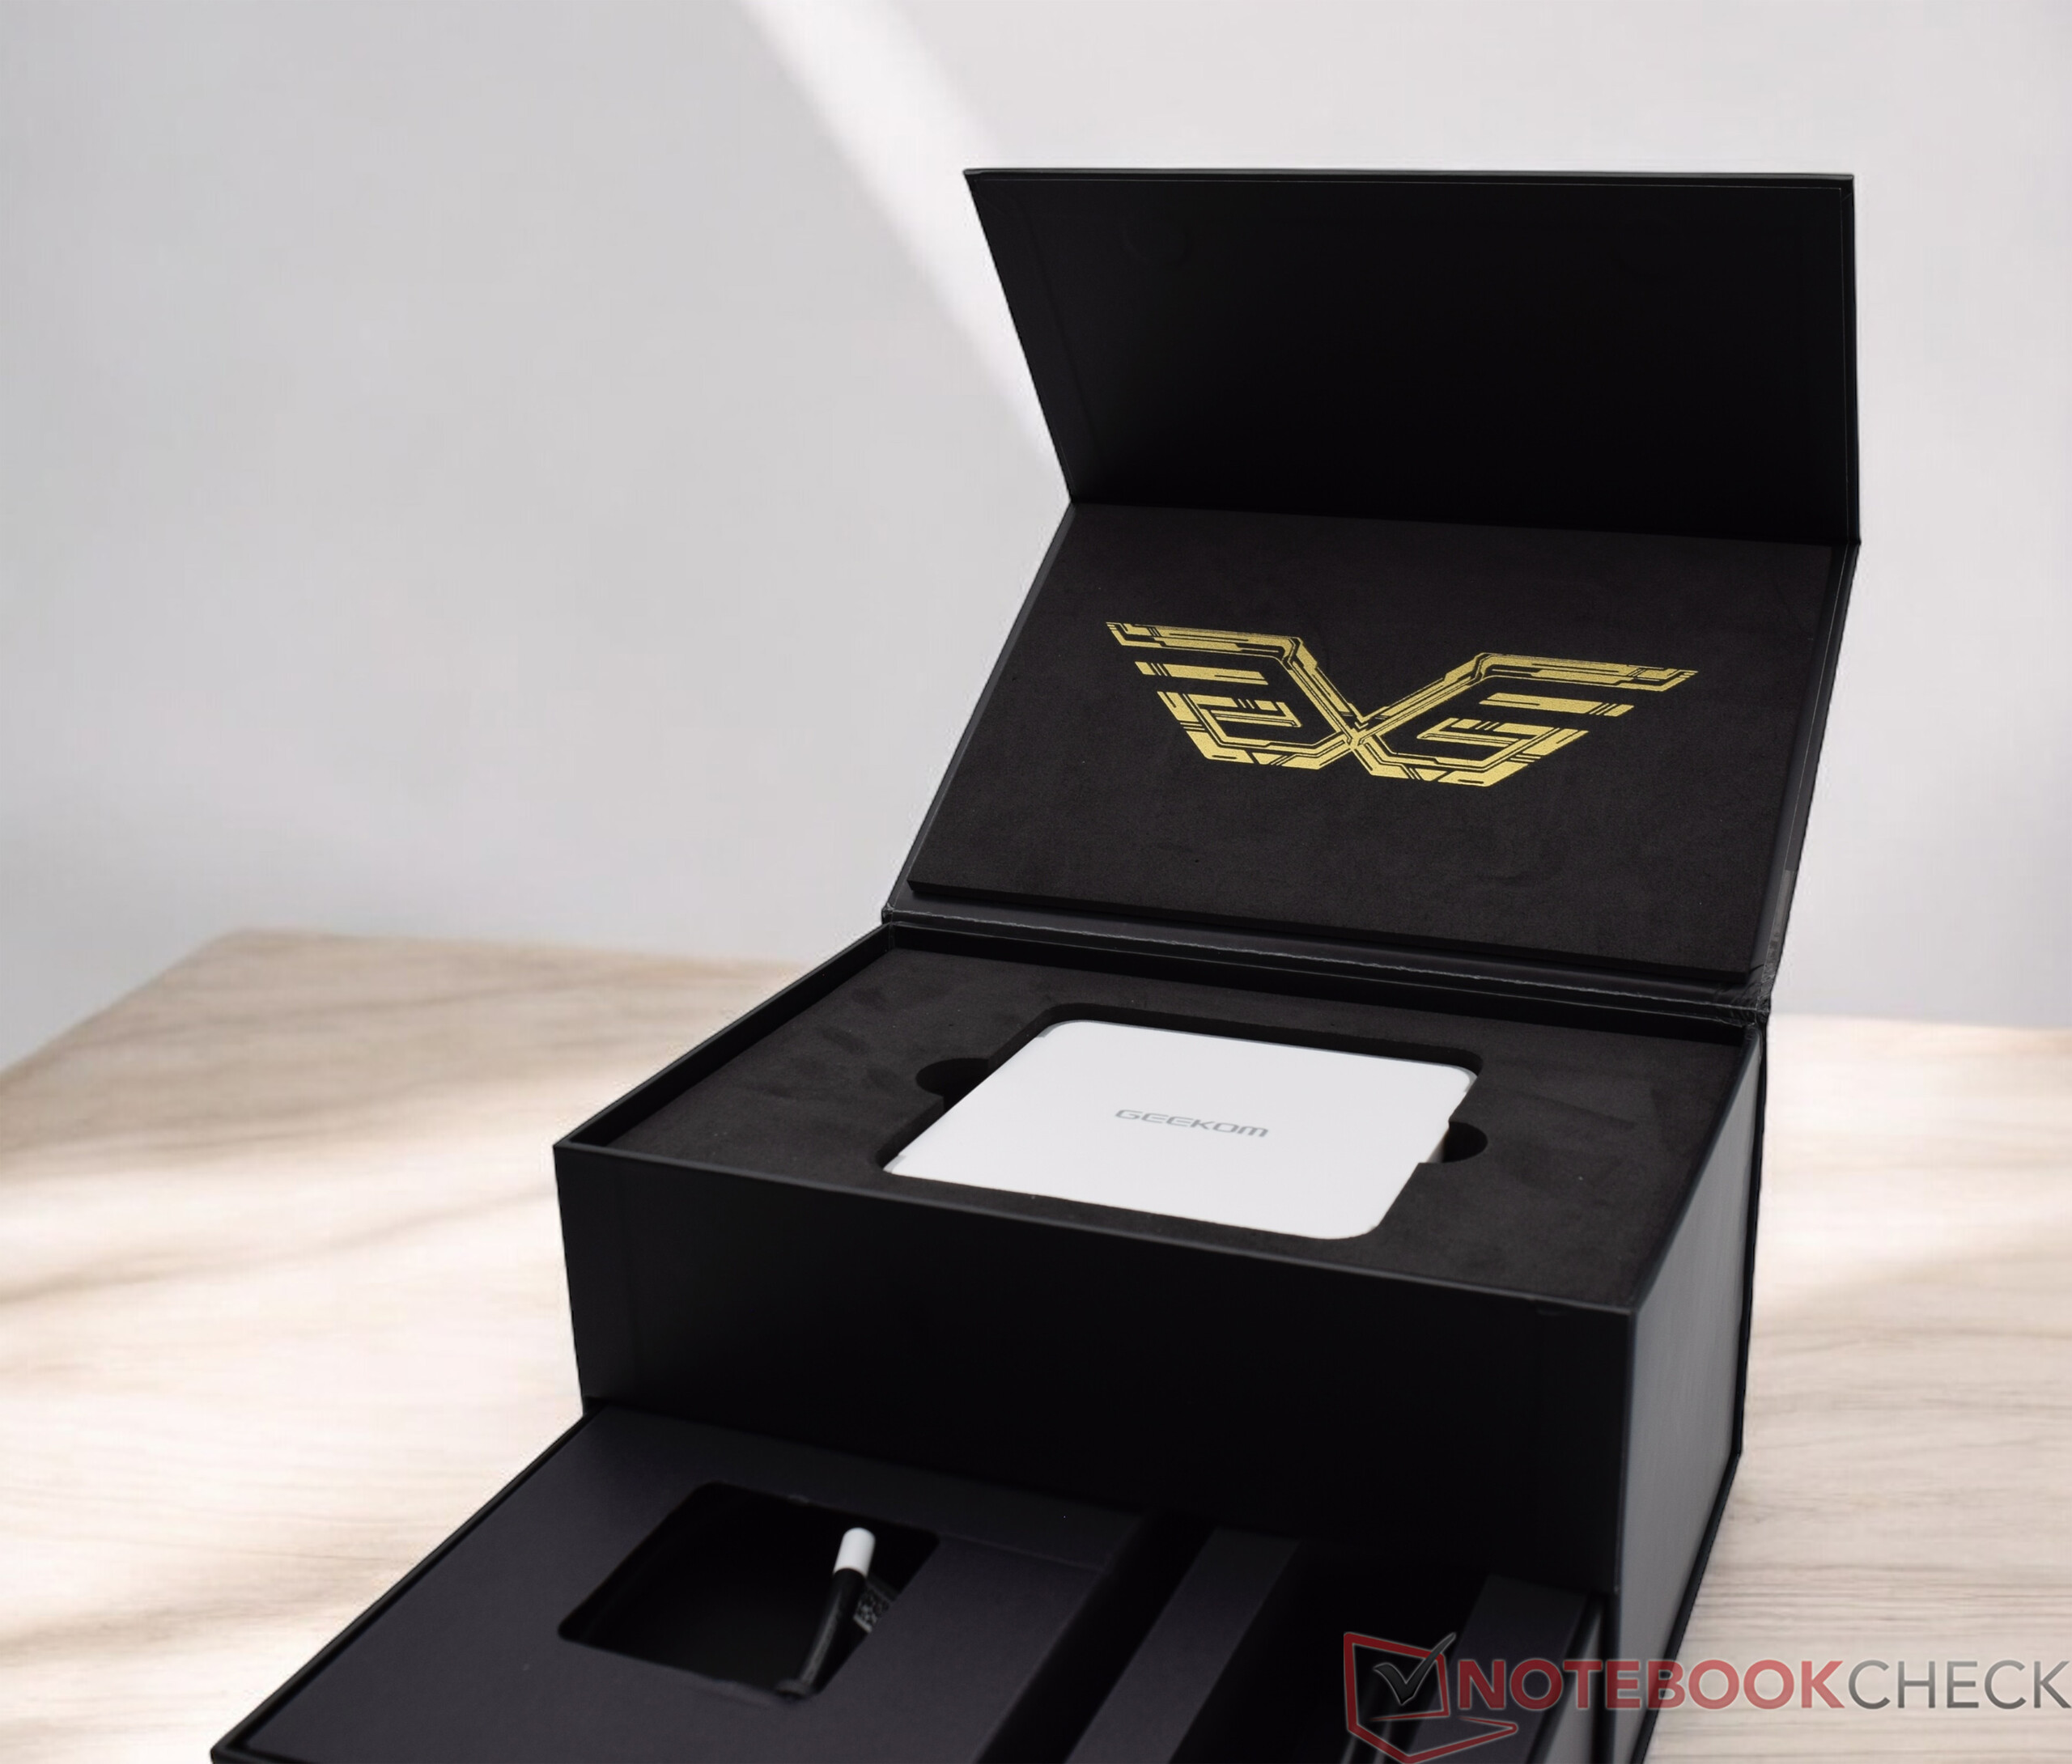
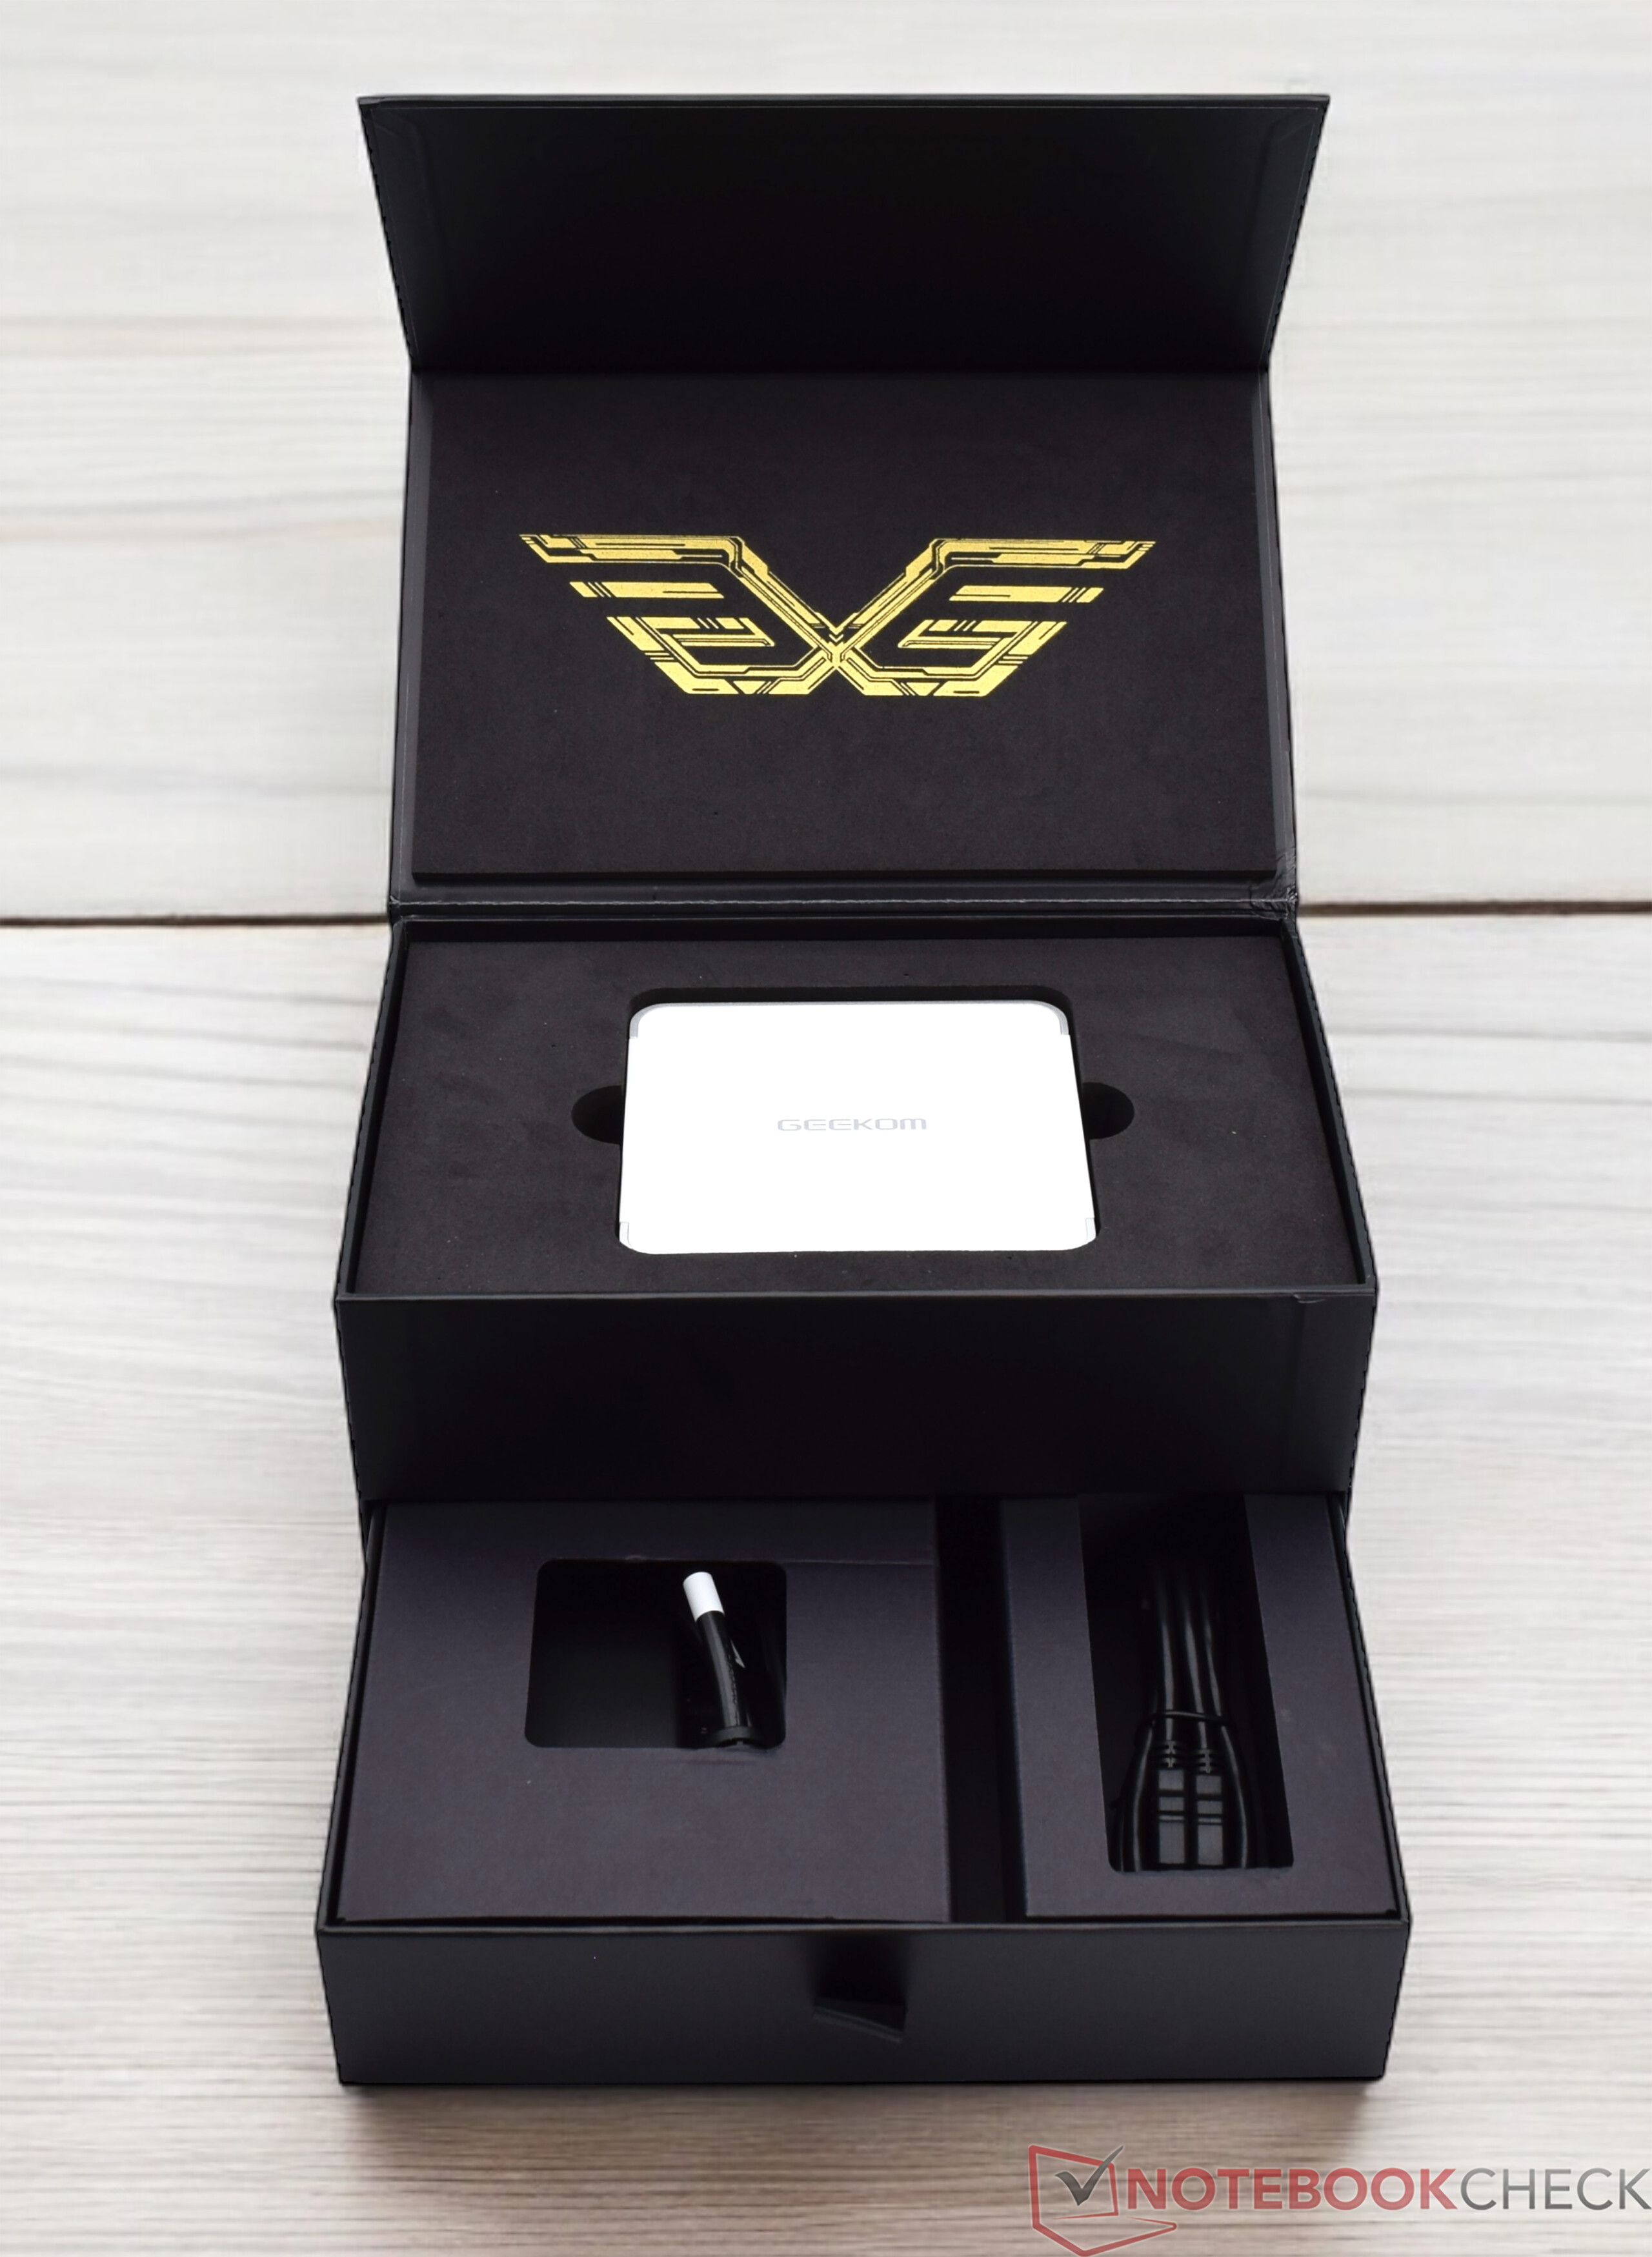
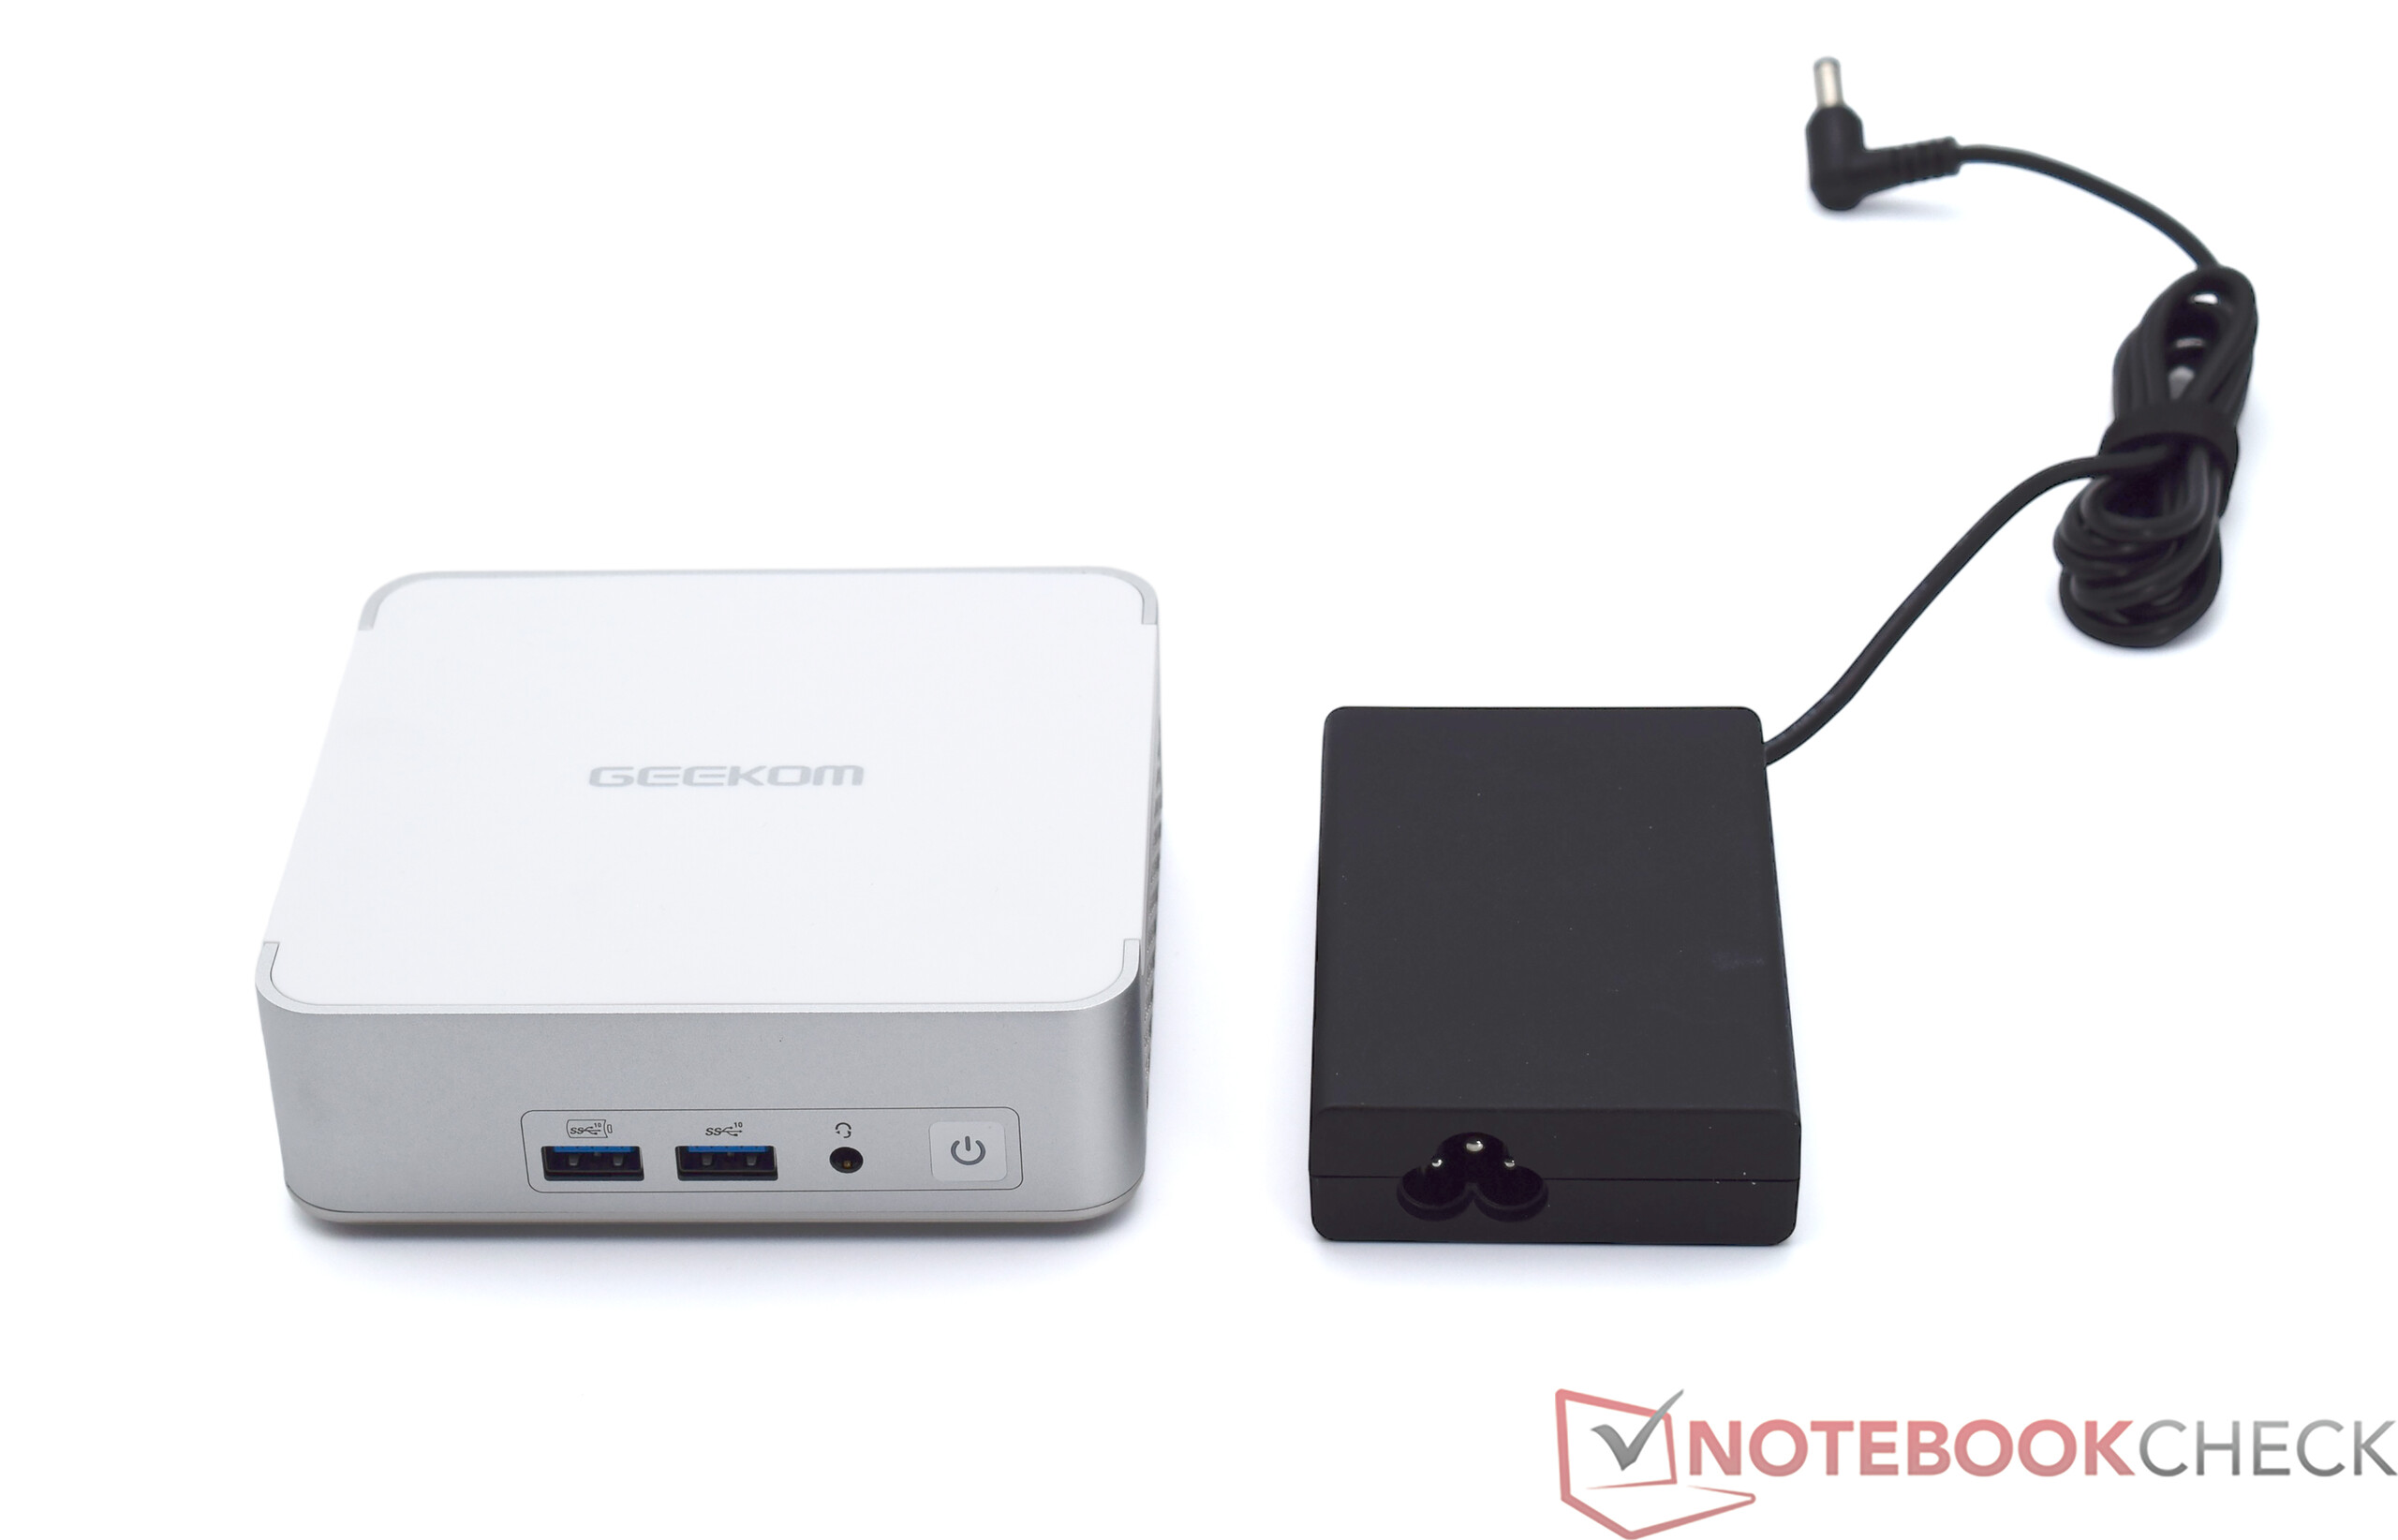
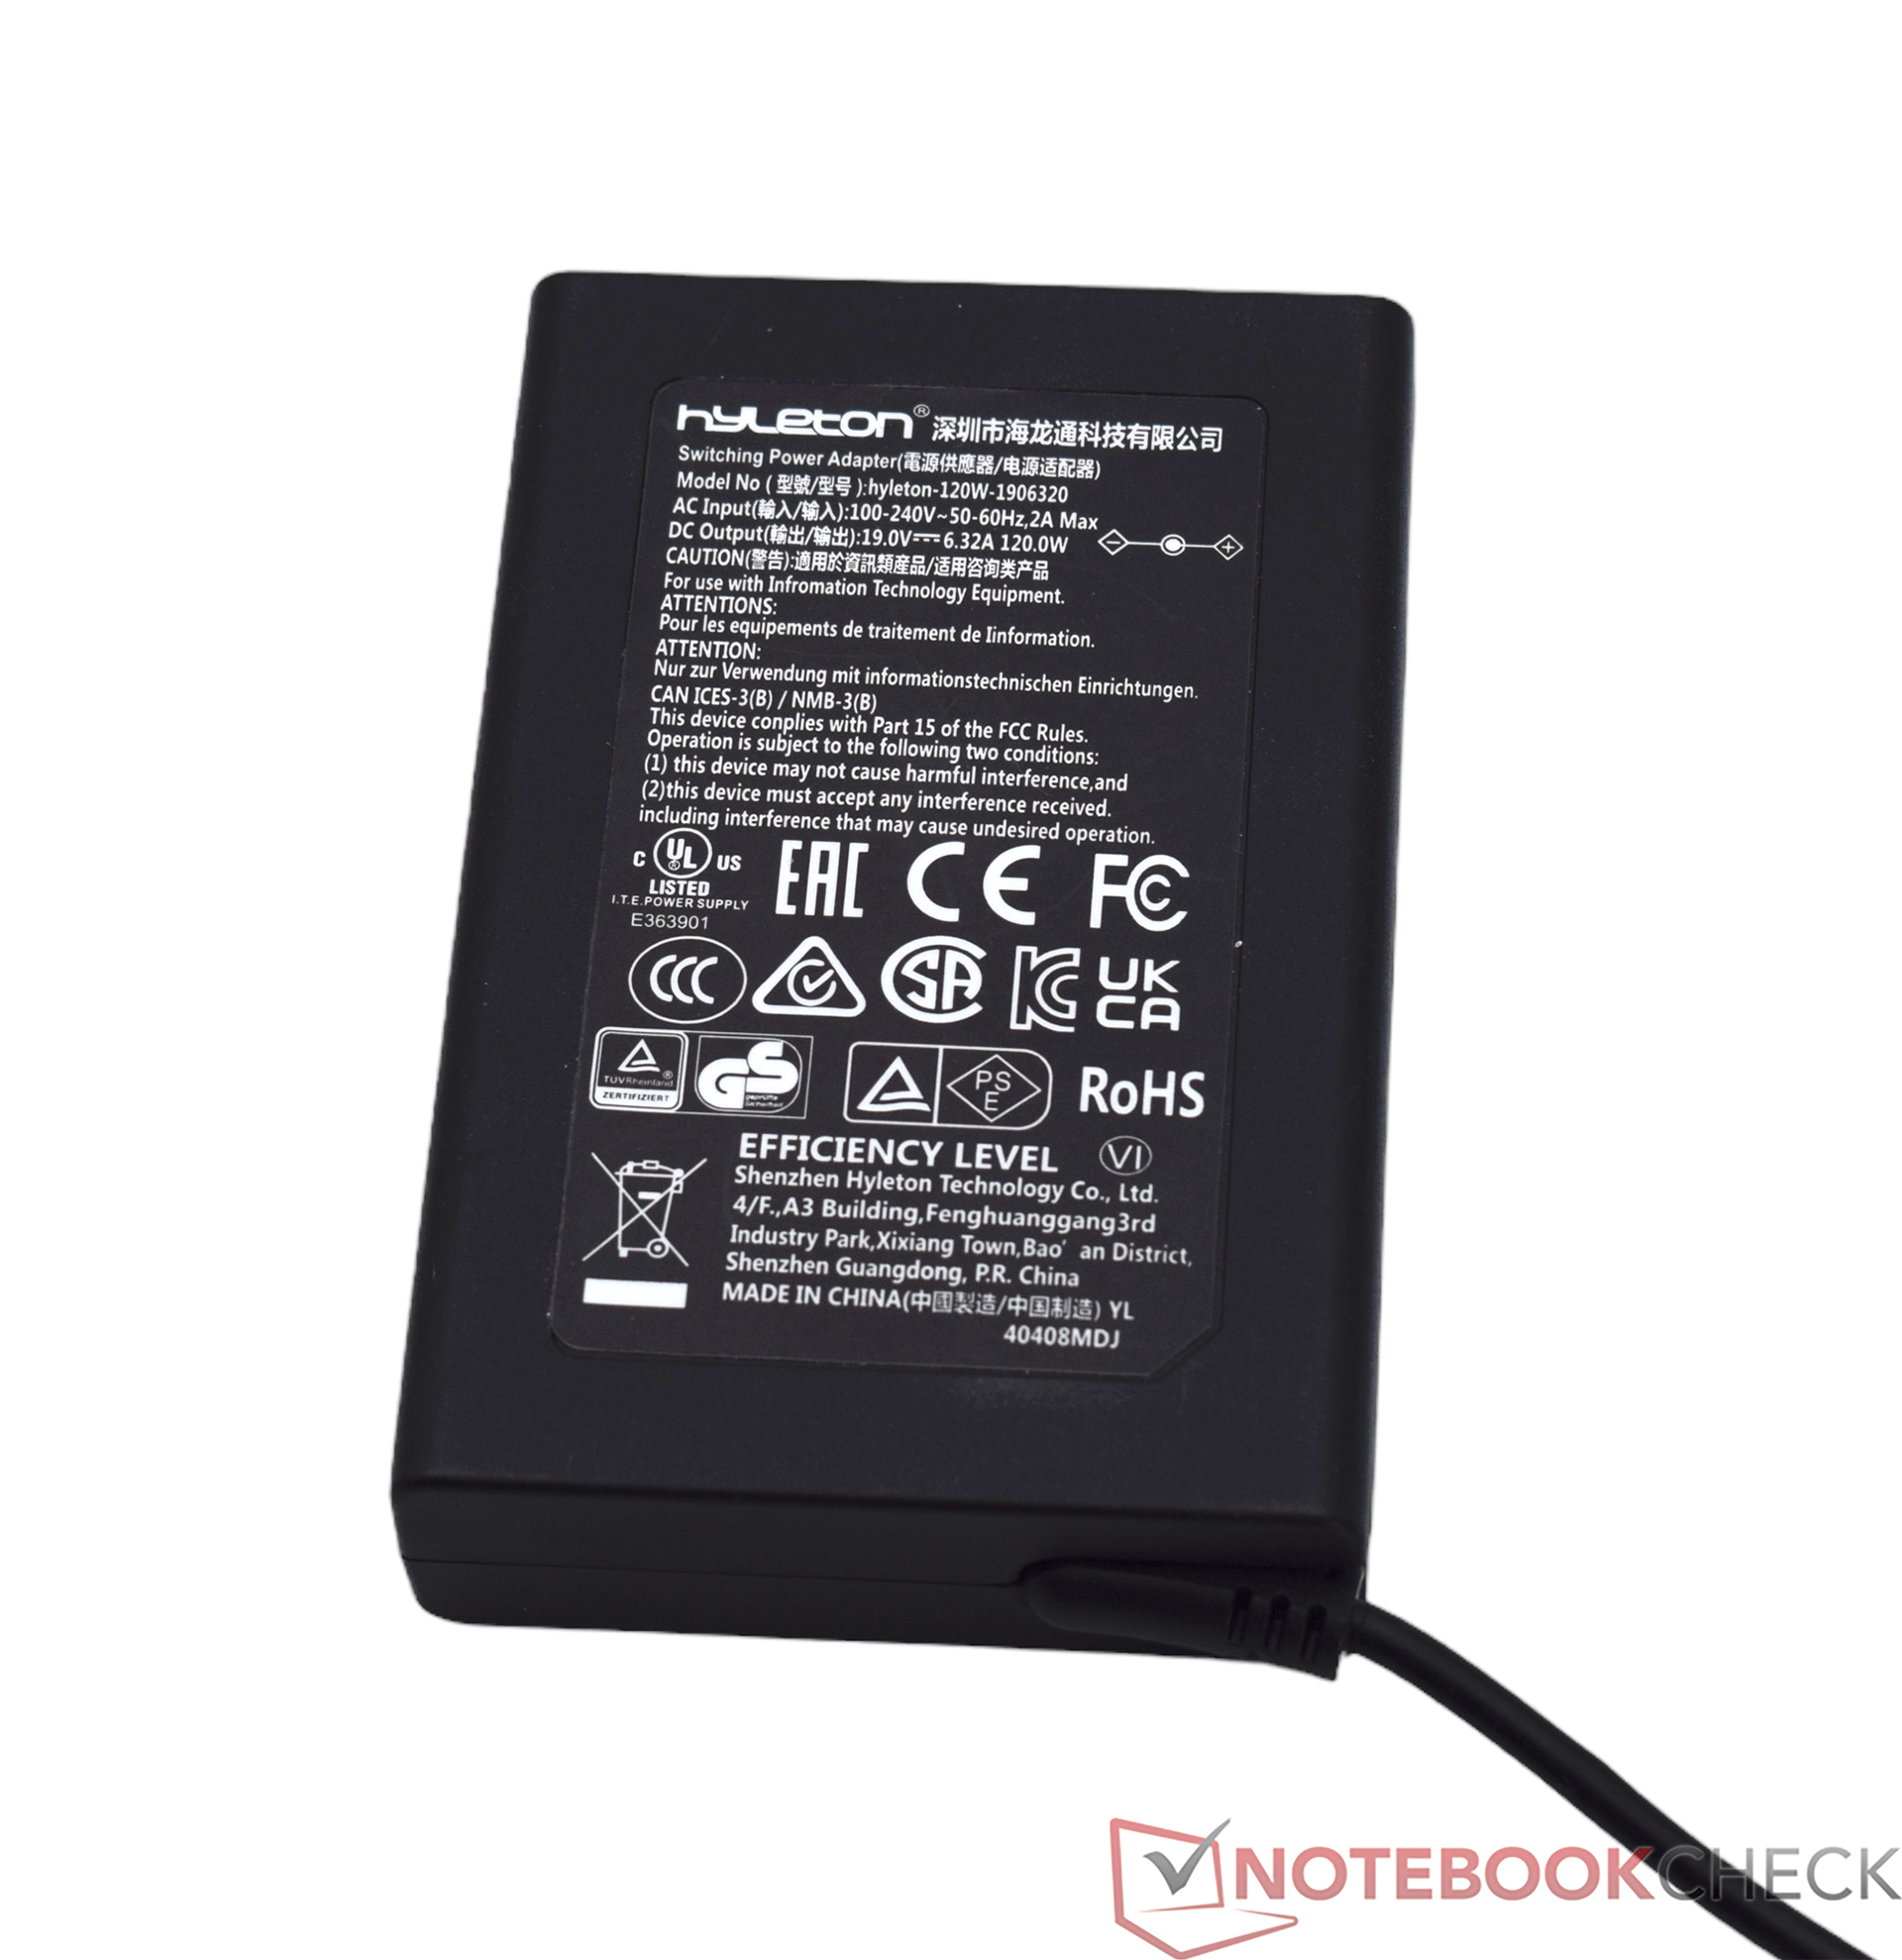
Geekom XT13 Pro'nun teslimat kapsamı olağan standartları sunuyor. Kutuda cihazın kendisine ek olarak 120 watt'lık güç kaynağı ünitesi ve montaj malzemeli bir VESA braketi de yer alıyor. Bir HDMI kablosu ve Geekom'un zorunlu teşekkür kartı da dahildir.
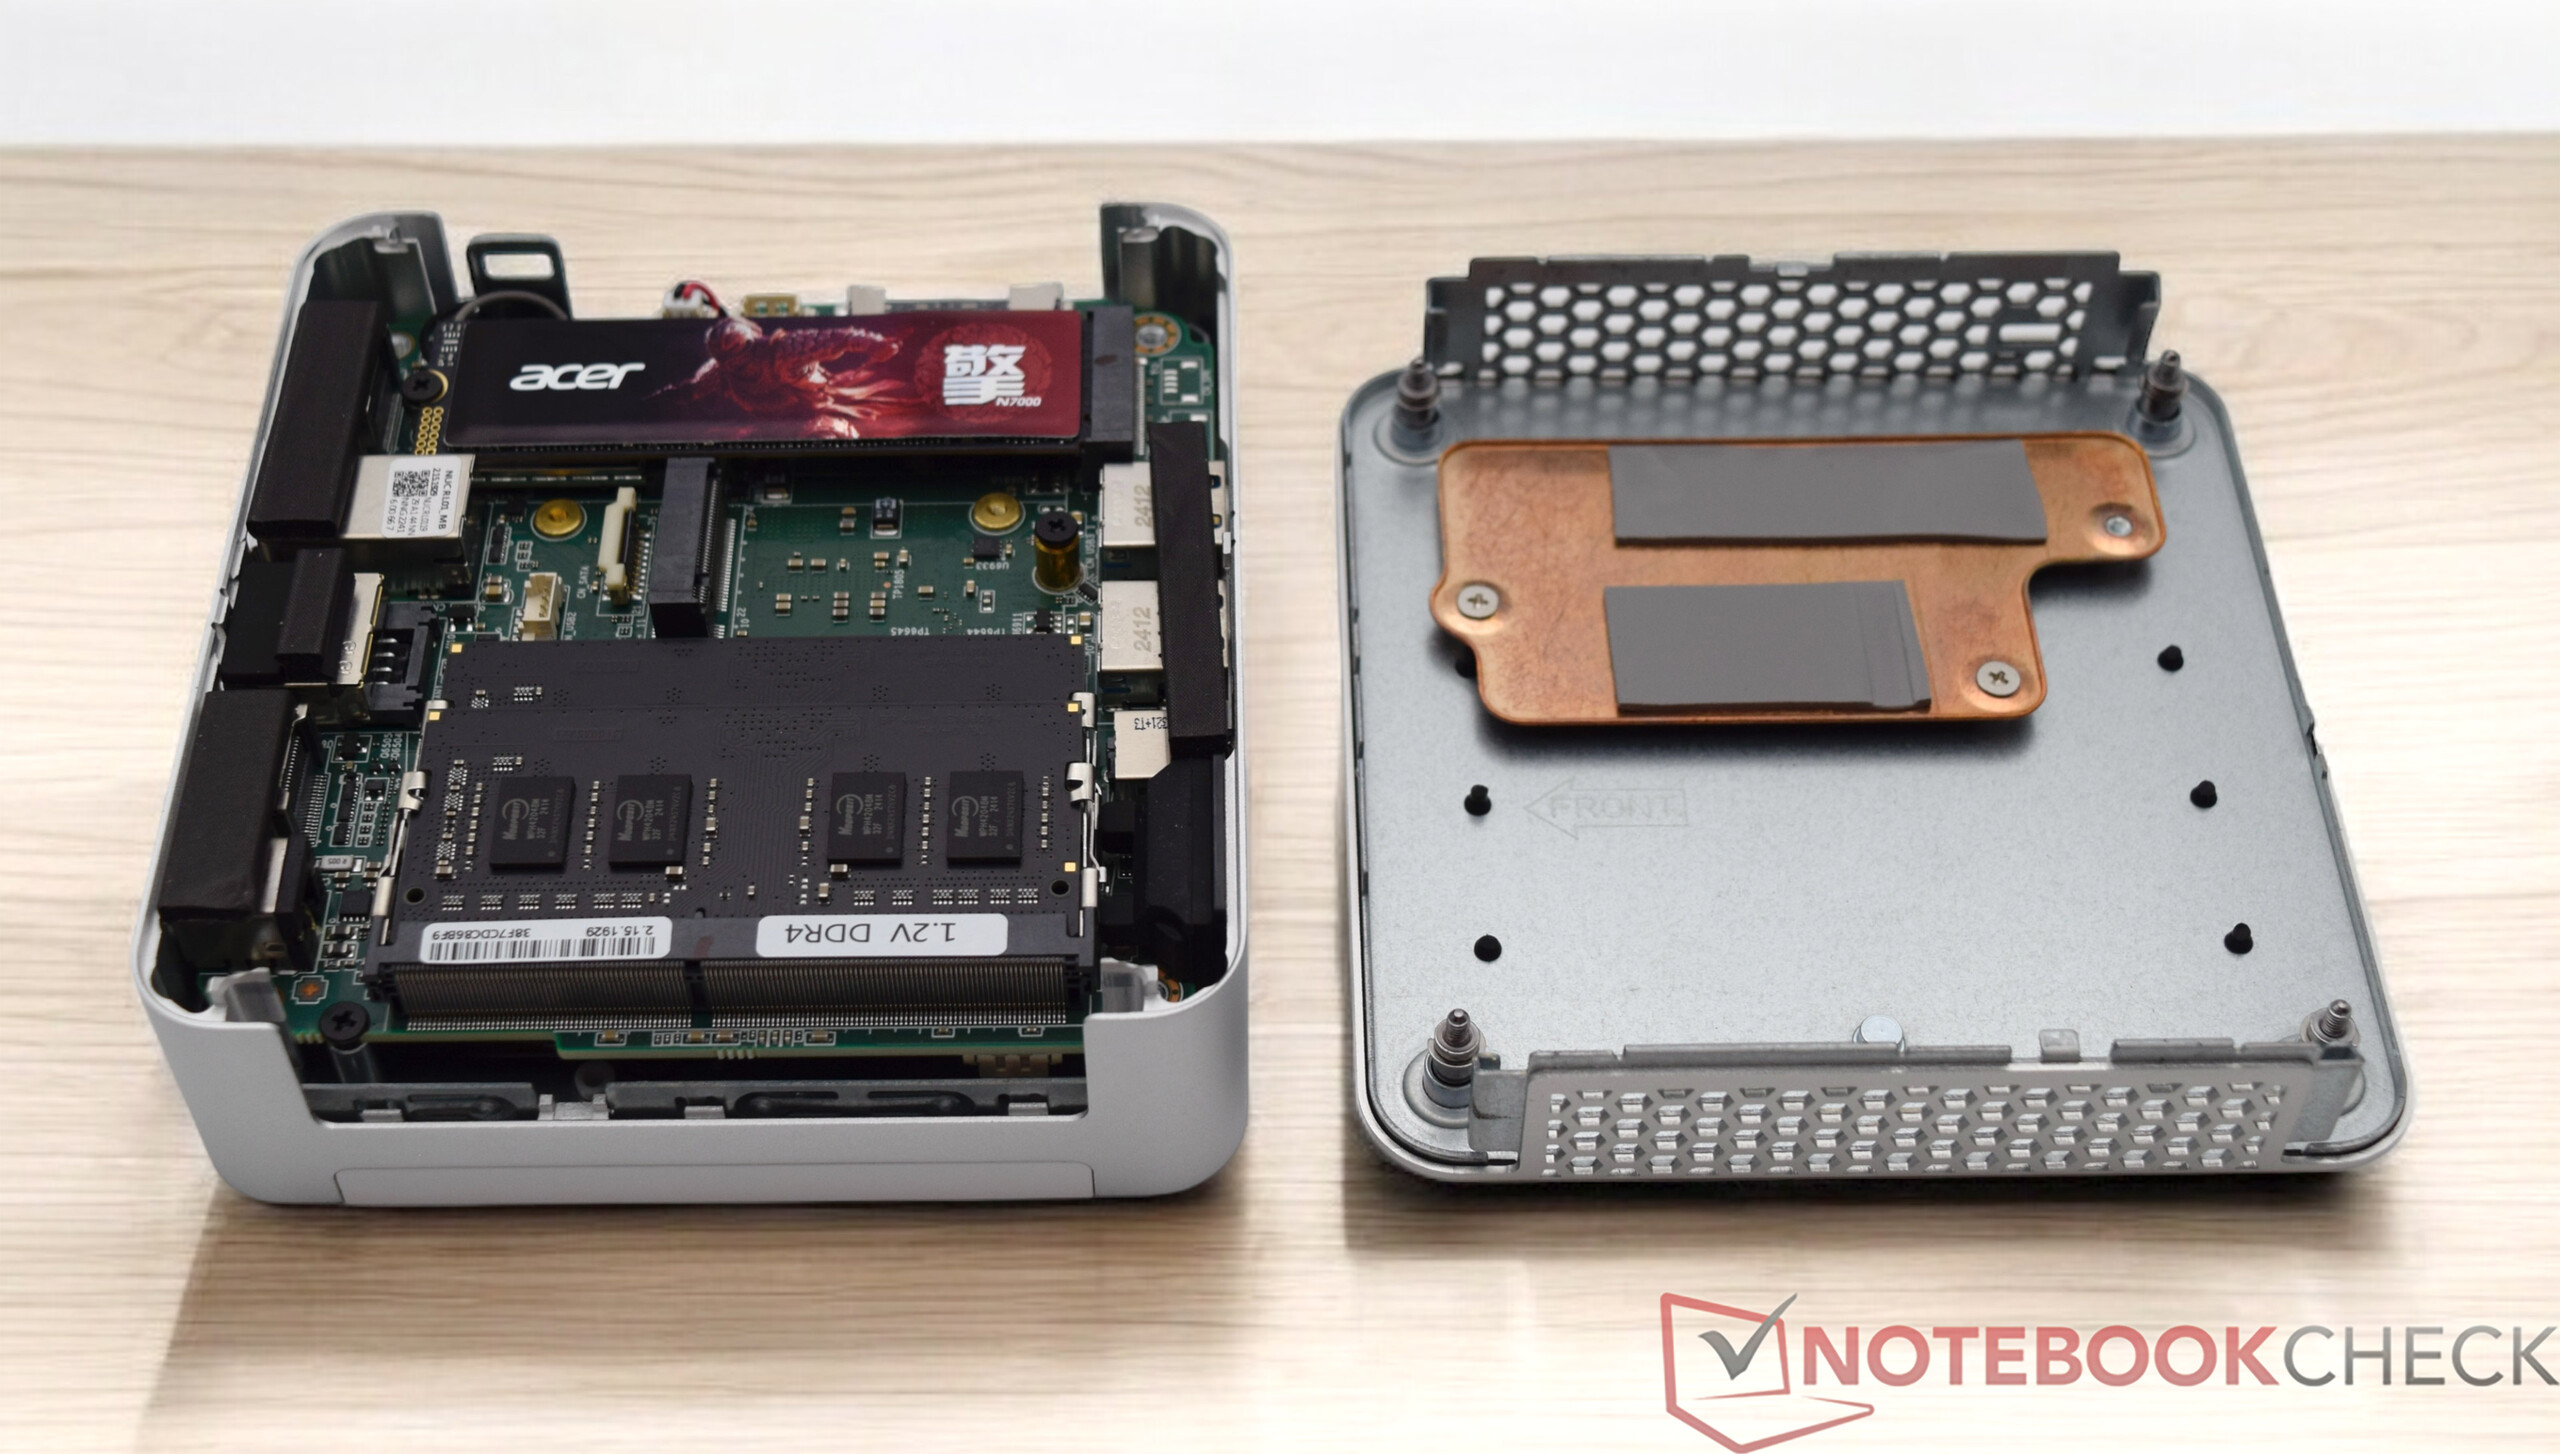
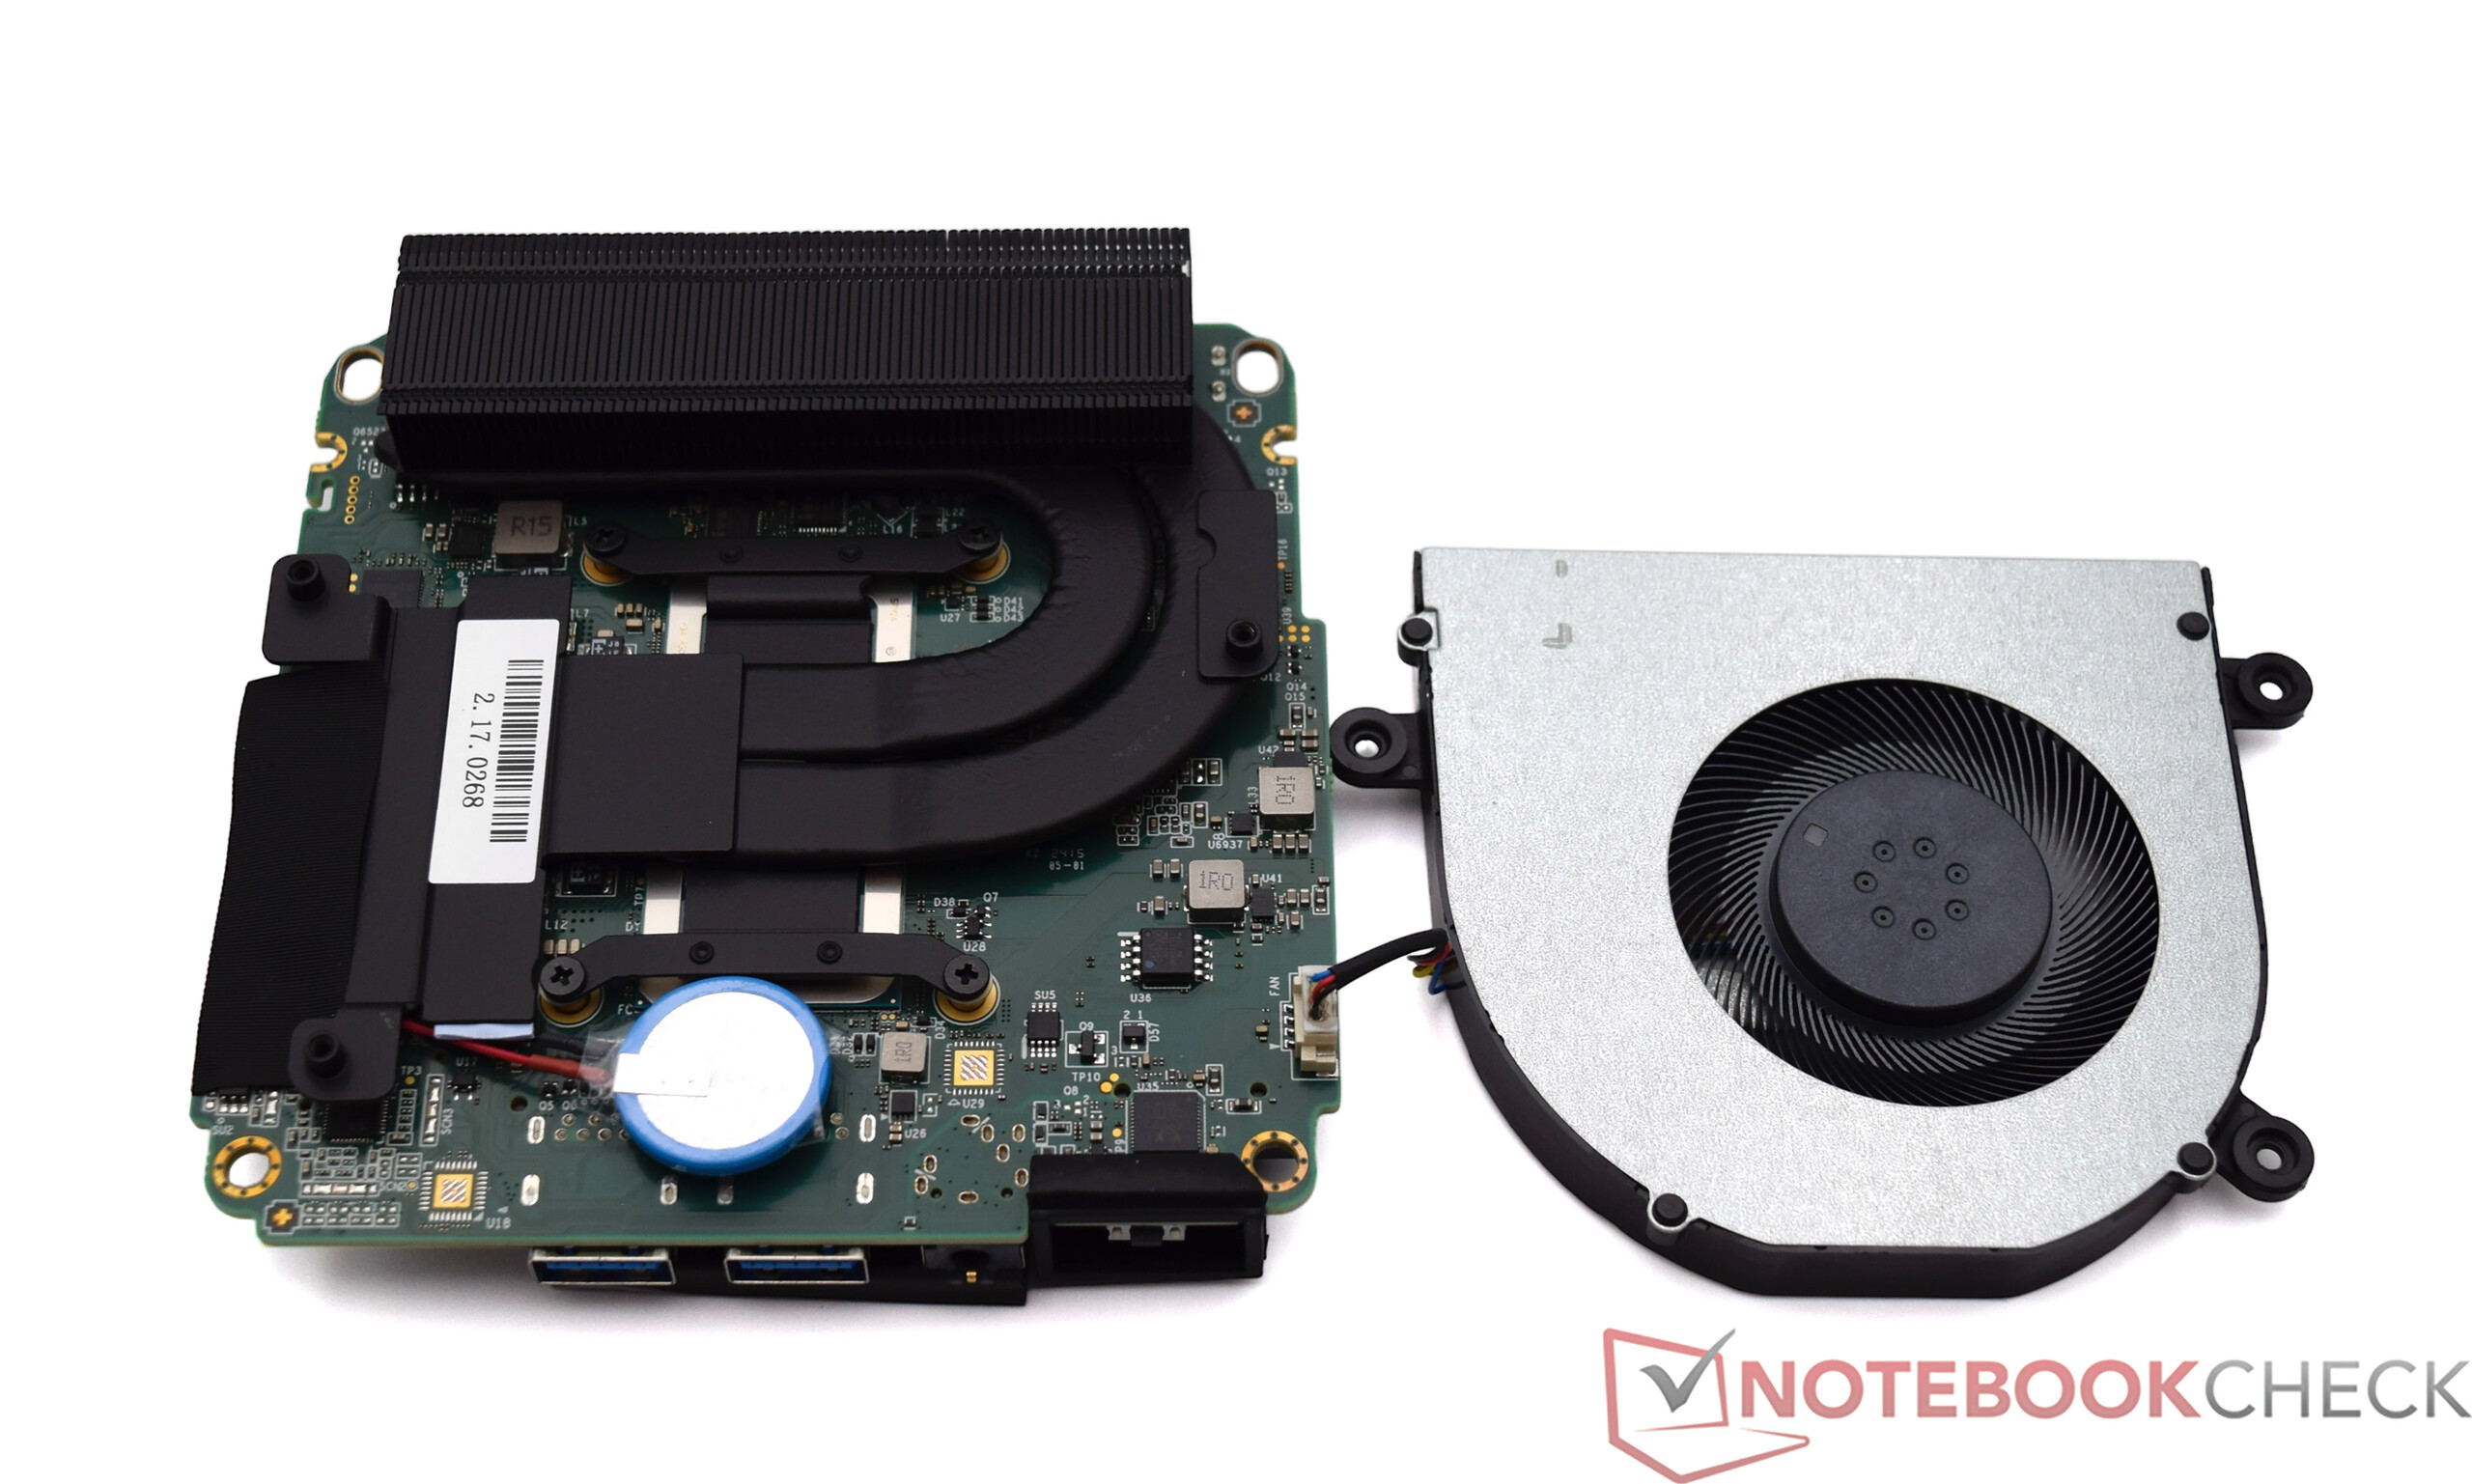
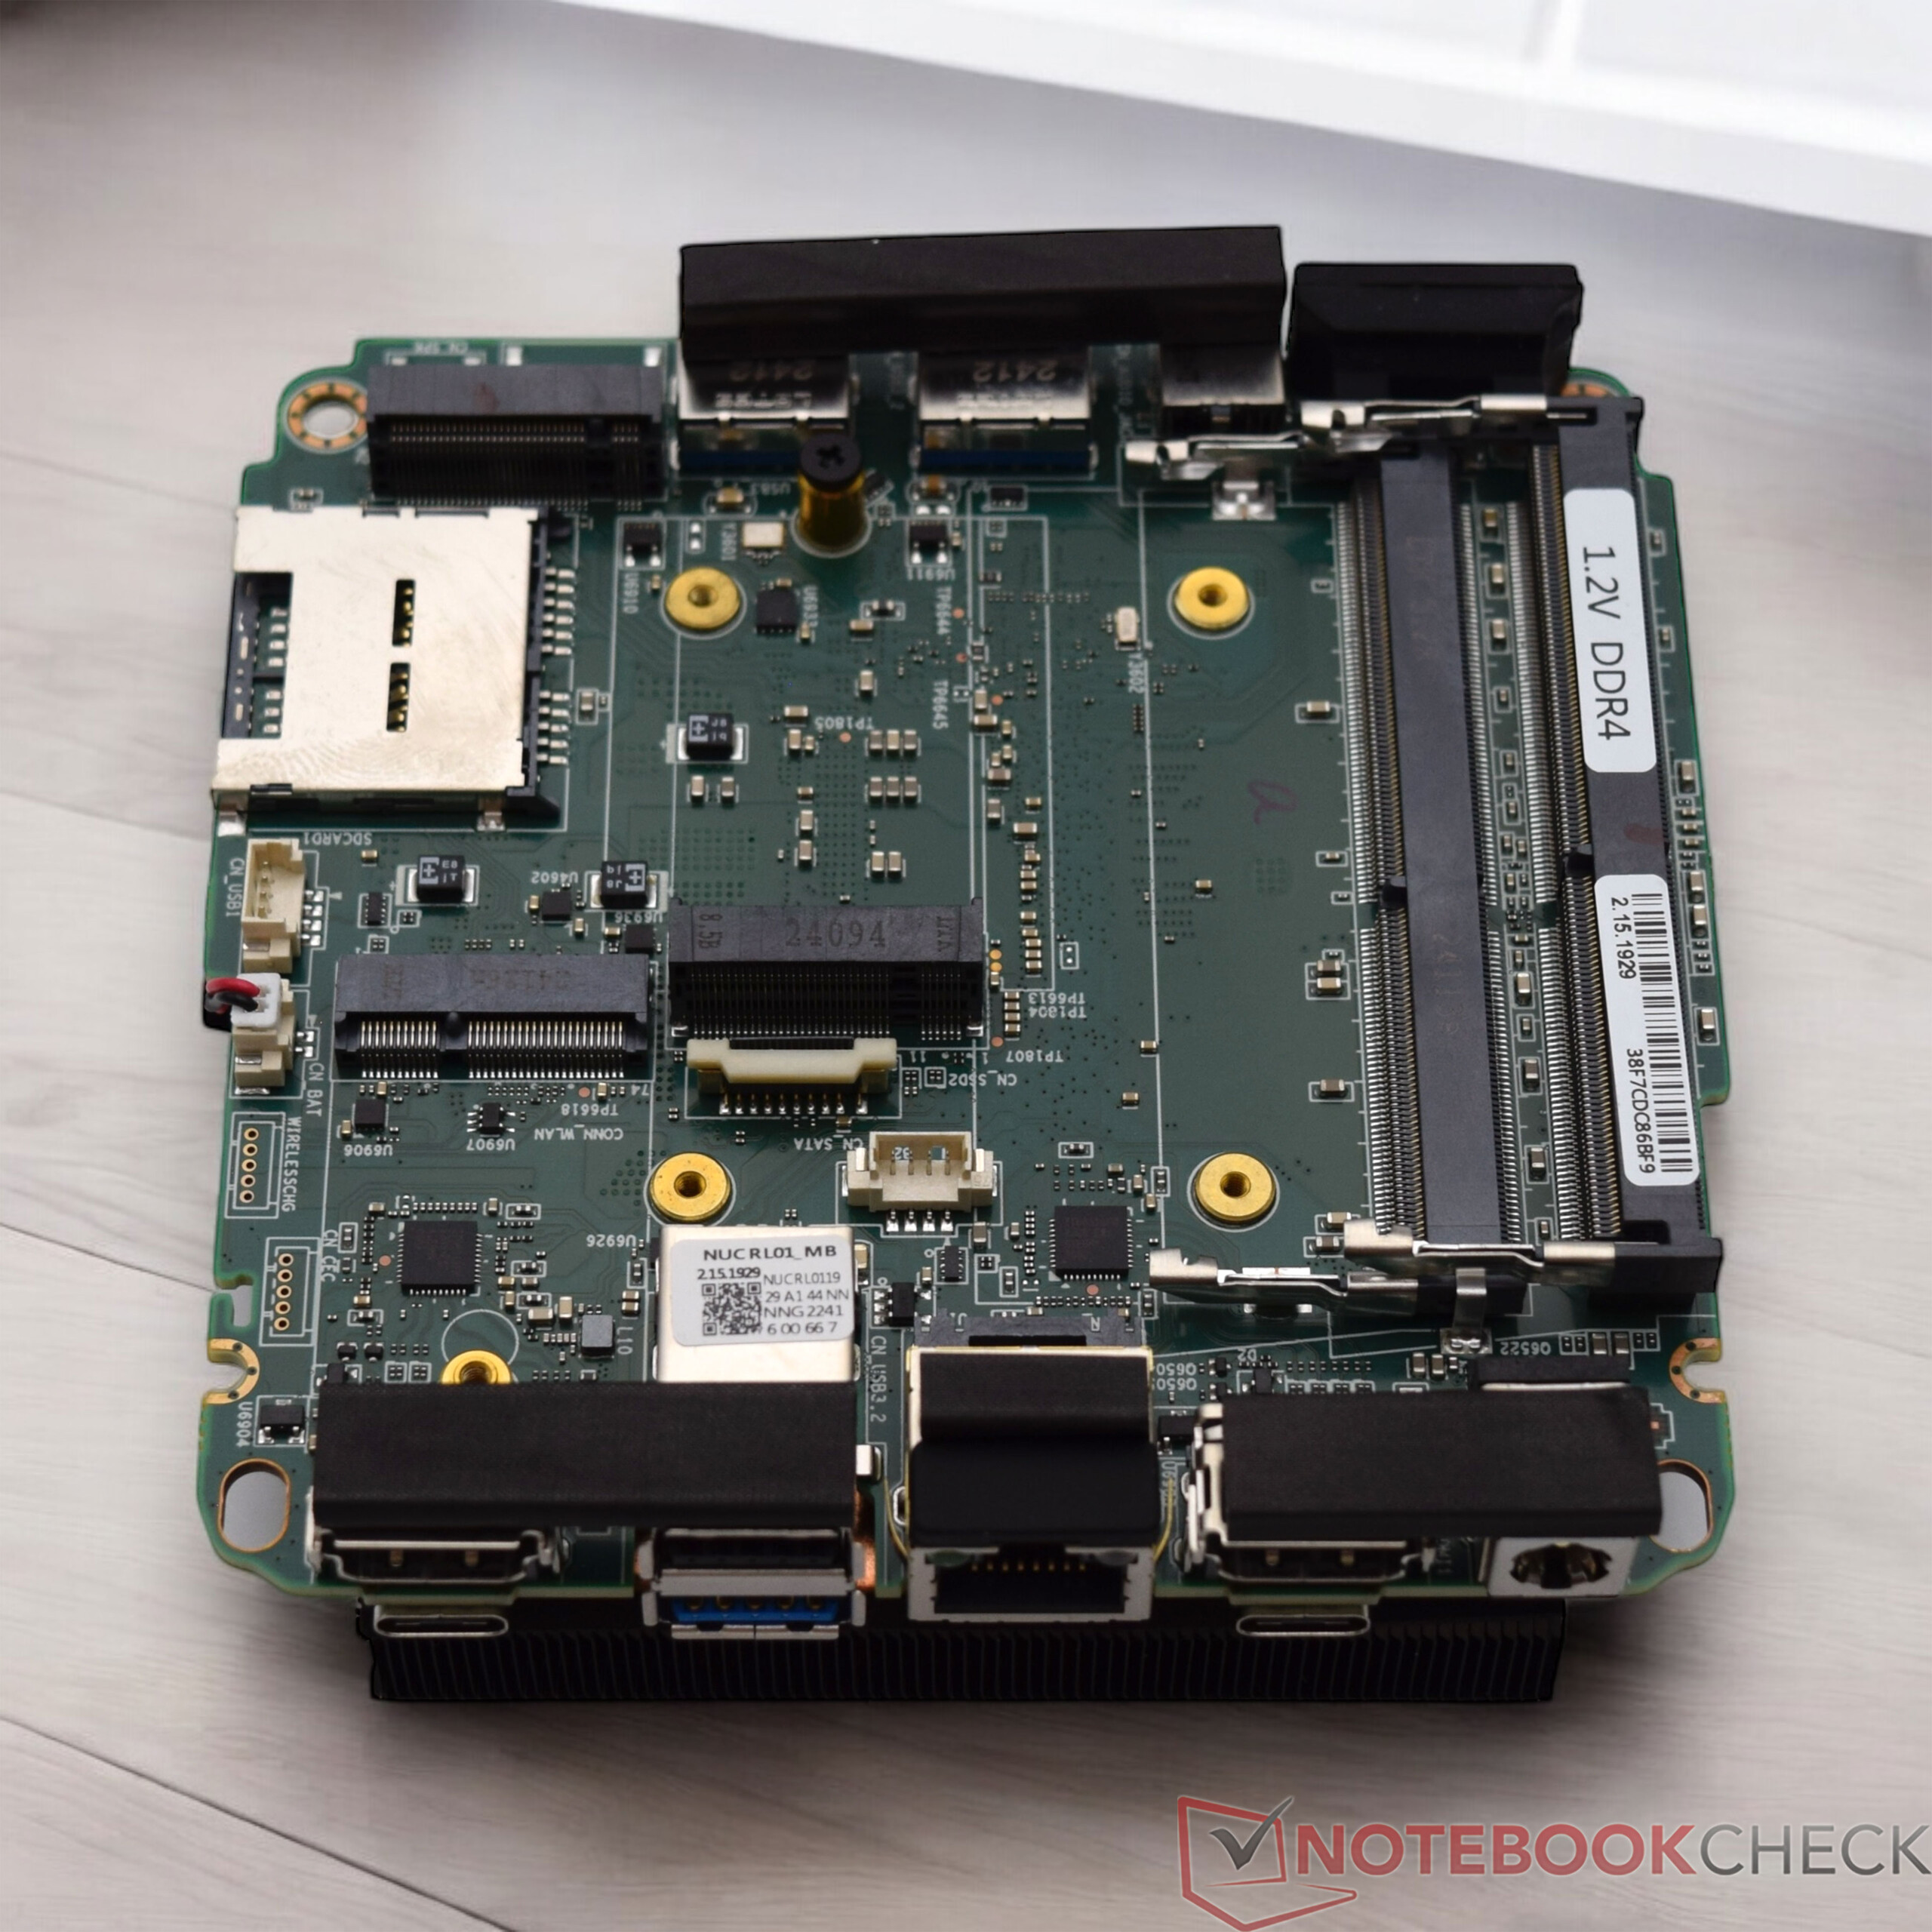
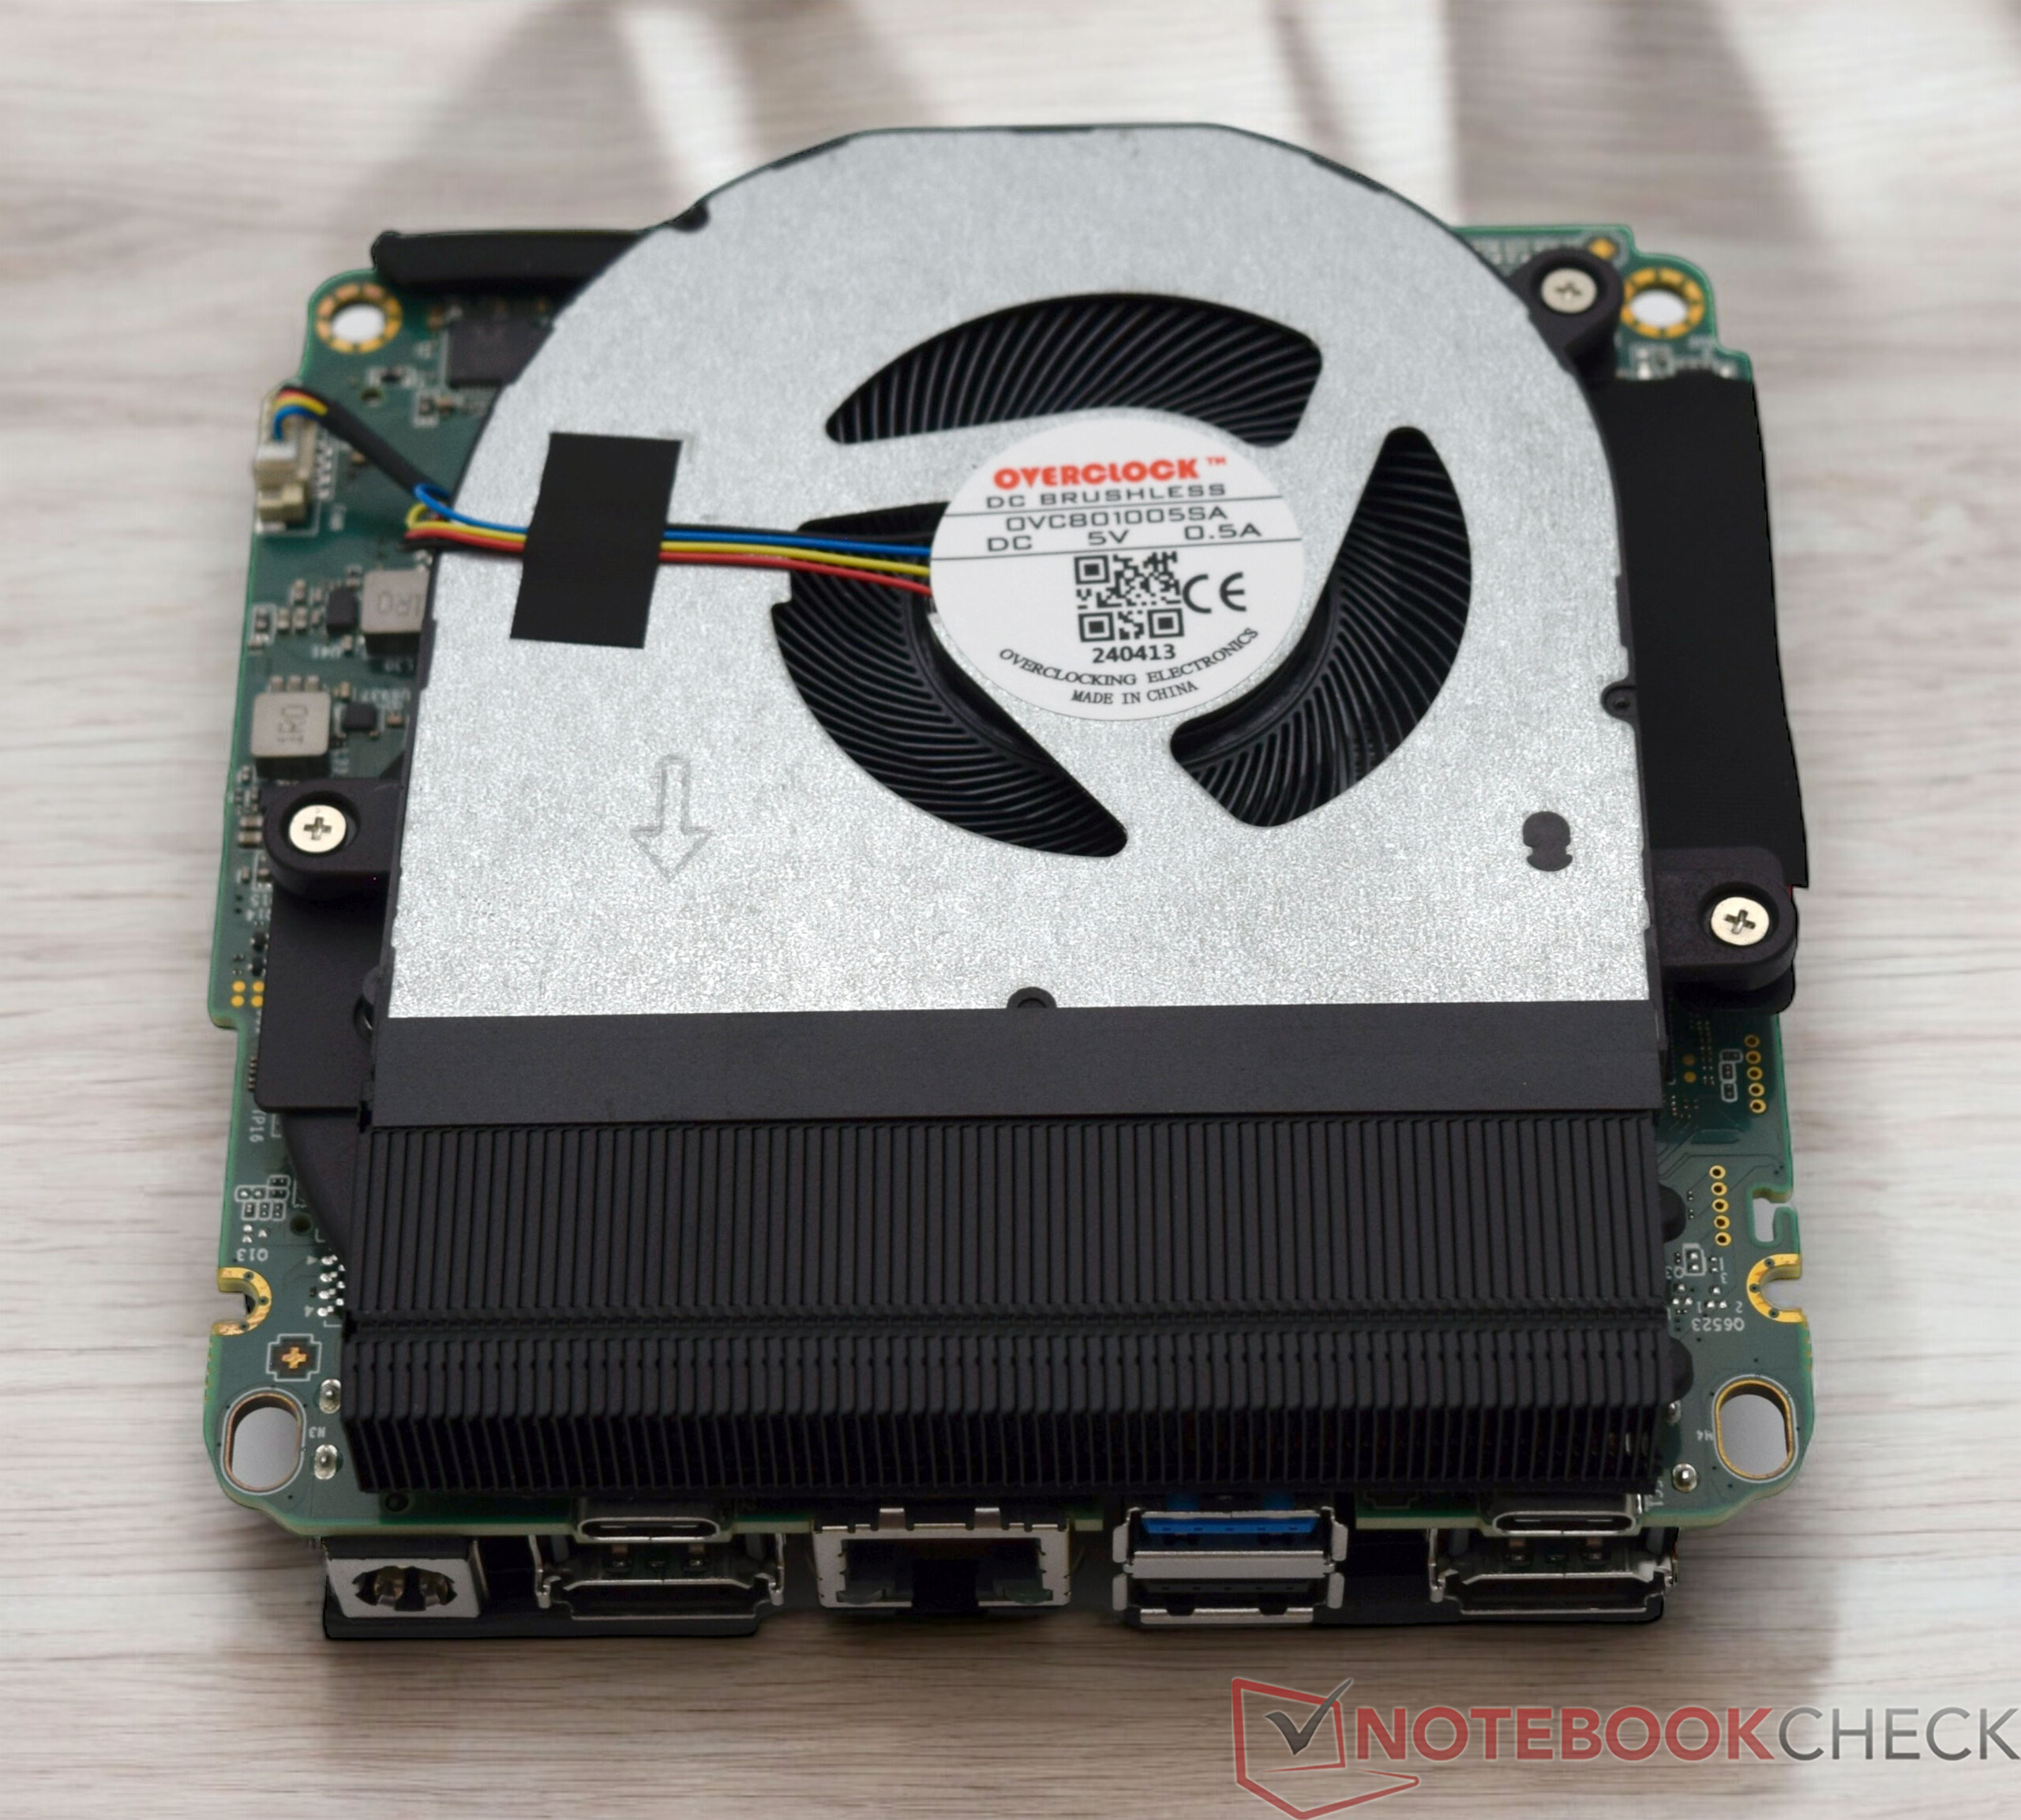
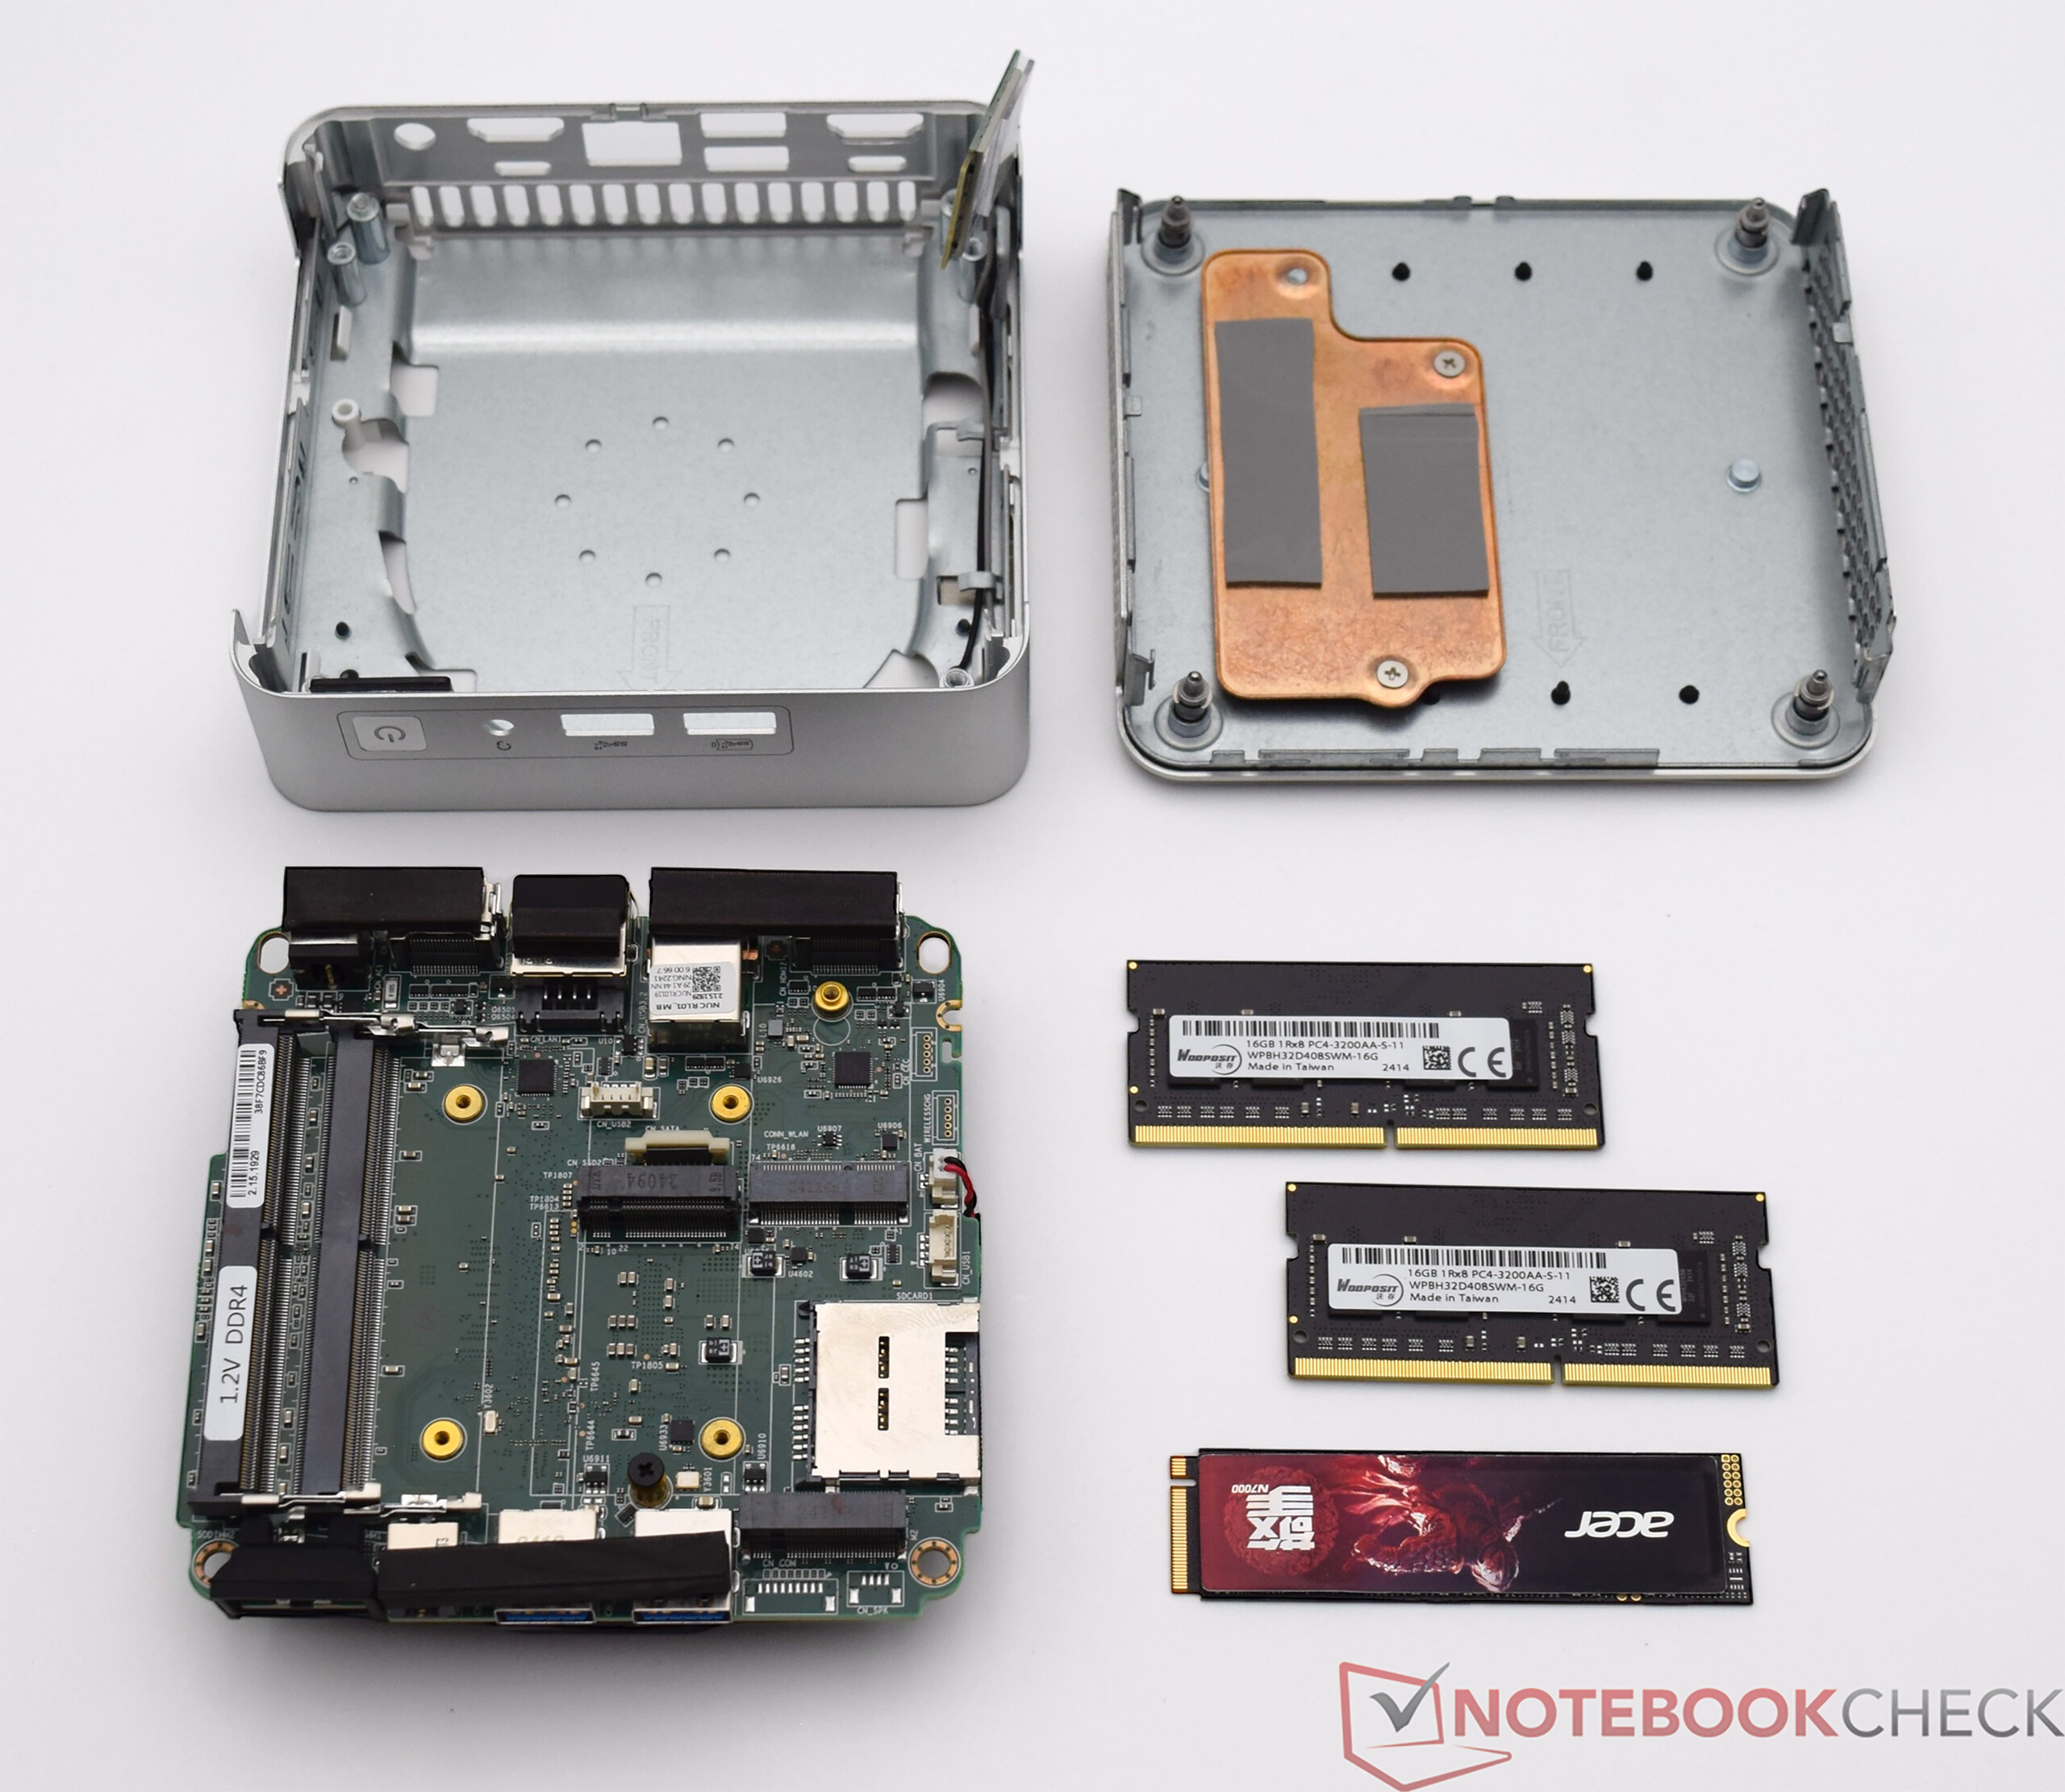
Bakım
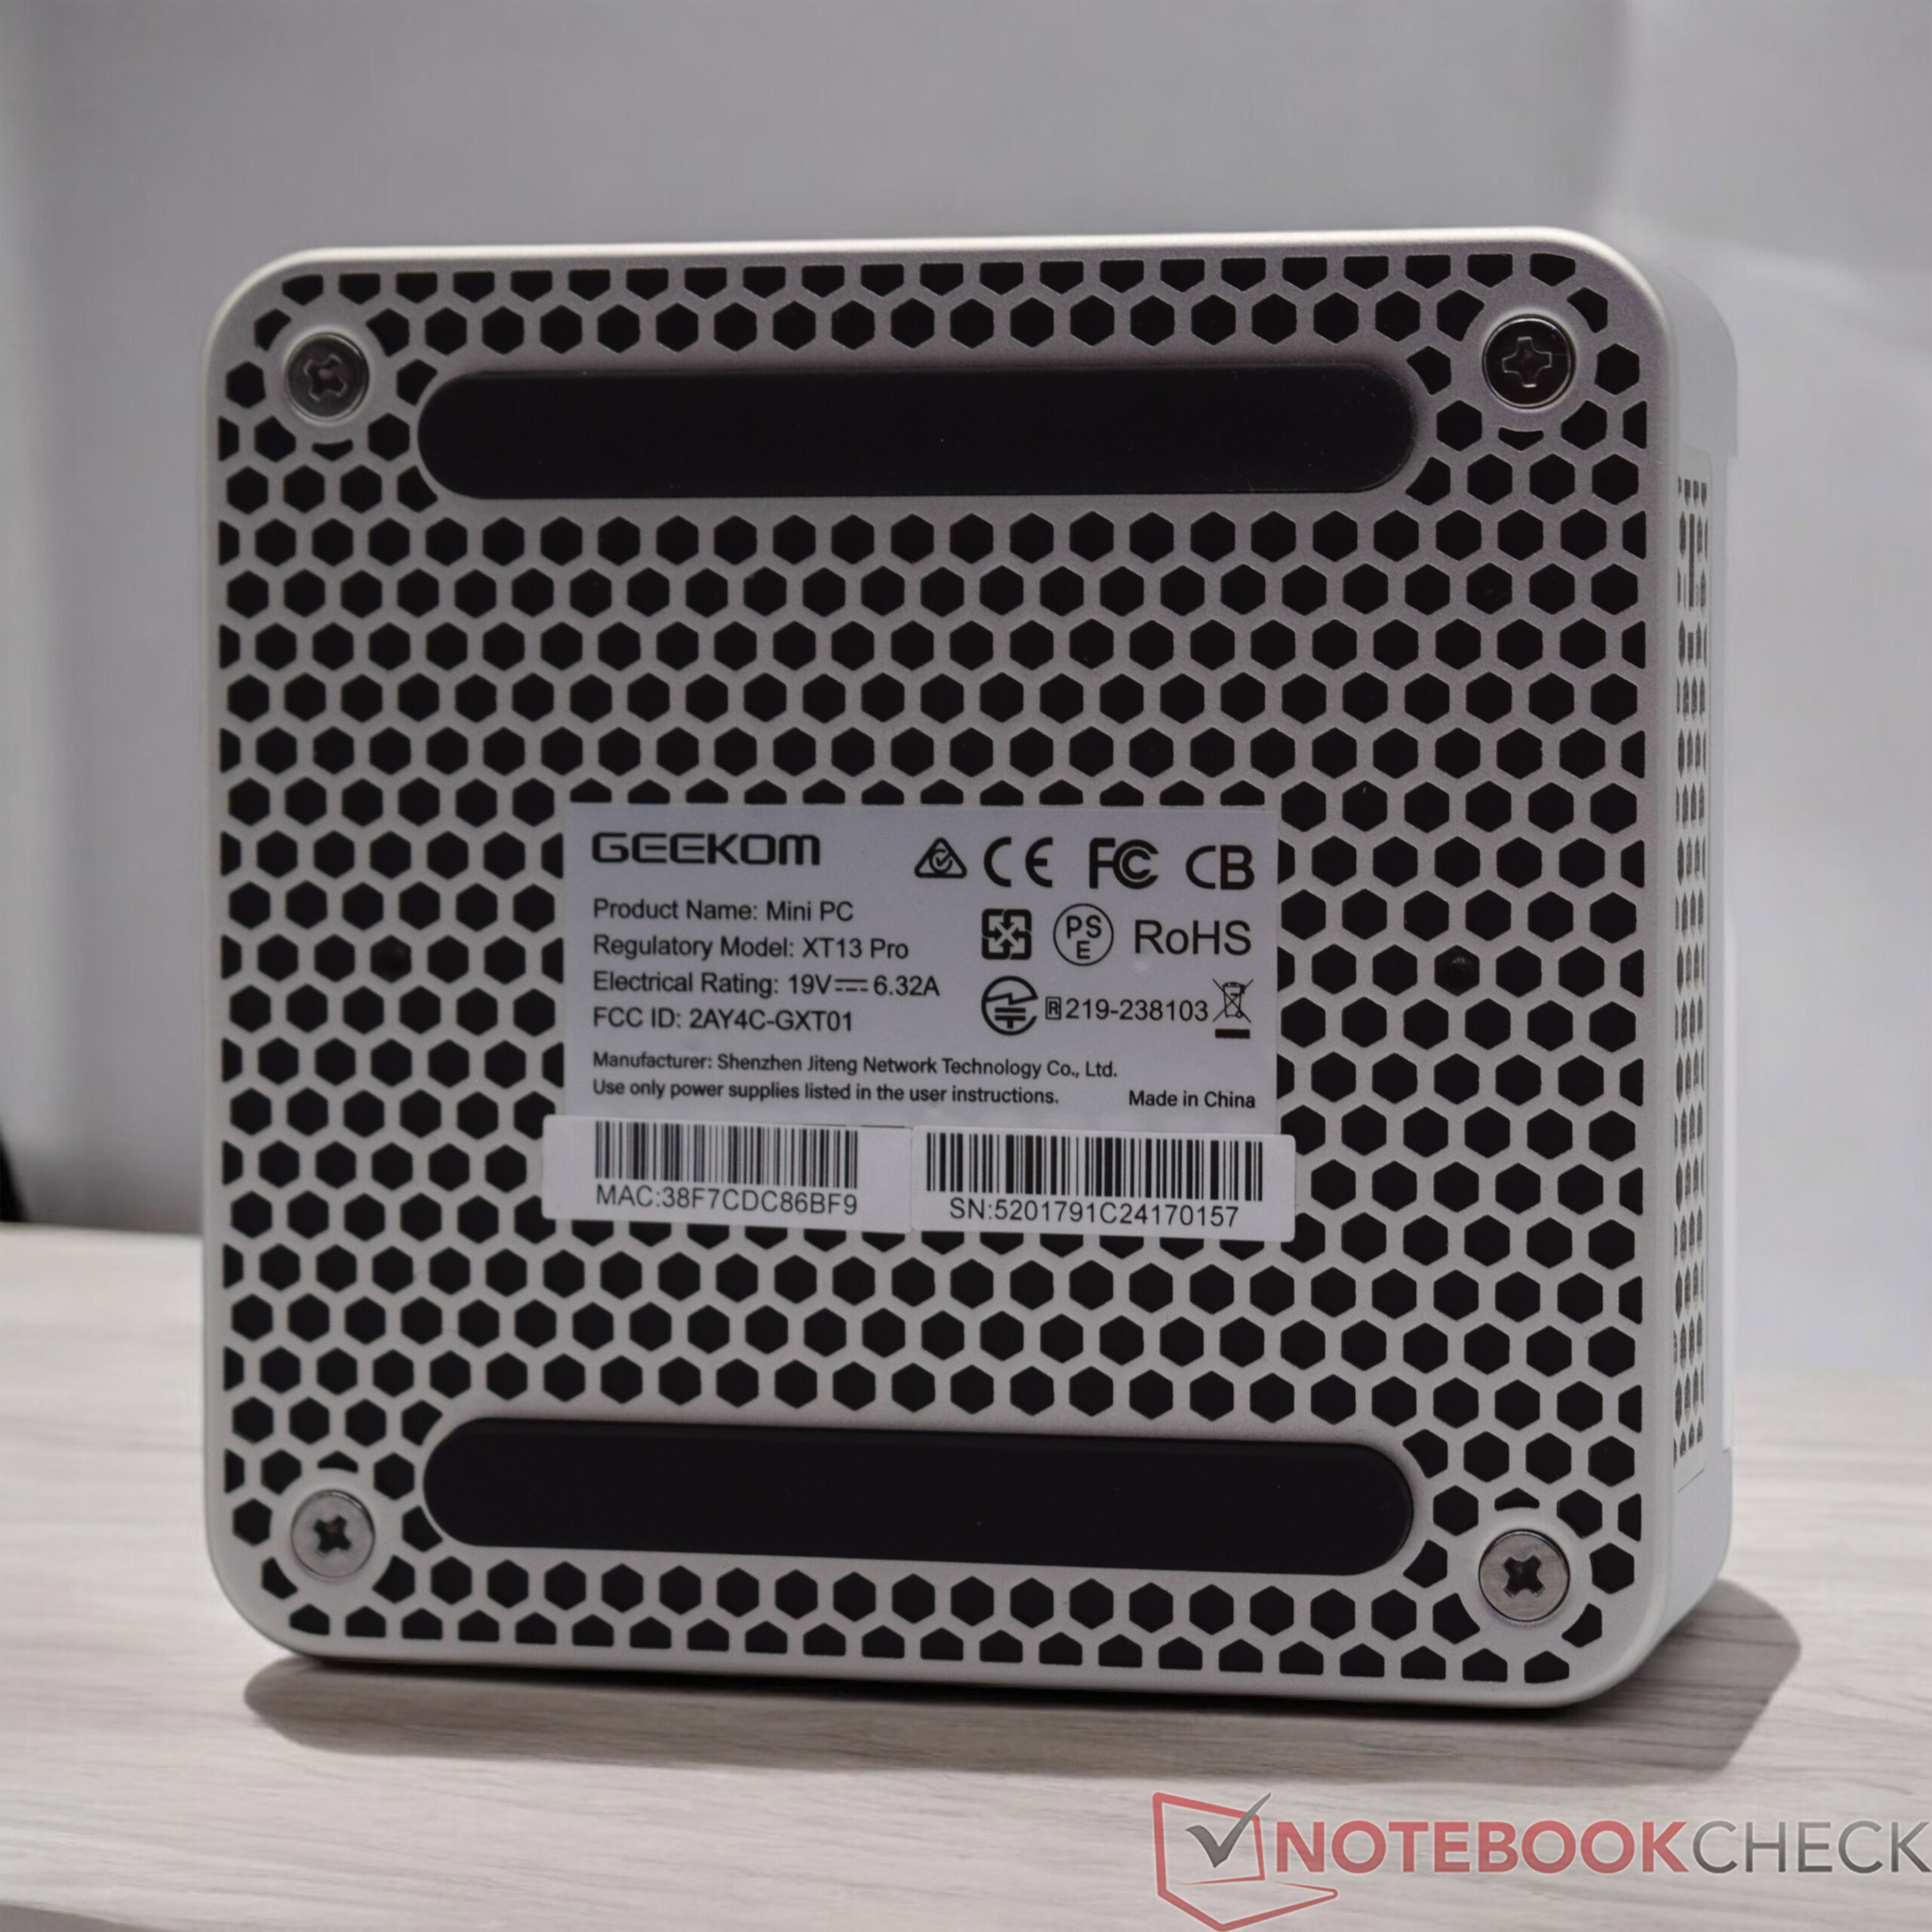
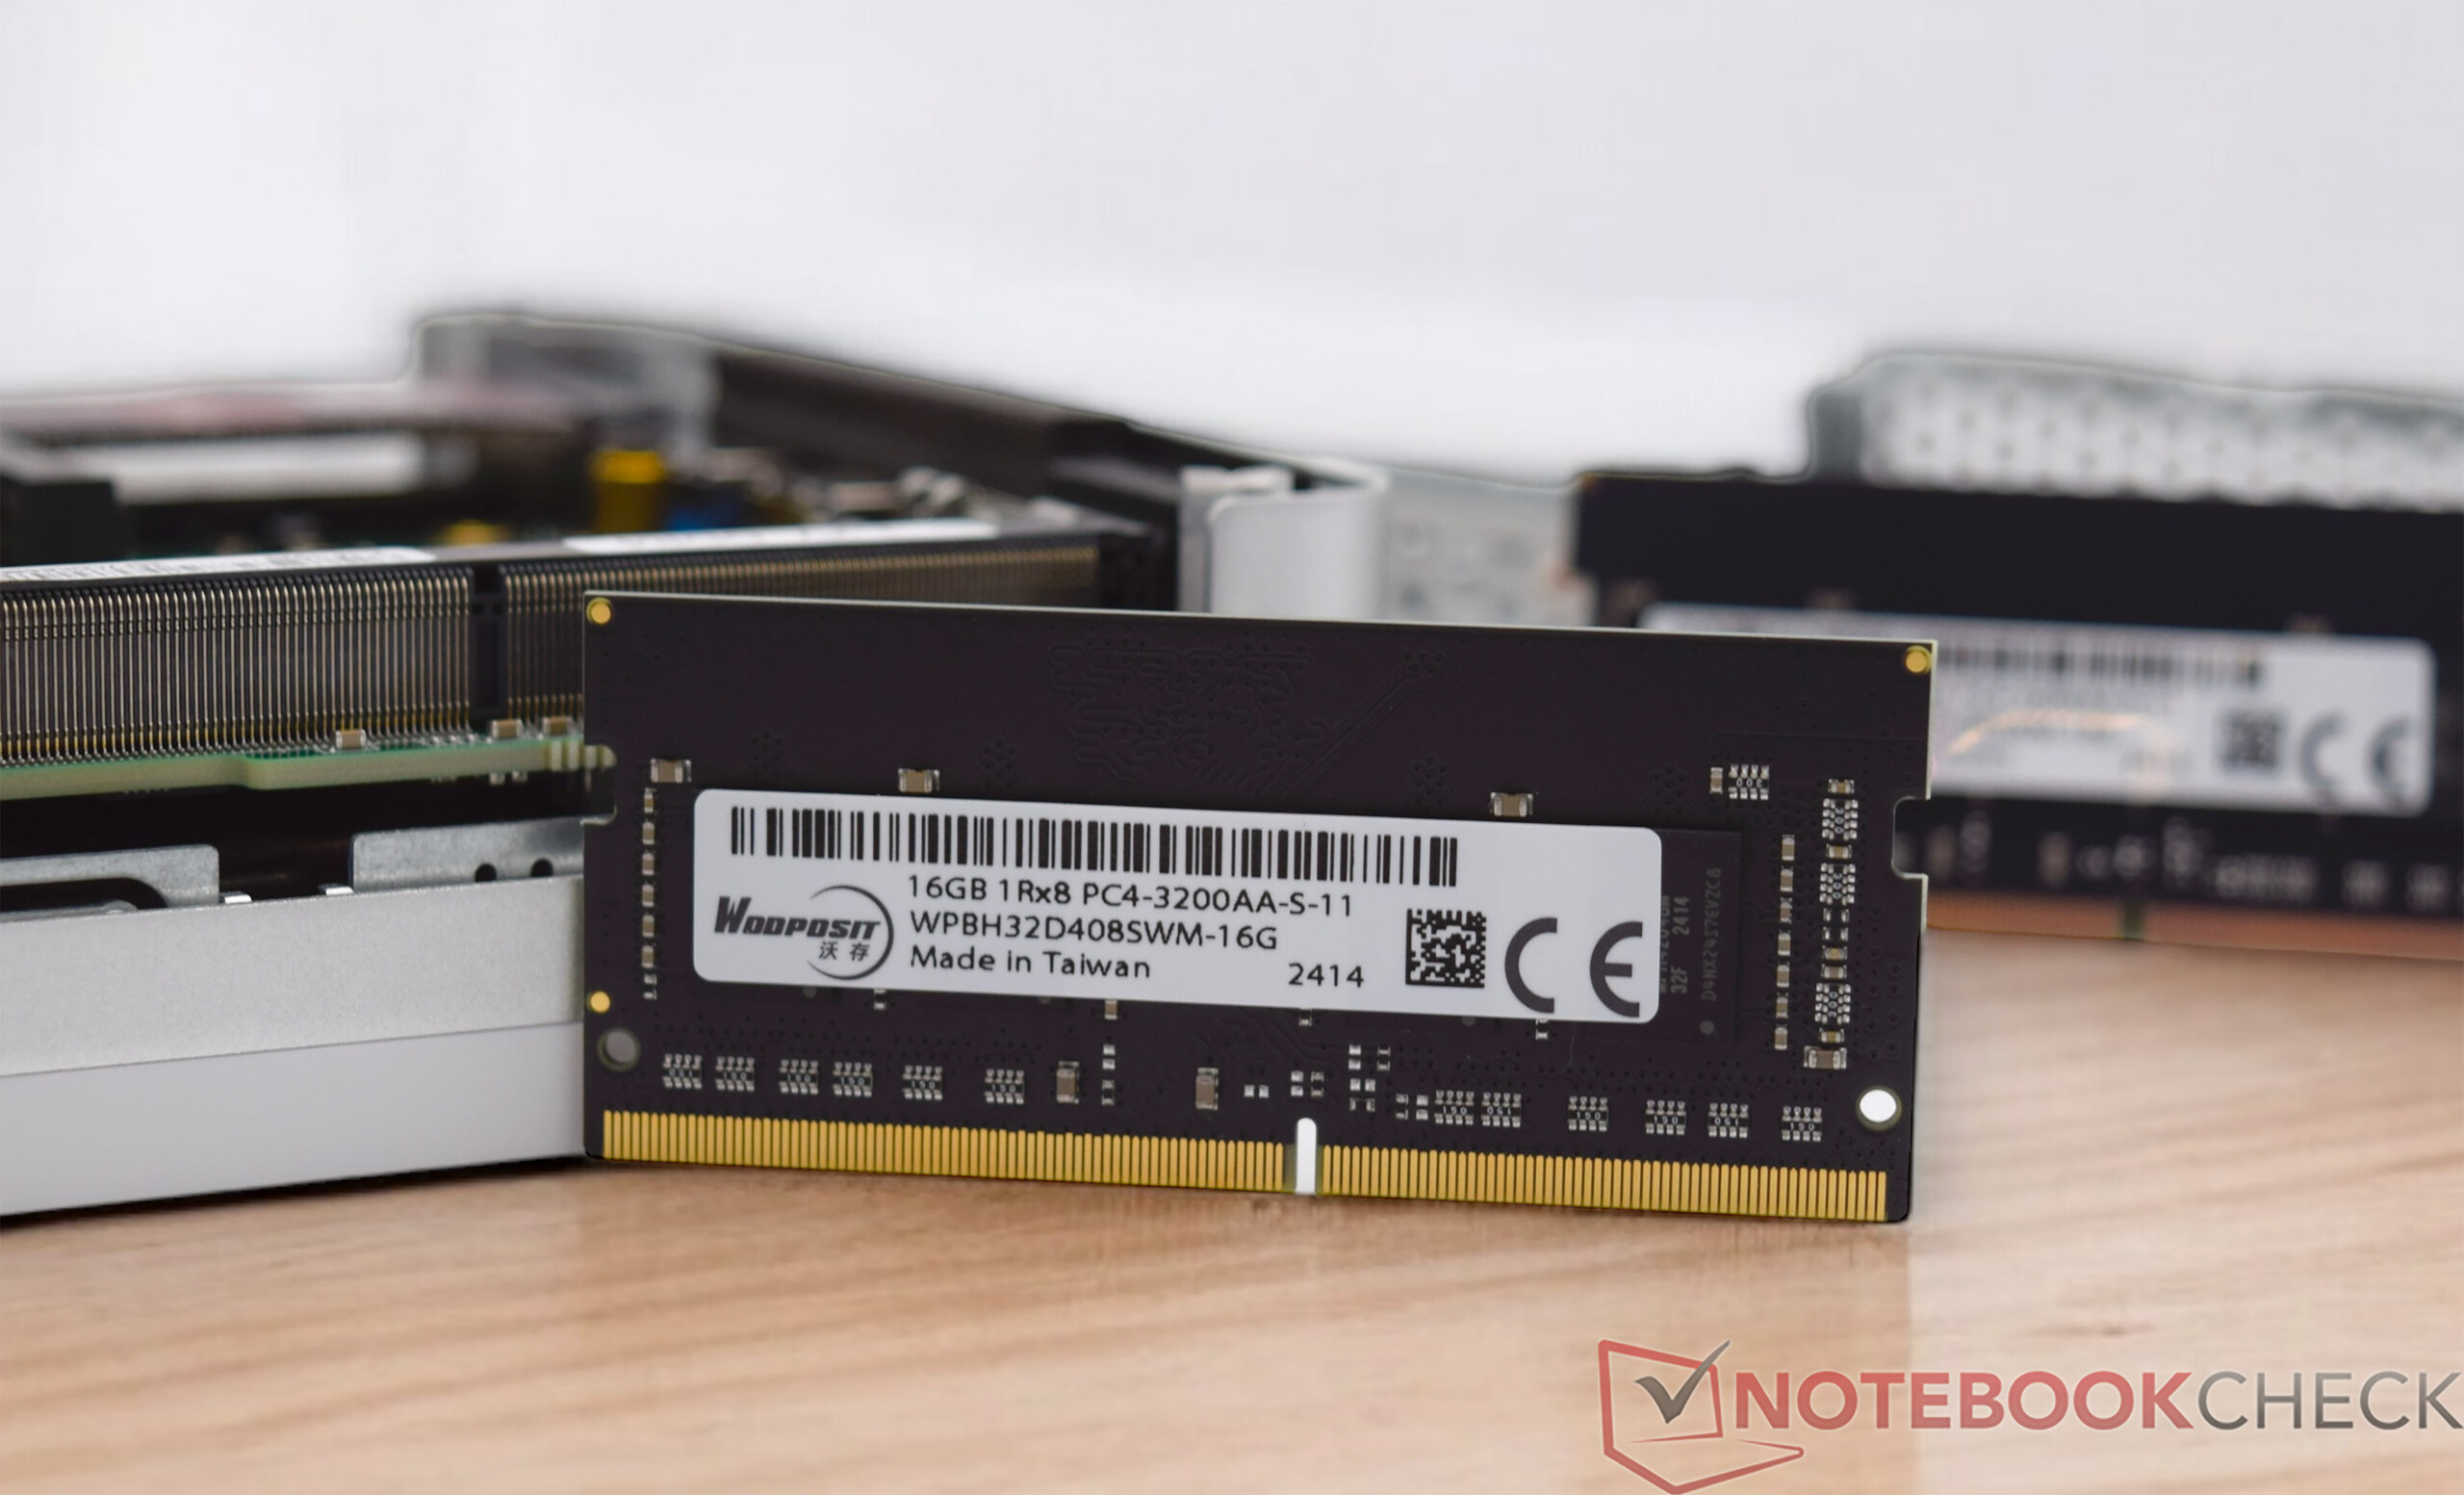
Geekom XT13 Pro'nun açılması kolaydır. Alt tarafta, taban plakasını kasanın geri kalanına sabitleyen yalnızca dört küçük vidanın gevşetilmesi gerekir. Taban plakasının üzerinde bir SSD soğutucusu vardır, bu yüzden bu noktada biraz daha dikkatli olmalısınız. RAM ve yığın depolamaya daha sonra kolayca erişilebilir. Bizim durumumuzda, ek bir SSD takılabilir. Ancak burada doğru standarda uyulmalıdır çünkü yalnızca 42 milimetre uzunluğundaki SATA SSD'ler uyumludur.
Sürdürülebilirlik
Geekom XT13 Pro, nispeten büyük bir kutuda ve çok fazla "hava" ile teslim edilir. Geekom'un işleri daha farklı yaptığını gördük. Ayrıca, verilen standart aksesuarlar ayrı plastik torbalarda paketlenmiştir, bu da sürdürülebilirlik açısından geliştirilebilir. Cihazın kendisi esas olarak metal ve plastikten yapılmıştır. Ancak, üretiminde geri dönüştürülmüş malzemelerin kullanılıp kullanılmadığını bilmiyoruz. Olumlu bir not olarak, üretici 36 aylık bir garanti sunuyor.
Performans - 14 çekirdekli ve 20 iş parçacıklı Intel Core i9-13900H
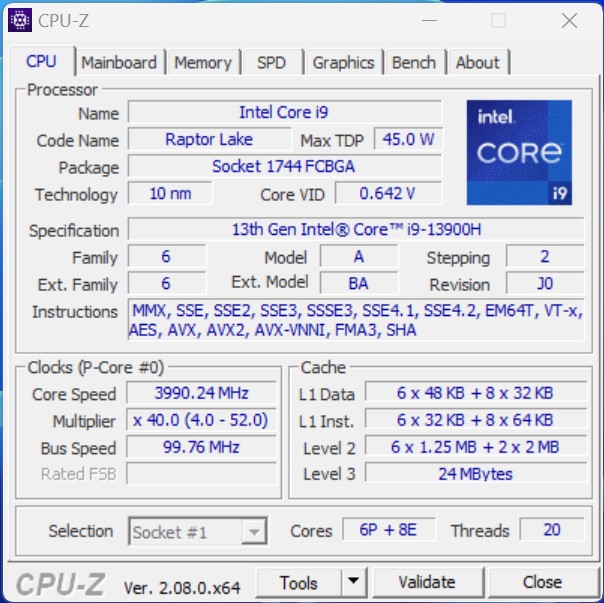
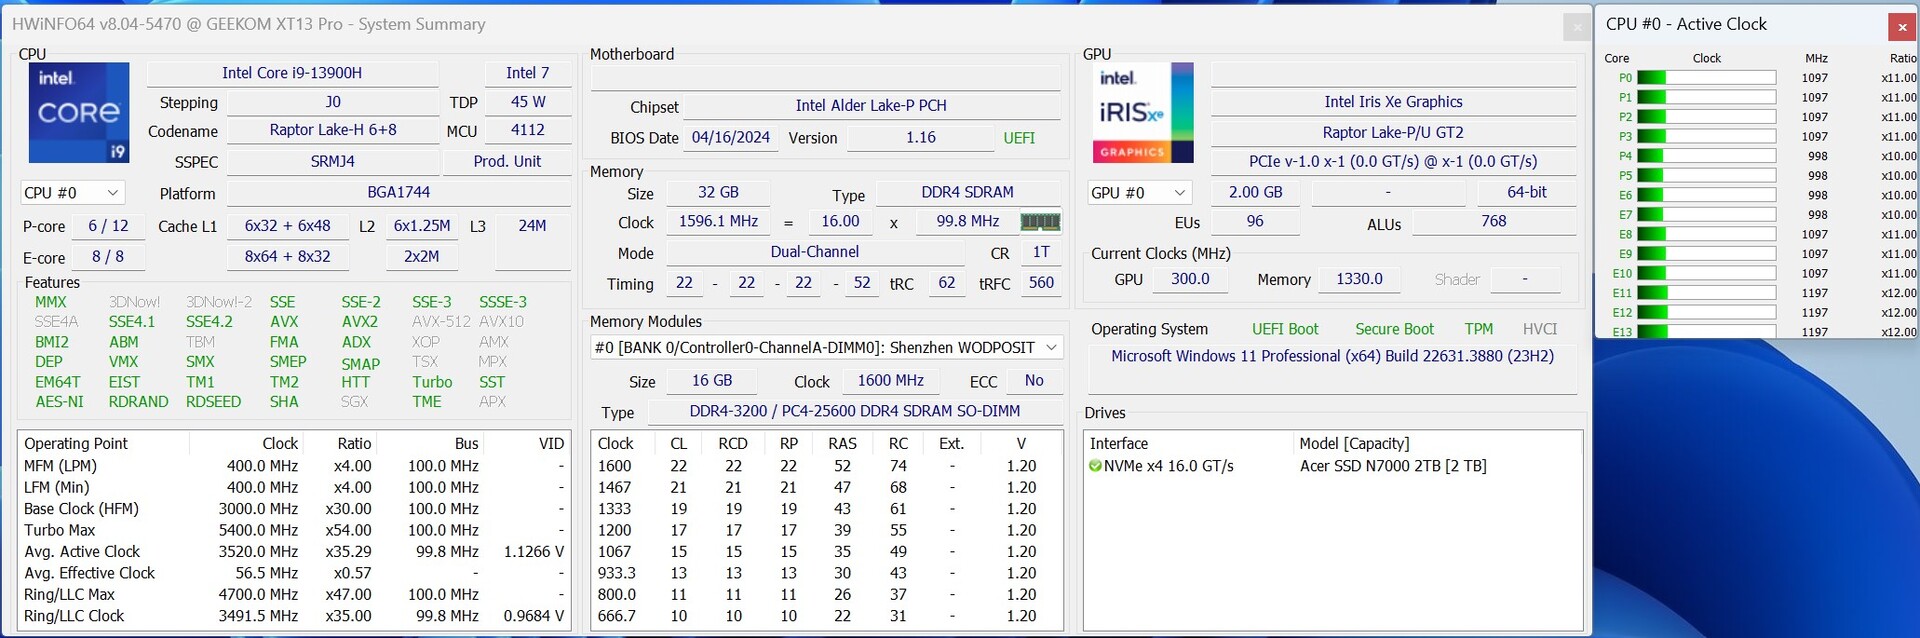
Geekom XT13 Pro, aşağıdaki özelliklere sahip en üst konfigürasyonda gelir Intel Core i9-13900H en üst konfigürasyonda. Alternatif olarak, NUC PC biraz daha zayıf bir güç kaynağı ile de donatılabilir Intel Core i7-13620H bu model de 6P çekirdeklerle donatılmıştır ve performans açısından en üst modele göre sadece hafif bir dezavantaja sahiptir. 32 GB DDR4 RAM her zaman dahildir, ancak hızlı NVMe SSD sağlam bir temel yapılandırma sağlar. Geekom XT13 Pro da performansa aç uygulamalar için aşılmaz bir görev değildir. Bununla birlikte, iGPU'nun 3D performansı en büyük zayıf noktadır, ancak bu bir eGPU ile gözle görülür şekilde iyileştirilebilir.
Test koşulları
Geekom XT13 Pro ile yapılan tüm performans testleri için "Yüksek performans" enerji profilini kullandık. Yalnızca güç tüketimi ve gürültü ölçümlerinde bundan sapmalar oldu Test kriterleri. Geekom, üreticinin spesifikasyonlarına uygun olarak SoC'nin en düşük güç tüketiminde çalışmasına izin verir. Rakamlarla bu, sürekli yük altında 35 watt'lık bir güç sınırı anlamına gelir, ancak kısa süreler için 64 watt'a kadar izin verilir.
İşlemci

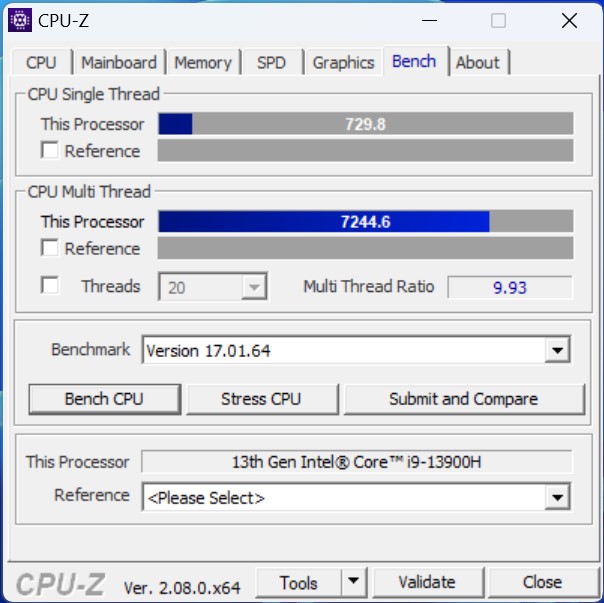
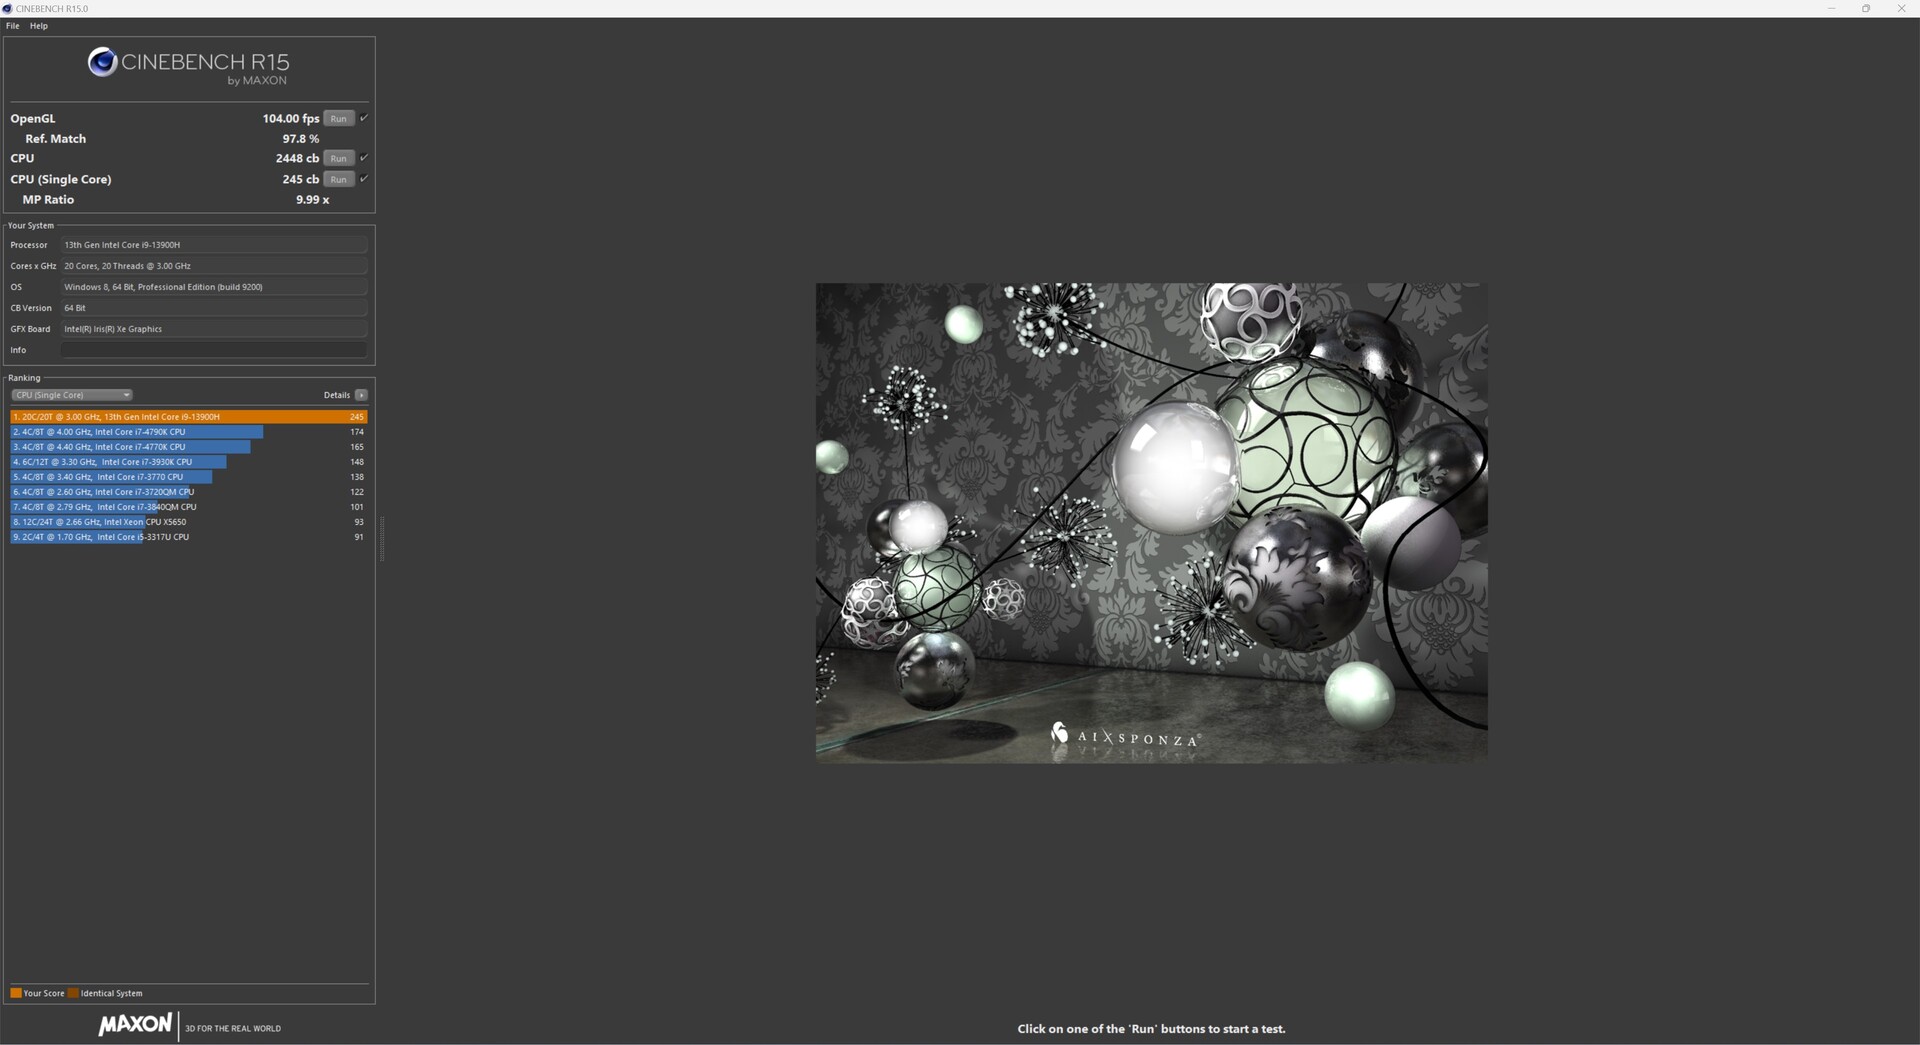
Bu Intel Core i9-13900H raptor Lake mimarisini temel alır ve 6P ve 8E çekirdeklerini birleştirir. Teknik olarak şunlar vardır Intel Core i9-12900H performans derecelendirmesindeki kıyaslama sonuçlarımızdan da görebileceğimiz gibi Geekom XT12 Pro. Bununla birlikte, ayrıntılı olarak, biraz daha iyi bir çok çekirdekli performansla dikkatleri üzerine çekebilen Intel Core i9-13900H lehine küçük bir avantaj görüyoruz. Bir AMD Ryzen 9 7940HS ya da Intel'in Meteor Lake serisindeki yeni modelleri. Ancak rakiplerin biraz daha hızlı modelleriyle arasındaki fark çok büyük değil. Küçük farklar nedeniyle günlük kullanımda gözle görülür bir performans farkı söz konusu değil.
İşlemciler için daha fazla karşılaştırma bulabilirsiniz burada.

| Performance Rating - Percent | |
| Geekom A7 | |
| Aoostar GEM12 | |
| Minisforum AtomMan X7 Ti | |
| Acemagic F2A | |
| Geekom XT13 Pro | |
| Geekom XT12 Pro | |
| Cinebench 2024 | |
| CPU Multi Core | |
| Minisforum AtomMan X7 Ti | |
| Acemagic F2A | |
| Aoostar GEM12 | |
| Geekom A7 | |
| Geekom XT13 Pro | |
| Geekom XT12 Pro | |
| CPU Single Core | |
| Minisforum AtomMan X7 Ti | |
| Geekom A7 | |
| Geekom XT12 Pro | |
| Aoostar GEM12 | |
| Acemagic F2A | |
| Geekom XT13 Pro | |
| Cinebench R15 | |
| CPU Single 64Bit | |
| Aoostar GEM12 | |
| Geekom A7 | |
| Minisforum AtomMan X7 Ti | |
| Acemagic F2A | |
| Geekom XT12 Pro | |
| Geekom XT13 Pro | |
| CPU Multi 64Bit | |
| Minisforum AtomMan X7 Ti | |
| Acemagic F2A | |
| Aoostar GEM12 | |
| Geekom A7 | |
| Geekom XT13 Pro | |
| Geekom XT12 Pro | |
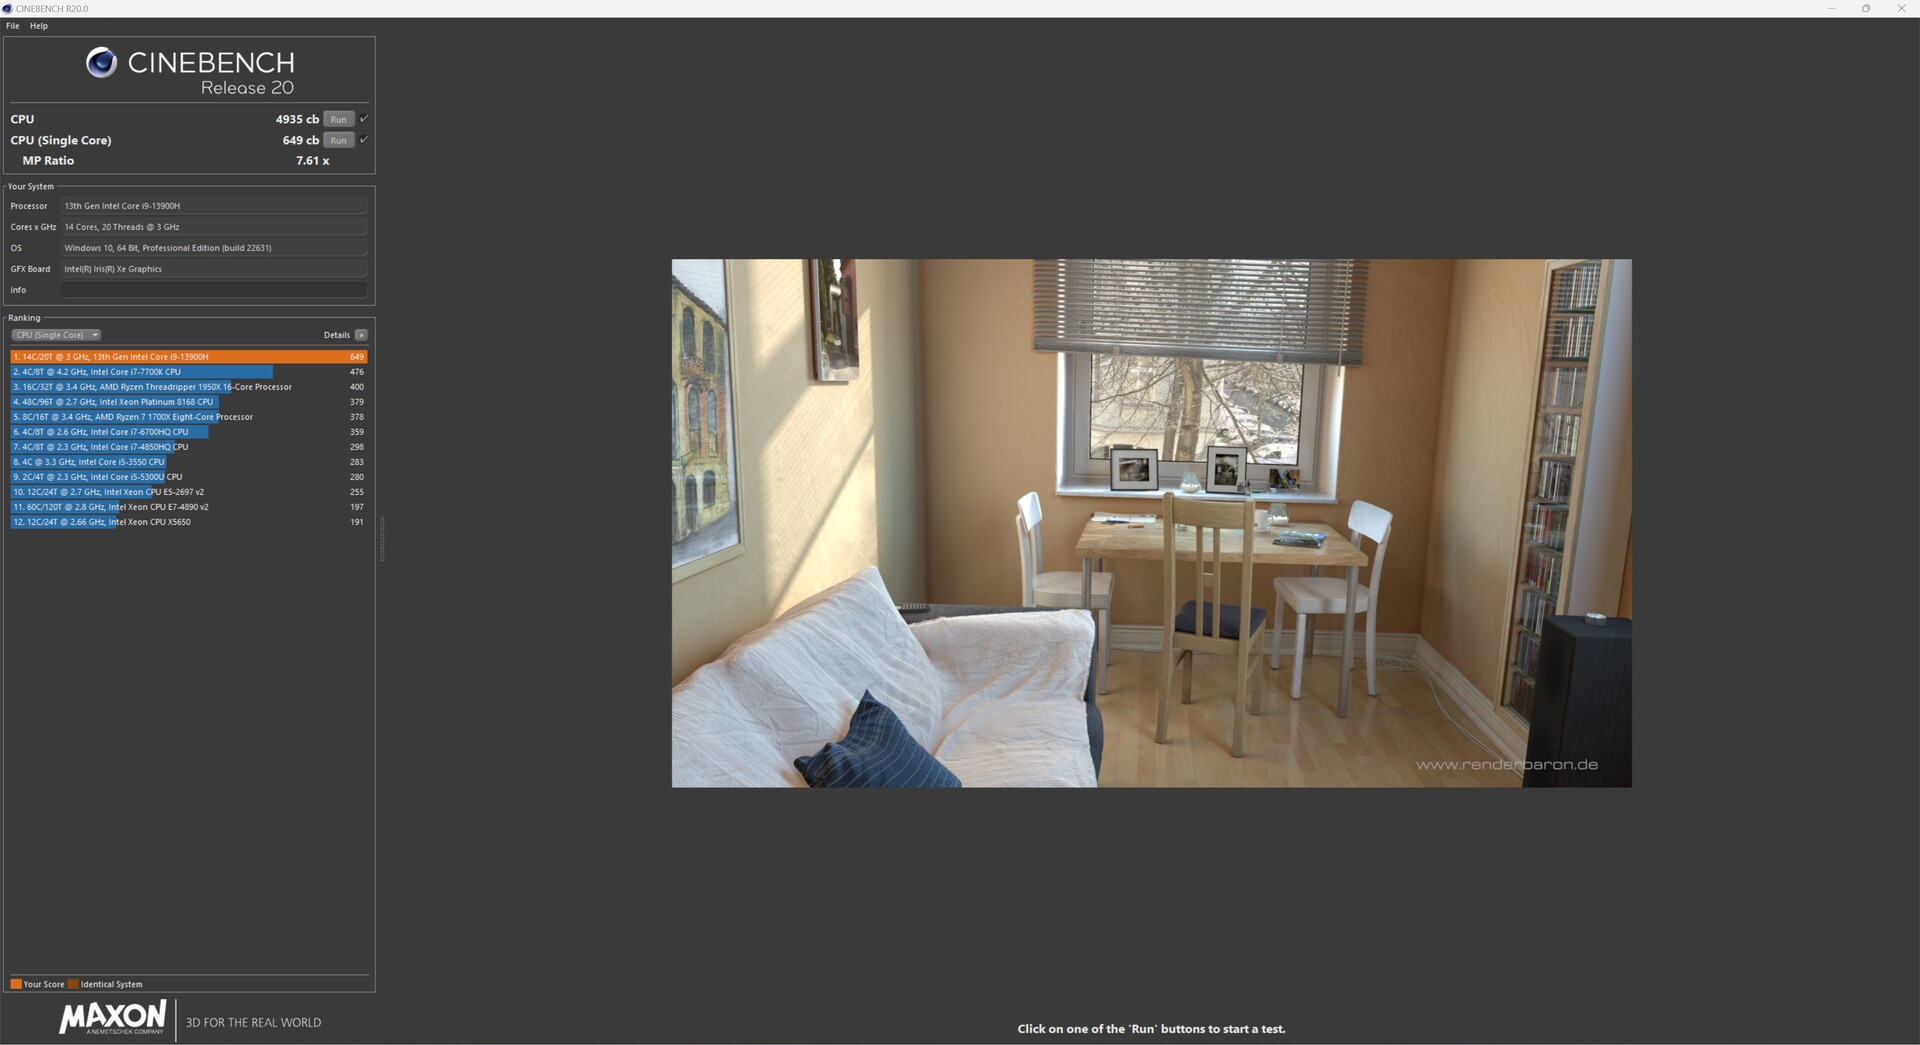
| Cinebench R20 | |
| CPU (Single Core) | |
| Minisforum AtomMan X7 Ti | |
| Geekom XT12 Pro | |
| Geekom A7 | |
| Aoostar GEM12 | |
| Acemagic F2A | |
| Geekom XT13 Pro | |
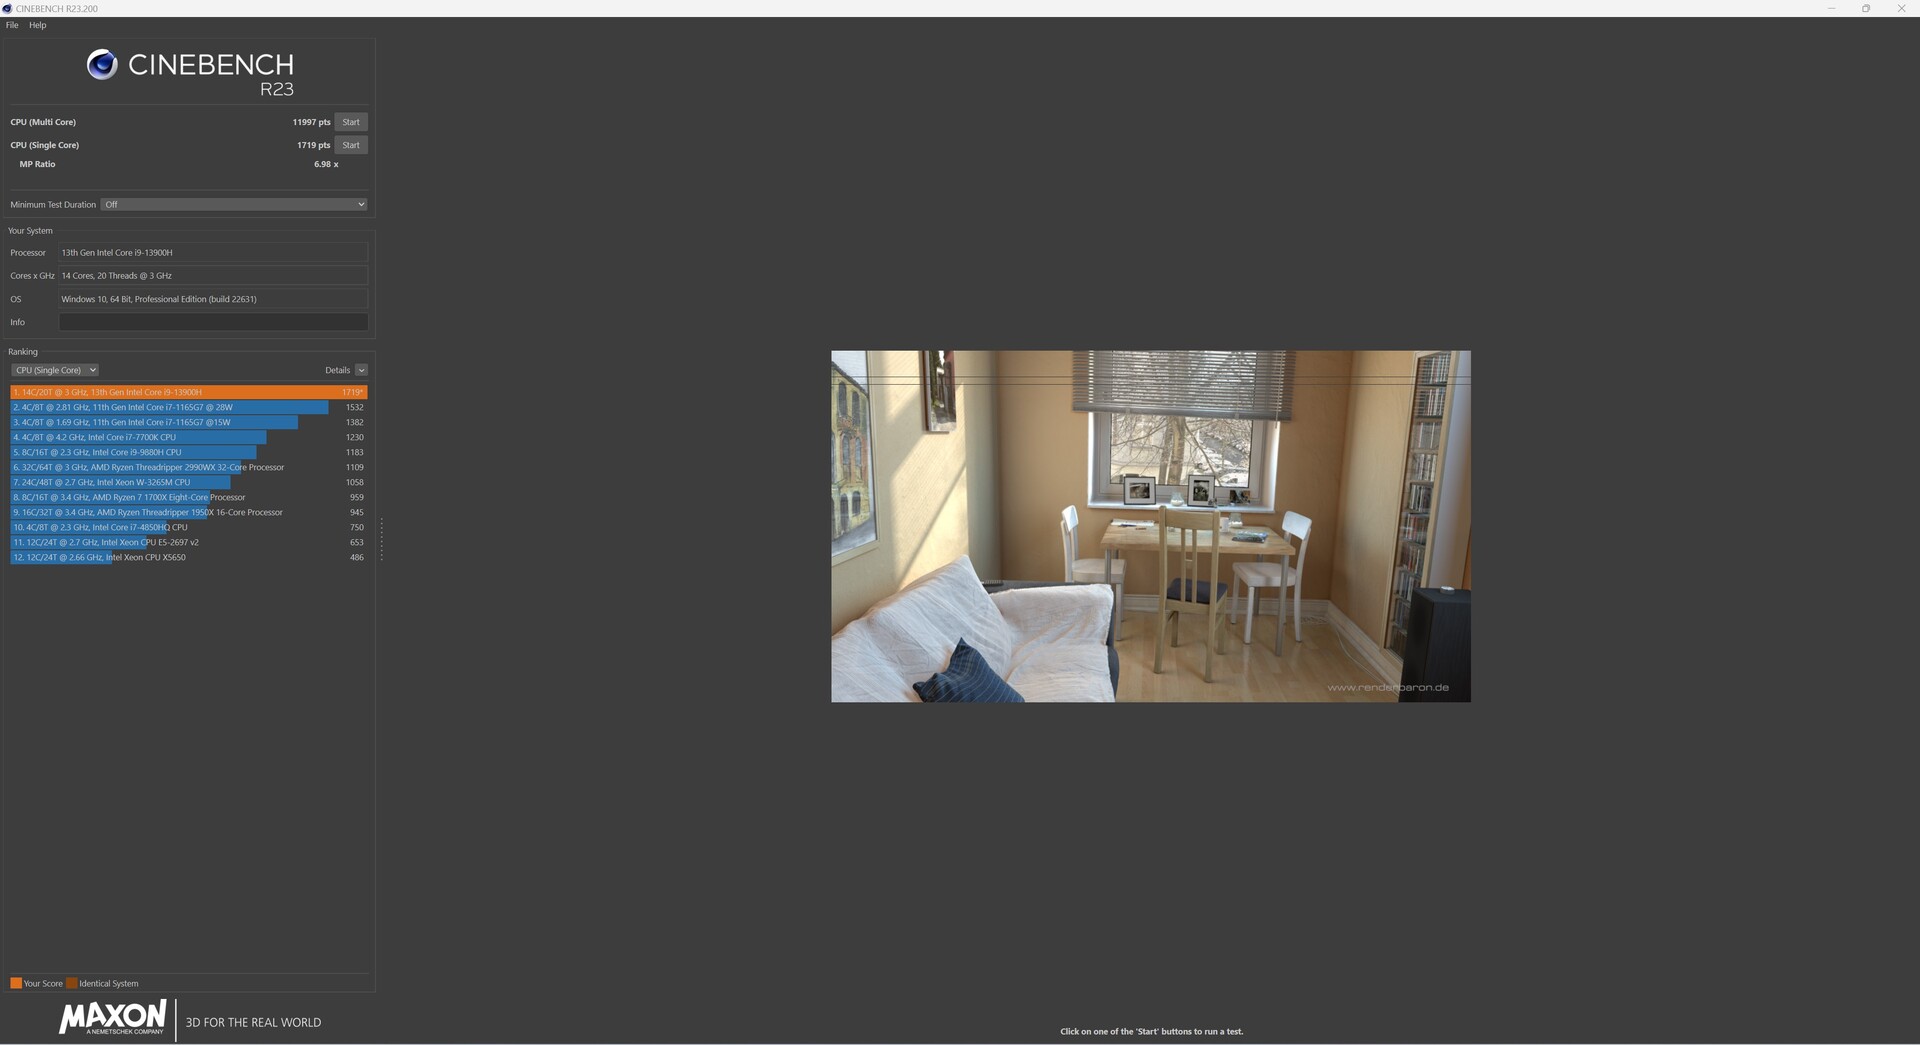
| CPU (Multi Core) | |
| Minisforum AtomMan X7 Ti | |
| Acemagic F2A | |
| Aoostar GEM12 | |
| Geekom A7 | |
| Geekom XT13 Pro | |
| Geekom XT12 Pro | |
| Cinebench R11.5 | |
| CPU Single 64Bit | |
| Geekom A7 | |
| Aoostar GEM12 | |
| Minisforum AtomMan X7 Ti | |
| Acemagic F2A | |
| Geekom XT12 Pro | |
| Geekom XT13 Pro | |
| CPU Multi 64Bit | |
| Minisforum AtomMan X7 Ti | |
| Acemagic F2A | |
| Geekom A7 | |
| Aoostar GEM12 | |
| Geekom XT13 Pro | |
| Geekom XT12 Pro | |
| Cinebench R10 | |
| Rendering Single CPUs 64Bit | |
| Minisforum AtomMan X7 Ti | |
| Geekom A7 | |
| Aoostar GEM12 | |
| Acemagic F2A | |
| Geekom XT13 Pro | |
| Geekom XT12 Pro | |
| Rendering Multiple CPUs 64Bit | |
| Acemagic F2A | |
| Minisforum AtomMan X7 Ti | |
| Aoostar GEM12 | |
| Geekom A7 | |
| Geekom XT13 Pro | |
| Geekom XT12 Pro | |
| Blender - v2.79 BMW27 CPU | |
| Geekom XT12 Pro | |
| Geekom XT13 Pro | |
| Geekom A7 | |
| Aoostar GEM12 | |
| Acemagic F2A | |
| Minisforum AtomMan X7 Ti | |
| wPrime 2.10 | |
| 32m | |
| Geekom XT12 Pro | |
| Acemagic F2A | |
| Geekom XT13 Pro | |
| Minisforum AtomMan X7 Ti | |
| Aoostar GEM12 | |
| Geekom A7 | |
| 1024m | |
| Minisforum AtomMan X7 Ti | |
| Geekom XT13 Pro | |
| Geekom XT12 Pro | |
| Acemagic F2A | |
| Aoostar GEM12 | |
| Geekom A7 | |
| WinRAR - Result | |
| Geekom XT12 Pro | |
| Minisforum AtomMan X7 Ti | |
| Acemagic F2A | |
| Geekom A7 | |
| Aoostar GEM12 | |
| Geekom XT13 Pro | |
| Geekbench 5.0 | |
| 5.0 Multi-Core | |
| Minisforum AtomMan X7 Ti | |
| Acemagic F2A | |
| Geekom A7 | |
| Aoostar GEM12 | |
| Geekom XT13 Pro | |
| Geekom XT12 Pro | |
| 5.0 Single-Core | |
| Geekom A7 | |
| Aoostar GEM12 | |
| Minisforum AtomMan X7 Ti | |
| Geekom XT12 Pro | |
| Acemagic F2A | |
| Geekom XT13 Pro | |
| Geekbench 4.4 | |
| 64 Bit Single-Core Score | |
| Geekom A7 | |
| Aoostar GEM12 | |
| Geekom XT12 Pro | |
| Minisforum AtomMan X7 Ti | |
| Geekom XT13 Pro | |
| Acemagic F2A | |
| 64 Bit Multi-Core Score | |
| Geekom A7 | |
| Minisforum AtomMan X7 Ti | |
| Aoostar GEM12 | |
| Acemagic F2A | |
| Geekom XT13 Pro | |
| Geekom XT12 Pro | |
| 3DMark 11 - 1280x720 Performance Physics | |
| Geekom A7 | |
| Minisforum AtomMan X7 Ti | |
| Aoostar GEM12 | |
| Acemagic F2A | |
| Geekom XT13 Pro | |
| Geekom XT12 Pro | |
| HWBOT x265 Benchmark v2.2 - 4k Preset | |
| Minisforum AtomMan X7 Ti | |
| Geekom A7 | |
| Aoostar GEM12 | |
| Acemagic F2A | |
| Geekom XT13 Pro | |
| Geekom XT12 Pro | |
| R Benchmark 2.5 - Overall mean | |
| Geekom XT13 Pro | |
| Acemagic F2A | |
| Geekom XT12 Pro | |
| Minisforum AtomMan X7 Ti | |
| Aoostar GEM12 | |
| Geekom A7 | |
| LibreOffice - 20 Documents To PDF | |
| Geekom A7 | |
| Minisforum AtomMan X7 Ti | |
| Aoostar GEM12 | |
| Geekom XT13 Pro | |
| Acemagic F2A | |
| Geekom XT12 Pro | |
| WebXPRT 3 - Overall | |
| Geekom A7 | |
| Aoostar GEM12 | |
| Geekom XT12 Pro | |
| Acemagic F2A | |
| Geekom XT13 Pro | |
| Minisforum AtomMan X7 Ti | |
| Mozilla Kraken 1.1 - Total | |
| Geekom XT13 Pro | |
| Acemagic F2A | |
| Minisforum AtomMan X7 Ti | |
| Aoostar GEM12 | |
| Geekom XT12 Pro | |
| Geekom A7 | |
| 3DMark | |
| 1920x1080 Fire Strike Physics | |
| Aoostar GEM12 | |
| Minisforum AtomMan X7 Ti | |
| Geekom A7 | |
| Acemagic F2A | |
| Geekom XT13 Pro | |
| Geekom XT12 Pro | |
| 2560x1440 Time Spy CPU | |
| Minisforum AtomMan X7 Ti | |
| Aoostar GEM12 | |
| Geekom A7 | |
| Acemagic F2A | |
| Geekom XT13 Pro | |
| Geekom XT12 Pro | |
| Super Pi mod 1.5 XS 1M - 1M | |
| Geekom XT13 Pro | |
| Geekom XT12 Pro | |
| Geekom A7 | |
| Aoostar GEM12 | |
| Acemagic F2A | |
| Minisforum AtomMan X7 Ti | |
| Super Pi mod 1.5 XS 2M - 2M | |
| Geekom A7 | |
| Aoostar GEM12 | |
| Geekom XT13 Pro | |
| Geekom XT12 Pro | |
| Acemagic F2A | |
| Minisforum AtomMan X7 Ti | |
| Super Pi Mod 1.5 XS 32M - 32M | |
| Aoostar GEM12 | |
| Geekom A7 | |
| Geekom XT13 Pro | |
| Geekom XT12 Pro | |
| Acemagic F2A | |
| Minisforum AtomMan X7 Ti | |
* ... daha küçük daha iyidir
AIDA64: FP32 Ray-Trace | FPU Julia | CPU SHA3 | CPU Queen | FPU SinJulia | FPU Mandel | CPU AES | CPU ZLib | FP64 Ray-Trace | CPU PhotoWorxx
| Performance Rating | |
| Geekom A7 | |
| Aoostar GEM12 | |
| Minisforum AtomMan X7 Ti | |
| Acemagic F2A | |
| Sınıf ortalaması Mini PC | |
| Geekom XT13 Pro | |
| Geekom XT12 Pro | |
| AIDA64 / FP32 Ray-Trace | |
| Aoostar GEM12 | |
| Geekom A7 | |
| Acemagic F2A | |
| Minisforum AtomMan X7 Ti | |
| Sınıf ortalaması Mini PC (764 - 51004, n=116, son 2 yıl) | |
| Geekom XT13 Pro | |
| Geekom XT12 Pro | |
| AIDA64 / FPU Julia | |
| Aoostar GEM12 | |
| Geekom A7 | |
| Minisforum AtomMan X7 Ti | |
| Acemagic F2A | |
| Sınıf ortalaması Mini PC (4140 - 214250, n=116, son 2 yıl) | |
| Geekom XT13 Pro | |
| Geekom XT12 Pro | |
| AIDA64 / CPU SHA3 | |
| Geekom A7 | |
| Aoostar GEM12 | |
| Minisforum AtomMan X7 Ti | |
| Acemagic F2A | |
| Sınıf ortalaması Mini PC (290 - 9399, n=116, son 2 yıl) | |
| Geekom XT13 Pro | |
| Geekom XT12 Pro | |
| AIDA64 / CPU Queen | |
| Geekom A7 | |
| Aoostar GEM12 | |
| Geekom XT13 Pro | |
| Acemagic F2A | |
| Minisforum AtomMan X7 Ti | |
| Geekom XT12 Pro | |
| Sınıf ortalaması Mini PC (8172 - 184747, n=116, son 2 yıl) | |
| AIDA64 / FPU SinJulia | |
| Aoostar GEM12 | |
| Geekom A7 | |
| Minisforum AtomMan X7 Ti | |
| Acemagic F2A | |
| Sınıf ortalaması Mini PC (408 - 29064, n=116, son 2 yıl) | |
| Geekom XT13 Pro | |
| Geekom XT12 Pro | |
| AIDA64 / FPU Mandel | |
| Aoostar GEM12 | |
| Geekom A7 | |
| Acemagic F2A | |
| Minisforum AtomMan X7 Ti | |
| Sınıf ortalaması Mini PC (2088 - 113499, n=116, son 2 yıl) | |
| Geekom XT13 Pro | |
| Geekom XT12 Pro | |
| AIDA64 / CPU AES | |
| Geekom A7 | |
| Minisforum AtomMan X7 Ti | |
| Acemagic F2A | |
| Geekom XT13 Pro | |
| Geekom XT12 Pro | |
| Sınıf ortalaması Mini PC (3691 - 325960, n=116, son 2 yıl) | |
| Aoostar GEM12 | |
| AIDA64 / CPU ZLib | |
| Minisforum AtomMan X7 Ti | |
| Acemagic F2A | |
| Aoostar GEM12 | |
| Geekom A7 | |
| Geekom XT13 Pro | |
| Sınıf ortalaması Mini PC (76.7 - 2039, n=116, son 2 yıl) | |
| Geekom XT12 Pro | |
| AIDA64 / FP64 Ray-Trace | |
| Aoostar GEM12 | |
| Geekom A7 | |
| Acemagic F2A | |
| Minisforum AtomMan X7 Ti | |
| Sınıf ortalaması Mini PC (432 - 26952, n=116, son 2 yıl) | |
| Geekom XT13 Pro | |
| Geekom XT12 Pro | |
| AIDA64 / CPU PhotoWorxx | |
| Minisforum AtomMan X7 Ti | |
| Geekom A7 | |
| Aoostar GEM12 | |
| Acemagic F2A | |
| Sınıf ortalaması Mini PC (5296 - 51727, n=116, son 2 yıl) | |
| Geekom XT13 Pro | |
| Geekom XT12 Pro | |
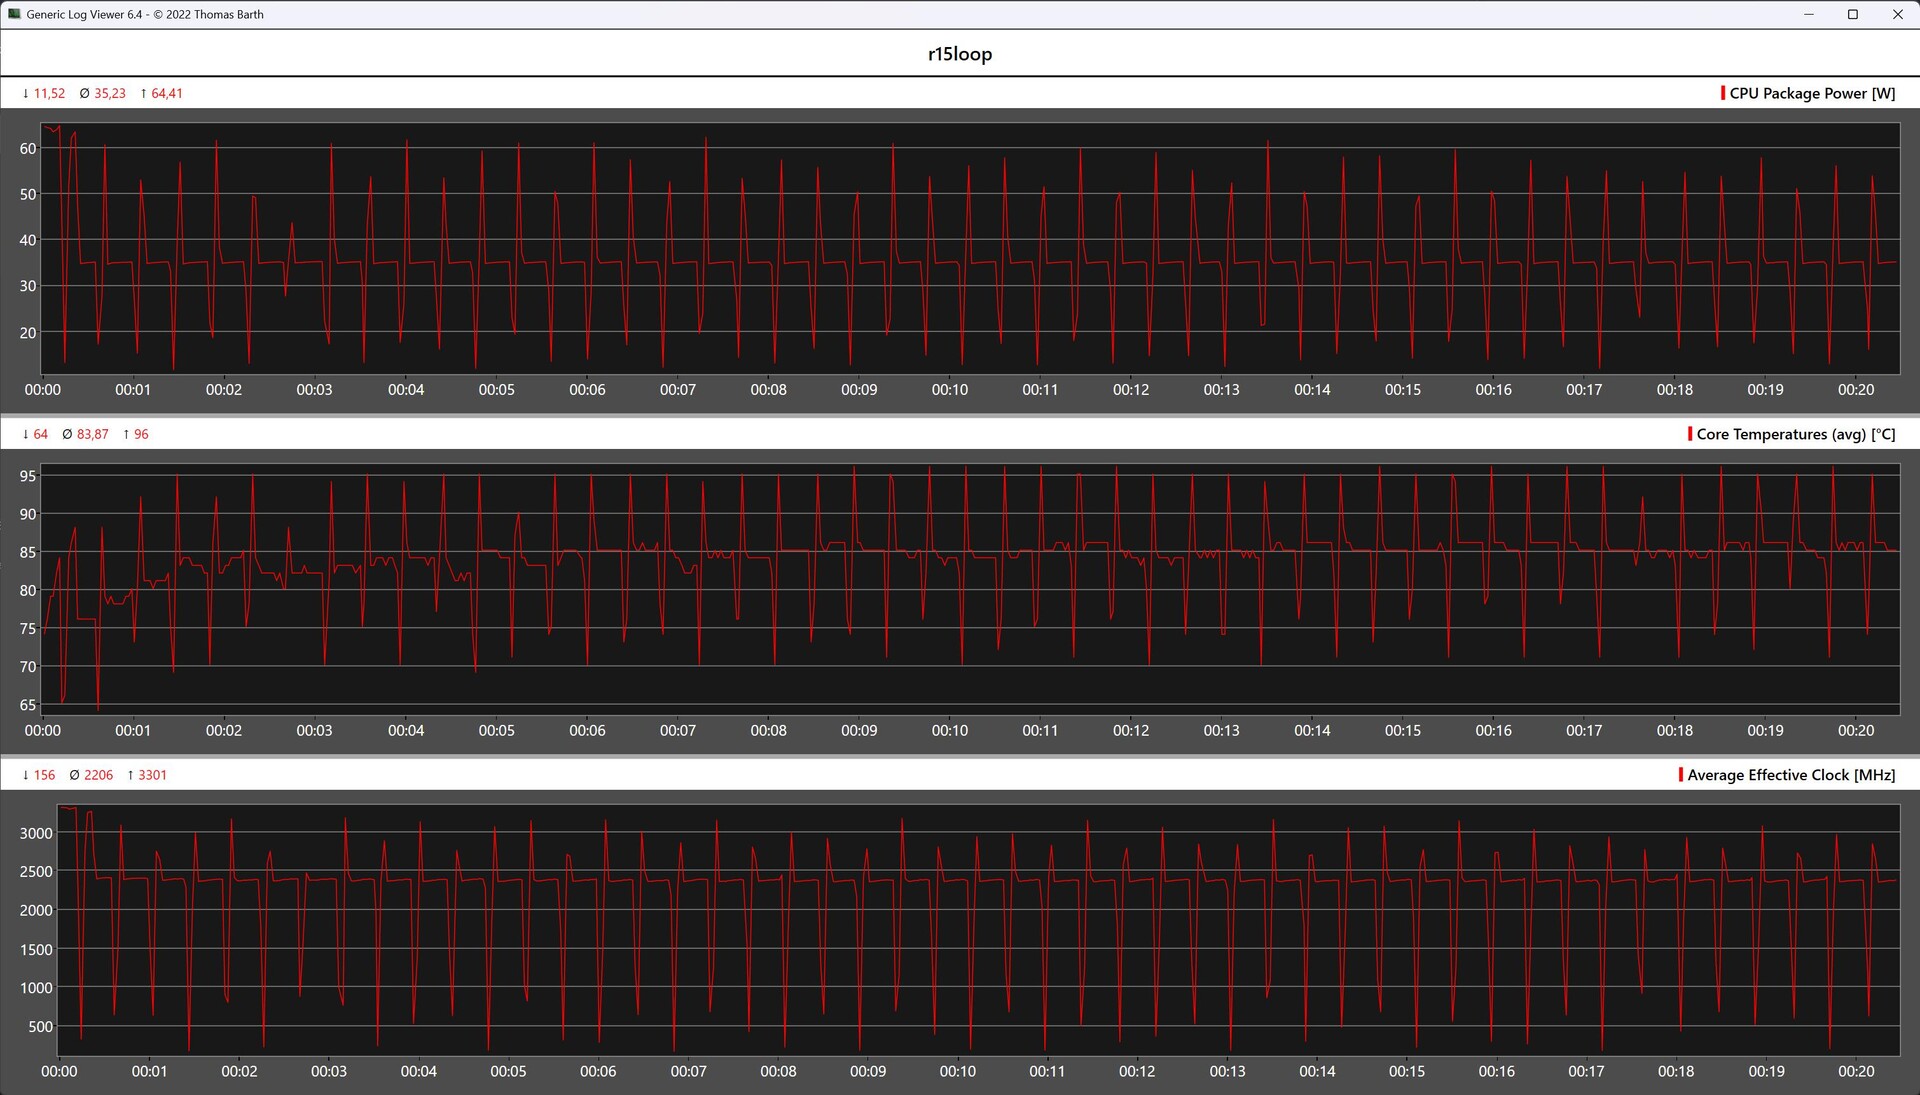
Cinebench R15 Çoklu döngü
Test örneğimizin Cinebench R15 sürekli döngüsü Geekom XT12 Pro ile neredeyse paralel çalışıyor. Ancak sonuçta, daha yeni XT13 Pro modeli açık bir farkla öne geçmeyi başarıyor. Küçük soğutma sisteminin SoC'nin Turbo'sunu daha uzun bir süre boyunca korumayı başaramadığı da görülebilir. Yüksek sıcaklıklar nedeniyle güç tüketiminin kısılması gerektiğinden 64 watt'lık maksimum güç sınırına yalnızca kısa bir süre için ulaşılıyor.
Sistem performansı
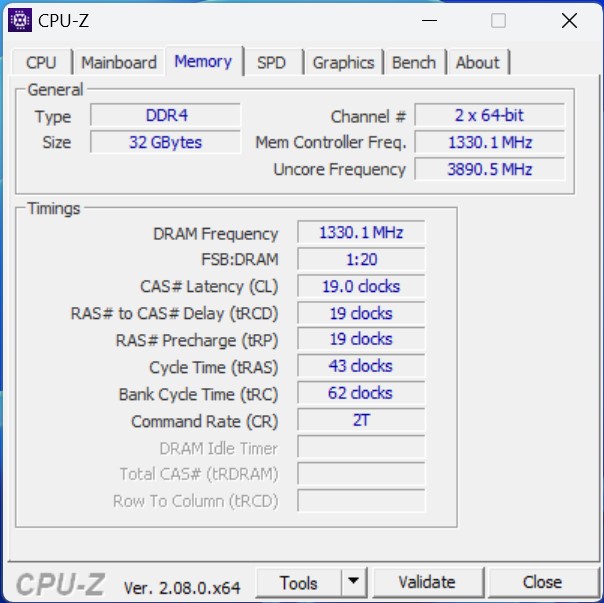
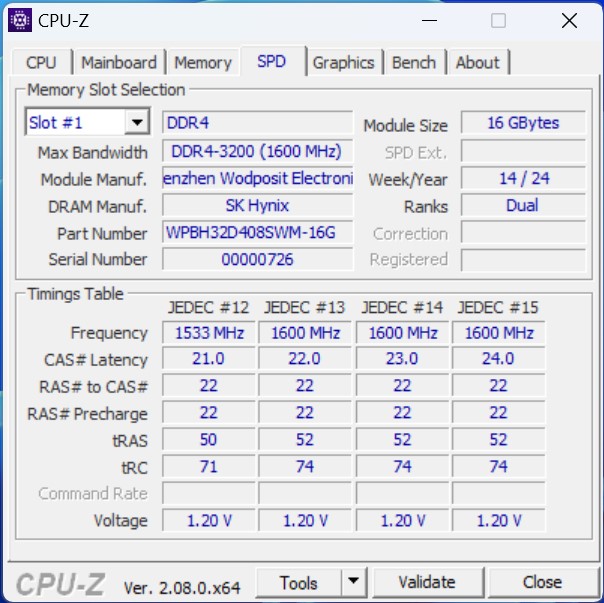
Sistem performansı testlerinde, Geekom XT13 Pro'nun belgelenen performansı, sıralamanın en altında yer almak için yeterince iyi. Ancak öznel olarak Geekom XT13 Pro'nun iyi bir performans sunduğunu söyleyebiliriz. Test aşamasında cihazla çalışırken gözle görülür bir gecikme gözlemleyemedik. RAM seçimi söz konusu olduğunda, AIDA64 kıyaslamalarından da görülebileceği gibi, daha yavaş olan DDR4 standardı intikamını alıyor. Teknik olarak Intel Core i9-13900H dDR5 (5.200 MT/s) ile birleştirilebilir.
| AIDA64 / Memory Copy | |
| Minisforum AtomMan X7 Ti | |
| Aoostar GEM12 | |
| Geekom A7 | |
| Acemagic F2A | |
| Sınıf ortalaması Mini PC (8377 - 89287, n=116, son 2 yıl) | |
| Geekom XT13 Pro | |
| Geekom XT12 Pro | |
| AIDA64 / Memory Read | |
| Minisforum AtomMan X7 Ti | |
| Acemagic F2A | |
| Geekom A7 | |
| Aoostar GEM12 | |
| Sınıf ortalaması Mini PC (8974 - 100086, n=116, son 2 yıl) | |
| Geekom XT12 Pro | |
| Geekom XT13 Pro | |
| AIDA64 / Memory Write | |
| Geekom A7 | |
| Aoostar GEM12 | |
| Minisforum AtomMan X7 Ti | |
| Acemagic F2A | |
| Sınıf ortalaması Mini PC (8762 - 100538, n=116, son 2 yıl) | |
| Geekom XT13 Pro | |
| Geekom XT12 Pro | |
| AIDA64 / Memory Latency | |
| Acemagic F2A | |
| Minisforum AtomMan X7 Ti | |
| Sınıf ortalaması Mini PC (44.9 - 184.8, n=116, son 2 yıl) | |
| Geekom A7 | |
| Aoostar GEM12 | |
| Geekom XT13 Pro | |
| Geekom XT12 Pro | |
* ... daha küçük daha iyidir
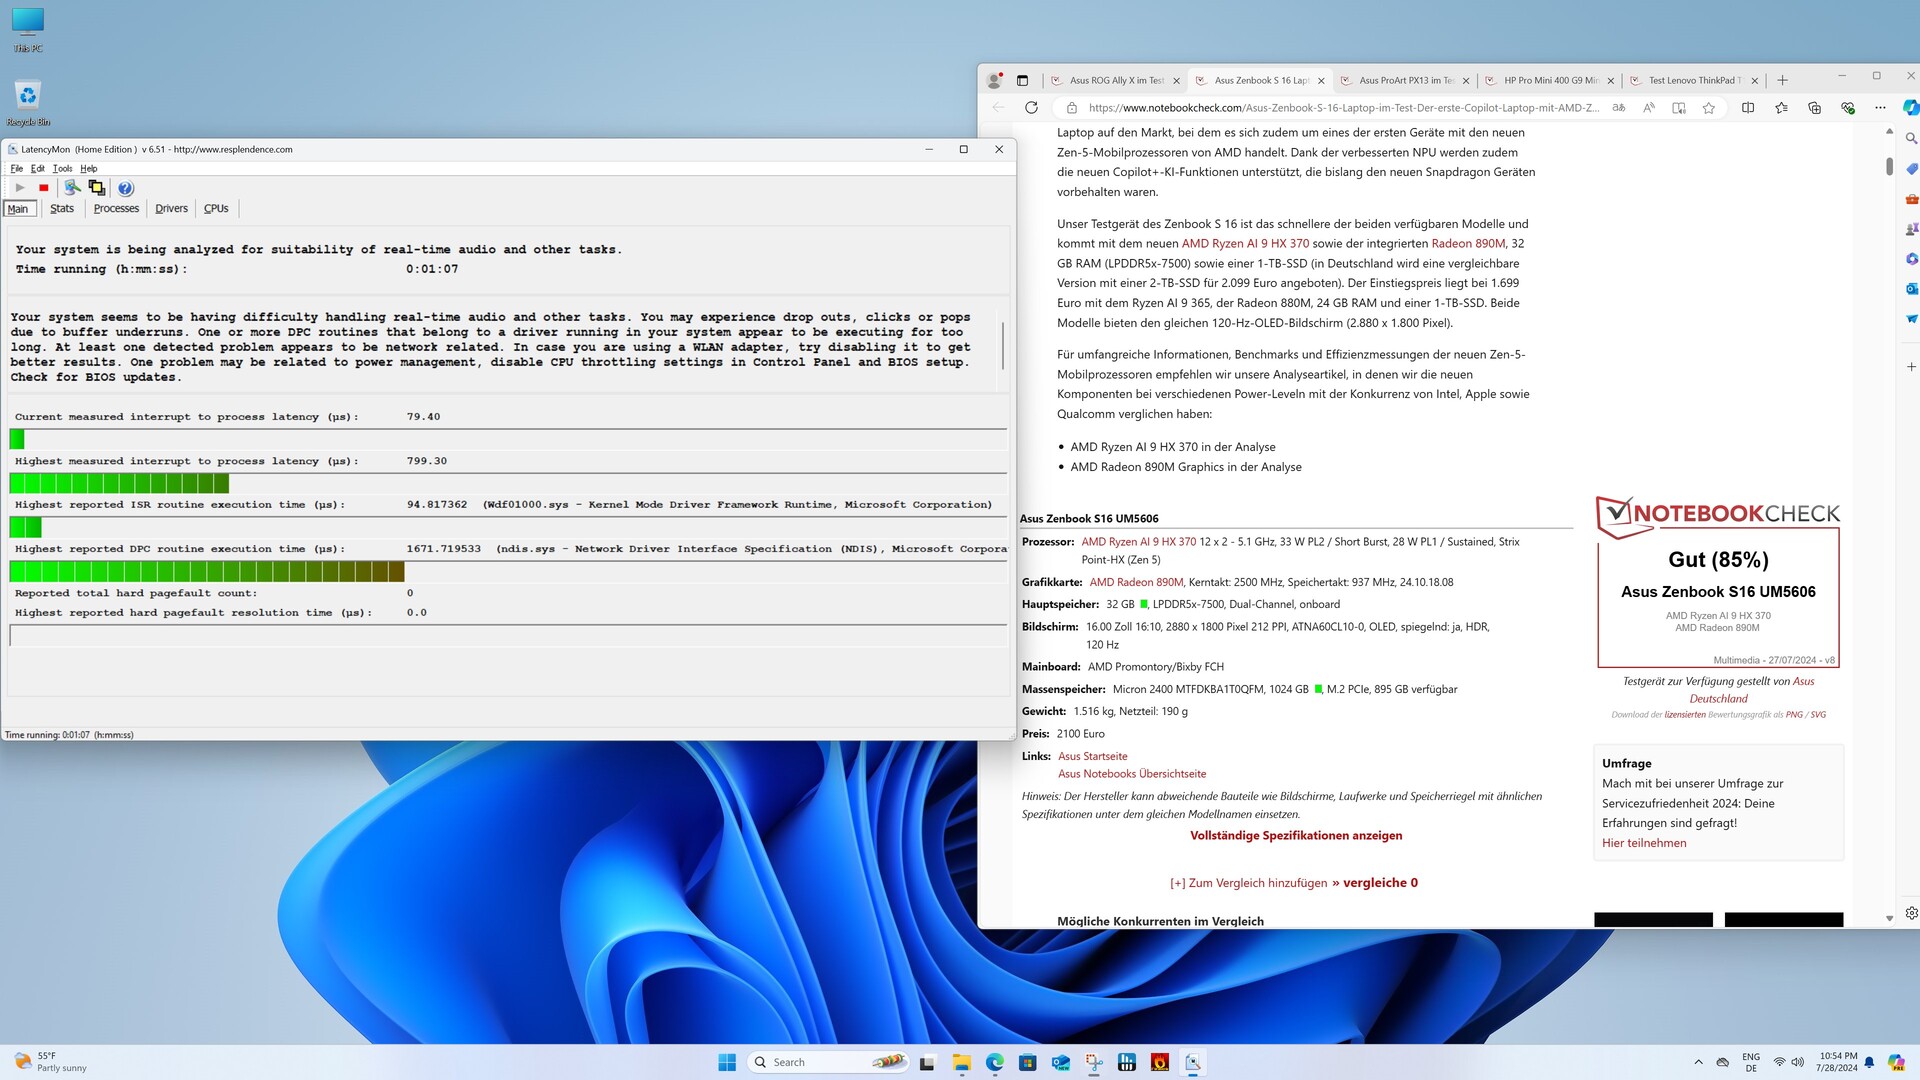
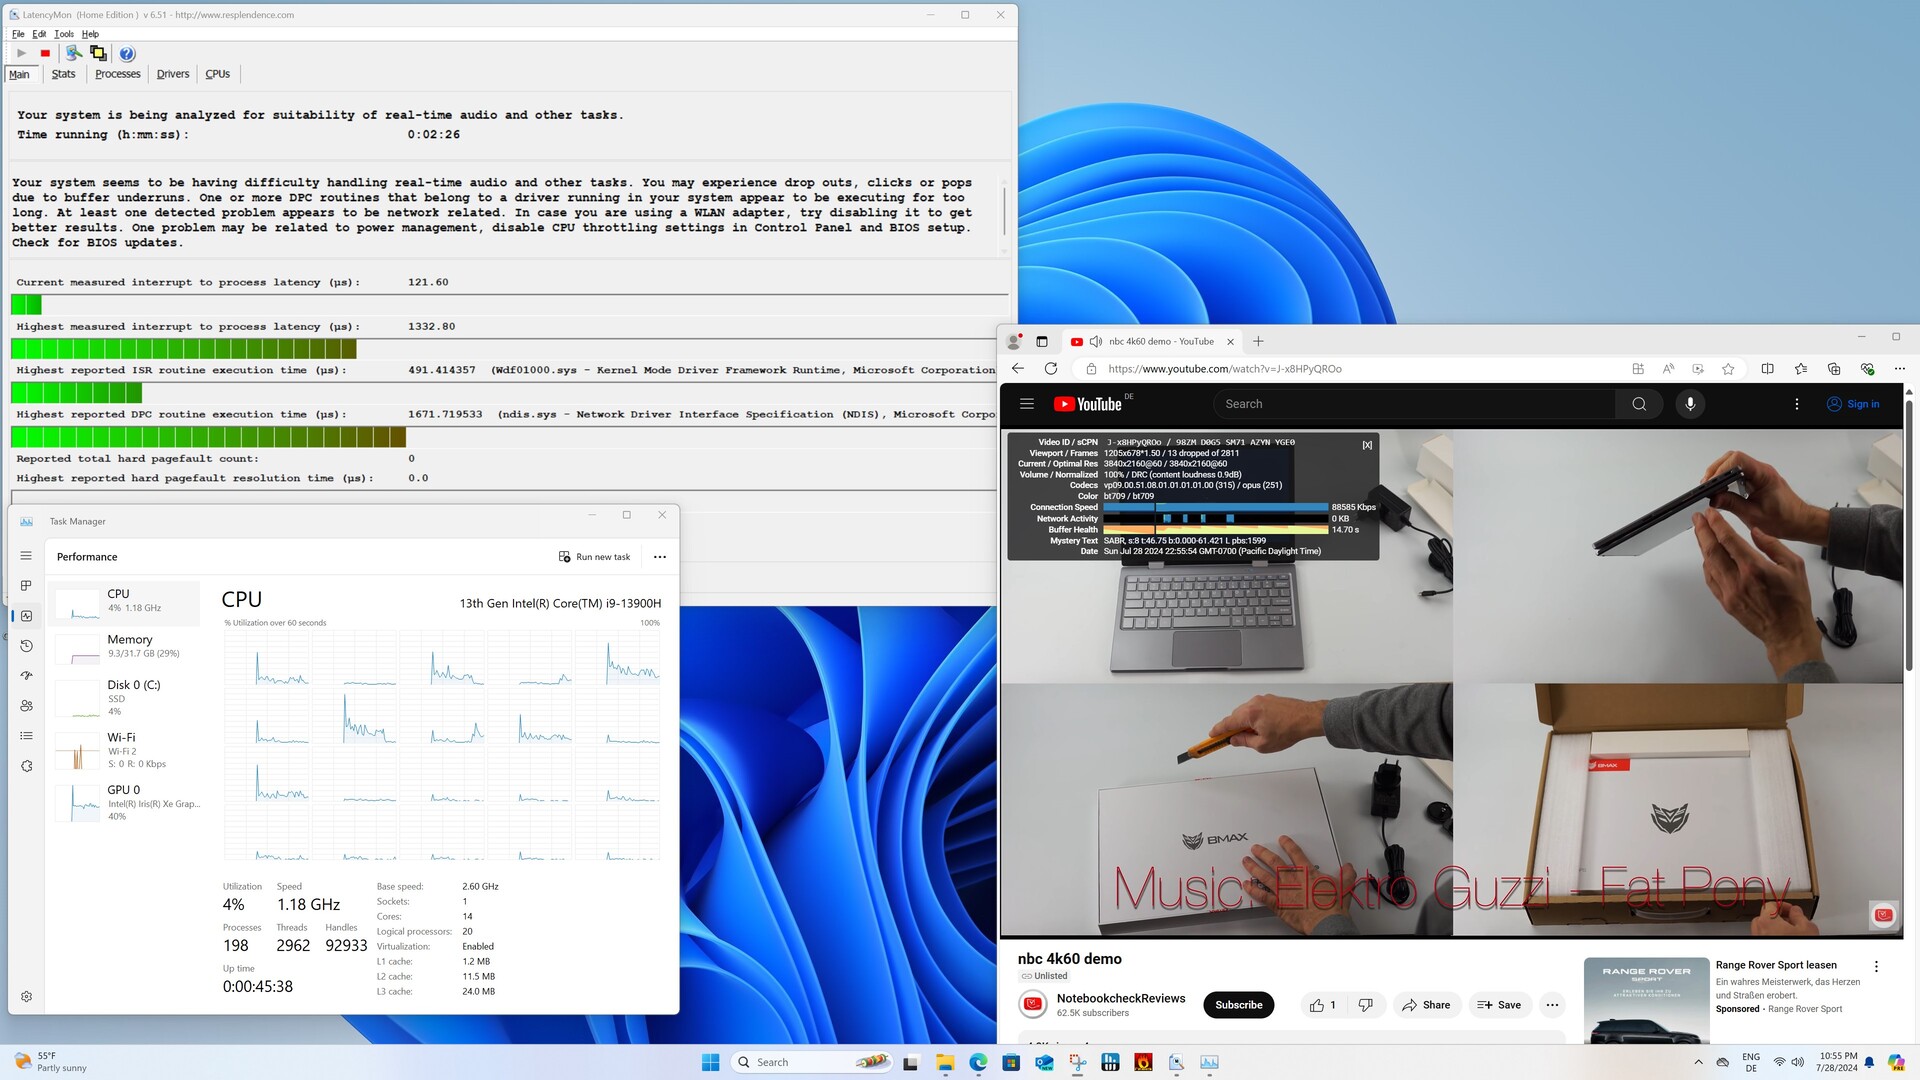
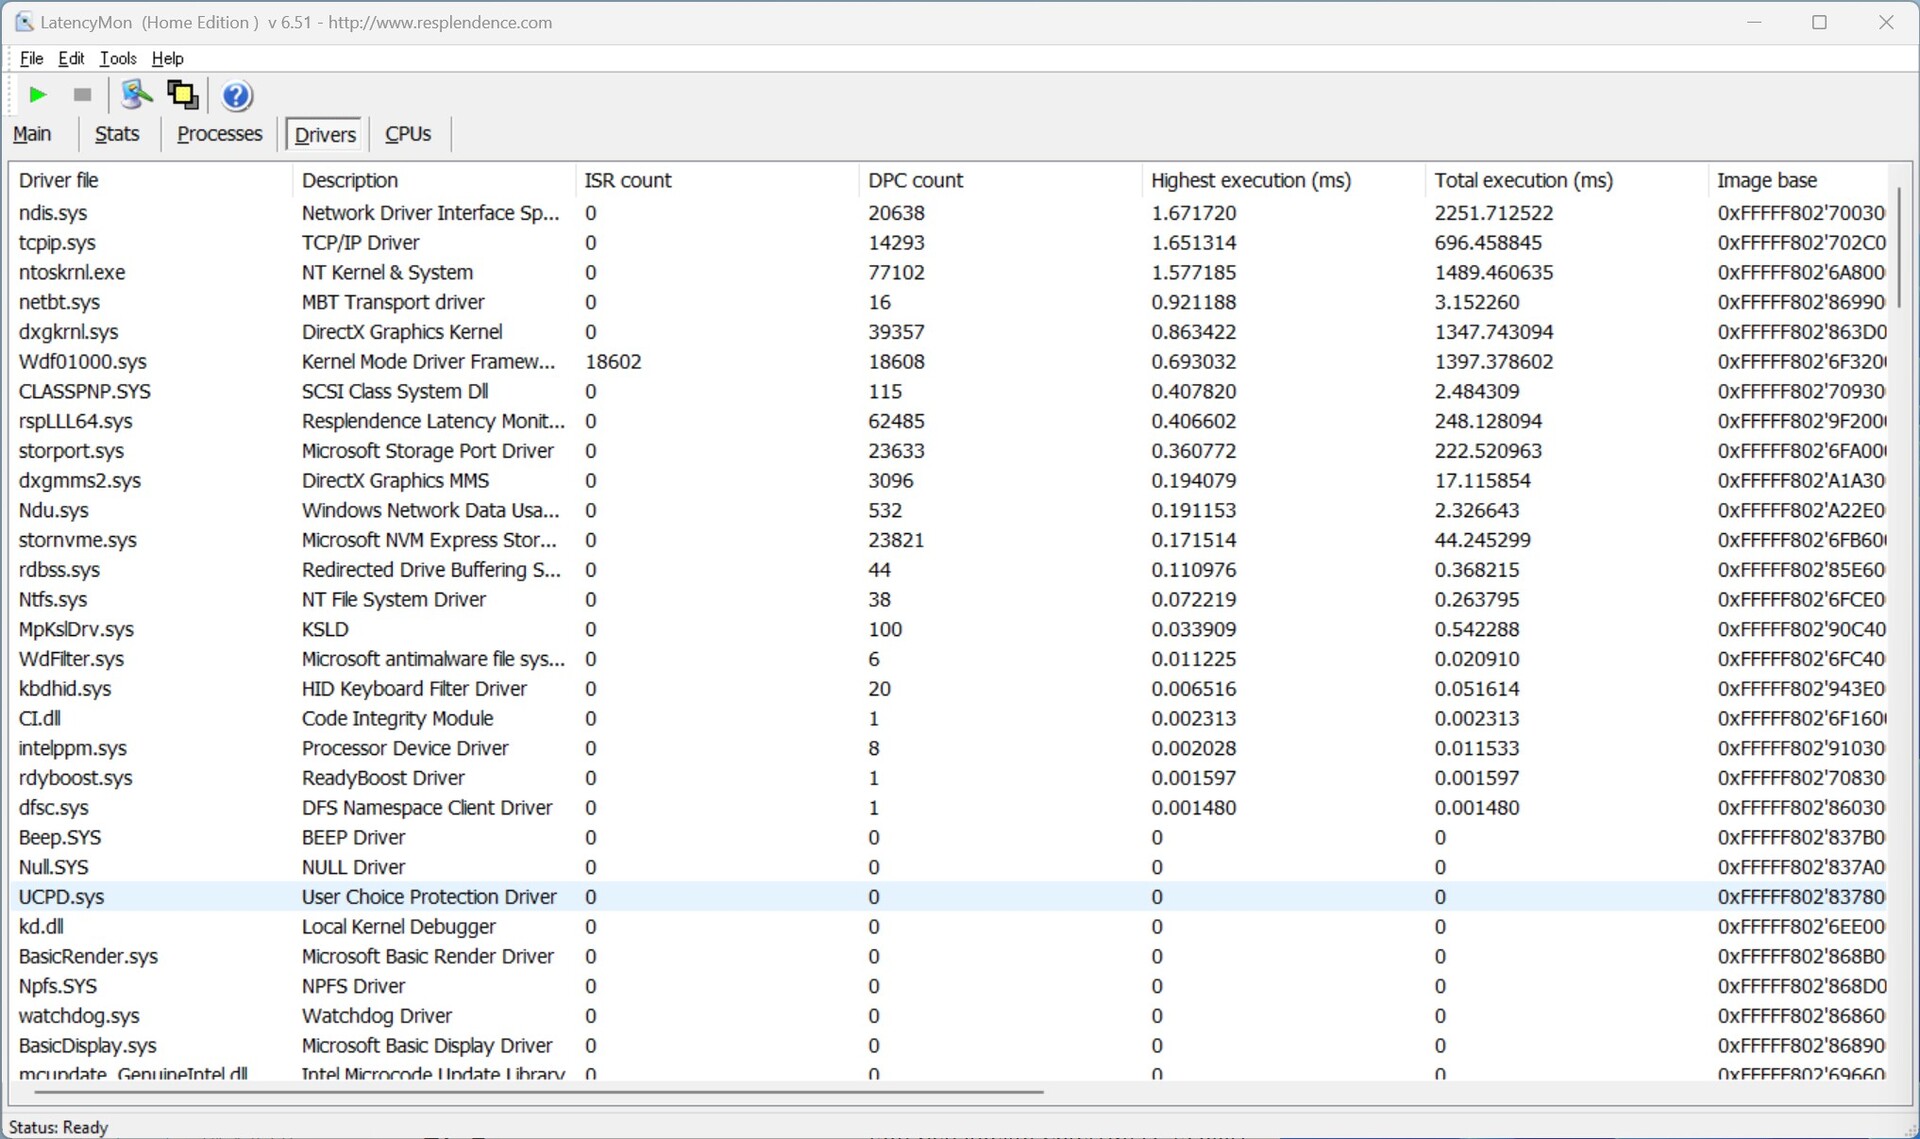
DPC gecikme süreleri
Geekom XT13 Pro ile aşırı derecede aşırı DPC gecikmeleri görmüyoruz. Bu durum şu şekildeydi Geekom XT12 Pro. Bununla birlikte, test örneğimiz olağanüstü sonuçlardan uzak. Sadece Edge tarayıcısıyla gezinirken bile maksimum değere ulaştık.

| DPC Latencies / LatencyMon - interrupt to process latency (max), Web, Youtube, Prime95 | |
| Acemagic F2A | |
| Geekom XT12 Pro | |
| Minisforum AtomMan X7 Ti | |
| Geekom XT13 Pro | |
| Geekom A7 | |
| Aoostar GEM12 | |
* ... daha küçük daha iyidir
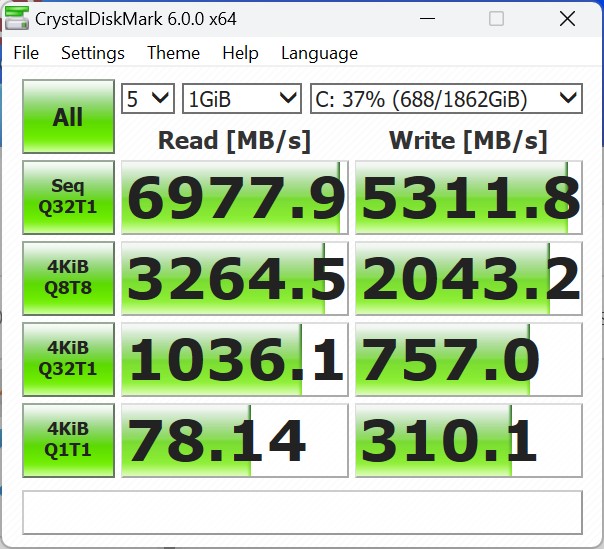
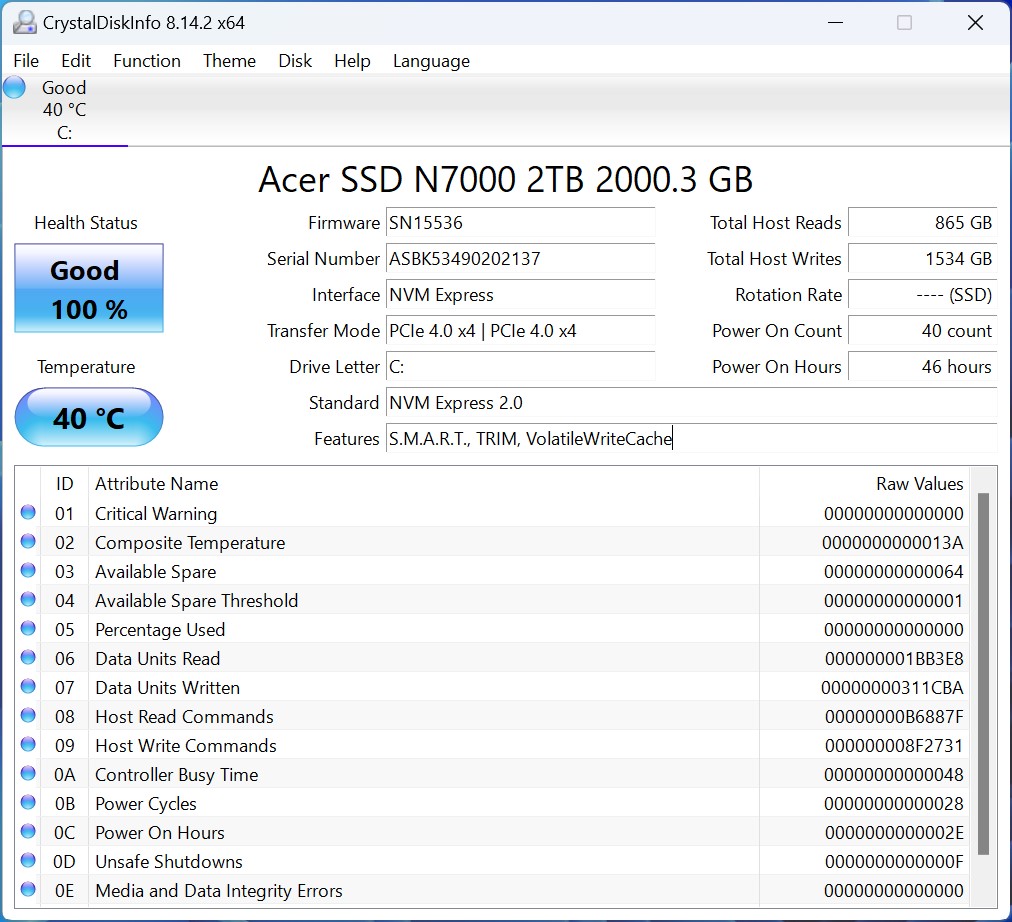
Yığın depolama
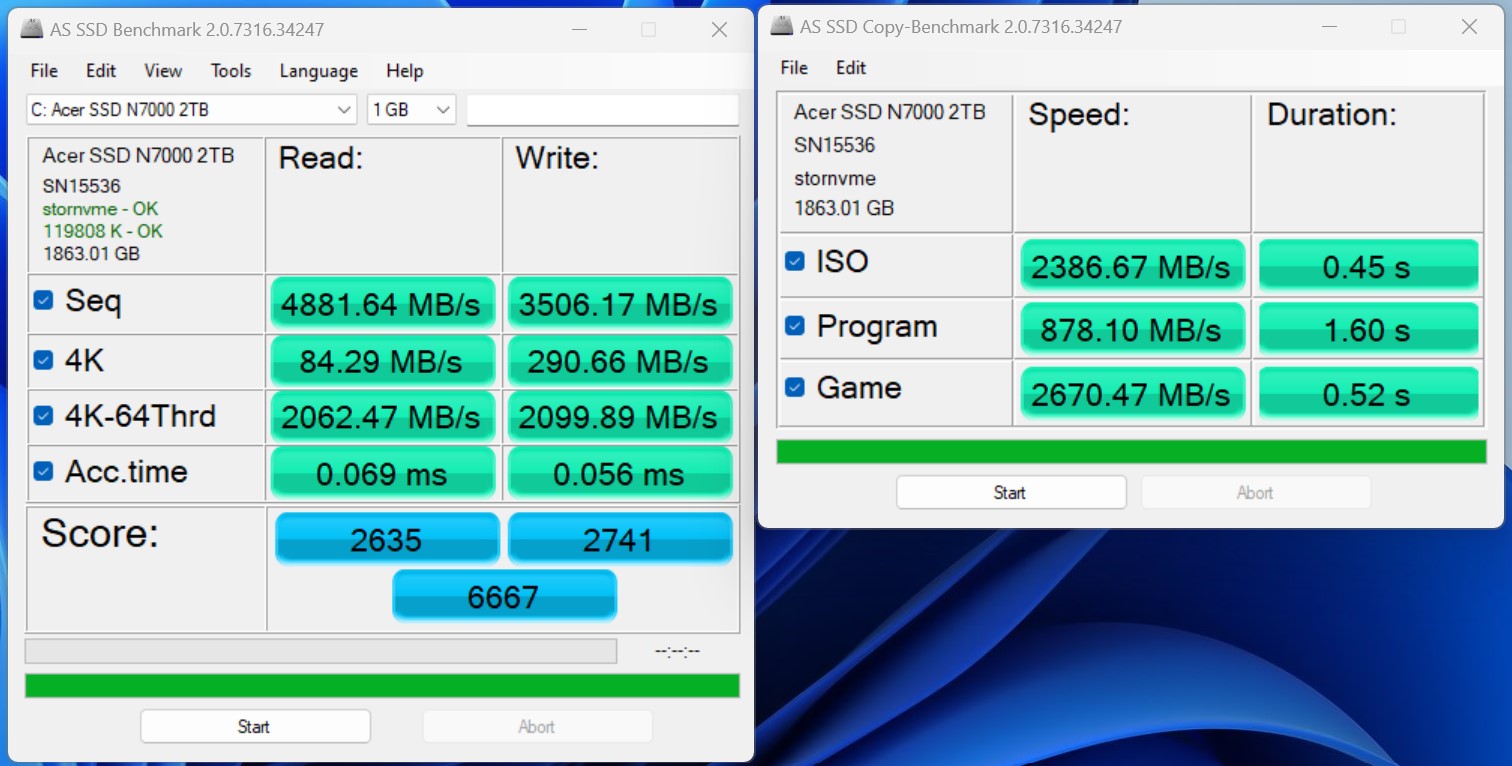
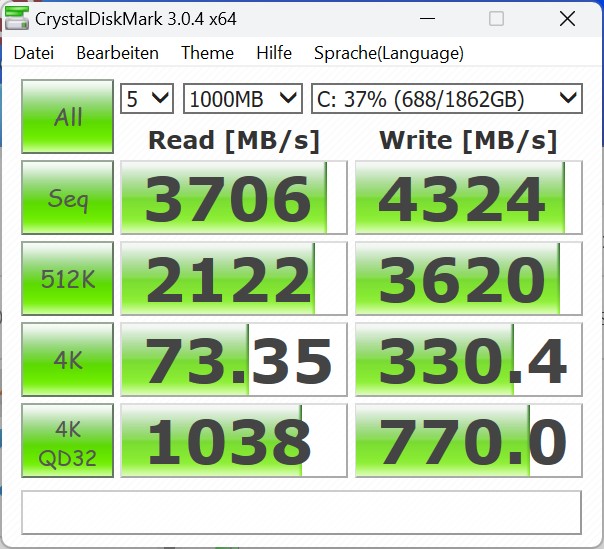
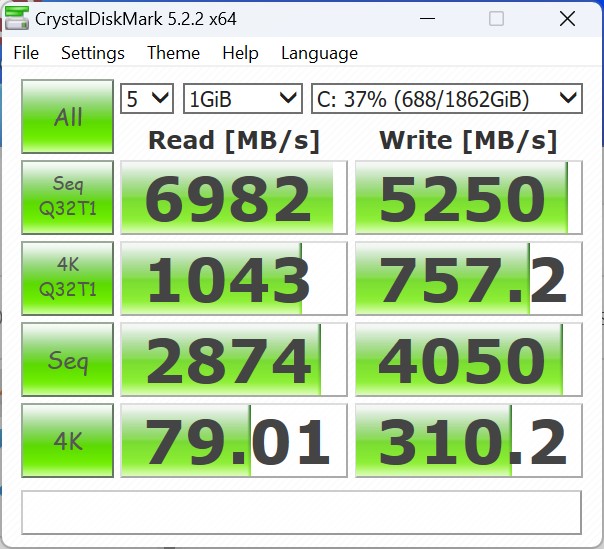
Geekom XT13 Pro, Acer'ın 2 TB depolama alanına sahip bir SSD'si ile donatılmıştır. Aynı model daha önce Geekom GT13 ve tüm testlerde mükemmel bir performans gösterdi. Teknik bağlantı optimum düzeyde ve elde edilen aktarım hızları çok yüksek. Sürekli yük altında, Acer N7000 okuma performansını sabit tutmakta biraz sorun yaşıyor. Neyse ki aşırı bir dezavantaj söz konusu değil. Grafikten de görülebileceği gibi, Acer N7000 düşük okuma performansıyla bile Geekom XT12 Pro ya da Acemagic F2A. Geekom XT12 Pro'nun testinde termal pedin konumuyla ilgili bir sorun ortaya çıktı, ancak Geekom XT13 Pro'da durum böyle değil. Termal pedler doğru konumdadır. Bakım bölümünde daha önce de belirttiğimiz gibi, Geekom XT13 Pro'ya ek bir SSD takılabilir. Ancak ikinci M.2 yuvası yalnızca 42 milimetre (M.2-2242) uzunluğundaki SATA SSD'leri desteklemektedir.
Daha fazla karşılaştırma ve kıyaslama için lütfen Karşılaştırma tablosu.

| Drive Performance Rating - Percent | |
| Aoostar GEM12 | |
| Geekom XT13 Pro | |
| Geekom XT12 Pro | |
| Minisforum AtomMan X7 Ti | |
| Geekom A7 | |
| Sınıf ortalaması Mini PC | |
| Acemagic F2A | |
* ... daha küçük daha iyidir
Continuous read: DiskSpd Read Loop, Queue Depth 8
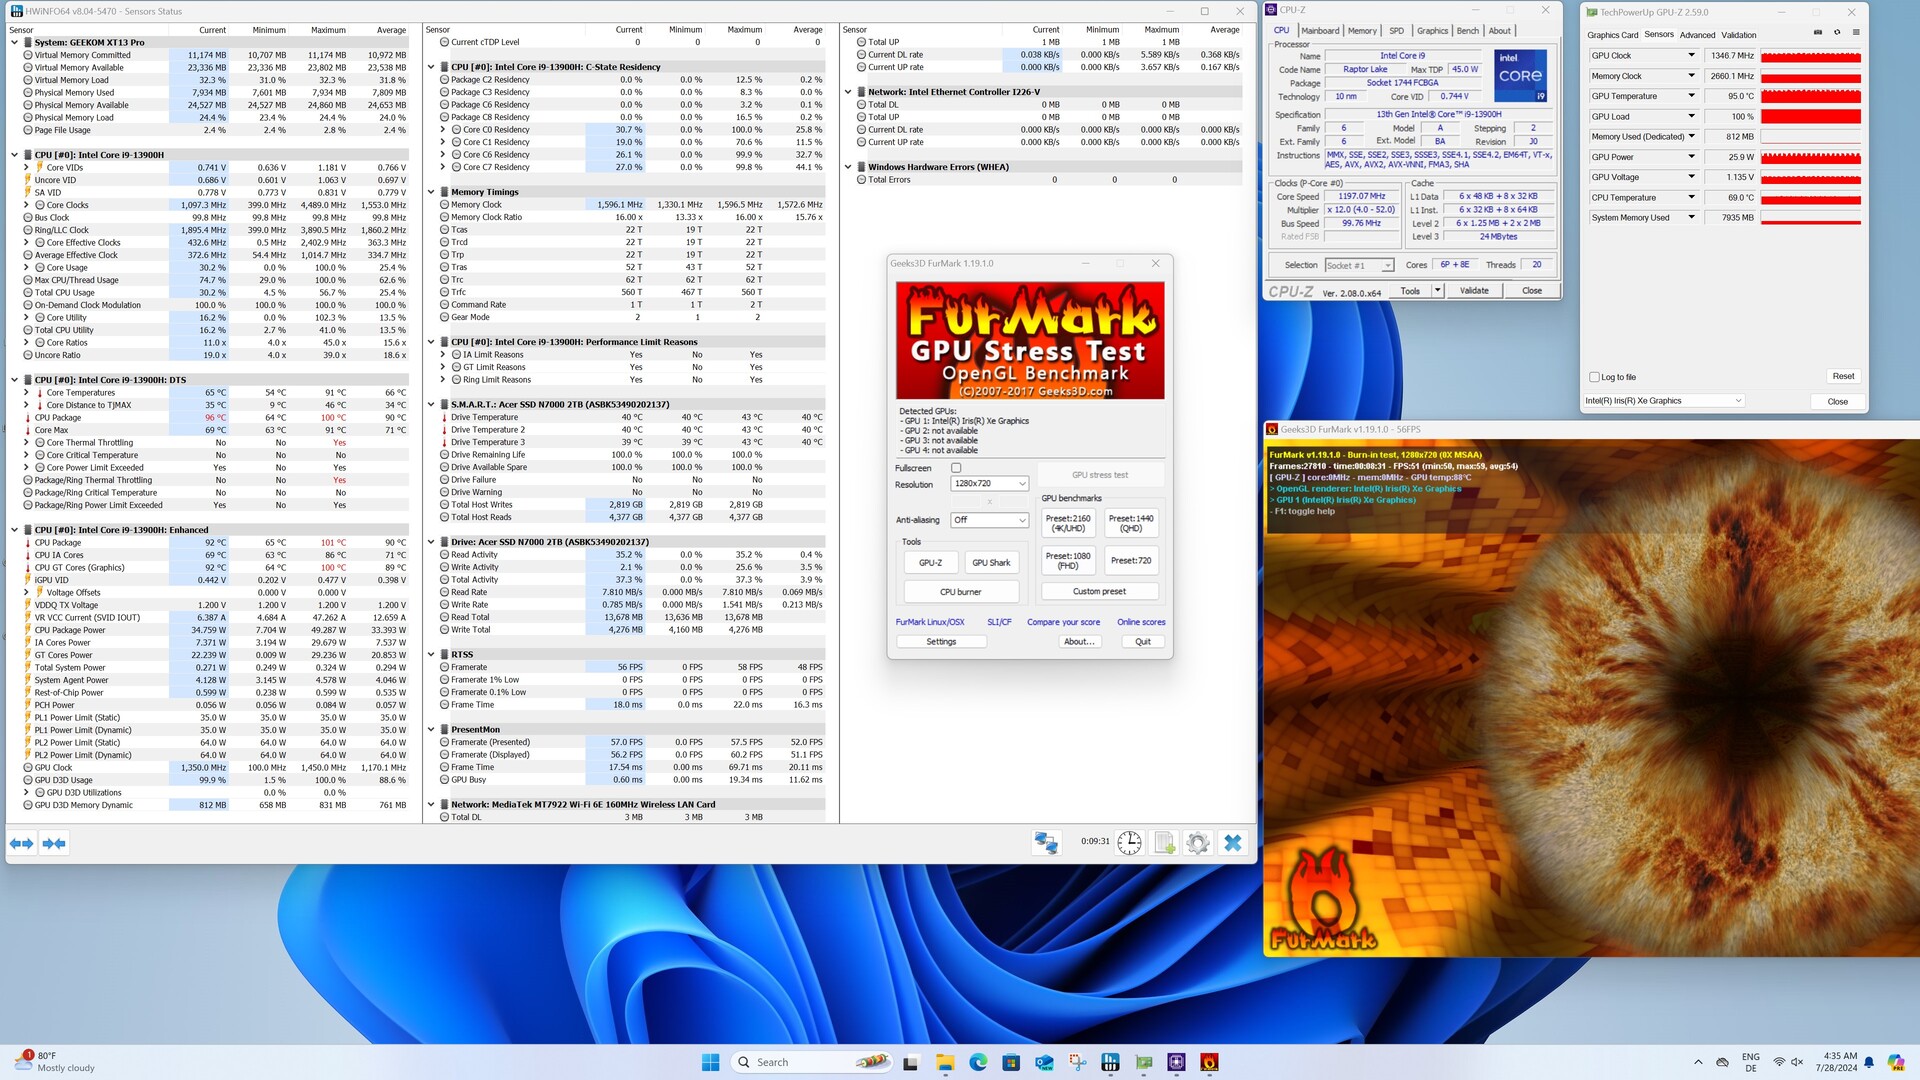
Grafikler
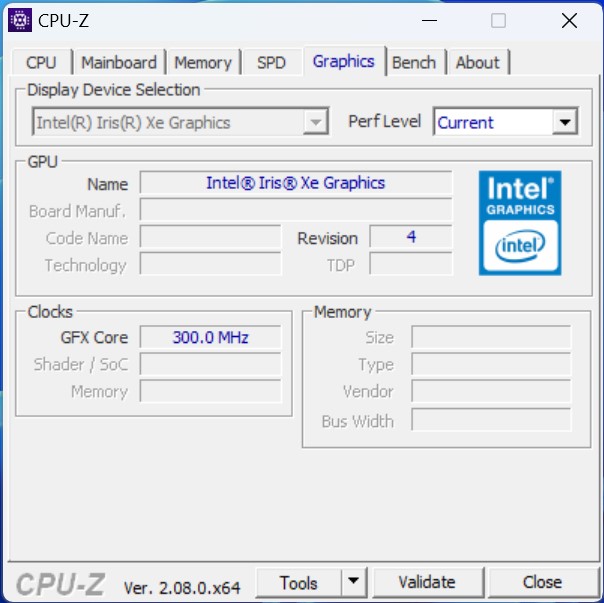
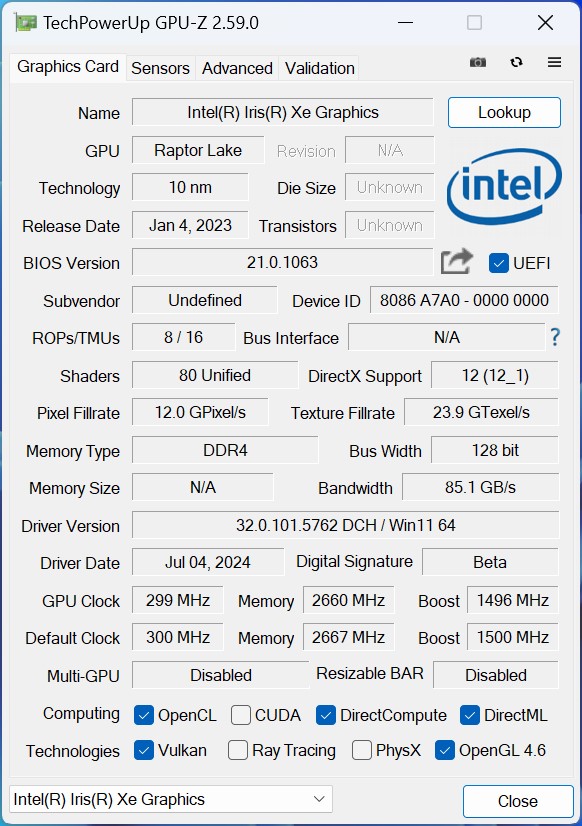
Bu Intel Iris Xe Graphics G7 3D hesaplamaları yapar ve görüntü çıktısından sorumludur. 96 EU ile Intel Core i9-13900H serideki en hızlı modeldir. Bununla birlikte, modası geçmiş model modern temsilciler karşısında kendini göstermekte zorlanıyor. Geekom, XT13 Pro'ya bir Meteor Lake SoC takma adımını atmaya cesaret etseydi, 3D performansında açıkça fark edilir bir artış beklenebilirdi. Intel Arc 8 çekirdekli iGPU'nun performansı karşılaştırma verilerinde mükemmel bir şekilde görülebiliyor. Bu arada, sisteme bir AMD Radeon 780M takılırsa daha da fazla 3D performansı elde edersiniz. Geekom'un kendisi şu anda bu iGPU'ya sahip birkaç cihaz sunuyor, bu da üreticinin bu disiplinde hayatı kendisi için zorlaştırdığı anlamına geliyor. Bunun bir örneği de Geekom A7, the Geekom A8veya Geekom AE7.
Daha fazla karşılaştırma ve kıyaslama için GPU karşılaştırma tablosu.
| 3DMark Performance Rating - Percent | |
| Geekom A7 | |
| Aoostar GEM12 | |
| Acemagic F2A | |
| Minisforum AtomMan X7 Ti | |
| Geekom XT13 Pro | |
| Geekom XT12 Pro | |
| 3DMark 11 - 1280x720 Performance GPU | |
| Geekom A7 | |
| Aoostar GEM12 | |
| Acemagic F2A | |
| Minisforum AtomMan X7 Ti | |
| Geekom XT13 Pro | |
| Geekom XT12 Pro | |
| 3DMark | |
| 2560x1440 Time Spy Graphics | |
| Acemagic F2A | |
| Minisforum AtomMan X7 Ti | |
| Geekom A7 | |
| Aoostar GEM12 | |
| Geekom XT13 Pro | |
| Geekom XT12 Pro | |
| 1920x1080 Fire Strike Graphics | |
| Geekom A7 | |
| Aoostar GEM12 | |
| Acemagic F2A | |
| Minisforum AtomMan X7 Ti | |
| Geekom XT13 Pro | |
| Geekom XT12 Pro | |
| Unigine Heaven 4.0 | |
| Extreme Preset OpenGL | |
| Aoostar GEM12 | |
| Acemagic F2A | |
| Minisforum AtomMan X7 Ti | |
| Geekom A7 | |
| Geekom XT13 Pro | |
| Geekom XT12 Pro | |
| Extreme Preset DX11 | |
| Aoostar GEM12 | |
| Minisforum AtomMan X7 Ti | |
| Acemagic F2A | |
| Geekom A7 | |
| Geekom XT13 Pro | |
| Geekom XT12 Pro | |
| Unigine Valley 1.0 | |
| 1920x1080 Extreme HD DirectX AA:x8 | |
| Aoostar GEM12 | |
| Minisforum AtomMan X7 Ti | |
| Geekom A7 | |
| Acemagic F2A | |
| Geekom XT13 Pro | |
| Geekom XT12 Pro | |
| 1920x1080 Extreme HD Preset OpenGL AA:x8 | |
| Minisforum AtomMan X7 Ti | |
| Aoostar GEM12 | |
| Acemagic F2A | |
| Geekom XT13 Pro | |
| Geekom XT12 Pro | |
| Geekom A7 | |
| Unigine Superposition | |
| 1280x720 720p Low | |
| Aoostar GEM12 | |
| Acemagic F2A | |
| Minisforum AtomMan X7 Ti | |
| Geekom A7 | |
| Geekom XT13 Pro | |
| Geekom XT12 Pro | |
| 1920x1080 1080p High | |
| Aoostar GEM12 | |
| Acemagic F2A | |
| Minisforum AtomMan X7 Ti | |
| Geekom A7 | |
| Geekom XT13 Pro | |
| Geekom XT12 Pro | |
| 1920x1080 1080p Extreme | |
| Acemagic F2A | |
| Minisforum AtomMan X7 Ti | |
| Aoostar GEM12 | |
| Geekom A7 | |
| Geekom XT13 Pro | |
| Geekom XT12 Pro | |
| ComputeMark v2.1 | |
| 1024x600 Normal, Score | |
| Geekom A7 | |
| Aoostar GEM12 | |
| Acemagic F2A | |
| Minisforum AtomMan X7 Ti | |
| Geekom XT13 Pro | |
| Geekom XT12 Pro | |
| 1024x600 Normal, Fluid 3DTex | |
| Aoostar GEM12 | |
| Geekom A7 | |
| Minisforum AtomMan X7 Ti | |
| Acemagic F2A | |
| Geekom XT13 Pro | |
| Geekom XT12 Pro | |
| 1024x600 Normal, Fluid 2DTexArr | |
| Geekom A7 | |
| Aoostar GEM12 | |
| Minisforum AtomMan X7 Ti | |
| Acemagic F2A | |
| Geekom XT13 Pro | |
| Geekom XT12 Pro | |
| 1024x600 Normal, Mandel Vector | |
| Geekom A7 | |
| Aoostar GEM12 | |
| Acemagic F2A | |
| Minisforum AtomMan X7 Ti | |
| Geekom XT12 Pro | |
| Geekom XT13 Pro | |
| 1024x600 Normal, Mandel Scalar | |
| Geekom A7 | |
| Aoostar GEM12 | |
| Acemagic F2A | |
| Minisforum AtomMan X7 Ti | |
| Geekom XT12 Pro | |
| Geekom XT13 Pro | |
| 1024x600 Normal, QJuliaRayTrace | |
| Geekom A7 | |
| Aoostar GEM12 | |
| Acemagic F2A | |
| Minisforum AtomMan X7 Ti | |
| Geekom XT13 Pro | |
| Geekom XT12 Pro | |
| LuxMark v2.0 64Bit | |
| Room GPUs-only | |
| Geekom A7 | |
| Aoostar GEM12 | |
| Minisforum AtomMan X7 Ti | |
| Geekom XT13 Pro | |
| Acemagic F2A | |
| Sala GPUs-only | |
| Minisforum AtomMan X7 Ti | |
| Acemagic F2A | |
| Geekom XT13 Pro | |
| Geekom A7 | |
| Aoostar GEM12 | |
| Affinity Photo 2 - Combined (Single / Multi GPU) | |
| Minisforum AtomMan X7 Ti | |
| Acemagic F2A | |
| Geekom XT13 Pro | |
| Geekom XT12 Pro | |
| Aoostar GEM12 | |
| Geekom A7 | |
| Geekom XT13 Pro, Intel Iris Xe Graphics G7 96EUs i9-13900H | Aoostar GEM12, AMD Radeon 780M R7 8845HS | Minisforum AtomMan X7 Ti, Intel Arc 8-Core iGPU Ultra 9 185H | Acemagic F2A, Intel Arc 8-Core iGPU Ultra 7 155H | Geekom XT12 Pro, Intel Iris Xe Graphics G7 96EUs i9-12900H | Geekom A7, AMD Radeon 780M R9 7940HS | Sınıf ortalaması Mini PC | |
|---|---|---|---|---|---|---|---|
| SPECviewperf 2020 | 309% | 36% | 25% | -4% | 278% | 188% | |
| 3840x2160 Medical (medical-03) | 3.63 | 11.2 209% | 4.23 17% | 5.05 39% | 3.49 -4% | 11.1 206% | 7.95 ? 119% |
| 3840x2160 Energy (energy-03) | 3.15 | 19.9 532% | 6.03 91% | 4.61 46% | 3.05 -3% | 14.1 348% | 11.4 ? 262% |
| 3840x2160 Creo (creo-03) | 16 | 33.4 109% | 18.5 16% | 17.9 12% | 14.8 -7% | 31.4 96% | 30.1 ? 88% |
| 3840x2160 CATIA (catia-06) | 7.9 | 23.2 194% | 11.1 41% | 10 27% | 7.78 -2% | 24.8 214% | 18.3 ? 132% |
| 3840x2160 3ds Max (3dsmax-07) | 10.3 | 20.4 98% | 14.9 45% | 12.9 25% | 9.69 -6% | 20.9 103% | 22.1 ? 115% |
| 3840x2160 Siemens NX (snx-04) | 6.13 | 64.1 946% | 6.24 2% | 5.7 -7% | 6.29 3% | 61.4 902% | 36.3 ? 492% |
| 3840x2160 Maya (maya-06) | 26.8 | 47.7 78% | 37.7 41% | 35.4 32% | 23.9 -11% | 47 75% | 56.6 ? 111% |
| 3DMark 05 Standard | 29045 puan | |
| 3DMark 06 Score 1366x768 | 30156 puan | |
| 3DMark Vantage P Result | 28599 puan | |
| 3DMark 11 Performance | 8024 puan | |
| 3DMark Ice Storm Standard Score | 155640 puan | |
| 3DMark Cloud Gate Standard Score | 28112 puan | |
| 3DMark Fire Strike Score | 5448 puan | |
| 3DMark Fire Strike Extreme Score | 2570 puan | |
| 3DMark Time Spy Score | 1920 puan | |
| 3DMark Steel Nomad Score | 183 puan | |
| 3DMark Steel Nomad Light Score | 1276 puan | |
Yardım | ||
Oyun performansı
Intel Iris Xe iGPU çoğu oyunla başa çıkamıyor. Yaşlı iGPU, yalnızca düşük çözünürlüklerde ve düşük veya orta grafik ön ayarında yeterli kare hızlarına ulaşır. Geekom XT13 Pro'yu hala oyun oynamak için kullanmak istiyorsanız, harici bir grafik kartı ile dolambaçlı yoldan gitmeniz gerekir. Cihaz ile USB4 üzerinden çeşitli modeller kullanılabiliyor.
| Dota 2 Reborn | |
| 1280x720 min (0/3) fastest | |
| Geekom A7 | |
| Aoostar GEM12 | |
| Geekom XT13 Pro | |
| Minisforum AtomMan X7 Ti | |
| Geekom XT12 Pro | |
| Acemagic F2A | |
| 1920x1080 high (2/3) | |
| Geekom A7 | |
| Aoostar GEM12 | |
| Minisforum AtomMan X7 Ti | |
| Acemagic F2A | |
| Geekom XT13 Pro | |
| Geekom XT12 Pro | |
| GTA V | |
| 1024x768 Lowest Settings possible | |
| Geekom A7 | |
| Aoostar GEM12 | |
| Minisforum AtomMan X7 Ti | |
| Acemagic F2A | |
| Geekom XT13 Pro | |
| 1920x1080 High/On (Advanced Graphics Off) AA:2xMSAA + FX AF:8x | |
| Geekom A7 | |
| Aoostar GEM12 | |
| Minisforum AtomMan X7 Ti | |
| Acemagic F2A | |
| Geekom XT13 Pro | |
| Cyberpunk 2077 2.2 Phantom Liberty | |
| 1920x1080 Low Preset (FSR off) | |
| Aoostar GEM12 | |
| Minisforum AtomMan X7 Ti | |
| Acemagic F2A | |
| Geekom XT13 Pro | |
| Geekom XT12 Pro | |
| 1920x1080 High Preset (FSR off) | |
| Aoostar GEM12 | |
| Minisforum AtomMan X7 Ti | |
| Acemagic F2A | |
| Geekom XT13 Pro | |
| Geekom XT12 Pro | |
| Baldur's Gate 3 | |
| 1280x720 Low Preset | |
| Aoostar GEM12 | |
| Minisforum AtomMan X7 Ti | |
| Geekom XT13 Pro | |
| 1920x1080 High Preset | |
| Aoostar GEM12 | |
| Minisforum AtomMan X7 Ti | |
| Geekom XT13 Pro | |
| F1 24 | |
| 1920x1080 Low Preset AA:T AF:16x | |
| Minisforum AtomMan X7 Ti | |
| Geekom XT13 Pro | |
| 1920x1080 High Preset AA:T AF:16x | |
| Minisforum AtomMan X7 Ti | |
| Geekom XT13 Pro | |
FPS chart
| düşük | orta | yüksek | ultra | |
|---|---|---|---|---|
| GTA V (2015) | 123.5 | 105.9 | 22.1 | 9 |
| Dota 2 Reborn (2015) | 117.2 | 82.9 | 72.5 | 66.5 |
| Final Fantasy XV Benchmark (2018) | 46 | 25.7 | 18.2 | |
| Baldur's Gate 3 (2023) | 19.9 | 15.4 | 13.5 | 13 |
| Cyberpunk 2077 2.2 Phantom Liberty (2023) | 18.6 | 15 | 13 | 11.4 |
| F1 24 (2024) | 43.1 | 37.3 | 26.7 |
Nvidia GeForce RTX 3060 Ti ile Geekom XT13 Pro performans kontrolü
Geekom XT13 Pro, harici grafik kartlarının kullanımını destekleyen iki USB4 portuna sahiptir. Genel sonucu etkilemeden, Razer Core X ve bir Nvidia GeForce RTX 3060 Ti ile bazı testler gerçekleştirdik. Intel Core i9-13900H'nin yaşlı iGPU'su ile karşılaştırıldığında, 3D performansı büyük ölçüde artırılabilir. Diğer test cihazlarıyla yapılan karşılaştırma, sentetik testlerde neredeyse aynı sonucu gösteriyor. Test edilen oyunlardan da görülebileceği gibi, oyun performansı da bu kombinasyonla önemli ölçüde artırılabilir. Bazen en modern oyunların bile tüm ayrıntılarıyla keyfini çıkarabilirsiniz.
| Performance Rating - Percent | |
| Geekom AE7 (Nvidia GeForce RTX 3060 Ti FE) | |
| Geekom A8 (Nvidia GeForce RTX 3060 Ti FE) | |
| Geekom GT13 Pro (Nvidia GeForce RTX 3060 Ti FE) | |
| Geekom XT13 Pro (Nvidia GeForce RTX 3060 Ti FE) | |
| Geekom XT12 Pro (Nvidia GeForce RTX 3060 Ti FE) | |
| Minisforum UH125 Pro (Nvidia GeForce RTX 3060 Ti FE) | |
| 3DMark 11 - 1280x720 Performance GPU | |
| Geekom A8 (Nvidia GeForce RTX 3060 Ti FE) | |
| Geekom AE7 (Nvidia GeForce RTX 3060 Ti FE) | |
| Geekom XT13 Pro (Nvidia GeForce RTX 3060 Ti FE) | |
| Geekom GT13 Pro (Nvidia GeForce RTX 3060 Ti FE) | |
| Geekom XT12 Pro (Nvidia GeForce RTX 3060 Ti FE) | |
| Minisforum UH125 Pro (Nvidia GeForce RTX 3060 Ti FE) | |
| 3DMark | |
| 2560x1440 Time Spy Graphics | |
| Geekom A8 (Nvidia GeForce RTX 3060 Ti FE) | |
| Geekom AE7 (Nvidia GeForce RTX 3060 Ti FE) | |
| Geekom XT13 Pro (Nvidia GeForce RTX 3060 Ti FE) | |
| Geekom GT13 Pro (Nvidia GeForce RTX 3060 Ti FE) | |
| Geekom XT12 Pro (Nvidia GeForce RTX 3060 Ti FE) | |
| Minisforum UH125 Pro (Nvidia GeForce RTX 3060 Ti FE) | |
| 1920x1080 Fire Strike Graphics | |
| Geekom AE7 (Nvidia GeForce RTX 3060 Ti FE) | |
| Geekom GT13 Pro (Nvidia GeForce RTX 3060 Ti FE) | |
| Geekom A8 (Nvidia GeForce RTX 3060 Ti FE) | |
| Geekom XT13 Pro (Nvidia GeForce RTX 3060 Ti FE) | |
| Minisforum UH125 Pro (Nvidia GeForce RTX 3060 Ti FE) | |
| Geekom XT12 Pro (Nvidia GeForce RTX 3060 Ti FE) | |
| 3840x2160 Fire Strike Ultra Graphics | |
| Geekom GT13 Pro (Nvidia GeForce RTX 3060 Ti FE) | |
| Geekom AE7 (Nvidia GeForce RTX 3060 Ti FE) | |
| Geekom XT12 Pro (Nvidia GeForce RTX 3060 Ti FE) | |
| Geekom XT13 Pro (Nvidia GeForce RTX 3060 Ti FE) | |
| Geekom A8 (Nvidia GeForce RTX 3060 Ti FE) | |
| Minisforum UH125 Pro (Nvidia GeForce RTX 3060 Ti FE) | |
| Unigine Superposition | |
| 1280x720 720p Low | |
| Geekom AE7 (Nvidia GeForce RTX 3060 Ti FE) | |
| Geekom GT13 Pro (Nvidia GeForce RTX 3060 Ti FE) | |
| Geekom A8 (Nvidia GeForce RTX 3060 Ti FE) | |
| Geekom XT13 Pro (Nvidia GeForce RTX 3060 Ti FE) | |
| Geekom XT12 Pro (Nvidia GeForce RTX 3060 Ti FE) | |
| Minisforum UH125 Pro (Nvidia GeForce RTX 3060 Ti FE) | |
| 1920x1080 1080p High | |
| Geekom GT13 Pro (Nvidia GeForce RTX 3060 Ti FE) | |
| Geekom A8 (Nvidia GeForce RTX 3060 Ti FE) | |
| Geekom AE7 (Nvidia GeForce RTX 3060 Ti FE) | |
| Geekom XT13 Pro (Nvidia GeForce RTX 3060 Ti FE) | |
| Minisforum UH125 Pro (Nvidia GeForce RTX 3060 Ti FE) | |
| Geekom XT12 Pro (Nvidia GeForce RTX 3060 Ti FE) | |
| 1920x1080 1080p Extreme | |
| Geekom GT13 Pro (Nvidia GeForce RTX 3060 Ti FE) | |
| Geekom XT13 Pro (Nvidia GeForce RTX 3060 Ti FE) | |
| Geekom XT12 Pro (Nvidia GeForce RTX 3060 Ti FE) | |
| Minisforum UH125 Pro (Nvidia GeForce RTX 3060 Ti FE) | |
| Geekom A8 (Nvidia GeForce RTX 3060 Ti FE) | |
| Geekom AE7 (Nvidia GeForce RTX 3060 Ti FE) | |
| 3840x2160 4k Optimized | |
| Geekom GT13 Pro (Nvidia GeForce RTX 3060 Ti FE) | |
| Geekom XT13 Pro (Nvidia GeForce RTX 3060 Ti FE) | |
| Geekom XT12 Pro (Nvidia GeForce RTX 3060 Ti FE) | |
| Geekom A8 (Nvidia GeForce RTX 3060 Ti FE) | |
| Minisforum UH125 Pro (Nvidia GeForce RTX 3060 Ti FE) | |
| Geekom AE7 (Nvidia GeForce RTX 3060 Ti FE) | |
| 7680x4320 8k Optimized | |
| Geekom GT13 Pro (Nvidia GeForce RTX 3060 Ti FE) | |
| Geekom XT13 Pro (Nvidia GeForce RTX 3060 Ti FE) | |
| Geekom XT12 Pro (Nvidia GeForce RTX 3060 Ti FE) | |
| Minisforum UH125 Pro (Nvidia GeForce RTX 3060 Ti FE) | |
| Geekom A8 (Nvidia GeForce RTX 3060 Ti FE) | |
| Geekom AE7 (Nvidia GeForce RTX 3060 Ti FE) | |
| Unigine Valley 1.0 | |
| 1920x1080 Extreme HD DirectX AA:x8 | |
| Geekom XT12 Pro (Nvidia GeForce RTX 3060 Ti FE) | |
| Geekom GT13 Pro (Nvidia GeForce RTX 3060 Ti FE) | |
| Geekom XT13 Pro (Nvidia GeForce RTX 3060 Ti FE) | |
| Geekom A8 (Nvidia GeForce RTX 3060 Ti FE) | |
| Geekom AE7 (Nvidia GeForce RTX 3060 Ti FE) | |
| Minisforum UH125 Pro (Nvidia GeForce RTX 3060 Ti FE) | |
| 1920x1080 Extreme HD Preset OpenGL AA:x8 | |
| Geekom GT13 Pro (Nvidia GeForce RTX 3060 Ti FE) | |
| Geekom XT12 Pro (Nvidia GeForce RTX 3060 Ti FE) | |
| Geekom XT13 Pro (Nvidia GeForce RTX 3060 Ti FE) | |
| Geekom A8 (Nvidia GeForce RTX 3060 Ti FE) | |
| Geekom AE7 (Nvidia GeForce RTX 3060 Ti FE) | |
| Minisforum UH125 Pro (Nvidia GeForce RTX 3060 Ti FE) | |
| Unigine Heaven 4.0 | |
| Extreme Preset OpenGL | |
| Geekom A8 (Nvidia GeForce RTX 3060 Ti FE) | |
| Geekom AE7 (Nvidia GeForce RTX 3060 Ti FE) | |
| Geekom GT13 Pro (Nvidia GeForce RTX 3060 Ti FE) | |
| Geekom XT13 Pro (Nvidia GeForce RTX 3060 Ti FE) | |
| Minisforum UH125 Pro (Nvidia GeForce RTX 3060 Ti FE) | |
| Geekom XT12 Pro (Nvidia GeForce RTX 3060 Ti FE) | |
| Extreme Preset DX11 | |
| Geekom XT13 Pro (Nvidia GeForce RTX 3060 Ti FE) | |
| Geekom GT13 Pro (Nvidia GeForce RTX 3060 Ti FE) | |
| Geekom A8 (Nvidia GeForce RTX 3060 Ti FE) | |
| Geekom XT12 Pro (Nvidia GeForce RTX 3060 Ti FE) | |
| Geekom AE7 (Nvidia GeForce RTX 3060 Ti FE) | |
| Minisforum UH125 Pro (Nvidia GeForce RTX 3060 Ti FE) | |
| ComputeMark v2.1 | |
| 1024x600 Normal, Score | |
| Geekom GT13 Pro (Nvidia GeForce RTX 3060 Ti FE) | |
| Geekom AE7 (Nvidia GeForce RTX 3060 Ti FE) | |
| Geekom A8 (Nvidia GeForce RTX 3060 Ti FE) | |
| Geekom XT13 Pro (Nvidia GeForce RTX 3060 Ti FE) | |
| Minisforum UH125 Pro (Nvidia GeForce RTX 3060 Ti FE) | |
| Geekom XT12 Pro (Nvidia GeForce RTX 3060 Ti FE) | |
| 1024x600 Normal, Fluid 3DTex | |
| Geekom GT13 Pro (Nvidia GeForce RTX 3060 Ti FE) | |
| Geekom AE7 (Nvidia GeForce RTX 3060 Ti FE) | |
| Minisforum UH125 Pro (Nvidia GeForce RTX 3060 Ti FE) | |
| Geekom A8 (Nvidia GeForce RTX 3060 Ti FE) | |
| Geekom XT13 Pro (Nvidia GeForce RTX 3060 Ti FE) | |
| Geekom XT12 Pro (Nvidia GeForce RTX 3060 Ti FE) | |
| 1024x600 Normal, Fluid 2DTexArr | |
| Geekom GT13 Pro (Nvidia GeForce RTX 3060 Ti FE) | |
| Geekom AE7 (Nvidia GeForce RTX 3060 Ti FE) | |
| Minisforum UH125 Pro (Nvidia GeForce RTX 3060 Ti FE) | |
| Geekom A8 (Nvidia GeForce RTX 3060 Ti FE) | |
| Geekom XT13 Pro (Nvidia GeForce RTX 3060 Ti FE) | |
| Geekom XT12 Pro (Nvidia GeForce RTX 3060 Ti FE) | |
| 1024x600 Normal, Mandel Vector | |
| Geekom GT13 Pro (Nvidia GeForce RTX 3060 Ti FE) | |
| Geekom AE7 (Nvidia GeForce RTX 3060 Ti FE) | |
| Geekom A8 (Nvidia GeForce RTX 3060 Ti FE) | |
| Geekom XT13 Pro (Nvidia GeForce RTX 3060 Ti FE) | |
| Minisforum UH125 Pro (Nvidia GeForce RTX 3060 Ti FE) | |
| Geekom XT12 Pro (Nvidia GeForce RTX 3060 Ti FE) | |
| 1024x600 Normal, Mandel Scalar | |
| Geekom GT13 Pro (Nvidia GeForce RTX 3060 Ti FE) | |
| Geekom AE7 (Nvidia GeForce RTX 3060 Ti FE) | |
| Geekom A8 (Nvidia GeForce RTX 3060 Ti FE) | |
| Geekom XT13 Pro (Nvidia GeForce RTX 3060 Ti FE) | |
| Minisforum UH125 Pro (Nvidia GeForce RTX 3060 Ti FE) | |
| Geekom XT12 Pro (Nvidia GeForce RTX 3060 Ti FE) | |
| 1024x600 Normal, QJuliaRayTrace | |
| Geekom GT13 Pro (Nvidia GeForce RTX 3060 Ti FE) | |
| Geekom AE7 (Nvidia GeForce RTX 3060 Ti FE) | |
| Geekom A8 (Nvidia GeForce RTX 3060 Ti FE) | |
| Geekom XT13 Pro (Nvidia GeForce RTX 3060 Ti FE) | |
| Minisforum UH125 Pro (Nvidia GeForce RTX 3060 Ti FE) | |
| Geekom XT12 Pro (Nvidia GeForce RTX 3060 Ti FE) | |
| Photoshop PugetBench - GPU Score | |
| Geekom A8 (Nvidia GeForce RTX 3060 Ti FE) | |
| Geekom AE7 (Nvidia GeForce RTX 3060 Ti FE) | |
| Geekom XT12 Pro (Nvidia GeForce RTX 3060 Ti FE) | |
| Geekom GT13 Pro (Nvidia GeForce RTX 3060 Ti FE) | |
| Minisforum UH125 Pro (Nvidia GeForce RTX 3060 Ti FE) | |
| Geekom XT13 Pro (Nvidia GeForce RTX 3060 Ti FE) | |
| Premiere Pro PugetBench - GPU 0.9 | |
| Geekom A8 (Nvidia GeForce RTX 3060 Ti FE) | |
| Geekom AE7 (Nvidia GeForce RTX 3060 Ti FE) | |
| Geekom GT13 Pro (Nvidia GeForce RTX 3060 Ti FE) | |
| Minisforum UH125 Pro (Nvidia GeForce RTX 3060 Ti FE) | |
| Geekom XT13 Pro (Nvidia GeForce RTX 3060 Ti FE) | |
| Geekom XT12 Pro (Nvidia GeForce RTX 3060 Ti FE) | |
| Cyberpunk 2077 2.2 Phantom Liberty | |
| 1280x720 Low Preset (FSR off) | |
| Geekom AE7 (Nvidia GeForce RTX 3060 Ti FE) | |
| Geekom A8 (Nvidia GeForce RTX 3060 Ti FE) | |
| Geekom XT13 Pro (Nvidia GeForce RTX 3060 Ti FE) | |
| Geekom GT13 Pro (Nvidia GeForce RTX 3060 Ti FE) | |
| Geekom XT12 Pro (Nvidia GeForce RTX 3060 Ti FE) | |
| Minisforum UH125 Pro (Nvidia GeForce RTX 3060 Ti FE) | |
| Geekom XT13 Pro | |
| 1920x1080 Medium Preset (FSR off) | |
| Geekom AE7 (Nvidia GeForce RTX 3060 Ti FE) | |
| Geekom XT13 Pro (Nvidia GeForce RTX 3060 Ti FE) | |
| Geekom A8 (Nvidia GeForce RTX 3060 Ti FE) | |
| Geekom GT13 Pro (Nvidia GeForce RTX 3060 Ti FE) | |
| Geekom XT12 Pro (Nvidia GeForce RTX 3060 Ti FE) | |
| Minisforum UH125 Pro (Nvidia GeForce RTX 3060 Ti FE) | |
| Geekom XT13 Pro | |
| 1920x1080 Ultra Preset (FSR off) | |
| Geekom AE7 (Nvidia GeForce RTX 3060 Ti FE) | |
| Geekom XT13 Pro (Nvidia GeForce RTX 3060 Ti FE) | |
| Geekom GT13 Pro (Nvidia GeForce RTX 3060 Ti FE) | |
| Geekom A8 (Nvidia GeForce RTX 3060 Ti FE) | |
| Geekom XT12 Pro (Nvidia GeForce RTX 3060 Ti FE) | |
| Minisforum UH125 Pro (Nvidia GeForce RTX 3060 Ti FE) | |
| Geekom XT13 Pro | |
| Baldur's Gate 3 | |
| 1920x1080 Low Preset | |
| Geekom GT13 Pro (Nvidia GeForce RTX 3060 Ti FE) | |
| Geekom XT12 Pro (Nvidia GeForce RTX 3060 Ti FE) | |
| Geekom XT13 Pro (Nvidia GeForce RTX 3060 Ti FE) | |
| Geekom AE7 (Nvidia GeForce RTX 3060 Ti FE) | |
| Geekom A8 (Nvidia GeForce RTX 3060 Ti FE) | |
| Minisforum UH125 Pro (Nvidia GeForce RTX 3060 Ti FE) | |
| Geekom XT13 Pro | |
| 1920x1080 Medium Preset | |
| Geekom XT13 Pro (Nvidia GeForce RTX 3060 Ti FE) | |
| Geekom GT13 Pro (Nvidia GeForce RTX 3060 Ti FE) | |
| Geekom A8 (Nvidia GeForce RTX 3060 Ti FE) | |
| Geekom XT12 Pro (Nvidia GeForce RTX 3060 Ti FE) | |
| Geekom AE7 (Nvidia GeForce RTX 3060 Ti FE) | |
| Minisforum UH125 Pro (Nvidia GeForce RTX 3060 Ti FE) | |
| Geekom XT13 Pro | |
| 1920x1080 Ultra Preset | |
| Geekom GT13 Pro (Nvidia GeForce RTX 3060 Ti FE) | |
| Geekom XT13 Pro (Nvidia GeForce RTX 3060 Ti FE) | |
| Geekom A8 (Nvidia GeForce RTX 3060 Ti FE) | |
| Geekom XT12 Pro (Nvidia GeForce RTX 3060 Ti FE) | |
| Geekom AE7 (Nvidia GeForce RTX 3060 Ti FE) | |
| Minisforum UH125 Pro (Nvidia GeForce RTX 3060 Ti FE) | |
| Geekom XT13 Pro | |
| F1 24 | |
| 1920x1080 Low Preset AA:T AF:16x | |
| Geekom AE7 (Nvidia GeForce RTX 3060 Ti FE) | |
| Geekom A8 (Nvidia GeForce RTX 3060 Ti FE) | |
| Geekom GT13 Pro (Nvidia GeForce RTX 3060 Ti FE) | |
| Geekom XT13 Pro (Nvidia GeForce RTX 3060 Ti FE) | |
| Geekom XT12 Pro (Nvidia GeForce RTX 3060 Ti FE) | |
| Minisforum UH125 Pro (Nvidia GeForce RTX 3060 Ti FE) | |
| Geekom XT13 Pro | |
| 1920x1080 Medium Preset AA:T AF:16x | |
| Geekom A8 (Nvidia GeForce RTX 3060 Ti FE) | |
| Geekom AE7 (Nvidia GeForce RTX 3060 Ti FE) | |
| Geekom XT12 Pro (Nvidia GeForce RTX 3060 Ti FE) | |
| Geekom XT13 Pro (Nvidia GeForce RTX 3060 Ti FE) | |
| Geekom GT13 Pro (Nvidia GeForce RTX 3060 Ti FE) | |
| Minisforum UH125 Pro (Nvidia GeForce RTX 3060 Ti FE) | |
| Geekom XT13 Pro | |
| 1920x1080 Ultra High Preset AA:T AF:16x | |
| Geekom AE7 (Nvidia GeForce RTX 3060 Ti FE) | |
| Geekom A8 (Nvidia GeForce RTX 3060 Ti FE) | |
| Geekom XT13 Pro (Nvidia GeForce RTX 3060 Ti FE) | |
| Geekom GT13 Pro (Nvidia GeForce RTX 3060 Ti FE) | |
| Geekom XT12 Pro (Nvidia GeForce RTX 3060 Ti FE) | |
| Minisforum UH125 Pro (Nvidia GeForce RTX 3060 Ti FE) | |
| Geekom XT13 Pro, Intel Iris Xe Graphics G7 96EUs i9-13900H | Geekom XT13 Pro (Nvidia GeForce RTX 3060 Ti FE), i9-13900H | Geekom GT13 Pro (Nvidia GeForce RTX 3060 Ti FE), i9-13900H | Geekom XT12 Pro (Nvidia GeForce RTX 3060 Ti FE), i9-12900H | Minisforum UH125 Pro (Nvidia GeForce RTX 3060 Ti FE), Ultra 5 125H | Geekom AE7 (Nvidia GeForce RTX 3060 Ti FE), R9 7940HS | Geekom A8 (Nvidia GeForce RTX 3060 Ti FE), R9 8945HS | Sınıf ortalaması Mini PC | |
|---|---|---|---|---|---|---|---|---|
| SPECviewperf 2020 | 391% | 387% | 321% | 182% | 395% | 516% | 188% | |
| 3840x2160 Medical (medical-03) | 3.63 | 13 258% | 10.8 198% | 11.8 225% | 10.9 200% | 13 258% | 10.8 198% | 7.95 ? 119% |
| 3840x2160 Energy (energy-03) | 3.15 | 20.9 563% | 21 567% | 18.9 500% | 17.8 465% | 20.9 563% | 50.3 1497% | 11.4 ? 262% |
| 3840x2160 Creo (creo-03) | 16 | 74.2 364% | 76.4 378% | 62.7 292% | 26.6 66% | 76.8 380% | 76.6 379% | 30.1 ? 88% |
| 3840x2160 CATIA (catia-06) | 7.9 | 39.4 399% | 40.1 408% | 32.8 315% | 23.6 199% | 39.2 396% | 38.8 391% | 18.3 ? 132% |
| 3840x2160 3ds Max (3dsmax-07) | 10.3 | 47.2 358% | 47.3 359% | 40 288% | 28.7 179% | 46.5 351% | 45.9 346% | 22.1 ? 115% |
| 3840x2160 Siemens NX (snx-04) | 6.13 | 16.5 169% | 16.5 169% | 15.2 148% | 11.4 86% | 16.6 171% | 16.6 171% | 36.3 ? 492% |
| 3840x2160 Maya (maya-06) | 26.8 | 194 624% | 196 631% | 155 478% | 47.5 77% | 199 643% | 195 628% | 56.6 ? 111% |
| düşük | orta | yüksek | ultra | QHD | 4K | |
|---|---|---|---|---|---|---|
| GTA V (2015) | 182.2 | 178.4 | 170.3 | 104.2 | 92.7 | 103.4 |
| Dota 2 Reborn (2015) | 165.8 | 138.3 | 132 | 121.9 | 104.6 | |
| Final Fantasy XV Benchmark (2018) | 183.7 | 142.2 | 98.8 | 77.6 | 48.6 | |
| X-Plane 11.11 (2018) | 146.4 | 137.9 | 106.3 | 92.1 | ||
| Baldur's Gate 3 (2023) | 113 | 91.3 | 79 | 78.5 | 61.6 | 37.1 |
| Cyberpunk 2077 2.2 Phantom Liberty (2023) | 88.2 | 81.4 | 71.7 | 64.4 | 44.5 | 22.2 |
| F1 24 (2024) | 76.9 | 73.1 | 60.5 | 42.2 | 36.9 | 19.2 |
Emisyonlar - Zayıf soğutma ve düşük güç tüketimi
Gürültü emisyonları
Aynı tasarıma sahip cihazlar bile gürültü emisyonları açısından en yüksek değerlerle etkileyemedi. Bu durum en azından yük altında Geekom XT13 Pro için de geçerlidir. Mini PC boştayken çok sessiz ve neredeyse hiç duyulmuyor. Bununla birlikte, fan her zaman çalışır, bu da yarı pasif çalışmanın mümkün olmadığı anlamına gelir. Yük altında, fan zaman zaman önemli ölçüde hızlanıyor ve 49,5 dB(A)'lık bir tepe ses basıncı seviyesi ölçebildik. Ancak, maksimum ses seviyesi her zaman mevcut değildir. Stres testi sırasında fan hızı tekrar tekrar dalgalandı, böylece Geekom XT13 Pro yük altında yalnızca 38 dB(A)'ya ulaştı. Aynı olguyu ortalama yük altında da gözlemledik. Burada ölçülebilir ses seviyesi 38 ile 42,2 dB(A) arasında dalgalanıyor
Ne yazık ki Geekom XT12 Pro en sessiz cihazlardan biri değil. Cihaz sadece rölantideyken neredeyse sessiz çalışıyor, sadece sessiz bir fan sesi duyuluyor. Bu durum yük altında değişiyor, mini PC 44,2 dB(A)'ya kadar açıkça duyulabiliyor. Hatta oyun sırasında 47,2 dB(A)'ya kadar ölçüm yapabildik. Ancak, oyun sırasında kalıcı olarak yüksek bir ses basıncı seviyesi tespit edemedik. Burada sonuç 39 ile 47,2 dB(A) arasında dalgalandı.
Ses yüksekliği
| Boşta |
| 27.6 / 27.8 / 27.9 dB |
| Çalışırken |
| 42.2 / 49.5 dB |
 | ||
30 dB sessiz 40 dB(A) duyulabilirlik 50 dB(A) gürültülü |
||
min: | ||
| Geekom XT13 Pro i9-13900H, Iris Xe G7 96EUs | Aoostar GEM12 R7 8845HS, Radeon 780M | Minisforum AtomMan X7 Ti Ultra 9 185H, Arc 8-Core | Acemagic F2A Ultra 7 155H, Arc 8-Core | Geekom XT12 Pro i9-12900H, Iris Xe G7 96EUs | Geekom A7 R9 7940HS, Radeon 780M | |
|---|---|---|---|---|---|---|
| Noise | 10% | 1% | 2% | 2% | -9% | |
| kapalı / ortam * | 25 | 24.3 3% | 24.1 4% | 24.9 -0% | 25.4 -2% | 25.4 -2% |
| Idle Minimum * | 27.6 | 27.5 -0% | 29.8 -8% | 25.4 8% | 28 -1% | 33.3 -21% |
| Idle Average * | 27.8 | 27.6 1% | 29.9 -8% | 25.7 8% | 28.1 -1% | 33.6 -21% |
| Idle Maximum * | 27.9 | 27.6 1% | 30 -8% | 25.7 8% | 28.5 -2% | 33.7 -21% |
| Load Average * | 42.2 | 36 15% | 37.3 12% | 47.8 -13% | 39.6 6% | 43.3 -3% |
| Cyberpunk 2077 ultra * | 46.6 | 35.4 24% | ||||
| Load Maximum * | 49.5 | 38.2 23% | 43.5 12% | 49 1% | 44.2 11% | 43.3 13% |
| Witcher 3 ultra * | 35.4 | 40.2 | 45.23 | 47.2 | 43.2 |
* ... daha küçük daha iyidir
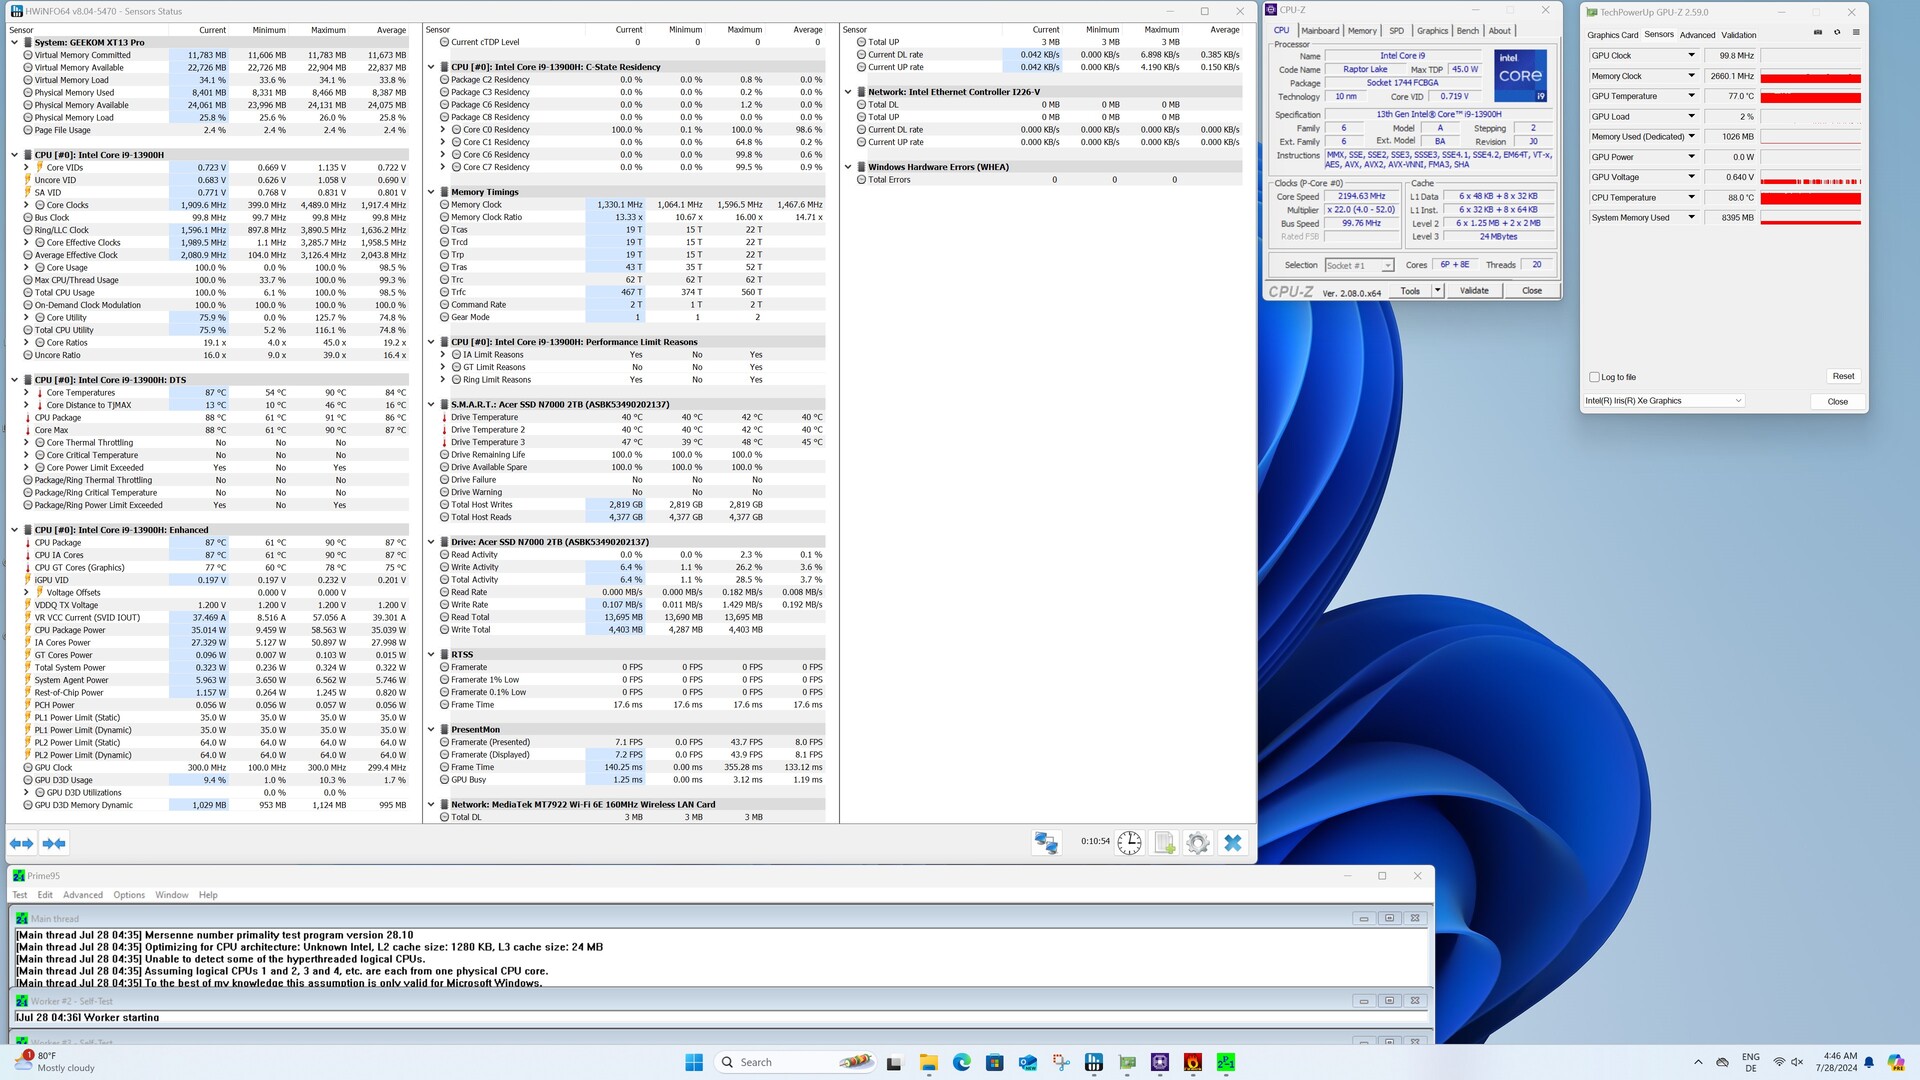
Sıcaklık
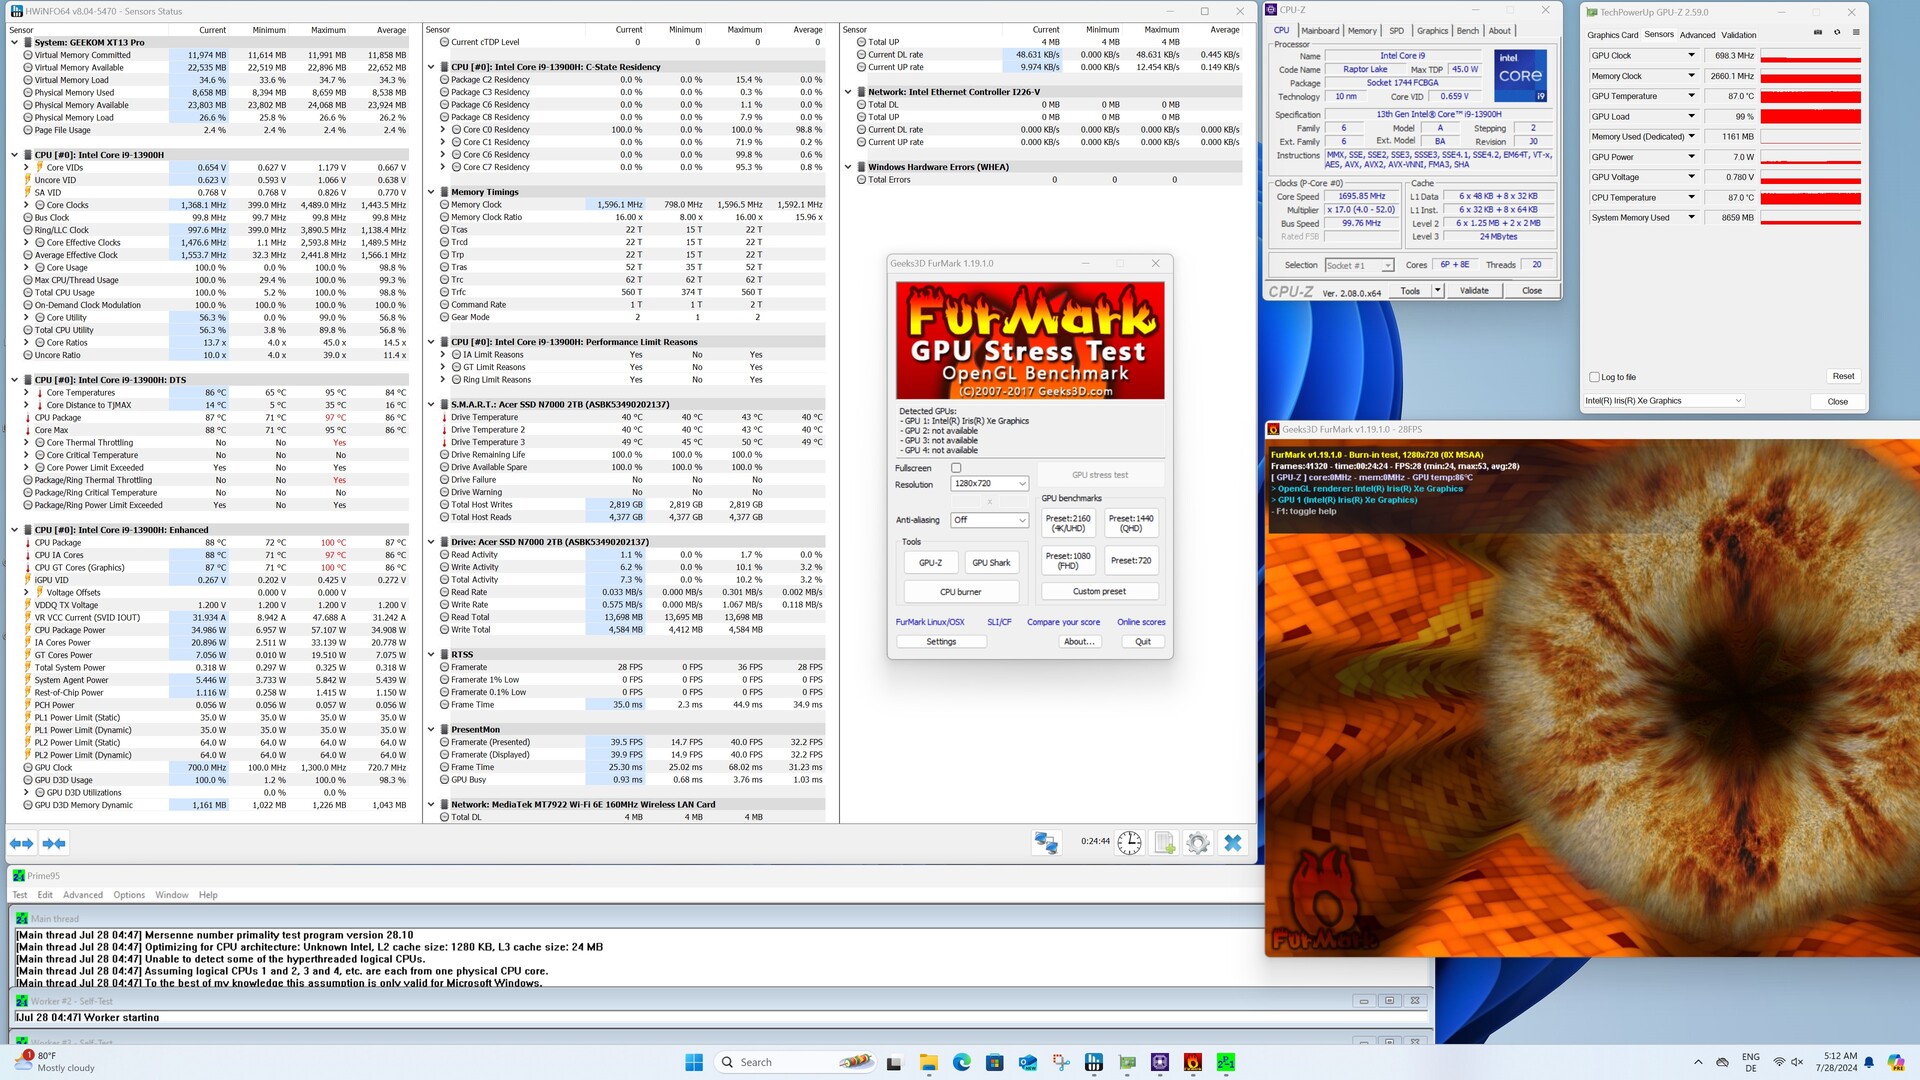
Gövde yük altında belirgin şekilde ısınır. Ancak, herhangi bir kritik değer bulamıyoruz. Geekom, yük altında hızla 100 °C'ye ulaşan maksimum sıcaklığı sınırlamadığı için SoC biraz farklı görünüyor. Cinebench R15 çoklu döngüsünün aksine, Intel Core i9-13900H stres testinde 64 watt sınırını aşmıyor. SoC çok hızlı ısınıyor ve performansın düşürülmesi gerekiyor. Daha uzun bir süre boyunca sıcaklık 90 °C civarında sabitlenir ve bu da işlemci için bir sorun teşkil etmez. Son derece kompakt tasarım, daha güçlü bir soğutma sistemi kurmayı imkansız hale getiriyor.
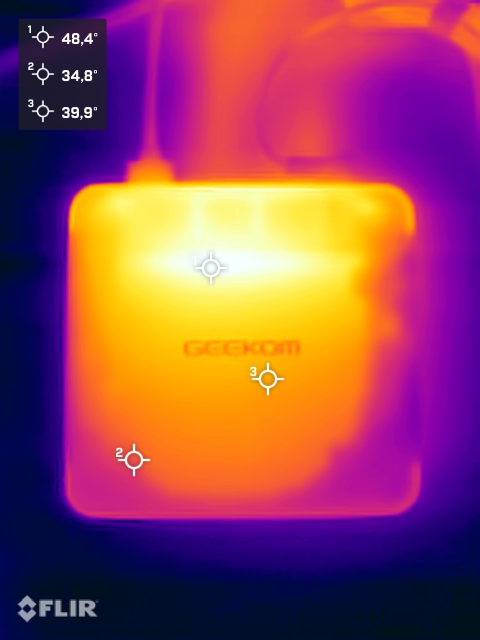
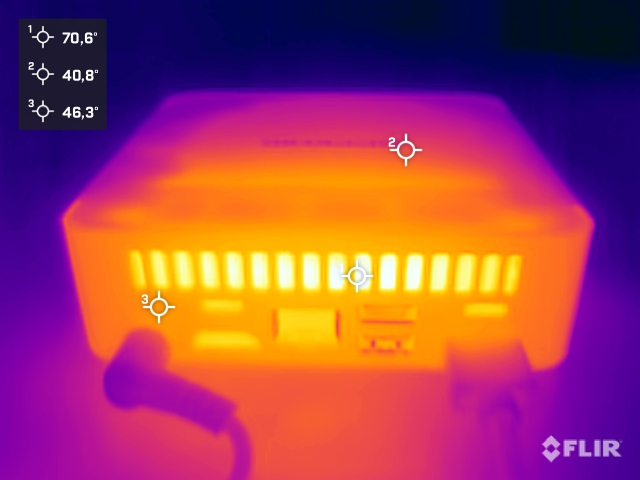
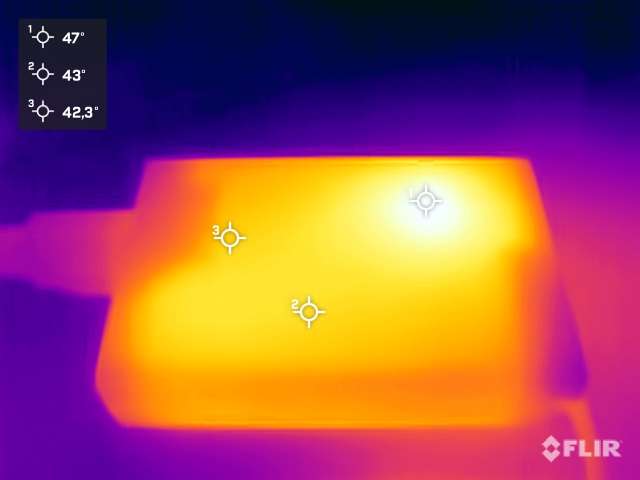
(-) Üst taraftaki maksimum sıcaklık, 35.8 °C / 96 F ortalamasına kıyasla 45.7 °C / 114 F'dir. , Mini PC sınıfı için 21.6 ile 69.5 °C arasında değişir.
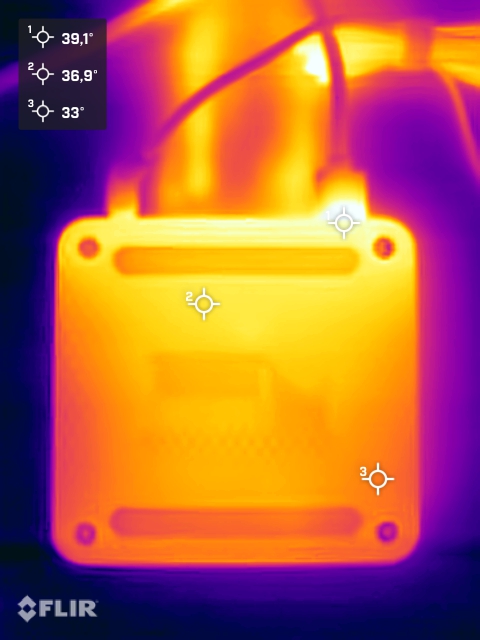
(±) Alt kısım, 36.1 °C / 97 F ortalamasına kıyasla maksimum 40.3 °C / 105 F'ye kadar ısınır
(+) Boşta kullanımda, üst tarafın ortalama sıcaklığı 27.9 °C / 82 F olup, cihazın 32.3 °C / 90 F.
Güç tüketimi
Geekom XT13 Pro'nun güç tüketimi rakipleriyle çok olumlu bir şekilde karşılaştırılıyor. Sadece boş modda bile düşük değerler ölçtük. Intel Core i9-13900H'nin düşük güç sınırları (PL1 ve PL2) yük altında nispeten düşük enerji gereksinimi sağlıyor. Ortalama yük altında sistem 50 watt'tan biraz daha az bir güçle idare ediyor. Yük altında, 94,5 watt'ı sadece sistemin Turbo'dan hala yararlanabildiği kısa bir süre için görüyoruz. Biraz tuhaf bir davranış gözlemleyebildik. Cinebench R23 Sigle testinde, diğer test cihazlarında hiç görülmeyen çok sayıda ani yükselme belgeledik. Testi birkaç kez tekrarladık - aynı sonuçla. SoC'nin bu durumda sürekli olarak bir sıcaklık sınırında çalıştığını ve bunun da kısa süreliğine daha fazla güç emmesine izin verdiğini varsaymak mantıklıdır. Güç kaynağı 120 watt'lık küçük bir güç kaynağı ünitesi tarafından sağlanmaktadır. Aynı güç kaynağı ünitesi birçok Geekom cihazında da bulunmaktadır.
| Kapalı / Bekleme modu | |
| Boşta | |
| Çalışırken |
|
Key:
min: | |
| Geekom XT13 Pro i9-13900H, Iris Xe G7 96EUs | Aoostar GEM12 R7 8845HS, Radeon 780M | Minisforum AtomMan X7 Ti Ultra 9 185H, Arc 8-Core | Acemagic F2A Ultra 7 155H, Arc 8-Core | Geekom XT12 Pro i9-12900H, Iris Xe G7 96EUs | Geekom A7 R9 7940HS, Radeon 780M | Ortalama Intel Iris Xe Graphics G7 96EUs | Sınıf ortalaması Mini PC | |
|---|---|---|---|---|---|---|---|---|
| Power Consumption | -38% | -34% | -35% | -21% | 11% | 2% | -41% | |
| Idle Minimum * | 6.3 | 8.2 -30% | 8.2 -30% | 9.1 -44% | 5.7 10% | 3.8 40% | 5.41 ? 14% | 9.52 ? -51% |
| Idle Average * | 7.1 | 10 -41% | 12.1 -70% | 10.3 -45% | 9.5 -34% | 4.8 32% | 8.6 ? -21% | 11.6 ? -63% |
| Idle Maximum * | 9 | 14.6 -62% | 14 -56% | 14.4 -60% | 16.5 -83% | 6.5 28% | 10.9 ? -21% | 14.9 ? -66% |
| Load Average * | 49.8 | 73.9 -48% | 53.1 -7% | 54.9 -10% | 53.3 -7% | 71.9 -44% | 45.4 ? 9% | 58.8 ? -18% |
| Cyberpunk 2077 ultra external monitor * | 54 | 79.9 -48% | ||||||
| Load Maximum * | 94.5 | 95.3 -1% | 100.4 -6% | 110.4 -17% | 87.8 7% | 94.7 -0% | 67.6 ? 28% | 99.7 ? -6% |
* ... daha küçük daha iyidir
Efficiency
| Performance Rating - Percent | |
| Geekom A8 | |
| Minisforum AtomMan X7 Ti | |
| Acemagic F2A | |
| Geekom XT13 Pro | |
| Geekom XT12 Pro | |
| Power Consumption | |
| Cinebench R23 Multi Power Efficiency - external Monitor | |
| Geekom A8 | |
| Minisforum AtomMan X7 Ti | |
| Geekom XT13 Pro | |
| Acemagic F2A | |
| Geekom XT12 Pro | |
| Cinebench R23 Single Power Efficiency - external Monitor | |
| Geekom A8 | |
| Minisforum AtomMan X7 Ti | |
| Acemagic F2A | |
| Geekom XT13 Pro | |
| Geekom XT12 Pro | |
| Cinebench R15 Multi Efficiency (external Monitor) | |
| Geekom A8 | |
| Minisforum AtomMan X7 Ti | |
| Geekom XT13 Pro | |
| Acemagic F2A | |
| Geekom XT12 Pro | |
Power consumption with external monitor
Power consumption with external monitor
Artılar
Eksiler
Karar - Üstün performans olmadan üstün fiyat
Geekom XT13 Pro güçlü bir mini PC. Ancak, bunu Geekom XT12 Pro ile zaten kanıtlayabildik. Sadece bu iki modeli birbiriyle karşılaştırırsak, gözle görülür bir performans kaybı olmadan eski cihazı tercih edebilirsiniz. Bu Intel Core i9-13900H geekom XT13 Pro'nun performansında gözle görülür bir artış sağlayamıyor. Intel Core i9-12900H ile karşılaştırıldığında teknik farklar çok küçük. Geekom, Meteor Lake serisine dayalı bir mini PC'nin cesur adımını atmaya cesaret edemiyor. Bu, diğer birçok üreticinin model serilerini Intel'in en yeni işlemcileriyle donatmış olması nedeniyle Geekom'un geride kaldığı anlamına geliyor. Geekom XT13 Pro'nun en büyük dezavantajı, tüm testlerde modern temsilcilerden daha düşük olan iGPU'dur. Ancak, Geekom burada sadece rakiplerinden değil, kendisinden de daha düşük. Geekom'un kendi portföyü, teknik olarak çok daha kötü olmayan, ancak genel olarak daha iyi bir sonuç veren en yeni AMD SoC'lere sahip mini PC'leri içeriyor. Henüz fiyatına bile bakmadık. Ne yazık ki, Geekom XT13 Pro burada tamamen çizginin dışında. en üst model olacaksa şu anda faturada 999 Euro var. Diğer mini PC'ler biraz daha ucuz ama daha fazla performans sunuyor.
Geekom XT13 Pro, Intel Core i9-13900H ile yeterli performans sunar ve çok yönlü özellikleriyle etkileyicidir. Bununla birlikte, Geekom XT13 Pro'nun fiyat-performans oranı hiç uyuşmuyor.
Geekom'un geçmişte defalarca puan topladığı iyi bağlanabilirlik, olumlu bir şekilde vurgulanmalıdır. Çok sayıda bağlantı arasında iki adet USB4 bağlantı noktası bulunuyor ve bu da geleceğe dönük satın alma kararını etkileyebilir. Üç yıllık üretici garantisi de Geekom'un bir cihazı lehine konuşuyor. Elbette bu, üreticinin diğer cihazları için de geçerli. Verimlilik Geekom XT12 Pro'ya kıyasla sadece biraz artırılabilir. Bu disiplinde Intel Core i9-13900H, daha modern Meteor Lake işlemcilerden açıkça daha düşük. Bu nedenle, Geekom XT13 Pro'ya yüksek satın alma fiyatına rağmen bir satın alma tavsiyesi veremiyoruz. Geekom XT13 Pro'nun bir raf ısıtıcısı haline gelmemesi için Geekom'un acilen mevcut fiyatlandırmasını gözden geçirmesi gerekiyor.
Not: Derecelendirme sistemimizi yakın zamanda güncelledik ve 8. versiyonun sonuçları 7. versiyonun sonuçları ile karşılaştırılamaz. Daha fazla bilgi için burada.
Geekom XT13 Pro
- 07/30/2024 v8
Sebastian Bade
 Total Sustainability Score:
 Şeffaflık
İncelenecek cihazların seçimi editör ekibimiz tarafından yapılır. Test örneği, inceleme amacıyla üretici tarafından yazara ücretsiz olarak verildi. Bu inceleme üzerinde herhangi bir üçüncü taraf etkisi bulunmamıştır ve üretici, yayınlanmadan önce bu incelemenin bir kopyasını almamıştır. Bu incelemeyi yayınlama zorunluluğu yoktu. İncelemelerimiz karşılığında asla tazminat veya ödeme kabul etmiyoruz. Bağımsız bir medya şirketi olarak Notebookcheck, üreticilerin, perakendecilerin veya yayıncıların otoritesine tabi değildir.
Notebookcheck bu şekilde test yapıyor
Notebookcheck, tüm sonuçların karşılaştırılabilir olmasını sağlamak için her yıl yüzlerce dizüstü bilgisayarı ve akıllı telefonu standart prosedürler kullanarak bağımsız olarak inceliyor. Yaklaşık 20 yıldır test yöntemlerimizi sürekli olarak geliştirdik ve bu süreçte endüstri standartlarını belirledik. Test laboratuvarlarımızda deneyimli teknisyenler ve editörler tarafından yüksek kaliteli ölçüm ekipmanları kullanılmaktadır. Bu testler çok aşamalı bir doğrulama sürecini içerir. Karmaşık derecelendirme sistemimiz, nesnelliği koruyan yüzlerce sağlam temellere dayanan ölçüm ve kıyaslamaya dayanmaktadır.Price comparison
