

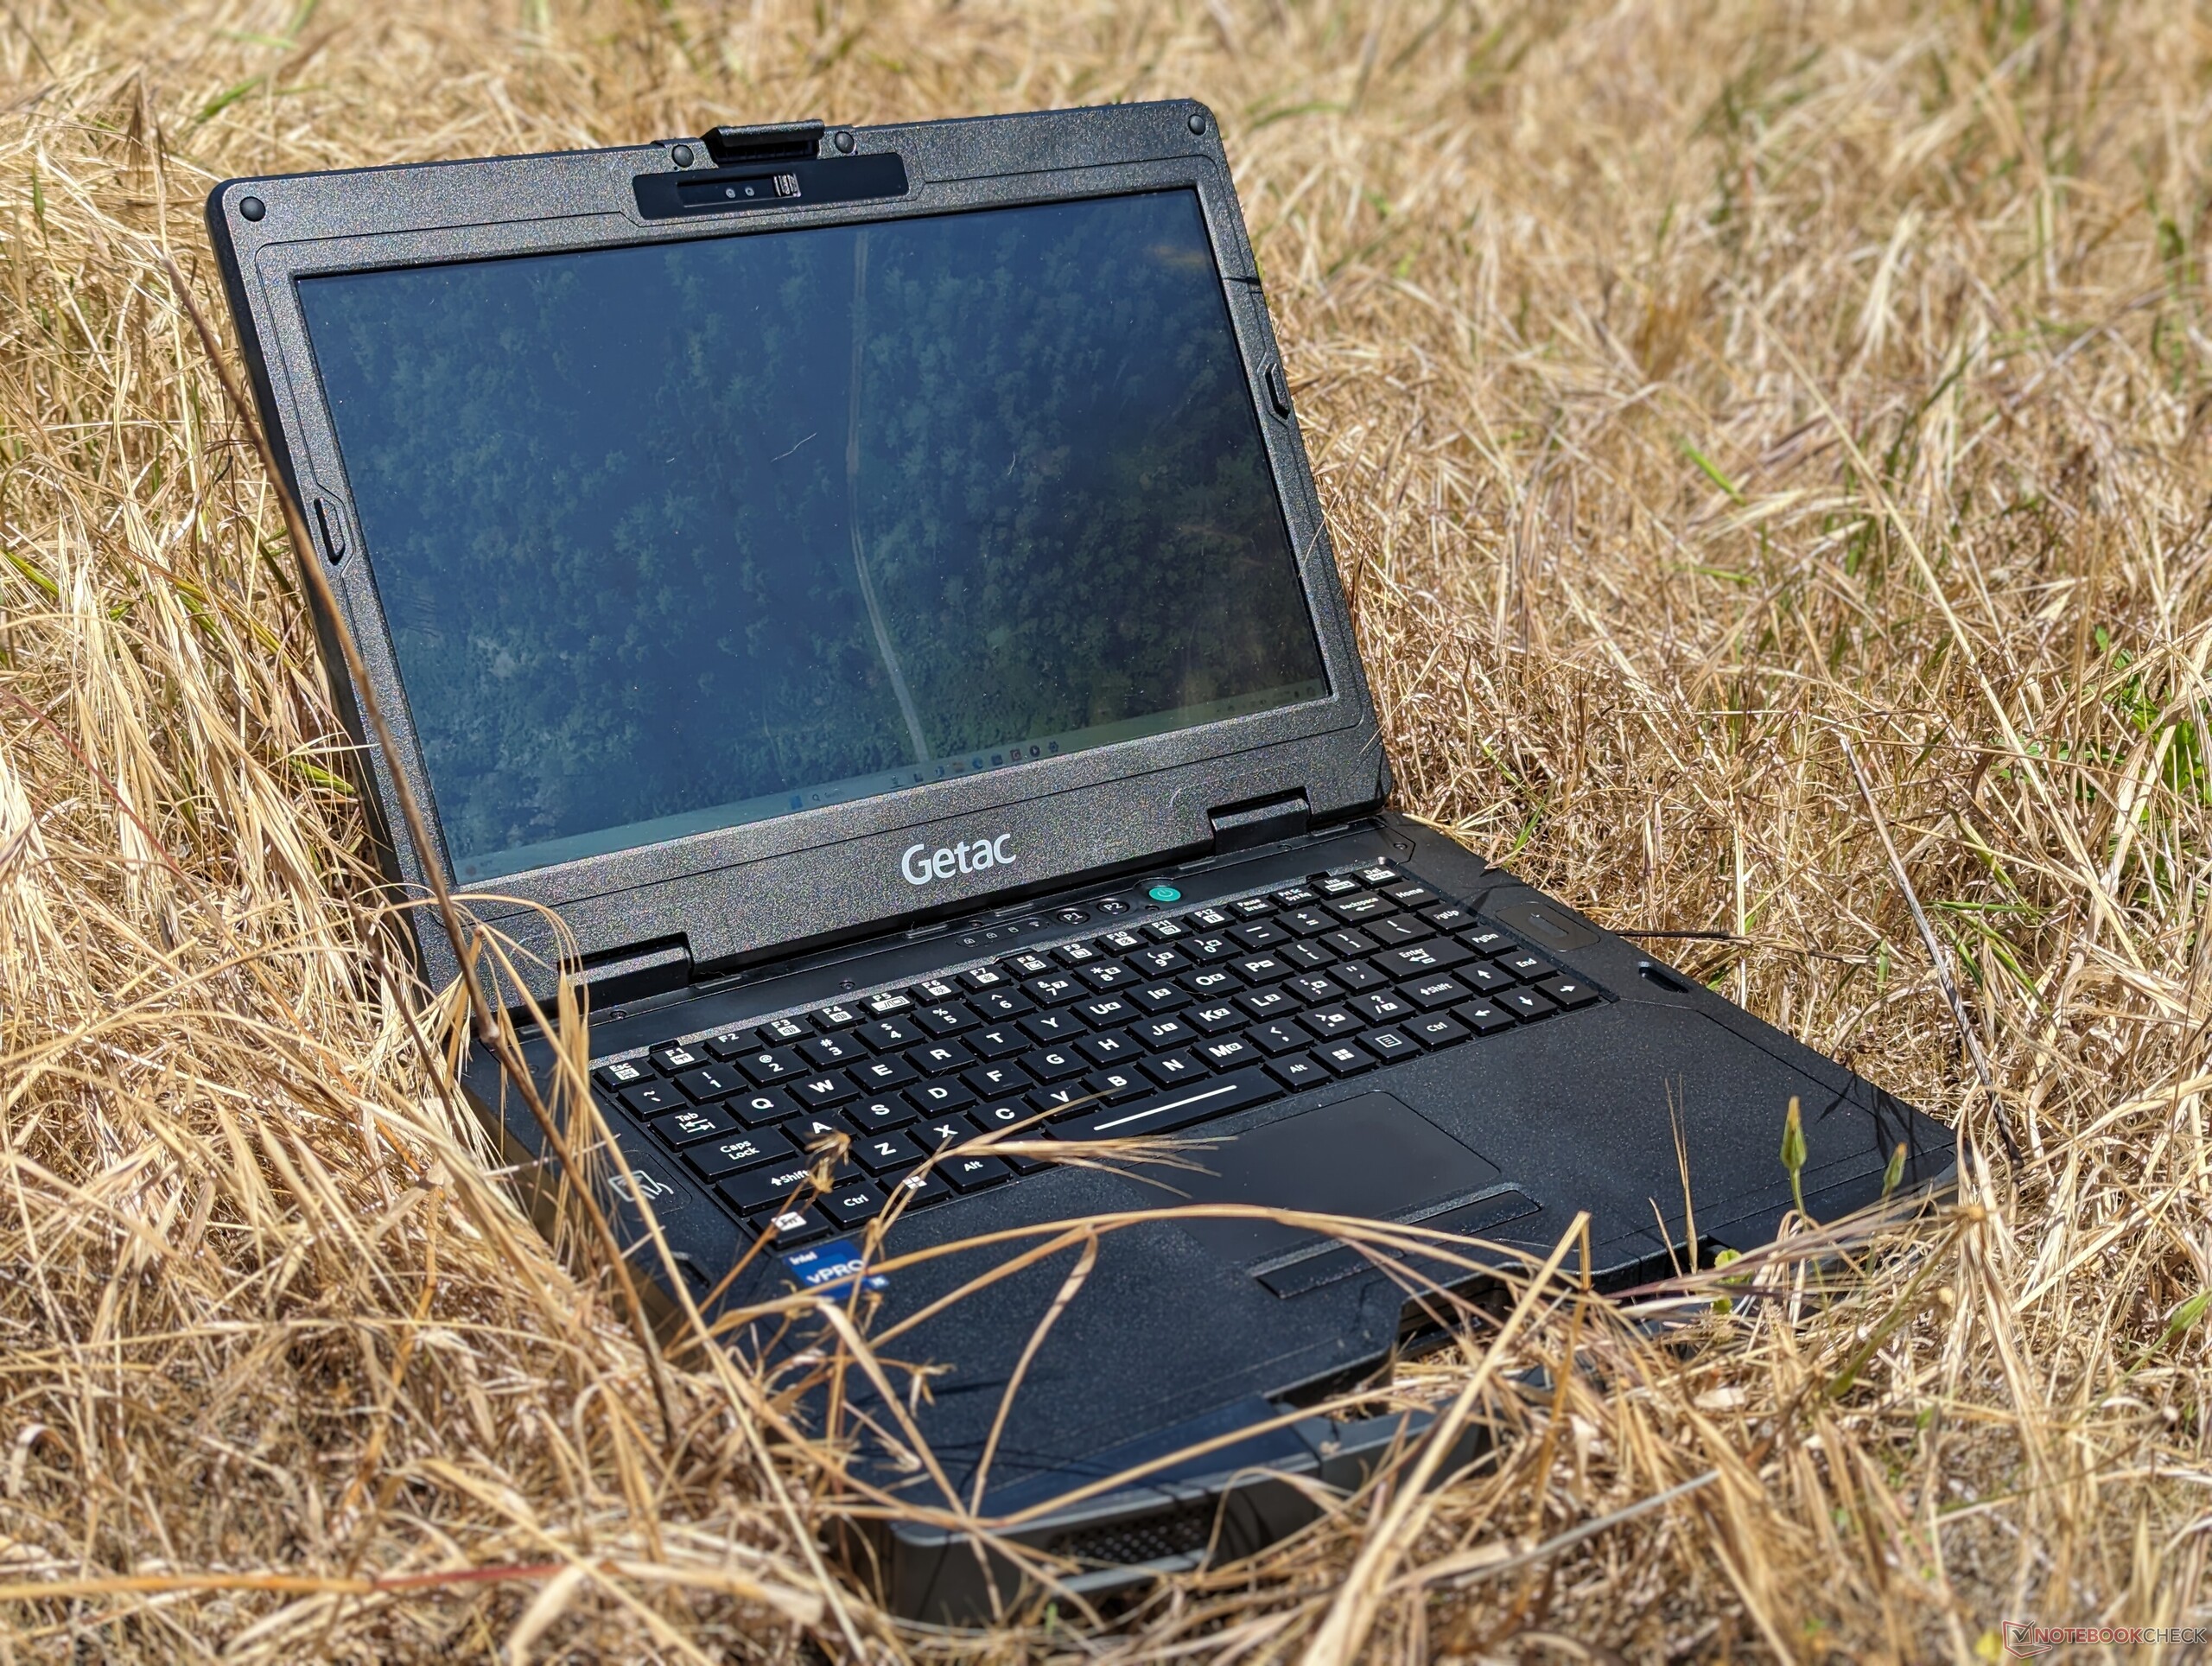
Getac S410 Gen 5 dayanıklı dizüstü bilgisayar incelemesi: Ekstra performans için Raptor Lake-P

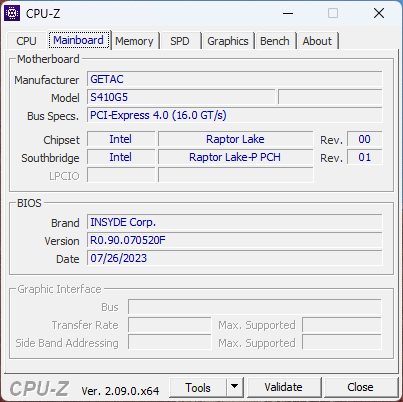
S410 bu yıl, önceki dört yinelemeyle aynı fiziksel özelliklere sahip 5. nesil bir model olarak geri döndü. İç donanımları, eski Tiger Lake-U seçeneklerinin yerini alan Raptor Lake-P vPro işlemcileri içerecek şekilde güncellendi. İncelemelerimize göz atmanızı öneririz S410 G4 ve orijinal 2018 S410 parçalar ve aksesuarlarla uyumluluğu korumak için çok az değişiklik yapıldığından, S410 G5'in kasası ve özellikleri hakkında daha fazla bilgi edinmek için. Bu inceleme bunun yerine S410 G5 ile alternatifleri ve öncülleri arasındaki performans farklılıklarına odaklanacaktır.
S410 G5 ve uzun kişiselleştirilebilir özellikler listesi hakkında daha fazla bilgiye adresindeki resmi PDF ürün sayfasından ulaşabilirsiniz.
Daha fazla Getac incelemesi:
Karşılaştırmalı olarak olası rakipler
Derecelendirme | Tarih | Modeli | Ağırlık | Yükseklik | Boyut | Çözünürlük | Fiyat |
|---|---|---|---|---|---|---|---|
| 82.9 % v7 (old) | 06/2024 | Getac S410 G5 i5-1350P, Iris Xe G7 80EUs | 2.9 kg | 34.9 mm | 14.00" | 1920x1080 | |
| 81.7 % v7 (old) | Getac S410 Gen 4 i7-1185G7, Iris Xe G7 96EUs | 3.2 kg | 34.9 mm | 14.00" | 1920x1080 | ||
v (old) | 09/2021 | Durabook S14I i7-1165G7, Iris Xe G7 96EUs | 3 kg | 38.1 mm | 14.00" | 1920x1080 | |
| 84.8 % v7 (old) | 04/2022 | Dell Latitude 14 5420-D2G5W i5-1135G7, Iris Xe G7 80EUs | 1.5 kg | 20.9 mm | 14.00" | 1920x1080 | |
v (old) | 06/2022 | Dell Latitude 7330 Rugged Extreme i7-1185G7, Iris Xe G7 96EUs | 2.7 kg | 36.5 mm | 13.30" | 1920x1080 | |
v (old) | 09/2022 | Panasonic Toughbook 40 i7-1185G7, Iris Xe G7 96EUs | 3.9 kg | 53.4 mm | 14.00" | 1920x1080 |
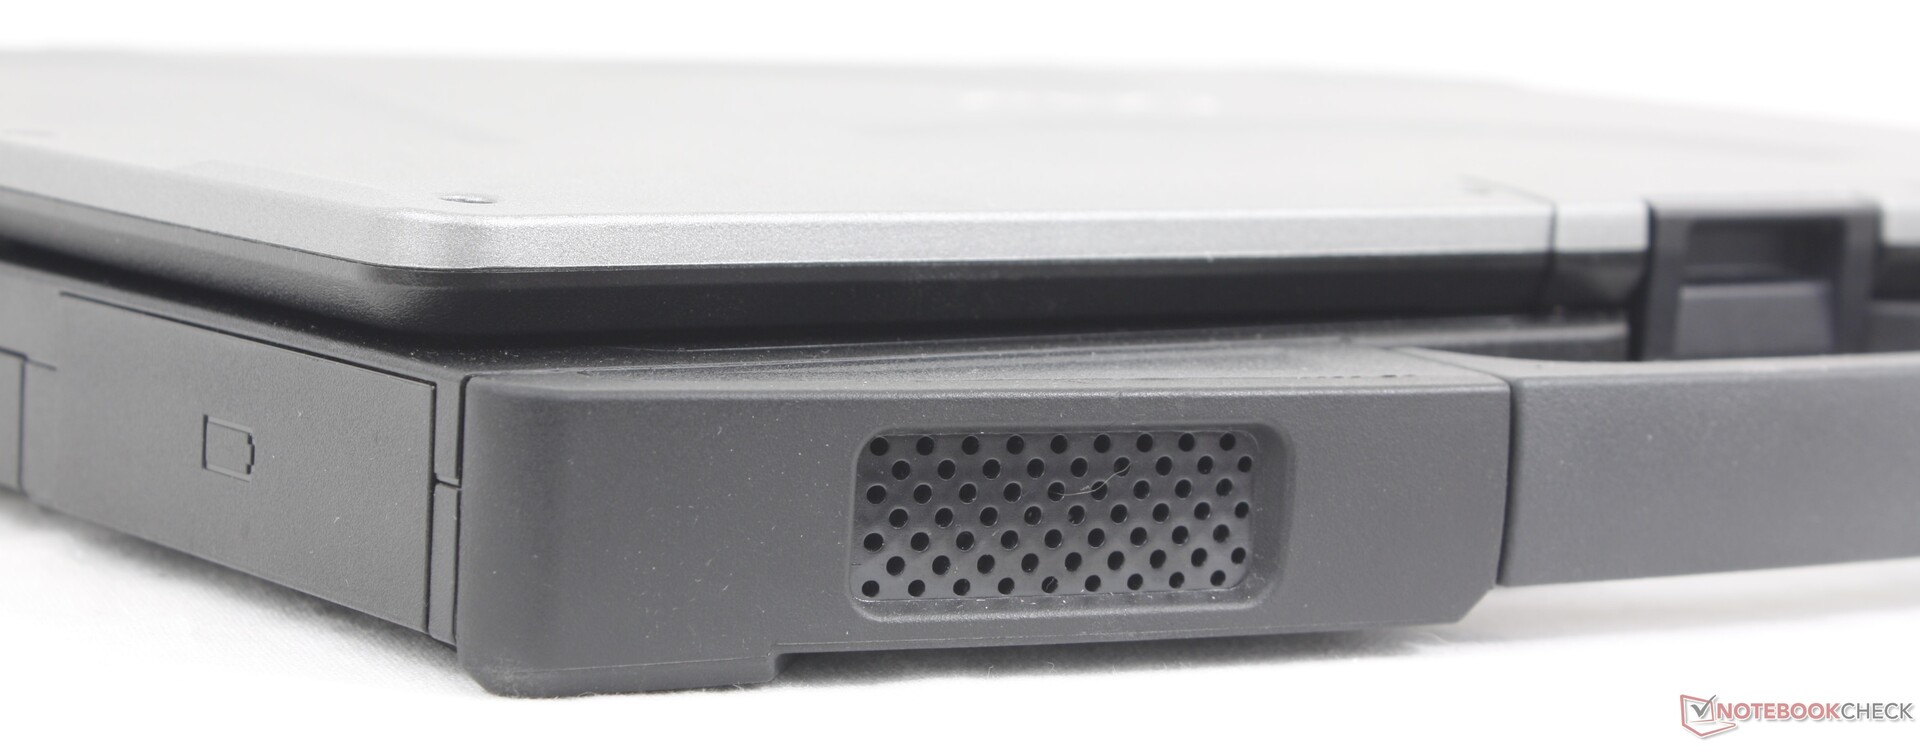
Kasa - MIL-STD-810H ve IP53 Sertifikası ile Sağlam
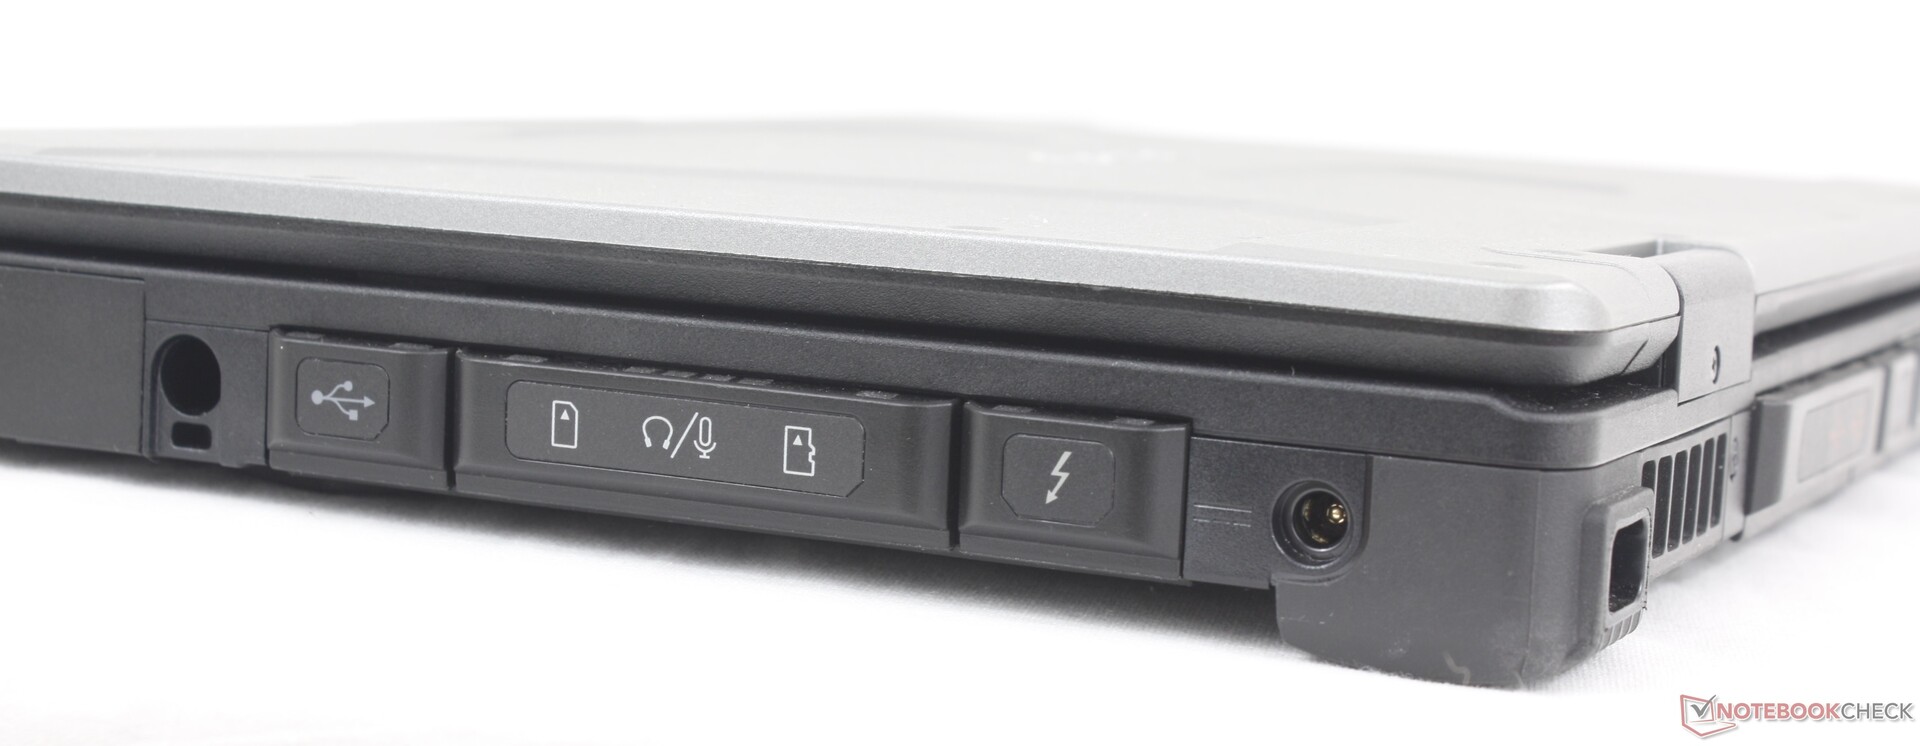
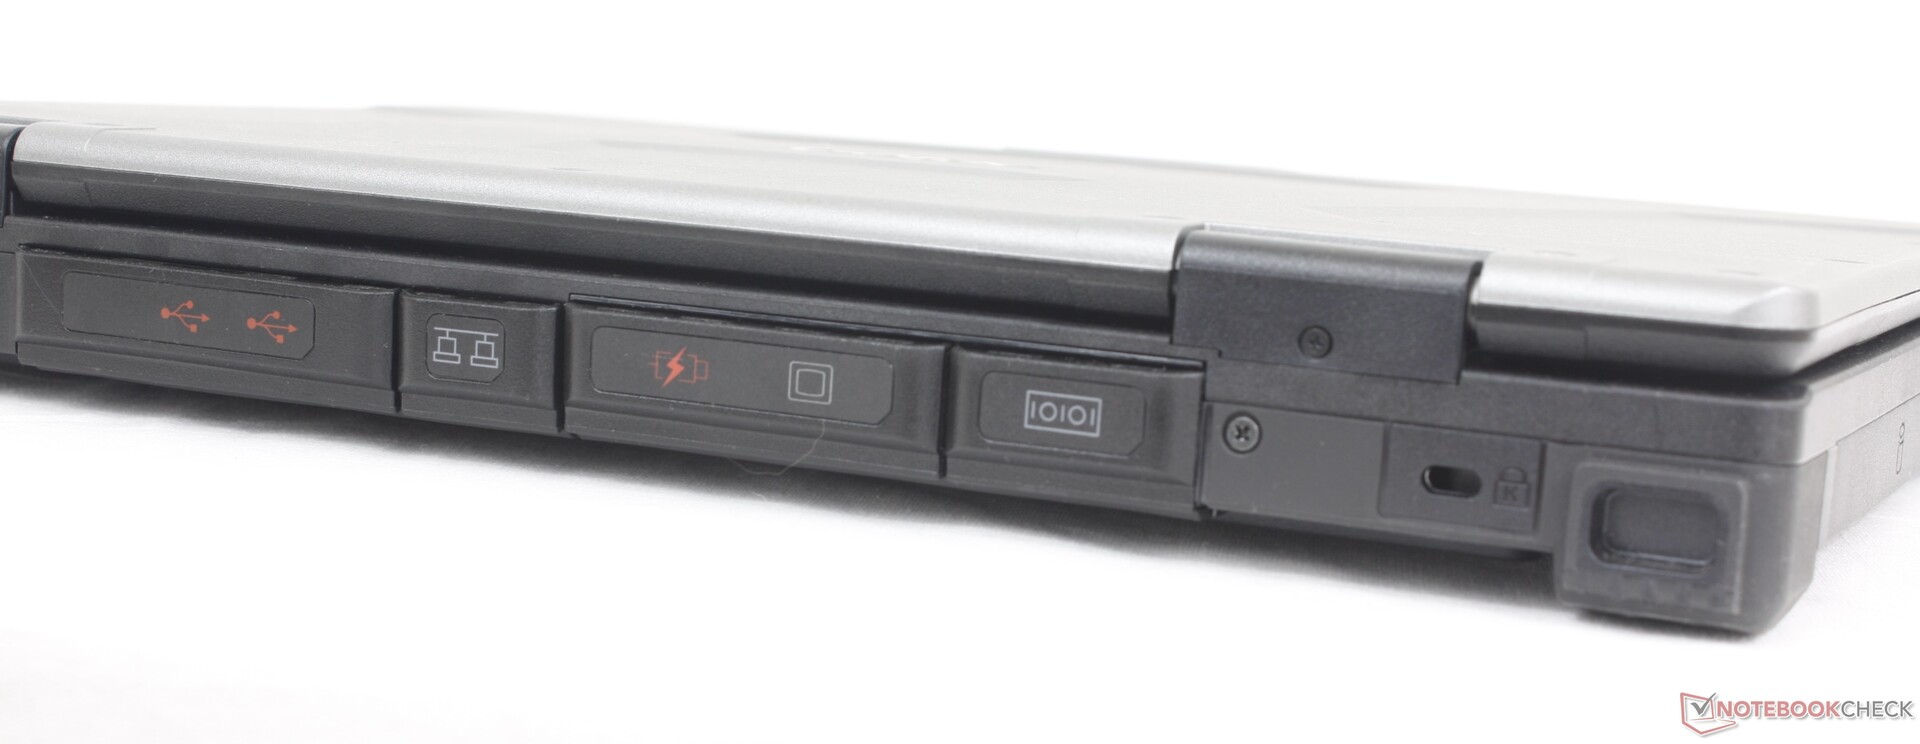
Bağlanabilirlik

SD Kart Okuyucu
| SD Card Reader | |
| average JPG Copy Test (av. of 3 runs) | |
| Dell Latitude 14 5420-D2G5W (AV Pro SD microSD 128 GB V60) | |
| Dell Latitude 7330 Rugged Extreme (AV Pro V60) | |
| Getac S410 G5 (AV Pro V60) | |
| Panasonic Toughbook 40 (AV Pro V60) | |
| Durabook S14I (Angelbird 128GB AV Pro UHS-II) | |
| maximum AS SSD Seq Read Test (1GB) | |
| Dell Latitude 7330 Rugged Extreme (AV Pro V60) | |
| Dell Latitude 14 5420-D2G5W (AV Pro SD microSD 128 GB V60) | |
| Getac S410 G5 (AV Pro V60) | |
| Panasonic Toughbook 40 (AV Pro V60) | |
| Durabook S14I (Angelbird 128GB AV Pro UHS-II) | |
İletişim
WLAN, Wi-Fi 6E hızlarını desteklemek için Intel AX201'den AX211'e yükseltildi.
| Networking | |
| iperf3 transmit AX12 | |
| Durabook S14I | |
| Dell Latitude 7330 Rugged Extreme | |
| Getac S410 Gen 4 | |
| Dell Latitude 14 5420-D2G5W | |
| iperf3 receive AX12 | |
| Durabook S14I | |
| Getac S410 Gen 4 | |
| Dell Latitude 7330 Rugged Extreme | |
| Dell Latitude 14 5420-D2G5W | |
| iperf3 transmit AXE11000 | |
| Panasonic Toughbook 40 | |
| Getac S410 G5 | |
| iperf3 receive AXE11000 | |
| Panasonic Toughbook 40 | |
| Getac S410 G5 | |
| iperf3 transmit AXE11000 6GHz | |
| Getac S410 G5 | |
| iperf3 receive AXE11000 6GHz | |
| Getac S410 G5 | |
Web kamerası
Test ünitemiz, S410 G4'teki 1 MP web kamerasına göre büyük bir yükseltme olacak şekilde 5 MP web kamerası ile yapılandırıldı. Windows Hello yüz tanıma özelliği desteklenmektedir.


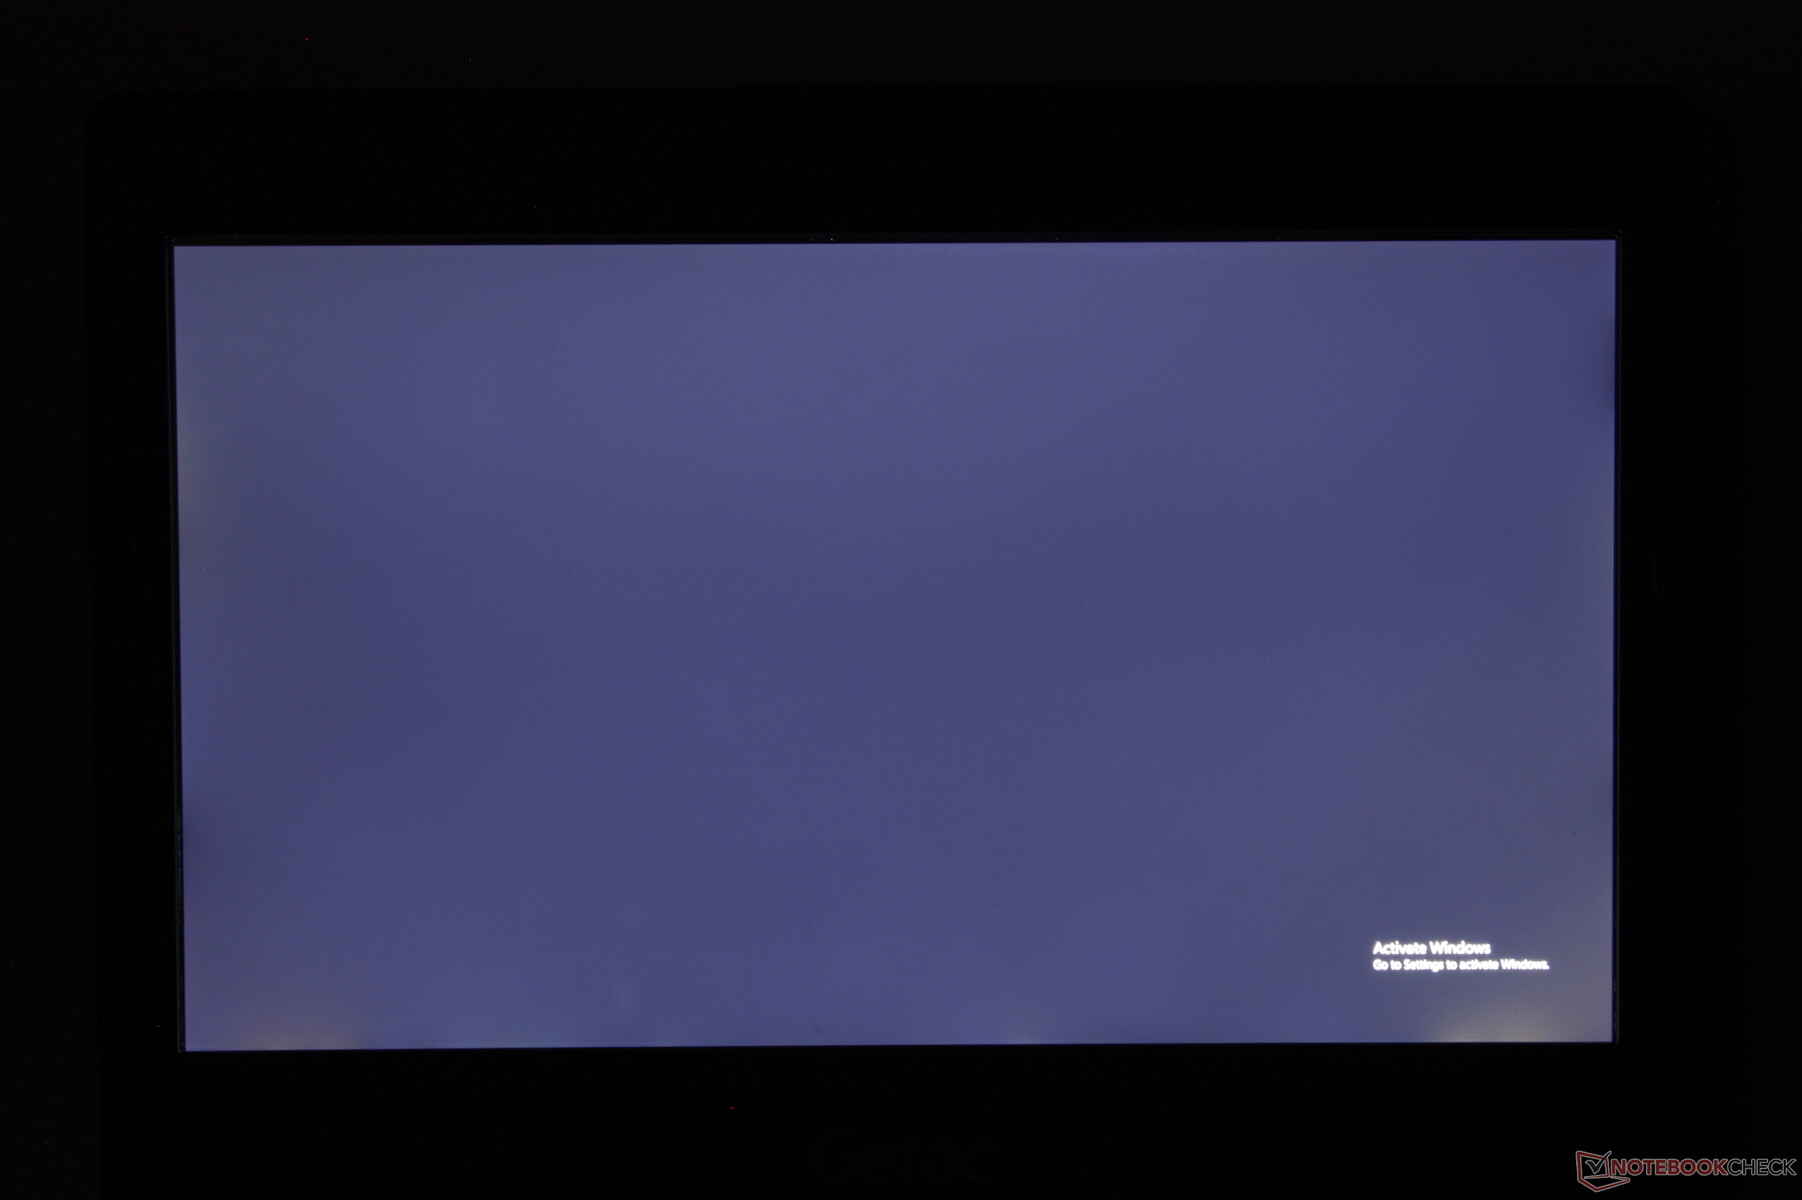
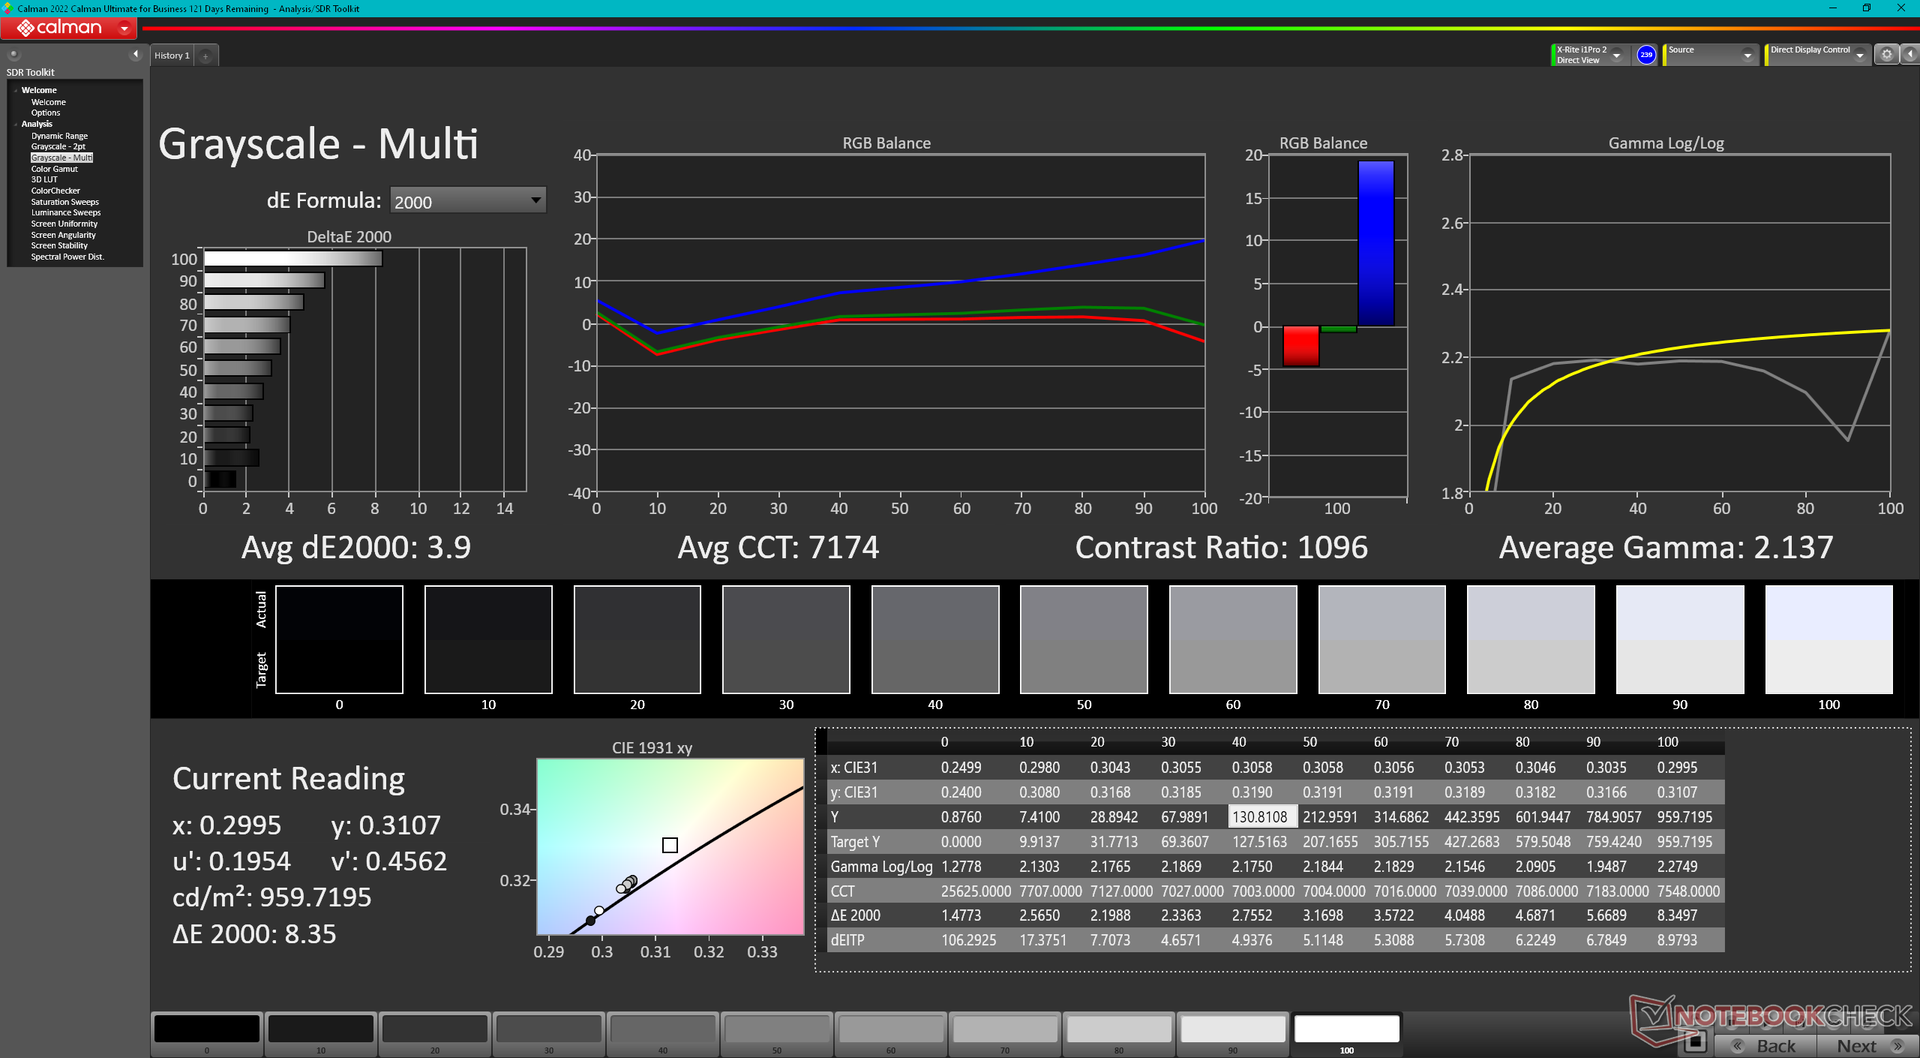
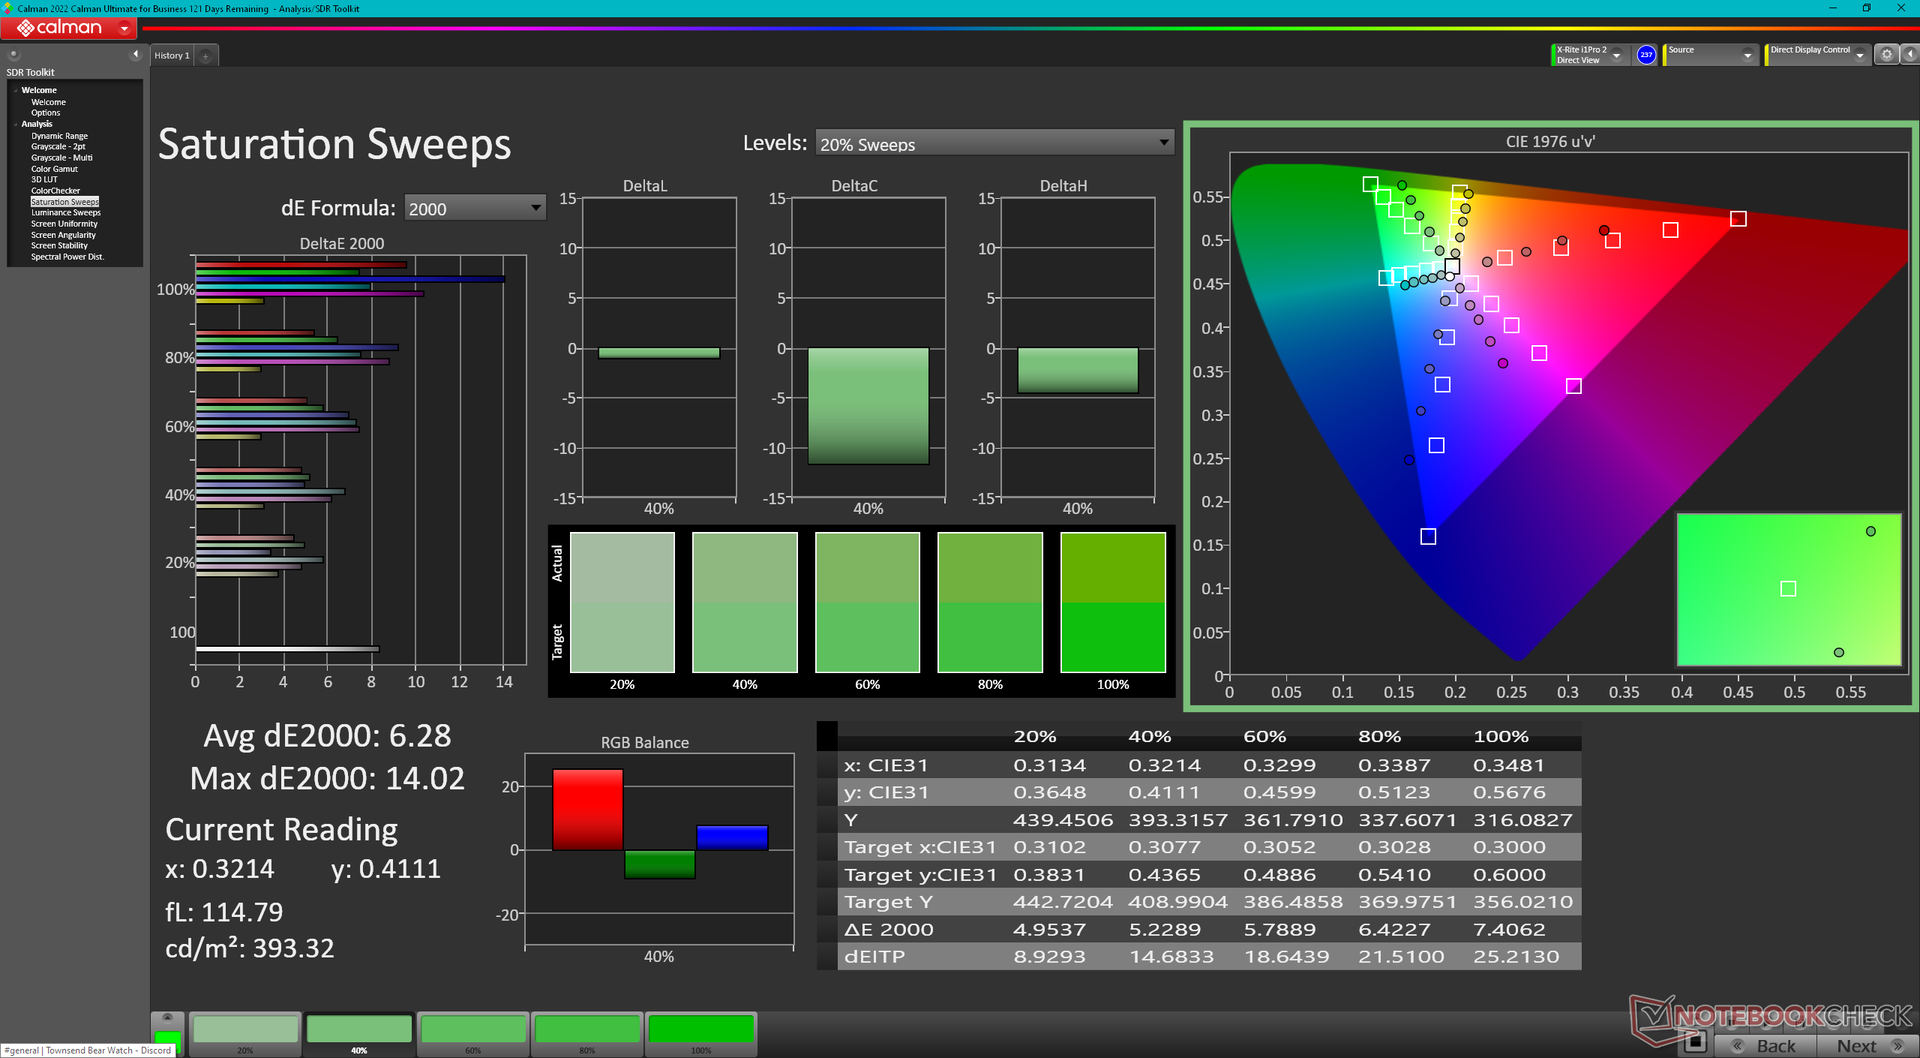
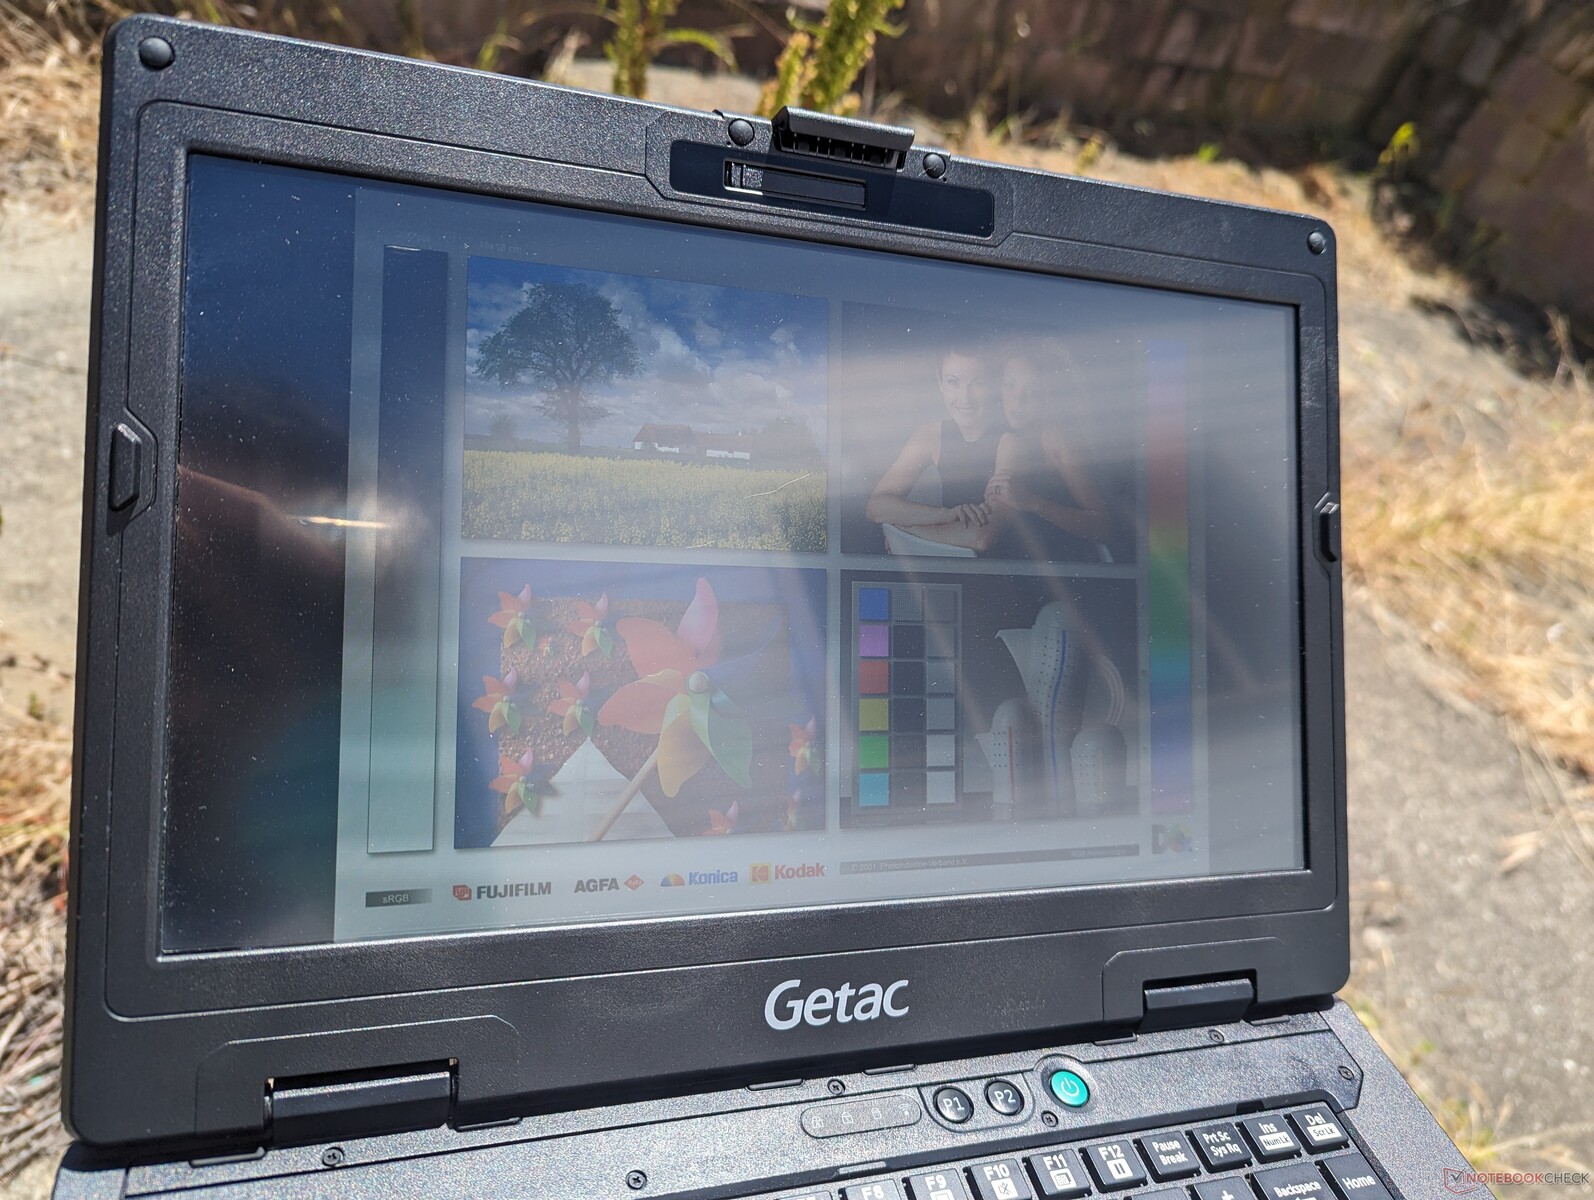
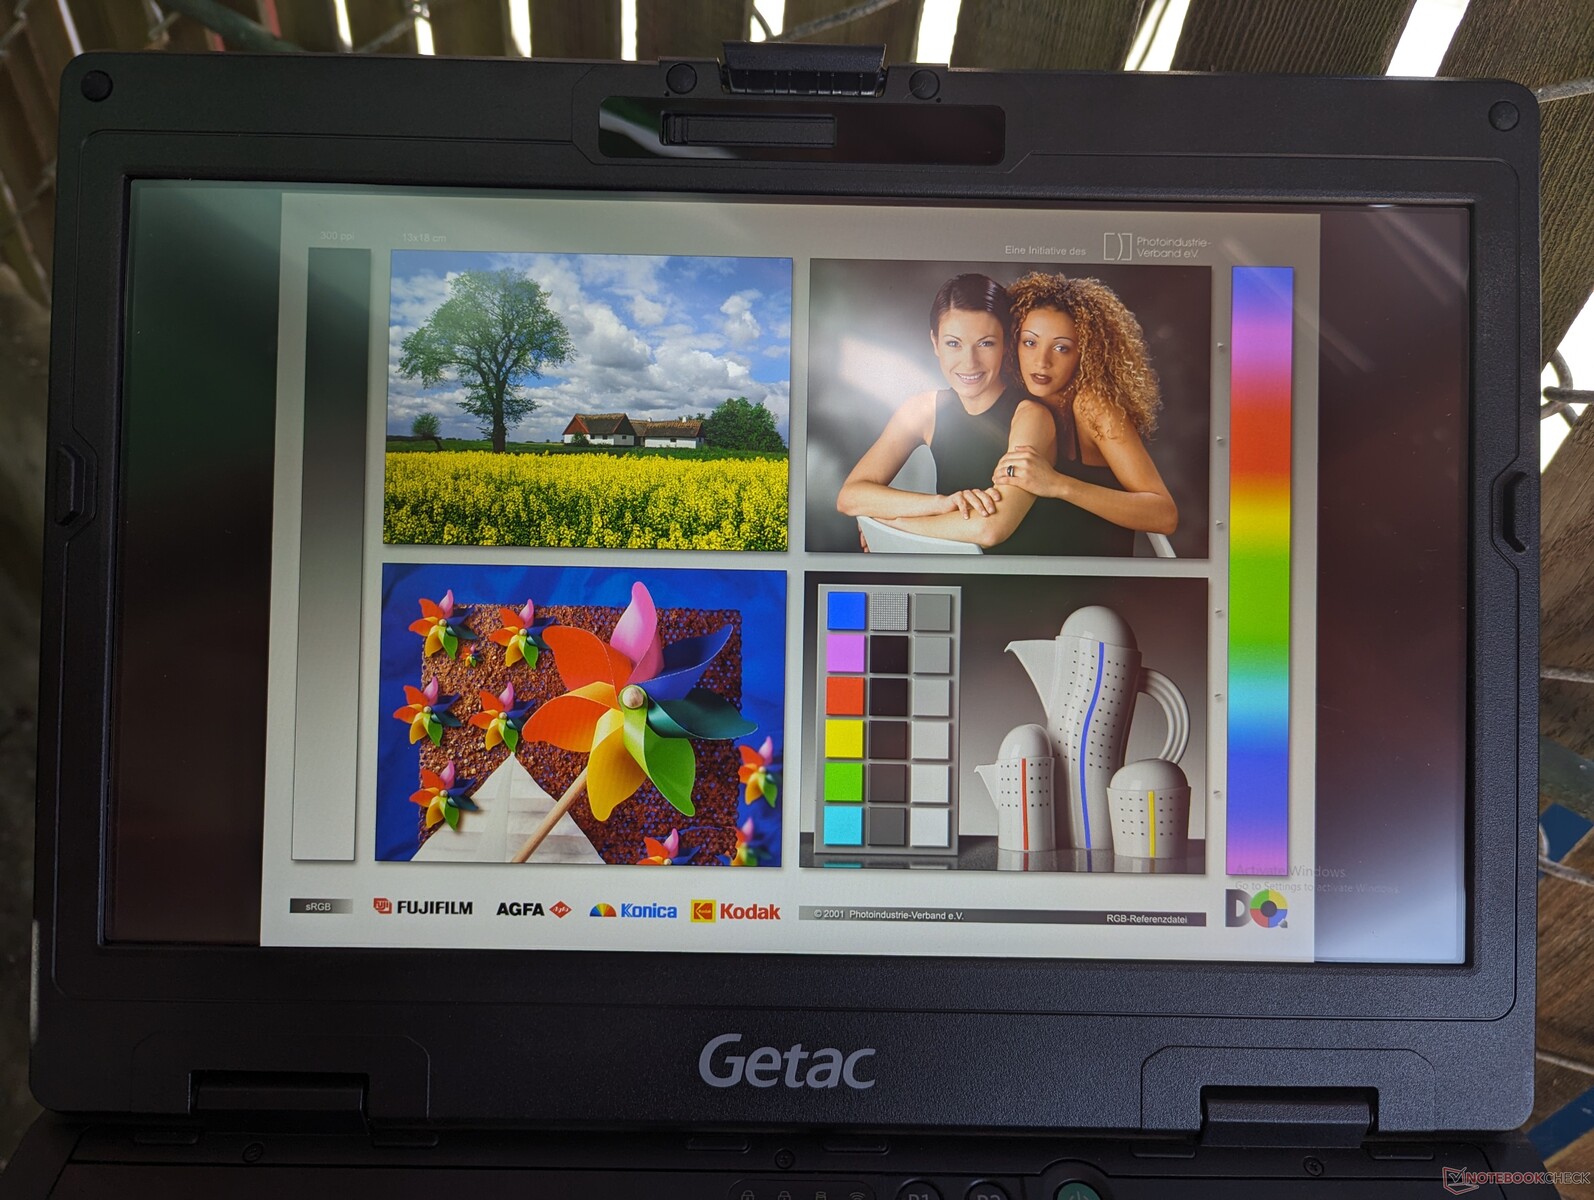
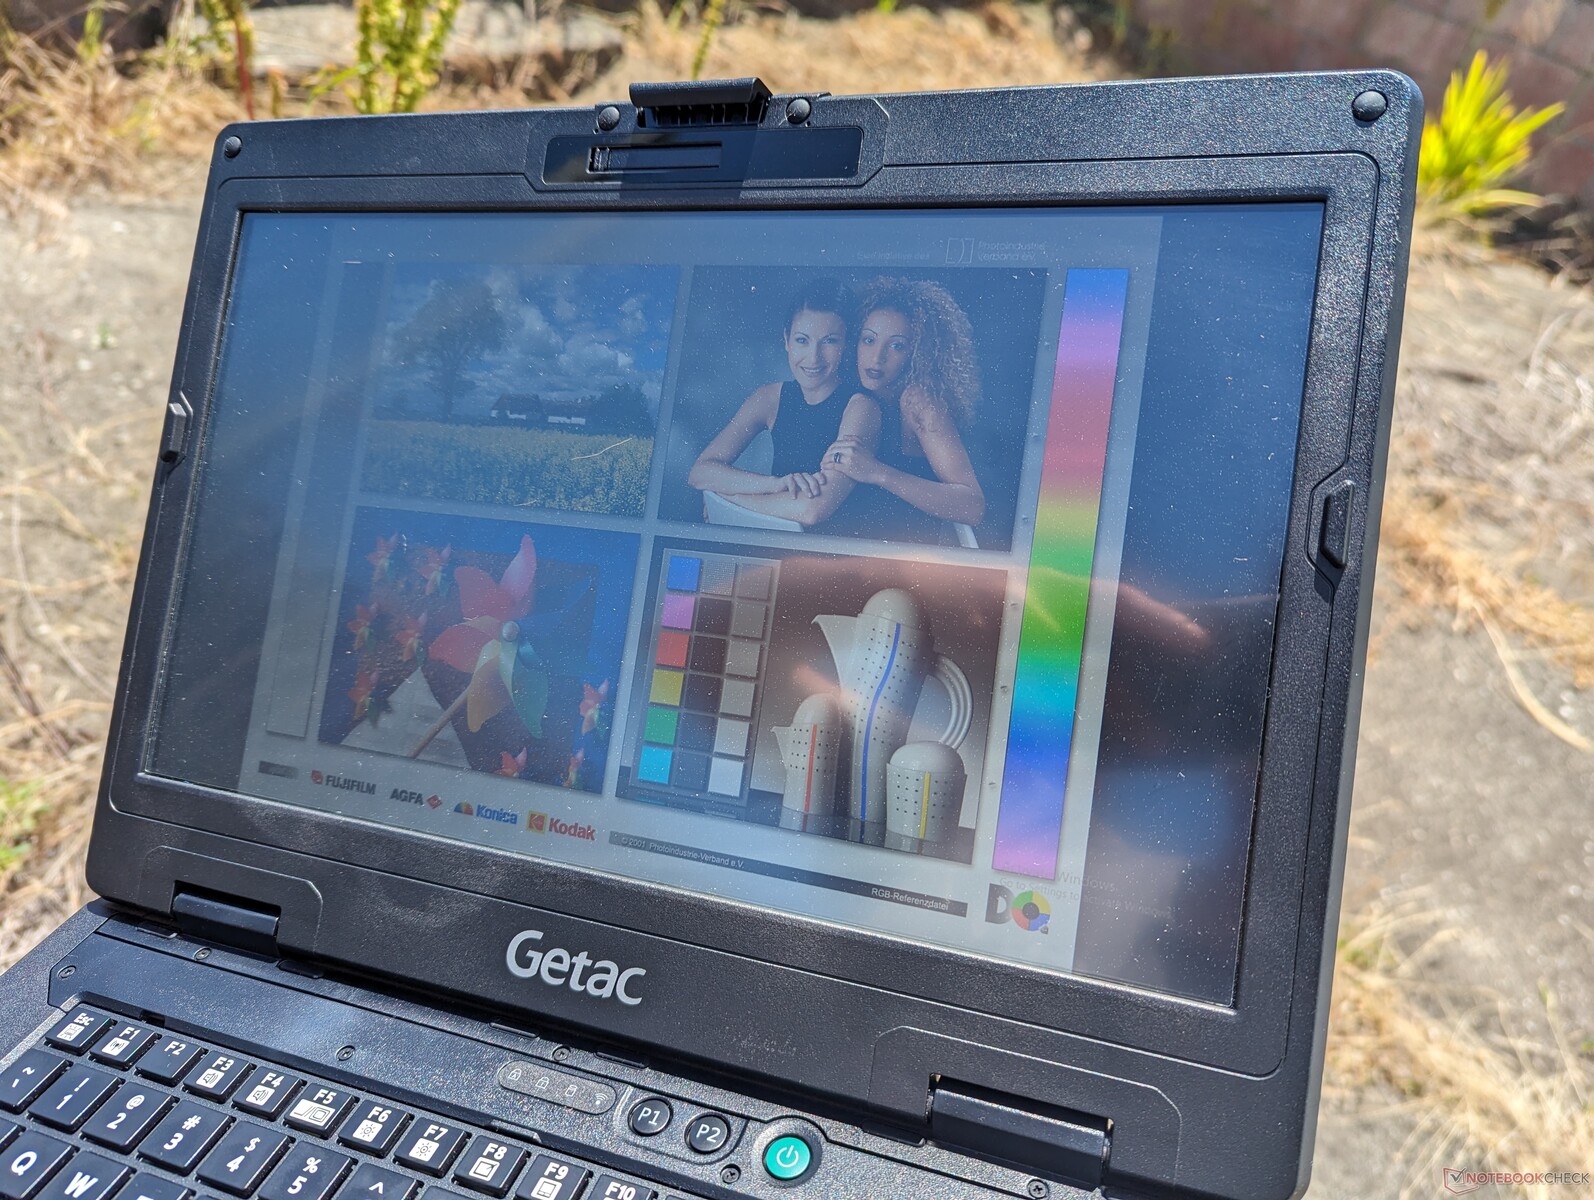
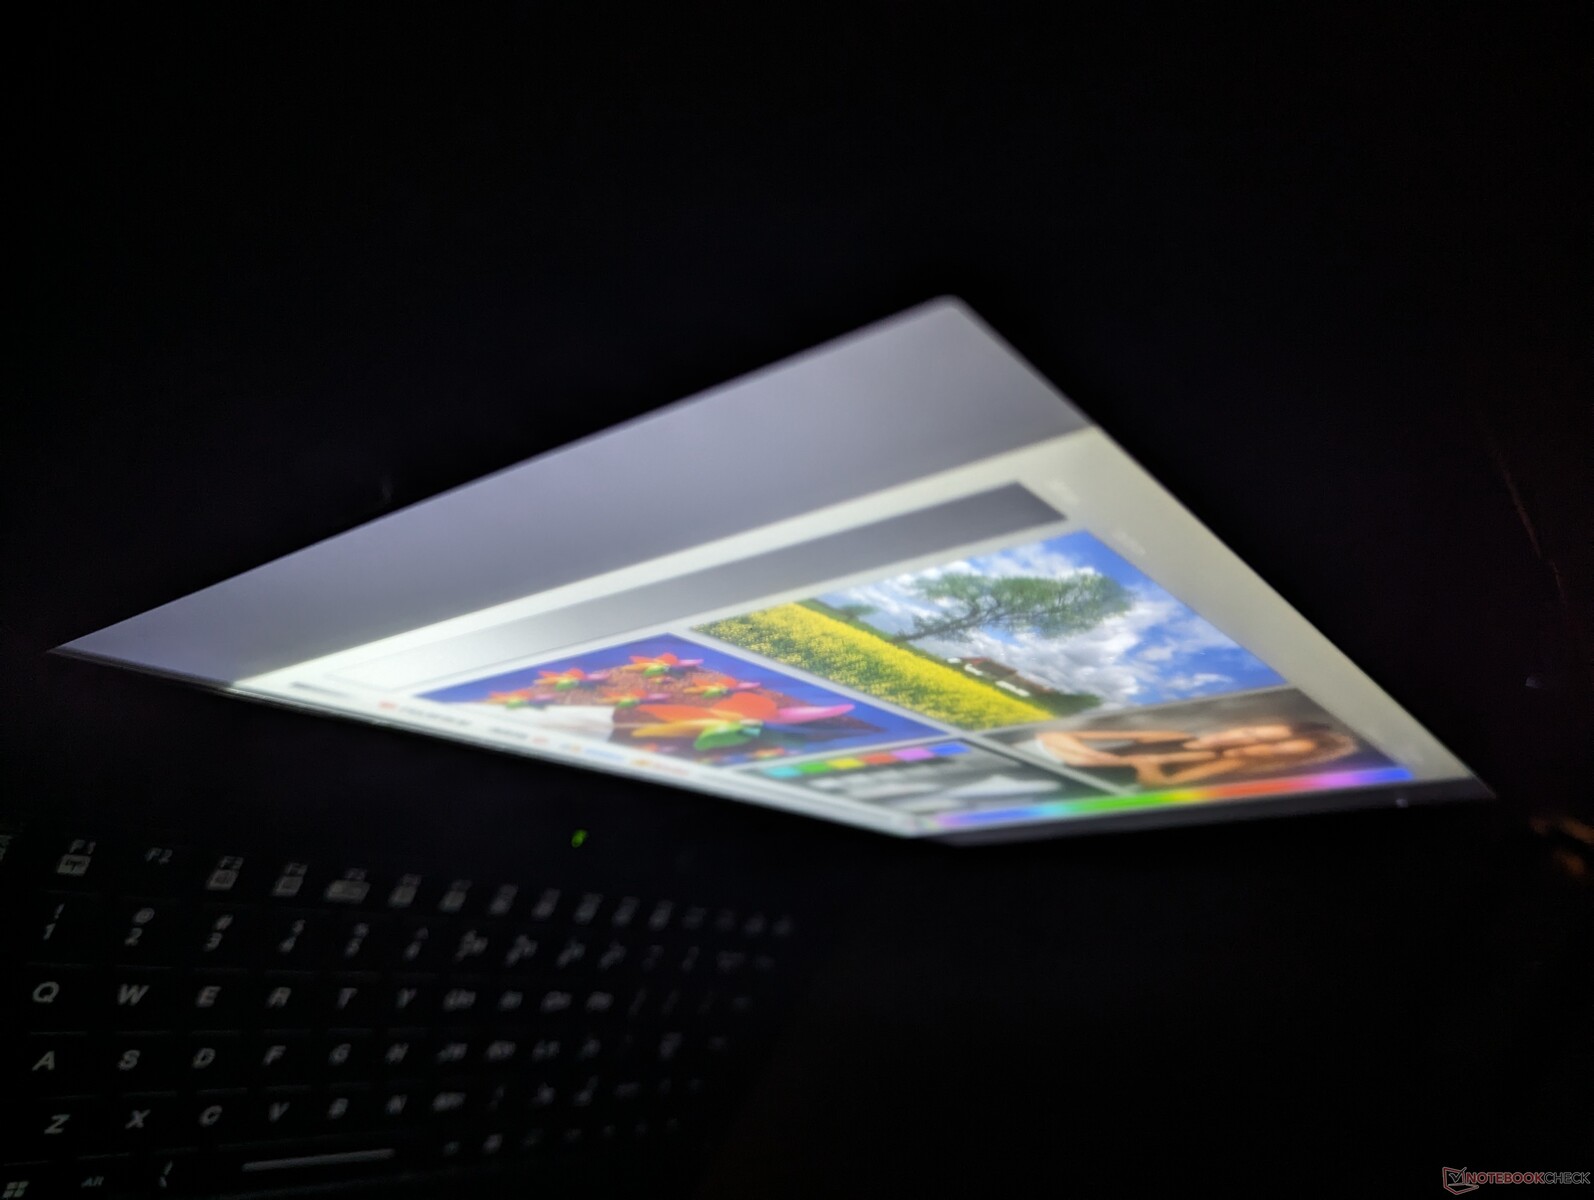
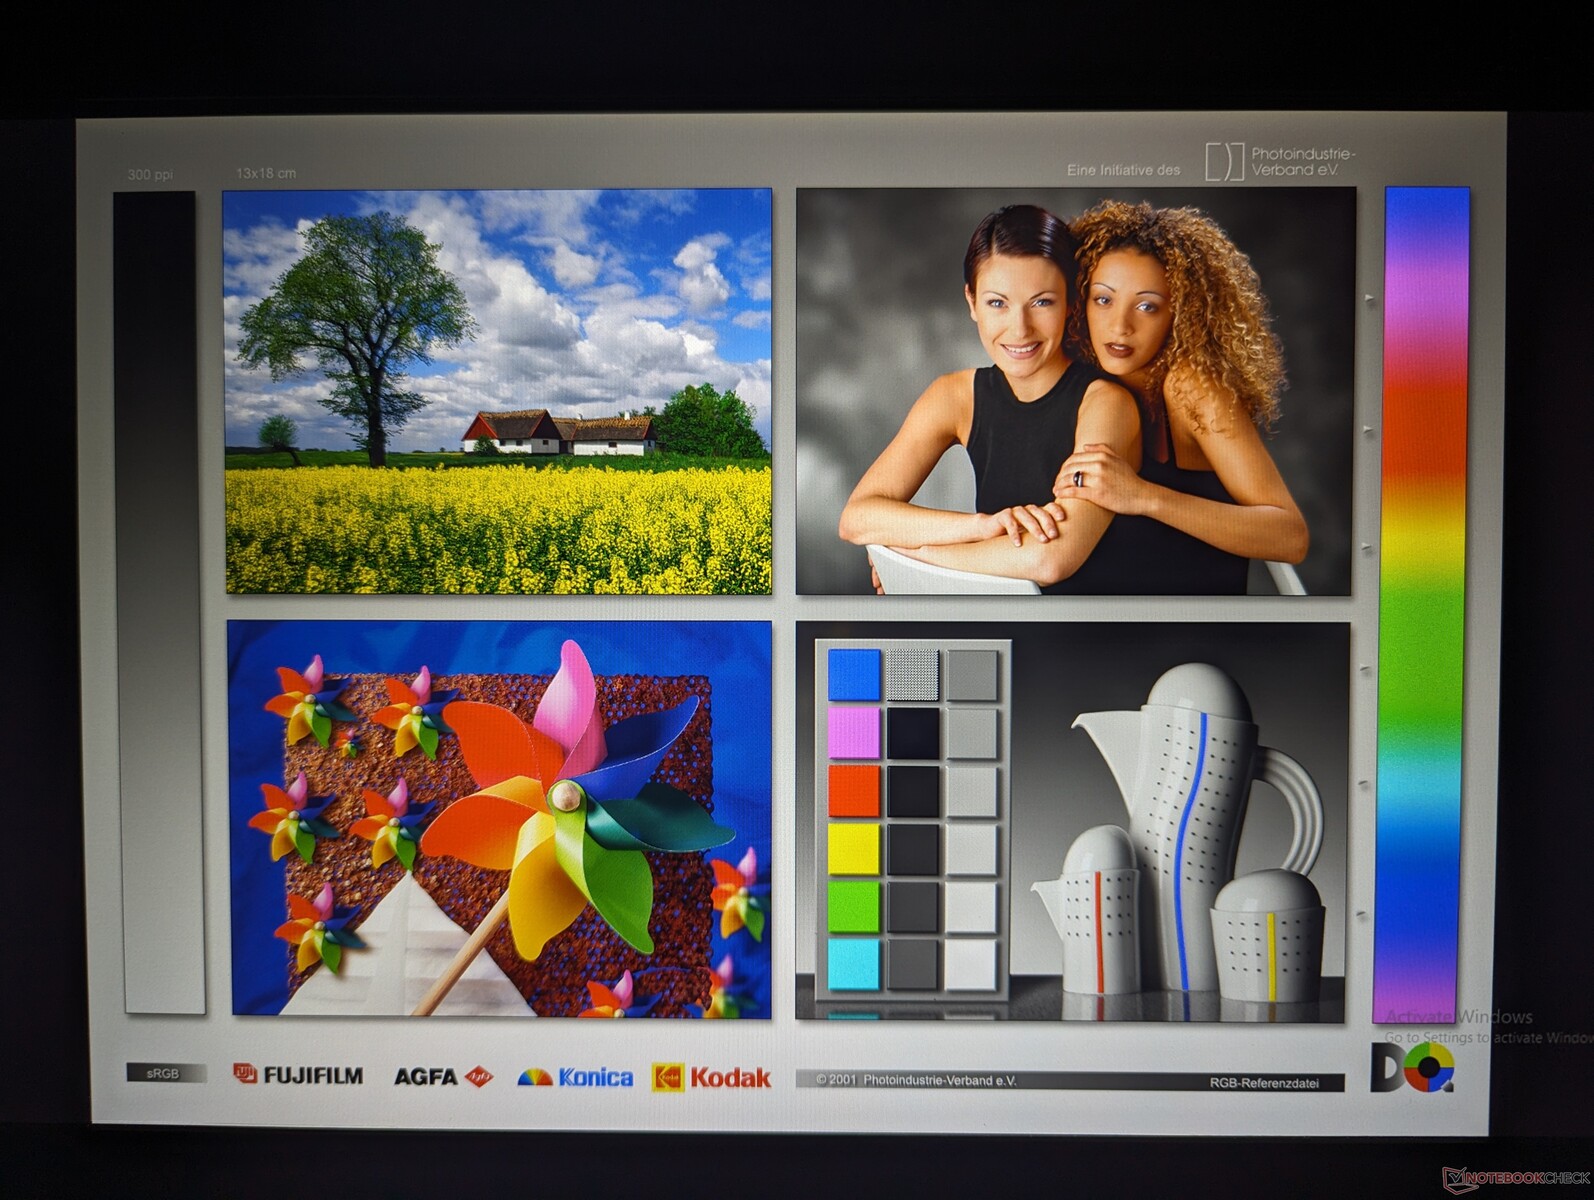
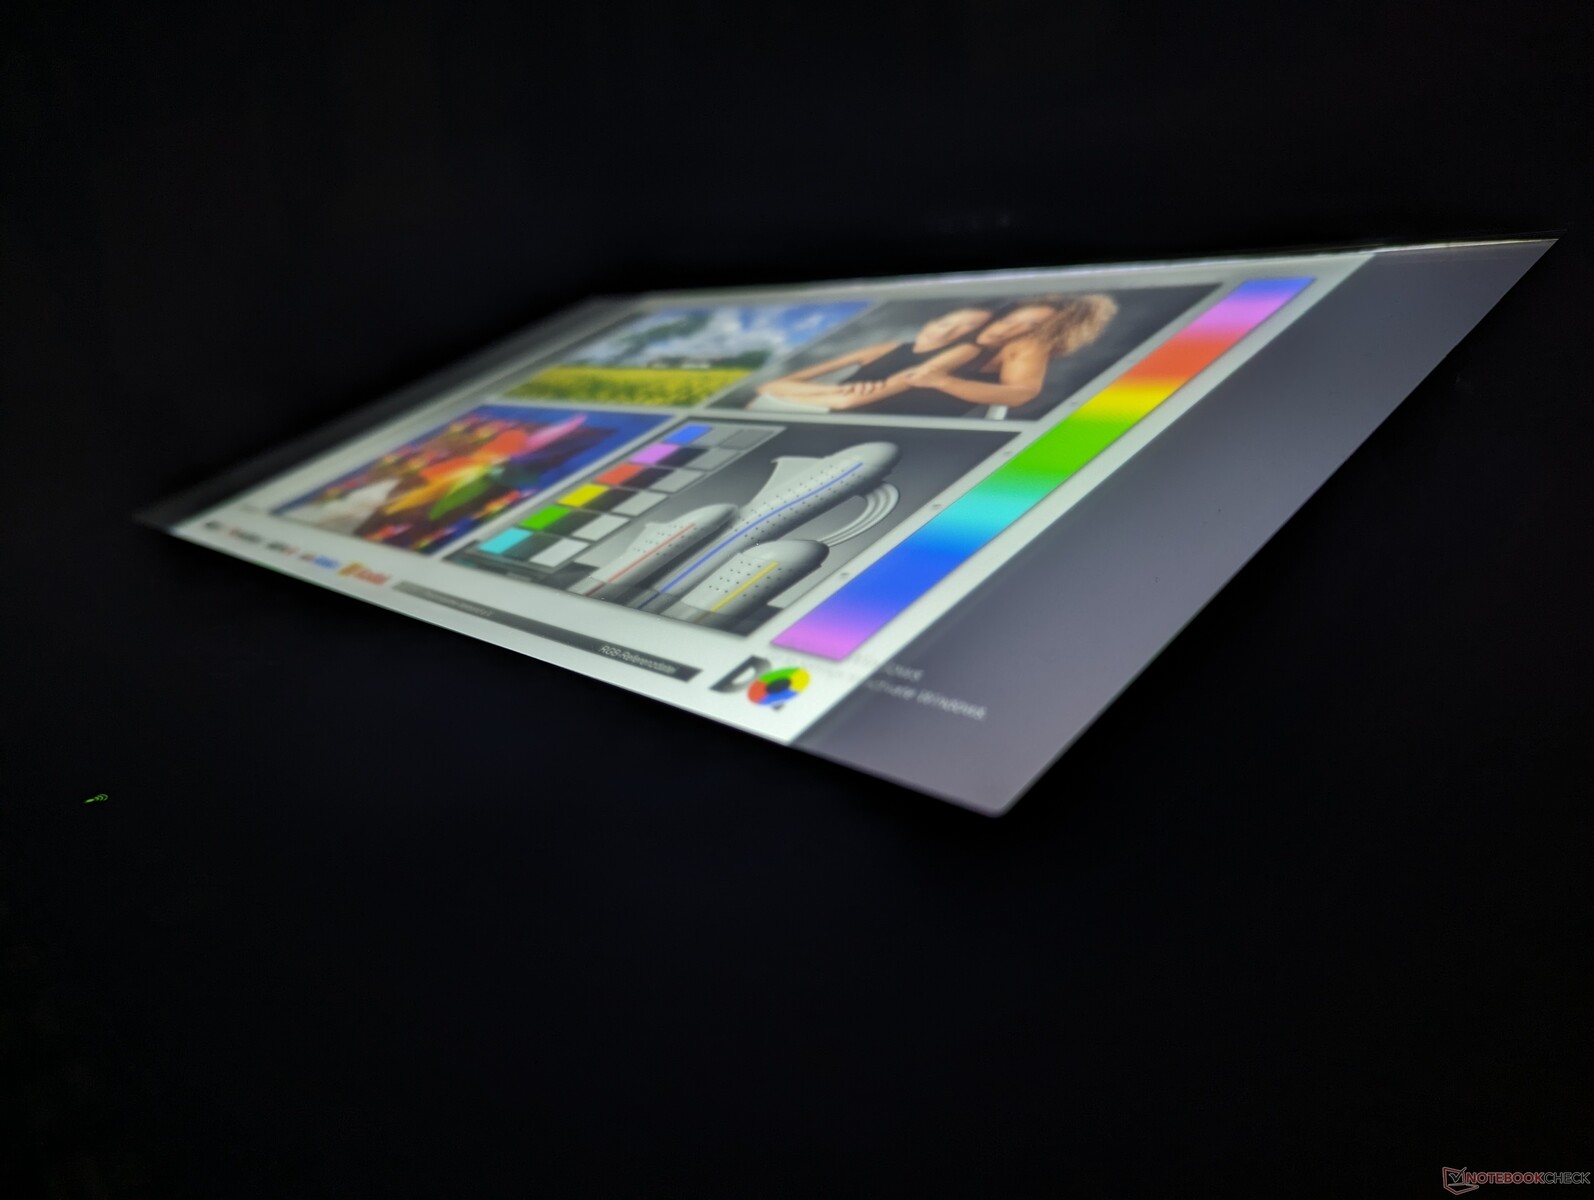
Ekran - Daha Hızlı Siyah-Beyaz Tepki Süreleri
S410 G5 ürünümüz TCL CSOT (SNE001BS1-1) panel ile gönderilirken, S410 G4 ürünümüz AU Optronics panel ile gönderilecektir. TCL panel, S410 G4'te göze çarpan bir sorun olan gölgelenmeyi azaltmak için daha hızlı siyah-beyaz ve gri-gri tepki süreleri sunar. Aksi takdirde, 1000 nit parlaklık, makul 1000:1 kontrast oranı ve sınırlı <%60 sRGB renkler dahil olmak üzere diğer tüm özellikler neredeyse aynı kalır.
| |||||||||||||||||||||||||
Aydınlatma: 86 %
Batarya modunda parlaklık: 958.4 cd/m²
Kontrast: 998:1 (Siyah: 0.96 cd/m²)
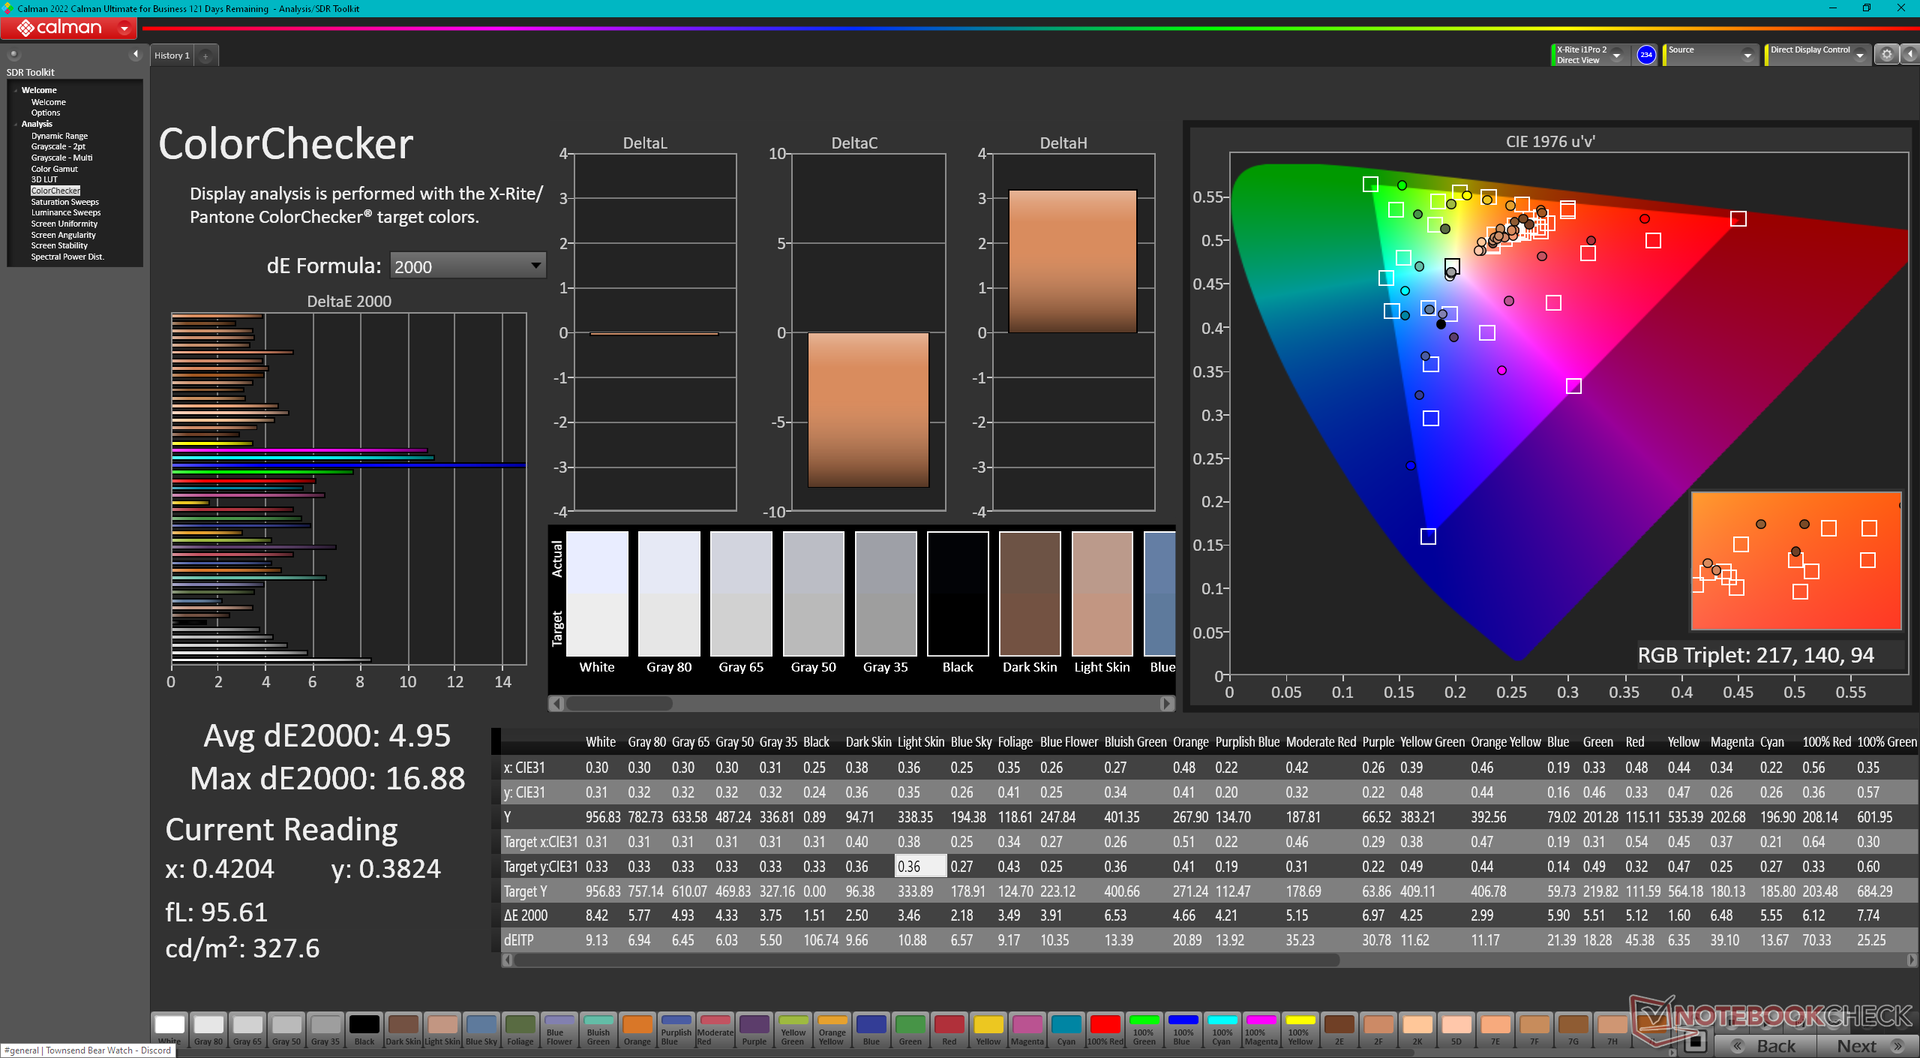
ΔE Color 4.95 | 0.5-29.43 Ø4.87, calibrated: 1.96
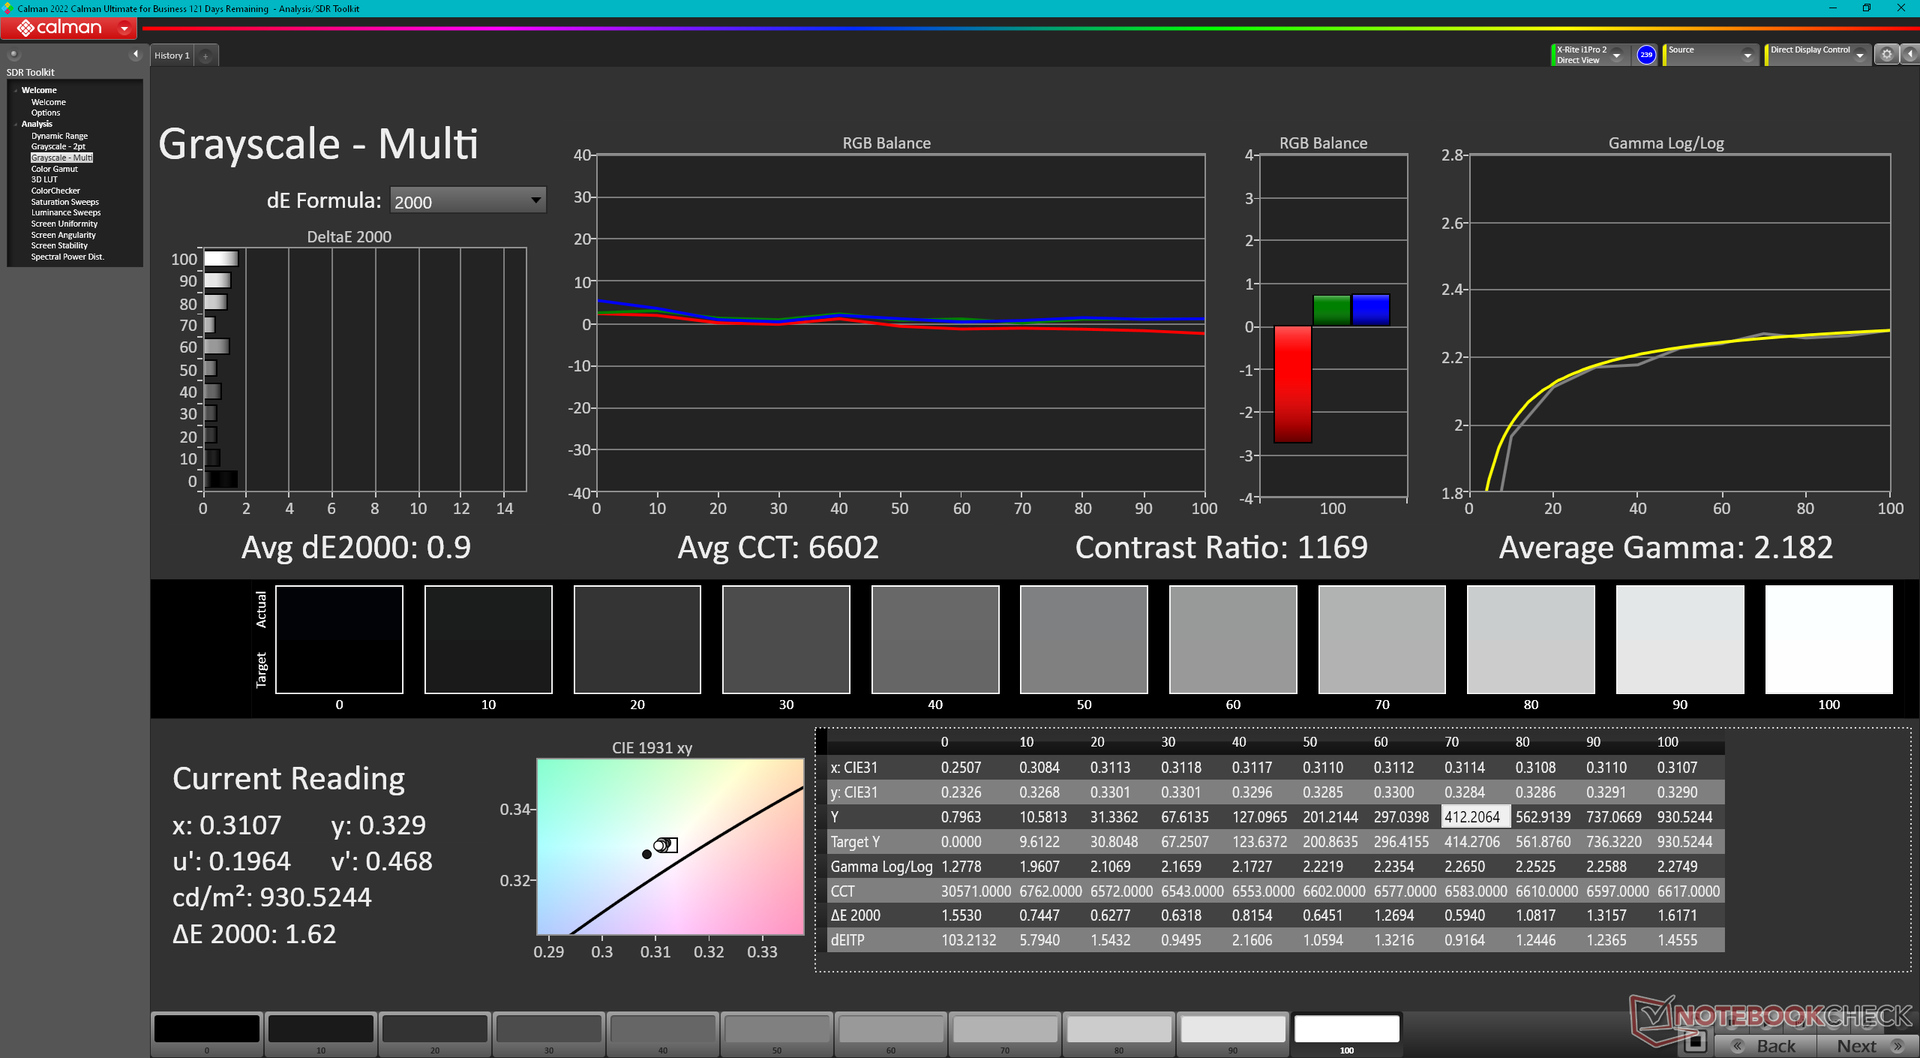
ΔE Greyscale 3.9 | 0.5-98 Ø5.1
39.8% AdobeRGB 1998 (Argyll 2.2.0 3D)
57.9% sRGB (Argyll 2.2.0 3D)
38.5% Display P3 (Argyll 2.2.0 3D)
Gamma: 2.14
| Getac S410 G5 CSOT T9 SNE001BS1-1, IPS, 1920x1080, 14" | Getac S410 Gen 4 AU Optronics AUO413D, IPS, 1920x1080, 14" | Durabook S14I KD140N0730A01, TN, 1920x1080, 14" | Dell Latitude 14 5420-D2G5W AUO5491 / B140HAN, IPS, 1920x1080, 14" | Dell Latitude 7330 Rugged Extreme Sharp LQ133M1, IPS, 1920x1080, 13.3" | Panasonic Toughbook 40 InfoVision M140NWF5 R3, IPS, 1920x1080, 14" | |
|---|---|---|---|---|---|---|
| Display | -1% | 13% | -7% | 72% | -7% | |
| Display P3 Coverage | 38.5 | 38.3 -1% | 43.55 13% | 36 -6% | 67.1 74% | 35.8 -7% |
| sRGB Coverage | 57.9 | 57.2 -1% | 65.4 13% | 54 -7% | 98.2 70% | 53.8 -7% |
| AdobeRGB 1998 Coverage | 39.8 | 39.5 -1% | 45 13% | 37 -7% | 69 73% | 37 -7% |
| Response Times | -30% | -11% | -41% | -143% | -48% | |
| Response Time Grey 50% / Grey 80% * | 29 ? | 35.2 ? -21% | 30.4 ? -5% | 41 ? -41% | 74.4 ? -157% | 50.4 ? -74% |
| Response Time Black / White * | 18.6 ? | 31.2 ? -68% | 11.8 ? 37% | 26 ? -40% | 42.4 ? -128% | 27.6 ? -48% |
| PWM Frequency | 876 ? | 870 ? -1% | 304.9 ? -65% | 694.4 ? -21% | ||
| Screen | -22% | -73% | -10% | 43% | 13% | |
| Brightness middle | 958.4 | 956.9 0% | 1180.7 23% | 290 -70% | 1414.1 48% | 1284.3 34% |
| Brightness | 978 | 984 1% | 1102 13% | 282 -71% | 1282 31% | 1289 32% |
| Brightness Distribution | 86 | 84 -2% | 89 3% | 81 -6% | 84 -2% | 82 -5% |
| Black Level * | 0.96 | 0.81 16% | 1.91 -99% | 0.26 73% | 0.83 14% | 0.89 7% |
| Contrast | 998 | 1181 18% | 618 -38% | 1115 12% | 1704 71% | 1443 45% |
| Colorchecker dE 2000 * | 4.95 | 6.6 -33% | 13.45 -172% | 4.65 6% | 1.99 60% | 4.67 6% |
| Colorchecker dE 2000 max. * | 16.88 | 22.94 -36% | 22.52 -33% | 7.5 56% | 3.75 78% | 19.85 -18% |
| Colorchecker dE 2000 calibrated * | 1.96 | 4.05 -107% | 3.19 -63% | 3.98 -103% | 0.72 63% | 2.21 -13% |
| Greyscale dE 2000 * | 3.9 | 6 -54% | 15.4 -295% | 3.22 17% | 2.8 28% | 2.7 31% |
| Gamma | 2.14 103% | 2.19 100% | 1.97 112% | 2.54 87% | 2.06 107% | 1.97 112% |
| CCT | 7174 91% | 7276 89% | 21134 31% | 6169 105% | 6775 96% | 6222 104% |
| Color Space (Percent of AdobeRGB 1998) | 41.6 | |||||
| Color Space (Percent of sRGB) | 65.5 | |||||
| Toplam Ortalama (Program / Ayarlar) | -18% /
-19% | -24% /
-44% | -19% /
-13% | -9% /
23% | -14% /
-3% |
* ... daha küçük daha iyidir
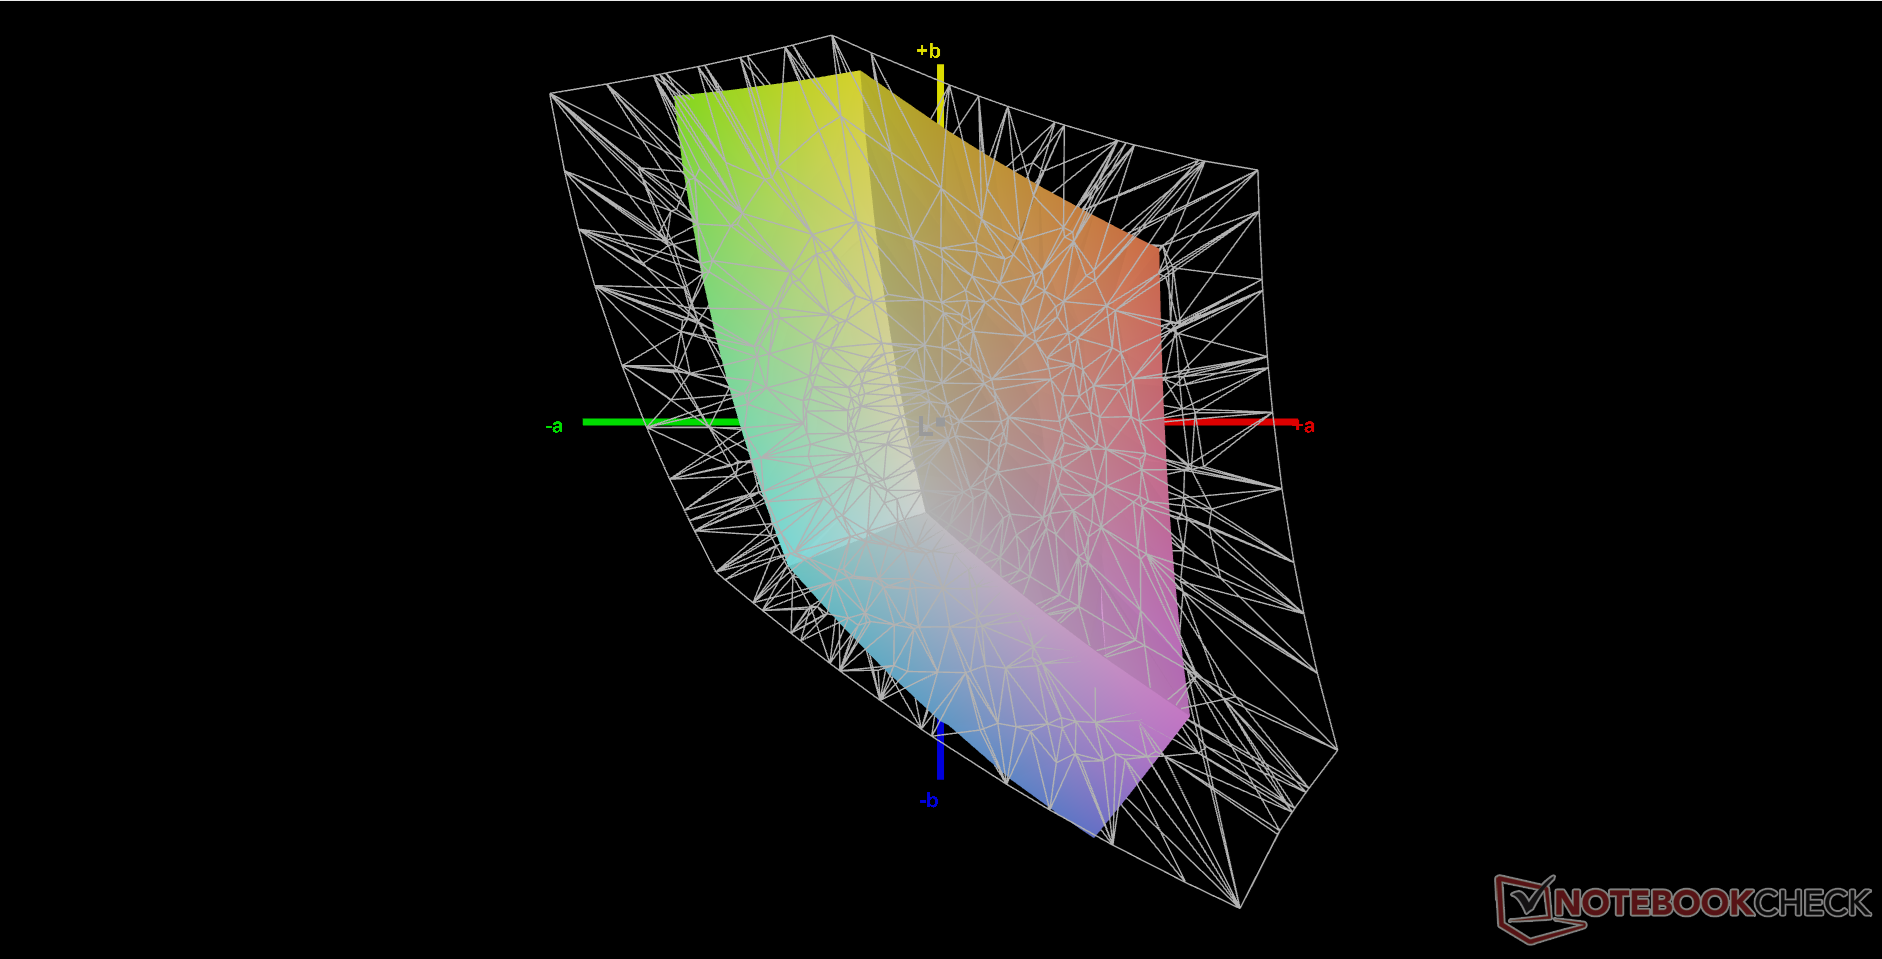
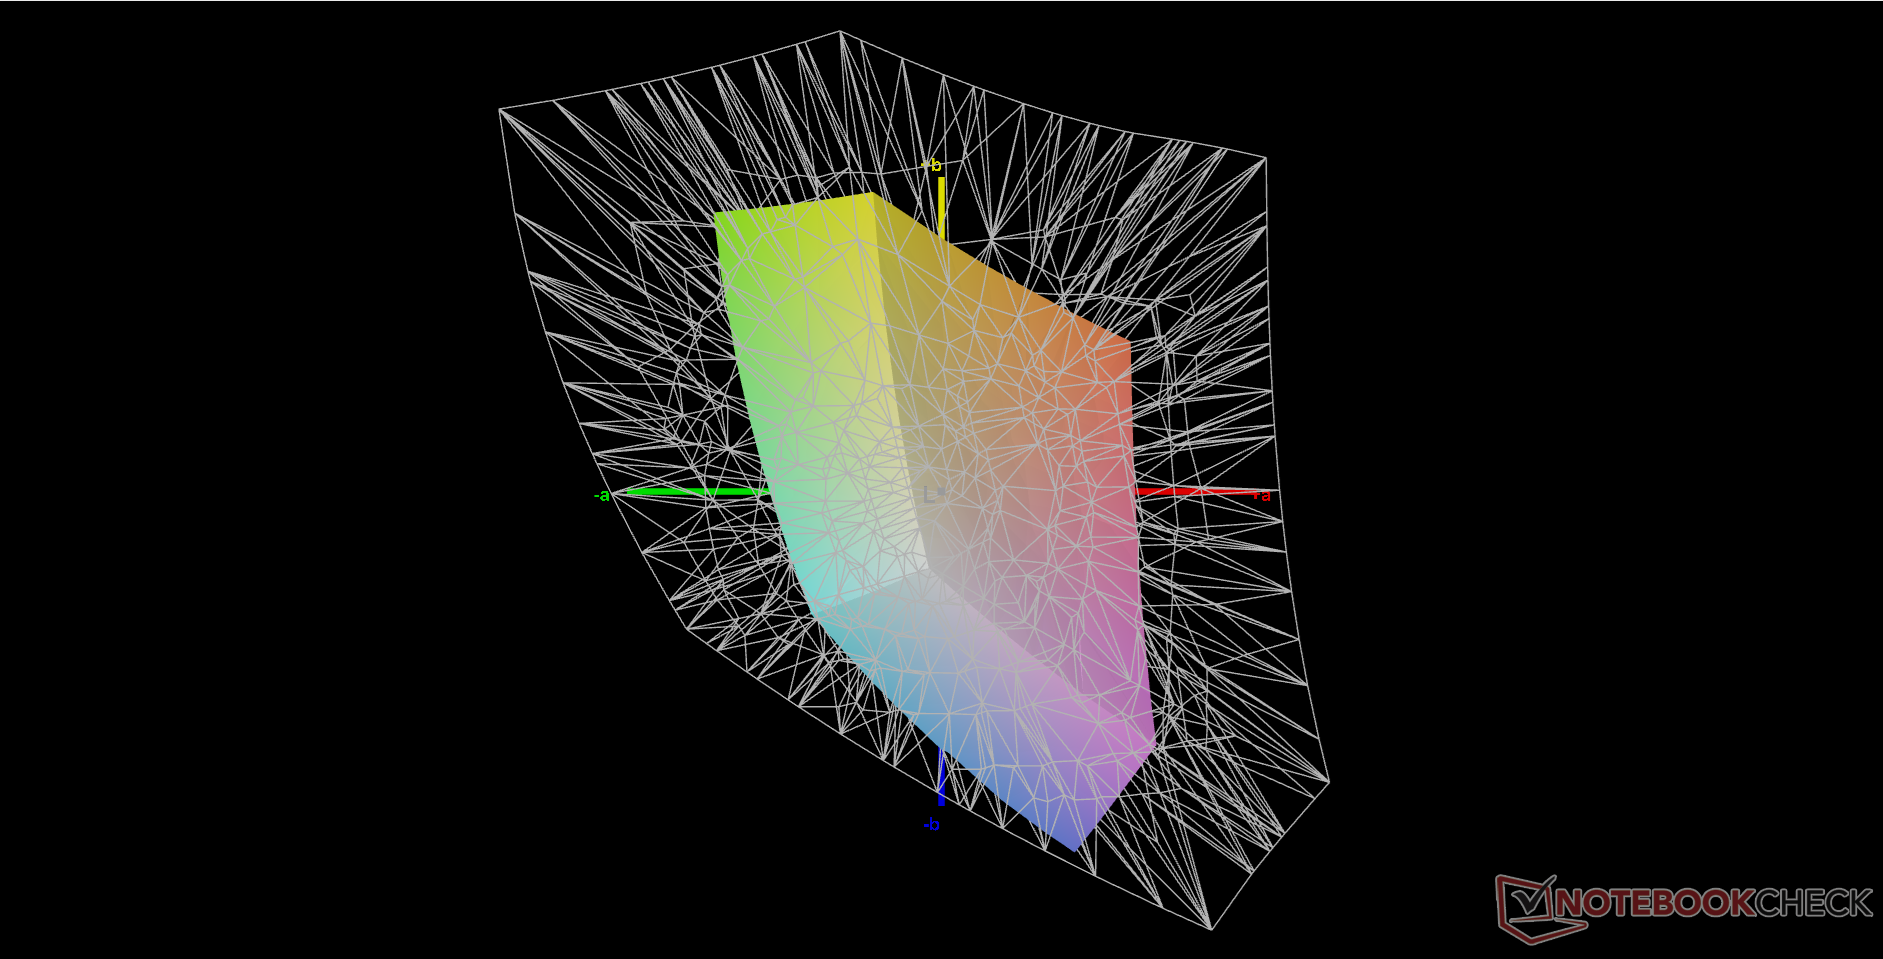
Ekran, 4'ten büyük ortalama deltaE değerleri ve aşırı soğuk renk sıcaklığı ile kötü kalibre edilmiş olarak geliyor. X-Rite renk ölçerimizle uygun bir kalibrasyon bu endişeleri giderir, ancak yukarıda bahsedilen sınırlı renk alanı nedeniyle renkler ne olursa olsun daha yüksek doygunluk seviyelerinde daha yanlış hale gelir. Ekrandan en iyi şekilde yararlanmak için kalibre edilmiş ICM profilimizi uygulamamanızı öneririz.
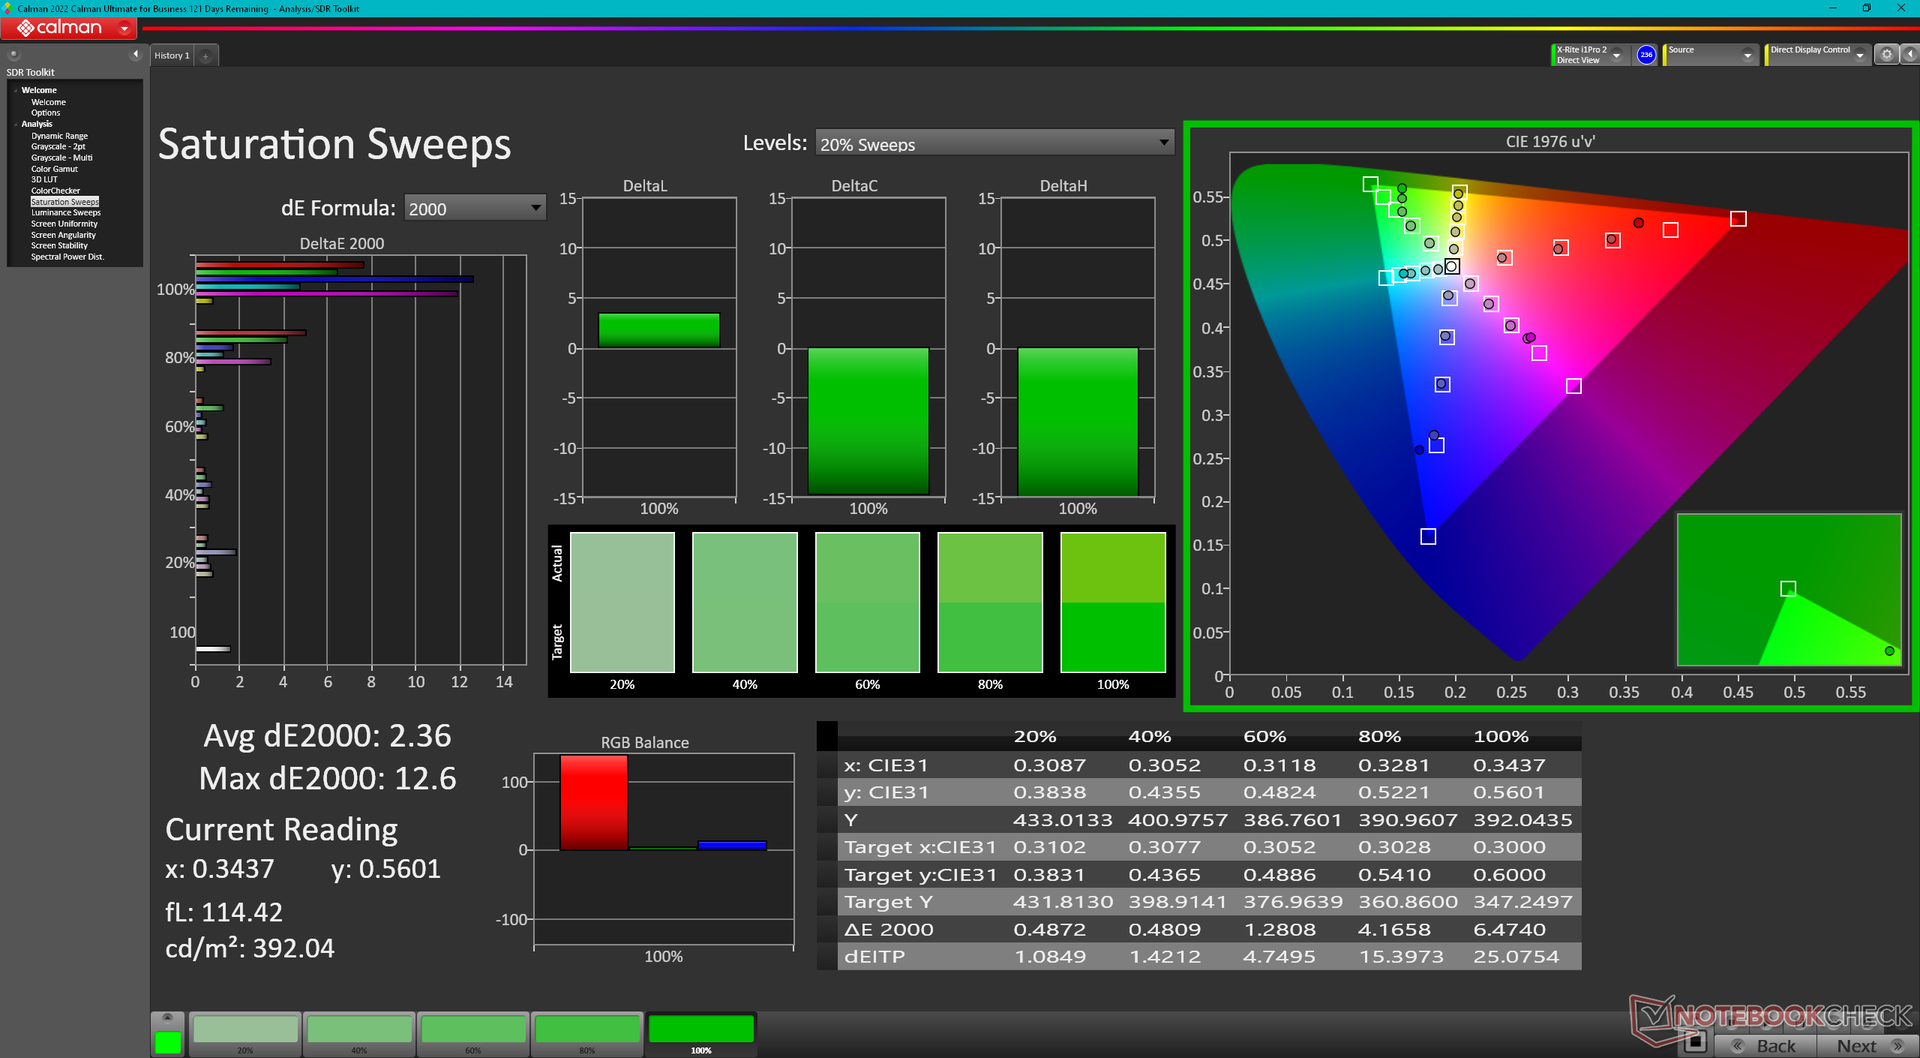
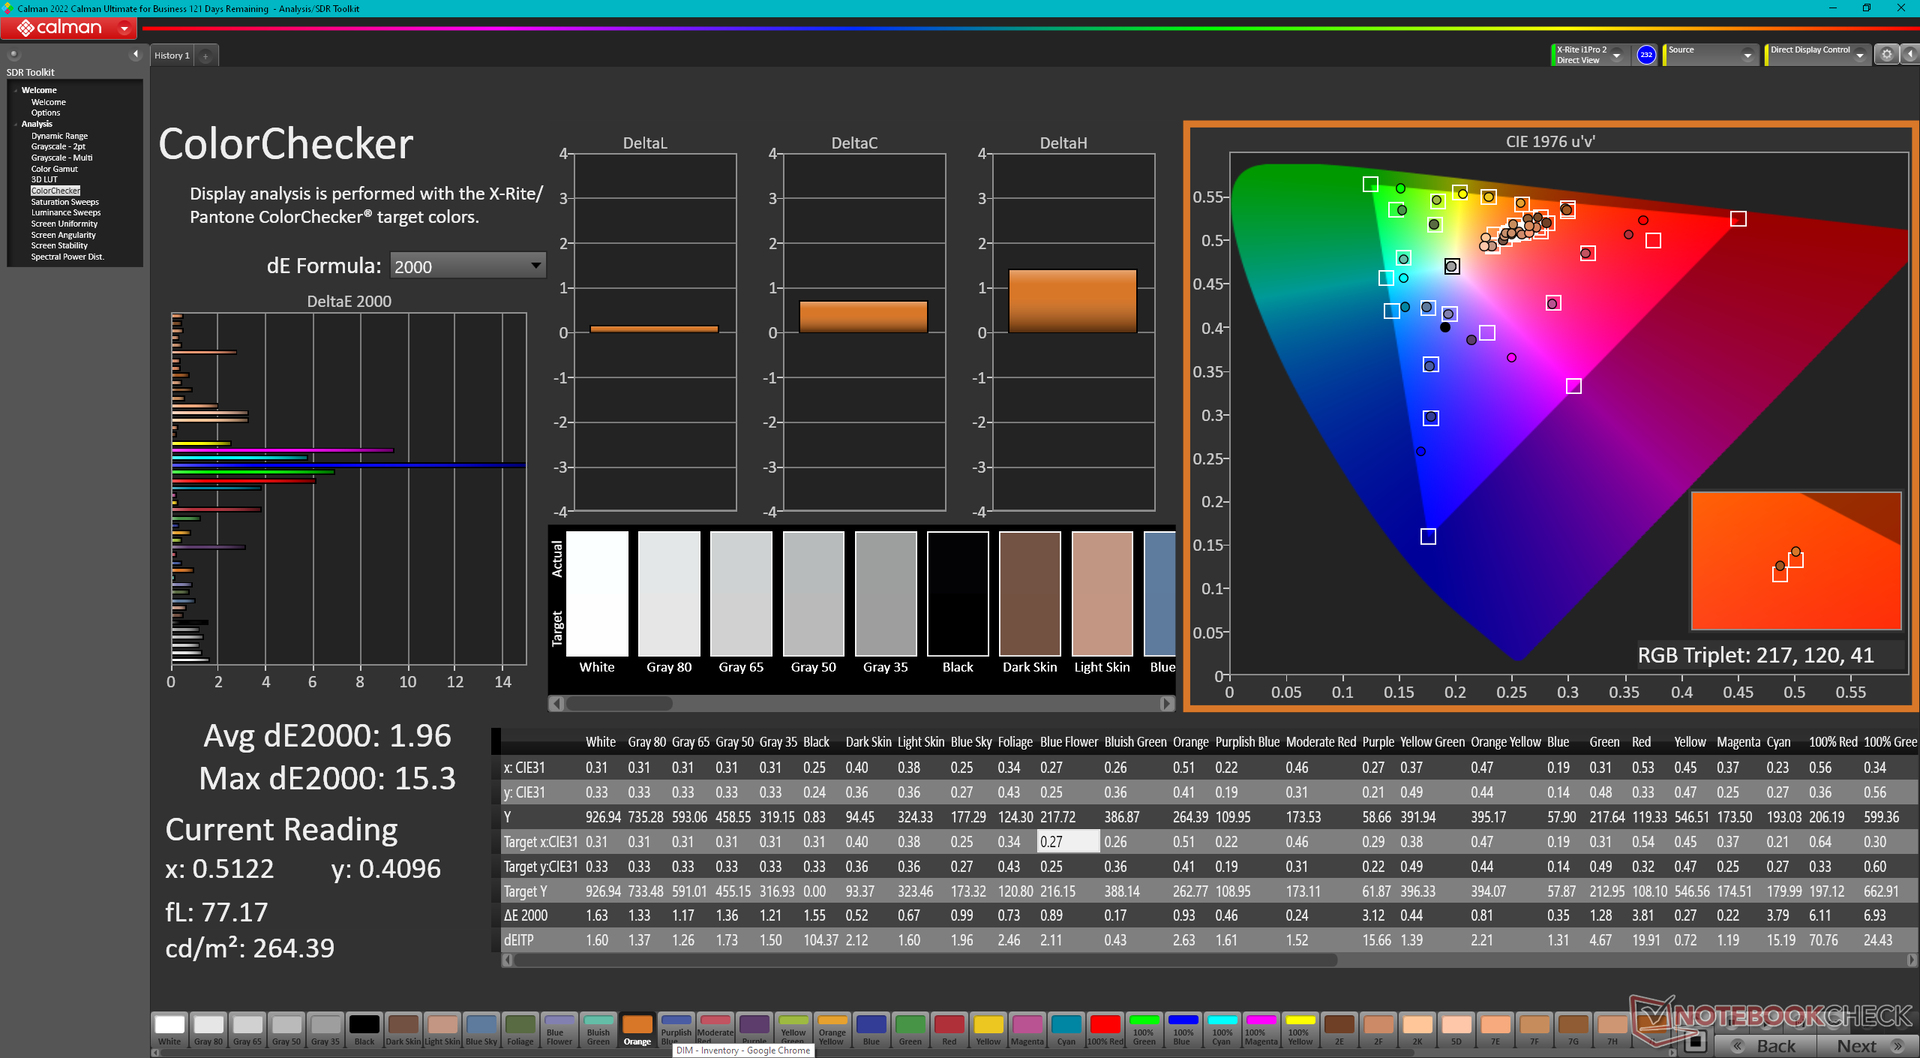
Yanıt Sürelerini Görüntüle
| ↔ Tepki Süresi Siyahtan Beyaza | ||
|---|---|---|
| 18.6 ms ... yükseliş ↗ ve sonbahar↘ birleşimi | ↗ 9.4 ms yükseliş | 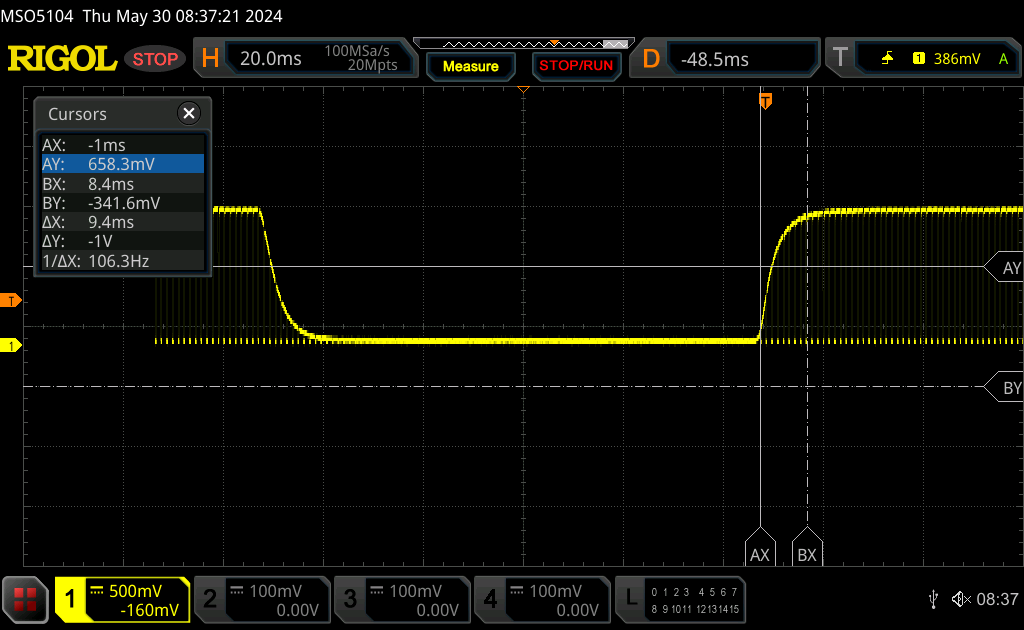 |
| ↘ 9.2 ms sonbahar | ||
| Ekran, testlerimizde iyi yanıt oranları gösteriyor ancak rekabetçi oyuncular için çok yavaş olabilir. Karşılaştırıldığında, test edilen tüm cihazlar 0.1 (minimum) ile 240 (maksimum) ms arasında değişir. » Tüm cihazların 38 %'si daha iyi. Bu, ölçülen yanıt süresinin test edilen tüm cihazların ortalamasından (20.8 ms) daha iyi olduğu anlamına gelir. | ||
| ↔ Tepki Süresi %50 Griden %80 Griye | ||
| 29 ms ... yükseliş ↗ ve sonbahar↘ birleşimi | ↗ 14.6 ms yükseliş | 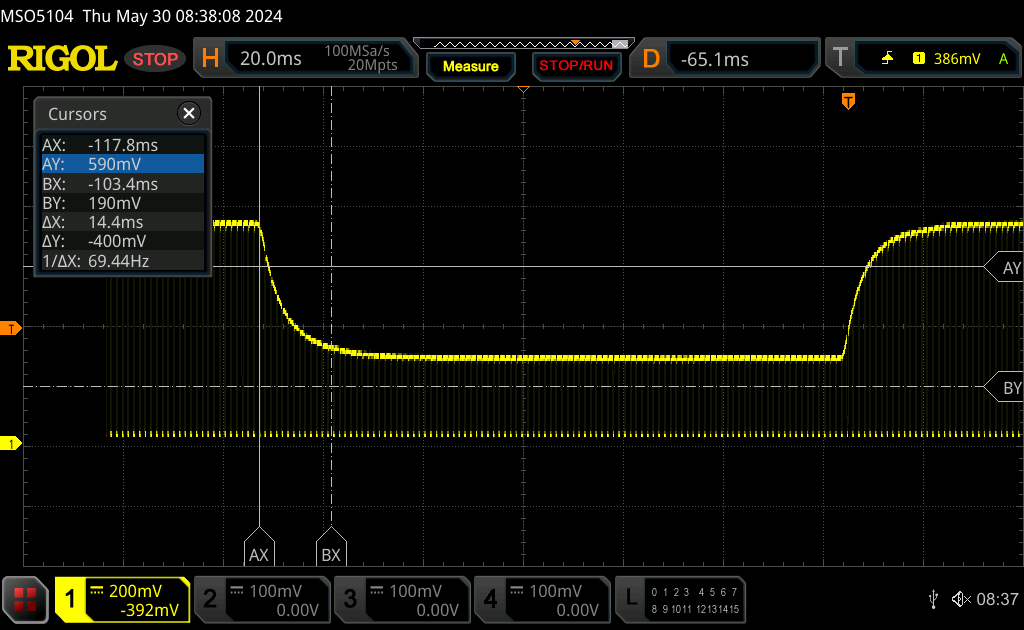 |
| ↘ 14.4 ms sonbahar | ||
| Ekran, testlerimizde nispeten yavaş yanıt oranları gösteriyor ve oyuncular için çok yavaş olabilir. Karşılaştırıldığında, test edilen tüm cihazlar 0.165 (minimum) ile 636 (maksimum) ms arasında değişir. » Tüm cihazların 36 %'si daha iyi. Bu, ölçülen yanıt süresinin test edilen tüm cihazların ortalamasından (32.5 ms) daha iyi olduğu anlamına gelir. | ||
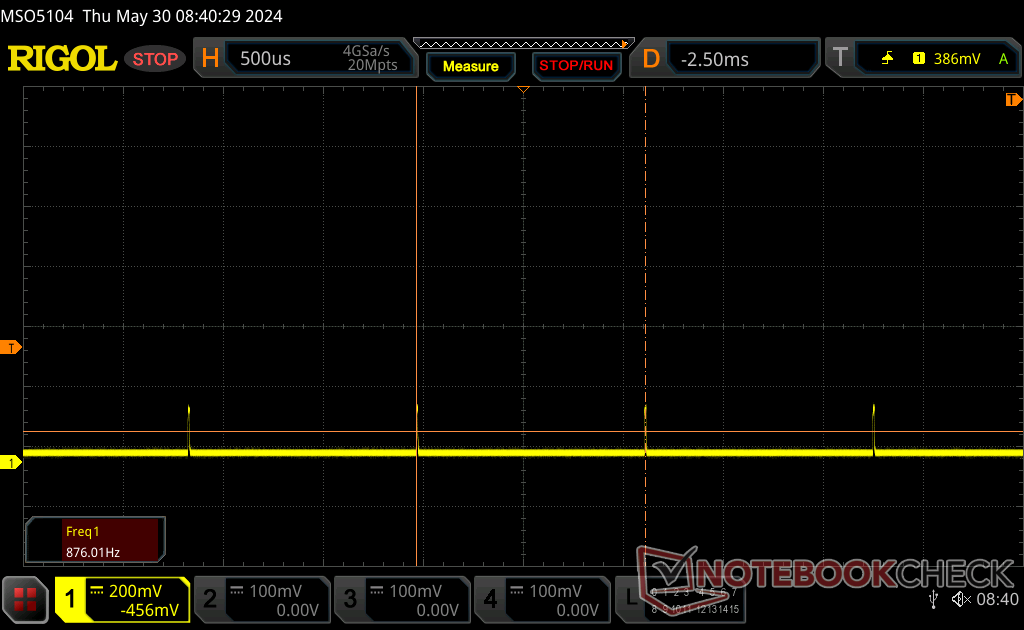
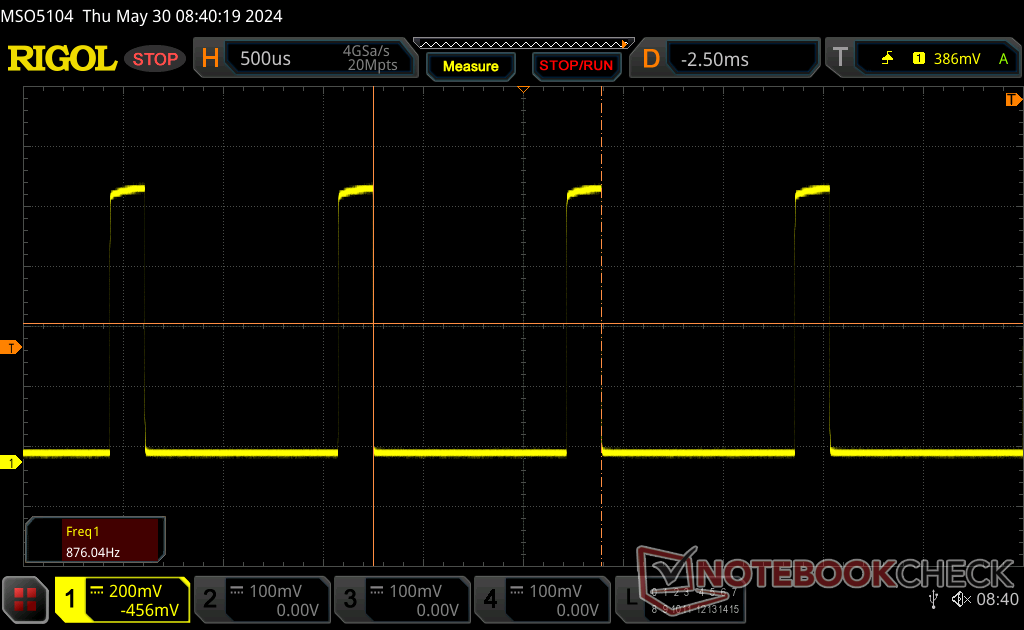
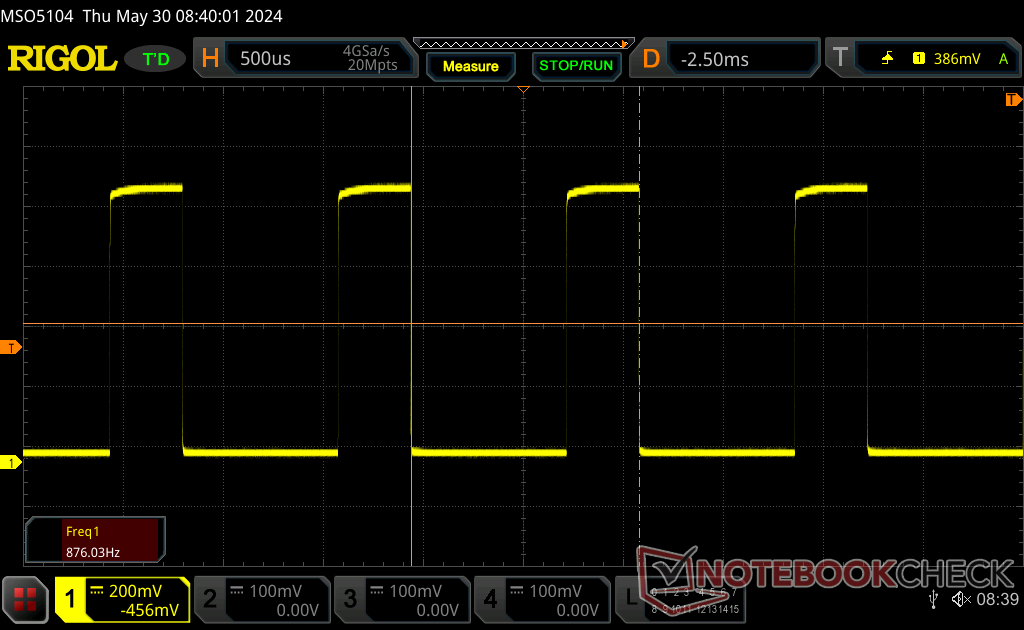
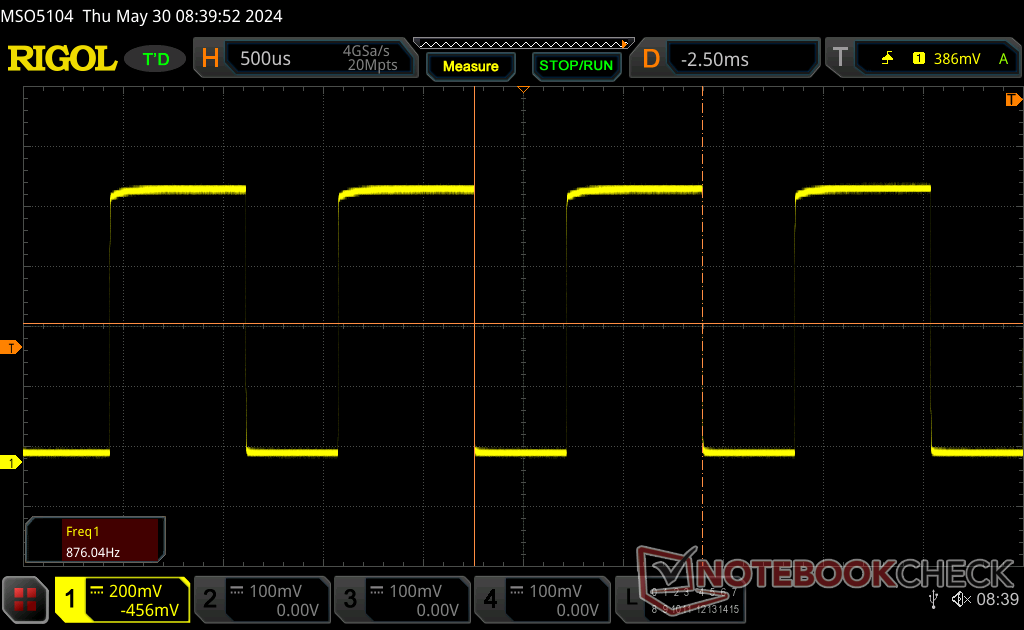
Ekran Titremesi / PWM (Darbe Genişliği Modülasyonu)
| Ekran titriyor / PWM algılandı | 876 Hz | ≤ 100 % parlaklık ayarı | 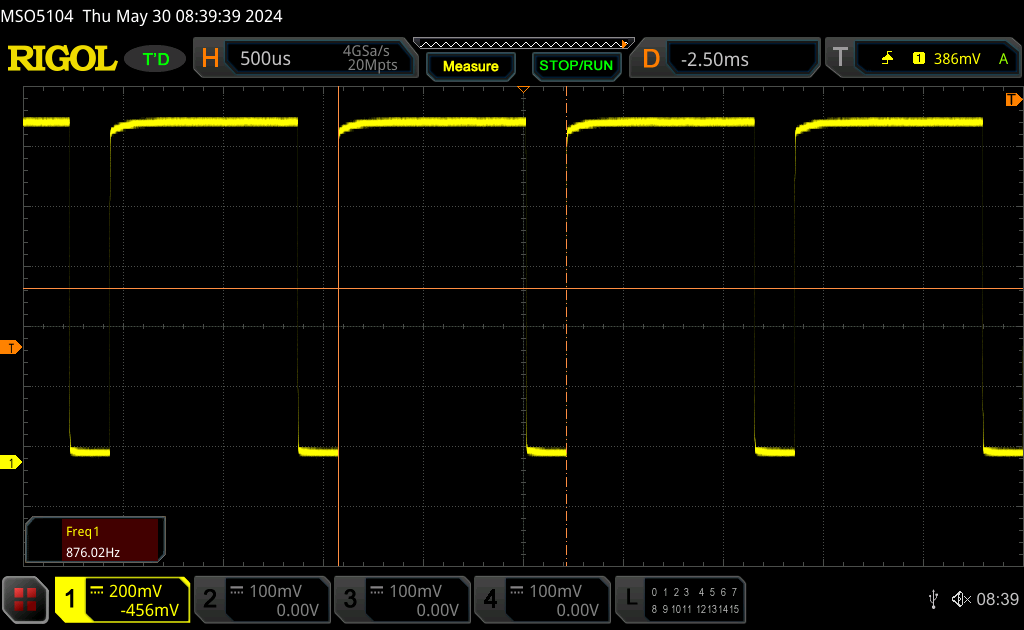 |
Ekran arka ışığı 876 Hz'de titriyor (en kötü durum, örneğin PWM kullanılması) 100 % ve altındaki parlaklık ayarında titreme algılandı. Bu parlaklık ayarının üzerinde titreme veya PWM olmamalıdır. 876 Hz frekansı oldukça yüksektir, bu nedenle PWM'ye duyarlı çoğu kullanıcı herhangi bir titremeyi fark etmemelidir. Karşılaştırıldığında: Test edilen tüm cihazların %53 %'si ekranı karartmak için PWM kullanmıyor. PWM tespit edilirse, ortalama 8516 (minimum: 5 - maksimum: 343500) Hz ölçüldü. | |||
Tüm parlaklık seviyelerinde 876 Hz frekansında darbe genişliği modülasyonu veya titreme mevcuttur. Titremeye karşı hassas olan kullanıcılar ekranı uzun süre kullanmaktan kaçınmak veya en azından parlaklık seviyesini azaltmak isteyebilir.
Performans - Raptor Gölü-P Yükseltmesi
Test Koşulları
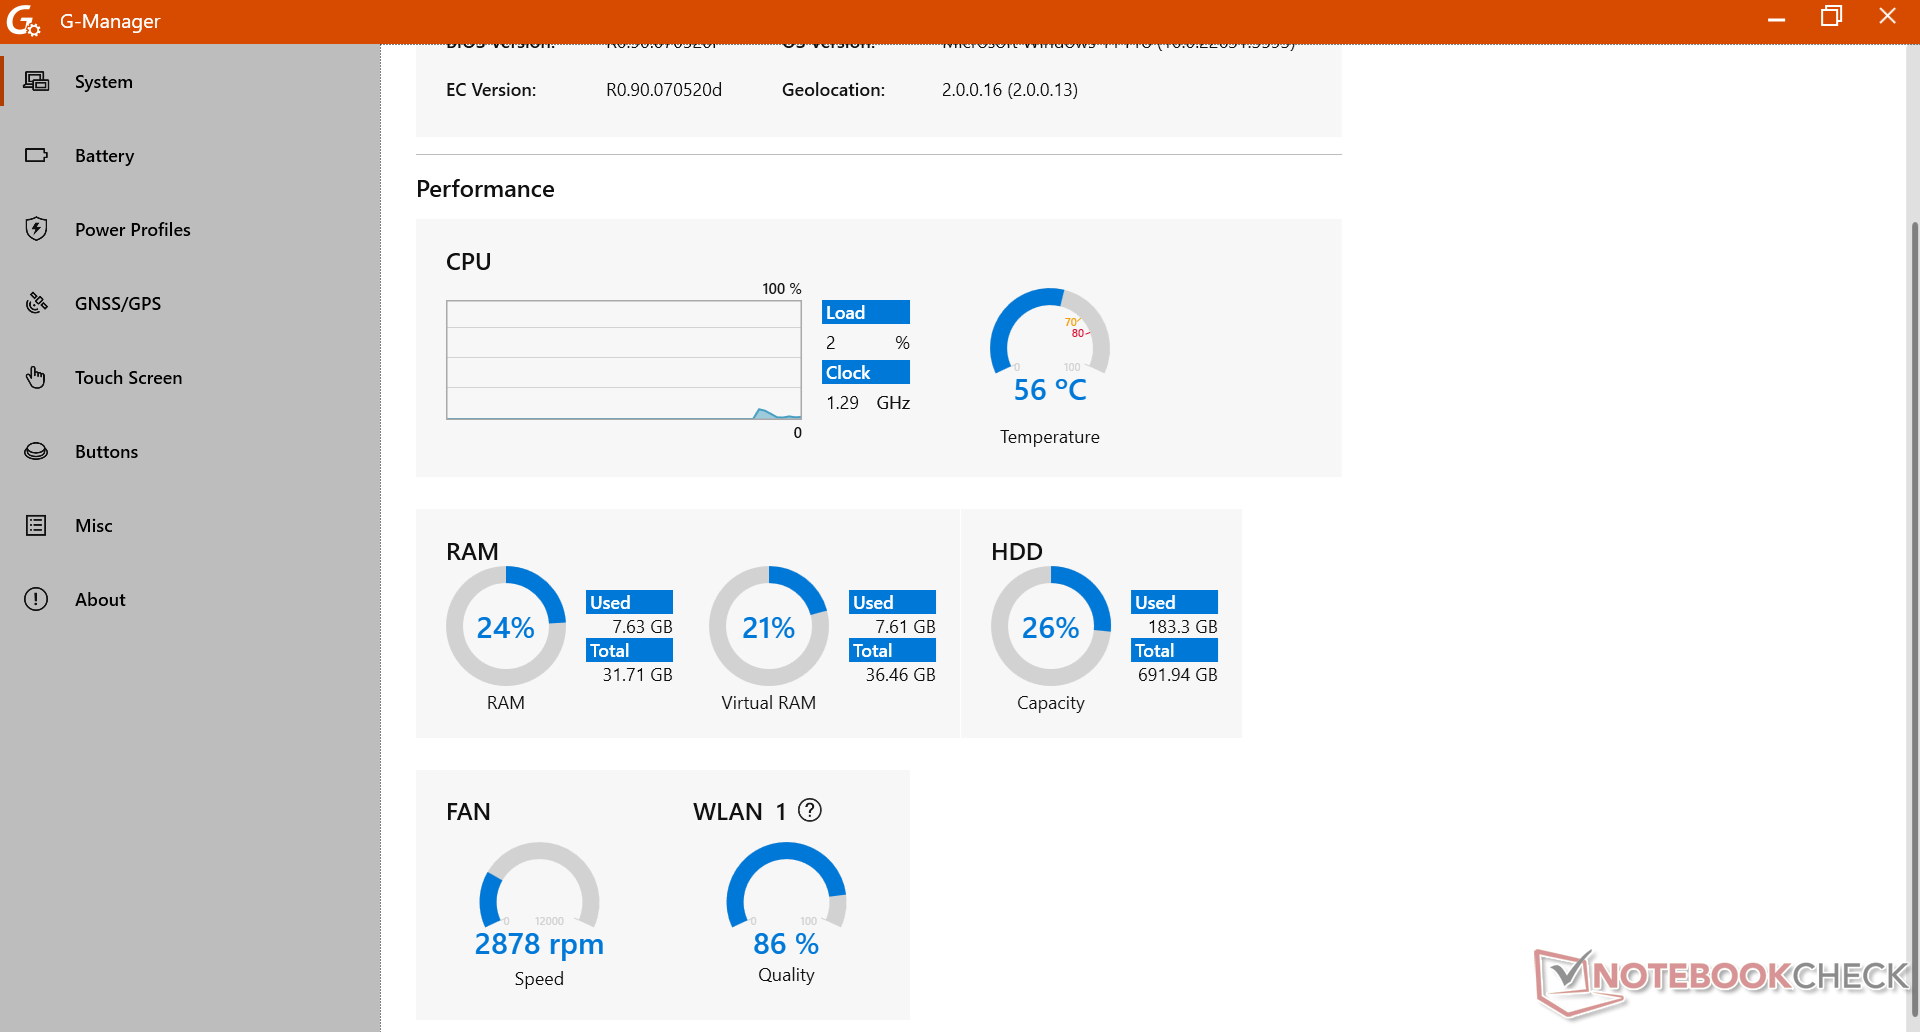
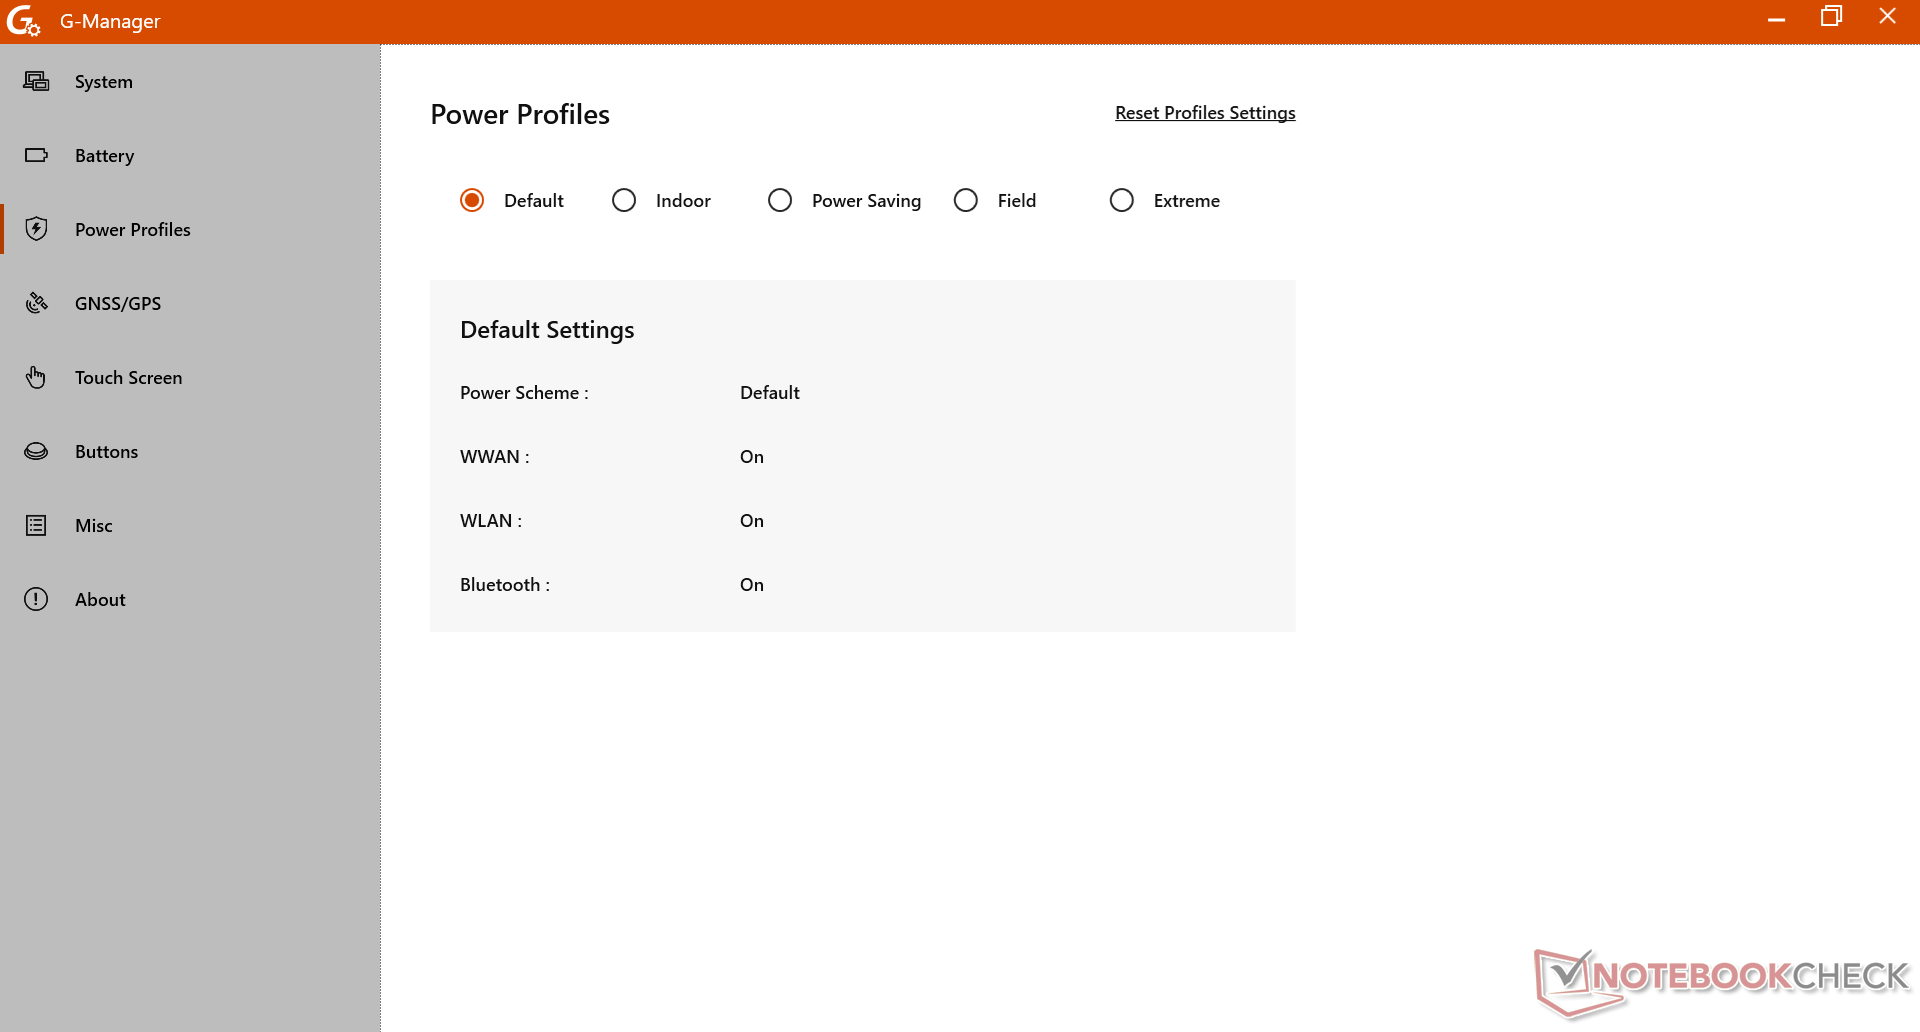
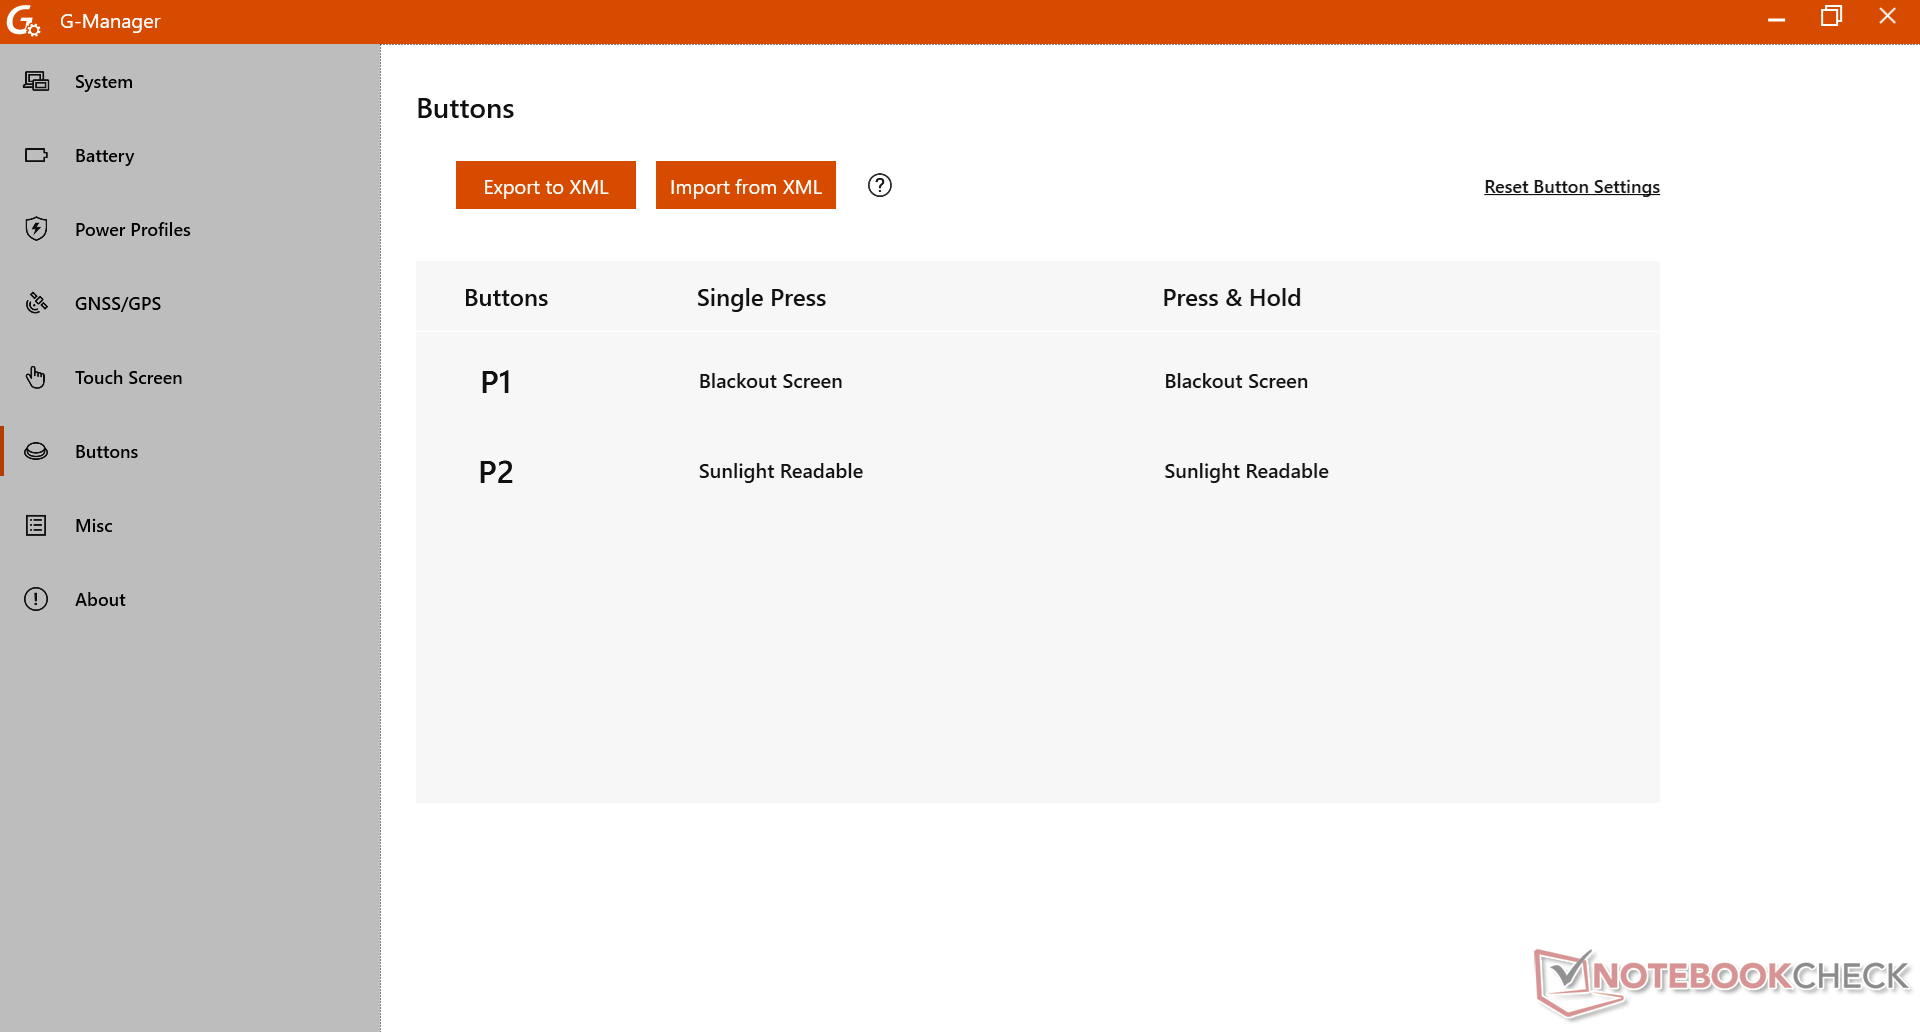
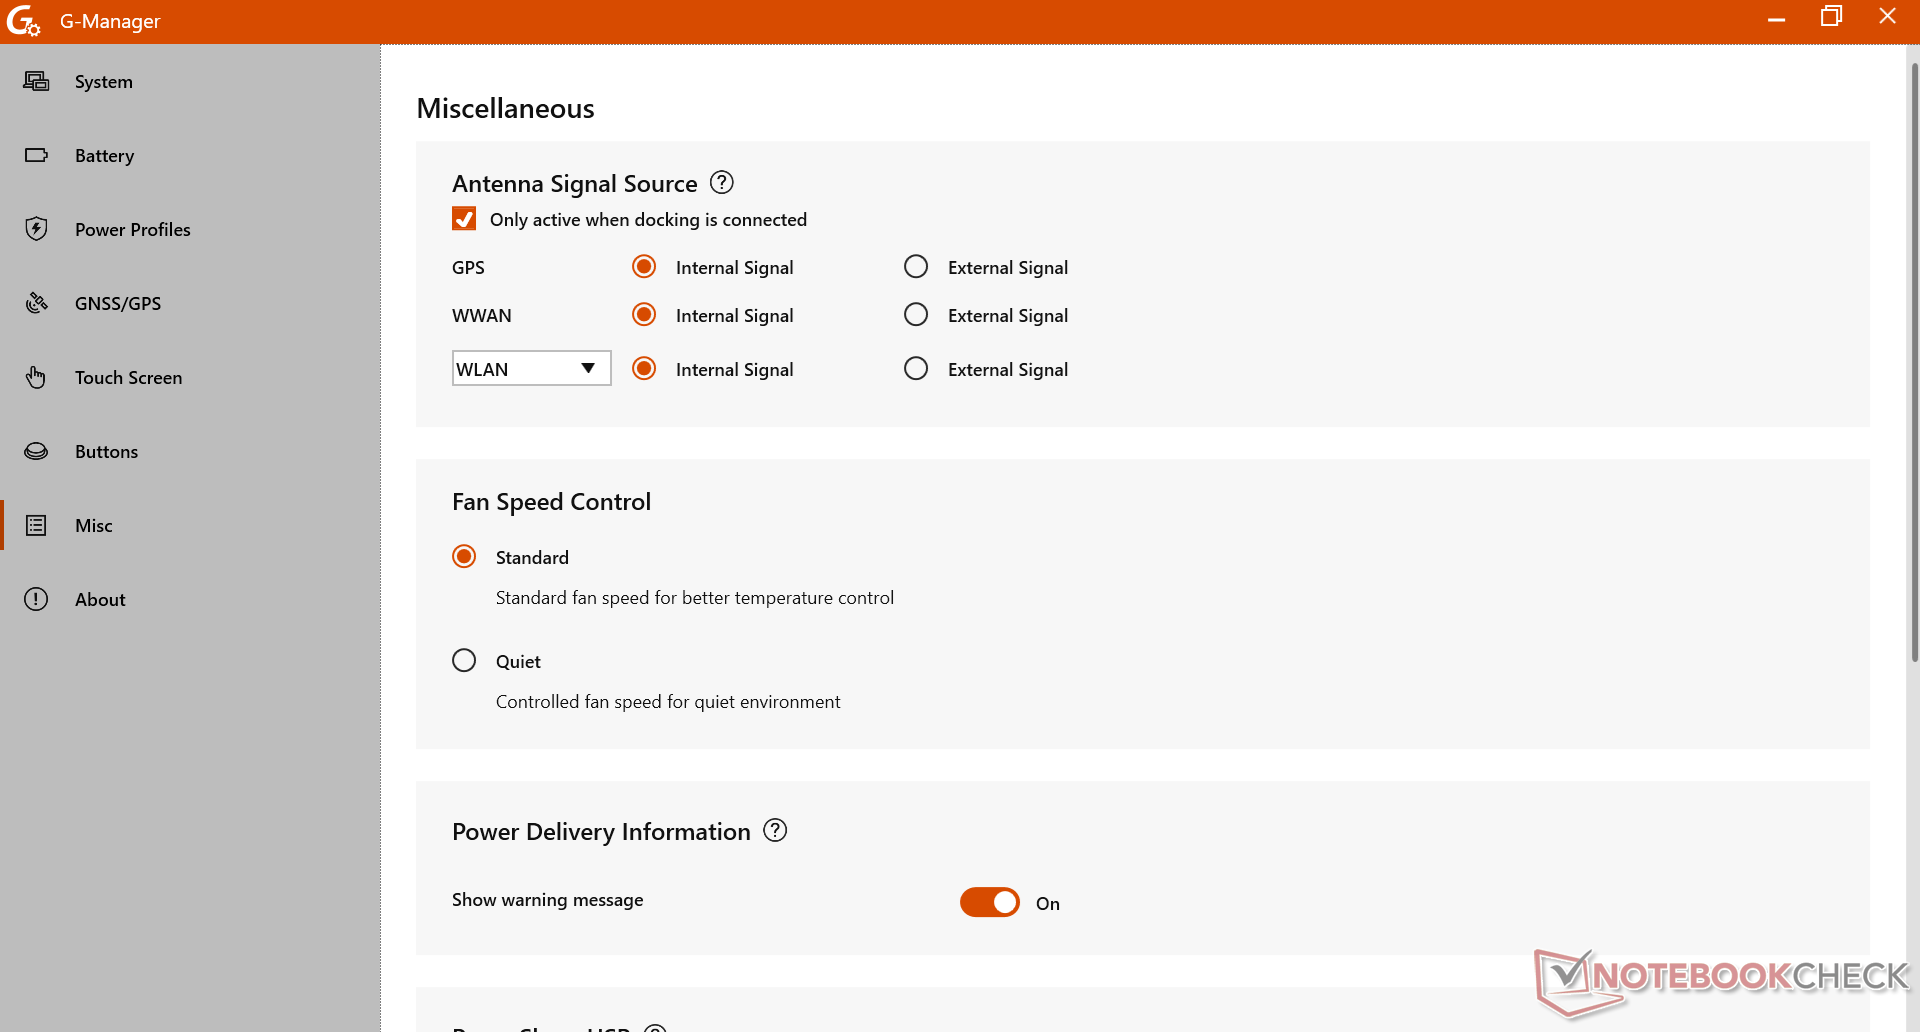
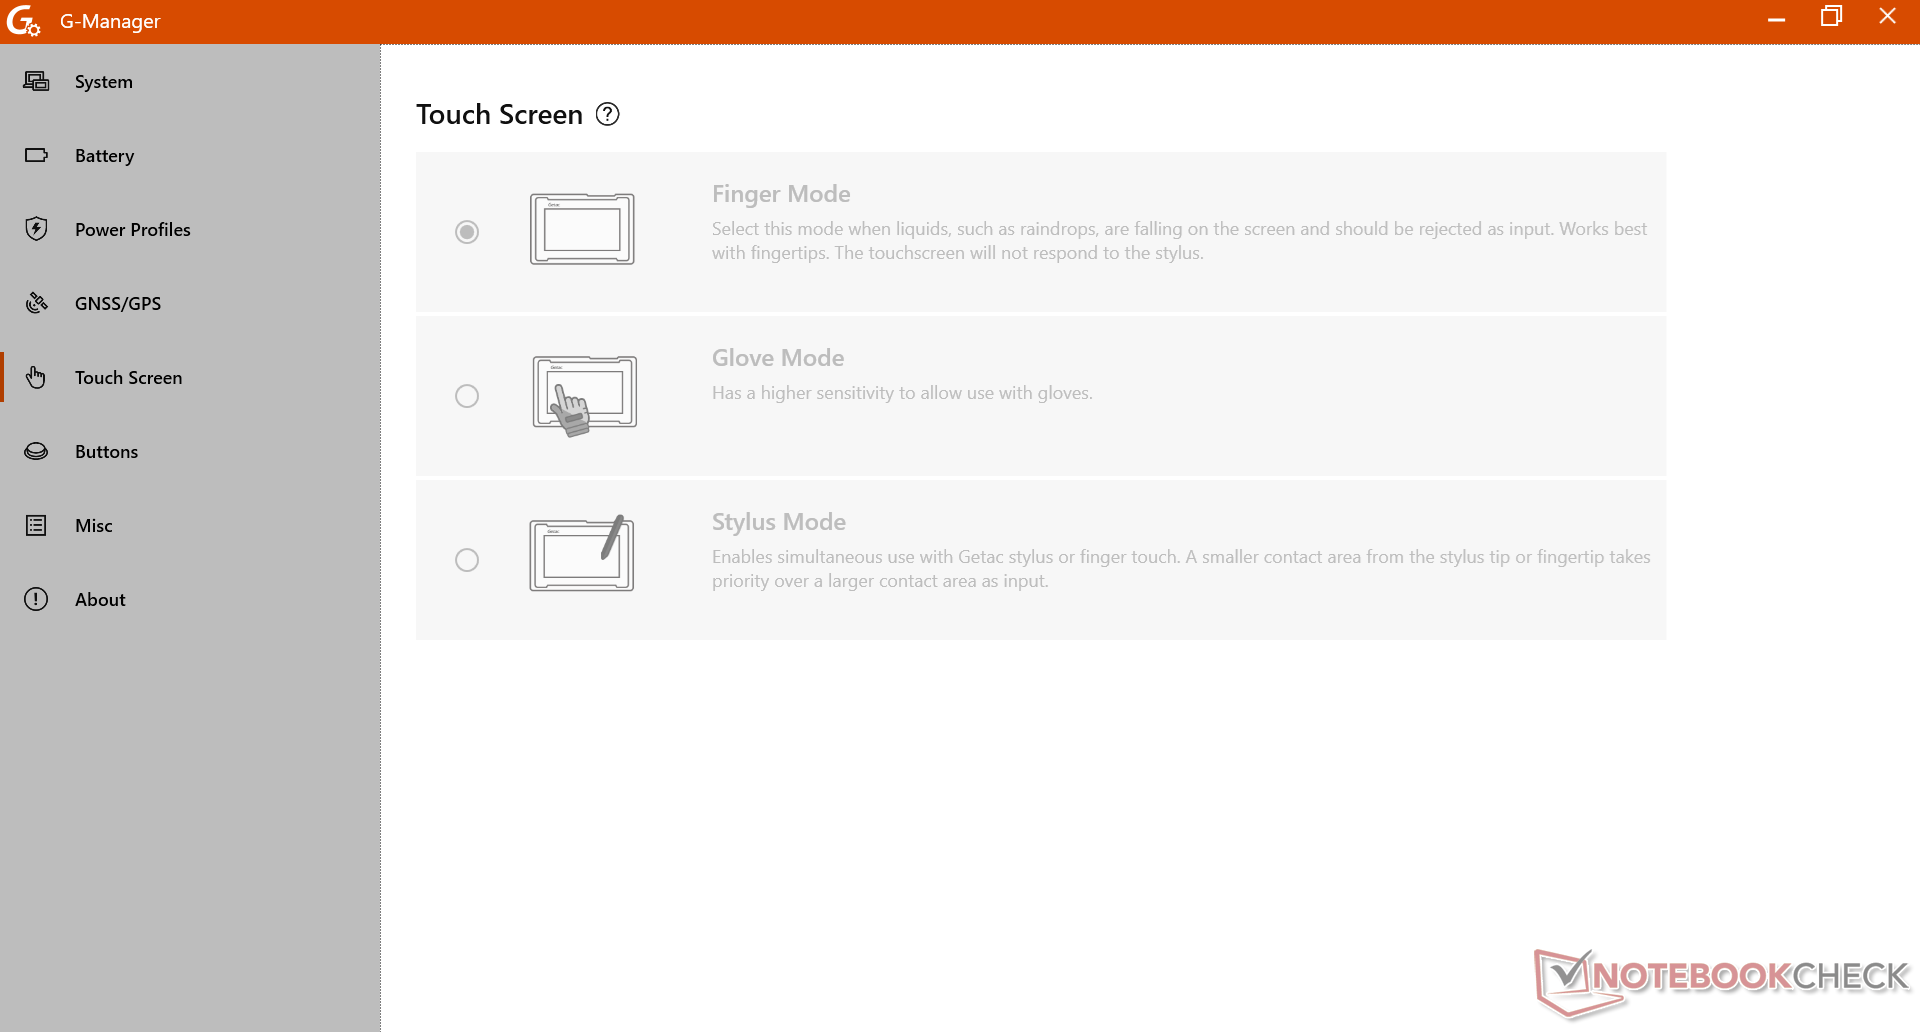
Aşağıdaki kıyaslamaları çalıştırmadan önce Windows'u Performans moduna ve G-Manager'ı Aşırı performans moduna ayarladık. Entegre GPS/GNSS, özelleştirilebilir düğmeler ve dokunmatik ekran hassasiyeti dahil olmak üzere S410'un birçok benzersiz özelliğini ayarlamak için bir merkez olduğundan, kullanıcıların G-Manager'a aşina olmaları önerilir.
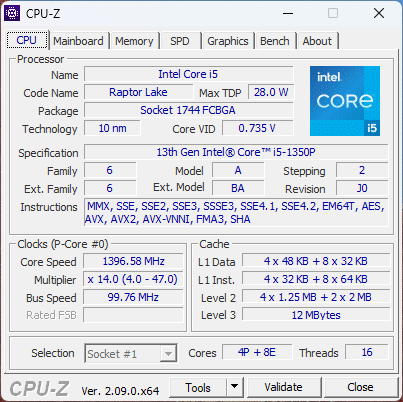
İşlemci
Performans sıçraması Core i7-1185G7 eski S410 G4'te daha yeni Core i5-1350P raptor Lake-P CPU, çok iş parçacıklı iş yükleri söz konusu olduğunda Tiger Lake-U'dan 2 kat daha hızlı olabileceğinden önemlidir. Ancak Turbo Boost, aşağıdaki CineBench R15 xT döngü testi grafiğimizin de gösterdiği gibi sınırlıdır. Buna rağmen, sistem dik azaltmayı hesaba kattıktan sonra bile eskisinden çok daha hızlıdır.
Cinebench R15 Multi Loop
Cinebench R23: Multi Core | Single Core
Cinebench R20: CPU (Multi Core) | CPU (Single Core)
Cinebench R15: CPU Multi 64Bit | CPU Single 64Bit
Blender: v2.79 BMW27 CPU
7-Zip 18.03: 7z b 4 | 7z b 4 -mmt1
Geekbench 6.4: Multi-Core | Single-Core
Geekbench 5.5: Multi-Core | Single-Core
HWBOT x265 Benchmark v2.2: 4k Preset
LibreOffice : 20 Documents To PDF
R Benchmark 2.5: Overall mean
| CPU Performance Rating | |
| Getac S410 G5 | |
| Ortalama Intel Core i5-1350P | |
| Dell Latitude 7330 Rugged Extreme -2! | |
| Panasonic Toughbook FZ-55 MK2 -4! | |
| Getac S410 Gen 4 -2! | |
| Dell Latitude 14 5420-D2G5W -2! | |
| Panasonic Toughbook 40 -2! | |
| Durabook S14I -2! | |
| Panasonic Toughbook FZ-55 -14! | |
| Getac B360 -3! | |
| Getac S410 -14! | |
| Cinebench R23 / Multi Core | |
| Getac S410 G5 | |
| Ortalama Intel Core i5-1350P (n=1) | |
| Dell Latitude 7330 Rugged Extreme | |
| Dell Latitude 14 5420-D2G5W | |
| Panasonic Toughbook FZ-55 MK2 | |
| Getac S410 Gen 4 | |
| Panasonic Toughbook 40 | |
| Getac B360 | |
| Durabook S14I | |
| Cinebench R23 / Single Core | |
| Getac S410 G5 | |
| Ortalama Intel Core i5-1350P (n=1) | |
| Dell Latitude 7330 Rugged Extreme | |
| Panasonic Toughbook FZ-55 MK2 | |
| Getac S410 Gen 4 | |
| Panasonic Toughbook 40 | |
| Durabook S14I | |
| Dell Latitude 14 5420-D2G5W | |
| Getac B360 | |
| Cinebench R20 / CPU (Multi Core) | |
| Getac S410 G5 | |
| Ortalama Intel Core i5-1350P (n=1) | |
| Dell Latitude 14 5420-D2G5W | |
| Dell Latitude 7330 Rugged Extreme | |
| Panasonic Toughbook FZ-55 MK2 | |
| Getac S410 Gen 4 | |
| Panasonic Toughbook 40 | |
| Getac B360 | |
| Durabook S14I | |
| Cinebench R20 / CPU (Single Core) | |
| Getac S410 G5 | |
| Ortalama Intel Core i5-1350P (n=1) | |
| Dell Latitude 7330 Rugged Extreme | |
| Panasonic Toughbook FZ-55 MK2 | |
| Getac S410 Gen 4 | |
| Durabook S14I | |
| Panasonic Toughbook 40 | |
| Dell Latitude 14 5420-D2G5W | |
| Getac B360 | |
| Cinebench R15 / CPU Multi 64Bit | |
| Getac S410 G5 | |
| Ortalama Intel Core i5-1350P (n=1) | |
| Dell Latitude 14 5420-D2G5W | |
| Dell Latitude 7330 Rugged Extreme | |
| Panasonic Toughbook FZ-55 MK2 | |
| Getac S410 Gen 4 | |
| Panasonic Toughbook 40 | |
| Getac B360 | |
| Durabook S14I | |
| Panasonic Toughbook FZ-55 | |
| Getac S410 | |
| Cinebench R15 / CPU Single 64Bit | |
| Getac S410 G5 | |
| Ortalama Intel Core i5-1350P (n=1) | |
| Dell Latitude 7330 Rugged Extreme | |
| Panasonic Toughbook FZ-55 MK2 | |
| Getac S410 Gen 4 | |
| Durabook S14I | |
| Panasonic Toughbook 40 | |
| Dell Latitude 14 5420-D2G5W | |
| Getac B360 | |
| Panasonic Toughbook FZ-55 | |
| Getac S410 | |
| Blender / v2.79 BMW27 CPU | |
| Durabook S14I | |
| Getac B360 | |
| Panasonic Toughbook 40 | |
| Getac S410 Gen 4 | |
| Panasonic Toughbook FZ-55 MK2 | |
| Dell Latitude 7330 Rugged Extreme | |
| Dell Latitude 14 5420-D2G5W | |
| Getac S410 G5 | |
| Ortalama Intel Core i5-1350P (n=1) | |
| 7-Zip 18.03 / 7z b 4 | |
| Getac S410 G5 | |
| Ortalama Intel Core i5-1350P (n=1) | |
| Dell Latitude 7330 Rugged Extreme | |
| Panasonic Toughbook FZ-55 MK2 | |
| Dell Latitude 14 5420-D2G5W | |
| Getac S410 Gen 4 | |
| Getac B360 | |
| Panasonic Toughbook 40 | |
| Durabook S14I | |
| 7-Zip 18.03 / 7z b 4 -mmt1 | |
| Dell Latitude 7330 Rugged Extreme | |
| Panasonic Toughbook FZ-55 MK2 | |
| Durabook S14I | |
| Getac S410 G5 | |
| Ortalama Intel Core i5-1350P (n=1) | |
| Panasonic Toughbook 40 | |
| Getac S410 Gen 4 | |
| Dell Latitude 14 5420-D2G5W | |
| Getac B360 | |
| Geekbench 6.4 / Multi-Core | |
| Getac S410 G5 | |
| Ortalama Intel Core i5-1350P (n=1) | |
| Geekbench 6.4 / Single-Core | |
| Getac S410 G5 | |
| Ortalama Intel Core i5-1350P (n=1) | |
| Geekbench 5.5 / Multi-Core | |
| Getac S410 G5 | |
| Ortalama Intel Core i5-1350P (n=1) | |
| Dell Latitude 7330 Rugged Extreme | |
| Getac S410 Gen 4 | |
| Panasonic Toughbook 40 | |
| Getac B360 | |
| Durabook S14I | |
| Dell Latitude 14 5420-D2G5W | |
| Geekbench 5.5 / Single-Core | |
| Getac S410 G5 | |
| Ortalama Intel Core i5-1350P (n=1) | |
| Dell Latitude 7330 Rugged Extreme | |
| Durabook S14I | |
| Getac S410 Gen 4 | |
| Panasonic Toughbook 40 | |
| Getac B360 | |
| Dell Latitude 14 5420-D2G5W | |
| HWBOT x265 Benchmark v2.2 / 4k Preset | |
| Getac S410 G5 | |
| Ortalama Intel Core i5-1350P (n=1) | |
| Dell Latitude 7330 Rugged Extreme | |
| Panasonic Toughbook FZ-55 MK2 | |
| Getac S410 Gen 4 | |
| Dell Latitude 14 5420-D2G5W | |
| Panasonic Toughbook 40 | |
| Getac B360 | |
| Durabook S14I | |
| LibreOffice / 20 Documents To PDF | |
| Dell Latitude 14 5420-D2G5W | |
| Panasonic Toughbook 40 | |
| Getac S410 Gen 4 | |
| Dell Latitude 7330 Rugged Extreme | |
| Panasonic Toughbook FZ-55 MK2 | |
| Durabook S14I | |
| Getac S410 G5 | |
| Ortalama Intel Core i5-1350P (n=1) | |
| R Benchmark 2.5 / Overall mean | |
| Getac B360 | |
| Dell Latitude 14 5420-D2G5W | |
| Panasonic Toughbook 40 | |
| Getac S410 Gen 4 | |
| Durabook S14I | |
| Panasonic Toughbook FZ-55 MK2 | |
| Dell Latitude 7330 Rugged Extreme | |
| Getac S410 G5 | |
| Ortalama Intel Core i5-1350P (n=1) | |
* ... daha küçük daha iyidir
AIDA64: FP32 Ray-Trace | FPU Julia | CPU SHA3 | CPU Queen | FPU SinJulia | FPU Mandel | CPU AES | CPU ZLib | FP64 Ray-Trace | CPU PhotoWorxx
| Performance Rating | |
| Getac S410 G5 | |
| Ortalama Intel Core i5-1350P | |
| Dell Latitude 7330 Rugged Extreme | |
| Dell Latitude 14 5420-D2G5W | |
| Getac S410 Gen 4 | |
| Panasonic Toughbook 40 | |
| Durabook S14I | |
| AIDA64 / FP32 Ray-Trace | |
| Getac S410 G5 | |
| Ortalama Intel Core i5-1350P (n=1) | |
| Dell Latitude 14 5420-D2G5W | |
| Dell Latitude 7330 Rugged Extreme | |
| Getac S410 Gen 4 | |
| Panasonic Toughbook 40 | |
| Durabook S14I | |
| AIDA64 / FPU Julia | |
| Getac S410 G5 | |
| Ortalama Intel Core i5-1350P (n=1) | |
| Dell Latitude 7330 Rugged Extreme | |
| Dell Latitude 14 5420-D2G5W | |
| Getac S410 Gen 4 | |
| Panasonic Toughbook 40 | |
| Durabook S14I | |
| AIDA64 / CPU SHA3 | |
| Dell Latitude 7330 Rugged Extreme | |
| Dell Latitude 14 5420-D2G5W | |
| Getac S410 G5 | |
| Ortalama Intel Core i5-1350P (n=1) | |
| Getac S410 Gen 4 | |
| Panasonic Toughbook 40 | |
| Durabook S14I | |
| AIDA64 / CPU Queen | |
| Getac S410 G5 | |
| Ortalama Intel Core i5-1350P (n=1) | |
| Dell Latitude 7330 Rugged Extreme | |
| Durabook S14I | |
| Getac S410 Gen 4 | |
| Dell Latitude 14 5420-D2G5W | |
| Panasonic Toughbook 40 | |
| AIDA64 / FPU SinJulia | |
| Getac S410 G5 | |
| Ortalama Intel Core i5-1350P (n=1) | |
| Dell Latitude 7330 Rugged Extreme | |
| Dell Latitude 14 5420-D2G5W | |
| Getac S410 Gen 4 | |
| Panasonic Toughbook 40 | |
| Durabook S14I | |
| AIDA64 / FPU Mandel | |
| Getac S410 G5 | |
| Ortalama Intel Core i5-1350P (n=1) | |
| Dell Latitude 7330 Rugged Extreme | |
| Dell Latitude 14 5420-D2G5W | |
| Getac S410 Gen 4 | |
| Panasonic Toughbook 40 | |
| Durabook S14I | |
| AIDA64 / CPU AES | |
| Dell Latitude 7330 Rugged Extreme | |
| Dell Latitude 14 5420-D2G5W | |
| Durabook S14I | |
| Getac S410 G5 | |
| Ortalama Intel Core i5-1350P (n=1) | |
| Getac S410 Gen 4 | |
| Panasonic Toughbook 40 | |
| AIDA64 / CPU ZLib | |
| Getac S410 G5 | |
| Ortalama Intel Core i5-1350P (n=1) | |
| Dell Latitude 7330 Rugged Extreme | |
| Dell Latitude 14 5420-D2G5W | |
| Panasonic Toughbook 40 | |
| Getac S410 Gen 4 | |
| Durabook S14I | |
| AIDA64 / FP64 Ray-Trace | |
| Getac S410 G5 | |
| Ortalama Intel Core i5-1350P (n=1) | |
| Dell Latitude 7330 Rugged Extreme | |
| Dell Latitude 14 5420-D2G5W | |
| Getac S410 Gen 4 | |
| Panasonic Toughbook 40 | |
| Durabook S14I | |
| AIDA64 / CPU PhotoWorxx | |
| Dell Latitude 7330 Rugged Extreme | |
| Getac S410 G5 | |
| Ortalama Intel Core i5-1350P (n=1) | |
| Getac S410 Gen 4 | |
| Panasonic Toughbook 40 | |
| Durabook S14I | |
| Dell Latitude 14 5420-D2G5W | |
Sistem Performansı
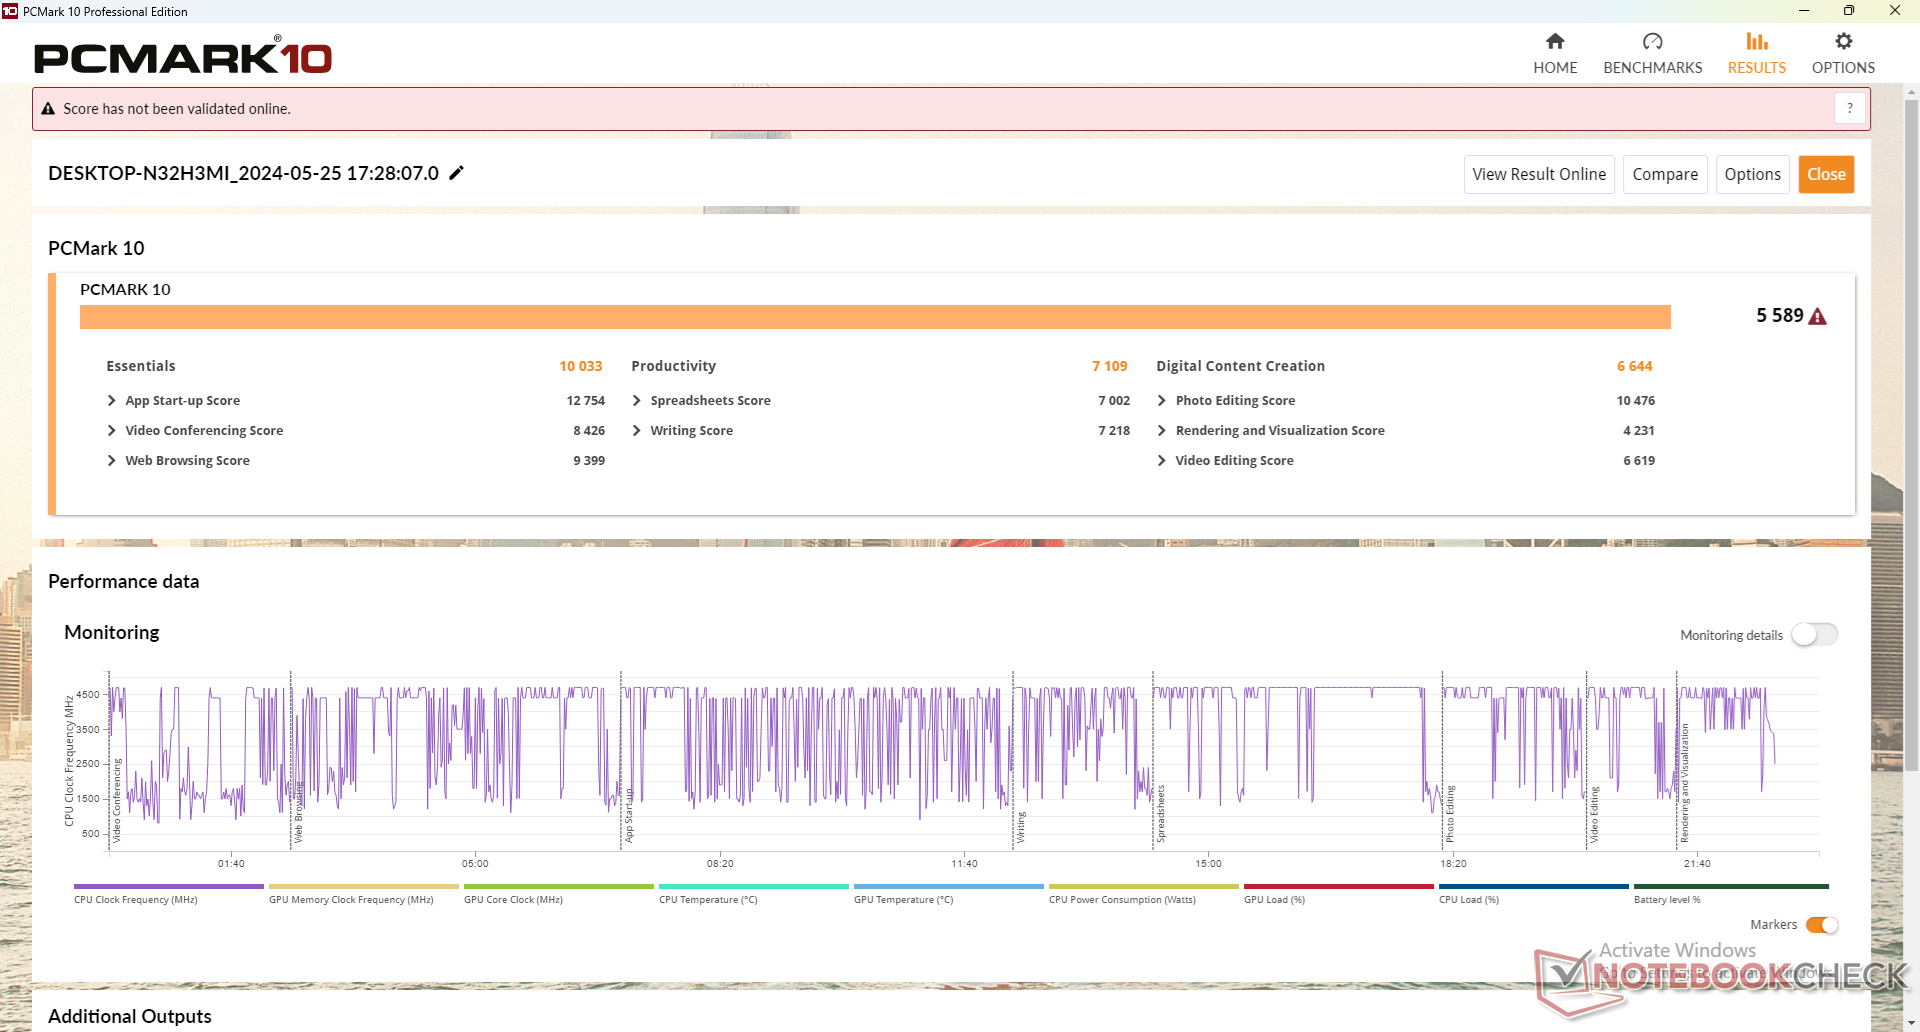
PCMark sonuçları, yeni işlemci ile daha hızlı genel performans yansıtmak için geçen yılki modelden sürekli olarak daha yüksektir.
CrossMark: Overall | Productivity | Creativity | Responsiveness
WebXPRT 3: Overall
WebXPRT 4: Overall
Mozilla Kraken 1.1: Total
| PCMark 10 / Score | |
| Getac S410 G5 | |
| Ortalama Intel Core i5-1350P, Intel Iris Xe Graphics G7 80EUs (n=1) | |
| Dell Latitude 7330 Rugged Extreme | |
| Panasonic Toughbook 40 | |
| Durabook S14I | |
| Getac S410 Gen 4 | |
| Dell Latitude 14 5420-D2G5W | |
| PCMark 10 / Essentials | |
| Dell Latitude 7330 Rugged Extreme | |
| Durabook S14I | |
| Getac S410 G5 | |
| Ortalama Intel Core i5-1350P, Intel Iris Xe Graphics G7 80EUs (n=1) | |
| Getac S410 Gen 4 | |
| Panasonic Toughbook 40 | |
| Dell Latitude 14 5420-D2G5W | |
| PCMark 10 / Productivity | |
| Getac S410 G5 | |
| Ortalama Intel Core i5-1350P, Intel Iris Xe Graphics G7 80EUs (n=1) | |
| Durabook S14I | |
| Dell Latitude 7330 Rugged Extreme | |
| Panasonic Toughbook 40 | |
| Dell Latitude 14 5420-D2G5W | |
| Getac S410 Gen 4 | |
| PCMark 10 / Digital Content Creation | |
| Getac S410 G5 | |
| Ortalama Intel Core i5-1350P, Intel Iris Xe Graphics G7 80EUs (n=1) | |
| Dell Latitude 7330 Rugged Extreme | |
| Panasonic Toughbook 40 | |
| Getac S410 Gen 4 | |
| Dell Latitude 14 5420-D2G5W | |
| Durabook S14I | |
| CrossMark / Overall | |
| Getac S410 G5 | |
| Ortalama Intel Core i5-1350P, Intel Iris Xe Graphics G7 80EUs (n=1) | |
| Panasonic Toughbook 40 | |
| Getac S410 Gen 4 | |
| Dell Latitude 14 5420-D2G5W | |
| CrossMark / Productivity | |
| Getac S410 G5 | |
| Ortalama Intel Core i5-1350P, Intel Iris Xe Graphics G7 80EUs (n=1) | |
| Panasonic Toughbook 40 | |
| Getac S410 Gen 4 | |
| Dell Latitude 14 5420-D2G5W | |
| CrossMark / Creativity | |
| Getac S410 G5 | |
| Ortalama Intel Core i5-1350P, Intel Iris Xe Graphics G7 80EUs (n=1) | |
| Panasonic Toughbook 40 | |
| Getac S410 Gen 4 | |
| Dell Latitude 14 5420-D2G5W | |
| CrossMark / Responsiveness | |
| Getac S410 G5 | |
| Ortalama Intel Core i5-1350P, Intel Iris Xe Graphics G7 80EUs (n=1) | |
| Panasonic Toughbook 40 | |
| Dell Latitude 14 5420-D2G5W | |
| Getac S410 Gen 4 | |
| WebXPRT 3 / Overall | |
| Getac S410 G5 | |
| Ortalama Intel Core i5-1350P, Intel Iris Xe Graphics G7 80EUs (n=1) | |
| Dell Latitude 7330 Rugged Extreme | |
| Durabook S14I | |
| Getac S410 Gen 4 | |
| Panasonic Toughbook 40 | |
| Dell Latitude 14 5420-D2G5W | |
| WebXPRT 4 / Overall | |
| Getac S410 G5 | |
| Ortalama Intel Core i5-1350P, Intel Iris Xe Graphics G7 80EUs (n=1) | |
| Mozilla Kraken 1.1 / Total | |
| Dell Latitude 14 5420-D2G5W | |
| Dell Latitude 7330 Rugged Extreme | |
| Panasonic Toughbook 40 | |
| Durabook S14I | |
| Getac S410 G5 | |
| Ortalama Intel Core i5-1350P, Intel Iris Xe Graphics G7 80EUs (n=1) | |
* ... daha küçük daha iyidir
| PCMark 10 Score | 5589 puan | |
Yardım | ||
| AIDA64 / Memory Copy | |
| Dell Latitude 7330 Rugged Extreme | |
| Getac S410 G5 | |
| Ortalama Intel Core i5-1350P (n=1) | |
| Getac S410 Gen 4 | |
| Panasonic Toughbook 40 | |
| Durabook S14I | |
| Dell Latitude 14 5420-D2G5W | |
| AIDA64 / Memory Read | |
| Dell Latitude 7330 Rugged Extreme | |
| Getac S410 G5 | |
| Ortalama Intel Core i5-1350P (n=1) | |
| Getac S410 Gen 4 | |
| Panasonic Toughbook 40 | |
| Durabook S14I | |
| Dell Latitude 14 5420-D2G5W | |
| AIDA64 / Memory Write | |
| Dell Latitude 7330 Rugged Extreme | |
| Getac S410 G5 | |
| Ortalama Intel Core i5-1350P (n=1) | |
| Getac S410 Gen 4 | |
| Panasonic Toughbook 40 | |
| Durabook S14I | |
| Dell Latitude 14 5420-D2G5W | |
| AIDA64 / Memory Latency | |
| Getac S410 G5 | |
| Ortalama Intel Core i5-1350P (n=1) | |
| Panasonic Toughbook 40 | |
| Dell Latitude 7330 Rugged Extreme | |
| Getac S410 Gen 4 | |
| Durabook S14I | |
| Dell Latitude 14 5420-D2G5W | |
* ... daha küçük daha iyidir
DPC Gecikme Süresi
Ana sayfamızın birden fazla tarayıcı sekmesini açarken hafif DPC sorunları var. 60 FPS'de 4K video oynatma, kaydedilen hiçbir atlanmış kare olmadan mükemmeldir.
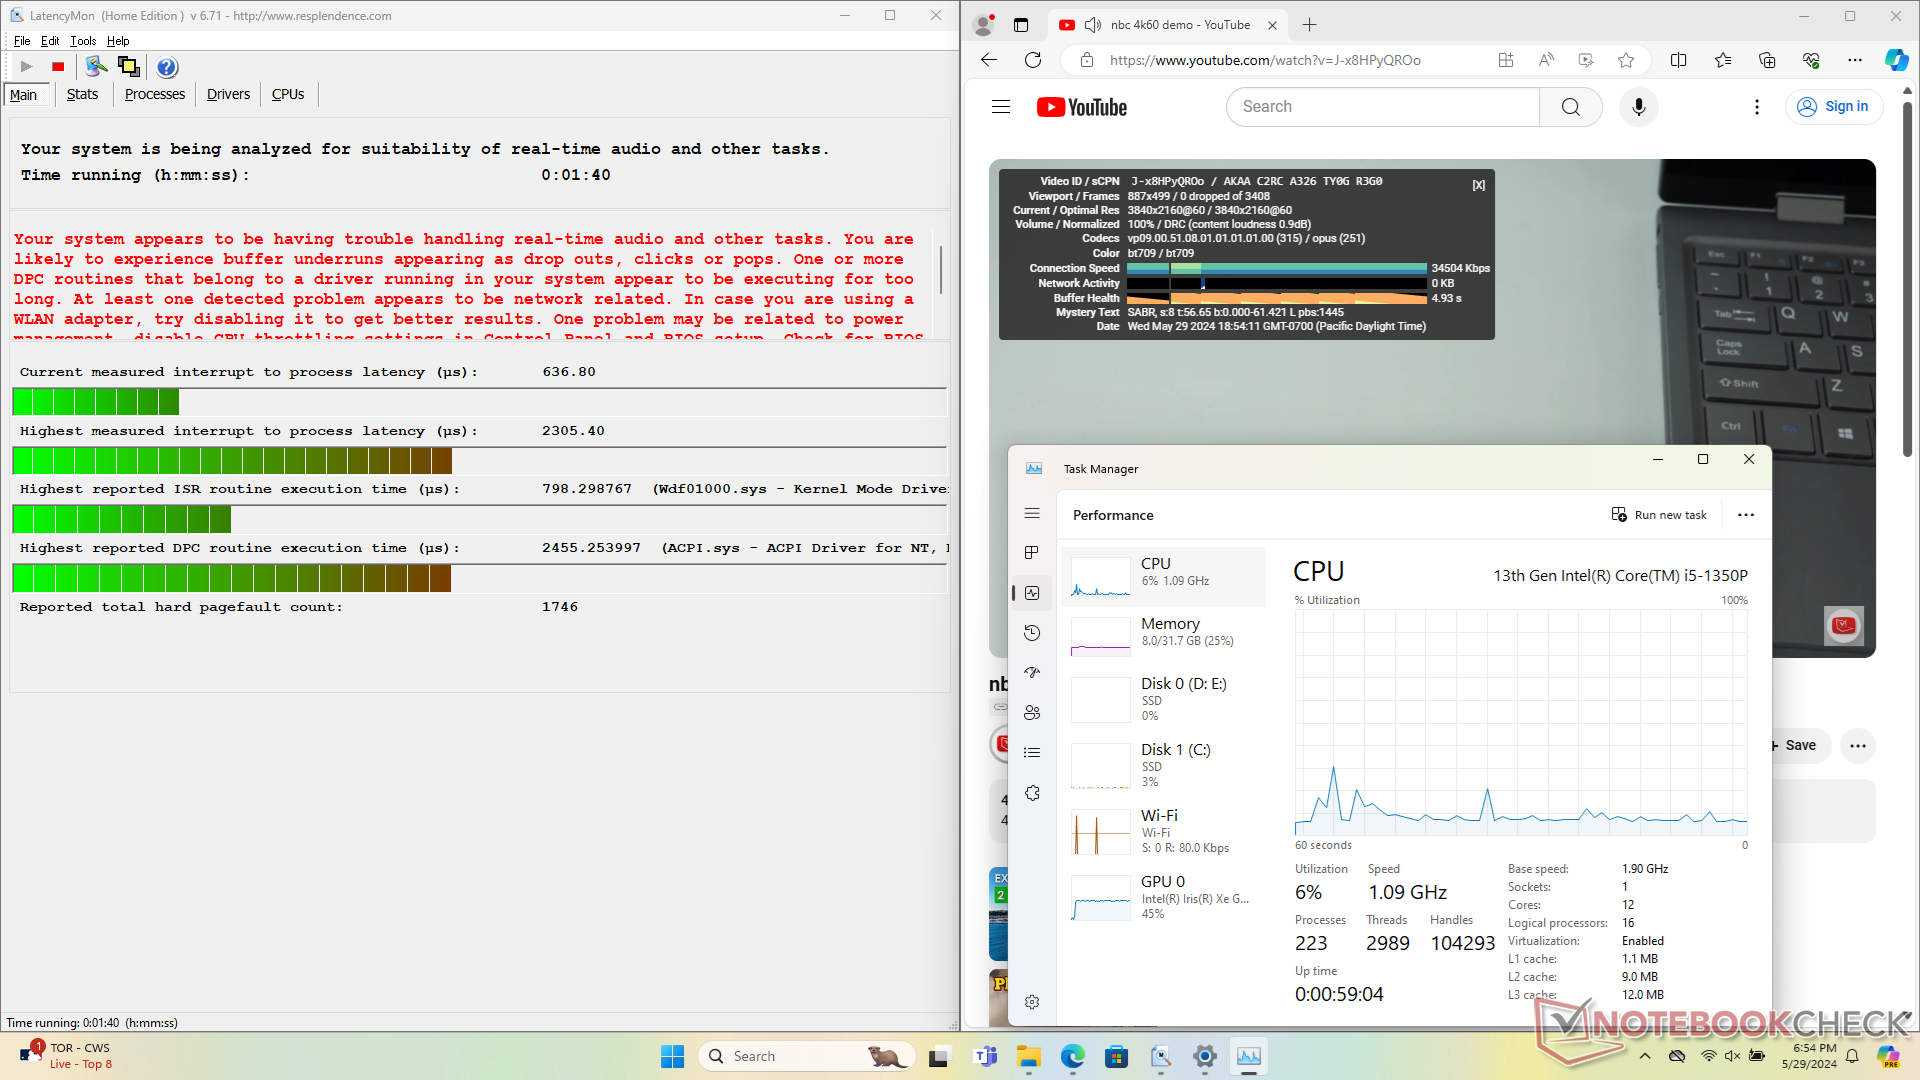
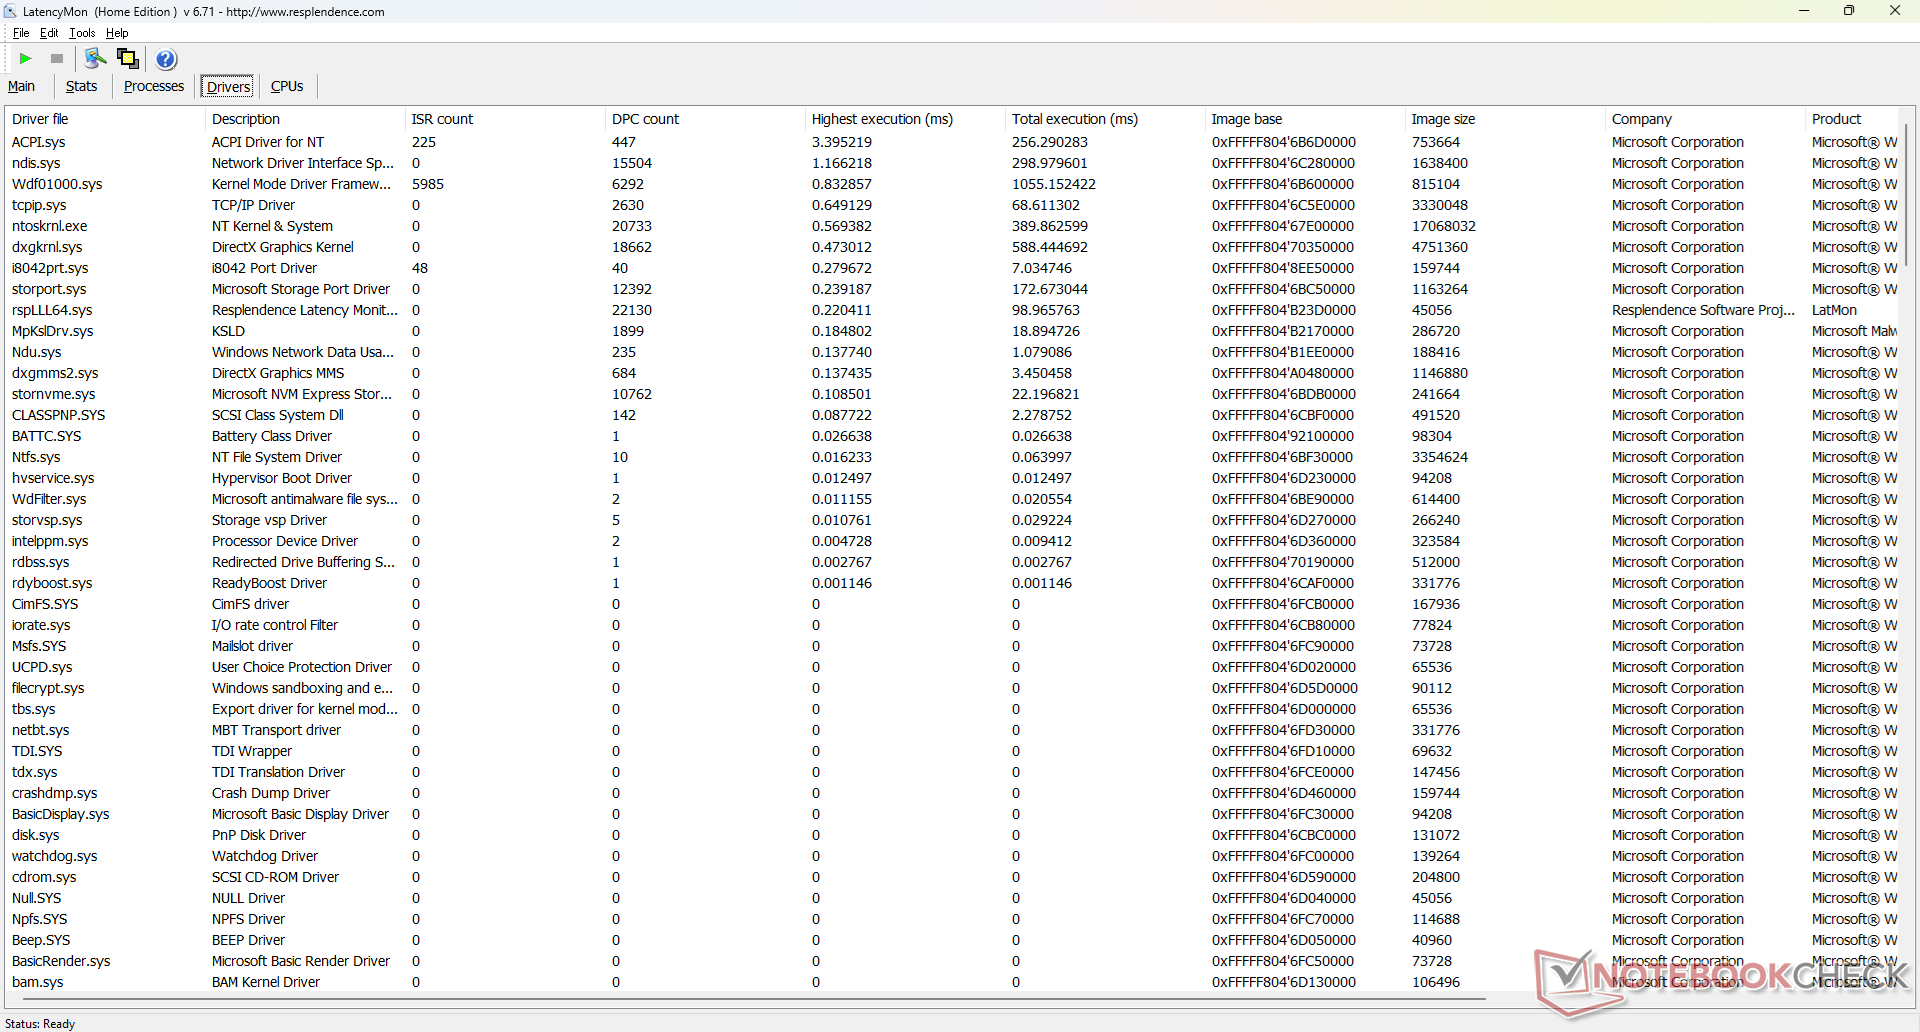
| DPC Latencies / LatencyMon - interrupt to process latency (max), Web, Youtube, Prime95 | |
| Dell Latitude 14 5420-D2G5W | |
| Getac S410 G5 | |
| Durabook S14I | |
| Getac S410 Gen 4 | |
| Panasonic Toughbook 40 | |
| Dell Latitude 7330 Rugged Extreme | |
* ... daha küçük daha iyidir
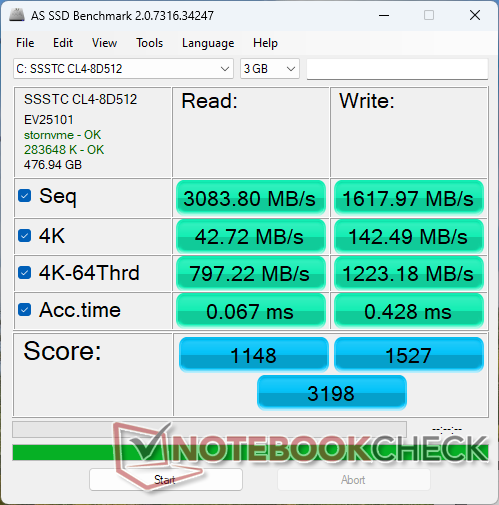
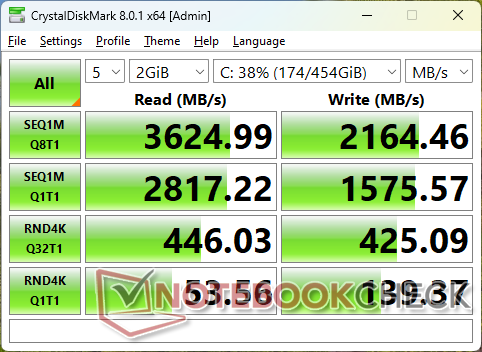
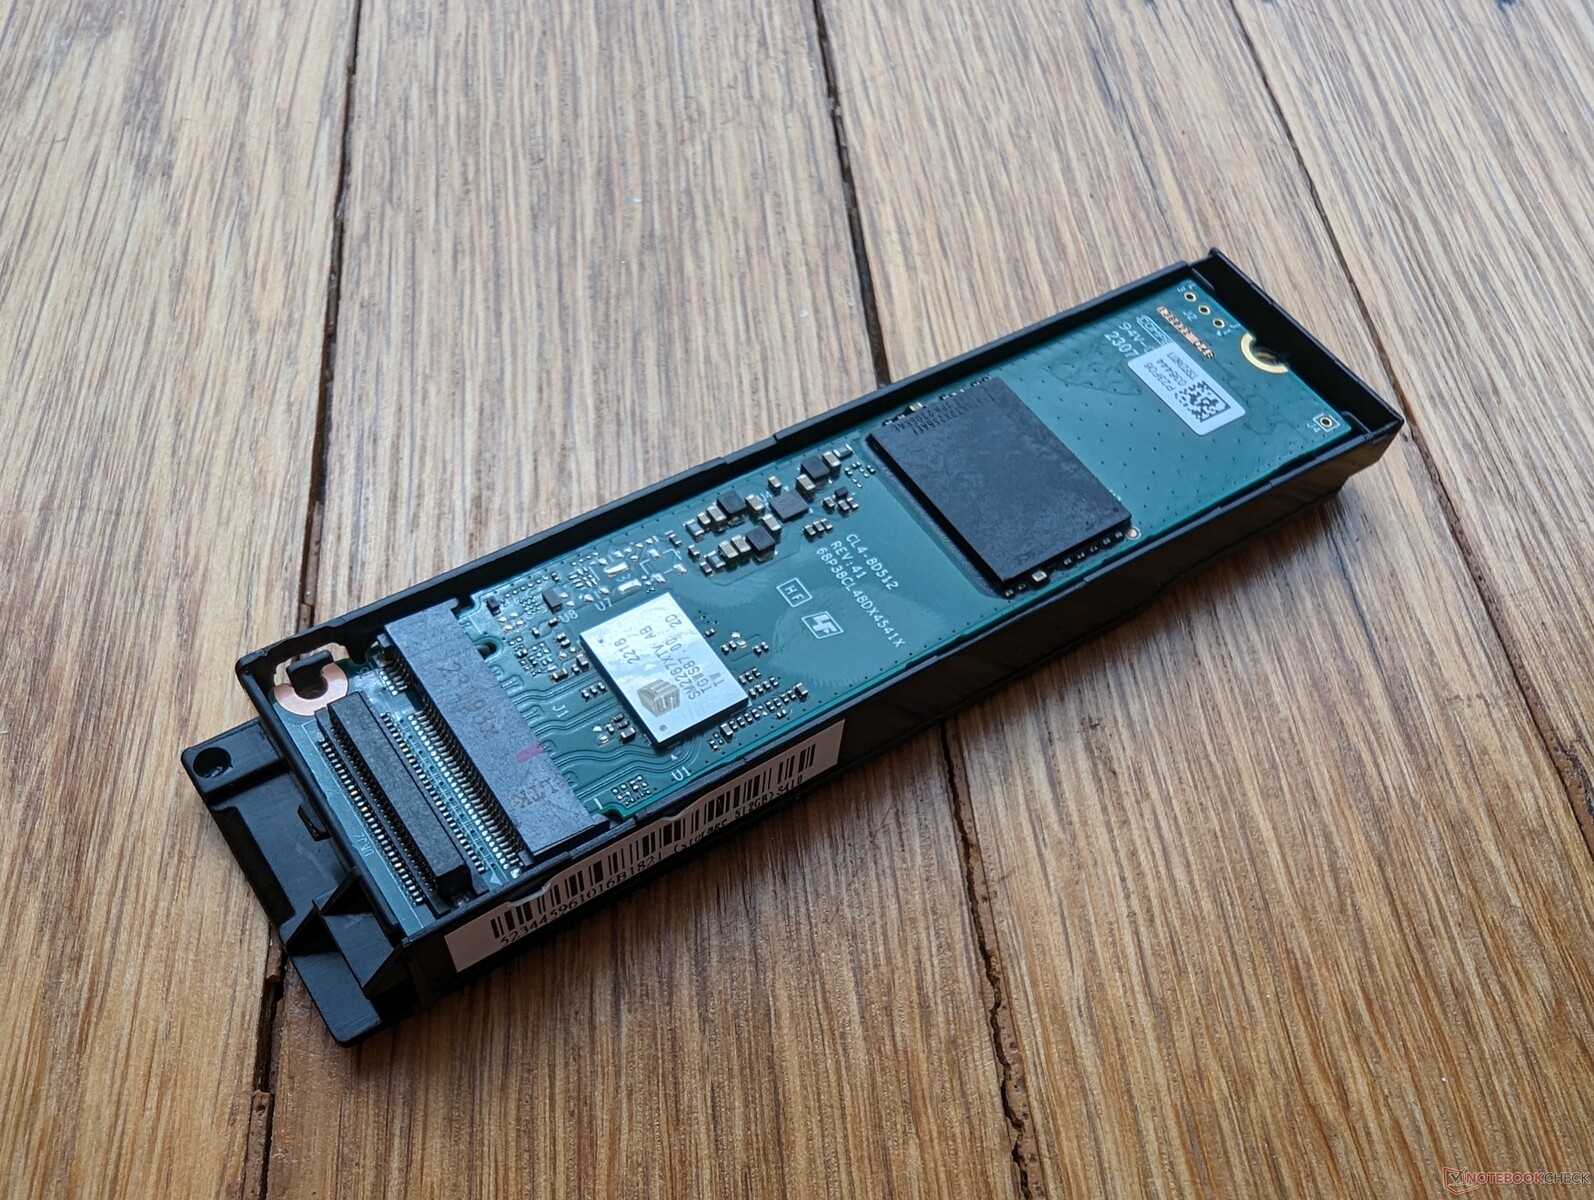
Depolama Cihazları
Test ünitemiz aşağıdakilerle birlikte gönderilir SSSTC CL4-8D512 eski S410 G4 ise SSSTC CA5-8D256 ile birlikte gönderilirdi. Yeni sürücü her yönden biraz daha hızlıdır, ancak yine de diğer sürücülerin çoğundan biraz daha uzun erişim sürelerinden muzdariptir.

| Drive Performance Rating - Percent | |
| Dell Latitude 7330 Rugged Extreme | |
| Getac S410 G5 | |
| Durabook S14I | |
| Panasonic Toughbook 40 | |
| Dell Latitude 14 5420-D2G5W | |
| Getac S410 Gen 4 | |
* ... daha küçük daha iyidir
Disk Throttling: DiskSpd Read Loop, Queue Depth 8
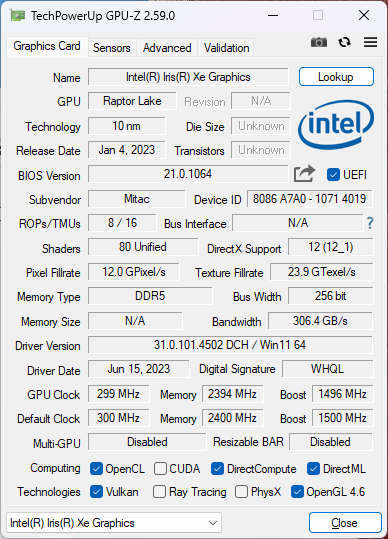
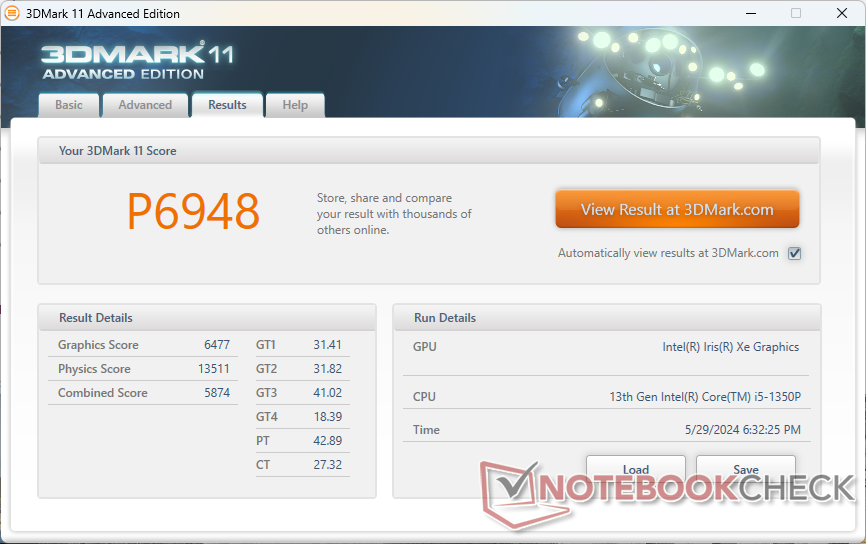
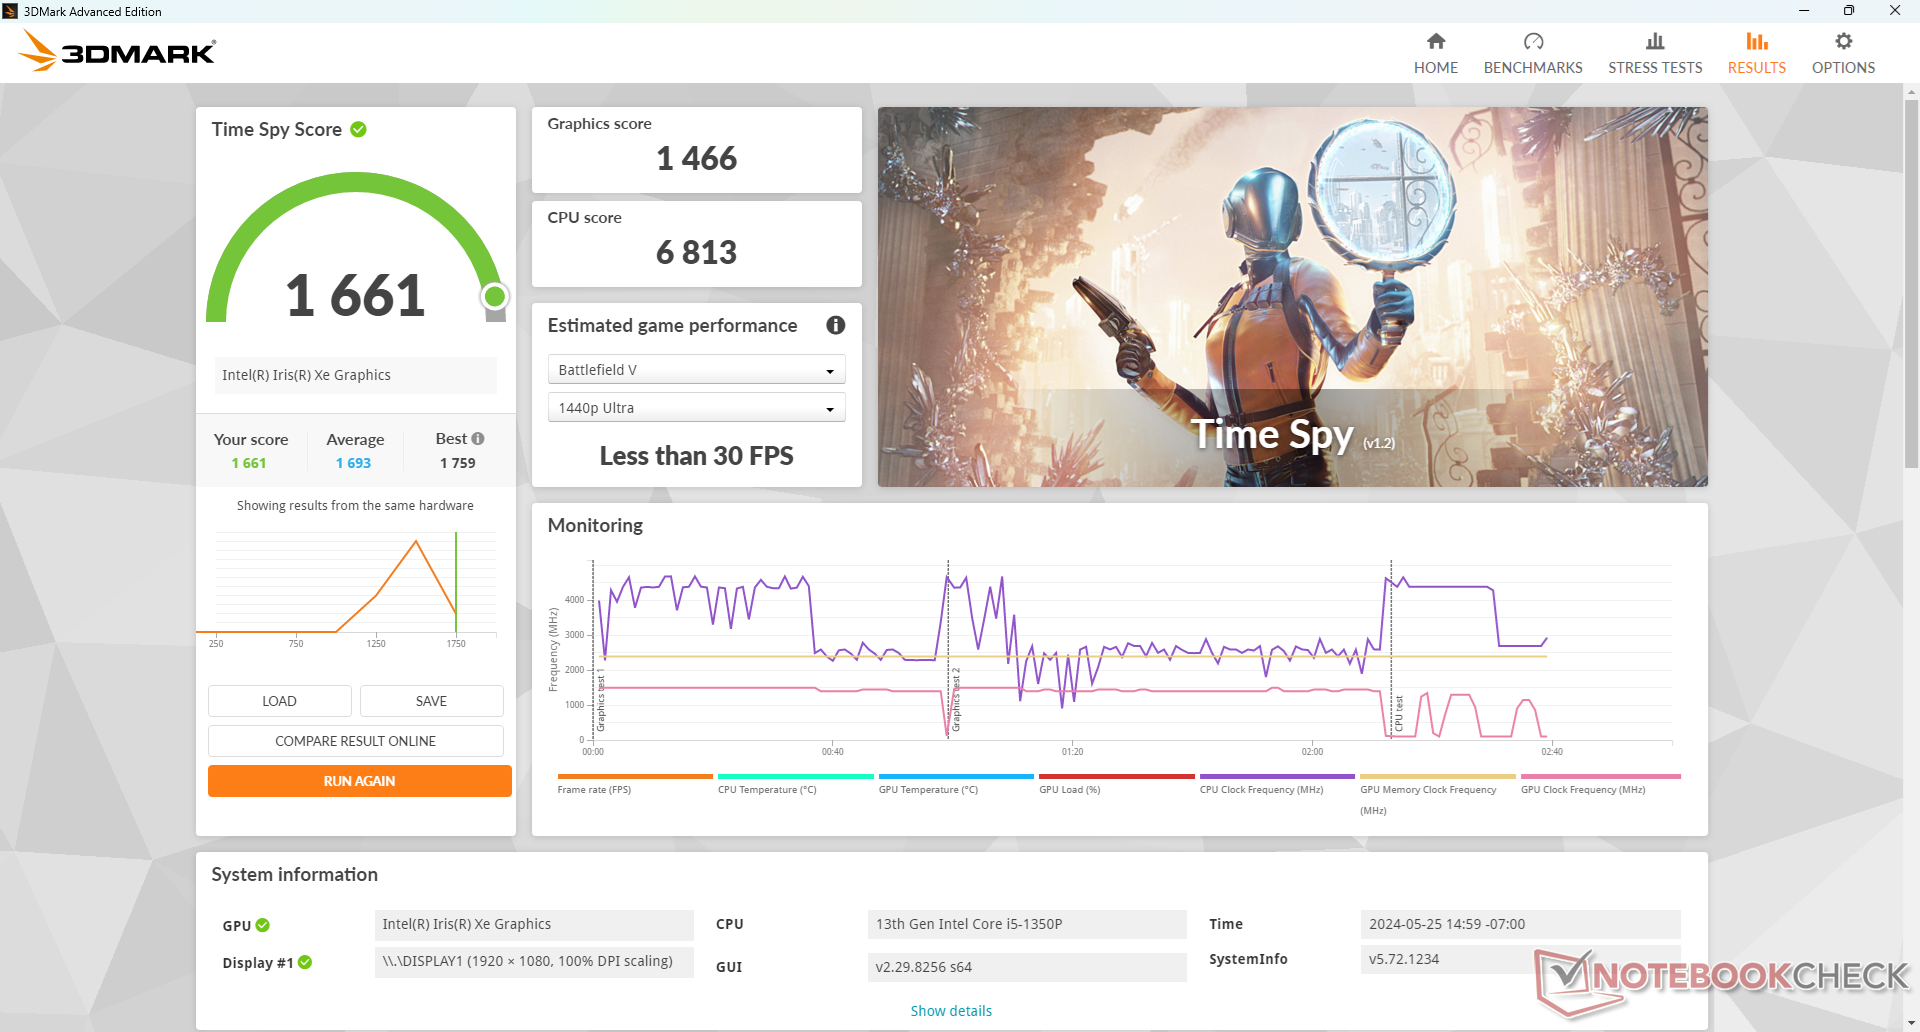
GPU Performansı - Yine Iris Xe
Tiger Lake-U ve Raptor Lake-P aynı temel Iris Xe mimarisini paylaşmaktadır ve bu nedenle S410 G4 ile S410 G5 arasındaki performans artışları minimum düzeydedir. S410 G4 Iris Xe Graphics G7 80 EUs ünitemizdeki hız, birincil hızdan sadece yüzde 10 daha hızlıdır Iris Xe Graphics G7 96 EUs geçen yılın modelinde. Bu küçük avantaj, uygulamaların büyük çoğunluğu için fark edilmeyecektir.
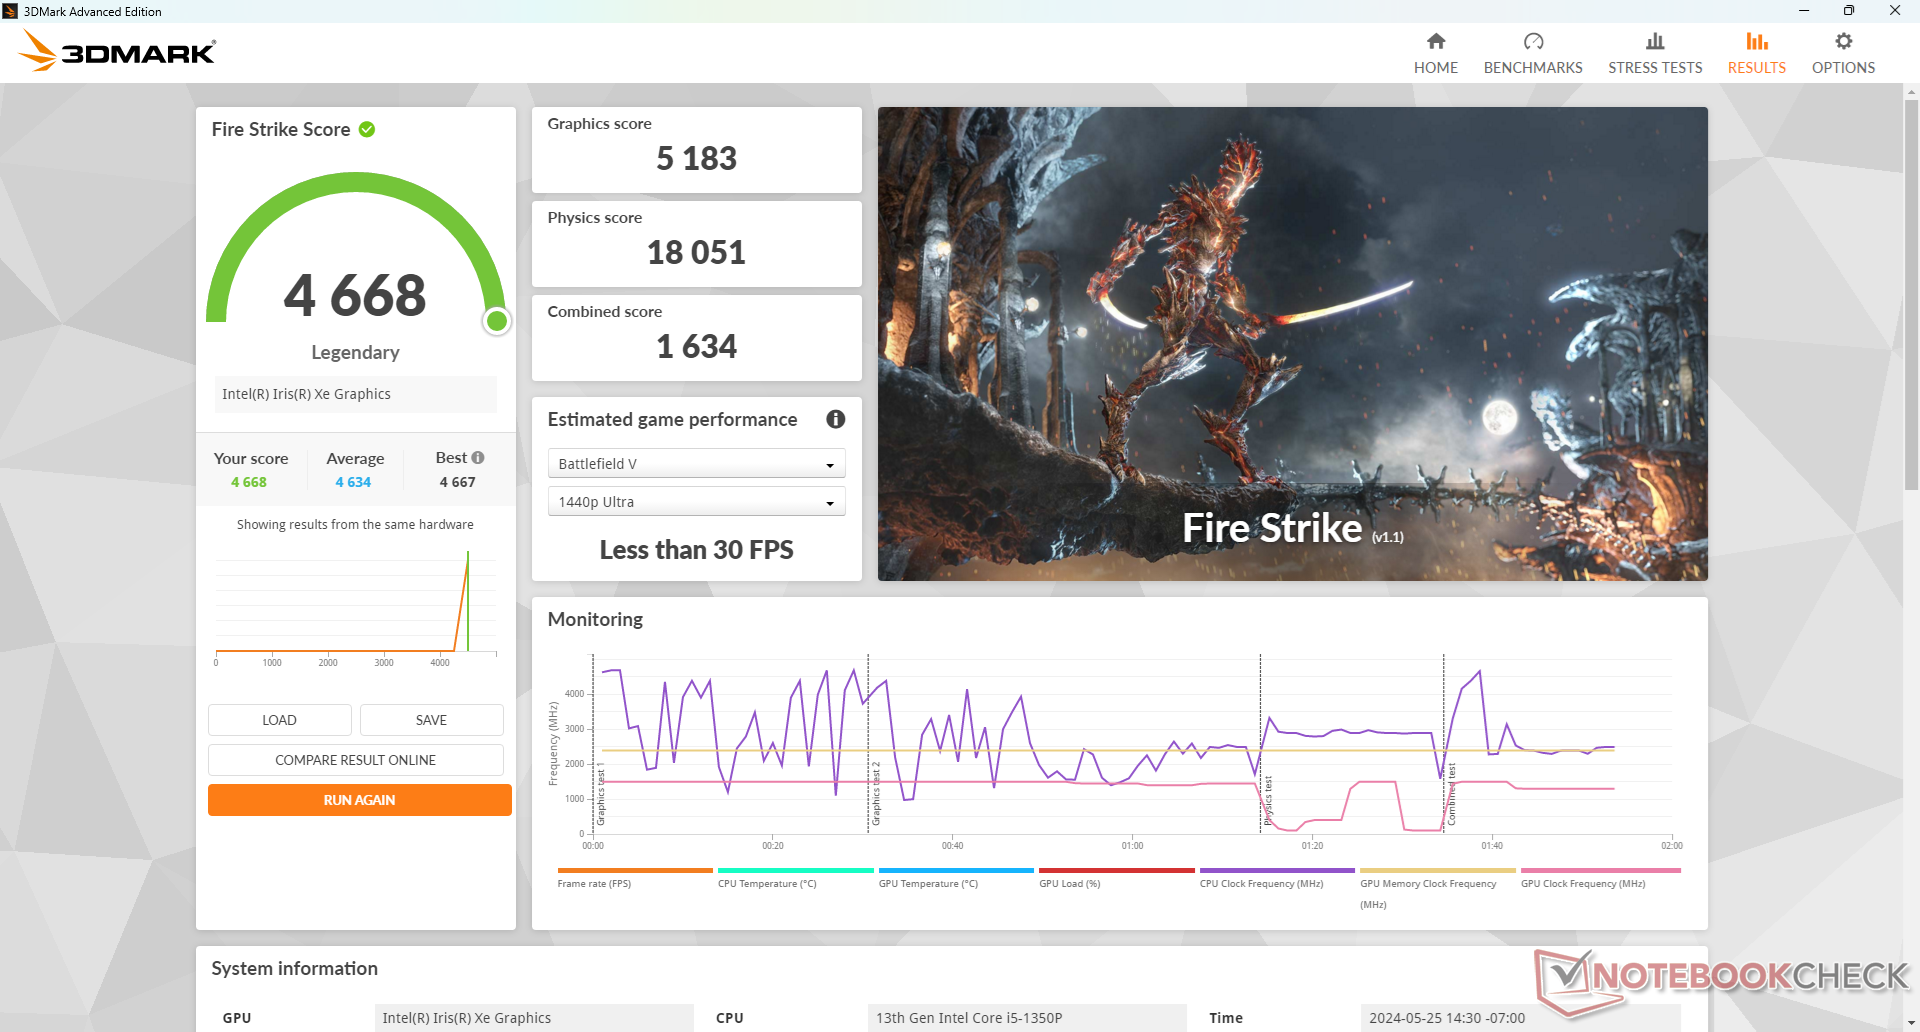
| Güç Profili | Grafik Puanı | Fizik Puanı | Birleşik Puan |
| Ekstrem Profil | 5183 | 18051 | 1634 |
| Varsayılan Profil | 5169 (-0%) | 17729 (-2%) | 1648 (-0%) |
| Akü Gücü | 5186 (-0%) | 11113 (-38%) | 1725 (-0%) |
Aşırı performans modunda çalıştırmak, yukarıdaki Fire Strike sonuç tablomuzda gösterildiği gibi normal Varsayılan performans modundan daha hızlı performansla sonuçlanmaz. Bununla birlikte, pil gücüyle çalışırken CPU performansı büyük ölçüde azalır ve bu da sahada hayal kırıklığı yaratabilir.
| 3DMark Performance Rating - Percent | |
| Dell Latitude 7330 Rugged Extreme | |
| Getac S410 G5 | |
| Panasonic Toughbook FZ-55 MK2 | |
| Getac S410 Gen 4 | |
| Panasonic Toughbook 40 | |
| Ortalama Intel Iris Xe Graphics G7 80EUs | |
| Durabook S14I | |
| Dell Latitude 14 5420-D2G5W -1! | |
| Getac B360 | |
| Getac S410 -4! | |
| Panasonic Toughbook FZ-55 | |
| 3DMark 11 - 1280x720 Performance GPU | |
| Dell Latitude 7330 Rugged Extreme | |
| Panasonic Toughbook FZ-55 MK2 | |
| Getac S410 Gen 4 | |
| Getac S410 G5 | |
| Panasonic Toughbook 40 | |
| Ortalama Intel Iris Xe Graphics G7 80EUs (2246 - 6579, n=110) | |
| Durabook S14I | |
| Dell Latitude 14 5420-D2G5W | |
| Getac B360 | |
| Getac S410 | |
| Panasonic Toughbook FZ-55 | |
| 3DMark 11 Performance | 6948 puan | |
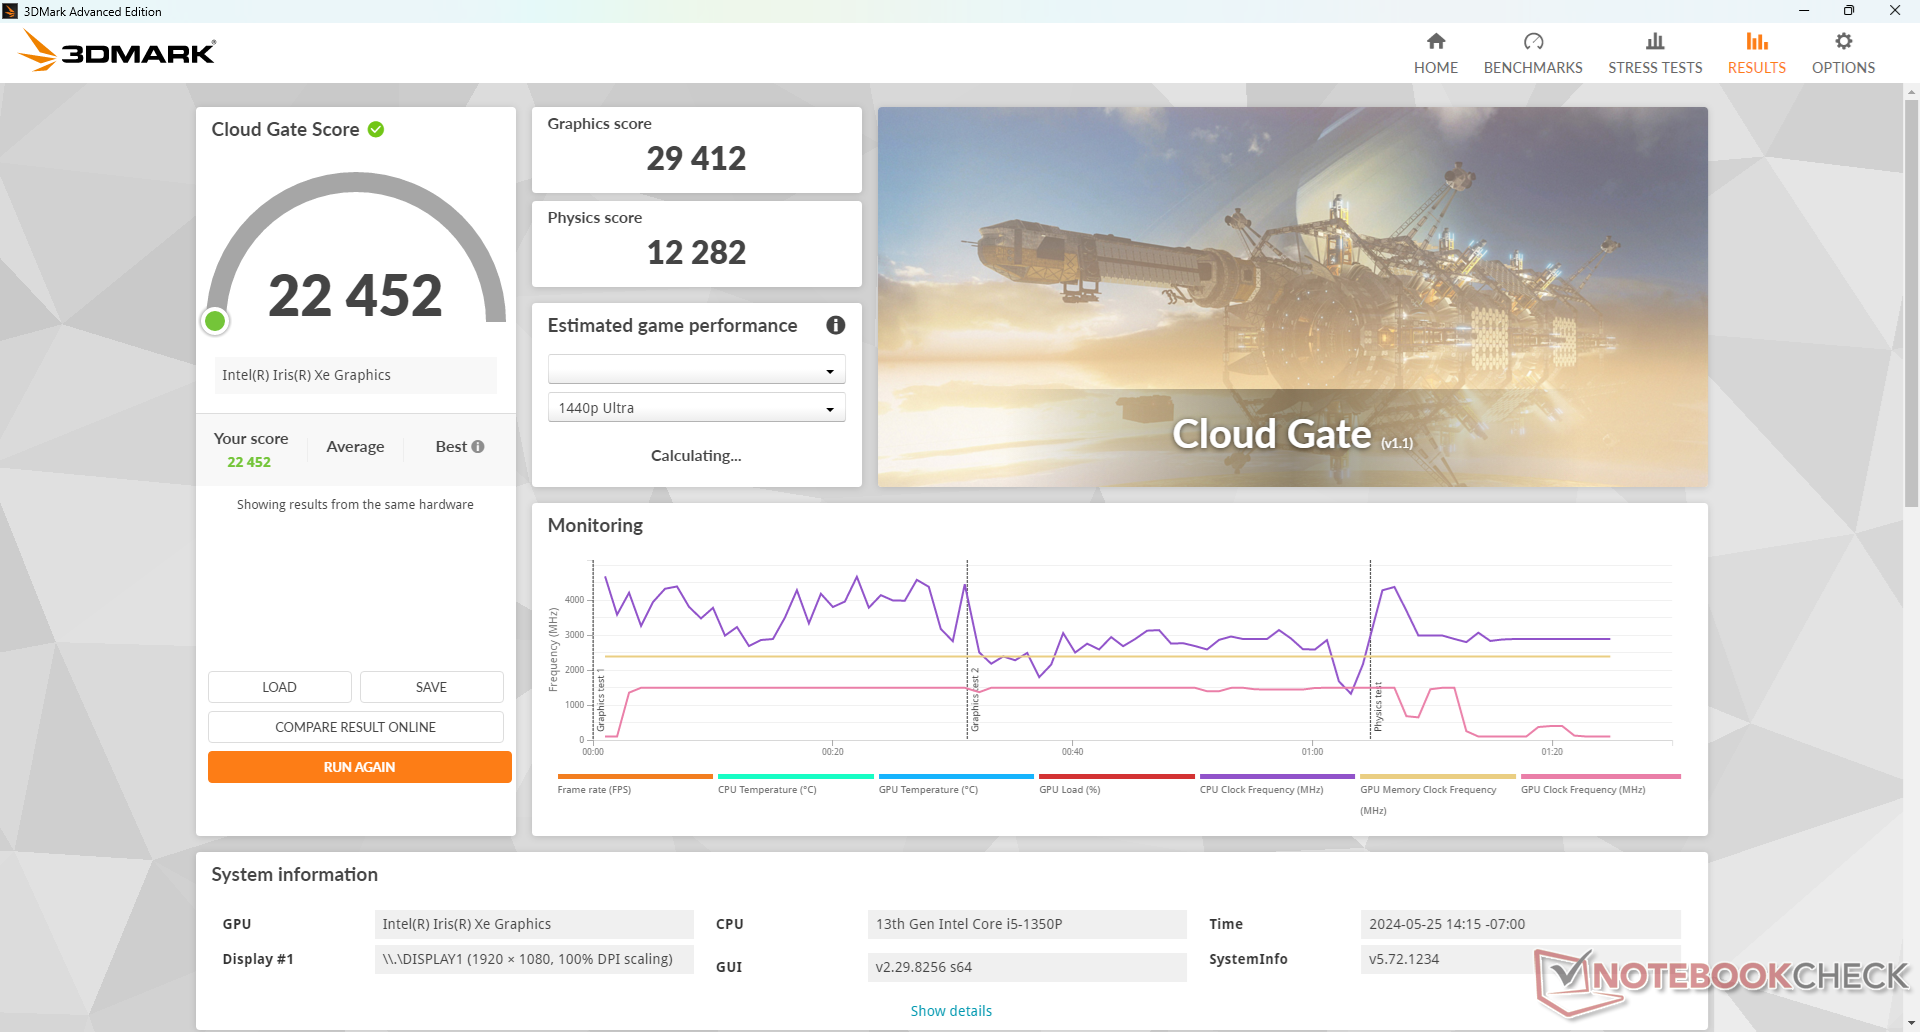
| 3DMark Cloud Gate Standard Score | 22452 puan | |
| 3DMark Fire Strike Score | 4668 puan | |
| 3DMark Time Spy Score | 1661 puan | |
Yardım | ||
| Blender - v3.3 Classroom CPU | |
| Getac S410 G5 | |
* ... daha küçük daha iyidir
| Performance Rating - Percent | |
| Getac S410 G5 | |
| Dell Latitude 7330 Rugged Extreme -2! | |
| Getac S410 Gen 4 | |
| Panasonic Toughbook 40 -2! | |
| Durabook S14I -3! | |
| Dell Latitude 14 5420-D2G5W -3! | |
| The Witcher 3 - 1920x1080 Ultra Graphics & Postprocessing (HBAO+) | |
| Getac S410 G5 | |
| Dell Latitude 7330 Rugged Extreme | |
| Panasonic Toughbook 40 | |
| Getac S410 Gen 4 | |
| Dell Latitude 14 5420-D2G5W | |
| GTA V - 1920x1080 Highest Settings possible AA:4xMSAA + FX AF:16x | |
| Getac S410 G5 | |
| Getac S410 Gen 4 | |
| Final Fantasy XV Benchmark - 1920x1080 High Quality | |
| Dell Latitude 7330 Rugged Extreme | |
| Getac S410 G5 | |
| Panasonic Toughbook 40 | |
| Getac S410 Gen 4 | |
| Durabook S14I | |
| Dell Latitude 14 5420-D2G5W | |
| Strange Brigade - 1920x1080 ultra AA:ultra AF:16 | |
| Getac S410 G5 | |
| Getac S410 Gen 4 | |
| Dota 2 Reborn - 1920x1080 ultra (3/3) best looking | |
| Dell Latitude 7330 Rugged Extreme | |
| Panasonic Toughbook 40 | |
| Getac S410 G5 | |
| Getac S410 Gen 4 | |
| Durabook S14I | |
| X-Plane 11.11 - 1920x1080 high (fps_test=3) | |
| Getac S410 G5 | |
| Getac S410 Gen 4 | |
| Durabook S14I | |
| Panasonic Toughbook 40 | |
| Dell Latitude 14 5420-D2G5W | |
| Dell Latitude 7330 Rugged Extreme | |
| GTA V | |
| 1024x768 Lowest Settings possible | |
| Getac S410 G5 | |
| Ortalama Intel Iris Xe Graphics G7 80EUs (36.5 - 144.6, n=82) | |
| Getac S410 Gen 4 | |
| Dell Latitude 14 5420-D2G5W | |
| 1920x1080 Lowest Settings possible | |
| Getac S410 G5 | |
| Ortalama Intel Iris Xe Graphics G7 80EUs (21.5 - 98.1, n=66) | |
| Getac S410 Gen 4 | |
| 1366x768 Normal/Off AF:4x | |
| Getac S410 G5 | |
| Ortalama Intel Iris Xe Graphics G7 80EUs (28.9 - 133.8, n=85) | |
| Getac S410 Gen 4 | |
| Dell Latitude 14 5420-D2G5W | |
| 1920x1080 Normal/Off AF:4x | |
| Getac S410 G5 | |
| Ortalama Intel Iris Xe Graphics G7 80EUs (18.8 - 97.2, n=66) | |
| Getac S410 Gen 4 | |
| 1920x1080 High/On (Advanced Graphics Off) AA:2xMSAA + FX AF:8x | |
| Getac S410 G5 | |
| Getac S410 Gen 4 | |
| Ortalama Intel Iris Xe Graphics G7 80EUs (7.81 - 32, n=84) | |
| Dell Latitude 14 5420-D2G5W | |
| 1920x1080 Highest Settings possible AA:4xMSAA + FX AF:16x | |
| Getac S410 G5 | |
| Getac S410 Gen 4 | |
| Ortalama Intel Iris Xe Graphics G7 80EUs (3.07 - 11.6, n=71) | |
| Dota 2 Reborn | |
| 1280x720 min (0/3) fastest | |
| Dell Latitude 7330 Rugged Extreme | |
| Panasonic Toughbook 40 | |
| Getac S410 G5 | |
| Ortalama Intel Iris Xe Graphics G7 80EUs (14.8 - 140.3, n=110) | |
| Getac B360 | |
| Panasonic Toughbook FZ-55 MK2 | |
| Getac S410 Gen 4 | |
| Durabook S14I | |
| 1366x768 med (1/3) | |
| Dell Latitude 7330 Rugged Extreme | |
| Panasonic Toughbook 40 | |
| Panasonic Toughbook FZ-55 MK2 | |
| Getac S410 G5 | |
| Ortalama Intel Iris Xe Graphics G7 80EUs (10.9 - 119.5, n=110) | |
| Getac S410 Gen 4 | |
| Durabook S14I | |
| Getac B360 | |
| 1920x1080 high (2/3) | |
| Dell Latitude 7330 Rugged Extreme | |
| Panasonic Toughbook 40 | |
| Getac S410 G5 | |
| Panasonic Toughbook FZ-55 MK2 | |
| Getac S410 Gen 4 | |
| Ortalama Intel Iris Xe Graphics G7 80EUs (10.4 - 70.9, n=110) | |
| Durabook S14I | |
| Getac B360 | |
| 1920x1080 ultra (3/3) best looking | |
| Dell Latitude 7330 Rugged Extreme | |
| Panasonic Toughbook 40 | |
| Getac S410 G5 | |
| Panasonic Toughbook FZ-55 MK2 | |
| Getac S410 Gen 4 | |
| Ortalama Intel Iris Xe Graphics G7 80EUs (7.8 - 66.1, n=111) | |
| Durabook S14I | |
| Getac B360 | |
| Final Fantasy XV Benchmark | |
| 1280x720 Lite Quality | |
| Dell Latitude 7330 Rugged Extreme | |
| Panasonic Toughbook FZ-55 MK2 | |
| Getac S410 G5 | |
| Panasonic Toughbook 40 | |
| Getac S410 Gen 4 | |
| Ortalama Intel Iris Xe Graphics G7 80EUs (8.32 - 45.6, n=105) | |
| Durabook S14I | |
| Dell Latitude 14 5420-D2G5W | |
| Getac B360 | |
| 1920x1080 Standard Quality | |
| Dell Latitude 7330 Rugged Extreme | |
| Panasonic Toughbook FZ-55 MK2 | |
| Getac S410 G5 | |
| Panasonic Toughbook 40 | |
| Getac S410 Gen 4 | |
| Ortalama Intel Iris Xe Graphics G7 80EUs (4.47 - 25.4, n=98) | |
| Durabook S14I | |
| Dell Latitude 14 5420-D2G5W | |
| Getac B360 | |
| 1920x1080 High Quality | |
| Dell Latitude 7330 Rugged Extreme | |
| Getac S410 G5 | |
| Panasonic Toughbook FZ-55 MK2 | |
| Panasonic Toughbook 40 | |
| Getac S410 Gen 4 | |
| Ortalama Intel Iris Xe Graphics G7 80EUs (4.01 - 22, n=89) | |
| Durabook S14I | |
| Dell Latitude 14 5420-D2G5W | |
| Getac B360 | |
| X-Plane 11.11 | |
| 1280x720 low (fps_test=1) | |
| Getac S410 G5 | |
| Getac S410 Gen 4 | |
| Durabook S14I | |
| Ortalama Intel Iris Xe Graphics G7 80EUs (9.12 - 74.4, n=109) | |
| Dell Latitude 14 5420-D2G5W | |
| Dell Latitude 7330 Rugged Extreme | |
| Panasonic Toughbook FZ-55 MK2 | |
| Panasonic Toughbook 40 | |
| Getac B360 | |
| 1920x1080 med (fps_test=2) | |
| Getac S410 G5 | |
| Getac S410 Gen 4 | |
| Durabook S14I | |
| Ortalama Intel Iris Xe Graphics G7 80EUs (6.45 - 40.5, n=110) | |
| Dell Latitude 14 5420-D2G5W | |
| Dell Latitude 7330 Rugged Extreme | |
| Panasonic Toughbook FZ-55 MK2 | |
| Panasonic Toughbook 40 | |
| Getac B360 | |
| 1920x1080 high (fps_test=3) | |
| Getac S410 G5 | |
| Getac S410 Gen 4 | |
| Durabook S14I | |
| Panasonic Toughbook 40 | |
| Ortalama Intel Iris Xe Graphics G7 80EUs (5.55 - 36.3, n=108) | |
| Dell Latitude 14 5420-D2G5W | |
| Panasonic Toughbook FZ-55 MK2 | |
| Dell Latitude 7330 Rugged Extreme | |
| Getac B360 | |
| Strange Brigade | |
| 1280x720 lowest AF:1 | |
| Getac S410 G5 | |
| Getac S410 Gen 4 | |
| Ortalama Intel Iris Xe Graphics G7 80EUs (22.7 - 98.7, n=82) | |
| Dell Latitude 14 5420-D2G5W | |
| 1920x1080 medium AA:medium AF:4 | |
| Getac S410 G5 | |
| Getac S410 Gen 4 | |
| Ortalama Intel Iris Xe Graphics G7 80EUs (6 - 48.8, n=84) | |
| Dell Latitude 14 5420-D2G5W | |
| 1920x1080 high AA:high AF:8 | |
| Getac S410 G5 | |
| Getac S410 Gen 4 | |
| Ortalama Intel Iris Xe Graphics G7 80EUs (11.4 - 34, n=81) | |
| Dell Latitude 14 5420-D2G5W | |
| 1920x1080 ultra AA:ultra AF:16 | |
| Getac S410 G5 | |
| Getac S410 Gen 4 | |
| Ortalama Intel Iris Xe Graphics G7 80EUs (13.6 - 27, n=57) | |
Witcher 3 adresinde rölantide çalışırken kare hızları, testin 40. dakikasında sadece 10 FPS'ye düşerek arka plan etkinliğinin kesintiye uğradığını gösteren bir örnek dışında sabittir. Bu, kararlılığın son derece önemli olduğu ve herhangi bir arka plan uygulamasının öncelikli olmaması gereken endüstriyel veya sağlam bir sistemde görmek için hayal kırıklığı yaratıyor.
Witcher 3 FPS Chart
| düşük | orta | yüksek | ultra | |
|---|---|---|---|---|
| GTA V (2015) | 101.8 | 94.6 | 22.5 | 9.58 |
| The Witcher 3 (2015) | 79.9 | 56.3 | 31.5 | 28 |
| Dota 2 Reborn (2015) | 94.8 | 71.3 | 55.8 | 49.5 |
| Final Fantasy XV Benchmark (2018) | 40.4 | 22 | 15.8 | |
| X-Plane 11.11 (2018) | 47.6 | 36.1 | 32.7 | |
| Strange Brigade (2018) | 86.2 | 38.9 | 31 | 25.1 |
Emisyonlar
Sistem Gürültüsü - Tiz Sesli Fan
Fan gürültüsü davranışı, benzer bir zemin ve tavan ile büyük ölçüde öncekiyle aynıdır. En büyük hayal kırıklığı ise nispeten tiz fan sesinin devam etmesi ve bunun da fanı kullanım sırasında olması gerekenden daha dikkat çekici hale getirmesi.
Ses yüksekliği
| Boşta |
| 23.4 / 25.9 / 26 dB |
| Çalışırken |
| 38.7 / 42.1 dB |
 | ||
30 dB sessiz 40 dB(A) duyulabilirlik 50 dB(A) gürültülü |
||
min: | ||
| Getac S410 G5 Iris Xe G7 80EUs, i5-1350P, SSSTC CL4-8D512 | Getac S410 Gen 4 Iris Xe G7 96EUs, i7-1185G7, SSSTC CA5-8D256 | Durabook S14I Iris Xe G7 96EUs, i7-1165G7, UDinfo M2P M2P80DE512GBAEP | Dell Latitude 14 5420-D2G5W Iris Xe G7 80EUs, i5-1135G7, WDC PC SN530 SDBPTPZ-256G | Dell Latitude 7330 Rugged Extreme Iris Xe G7 96EUs, i7-1185G7 | Panasonic Toughbook 40 Iris Xe G7 96EUs, i7-1185G7, Samsung PM991 MZVLQ1T0HALB | |
|---|---|---|---|---|---|---|
| Noise | -2% | -4% | -4% | 13% | 1% | |
| kapalı / ortam * | 23.4 | 23.3 -0% | 25.2 -8% | 25 -7% | 22.9 2% | 22.8 3% |
| Idle Minimum * | 23.4 | 23.5 -0% | 25.2 -8% | 25 -7% | 23.1 1% | 26 -11% |
| Idle Average * | 25.9 | 23.5 9% | 25.2 3% | 25 3% | 23.1 11% | 26 -0% |
| Idle Maximum * | 26 | 28 -8% | 34.5 -33% | 25 4% | 23.1 11% | 26 -0% |
| Load Average * | 38.7 | 42.8 -11% | 34.5 11% | 36.5 6% | 28 28% | 37.6 3% |
| Witcher 3 ultra * | 42.1 | 42.3 -0% | 31.2 26% | 37.8 10% | ||
| Load Maximum * | 42.1 | 42.6 -1% | 36.2 14% | 52.4 -24% | 36.2 14% | 40.3 4% |
* ... daha küçük daha iyidir
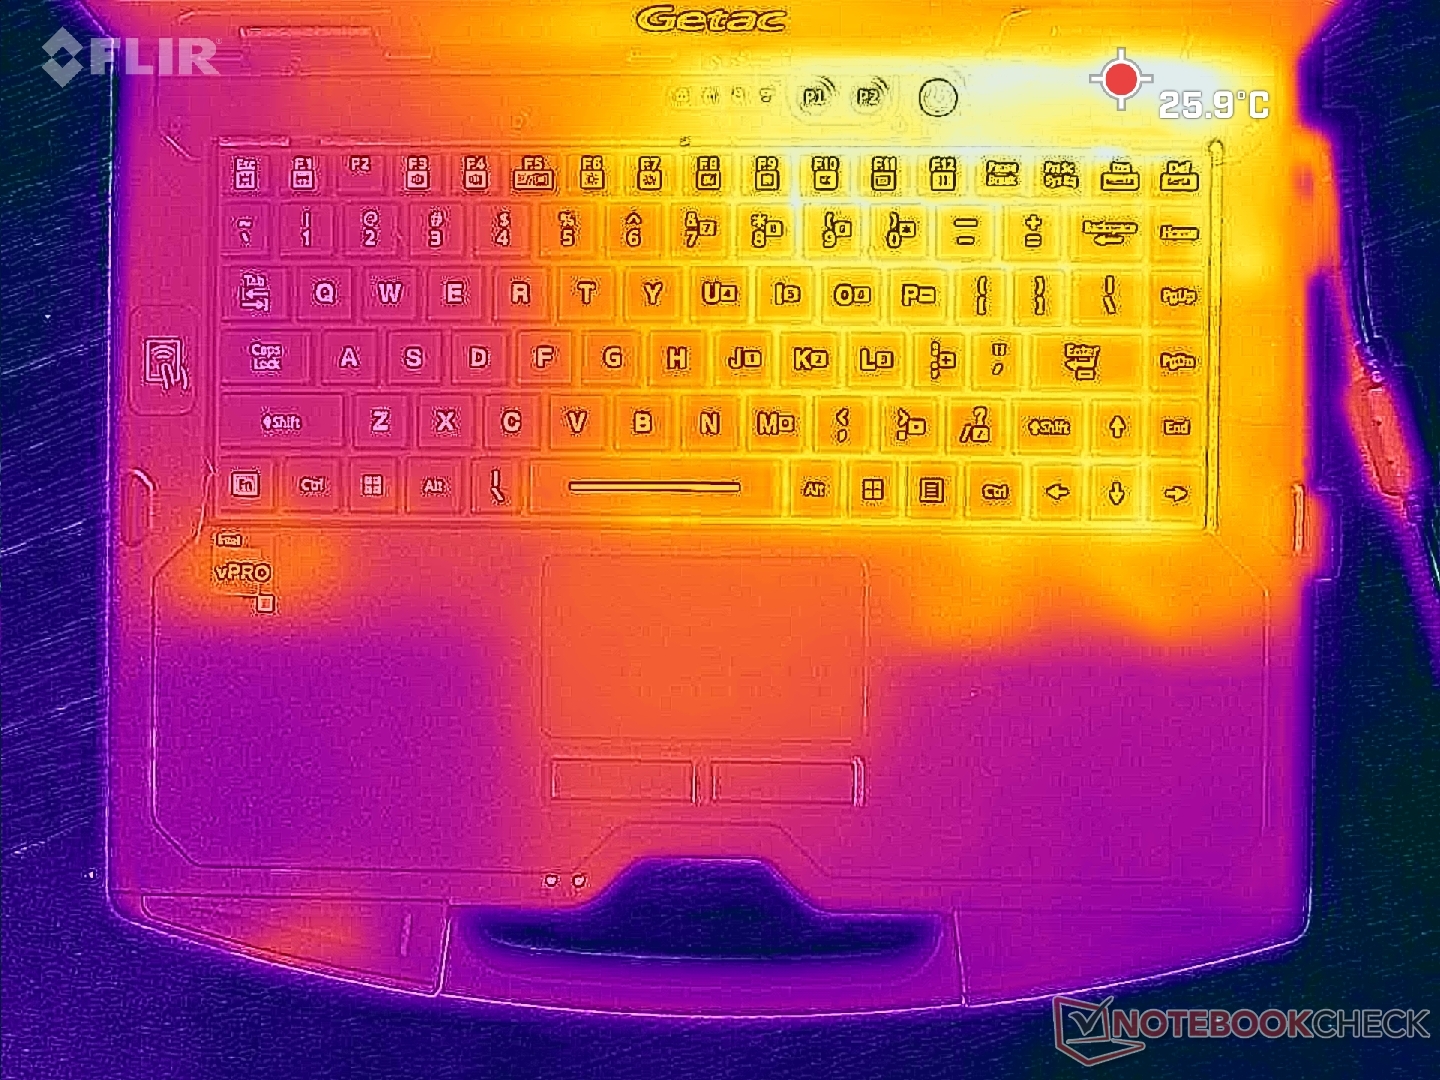
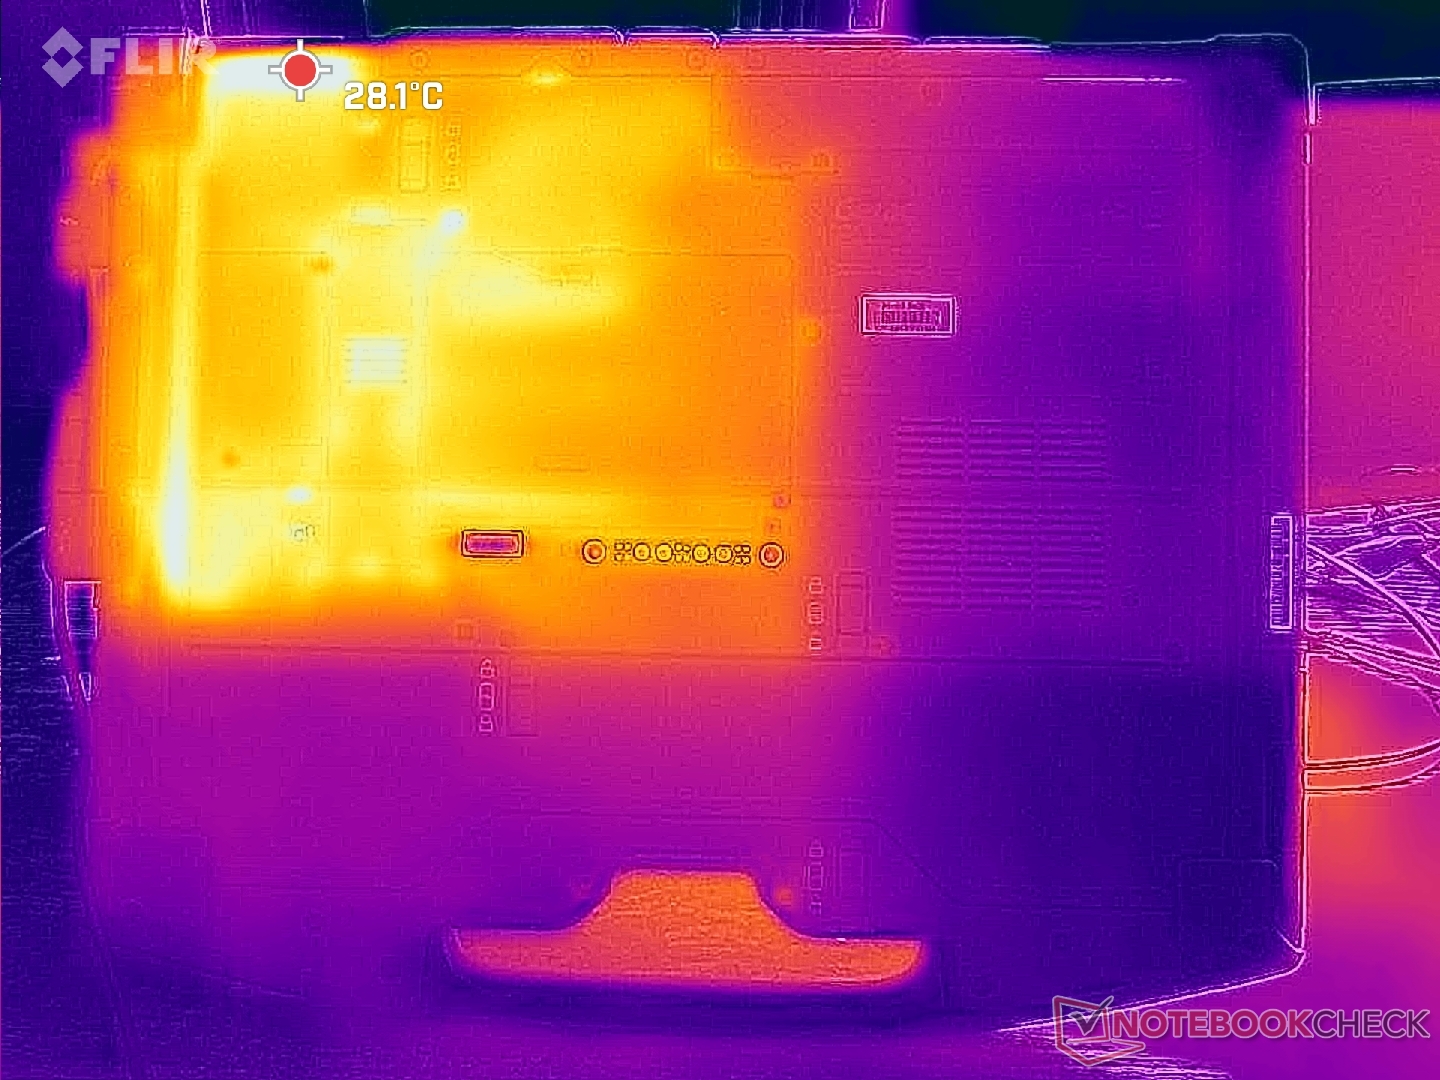
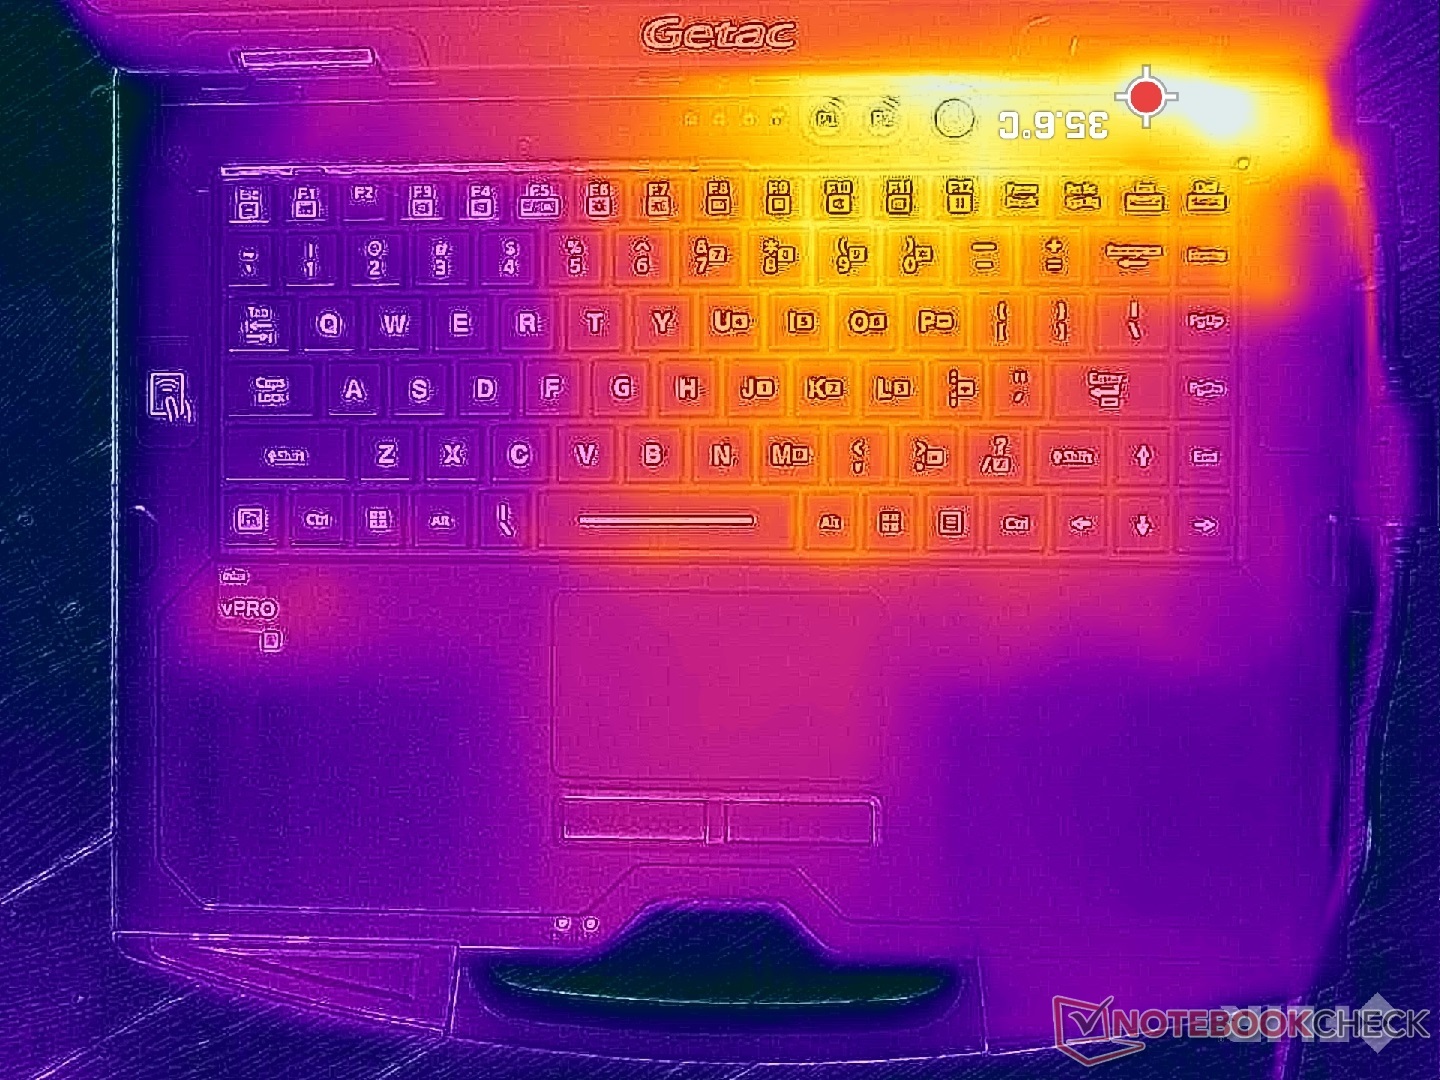
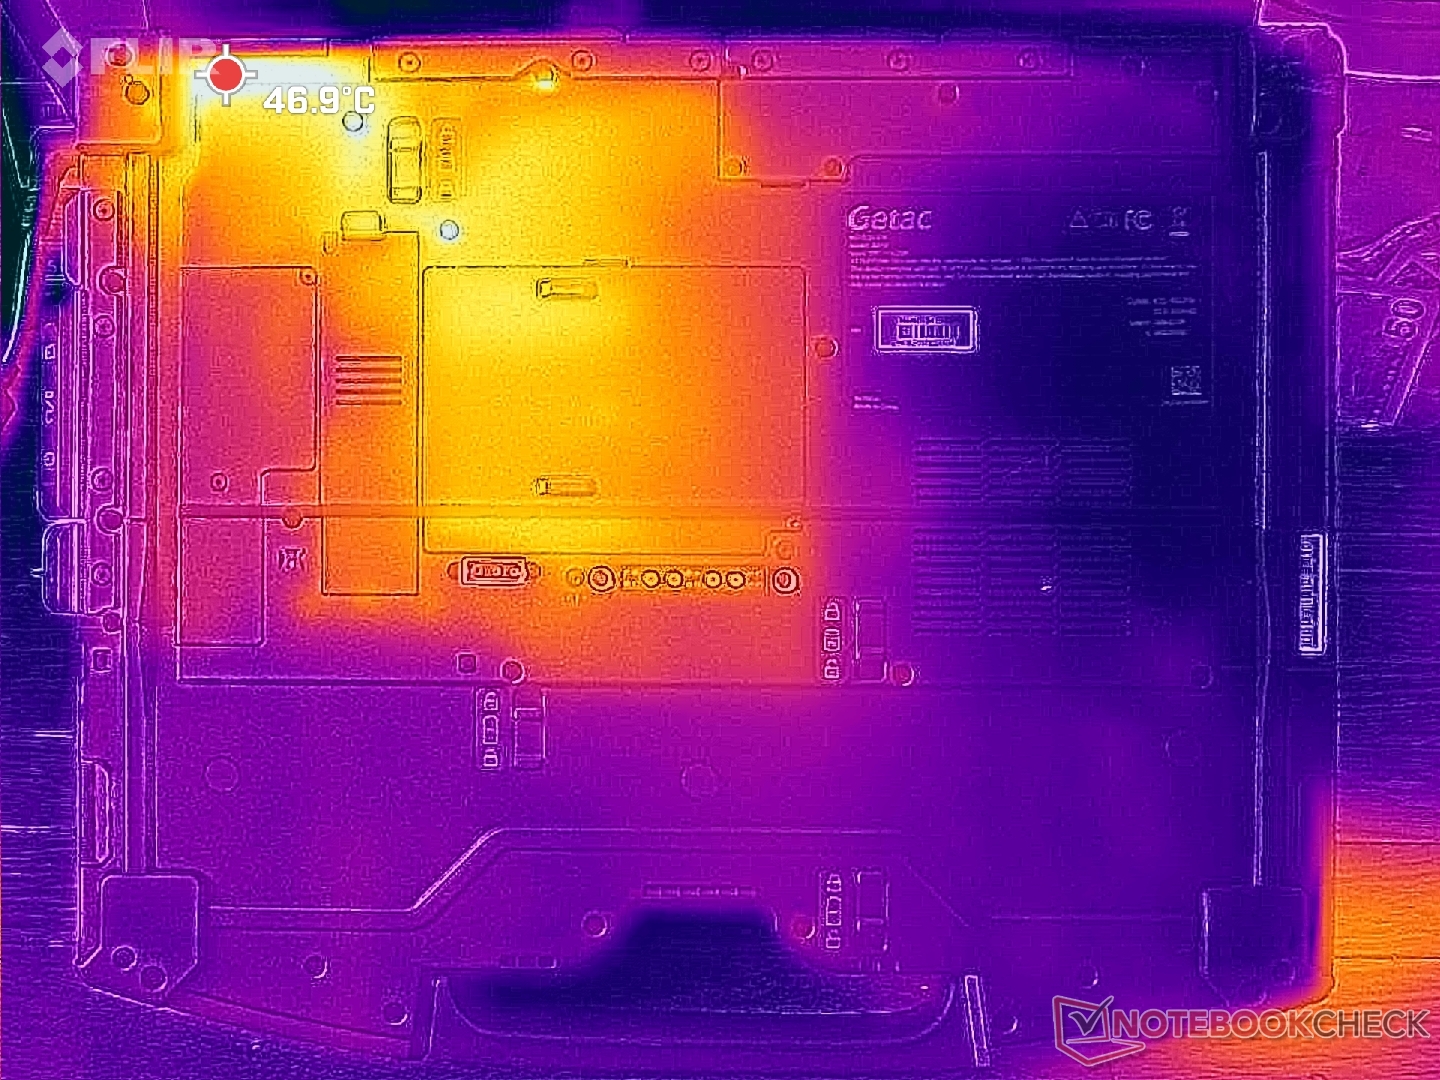
Sıcaklık
Yüzey sıcaklıkları kasanın sağ yarısında sola göre daha yüksektir. Sıcak noktalar dizüstü bilgisayarın C ve D kapaklarında sırasıyla 36 C ve 47 C'nin üzerine çıkabilir, ancak bu alanlar parmakların veya cildin temas etme olasılığının düşük olduğu arka tarafa doğru yoğunlaşmıştır.
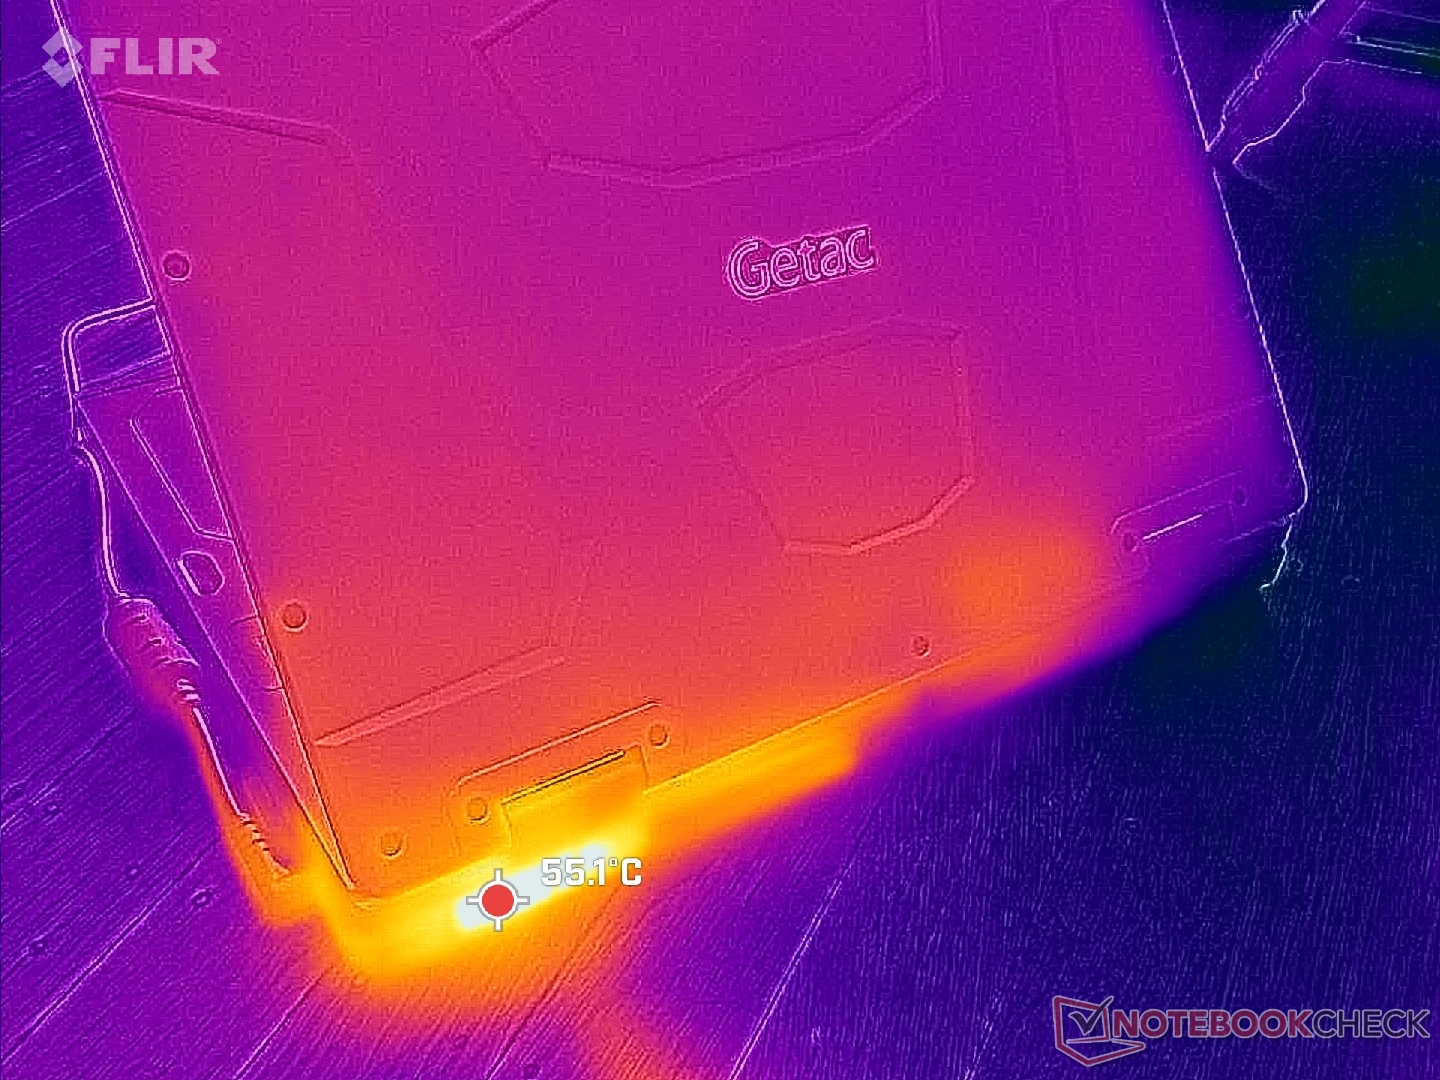
(+) Üst taraftaki maksimum sıcaklık, 34.3 °C / 94 F ortalamasına kıyasla 37 °C / 99 F'dir. , Office sınıfı için 21.2 ile 62.5 °C arasında değişir.
(±) Alt kısım, 36.8 °C / 98 F ortalamasına kıyasla maksimum 42.2 °C / 108 F'ye kadar ısınır
(+) Boşta kullanımda, üst tarafın ortalama sıcaklığı 25.6 °C / 78 F olup, cihazın 29.5 °C / 85 F.
(+) Avuç içi dayanakları ve dokunmatik yüzey, maksimum 26.8 °C / 80.2 F ile cilt sıcaklığından daha soğuktur ve bu nedenle dokunulduğunda soğuktur.
(±) Benzer cihazların avuç içi dayanağı alanının ortalama sıcaklığı 27.6 °C / 81.7 F (+0.8 °C / 1.5 F) idi.
| Getac S410 G5 Intel Core i5-1350P, Intel Iris Xe Graphics G7 80EUs | Getac S410 Gen 4 Intel Core i7-1185G7, Intel Iris Xe Graphics G7 96EUs | Durabook S14I Intel Core i7-1165G7, Intel Iris Xe Graphics G7 96EUs | Dell Latitude 14 5420-D2G5W Intel Core i5-1135G7, Intel Iris Xe Graphics G7 80EUs | Dell Latitude 7330 Rugged Extreme Intel Core i7-1185G7, Intel Iris Xe Graphics G7 96EUs | Panasonic Toughbook 40 Intel Core i7-1185G7, Intel Iris Xe Graphics G7 96EUs | |
|---|---|---|---|---|---|---|
| Heat | -7% | -1% | 2% | 14% | 5% | |
| Maximum Upper Side * | 37 | 36 3% | 36.4 2% | 41.7 -13% | 34.6 6% | 35.6 4% |
| Maximum Bottom * | 42.2 | 46.8 -11% | 38.6 9% | 35.6 16% | 36.6 13% | 40 5% |
| Idle Upper Side * | 28.8 | 30 -4% | 32.6 -13% | 29.9 -4% | 24.8 14% | 28.6 1% |
| Idle Bottom * | 33 | 38.2 -16% | 33.8 -2% | 29.7 10% | 25.2 24% | 29.4 11% |
* ... daha küçük daha iyidir
Stres Testi
Yük altında çekirdek sıcaklığı geçen yılki S410 G4'e göre birkaç C derece daha düşüktür. Prime95 stresini çalıştırırken, CPU 3,1 GHz, 53 W ve 97 C'ye yükselir ve sınırlı Turbo Boost sürdürülebilirliği nedeniyle testten bir dakika sonra 1,9 GHz, 88 C ve 29 W'ye düşer. Çekirdek sıcaklığı da aşağıdaki durumlarda benzerdir Witcher 3 s410 G4'ün CPU'su ise 90 C'nin çok üzerinde stabilize olur.
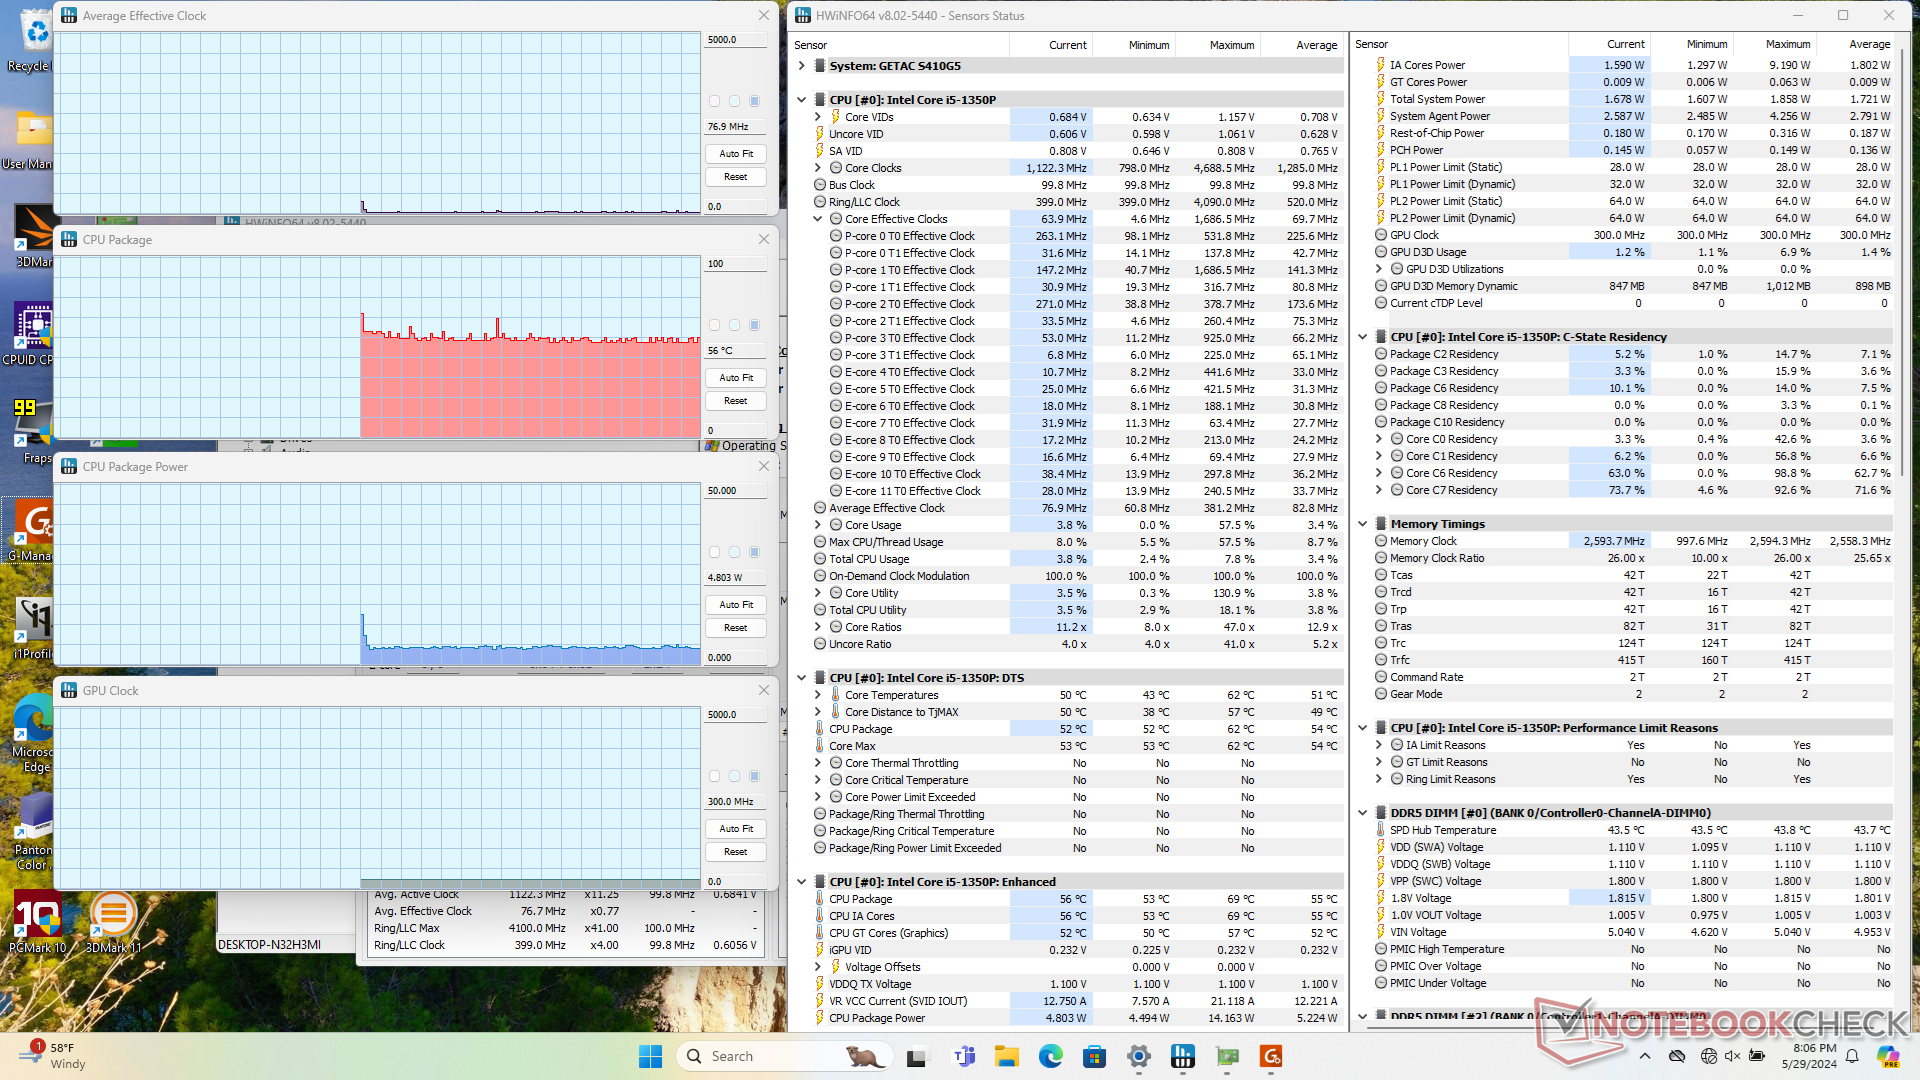
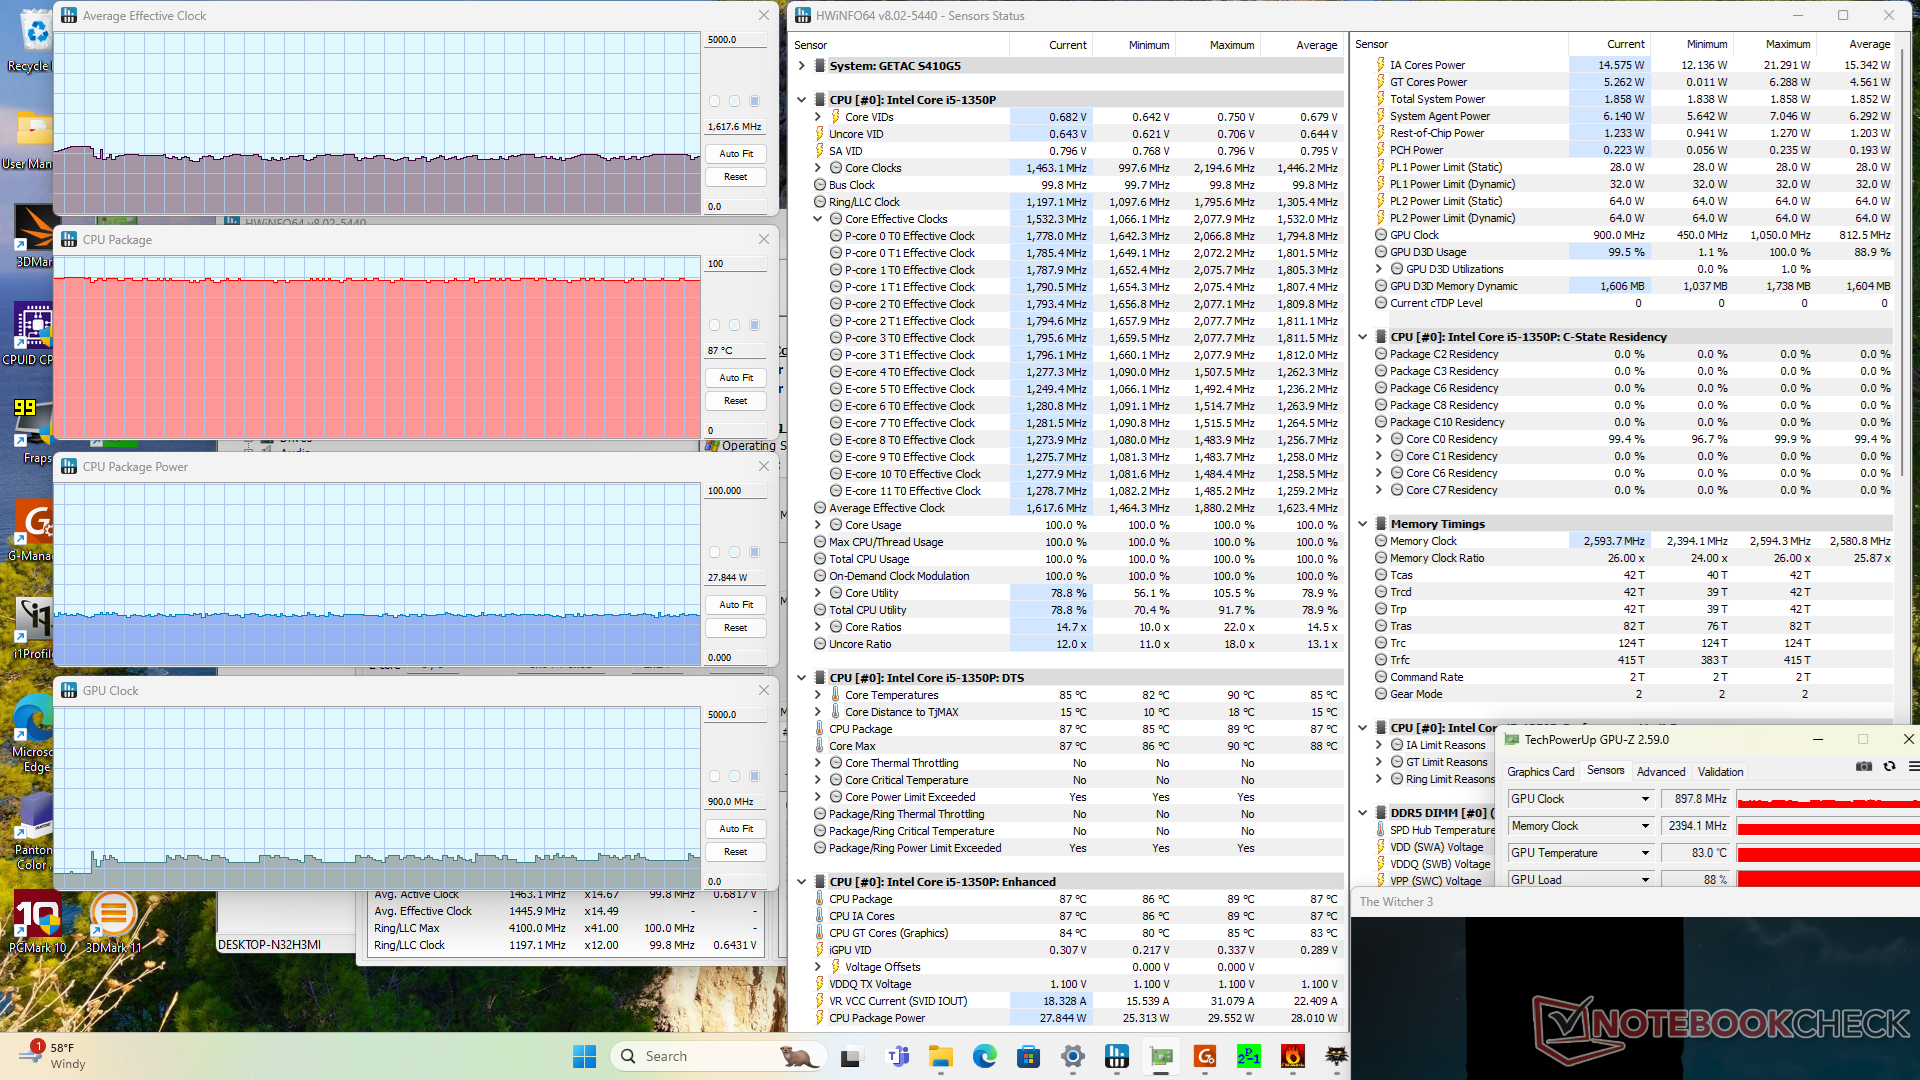
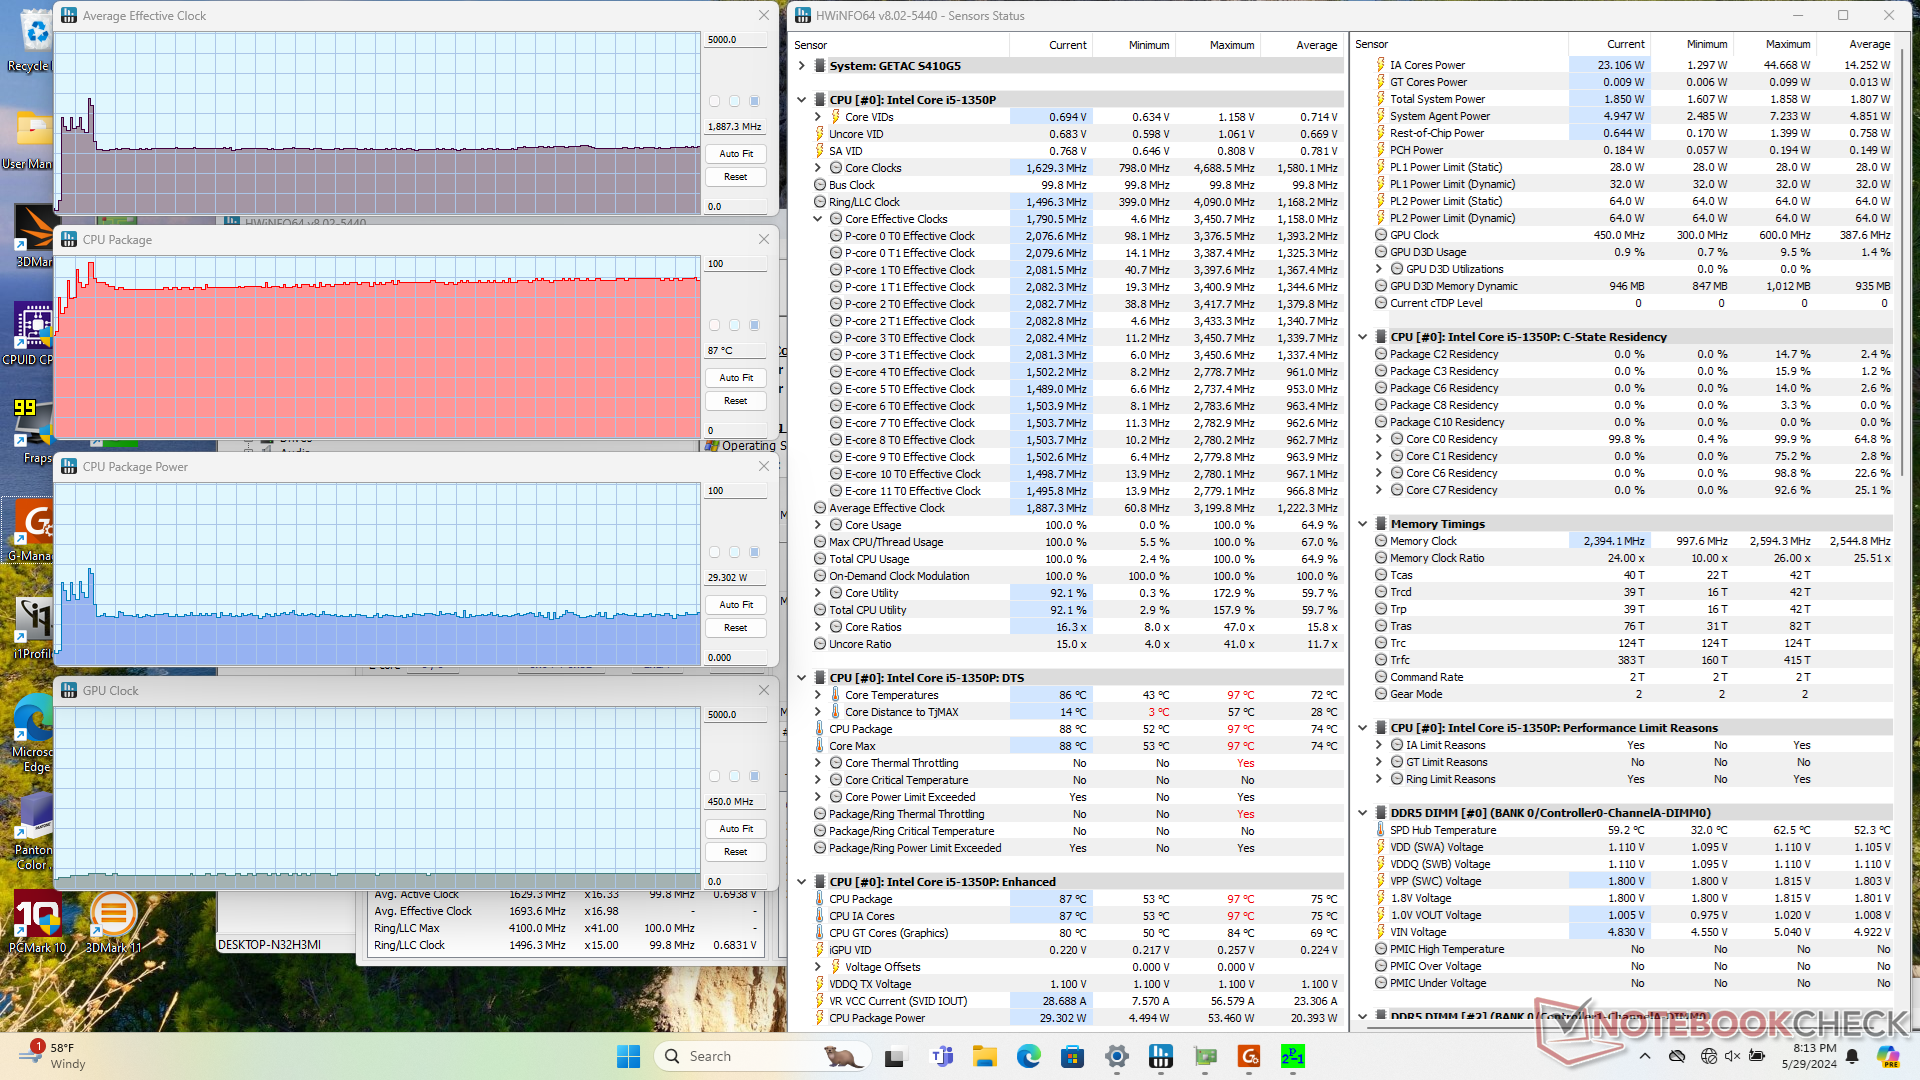
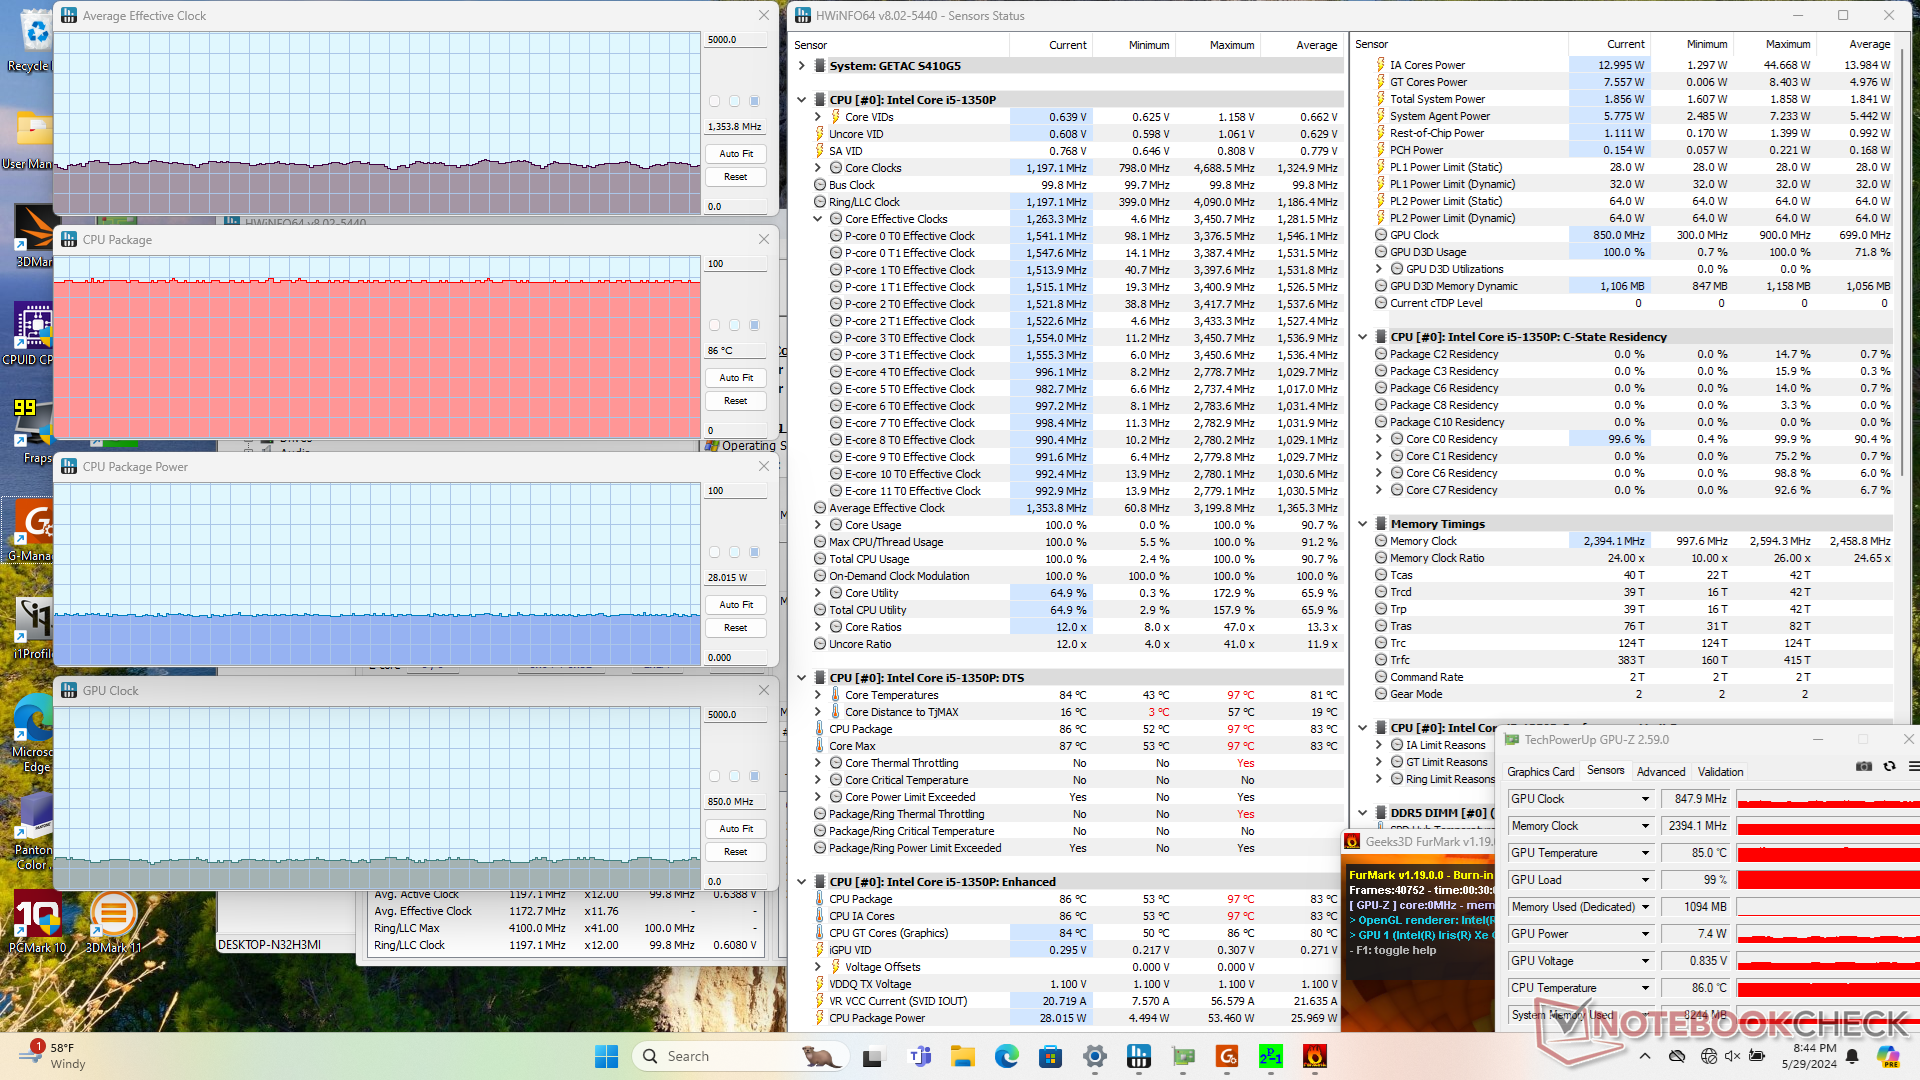
| Ortalama CPU Saati (GHz) | GPU Saati (MHz) | Ortalama CPU Sıcaklığı (°C) | |
| Sistem Boşta | -- | -- | 56 |
| Prime95 Stres | 1.9 | -- | 88 |
| Prime95 + FurMark Stres | 1.2 - 1.5 | 850 | 86 |
| Witcher 3 Stres | 1,6 | 900 | 87 |
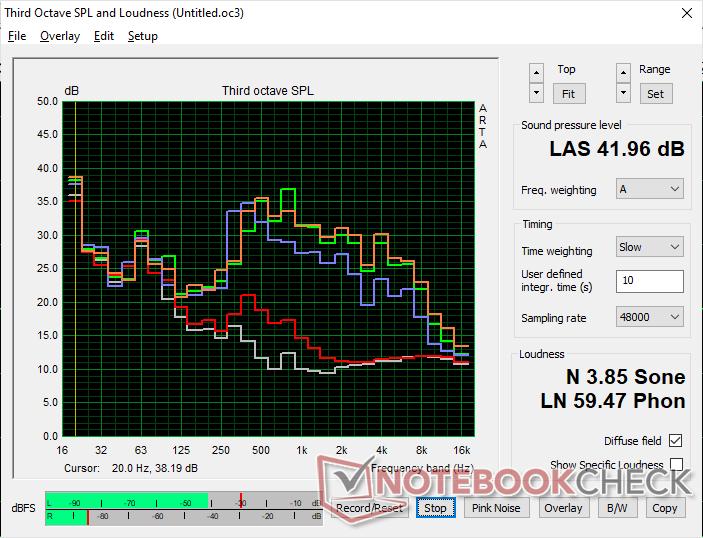
Konuşmacılar
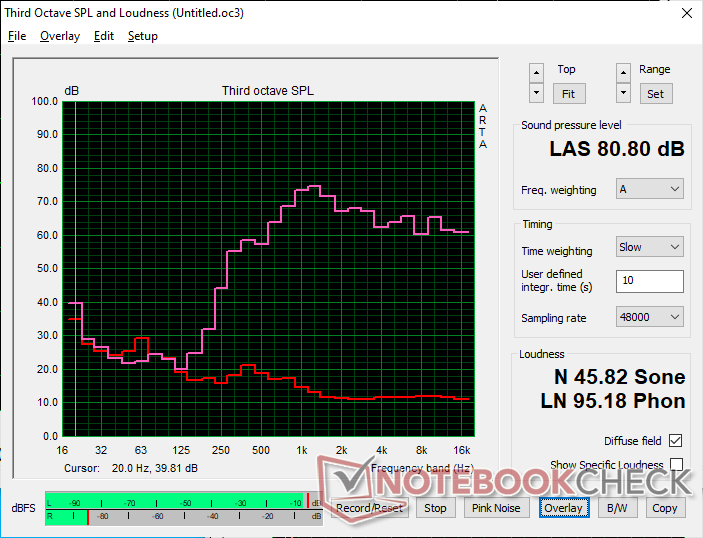
Getac S410 G5 ses analizi
(±) | hoparlör ses yüksekliği ortalama ama iyi (80.8 dB)
Bas 100 - 315Hz
(-) | neredeyse hiç bas yok - ortalama olarak medyandan 29.2% daha düşük
(±) | Bas doğrusallığı ortalamadır (13.4% delta - önceki frekans)
Ortalar 400 - 2000 Hz
(±) | daha yüksek ortalar - ortalama olarak medyandan 6.7% daha yüksek
(±) | Ortaların doğrusallığı ortalamadır (7.5% delta - önceki frekans)
Yüksekler 2 - 16 kHz
(+) | dengeli yüksekler - medyandan yalnızca 2.9% uzakta
(+) | yüksekler doğrusaldır (6% deltadan önceki frekansa)
Toplam 100 - 16.000 Hz
(±) | Genel sesin doğrusallığı ortalamadır (23.3% ortancaya göre fark)
Aynı sınıfla karşılaştırıldığında
» Bu sınıftaki tüm test edilen cihazların %64%'si daha iyi, 8% benzer, 28% daha kötüydü
» En iyisinin deltası 7% idi, ortalama 21% idi, en kötüsü 53% idi
Test edilen tüm cihazlarla karşılaştırıldığında
» Test edilen tüm cihazların %68'si daha iyi, 6 benzer, % 27 daha kötüydü
» En iyisinin deltası 4% idi, ortalama 24% idi, en kötüsü 134% idi
Apple MacBook Pro 16 2021 M1 Pro ses analizi
(+) | hoparlörler nispeten yüksek sesle çalabilir (84.7 dB)
Bas 100 - 315Hz
(+) | iyi bas - medyandan yalnızca 3.8% uzakta
(+) | bas doğrusaldır (5.2% delta ile önceki frekans)
Ortalar 400 - 2000 Hz
(+) | dengeli ortalar - medyandan yalnızca 1.3% uzakta
(+) | orta frekanslar doğrusaldır (2.1% deltadan önceki frekansa)
Yüksekler 2 - 16 kHz
(+) | dengeli yüksekler - medyandan yalnızca 1.9% uzakta
(+) | yüksekler doğrusaldır (2.7% deltadan önceki frekansa)
Toplam 100 - 16.000 Hz
(+) | genel ses doğrusaldır (4.6% ortancaya göre fark)
Aynı sınıfla karşılaştırıldığında
» Bu sınıftaki tüm test edilen cihazların %0%'si daha iyi, 0% benzer, 100% daha kötüydü
» En iyisinin deltası 5% idi, ortalama 18% idi, en kötüsü 45% idi
Test edilen tüm cihazlarla karşılaştırıldığında
» Test edilen tüm cihazların %0'si daha iyi, 0 benzer, % 100 daha kötüydü
» En iyisinin deltası 4% idi, ortalama 24% idi, en kötüsü 134% idi
Enerji Yönetimi
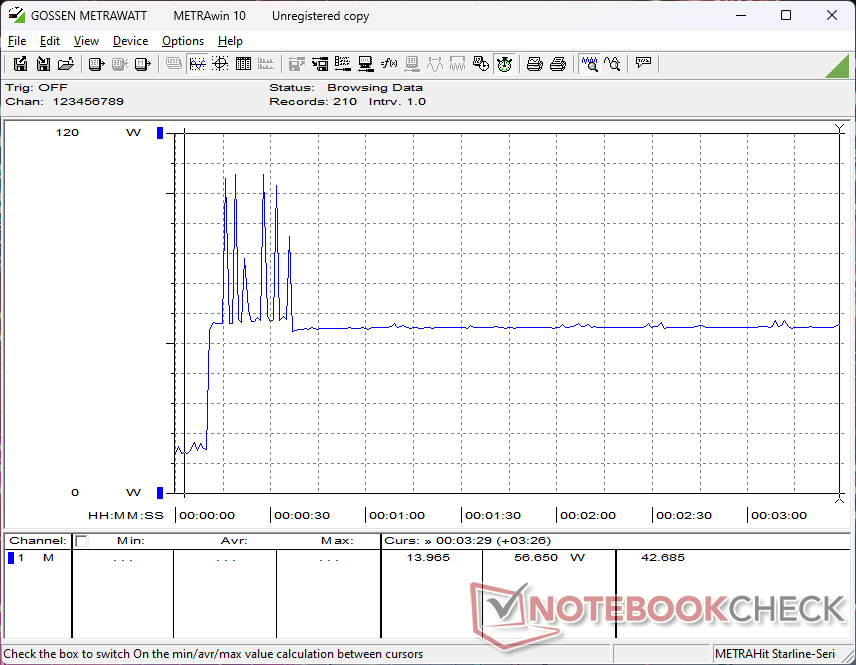
Güç Tüketimi
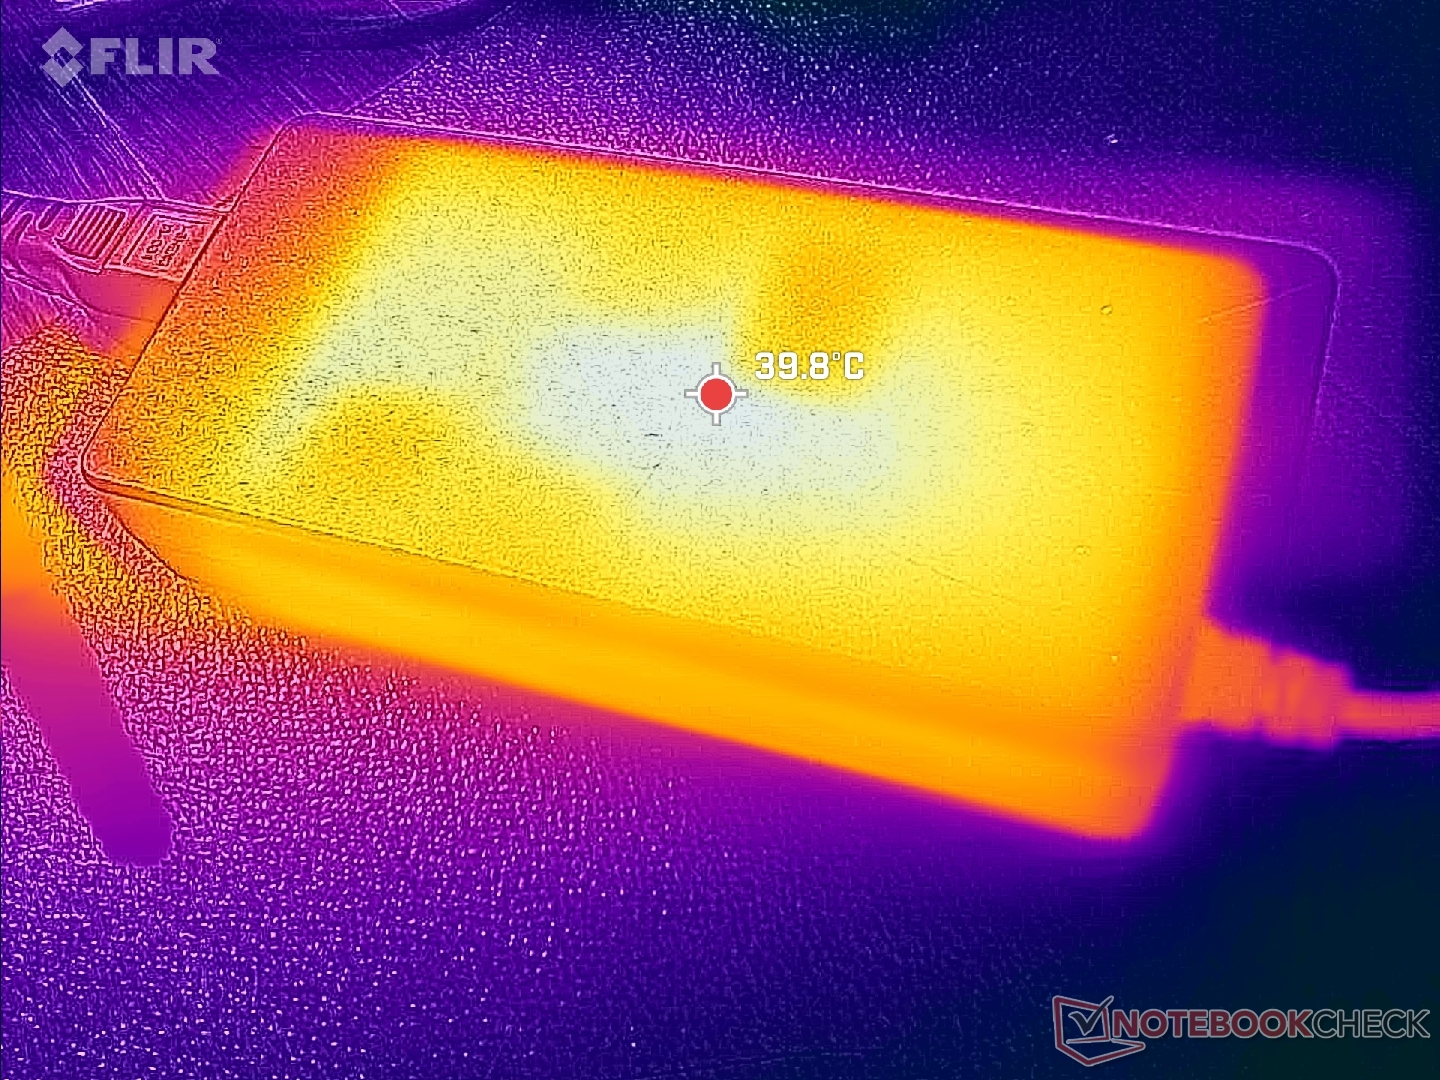
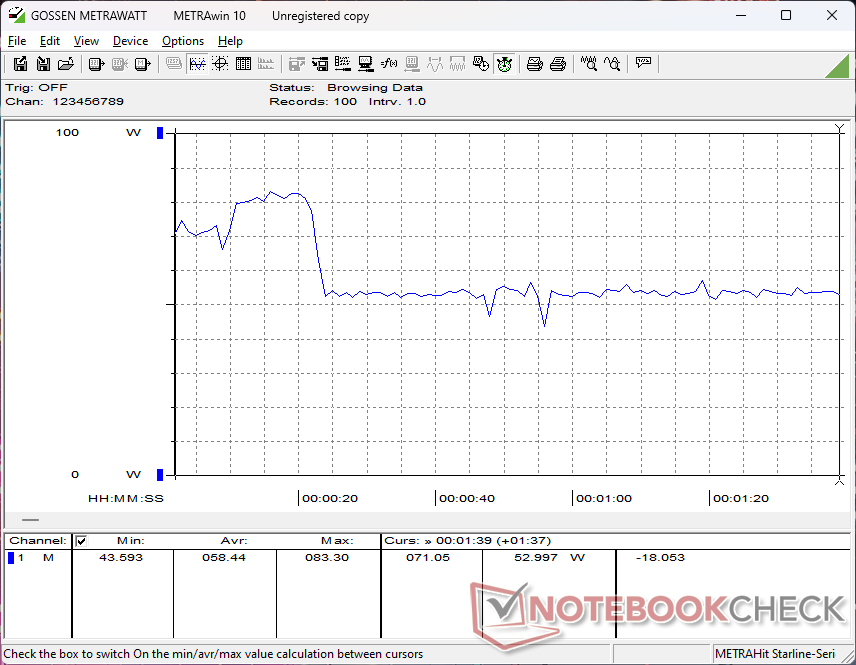
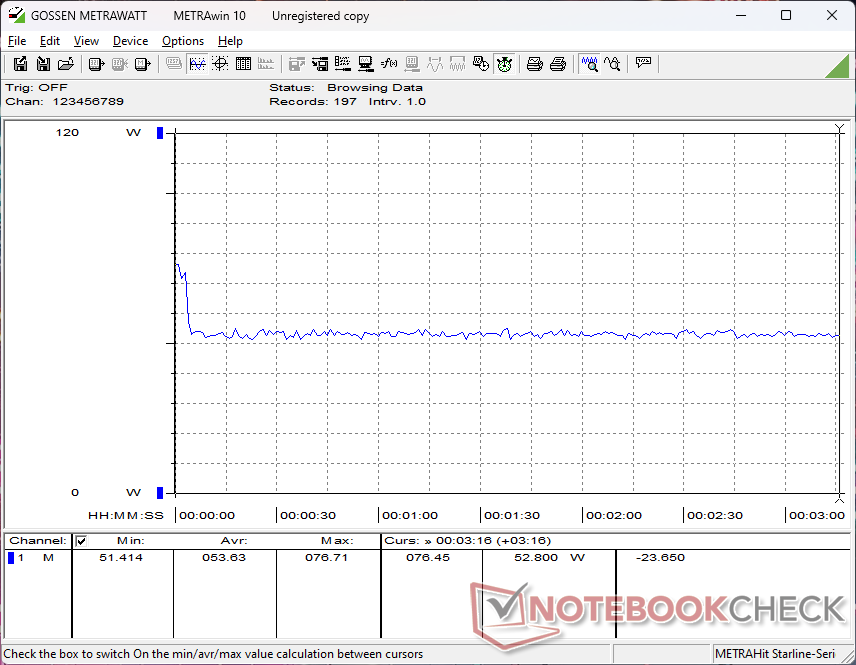
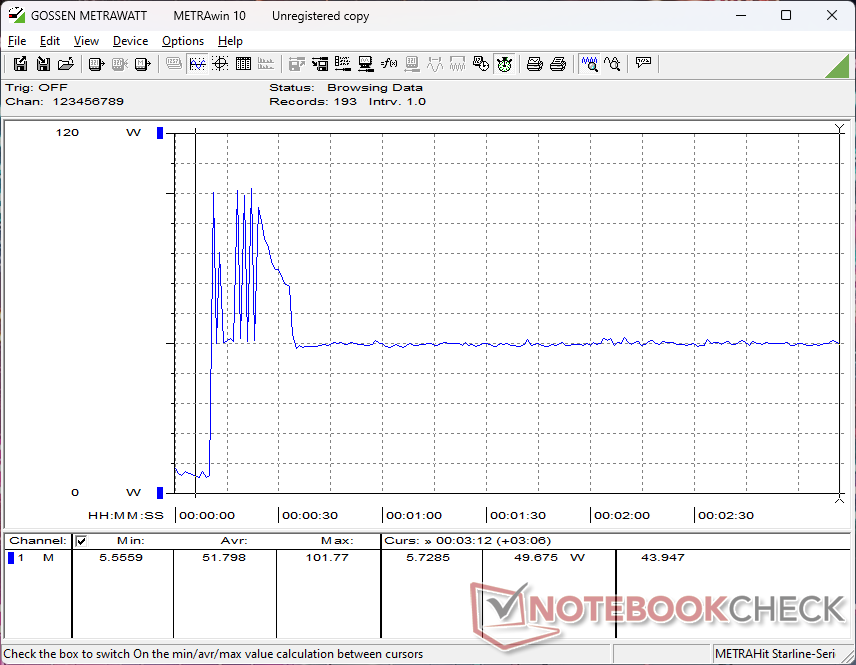
Güç tüketimi S410 G4 ile karşılaştırılabilir ancak CPU ile ilgili önemli bir istisna var. Yeni Core i5-1350P yukarıda bahsedildiği gibi Core i7-1185G7'den önemli ölçüde daha hızlıdır, ancak bunun bedeli özellikle Turbo Boost aktifken daha yüksek güç tüketimidir. Örneğin, Turbo Boost'un en hızlı olduğu Prime95 stresinin ilk birkaç saniyesinde tüketim 102 W'a kadar çıkabilirken S410 G4'te bu değer sadece 73 W'tır. Buna rağmen, watt başına performans, herhangi bir azaltmadan önce ve sonra yeni CPU ile hala daha üstündür.
Model, daha önce olduğu gibi aynı 90 W AC adaptörle birlikte gönderilir.
| Kapalı / Bekleme modu | |
| Boşta | |
| Çalışırken |
|
Key:
min: | |
| Getac S410 G5 i5-1350P, Iris Xe G7 80EUs, SSSTC CL4-8D512, IPS, 1920x1080, 14" | Getac S410 Gen 4 i7-1185G7, Iris Xe G7 96EUs, SSSTC CA5-8D256, IPS, 1920x1080, 14" | Durabook S14I i7-1165G7, Iris Xe G7 96EUs, UDinfo M2P M2P80DE512GBAEP, TN, 1920x1080, 14" | Dell Latitude 14 5420-D2G5W i5-1135G7, Iris Xe G7 80EUs, WDC PC SN530 SDBPTPZ-256G, IPS, 1920x1080, 14" | Dell Latitude 7330 Rugged Extreme i7-1185G7, Iris Xe G7 96EUs, , IPS, 1920x1080, 13.3" | Panasonic Toughbook 40 i7-1185G7, Iris Xe G7 96EUs, Samsung PM991 MZVLQ1T0HALB, IPS, 1920x1080, 14" | |
|---|---|---|---|---|---|---|
| Power Consumption | 10% | 11% | 44% | 23% | 18% | |
| Idle Minimum * | 7.9 | 8.3 -5% | 6.8 14% | 3.4 57% | 4.1 48% | 4.9 38% |
| Idle Average * | 14.4 | 10.5 27% | 16.4 -14% | 7.1 51% | 11.7 19% | 12.3 15% |
| Idle Maximum * | 15.2 | 14.9 2% | 16.9 -11% | 8.4 45% | 11.8 22% | 14 8% |
| Load Average * | 58.4 | 48.6 17% | 39.2 33% | 35.3 40% | 48.5 17% | 54 8% |
| Witcher 3 ultra * | 53.7 | 50.9 5% | 35.4 34% | 44.3 18% | 46.3 14% | |
| Load Maximum * | 106.5 | 90.1 15% | 73.1 31% | 67 37% | 91 15% | 83.6 22% |
* ... daha küçük daha iyidir
Power Consumption Witcher 3 / Stresstest
Power Consumption external Monitor
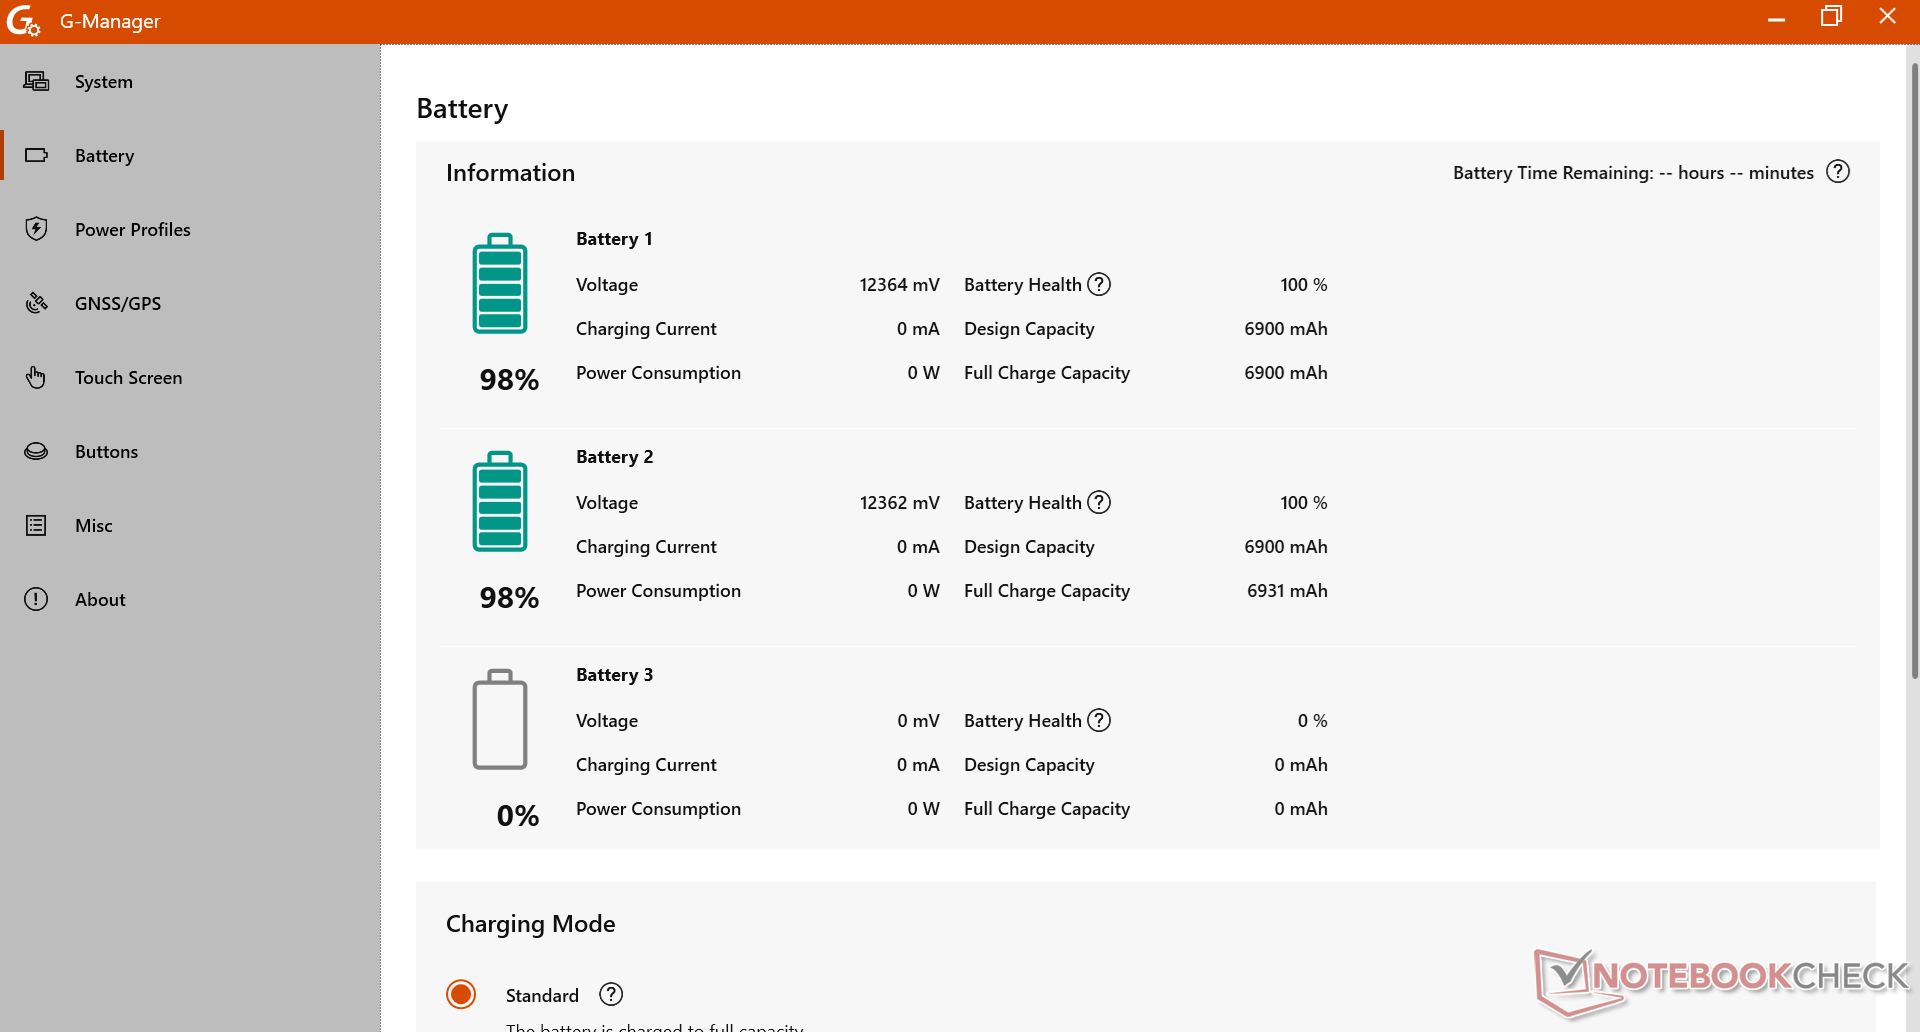
Pil Ömrü
S410 G5 test ünitemiz, S410 G4 ünitemizden farklı olarak dahili bir batarya içermiyor ve bunun yerine toplam 150 Wh kapasite için iki adet çıkarılabilir 75 Wh bataryaya dayanıyor. WLAN çalışma süresi, daha küçük toplam kapasiteyi hesaba kattıktan sonra bile geçen yılki modelden çok daha kısadır (17,5 saate karşı 28,5 saat). Pil ömrü farklılığı büyük ölçüde yukarıdaki Güç Tüketimi bölümünde bahsedildiği gibi daha zorlu Raptor Lake-P CPU'ya bağlanabilir.
| Getac S410 G5 i5-1350P, Iris Xe G7 80EUs, 150 Wh | Getac S410 Gen 4 i7-1185G7, Iris Xe G7 96EUs, 194 Wh | Durabook S14I i7-1165G7, Iris Xe G7 96EUs, 50 Wh | Dell Latitude 14 5420-D2G5W i5-1135G7, Iris Xe G7 80EUs, 63 Wh | Dell Latitude 7330 Rugged Extreme i7-1185G7, Iris Xe G7 96EUs, 107 Wh | Panasonic Toughbook 40 i7-1185G7, Iris Xe G7 96EUs, 136 Wh | |
|---|---|---|---|---|---|---|
| Pil Çalışma Süresi | 63% | -69% | -27% | 2% | 8% | |
| WiFi v1.3 | 1052 | 1715 63% | 329 -69% | 769 -27% | 1077 2% | 1137 8% |
| Reader / Idle | 1371 | |||||
| Load | 146 |
Artılar
Eksiler
Karar
S410 G5, endüstriyel ve devlet uygulamaları için önemli olan önceki nesil modellerle uyumluluğu koruyor. Ekran gölgelenmesinin azalması ve CPU performansındaki artış kesinlikle en son modelin öne çıkan özellikleri ve eski S410 G4 yerine S410 G5'i satın almanın ana nedenleri. Pil ömrü daha hızlı CPU'dan bir darbe alıyor, ancak özellikle sistem birden fazla pil paketini destekleyebildiği için hala çok uzun. Bu arada, daha yüksek çözünürlüklü web kamerası ve uygun Wi-Fi 6E desteği güzel ekstralar.
Sağlam Getac S410 G5, yeni 13. nesil CPU sayesinde eskisinden önemli ölçüde daha hızlı. Bununla birlikte, bazı dahili ve harici özelliklerin kullanıcı deneyimini iyileştirmek için güncellemelere ihtiyacı vardır.
Tasarımın bazı can sıkıcı yönlerinin gelecek sürümler için ele alındığını görmek isteriz. Örneğin daha büyük bir fan, fan gürültüsünü azaltmaya yardımcı olacaktır. Hoparlörlerin sesi daha yüksek olabilir ve bağlantı noktası kapaklarının açılması daha kolay olabilir. Klavye tuşları da çok güvenilir değil, çünkü bir girişi kaydetmeden bir tuşa vurmak mümkün. Bu dezavantajlar S410 serisinde de devam ediyor ve her geçen yıl göz ardı edilmesi daha da zorlaşıyor.
Fiyat ve Bulunabilirlik
Fiyat teklifleri mevcuttur getac'ın resmi web siteleri talep üzerine.
Getac S410 G5
- 06/05/2024 v7 (old)
Allen Ngo
Şeffaflık
İncelenecek cihazların seçimi editör ekibimiz tarafından yapılır. Test örneği, bu incelemenin amacı doğrultusunda üretici veya perakendeci tarafından yazara ödünç olarak sağlanmıştır. Borç verenin bu inceleme üzerinde herhangi bir etkisi olmadığı gibi, üretici de yayınlanmadan önce bu incelemenin bir kopyasını almamıştır. Bu incelemeyi yayınlama zorunluluğu yoktu. İncelemelerimiz karşılığında asla tazminat veya ödeme kabul etmiyoruz. Bağımsız bir medya şirketi olarak Notebookcheck, üreticilerin, perakendecilerin veya yayıncıların otoritesine tabi değildir.
Notebookcheck bu şekilde test yapıyor
Notebookcheck, tüm sonuçların karşılaştırılabilir olmasını sağlamak için her yıl yüzlerce dizüstü bilgisayarı ve akıllı telefonu standart prosedürler kullanarak bağımsız olarak inceliyor. Yaklaşık 20 yıldır test yöntemlerimizi sürekli olarak geliştirdik ve bu süreçte endüstri standartlarını belirledik. Test laboratuvarlarımızda deneyimli teknisyenler ve editörler tarafından yüksek kaliteli ölçüm ekipmanları kullanılmaktadır. Bu testler çok aşamalı bir doğrulama sürecini içerir. Karmaşık derecelendirme sistemimiz, nesnelliği koruyan yüzlerce sağlam temellere dayanan ölçüm ve kıyaslamaya dayanmaktadır.Price comparison

