

HP Victus 16 (2024) dizüstü bilgisayar incelemesi: RTX 4060 gücü uzun çalışma süreleriyle eşleşti
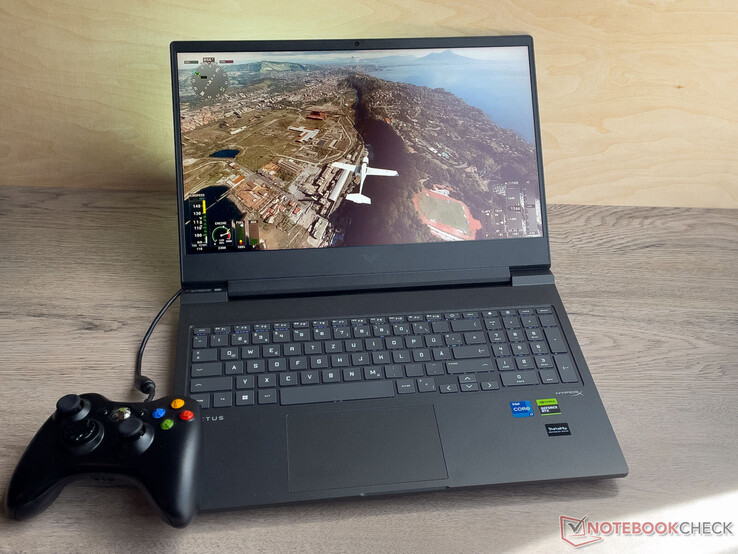
HP'nin Victus serisi, giriş seviyesinden orta seviyeye kadar oyun dizüstü bilgisayarlarından oluşuyor; bu test cihazı da ikinci sınıf olarak sınıflandırılabilir: Bir Raptor Lake işlemci, GeForce RTX 406016 GB RAM ve 512 GB SSD'den oluşan toplam paketin maliyeti yaklaşık 1.600 ABD dolarıdır. Rakipleri arasında aşağıdaki gibi cihazlar bulunmaktadır Gigabyte G6X 9KG (2024), Dell G16, Asus TUF Gaming A16 FA617XS ve Lenovo Legion 5 16IRX G9.
Victus 16'nın 2024 versiyonu, 2023 modeliyle aynı şekilde üretilmiştir. İkincisinin iki enkarnasyonunu zaten test ettik (RTX 4050 ve RTX 4070).
Karşılaştırmalı olarak olası rakipler
Derecelendirme | Tarih | Modeli | Ağırlık | Yükseklik | Boyut | Çözünürlük | Fiyat |
|---|---|---|---|---|---|---|---|
| 84.3 % v7 (old) | 05/2024 | HP Victus 16 (2024) i7-14700HX, NVIDIA GeForce RTX 4060 Laptop GPU | 2.4 kg | 23.9 mm | 16.10" | 1920x1080 | |
| 83.2 % v7 (old) | 03/2024 | Gigabyte G6X 9KG (2024) i7-13650HX, NVIDIA GeForce RTX 4060 Laptop GPU | 2.6 kg | 25.1 mm | 16.00" | 1920x1200 | |
| 85.5 % v7 (old) | 02/2024 | Dell G16, i7-13650HX, RTX 4060 i7-13650HX, NVIDIA GeForce RTX 4060 Laptop GPU | 2.8 kg | 25.65 mm | 16.00" | 2560x1600 | |
| 89.1 % v7 (old) | 02/2024 | Lenovo Legion 5 16IRX G9 i7-14650HX, NVIDIA GeForce RTX 4060 Laptop GPU | 2.4 kg | 25.2 mm | 16.00" | 2560x1600 | |
| 86.9 % v7 (old) | 06/2023 | Asus TUF Gaming A16 FA617XS R9 7940HS, Radeon RX 7600S | 2.2 kg | 22.1 mm | 16.00" | 1920x1200 |
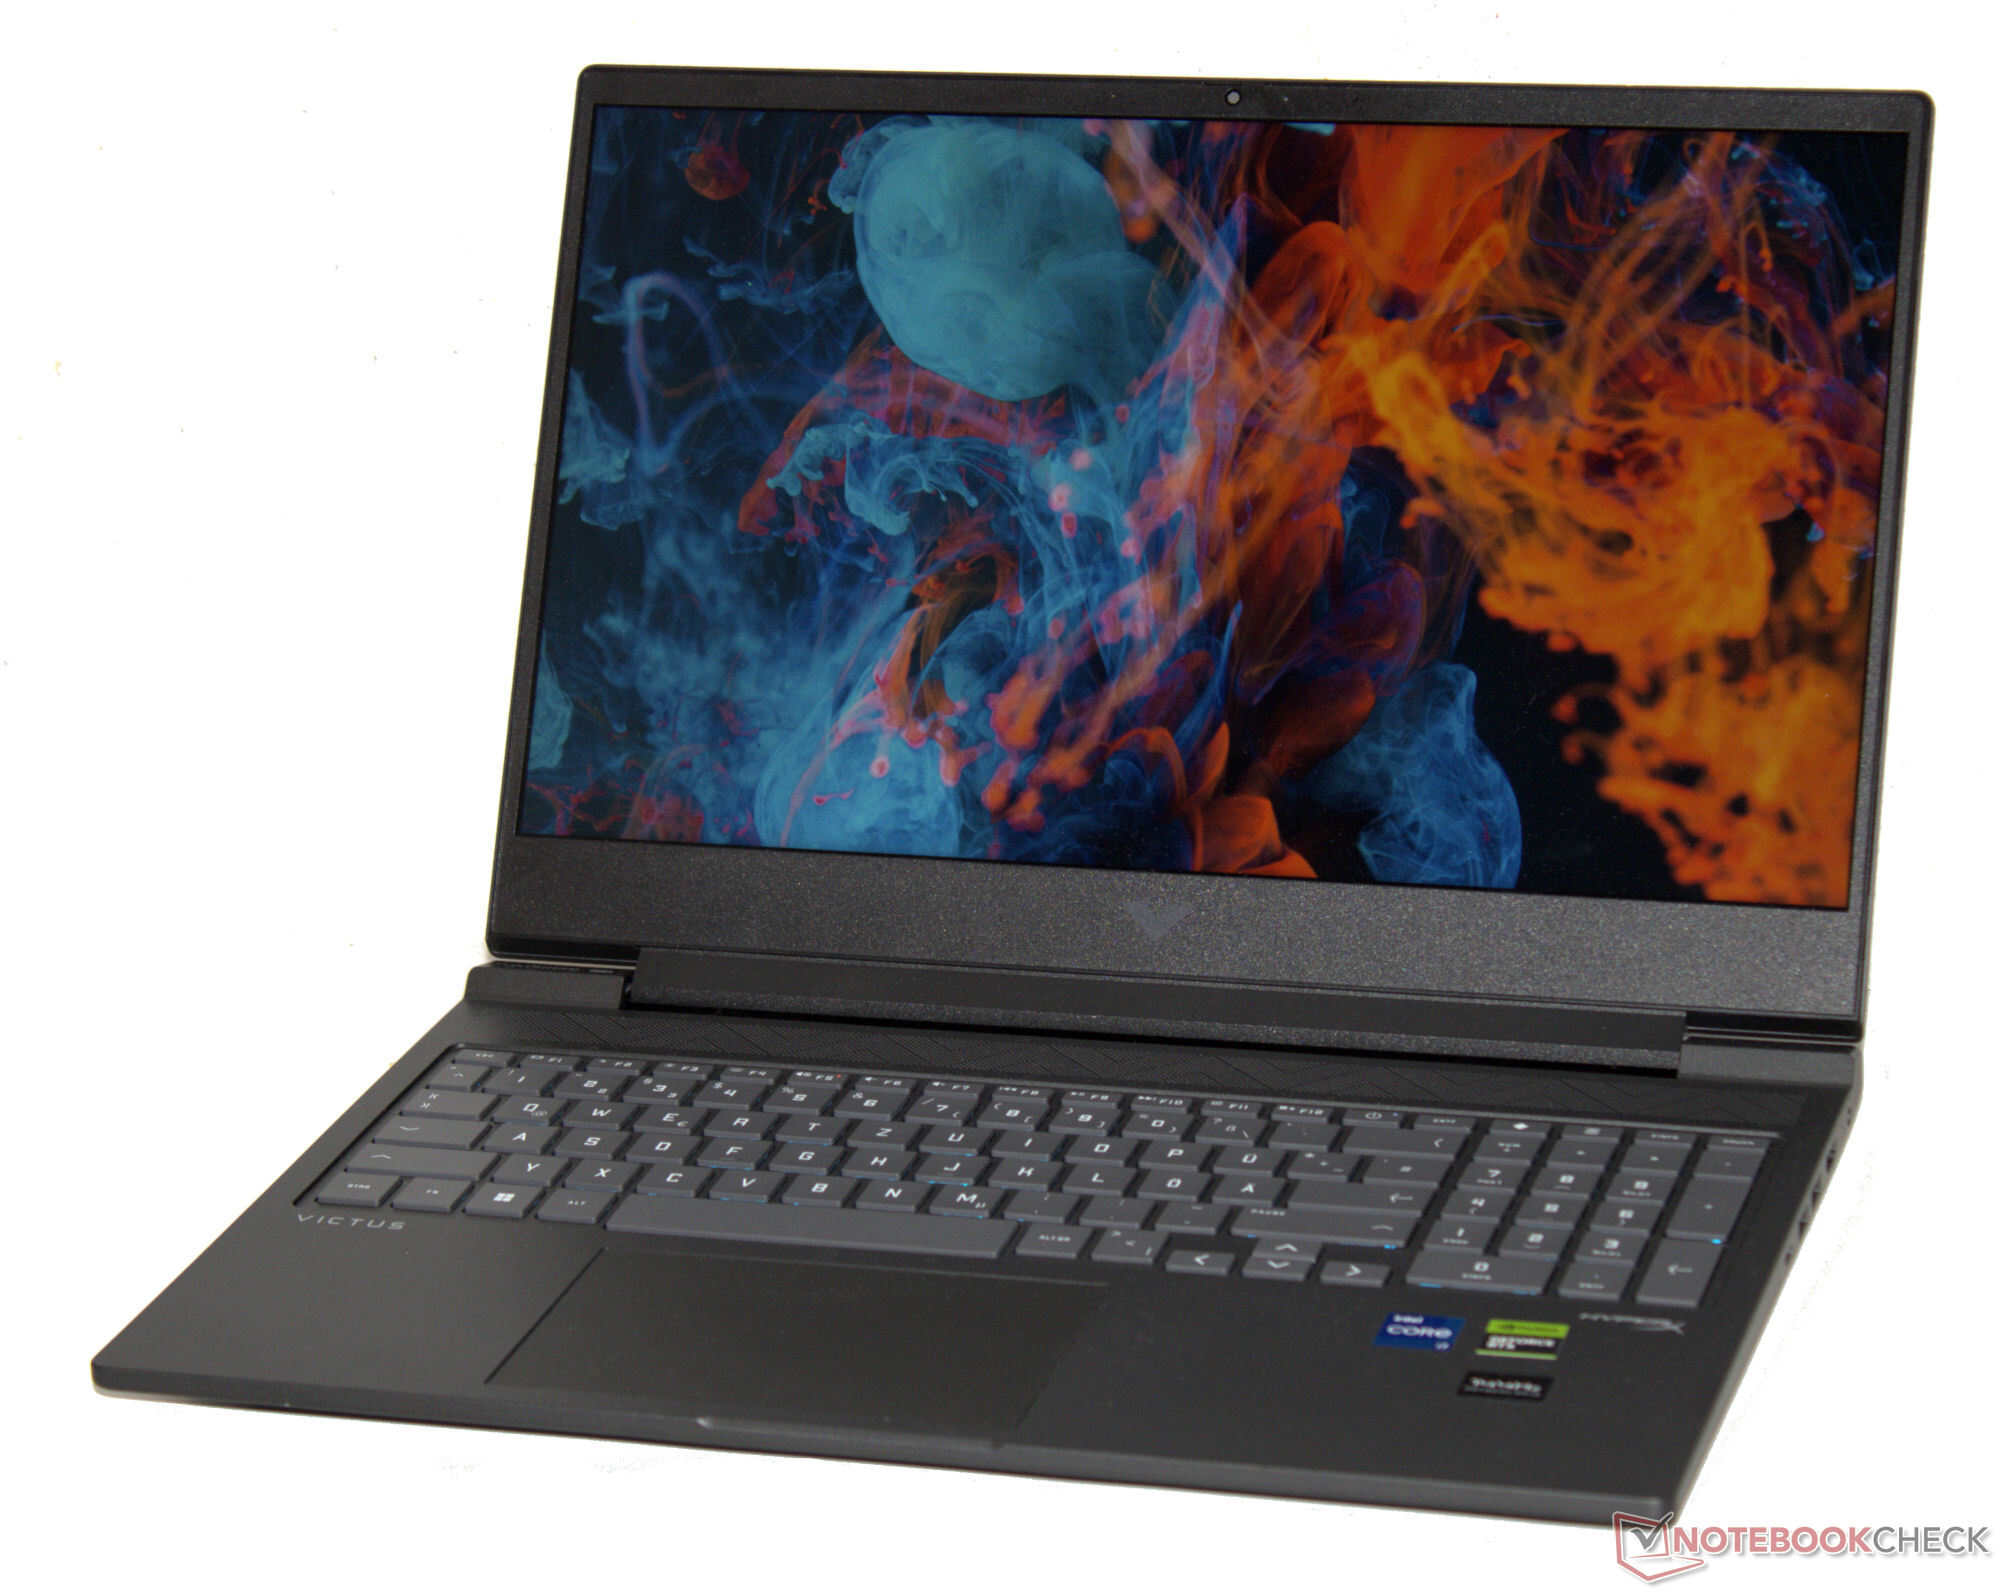
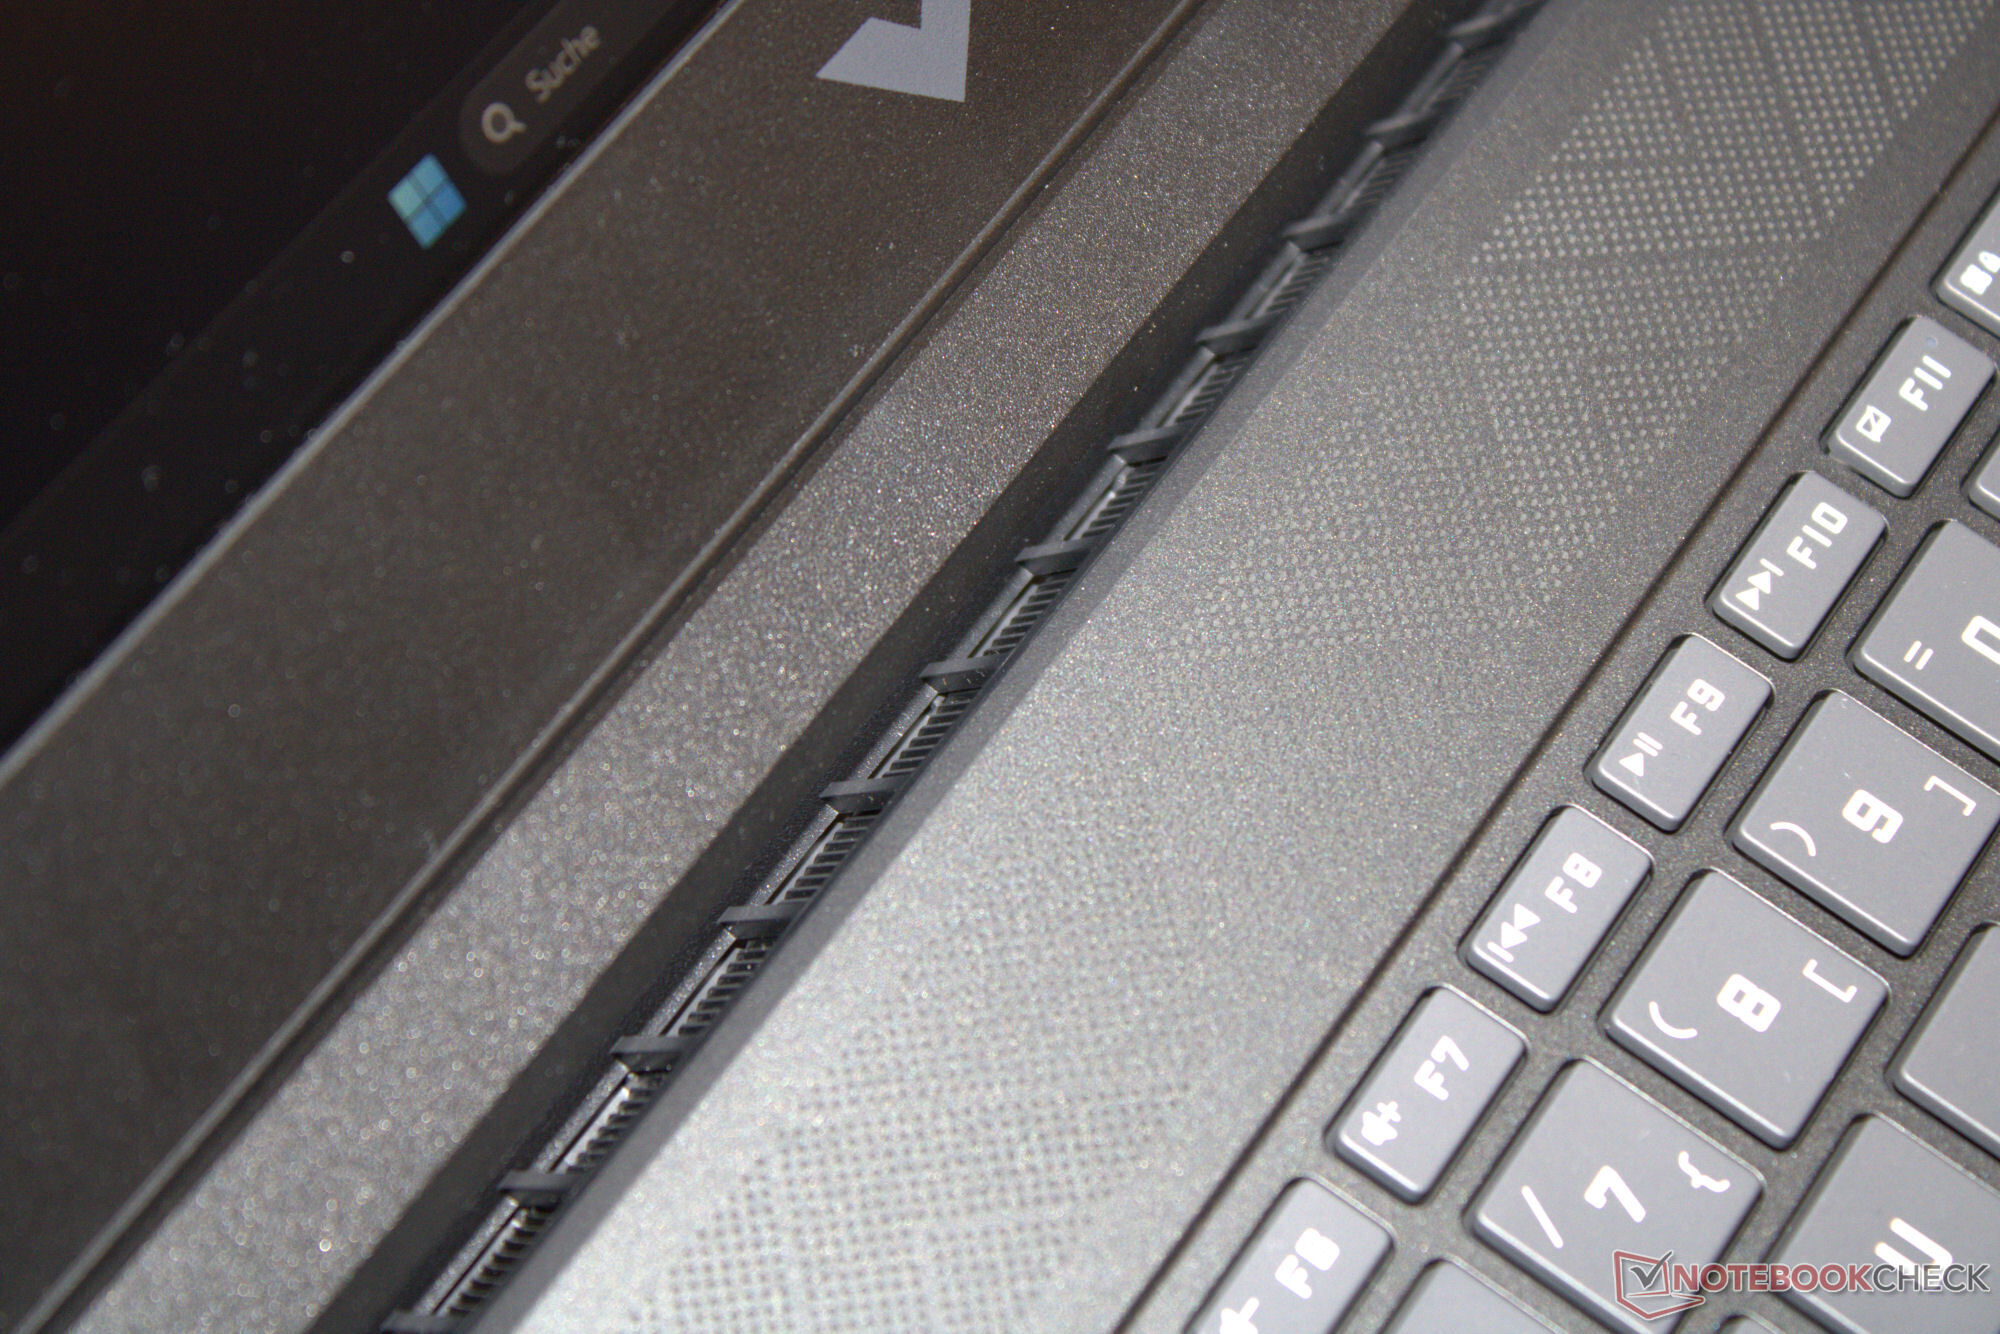
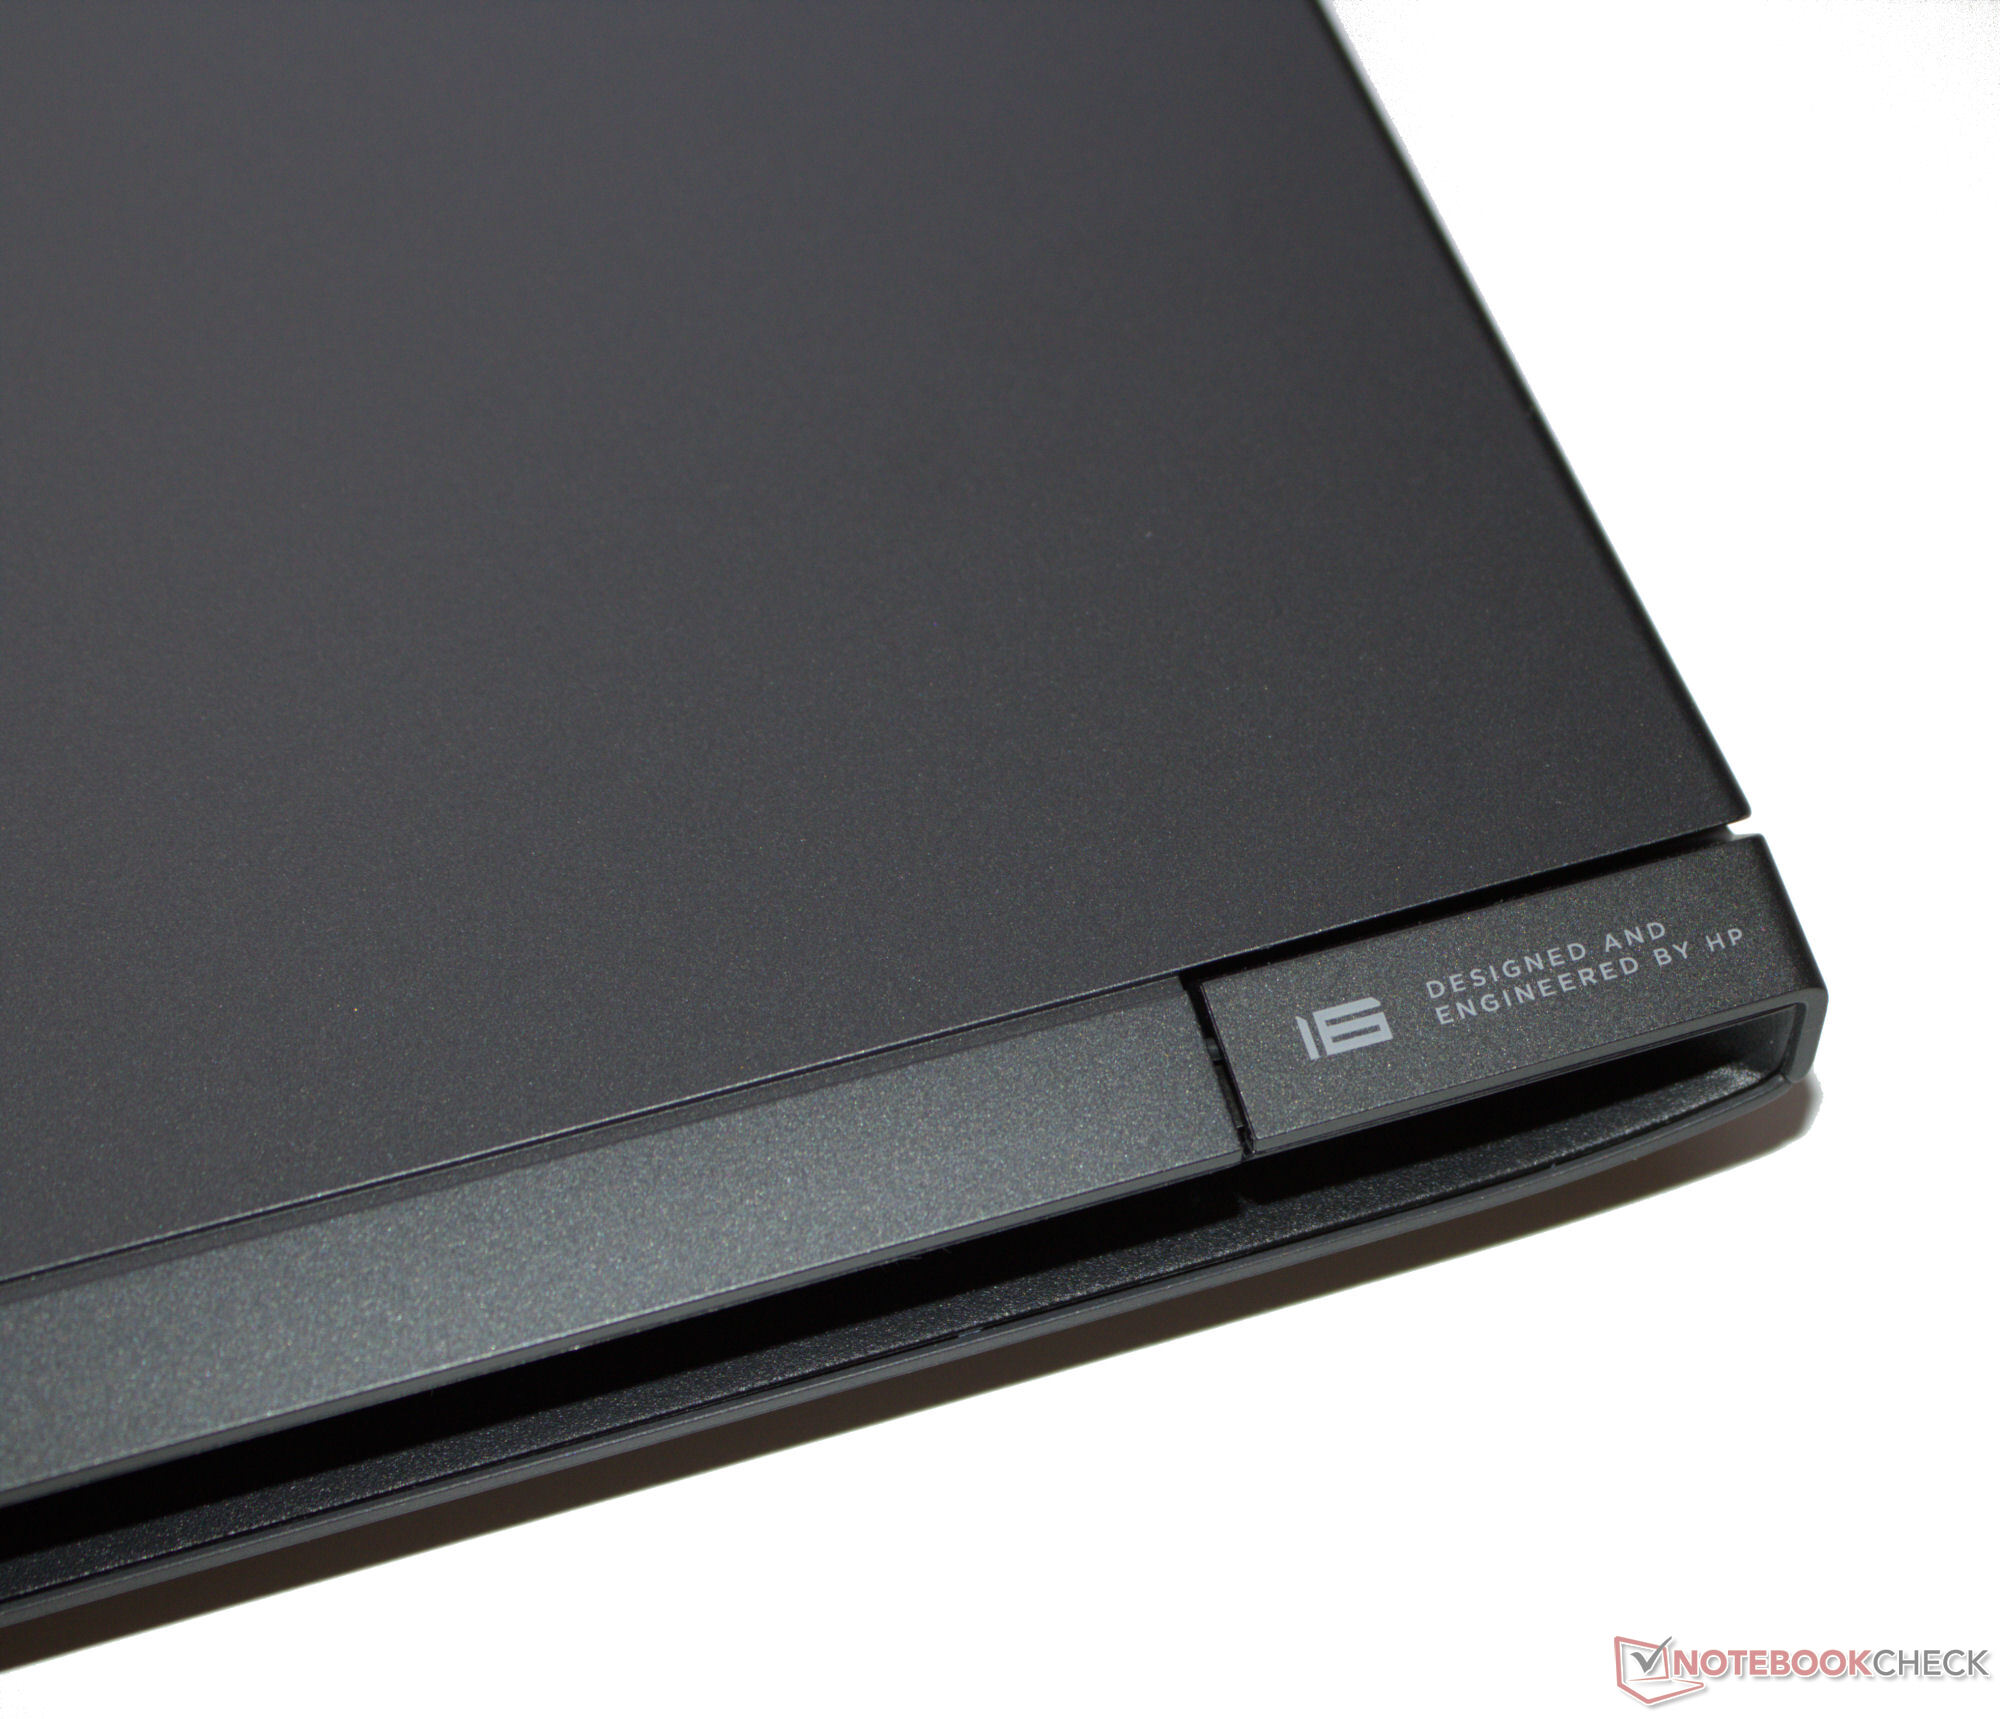
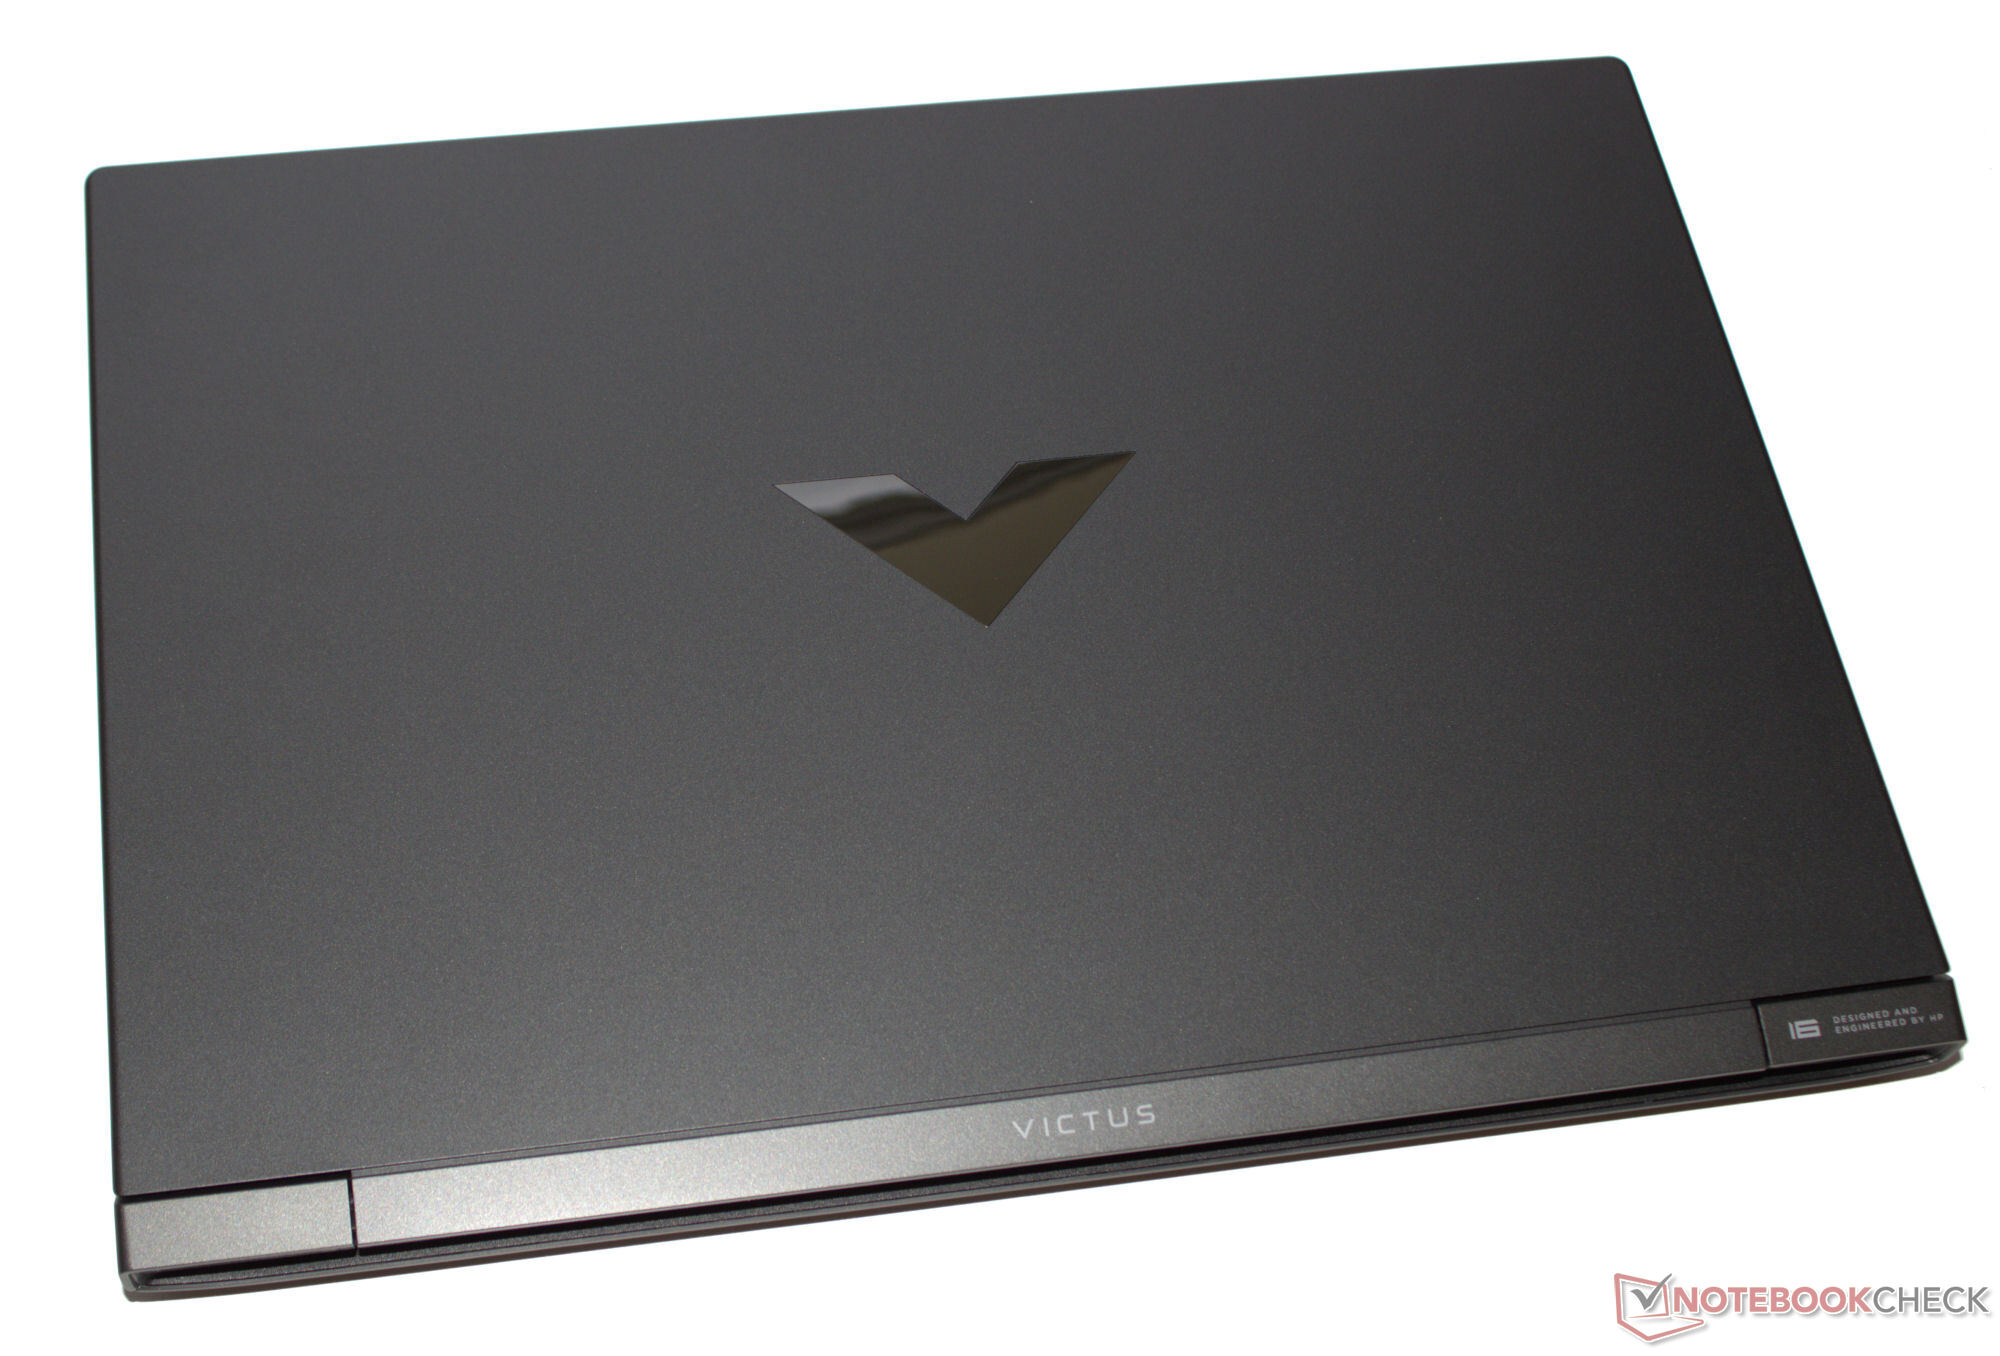
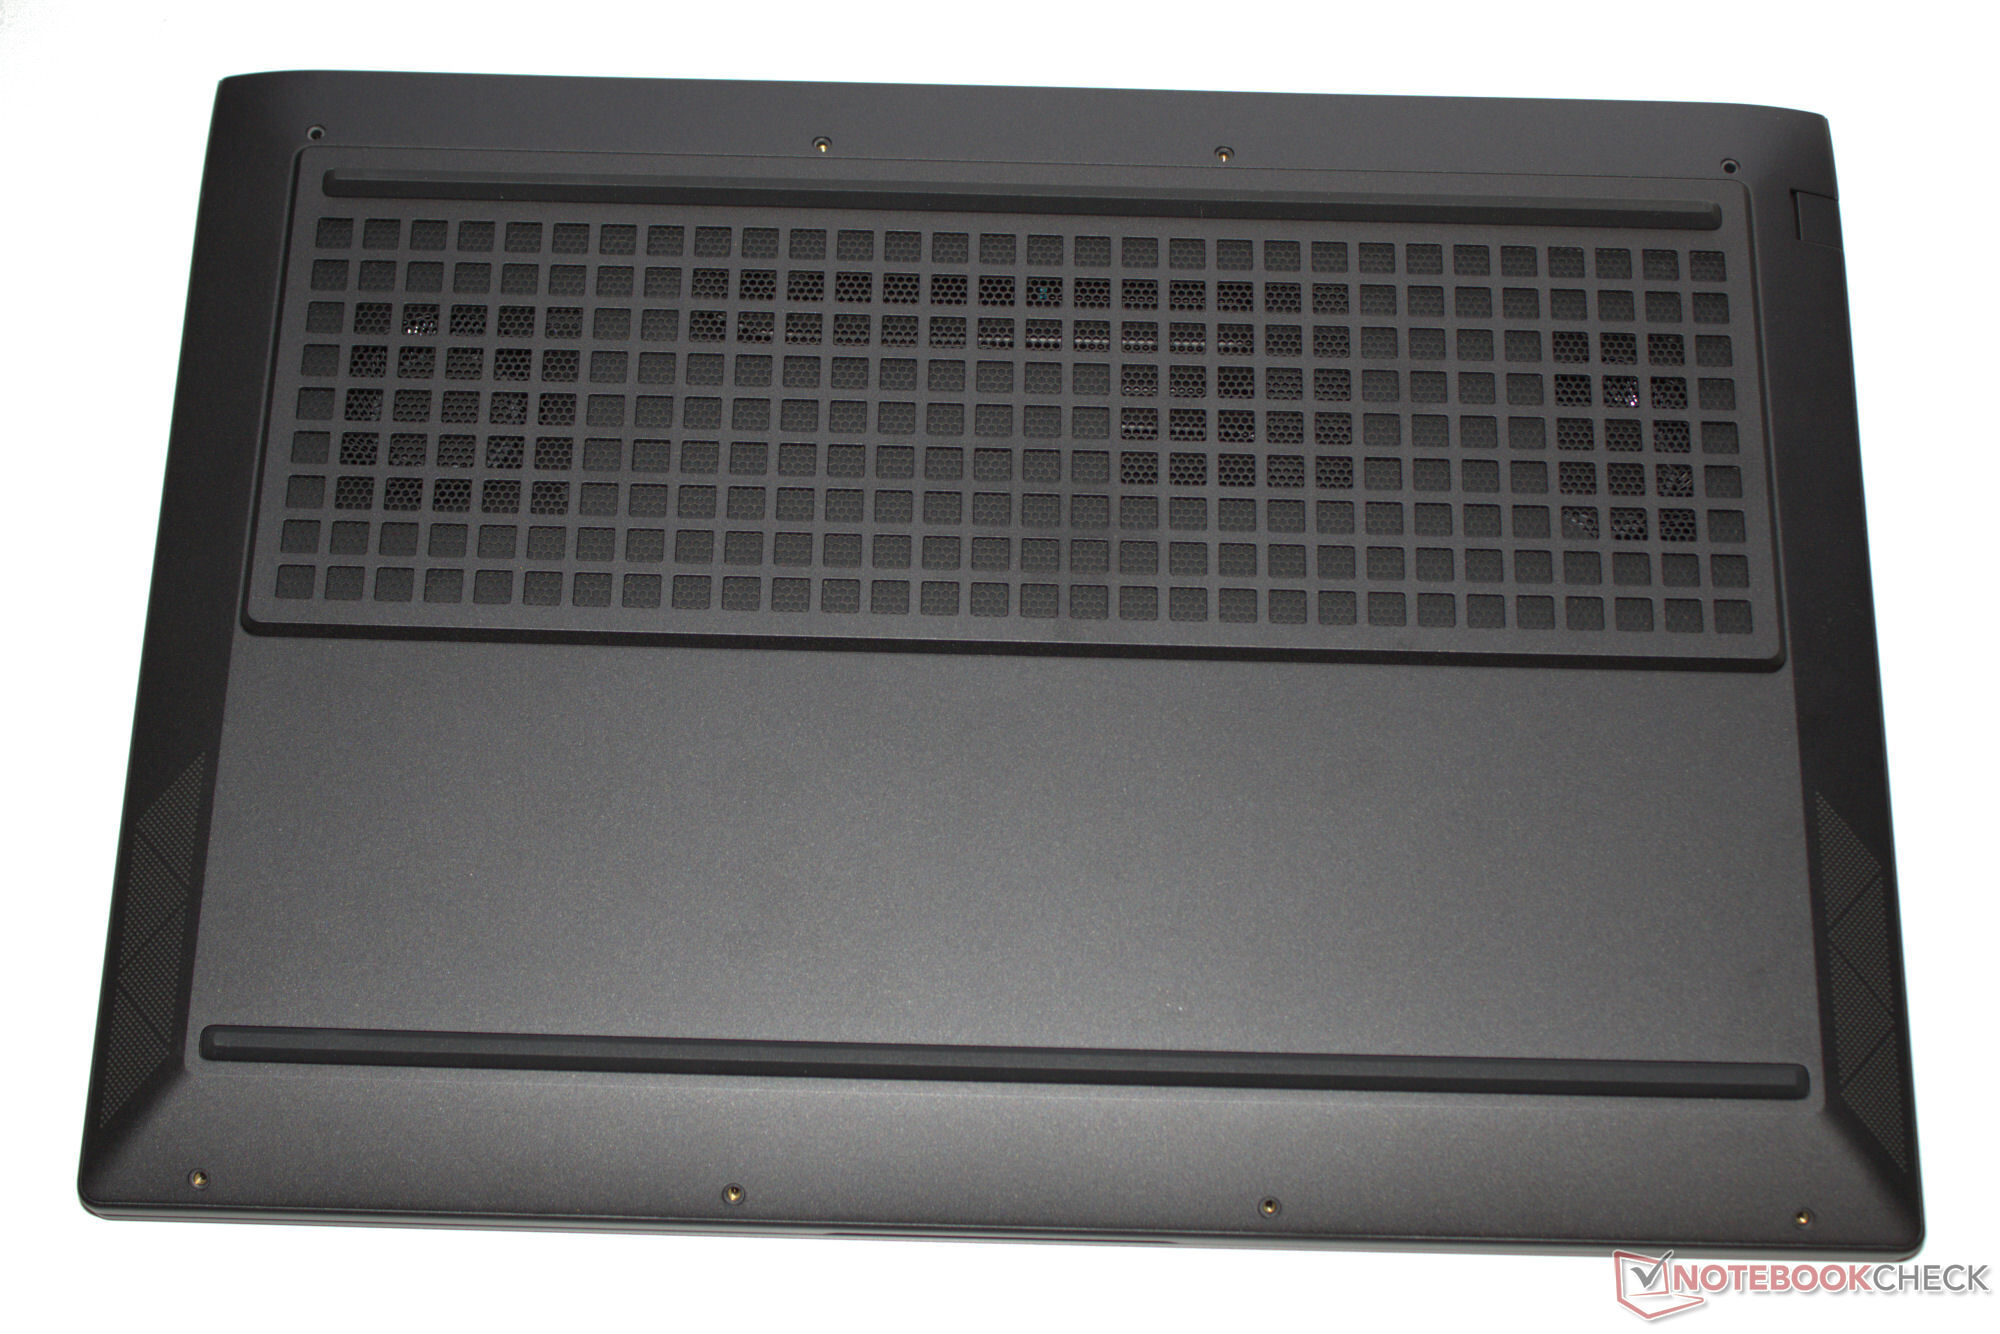
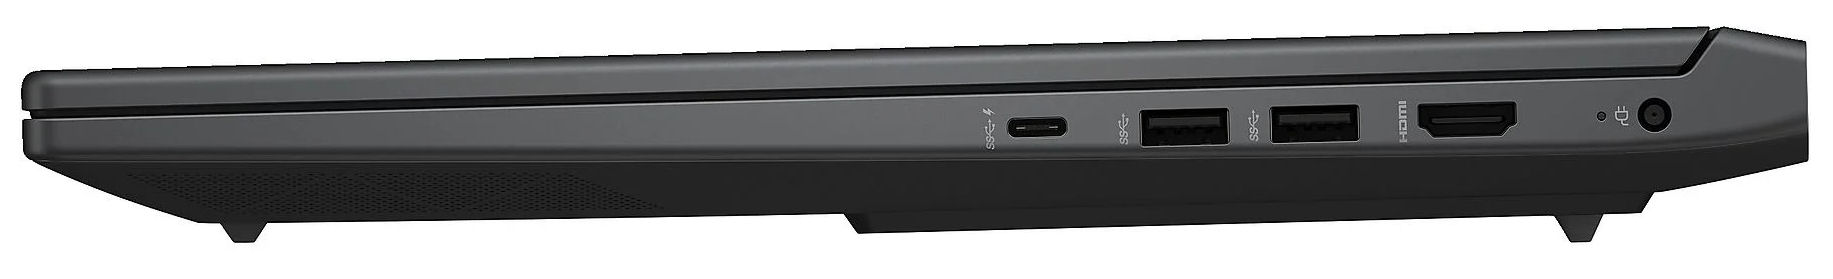
Kasa ve bağlantı - HP Victus Güç Dağıtımı özelliğine sahiptir
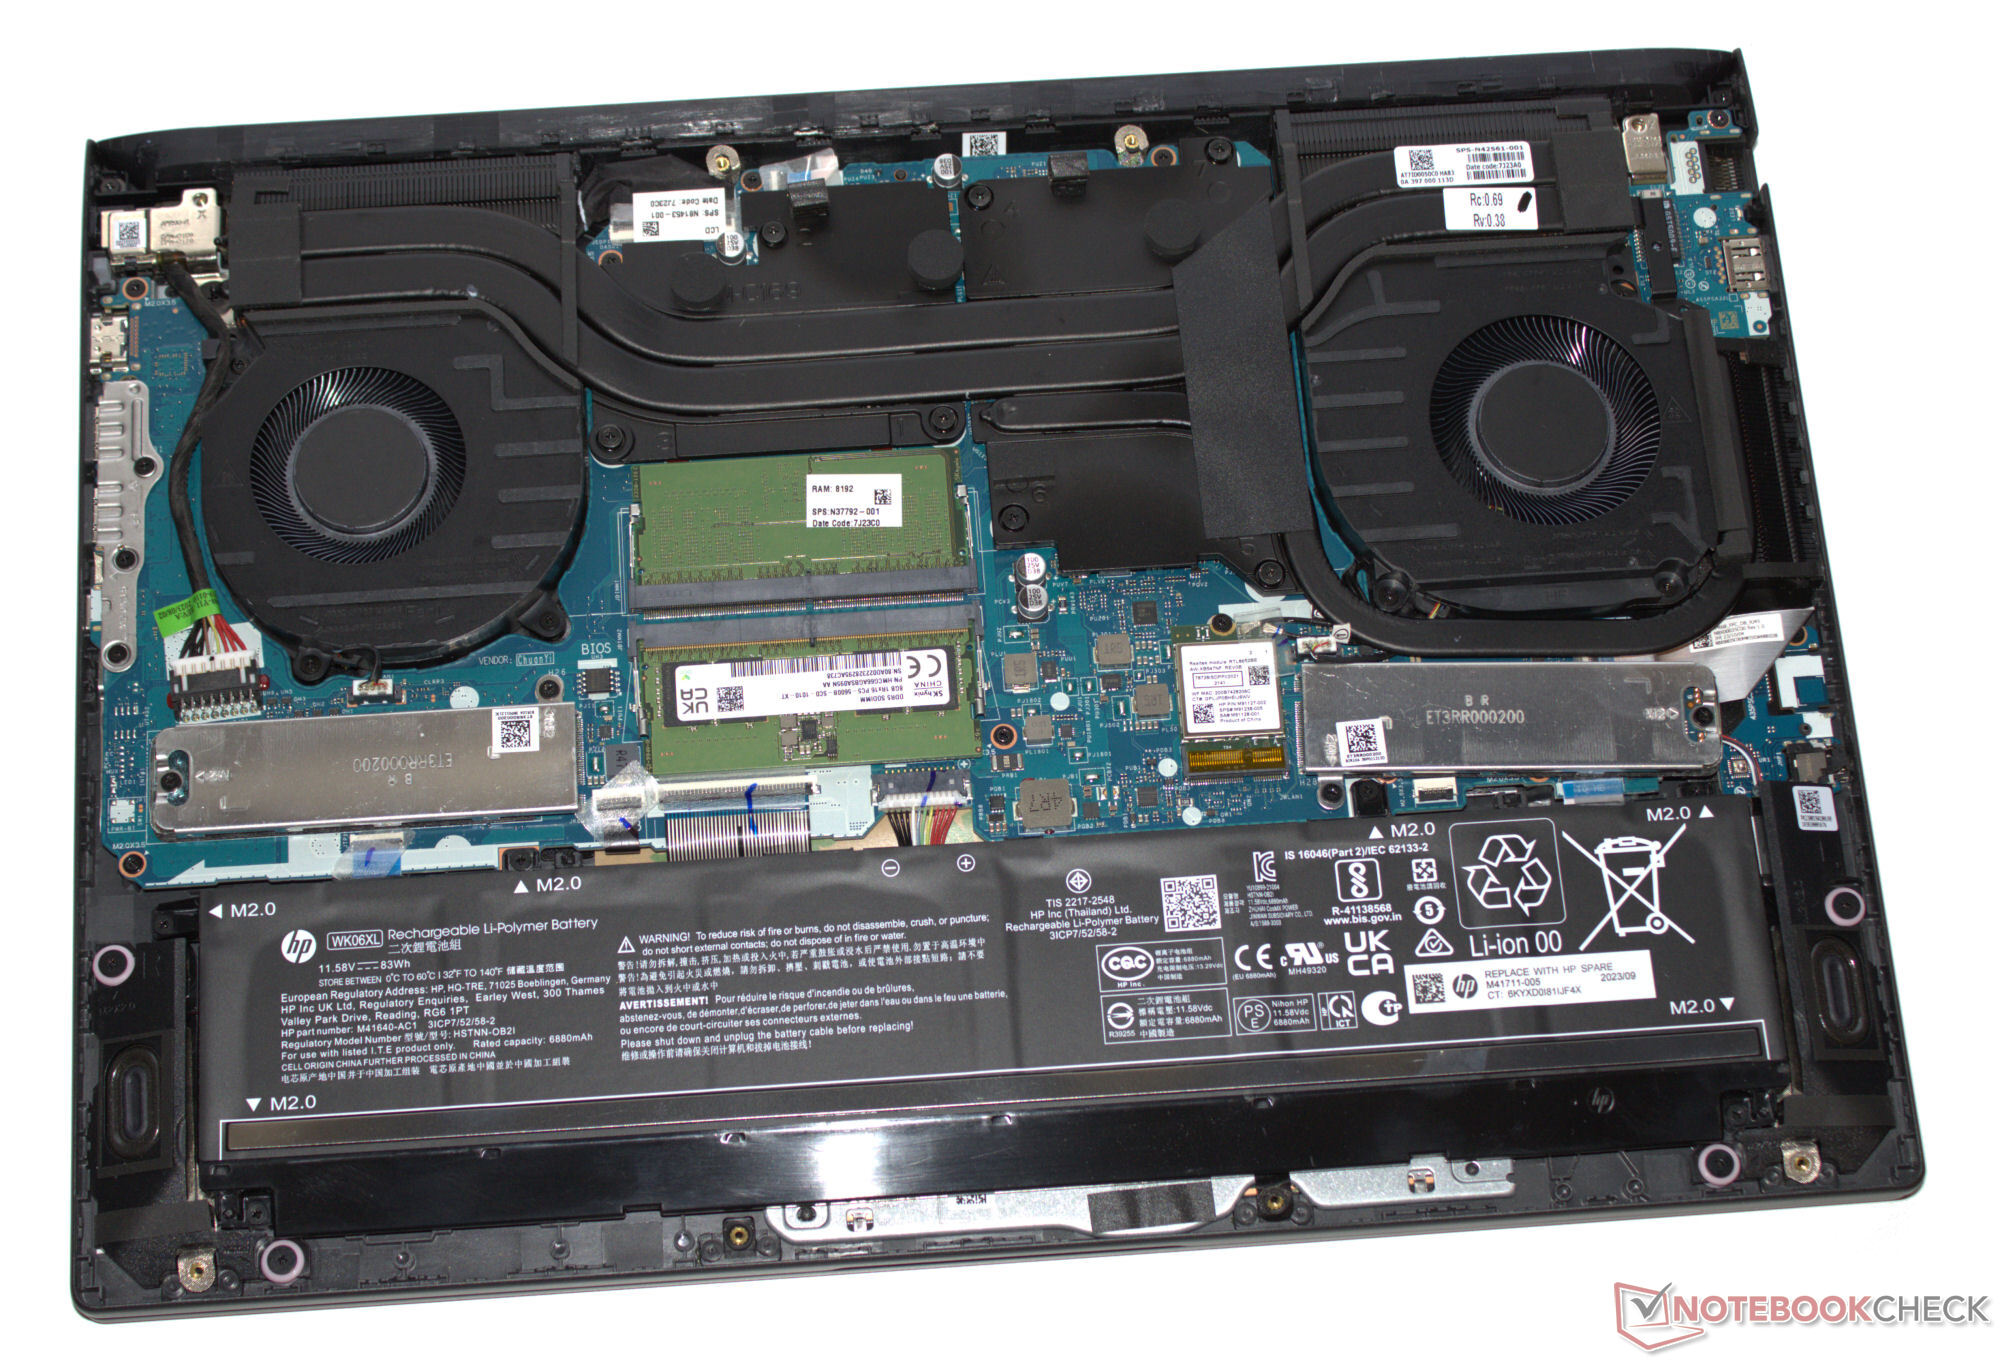
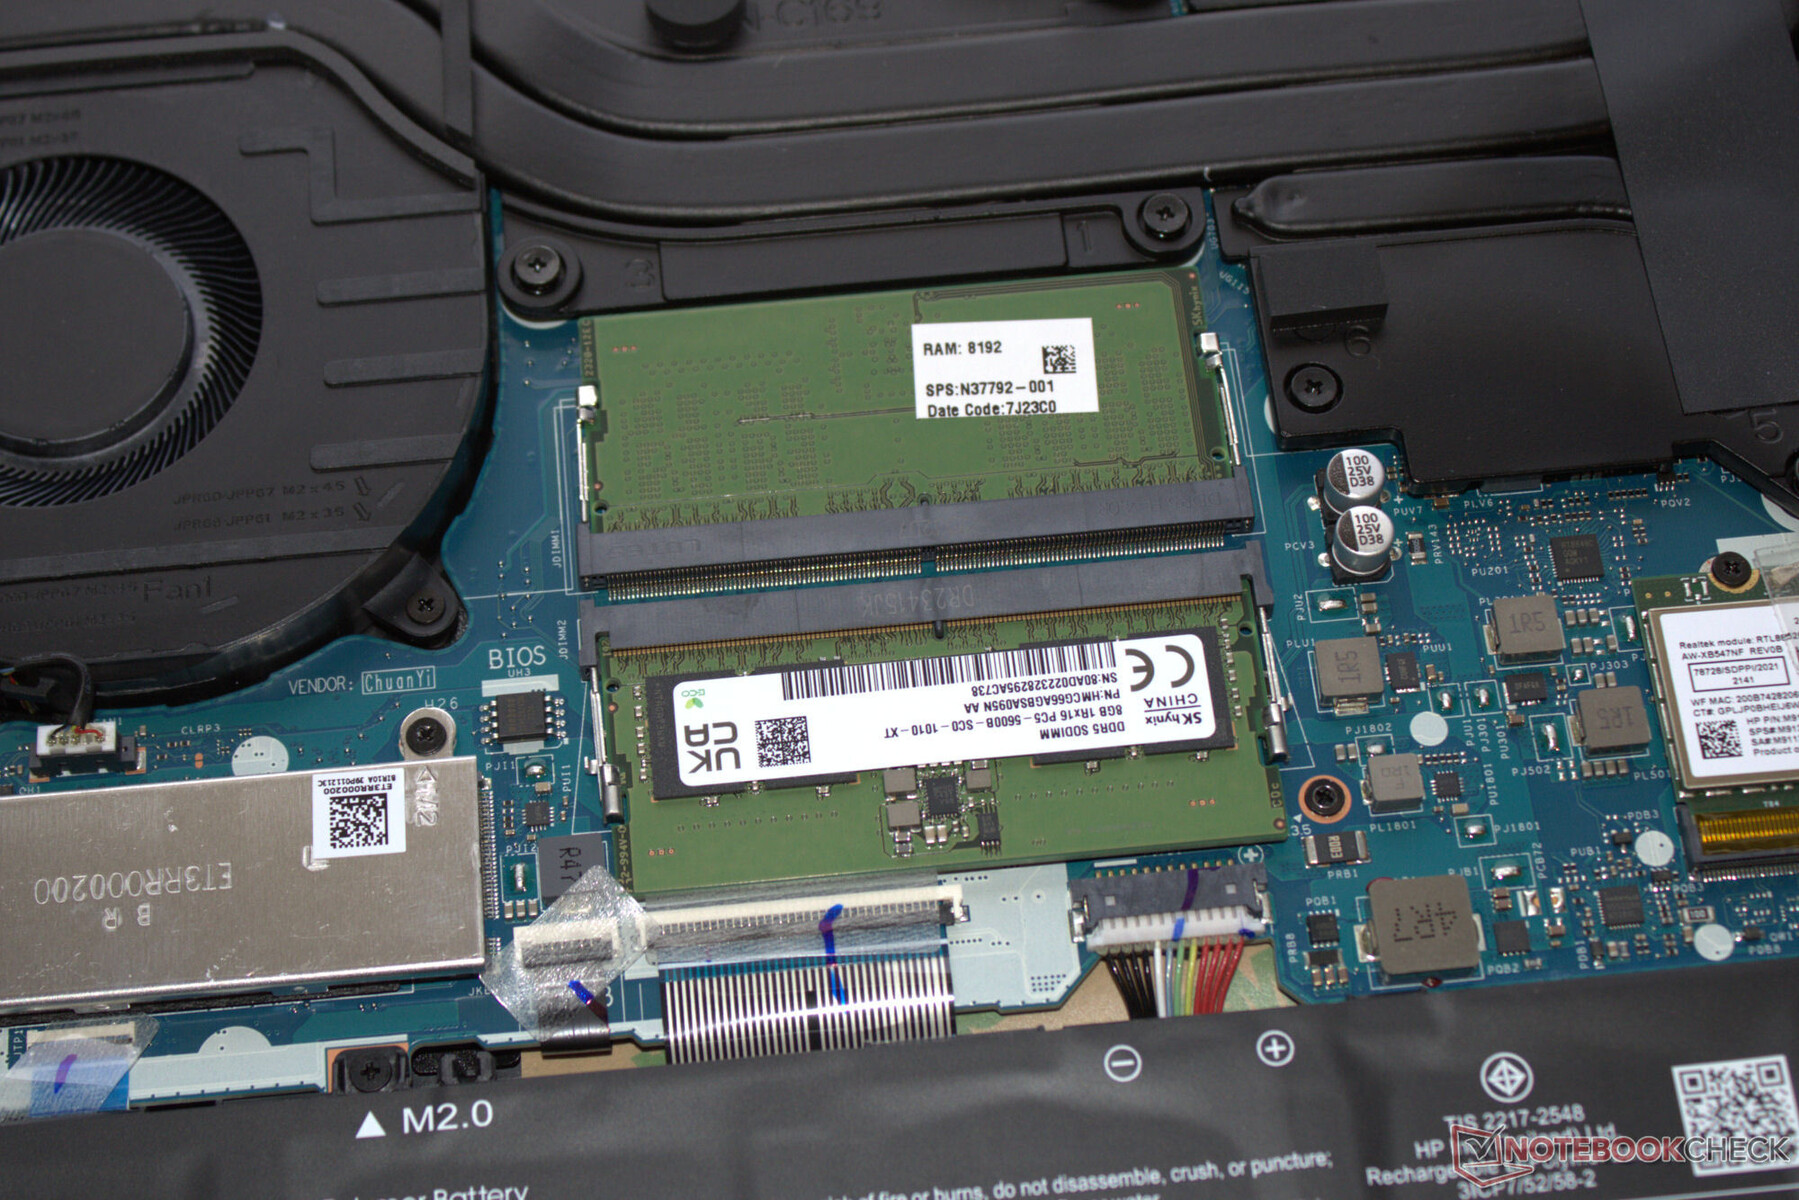
Yüksek kaliteli malzemeler bekleyemezsiniz: Dizüstü bilgisayarın tüm kasası, koyu gri antrasit siyahı olan "Mica Silver" renginde mat plastikten yapılmıştır. Kapak ve taban ünitesi bükülebilir. Sade kasasında hiçbir LED öğe kullanılmamış ve en göz alıcı aksesuar cihazın kapağının arkasındaki Victus logosu. Bataryaya (vidalanmış, yapıştırılmamış) ve diğer donanımlarına alt kasa parçasını çıkardıktan sonra erişilebilir.
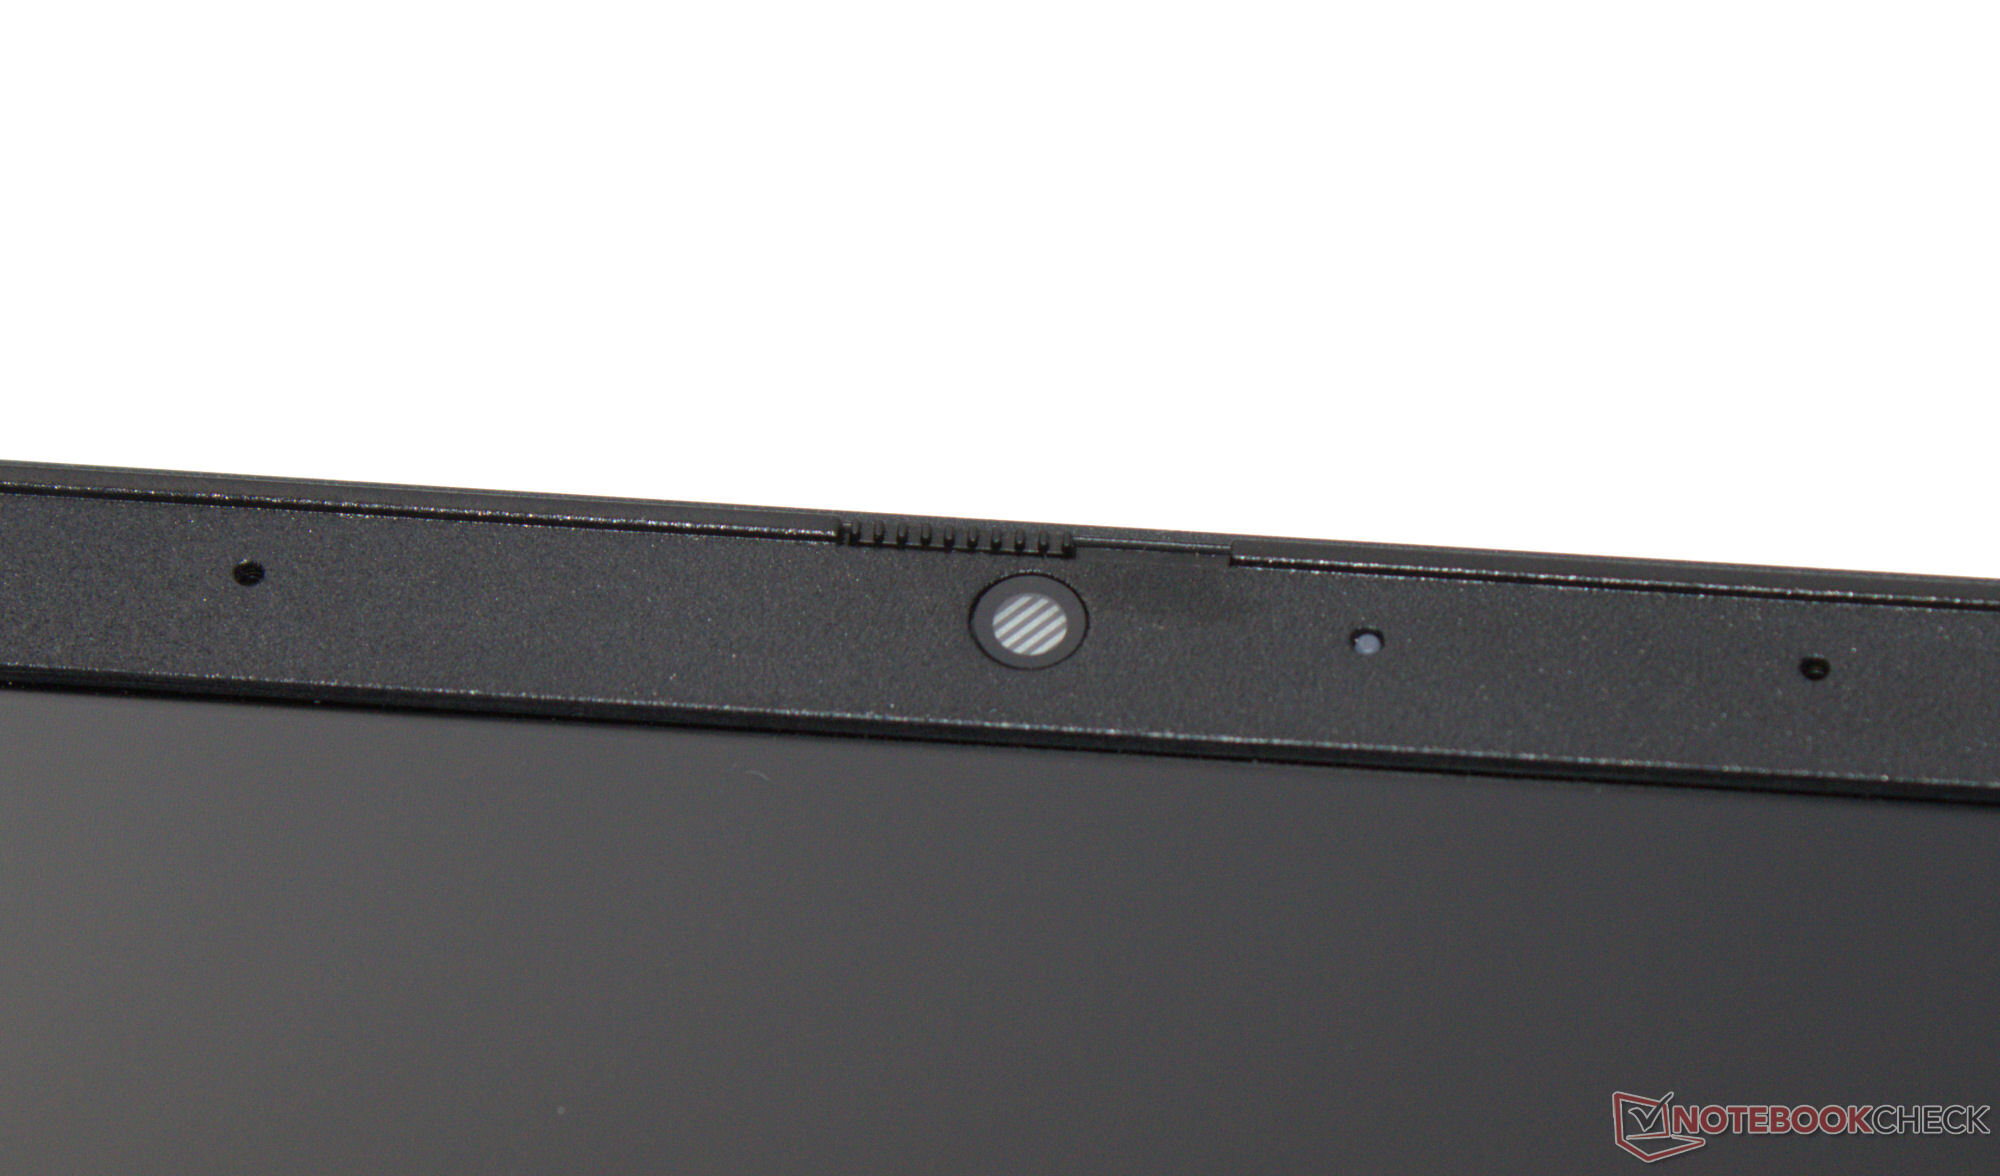
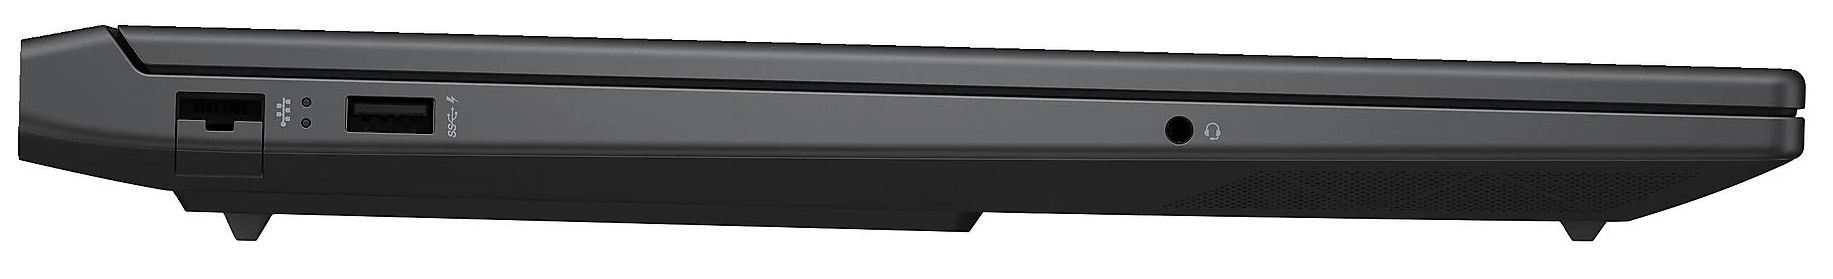
Thunderbolt ve USB 4'ü boşuna arayacaksınız: Dört USB bağlantı noktasının tümü (3x USB-A, 1x USB-C) USB 3.2 Gen 1 standardını takip eder. USB-C bağlantı noktası Güç Dağıtımı'nı destekler ve bir DisplayPort sinyali çıkışı sağlayabilir. Dizüstü bilgisayar toplamda iki video çıkışına (1x HDMI, 1x DP) sahiptir. Web kamerası (2,1 MP, kapaklı) ortalama sonuçlar veriyor. SD kart okuyucu ile donatılmamıştır.
Victus, rakiplerinin Intel çipleriyle rekabet edemeyen bir Realtek WiFi 6 çipi (RTL8852BE) ile donatılmıştır: Ölçtüğümüz WiFi veri hızları iyiydi, ancak günümüzün olanaklarının gerisinde kalıyor.


 NVIDIA GeForce RTX 4060 Laptop GPU, i7-14700HX, Kioxia XG8 KXG80ZNV512G")
 NVIDIA GeForce RTX 4060 Laptop GPU, i7-14700HX, Kioxia XG8 KXG80ZNV512G")
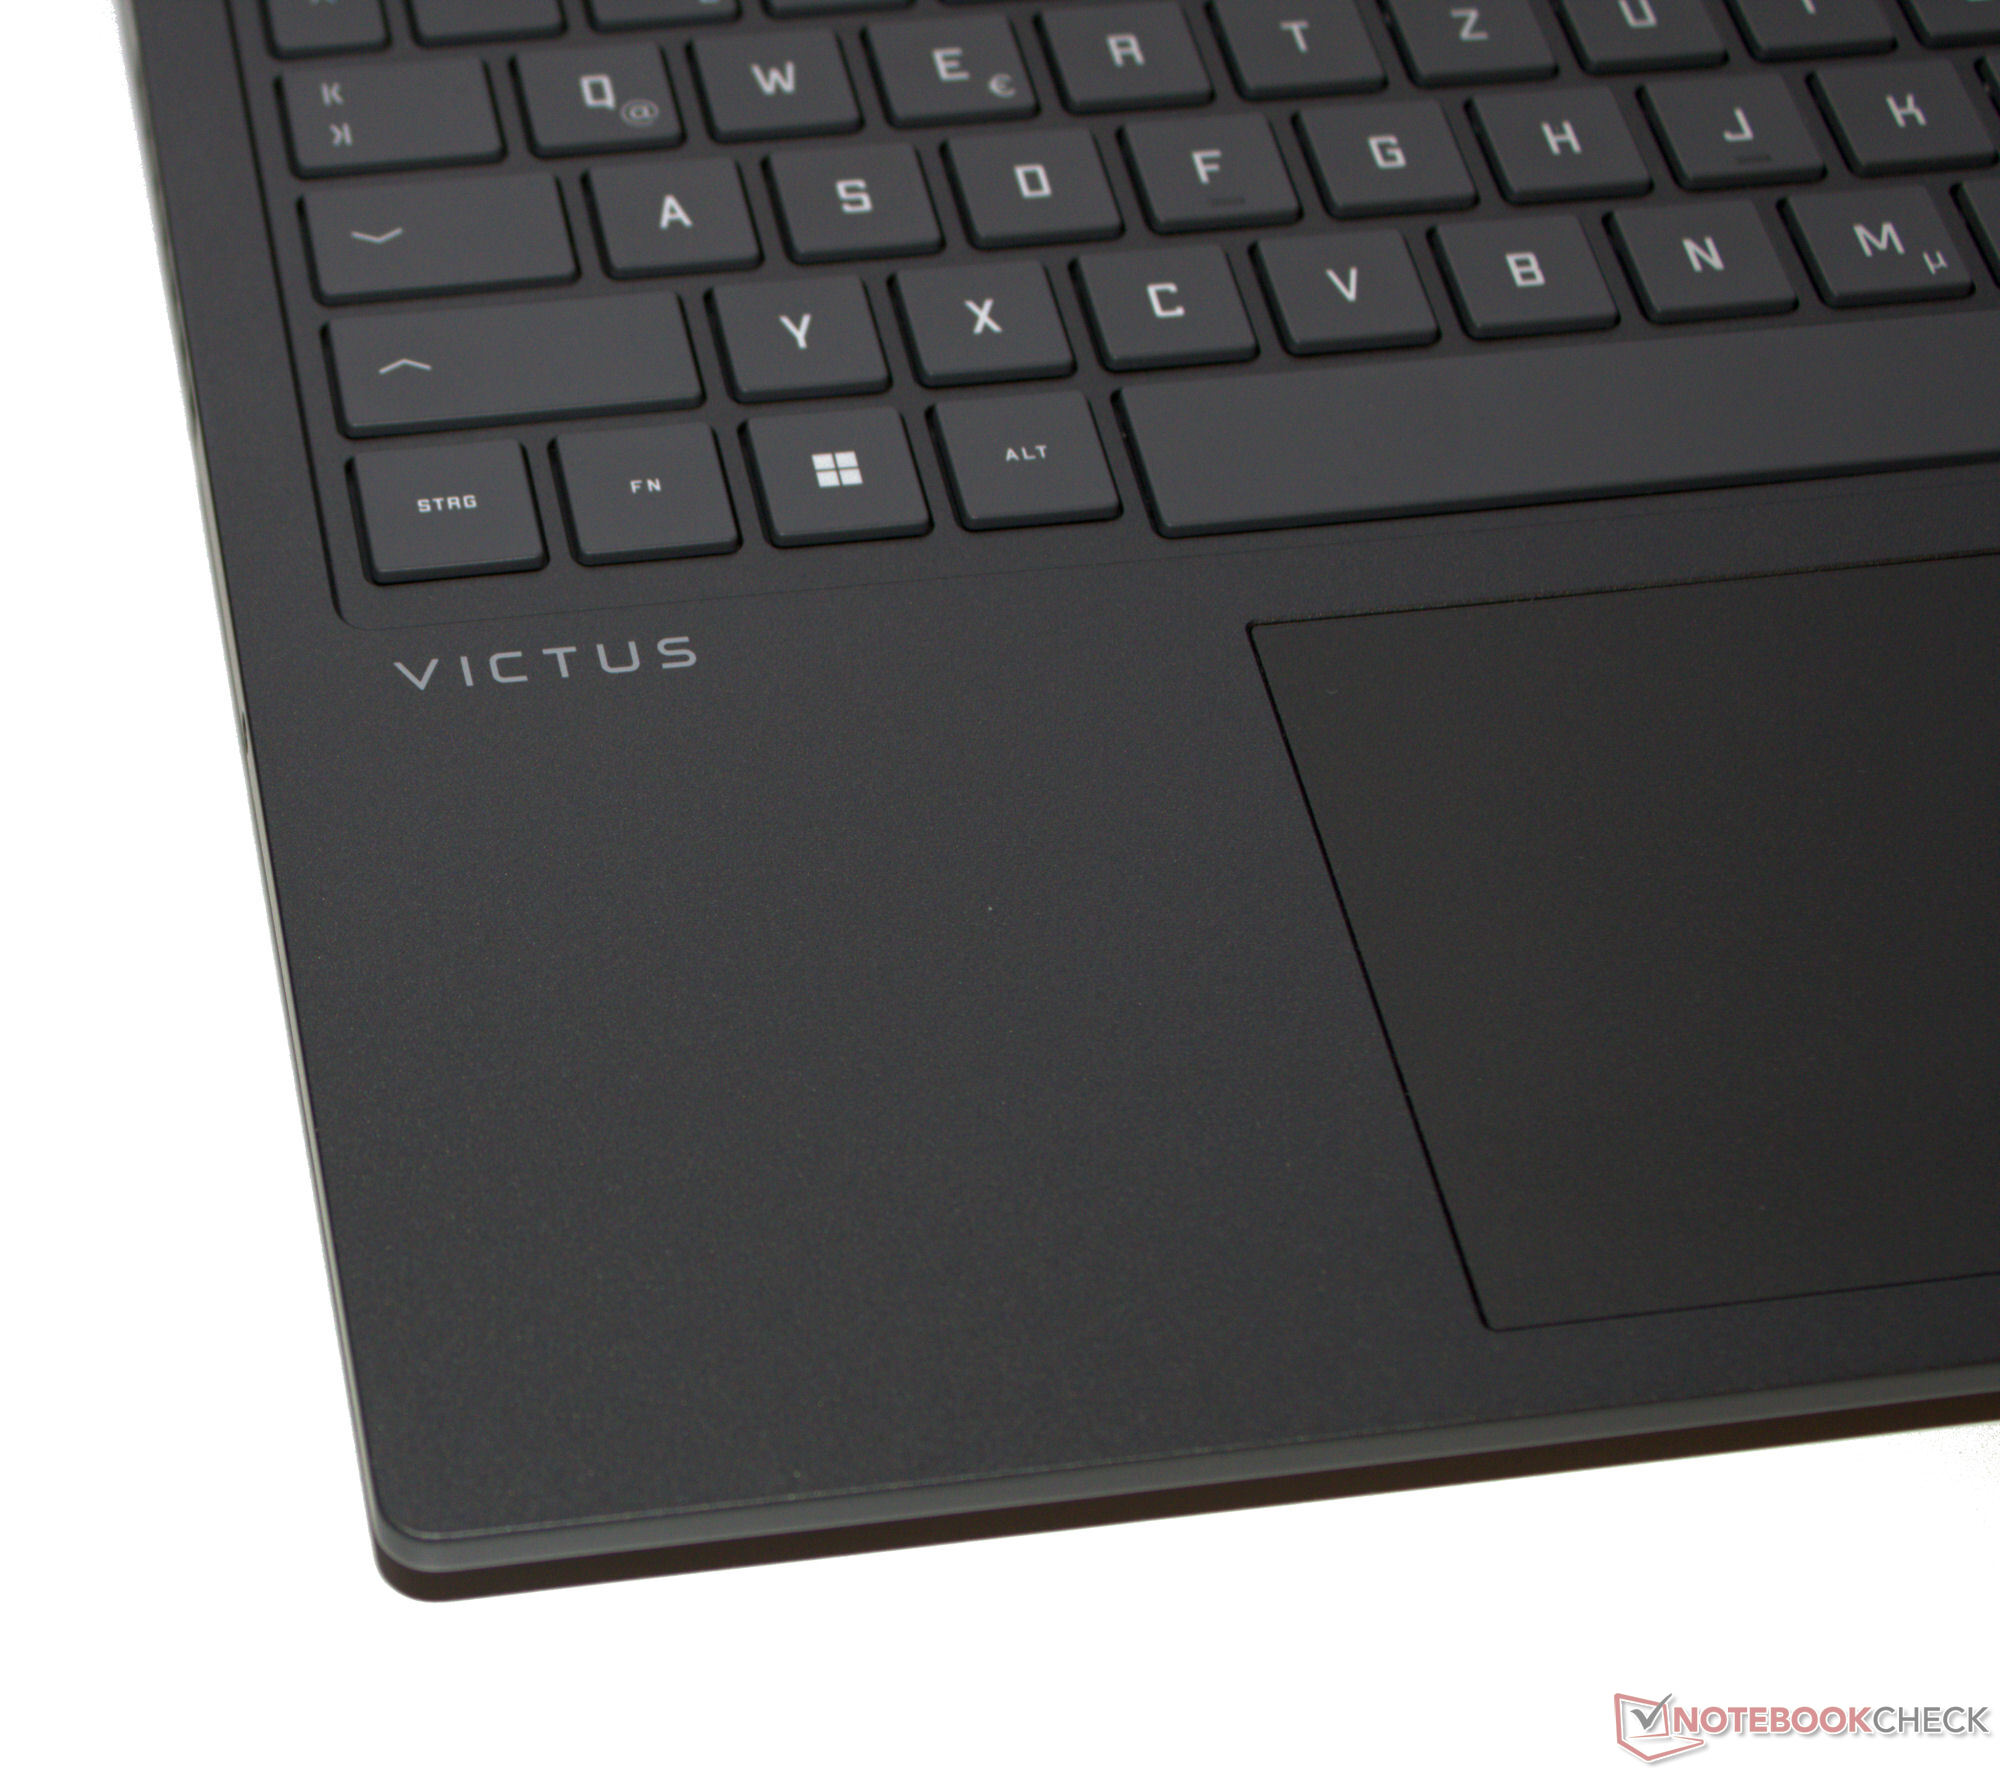
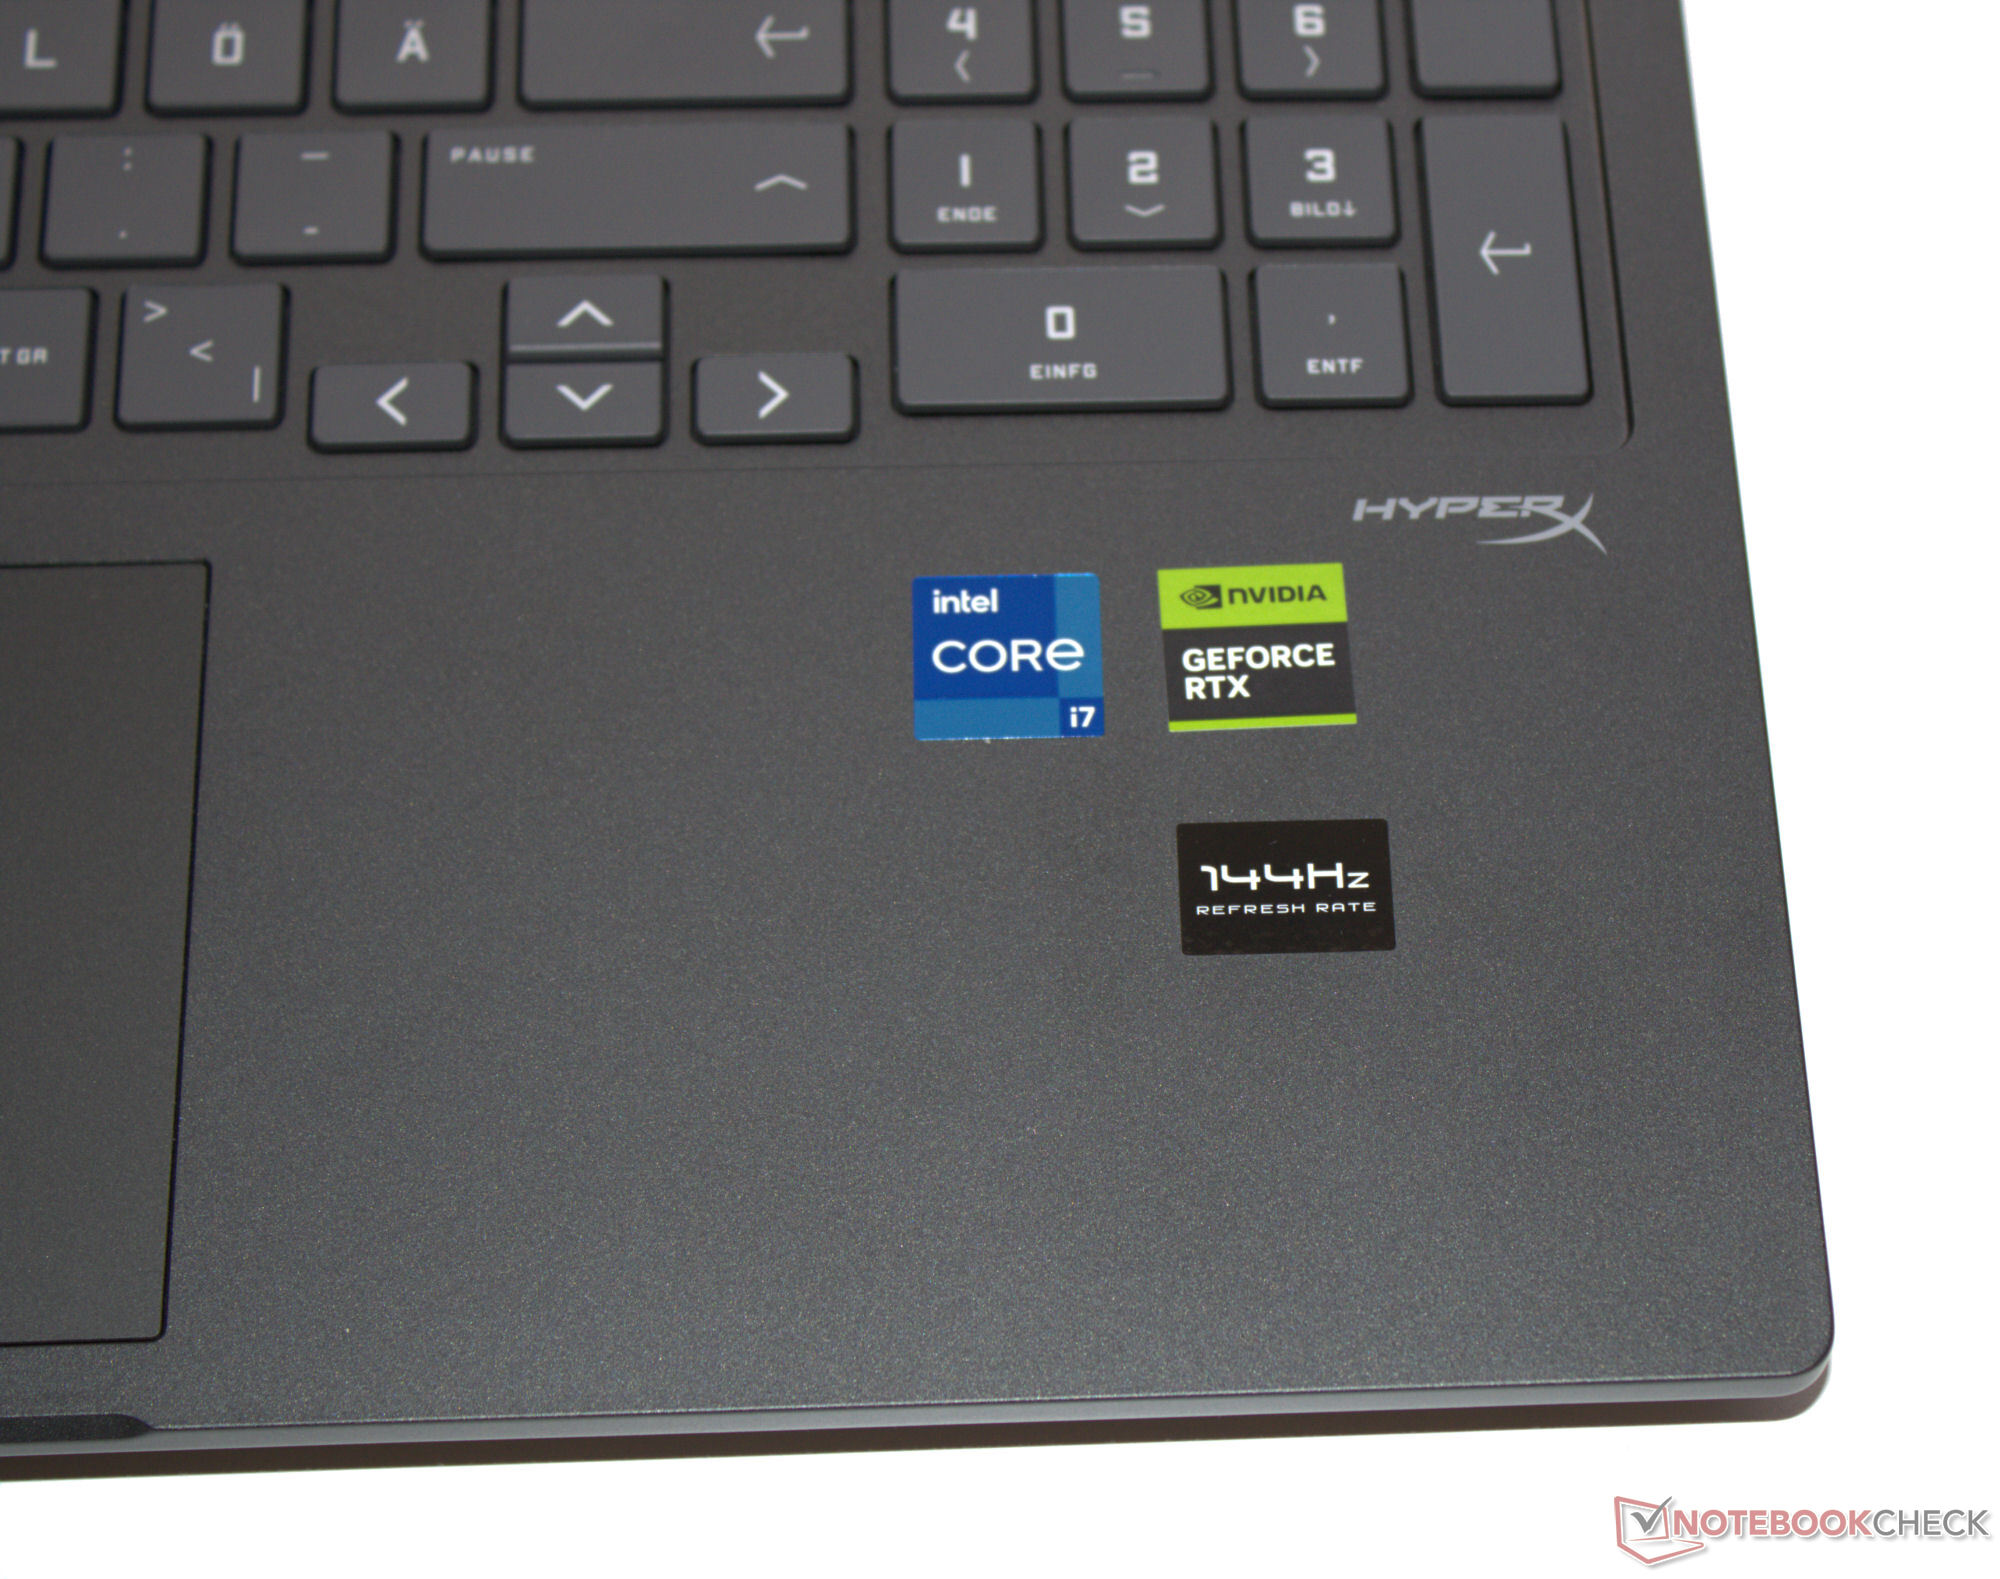
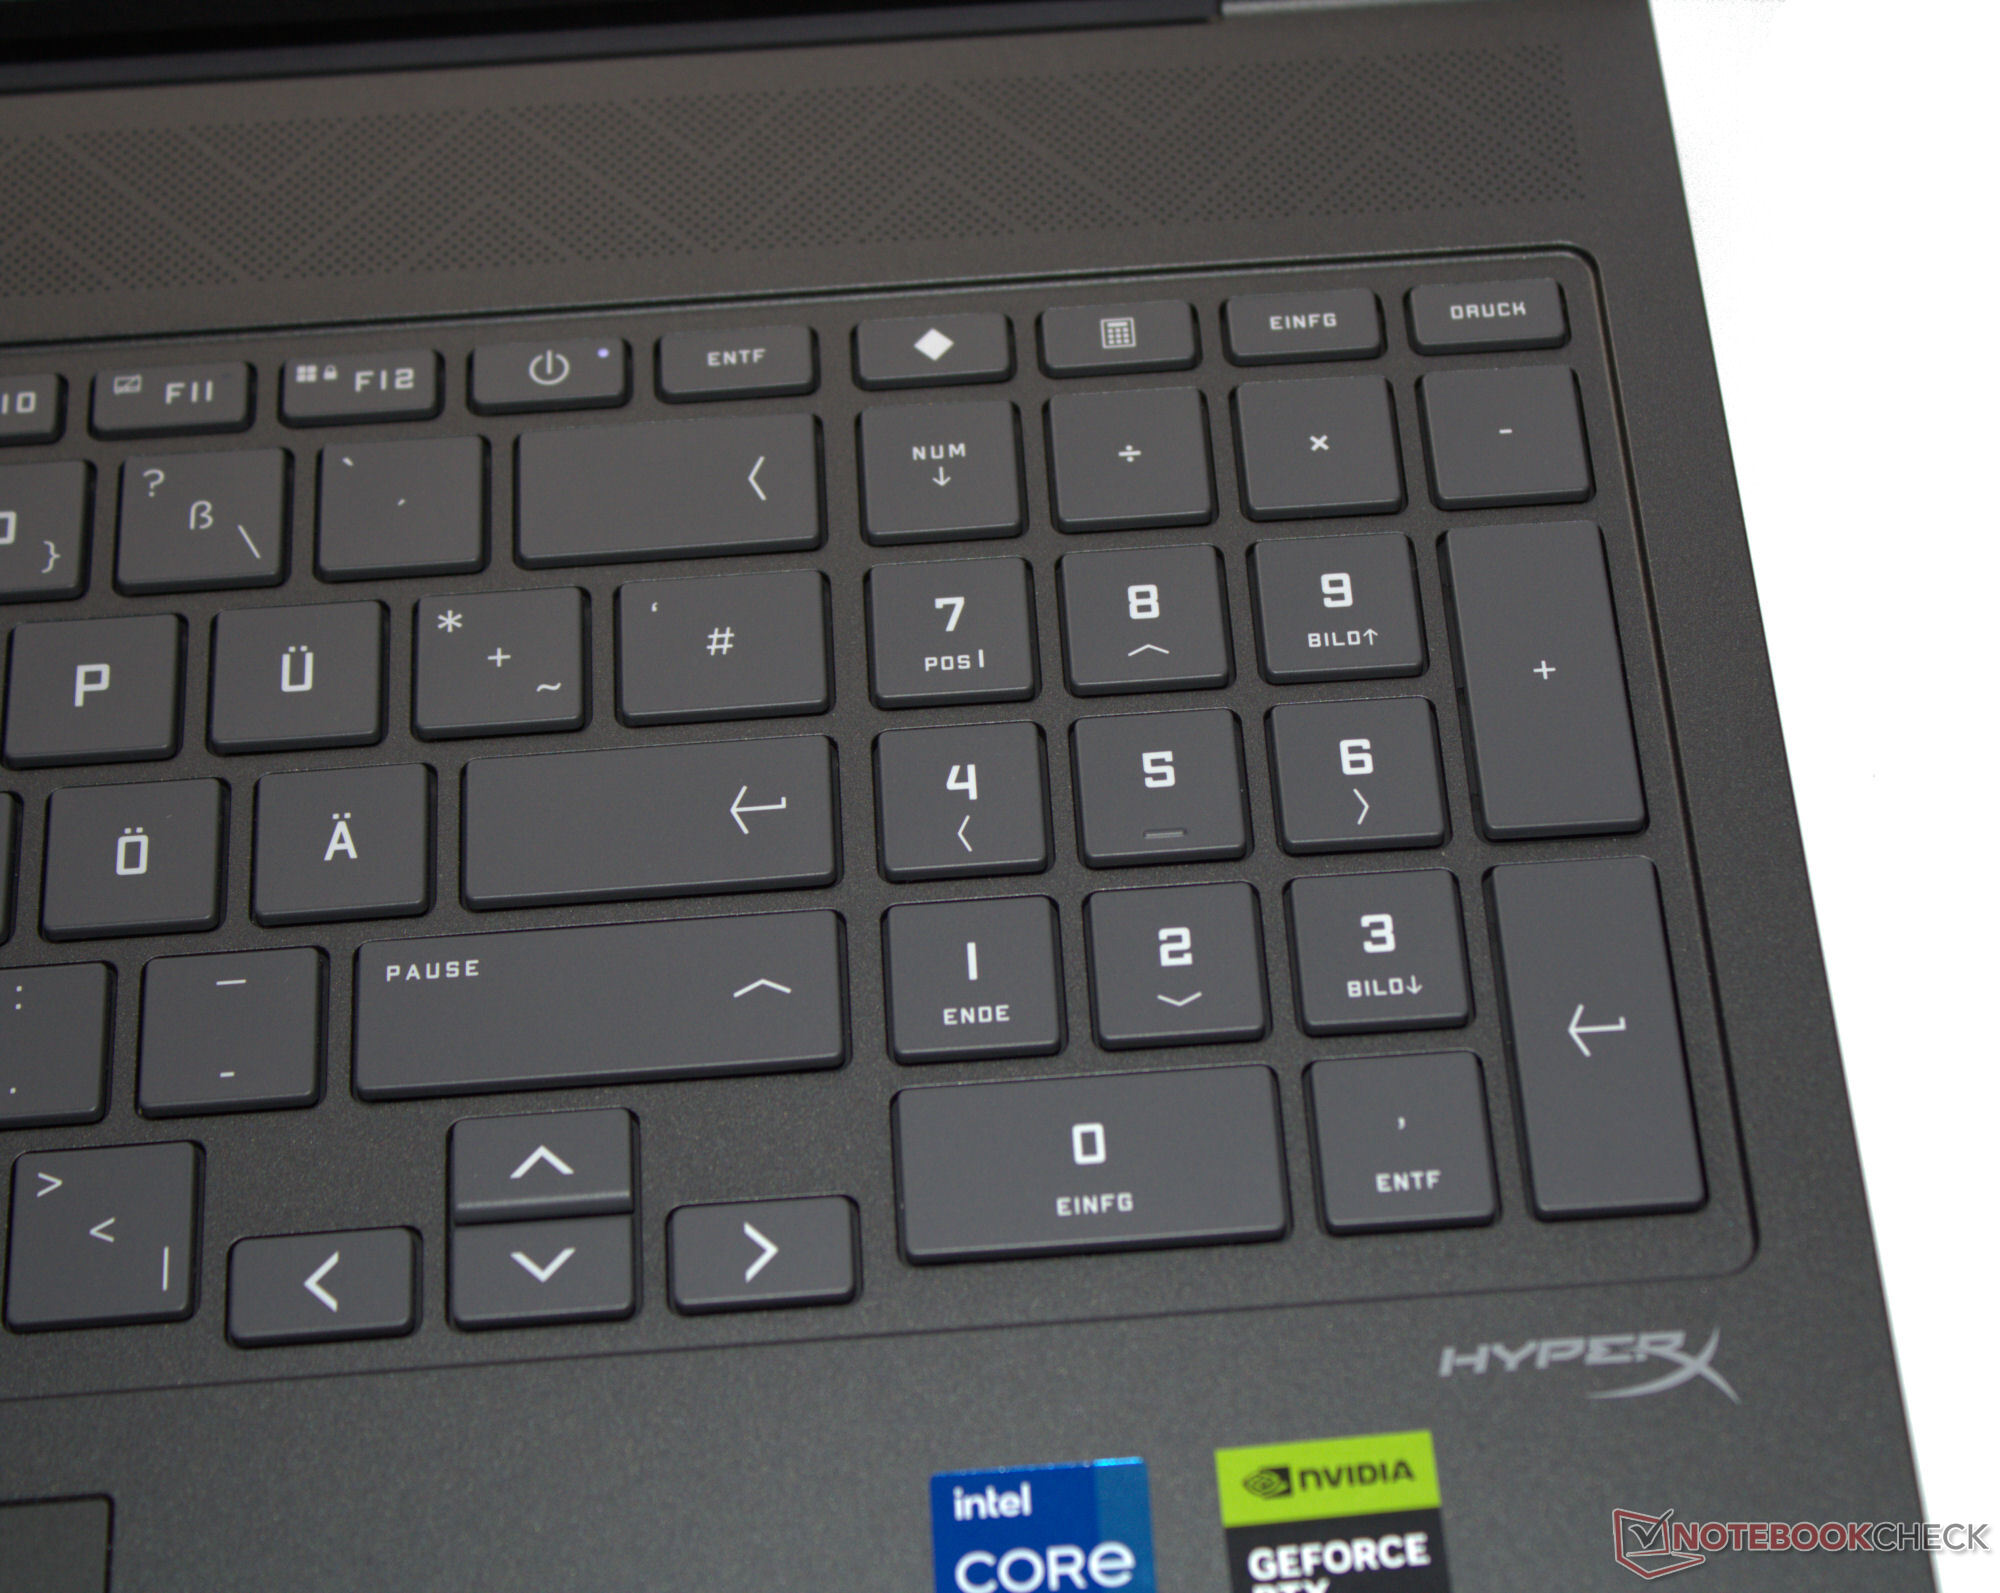
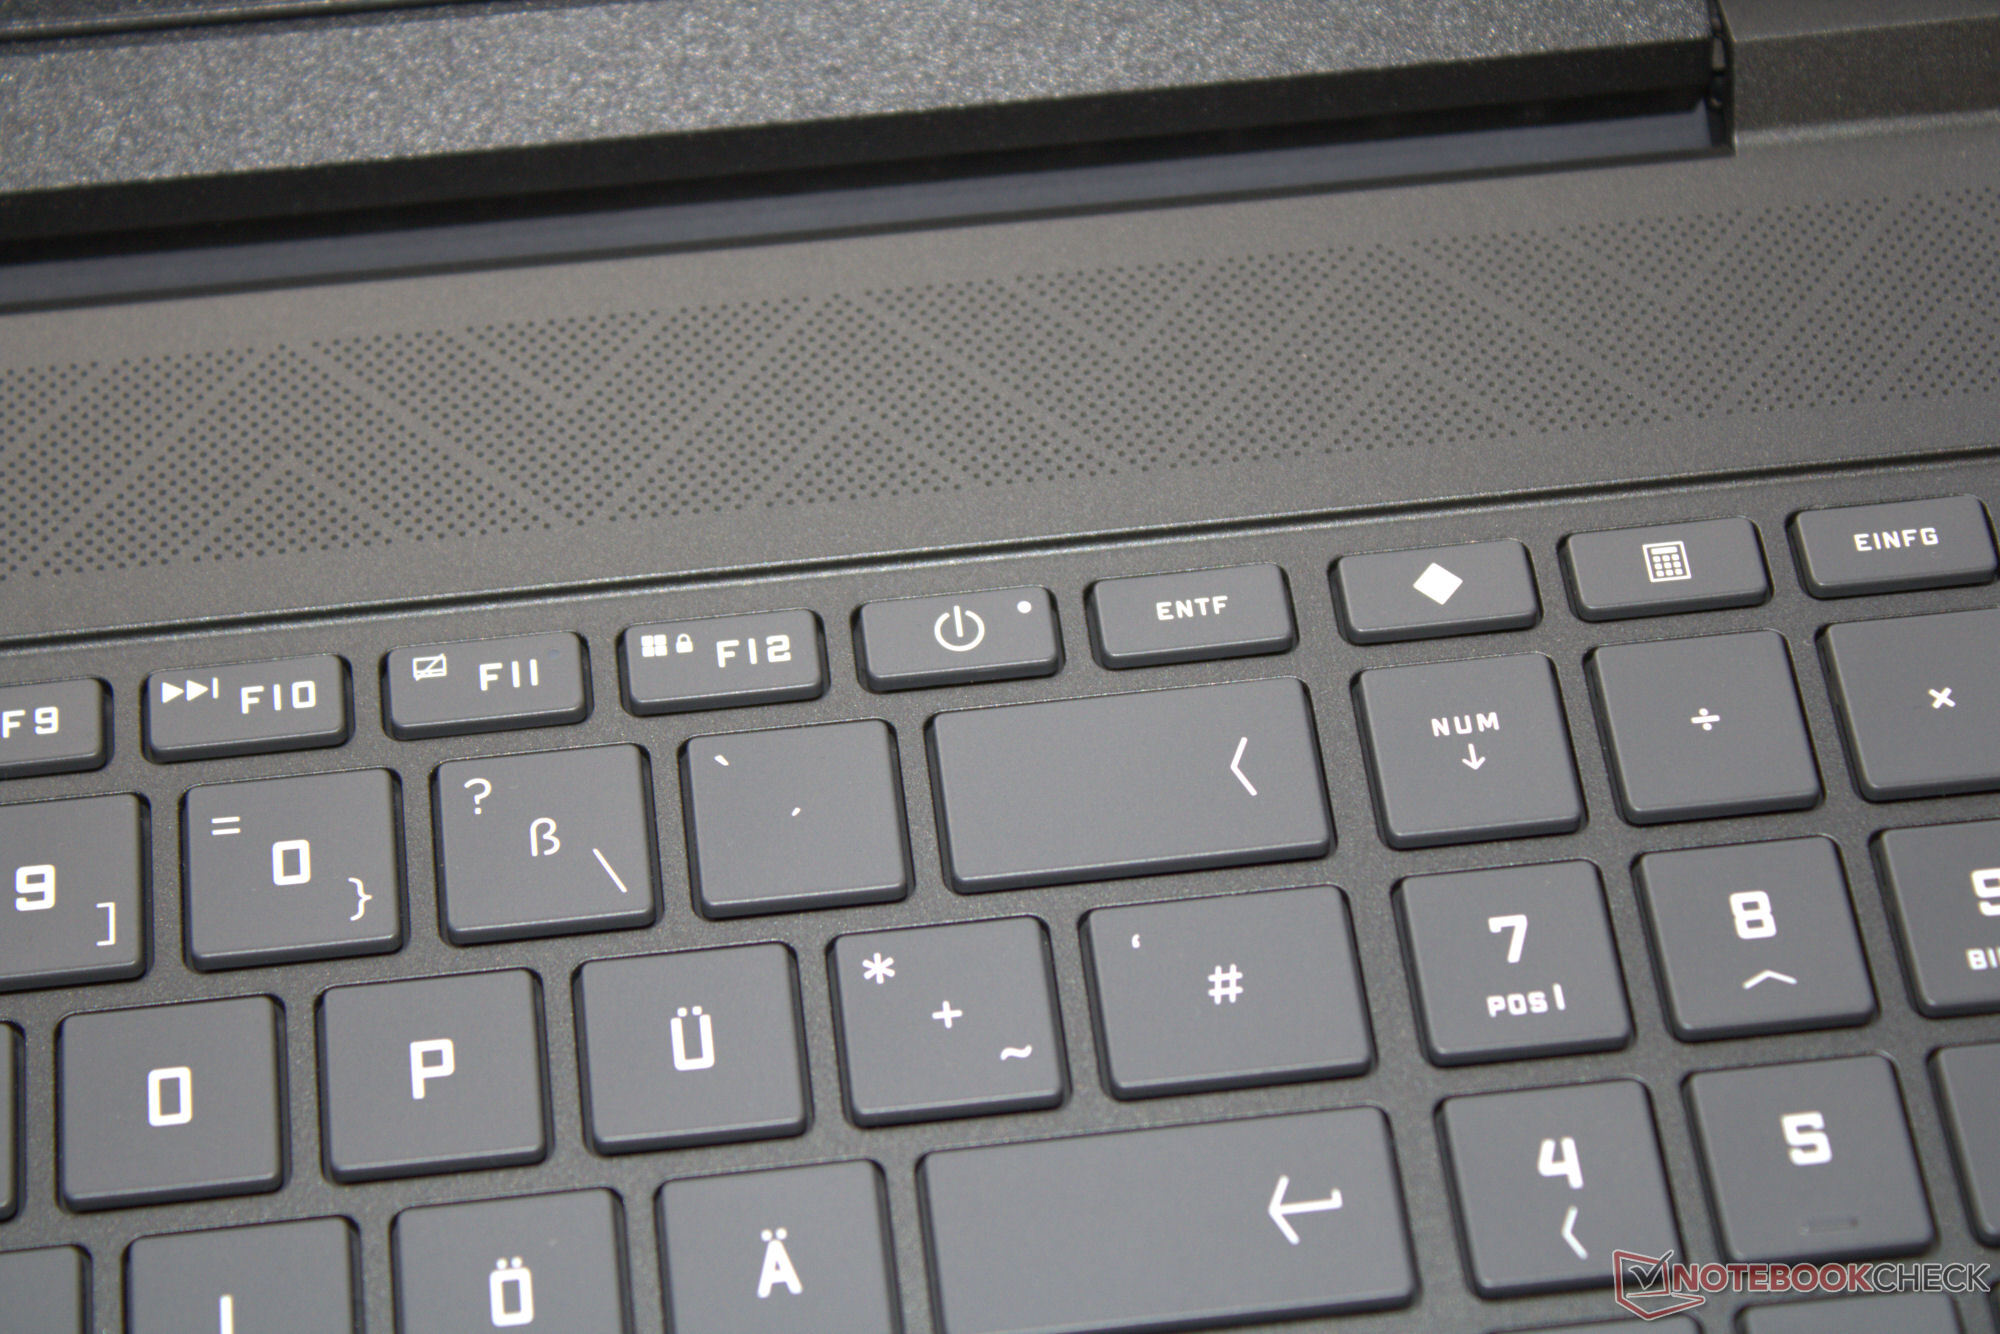
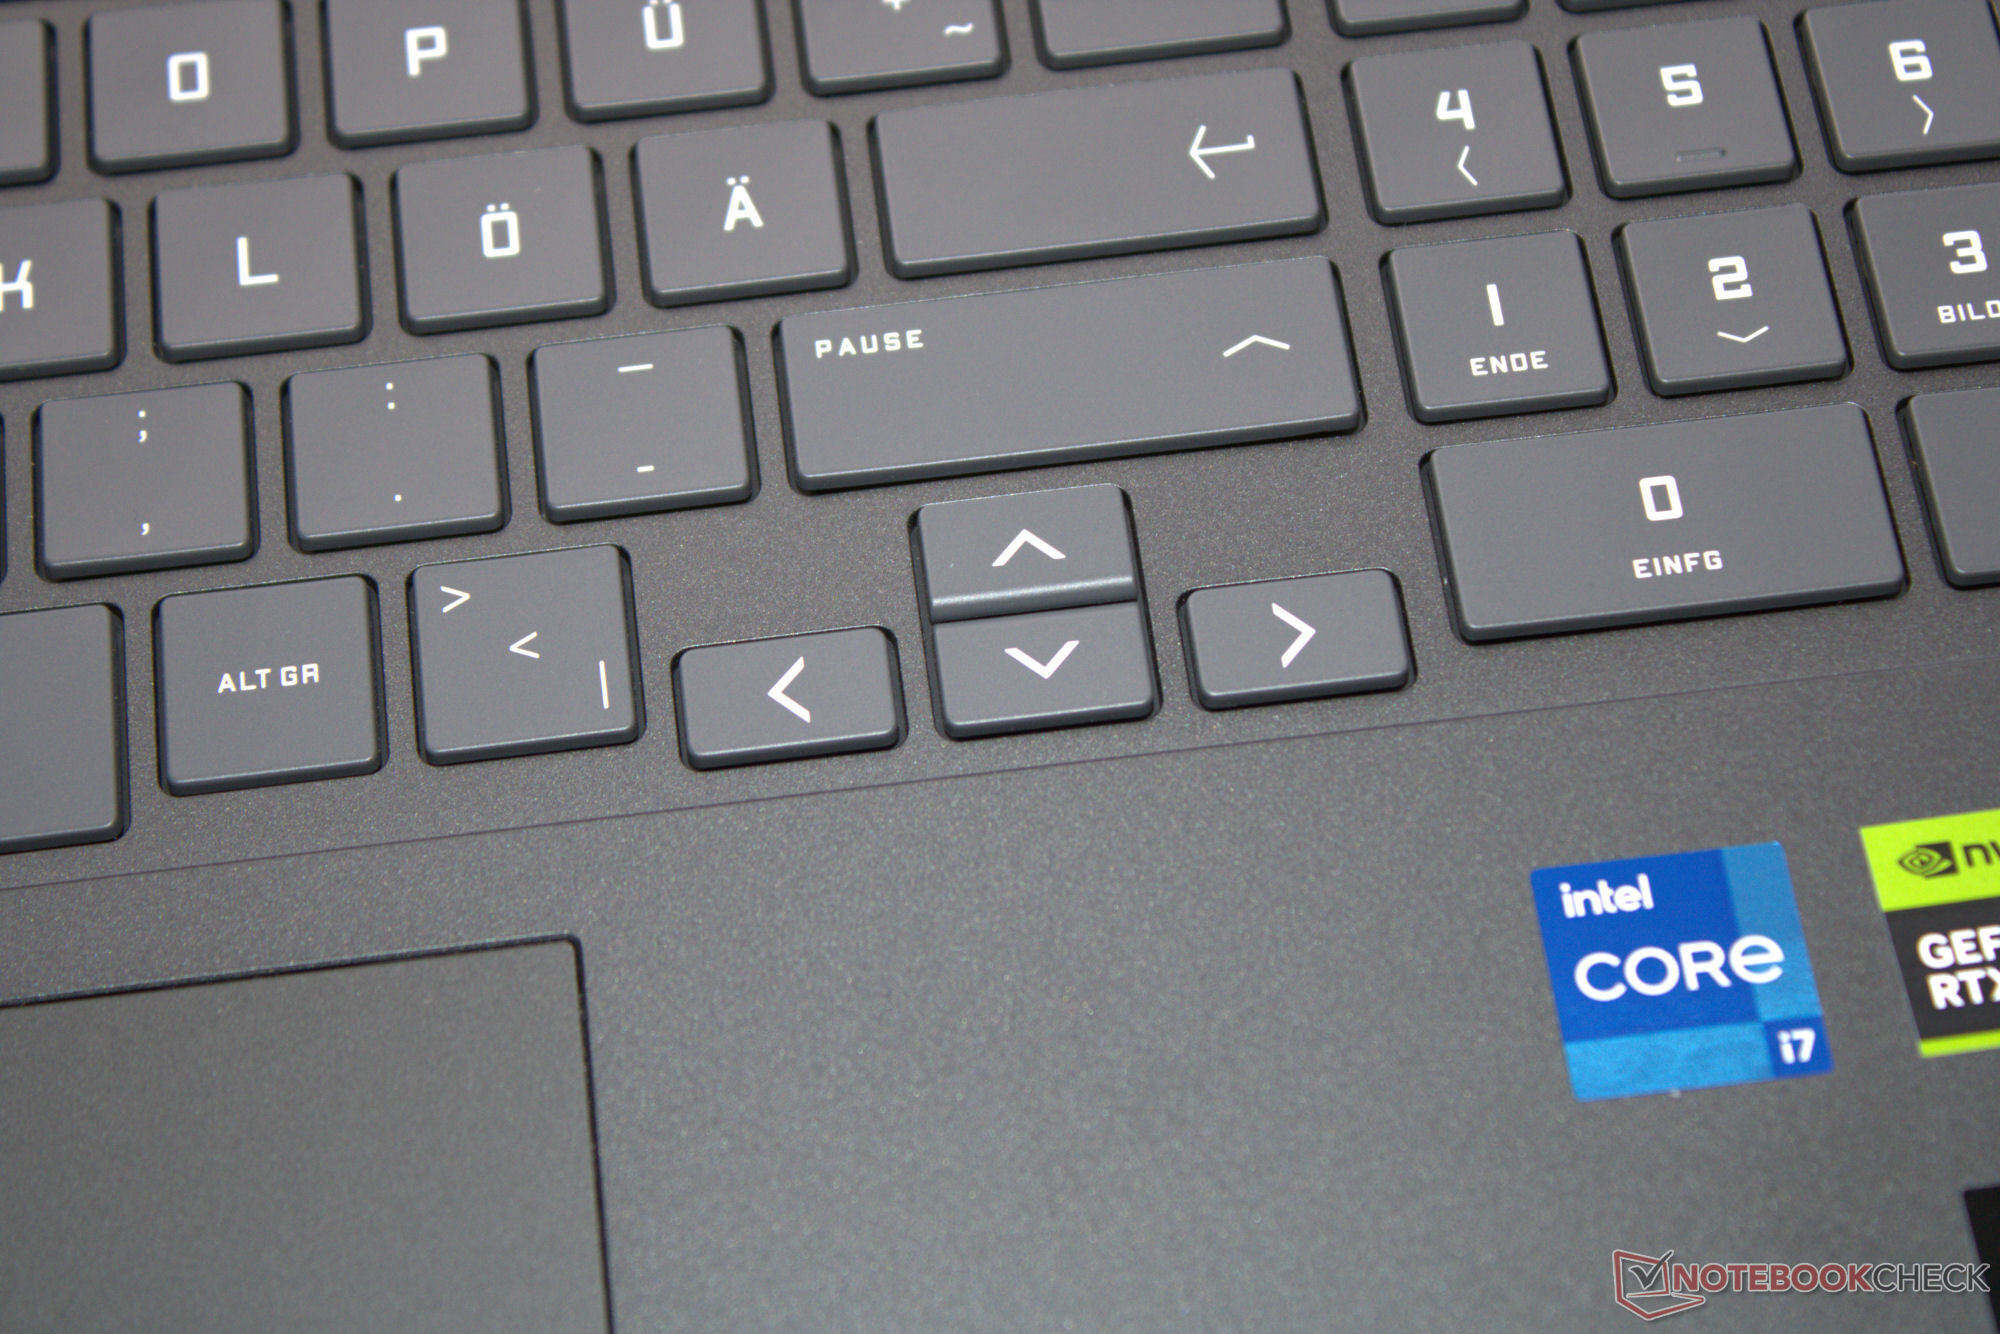
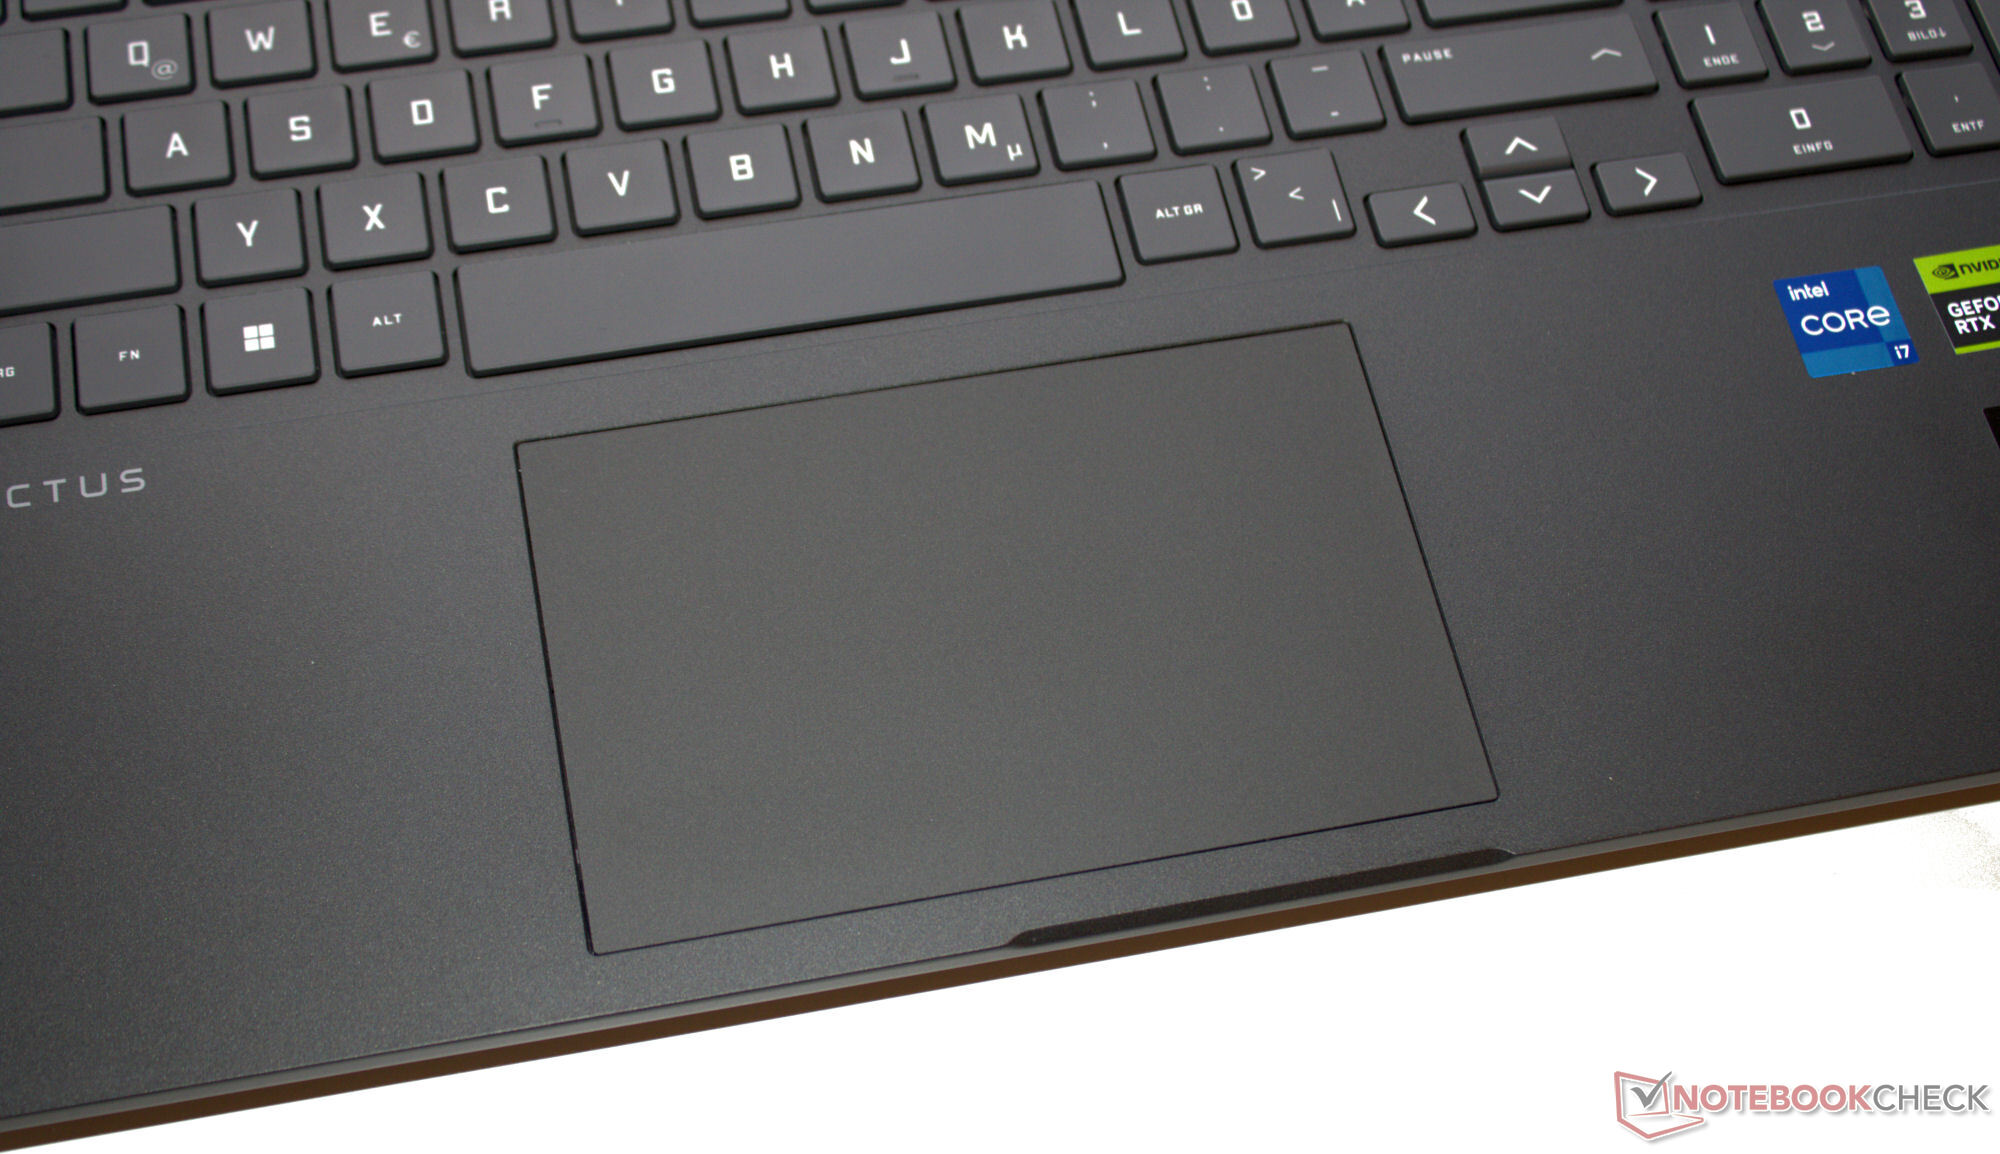
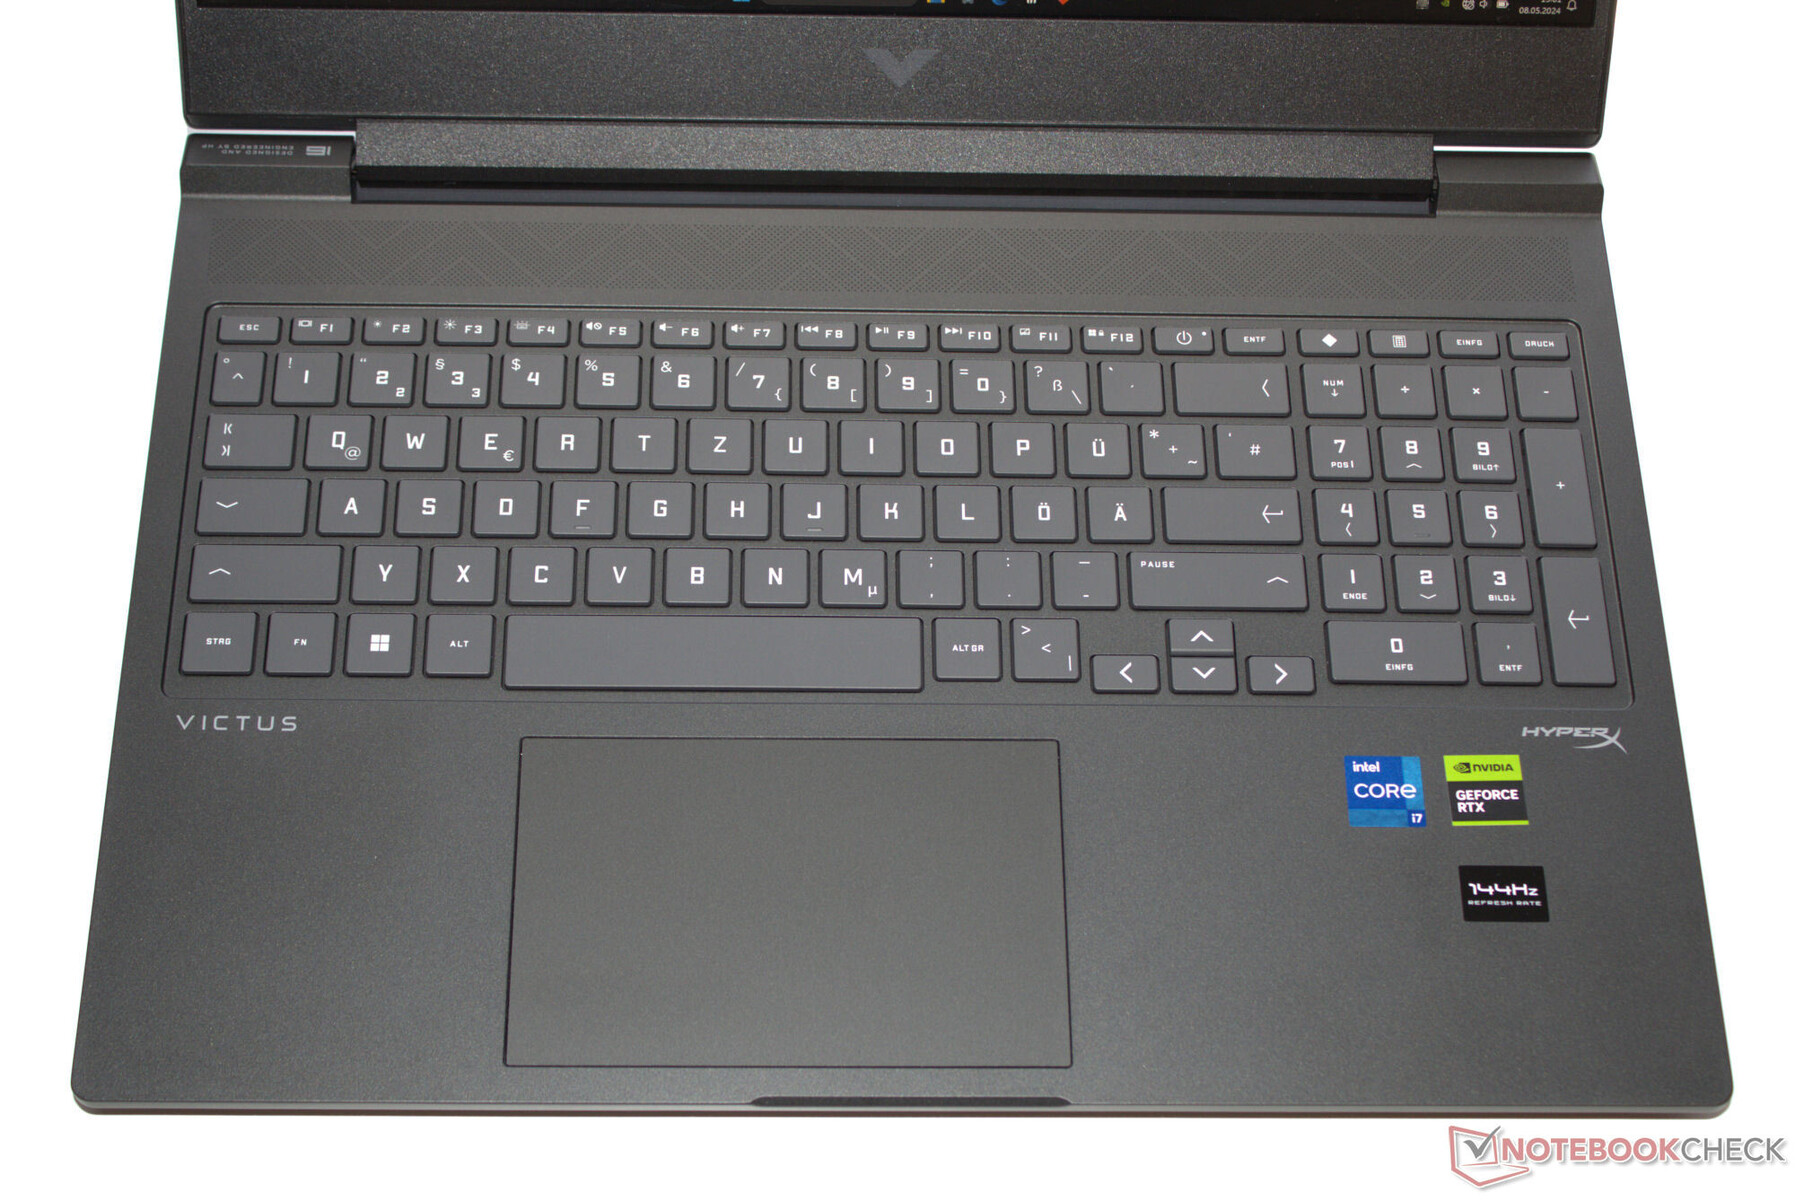
Giriş aygıtları - Küçük ok tuşlarına sahip HP dizüstü bilgisayar
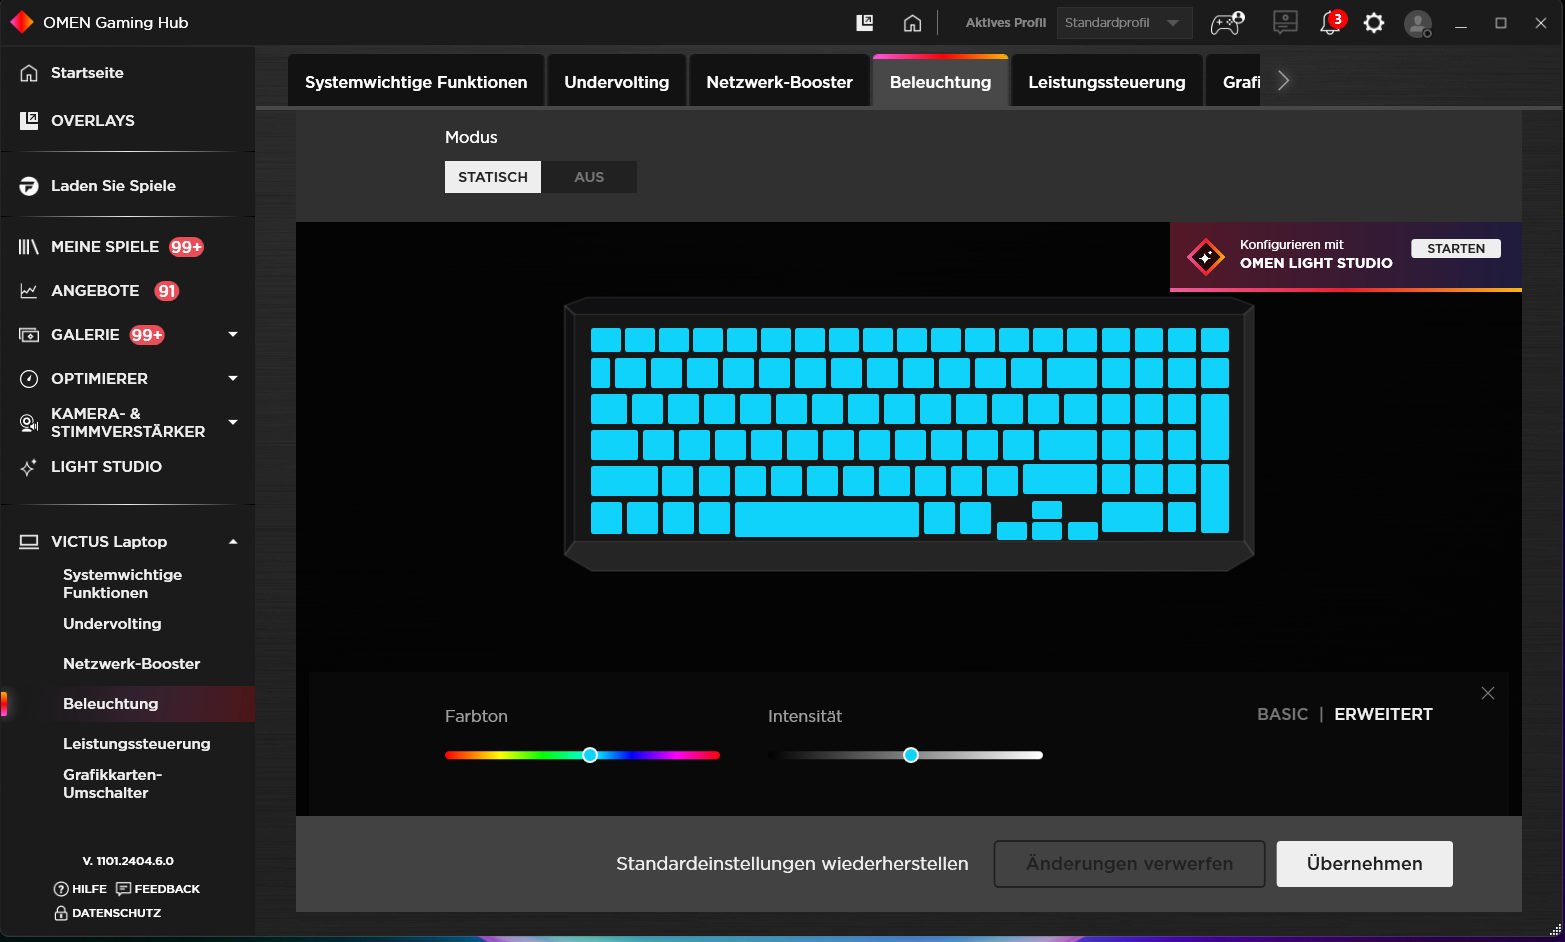
Chiclet klavyenin pürüzsüz tuşları (RGB aydınlatma, sayı tuş takımı) kısa bir kaldırma ve net bir basınç noktasına sahiptir. Dirençleri biraz daha keskin olabilir. Klavye yazarken hafifçe zıplıyor. Negatif: Hem ok tuşları hem de Enter tuşu nispeten küçük. Kısa bir kaldırma ve net bir basınç noktasına sahip bir clickpad (12,5 x 7,5 cm) fare yerine geçer.
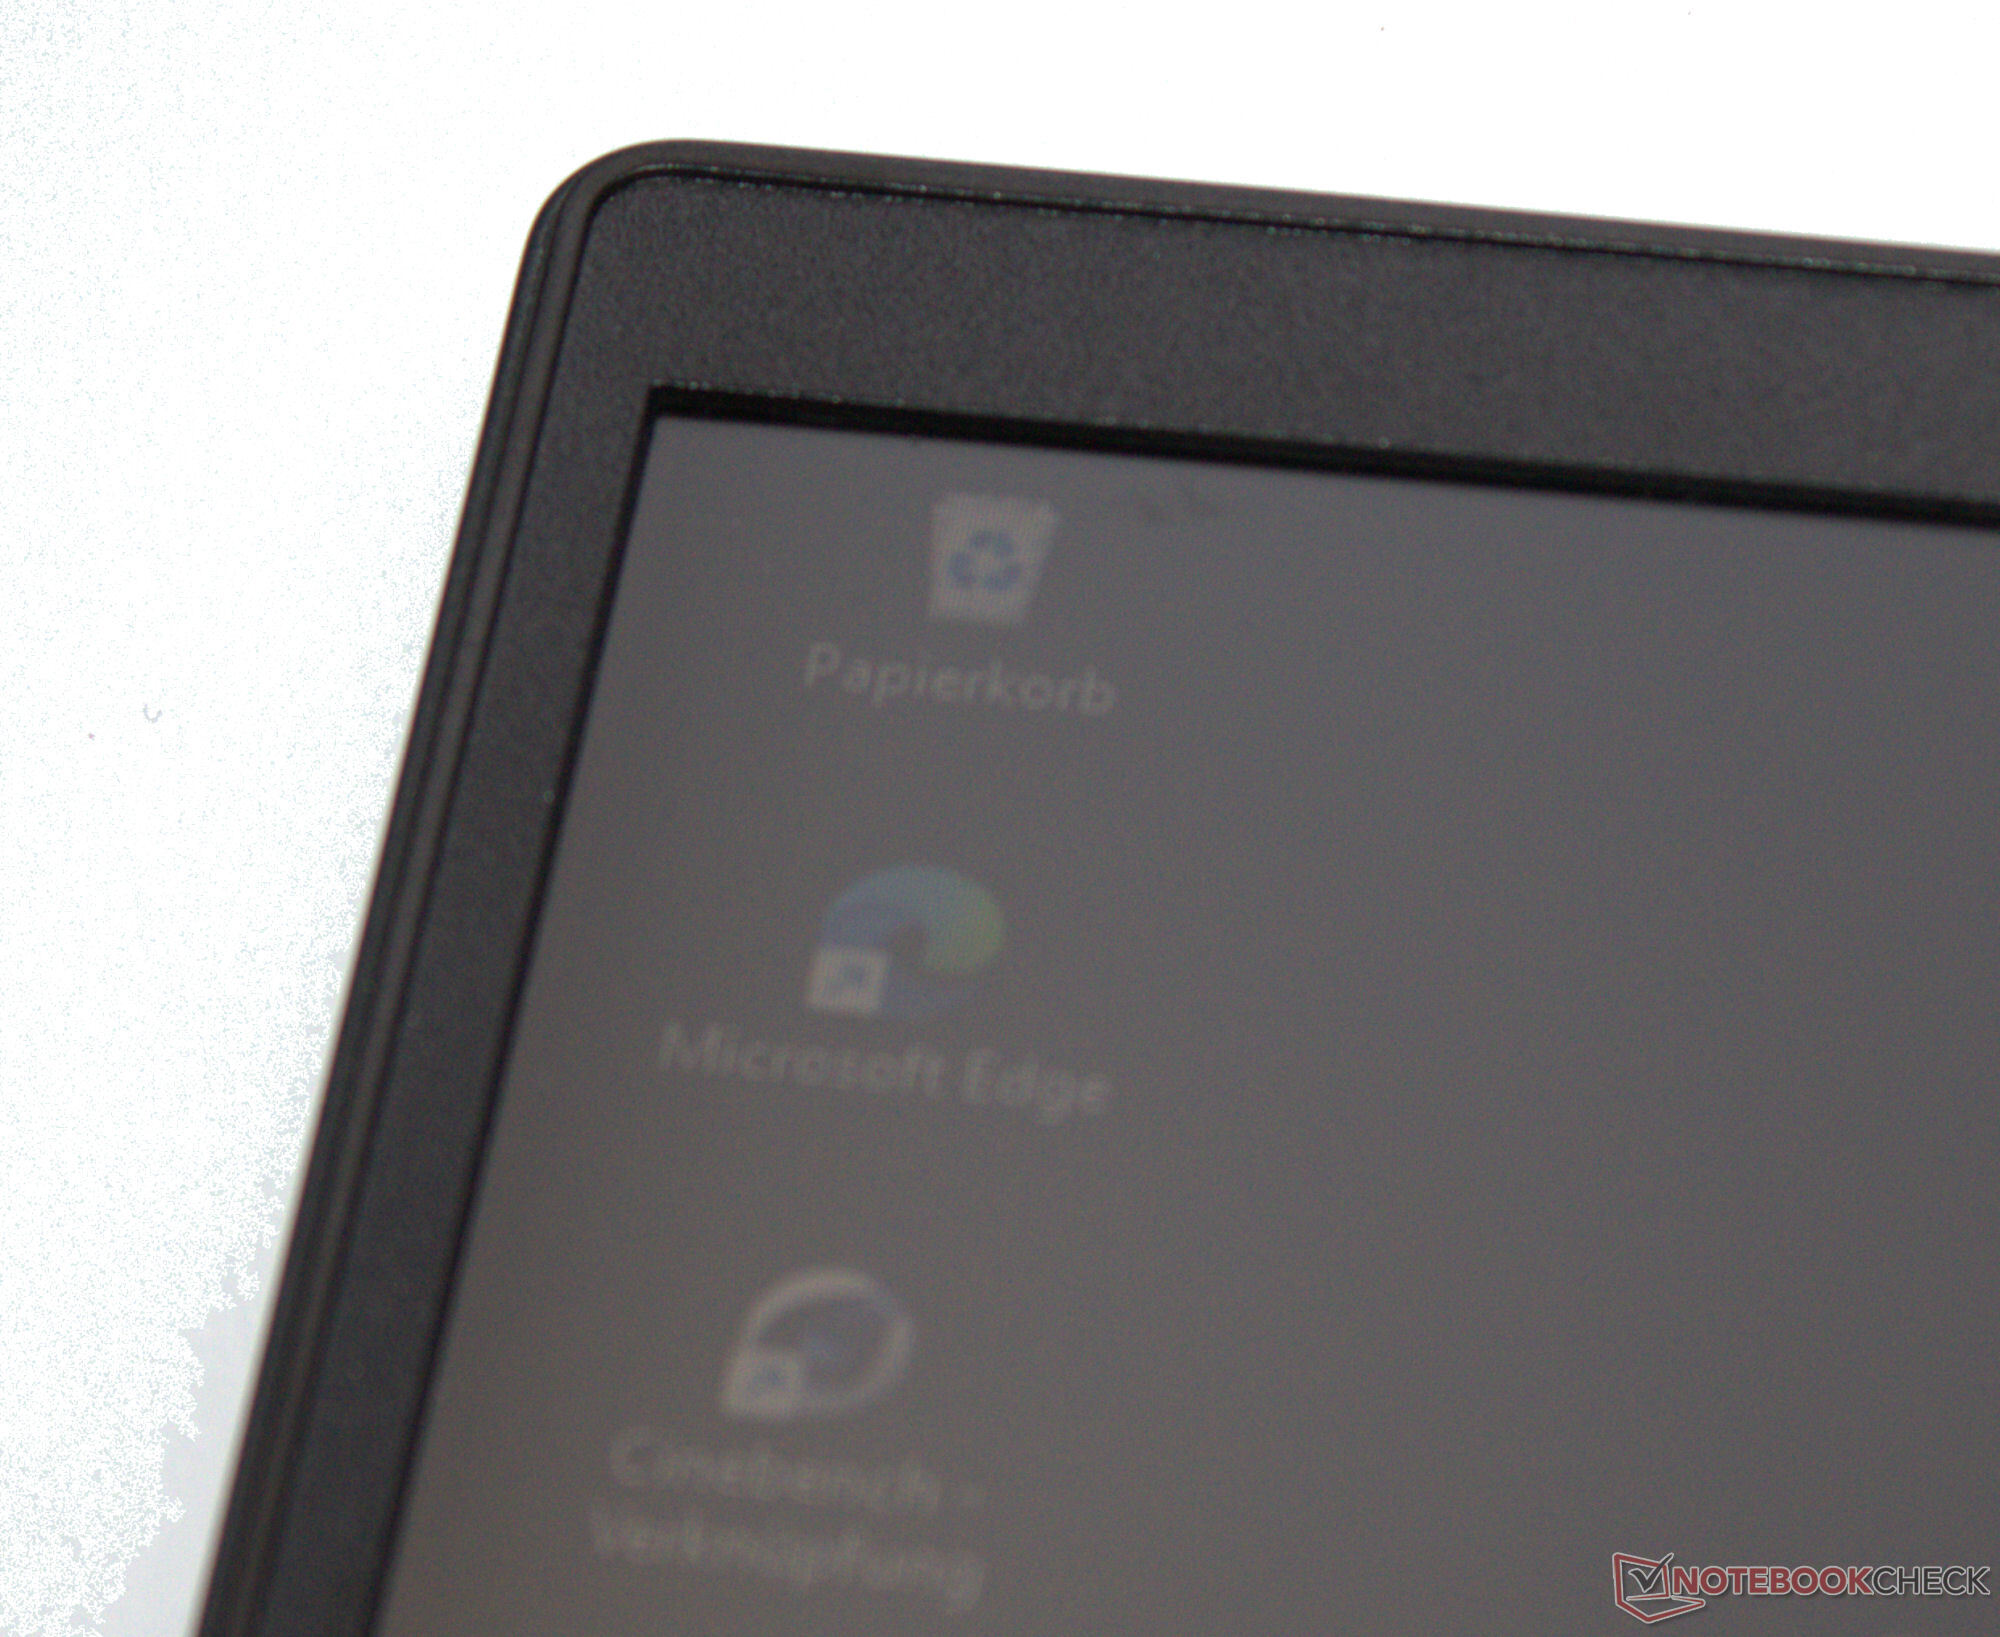
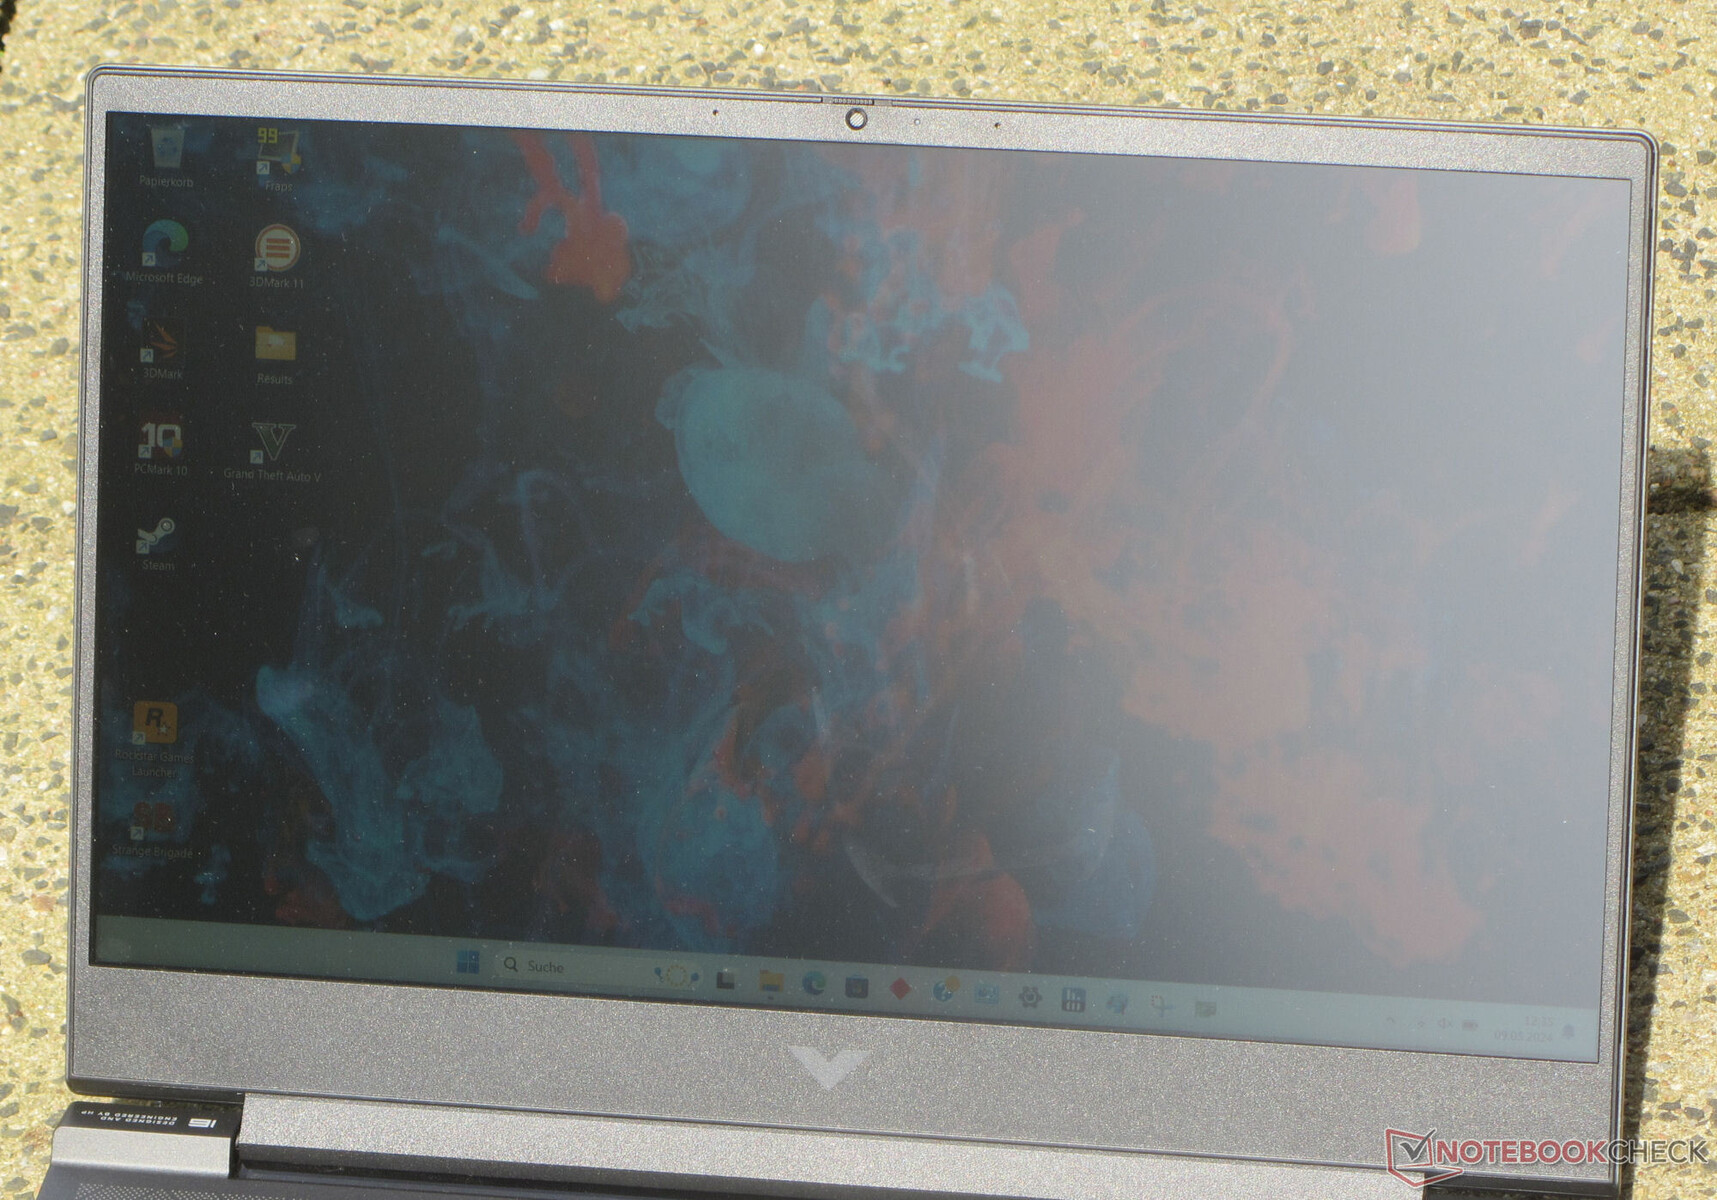
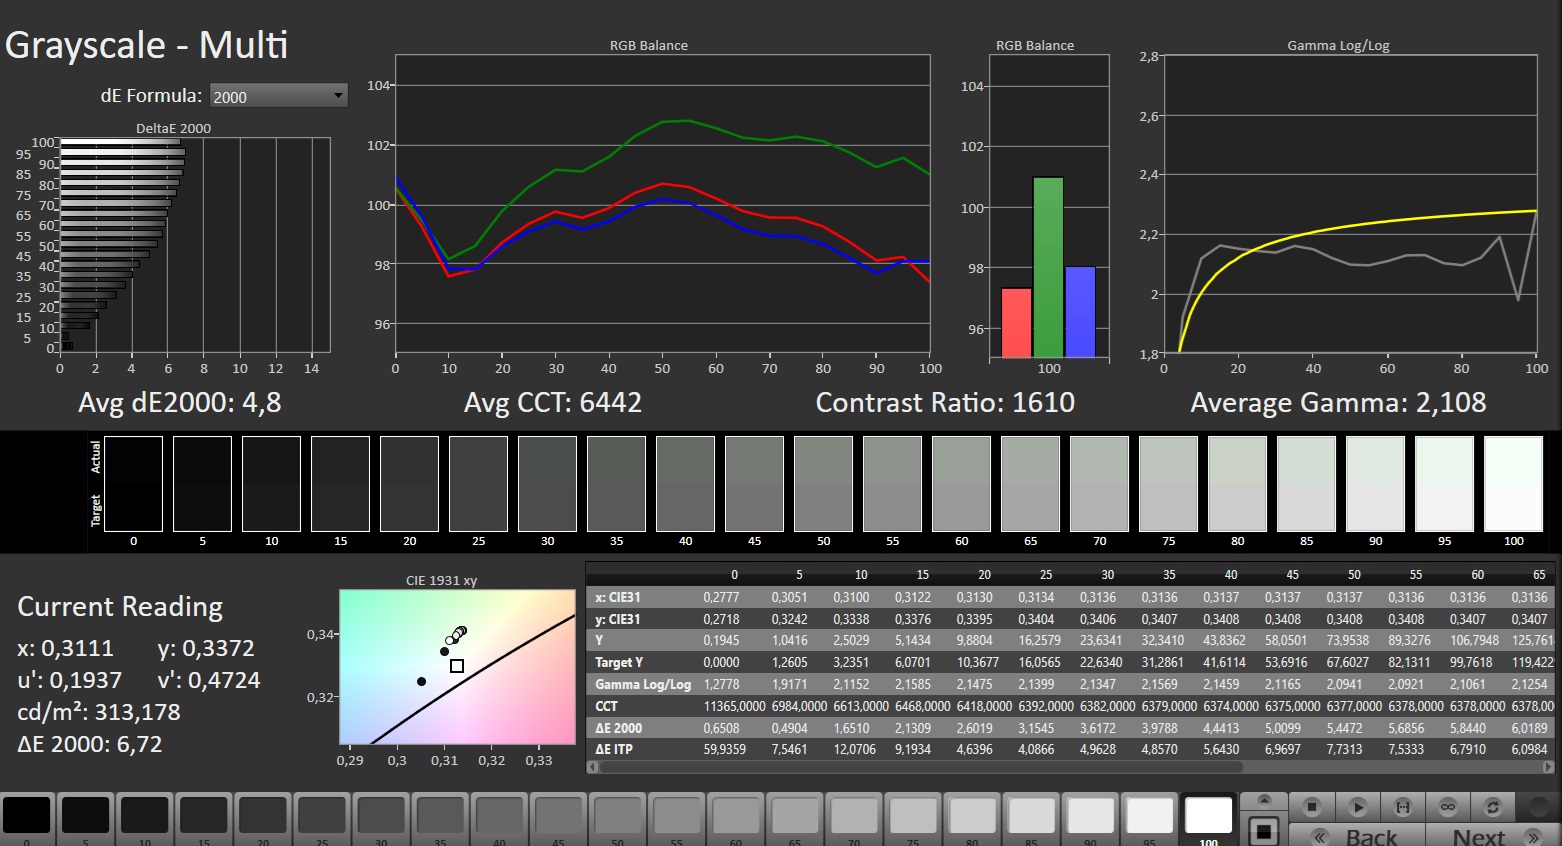
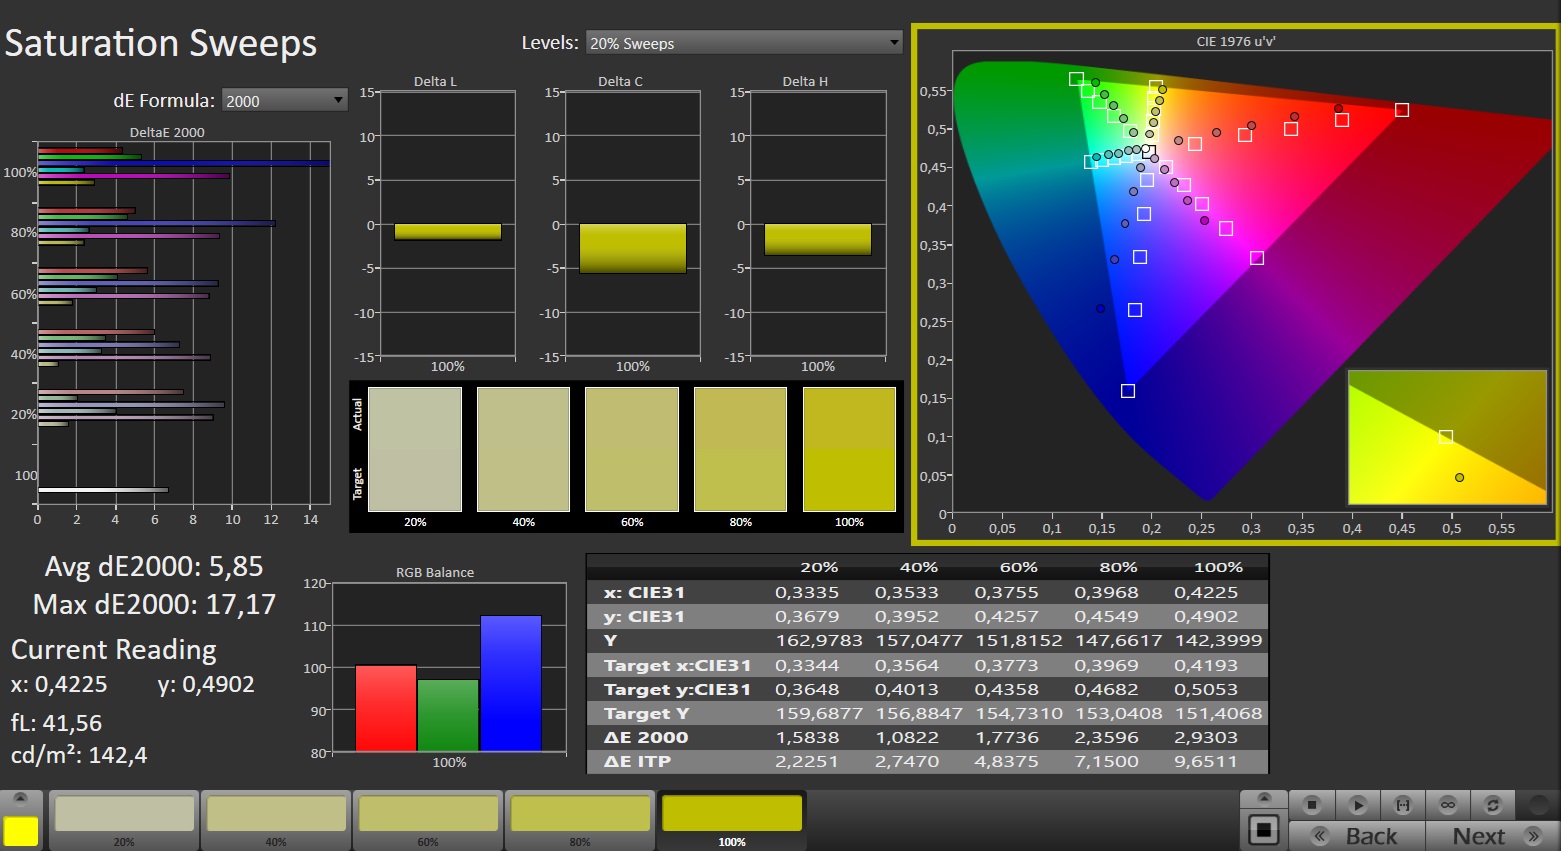
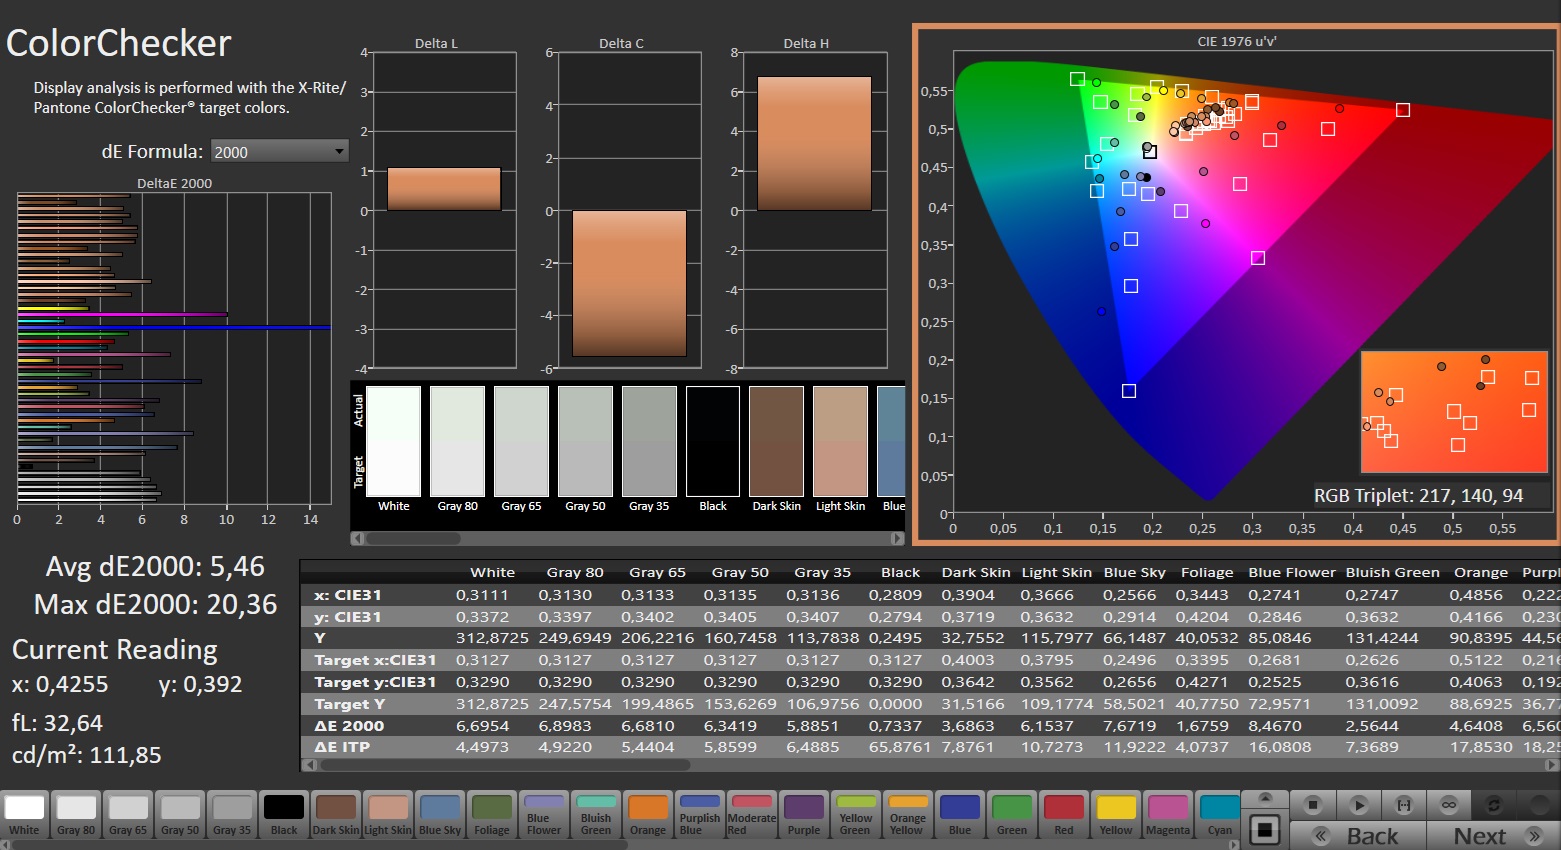
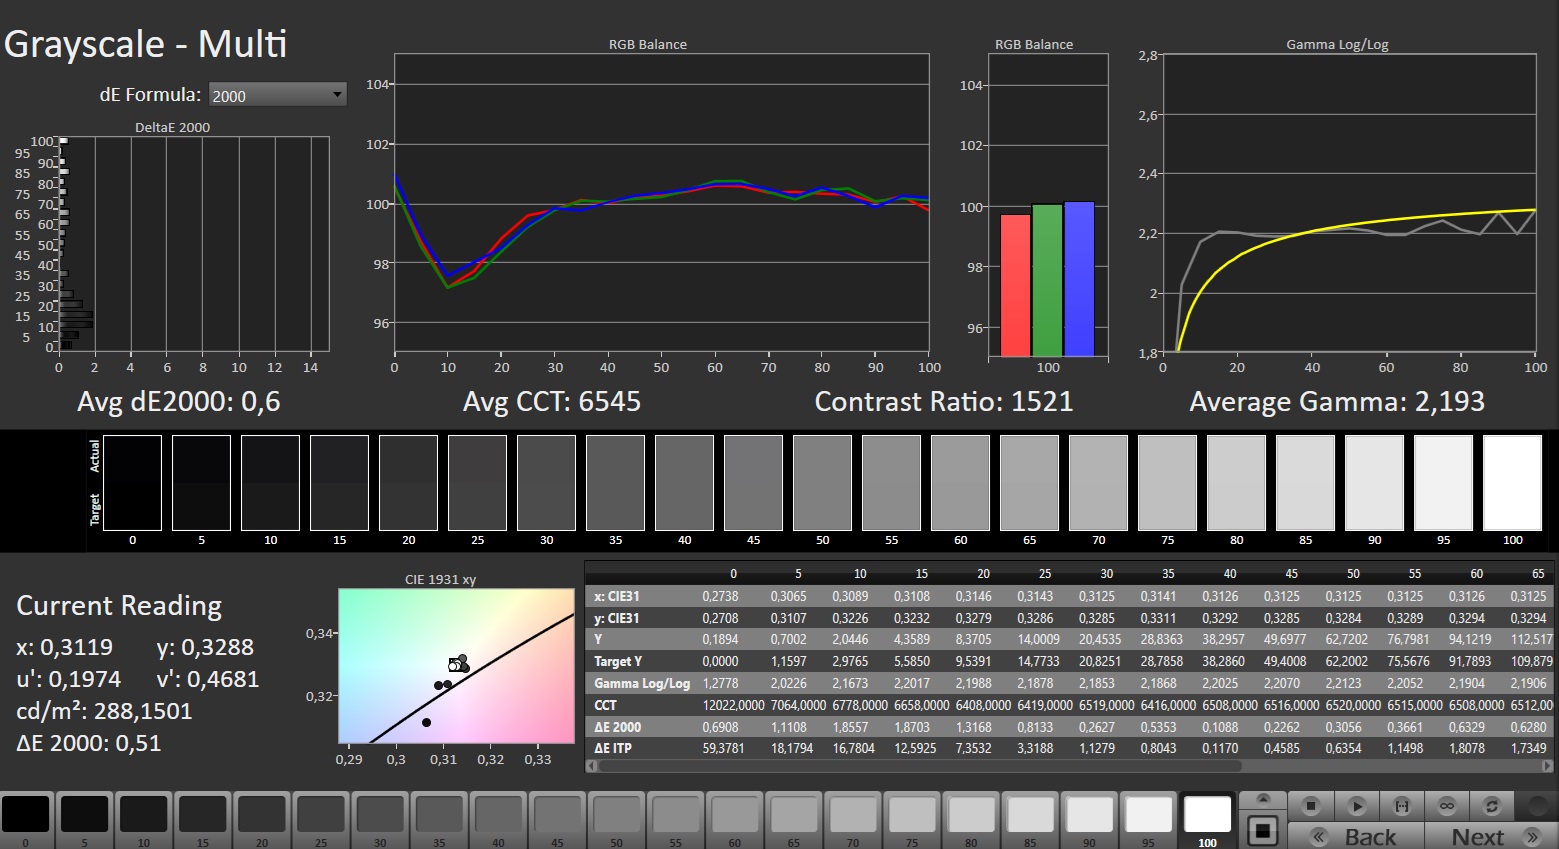
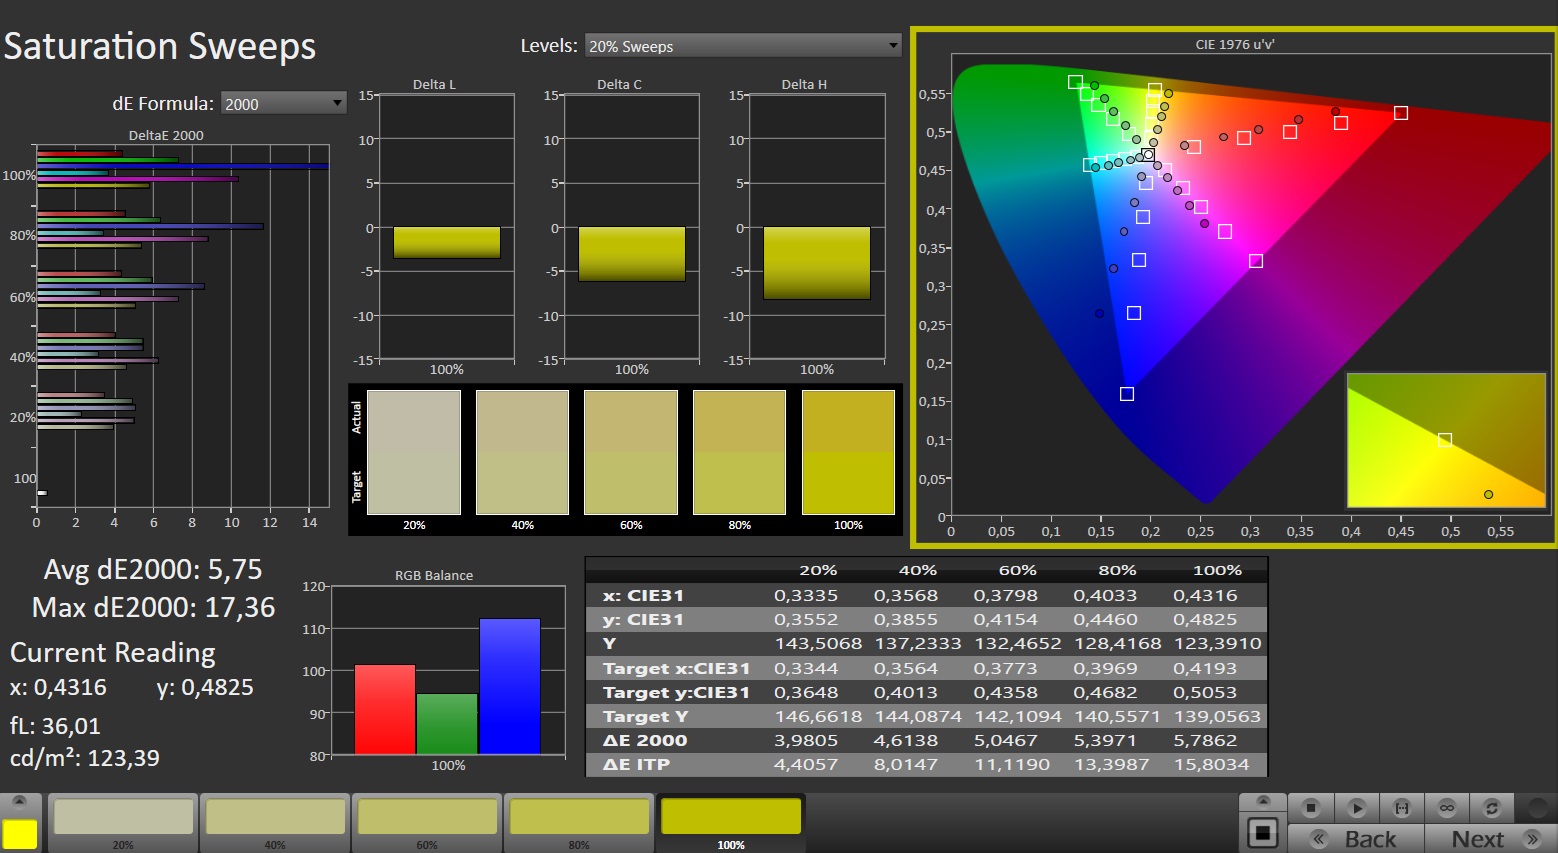
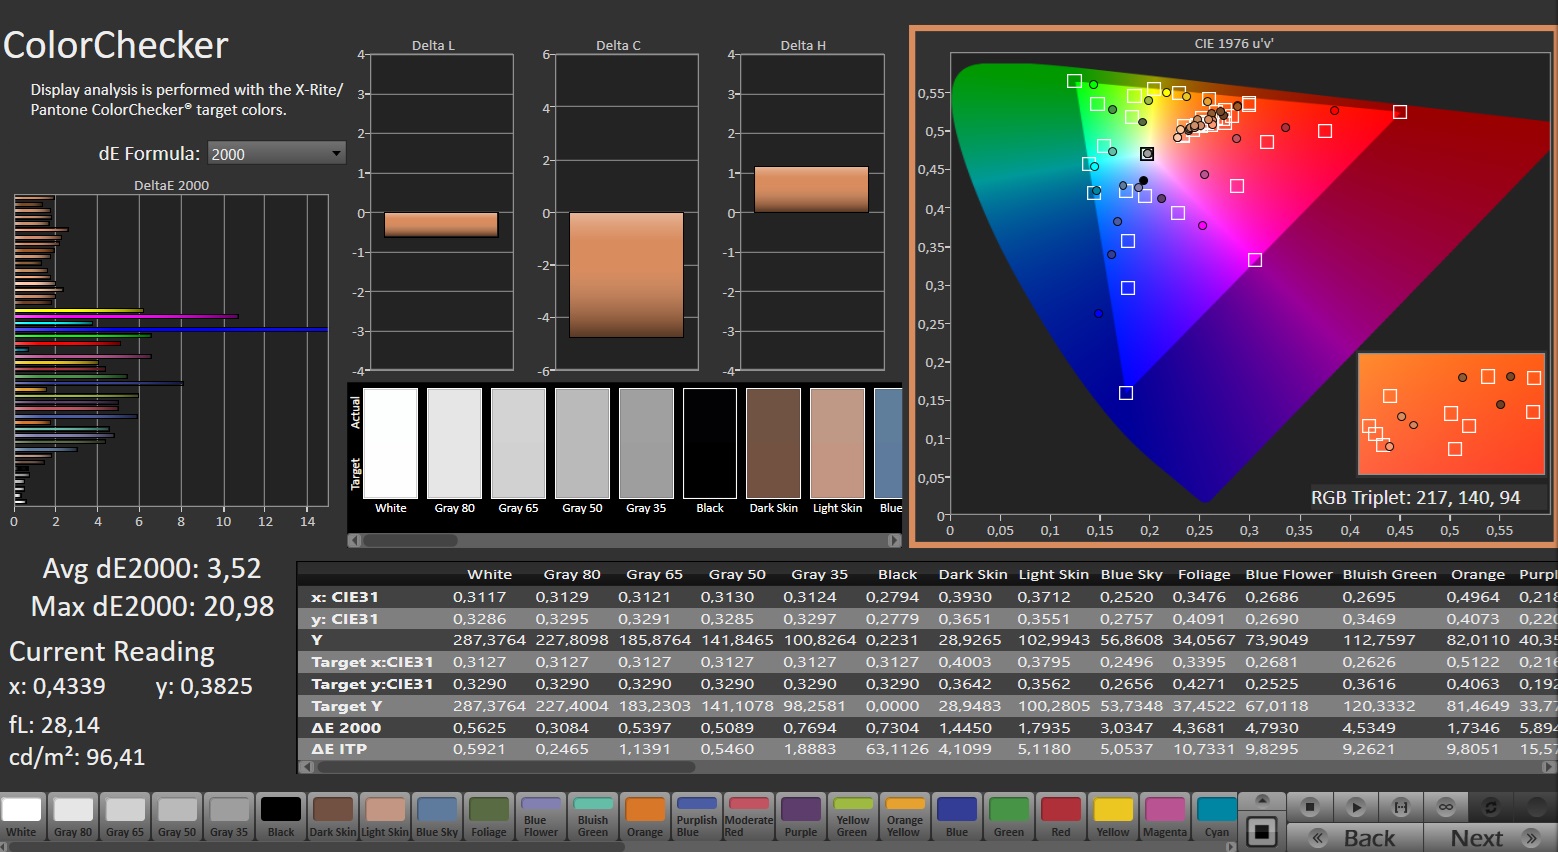
Ekran - Düşük renk doğruluğuna sahip IPS panel
HP, Victus'u 16:9 en boy oranına sahip, görüş açısına dayanıklı 144 Hz panel (FHD, IPS) ile donatmıştır. Tüm parlaklık seviyelerinde herhangi bir PWM titremesi göstermiyor. 16,1 inç ekranın parlaklığı ve kontrastı iç mekan kullanımı için tasarlanmıştır - hedef değer (> 300 cd/m²) tam olarak karşılanmamıştır. Güneş çok parlak olmadığı sürece dışarıda da ekrandan okuma yapabilirsiniz.
| |||||||||||||||||||||||||
Aydınlatma: 86 %
Batarya modunda parlaklık: 287 cd/m²
Kontrast: 1511:1 (Siyah: 0.19 cd/m²)
ΔE Color 5.46 | 0.5-29.43 Ø4.87, calibrated: 3.52
ΔE Greyscale 4.8 | 0.5-98 Ø5.1
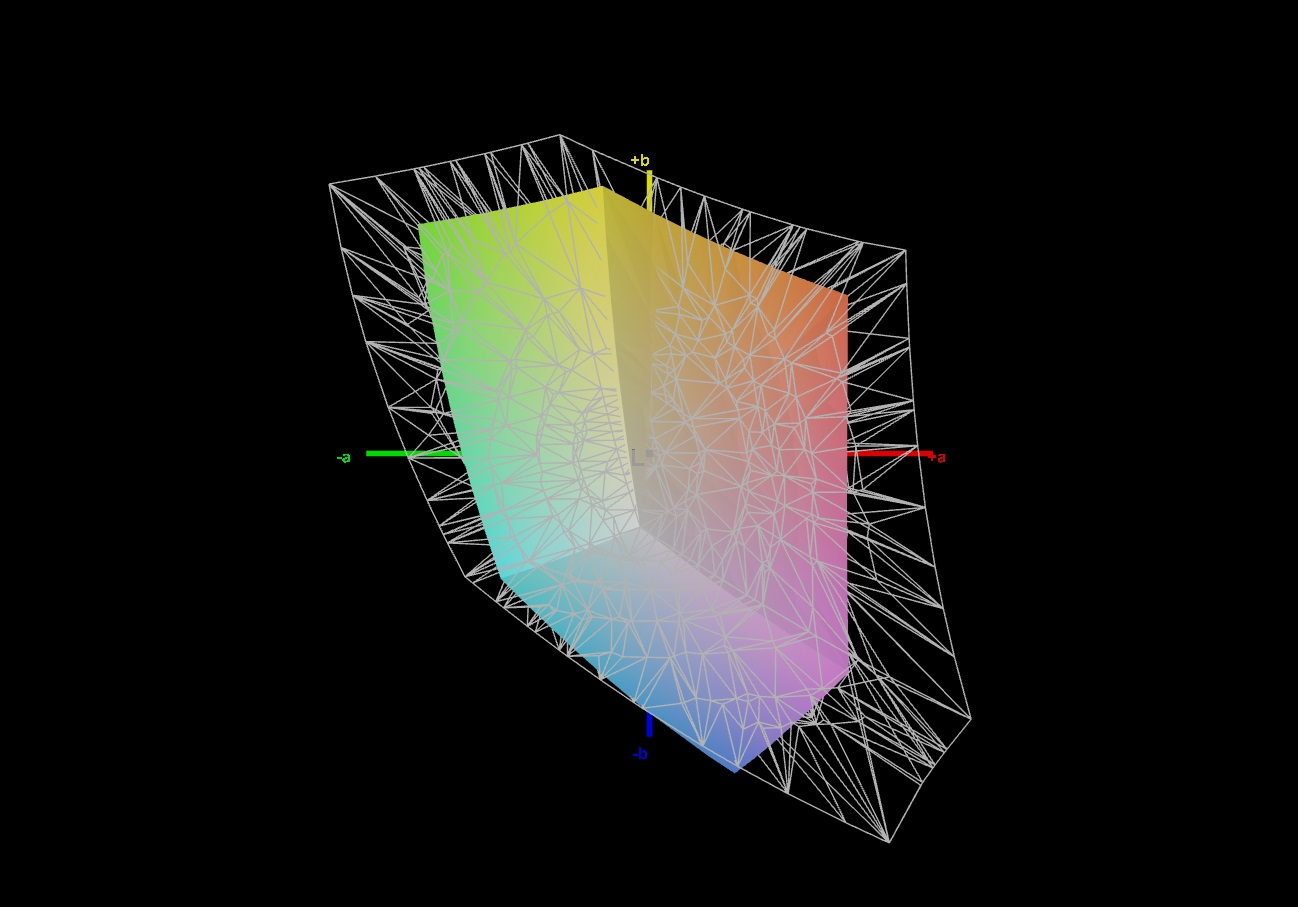
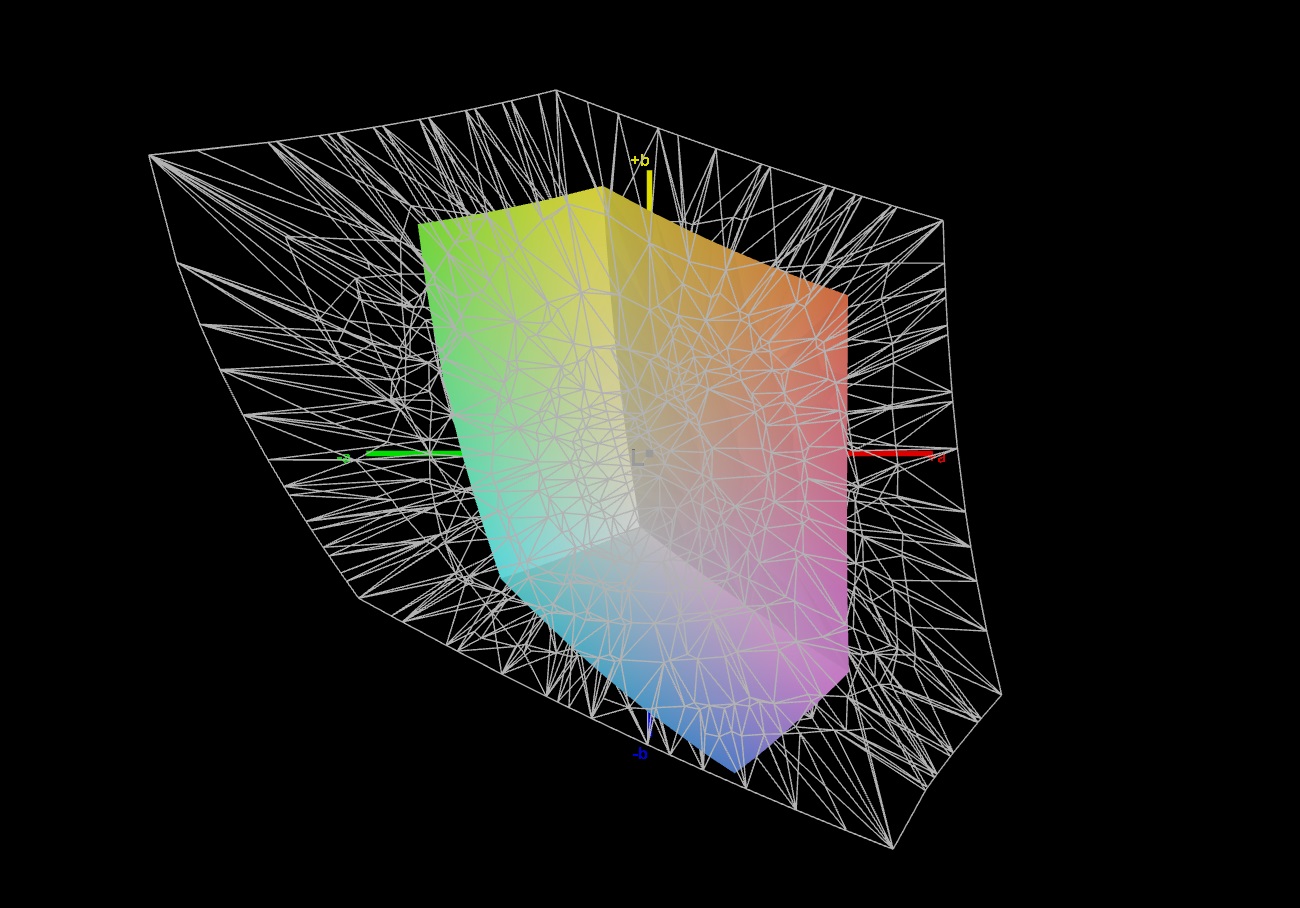
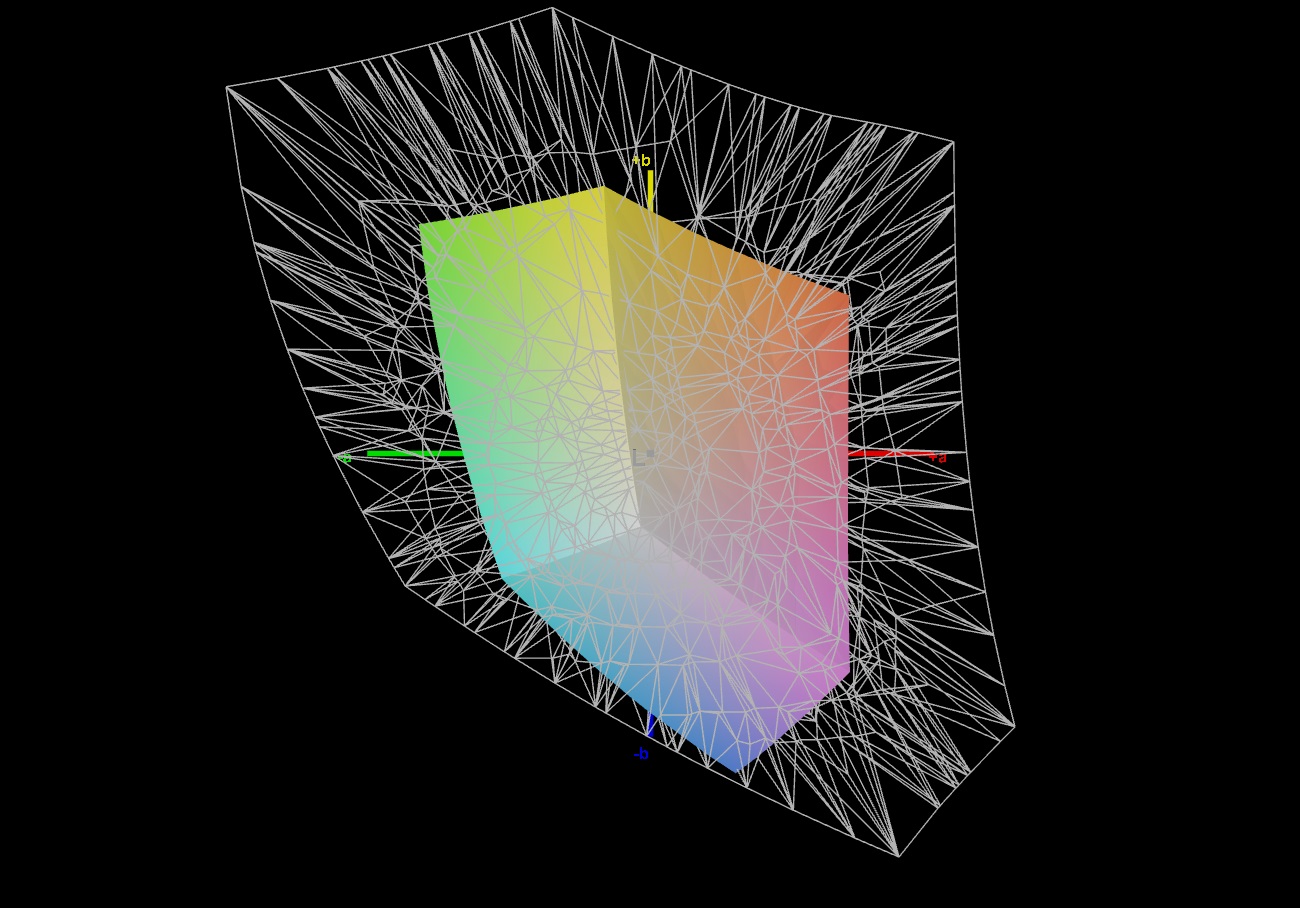
42.7% AdobeRGB 1998 (Argyll 2.2.0 3D)
61.7% sRGB (Argyll 2.2.0 3D)
41.3% Display P3 (Argyll 2.2.0 3D)
Gamma: 2.108
| HP Victus 16 (2024) Chi Mei CMN163E, IPS, 1920x1080, 16.1" | Gigabyte G6X 9KG (2024) BOE NE160WUM-NX6, IPS, 1920x1200, 16" | Dell G16, i7-13650HX, RTX 4060 Chi Mei CMN161D (160GME), IPS, 2560x1600, 16" | Lenovo Legion 5 16IRX G9 NE160QDM-NZ3, IPS, 2560x1600, 16" | Asus TUF Gaming A16 FA617XS BOE NE160WUM-NX2, IPS, 1920x1200, 16" | |
|---|---|---|---|---|---|
| Display | 1% | 62% | 70% | 64% | |
| Display P3 Coverage | 41.3 | 41.8 1% | 67.5 63% | 72.4 75% | 69.3 68% |
| sRGB Coverage | 61.7 | 62.4 1% | 98.5 60% | 100 62% | 97.3 58% |
| AdobeRGB 1998 Coverage | 42.7 | 43.3 1% | 69.3 62% | 74.1 74% | 70.7 66% |
| Response Times | -29% | 59% | 55% | 46% | |
| Response Time Grey 50% / Grey 80% * | 28.6 ? | 40.5 ? -42% | 7.6 ? 73% | 12.5 ? 56% | 15.6 ? 45% |
| Response Time Black / White * | 18.7 ? | 21.6 ? -16% | 10.4 ? 44% | 8.7 ? 53% | 10 ? 47% |
| PWM Frequency | |||||
| Screen | 6% | 21% | 45% | 29% | |
| Brightness middle | 287 | 353 23% | 369 29% | 526 83% | 301 5% |
| Brightness | 288 | 318 10% | 344 19% | 500 74% | 294 2% |
| Brightness Distribution | 86 | 81 -6% | 89 3% | 87 1% | 94 9% |
| Black Level * | 0.19 | 0.21 -11% | 0.26 -37% | 0.33 -74% | 0.21 -11% |
| Contrast | 1511 | 1681 11% | 1419 -6% | 1594 5% | 1433 -5% |
| Colorchecker dE 2000 * | 5.46 | 5.21 5% | 3.04 44% | 1.2 78% | 1.79 67% |
| Colorchecker dE 2000 max. * | 20.36 | 19.95 2% | 5.56 73% | 2.1 90% | 3.48 83% |
| Colorchecker dE 2000 calibrated * | 3.52 | 3.61 -3% | 2.35 33% | 1 72% | 1.2 66% |
| Greyscale dE 2000 * | 4.8 | 3.6 25% | 3.38 30% | 1.3 73% | 2.5 48% |
| Gamma | 2.108 104% | 2.367 93% | 2.47 89% | 2.23 99% | 2.265 97% |
| CCT | 6442 101% | 7138 91% | 6040 108% | 6391 102% | 6157 106% |
| Toplam Ortalama (Program / Ayarlar) | -7% /
0% | 47% /
35% | 57% /
52% | 46% /
39% |
* ... daha küçük daha iyidir
Panel, yaygın renk alanlarını (AdobeRGB, sRGB, DCI-P3) yeniden üretemez. Bu açıdan bazı rakiplerin ekranları daha fazlasını sunuyor. Renk üretimi de en iyisi değil: Fabrika sapması 5,5'tir ve bir kalibrasyon değeri yaklaşık 3,5'e düşürür - her durumda, hedefi (DeltaE < 3) kaçırılmıştır.
Yanıt Sürelerini Görüntüle
| ↔ Tepki Süresi Siyahtan Beyaza | ||
|---|---|---|
| 18.7 ms ... yükseliş ↗ ve sonbahar↘ birleşimi | ↗ 9.6 ms yükseliş | 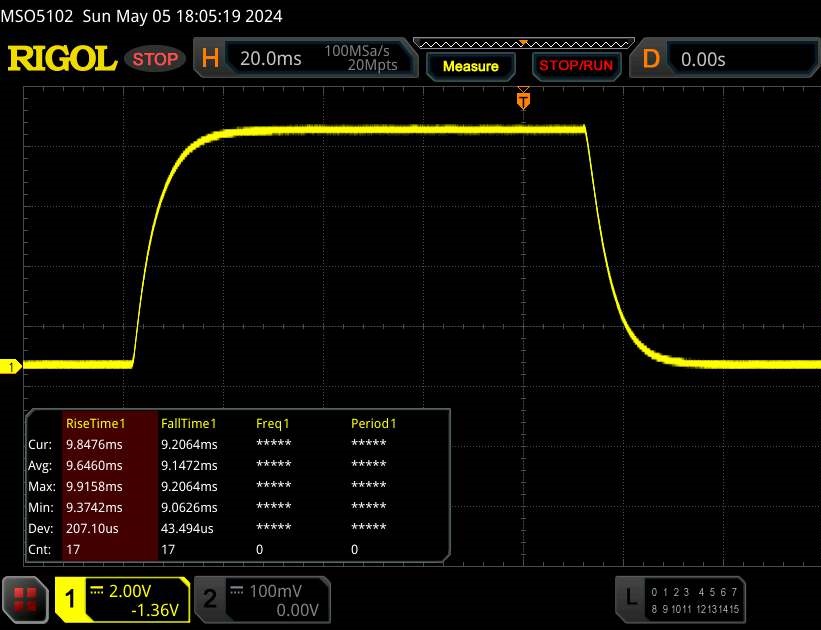 |
| ↘ 9.1 ms sonbahar | ||
| Ekran, testlerimizde iyi yanıt oranları gösteriyor ancak rekabetçi oyuncular için çok yavaş olabilir. Karşılaştırıldığında, test edilen tüm cihazlar 0.1 (minimum) ile 240 (maksimum) ms arasında değişir. » Tüm cihazların 38 %'si daha iyi. Bu, ölçülen yanıt süresinin test edilen tüm cihazların ortalamasından (20.8 ms) daha iyi olduğu anlamına gelir. | ||
| ↔ Tepki Süresi %50 Griden %80 Griye | ||
| 28.6 ms ... yükseliş ↗ ve sonbahar↘ birleşimi | ↗ 13.3 ms yükseliş | 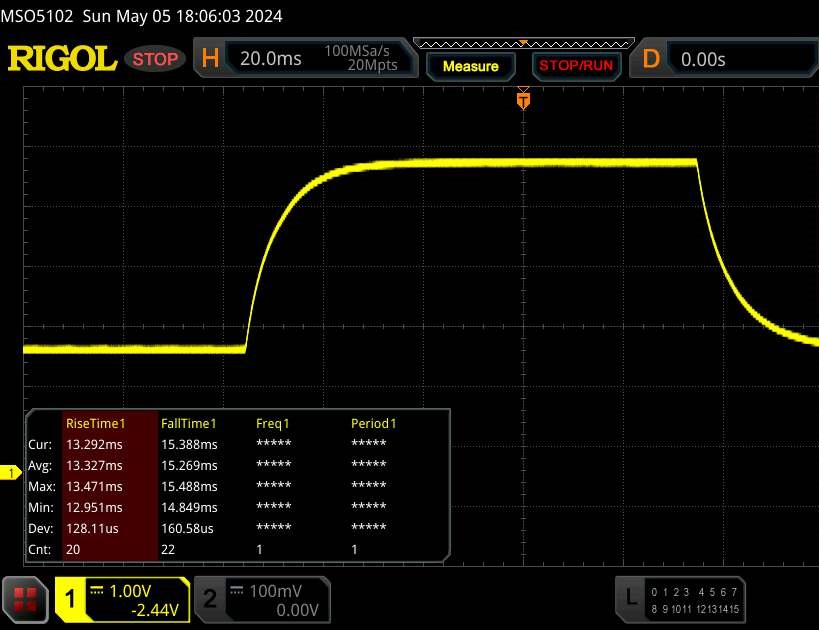 |
| ↘ 15.3 ms sonbahar | ||
| Ekran, testlerimizde nispeten yavaş yanıt oranları gösteriyor ve oyuncular için çok yavaş olabilir. Karşılaştırıldığında, test edilen tüm cihazlar 0.165 (minimum) ile 636 (maksimum) ms arasında değişir. » Tüm cihazların 35 %'si daha iyi. Bu, ölçülen yanıt süresinin test edilen tüm cihazların ortalamasından (32.5 ms) daha iyi olduğu anlamına gelir. | ||
Ekran Titremesi / PWM (Darbe Genişliği Modülasyonu)
| Ekran titriyor / PWM algılanmadı | 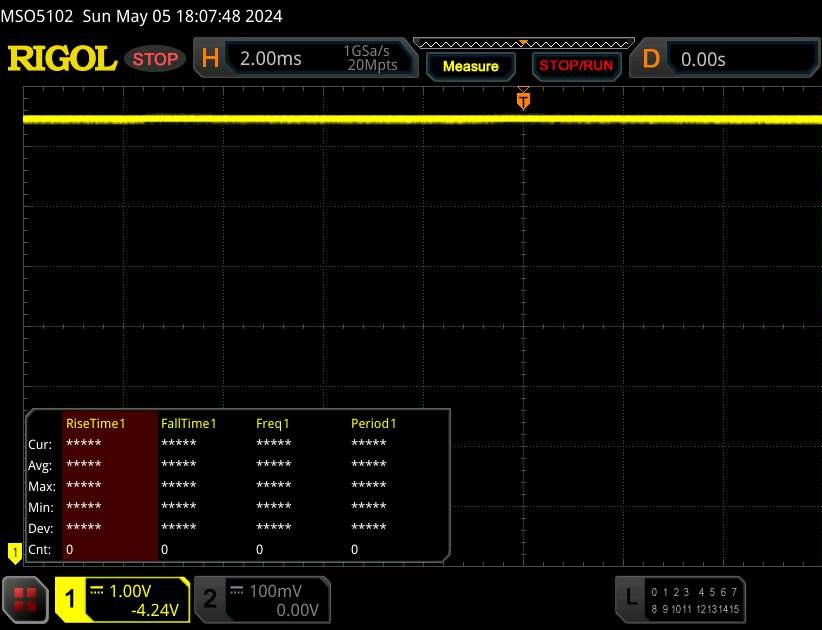 | ||
Karşılaştırıldığında: Test edilen tüm cihazların %53 %'si ekranı karartmak için PWM kullanmıyor. PWM tespit edilirse, ortalama 8516 (minimum: 5 - maksimum: 343500) Hz ölçüldü. | |||
Performans - Raptor Lake ve Ada Lovelace buhar sağlıyor
HP, Victus 16'nın çeşitli yapılandırma varyantlarını sunmaktadır. Victus 16 r1000 serisinin şu anda en ucuz versiyonu yaklaşık 1.300 ABD dolarına bulunabilmektedir (Core i5-14500HX, GeForce RTX 4050, 16 GB RAM, 512 GB SSD, Windows yok). Mevcut test cihazı için yaklaşık 1.600 ABD doları harcamanız gerekecektir.
Test koşulları
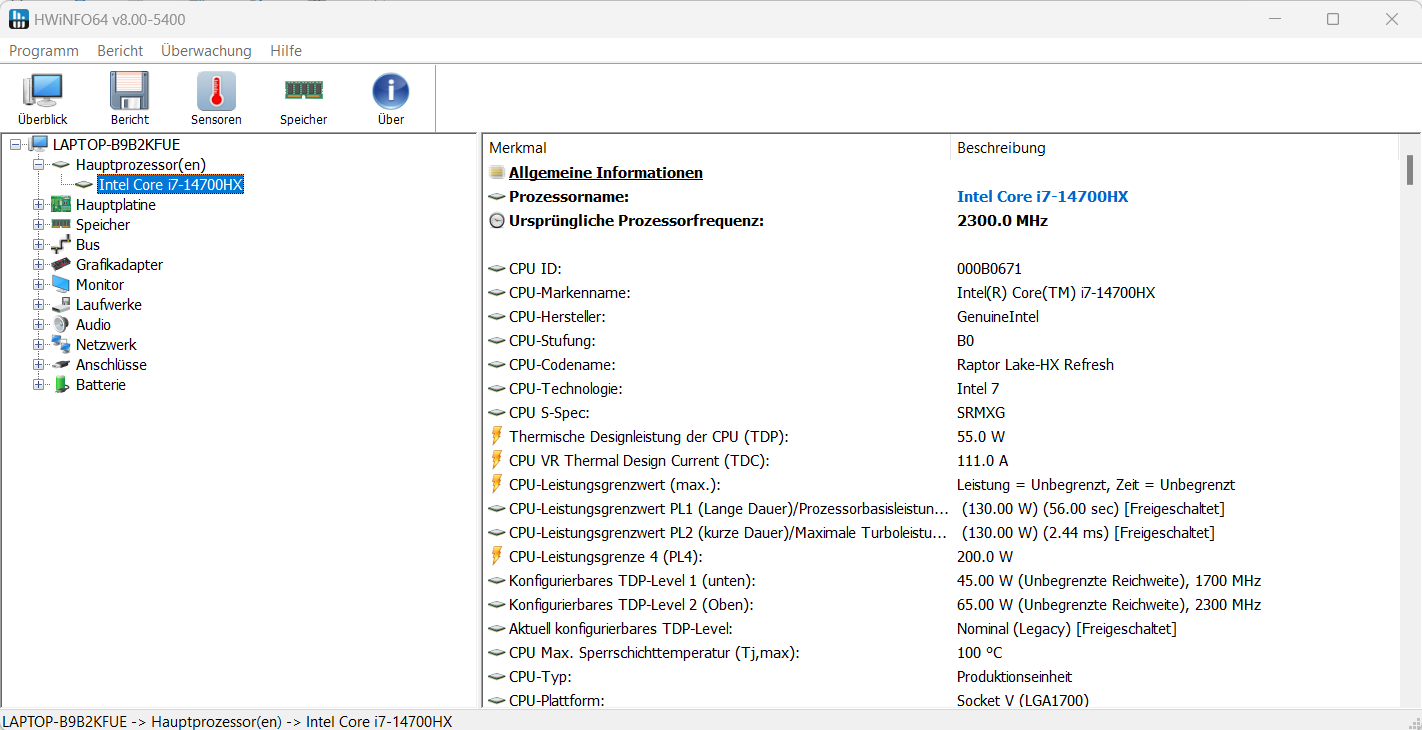
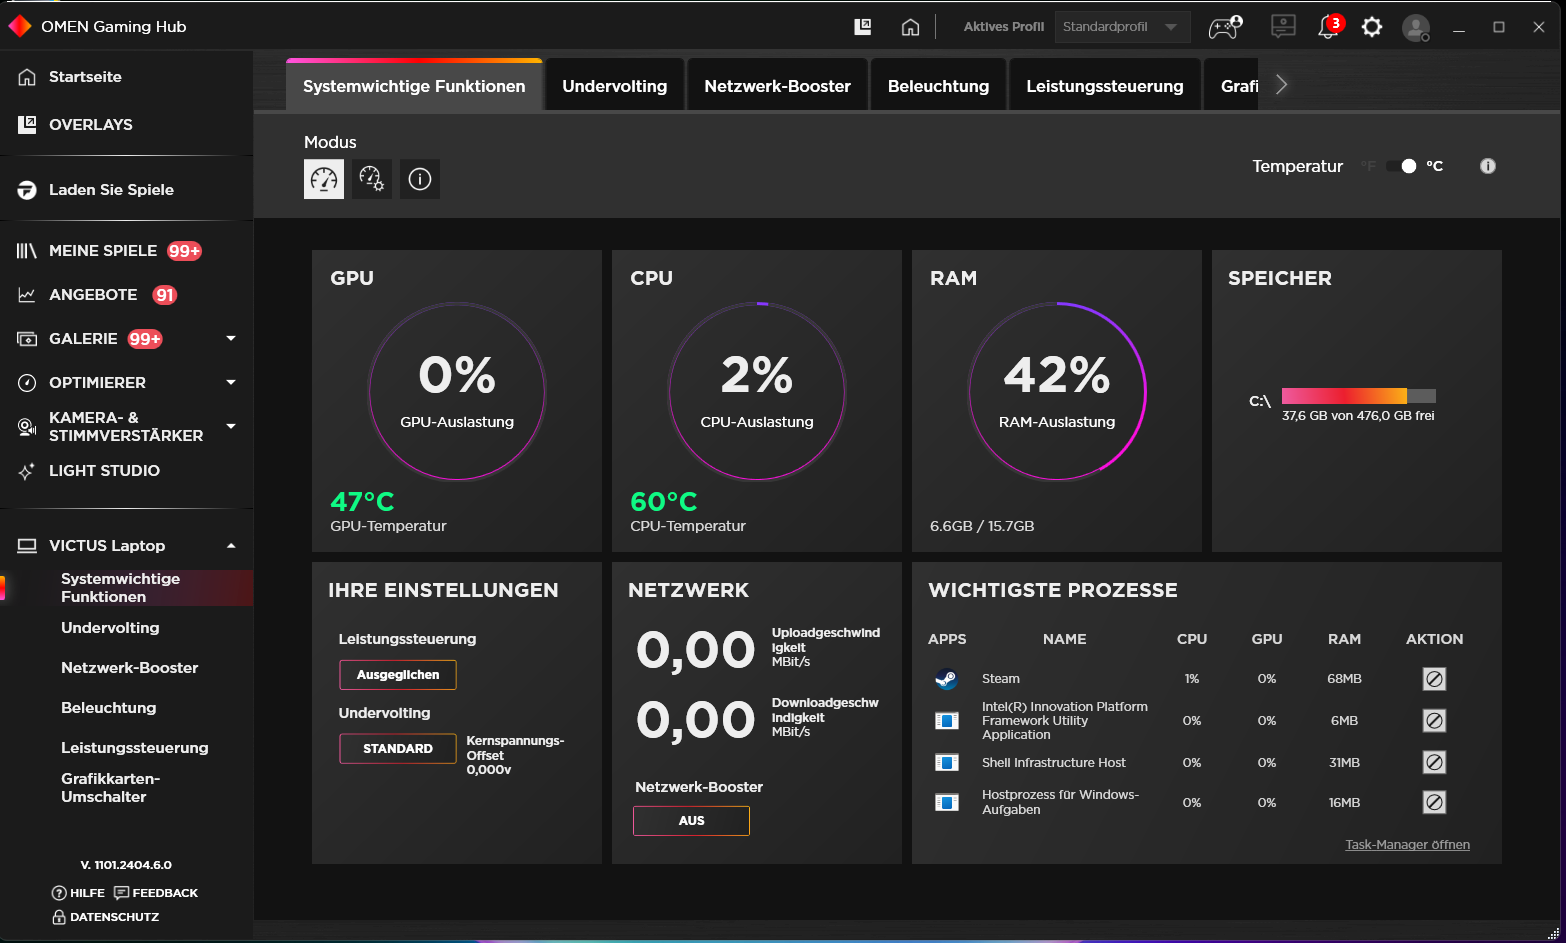
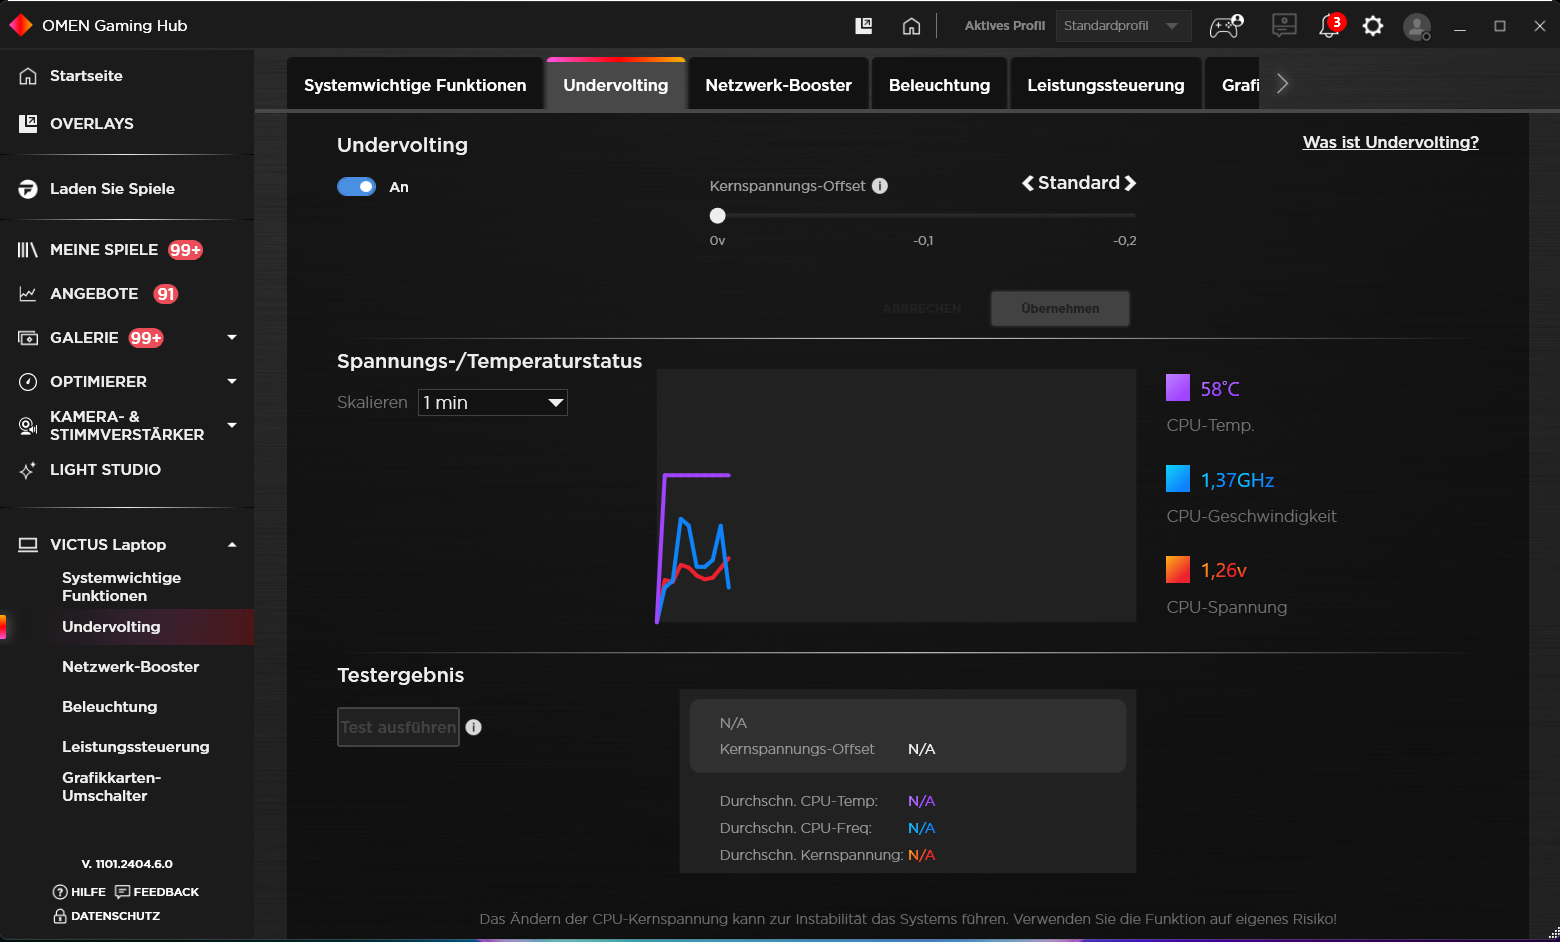
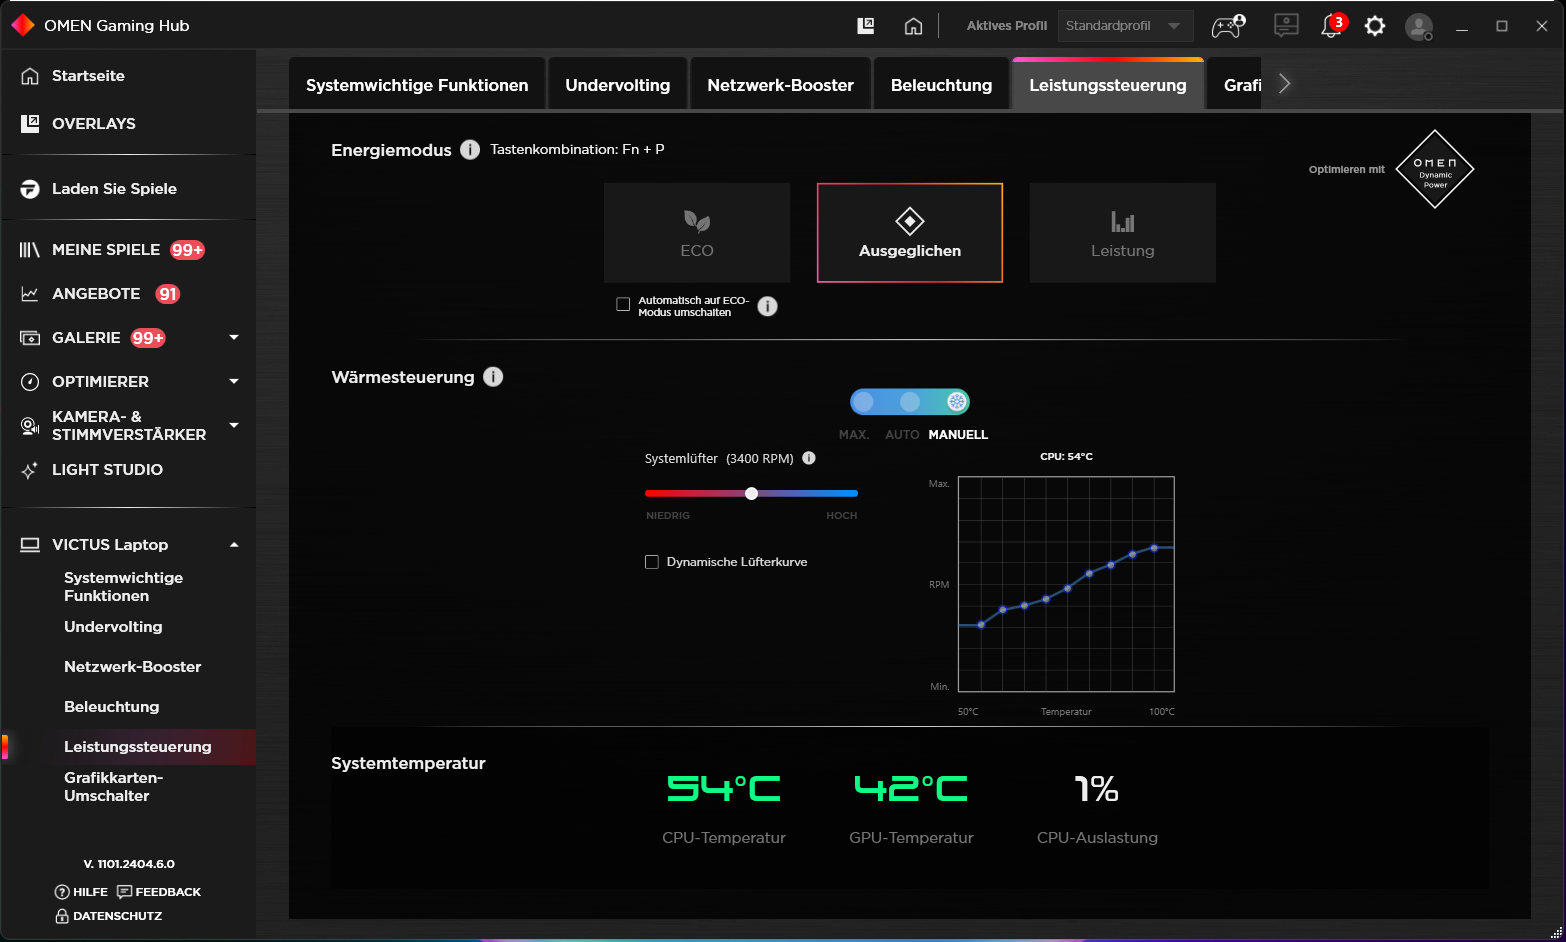
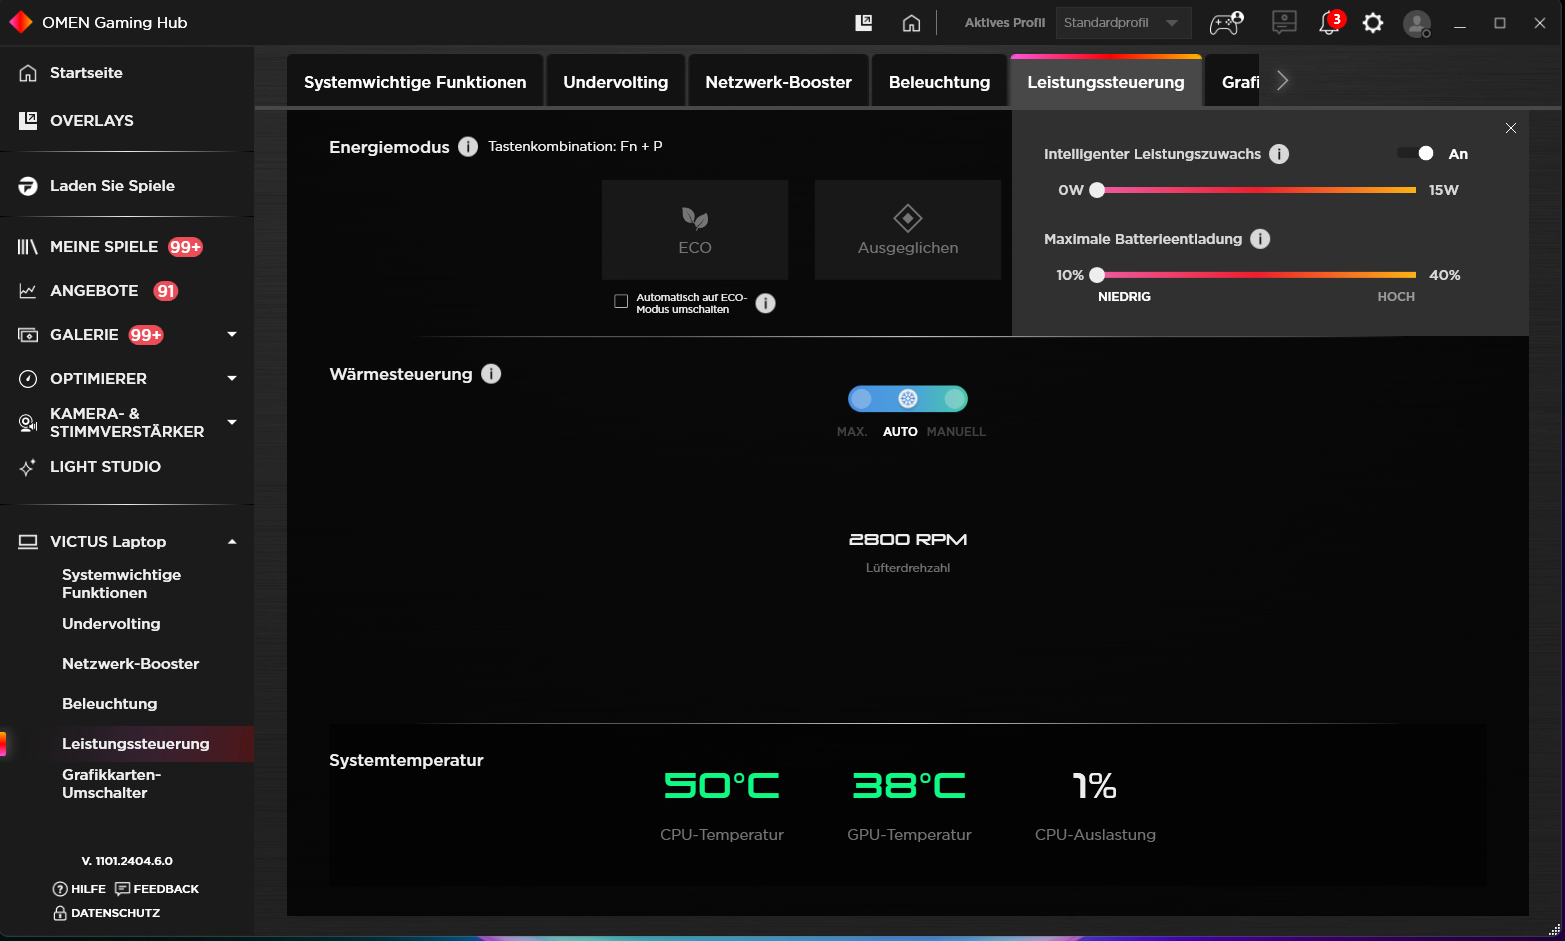
Kullanıcıların seçebileceği HP'ye özgü üç sistem modu (tabloya bakınız) mevcuttur. Testimiz sırasında "Dengeli" (kıyaslamalar) ve "ECO" (pil testleri) modları kullanıldı. Modları hızlı bir şekilde değiştirmek bir tuş kombinasyonu (Fn + P) ile yapılabilir. "Omen Gaming Hub" (dizüstü bilgisayarın kontrol merkezi) da modu seçmenize izin verir. Ayrıca, diğer şeylerin yanı sıra CPU'nun düşük voltajlı olmasına ve bireysel bir fan eğrisinin ayarlanmasına izin verir.
| Dengeli | Performans | Eco | |
|---|---|---|---|
| Güç Sınırı 1 (HWInfo) | 130 watt | 130 watt | 130 watt |
| Güç Sınırı 2 (HWInfo) | 130 watt | 130 watt | 130 watt |
| Performans (Witcher 3) | 98 fps | 100 fps | 60 fps (kilitli) |
| Gürültü (Witcher 3) | 43 dB(A) | 52 dB(A) | 38 dB(A) |
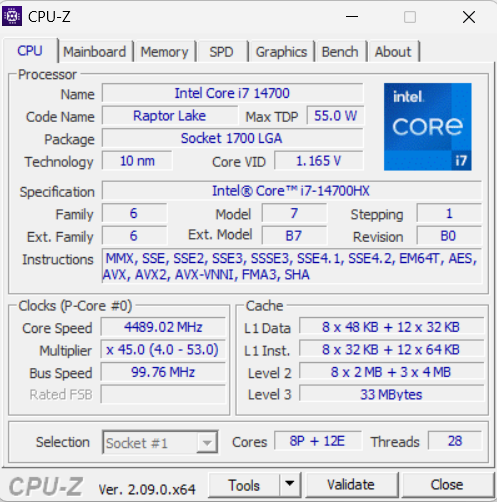
İşlemci
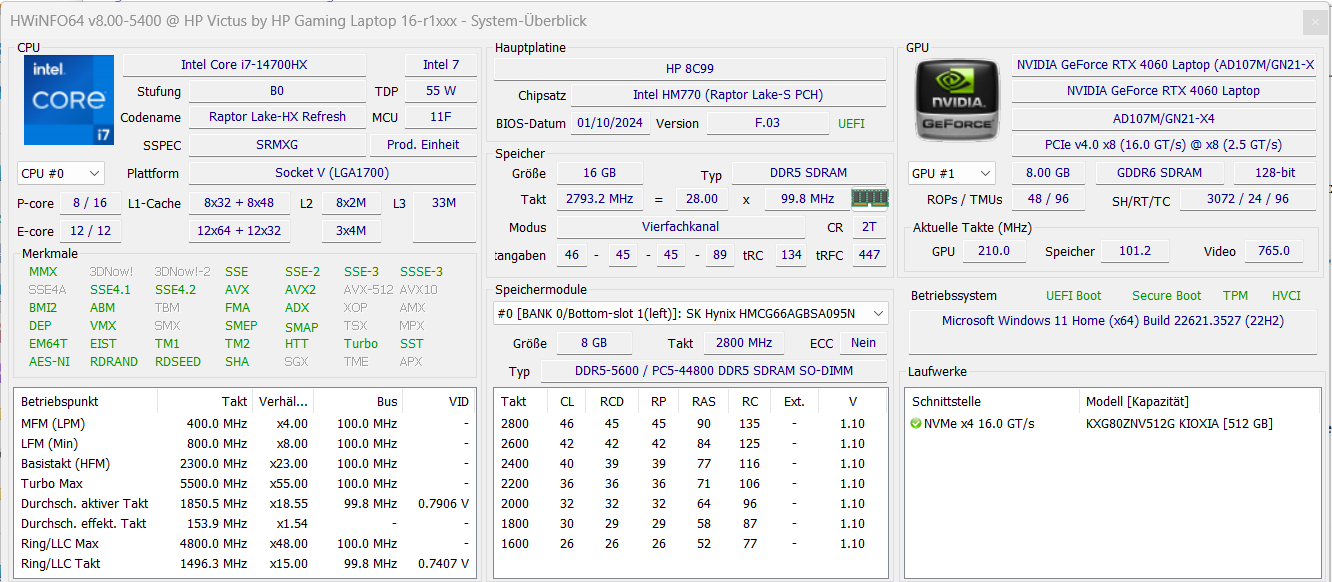
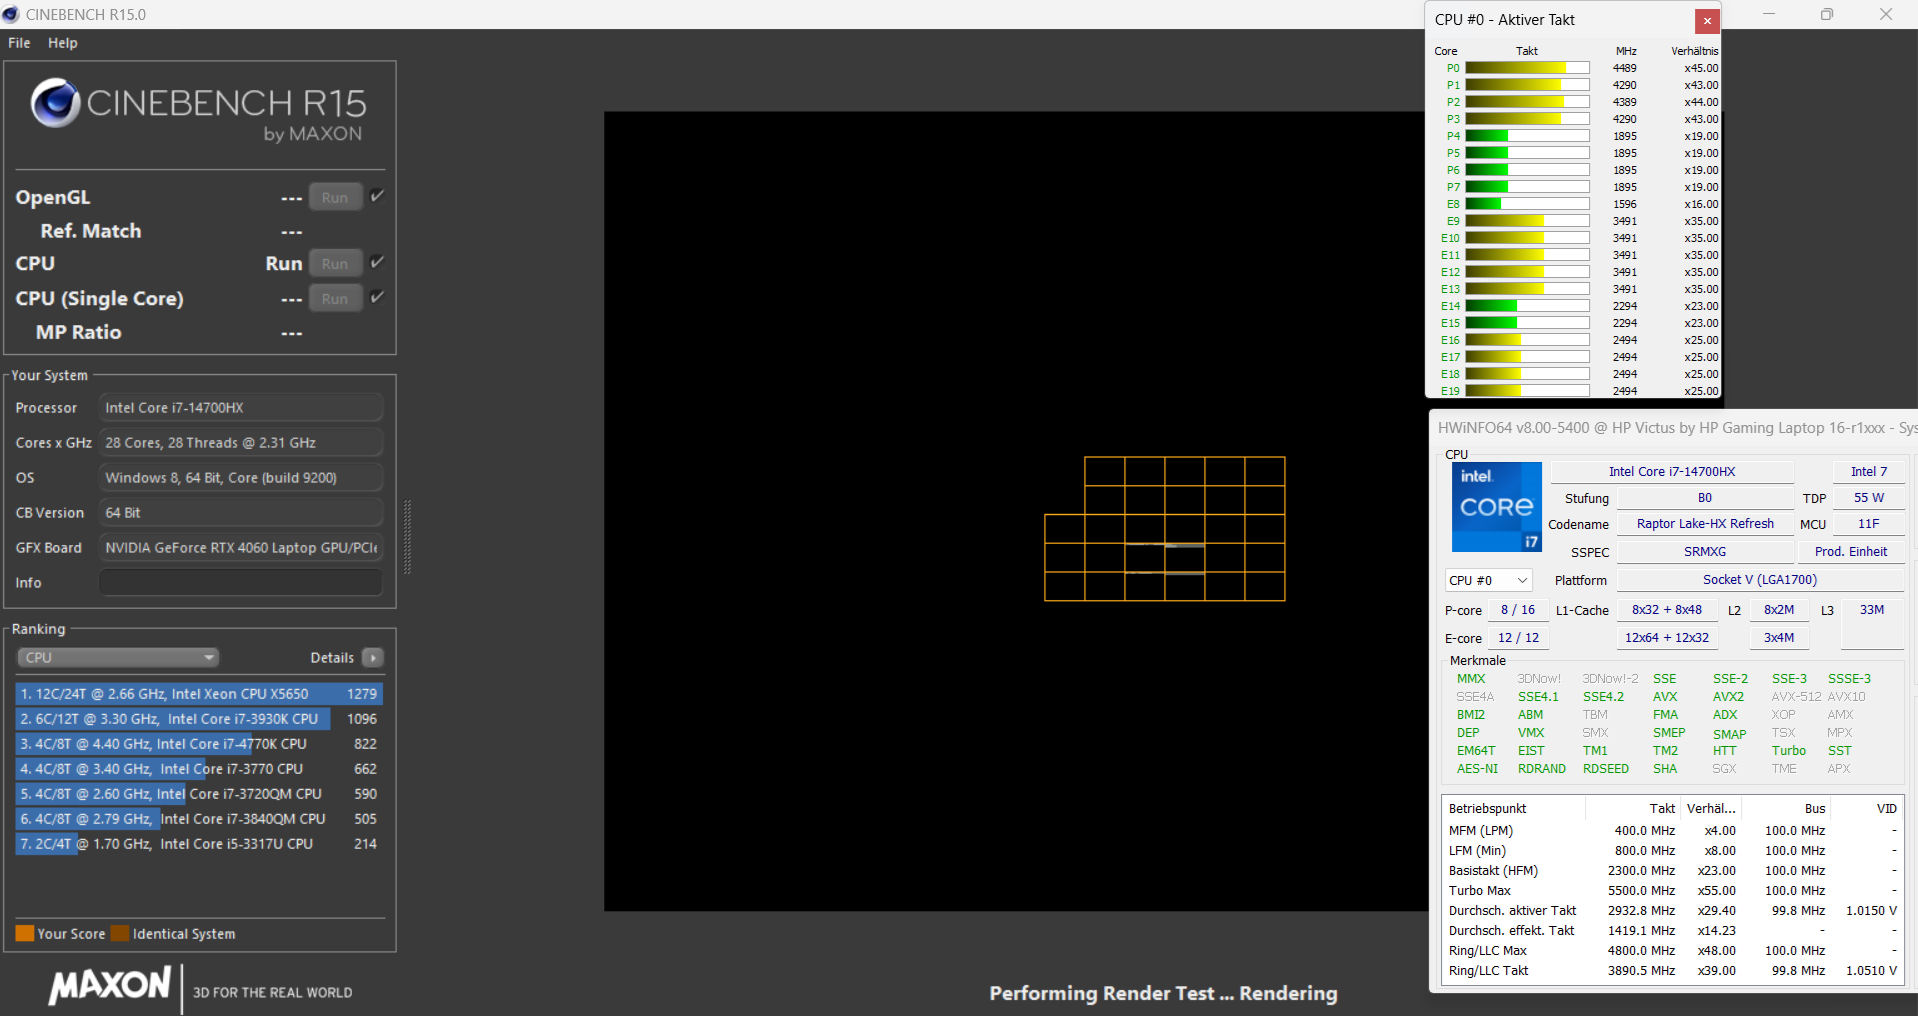
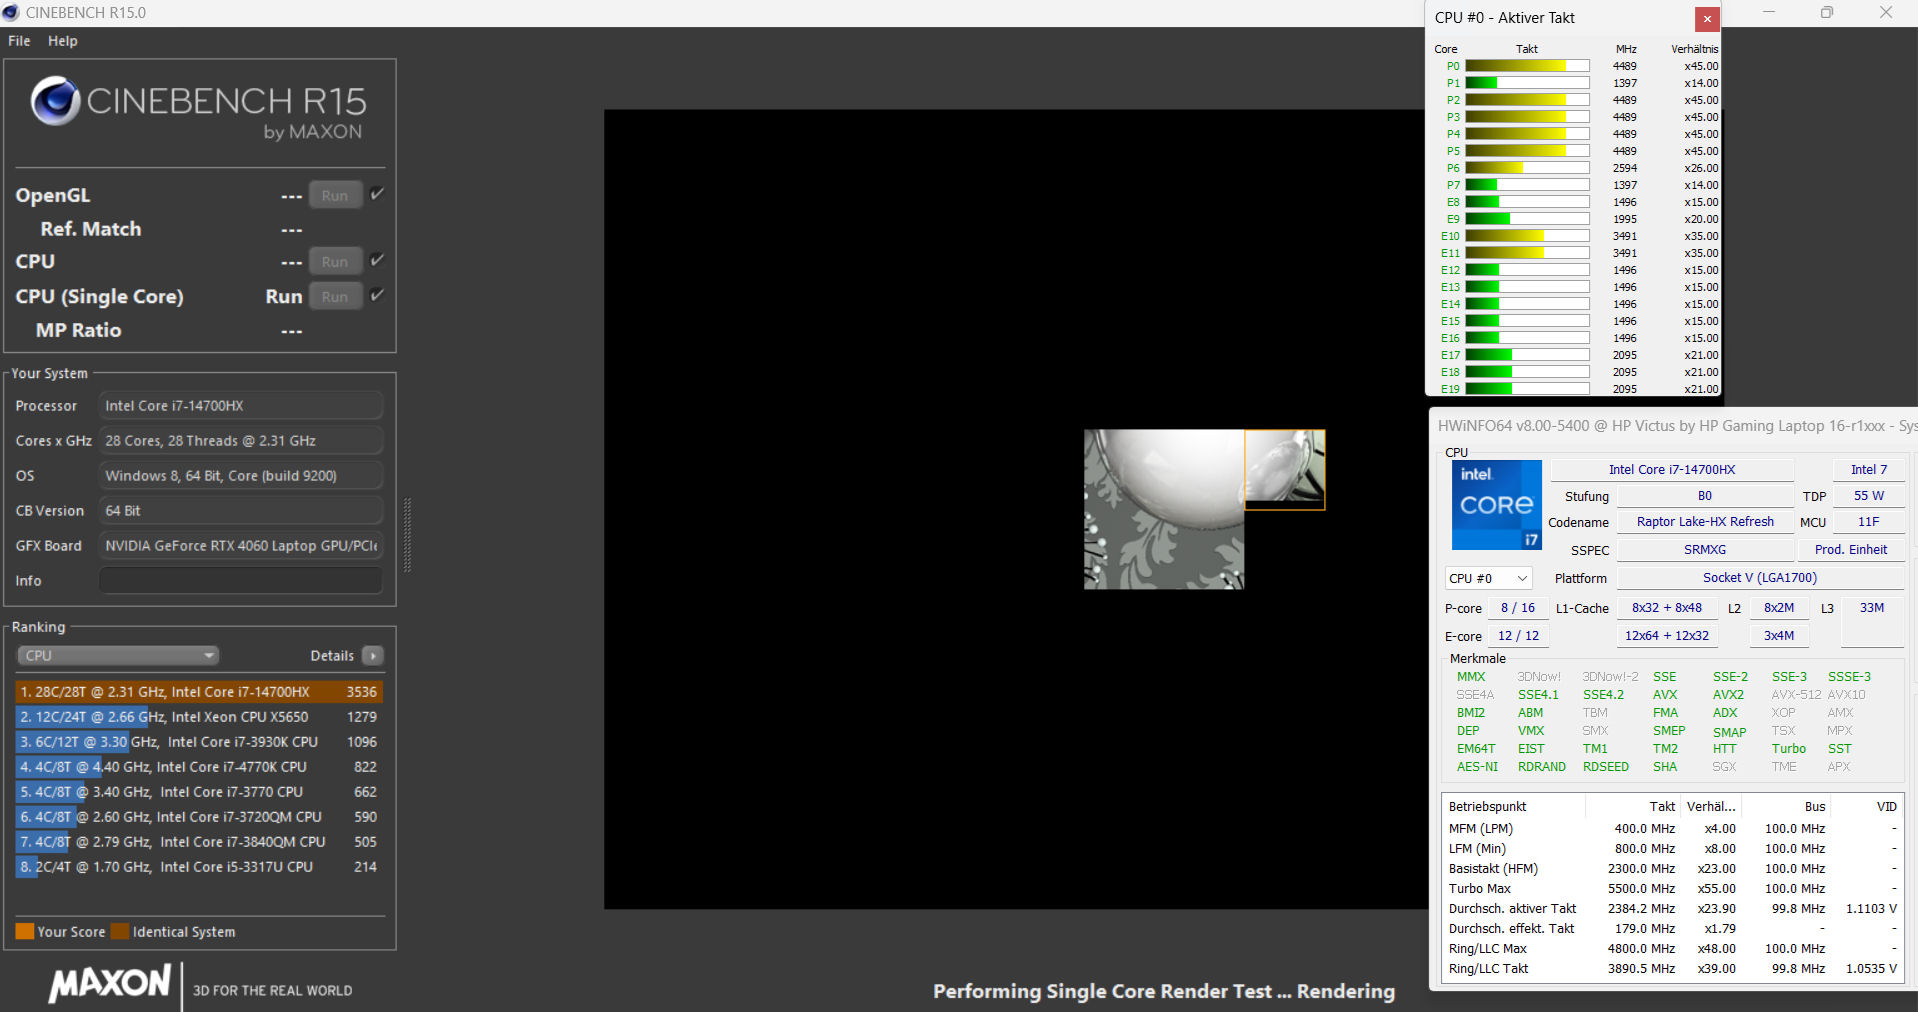
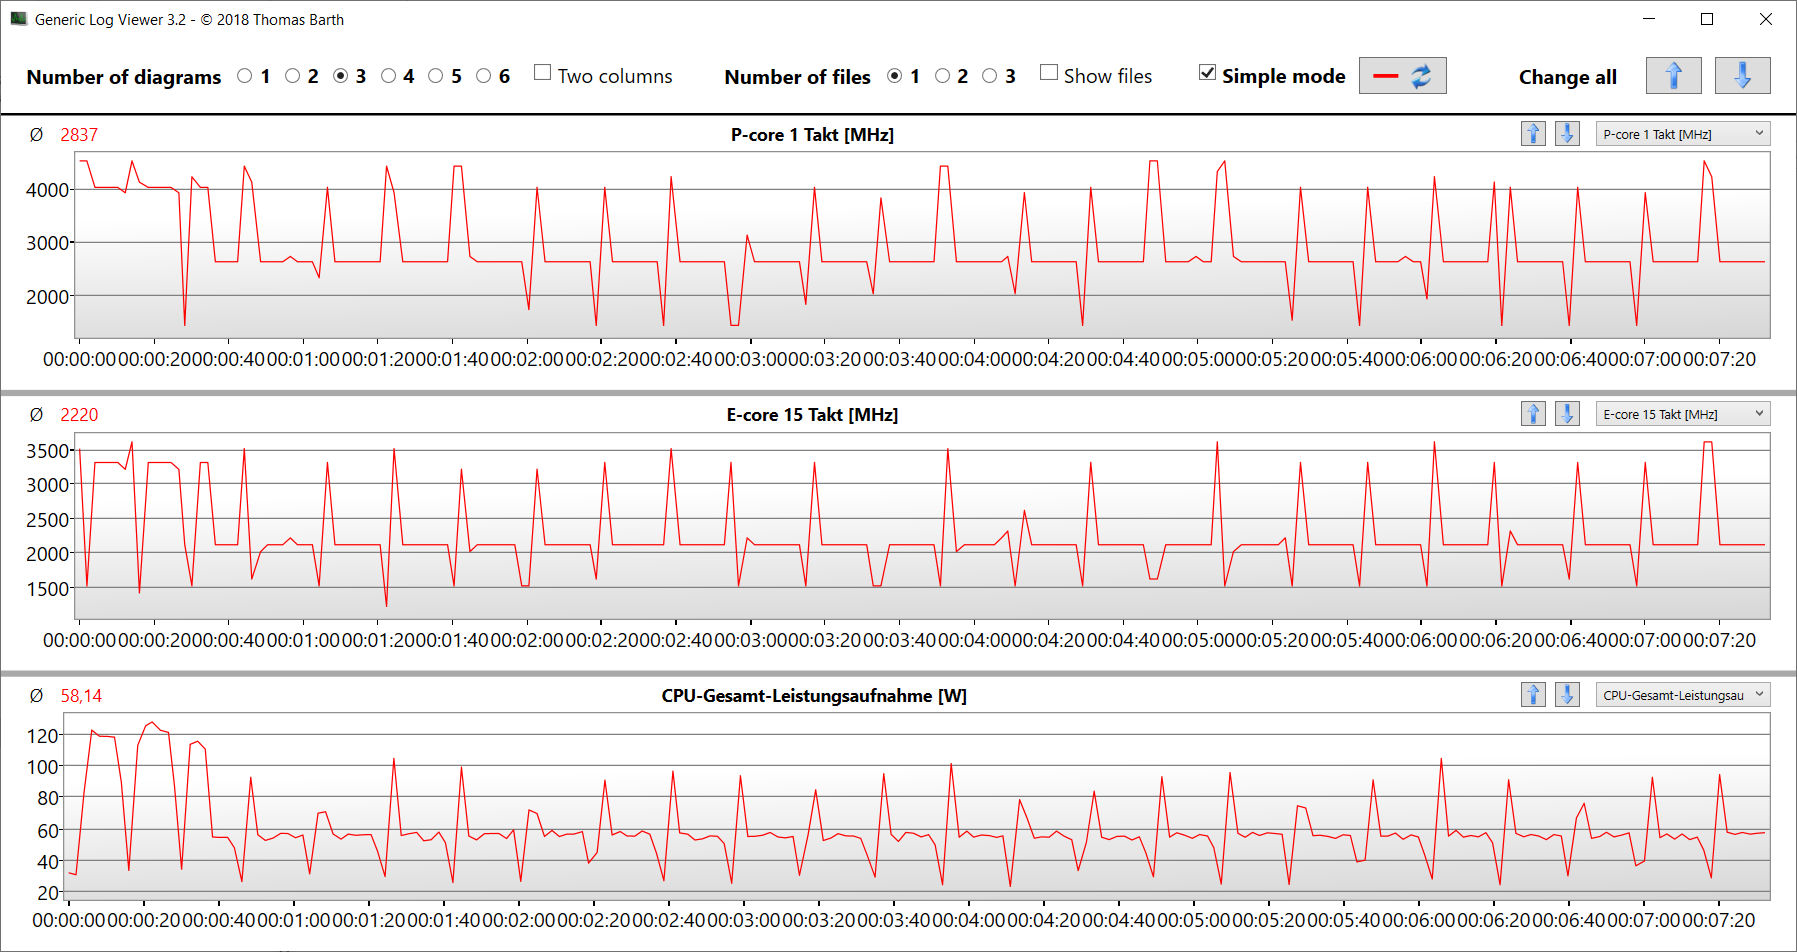
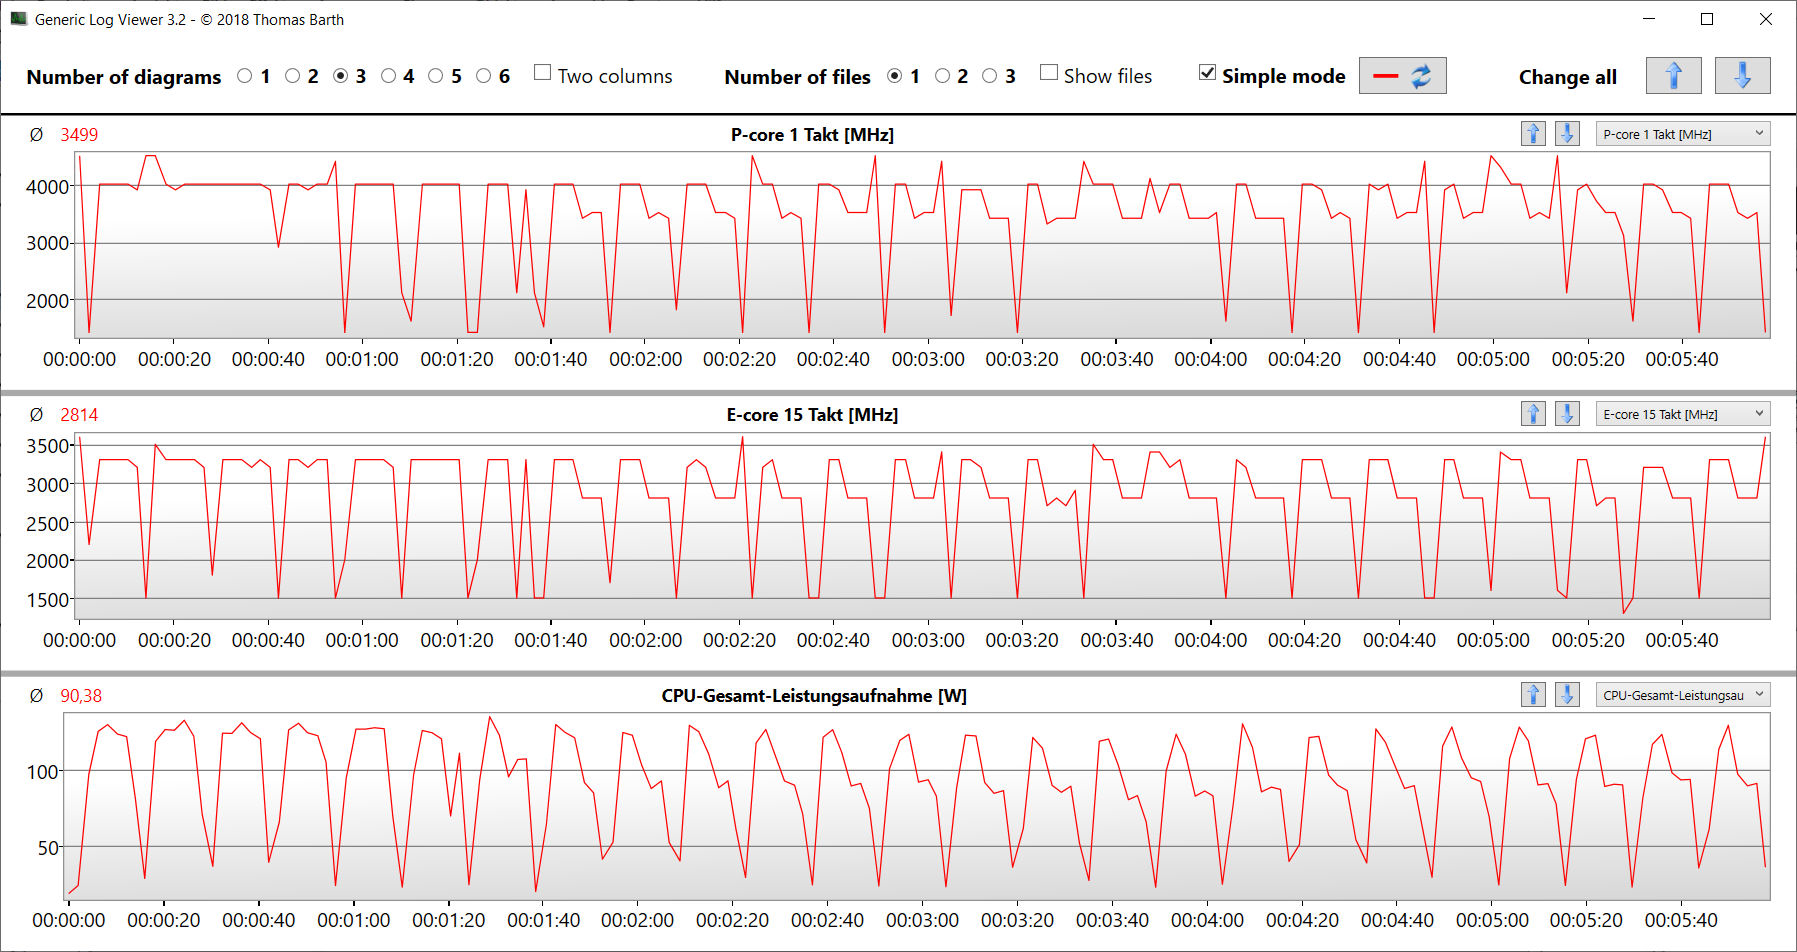
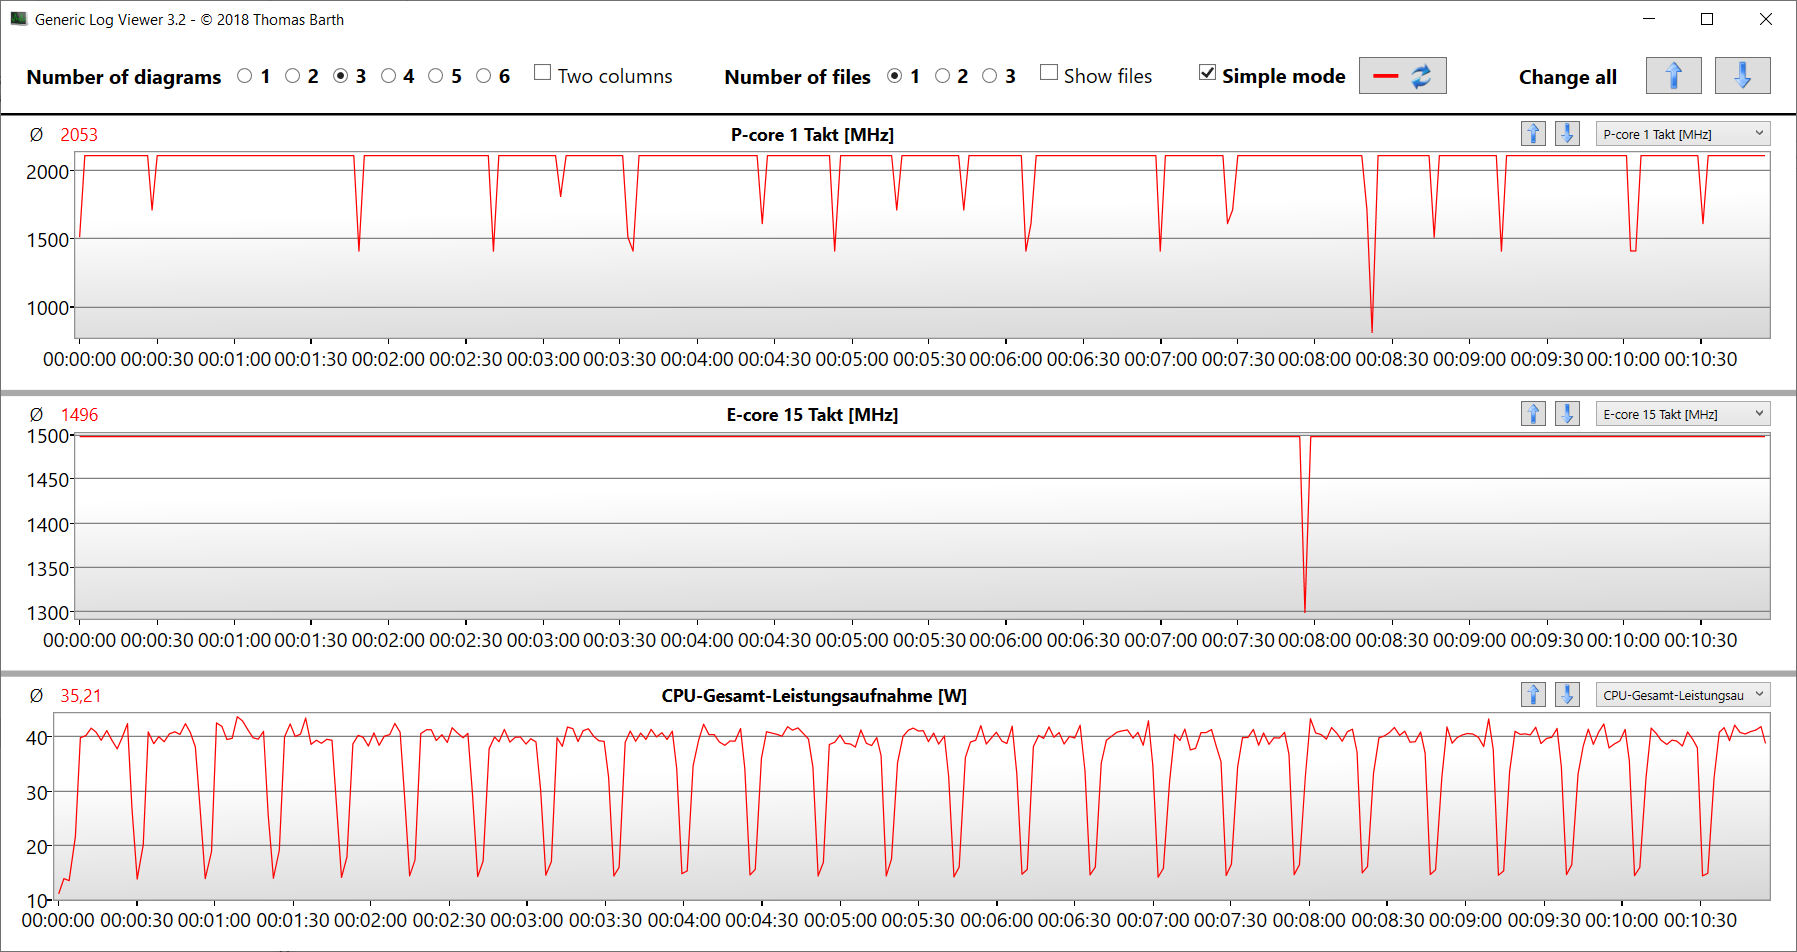
Bu Core i7-14700HX'in (Raptor Lake) 20 CPU çekirdeği (8P + 12E = 28 iş parçacığı) 5,5 GHz (P) ve 3,9 GHz (E) maksimum saat hızlarına ulaşır. Kalıcı çoklu iş parçacığı yükü (CB15 Döngüsü), saat hızının ilk çalıştırmadan dördüncü çalıştırmaya ("Dengeli") kadar düşmesine neden olur. Bundan sonra sabit bir seviyede kalır. "Performans" sürekli olarak daha yüksek bir saat hızıyla sonuçlanır.
Kıyaslama sonuçları biraz hayal kırıklığı yarattı: Dört ek CPU çekirdeği ve daha yüksek saat hızlarına rağmen, CPU kendisini Legion 5 16IRX G9'un Core i7-14650HX ile arasına mesafe koyamadı. Çoklu iş parçacığı performansı hemen hemen aynı iken, tek iş parçacığı performansı söz konusu olduğunda 14650HX açık ara galiptir.
Cinebench R15 Multi continuous test
| CPU Performance Rating - Percent | |
| Lenovo Legion 5 16IRX G9 | |
| Ortalama Intel Core i7-14700HX | |
| HP Victus 16 (2024) | |
| Sınıf ortalaması Gaming | |
| HP Victus 16 (2024) | |
| Dell G16, i7-13650HX, RTX 4060 | |
| Gigabyte G6X 9KG (2024) | |
| Asus TUF Gaming A16 FA617XS -2! | |
| Cinebench R20 | |
| CPU (Multi Core) | |
| Lenovo Legion 5 16IRX G9 | |
| HP Victus 16 (2024) | |
| Ortalama Intel Core i7-14700HX (8361 - 10498, n=7) | |
| HP Victus 16 (2024) (Leistung) | |
| Sınıf ortalaması Gaming (2179 - 15517, n=151, son 2 yıl) | |
| Dell G16, i7-13650HX, RTX 4060 | |
| Gigabyte G6X 9KG (2024) | |
| Asus TUF Gaming A16 FA617XS | |
| CPU (Single Core) | |
| Ortalama Intel Core i7-14700HX (651 - 821, n=7) | |
| Lenovo Legion 5 16IRX G9 | |
| Sınıf ortalaması Gaming (439 - 866, n=151, son 2 yıl) | |
| Dell G16, i7-13650HX, RTX 4060 | |
| Asus TUF Gaming A16 FA617XS | |
| Gigabyte G6X 9KG (2024) | |
| HP Victus 16 (2024) (Leistung) | |
| HP Victus 16 (2024) | |
| Cinebench R15 | |
| CPU Multi 64Bit | |
| HP Victus 16 (2024) | |
| Lenovo Legion 5 16IRX G9 | |
| Ortalama Intel Core i7-14700HX (3328 - 4137, n=7) | |
| HP Victus 16 (2024) (Leistung) | |
| Sınıf ortalaması Gaming (905 - 6074, n=154, son 2 yıl) | |
| Dell G16, i7-13650HX, RTX 4060 | |
| Gigabyte G6X 9KG (2024) | |
| Asus TUF Gaming A16 FA617XS | |
| CPU Single 64Bit | |
| Lenovo Legion 5 16IRX G9 | |
| Asus TUF Gaming A16 FA617XS | |
| Ortalama Intel Core i7-14700HX (238 - 304, n=7) | |
| Sınıf ortalaması Gaming (191.9 - 343, n=151, son 2 yıl) | |
| Dell G16, i7-13650HX, RTX 4060 | |
| Gigabyte G6X 9KG (2024) | |
| HP Victus 16 (2024) (Leistung) | |
| HP Victus 16 (2024) | |
| Blender - v2.79 BMW27 CPU | |
| Gigabyte G6X 9KG (2024) | |
| Asus TUF Gaming A16 FA617XS | |
| Sınıf ortalaması Gaming (81 - 555, n=144, son 2 yıl) | |
| HP Victus 16 (2024) | |
| Dell G16, i7-13650HX, RTX 4060 | |
| Ortalama Intel Core i7-14700HX (126 - 184, n=7) | |
| Lenovo Legion 5 16IRX G9 | |
| HP Victus 16 (2024) (Leistung) | |
| Geekbench 6.4 | |
| Multi-Core | |
| Ortalama Intel Core i7-14700HX (14807 - 17562, n=7) | |
| Lenovo Legion 5 16IRX G9 (6.2.1) | |
| HP Victus 16 (2024) (6.2.1, Leistung) | |
| HP Victus 16 (2024) (6.2.1) | |
| Sınıf ortalaması Gaming (5340 - 21668, n=119, son 2 yıl) | |
| Dell G16, i7-13650HX, RTX 4060 (6.2.1) | |
| Gigabyte G6X 9KG (2024) (6.2.1) | |
| Single-Core | |
| Ortalama Intel Core i7-14700HX (2378 - 2975, n=7) | |
| Lenovo Legion 5 16IRX G9 (6.2.1) | |
| Sınıf ortalaması Gaming (1490 - 3219, n=119, son 2 yıl) | |
| Dell G16, i7-13650HX, RTX 4060 (6.2.1) | |
| Gigabyte G6X 9KG (2024) (6.2.1) | |
| HP Victus 16 (2024) (6.2.1, Leistung) | |
| HP Victus 16 (2024) (6.2.1) | |
| HWBOT x265 Benchmark v2.2 - 4k Preset | |
| HP Victus 16 (2024) (Leistung) | |
| Lenovo Legion 5 16IRX G9 | |
| Ortalama Intel Core i7-14700HX (22 - 27.4, n=7) | |
| Sınıf ortalaması Gaming (6.72 - 42.9, n=148, son 2 yıl) | |
| HP Victus 16 (2024) | |
| Asus TUF Gaming A16 FA617XS | |
| Dell G16, i7-13650HX, RTX 4060 | |
| Gigabyte G6X 9KG (2024) | |
| LibreOffice - 20 Documents To PDF | |
| HP Victus 16 (2024) (6.3.4.2) | |
| Dell G16, i7-13650HX, RTX 4060 (6.3.4.2) | |
| Sınıf ortalaması Gaming (19 - 96.6, n=147, son 2 yıl) | |
| Ortalama Intel Core i7-14700HX (41.9 - 55.3, n=7) | |
| Lenovo Legion 5 16IRX G9 (6.3.4.2) | |
| HP Victus 16 (2024) (6.3.4.2. Leistung) | |
| Asus TUF Gaming A16 FA617XS | |
| Gigabyte G6X 9KG (2024) (6.3.4.2) | |
| R Benchmark 2.5 - Overall mean | |
| HP Victus 16 (2024) | |
| HP Victus 16 (2024) (Leistung) | |
| Sınıf ortalaması Gaming (0.3609 - 0.759, n=150, son 2 yıl) | |
| Gigabyte G6X 9KG (2024) | |
| Asus TUF Gaming A16 FA617XS | |
| Dell G16, i7-13650HX, RTX 4060 | |
| Dell G16, i7-13650HX, RTX 4060 | |
| Lenovo Legion 5 16IRX G9 | |
| Ortalama Intel Core i7-14700HX (0.3821 - 0.4896, n=7) | |
* ... daha küçük daha iyidir
AIDA64: FP32 Ray-Trace | FPU Julia | CPU SHA3 | CPU Queen | FPU SinJulia | FPU Mandel | CPU AES | CPU ZLib | FP64 Ray-Trace | CPU PhotoWorxx
| Performance Rating | |
| HP Victus 16 (2024) | |
| Asus TUF Gaming A16 FA617XS | |
| Ortalama Intel Core i7-14700HX | |
| Sınıf ortalaması Gaming | |
| Lenovo Legion 5 16IRX G9 | |
| Dell G16, i7-13650HX, RTX 4060 | |
| HP Victus 16 (2024) | |
| Gigabyte G6X 9KG (2024) | |
| AIDA64 / FP32 Ray-Trace | |
| Asus TUF Gaming A16 FA617XS (v6.75.6100) | |
| Sınıf ortalaması Gaming (4986 - 81639, n=147, son 2 yıl) | |
| HP Victus 16 (2024) (v6.92.6600, Leistung) | |
| Ortalama Intel Core i7-14700HX (16932 - 23676, n=7) | |
| Lenovo Legion 5 16IRX G9 (v6.92.6600) | |
| Dell G16, i7-13650HX, RTX 4060 (v6.92.6600) | |
| HP Victus 16 (2024) (v6.92.6600) | |
| Gigabyte G6X 9KG (2024) (v6.92.6600) | |
| AIDA64 / FPU Julia | |
| Asus TUF Gaming A16 FA617XS (v6.75.6100) | |
| HP Victus 16 (2024) (v6.92.6600, Leistung) | |
| Ortalama Intel Core i7-14700HX (86338 - 116556, n=7) | |
| Sınıf ortalaması Gaming (25360 - 252486, n=147, son 2 yıl) | |
| Lenovo Legion 5 16IRX G9 (v6.92.6600) | |
| Dell G16, i7-13650HX, RTX 4060 (v6.92.6600) | |
| HP Victus 16 (2024) (v6.92.6600) | |
| Gigabyte G6X 9KG (2024) (v6.92.6600) | |
| AIDA64 / CPU SHA3 | |
| HP Victus 16 (2024) (v6.92.6600, Leistung) | |
| Ortalama Intel Core i7-14700HX (4008 - 5567, n=7) | |
| Sınıf ortalaması Gaming (1339 - 10389, n=147, son 2 yıl) | |
| Asus TUF Gaming A16 FA617XS (v6.75.6100) | |
| Dell G16, i7-13650HX, RTX 4060 (v6.92.6600) | |
| Lenovo Legion 5 16IRX G9 (v6.92.6600) | |
| HP Victus 16 (2024) (v6.92.6600) | |
| Gigabyte G6X 9KG (2024) (v6.92.6600) | |
| AIDA64 / CPU Queen | |
| Ortalama Intel Core i7-14700HX (129836 - 152200, n=7) | |
| HP Victus 16 (2024) (v6.92.6600, Leistung) | |
| HP Victus 16 (2024) (v6.92.6600) | |
| Asus TUF Gaming A16 FA617XS (v6.75.6100) | |
| Sınıf ortalaması Gaming (50699 - 200651, n=147, son 2 yıl) | |
| Gigabyte G6X 9KG (2024) (v6.92.6600) | |
| Dell G16, i7-13650HX, RTX 4060 (v6.92.6600) | |
| Lenovo Legion 5 16IRX G9 (v6.92.6600) | |
| AIDA64 / FPU SinJulia | |
| Asus TUF Gaming A16 FA617XS (v6.75.6100) | |
| Ortalama Intel Core i7-14700HX (11704 - 14434, n=7) | |
| Sınıf ortalaması Gaming (4800 - 32988, n=147, son 2 yıl) | |
| HP Victus 16 (2024) (v6.92.6600, Leistung) | |
| Lenovo Legion 5 16IRX G9 (v6.92.6600) | |
| HP Victus 16 (2024) (v6.92.6600) | |
| Dell G16, i7-13650HX, RTX 4060 (v6.92.6600) | |
| Gigabyte G6X 9KG (2024) (v6.92.6600) | |
| AIDA64 / FPU Mandel | |
| Asus TUF Gaming A16 FA617XS (v6.75.6100) | |
| Sınıf ortalaması Gaming (12321 - 134044, n=147, son 2 yıl) | |
| HP Victus 16 (2024) (v6.92.6600, Leistung) | |
| Ortalama Intel Core i7-14700HX (42125 - 58380, n=7) | |
| Lenovo Legion 5 16IRX G9 (v6.92.6600) | |
| Dell G16, i7-13650HX, RTX 4060 (v6.92.6600) | |
| HP Victus 16 (2024) (v6.92.6600) | |
| Gigabyte G6X 9KG (2024) (v6.92.6600) | |
| AIDA64 / CPU AES | |
| HP Victus 16 (2024) (v6.92.6600, Leistung) | |
| Sınıf ortalaması Gaming (19065 - 328679, n=147, son 2 yıl) | |
| Ortalama Intel Core i7-14700HX (82161 - 113157, n=7) | |
| Lenovo Legion 5 16IRX G9 (v6.92.6600) | |
| Asus TUF Gaming A16 FA617XS (v6.75.6100) | |
| Dell G16, i7-13650HX, RTX 4060 (v6.92.6600) | |
| HP Victus 16 (2024) (v6.92.6600) | |
| Gigabyte G6X 9KG (2024) (v6.92.6600) | |
| AIDA64 / CPU ZLib | |
| HP Victus 16 (2024) (v6.92.6600, Leistung) | |
| Ortalama Intel Core i7-14700HX (1177 - 1682, n=7) | |
| Sınıf ortalaması Gaming (373 - 2531, n=147, son 2 yıl) | |
| Lenovo Legion 5 16IRX G9 (v6.92.6600) | |
| Dell G16, i7-13650HX, RTX 4060 (v6.92.6600) | |
| HP Victus 16 (2024) (v6.92.6600) | |
| Gigabyte G6X 9KG (2024) (v6.92.6600) | |
| Asus TUF Gaming A16 FA617XS (v6.75.6100) | |
| AIDA64 / FP64 Ray-Trace | |
| Asus TUF Gaming A16 FA617XS (v6.75.6100) | |
| Sınıf ortalaması Gaming (2540 - 43430, n=147, son 2 yıl) | |
| Ortalama Intel Core i7-14700HX (9029 - 12928, n=7) | |
| HP Victus 16 (2024) (v6.92.6600, Leistung) | |
| Dell G16, i7-13650HX, RTX 4060 (v6.92.6600) | |
| Lenovo Legion 5 16IRX G9 (v6.92.6600) | |
| HP Victus 16 (2024) (v6.92.6600) | |
| Gigabyte G6X 9KG (2024) (v6.92.6600) | |
| AIDA64 / CPU PhotoWorxx | |
| Ortalama Intel Core i7-14700HX (39151 - 49671, n=7) | |
| Sınıf ortalaması Gaming (10805 - 60161, n=147, son 2 yıl) | |
| HP Victus 16 (2024) (v6.92.6600) | |
| HP Victus 16 (2024) (v6.92.6600, Leistung) | |
| Gigabyte G6X 9KG (2024) (v6.92.6600) | |
| Dell G16, i7-13650HX, RTX 4060 (v6.92.6600) | |
| Lenovo Legion 5 16IRX G9 (v6.92.6600) | |
| Asus TUF Gaming A16 FA617XS (v6.75.6100) | |
Sistem performansı
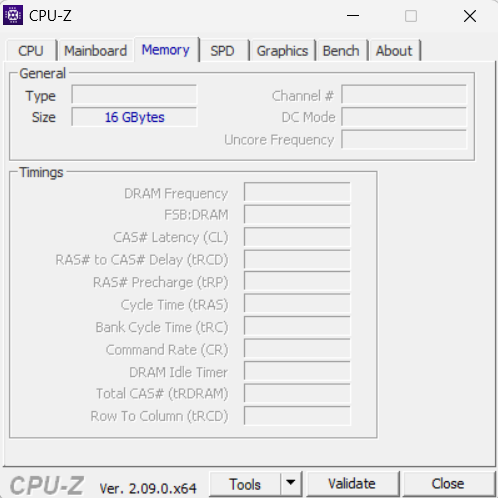
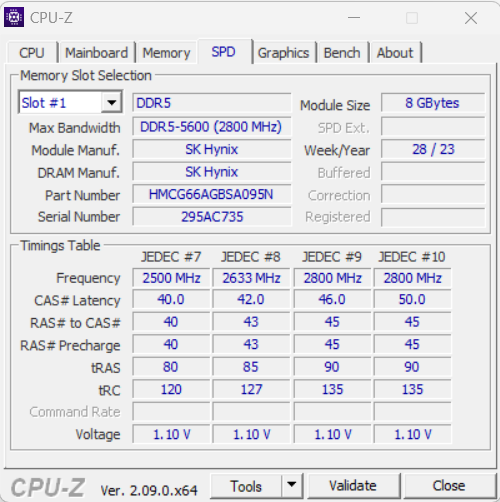
Sorunsuz çalışan sistem, oyun, render ve akış gibi zorlu uygulamalar için yeterli performans sağlar. RAM'in aktarım hızları DDR5-5600 RAM için normal seviyede.
CrossMark: Overall | Productivity | Creativity | Responsiveness
WebXPRT 3: Overall
WebXPRT 4: Overall
Mozilla Kraken 1.1: Total
| PCMark 10 / Score | |
| Asus TUF Gaming A16 FA617XS | |
| Ortalama Intel Core i7-14700HX, NVIDIA GeForce RTX 4060 Laptop GPU (7528 - 8278, n=2) | |
| Sınıf ortalaması Gaming (5776 - 9852, n=133, son 2 yıl) | |
| Lenovo Legion 5 16IRX G9 | |
| Gigabyte G6X 9KG (2024) | |
| HP Victus 16 (2024) | |
| Dell G16, i7-13650HX, RTX 4060 | |
| PCMark 10 / Essentials | |
| Ortalama Intel Core i7-14700HX, NVIDIA GeForce RTX 4060 Laptop GPU (10778 - 11087, n=2) | |
| Asus TUF Gaming A16 FA617XS | |
| Lenovo Legion 5 16IRX G9 | |
| HP Victus 16 (2024) | |
| Sınıf ortalaması Gaming (9057 - 12600, n=133, son 2 yıl) | |
| Gigabyte G6X 9KG (2024) | |
| Dell G16, i7-13650HX, RTX 4060 | |
| PCMark 10 / Productivity | |
| Asus TUF Gaming A16 FA617XS | |
| Gigabyte G6X 9KG (2024) | |
| Dell G16, i7-13650HX, RTX 4060 | |
| HP Victus 16 (2024) | |
| Sınıf ortalaması Gaming (6662 - 14612, n=133, son 2 yıl) | |
| Ortalama Intel Core i7-14700HX, NVIDIA GeForce RTX 4060 Laptop GPU (9823 - 9910, n=2) | |
| Lenovo Legion 5 16IRX G9 | |
| PCMark 10 / Digital Content Creation | |
| Ortalama Intel Core i7-14700HX, NVIDIA GeForce RTX 4060 Laptop GPU (10841 - 14135, n=2) | |
| Sınıf ortalaması Gaming (6807 - 18475, n=133, son 2 yıl) | |
| Lenovo Legion 5 16IRX G9 | |
| Asus TUF Gaming A16 FA617XS | |
| Dell G16, i7-13650HX, RTX 4060 | |
| Gigabyte G6X 9KG (2024) | |
| HP Victus 16 (2024) | |
| CrossMark / Overall | |
| Lenovo Legion 5 16IRX G9 | |
| Ortalama Intel Core i7-14700HX, NVIDIA GeForce RTX 4060 Laptop GPU (1923 - 2132, n=2) | |
| Gigabyte G6X 9KG (2024) | |
| HP Victus 16 (2024) | |
| Sınıf ortalaması Gaming (1247 - 2344, n=114, son 2 yıl) | |
| Dell G16, i7-13650HX, RTX 4060 | |
| Asus TUF Gaming A16 FA617XS | |
| CrossMark / Productivity | |
| Lenovo Legion 5 16IRX G9 | |
| Ortalama Intel Core i7-14700HX, NVIDIA GeForce RTX 4060 Laptop GPU (1782 - 1973, n=2) | |
| Gigabyte G6X 9KG (2024) | |
| Sınıf ortalaması Gaming (1299 - 2204, n=114, son 2 yıl) | |
| HP Victus 16 (2024) | |
| Dell G16, i7-13650HX, RTX 4060 | |
| Asus TUF Gaming A16 FA617XS | |
| CrossMark / Creativity | |
| Lenovo Legion 5 16IRX G9 | |
| Ortalama Intel Core i7-14700HX, NVIDIA GeForce RTX 4060 Laptop GPU (2107 - 2399, n=2) | |
| HP Victus 16 (2024) | |
| Sınıf ortalaması Gaming (1275 - 2660, n=114, son 2 yıl) | |
| Gigabyte G6X 9KG (2024) | |
| Dell G16, i7-13650HX, RTX 4060 | |
| Asus TUF Gaming A16 FA617XS | |
| CrossMark / Responsiveness | |
| Gigabyte G6X 9KG (2024) | |
| Lenovo Legion 5 16IRX G9 | |
| Ortalama Intel Core i7-14700HX, NVIDIA GeForce RTX 4060 Laptop GPU (1835 - 1885, n=2) | |
| HP Victus 16 (2024) | |
| Sınıf ortalaması Gaming (1030 - 2330, n=114, son 2 yıl) | |
| Dell G16, i7-13650HX, RTX 4060 | |
| Asus TUF Gaming A16 FA617XS | |
| WebXPRT 3 / Overall | |
| Lenovo Legion 5 16IRX G9 | |
| Gigabyte G6X 9KG (2024) | |
| Sınıf ortalaması Gaming (215 - 480, n=127, son 2 yıl) | |
| Ortalama Intel Core i7-14700HX, NVIDIA GeForce RTX 4060 Laptop GPU (276 - 301, n=2) | |
| HP Victus 16 (2024) | |
| Dell G16, i7-13650HX, RTX 4060 | |
| WebXPRT 4 / Overall | |
| Lenovo Legion 5 16IRX G9 | |
| Sınıf ortalaması Gaming (176.4 - 335, n=115, son 2 yıl) | |
| Asus TUF Gaming A16 FA617XS | |
| Ortalama Intel Core i7-14700HX, NVIDIA GeForce RTX 4060 Laptop GPU (251 - 273, n=2) | |
| Gigabyte G6X 9KG (2024) | |
| HP Victus 16 (2024) | |
| Mozilla Kraken 1.1 / Total | |
| HP Victus 16 (2024) | |
| Gigabyte G6X 9KG (2024) | |
| Dell G16, i7-13650HX, RTX 4060 | |
| Ortalama Intel Core i7-14700HX, NVIDIA GeForce RTX 4060 Laptop GPU (467 - 542, n=2) | |
| Asus TUF Gaming A16 FA617XS | |
| Sınıf ortalaması Gaming (409 - 674, n=139, son 2 yıl) | |
| Lenovo Legion 5 16IRX G9 | |
* ... daha küçük daha iyidir
| PCMark 10 Score | 7528 puan | |
Yardım | ||
| AIDA64 / Memory Copy | |
| Ortalama Intel Core i7-14700HX (63949 - 78742, n=7) | |
| HP Victus 16 (2024) | |
| Sınıf ortalaması Gaming (21750 - 97515, n=147, son 2 yıl) | |
| Gigabyte G6X 9KG (2024) | |
| Lenovo Legion 5 16IRX G9 | |
| Asus TUF Gaming A16 FA617XS | |
| Dell G16, i7-13650HX, RTX 4060 | |
| AIDA64 / Memory Read | |
| Ortalama Intel Core i7-14700HX (68593 - 86175, n=7) | |
| HP Victus 16 (2024) | |
| Lenovo Legion 5 16IRX G9 | |
| Sınıf ortalaması Gaming (22956 - 102937, n=147, son 2 yıl) | |
| Gigabyte G6X 9KG (2024) | |
| Dell G16, i7-13650HX, RTX 4060 | |
| Asus TUF Gaming A16 FA617XS | |
| AIDA64 / Memory Write | |
| Asus TUF Gaming A16 FA617XS | |
| Ortalama Intel Core i7-14700HX (64033 - 76689, n=7) | |
| Sınıf ortalaması Gaming (22297 - 108954, n=147, son 2 yıl) | |
| HP Victus 16 (2024) | |
| Gigabyte G6X 9KG (2024) | |
| Dell G16, i7-13650HX, RTX 4060 | |
| Lenovo Legion 5 16IRX G9 | |
| AIDA64 / Memory Latency | |
| HP Victus 16 (2024) | |
| Sınıf ortalaması Gaming (59.5 - 259, n=147, son 2 yıl) | |
| Dell G16, i7-13650HX, RTX 4060 | |
| Asus TUF Gaming A16 FA617XS | |
| Gigabyte G6X 9KG (2024) | |
| Lenovo Legion 5 16IRX G9 | |
| Ortalama Intel Core i7-14700HX (82.7 - 96.4, n=7) | |
* ... daha küçük daha iyidir
DPC gecikme süreleri
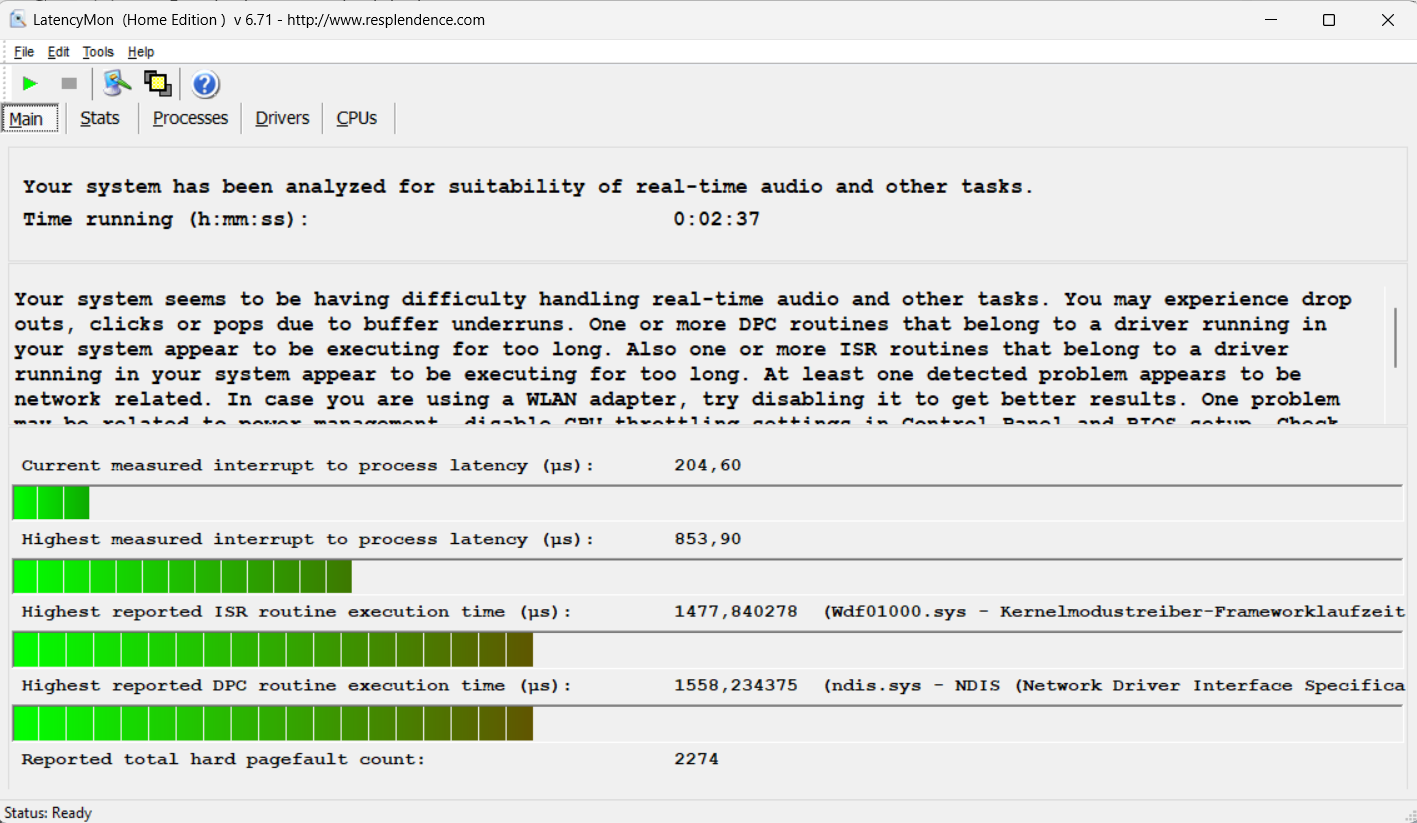
Dizüstü bilgisayarın gecikme sürelerini kontrol etmek (web'de gezinme, 4k video oynatma, Prime95 yüksek yük) bazı anormallikler ortaya çıkardı. Mevcut donanım-yazılım kombinasyonu gerçek zamanlı video ve ses düzenleme için uygun görünmüyor. Gelecekteki yazılım güncellemeleri değişikliklere yol açabilir.
| DPC Latencies / LatencyMon - interrupt to process latency (max), Web, Youtube, Prime95 | |
| Gigabyte G6X 9KG (2024) | |
| Lenovo Legion 5 16IRX G9 | |
| Asus TUF Gaming A16 FA617XS | |
| Dell G16, i7-13650HX, RTX 4060 | |
| HP Victus 16 (2024) | |
* ... daha küçük daha iyidir
Depolama cihazları
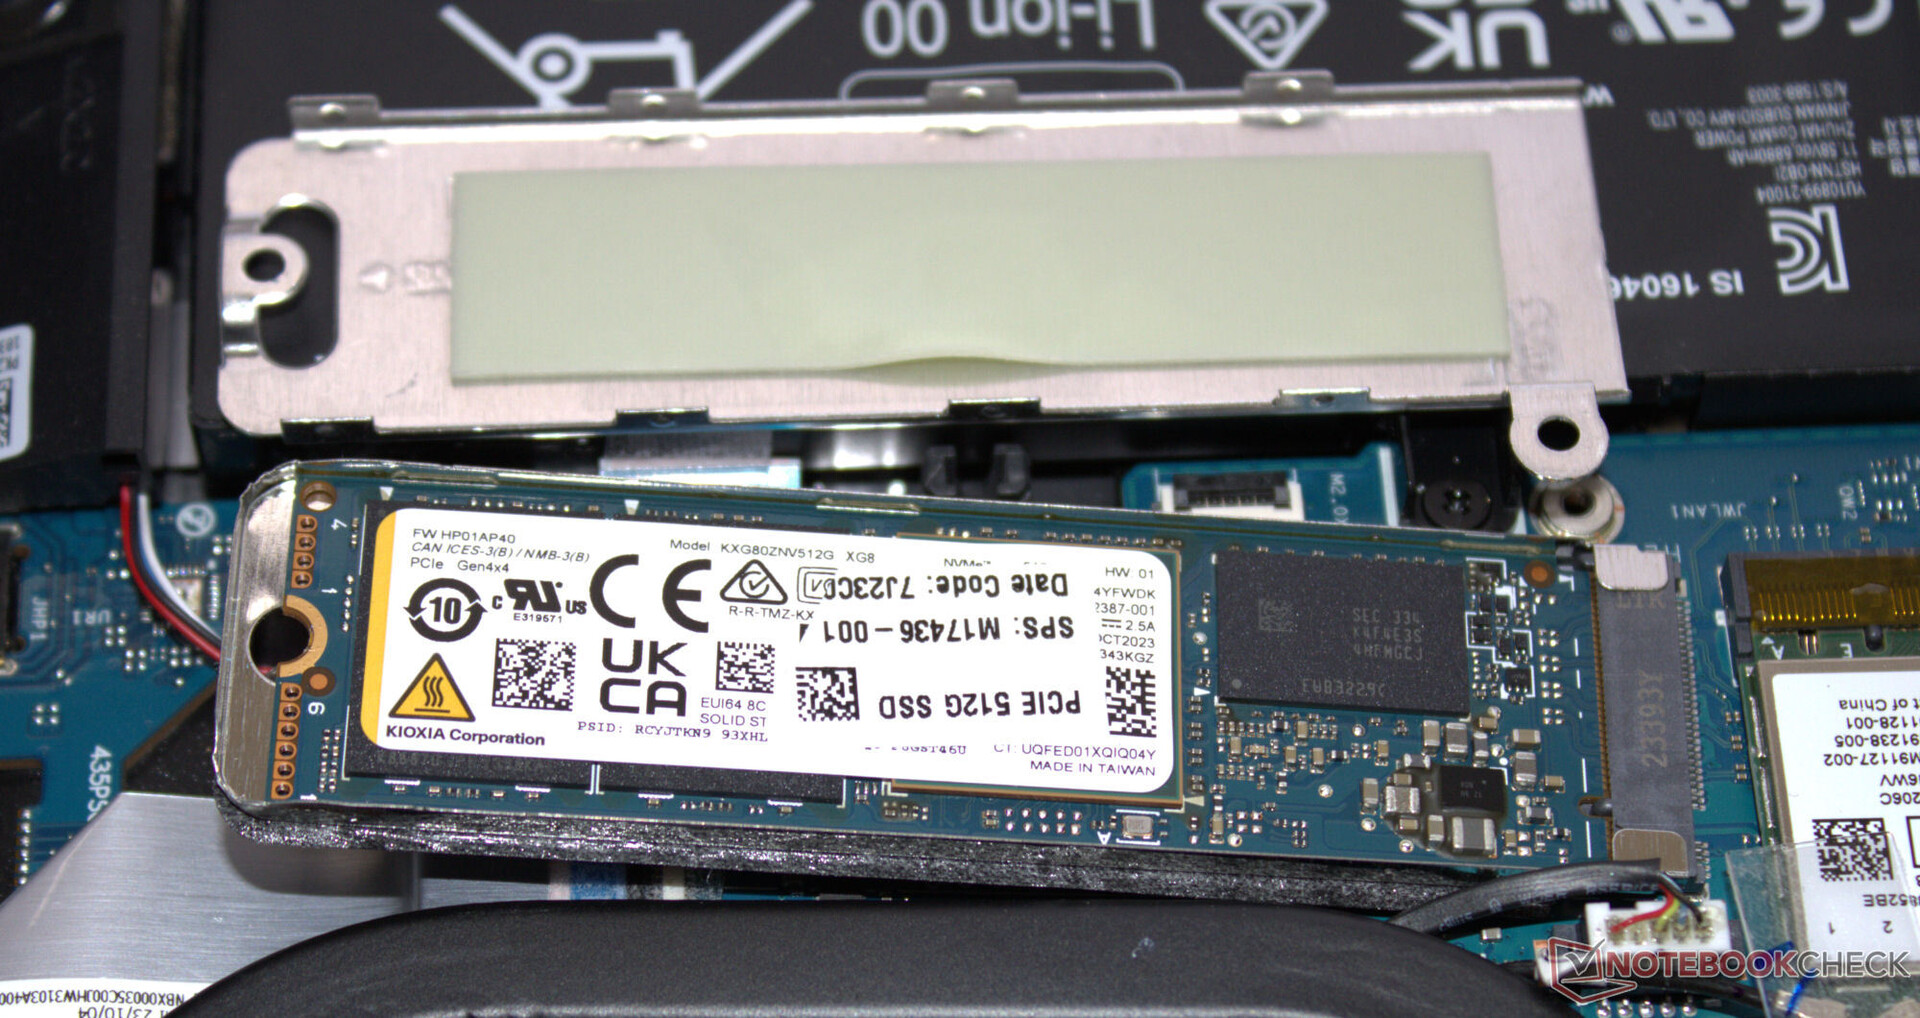
Kioxia'nın PCIe 4 SSD'si (M.2-2280) 512 GB kapasiteye sahiptir ve iyi aktarım hızları sunar. DiskSpd döngüsü sırasında veri hızları, termal azaltmanın bir sonucu olarak adım adım daha düşük bir seviyeye indi. Dizüstü bilgisayarda ikinci bir SSD için yer vardır.

* ... daha küçük daha iyidir
Reading continuous performance: DiskSpd Read Loop, Queue Depth 8
Grafik kartı
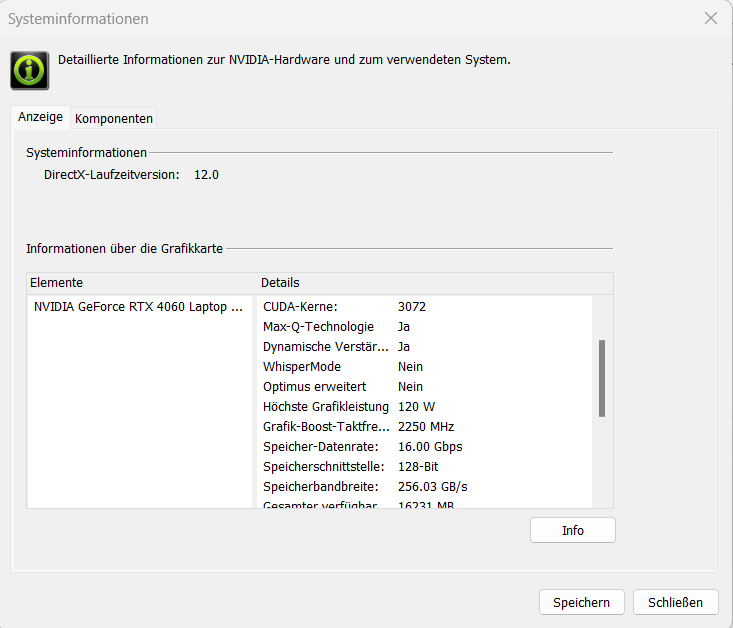
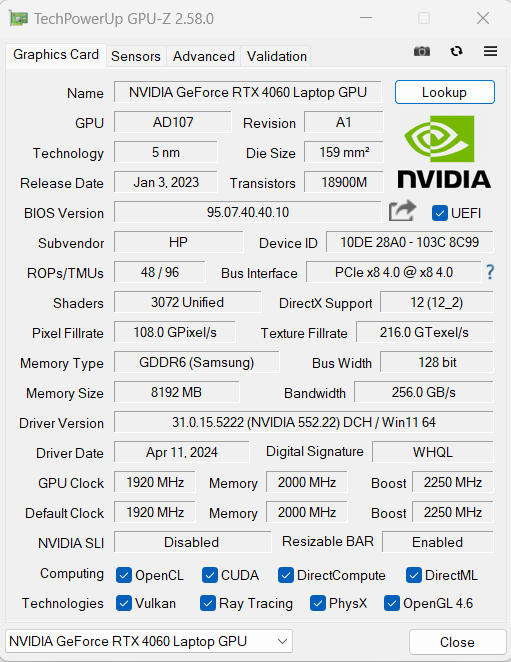
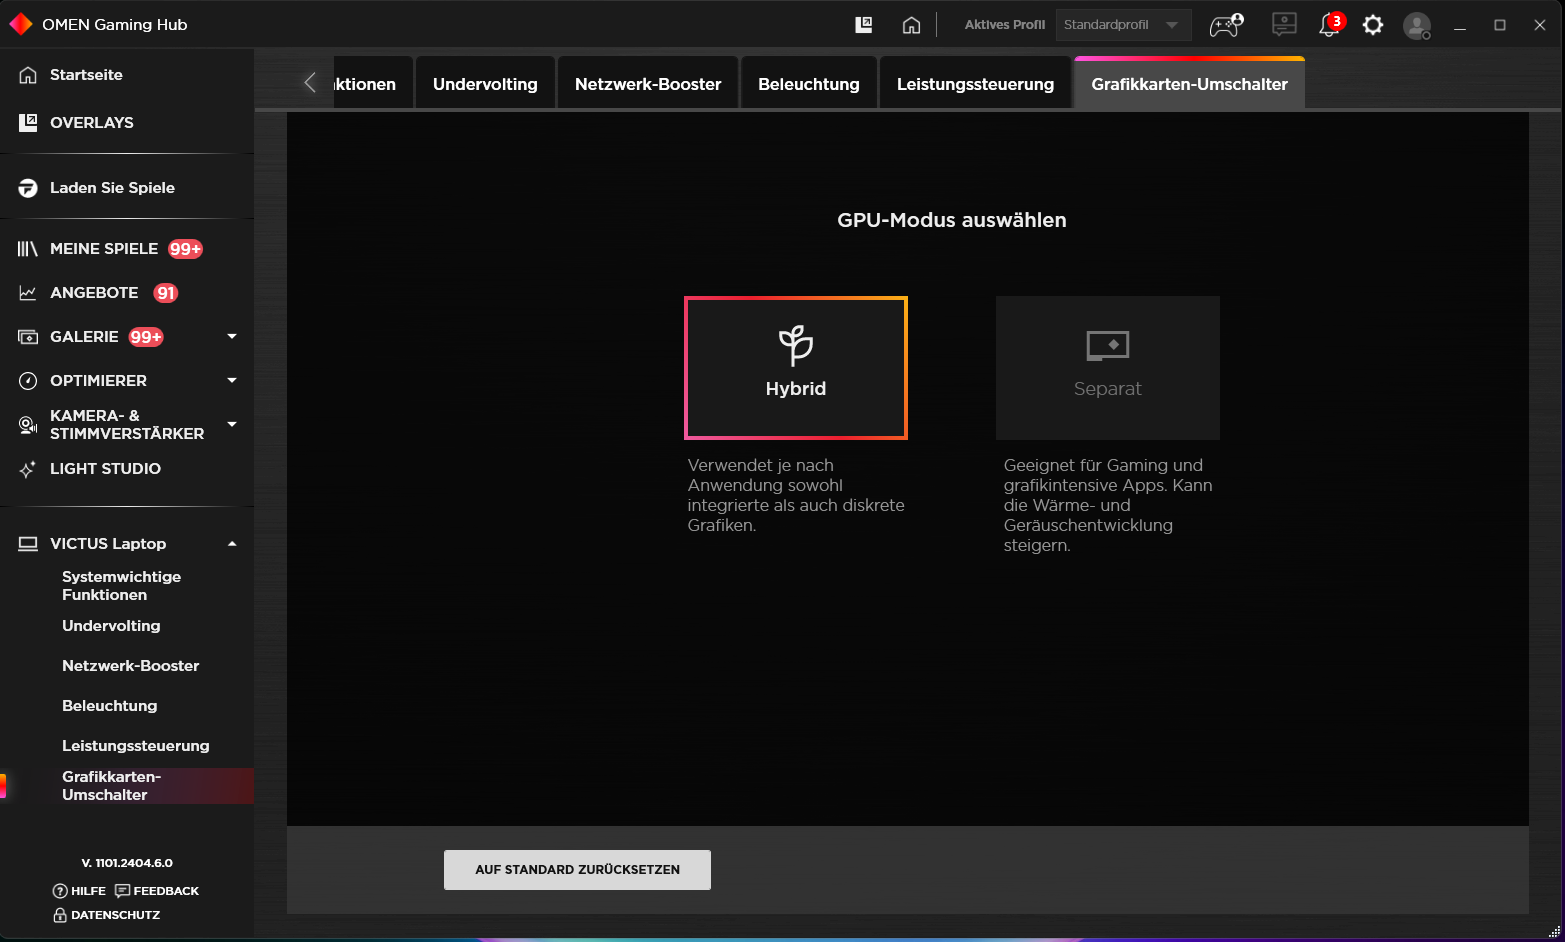
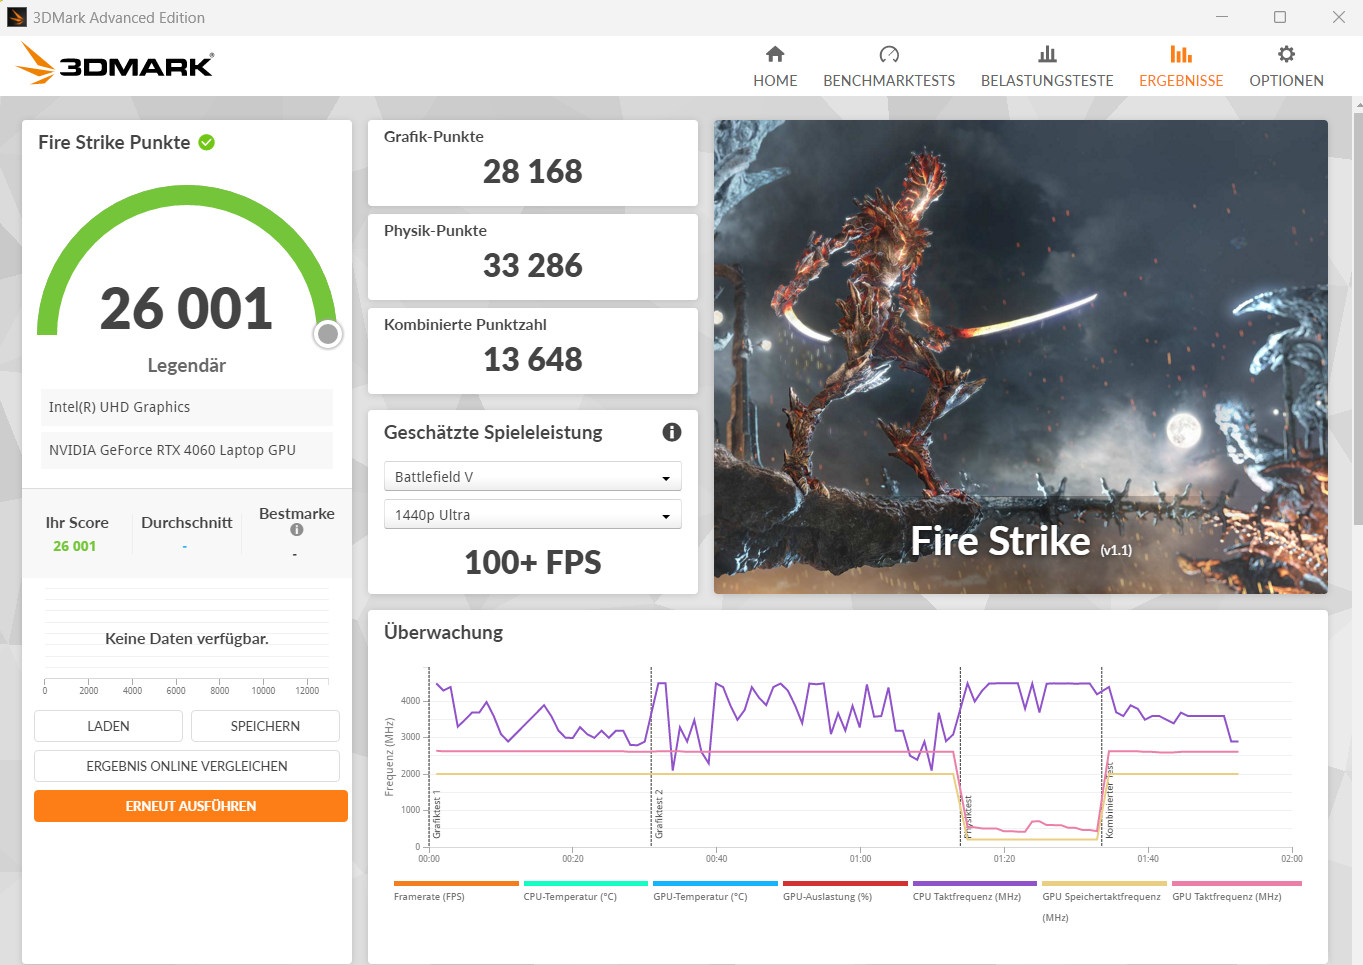
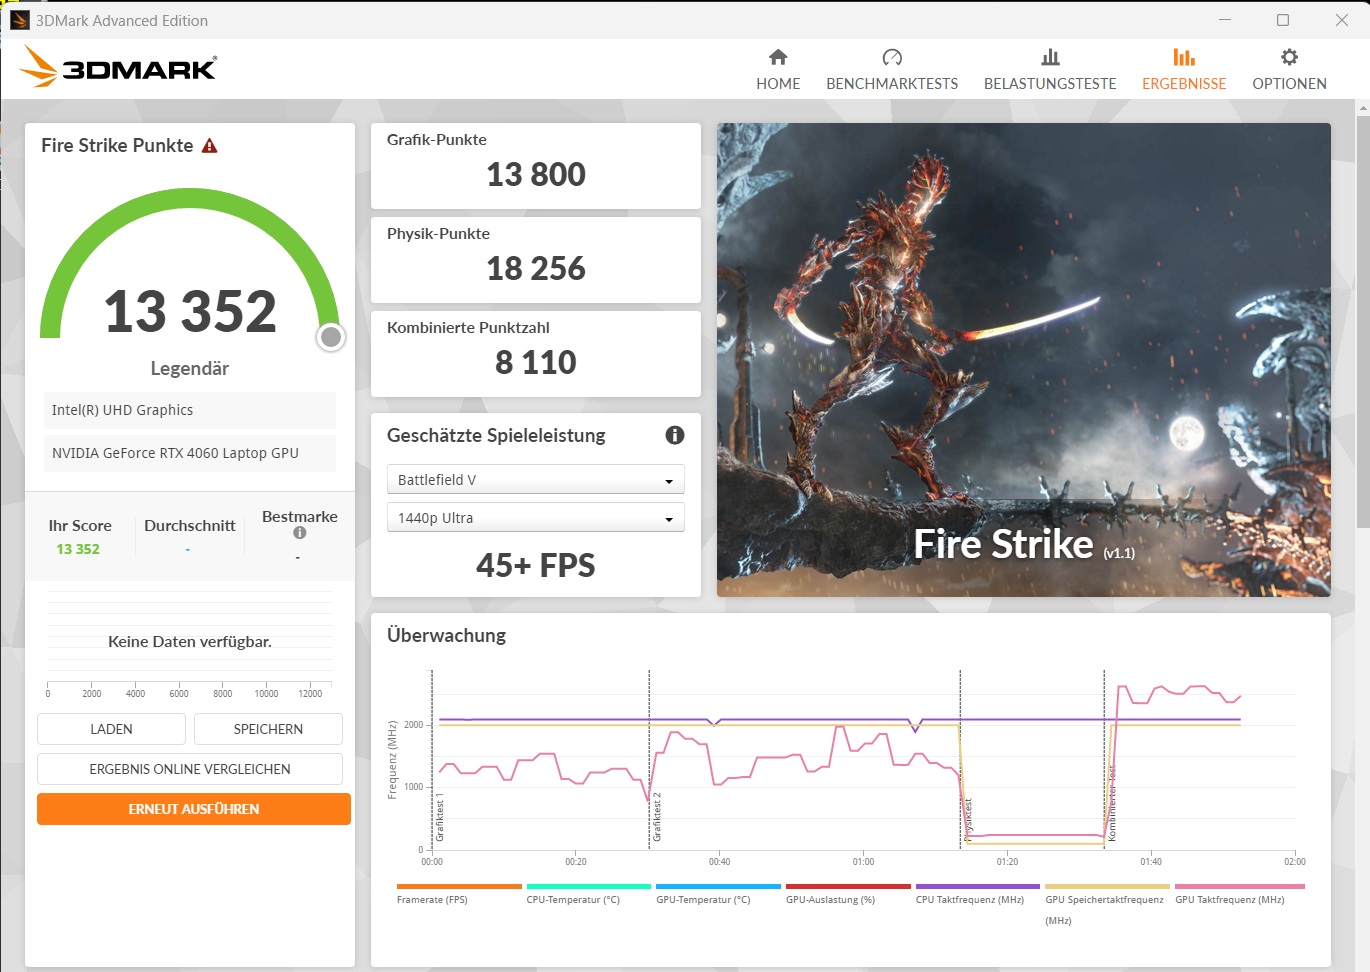
Orta sınıf GeForce RTX 4060 GPU (3.072 gölgelendirici, 128 bit veri yolu, 8 GB GDDR6, 120 watt) yüksek ila maksimum ayarları kullanarak FHD oyun oynamaya izin verir. Karşılaştırma değerleri ve kare hızları RTX 4060'ın ortalamasının ("Dengeli") biraz üzerinde geldi. "Performans" profili küçük bir avantaj sağladı. Gelişmiş Optimus desteklenmiyor. Bu da dGPU ve Optimus arasında geçiş yapmak için yeniden başlatma gerektiği anlamına geliyor.


| 3DMark Performance Rating - Percent | |
| Sınıf ortalaması Gaming | |
| Lenovo Legion 5 16IRX G9 | |
| HP Victus 16 (2024) | |
| Dell G16, i7-13650HX, RTX 4060 | |
| Gigabyte G6X 9KG (2024) | |
| HP Victus 16 (2024) | |
| Ortalama NVIDIA GeForce RTX 4060 Laptop GPU | |
| Asus TUF Gaming A16 FA617XS | |
| 3DMark 11 - 1280x720 Performance GPU | |
| Sınıf ortalaması Gaming (10741 - 72178, n=143, son 2 yıl) | |
| Lenovo Legion 5 16IRX G9 | |
| HP Victus 16 (2024) (Leistung) | |
| Dell G16, i7-13650HX, RTX 4060 | |
| Gigabyte G6X 9KG (2024) | |
| HP Victus 16 (2024) | |
| Ortalama NVIDIA GeForce RTX 4060 Laptop GPU (28136 - 38912, n=57) | |
| Asus TUF Gaming A16 FA617XS | |
| 3DMark | |
| 1920x1080 Fire Strike Graphics | |
| Sınıf ortalaması Gaming (2913 - 56116, n=155, son 2 yıl) | |
| HP Victus 16 (2024) (Leistung) | |
| Lenovo Legion 5 16IRX G9 | |
| Gigabyte G6X 9KG (2024) | |
| Dell G16, i7-13650HX, RTX 4060 | |
| HP Victus 16 (2024) | |
| Asus TUF Gaming A16 FA617XS | |
| Ortalama NVIDIA GeForce RTX 4060 Laptop GPU (20533 - 29656, n=54) | |
| 2560x1440 Time Spy Graphics | |
| Sınıf ortalaması Gaming (2295 - 24599, n=151, son 2 yıl) | |
| Lenovo Legion 5 16IRX G9 | |
| HP Victus 16 (2024) (Leistung) | |
| Dell G16, i7-13650HX, RTX 4060 | |
| Ortalama NVIDIA GeForce RTX 4060 Laptop GPU (7484 - 11451, n=56) | |
| HP Victus 16 (2024) | |
| Gigabyte G6X 9KG (2024) | |
| Asus TUF Gaming A16 FA617XS | |
| 3DMark 11 Performance | 30439 puan | |
| 3DMark Fire Strike Score | 24569 puan | |
| 3DMark Time Spy Score | 10542 puan | |
Yardım | ||
| Blender | |
| v3.3 Classroom OPTIX/RTX | |
| Dell G16, i7-13650HX, RTX 4060 (3.3.3) | |
| Lenovo Legion 5 16IRX G9 (3.3.3) | |
| Ortalama NVIDIA GeForce RTX 4060 Laptop GPU (19 - 28, n=53) | |
| HP Victus 16 (2024) (3.3.3) | |
| Sınıf ortalaması Gaming (10 - 95, n=143, son 2 yıl) | |
| HP Victus 16 (2024) (3.3.3, Leistung) | |
| Gigabyte G6X 9KG (2024) (3.3.3) | |
| v3.3 Classroom CUDA | |
| Dell G16, i7-13650HX, RTX 4060 (3.3.3) | |
| Ortalama NVIDIA GeForce RTX 4060 Laptop GPU (39 - 53, n=53) | |
| Lenovo Legion 5 16IRX G9 (3.3.3) | |
| HP Victus 16 (2024) (3.3.3) | |
| HP Victus 16 (2024) (3.3.3, Leistung) | |
| Gigabyte G6X 9KG (2024) (3.3.3) | |
| Sınıf ortalaması Gaming (16 - 175, n=145, son 2 yıl) | |
| v3.3 Classroom CPU | |
| Gigabyte G6X 9KG (2024) (3.3.3) | |
| HP Victus 16 (2024) (3.3.3) | |
| Ortalama NVIDIA GeForce RTX 4060 Laptop GPU (189 - 452, n=53) | |
| Sınıf ortalaması Gaming (123 - 962, n=150, son 2 yıl) | |
| Asus TUF Gaming A16 FA617XS (3.3.3) | |
| Dell G16, i7-13650HX, RTX 4060 (3.3.3) | |
| Lenovo Legion 5 16IRX G9 (3.3.3) | |
| HP Victus 16 (2024) (3.3.3, Leistung) | |
| Geekbench 5.5 | |
| OpenCL Score | |
| Sınıf ortalaması Gaming (5039 - 270235, n=150, son 2 yıl) | |
| HP Victus 16 (2024) (Leistung) | |
| Gigabyte G6X 9KG (2024) | |
| Dell G16, i7-13650HX, RTX 4060 | |
| HP Victus 16 (2024) | |
| Ortalama NVIDIA GeForce RTX 4060 Laptop GPU (5039 - 112238, n=53) | |
| Asus TUF Gaming A16 FA617XS | |
| Lenovo Legion 5 16IRX G9 | |
| Vulkan Score 5.5 | |
| HP Victus 16 (2024) (Leistung) | |
| Sınıf ortalaması Gaming (9296 - 176078, n=103, son 2 yıl) | |
| Ortalama NVIDIA GeForce RTX 4060 Laptop GPU (28838 - 87612, n=31) | |
| HP Victus 16 (2024) | |
| Gigabyte G6X 9KG (2024) | |
| Asus TUF Gaming A16 FA617XS | |
| Geekbench 6.4 | |
| GPU OpenCL | |
| Sınıf ortalaması Gaming (4321 - 234213, n=118, son 2 yıl) | |
| Gigabyte G6X 9KG (2024) (6.2.1) | |
| HP Victus 16 (2024) (6.2.1) | |
| Dell G16, i7-13650HX, RTX 4060 (6.2.1) | |
| Ortalama NVIDIA GeForce RTX 4060 Laptop GPU (4321 - 100831, n=40) | |
| HP Victus 16 (2024) (6.2.1, Leistung) | |
| Lenovo Legion 5 16IRX G9 (6.2.1) | |
| GPU Vulkan | |
| Gigabyte G6X 9KG (2024) (6.2.1) | |
| HP Victus 16 (2024) (6.2.1, Leistung) | |
| HP Victus 16 (2024) (6.2.1) | |
| Sınıf ortalaması Gaming (4286 - 231659, n=110, son 2 yıl) | |
| Ortalama NVIDIA GeForce RTX 4060 Laptop GPU (4286 - 101001, n=36) | |
| Lenovo Legion 5 16IRX G9 (6.2.1) | |
| Dell G16, i7-13650HX, RTX 4060 (6.2.1) | |
| V-Ray 5 Benchmark | |
| GPU RTX | |
| Sınıf ortalaması Gaming (556 - 4011, n=88, son 2 yıl) | |
| Gigabyte G6X 9KG (2024) (5.0.1) | |
| HP Victus 16 (2024) (5.0.1) | |
| HP Victus 16 (2024) (5.0.1, Leistung) | |
| Dell G16, i7-13650HX, RTX 4060 (5.0.1) | |
| Ortalama NVIDIA GeForce RTX 4060 Laptop GPU (1387 - 1817, n=28) | |
| GPU CUDA | |
| Sınıf ortalaması Gaming (300 - 3229, n=90, son 2 yıl) | |
| Gigabyte G6X 9KG (2024) (5.0.1) | |
| HP Victus 16 (2024) (5.0.1) | |
| HP Victus 16 (2024) (5.0.1, Leistung) | |
| Ortalama NVIDIA GeForce RTX 4060 Laptop GPU (957 - 1294, n=29) | |
| Dell G16, i7-13650HX, RTX 4060 (5.0.1) | |
| Asus TUF Gaming A16 FA617XS (5.0.1) | |
| CPU | |
| HP Victus 16 (2024) (5.0.1) | |
| Sınıf ortalaması Gaming (3562 - 30302, n=92, son 2 yıl) | |
| HP Victus 16 (2024) (5.0.1) | |
| Ortalama NVIDIA GeForce RTX 4060 Laptop GPU (8364 - 21065, n=28) | |
| Asus TUF Gaming A16 FA617XS (5.0.1) | |
| Gigabyte G6X 9KG (2024) (5.0.1) | |
| Dell G16, i7-13650HX, RTX 4060 (5.0.1) | |
| V-Ray Benchmark Next 4.10 | |
| GPU | |
| Sınıf ortalaması Gaming (54 - 1317, n=122, son 2 yıl) | |
| Lenovo Legion 5 16IRX G9 (v4.10.07 ) | |
| Gigabyte G6X 9KG (2024) (v4.10.07 ) | |
| HP Victus 16 (2024) (v4.10.07, Leistung) | |
| Ortalama NVIDIA GeForce RTX 4060 Laptop GPU (483 - 715, n=46) | |
| HP Victus 16 (2024) (v4.10.07 ) | |
| Asus TUF Gaming A16 FA617XS (v4.10.07 ) | |
| CPU | |
| HP Victus 16 (2024) (v4.10.07, Leistung) | |
| Lenovo Legion 5 16IRX G9 (v4.10.07 ) | |
| HP Victus 16 (2024) (v4.10.07 ) | |
| Sınıf ortalaması Gaming (5413 - 44129, n=122, son 2 yıl) | |
| Ortalama NVIDIA GeForce RTX 4060 Laptop GPU (12680 - 32360, n=46) | |
| Gigabyte G6X 9KG (2024) (v4.10.07 ) | |
| Asus TUF Gaming A16 FA617XS (v4.10.07 ) | |
* ... daha küçük daha iyidir
| Performance Rating - Percent | |
| Lenovo Legion 5 16IRX G9 | |
| Sınıf ortalaması Gaming | |
| HP Victus 16 (2024) | |
| Dell G16, i7-13650HX, RTX 4060 | |
| Gigabyte G6X 9KG (2024) | |
| HP Victus 16 (2024) | |
| Ortalama NVIDIA GeForce RTX 4060 Laptop GPU | |
| Asus TUF Gaming A16 FA617XS | |
| The Witcher 3 - 1920x1080 Ultra Graphics & Postprocessing (HBAO+) | |
| Sınıf ortalaması Gaming (18.4 - 214, n=119, son 2 yıl) | |
| Dell G16, i7-13650HX, RTX 4060 | |
| HP Victus 16 (2024) | |
| Ortalama NVIDIA GeForce RTX 4060 Laptop GPU (77 - 159.7, n=42) | |
| Gigabyte G6X 9KG (2024) | |
| HP Victus 16 (2024) | |
| Asus TUF Gaming A16 FA617XS | |
| Lenovo Legion 5 16IRX G9 | |
| GTA V - 1920x1080 Highest Settings possible AA:4xMSAA + FX AF:16x | |
| Lenovo Legion 5 16IRX G9 | |
| Dell G16, i7-13650HX, RTX 4060 | |
| HP Victus 16 (2024) | |
| Gigabyte G6X 9KG (2024) | |
| Sınıf ortalaması Gaming (12.1 - 168.2, n=132, son 2 yıl) | |
| HP Victus 16 (2024) | |
| Ortalama NVIDIA GeForce RTX 4060 Laptop GPU (76.9 - 126.3, n=48) | |
| Asus TUF Gaming A16 FA617XS | |
| Final Fantasy XV Benchmark - 1920x1080 High Quality | |
| Sınıf ortalaması Gaming (19.2 - 201, n=144, son 2 yıl) | |
| Lenovo Legion 5 16IRX G9 | |
| HP Victus 16 (2024) | |
| Dell G16, i7-13650HX, RTX 4060 | |
| Gigabyte G6X 9KG (2024) | |
| HP Victus 16 (2024) | |
| Ortalama NVIDIA GeForce RTX 4060 Laptop GPU (75.1 - 109.8, n=51) | |
| Asus TUF Gaming A16 FA617XS | |
| Strange Brigade - 1920x1080 ultra AA:ultra AF:16 | |
| Sınıf ortalaması Gaming (38.9 - 420, n=140, son 2 yıl) | |
| Lenovo Legion 5 16IRX G9 | |
| Dell G16, i7-13650HX, RTX 4060 | |
| HP Victus 16 (2024) | |
| Gigabyte G6X 9KG (2024) | |
| Ortalama NVIDIA GeForce RTX 4060 Laptop GPU (135.3 - 210, n=50) | |
| HP Victus 16 (2024) | |
| Asus TUF Gaming A16 FA617XS | |
| Dota 2 Reborn - 1920x1080 ultra (3/3) best looking | |
| Lenovo Legion 5 16IRX G9 | |
| HP Victus 16 (2024) | |
| HP Victus 16 (2024) | |
| Dell G16, i7-13650HX, RTX 4060 | |
| Sınıf ortalaması Gaming (65.1 - 220, n=148, son 2 yıl) | |
| Ortalama NVIDIA GeForce RTX 4060 Laptop GPU (115 - 183.8, n=53) | |
| Gigabyte G6X 9KG (2024) | |
| Asus TUF Gaming A16 FA617XS | |
| X-Plane 11.11 - 1920x1080 high (fps_test=3) | |
| Lenovo Legion 5 16IRX G9 | |
| HP Victus 16 (2024) | |
| Dell G16, i7-13650HX, RTX 4060 | |
| Gigabyte G6X 9KG (2024) | |
| Sınıf ortalaması Gaming (32.8 - 166.2, n=151, son 2 yıl) | |
| Ortalama NVIDIA GeForce RTX 4060 Laptop GPU (60.7 - 141.1, n=54) | |
| HP Victus 16 (2024) | |
| Asus TUF Gaming A16 FA617XS | |
| Cyberpunk 2077 2.2 Phantom Liberty | |
| 1920x1080 Ultra Preset (FSR off) | |
| Sınıf ortalaması Gaming (6.76 - 158, n=90, son 2 yıl) | |
| Lenovo Legion 5 16IRX G9 (2.02) | |
| HP Victus 16 (2024) (2.02, Leistung) | |
| Ortalama NVIDIA GeForce RTX 4060 Laptop GPU (56.4 - 93.1, n=31) | |
| Dell G16, i7-13650HX, RTX 4060 (2.11) | |
| Gigabyte G6X 9KG (2024) (2.02) | |
| HP Victus 16 (2024) (2.02) | |
| 2560x1440 Ultra Preset (FSR off) | |
| Sınıf ortalaması Gaming (24.8 - 106.8, n=70, son 2 yıl) | |
| Lenovo Legion 5 16IRX G9 (2.02) | |
| Dell G16, i7-13650HX, RTX 4060 (2.11) | |
| Ortalama NVIDIA GeForce RTX 4060 Laptop GPU (32.9 - 51.8, n=19) | |
| 1920x1080 Ray Tracing Ultra Preset (DLSS off) | |
| Sınıf ortalaması Gaming (11.9 - 77.7, n=57, son 2 yıl) | |
| HP Victus 16 (2024) (2.02, Leistung) | |
| Ortalama NVIDIA GeForce RTX 4060 Laptop GPU (23.6 - 37.4, n=21) | |
| Gigabyte G6X 9KG (2024) (2.02) | |
| HP Victus 16 (2024) (2.02) | |
| Dragon's Dogma 2 - 1920x1080 High Preset | |
| Sınıf ortalaması Gaming (49.5 - 80, n=8, son 2 yıl) | |
| HP Victus 16 (2024) | |
| Ortalama NVIDIA GeForce RTX 4060 Laptop GPU (57.2 - 67.7, n=5) | |
| Razer Blade 14 Mid 23 | |
| Palworld - 1920x1080 Epic Preset AA:TSR | |
| Razer Blade 14 Mid 23 | |
| Ortalama NVIDIA GeForce RTX 4060 Laptop GPU (83.9 - 87.8, n=2) | |
| HP Victus 16 (2024) | |
| Sınıf ortalaması Gaming (20.9 - 150.9, n=8, son 2 yıl) | |
| The Finals | |
| 1920x1080 Epic Preset | |
| Razer Blade 14 Mid 23 | |
| Ortalama NVIDIA GeForce RTX 4060 Laptop GPU (122.3 - 126, n=2) | |
| HP Victus 16 (2024) | |
| Sınıf ortalaması Gaming (24.8 - 211, n=12, son 2 yıl) | |
| 1920x1080 Epic Preset + Epic RTX Global Illumination | |
| Sınıf ortalaması Gaming (51.1 - 190.8, n=7, son 2 yıl) | |
| Razer Blade 14 Mid 23 | |
| Ortalama NVIDIA GeForce RTX 4060 Laptop GPU (116.8 - 121.1, n=2) | |
| HP Victus 16 (2024) | |
| EA Sports WRC - 1920x1080 Ultra Preset AA:Epic AF:16x | |
| HP Victus 16 (2024) | |
| Ortalama NVIDIA GeForce RTX 4060 Laptop GPU (78.4 - 79.6, n=2) | |
| Razer Blade 14 Mid 23 | |
| Sınıf ortalaması Gaming (15.4 - 115.1, n=7, son 2 yıl) | |
| Enshrouded - 1920x1080 Max. Quality AA:FX | |
| HP Victus 16 (2024) | |
| Sınıf ortalaması Gaming (9.48 - 101.5, n=12, son 2 yıl) | |
| Ortalama NVIDIA GeForce RTX 4060 Laptop GPU (43 - 51.1, n=2) | |
| Razer Blade 14 Mid 23 | |
Witcher 3 FPS diagram
| düşük | orta | yüksek | ultra | |
|---|---|---|---|---|
| GTA V (2015) | 185.8 | 181.2 | 176.1 | 110.2 |
| The Witcher 3 (2015) | 448.6 | 297.7 | 181.9 | 99.9 |
| Dota 2 Reborn (2015) | 198.1 | 177.8 | 168.4 | 149.7 |
| Final Fantasy XV Benchmark (2018) | 208 | 135.3 | 98.1 | |
| X-Plane 11.11 (2018) | 154.4 | 129.2 | 100.3 | |
| Strange Brigade (2018) | 406 | 253 | 205 | 179 |
| Cyberpunk 2077 2.2 Phantom Liberty (2023) | 113.6 | 90 | 76.9 | 67.1 |
| EA Sports WRC (2023) | 129.3 | 93.7 | 85.2 | 79.6 |
| The Finals (2023) | 196.7 | 161.7 | 155.9 | 122.3 |
| Palworld (2024) | 139.2 | 116.3 | 91.8 | 83.9 |
| Enshrouded (2024) | 85.5 | 71.2 | 59.7 | 51.1 |
| Dragon's Dogma 2 (2024) | 67.1 | 63.3 |
Emisyonlar ve güç - Etkileyici çalışma sürelerine sahip oyun dizüstü bilgisayarı
Gürültü emisyonları
Fanlar genellikle mümkün olduğunca düşük tutulur ve yalnızca başka seçenek olmadığında daha hızlı döner. Bununla birlikte, cihazın gürültü emisyonları tam yük altında ("Dengeli") 48 dB(A)'ya kadar yükselir. "Performans" daha da yüksek değerlerle sonuçlanır. "Eco" modu kullanılarak önemli ölçüde daha sessiz kullanım elde edilebilir.
Rölanti modunda veya düşük yük altında fanların tamamen hareketsiz kalması mümkündür. Ancak, bunun için HP bios seçeneği "fan her zaman açık" (varsayılan olarak etkindir) devre dışı bırakılmalıdır. Aksi takdirde, fanların her zaman çalışmasını sağlar.
Ses yüksekliği
| Boşta |
| 28 / 29 / 33 dB |
| Çalışırken |
| 45 / 48 dB |
 | ||
30 dB sessiz 40 dB(A) duyulabilirlik 50 dB(A) gürültülü |
||
min: | ||
| HP Victus 16 (2024) NVIDIA GeForce RTX 4060 Laptop GPU, i7-14700HX, Kioxia XG8 KXG80ZNV512G | Gigabyte G6X 9KG (2024) NVIDIA GeForce RTX 4060 Laptop GPU, i7-13650HX, Gigabyte AG450E1024-SI | Dell G16, i7-13650HX, RTX 4060 NVIDIA GeForce RTX 4060 Laptop GPU, i7-13650HX, WD PC SN740 SDDPNQD-1T00 | Lenovo Legion 5 16IRX G9 NVIDIA GeForce RTX 4060 Laptop GPU, i7-14650HX, Samsung PM9A1 MZVL21T0HCLR | Asus TUF Gaming A16 FA617XS Radeon RX 7600S, R9 7940HS, Micron 2400 MTFDKBA512QFM | |
|---|---|---|---|---|---|
| Noise | -10% | 13% | -3% | 2% | |
| kapalı / ortam * | 25 | 26 -4% | 23 8% | 24 4% | 25 -0% |
| Idle Minimum * | 28 | 30 -7% | 23 18% | 24 14% | 25 11% |
| Idle Average * | 29 | 32 -10% | 23 21% | 28.8 1% | 26 10% |
| Idle Maximum * | 33 | 35 -6% | 27.96 15% | 32 3% | 28 15% |
| Load Average * | 45 | 51 -13% | 27.96 38% | 45.5 -1% | 43 4% |
| Witcher 3 ultra * | 43 | 51 -19% | 47.89 -11% | 53.1 -23% | 51 -19% |
| Load Maximum * | 48 | 54 -13% | 47.89 -0% | 55.7 -16% | 53 -10% |
* ... daha küçük daha iyidir
Sıcaklık
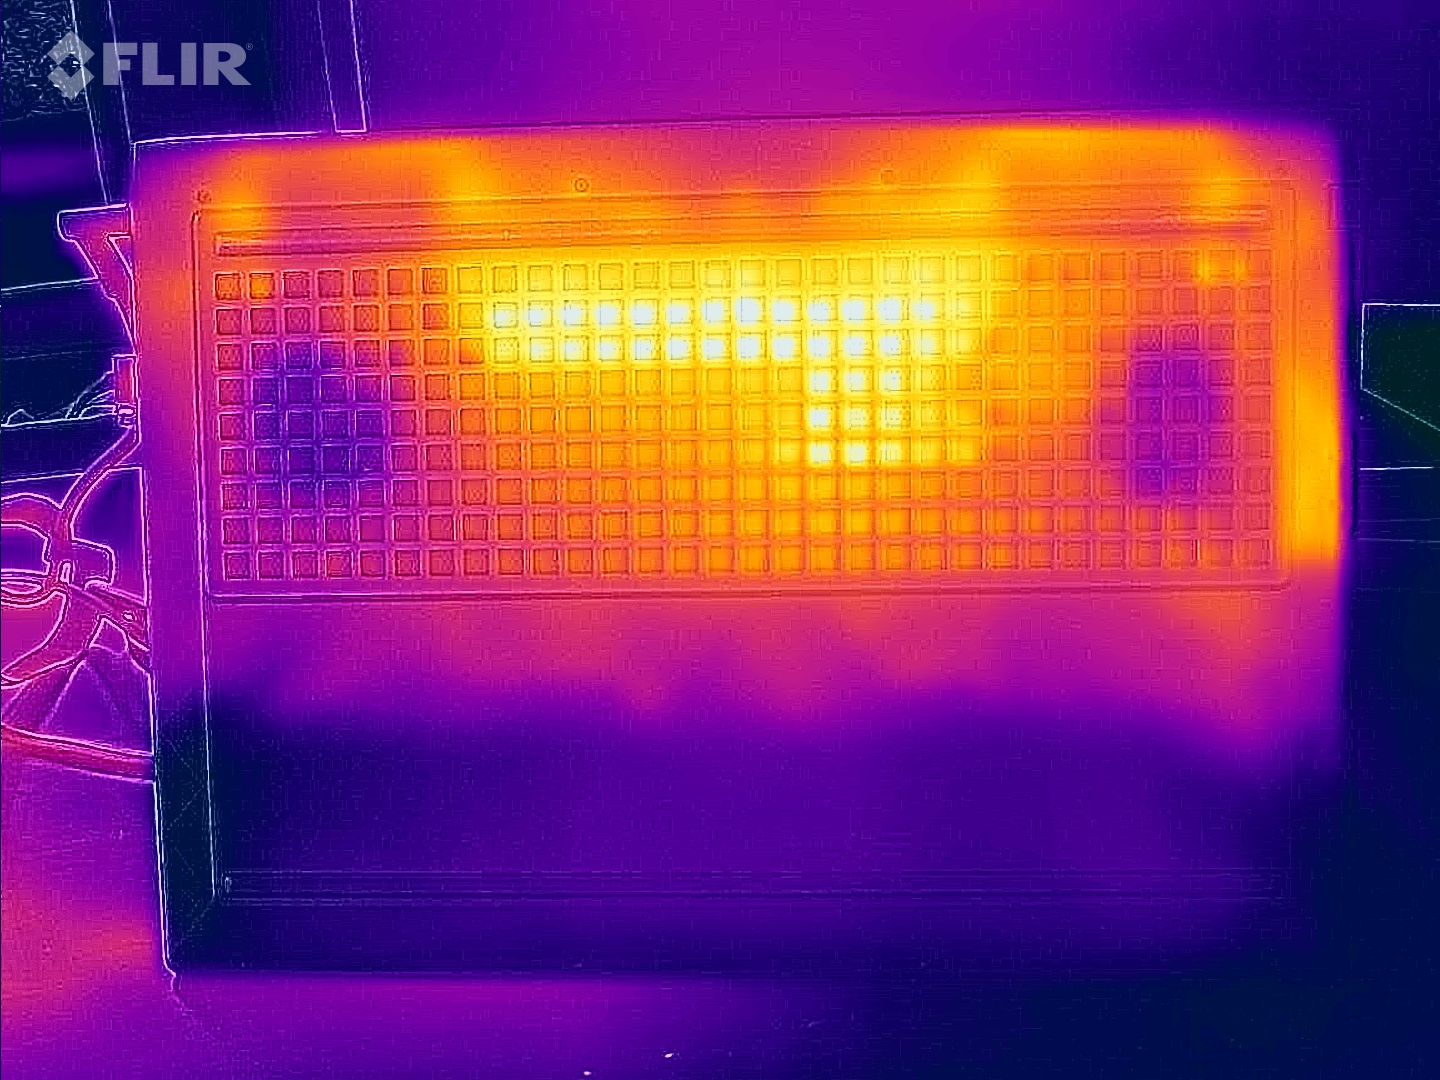
Stres testi ve Witcher 3 testi dizüstü bilgisayarın belirgin şekilde ısınmasına neden olmuştur. Testler sırasında belirli noktalarda 50 °C sıcaklıklara ulaşıldı. Günlük kullanımda (ofis, internet) değerler genellikle yeşil aralıkta kalmaktadır.
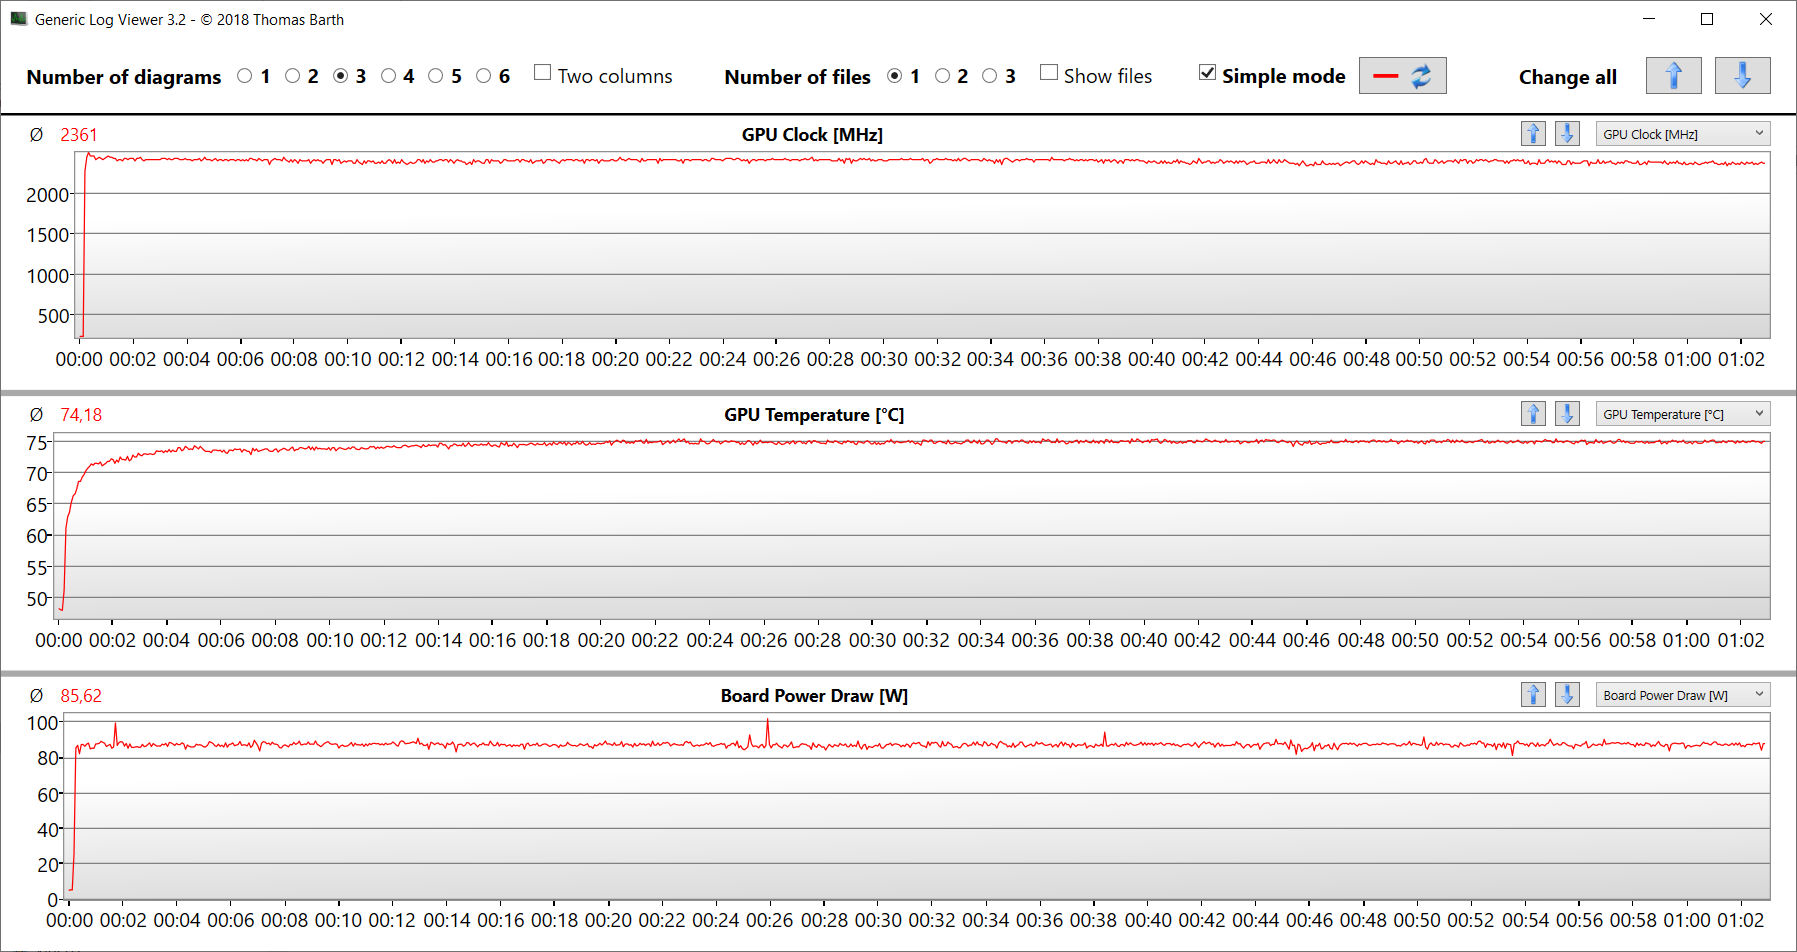
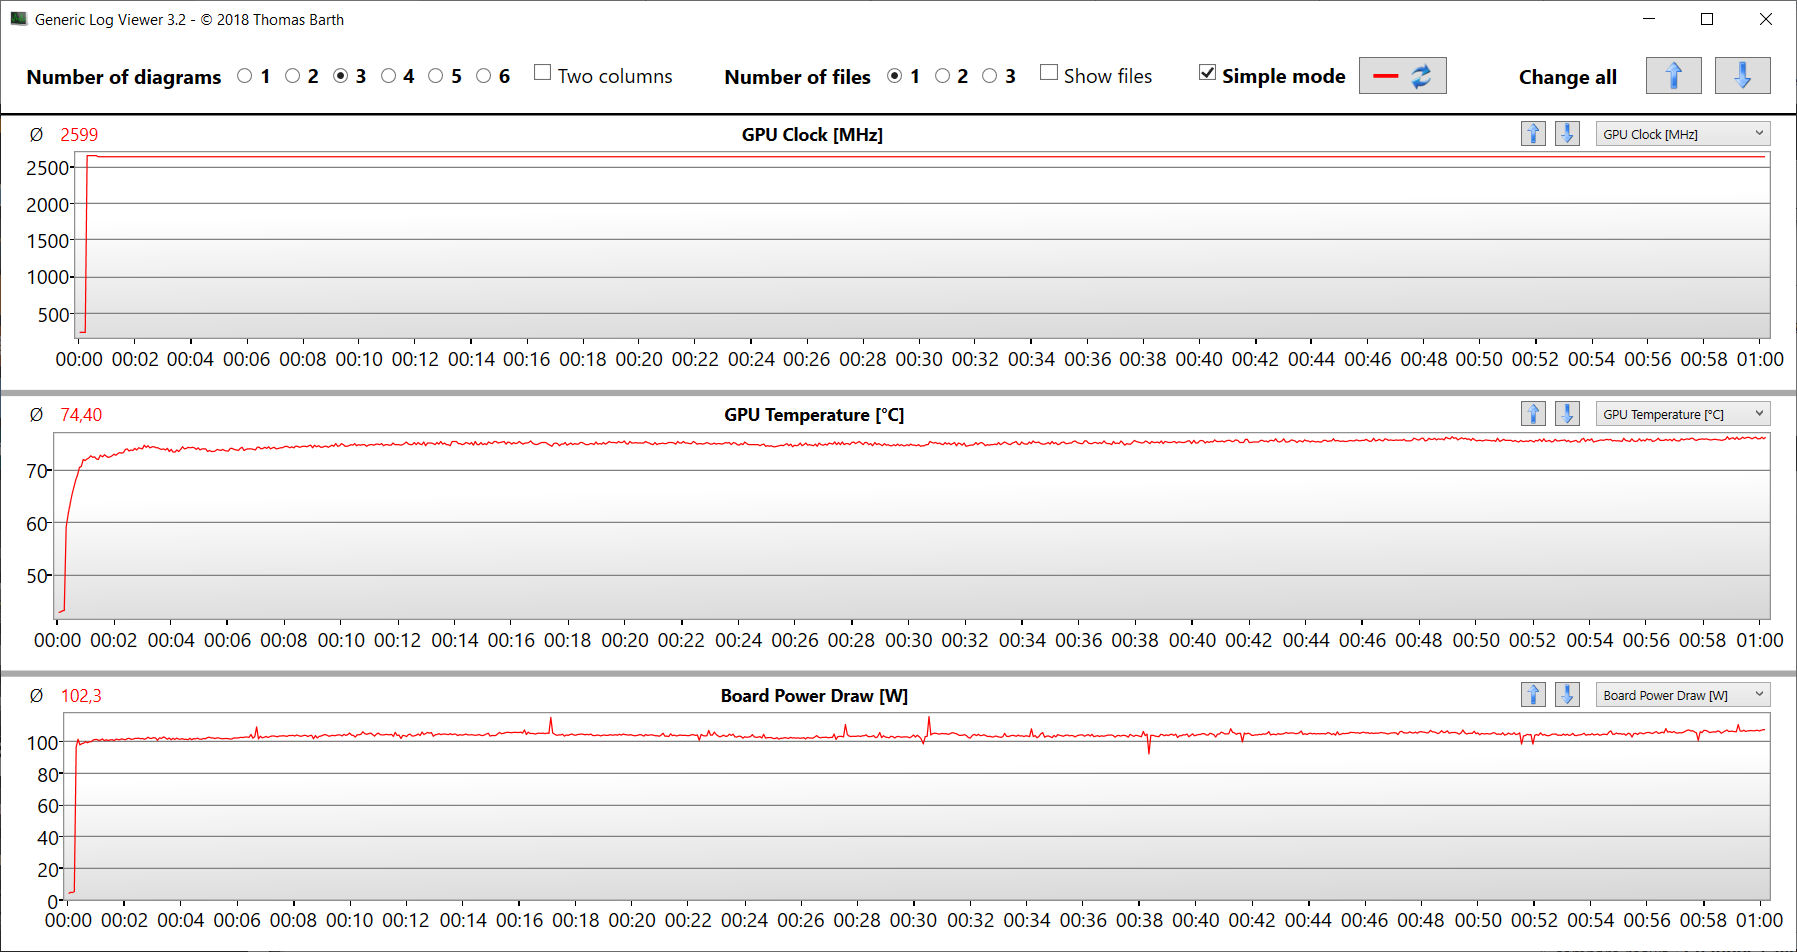
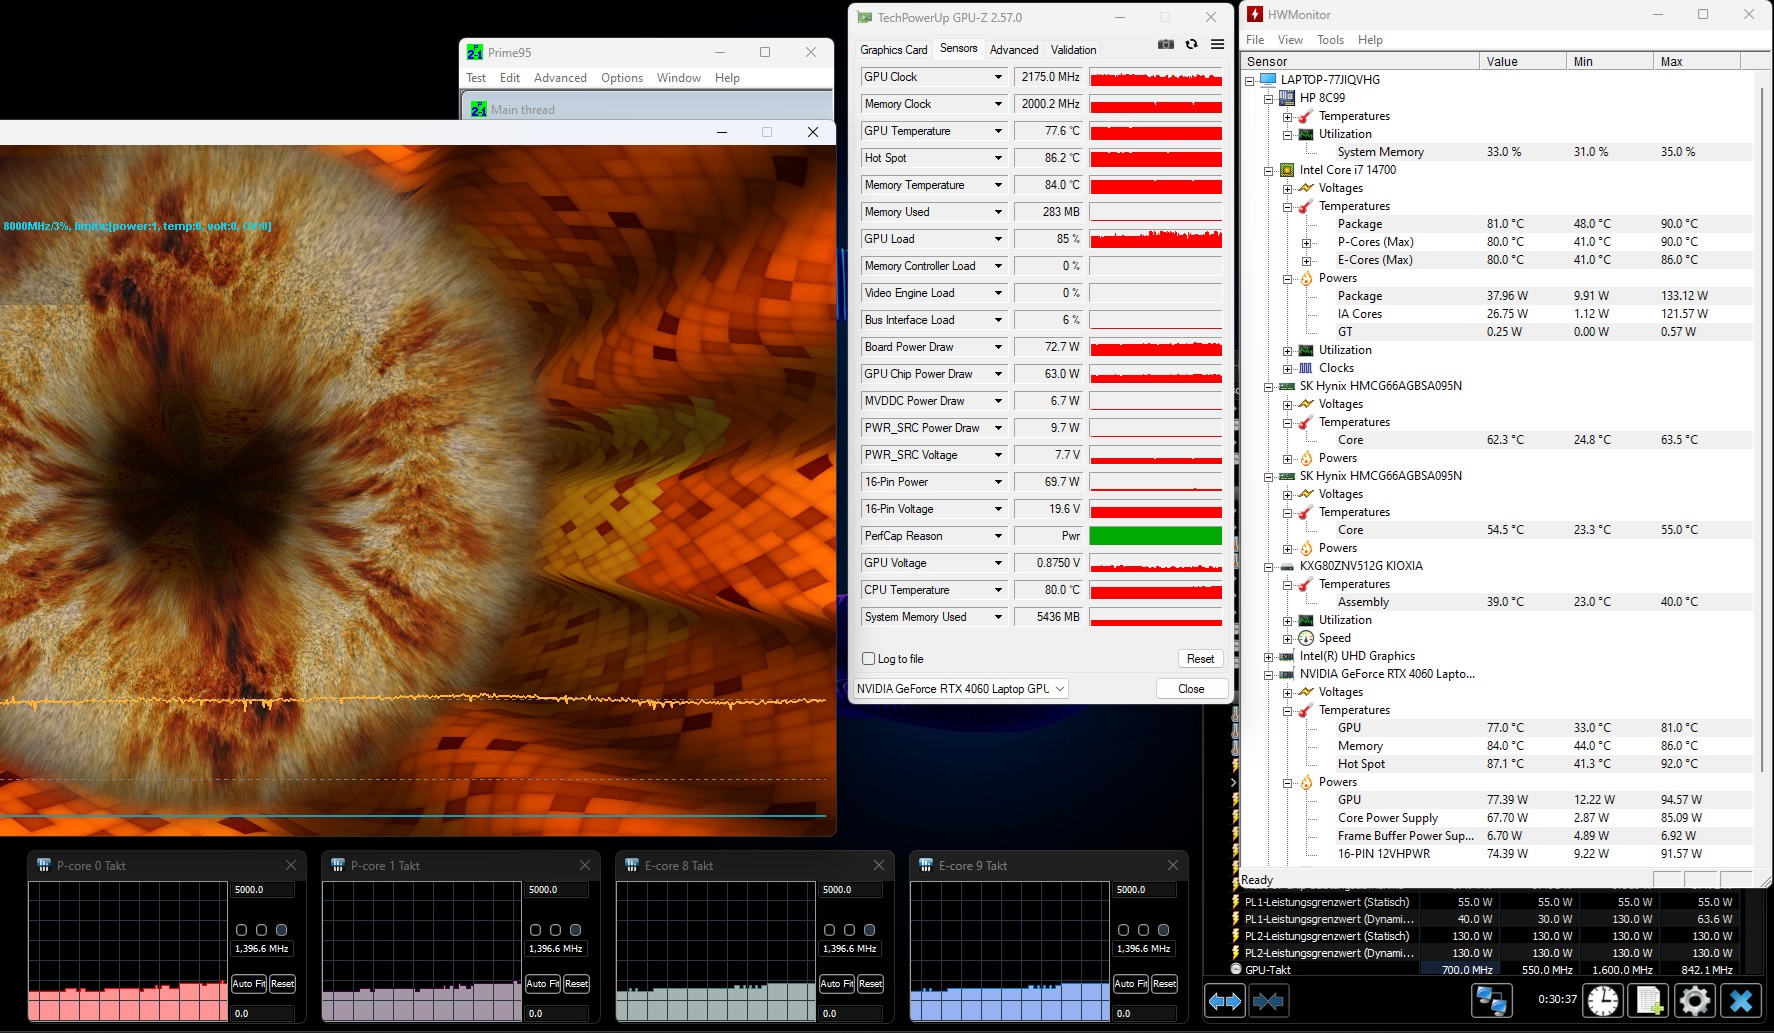
Aşırı stres testi senaryosu (Prime95 ve Furmark sürekli çalışmada) sistemin tam yük altında kararlılığını kontrol eder. CPU saati başlangıçta dalgalandı, ancak daha sonra düşük bir seviyede stabilize oldu. GPU neredeyse tam güçte çalıştı.
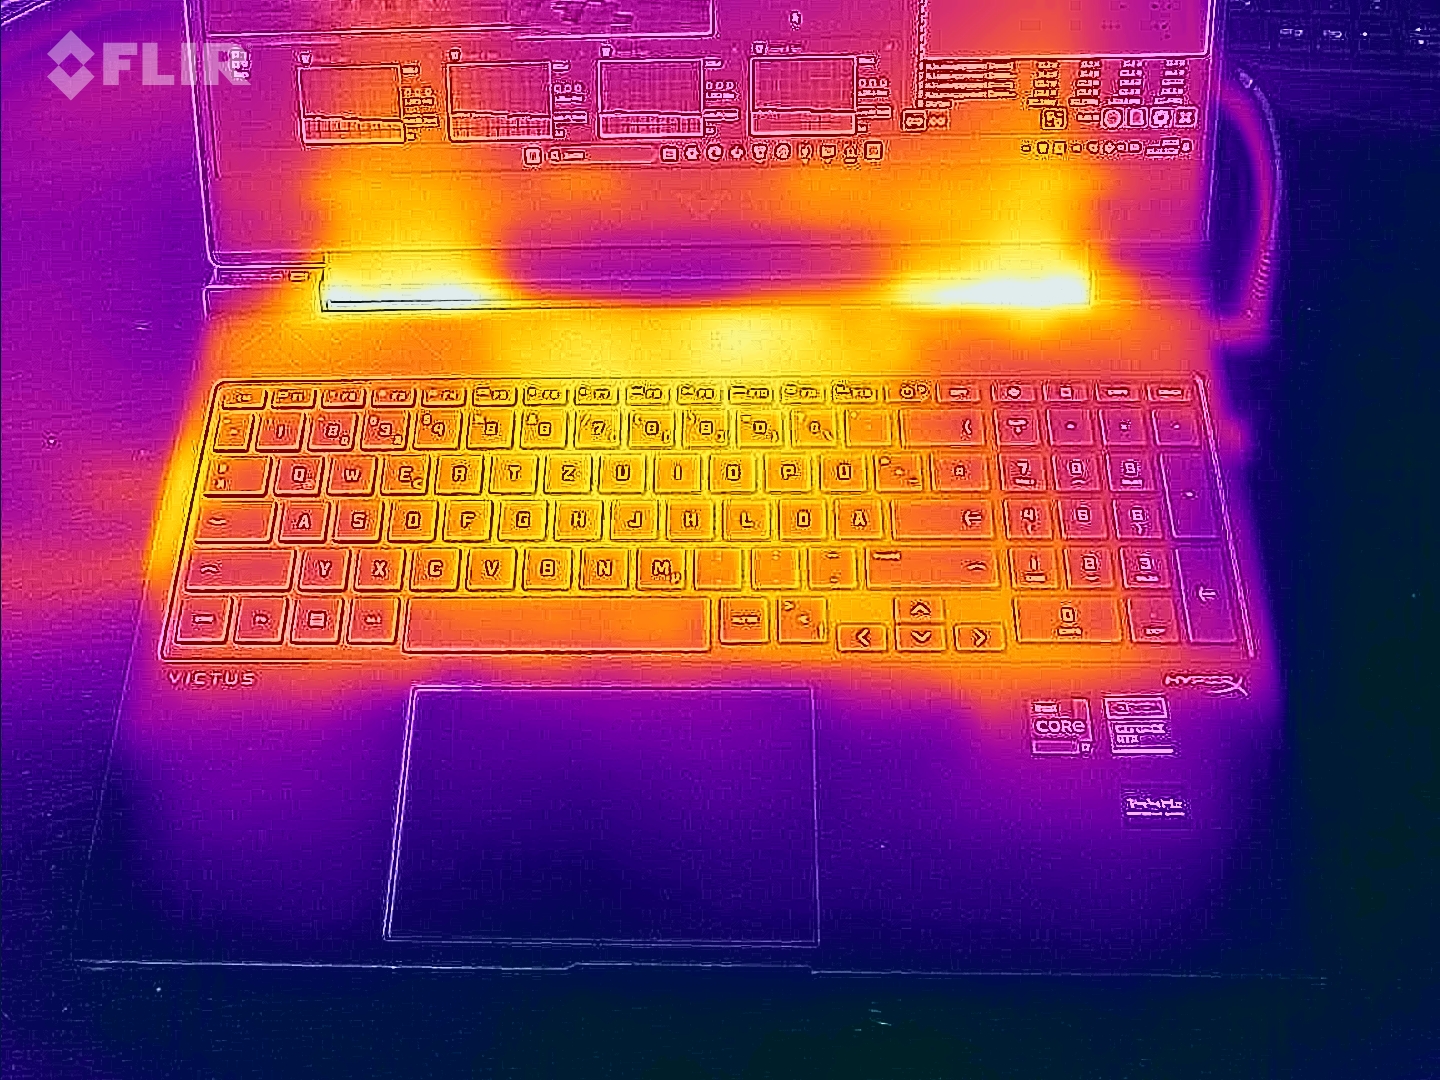
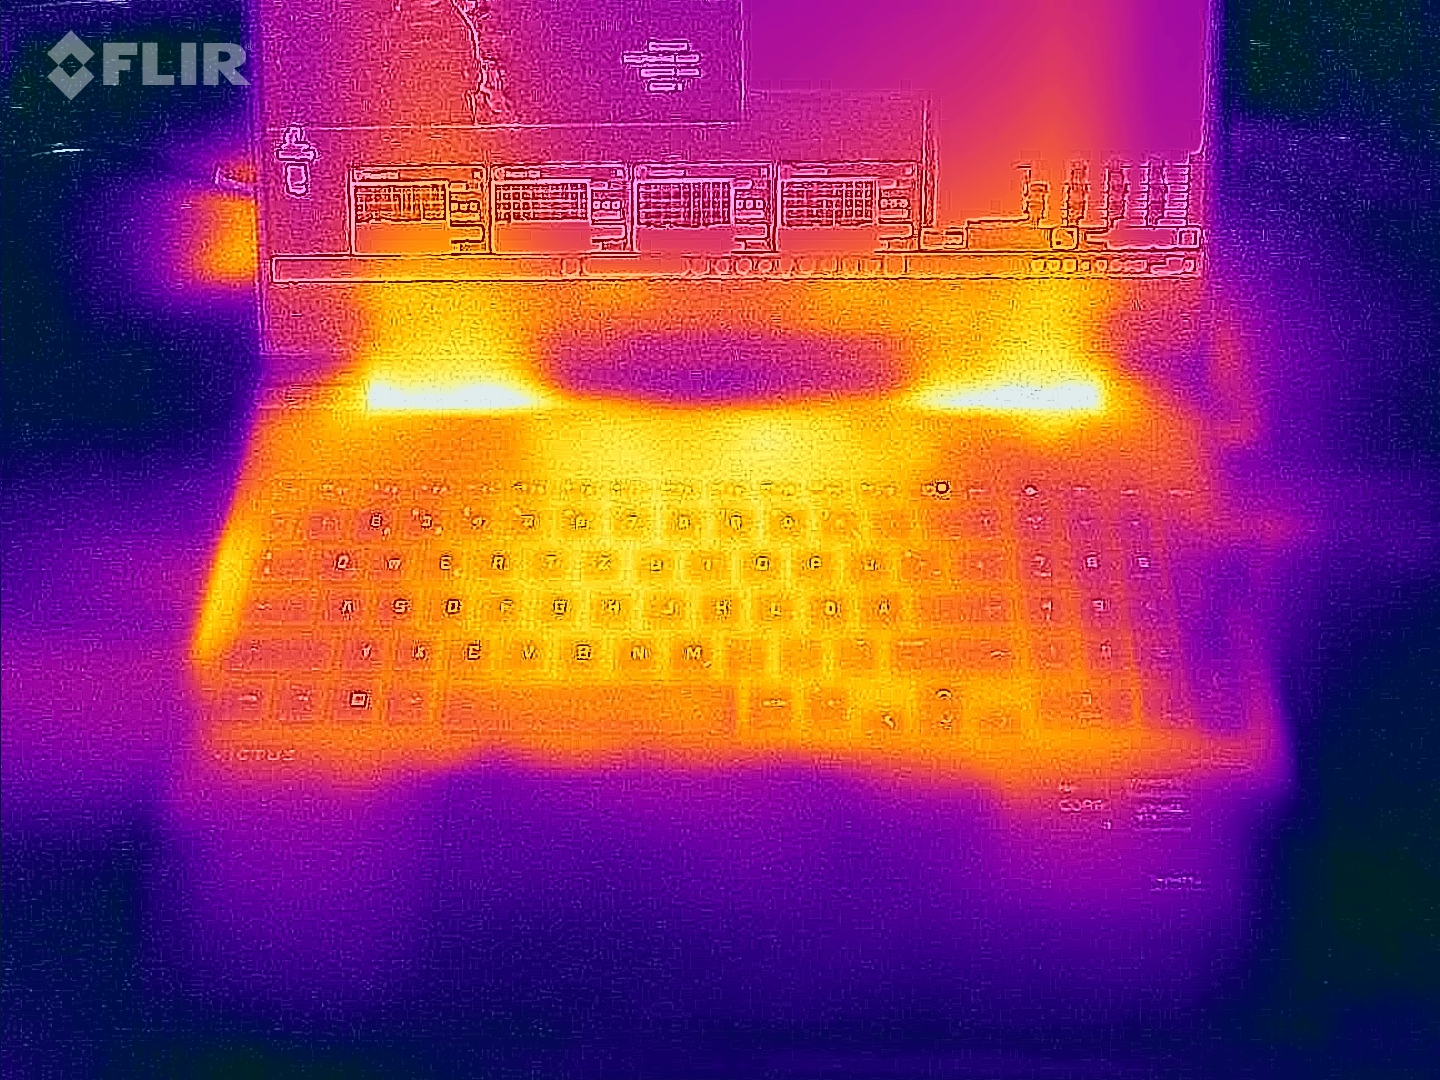
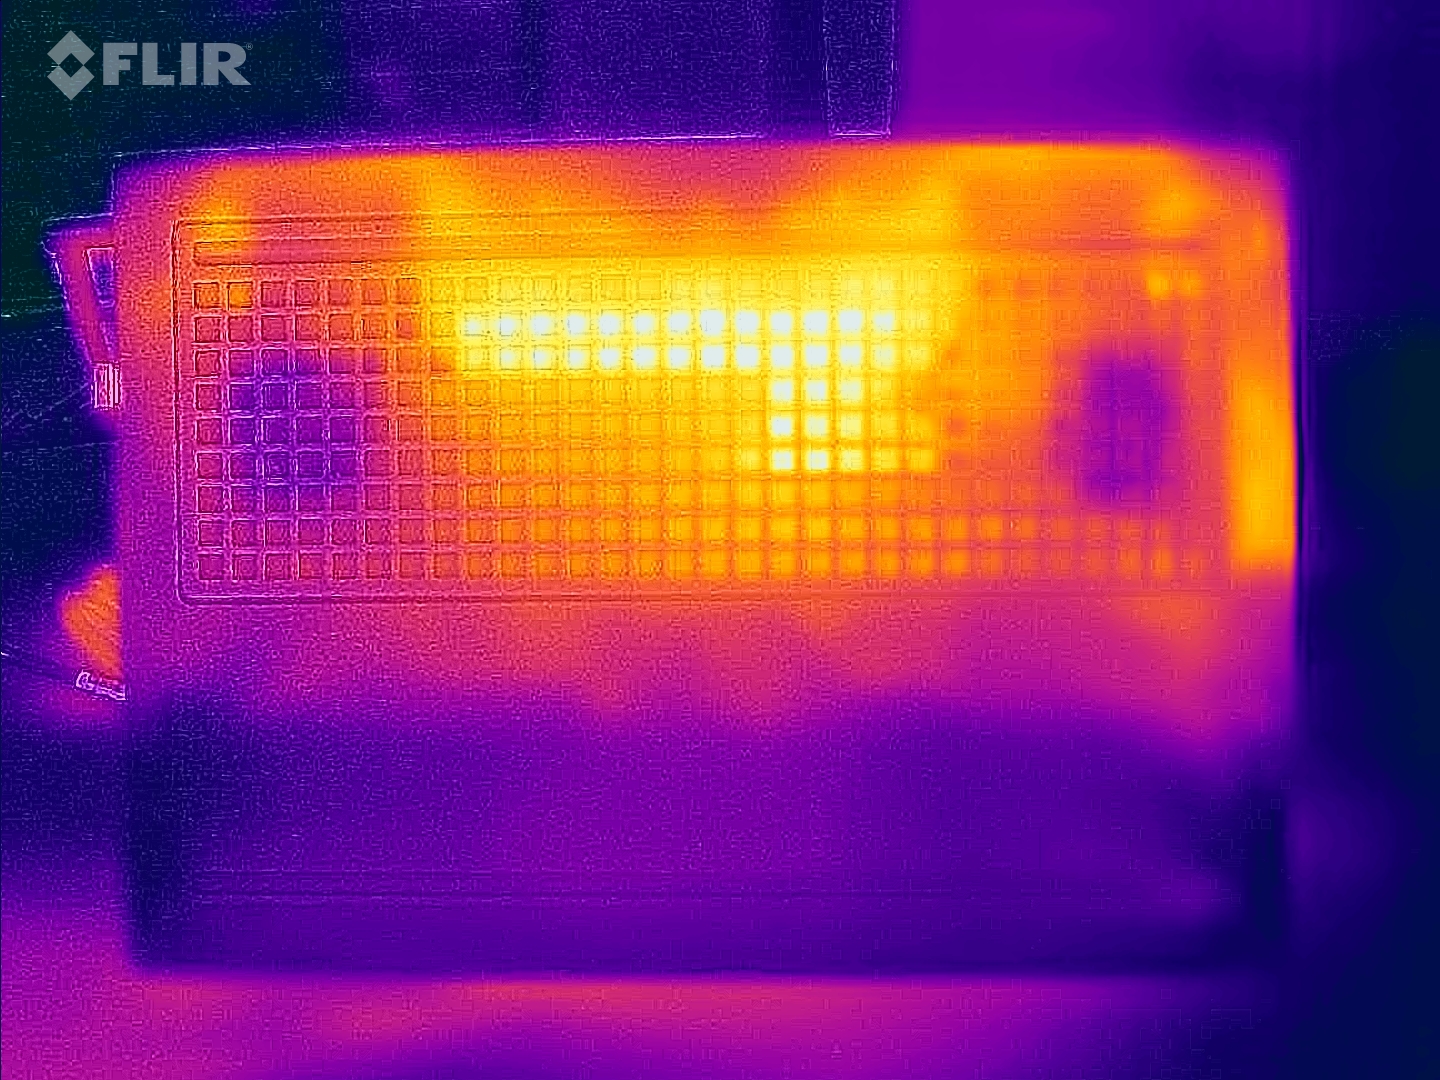
(-) Üst taraftaki maksimum sıcaklık, 40.4 °C / 105 F ortalamasına kıyasla 50 °C / 122 F'dir. , Gaming sınıfı için 21.2 ile 68.8 °C arasında değişir.
(-) Alt kısım, 43.2 °C / 110 F ortalamasına kıyasla maksimum 50 °C / 122 F'ye kadar ısınır
(+) Boşta kullanımda, üst tarafın ortalama sıcaklığı 24.7 °C / 76 F olup, cihazın 33.9 °C / 93 F.
(-) The Witcher 3 oynarken, üst tarafın ortalama sıcaklığı 38.3 °C / 101 F olup, cihazın 33.9 °C / 93 F.
(+) Avuç içi dayanakları ve dokunmatik yüzey, maksimum 31 °C / 87.8 F ile cilt sıcaklığından daha soğuktur ve bu nedenle dokunulduğunda soğuktur.
(-) Benzer cihazların avuç içi dayanağı alanının ortalama sıcaklığı 28.9 °C / 84 F (-2.1 °C / -3.8 F) idi.
| HP Victus 16 (2024) Intel Core i7-14700HX, NVIDIA GeForce RTX 4060 Laptop GPU | Gigabyte G6X 9KG (2024) Intel Core i7-13650HX, NVIDIA GeForce RTX 4060 Laptop GPU | Dell G16, i7-13650HX, RTX 4060 Intel Core i7-13650HX, NVIDIA GeForce RTX 4060 Laptop GPU | Lenovo Legion 5 16IRX G9 Intel Core i7-14650HX, NVIDIA GeForce RTX 4060 Laptop GPU | Asus TUF Gaming A16 FA617XS AMD Ryzen 9 7940HS, AMD Radeon RX 7600S | |
|---|---|---|---|---|---|
| Heat | -10% | -22% | -7% | -9% | |
| Maximum Upper Side * | 50 | 41 18% | 49 2% | 40.4 19% | 53 -6% |
| Maximum Bottom * | 50 | 43 14% | 58 -16% | 43.8 12% | 48 4% |
| Idle Upper Side * | 25 | 32 -28% | 35 -40% | 30.3 -21% | 30 -20% |
| Idle Bottom * | 26 | 37 -42% | 35 -35% | 35.3 -36% | 30 -15% |
* ... daha küçük daha iyidir
Konuşmacılar
Dizüstü bilgisayarın stereo hoparlörleri genel olarak iyi bir ses üretiyor, ancak daha fazla basa sahip olabilir.
HP Victus 16 (2024) ses analizi
(+) | hoparlörler nispeten yüksek sesle çalabilir (82 dB)
Bas 100 - 315Hz
(-) | neredeyse hiç bas yok - ortalama olarak medyandan 20.3% daha düşük
(±) | Bas doğrusallığı ortalamadır (13.3% delta - önceki frekans)
Ortalar 400 - 2000 Hz
(+) | dengeli ortalar - medyandan yalnızca 1.6% uzakta
(+) | orta frekanslar doğrusaldır (3.3% deltadan önceki frekansa)
Yüksekler 2 - 16 kHz
(+) | dengeli yüksekler - medyandan yalnızca 3.1% uzakta
(+) | yüksekler doğrusaldır (4.7% deltadan önceki frekansa)
Toplam 100 - 16.000 Hz
(+) | genel ses doğrusaldır (14% ortancaya göre fark)
Aynı sınıfla karşılaştırıldığında
» Bu sınıftaki tüm test edilen cihazların %21%'si daha iyi, 7% benzer, 72% daha kötüydü
» En iyisinin deltası 6% idi, ortalama 18% idi, en kötüsü 132% idi
Test edilen tüm cihazlarla karşılaştırıldığında
» Test edilen tüm cihazların %14'si daha iyi, 4 benzer, % 82 daha kötüydü
» En iyisinin deltası 4% idi, ortalama 24% idi, en kötüsü 134% idi
Gigabyte G6X 9KG (2024) ses analizi
(+) | hoparlörler nispeten yüksek sesle çalabilir (82 dB)
Bas 100 - 315Hz
(-) | neredeyse hiç bas yok - ortalama olarak medyandan 24.9% daha düşük
(±) | Bas doğrusallığı ortalamadır (13.7% delta - önceki frekans)
Ortalar 400 - 2000 Hz
(+) | dengeli ortalar - medyandan yalnızca 4.1% uzakta
(+) | orta frekanslar doğrusaldır (5.4% deltadan önceki frekansa)
Yüksekler 2 - 16 kHz
(+) | dengeli yüksekler - medyandan yalnızca 2.2% uzakta
(±) | Yükseklerin doğrusallığı ortalamadır (7.4% delta - önceki frekans)
Toplam 100 - 16.000 Hz
(±) | Genel sesin doğrusallığı ortalamadır (17.2% ortancaya göre fark)
Aynı sınıfla karşılaştırıldığında
» Bu sınıftaki tüm test edilen cihazların %45%'si daha iyi, 11% benzer, 44% daha kötüydü
» En iyisinin deltası 6% idi, ortalama 18% idi, en kötüsü 132% idi
Test edilen tüm cihazlarla karşılaştırıldığında
» Test edilen tüm cihazların %29'si daha iyi, 8 benzer, % 63 daha kötüydü
» En iyisinin deltası 4% idi, ortalama 24% idi, en kötüsü 134% idi
Güç tüketimi
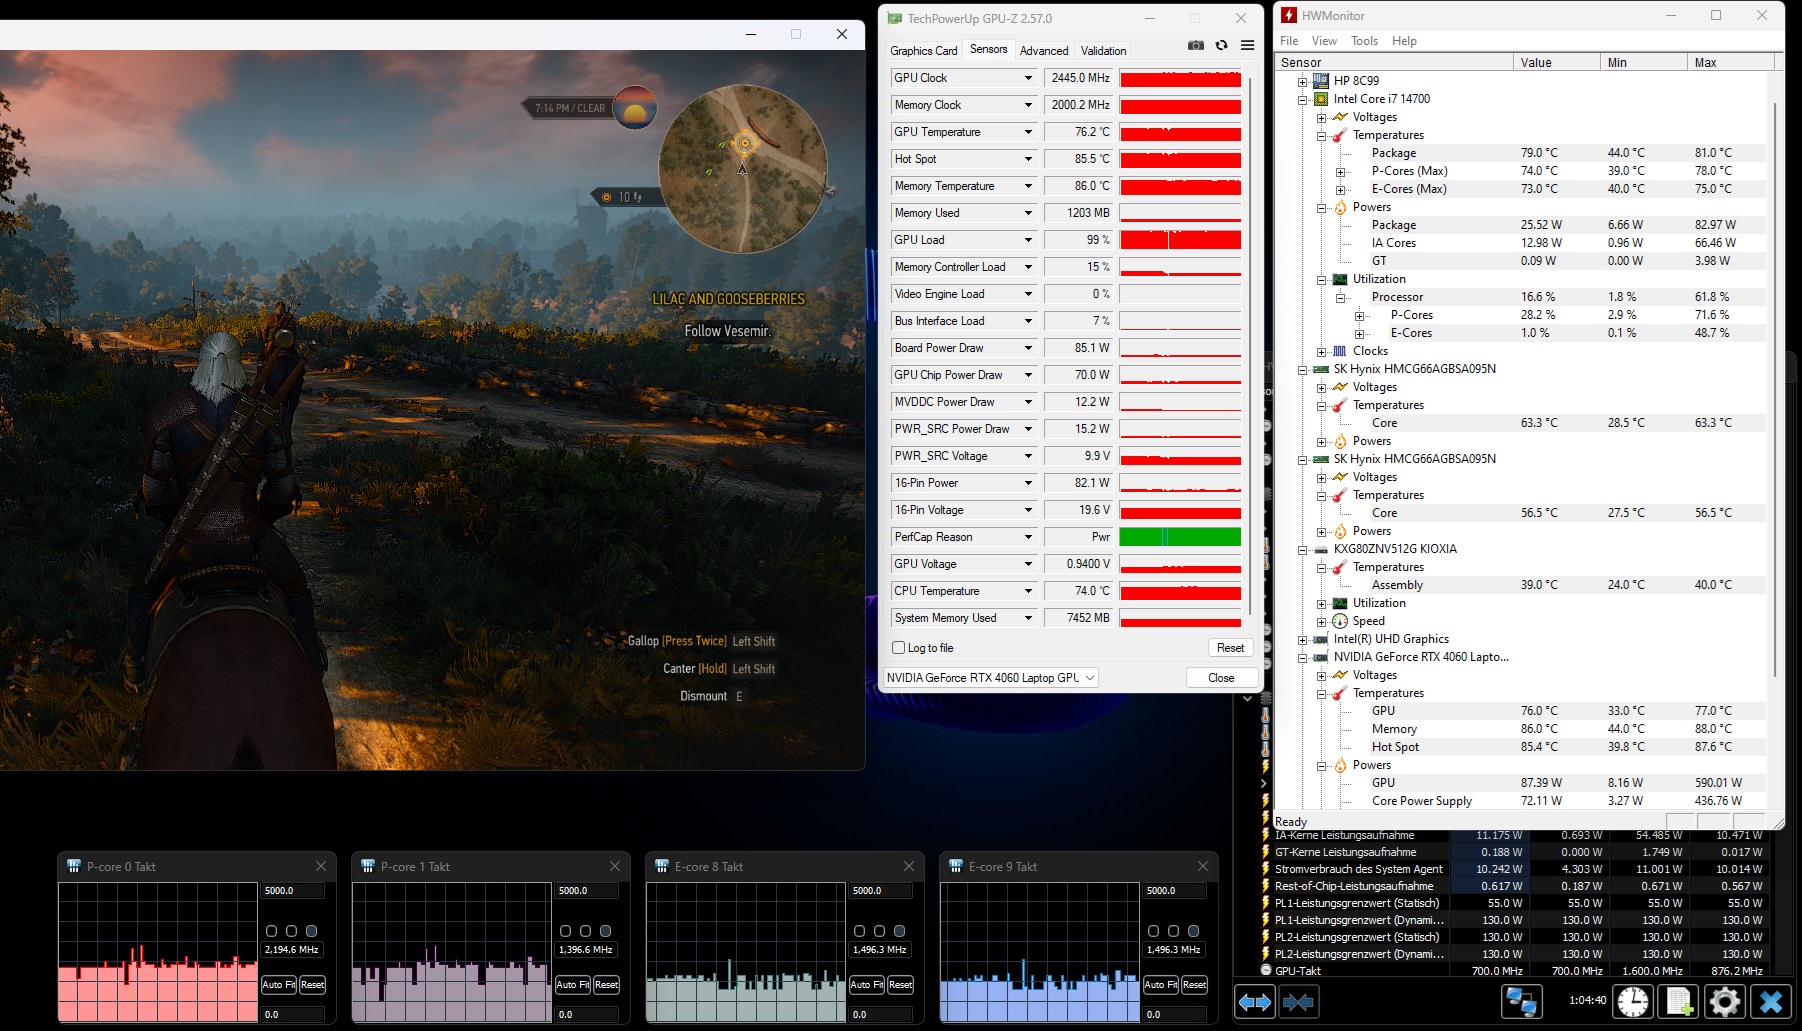
Güç tüketimi, kurulu donanım için oldukça normaldir. Süre Witcher 3 test sabit güç tüketimi ile çalıştırılmıştır, stres testinin başlangıcında dizüstü bilgisayarın talebi dalgalanmıştır. Güç kaynağı ünitesi (230 watt) yeterli büyüklüktedir.
| Kapalı / Bekleme modu | |
| Boşta | |
| Çalışırken |
|
Key:
min: | |
Power consumption Witcher 3 / stress test
Power consumption with external monitor
Çalışma Zamanları
16,1 inçlik cihaz, pratik WLAN testimiz sırasında (bir komut dosyası kullanarak web sitelerine erişirken yükü gösteren) 8:31 saatlik bir çalışma süresi elde etti - çok iyi bir değer. Karşılaştırma alanında sadece Asus TUF Gaming A16 daha iyisini yaptı.
Artılar
Eksiler
Karar - Sağlam bir orta sınıf oyun dizüstü bilgisayarı

Victus, yüksek ila maksimum ayarlarda FHD oyun oynamaya izin verir. Gerekli güç, Victus'un Core i7-14700HX ve GeForce RTX 4060. Utanç verici: CPU'nun tek çekirdek performansı mümkün olanın biraz altında. Sınıf için standart olduğu gibi, emisyonları bir miktar performanstan vazgeçerek orta değerlere düşürülebilir. Pozitif: Tam yük altında dizüstü bilgisayarın gürültü emisyonları kabul edilebilir düzeyde.
HP'de depolama açgözlülüğü: 1.600 dolarlık bir dizüstü oyun bilgisayarının daha fazla depolama alanı sunması gerekir.
HP, 16:10 bandwagonuna atlamadı - bunun yerine 16:9 en boy oranına sadık kaldı: Kurulu 16,1 inç panel (FHD, 144 Hz) gayet iyi; ancak cihazın yaklaşık 1.600 ABD doları olan fiyatı göz önüne alındığında, gerçekten daha iyi renk alanı kapsamı sunması gerekir. 512 GB depolama alanı bir oyun dizüstü bilgisayarı için çok fazla değil. Bu açıdan da fiyatına göre daha fazlasını beklersiniz.
HP bu dizüstü bilgisayara Thunderbolt 4/USB 4 gibi modern bağlantılar vermemiş, ancak yine de Power Delivery gibi kullanışlı işlevleri unutmamış - pil USB-C güç kaynağı (100 watt) ile şarj edilebiliyor. Olumlu: Tam şarjlı pil yaklaşık 8,5 saatlik WiFi çalışma süresi için yeterli; bu değer diğer birçok oyun dizüstü bilgisayarının ulaşmayı ancak hayal edebileceği bir değer.
Uygulanabilir bir alternatif şu olabilir Gigabyte G6X 9KG (2024). Bu dizüstü bilgisayar benzer bir bilgi işlem gücü ve benzer şekilde iyi çalışma süreleri sunuyor ancak 16:9 panel yerine 16:10 panele sahip.
Fiyat ve bulunabilirlik
HP Victus 16 (2024) şu anda Amazon'dan yaklaşık 1.333 ABD Doları karşılığında satın alınabilir. Bu Core i7-13700HX, NVIDIA GeForce RTX 4060, 64GB DDR5 RAM ve 2TB SSD içeren varyanttır.
HP'nin web sitesi üzerinden özel bir varyant da yapılandırabilirsiniz.
HP Victus 16 (2024)
- 05/14/2024 v7 (old)
Sascha Mölck
Şeffaflık
İncelenecek cihazların seçimi editör ekibimiz tarafından yapılır. Test örneği, bu incelemenin amacı doğrultusunda üretici veya perakendeci tarafından yazara ödünç olarak sağlanmıştır. Borç verenin bu inceleme üzerinde herhangi bir etkisi olmadığı gibi, üretici de yayınlanmadan önce bu incelemenin bir kopyasını almamıştır. Bu incelemeyi yayınlama zorunluluğu yoktu. İncelemelerimiz karşılığında asla tazminat veya ödeme kabul etmiyoruz. Bağımsız bir medya şirketi olarak Notebookcheck, üreticilerin, perakendecilerin veya yayıncıların otoritesine tabi değildir.
Notebookcheck bu şekilde test yapıyor
Notebookcheck, tüm sonuçların karşılaştırılabilir olmasını sağlamak için her yıl yüzlerce dizüstü bilgisayarı ve akıllı telefonu standart prosedürler kullanarak bağımsız olarak inceliyor. Yaklaşık 20 yıldır test yöntemlerimizi sürekli olarak geliştirdik ve bu süreçte endüstri standartlarını belirledik. Test laboratuvarlarımızda deneyimli teknisyenler ve editörler tarafından yüksek kaliteli ölçüm ekipmanları kullanılmaktadır. Bu testler çok aşamalı bir doğrulama sürecini içerir. Karmaşık derecelendirme sistemimiz, nesnelliği koruyan yüzlerce sağlam temellere dayanan ölçüm ve kıyaslamaya dayanmaktadır.Price comparison

