

İnceleme: Dell XPS 13 7390 2-in-1 Core i7-1065G7
Kısa süre önce giriş seviyesi Ice Lake Core i3-1005G1 CPU'lu 1000 $ XPS 13 7390 2'si 1 arada temel modelini inceledik ve genel bir paket olarak oldukça iyi olduğunu gördük. Ham işlemci performansı fiyatı göz önünde bulundurarak biraz karışıktı, ancak Core i3 benzeri performans için süper parlak ekran ve sistemin genel kalitesi. Bu inceleme için, 1700 $ XPS 13 7390 2-in - Daha düşük Core i3 seçeneğiyle nasıl karşılaştırılacağını görmek için üst seviye Core i7-1065G7 CPU ve entegre Iris Plus GPU ile 1 yapılandırma. Dört çekirdekli Core i7, çift çekirdekli Core i3 üzerinden ne kadar bir performans artışı sunuyor? Yeni Iris Plus GPU'da oyun oynayabilir misiniz ve daha güçlü işlemci ile pil ömrü açığı var mı? Kasa, ekran, klavye ve diğer fiziksel özellikler hakkında daha fazla bilgi için XPS 13 7390 2'si 1 arada mevcut incelememize bakın. Yeni bir XPS 13 dönüştürülebilir için çit üzerinde olabileceklere yardımcı olmak için Core i3 ve Core i7 yapılandırmaları arasında bulabileceğimiz tüm farklılıklar üzerinde duracağız. Dell XPS 13 7390 2'si 1 arada Core i7 şimdi 400 $ 'dır 10 Ekim'e kadar kupon kodu ve indirim kartlarıyla birlikte. Detaylar için burayı inceleyin. Daha fazla Dell incelemesi: XPS 15 7590XPS 13 7390 2'si bir arada Core i3XPS 13 9380Alienware m15 R2Latitude 7400
Durum


SD Kart Okuyucu
| SD Card Reader | |
| average JPG Copy Test (av. of 3 runs) | |
| Dell XPS 13 9380 2019 (Toshiba Exceria Pro SDXC 64 GB UHS-II) | |
| Dell XPS 13 9370 FHD i5 (Toshiba Exceria Pro M501 64 GB UHS-II) | |
| Dell XPS 13 7390 2-in-1 Core i3 (Toshiba Exceria Pro M501 64 GB UHS-II) | |
| Dell XPS 13 7390 2-in-1 Core i7 (Toshiba Exceria Pro M501 64 GB UHS-II) | |
| Dell XPS 13-9365 2-in-1 (Toshiba THN-M401S0640E2) | |
| maximum AS SSD Seq Read Test (1GB) | |
| Dell XPS 13 9370 FHD i5 (Toshiba Exceria Pro M501 64 GB UHS-II) | |
| Dell XPS 13 7390 2-in-1 Core i3 (Toshiba Exceria Pro M501 64 GB UHS-II) | |
| Dell XPS 13 9380 2019 (Toshiba Exceria Pro SDXC 64 GB UHS-II) | |
| Dell XPS 13 7390 2-in-1 Core i7 (Toshiba Exceria Pro M501 64 GB UHS-II) | |
| Dell XPS 13-9365 2-in-1 (Toshiba THN-M401S0640E2) | |
İletişim
Garip bir şekilde, iletim hızları kaynaktan sadece 1-2 metre uzaktayken bile beklenenden çok daha düşük. XPS 13 9380'deki daha eski Qualcomm QCA6174, 1 Gbps sınırlı sunucumuzdan bağımsız olarak Wi-Fi 6 uyumlu Katil AX1650'lerden daha iyi bir performansa sahip. Ünitemizde bunun bir hata veya anten aksaklığı olabileceğinden şüpheleniyoruz. (13 Ekim 2019 güncelleme: Sorunun XPS sistemi yerine Netgear EA8500 yönlendiricimizle ilgili olabileceğini belirledik.) anomalinin kaynağını onaylayabildiğimiz anda.)
| Networking | |
| iperf3 transmit AX12 | |
| Dell XPS 13 9380 2019 | |
| Dell XPS 13 9370 FHD i5 | |
| Dell XPS 13 7390 2-in-1 Core i3 | |
| Dell XPS 13-9365 2-in-1 | |
| Dell XPS 13 7390 2-in-1 Core i7 | |
| iperf3 receive AX12 | |
| Dell XPS 13 7390 2-in-1 Core i3 | |
| Dell XPS 13 7390 2-in-1 Core i7 | |
| Dell XPS 13 9370 FHD i5 | |
| Dell XPS 13 9380 2019 | |
| Dell XPS 13-9365 2-in-1 | |
Ekran: Çoğu Ultrabook'tan Daha Parlak
Net 16:10 ekran, Core i3 SKU’daki ile Sharp LQ134N1 panel adınınkiyle aynı kalır. Sonuç olarak, kontrast, tepki süreleri, parlaklık ve renk gamı ölçümlerimiz iki yapılandırma arasında oldukça benzerdir. 4K UHD SKU'yu daha sonraki bir tarihte, hisse senedi daha hazır olduğunda kontrol etmek zorunda kalacağız. Core i3 ve Core i7 SKU'larımız arasında fark edebileceğimiz ana fark, ikincisinin biraz daha düzensiz arka ışık kanamasından muzdarip olmasıdır. Özellikle kötü bir ünitenin alıcı ucunda olmanız durumunda, bunun için kontrol etmenizi öneririz.


| |||||||||||||||||||||||||
Aydınlatma: 86 %
Batarya modunda parlaklık: 549.8 cd/m²
Kontrast: 1410:1 (Siyah: 0.39 cd/m²)
ΔE Color 2.12 | 0.5-29.43 Ø4.87, calibrated: 1.37
ΔE Greyscale 2.6 | 0.5-98 Ø5.1
99.7% sRGB (Argyll 1.6.3 3D)
65.4% AdobeRGB 1998 (Argyll 1.6.3 3D)
71.5% AdobeRGB 1998 (Argyll 2.2.0 3D)
99.2% sRGB (Argyll 2.2.0 3D)
69.9% Display P3 (Argyll 2.2.0 3D)
Gamma: 2.3
| Dell XPS 13 7390 2-in-1 Core i7 Sharp LQ134N1, IPS, 13.4", 1920x1200 | Dell XPS 13 7390 2-in-1 Core i3 Sharp LQ134N1, IPS, 13.4", 1920x1200 | Dell XPS 13 9380 2019 ID: AUO 282B B133ZAN Dell: 90NTH, IPS, 13.3", 3840x2160 | Dell XPS 13 9370 FHD i5 SHP1484, IPS, 13.3", 1920x1080 | Dell XPS 13 9360 FHD i7 Iris SHP1449, IPS, 13.3", 1920x1080 | Dell XPS 13-9365 2-in-1 IPS, 13.3", 1920x1080 | |
|---|---|---|---|---|---|---|
| Display | -2% | -7% | -2% | -24% | -31% | |
| Display P3 Coverage | 69.9 | 68.6 -2% | 64.7 -7% | 68.9 -1% | 51.6 -26% | 47.32 -32% |
| sRGB Coverage | 99.2 | 98.2 -1% | 93.1 -6% | 96.6 -3% | 77.4 -22% | 71.1 -28% |
| AdobeRGB 1998 Coverage | 71.5 | 70.4 -2% | 65.3 -9% | 69.6 -3% | 53.3 -25% | 48.83 -32% |
| Response Times | -4% | -23% | -49% | 230% | -24% | |
| Response Time Grey 50% / Grey 80% * | 47.6 ? | 46 ? 3% | 58 ? -22% | 62.4 ? -31% | 41.2 ? 13% | 48 ? -1% |
| Response Time Black / White * | 29.2 ? | 33.6 ? -15% | 36 ? -23% | 45.6 ? -56% | 30 ? -3% | 32.8 ? -12% |
| PWM Frequency | 2500 ? | 2525 ? 1% | 1008 ? -60% | 19530 ? 681% | 1042 ? -58% | |
| Screen | 6% | -35% | -25% | -47% | -74% | |
| Brightness middle | 549.8 | 576.3 5% | 404 -27% | 428 -22% | 461 -16% | 322.6 -41% |
| Brightness | 520 | 555 7% | 389 -25% | 405 -22% | 418 -20% | 306 -41% |
| Brightness Distribution | 86 | 88 2% | 85 -1% | 87 1% | 85 -1% | 91 6% |
| Black Level * | 0.39 | 0.33 15% | 0.37 5% | 0.26 33% | 0.2 49% | 0.19 51% |
| Contrast | 1410 | 1746 24% | 1092 -23% | 1646 17% | 2305 63% | 1698 20% |
| Colorchecker dE 2000 * | 2.12 | 1.45 32% | 3.72 -75% | 3.8 -79% | 5.4 -155% | 7.7 -263% |
| Colorchecker dE 2000 max. * | 3.66 | 4.12 -13% | 7.38 -102% | 7.2 -97% | 12.2 -233% | 11.1 -203% |
| Colorchecker dE 2000 calibrated * | 1.37 | 1.19 13% | 2.06 -50% | |||
| Greyscale dE 2000 * | 2.6 | 3.1 -19% | 4.44 -71% | 4.4 -69% | 5.4 -108% | 7.9 -204% |
| Gamma | 2.3 96% | 2.27 97% | 2.34 94% | 2.21 100% | 2.15 102% | 2.88 76% |
| CCT | 6884 94% | 6931 94% | 7095 92% | 7067 92% | 7258 90% | 7044 92% |
| Color Space (Percent of AdobeRGB 1998) | 65.4 | 64.2 -2% | 60 -8% | 62.8 -4% | 48.6 -26% | 44.1 -33% |
| Color Space (Percent of sRGB) | 99.7 | 98.5 -1% | 93 -7% | 96.4 -3% | 76.9 -23% | 69.9 -30% |
| Toplam Ortalama (Program / Ayarlar) | 0% /
3% | -22% /
-28% | -25% /
-25% | 53% /
9% | -43% /
-56% |
* ... daha küçük daha iyidir


Yanıt Sürelerini Görüntüle
| ↔ Tepki Süresi Siyahtan Beyaza | ||
|---|---|---|
| 29.2 ms ... yükseliş ↗ ve sonbahar↘ birleşimi | ↗ 16 ms yükseliş |  |
| ↘ 13.2 ms sonbahar | ||
| Ekran, testlerimizde nispeten yavaş yanıt oranları gösteriyor ve oyuncular için çok yavaş olabilir. Karşılaştırıldığında, test edilen tüm cihazlar 0.1 (minimum) ile 240 (maksimum) ms arasında değişir. » Tüm cihazların 76 %'si daha iyi. Bu, ölçülen yanıt süresinin test edilen tüm cihazların ortalamasından (20.8 ms) daha kötü olduğu anlamına gelir. | ||
| ↔ Tepki Süresi %50 Griden %80 Griye | ||
| 47.6 ms ... yükseliş ↗ ve sonbahar↘ birleşimi | ↗ 23.2 ms yükseliş |  |
| ↘ 24.4 ms sonbahar | ||
| Ekran, testlerimizde yavaş yanıt oranları gösteriyor ve oyuncular için yetersiz olacaktır. Karşılaştırıldığında, test edilen tüm cihazlar 0.165 (minimum) ile 636 (maksimum) ms arasında değişir. » Tüm cihazların 81 %'si daha iyi. Bu, ölçülen yanıt süresinin test edilen tüm cihazların ortalamasından (32.5 ms) daha kötü olduğu anlamına gelir. | ||
Ekran Titremesi / PWM (Darbe Genişliği Modülasyonu)
| Ekran titriyor / PWM algılandı | 2500 Hz | ≤ 25 % parlaklık ayarı |  |
Ekran arka ışığı 2500 Hz'de titriyor (en kötü durum, örneğin PWM kullanılması) 25 % ve altındaki parlaklık ayarında titreme algılandı. Bu parlaklık ayarının üzerinde titreme veya PWM olmamalıdır. 2500 Hz frekansı oldukça yüksektir, bu nedenle PWM'ye duyarlı çoğu kullanıcı herhangi bir titremeyi fark etmemelidir. Karşılaştırıldığında: Test edilen tüm cihazların %53 %'si ekranı karartmak için PWM kullanmıyor. PWM tespit edilirse, ortalama 8516 (minimum: 5 - maksimum: 343500) Hz ölçüldü. | |||


Verim

10. nesil Core i7-1065G7, hem daha hızlı CPU performansı hem de önemli ölçüde daha hızlı entegre grafik performansı sunarak 9. nesil Core i7-8565U’yu gerçekleştirdi. Dell çekyatları, işlemcinin yapabileceklerini daha iyi kullanmak için 15 W sürümü yerine i7-1065G7'nin daha hızlı olan 25 W versiyonunu kullanır. Intel'in en yeni CPU'ları hakkında daha fazla bilgi edinmek için Core i7-1065G7'ye genel bakışımıza bakın. Gelecekte Comet Lake-U seçenekleri için parmaklarını geçen kullanıcılar, XPS 13 7390 2-in-1 için özel olarak tasarlanmıştır Buz Gölü Dell, şu anda XPS 13 2-in-1 ürününe hexa-core Comet Lake-U seçeneklerini sunma konusunda hiçbir plan olmadığını ve bu nedenle XPS 13 7390 kapaklı münhasırlığını koruduğunu belirtti.LatencyMon bile DPC gecikme sorunlarını göstermeye devam ediyor. kablosuz devre dışı bırakıldığında.


İşlemci: 9. Nesil Viski Gölü-U Üzerinden Bir Atılım
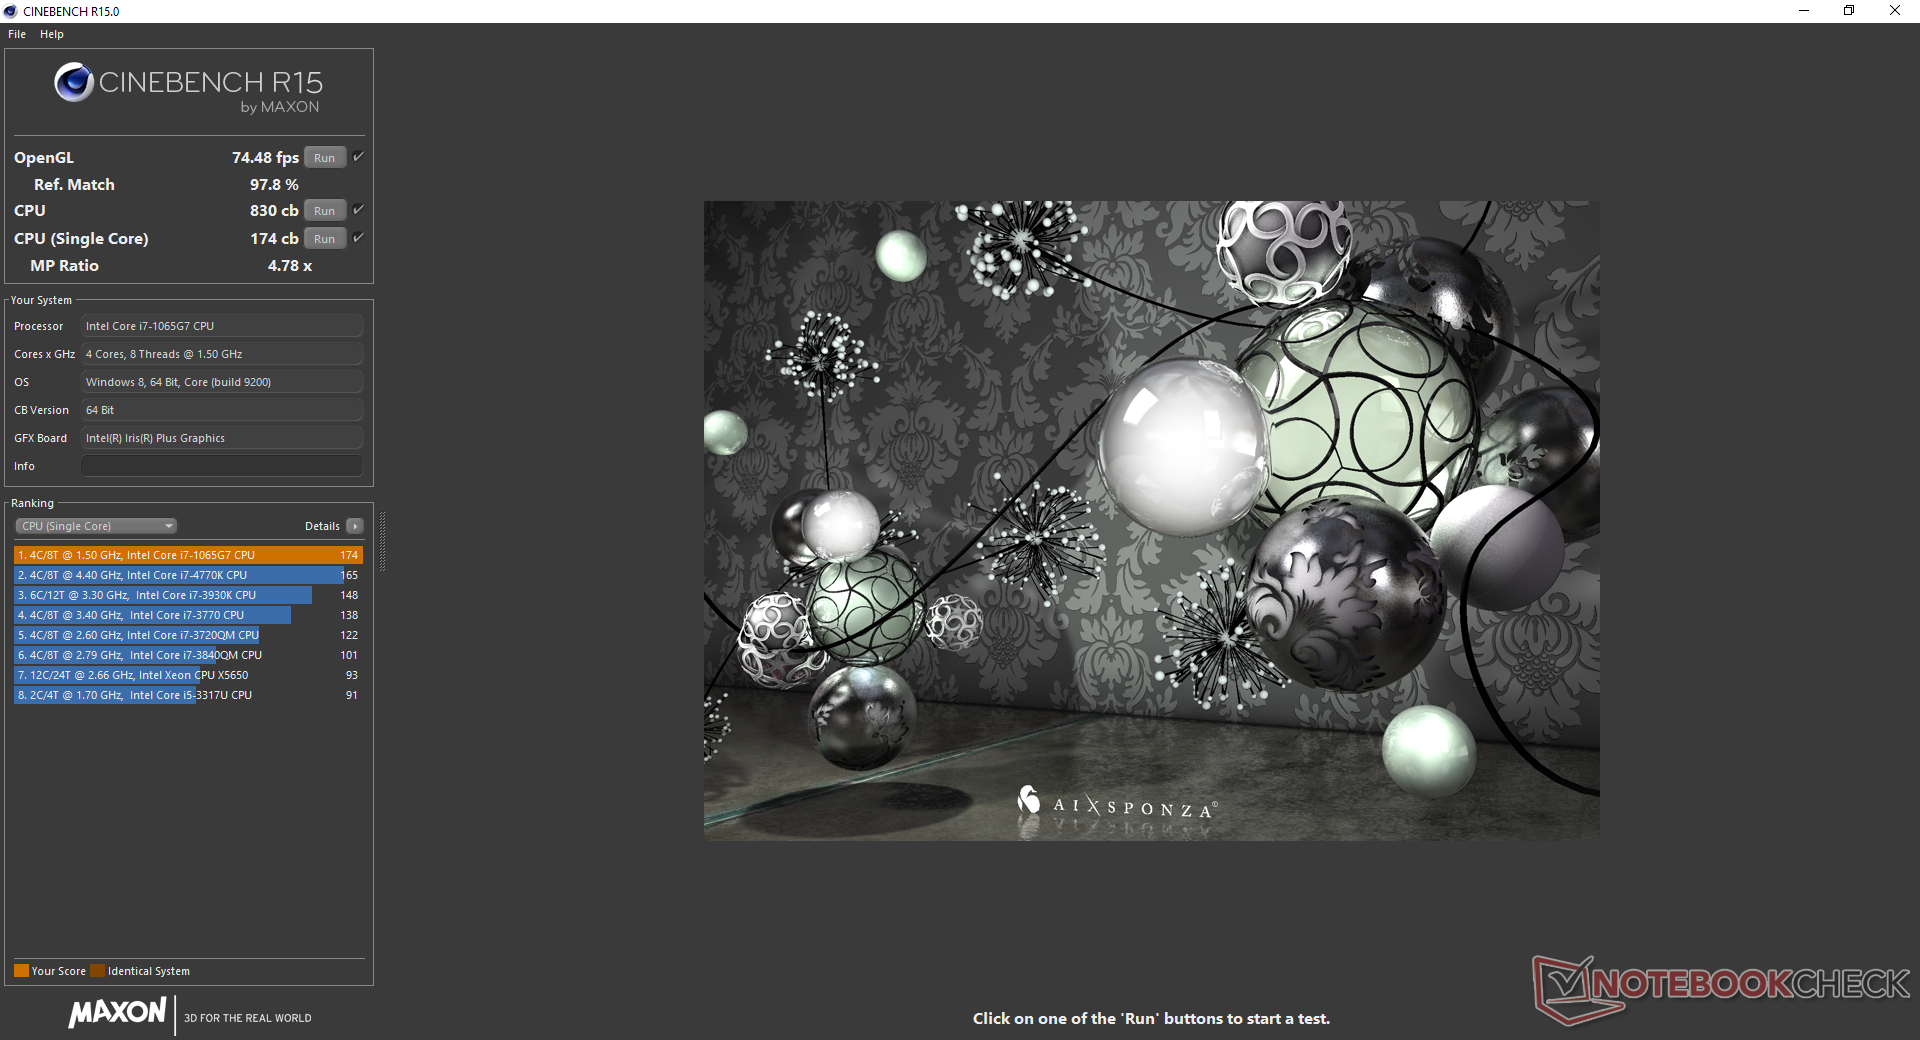
Ham işlemci performansı kasa boyutuna göre çok yüksektir. CineBench R15 Multi-Thread'ı bir döngüde çalıştırırken, sonuçlar, Turbo Boost saat hızlarının en yüksek olduğu ilk dört döngü için XPS 15'teki Core i5-9300H ile aynıdır. Ancak sonuçta, saat hızları neredeyse yüzde 20'lik bir performans düşüşü için kabul edilebilir sıcaklıkları korumak amacıyla düşecektir. Başka bir deyişle, işlemci performansı, birkaç ay önce test ettiğimiz üretim öncesi Core i7-1065G7 ünitesinin hemen altında olmak yerine oldukça düşmeden önce mükemmel ilk izlenimler için çok hızlı bir şekilde başlar. Buna karşılık, XPS 13 7390 2'si 1 Arada Core i3-1005G1 SKU, Turbo Boost saat hızları daha mütevazı olduğundan, zaman içinde performansta keskin bir düşüş yaşamıyor. 25 W Core i7 Ice Göl hala 15 W Whisky Lake-U selefinden daha hızlı. Ham performans, XPS 13 9380'den daha istikrarlı iken, Dell Inspiron 7390 2'si 1 arada daha ucuz olan Core i7-8565U'dan yaklaşık yüzde 35 daha hızlı. Deep Learning Boost, önceki nesil Core U serisi işlemcilerde ve hatta en yeni 2. nesil AMD Zen serilerinde bulunamadı. Her şeye rağmen. Bu özelliğin pratikliği, herhangi bir günlük kullanım senaryosunu gerçekten etkilemek için Windows'ta henüz tam olarak keşfedilmemiştir. Daha fazla teknik bilgi ve kıyaslama karşılaştırması için Core i7-1065G7'deki özel sayfamıza bakın.


| Cinebench R20 | |
| CPU (Single Core) | |
| Dell XPS 13 7390 2-in-1 Core i7 | |
| Intel SDS Core i7-1065G7 Preliminary Sample 25 W | |
| Dell XPS 15 7590 9980HK GTX 1650 | |
| Intel SDS Core i7-1065G7 Preliminary Sample 15 W | |
| Ortalama Intel Core i7-1065G7 (358 - 474, n=31) | |
| Dell G5 15 5590 | |
| Dell XPS 13 7390 2-in-1 Core i3 | |
| Dell Latitude 14 5495 | |
| Dell Inspiron 15 5000 5585 | |
| CPU (Multi Core) | |
| Dell XPS 15 7590 9980HK GTX 1650 | |
| Dell G5 15 5590 | |
| Dell XPS 13 7390 2-in-1 Core i7 | |
| Intel SDS Core i7-1065G7 Preliminary Sample 25 W | |
| Ortalama Intel Core i7-1065G7 (1081 - 2024, n=31) | |
| Dell Inspiron 15 5000 5585 | |
| Dell Latitude 14 5495 | |
| Intel SDS Core i7-1065G7 Preliminary Sample 15 W | |
| Dell XPS 13 7390 2-in-1 Core i3 | |
Sistem Performansı: Göründüğünden Daha Hızlı
PCMark kriterleri, Core i3 SKU'yu yüzde 20 ila 50 oranında geride bırakan XPS 13 7390 2'si 1 arada Core i7 ürünümüzü gösteriyor. En büyük avantaj, entegre Iris Plus GPU'nun kaslarını Core i3 SKU'nun UHD Graphics G1'i üzerinden bükebileceği GPU-yoğun Dijital Oluşturma kriterinde. Aslında, genel sonuçlar mevcut en hızlı XPS 13 9380 konfigürasyonundan bile daha hızlıdır. Ünite, son Core i3 ünitemizin yaptığı herhangi bir ses veya USB sorunu göstermiyor.


| PCMark 8 | |
| Home Score Accelerated v2 | |
| Dell XPS 15 7590 i5 iGPU FHD | |
| Apple MacBook Pro 13 2019 i5 4TB3 | |
| Dell XPS 13 9370 FHD i5 | |
| Dell XPS 13 7390 2-in-1 Core i7 | |
| Dell XPS 13 9360 FHD i7 Iris | |
| Dell XPS 15 7590 9980HK GTX 1650 | |
| Dell XPS 13 9380 2019 | |
| Dell XPS 13 9380 i7 4K | |
| Dell XPS 13 7390 2-in-1 Core i3 | |
| Dell XPS 13-9365 2-in-1 | |
| Work Score Accelerated v2 | |
| Dell XPS 13 7390 2-in-1 Core i7 | |
| Dell XPS 15 7590 i5 iGPU FHD | |
| Dell XPS 13 9370 FHD i5 | |
| Dell XPS 13 9360 FHD i7 Iris | |
| Dell XPS 15 7590 9980HK GTX 1650 | |
| Dell XPS 13-9365 2-in-1 | |
| Apple MacBook Pro 13 2019 i5 4TB3 | |
| Dell XPS 13 7390 2-in-1 Core i3 | |
| Dell XPS 13 9380 i7 4K | |
| Dell XPS 13 9380 2019 | |
| PCMark 8 Home Score Accelerated v2 | 3982 puan | |
| PCMark 8 Work Score Accelerated v2 | 5086 puan | |
| PCMark 10 Score | 4677 puan | |
Yardım | ||
Depolama Aygıtları: Her Şey Lehimli
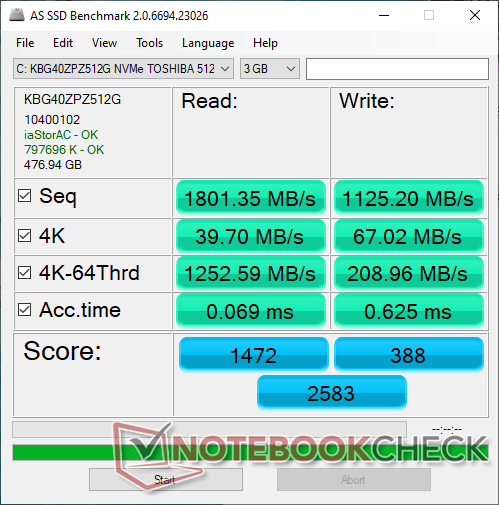
Core i7 ünitemiz, Core i3 konfigürasyonundaki 256 GB Toshiba BG4 NVMe SSD'ye çok benzeyen 512 GB Toshiba BG4 NVMe SSD ile birlikte gelir. Bu bileşenler lehimlenirken kullanıcılar hem RAM hem de depolamayı dikkatlice seçmelidir.

| Dell XPS 13 7390 2-in-1 Core i7 Toshiba BG4 KBG40ZPZ512G | Dell XPS 13 7390 2-in-1 Core i3 Toshiba BG4 KBG40ZPZ256G | Dell XPS 13 9380 2019 SK hynix PC401 HFS256GD9TNG | Dell XPS 13-9365 2-in-1 Toshiba NVMe THNSN5256GPUK | Dell Latitude 7200 WDC PC SN520 SDAPNUW-512G | Dell Latitude 13 5300 2-in-1 SK hynix PC401 HFS256GD9TNG | |
|---|---|---|---|---|---|---|
| AS SSD | -11% | -5% | -10% | 63% | -4% | |
| Seq Read | 1801 | 1558 -13% | 2035 13% | 1283 -29% | 1294 -28% | 1236 -31% |
| Seq Write | 1125 | 1103 -2% | 658 -42% | 735 -35% | 856 -24% | 500 -56% |
| 4K Read | 39.7 | 37.52 -5% | 39.74 0% | 37.69 -5% | 42.52 7% | 40.1 1% |
| 4K Write | 67 | 59 -12% | 105.7 58% | 96.9 45% | 141 110% | 115.7 73% |
| 4K-64 Read | 1253 | 1684 34% | 461 -63% | 586 -53% | 983 -22% | 474.1 -62% |
| 4K-64 Write | 209 | 198.9 -5% | 300.1 44% | 204.7 -2% | 1183 466% | 350.4 68% |
| Access Time Read * | 0.069 | 0.099 -43% | 0.061 12% | 0.045 35% | 0.057 17% | 0.04 42% |
| Access Time Write * | 0.625 | 0.722 -16% | 0.051 92% | 0.037 94% | 0.026 96% | 0.051 92% |
| Score Read | 1472 | 1877 28% | 704 -52% | 752 -49% | 1155 -22% | 638 -57% |
| Score Write | 388 | 368 -5% | 471 21% | 375 -3% | 1410 263% | 516 33% |
| Score Total | 2583 | 3180 23% | 1479 -43% | 1495 -42% | 3142 22% | 1456 -44% |
| Copy ISO MB/s | 1293 | 677 -48% | 893 -31% | 950 -27% | 1387 7% | 818 -37% |
| Copy Program MB/s | 560 | 298.4 -47% | 287.9 -49% | 263.8 -53% | 449.5 -20% | 395.5 -29% |
| Copy Game MB/s | 927 | 496.1 -46% | 618 -33% | 726 -22% | 1059 14% | 452.5 -51% |
* ... daha küçük daha iyidir

GPU Performansı: İstenmeyen Çok Oyunculu Oyunlar İçin Yeterince İyi
Grafik performansı, işlerin zorlaştığı yerdir. Yeni entegre Iris Plus'ın UHD Graphics 620'nin ötesinde bir lig olduğu doğru, ancak gerçek dünya performansı oyuna, API'ye veya uygulamaya bağlı olarak çok daha değişken. Burada belirtildiği gibi, 3DMark sonuçları, özellikle iki farklı GPU ailesini karşılaştırırken, gerçek dünyadaki oyun performansına zayıf bir şekilde çevriliyor. Örneğin, GeForce MX250, 3DMark benchmarklarına göre Iris Plus'tan yüzde 17 ila 36 daha hızlı. Gerçekte, MX250, başlığa bağlı olarak Iris Plus'a göre yüzde 50 ila 70 daha yüksek kare hızları sunabilir. CS: GO, Fortnite, Rocket League veya DOTA 2'nin sıradan bir oyuncusuysanız, Iris Plus'ın iş 1080p'de veya 720p'de daha da kötüye gitti. Overwatch veya Destiny 2 gibi daha zorlu oyunlar için, bunun yerine GeForce MX150 veya MX250 ile daha iyi olursunuz.


| 3DMark 11 | |
| 1280x720 Performance GPU | |
| Dell XPS 15 7590 9980HK GTX 1650 | |
| Dell Inspiron 15 7000 7577 | |
| Asus Zenbook UX510UW-CN044T | |
| Dell Inspiron 17-7786 | |
| Dell XPS 13 7390 2-in-1 Core i7 | |
| Huawei MateBook 14 KLV-W29 | |
| Dell Inspiron 15 5000 5585 | |
| Ortalama Intel Iris Plus Graphics G7 (Ice Lake 64 EU) (2112 - 4630, n=28) | |
| Lenovo Ideapad C340-14API 81N6004UGE | |
| Dell XPS 13 7390 2-in-1 Core i3 | |
| Asus ZenBook 14 UX433FA | |
| Dell XPS 15 7590 i5 iGPU FHD | |
| Dell Latitude 3400 | |
| 1280x720 Performance Combined | |
| Dell XPS 15 7590 9980HK GTX 1650 | |
| Dell Inspiron 15 7000 7577 | |
| Huawei MateBook 14 KLV-W29 | |
| Asus Zenbook UX510UW-CN044T | |
| Dell Inspiron 17-7786 | |
| Dell XPS 13 7390 2-in-1 Core i7 | |
| Dell Inspiron 15 5000 5585 | |
| Ortalama Intel Iris Plus Graphics G7 (Ice Lake 64 EU) (1319 - 4163, n=28) | |
| Lenovo Ideapad C340-14API 81N6004UGE | |
| Dell XPS 13 7390 2-in-1 Core i3 | |
| Asus ZenBook 14 UX433FA | |
| Dell XPS 15 7590 i5 iGPU FHD | |
| Dell Latitude 3400 | |
| 3DMark 06 Standard Score | 17752 puan | |
| 3DMark 11 Performance | 4958 puan | |
| 3DMark Ice Storm Standard Score | 77789 puan | |
| 3DMark Cloud Gate Standard Score | 14796 puan | |
| 3DMark Fire Strike Score | 2925 puan | |
| 3DMark Time Spy Score | 948 puan | |
Yardım | ||
| Rocket League | |
| 1920x1080 High Quality AA:High FX | |
| Dell XPS 15 7590 9980HK GTX 1650 | |
| Acer Aspire 5 A515-52G-723L | |
| Intel SDS Core i7-1065G7 Preliminary Sample 25 W | |
| Intel SDS Core i7-1065G7 Preliminary Sample 15 W | |
| Dell Inspiron 15 5000 5585 | |
| Dell XPS 13 7390 2-in-1 Core i7 | |
| Dell XPS 13 9360 FHD i7 Iris | |
| Dell XPS 13 7390 2-in-1 Core i3 | |
| Dell XPS 13 9370 FHD i5 | |
| Asus ZenBook 14 UX433FA | |
| 1920x1080 Performance | |
| Dell XPS 15 7590 9980HK GTX 1650 | |
| Dell Inspiron 15 5000 5585 | |
| Intel SDS Core i7-1065G7 Preliminary Sample 25 W | |
| Intel SDS Core i7-1065G7 Preliminary Sample 15 W | |
| Dell XPS 13 7390 2-in-1 Core i3 | |
| Dell XPS 13 7390 2-in-1 Core i7 | |
| Asus ZenBook 14 UX433FA | |
| The Witcher 3 - 1920x1080 High Graphics & Postprocessing (Nvidia HairWorks Off) | |
| Dell G5 15 5590 | |
| Dell XPS 15 7590 9980HK GTX 1650 | |
| Dell XPS 15 9575 i5-8305G | |
| Dell Inspiron 15 7000 7577 | |
| Dell XPS 15 2018 i5 FHD 97Wh | |
| Huawei MateBook 14 KLV-W29 | |
| Acer Aspire 5 A515-52G-723L | |
| Dell Inspiron 15 5000 5585 | |
| Intel SDS Core i7-1065G7 Preliminary Sample 15 W | |
| Huawei Matebook X Pro i5 | |
| Intel SDS Core i7-1065G7 Preliminary Sample 25 W | |
| Dell XPS 13 7390 2-in-1 Core i7 | |
| Dell Latitude 14 5495 | |
| Dell XPS 13 7390 2-in-1 Core i3 | |
| Shadow of the Tomb Raider - 1280x720 Lowest Preset | |
| Dell XPS 15 7590 9980HK GTX 1650 | |
| Acer Aspire 5 A515-52G-723L | |
| Dell Inspiron 15 5000 5585 | |
| Intel SDS Core i7-1065G7 Preliminary Sample 15 W | |
| Intel SDS Core i7-1065G7 Preliminary Sample 25 W | |
| Dell XPS 13 7390 2-in-1 Core i7 | |
| Dell XPS 13 9380 2019 | |
Witcher 3'te rölanti, tutarlı performans için zaman içinde hiçbir çerçeve düşmesi ve azaltma göstermez. Iris Plus, ekran yırtılmasının farkedildiği 30 FPS ile 60 FPS arasında çalışma eğiliminde olduğundan daha düzgün kare hızlandırma için v-sync işlevini kullanmanızı öneririz.
| düşük | orta | yüksek | ultra | |
|---|---|---|---|---|
| Guild Wars 2 (2012) | 105 | 33.2 | 13.9 | |
| StarCraft II: Heart of the Swarm (2013) | 321.1 | 98.1 | 61.6 | 30.6 |
| BioShock Infinite (2013) | 112.6 | 68.6 | 58.1 | 21.3 |
| The Witcher 3 (2015) | 54.9 | 34.4 | 17 | 7.8 |
| Metal Gear Solid V (2015) | 60 | 60 | 31.1 | 18.1 |
| Rise of the Tomb Raider (2016) | 42.4 | 26.9 | 14.7 | 10.5 |
| Doom (2016) | 41.2 | 20.4 | ||
| Overwatch (2016) | 91.4 | 56 | 29.7 | |
| Rocket League (2017) | 114 | 62.6 | 33.8 | |
| Destiny 2 (2017) | 29.4 | 20.4 | ||
| Shadow of the Tomb Raider (2018) | 27 | |||
| F1 2019 (2019) | 35 | 22 | 20 | 13 |
| Borderlands 3 (2019) | 31.8 | 13.8 | 8.7 | 6.6 |
Emisyonları
Sistem Gürültüsü: Tarama Sırasında Sessiz, Oyun Sırasında Yüksek Eğimli
Fan gürültüsü ve davranışı, temel performans farklılıklarına rağmen Core i3 konfigürasyonunda olduğu gibi aynı kalır. Sistem, videoya göz atarken veya video akışı yaparken sessiz ya da neredeyse sessiz. Bu arada, oyun yükleri fanları, XPS 13'ten daha yüksek olacak şekilde maksimum 43.4 dB (A) sabit bir hıza ulaşana kadar yavaşça çarpacaktır. Özellikle yüksek ses perdesi, fanların sistem altındayken olması gerekenden daha belirgin olmasını sağlar. stresli yükler.Bizim birimin klavye tuşlarının yanına bir kulak koyarken çok hafif bobin şarabı veya elektronik gürültü olduğunu görebiliyoruz. Sistemden normal bir mesafede otururken bu duyulamaz hale gelir.
| Dell XPS 13 7390 2-in-1 Core i7 Iris Plus Graphics G7 (Ice Lake 64 EU), i7-1065G7, Toshiba BG4 KBG40ZPZ512G | Dell XPS 13 7390 2-in-1 Core i3 UHD Graphics G1 (Ice Lake 32 EU), i3-1005G1, Toshiba BG4 KBG40ZPZ256G | Dell XPS 13 9380 2019 UHD Graphics 620, i5-8265U, SK hynix PC401 HFS256GD9TNG | Dell XPS 13 9370 FHD i5 UHD Graphics 620, i5-8250U, Toshiba XG5 KXG50ZNV256G | Dell XPS 13 9360 FHD i7 Iris Iris Plus Graphics 640, i7-7560U, Toshiba XG4 NVMe (THNSN5512GPUK) | Dell XPS 13-9365 2-in-1 HD Graphics 615, i7-7Y75, Toshiba NVMe THNSN5256GPUK | |
|---|---|---|---|---|---|---|
| Noise | 0% | -3% | -1% | -2% | ||
| kapalı / ortam * | 28.1 | 28 -0% | 30.4 -8% | 29.1 -4% | 29.9 -6% | |
| Idle Minimum * | 28.1 | 28 -0% | 30.4 -8% | 29.1 -4% | 29.9 -6% | |
| Idle Average * | 28.1 | 28 -0% | 30.4 -8% | 29.1 -4% | 29.9 -6% | |
| Idle Maximum * | 28.1 | 28 -0% | 30.4 -8% | 29.1 -4% | 30.3 -8% | |
| Load Average * | 31.7 | 31.7 -0% | 31.7 -0% | 32.2 -2% | 33.9 -7% | |
| Witcher 3 ultra * | 43.4 | |||||
| Load Maximum * | 43.4 | 43.5 -0% | 38.1 12% | 37.3 14% | 34.9 20% |
* ... daha küçük daha iyidir
Ses yüksekliği
| Boşta |
| 28.1 / 28.1 / 28.1 dB |
| Çalışırken |
| 31.7 / 43.4 dB |
 | ||
30 dB sessiz 40 dB(A) duyulabilirlik 50 dB(A) gürültülü |
||
min: | ||
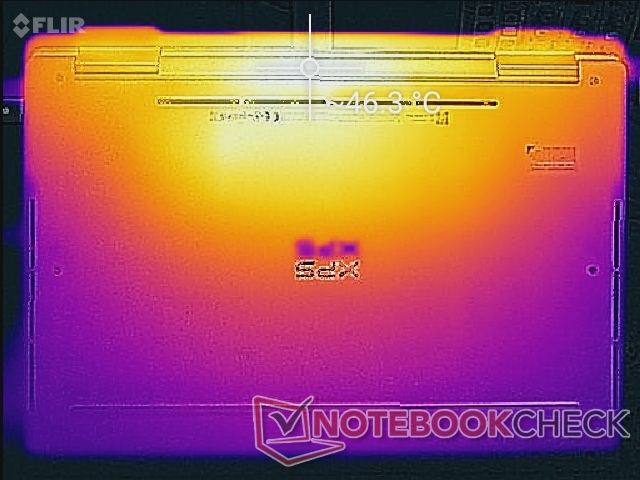
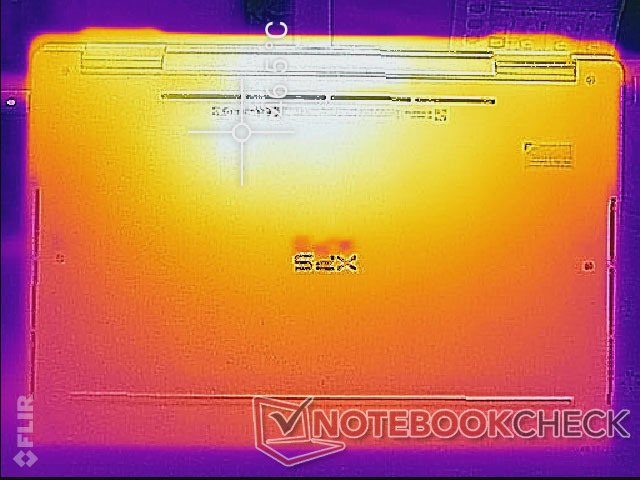
Sıcaklık: Çekirdek i3 SKU Neredeyse aynı
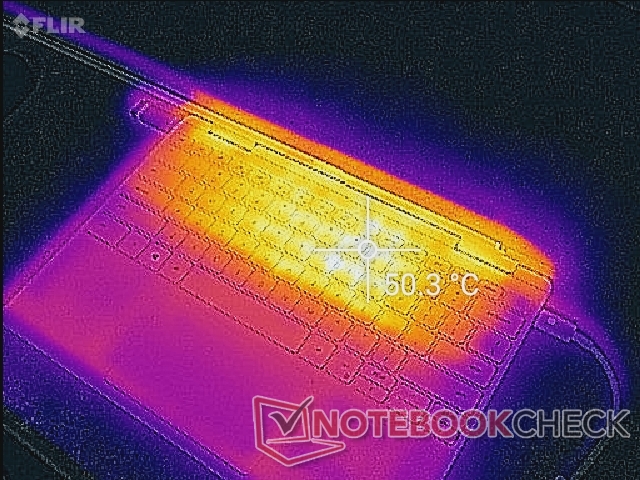
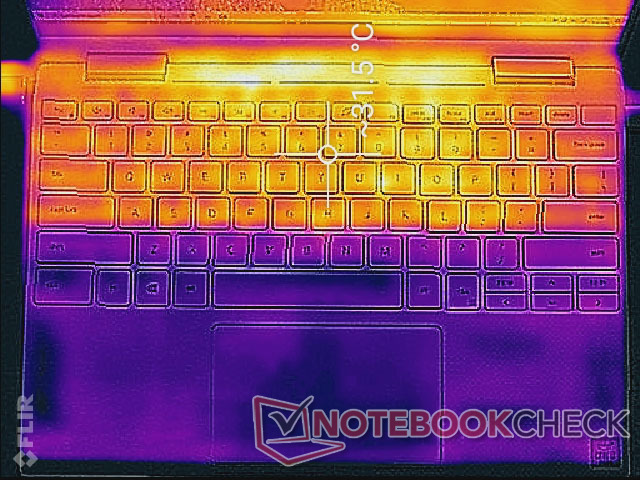
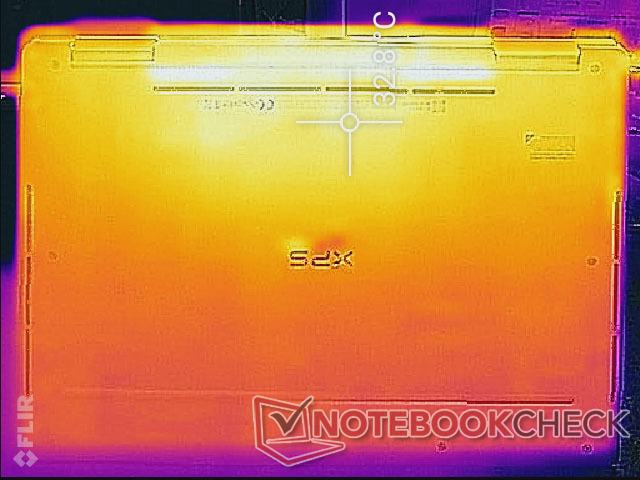
Yüzey sıcaklıkları Core i7 konfigürasyonunda gözlemlediklerimizle aynı kalıyor. Yüzeyler yüke bağlı olarak 30 C ile 50 C arasında değişebilir. Sıcak noktalar, birimin arkasına doğru, klavyeden ve avuç içi dayanaklarından uzakta olacak şekilde yerleştirilmiştir.
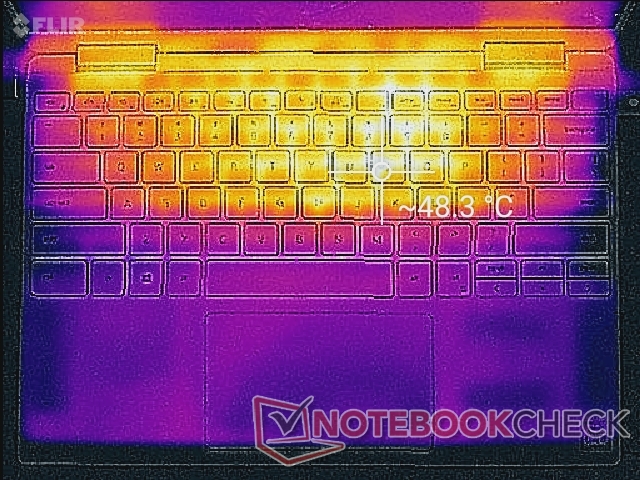
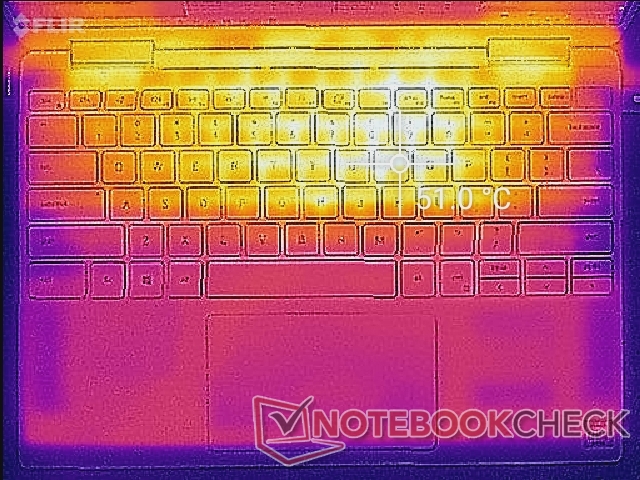
(-) Üst taraftaki maksimum sıcaklık, 35.3 °C / 96 F ortalamasına kıyasla 51.4 °C / 125 F'dir. , Convertible sınıfı için 19.6 ile 60 °C arasında değişir.
(-) Alt kısım, 36.8 °C / 98 F ortalamasına kıyasla maksimum 46.4 °C / 116 F'ye kadar ısınır
(+) Boşta kullanımda, üst tarafın ortalama sıcaklığı 30.3 °C / 87 F olup, cihazın 30.3 °C / 87 F.
(±) The Witcher 3 oynarken, üst tarafın ortalama sıcaklığı 37.7 °C / 100 F olup, cihazın 30.3 °C / 87 F.
(+) Avuç içi dayanakları ve dokunmatik yüzey maksimum (33.8 °C / 92.8 F) cilt sıcaklığına ulaşıyor ve bu nedenle sıcak değil.
(-) Benzer cihazların avuç içi dayanağı alanının ortalama sıcaklığı 28 °C / 82.4 F (-5.8 °C / -10.4 F) idi.
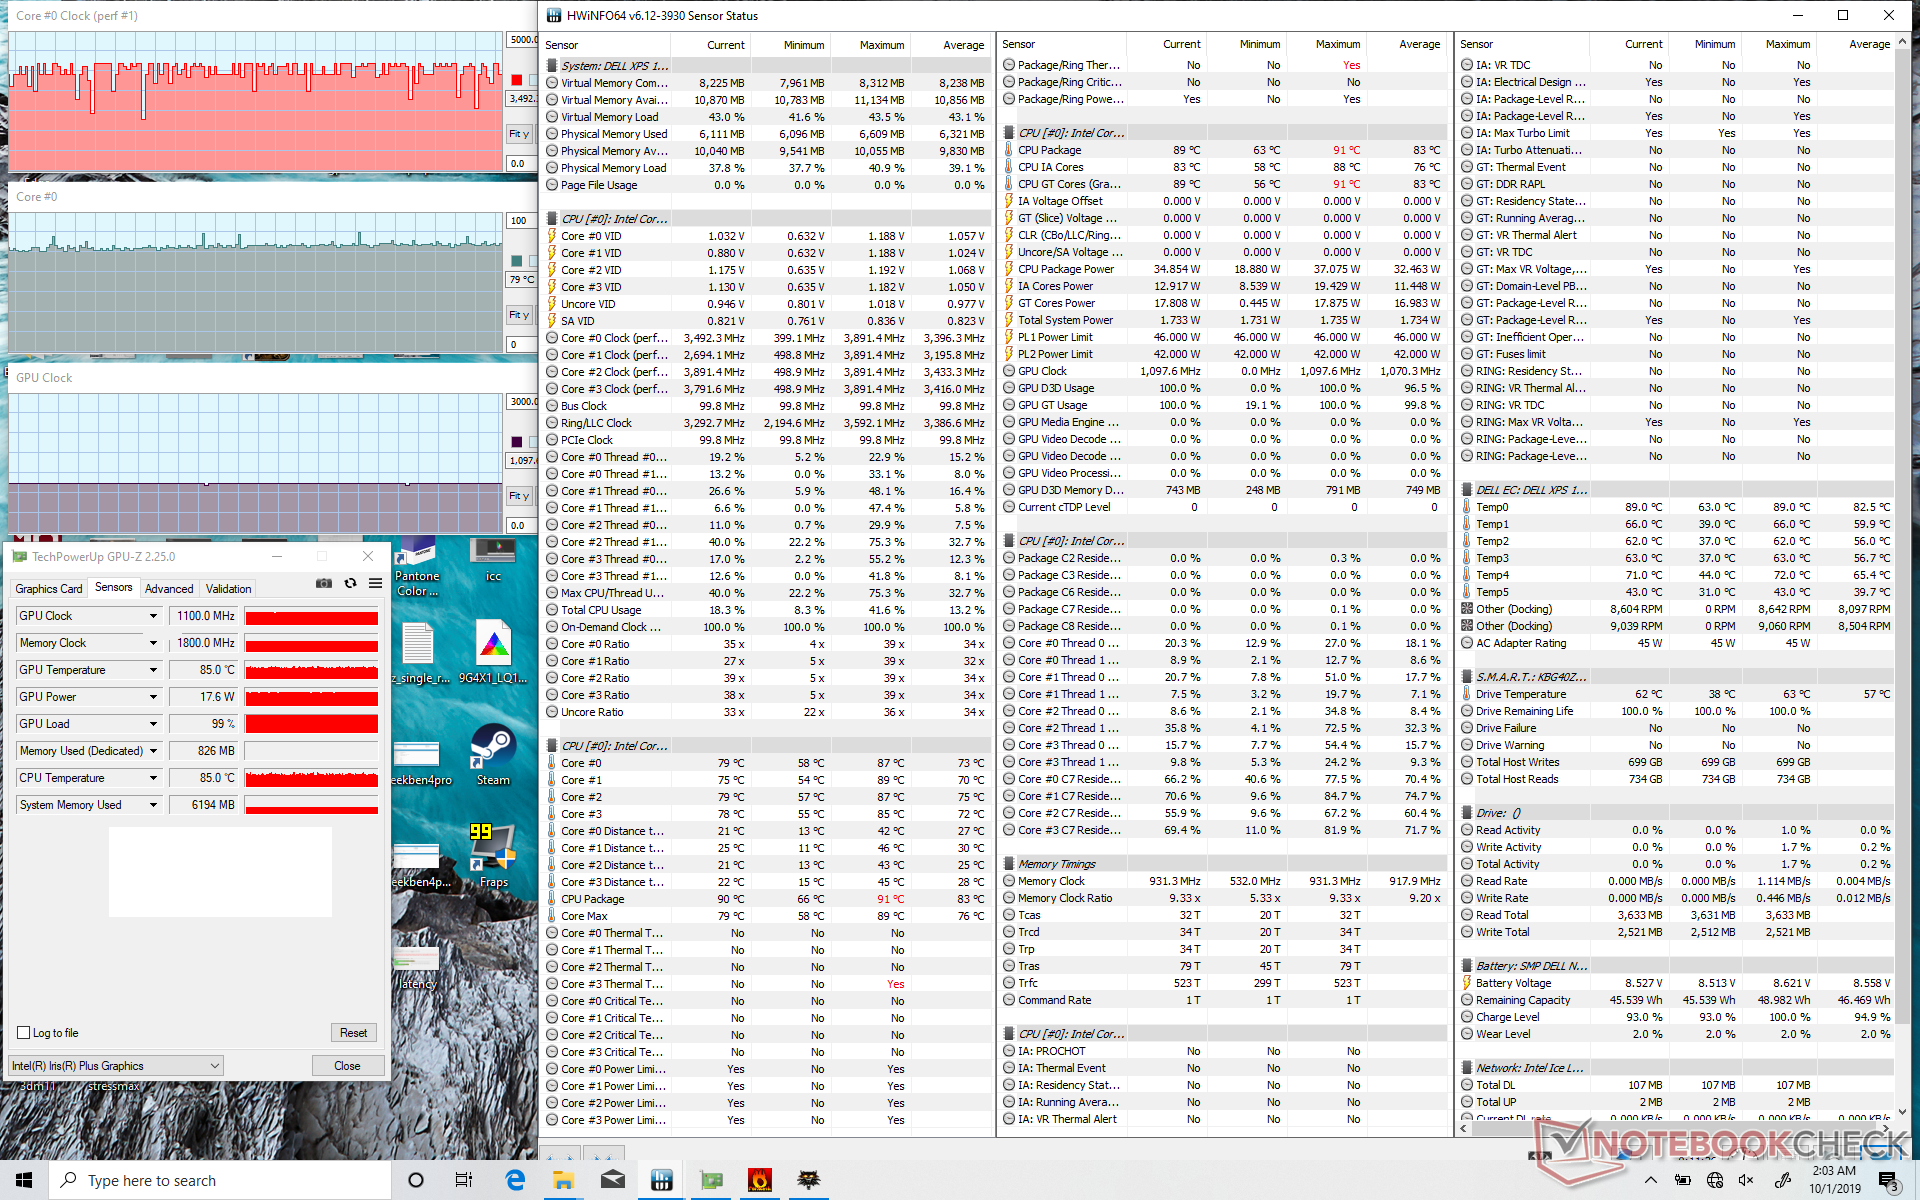
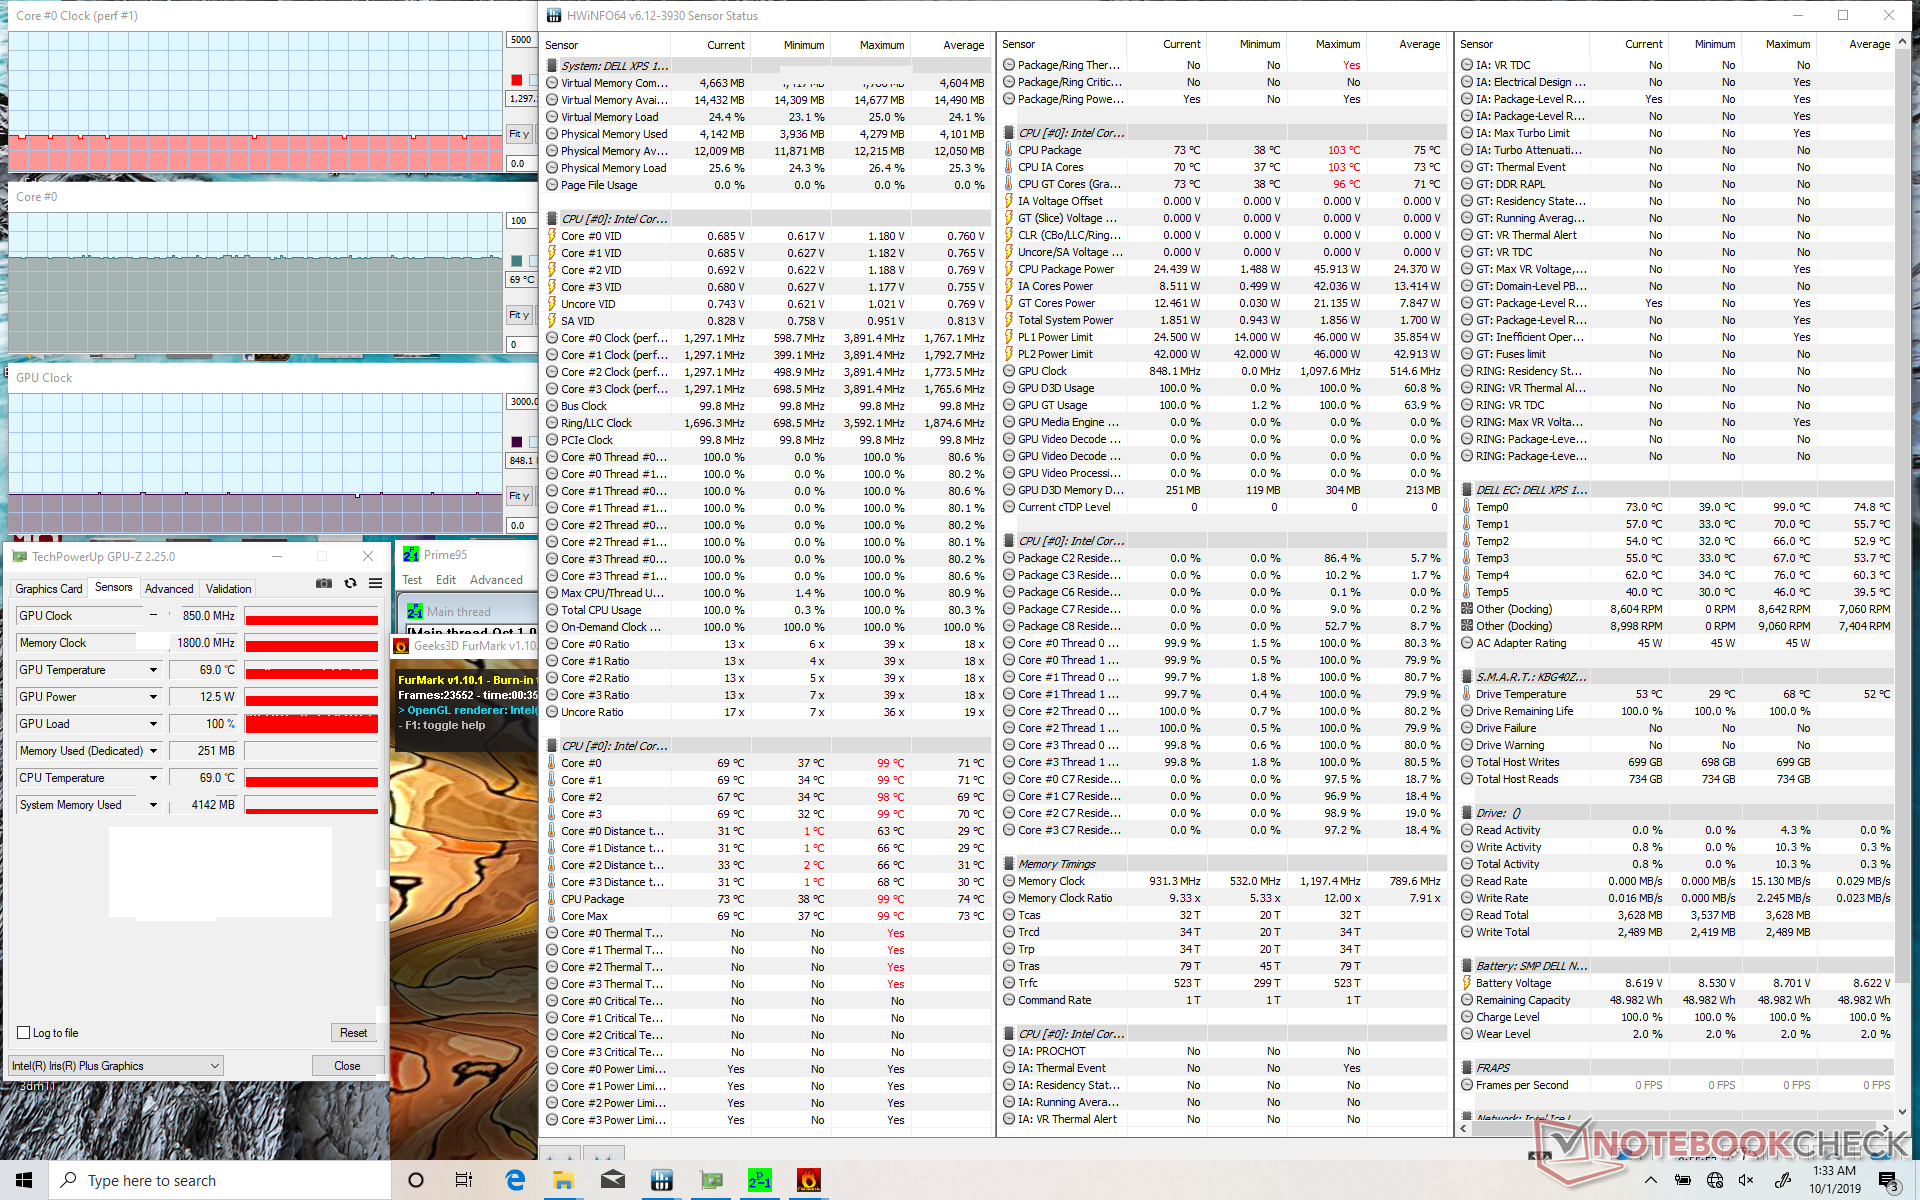
Stres Testi:> 95 Derece C de sabit
İşlemci davranışını gözlemlemek ve olası azaltma sorunları için tanımlamak için sistemi sentetik yüklerle vurguluyoruz. Prime95'i çalıştırırken, saat hızları daha sonra 3,0 ila 3,1 GHz'de sabitlenmeden önce ilk dakika kadar 2,9 ila 3,5 GHz arasında geçiş yapar. Çekirdek sıcaklığı, diğer Ultrabook'lardan çok daha sıcak olması için yaklaşık 98 ° C sıcaklıkta sabitlenene kadar yavaşça tırmanıyor. Bu çok yüksek sıcaklık, normalden daha hızlı ve sürekli saat hızları sağladığı için Dell ve Intel'den gelen kasıtlı bir "özelliktir". Son nesil Core i7-8565U'ya sahip Asus ZenBook S13, örneğin, daha düşük bir 60 ° C sıcaklıkta ancak benzer Prime95 koşullarında daha yavaş bir 2.0 GHz saat hızında stabilize oluyor. Hem Prime95'i hem de FurMark'ı aynı anda çalıştırmak, hem maksimum CPU hem de GPU kullanımıyla başa çıkmak için elinden gelenin en iyisini yaptığı için işlemciyi sadece 1.3 GHz ve 69 C'ye düşürecektir. Running Witcher 3, gerçek dünyadaki oyun koşullarının daha temsilcisidir. GPU saat hızı ve sıcaklığı, GPU-Z'ye göre 1097 MHz ve 79 ° C ila 85 ° C arasında sabit kalır. Core i7 Buz Gölü İşlemcisi, Kaby Gölü-R veya Whiskey Gölü-U ailelerinin görmeye alıştığımızdan daha sıcak çalışıyor. Aküler üzerinde yapılan bir 3DMark Bulut Kapısı testi, şebekedeki 8421 ve 18881 puanlara göre sırasıyla 8365 ve 13471 puanlık Fizik ve Grafik puanlarını verir.
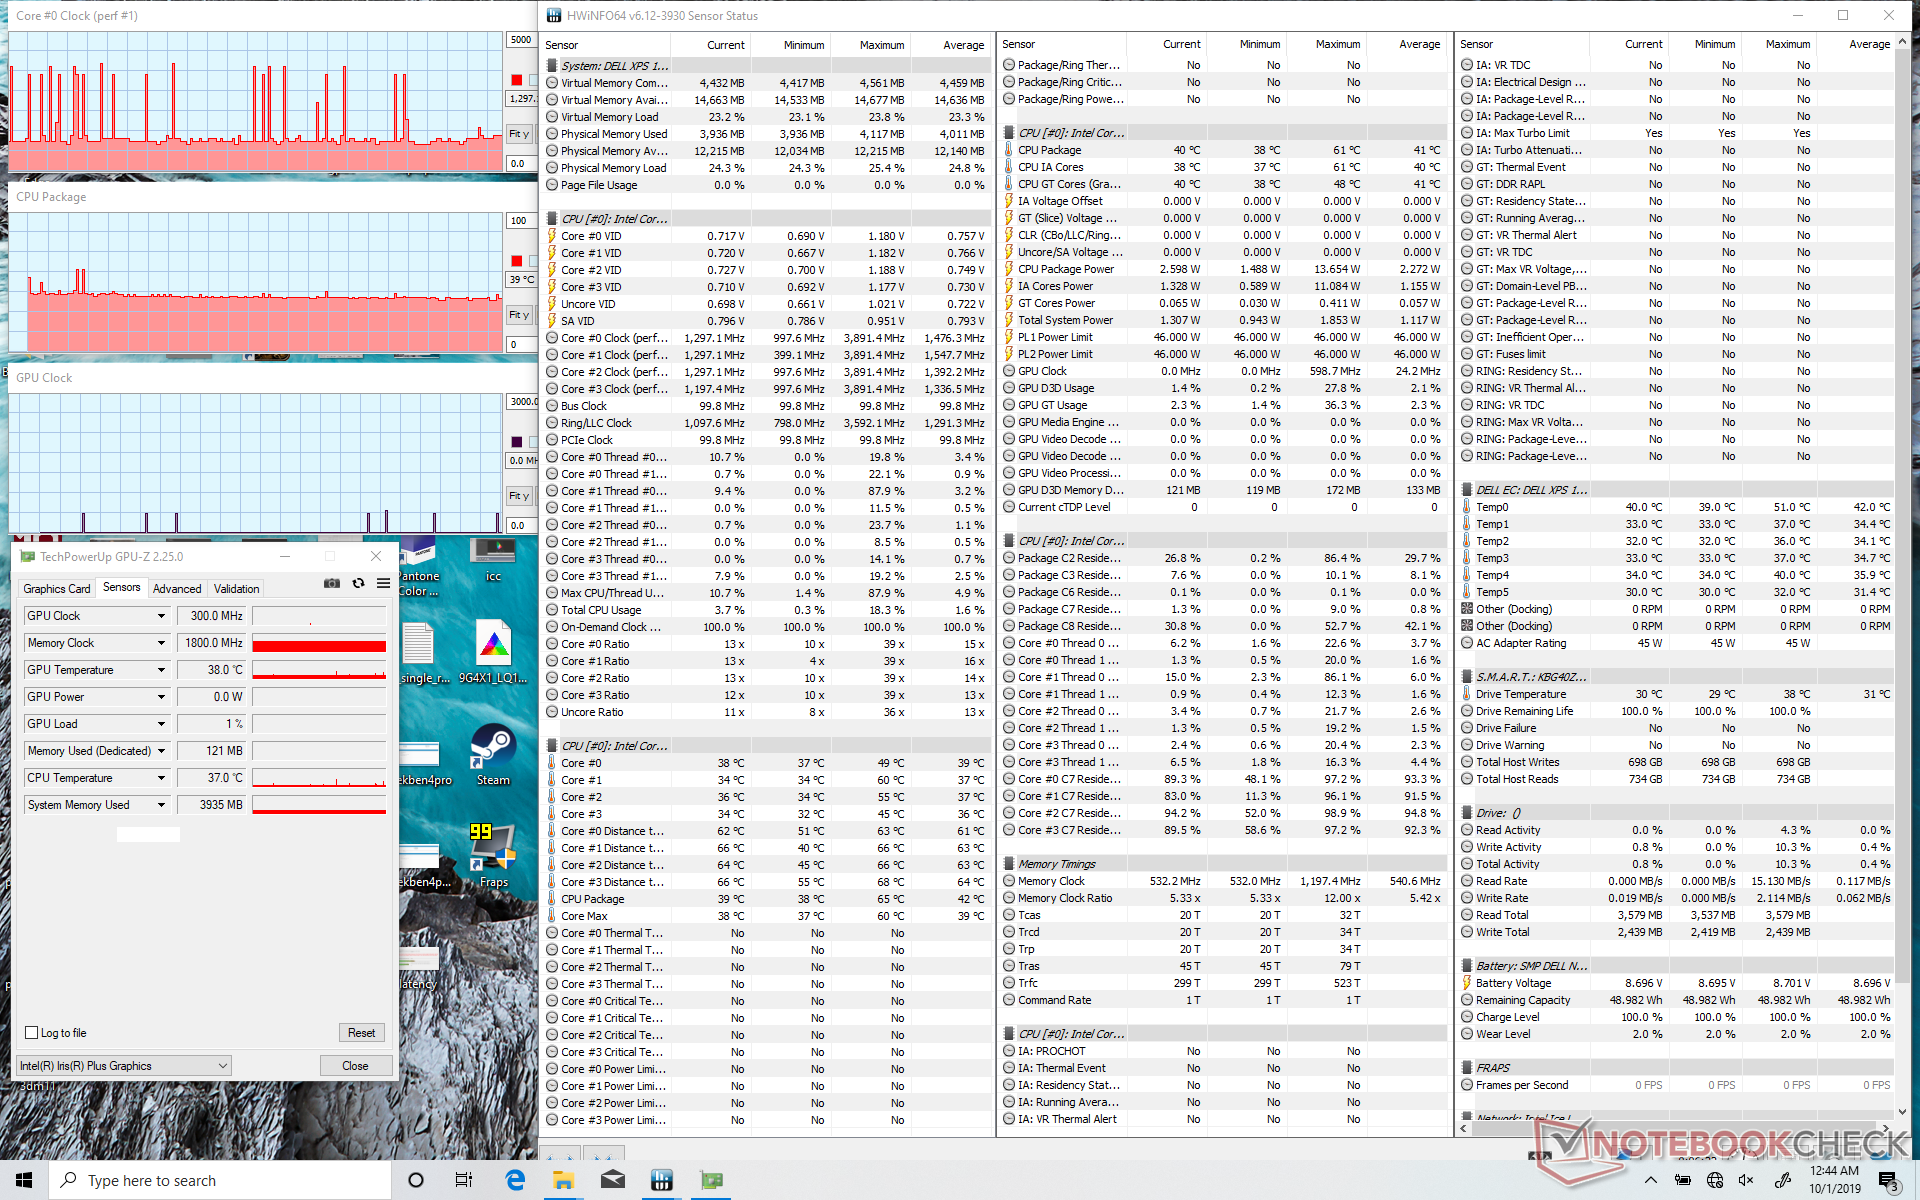

| CPU Clock (GHz) | GPU Clock (MHz) | Average CPU Temperature (°C) | |
| System Idle | -- | -- | 39 |
| Prime95 Stress | 3.0 | -- | ~99 |
| Prime95 + FurMark Stress | 1.3 | 848 | 69 |
| Witcher 3 Stress | ~3.5 | 1097 | 79 - 85 |
Hoparlörler
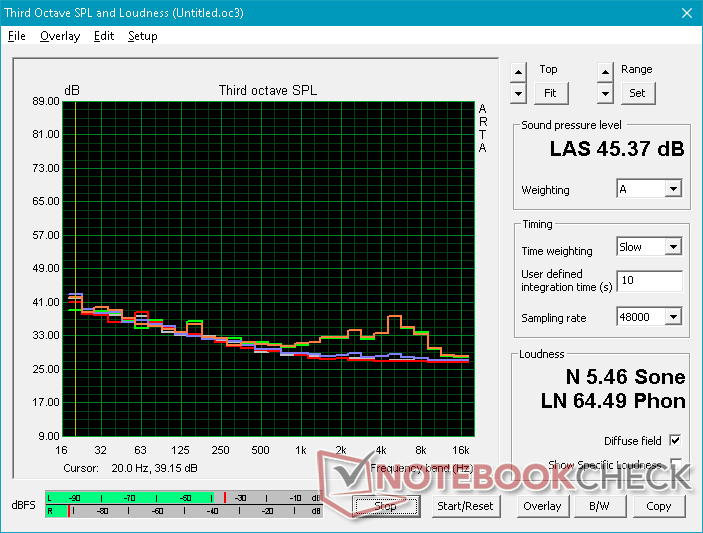
Waves MaxxAudio 2 x 2 W stereo hoparlörler, Core i3 ünitesinde yaşadıklarımızdan farklı olarak bu sefer gerçekten çalışıyor. Ses kalitesi, yaklaşık 250 Hz'ye kadar dik bir yuvarlama olmadan dönüştürülebilir bir subnotebooktan beklenenden daha iyidir. Tiz ve bas nispeten dengeli hissediyor.


Dell XPS 13 7390 2-in-1 Core i7 ses analizi
(±) | hoparlör ses yüksekliği ortalama ama iyi (80.7 dB)
Bas 100 - 315Hz
(±) | azaltılmış bas - ortalama olarak medyandan 7.8% daha düşük
(±) | Bas doğrusallığı ortalamadır (12.5% delta - önceki frekans)
Ortalar 400 - 2000 Hz
(+) | dengeli ortalar - medyandan yalnızca 4.5% uzakta
(+) | orta frekanslar doğrusaldır (6.2% deltadan önceki frekansa)
Yüksekler 2 - 16 kHz
(+) | dengeli yüksekler - medyandan yalnızca 3.4% uzakta
(±) | Yükseklerin doğrusallığı ortalamadır (10.5% delta - önceki frekans)
Toplam 100 - 16.000 Hz
(+) | genel ses doğrusaldır (14.8% ortancaya göre fark)
Aynı sınıfla karşılaştırıldığında
» Bu sınıftaki tüm test edilen cihazların %22%'si daha iyi, 4% benzer, 74% daha kötüydü
» En iyisinin deltası 6% idi, ortalama 20% idi, en kötüsü 57% idi
Test edilen tüm cihazlarla karşılaştırıldığında
» Test edilen tüm cihazların %18'si daha iyi, 4 benzer, % 78 daha kötüydü
» En iyisinin deltası 4% idi, ortalama 24% idi, en kötüsü 134% idi
Apple MacBook 12 (Early 2016) 1.1 GHz ses analizi
(+) | hoparlörler nispeten yüksek sesle çalabilir (83.6 dB)
Bas 100 - 315Hz
(±) | azaltılmış bas - ortalama olarak medyandan 11.3% daha düşük
(±) | Bas doğrusallığı ortalamadır (14.2% delta - önceki frekans)
Ortalar 400 - 2000 Hz
(+) | dengeli ortalar - medyandan yalnızca 2.4% uzakta
(+) | orta frekanslar doğrusaldır (5.5% deltadan önceki frekansa)
Yüksekler 2 - 16 kHz
(+) | dengeli yüksekler - medyandan yalnızca 2% uzakta
(+) | yüksekler doğrusaldır (4.5% deltadan önceki frekansa)
Toplam 100 - 16.000 Hz
(+) | genel ses doğrusaldır (10.2% ortancaya göre fark)
Aynı sınıfla karşılaştırıldığında
» Bu sınıftaki tüm test edilen cihazların %6%'si daha iyi, 2% benzer, 91% daha kötüydü
» En iyisinin deltası 5% idi, ortalama 19% idi, en kötüsü 53% idi
Test edilen tüm cihazlarla karşılaştırıldığında
» Test edilen tüm cihazların %4'si daha iyi, 1 benzer, % 95 daha kötüydü
» En iyisinin deltası 4% idi, ortalama 24% idi, en kötüsü 134% idi
Enerji yönetimi
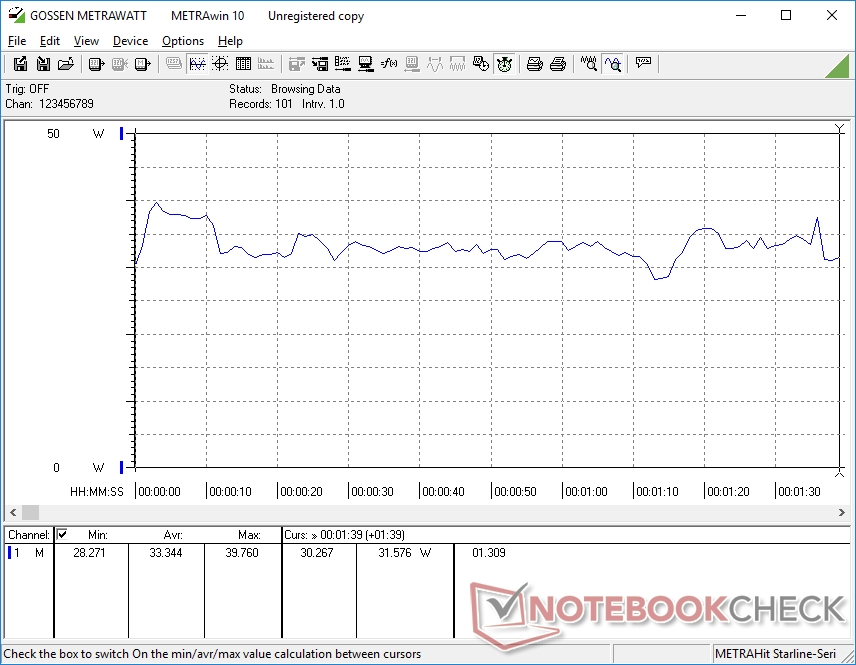
Güç tüketimi
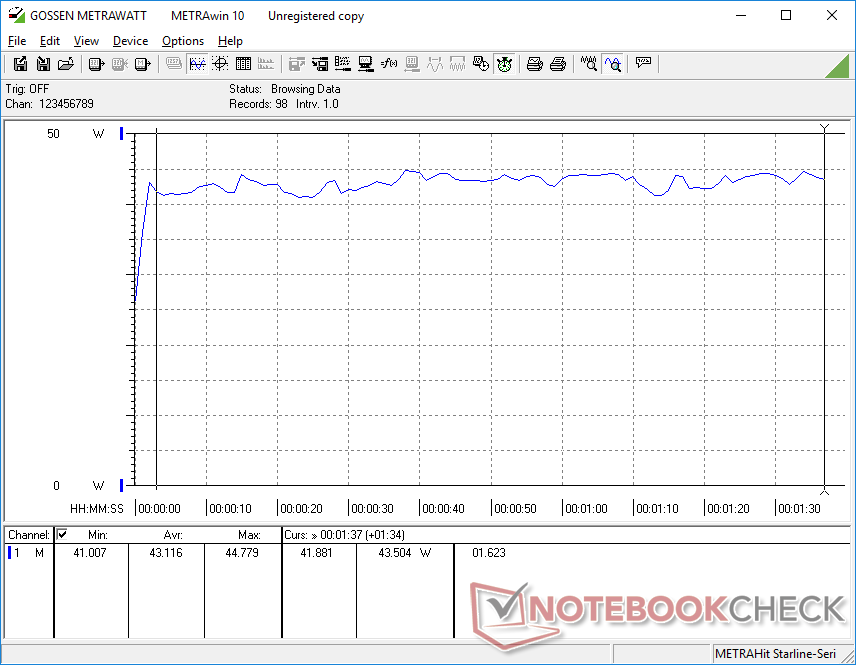
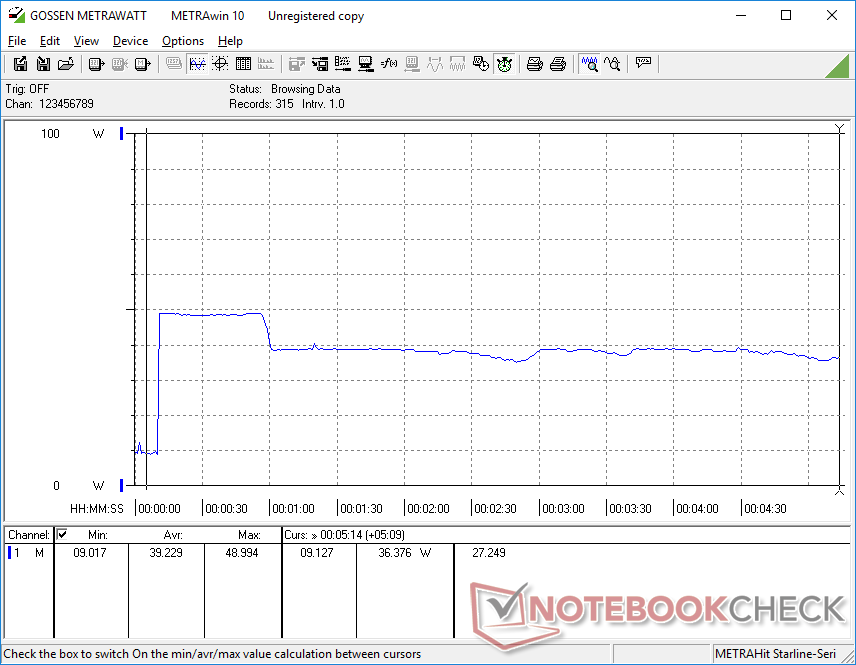
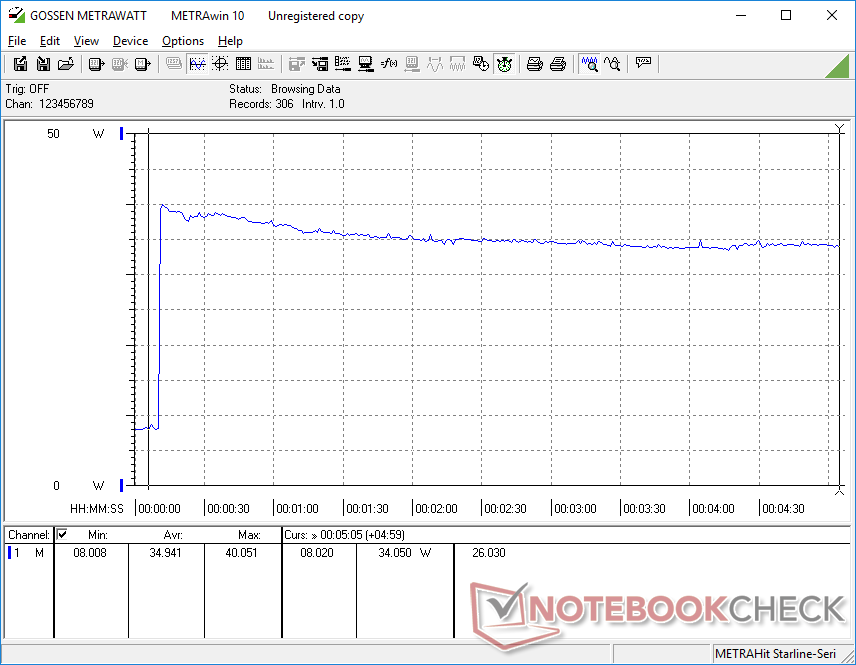
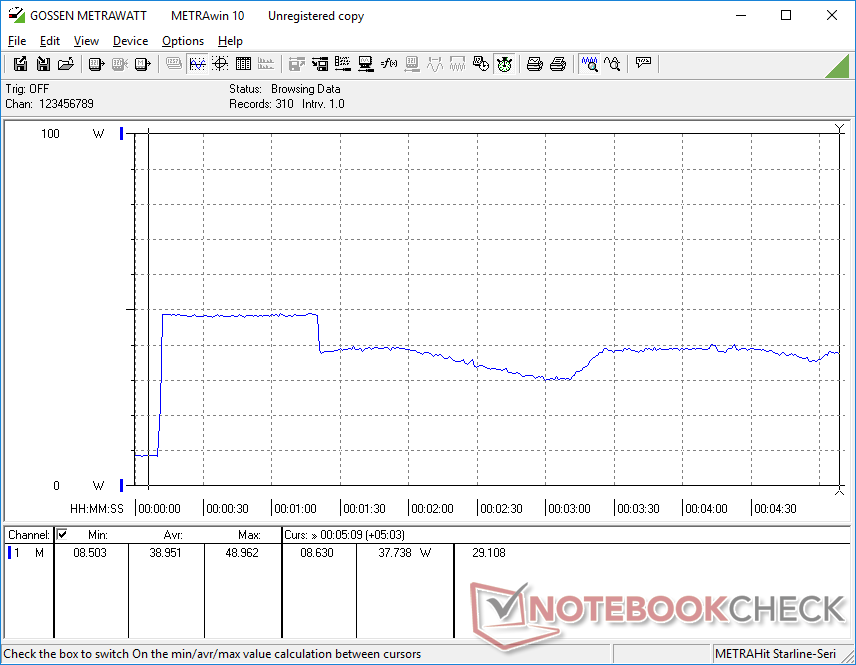
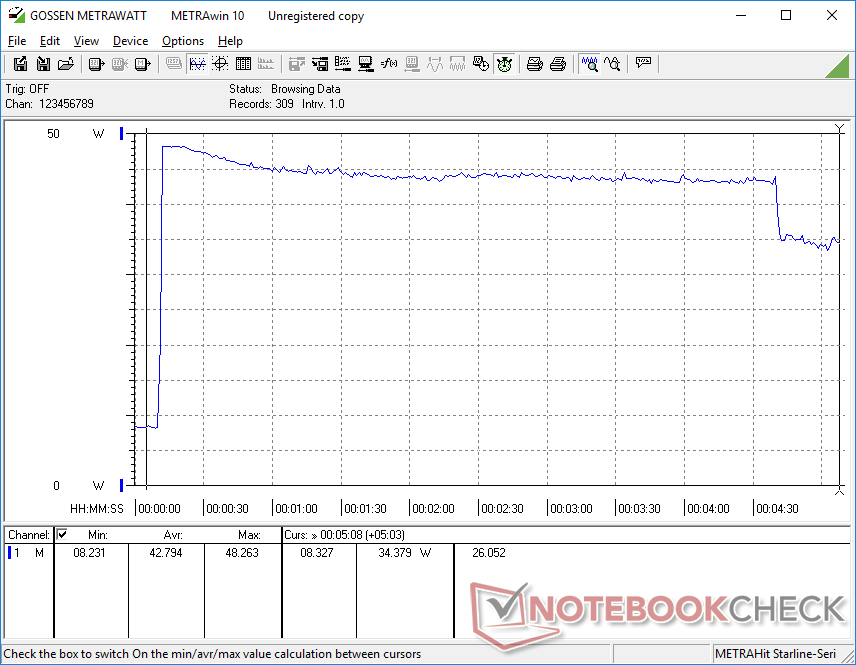
Rölantide iken sarfiyat, esas olarak parlaklık ayarına ve güç profiline bağlı olarak 3 W ila 7 W'deki Core i3 SKU ile aynıdır. Bunun yerine, sistem stres altındayken tüketimin nasıl değişebileceği ile de ilgileniyoruz. Core i7 SKU'da Prime95 kullanırken, tüketim yaklaşık 36 W'da hızlı bir şekilde düşmeden ve dengelenmeden önce tüketim yaklaşık 50 saniye boyunca 49 W'a çıkıyor. Core i3 SKU, yaklaşık 34 W'da sabit bir şekilde düşmeden ve dengelemeden önce tüketimin sadece 40 W'a çıkmasına neden olacaktır. Core i7 SKU, Core i3 SKU'dan ve hem güç tüketimimizden hem de CineBench'ten daha uzun süre CPU Turbo Boost saat hızlarını koruyabilir döngü testi gözlemleri bunu yansıtır. Yüzde 100 kullanım (Prime95 FurMark) kullanımına maruz kaldığında, tüketim yine çok küçük (~ 6.0 x 5.5 x 2.3 cm) 45 AC adaptörden yaklaşık 49 W'a çıkar. Bu sonuçta, yukarıdaki Stres Test bölümümüzün çok yüksek çekirdek sıcaklıkları tarafından örneklenen termal sınırlamalar nedeniyle, ilk dakikadan sonra yaklaşık 37 W'a düşer. Aşağıdaki grafikler, farklı idarelerdeki Core i7 ve Core i3 SKU'lar arasındaki güç tüketimi davranışlarını karşılaştırmaktadır. senaryoları. Ölçeklerinin aynı olmadığını unutmayın.
| Kapalı / Bekleme modu | |
| Boşta | |
| Çalışırken |
|
Key:
min: | |
| Dell XPS 13 7390 2-in-1 Core i7 i7-1065G7, Iris Plus Graphics G7 (Ice Lake 64 EU), Toshiba BG4 KBG40ZPZ512G, IPS, 1920x1200, 13.4" | HP Envy x360 13-ar0601ng R7 3700U, Vega 10, SK Hynix BC501 HFM512GDJTNG, IPS, 120 Hz, 1920x1080, 13.3" | Dell XPS 13 7390 2-in-1 Core i3 i3-1005G1, UHD Graphics G1 (Ice Lake 32 EU), Toshiba BG4 KBG40ZPZ256G, IPS, 1920x1200, 13.4" | Dell XPS 13 9380 2019 i5-8265U, UHD Graphics 620, SK hynix PC401 HFS256GD9TNG, IPS, 3840x2160, 13.3" | Dell XPS 13 9370 FHD i5 i5-8250U, UHD Graphics 620, Toshiba XG5 KXG50ZNV256G, IPS, 1920x1080, 13.3" | Dell XPS 13-9365 2-in-1 i7-7Y75, HD Graphics 615, Toshiba NVMe THNSN5256GPUK, IPS, 1920x1080, 13.3" | |
|---|---|---|---|---|---|---|
| Power Consumption | -2% | 1% | -37% | 1% | 25% | |
| Idle Minimum * | 2.6 | 3.2 -23% | 3 -15% | 4.8 -85% | 3.14 -21% | 3.1 -19% |
| Idle Average * | 5.3 | 2.8 47% | 5.4 -2% | 8.6 -62% | 5.22 2% | 4.3 19% |
| Idle Maximum * | 7 | 12.4 -77% | 7.3 -4% | 10.4 -49% | 6 14% | 4.9 30% |
| Load Average * | 43.1 | 24.2 44% | 33.4 23% | 37.9 12% | 38.5 11% | 24.3 44% |
| Witcher 3 ultra * | 43.1 | |||||
| Load Maximum * | 49 | 50 -2% | 48.3 1% | 48.5 1% | 50.4 -3% | 22.8 53% |
* ... daha küçük daha iyidir
Pil Ömrü: Tüm Gün Gezen ve Daha Fazlası
XPS 13 7390 2-in-1'in Core i3 ve Core i7 SKU'ları arasında aynı 150 nit WLAN testini yaptık ve sonuçları neredeyse aynıydı. Kullanıcılar, işlemci seçeneğine bakılmaksızın 9 saat boyunca gerçek dünya göz atma kullanımından yalnızca kısa bir süre bekleyebilirler. Ekranı daha parlak yapmak veya 4K UHD SKU’yu seçmek tercih etmeden pil ömrünü kısaltacaktır.
| Dell XPS 13 7390 2-in-1 Core i7 i7-1065G7, Iris Plus Graphics G7 (Ice Lake 64 EU), 51 Wh | Dell XPS 13 7390 2-in-1 Core i3 i3-1005G1, UHD Graphics G1 (Ice Lake 32 EU), 51 Wh | Dell XPS 13 9380 2019 i5-8265U, UHD Graphics 620, 52 Wh | Dell XPS 13 9370 FHD i5 i5-8250U, UHD Graphics 620, 52 Wh | Dell XPS 13 9360 FHD i7 Iris i7-7560U, Iris Plus Graphics 640, 60 Wh | Dell XPS 13-9365 2-in-1 i7-7Y75, HD Graphics 615, 46 Wh | |
|---|---|---|---|---|---|---|
| Pil Çalışma Süresi | 0% | -7% | 20% | 22% | 28% | |
| WiFi v1.3 | 537 | 535 0% | 498 -7% | 644 20% | 655 22% | 686 28% |
| Reader / Idle | 2139 | 1032 | 1417 | 1521 | 971 | |
| Load | 130 | 141 | 119 | 154 | 175 |
Artılar
Eksiler
Karar
XPS 13 7390 2-in-1 için göz önünde bulundurulması gereken iki önemli özellik var: Yeni işlemci ve ardından dizüstü bilgisayarın kendisi. 25 W Buz Gölü CPU, hem CPU hem de GPU beygir gücündeki son nesil 15 W Whiskey Lake-U serisine göre ölçülebilir bir yükseltmedir. Deltalar, bu dönüştürülebilir malzemenin kendisinden önce gelen tüm XPS 13 modellerinden daha iyi performans gösterebilmesi için yeterince geniş. Bir subnotebook'ta en popüler çok oyunculu başlıkları çalıştırabilmeniz bu ince ve hafif, CPU'nun normalden çok daha sıcak çalışması gerekse bile zaten kayda değer bir başarıdır. Bu durumda, Ice Lake, Intel’in istediğini elde etti: 35 W AMD Ryzen 7 3700U’ya Watt başına daha yüksek bir performansla karşılaştırılabilir ham performans sunarken, AI hızlandırmayı serileri daha iyi hale getirecek şekilde bir araya getirdi. XPS 13 7390 2'si 1 arada dizüstü bilgisayar, fanların yüksek yükler sırasında daha belirgin olmadıklarını ve sıkışık Ok tuşlarının daha büyük olabileceğini düşünüyoruz. Aksi halde, parlak paneli, geniş renk gamını, uzun pil ömrünü ve çok küçük form faktörünü sevdiğimizden hoşlanmayan pek bir şey yoktur. Pil ömrü, fan davranışı ve sıcaklıklar performans farklılıklarına rağmen Core i3 SKU'ya benzer. Bunun yerine, burada sevmediğimiz bir şey yok, çünkü dönüştürülebilir barebonları hissediyor ve özelliklerden arınmış. HP, kendi Ice Lake ile çalışan Spectre x360 13'ü piyasaya sürmek üzere ve Dell'de yükseltilemez depolama, 4G LTE, eSIM, HDMI, USB Tip-A ve daha da parlak 1000 nit nitelikler içeren bir avuç özellikle yenilenmiş EliteBook'u yeniliyor. panel. Sadece en son XPS 13 2-in-1'in ince estetiği için birçok ekstradan vazgeçeceksiniz. XPS 13 7390 2-in-1, mütevazi görünümünün önerebileceğinden daha hızlı çalışıyor. Kapak tarafında, süper ince tasarımı, birçok rakip Ultrabook'un standart olarak sunma eğiliminde olduğu son kullanıcı yükseltme seçeneklerini ve bağlantı özelliklerini atladı.
Dell XPS 13 7390 2-in-1 Core i7
- 05/15/2020 v7 (old)
Allen Ngo
Price comparison
