

Kısa inceleme: Dell Precision 7720 (Xeon, P5000, 4K) çalışma istasyonu


| Networking | |
| iperf3 transmit AX12 | |
| HP ZBook 17 G4-Y3J82AV | |
| Dell Precision 7720 | |
| Lenovo ThinkPad P71-20HK0004GE | |
| Fujitsu Celsius H970 | |
| MSI WE72 7RJ | |
| iperf3 receive AX12 | |
| Fujitsu Celsius H970 | |
| Lenovo ThinkPad P71-20HK0004GE | |
| HP ZBook 17 G4-Y3J82AV | |
| Dell Precision 7720 | |
| MSI WE72 7RJ | |
Ekran Titremesi / PWM (Darbe Genişliği Modülasyonu)
| Ekran titriyor / PWM algılandı | 1020 Hz | ≤ 20 % parlaklık ayarı |  |
Ekran arka ışığı 1020 Hz'de titriyor (en kötü durum, örneğin PWM kullanılması) 20 % ve altındaki parlaklık ayarında titreme algılandı. Bu parlaklık ayarının üzerinde titreme veya PWM olmamalıdır. 1020 Hz frekansı oldukça yüksektir, bu nedenle PWM'ye duyarlı çoğu kullanıcı herhangi bir titremeyi fark etmemelidir. Karşılaştırıldığında: Test edilen tüm cihazların %53 %'si ekranı karartmak için PWM kullanmıyor. PWM tespit edilirse, ortalama 8516 (minimum: 5 - maksimum: 343500) Hz ölçüldü. | |||
| |||||||||||||||||||||||||
Aydınlatma: 89 %
Batarya modunda parlaklık: 462 cd/m²
Kontrast: 1031:1 (Siyah: 0.45 cd/m²)
ΔE Color 3.2 | 0.5-29.43 Ø4.87
ΔE Greyscale 4.2 | 0.5-98 Ø5.1
100% sRGB (Argyll 1.6.3 3D)
88.1% AdobeRGB 1998 (Argyll 1.6.3 3D)
99.2% AdobeRGB 1998 (Argyll 2.2.0 3D)
100% sRGB (Argyll 2.2.0 3D)
87.6% Display P3 (Argyll 2.2.0 3D)
Gamma: 2.01
| Dell Precision 7720 SHP1446 (LQ173D1), , 3840x2160, 17.3" | Lenovo ThinkPad P71-20HK0004GE LEN4123, VVX17P051J00, , 3840x2160, 17.3" | HP ZBook 17 G4-Y3J82AV Sharp SHP144C, , 3840x2160, 17.3" | MSI WE72 7RJ LP173WF4-SPF1, , 1920x1080, 17.3" | Fujitsu Celsius H970 LP173WF4-SPF3, , 1920x1080, 17.3" | Dell Precision 7710 SDC8151, VHN17_173HL, , 1920x1080, 17.3" | |
|---|---|---|---|---|---|---|
| Display | 0% | -25% | -26% | -19% | ||
| Display P3 Coverage | 87.6 | 88 0% | 67.4 -23% | 66.8 -24% | 66.6 -24% | |
| sRGB Coverage | 100 | 100 0% | 85.3 -15% | 84.6 -15% | 96.9 -3% | |
| AdobeRGB 1998 Coverage | 99.2 | 99.6 0% | 62.4 -37% | 61.8 -38% | 68.6 -31% | |
| Response Times | 41% | 7% | 34% | 45% | -14% | |
| Response Time Grey 50% / Grey 80% * | 60 ? | 39.2 ? 35% | 56.8 ? 5% | 45.2 ? 25% | 32 ? 47% | 50 ? 17% |
| Response Time Black / White * | 46.4 ? | 23.2 ? 50% | 38.4 ? 17% | 26.4 ? 43% | 26.4 ? 43% | 36 ? 22% |
| PWM Frequency | 1020 ? | 1412 ? 38% | 1020 ? 0% | 198 ? -81% | ||
| Screen | 10% | 17% | -33% | -28% | -7% | |
| Brightness middle | 464 | 358 -23% | 391 -16% | 302 -35% | 368 -21% | 332 -28% |
| Brightness | 441 | 338 -23% | 360 -18% | 306 -31% | 360 -18% | 307 -30% |
| Brightness Distribution | 89 | 83 -7% | 87 -2% | 93 4% | 91 2% | 83 -7% |
| Black Level * | 0.45 | 0.31 31% | 0.35 22% | 0.31 31% | 0.3 33% | 0.33 27% |
| Contrast | 1031 | 1155 12% | 1117 8% | 974 -6% | 1227 19% | 1006 -2% |
| Colorchecker dE 2000 * | 3.2 | 2.1 34% | 1.3 59% | 6.2 -94% | 6.4 -100% | 3 6% |
| Colorchecker dE 2000 max. * | 6.1 | 3.6 41% | 2.5 59% | 10.6 -74% | 10.1 -66% | |
| Greyscale dE 2000 * | 4.2 | 2 52% | 1.8 57% | 7.3 -74% | 7.2 -71% | 4 5% |
| Gamma | 2.01 109% | 2.16 102% | 2.11 104% | 2.08 106% | 2.02 109% | 2 110% |
| CCT | 6736 96% | 6216 105% | 6461 101% | 7020 93% | 6882 94% | 7089 92% |
| Color Space (Percent of AdobeRGB 1998) | 88.1 | 77 -13% | 87.9 0% | 56 -36% | 55.5 -37% | 62 -30% |
| Color Space (Percent of sRGB) | 100 | 99.97 0% | 100 0% | 85.2 -15% | 84.4 -16% | 97 -3% |
| Toplam Ortalama (Program / Ayarlar) | 26% /
17% | 8% /
12% | -8% /
-22% | -3% /
-17% | -13% /
-11% |
* ... daha küçük daha iyidir
Yanıt Sürelerini Görüntüle
| ↔ Tepki Süresi Siyahtan Beyaza | ||
|---|---|---|
| 46.4 ms ... yükseliş ↗ ve sonbahar↘ birleşimi | ↗ 28.4 ms yükseliş |  |
| ↘ 18 ms sonbahar | ||
| Ekran, testlerimizde yavaş yanıt oranları gösteriyor ve oyuncular için yetersiz olacaktır. Karşılaştırıldığında, test edilen tüm cihazlar 0.1 (minimum) ile 240 (maksimum) ms arasında değişir. » Tüm cihazların 99 %'si daha iyi. Bu, ölçülen yanıt süresinin test edilen tüm cihazların ortalamasından (20.8 ms) daha kötü olduğu anlamına gelir. | ||
| ↔ Tepki Süresi %50 Griden %80 Griye | ||
| 60 ms ... yükseliş ↗ ve sonbahar↘ birleşimi | ↗ 26.8 ms yükseliş |  |
| ↘ 33.2 ms sonbahar | ||
| Ekran, testlerimizde yavaş yanıt oranları gösteriyor ve oyuncular için yetersiz olacaktır. Karşılaştırıldığında, test edilen tüm cihazlar 0.165 (minimum) ile 636 (maksimum) ms arasında değişir. » Tüm cihazların 95 %'si daha iyi. Bu, ölçülen yanıt süresinin test edilen tüm cihazların ortalamasından (32.5 ms) daha kötü olduğu anlamına gelir. | ||


| Cinebench R15 | |
| CPU Single 64Bit | |
| SCHENKER XMG U507 2017 | |
| Dell Precision 7720 | |
| Guru Mars K | |
| HP ZBook 17 G4-Y3J82AV | |
| Fujitsu Celsius H970 | |
| Lenovo ThinkPad P71-20HK0004GE | |
| Dell Precision 7710 | |
| MSI WE72 7RJ | |
| CPU Multi 64Bit | |
| SCHENKER XMG U507 2017 | |
| Guru Mars K | |
| Dell Precision 7720 | |
| HP ZBook 17 G4-Y3J82AV | |
| Lenovo ThinkPad P71-20HK0004GE | |
| Dell Precision 7710 | |
| MSI WE72 7RJ | |
| Fujitsu Celsius H970 | |
| PCMark 8 | |
| Home Score Accelerated v2 | |
| Dell Precision 7710 | |
| HP ZBook 17 G4-Y3J82AV | |
| MSI WE72 7RJ | |
| Dell Precision 7720 | |
| Lenovo ThinkPad P71-20HK0004GE | |
| Work Score Accelerated v2 | |
| Dell Precision 7710 | |
| Fujitsu Celsius H970 | |
| MSI WE72 7RJ | |
| HP ZBook 17 G4-Y3J82AV | |
| Dell Precision 7720 | |
| Creative Score Accelerated v2 | |
| HP ZBook 17 G4-Y3J82AV | |
| Fujitsu Celsius H970 | |
| Lenovo ThinkPad P71-20HK0004GE | |
| Dell Precision 7710 | |
| Dell Precision 7720 | |
| PCMark 10 - Score | |
| HP ZBook 17 G4-Y3J82AV | |
| Dell Precision 7720 | |
| Fujitsu Celsius H970 | |
| PCMark 8 Home Score Accelerated v2 | 3772 puan | |
| PCMark 8 Creative Score Accelerated v2 | 5498 puan | |
| PCMark 8 Work Score Accelerated v2 | 4460 puan | |
| PCMark 10 Score | 5248 puan | |
Yardım | ||

| LuxMark v2.0 64Bit | |
| Room GPUs-only | |
| Dell Precision 7720 | |
| HP ZBook 17 G4-Y3J82AV | |
| Fujitsu Celsius H970 | |
| Lenovo ThinkPad P71-20HK0004GE | |
| MSI WT72-6QM | |
| MSI WE72 7RJ | |
| Dell Precision 7710 | |
| Sala GPUs-only | |
| Dell Precision 7720 | |
| HP ZBook 17 G4-Y3J82AV | |
| Fujitsu Celsius H970 | |
| Lenovo ThinkPad P71-20HK0004GE | |
| MSI WT72-6QM | |
| MSI WE72 7RJ | |
| Dell Precision 7710 | |
| SiSoft Sandra 2016 | |
| Image Processing | |
| Dell Precision 7720 | |
| HP ZBook 17 G4-Y3J82AV | |
| Dell Precision 7710 | |
| Lenovo ThinkPad P71-20HK0004GE | |
| GP Cryptography (Higher Security AES256+SHA2-512) | |
| HP ZBook 17 G4-Y3J82AV | |
| Dell Precision 7720 | |
| Lenovo ThinkPad P71-20HK0004GE | |
| Dell Precision 7710 | |
| GP Financial Analysis (FP High/Double Precision) | |
| Dell Precision 7720 | |
| HP ZBook 17 G4-Y3J82AV | |
| Dell Precision 7710 | |
| Lenovo ThinkPad P71-20HK0004GE | |
| 3DMark 11 - 1280x720 Performance GPU | |
| Guru Mars K | |
| SCHENKER XMG U507 2017 | |
| Asus Zephyrus GX501 | |
| Lenovo Legion Y920-17IKB | |
| HP ZBook 17 G4-Y3J82AV | |
| Dell Precision 7720 | |
| Fujitsu Celsius H970 | |
| MSI WT72-6QM | |
| Lenovo ThinkPad P71-20HK0004GE | |
| Dell Precision 7710 | |
| MSI WE72 7RJ | |
| 3DMark | |
| 1280x720 Cloud Gate Standard Graphics | |
| Guru Mars K | |
| SCHENKER XMG U507 2017 | |
| Asus Zephyrus GX501 | |
| Dell Precision 7720 | |
| HP ZBook 17 G4-Y3J82AV | |
| Lenovo Legion Y920-17IKB | |
| MSI WT72-6QM | |
| Lenovo ThinkPad P71-20HK0004GE | |
| Fujitsu Celsius H970 | |
| Razer Blade (2017) UHD | |
| Dell Precision 7710 | |
| MSI WE72 7RJ | |
| 1920x1080 Fire Strike Graphics | |
| Guru Mars K | |
| SCHENKER XMG U507 2017 | |
| Asus Zephyrus GX501 | |
| Lenovo Legion Y920-17IKB | |
| Dell Precision 7720 | |
| HP ZBook 17 G4-Y3J82AV | |
| Fujitsu Celsius H970 | |
| Razer Blade (2017) UHD | |
| MSI WT72-6QM | |
| Lenovo ThinkPad P71-20HK0004GE | |
| Dell Precision 7710 | |
| MSI WE72 7RJ | |
| Unigine Heaven 4.0 | |
| Extreme Preset DX11 | |
| SCHENKER XMG U507 2017 | |
| Asus Zephyrus GX501 | |
| Dell Precision 7720 | |
| HP ZBook 17 G4-Y3J82AV | |
| Lenovo ThinkPad P71-20HK0004GE | |
| MSI WE72 7RJ | |
| Extreme Preset OpenGL | |
| Dell Precision 7720 | |
| HP ZBook 17 G4-Y3J82AV | |
| Lenovo ThinkPad P71-20HK0004GE | |
| MSI WE72 7RJ | |
| Unigine Valley 1.0 | |
| 1920x1080 Extreme HD DirectX AA:x8 | |
| HP ZBook 17 G4-Y3J82AV | |
| Dell Precision 7720 | |
| Lenovo ThinkPad P71-20HK0004GE | |
| MSI WT72-6QM | |
| Dell Precision 7710 | |
| MSI WE72 7RJ | |
| 1920x1080 Extreme HD Preset OpenGL AA:x8 | |
| HP ZBook 17 G4-Y3J82AV | |
| Dell Precision 7720 | |
| Lenovo ThinkPad P71-20HK0004GE | |
| Dell Precision 7710 | |
| MSI WE72 7RJ | |
| 3DMark 11 Performance | 16158 puan | |
| 3DMark Ice Storm Standard Score | 58131 puan | |
| 3DMark Cloud Gate Standard Score | 28999 puan | |
| 3DMark Fire Strike Score | 12298 puan | |
| 3DMark Time Spy Score | 4823 puan | |
Yardım | ||
| düşük | orta | yüksek | ultra | 4K | |
|---|---|---|---|---|---|
| The Witcher 3 (2015) | 53.4 | 36 | |||
| Star Wars Battlefront (2015) | 118.5 | 44 | |||
| Rainbow Six Siege (2015) | 55.6 | ||||
| Rise of the Tomb Raider (2016) | 97.9 | 84 | 35.8 | ||
| Battlefield 1 (2016) | 40.8 | ||||
| For Honor (2017) | 127.9 | 121.1 | 95.1 | 37.6 | |
| Ghost Recon Wildlands (2017) | 83.9 | 76.5 | 42.8 | 27.5 | |
| Prey (2017) | 125.2 | 47.8 |
Ses yüksekliği
| Boşta |
| 29.5 / 29.5 / 29.5 dB |
| Çalışırken |
| 35 / 47.8 dB |
 | ||
30 dB sessiz 40 dB(A) duyulabilirlik 50 dB(A) gürültülü |
||
min: | ||
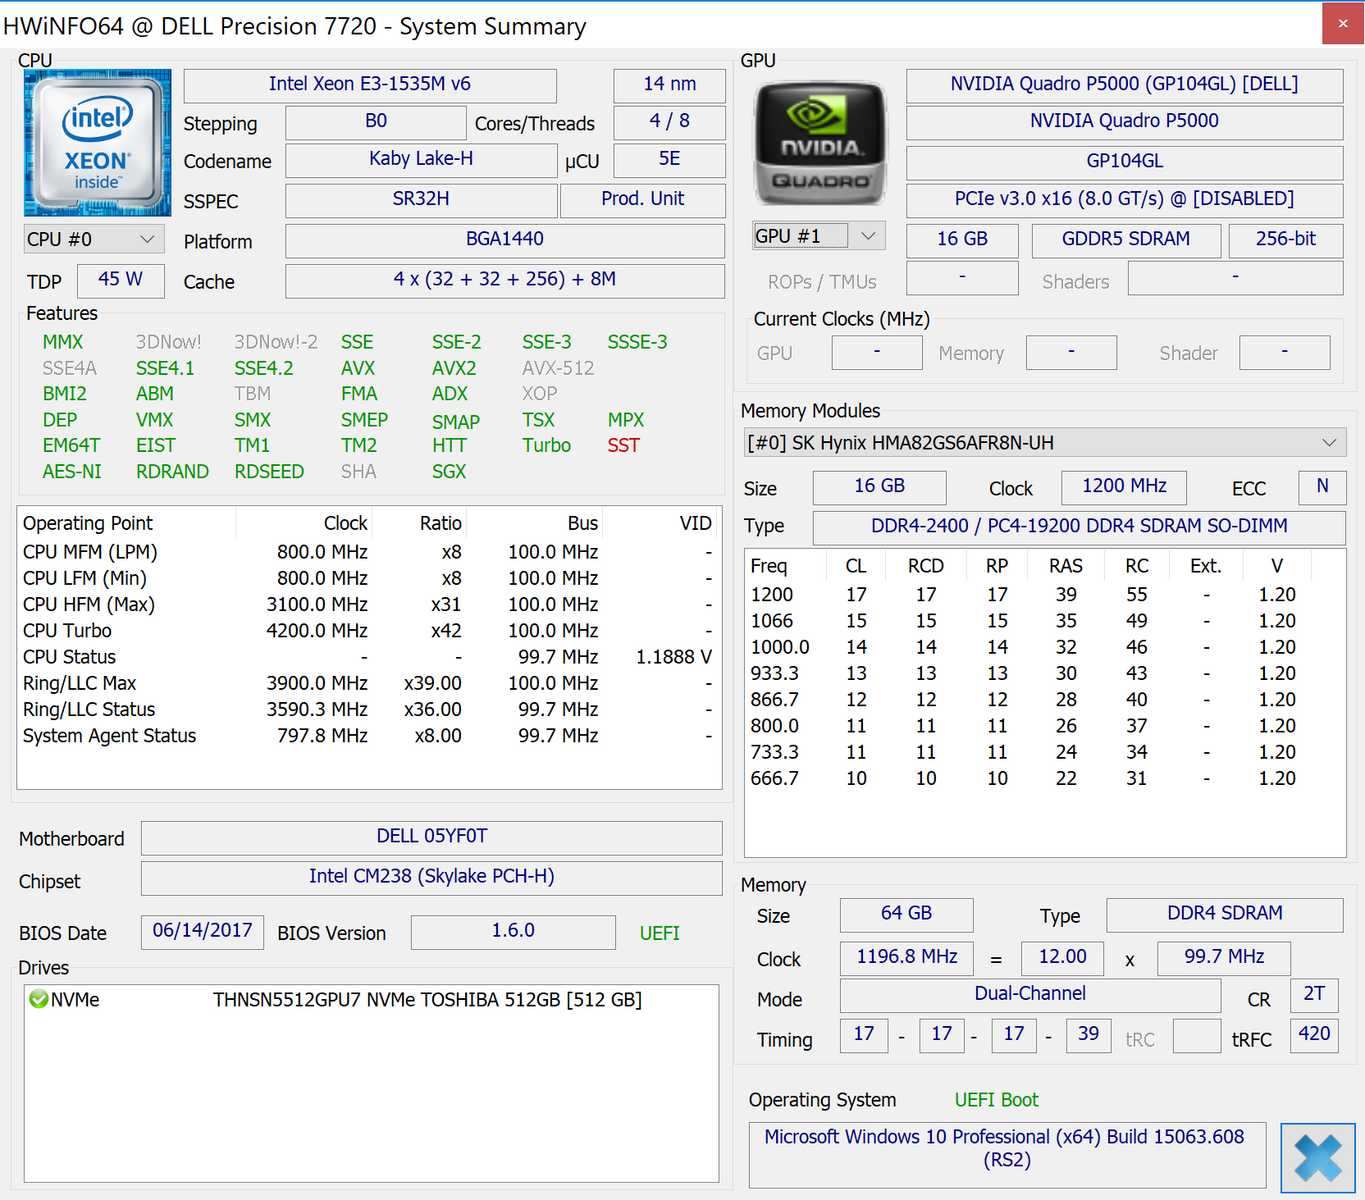
| Dell Precision 7720 Quadro P5000, E3-1535M v6, Toshiba NVMe THNSN5512GPU7 | Lenovo ThinkPad P71-20HK0004GE Quadro P3000, i7-7820HQ, Samsung PM961 NVMe MZVLW512HMJP | HP ZBook 17 G4-Y3J82AV Quadro P5000, E3-1535M v6, Samsung SSD SM961 1TB M.2 MZVKW1T0HMLH | MSI WE72 7RJ Quadro M2200, i7-7700HQ, Samsung SM961 MZVPW256 m.2 PCI-e | Fujitsu Celsius H970 Quadro P4000, E3-1535M v6, Samsung SM961 MZVKW512HMJP m.2 PCI-e | |
|---|---|---|---|---|---|
| Noise | 2% | -7% | -14% | -10% | |
| kapalı / ortam * | 29.5 | 29.2 1% | 29.6 -0% | 29.3 1% | 30.2 -2% |
| Idle Minimum * | 29.5 | 29.2 1% | 29.6 -0% | 36.3 -23% | 30.2 -2% |
| Idle Average * | 29.5 | 29.2 1% | 31.7 -7% | 36.3 -23% | 32.8 -11% |
| Idle Maximum * | 29.5 | 32.2 -9% | 34.4 -17% | 36.6 -24% | 32.8 -11% |
| Load Average * | 35 | 34.7 1% | 41.3 -18% | 40.4 -15% | 47.3 -35% |
| Witcher 3 ultra * | 41 | 45.6 -11% | |||
| Load Maximum * | 47.8 | 39.1 18% | 45.6 5% | 46.6 3% | 47.3 1% |
* ... daha küçük daha iyidir
(±) Üst taraftaki maksimum sıcaklık, 38.2 °C / 101 F ortalamasına kıyasla 42.3 °C / 108 F'dir. , Workstation sınıfı için 22.2 ile 69.8 °C arasında değişir.
(±) Alt kısım, 41.2 °C / 106 F ortalamasına kıyasla maksimum 44.9 °C / 113 F'ye kadar ısınır
(+) Boşta kullanımda, üst tarafın ortalama sıcaklığı 25.2 °C / 77 F olup, cihazın 32 °C / 90 F.
(±) The Witcher 3 oynarken, üst tarafın ortalama sıcaklığı 35.1 °C / 95 F olup, cihazın 32 °C / 90 F.
(+) Avuç içi dayanakları ve dokunmatik yüzey, maksimum 27.3 °C / 81.1 F ile cilt sıcaklığından daha soğuktur ve bu nedenle dokunulduğunda soğuktur.
(±) Benzer cihazların avuç içi dayanağı alanının ortalama sıcaklığı 27.8 °C / 82 F (+0.5 °C / 0.9 F) idi.
| Kapalı / Bekleme modu | |
| Boşta | |
| Çalışırken |
|
Key:
min: | |
| Dell Precision 7720 E3-1535M v6, Quadro P5000, Toshiba NVMe THNSN5512GPU7, IGZO, 3840x2160, 17.3" | Lenovo ThinkPad P71-20HK0004GE i7-7820HQ, Quadro P3000, Samsung PM961 NVMe MZVLW512HMJP, IPS, 3840x2160, 17.3" | HP ZBook 17 G4-Y3J82AV E3-1535M v6, Quadro P5000, Samsung SSD SM961 1TB M.2 MZVKW1T0HMLH, IPS, 3840x2160, 17.3" | MSI WE72 7RJ i7-7700HQ, Quadro M2200, Samsung SM961 MZVPW256 m.2 PCI-e, IPS, 1920x1080, 17.3" | Fujitsu Celsius H970 E3-1535M v6, Quadro P4000, Samsung SM961 MZVKW512HMJP m.2 PCI-e, IPS LED, 1920x1080, 17.3" | MSI WT72-6QM E3-1505M v5, Quadro M5000M, Toshiba NVMe THNSN5256GPU7, IPS, 1920x1080, 17.3" | |
|---|---|---|---|---|---|---|
| Power Consumption | 17% | -5% | -2% | 14% | -48% | |
| Idle Minimum * | 9.6 | 7.44 22% | 12.9 -34% | 15 -56% | 10.7 -11% | 24.8 -158% |
| Idle Average * | 20.5 | 18 12% | 19.6 4% | 20.1 2% | 15.8 23% | 29.7 -45% |
| Idle Maximum * | 22.9 | 21.8 5% | 23.6 -3% | 23.8 -4% | 17.8 22% | 30.1 -31% |
| Load Average * | 96.8 | 77.1 20% | 92.8 4% | 85.6 12% | 92 5% | 105.2 -9% |
| Load Maximum * | 202.1 | 150.5 26% | 190 6% | 128 37% | 137 32% | 192.2 5% |
| Witcher 3 ultra * | 148.5 |
* ... daha küçük daha iyidir
| Dell Precision 7720 E3-1535M v6, Quadro P5000, 91 Wh | Lenovo ThinkPad P71-20HK0004GE i7-7820HQ, Quadro P3000, 96 Wh | HP ZBook 17 G4-Y3J82AV E3-1535M v6, Quadro P5000, 95 Wh | MSI WE72 7RJ i7-7700HQ, Quadro M2200, 51 Wh | Fujitsu Celsius H970 E3-1535M v6, Quadro P4000, 96 Wh | Dell Precision 7710 E3-1535M v5, FirePro W7170M, 72 Wh | |
|---|---|---|---|---|---|---|
| Pil Çalışma Süresi | 11% | -11% | -52% | 34% | 0% | |
| Reader / Idle | 685 | 872 27% | 469 -32% | 268 -61% | 1002 46% | 775 13% |
| H.264 | 405 | 517 28% | 316 -22% | 181 -55% | 573 41% | 283 -30% |
| WiFi v1.3 | 379 | 358 -6% | 295 -22% | 177 -53% | 542 43% | 365 -4% |
| Load | 70 | 66 -6% | 92 31% | 42 -40% | 74 6% | 85 21% |
Artılar
Eksiler

Dell'in Precision 7720 modeli çok güçlü bir çalışma istasyonu. Yüksek kaliteli kasa önceki jenerasyona göre değişmemiş ama artık Thunderbolt 3 bağlantısı da var. Önceki versiyonda yoğun kullanım esnasında hem işlemci hem grafik kartı takılmaları olabiliyordu ancak bu modelde sorun çözülmüş. Test cihazımız en güçlü bileşenlerle geliyor ve sunulan performans yoğun kullanımda bile çok iyi. Böylesi bir performansa ihtiyacınız var mı elbette tartışılır. Grafik kartı özellikle çoğu durum için fazla fazla iyi.
4K PremierColor ekran bizi biraz hayal kırıklığına uğrattı. Bu elbette biraz kulağa su kaçırmak gibi olabilir ama bu kadar yüksek fiyat etiketi olan bir cihazdan daha iyi performans beklemeyi biraz hak olarak görüyoruz. Ekranı mutlaka kalibre etmek gerekli.
Çok fazla performansa ihtiyaç duyuyorsanız Precision 7720 kesinlikle iyi bir seçim.
Yüksek performansa rağmen rahatsız edici fan sesi yok. Elbette çok yoğun çalışırken ses duyabilirsiniz ama basit işlerle uğraşırken genellikle kapalılar. Sıcaklık üretimini de çok eleştiremiyoruz.
Ekranın aksaklıklarının dışında hata bulmak için çok detaylı bakmak gerekli. SD okuyucu da bunlardan biri. Malesef test cihazımızda çalışmadı ama bunun ayrı bir test olduğunu düşünüyoruz. SIM slotu kasanın içinde yer alıyor ve ulaşılması biraz güç.
Tüm bu performans elbette ucuz değil. Ama rakip modeller de benzer fiyatlara satılıyor. Precision 7720 çok iyi bir skorla karşınızda.
Dell Precision 7720
- 01/21/2018 v6 (old)
Andreas Osthoff
