

MSI Claw incelemesi - Intel Core Ultra işlemcili oyun el bilgisayarı hayal kırıklığı yaratıyor
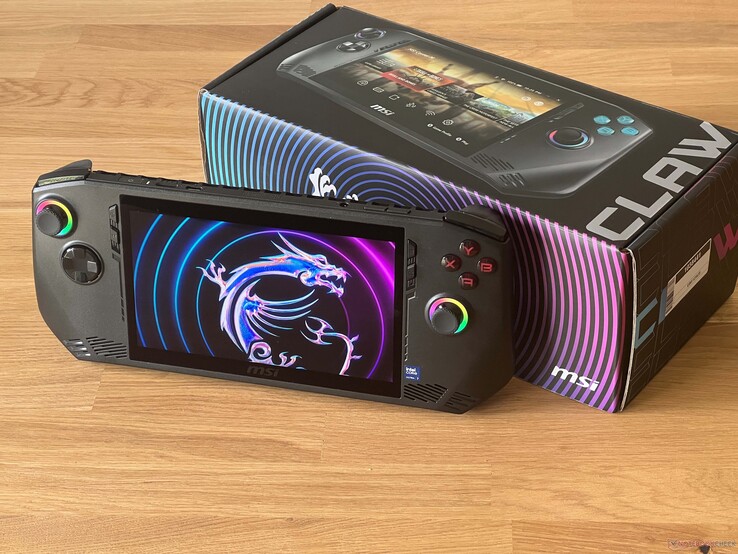
Oyun el bilgisayarları şu anda çok moda ve her büyük üretici bu furyaya katılmaya çalışıyor. MSI da bir istisna değil, ancak yeni Claw ile piyasaya oldukça geç çıktı ve AMD işlemciye sahip rakiplerinin çoğunun aksine MSI, Intel Core Ultra modelini tercih etti. Ayrıca 7 inç IPS ekran ve Hall Effect joystick ve tetiklerle donatılmıştır.
MSI'ın şu anda sunduğu iki model var: Claw A1M-036 ile birlikte gelen Core Ultra 5 135H, 16 GB RAM ve 512 GB SSD ve daha güçlü Claw A1M-059 Core Ultra 7 155H16 GB RAM ve 1 TB SSD'yi 899 ABD dolarına satıyor ki test ettiğimiz ürün de bu.
Karşılaştırmalı olarak olası rakipler
Derecelendirme | Tarih | Modeli | Ağırlık | Yükseklik | Boyut | Çözünürlük | Fiyat |
|---|---|---|---|---|---|---|---|
| 77.4 % | 06/2024 | MSI Claw Ultra 7 155H, Arc 8-Core | 672 g | 33 mm | 7.00" | 1920x1080 | |
| 88.9 % v7 (old) | 02/2024 | Valve Steam Deck 1 TB OLED Steam Deck OLED APU, Radeon Radeon Steam Deck 8CU | 640 g | 49 mm | 7.40" | 1280x800 | |
| 66.3 % | 01/2024 | Lenovo Legion Go Z1 Extreme, Radeon 780M | 845 g | 41 mm | 8.80" | 2560x1600 | |
| 87.5 % v7 (old) | 03/2024 | Asus ROG Ally Z1 Extreme Z1 Extreme, Radeon 780M | 611 g | 21.22 mm | 7.00" | 1920x1080 | |
| 84.9 % v7 (old) | 01/2024 | ONEXPLAYER 2 Pro AR18 R7 7840U, Radeon 780M | 876 g | 43 mm | 8.40" | 2560x1600 | |
| 85.2 % v7 (old) | 01/2024 | Ayaneo Kun R7 7840U, Radeon 780M | 942 g | 22 mm | 8.40" | 2560x1600 |
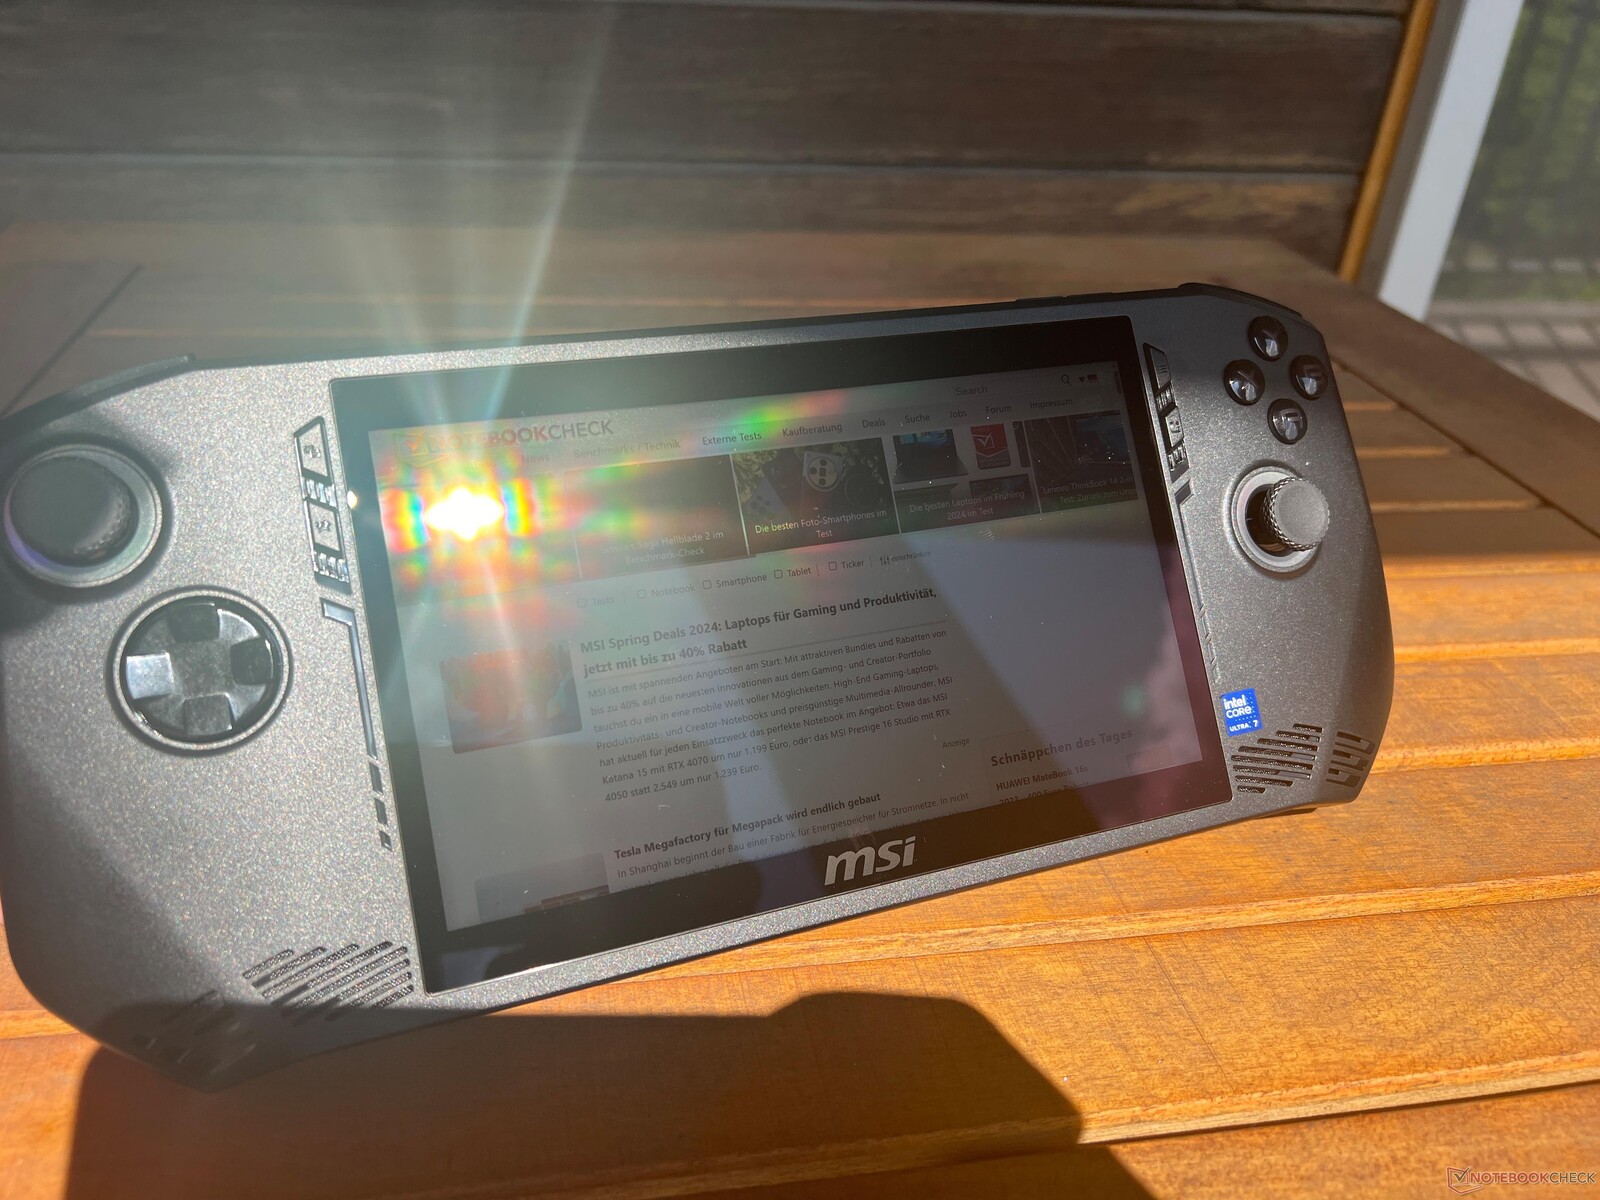
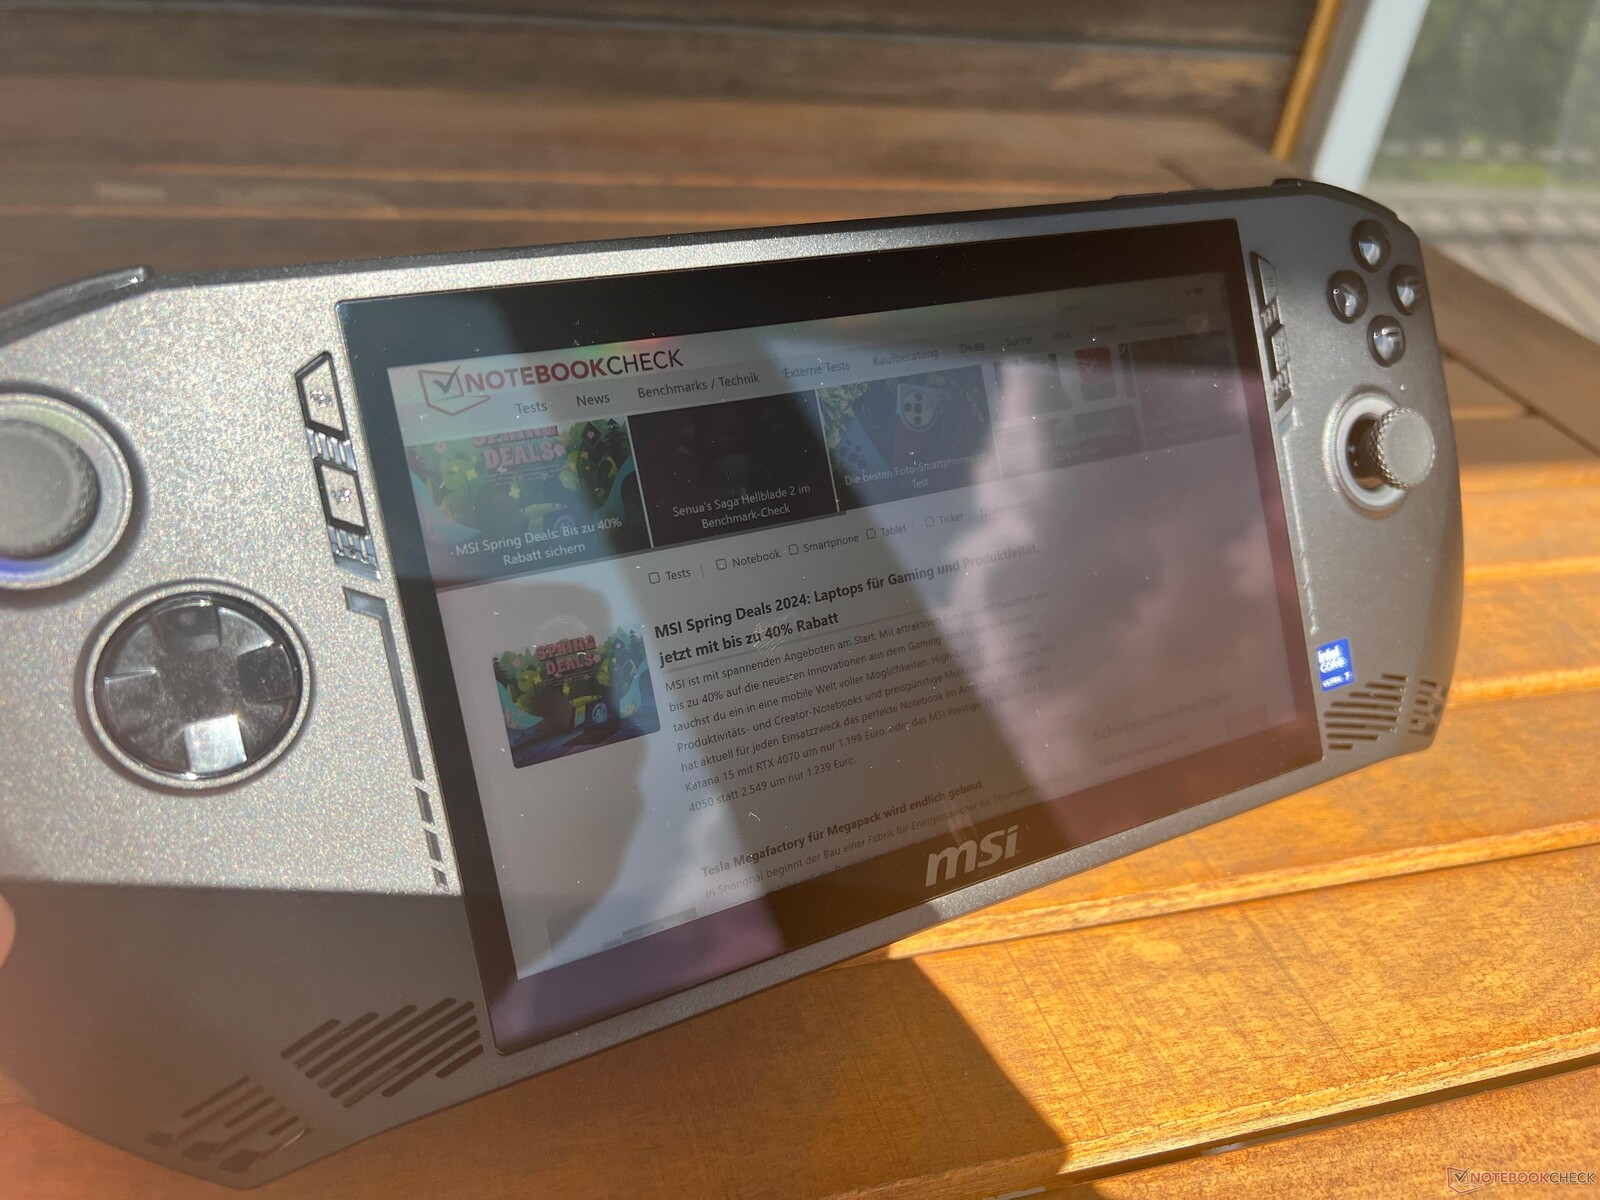
Kasa - Aydınlatmalı kumanda kolları ve düğmeleri ile The Claw
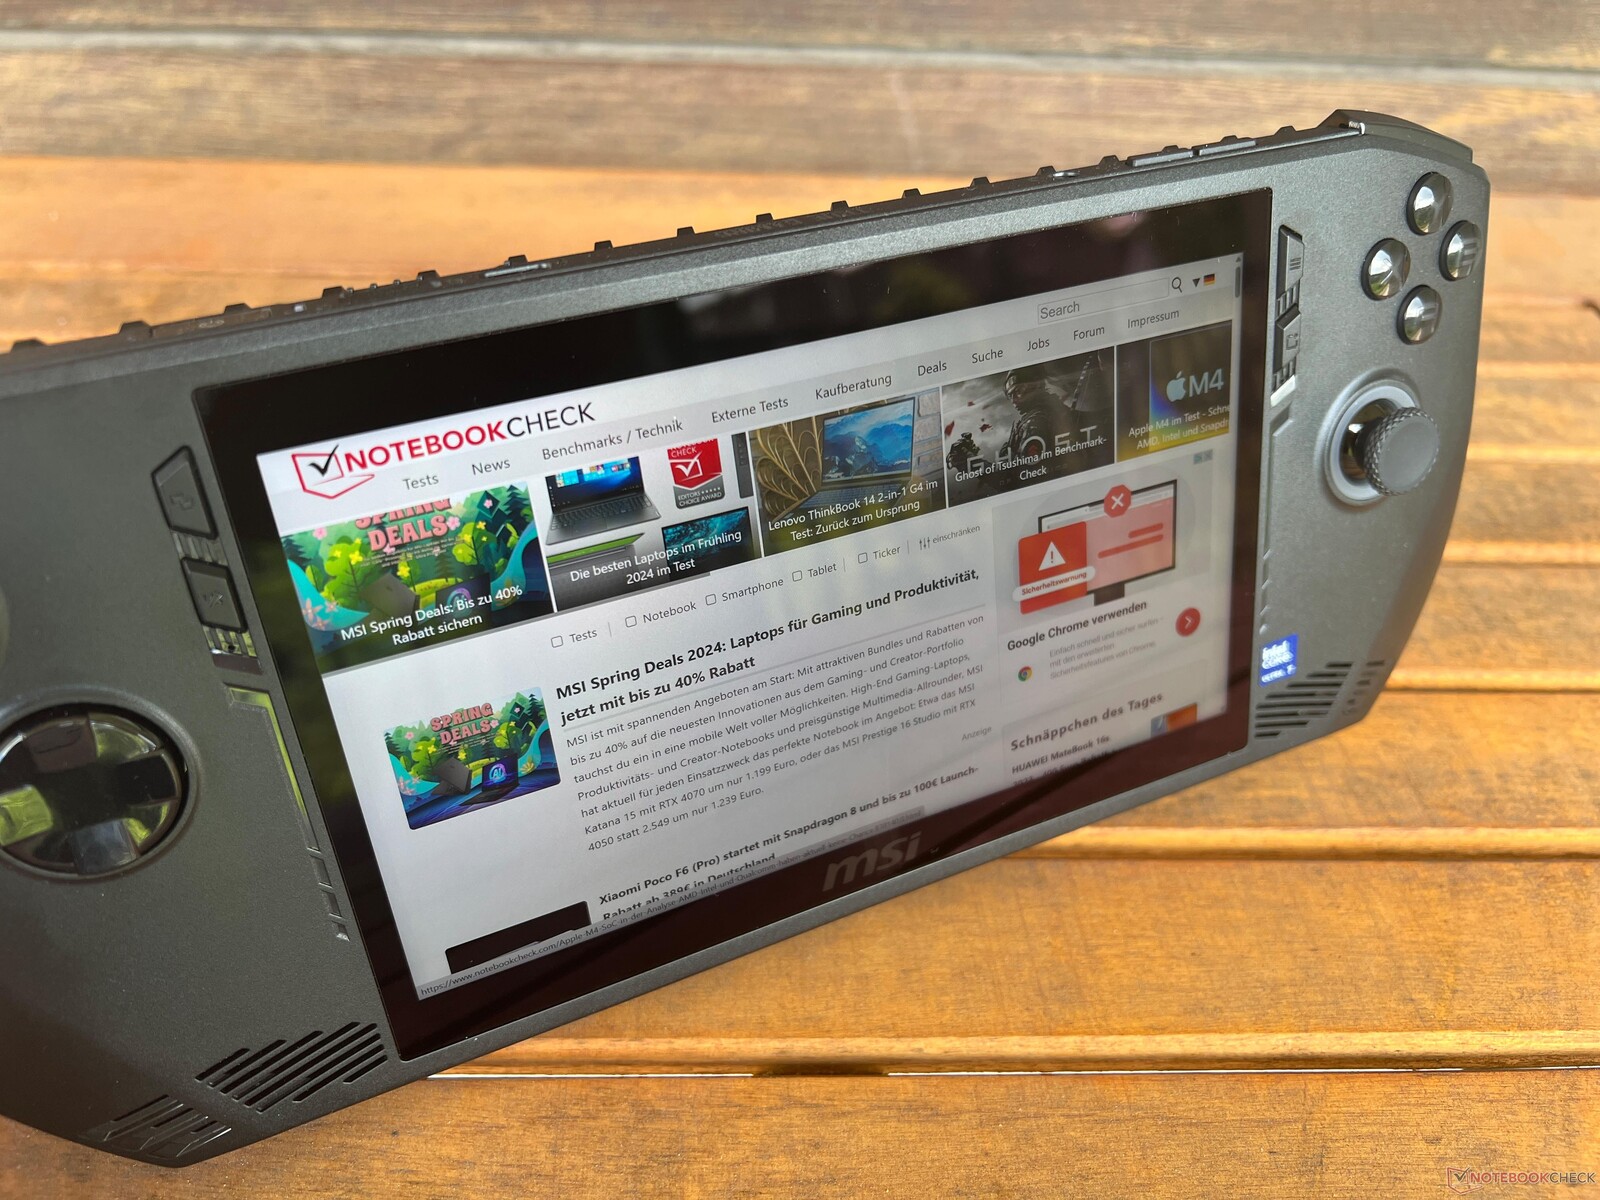
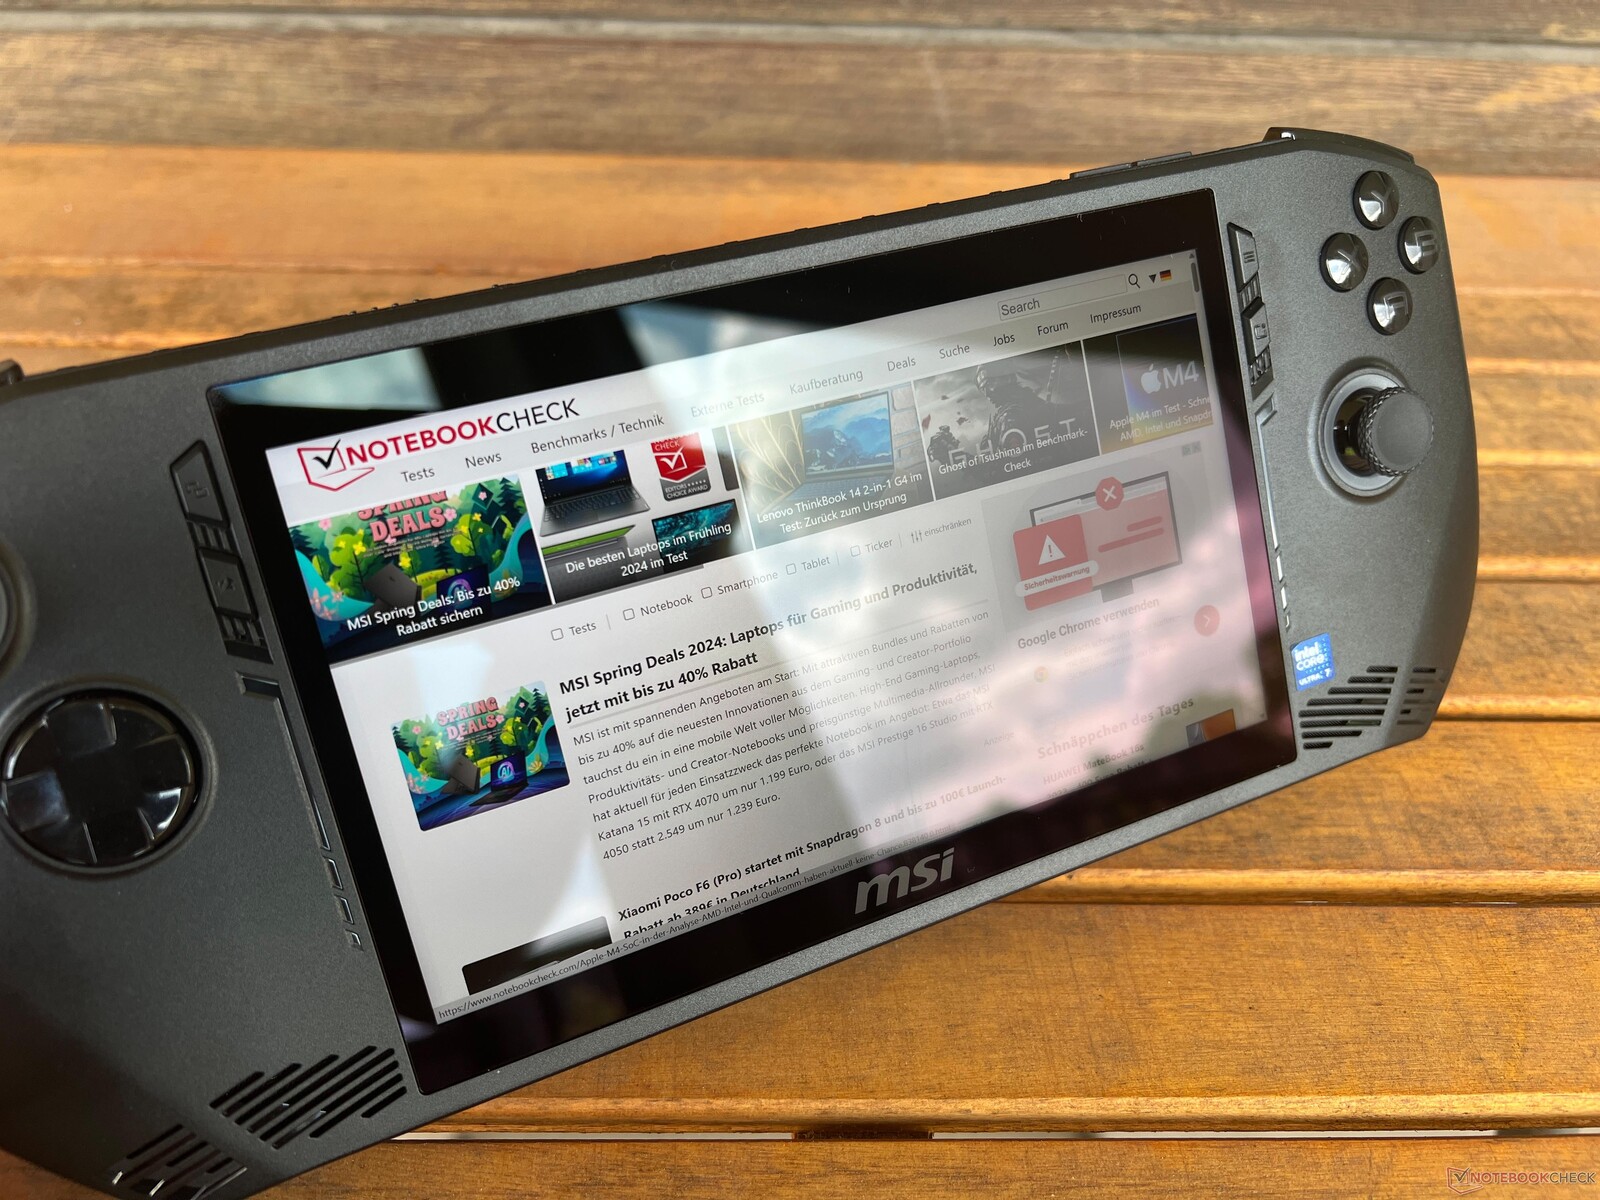
MSI Claw, MSI Claw gibi tipik bir oyun el bilgisayarıdır Asus'tan ROG Ally karşılaştırıldığında Lenovo Legion Go örneğin, çıkarılabilir kontrolörlere sahip değildir. MSI Claw, pürüzsüz yüzeylere sahip siyah plastik bir kasa kullanıyor - sadece arka kısımda çok sayıda fan ızgarası var. Genel olarak iyi inşa edilmiş, ancak cihazdan bazı gıcırtı sesleri çıkarabilirsiniz. Öte yandan parmak izi izleri büyük bir sorun değil. Kumanda kollarının etrafındaki iki halkanın yanı sıra sağ taraftaki düğmeler de aydınlatılabiliyor. Geniş siyah çerçeveleri biraz rahatsız edici (özellikle ekranın üstünde ve altında), ancak iyi izlenimi ek kasa malzemesi kullanımıyla pekiştiriliyor.

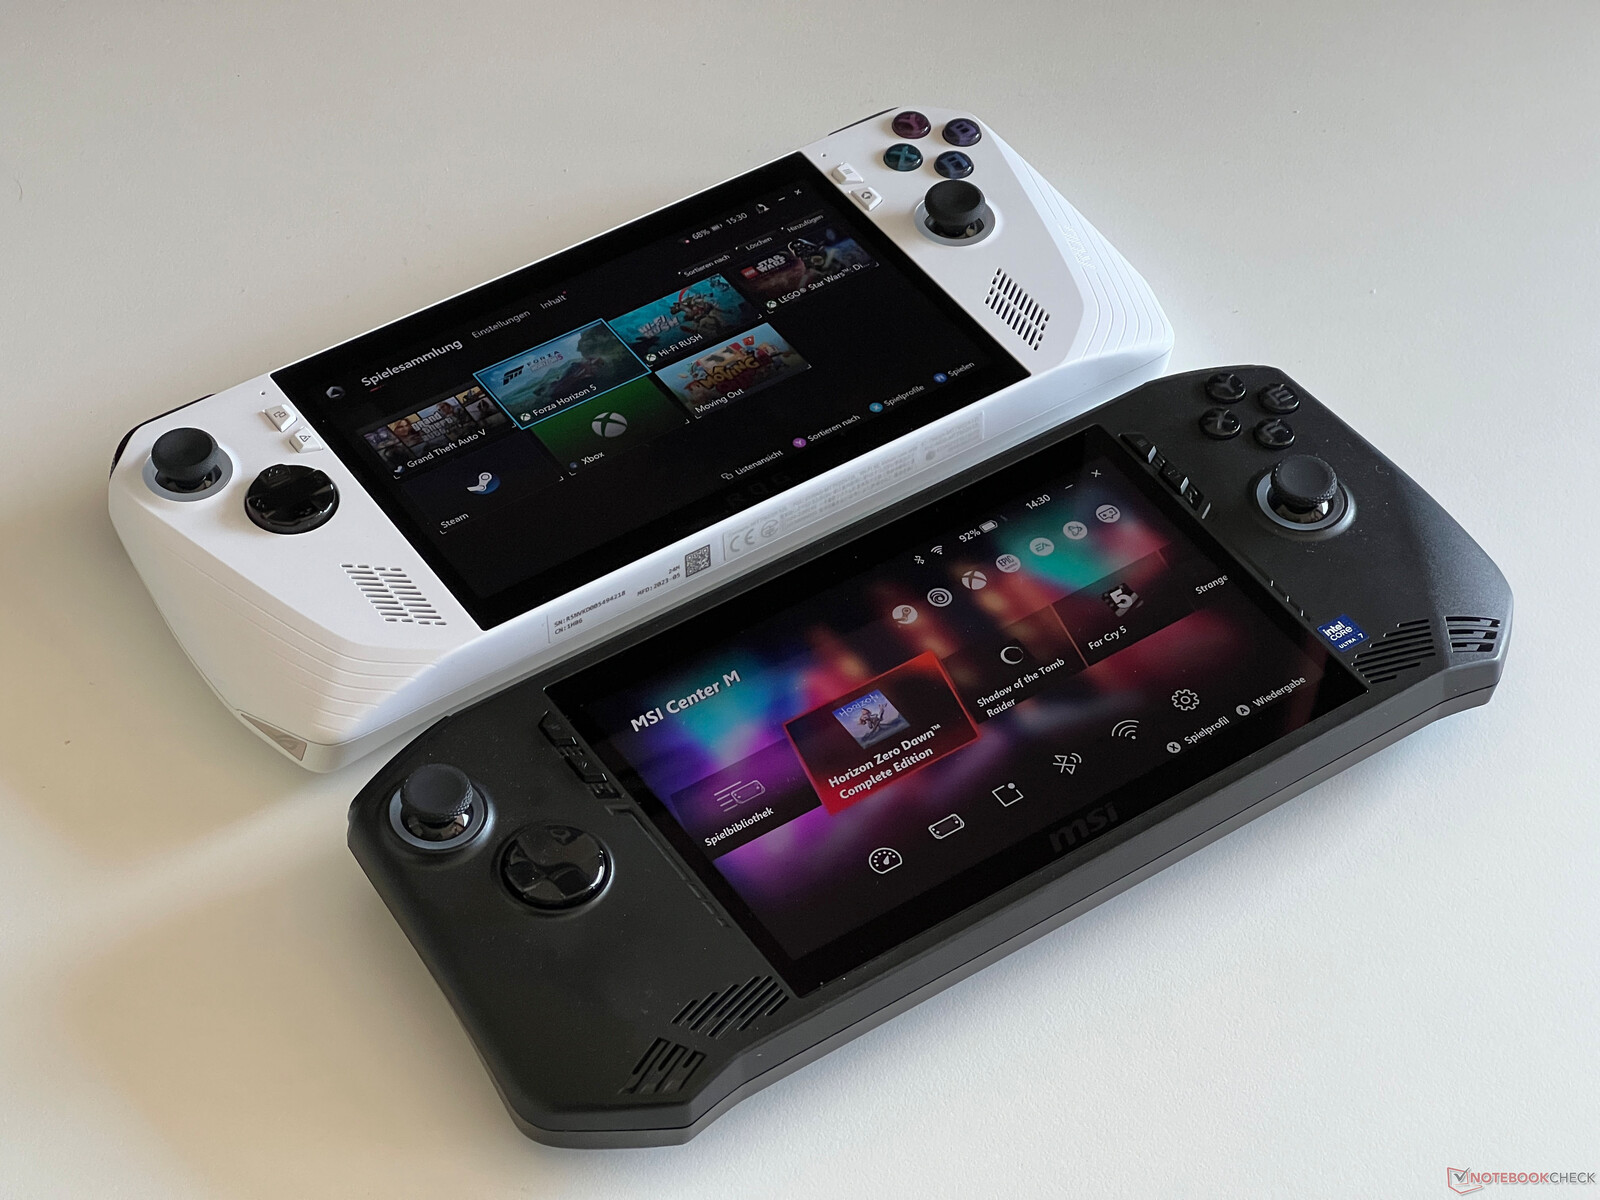
Örneğin ROG Ally'nin çerçeveleri aynı genişlikte ancak buna karşılık kasası ekranın üstünde ve altında biraz daha dar. Genel olarak MSI Claw biraz daha büyük ve tutma yerleri daha farklı şekillendirilmiş. Sonuç olarak, ergonomisi daha iyi ve özellikle daha büyük ellerle cihazı daha kolay tutabilirsiniz, bu da ROG Ally'den biraz daha rahat olmasını sağlar.
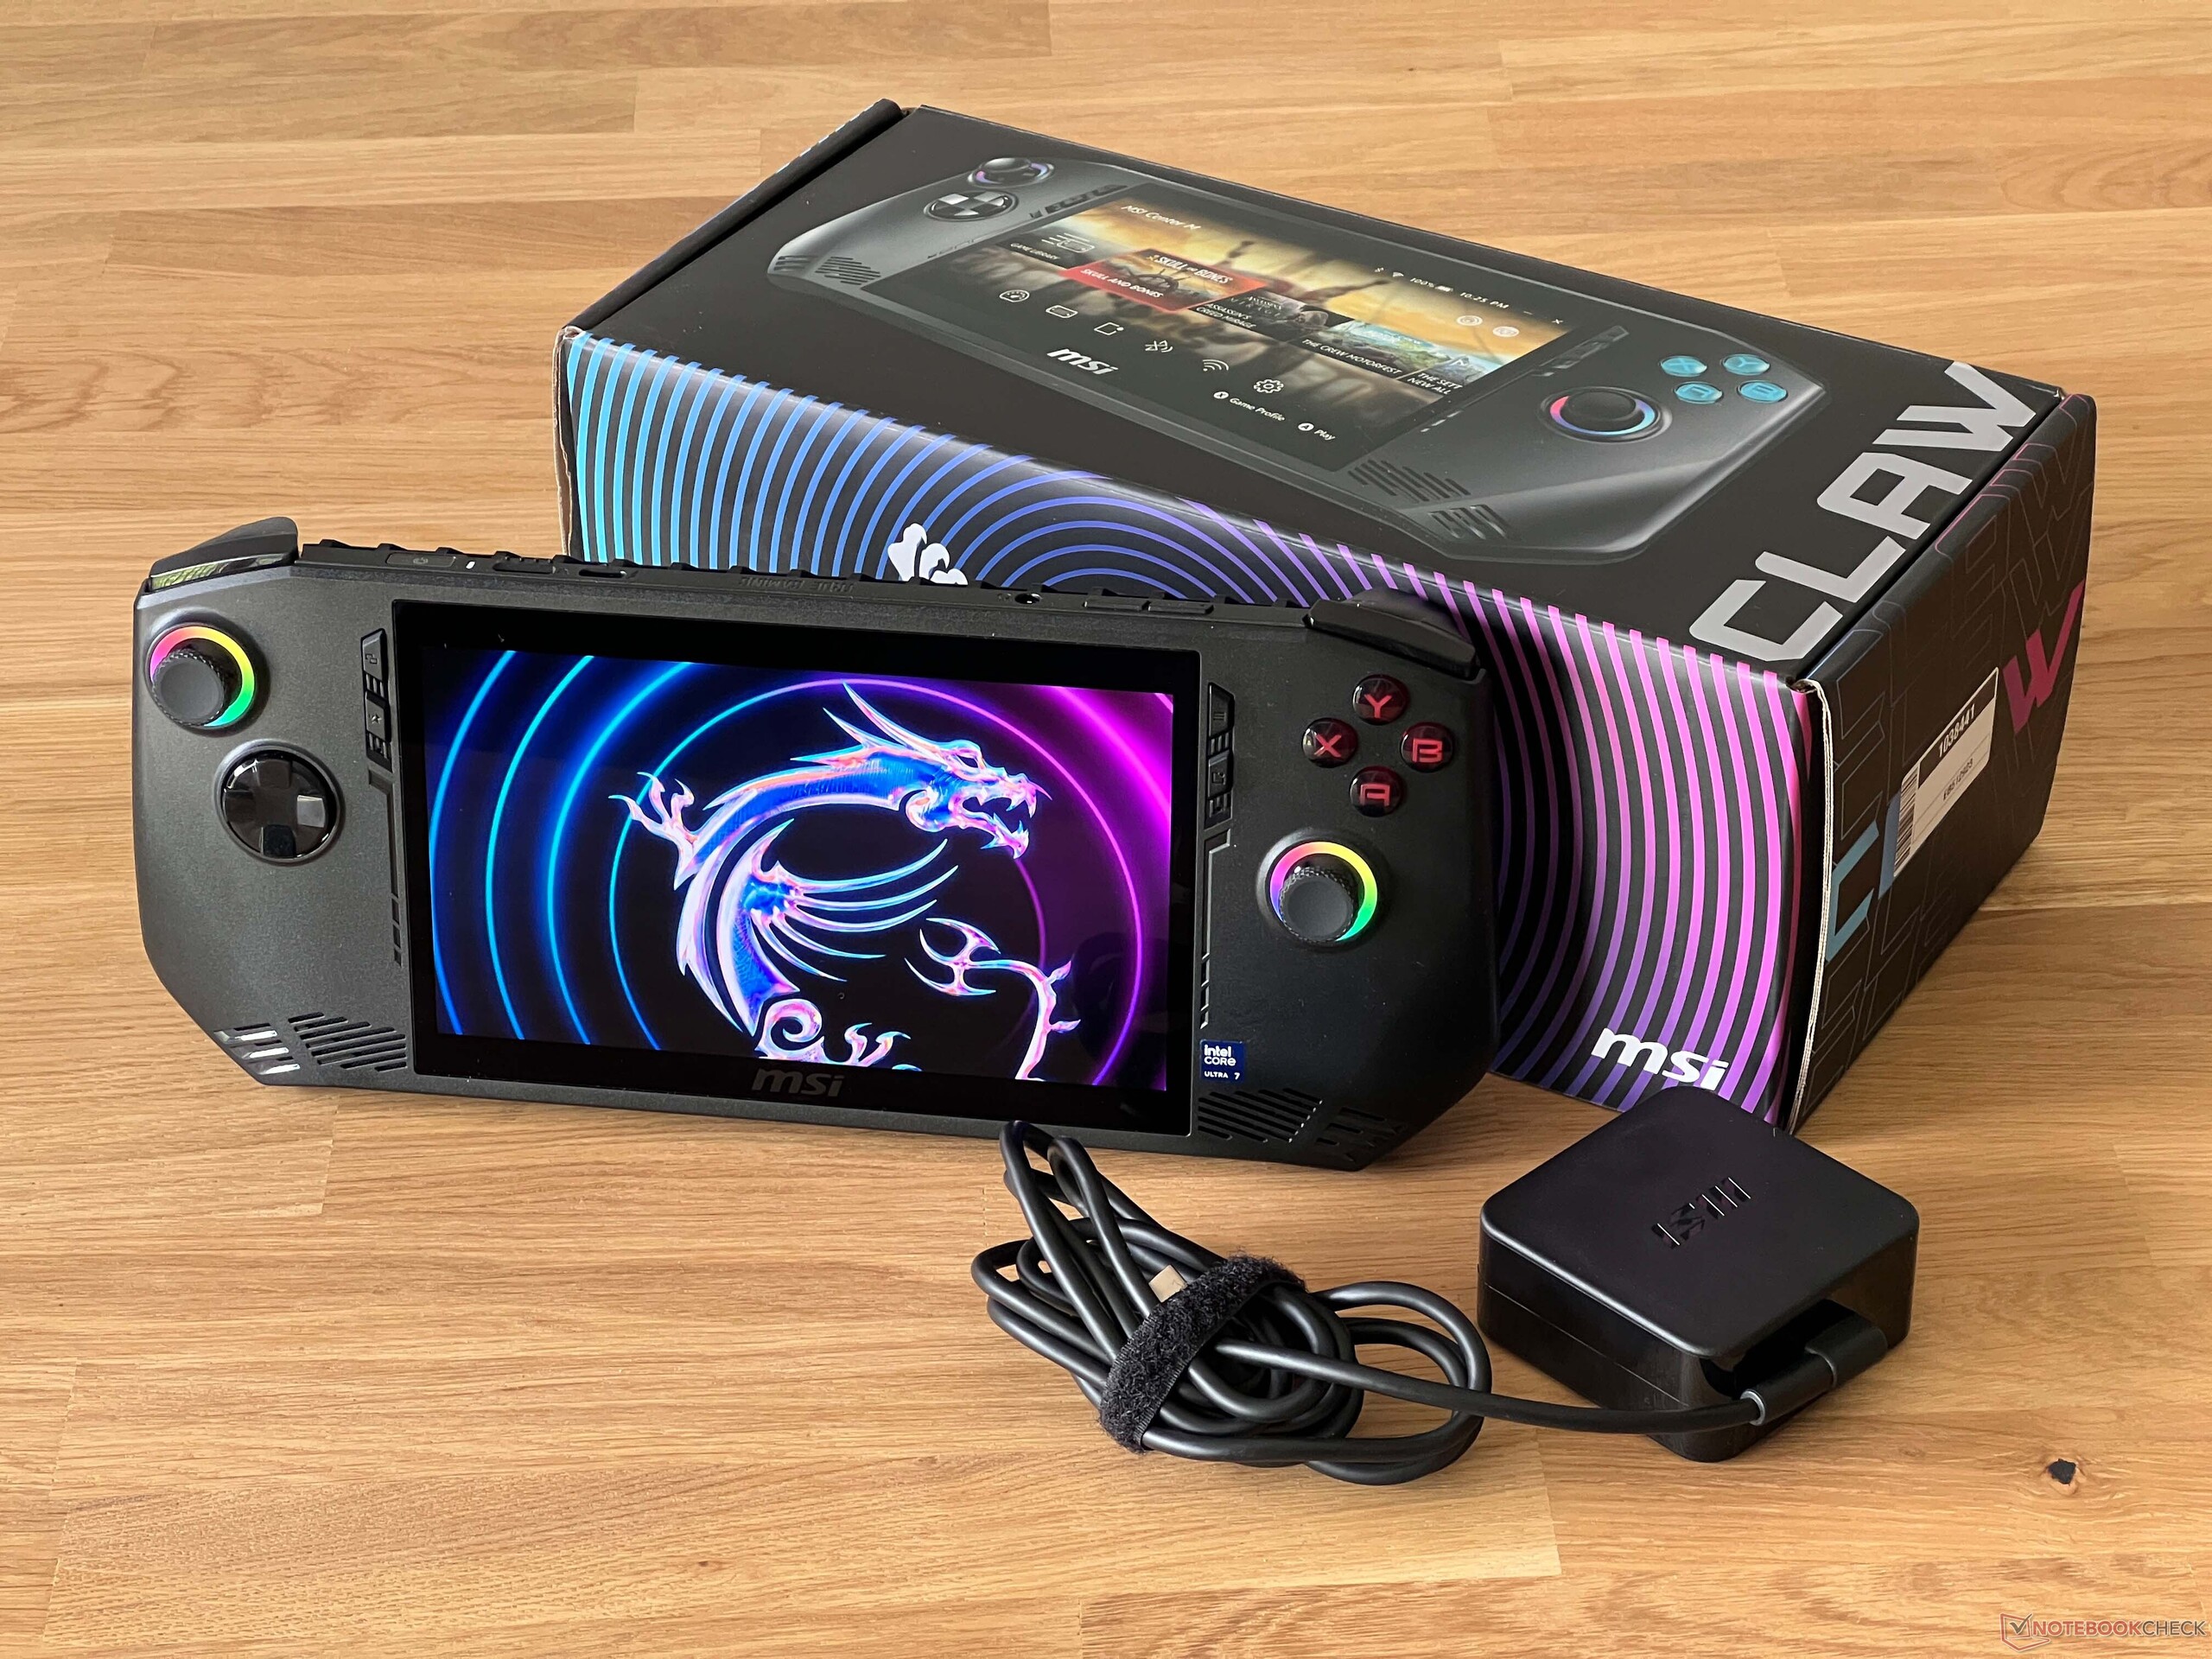
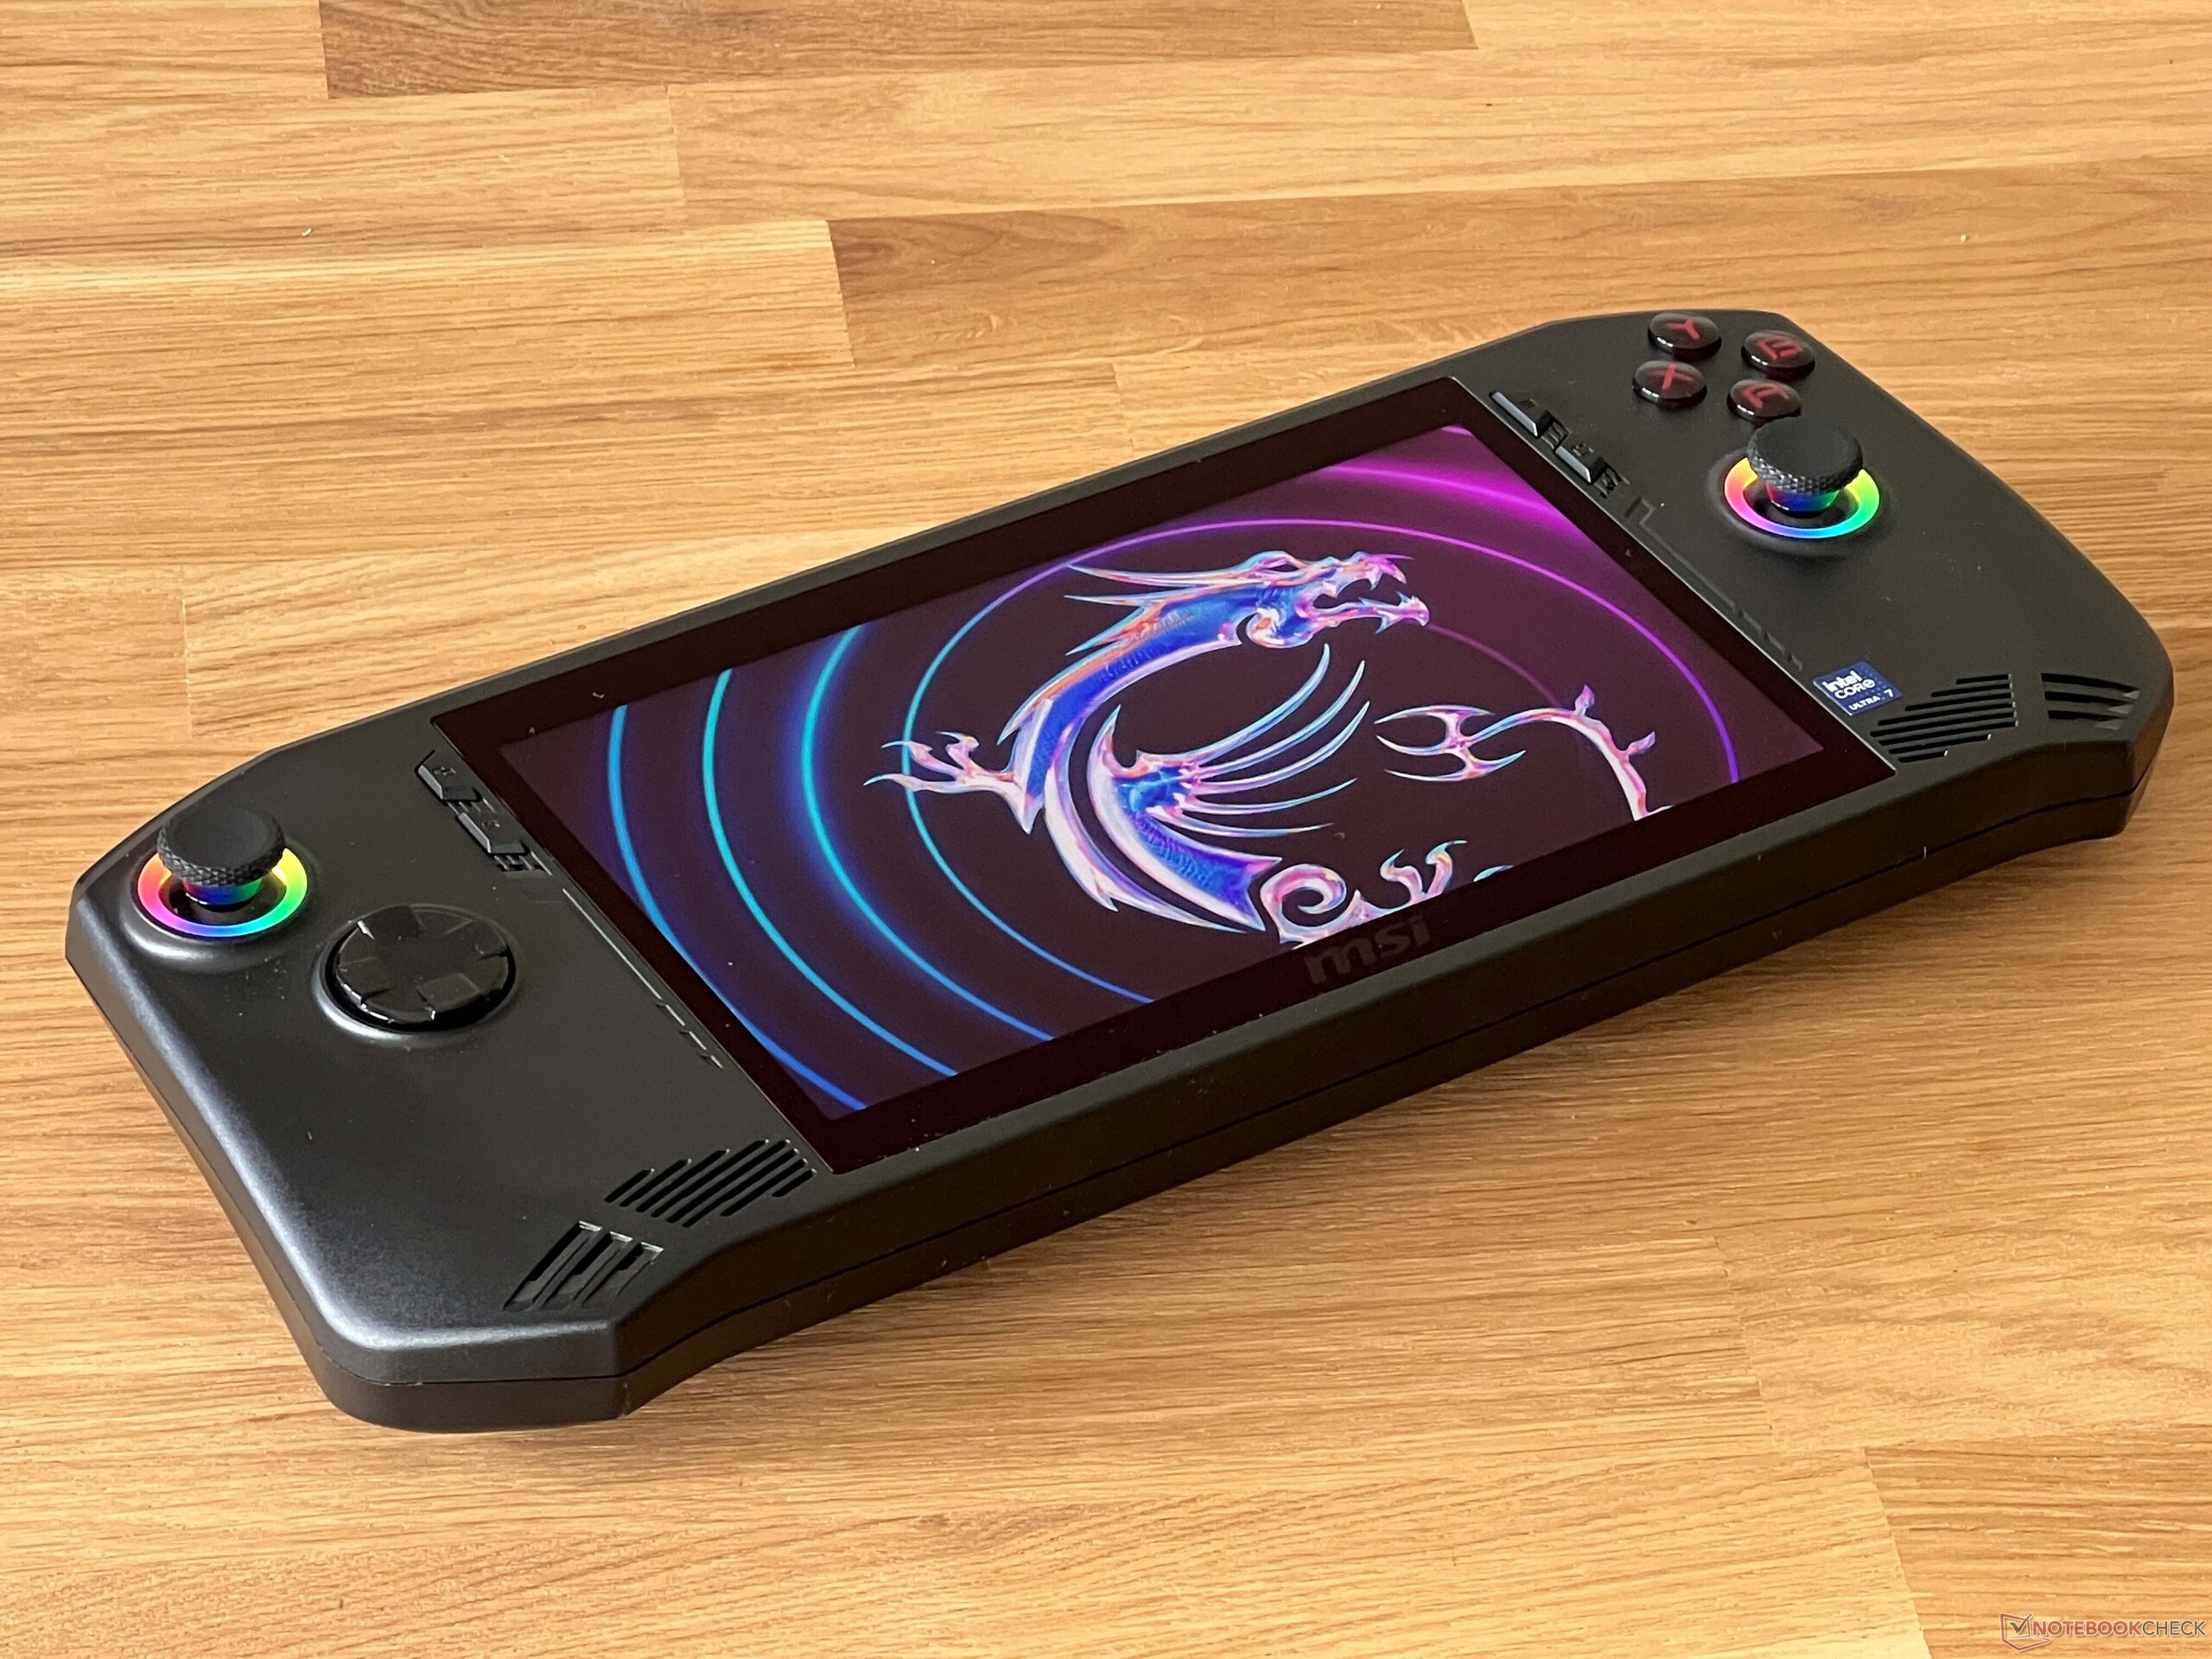

672 gram ağırlığındaki MSI Claw, karşılaştırma alanındaki en hafif el cihazlarından biridir ve uzun süre kullanırken bile ağırlığıyla ilgili herhangi bir sorun yaşamazsınız. Kulplar dahil edildiğinde kasa kalınlığı yaklaşık 3,4 cm'dir. Birlikte verilen 65 watt'lık güç kaynağı 341 gram ağırlığındadır.
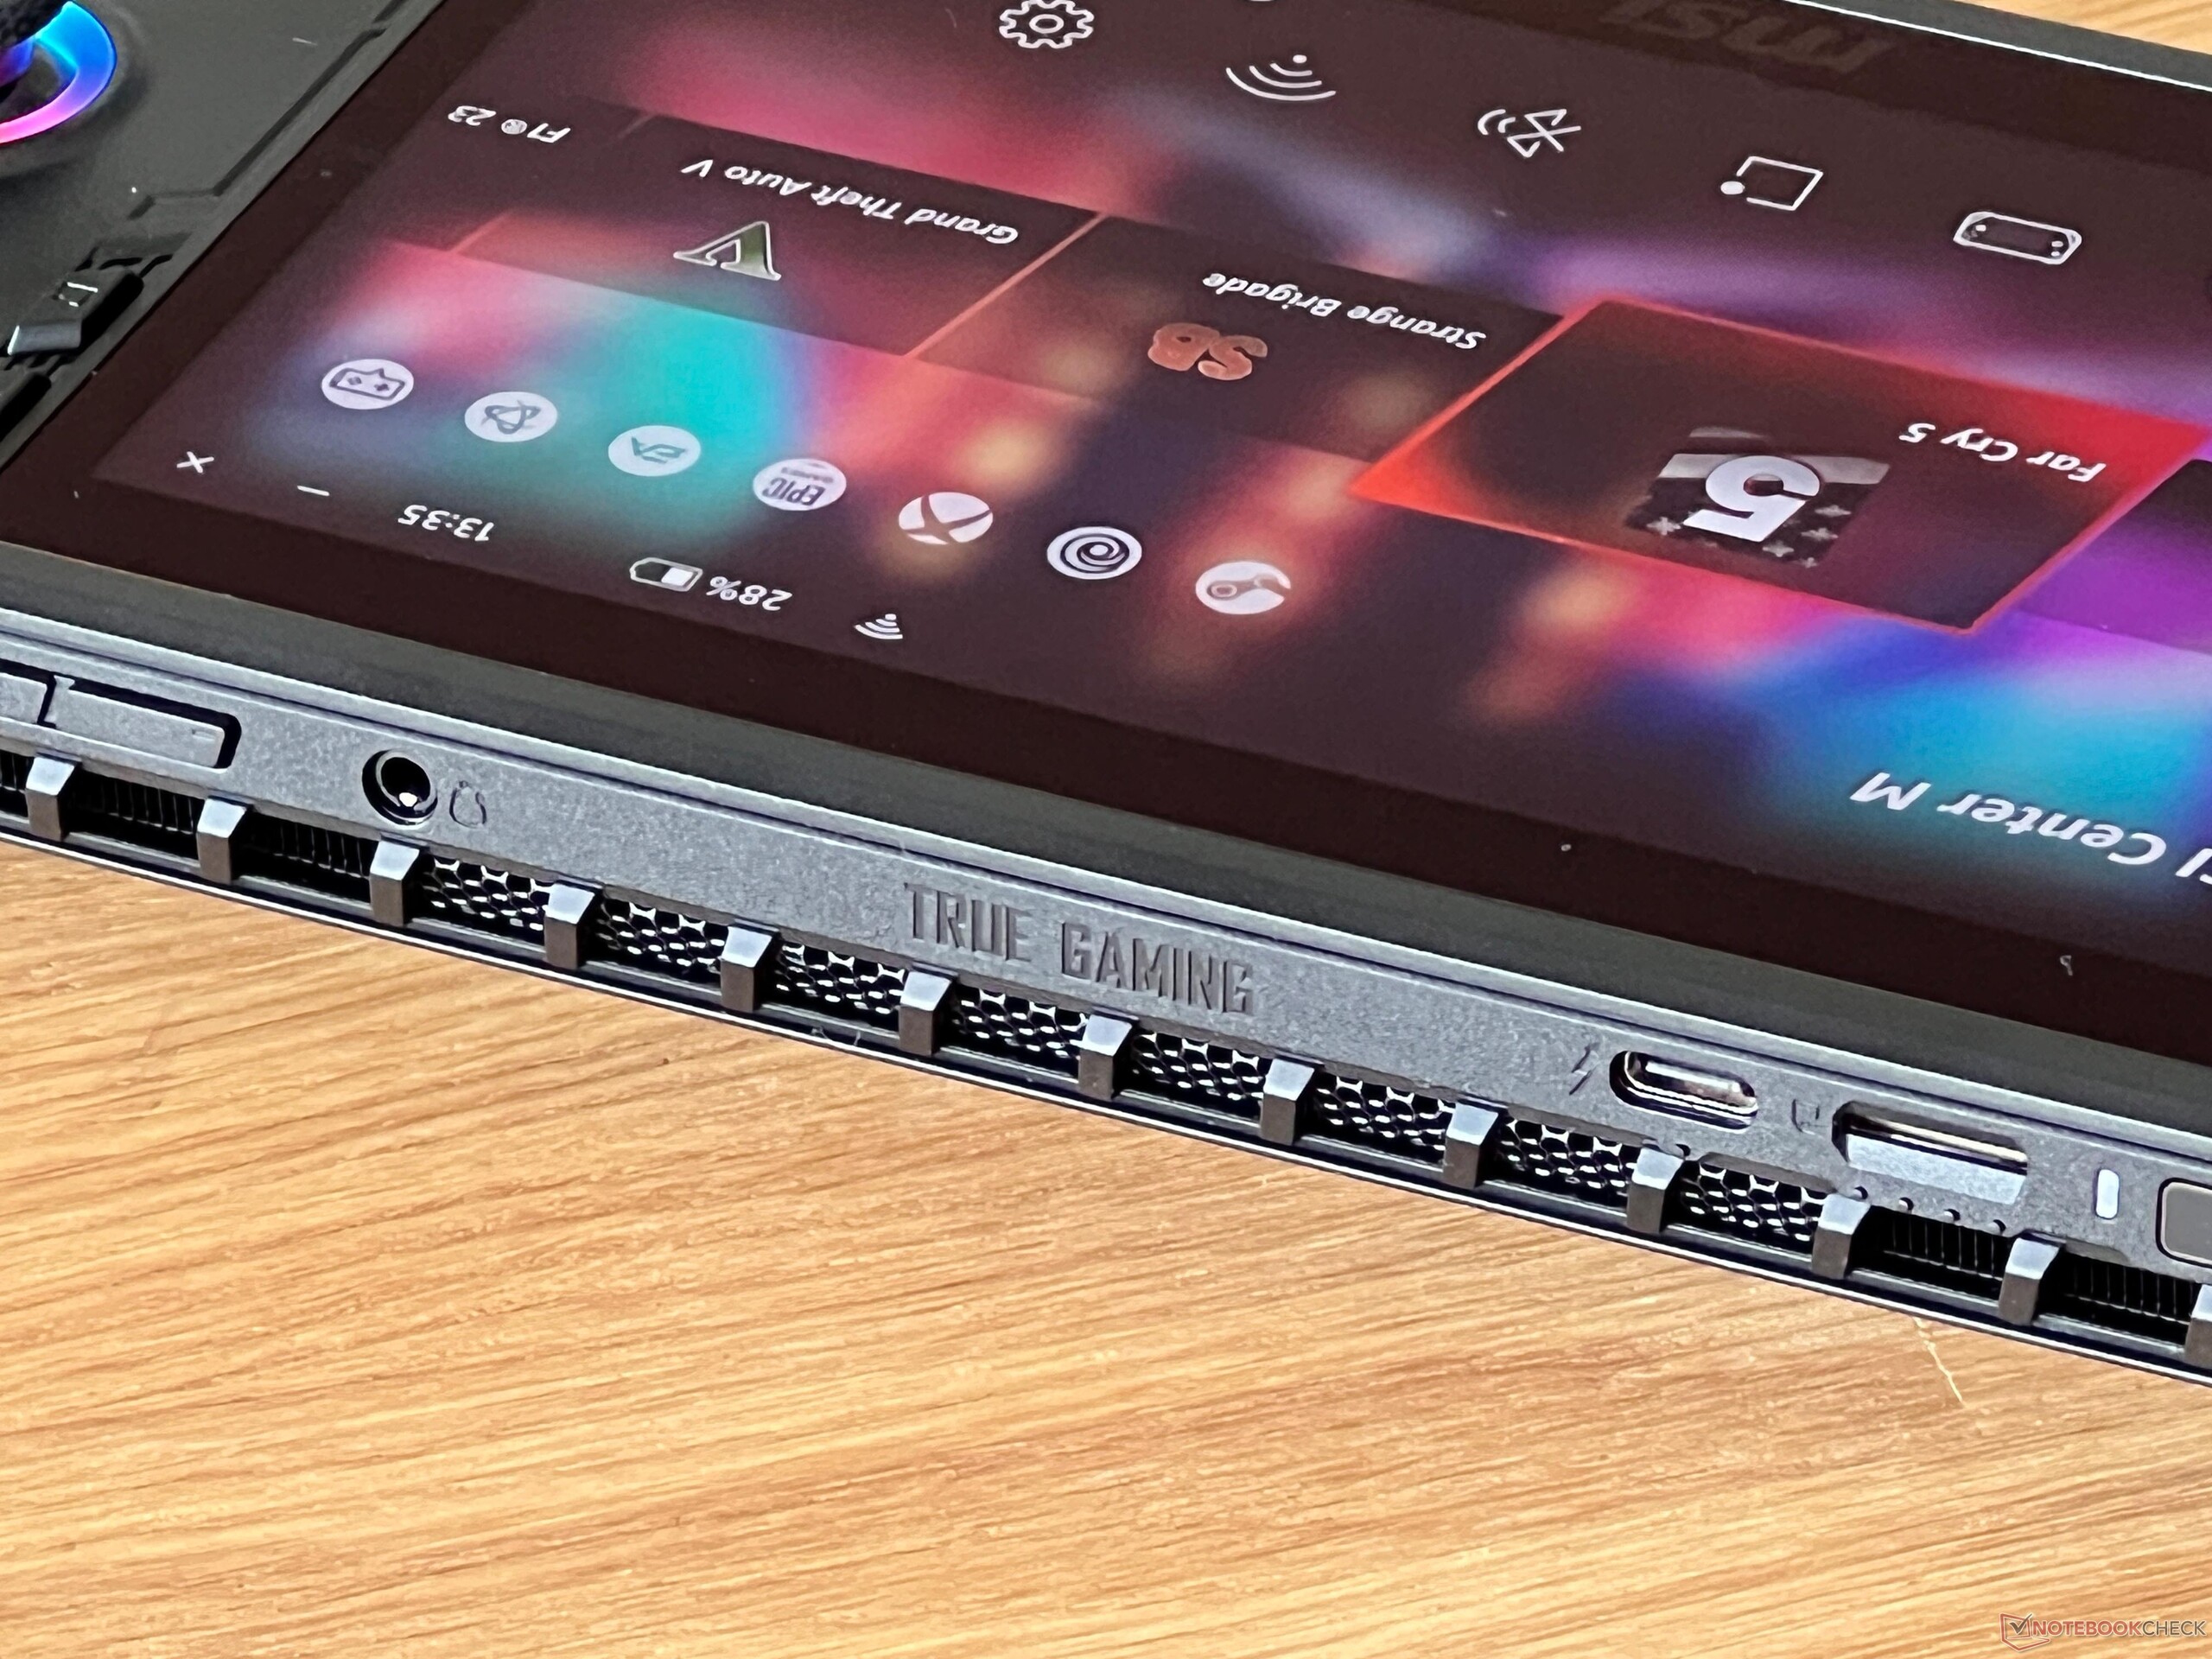
Bağlanabilirlik - Thunderbolt 4
MSI, cihazın üst kısmına Thunderbolt 4'ü de destekleyen bir USB-C bağlantı noktası yerleştirmiş. Örneğin harici SSD'leri veya USB bellekleri hızlı bir şekilde bağlamak için ikinci bir USB bağlantısı görmek isterdik. Bu, özellikle cihaz şebekeye bağlandığında veya harici bir monitörle birlikte çalıştırıldığında önemlidir. Testimizin bir kısmını harici bir monitöre bağlı oyuncu ile gerçekleştirdik ve ekran USB-C üzerinden güç dağıtımını desteklediği sürece harika çalıştı. Web kamerası yok, ancak güç düğmesi parmak izi tarayıcısı olarak da kullanılabiliyor.
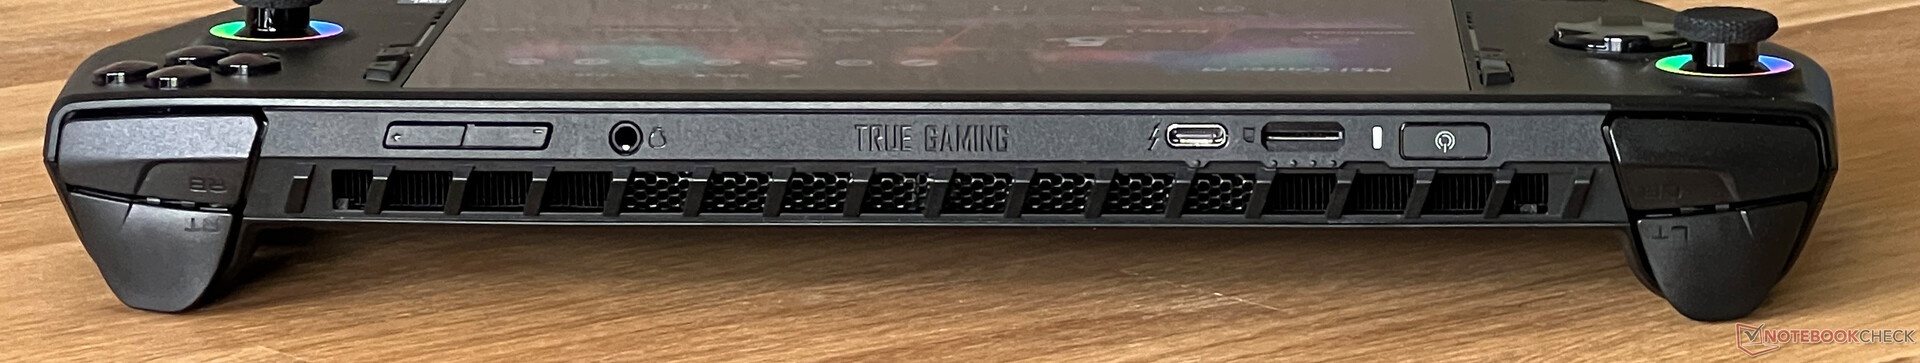
SD kart okuyucu
Üstteki yuvaya bir microSD kart takarak cihazın depolama alanını genişletebilirsiniz. Referans kartımızı (Angelbird AV Pro V60) kullanarak yaptığımız testte, kart okuyucunun 200 MB/s'nin üzerindeki aktarım hızları çok iyiydi ve karttan görüntü dosyalarını kopyalarken bile 120 MB/s civarında ölçüm yaptık.
| SD Card Reader | |
| average JPG Copy Test (av. of 3 runs) | |
| ONEXPLAYER 2 Pro AR18 (Angelbird AV PRO microSD) | |
| Lenovo Legion Go | |
| Ayaneo Kun | |
| Asus ROG Ally Z1 Extreme (Angelbird AV Pro V60) | |
| MSI Claw (Angelbird AV Pro V60) | |
| Sınıf ortalaması Handheld / UMPC (20.9 - 201, n=14, son 2 yıl) | |
| Valve Steam Deck 1 TB OLED | |
| maximum AS SSD Seq Read Test (1GB) | |
| Asus ROG Ally Z1 Extreme (Angelbird AV Pro V60) | |
| ONEXPLAYER 2 Pro AR18 (Angelbird AV PRO microSD) | |
| MSI Claw (Angelbird AV Pro V60) | |
| Ayaneo Kun | |
| Sınıf ortalaması Handheld / UMPC (74.7 - 260, n=13, son 2 yıl) | |
| Lenovo Legion Go | |
İletişim
MSI, Claw el cihazını modern bir Wi-Fi 7 modülü olan Killer BE1750x BE200NGW ile donattı, bu da cihazın en yeni WLAN ağları için hazır olduğu anlamına geliyor. Testlerimizde henüz uygun bir Wi-Fi 7 yönlendirici kullanmıyoruz, ancak Asus'un referans yönlendiricisini kullanarak performansı hala çok iyi ve istikrarlıydı, ancak daha büyük dizüstü bilgisayarlarınkini tam olarak karşılayamadı. Günlük kullanımda, sinyal kalitesiyle ilgili hiçbir sorun yaşamadık ve büyük oyunları bile indirmek hiç zaman almadı.
| Networking | |
| MSI Claw | |
| iperf3 transmit AXE11000 | |
| iperf3 receive AXE11000 | |
| Valve Steam Deck 1 TB OLED | |
| iperf3 transmit AXE11000 | |
| iperf3 receive AXE11000 | |
| iperf3 transmit AXE11000 6GHz | |
| iperf3 receive AXE11000 6GHz | |
| Lenovo Legion Go | |
| iperf3 transmit AXE11000 | |
| iperf3 receive AXE11000 | |
| iperf3 transmit AXE11000 6GHz | |
| iperf3 receive AXE11000 6GHz | |
| Asus ROG Ally Z1 Extreme | |
| iperf3 transmit AXE11000 | |
| iperf3 receive AXE11000 | |
| ONEXPLAYER 2 Pro AR18 | |
| iperf3 transmit AXE11000 | |
| iperf3 receive AXE11000 | |
| iperf3 transmit AXE11000 6GHz | |
| iperf3 receive AXE11000 6GHz | |
| Ayaneo Kun | |
| iperf3 transmit AXE11000 | |
| iperf3 receive AXE11000 | |
| iperf3 transmit AXE11000 6GHz | |
| iperf3 receive AXE11000 6GHz | |
Bakım
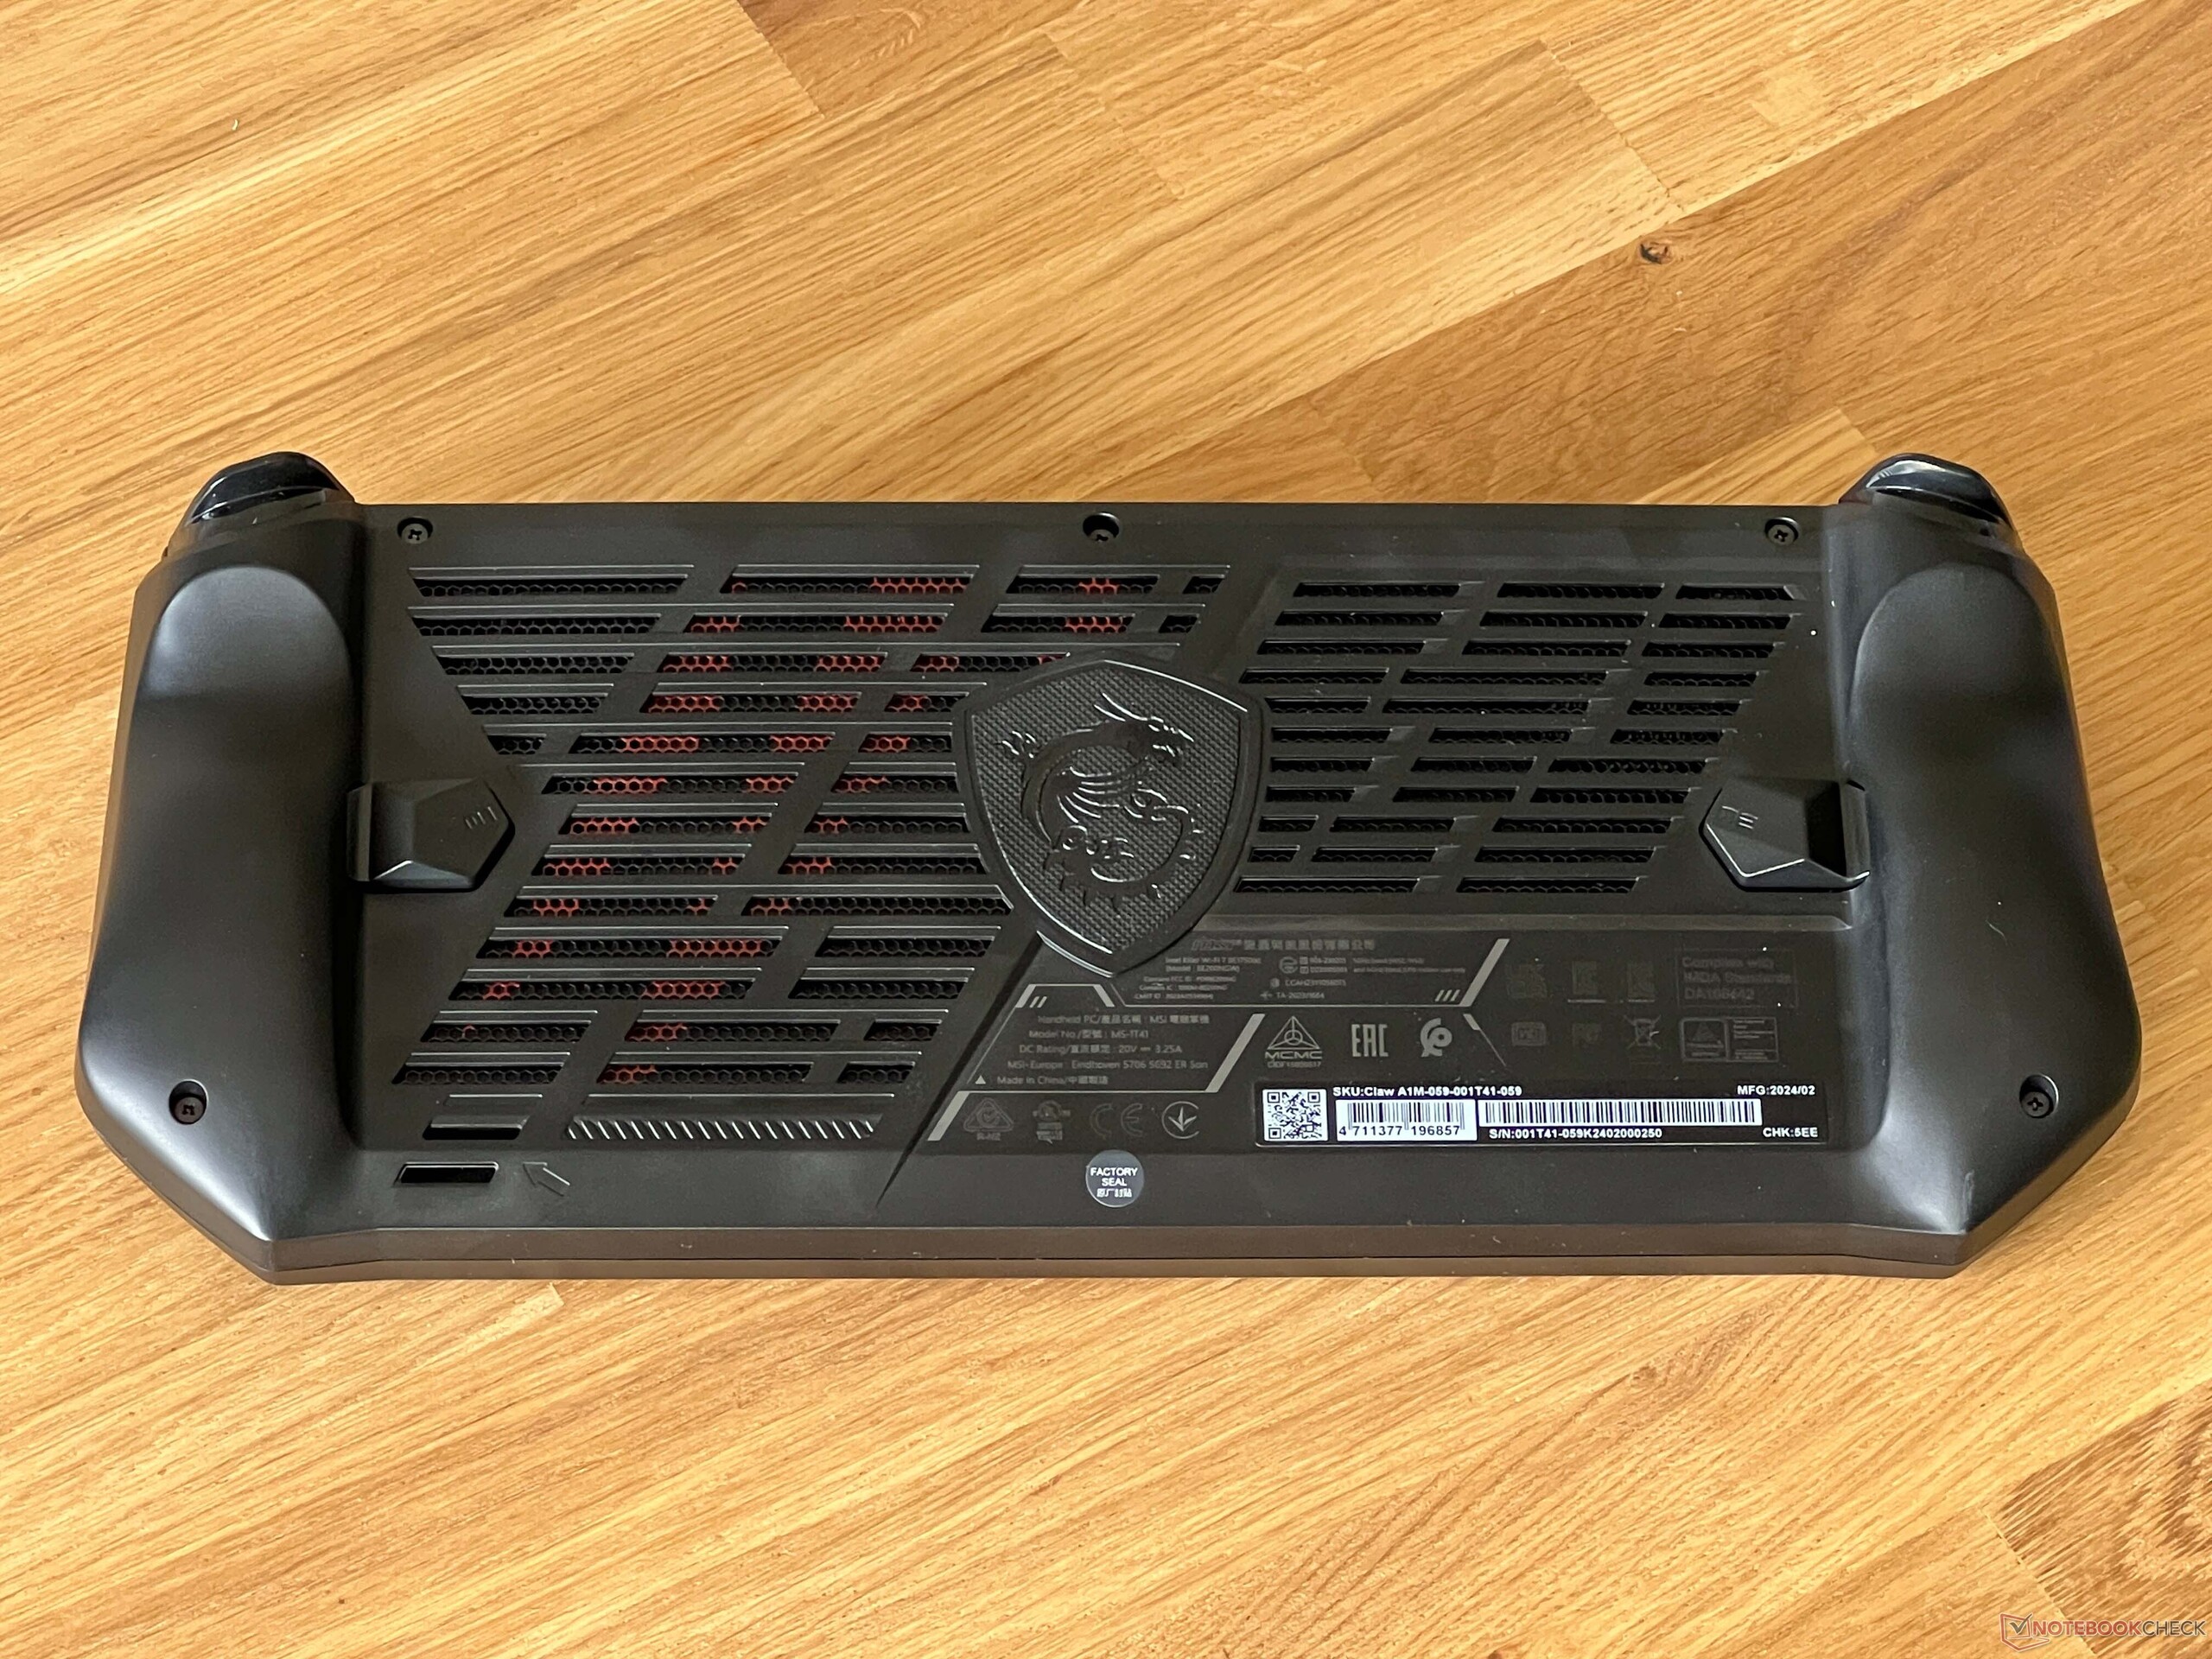
Arka kısım toplam altı adet Phillips vida ile sabitlenmiştir. MSI cihazlarında her zaman olduğu gibi, bir vida üzerinde Fabrika Mührü yazan bir etiketle kapatılmıştır. Doğru kullanım el cihazının garantisini geçersiz kılmaz, ancak test cihazımız bir mağaza cihazı olduğu için mühre zarar vermek istemedik. Küçük M.2 2230 SSD'yi değiştirmek için hem pilin hem de tüm soğutma ünitesinin çıkarılması gerekir, bu da tekrar bir araya getirdiğinizde termal macunun yeniden uygulanmasını gerekli kılar.
Giriş cihazları ve çalıştırma
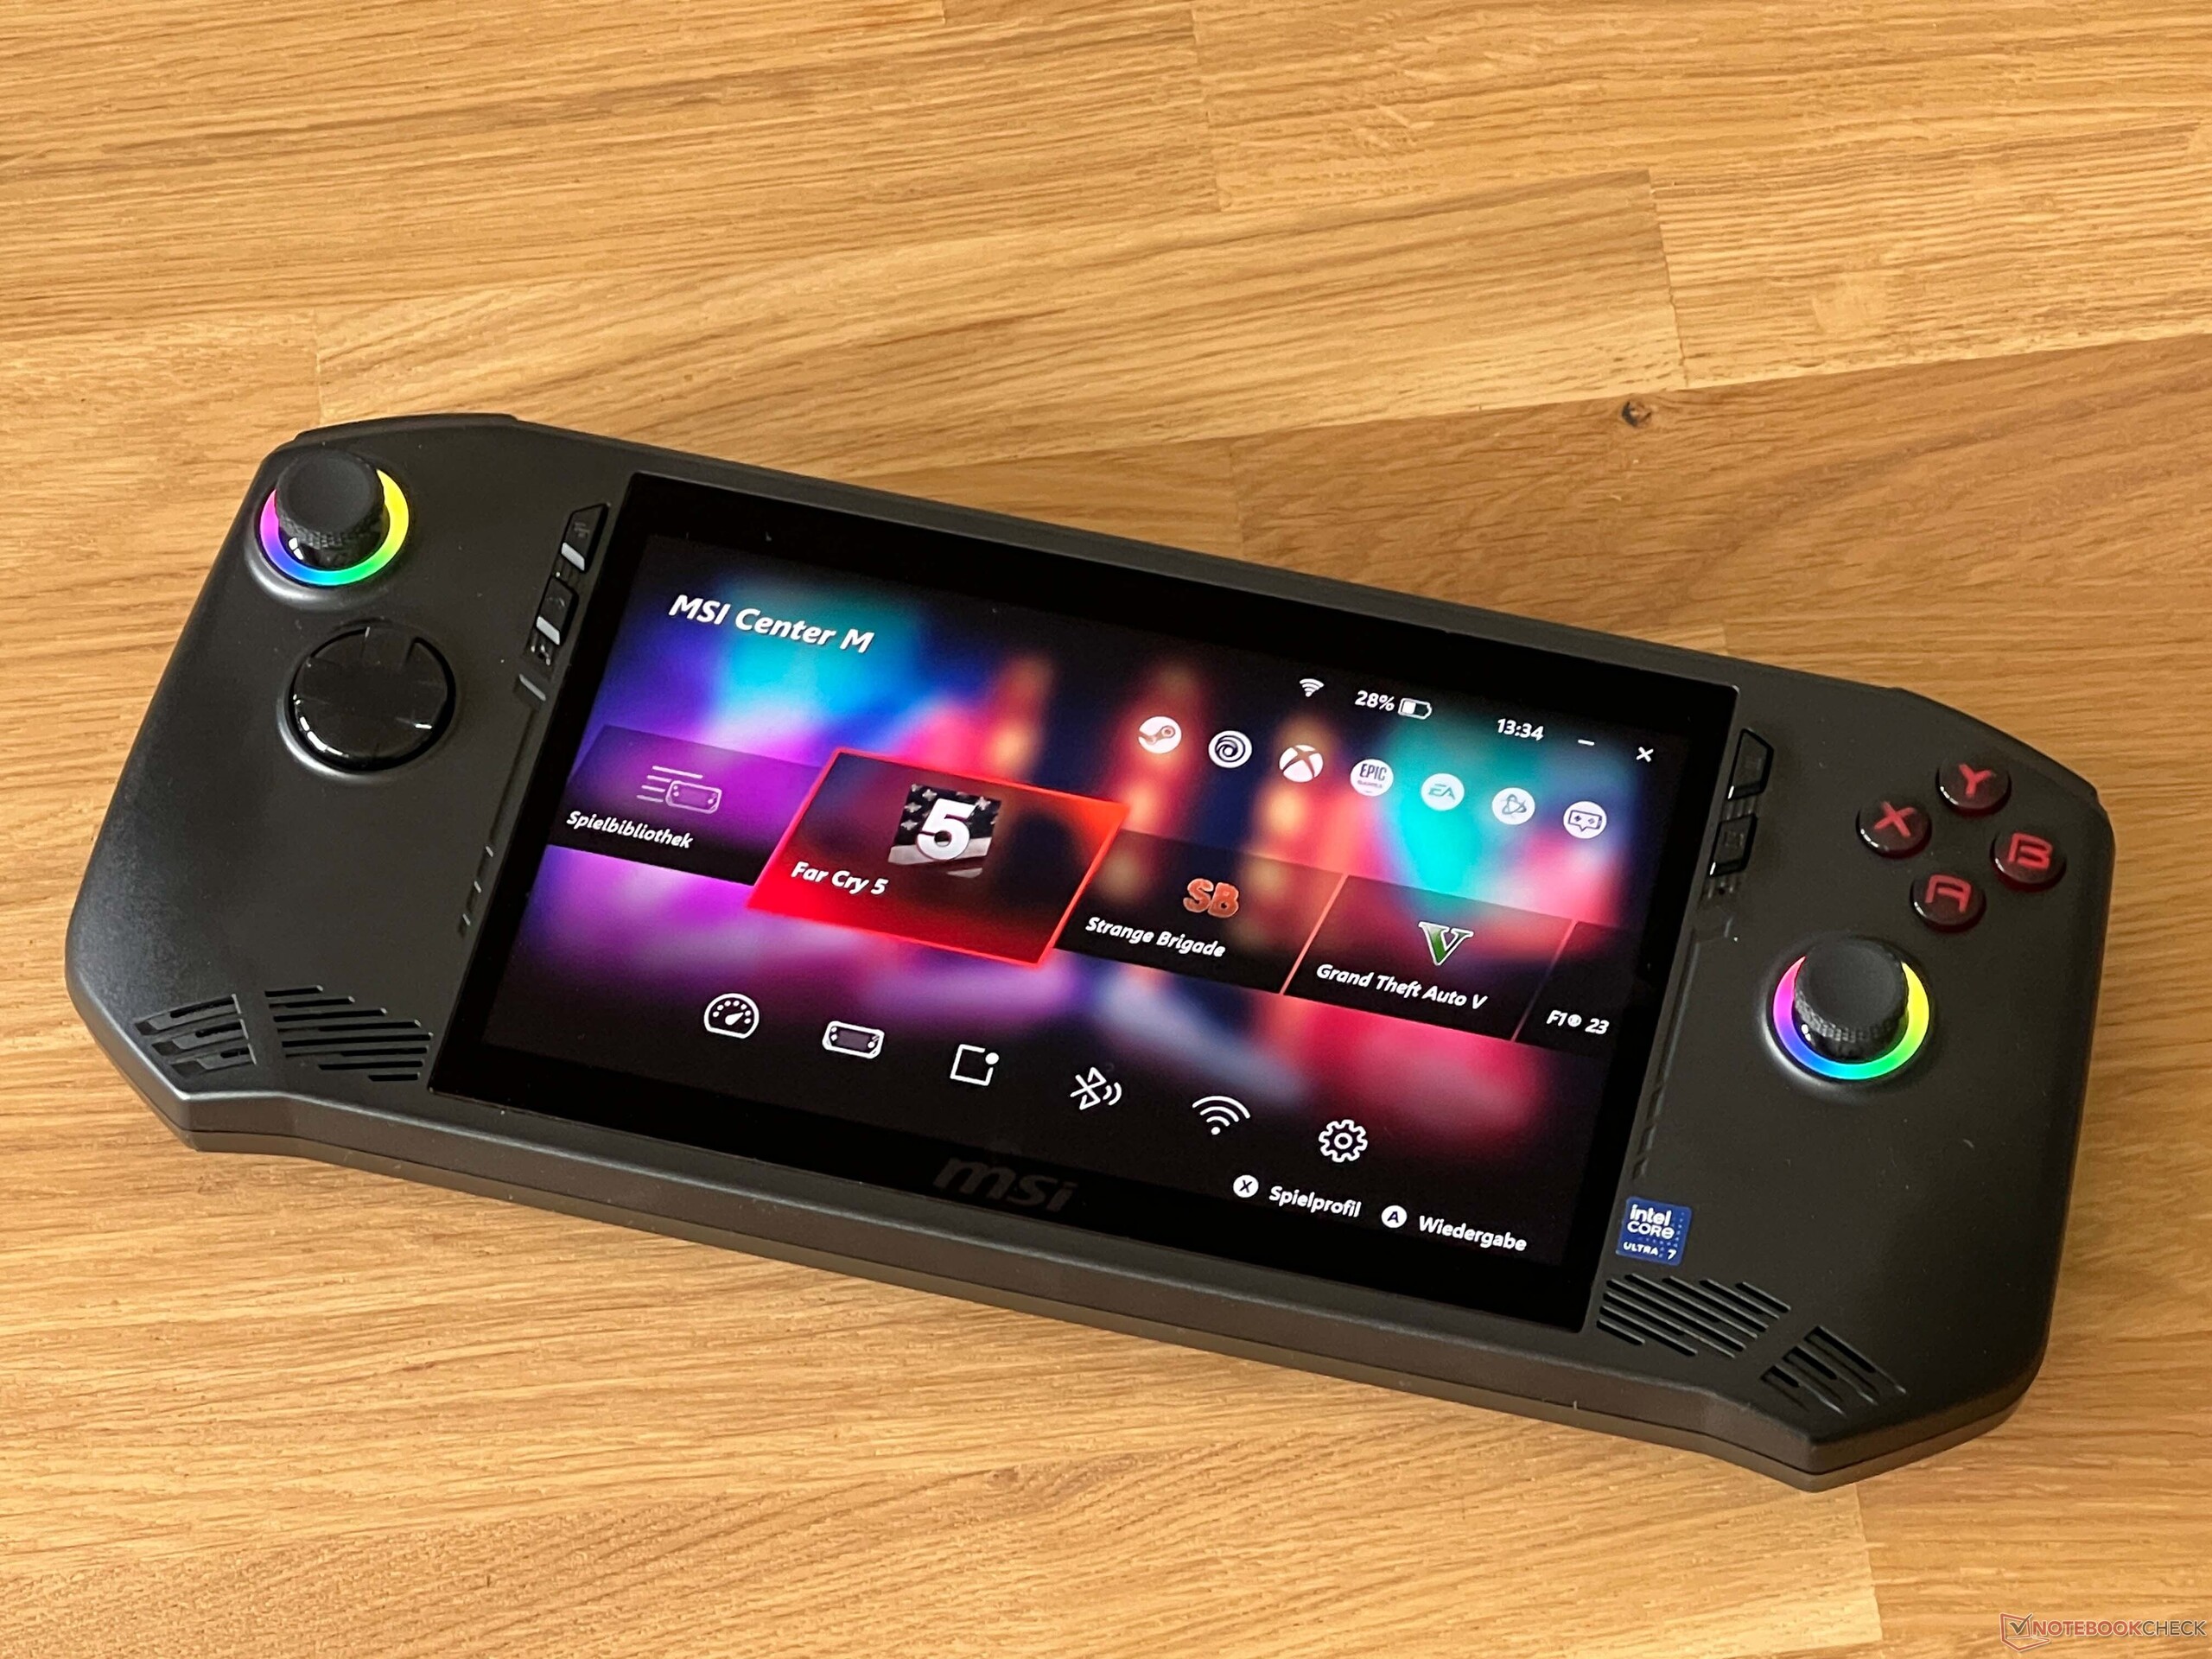
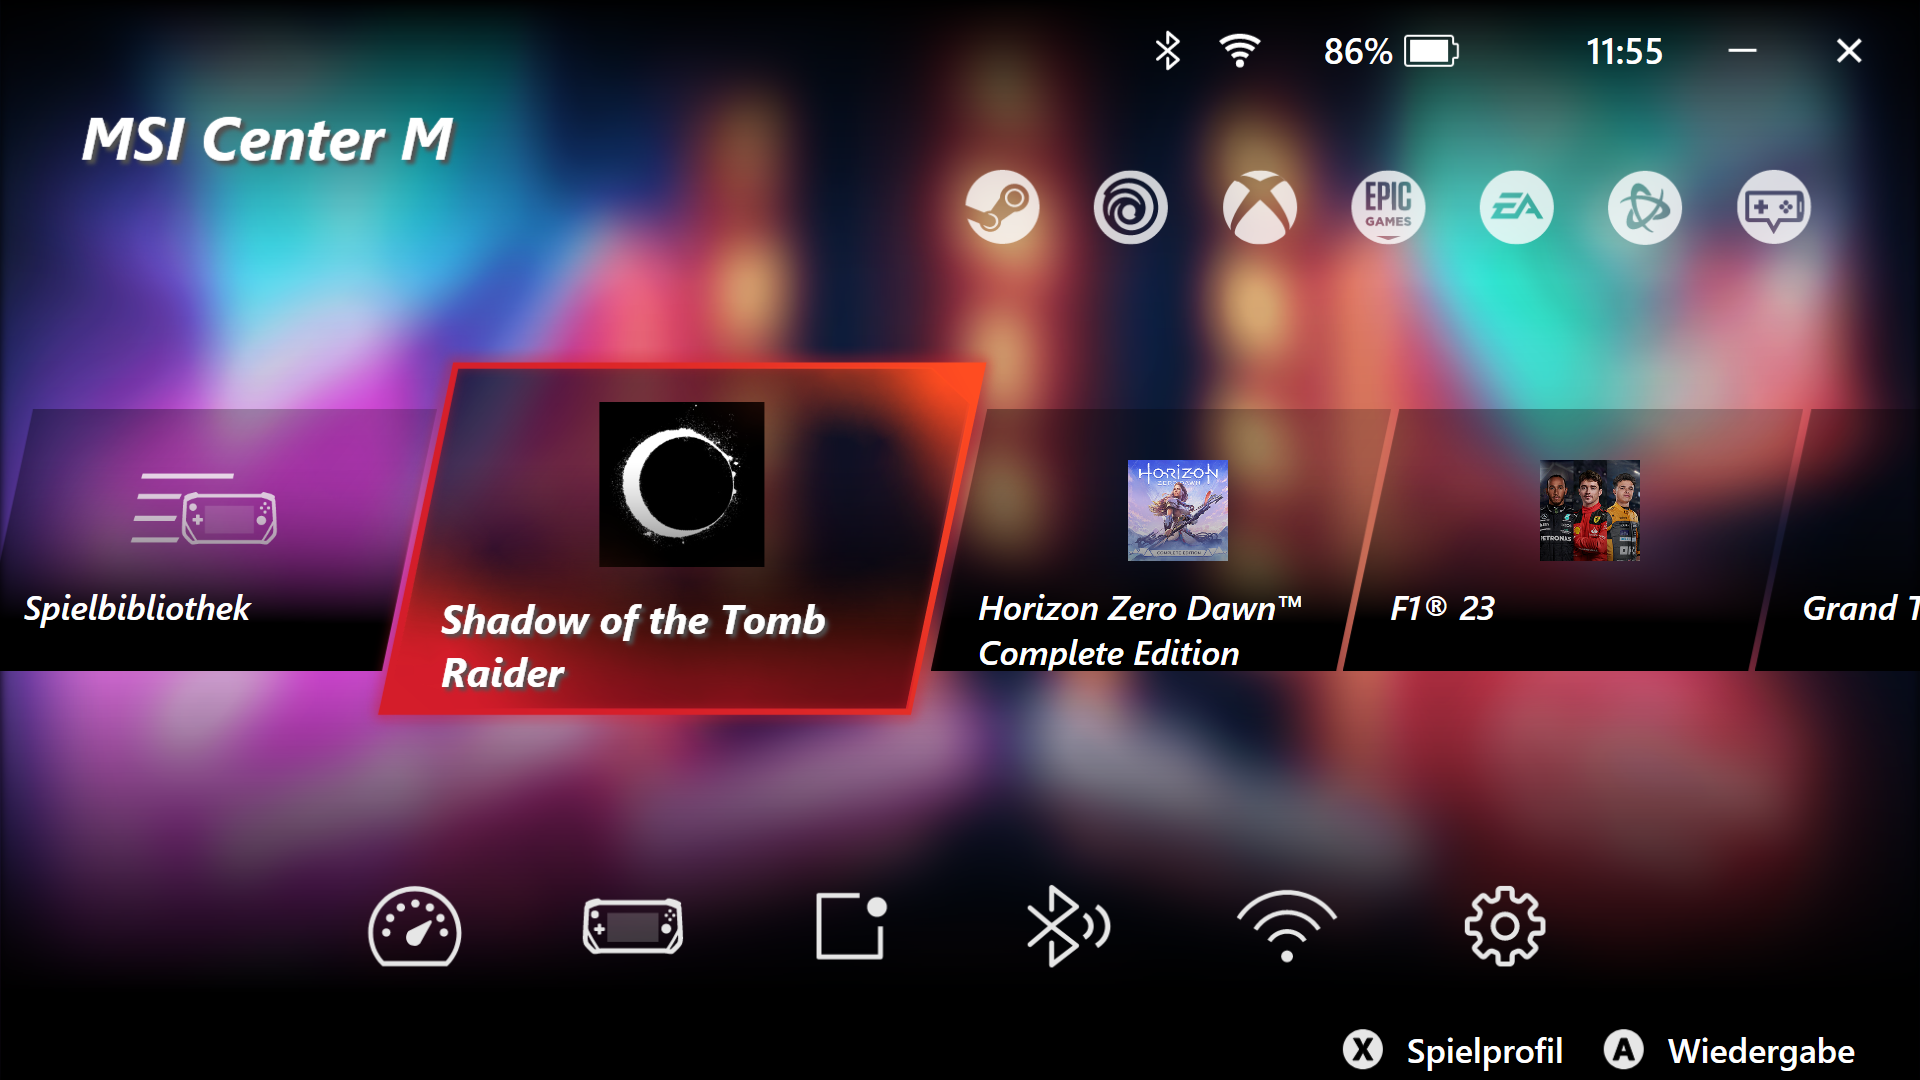
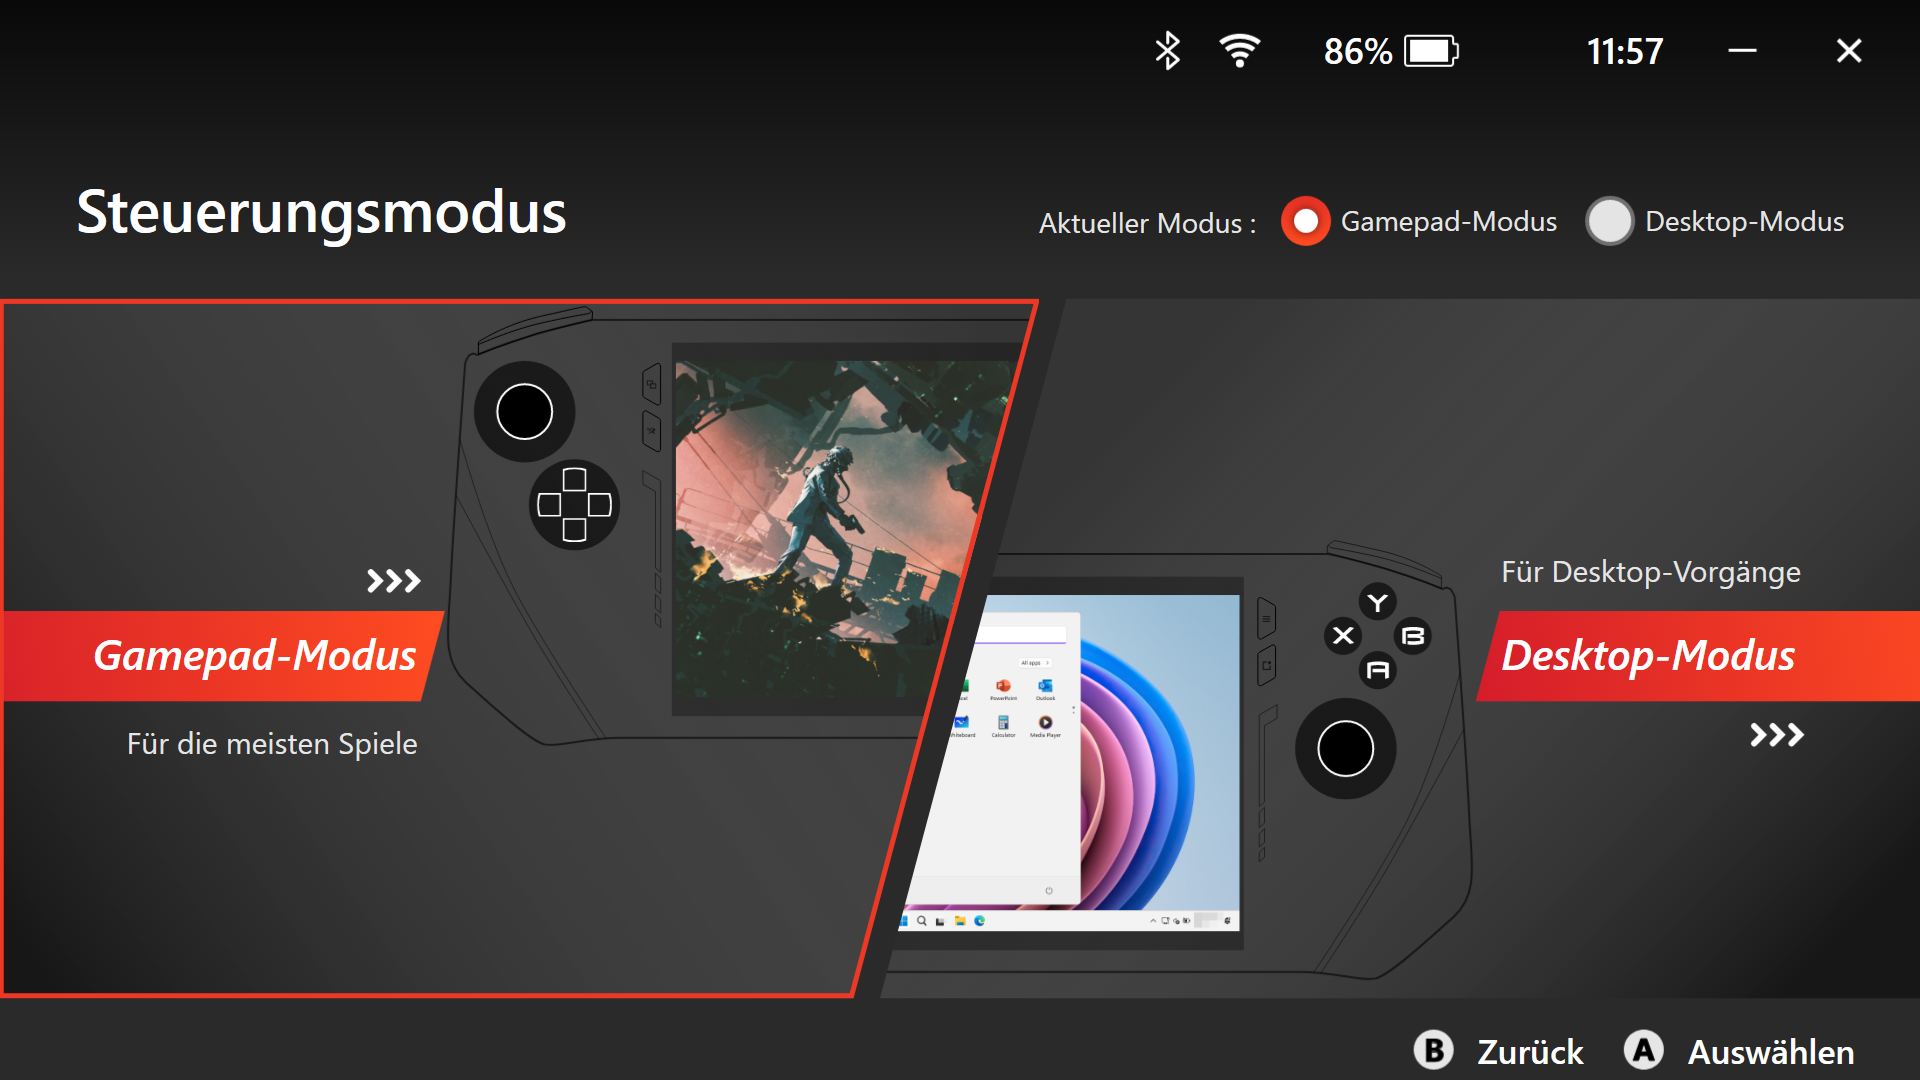
Birincil giriş yöntemleri cihazın kapasitif özelliğinin yanı sıra iki joystick, D-pad ve ek düğmeler gibi "gamepad" kontrolleridir. Dokunmatik ekranın kendisi mükemmel çalışıyor, ancak Windows'u sadece bir dokunmatik ekranla (özellikle küçük bir ekranla) kullanmak yine de çok yorucu ve ilk kurulum çok eğlenceli değil. İdeal olarak, cihaza güç sağlayan ve bir fare ile klavyenin de doğrudan bağlanabileceği bir monitörünüz olmalıdır. Windows ile işiniz biter bitmez, her şey üreticinin yazılımı etrafında döner - bu durumda MSI Center M. Cihaz açıldığında başlatıcı otomatik olarak başlatılabilir ve tüm ayarlarda değişiklikler burada yapılabilir. Buna ek olarak, Steam, UPlay, XBox, Epic, EA ve Battlenet gibi tüm önemli oyun hizmetleri zaten entegre edilmiş durumda ve bu sayede oyun yüklemek çok kolay. Ayrıca, herhangi bir zamanda görüntülenebilen ve en önemli ayarları (enerji profili, parlaklık, Wi-Fi bağlantısı) hızlı bir şekilde değiştirmek için kullanılabilen hızlı bir menü de vardır. Menü de son derece özelleştirilebilir ve genel olarak Center-M yazılımı kusursuz çalışıyor ve çok iyi geliştirilmiş görünüyor. Sadece gerçek zamanlı izleme (üç farklı mod) sol üst köşeye bağlı ve FPS ekranı test ettiğimiz oyunların hiçbirinde çalışmadı.
MSI, Hall Effect analog çubukları ve tetikleyicileri kullanır, bu nedenle çubuk kayması ile ilgili herhangi bir sorun olmayacaktır. Düğmeler toplamda ROG Ally'ye kıyasla biraz daha yüksek ses çıkarıyor ve tetikler orijinal konumlarına döndüğünde çıkan yüksek ses biraz can sıkıcı olabiliyor. Ancak oyun oynarken herhangi bir işlevsel sorunla karşılaşmadık.
Ekran - 120 Hz yenileme hızına sahip 7 inç IPS

7 inç 16:9 IPS ekran 1.920 x 1.080 piksel çözünürlüğe sahiptir. Yenileme hızı 120 Hz ancak ROG Ally'nin aksine Claw değişken yenileme hızını desteklemiyor. Parlak yüzeyler biraz grenli görünme eğiliminde olsa da ekran genel olarak iyi bir izlenim bırakıyor. Tepki süreleri güzel ve hızlı ve tam parlaklıkta sadece hafif bir arka ışık akması gözlemledik, ayrıca PWM titremesi de yok.
Maksimum parlaklığı 483 cd/m² ve ortalama 461 cd/m² olarak ölçtük. Siyah seviyesi 0,32 cd/m²'dir ve bu da neredeyse 1.500:1'lik çok iyi bir maksimum kontrast oranıyla sonuçlanır.
| |||||||||||||||||||||||||
Aydınlatma: 88 %
Kontrast: 1491:1 (Siyah: 0.32 cd/m²)
ΔE Color 2.6 | 0.5-29.43 Ø4.87, calibrated: 1.5
ΔE Greyscale 3.9 | 0.5-98 Ø5.1
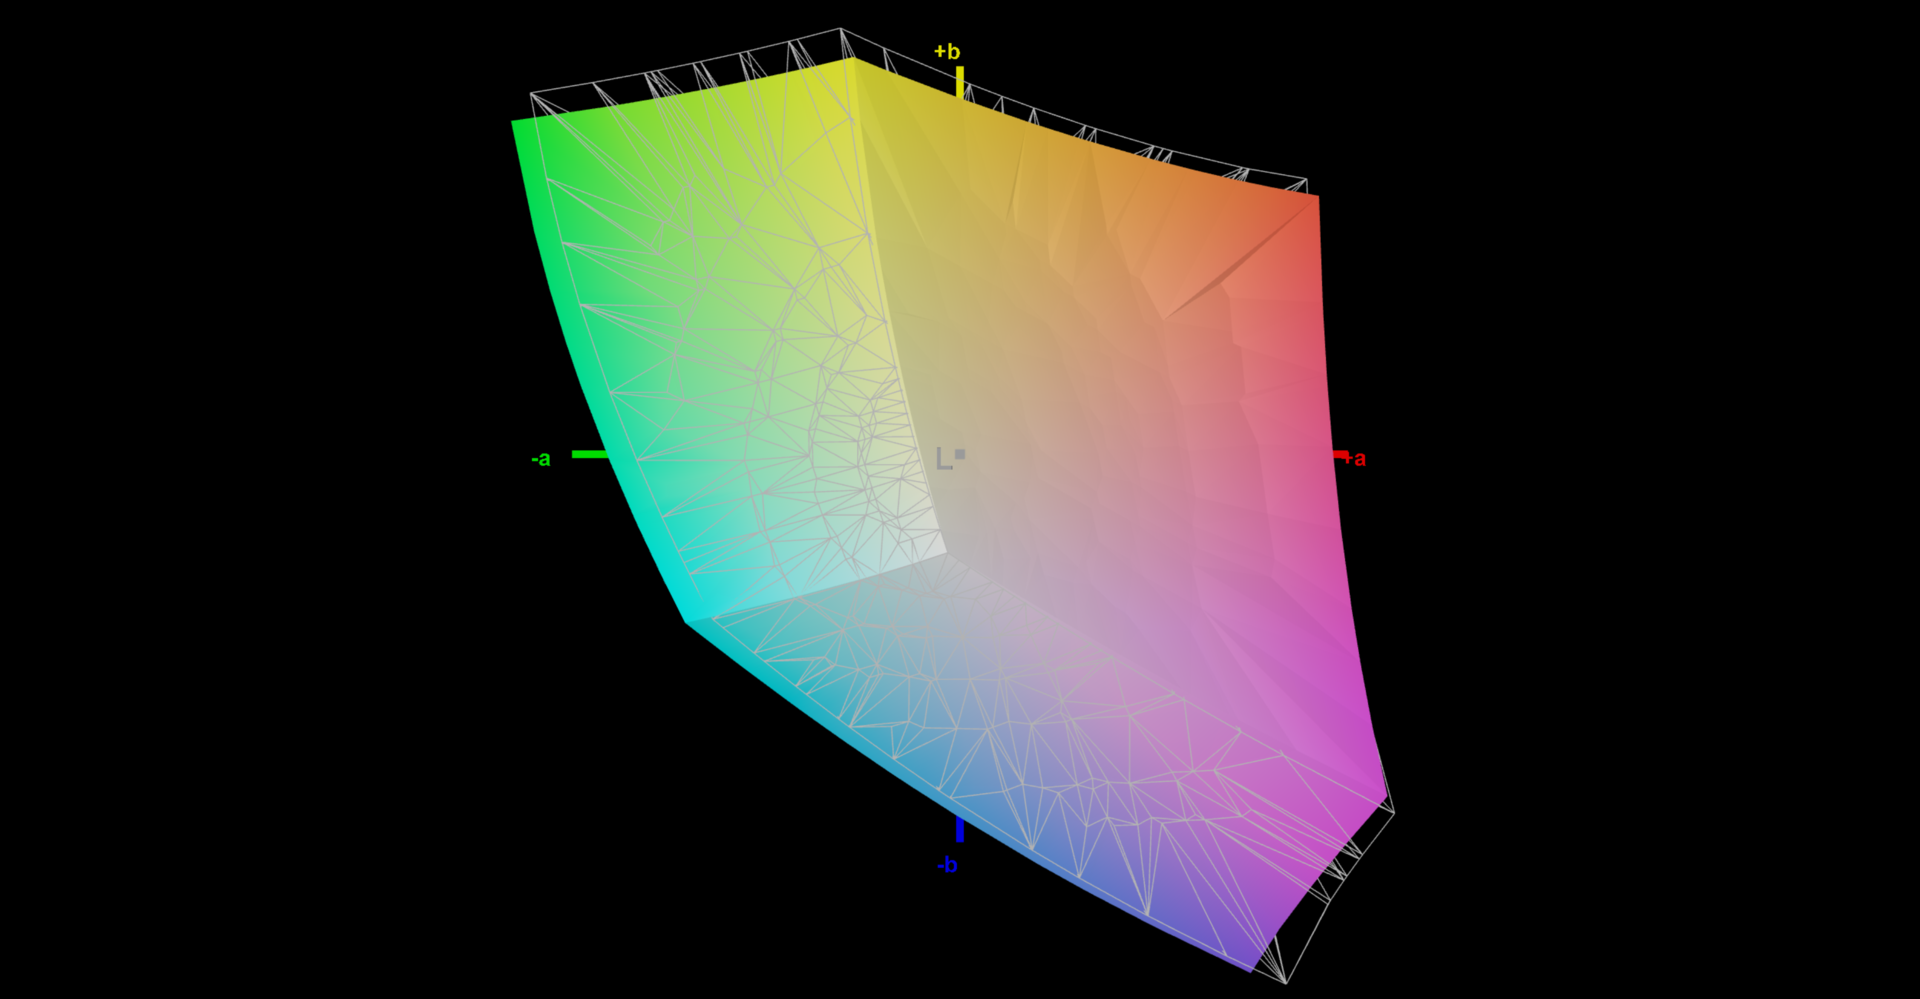
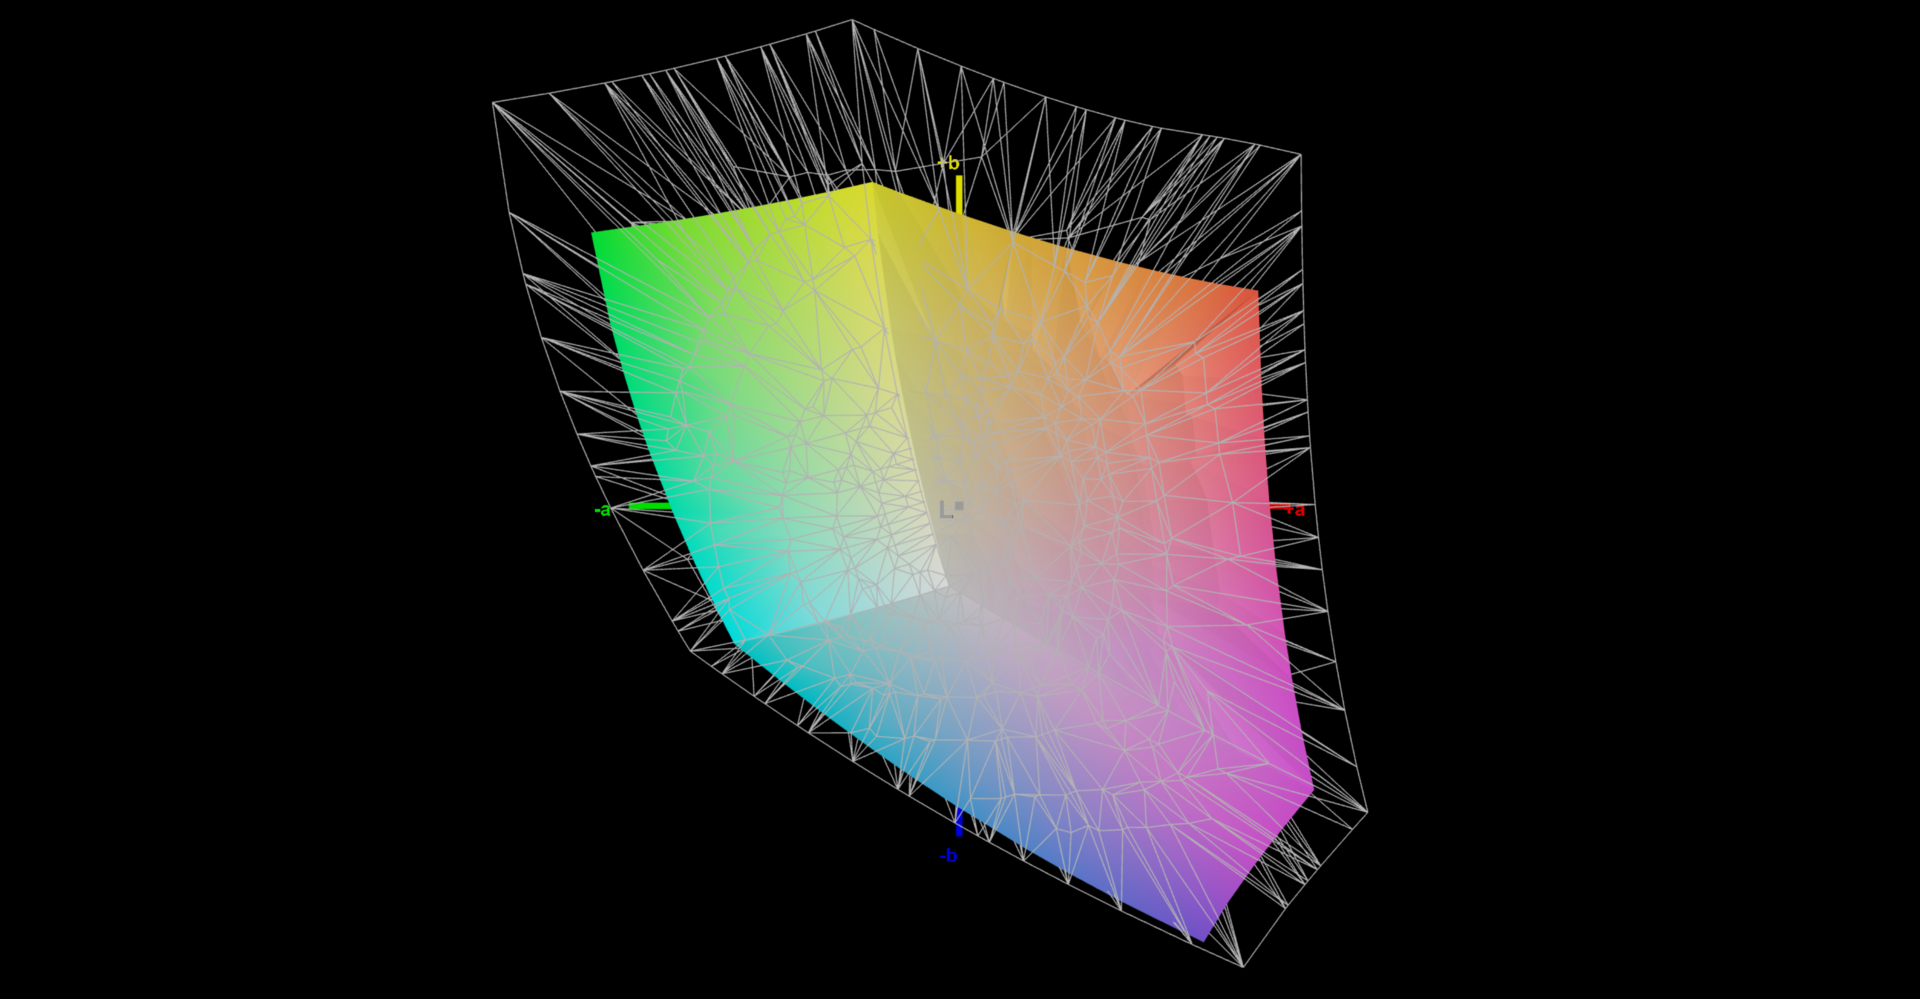
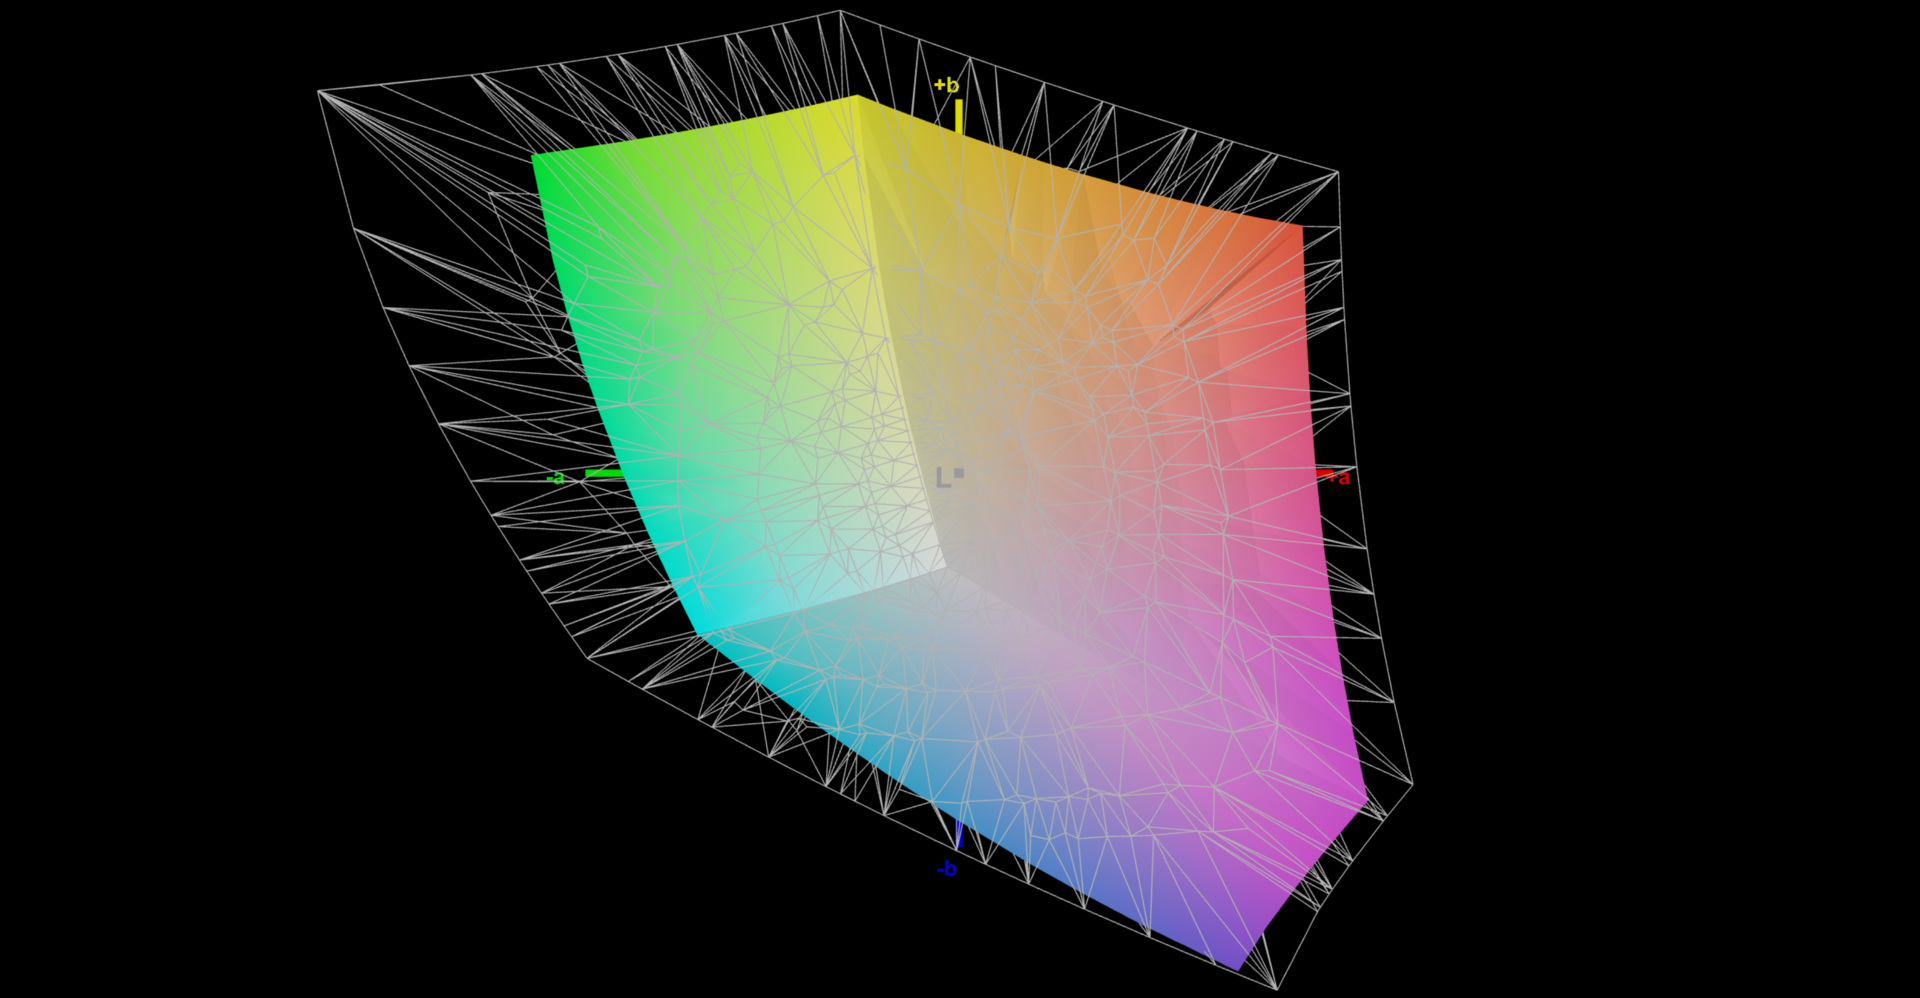
69.4% AdobeRGB 1998 (Argyll 2.2.0 3D)
94.4% sRGB (Argyll 2.2.0 3D)
67% Display P3 (Argyll 2.2.0 3D)
Gamma: 2.17
| MSI Claw TL070FVXS02-0, IPS, 1920x1080, 7" | Valve Steam Deck 1 TB OLED ANX7530 U, OLED, 1280x800, 7.4" | Lenovo Legion Go Legion Go Display, IPS, 2560x1600, 8.8" | Asus ROG Ally Z1 Extreme TL070FVSX01-0, IPS, 1920x1080, 7" | ONEXPLAYER 2 Pro AR18 FLQ8423-24L0, IPS, 2560x1600, 8.4" | Ayaneo Kun Ayaneo 2K, IPS, 2560x1600, 8.4" | |
|---|---|---|---|---|---|---|
| Display | 31% | 24% | -2% | 20% | 25% | |
| Display P3 Coverage | 67 | 99.6 49% | 92.1 37% | 65.6 -2% | 91.9 37% | 93.52 40% |
| sRGB Coverage | 94.4 | 100 6% | 99.56 5% | 92.1 -2% | 99.3 5% | 99.4 5% |
| AdobeRGB 1998 Coverage | 69.4 | 96.1 38% | 90.09 30% | 67.9 -2% | 81.6 18% | 91.2 31% |
| Response Times | -17% | -122% | -3% | -211% | -154% | |
| Response Time Grey 50% / Grey 80% * | 9.2 ? | 9 ? 2% | 20.8 ? -126% | 10.5 ? -14% | 25.5 ? -177% | 24.2 ? -163% |
| Response Time Black / White * | 6.6 ? | 9 ? -36% | 14.4 ? -118% | 6 ? 9% | 22.73 ? -244% | 16.2 ? -145% |
| PWM Frequency | 360 ? | 700 | 20000 | |||
| Screen | 147% | -37% | -17% | -14% | -20% | |
| Brightness middle | 477 | 485 2% | 411 -14% | 513 8% | 318 -33% | 680 43% |
| Brightness | 461 | 482 5% | 413 -10% | 474 3% | 287 -38% | 678 47% |
| Brightness Distribution | 88 | 98 11% | 80 -9% | 84 -5% | 48 -45% | 91 3% |
| Black Level * | 0.32 | 0.03 91% | 0.42 -31% | 0.38 -19% | 0.1118 65% | 0.5 -56% |
| Contrast | 1491 | 16167 984% | 979 -34% | 1350 -9% | 2844 91% | 1360 -9% |
| Colorchecker dE 2000 * | 2.6 | 2 23% | 5.94 -128% | 3.7 -42% | 4.81 -85% | 4 -54% |
| Colorchecker dE 2000 max. * | 5.8 | 5 14% | 10.56 -82% | 8.3 -43% | 6.93 -19% | 9 -55% |
| Colorchecker dE 2000 calibrated * | 1.5 | 2.95 -97% | 1.53 -2% | 1 33% | ||
| Greyscale dE 2000 * | 3.9 | 2 49% | 0.92 76% | 5.1 -31% | 6.12 -57% | 9 -131% |
| Gamma | 2.17 101% | 2 110% | 1.93 114% | 2.14 103% | 2.003 110% | 2 110% |
| CCT | 7250 90% | 6336 103% | 8064 81% | 7732 84% | 7707 84% | 7188 90% |
| Toplam Ortalama (Program / Ayarlar) | 54% /
95% | -45% /
-36% | -7% /
-11% | -68% /
-35% | -50% /
-29% |
* ... daha küçük daha iyidir
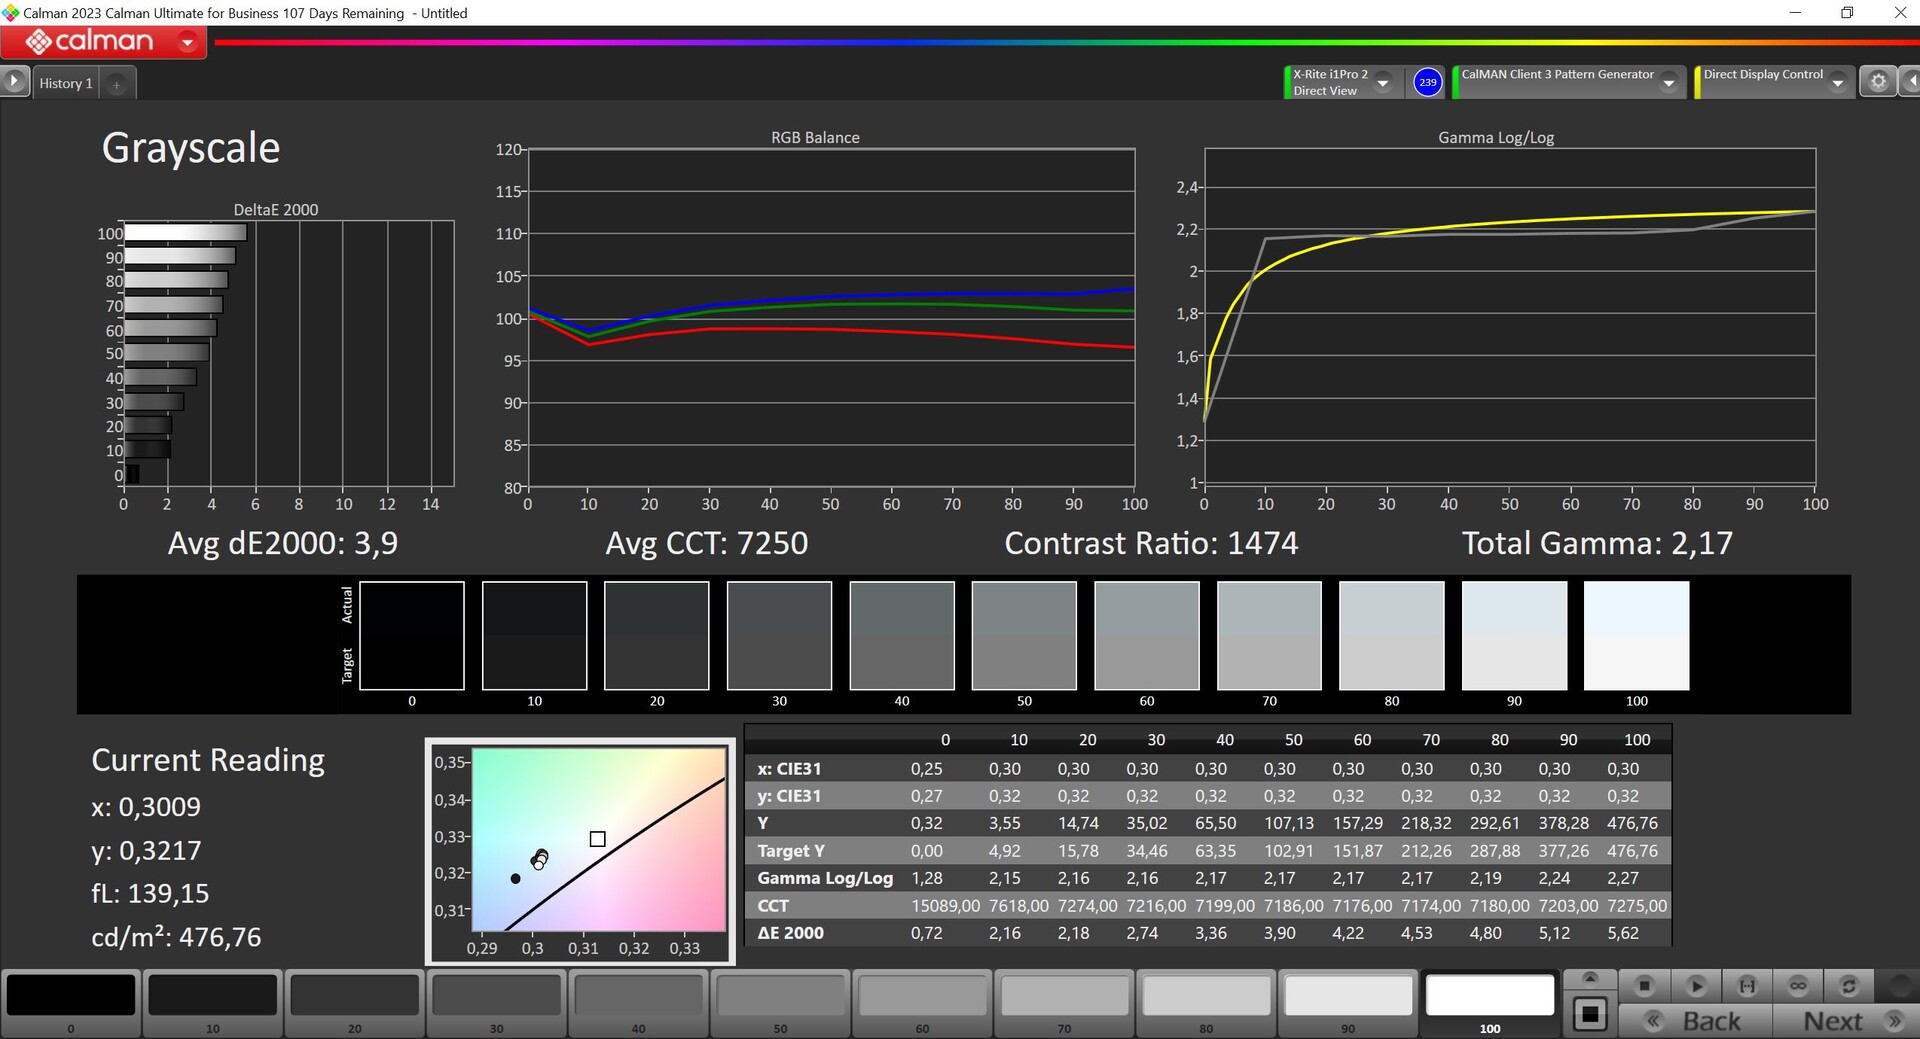

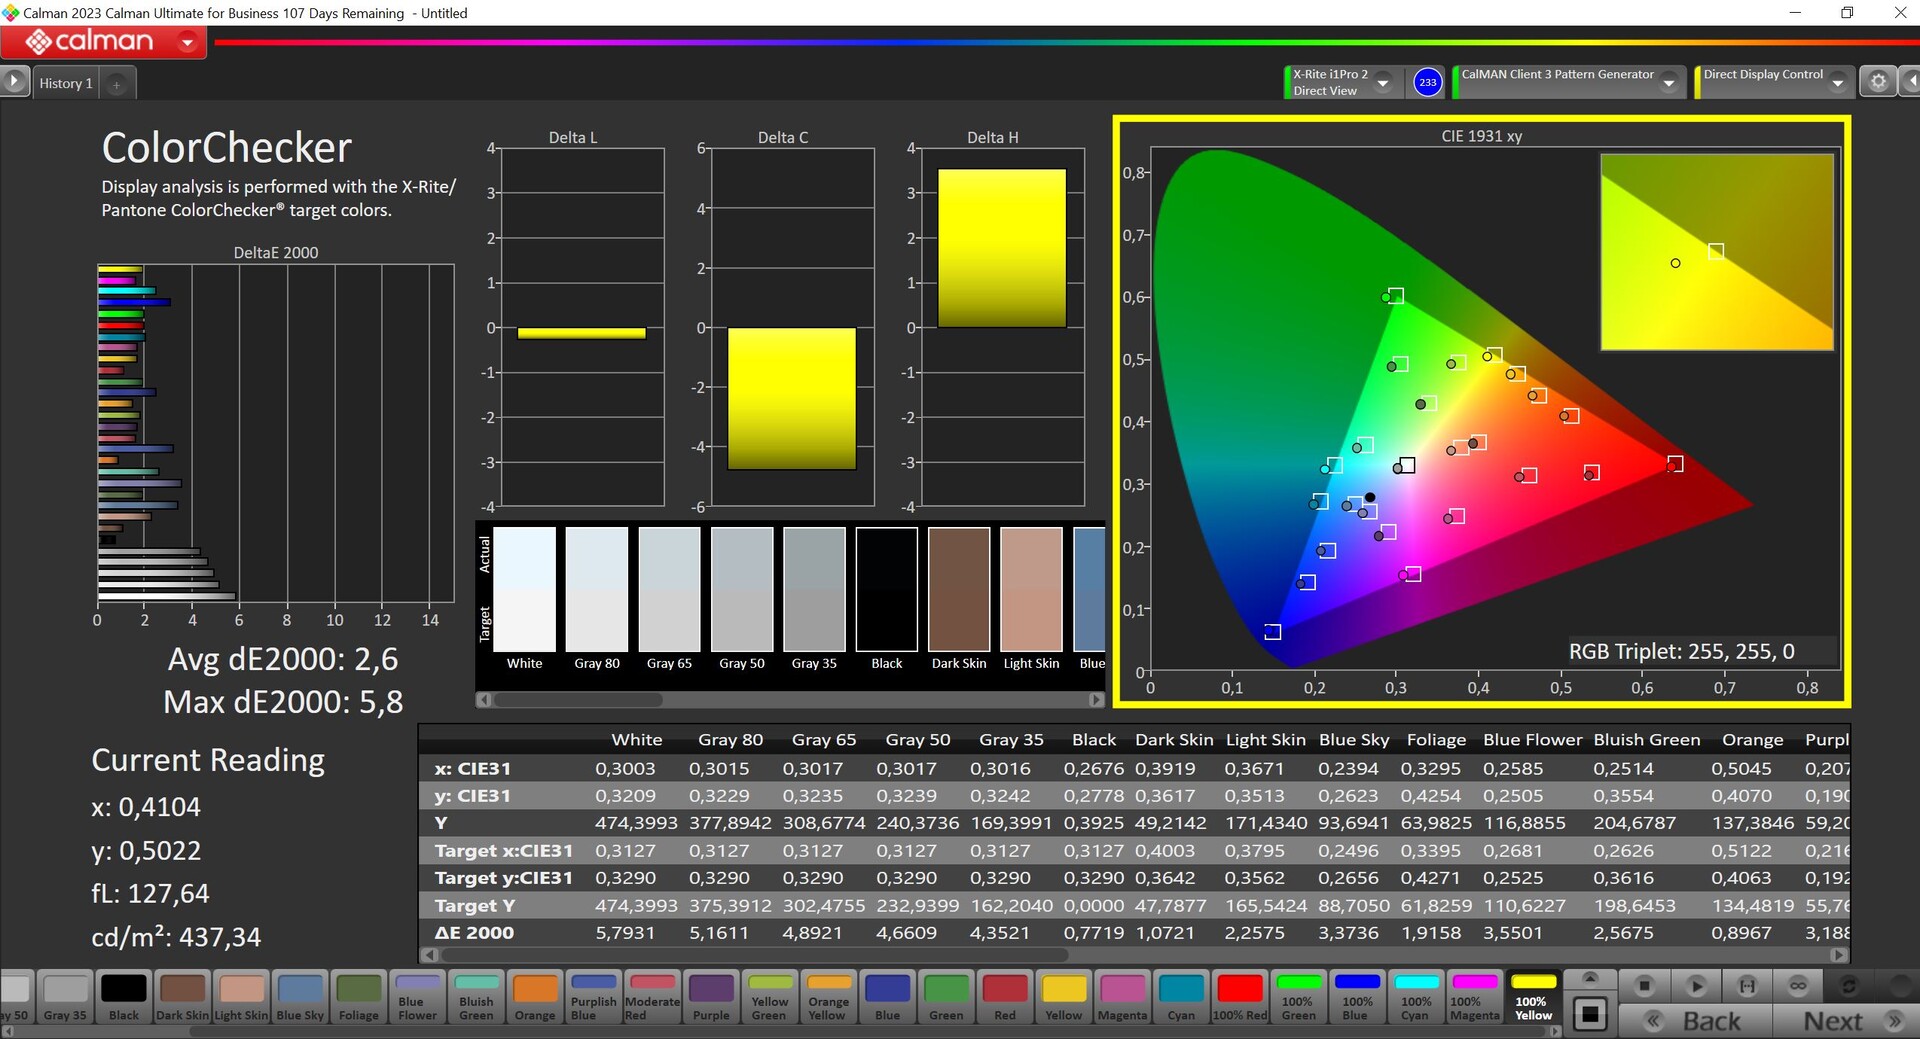
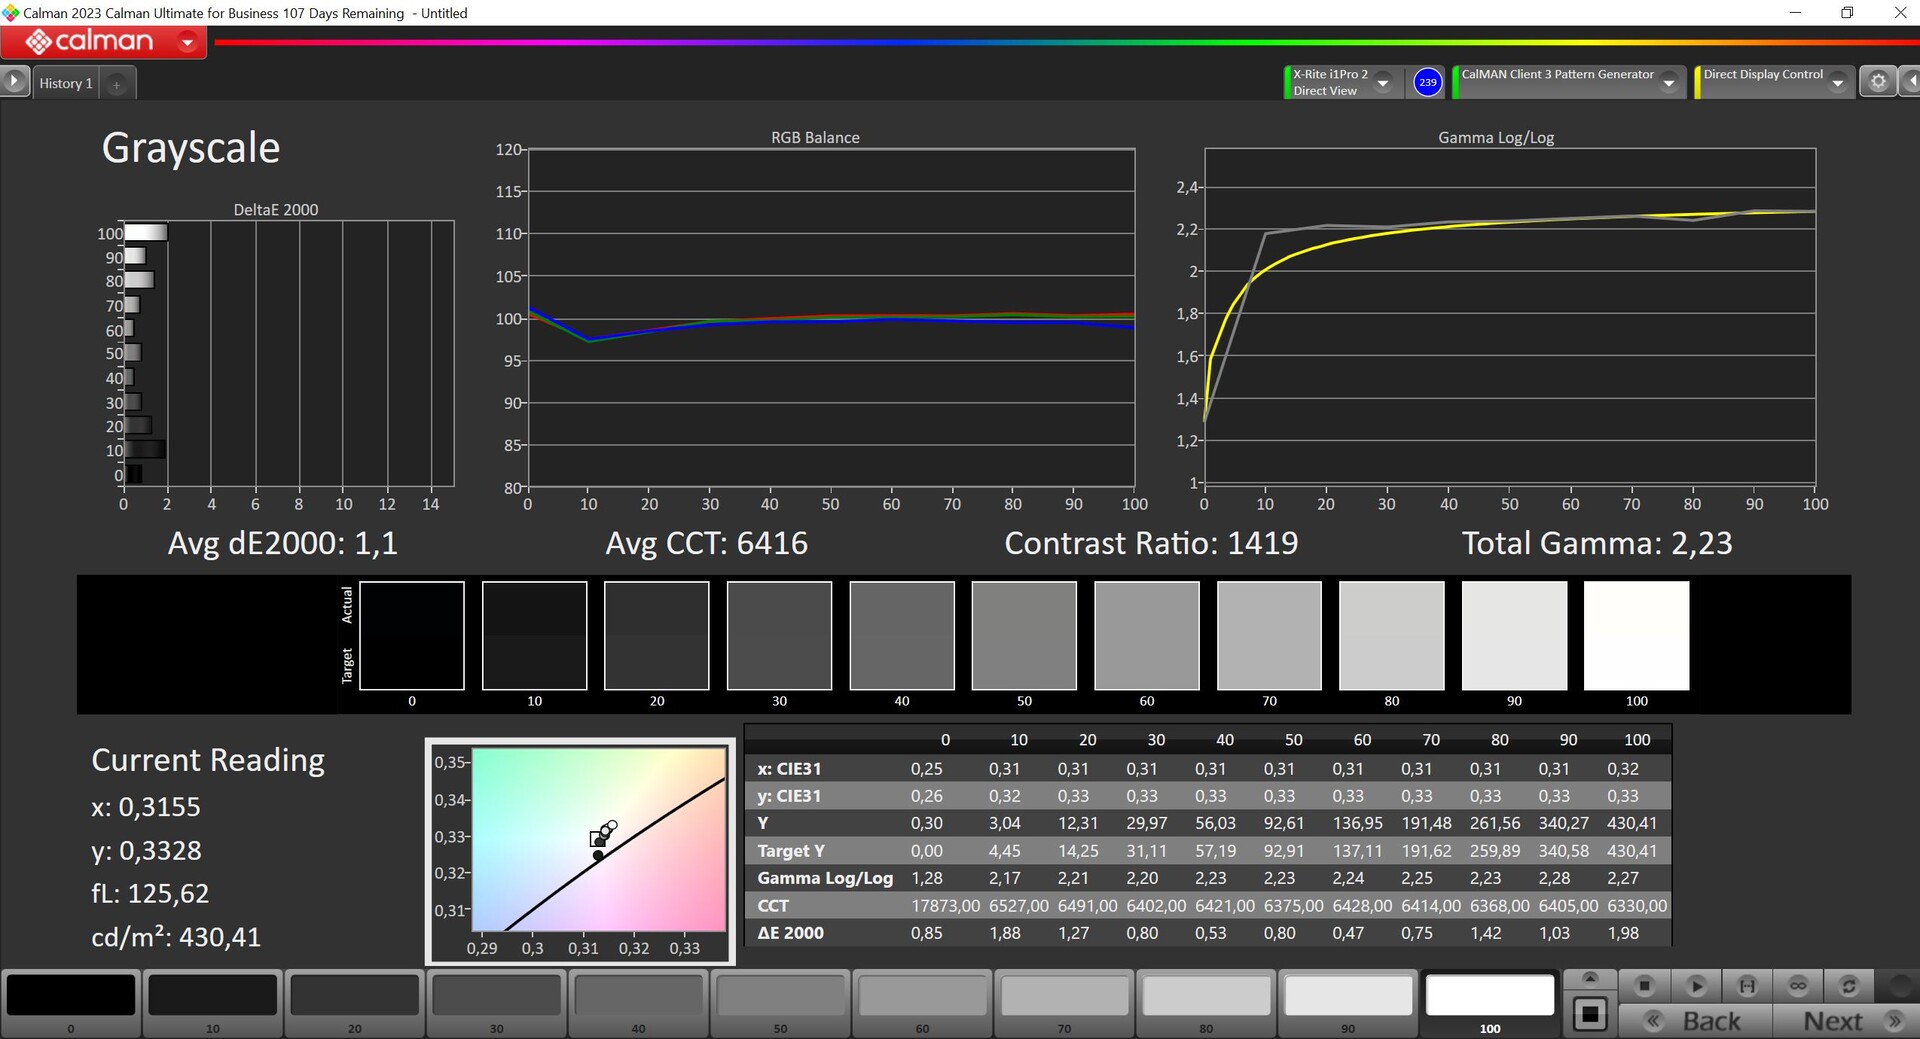
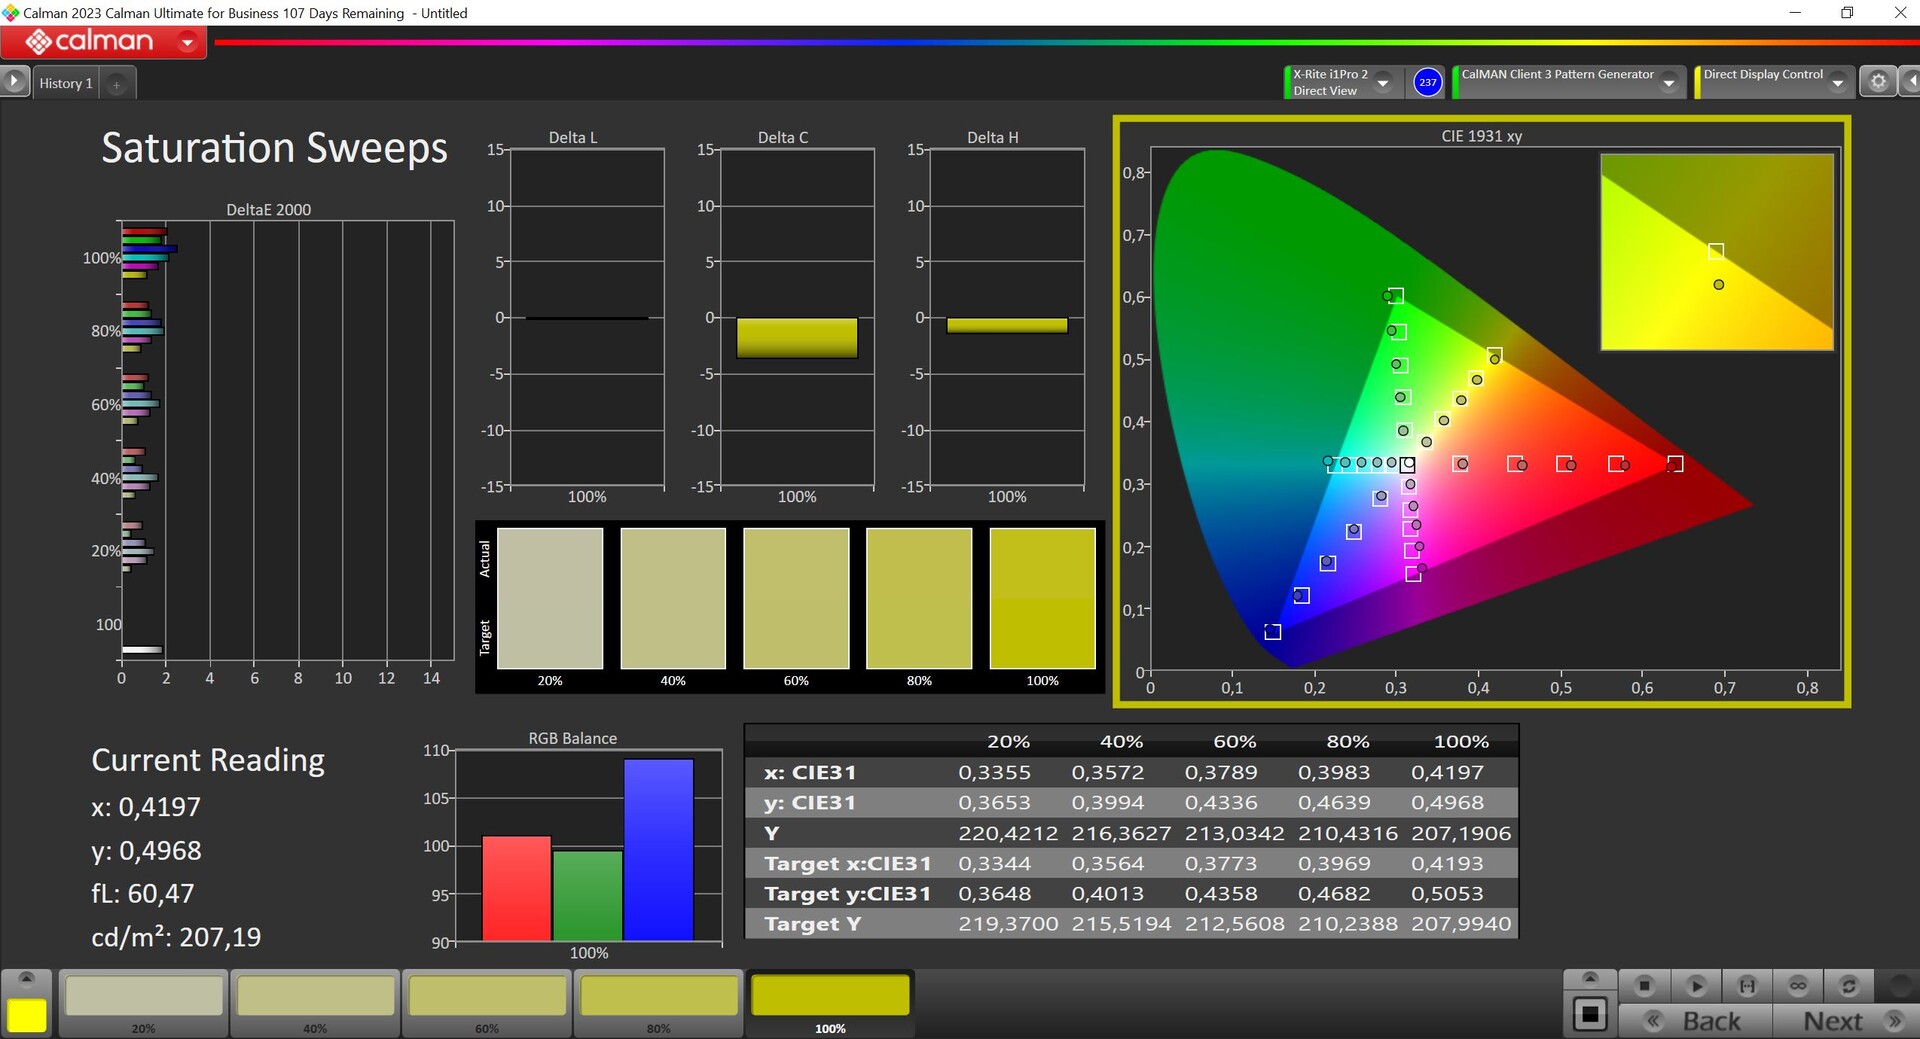
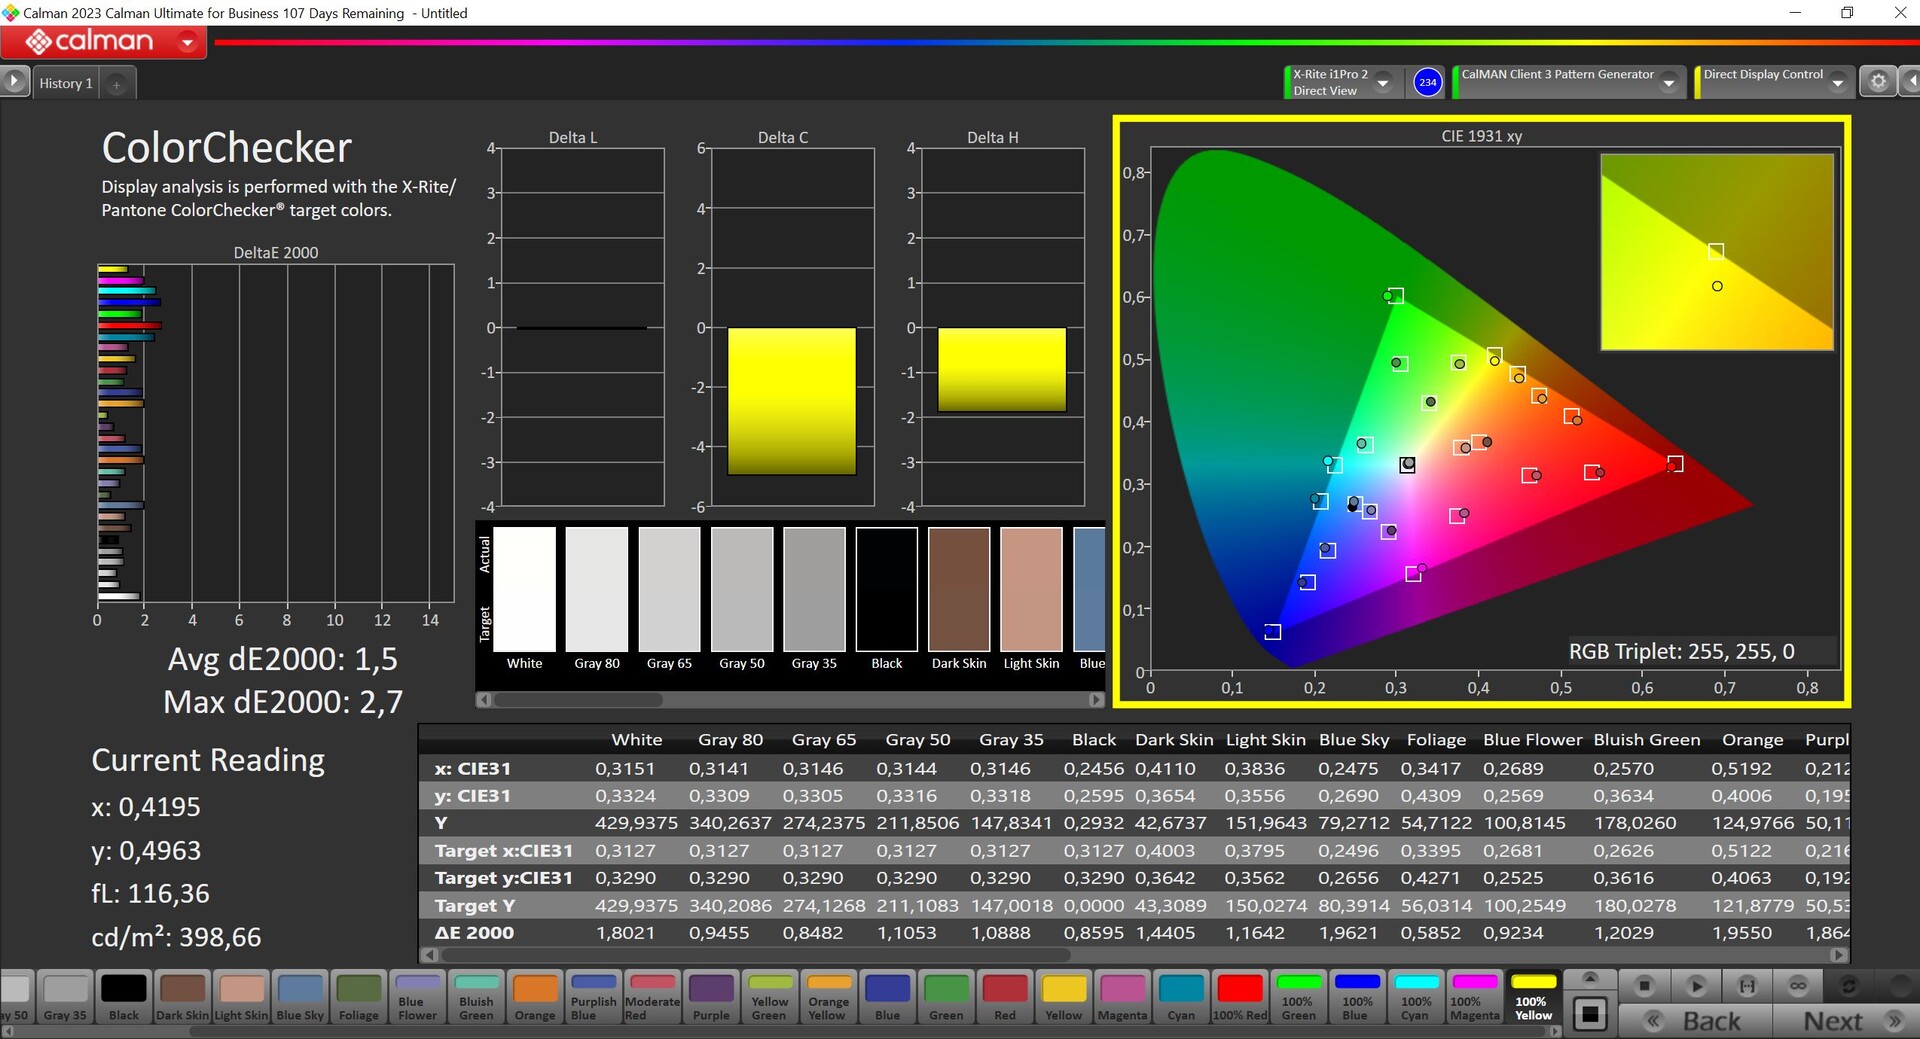
MSI herhangi bir renk profili sunmuyor ve profesyonel CalMAN yazılımıyla (X-Rite i1 Pro 2) yaptığımız analiz sırasında panel, çok soğuk bir renk sıcaklığıyla bağlantılı olarak hafif bir mavi ton gösterdi. Öte yandan renk sapmaları iyi durumda. MSI bu ayarları daha yüksek bir parlaklık elde etmek için kullanıyor. Kalibrasyonumuzla (profil yukarıda ücretsiz olarak indirilebilir), özellikle gri tonlamasını iyileştirebildik ve renk atmasını geçmişte bıraktık - ancak maksimum parlaklığı neredeyse 50 cd / m² daha düşüktü. SRGB renk alanı %95 oranında kapsanıyor ve teorik olarak cihazda görüntüleri bile düzenleyebilirsiniz, ancak bu bir oyun el bilgisayarı için gerçekçi bir kullanım senaryosu değil.
Yanıt Sürelerini Görüntüle
| ↔ Tepki Süresi Siyahtan Beyaza | ||
|---|---|---|
| 6.6 ms ... yükseliş ↗ ve sonbahar↘ birleşimi | ↗ 3.1 ms yükseliş | 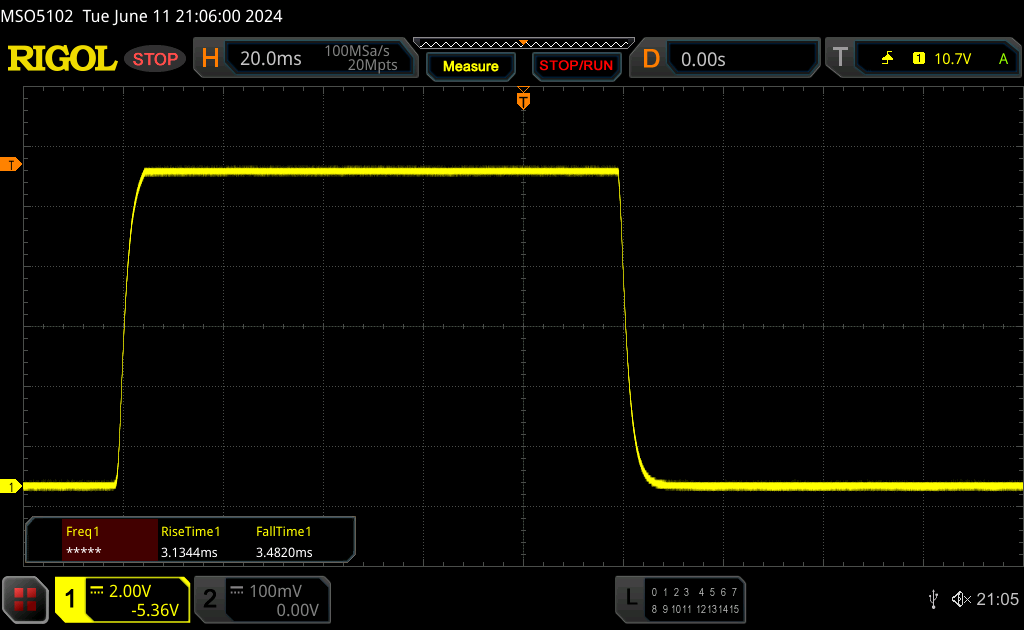 |
| ↘ 3.5 ms sonbahar | ||
| Ekran, testlerimizde çok hızlı yanıt oranları gösteriyor ve hızlı oyun oynamaya çok uygun olmalı. Karşılaştırıldığında, test edilen tüm cihazlar 0.1 (minimum) ile 240 (maksimum) ms arasında değişir. » Tüm cihazların 18 %'si daha iyi. Bu, ölçülen yanıt süresinin test edilen tüm cihazların ortalamasından (20.7 ms) daha iyi olduğu anlamına gelir. | ||
| ↔ Tepki Süresi %50 Griden %80 Griye | ||
| 9.2 ms ... yükseliş ↗ ve sonbahar↘ birleşimi | ↗ 4.6 ms yükseliş | 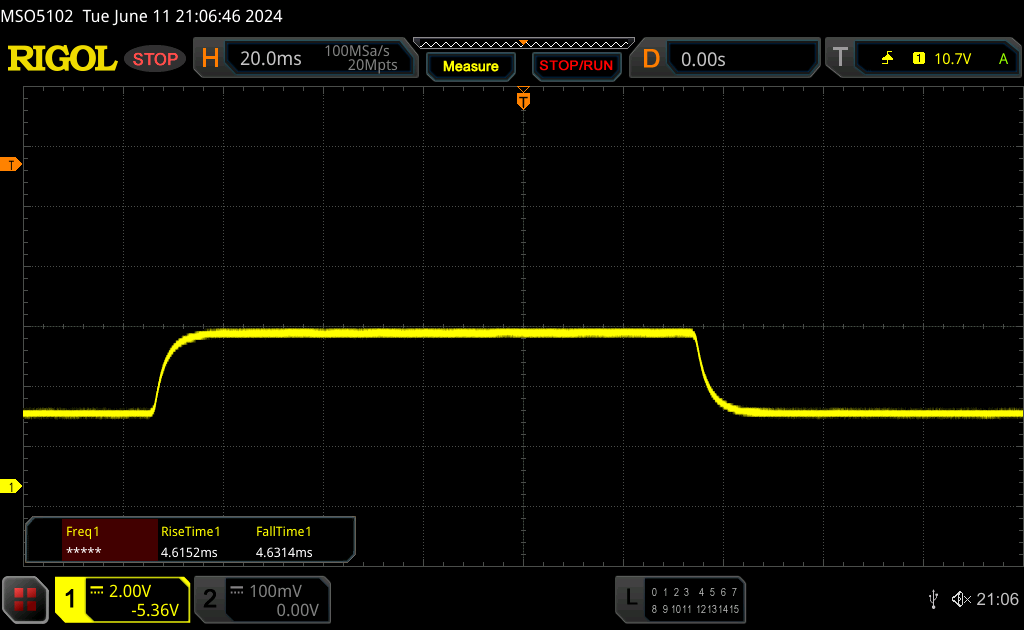 |
| ↘ 4.6 ms sonbahar | ||
| Ekran, testlerimizde hızlı yanıt oranları gösteriyor ve oyun oynamaya uygun olmalı. Karşılaştırıldığında, test edilen tüm cihazlar 0.165 (minimum) ile 636 (maksimum) ms arasında değişir. » Tüm cihazların 20 %'si daha iyi. Bu, ölçülen yanıt süresinin test edilen tüm cihazların ortalamasından (32.5 ms) daha iyi olduğu anlamına gelir. | ||
Ekran Titremesi / PWM (Darbe Genişliği Modülasyonu)
| Ekran titriyor / PWM algılanmadı | 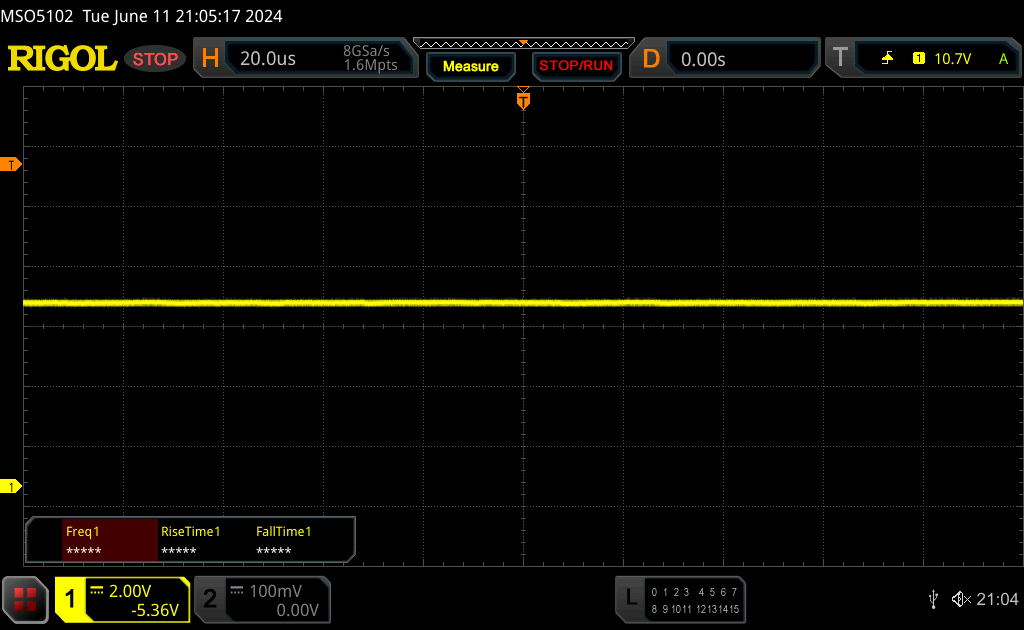 | ||
Karşılaştırıldığında: Test edilen tüm cihazların %53 %'si ekranı karartmak için PWM kullanmıyor. PWM tespit edilirse, ortalama 8492 (minimum: 5 - maksimum: 343500) Hz ölçüldü. | |||
Elbette parlak dokunmatik ekrandaki yansımalar beklenen bir şey ve çok parlak günlerde cihazı kullanmak biraz zorlaşıyor. Ancak, çoğu durumda işe yarayan bir pozisyon bulabilmeniz gerekir. Görüş açıları söz konusu olduğunda herhangi bir sorun yok.

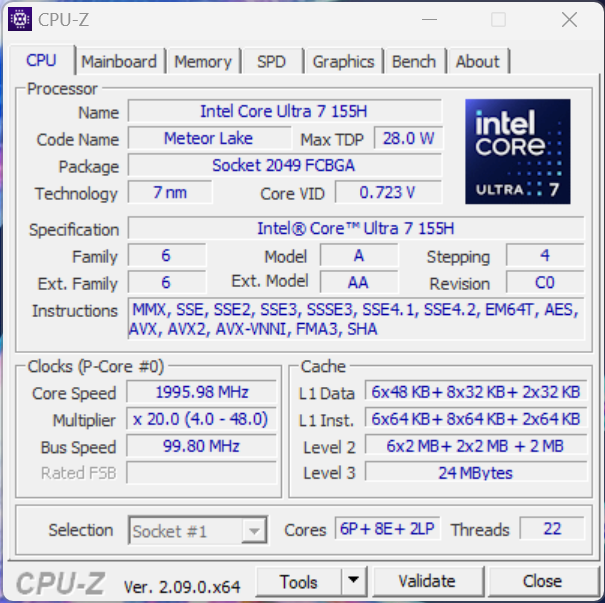
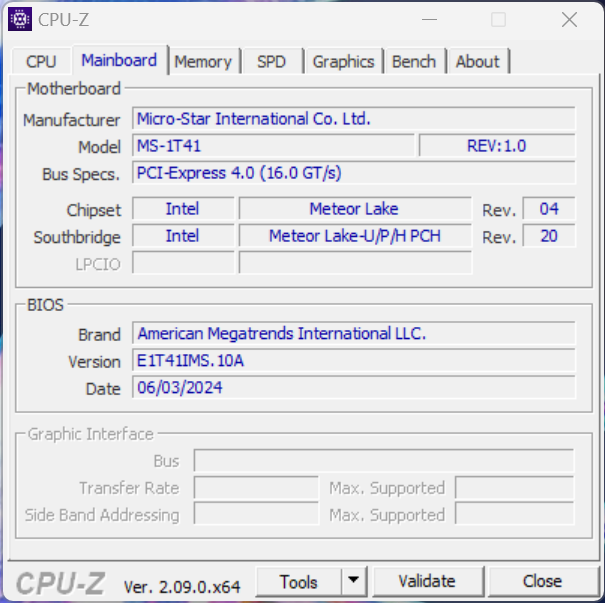
Performans - Intel Core Ultra ve 16 GB RAM
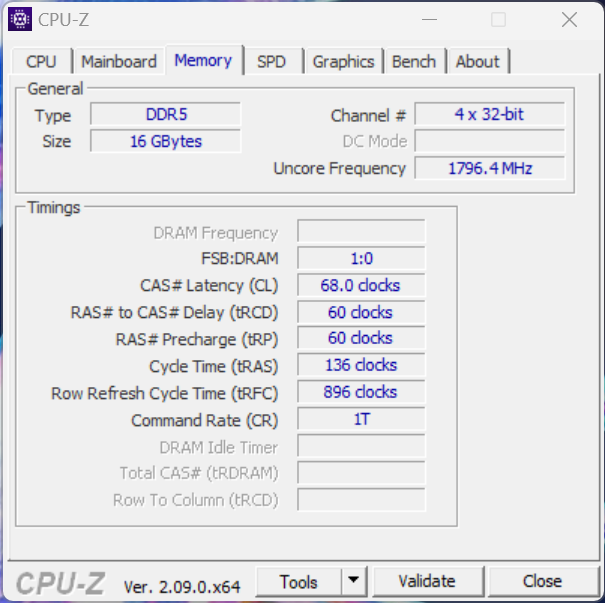
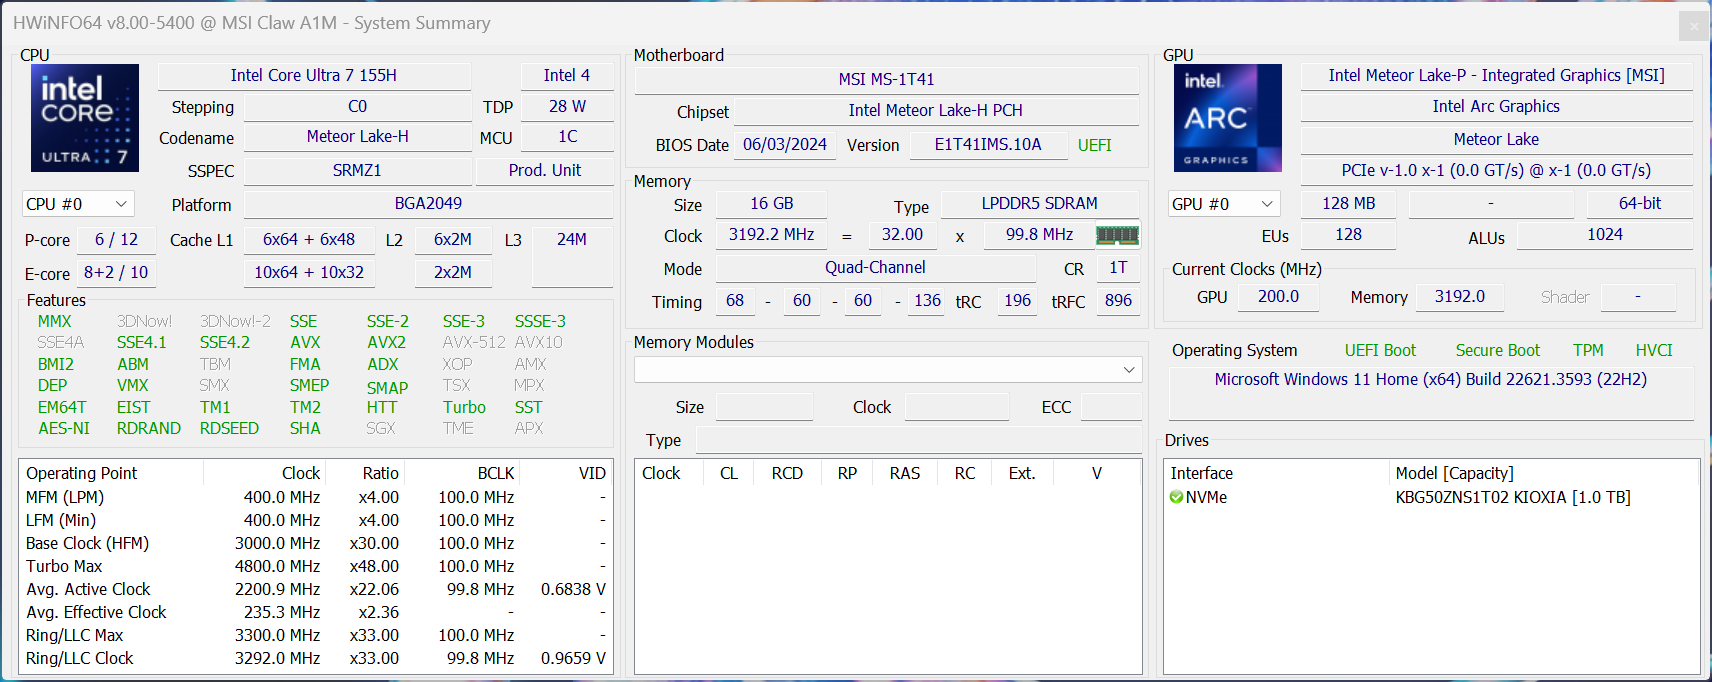
Daha önce de belirtildiği gibi, MSI Claw oyun el bilgisayarını Core Ultra 7 155H veya daha zayıf Core Ultra 5 135H ile alabilirsiniz, ikincisi de biraz daha zayıf bir iGPU ile birlikte gelir. Her iki model de 16 GB RAM ile donatılmıştır ve VRAM'i manuel olarak atama seçeneği yoktur.
Test koşulları
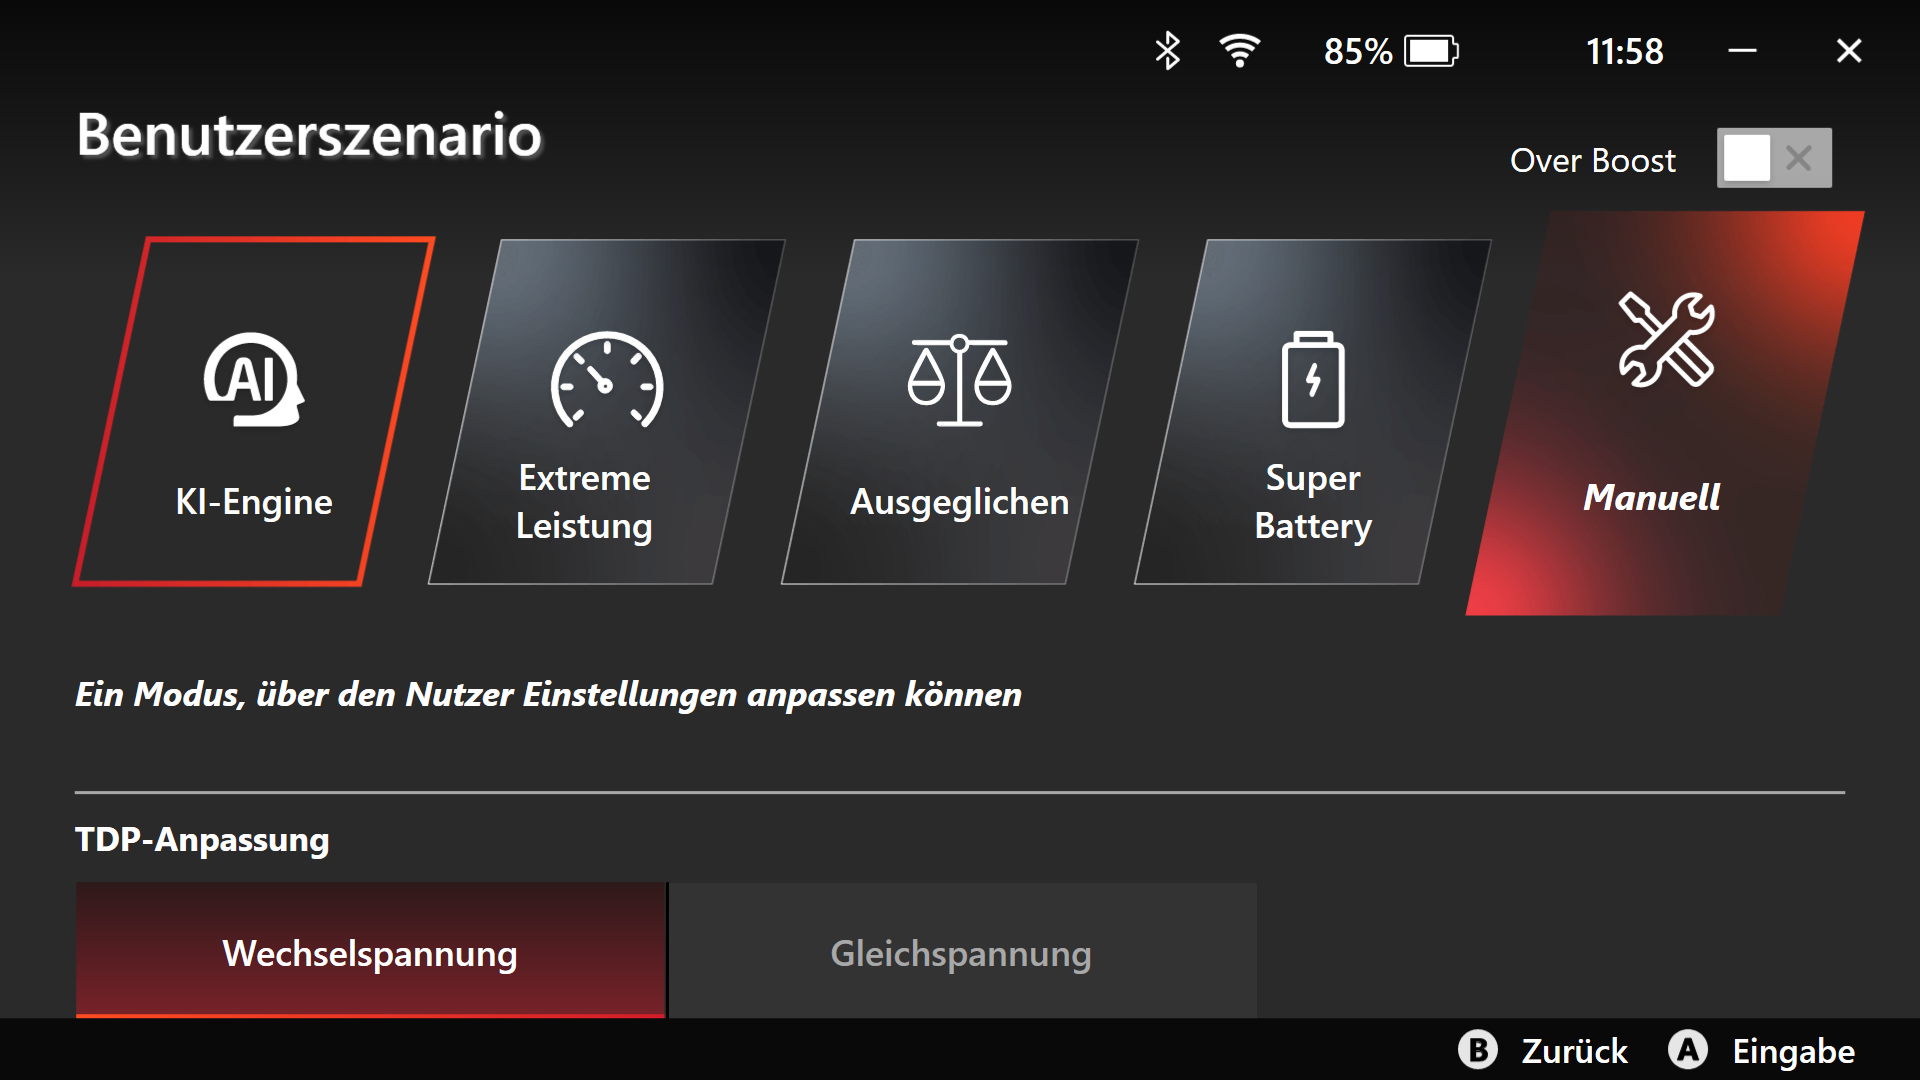
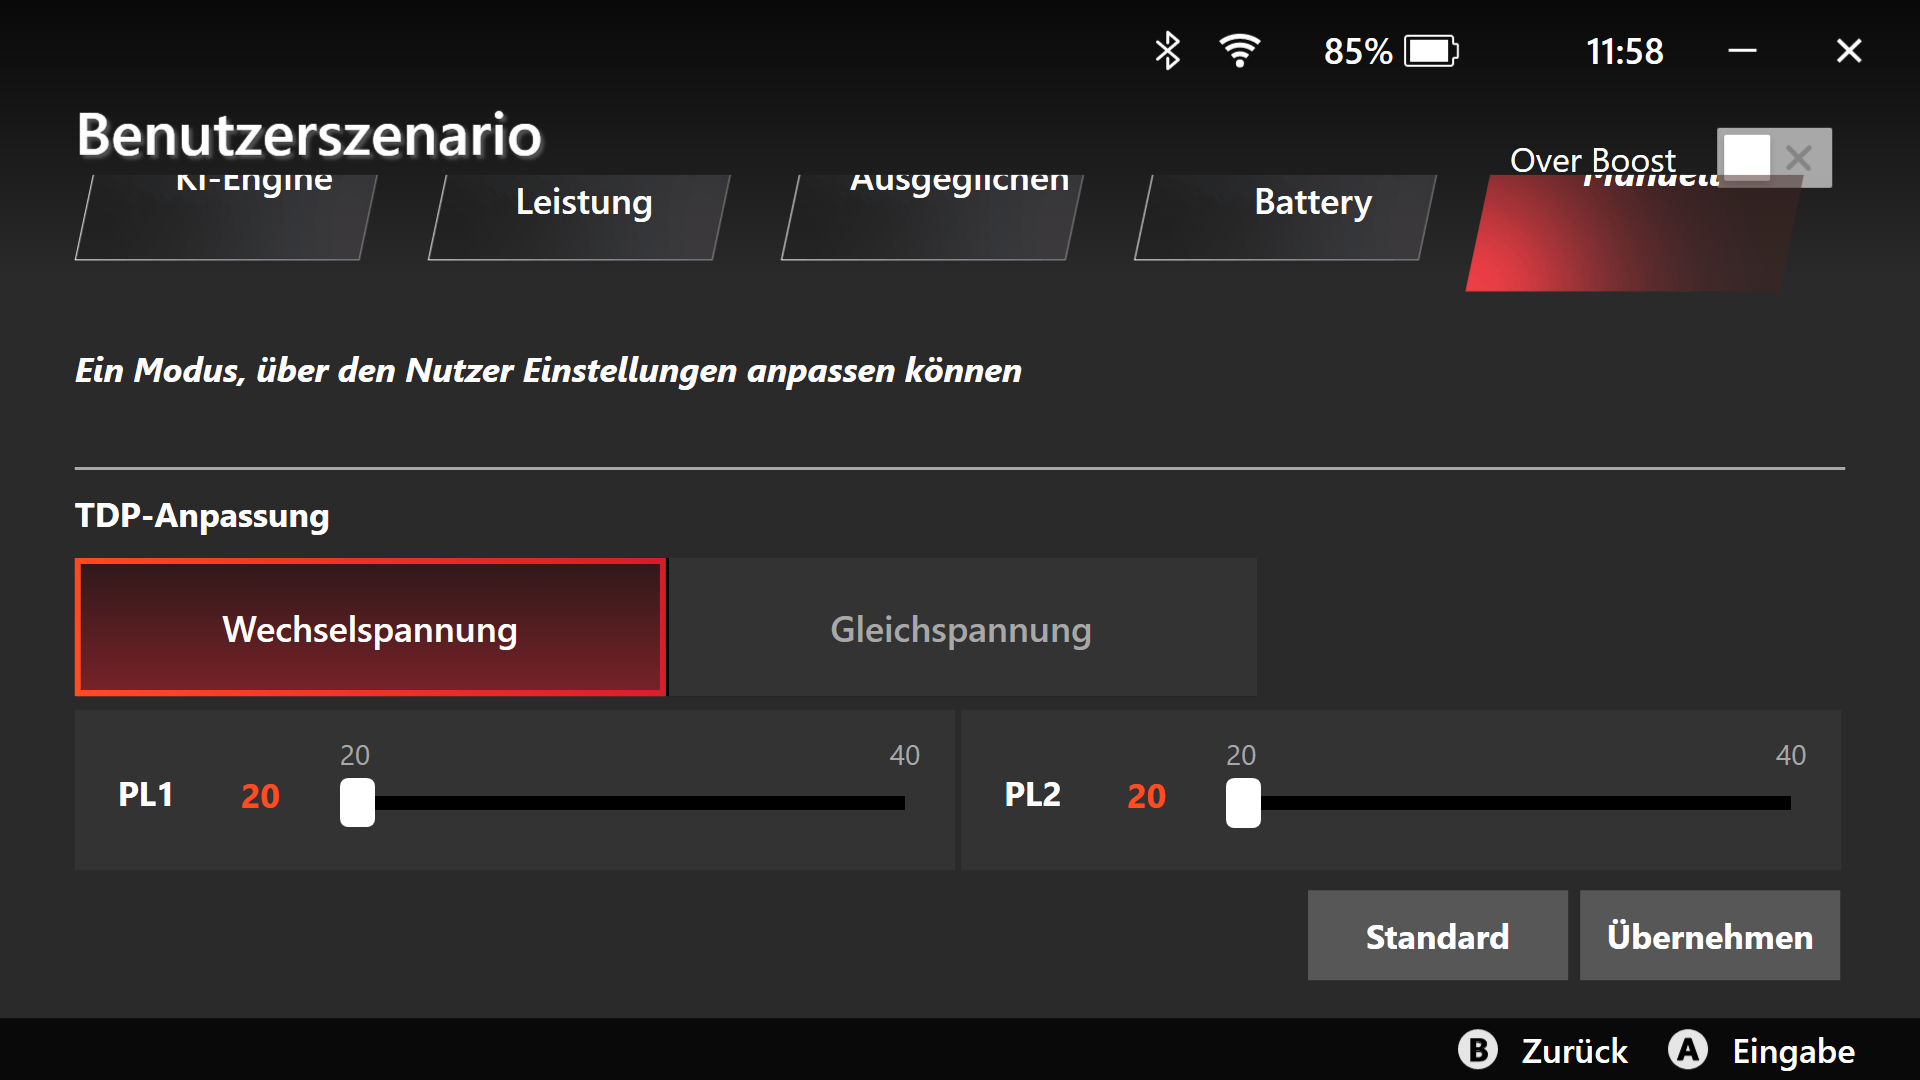
MSI, AI Engine modunun varsayılan olarak etkin olduğu çeşitli enerji profilleri sunar. Bu, yük senaryosuna göre en iyi ayarları otomatik olarak seçmelidir ve biz de aşağıdaki kıyaslamalar ve testler için bu modu kullandık. Çeşitli profillerin TDP ve performans değerlerini aşağıdaki tabloda listeledik.
| Enerji profili | TDP şebeke | TDP pil | CB R23 multi | Time Spy grafik | Cyberpunk 2077 1080p Düşük | maks. fan gürültü emisyonları |
|---|---|---|---|---|---|---|
| Süper Batarya | 20 watt | 20 watt | 7.270 puan | 2.581 puan | 23,3 fps | 36,6 dB(A) |
| Dengeli | 35 watt | 30 watt | 12.523 puan | 3.517 puan | 31fps | 45,5 dB(A) |
| AI | 45 -> 43 watt | 35 watt | 14.463 puan | 3.491 puan | 31fps | 45,5 dB(A) |
| Olağanüstü Performans | 45 -> 43 watt | 35 watt | 14.550 puan | 4.461 puan | 31fps | 48,5 dB(A) |
TDP değerlerini ayarlayabileceğiniz bir manuel mod da var, ancak yalnızca 20-35 watt aralığında ve dolayısıyla mevcut profillerin aralığında. Diğer el bilgisayarları bu konuda daha fazla esneklik sunuyor.
İşlemci - Core Ultra 7 155H
Bu Core Ultra 7 155H intel'in mevcut Meteor Lake nesli şu anda pek çok dizüstü bilgisayarda kullanılıyor. MSI Claw'daki performansı da istikrarlı ve genel olarak iyi, ancak Intel işlemci karşılaştırılabilir performans sunmak için diğer AMD el cihazlarından daha fazla güç gerektiriyor, bu da elbette bir el cihazı için ideal değil. Buna ek olarak, soğutma ünitesinin yapması gereken çok iş var, ancak bu konu hakkında biraz sonra emisyonlar bölümünde daha fazla konuşacağız. Pille çalışma sırasında işlemcinin maksimum 35 watt tüketmesine izin veriliyor, bu nedenle çok çekirdekli performansı bu durumda yaklaşık %14 daha düşük. Daha fazla CPU kıyaslaması için tEKNİK BÖLÜM.
Cinebench R15 Multi continuous test
Cinebench R23: Multi Core | Single Core
Cinebench R20: CPU (Multi Core) | CPU (Single Core)
Cinebench R15: CPU Multi 64Bit | CPU Single 64Bit
Blender: v2.79 BMW27 CPU
7-Zip 18.03: 7z b 4 | 7z b 4 -mmt1
Geekbench 6.4: Multi-Core | Single-Core
Geekbench 5.5: Multi-Core | Single-Core
HWBOT x265 Benchmark v2.2: 4k Preset
LibreOffice : 20 Documents To PDF
R Benchmark 2.5: Overall mean
| CPU Performance Rating | |
| Asus ROG Ally Z1 Extreme | |
| Lenovo Legion Go -2! | |
| Ortalama Intel Core Ultra 7 155H | |
| MSI Claw | |
| Ayaneo Kun | |
| ONEXPLAYER 2 Pro AR18 | |
| Sınıf ortalaması Handheld / UMPC | |
| Valve Steam Deck 1 TB OLED -6! | |
| Cinebench R23 / Multi Core | |
| Ayaneo Kun | |
| Ortalama Intel Core Ultra 7 155H (9769 - 19007, n=52) | |
| Asus ROG Ally Z1 Extreme | |
| MSI Claw | |
| ONEXPLAYER 2 Pro AR18 | |
| Lenovo Legion Go | |
| Sınıf ortalaması Handheld / UMPC (3984 - 16841, n=17, son 2 yıl) | |
| Valve Steam Deck 1 TB OLED | |
| Cinebench R23 / Single Core | |
| Asus ROG Ally Z1 Extreme | |
| MSI Claw | |
| Lenovo Legion Go | |
| ONEXPLAYER 2 Pro AR18 | |
| Ortalama Intel Core Ultra 7 155H (1496 - 1815, n=52) | |
| Sınıf ortalaması Handheld / UMPC (1088 - 2006, n=16, son 2 yıl) | |
| Ayaneo Kun | |
| Cinebench R20 / CPU (Multi Core) | |
| Ayaneo Kun | |
| Asus ROG Ally Z1 Extreme | |
| Ortalama Intel Core Ultra 7 155H (3798 - 7409, n=50) | |
| ONEXPLAYER 2 Pro AR18 | |
| Lenovo Legion Go | |
| MSI Claw | |
| Sınıf ortalaması Handheld / UMPC (1521 - 6577, n=15, son 2 yıl) | |
| Valve Steam Deck 1 TB OLED | |
| Cinebench R20 / CPU (Single Core) | |
| Asus ROG Ally Z1 Extreme | |
| MSI Claw | |
| ONEXPLAYER 2 Pro AR18 | |
| Lenovo Legion Go | |
| Ortalama Intel Core Ultra 7 155H (601 - 696, n=50) | |
| Sınıf ortalaması Handheld / UMPC (357 - 787, n=15, son 2 yıl) | |
| Ayaneo Kun | |
| Valve Steam Deck 1 TB OLED | |
| Cinebench R15 / CPU Multi 64Bit | |
| Ortalama Intel Core Ultra 7 155H (1932 - 2880, n=56) | |
| Ayaneo Kun | |
| Asus ROG Ally Z1 Extreme | |
| ONEXPLAYER 2 Pro AR18 | |
| Lenovo Legion Go | |
| MSI Claw | |
| Sınıf ortalaması Handheld / UMPC (689 - 2533, n=15, son 2 yıl) | |
| Valve Steam Deck 1 TB OLED | |
| Cinebench R15 / CPU Single 64Bit | |
| Asus ROG Ally Z1 Extreme | |
| Lenovo Legion Go | |
| ONEXPLAYER 2 Pro AR18 | |
| MSI Claw | |
| Sınıf ortalaması Handheld / UMPC (155.1 - 304, n=14, son 2 yıl) | |
| Ortalama Intel Core Ultra 7 155H (99.6 - 268, n=52) | |
| Ayaneo Kun | |
| Blender / v2.79 BMW27 CPU | |
| Sınıf ortalaması Handheld / UMPC (189 - 588, n=13, son 2 yıl) | |
| MSI Claw | |
| ONEXPLAYER 2 Pro AR18 | |
| Ortalama Intel Core Ultra 7 155H (175 - 381, n=47) | |
| Asus ROG Ally Z1 Extreme | |
| Ayaneo Kun | |
| 7-Zip 18.03 / 7z b 4 | |
| Asus ROG Ally Z1 Extreme | |
| Ayaneo Kun | |
| Ortalama Intel Core Ultra 7 155H (41739 - 70254, n=50) | |
| Lenovo Legion Go | |
| ONEXPLAYER 2 Pro AR18 | |
| MSI Claw | |
| Sınıf ortalaması Handheld / UMPC (19684 - 66618, n=14, son 2 yıl) | |
| Valve Steam Deck 1 TB OLED | |
| 7-Zip 18.03 / 7z b 4 -mmt1 | |
| Asus ROG Ally Z1 Extreme | |
| ONEXPLAYER 2 Pro AR18 | |
| Ayaneo Kun | |
| Ortalama Intel Core Ultra 7 155H (4594 - 5621, n=50) | |
| MSI Claw | |
| Sınıf ortalaması Handheld / UMPC (3653 - 6143, n=14, son 2 yıl) | |
| Valve Steam Deck 1 TB OLED | |
| Geekbench 6.4 / Multi-Core | |
| Ortalama Intel Core Ultra 7 155H (7732 - 13656, n=55) | |
| Asus ROG Ally Z1 Extreme | |
| Lenovo Legion Go | |
| Lenovo Legion Go | |
| MSI Claw | |
| Sınıf ortalaması Handheld / UMPC (4587 - 13426, n=16, son 2 yıl) | |
| Ayaneo Kun | |
| ONEXPLAYER 2 Pro AR18 | |
| Valve Steam Deck 1 TB OLED | |
| Geekbench 6.4 / Single-Core | |
| Lenovo Legion Go | |
| Lenovo Legion Go | |
| Asus ROG Ally Z1 Extreme | |
| MSI Claw | |
| Ortalama Intel Core Ultra 7 155H (1901 - 2473, n=52) | |
| Sınıf ortalaması Handheld / UMPC (1348 - 2904, n=16, son 2 yıl) | |
| ONEXPLAYER 2 Pro AR18 | |
| Ayaneo Kun | |
| Valve Steam Deck 1 TB OLED | |
| Geekbench 5.5 / Multi-Core | |
| Ortalama Intel Core Ultra 7 155H (10017 - 13556, n=52) | |
| Asus ROG Ally Z1 Extreme | |
| MSI Claw | |
| Lenovo Legion Go | |
| Lenovo Legion Go | |
| Sınıf ortalaması Handheld / UMPC (3932 - 11975, n=16, son 2 yıl) | |
| Ayaneo Kun | |
| ONEXPLAYER 2 Pro AR18 | |
| Valve Steam Deck 1 TB OLED | |
| Geekbench 5.5 / Single-Core | |
| Asus ROG Ally Z1 Extreme | |
| Lenovo Legion Go | |
| Lenovo Legion Go | |
| MSI Claw | |
| Ortalama Intel Core Ultra 7 155H (1462 - 1824, n=52) | |
| Sınıf ortalaması Handheld / UMPC (875 - 2134, n=16, son 2 yıl) | |
| ONEXPLAYER 2 Pro AR18 | |
| Valve Steam Deck 1 TB OLED | |
| Ayaneo Kun | |
| HWBOT x265 Benchmark v2.2 / 4k Preset | |
| Ayaneo Kun | |
| Asus ROG Ally Z1 Extreme | |
| Ortalama Intel Core Ultra 7 155H (9.93 - 21.2, n=50) | |
| Lenovo Legion Go | |
| ONEXPLAYER 2 Pro AR18 | |
| Sınıf ortalaması Handheld / UMPC (7.07 - 20.8, n=14, son 2 yıl) | |
| MSI Claw | |
| LibreOffice / 20 Documents To PDF | |
| ONEXPLAYER 2 Pro AR18 | |
| Sınıf ortalaması Handheld / UMPC (41.1 - 92.8, n=14, son 2 yıl) | |
| Ayaneo Kun | |
| Lenovo Legion Go | |
| Ortalama Intel Core Ultra 7 155H (37.5 - 79.2, n=49) | |
| MSI Claw | |
| Asus ROG Ally Z1 Extreme | |
| R Benchmark 2.5 / Overall mean | |
| Sınıf ortalaması Handheld / UMPC (0.4167 - 0.756, n=15, son 2 yıl) | |
| Ayaneo Kun | |
| Ayaneo Kun | |
| Ortalama Intel Core Ultra 7 155H (0.4457 - 0.53, n=49) | |
| ONEXPLAYER 2 Pro AR18 | |
| MSI Claw | |
| Lenovo Legion Go | |
| Asus ROG Ally Z1 Extreme | |
* ... daha küçük daha iyidir
AIDA64: FP32 Ray-Trace | FPU Julia | CPU SHA3 | CPU Queen | FPU SinJulia | FPU Mandel | CPU AES | CPU ZLib | FP64 Ray-Trace | CPU PhotoWorxx
| Performance Rating | |
| Ayaneo Kun | |
| Asus ROG Ally Z1 Extreme | |
| ONEXPLAYER 2 Pro AR18 | |
| Lenovo Legion Go | |
| Sınıf ortalaması Handheld / UMPC | |
| Ortalama Intel Core Ultra 7 155H | |
| MSI Claw | |
| AIDA64 / FP32 Ray-Trace | |
| Ayaneo Kun | |
| Ayaneo Kun | |
| Asus ROG Ally Z1 Extreme | |
| ONEXPLAYER 2 Pro AR18 | |
| Lenovo Legion Go | |
| Sınıf ortalaması Handheld / UMPC (6990 - 26450, n=15, son 2 yıl) | |
| Ortalama Intel Core Ultra 7 155H (6670 - 18470, n=50) | |
| MSI Claw | |
| AIDA64 / FPU Julia | |
| Ayaneo Kun | |
| Ayaneo Kun | |
| Asus ROG Ally Z1 Extreme | |
| ONEXPLAYER 2 Pro AR18 | |
| Lenovo Legion Go | |
| Sınıf ortalaması Handheld / UMPC (42932 - 109745, n=15, son 2 yıl) | |
| Ortalama Intel Core Ultra 7 155H (40905 - 93181, n=50) | |
| MSI Claw | |
| AIDA64 / CPU SHA3 | |
| Ayaneo Kun | |
| Ayaneo Kun | |
| Asus ROG Ally Z1 Extreme | |
| ONEXPLAYER 2 Pro AR18 | |
| Lenovo Legion Go | |
| Sınıf ortalaması Handheld / UMPC (1403 - 4847, n=15, son 2 yıl) | |
| Ortalama Intel Core Ultra 7 155H (1940 - 4436, n=50) | |
| MSI Claw | |
| AIDA64 / CPU Queen | |
| Ayaneo Kun | |
| Ayaneo Kun | |
| Asus ROG Ally Z1 Extreme | |
| ONEXPLAYER 2 Pro AR18 | |
| Lenovo Legion Go | |
| Ortalama Intel Core Ultra 7 155H (64698 - 94181, n=50) | |
| Sınıf ortalaması Handheld / UMPC (41744 - 114294, n=15, son 2 yıl) | |
| MSI Claw | |
| AIDA64 / FPU SinJulia | |
| Ayaneo Kun | |
| Ayaneo Kun | |
| Asus ROG Ally Z1 Extreme | |
| ONEXPLAYER 2 Pro AR18 | |
| Lenovo Legion Go | |
| Sınıf ortalaması Handheld / UMPC (4425 - 16980, n=15, son 2 yıl) | |
| Ortalama Intel Core Ultra 7 155H (5639 - 10647, n=50) | |
| MSI Claw | |
| AIDA64 / FPU Mandel | |
| Ayaneo Kun | |
| Ayaneo Kun | |
| Asus ROG Ally Z1 Extreme | |
| ONEXPLAYER 2 Pro AR18 | |
| Lenovo Legion Go | |
| Sınıf ortalaması Handheld / UMPC (23380 - 58482, n=15, son 2 yıl) | |
| Ortalama Intel Core Ultra 7 155H (18236 - 47685, n=50) | |
| MSI Claw | |
| AIDA64 / CPU AES | |
| Ayaneo Kun | |
| Ayaneo Kun | |
| ONEXPLAYER 2 Pro AR18 | |
| Sınıf ortalaması Handheld / UMPC (21547 - 166333, n=15, son 2 yıl) | |
| Ortalama Intel Core Ultra 7 155H (45713 - 152179, n=50) | |
| Asus ROG Ally Z1 Extreme | |
| MSI Claw | |
| Lenovo Legion Go | |
| AIDA64 / CPU ZLib | |
| Ayaneo Kun | |
| Ayaneo Kun | |
| Asus ROG Ally Z1 Extreme | |
| Ortalama Intel Core Ultra 7 155H (557 - 1250, n=50) | |
| ONEXPLAYER 2 Pro AR18 | |
| Sınıf ortalaması Handheld / UMPC (356 - 1112, n=15, son 2 yıl) | |
| MSI Claw | |
| Lenovo Legion Go | |
| AIDA64 / FP64 Ray-Trace | |
| Ayaneo Kun | |
| Ayaneo Kun | |
| Asus ROG Ally Z1 Extreme | |
| ONEXPLAYER 2 Pro AR18 | |
| Lenovo Legion Go | |
| Sınıf ortalaması Handheld / UMPC (3766 - 14181, n=15, son 2 yıl) | |
| Ortalama Intel Core Ultra 7 155H (3569 - 9802, n=50) | |
| MSI Claw | |
| AIDA64 / CPU PhotoWorxx | |
| MSI Claw | |
| Ortalama Intel Core Ultra 7 155H (32719 - 54223, n=50) | |
| Sınıf ortalaması Handheld / UMPC (19472 - 54726, n=15, son 2 yıl) | |
| Asus ROG Ally Z1 Extreme | |
| Lenovo Legion Go | |
| Ayaneo Kun | |
| Ayaneo Kun | |
| ONEXPLAYER 2 Pro AR18 | |
Sistem performansı
Windows'un hala garip olan dokunmatik kullanımı dışında, MSI Claw modern bileşenlere sahip hızlı bir cihazdır. Testimiz sırasında çökme veya diğer sınırlamalarla ilgili herhangi bir sorun yaşamadık. Ayrıca, sentetik testler sırasında herhangi bir darboğaz yaşanmadı.
CrossMark: Overall | Productivity | Creativity | Responsiveness
WebXPRT 3: Overall
WebXPRT 4: Overall
Mozilla Kraken 1.1: Total
| PCMark 10 / Score | |
| Asus ROG Ally Z1 Extreme | |
| Ortalama Intel Core Ultra 7 155H, Intel Arc 8-Core iGPU (4809 - 7529, n=34) | |
| MSI Claw | |
| Lenovo Legion Go | |
| Sınıf ortalaması Handheld / UMPC (5219 - 7471, n=15, son 2 yıl) | |
| Ayaneo Kun | |
| ONEXPLAYER 2 Pro AR18 | |
| PCMark 10 / Essentials | |
| Ortalama Intel Core Ultra 7 155H, Intel Arc 8-Core iGPU (7605 - 11289, n=34) | |
| Asus ROG Ally Z1 Extreme | |
| Lenovo Legion Go | |
| Sınıf ortalaması Handheld / UMPC (8427 - 11262, n=15, son 2 yıl) | |
| MSI Claw | |
| Ayaneo Kun | |
| ONEXPLAYER 2 Pro AR18 | |
| PCMark 10 / Productivity | |
| Asus ROG Ally Z1 Extreme | |
| Lenovo Legion Go | |
| Ortalama Intel Core Ultra 7 155H, Intel Arc 8-Core iGPU (6042 - 10591, n=34) | |
| Sınıf ortalaması Handheld / UMPC (7213 - 10031, n=15, son 2 yıl) | |
| MSI Claw | |
| Ayaneo Kun | |
| ONEXPLAYER 2 Pro AR18 | |
| PCMark 10 / Digital Content Creation | |
| MSI Claw | |
| Ayaneo Kun | |
| Ortalama Intel Core Ultra 7 155H, Intel Arc 8-Core iGPU (4985 - 10709, n=34) | |
| Asus ROG Ally Z1 Extreme | |
| Sınıf ortalaması Handheld / UMPC (6350 - 10026, n=15, son 2 yıl) | |
| ONEXPLAYER 2 Pro AR18 | |
| Lenovo Legion Go | |
| CrossMark / Overall | |
| Asus ROG Ally Z1 Extreme | |
| MSI Claw | |
| Ortalama Intel Core Ultra 7 155H, Intel Arc 8-Core iGPU (1366 - 1903, n=34) | |
| Sınıf ortalaması Handheld / UMPC (840 - 1847, n=13, son 2 yıl) | |
| Ayaneo Kun | |
| ONEXPLAYER 2 Pro AR18 | |
| Valve Steam Deck 1 TB OLED | |
| CrossMark / Productivity | |
| Asus ROG Ally Z1 Extreme | |
| MSI Claw | |
| Ortalama Intel Core Ultra 7 155H, Intel Arc 8-Core iGPU (1291 - 1798, n=33) | |
| Sınıf ortalaması Handheld / UMPC (874 - 1719, n=13, son 2 yıl) | |
| Ayaneo Kun | |
| ONEXPLAYER 2 Pro AR18 | |
| Valve Steam Deck 1 TB OLED | |
| CrossMark / Creativity | |
| Asus ROG Ally Z1 Extreme | |
| Ortalama Intel Core Ultra 7 155H, Intel Arc 8-Core iGPU (1519 - 1929, n=33) | |
| MSI Claw | |
| Sınıf ortalaması Handheld / UMPC (808 - 2077, n=13, son 2 yıl) | |
| ONEXPLAYER 2 Pro AR18 | |
| Ayaneo Kun | |
| Valve Steam Deck 1 TB OLED | |
| CrossMark / Responsiveness | |
| MSI Claw | |
| Ayaneo Kun | |
| Asus ROG Ally Z1 Extreme | |
| Ortalama Intel Core Ultra 7 155H, Intel Arc 8-Core iGPU (939 - 1802, n=33) | |
| ONEXPLAYER 2 Pro AR18 | |
| Sınıf ortalaması Handheld / UMPC (759 - 1610, n=13, son 2 yıl) | |
| Valve Steam Deck 1 TB OLED | |
| WebXPRT 3 / Overall | |
| Asus ROG Ally Z1 Extreme | |
| Lenovo Legion Go | |
| Ortalama Intel Core Ultra 7 155H, Intel Arc 8-Core iGPU (252 - 299, n=34) | |
| MSI Claw | |
| Sınıf ortalaması Handheld / UMPC (188.4 - 323, n=15, son 2 yıl) | |
| ONEXPLAYER 2 Pro AR18 | |
| Ayaneo Kun | |
| Ayaneo Kun | |
| WebXPRT 4 / Overall | |
| Asus ROG Ally Z1 Extreme | |
| MSI Claw | |
| Ortalama Intel Core Ultra 7 155H, Intel Arc 8-Core iGPU (166.4 - 309, n=29) | |
| Sınıf ortalaması Handheld / UMPC (107 - 291, n=12, son 2 yıl) | |
| Ayaneo Kun | |
| Valve Steam Deck 1 TB OLED | |
| Mozilla Kraken 1.1 / Total | |
| Ayaneo Kun | |
| Ayaneo Kun | |
| Sınıf ortalaması Handheld / UMPC (428 - 895, n=15, son 2 yıl) | |
| Lenovo Legion Go | |
| Ortalama Intel Core Ultra 7 155H, Intel Arc 8-Core iGPU (517 - 614, n=35) | |
| MSI Claw | |
| ONEXPLAYER 2 Pro AR18 | |
* ... daha küçük daha iyidir
| PCMark 10 Score | 6504 puan | |
Yardım | ||
| AIDA64 / Memory Copy | |
| Asus ROG Ally Z1 Extreme | |
| Ortalama Intel Core Ultra 7 155H (62397 - 96791, n=50) | |
| MSI Claw | |
| Lenovo Legion Go | |
| Sınıf ortalaması Handheld / UMPC (32617 - 107929, n=16, son 2 yıl) | |
| Ayaneo Kun | |
| Ayaneo Kun | |
| ONEXPLAYER 2 Pro AR18 | |
| Valve Steam Deck 1 TB OLED | |
| AIDA64 / Memory Read | |
| MSI Claw | |
| Ortalama Intel Core Ultra 7 155H (60544 - 90647, n=50) | |
| Sınıf ortalaması Handheld / UMPC (25380 - 100208, n=15, son 2 yıl) | |
| Lenovo Legion Go | |
| Asus ROG Ally Z1 Extreme | |
| Ayaneo Kun | |
| ONEXPLAYER 2 Pro AR18 | |
| Valve Steam Deck 1 TB OLED | |
| AIDA64 / Memory Write | |
| Lenovo Legion Go | |
| Asus ROG Ally Z1 Extreme | |
| Sınıf ortalaması Handheld / UMPC (25596 - 117883, n=17, son 2 yıl) | |
| MSI Claw | |
| Ortalama Intel Core Ultra 7 155H (58692 - 93451, n=50) | |
| Ayaneo Kun | |
| Ayaneo Kun | |
| Ayaneo Kun | |
| ONEXPLAYER 2 Pro AR18 | |
| Valve Steam Deck 1 TB OLED | |
| AIDA64 / Memory Latency | |
| Ortalama Intel Core Ultra 7 155H (116.2 - 233, n=50) | |
| MSI Claw | |
| Ayaneo Kun | |
| Ayaneo Kun | |
| ONEXPLAYER 2 Pro AR18 | |
| Sınıf ortalaması Handheld / UMPC (99.8 - 147.6, n=16, son 2 yıl) | |
| Lenovo Legion Go | |
| Asus ROG Ally Z1 Extreme | |
| Valve Steam Deck 1 TB OLED | |
* ... daha küçük daha iyidir
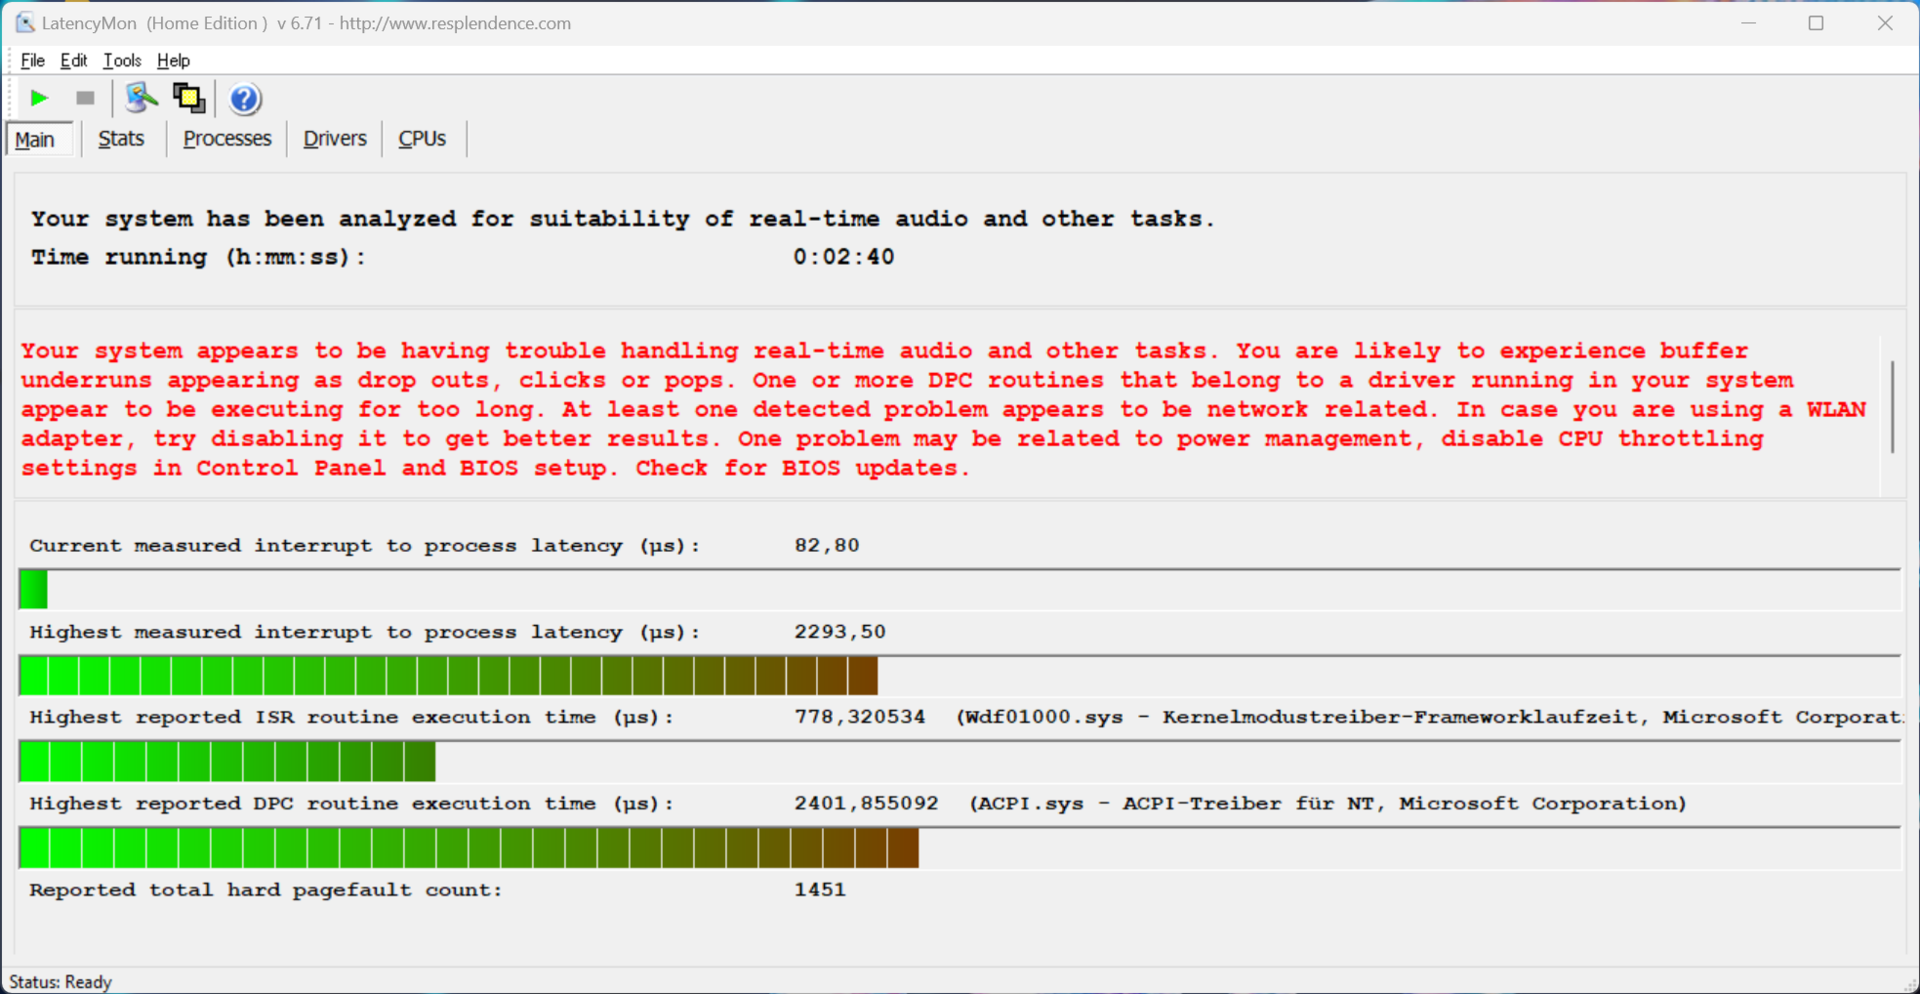
DPC gecikme süreleri
Standartlaştırılmış gecikme testimizde (internette gezinme, 4K YouTube oynatma, CPU yükü), mevcut BIOS sürümüne sahip test cihazı, gerçek zamanlı ses uygulamalarını kullanırken bazı sınırlamalar gösterdi.
| DPC Latencies / LatencyMon - interrupt to process latency (max), Web, Youtube, Prime95 | |
| MSI Claw | |
| Asus ROG Ally Z1 Extreme | |
| ONEXPLAYER 2 Pro AR18 | |
| Ayaneo Kun | |
* ... daha küçük daha iyidir
Depolama cihazı
Claw, 1 TB depolama kapasitesi sunan kompakt bir M.2 2230 SSD (bizim durumumuzda Kioxia (BG5)) ile donatılmıştır, bu sayede kullanıcılar cihazı ilk kez başlattıktan sonra 871 GB'ı kullanabilirler. Bir PCIe 4.0 SSD olmasına rağmen, maksimum aktarım hızları en iyi ihtimalle yalnızca 3,5 GB/s olarak listelenmiştir ve kıyaslama sonuçlarımız da çoğunlukla 3 GB/s civarında değerler göstermiştir. Yine de bu, bir oyun el bilgisayarı için tamamen yeterlidir ve uzun süreli yük altında bile performansta herhangi bir düşüş gözlemlemedik. Diğer SSD kıyaslamalarını aşağıda bulabilirsiniz burada.

| Drive Performance Rating - Percent | |
| ONEXPLAYER 2 Pro AR18 -11! | |
| Ayaneo Kun | |
| Lenovo Legion Go | |
| Sınıf ortalaması Handheld / UMPC | |
| MSI Claw | |
| Ortalama Kioxia BG5 KBG50ZNS1T02 | |
| Valve Steam Deck 1 TB OLED -11! | |
| Asus ROG Ally Z1 Extreme | |
* ... daha küçük daha iyidir
Reading continuous performance: DiskSpd Read Loop, Queue Depth 8
Grafik kartı
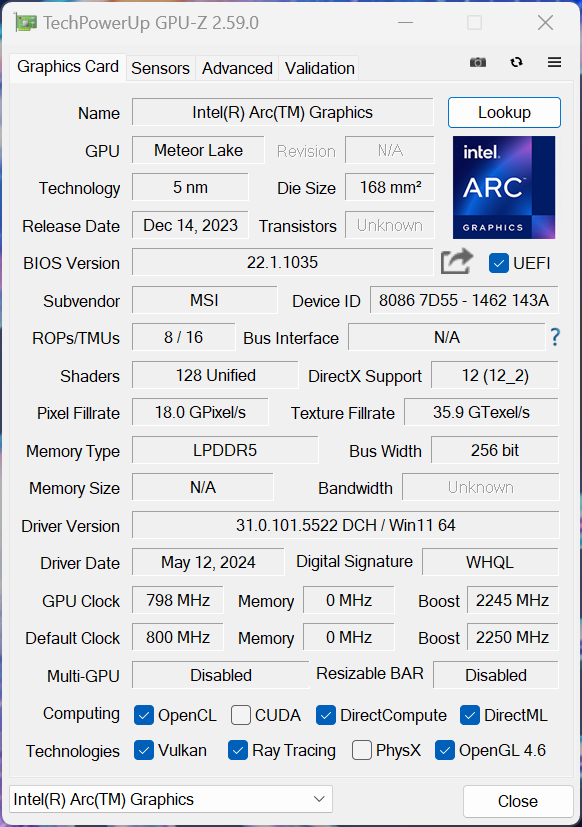
Test cihazımız ile Intel Core Ultra 7 155H hızlı Arc Graphics iGPU maksimum 2,25 GHz saat hızına ulaşabilen 8 Xe çekirdeği ile. Sentetik 3DMark testlerinde Intel, eski modele kıyasla performansını önemli ölçüde artırmayı başardı Iris Xe Graphics G7 ve AMD'nin Radeon 780M çok az farkla yenildi. IGPU, yüksek çözünürlüklü videoları oynatmak gibi günlük görevler için çok iyi bir donanıma sahip.
Cihazın grafik performansı hem pil kullanımında hem de sürekli yük altında sabit kalıyor. Diğer GPU kıyaslamaları şurada bulunabilir i̇şte.
| 3DMark 11 Performance | 12271 puan | |
| 3DMark Fire Strike Score | 7988 puan | |
| 3DMark Time Spy Score | 3829 puan | |
Yardım | ||
* ... daha küçük daha iyidir
Oyun performansı
Şimdi sıra el bilgisayarının oyun performansına geldi. Bu açıdan MSI Claw, sentetik testlerdeki iyi GPU sonuçlarını tekrarlayamadı ve bunun yerine neredeyse her oyunda AMD rekabetinin gerisinde kaldı. Sadece Steam Deck'i geçebildi. Bu, doğal 1080p çözünürlüğünde, yalnızca orta ila yüksek ayrıntılar kullanan birçok oyunu ve aşağıdaki gibi zorlu oyunları oynayabileceğiniz anlamına gelir Cyberpunk 2077 veya Baldurs Gate 3 düşük ayrıntı ayarlarında bile yükseltme teknolojisi kullanmadan çalıştırmak zordur. Buna ek olarak, Intel sürücüsünün performansını veya tasvir kalitesini daha da artırmak için AMD yazılımına kıyasla daha az özellik (örneğin Kare Üretimi) sunduğu gerçeği de var.
| Performance Rating - Percent | |
| Lenovo Legion Go | |
| Asus ROG Ally Z1 Extreme | |
| Ayaneo Kun | |
| ONEXPLAYER 2 Pro AR18 | |
| MSI Claw -1! | |
| Sınıf ortalaması Handheld / UMPC | |
| Valve Steam Deck 1 TB OLED -3! | |
| The Witcher 3 - 1920x1080 Ultra Graphics & Postprocessing (HBAO+) | |
| Ayaneo Kun | |
| ONEXPLAYER 2 Pro AR18 | |
| Lenovo Legion Go | |
| Asus ROG Ally Z1 Extreme | |
| Sınıf ortalaması Handheld / UMPC (17.5 - 33.9, n=11, son 2 yıl) | |
| MSI Claw | |
| GTA V - 1920x1080 Highest Settings possible AA:4xMSAA + FX AF:16x | |
| Ayaneo Kun | |
| Ayaneo Kun | |
| Asus ROG Ally Z1 Extreme | |
| ONEXPLAYER 2 Pro AR18 | |
| Lenovo Legion Go | |
| Sınıf ortalaması Handheld / UMPC (14 - 32.8, n=16, son 2 yıl) | |
| Valve Steam Deck 1 TB OLED | |
| Final Fantasy XV Benchmark - 1920x1080 High Quality | |
| Ayaneo Kun | |
| ONEXPLAYER 2 Pro AR18 | |
| Asus ROG Ally Z1 Extreme | |
| Lenovo Legion Go | |
| Sınıf ortalaması Handheld / UMPC (18.4 - 34.4, n=18, son 2 yıl) | |
| MSI Claw | |
| Valve Steam Deck 1 TB OLED | |
| Strange Brigade - 1920x1080 ultra AA:ultra AF:16 | |
| Ayaneo Kun | |
| ONEXPLAYER 2 Pro AR18 | |
| Asus ROG Ally Z1 Extreme | |
| MSI Claw | |
| Sınıf ortalaması Handheld / UMPC (30 - 56.1, n=18, son 2 yıl) | |
| Lenovo Legion Go | |
| Valve Steam Deck 1 TB OLED | |
| Dota 2 Reborn - 1920x1080 ultra (3/3) best looking | |
| Lenovo Legion Go | |
| Asus ROG Ally Z1 Extreme | |
| Sınıf ortalaması Handheld / UMPC (30.8 - 85, n=18, son 2 yıl) | |
| MSI Claw | |
| ONEXPLAYER 2 Pro AR18 | |
| Ayaneo Kun | |
| Ayaneo Kun | |
| X-Plane 11.11 - 1920x1080 high (fps_test=3) | |
| MSI Claw | |
| Lenovo Legion Go | |
| Sınıf ortalaması Handheld / UMPC (24.5 - 50.5, n=18, son 2 yıl) | |
| Asus ROG Ally Z1 Extreme | |
| ONEXPLAYER 2 Pro AR18 | |
| Ayaneo Kun | |
| Ayaneo Kun | |
| Cyberpunk 2077 2.2 Phantom Liberty | |
| 1920x1080 Ultra Preset (FSR off) | |
| Sınıf ortalaması Handheld / UMPC (11.5 - 28.5, n=13, son 2 yıl) | |
| Asus ROG Ally Z1 Extreme | |
| Ortalama Intel Arc 8-Core iGPU (13 - 24.7, n=26) | |
| MSI Claw | |
| 1920x1080 High Preset (FSR off) | |
| Lenovo Legion Go | |
| Ayaneo Kun | |
| Ayaneo Kun | |
| Asus ROG Ally Z1 Extreme | |
| Sınıf ortalaması Handheld / UMPC (13.8 - 31.4, n=19, son 2 yıl) | |
| ONEXPLAYER 2 Pro AR18 | |
| MSI Claw | |
| Ortalama Intel Arc 8-Core iGPU (7.3 - 27.6, n=34) | |
| Valve Steam Deck 1 TB OLED | |
Witcher 3 FPS diagram
Cyberpunk 2077 döngümüz, MSI el bilgisayarının oyun performansının uzun süreli yük altında sabit kaldığını gösteriyor. Ayrıca çeşitli enerji profillerini kullanarak oyun performansını test ettik ve bulgularımızı aşağıdaki tabloda özetledik. Verimli mod Super Battery , eski veya daha az talepkar oyunlar için çok uygundur; aksi takdirde performansı yeterli değildir.
| Oyun (1080p) | Süper Pil | Dengeli | AI | Olağanüstü Performans |
|---|---|---|---|---|
| Witcher 3 (Ultra) | 20.7fps | 25.8fps | 25.6fps | 25.6fps |
| Far Cry 5 (Ultra) | 28fps | 32fps | 34fps | 33fps |
| Shadow of the Tomb Raider (Ultra) | 23fps | 27fps | 27fps | 26fps |
| GTA V (Yüksek) | 34.2fps | 40.8fps | 39.6fps | 39.6fps |
| Cyberpunk 2077 (Düşük) | 23.3fps | 31fps | 30.9fps | 31.1fps |
| Baldurs Gate 3 (Düşük) | 28.7fps | 33.1fps | 31.7fps | 33.3fps |
| düşük | orta | yüksek | ultra | |
|---|---|---|---|---|
| GTA V (2015) | 158.1 | 147.9 | 39.6 | |
| The Witcher 3 (2015) | 135 | 51 | 25.6 | |
| Dota 2 Reborn (2015) | 98.6 | 84.1 | 67.4 | 63.6 |
| Final Fantasy XV Benchmark (2018) | 58.5 | 35.9 | 25.4 | |
| X-Plane 11.11 (2018) | 51.6 | 45.1 | 38.9 | |
| Far Cry 5 (2018) | 67 | 40 | 37 | 34 |
| Strange Brigade (2018) | 163 | 71 | 59 | 46 |
| Shadow of the Tomb Raider (2018) | 69 | 33 | 31 | 27 |
| F1 23 (2023) | 64.4 | 59.4 | 41.2 | |
| Baldur's Gate 3 (2023) | 31.7 | 24.8 | 20.7 | 20.3 |
| Cyberpunk 2077 2.2 Phantom Liberty (2023) | 30.9 | 25.3 | 21.9 | 19.8 |
| Horizon Forbidden West (2024) | 52 | 34 | 29 | 25 |
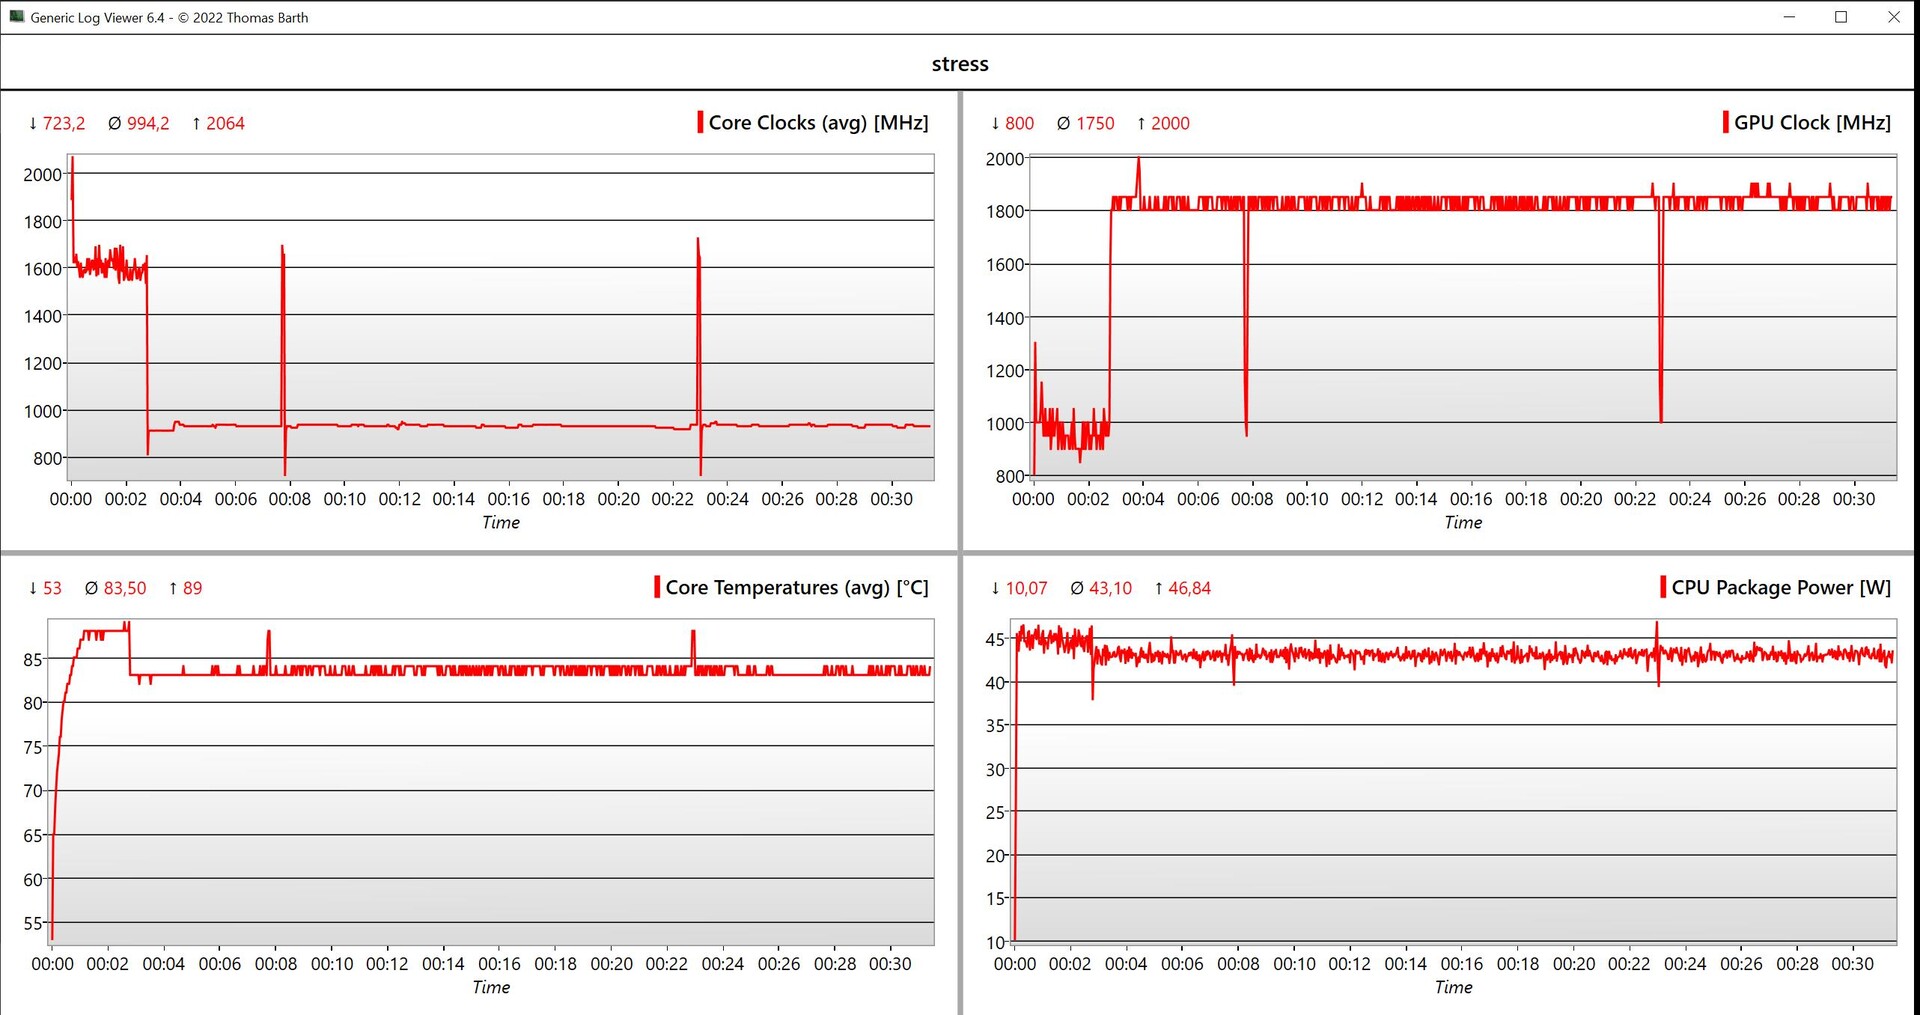
Emisyonlar - Rahatsız edici fanlar
Gürültü emisyonları
İki fandan oluşan soğutma ünitesi Intel işlemcinin yüksek güç limitlerini korumayı başarıyor, ancak sonuçta en verimli modu kullanırken bile neredeyse sürekli çalışan fanlara sahip bir oyun el bilgisayarı ortaya çıkıyor. Fanların gerçekten devre dışı bırakılması nispeten nadirdir ve normalde, el cihazı rölantideyken bile her zaman bir tıslama sesi vardır. Yük altında durum daha da kötüleşiyor ve MSI Claw en gürültülü cihazlardan biri haline geliyor. Oyun oynarken 45-48 dB(A) ve en verimli Süper Pil modunu (20 watt TDP) kullanırken 37 dB(A)'nın hemen altında ölçtük.
| Enerji profili | Cyberpunk 2077 Phantom Liberty | Stres testi | maks. pil çalışması |
|---|---|---|---|
| Süper Batarya | 36,6 dB(A) | 36,6 dB(A) | 36,6 dB(A) |
| Dengeli | 45,5 dB(A) | 45,5 dB(A) | 45,5 dB(A) |
| AI | 45,5 dB(A) | 45,5 dB(A) | 45,5 dB(A) |
| Olağanüstü Performans | 48,5 dB(A) | 48,5 dB(A) | 46,3 dB(A) |
Ses yüksekliği
| Boşta |
| 25.7 / 31.7 / 31.7 dB |
| Çalışırken |
| 36.6 / 45.5 dB |
 | ||
30 dB sessiz 40 dB(A) duyulabilirlik 50 dB(A) gürültülü |
||
min: | ||
| MSI Claw Arc 8-Core, Ultra 7 155H, Kioxia BG5 KBG50ZNS1T02 | Valve Steam Deck 1 TB OLED Radeon Radeon Steam Deck 8CU, Steam Deck OLED APU, Phison ESMP001TKB5C3 | Lenovo Legion Go Radeon 780M, Z1 Extreme, WD PC SN740 512GB SDDPMQD-512G-1101 | Asus ROG Ally Z1 Extreme Radeon 780M, Z1 Extreme, Micron 2400 MTFDKBK512QFM | ONEXPLAYER 2 Pro AR18 Radeon 780M, R7 7840U | Ayaneo Kun Radeon 780M, R7 7840U, Phison M.2 2280 E18 4000GB | |
|---|---|---|---|---|---|---|
| Noise | 12% | 15% | 11% | 9% | 1% | |
| kapalı / ortam * | 25.7 | 24.7 4% | 23 11% | 23.3 9% | 24.4 5% | |
| Idle Minimum * | 25.7 | 25 3% | 23 11% | 23.3 9% | 24.4 5% | 25.31 2% |
| Idle Average * | 31.7 | 25 21% | 23 27% | 23.3 26% | 24.4 23% | 25.31 20% |
| Idle Maximum * | 31.7 | 25 21% | 25 21% | 27.3 14% | 30.6 3% | 34.5 -9% |
| Load Average * | 36.6 | 31.3 14% | 37 -1% | 39.2 -7% | 36 2% | 34.9 5% |
| Cyberpunk 2077 ultra * | 45.5 | |||||
| Load Maximum * | 45.5 | 40.8 10% | 37 19% | 39.2 14% | 39.3 14% | 50.78 -12% |
| Witcher 3 ultra * | 46 | 39.2 |
* ... daha küçük daha iyidir
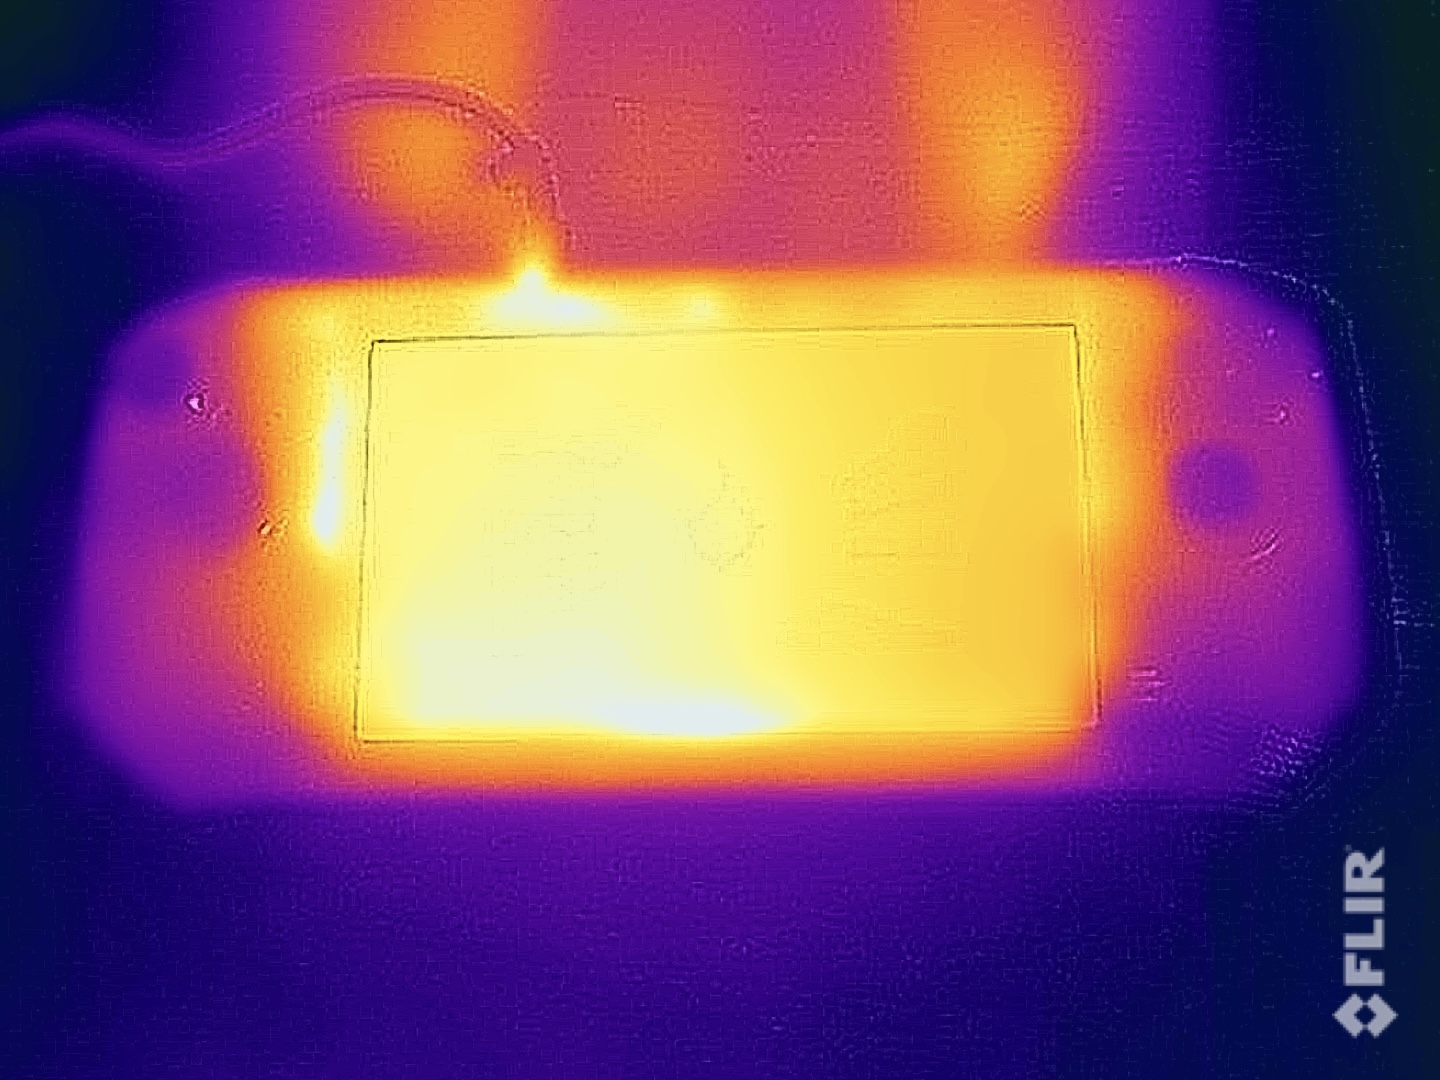
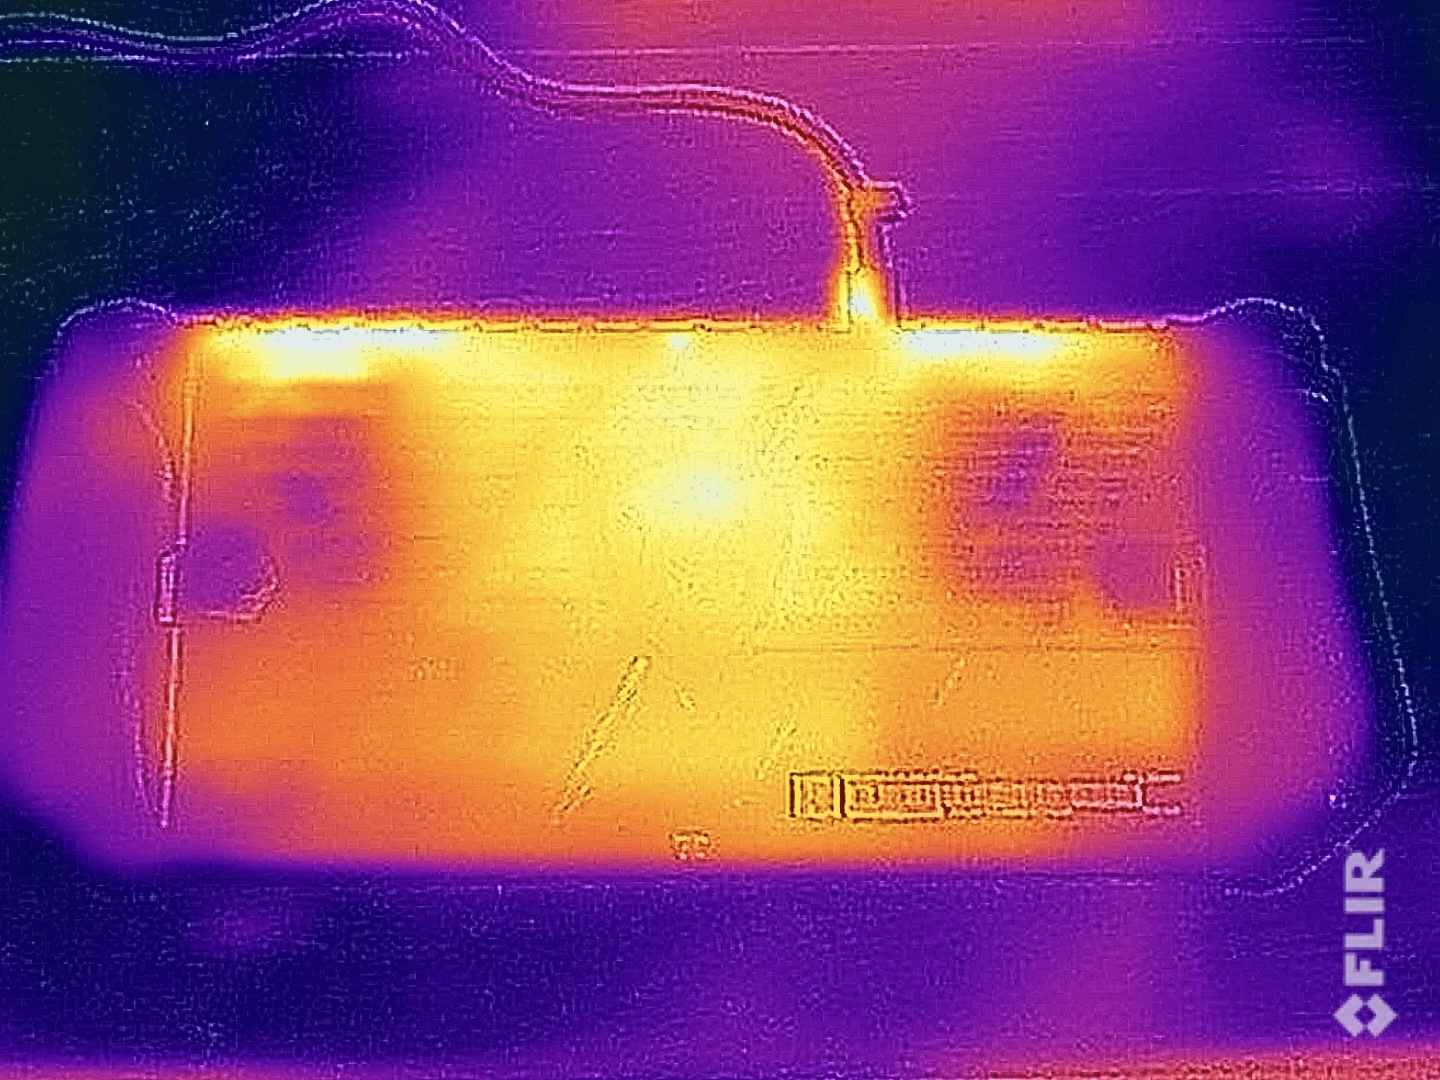
Sıcaklık
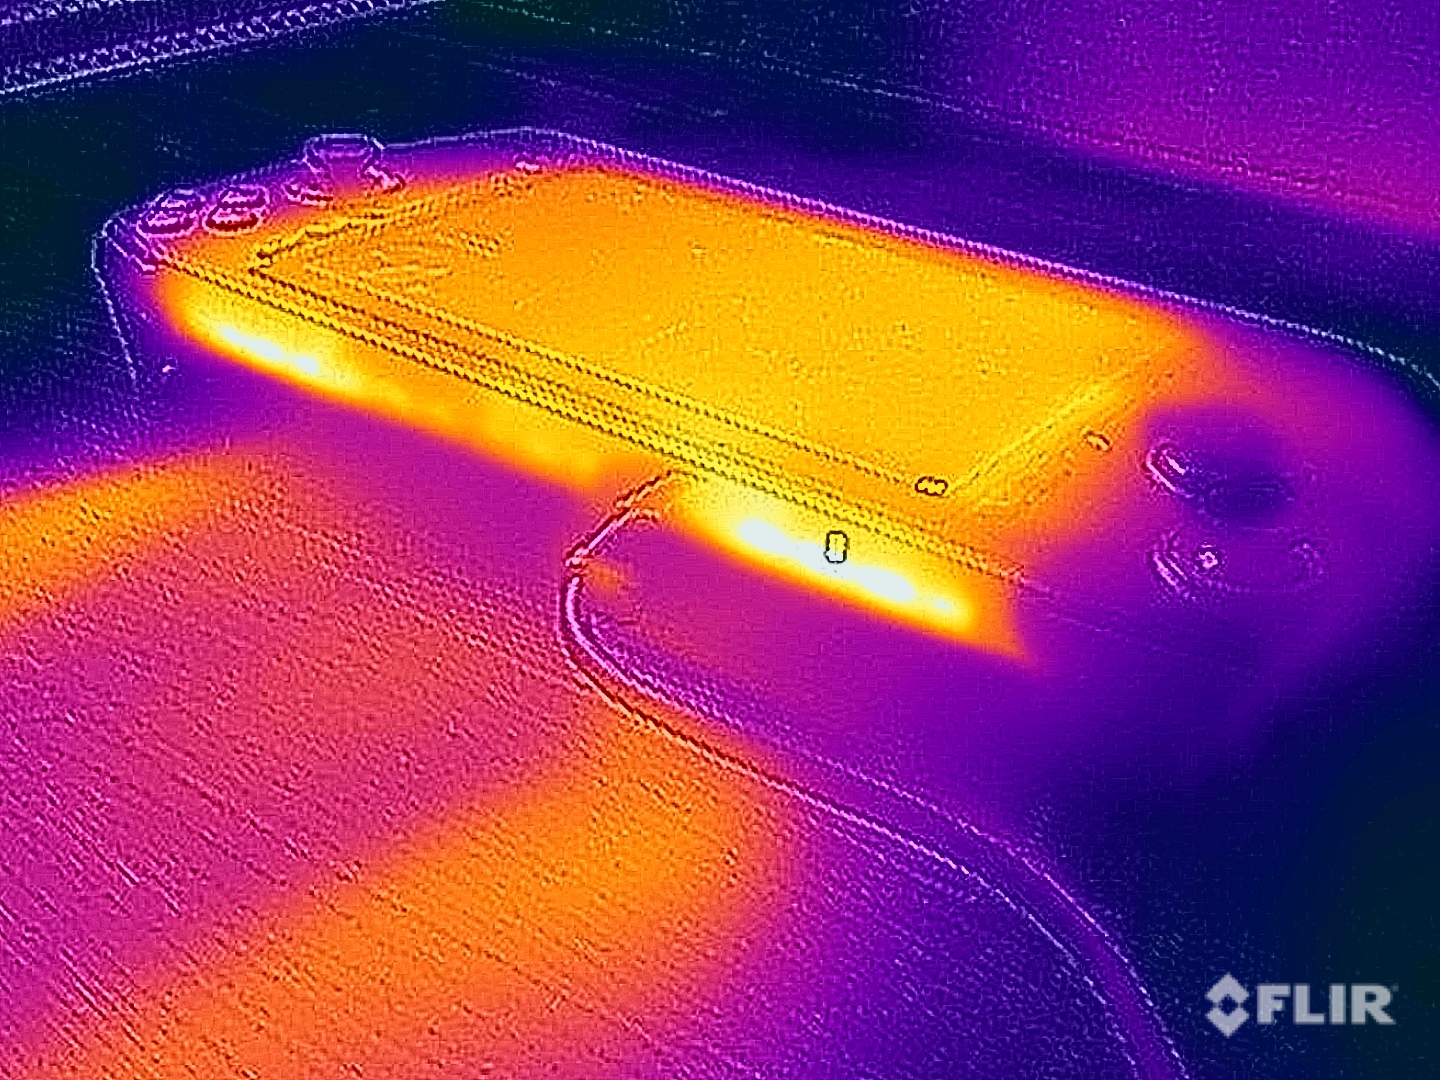
Claw'ın orta alanı oldukça ısınıyor, ancak bu önemli değil çünkü tutma yerleri her zaman güzel ve serin kalıyor ve oyun oynarken herhangi bir kısıtlama olmadığını fark ettik. Fan çıkışları üst kısımda yer alıyor ve bu nedenle engel teşkil etmiyor. Stres testi sırasında işlemci kısa bir süre 45 watt'ta çalıştıktan sonra 43 watt'ta sabitlendi.
(±) Üst taraftaki maksimum sıcaklık, 38.4 °C / 101 F ortalamasına kıyasla 41.8 °C / 107 F'dir. , Handheld / UMPC sınıfı için 26.6 ile 55 °C arasında değişir.
(+) Alt kısım, 38 °C / 100 F ortalamasına kıyasla maksimum 35.9 °C / 97 F'ye kadar ısınır
(+) Boşta kullanımda, üst tarafın ortalama sıcaklığı 30.9 °C / 88 F olup, cihazın 31.6 °C / 89 F.
(-) 3: The average temperature for the upper side is 39.9 °C / 104 F, compared to the average of 31.6 °C / 89 F for the class Handheld / UMPC.
(-) Avuç içi dayanakları ve dokunmatik yüzey maksimum 41.8 °C / 107.2 F ile dokunulamayacak kadar ısınabilir.
(-) Benzer cihazların avuç içi dayanağı alanının ortalama sıcaklığı 30.5 °C / 86.9 F (-11.3 °C / -20.3 F) idi.
Konuşmacılar
Ön taraftaki iki stereo hoparlör oldukça iyi bir iş çıkarıyor ve çok yüksek ses çıkarıyor. Ancak oyun oynarken sürekli fan gürültüsünü engellemek yine de zor. Ses net ancak diğer el bilgisayarlarında da olduğu gibi biraz vurucu değil. Ses ROG Ally karşılaştırılabilir bir seviyede, ancak Valve'ın Buhar Güvertesi OLED biraz daha iyi performans gösterir.
MSI Claw ses analizi
(+) | hoparlörler nispeten yüksek sesle çalabilir (87.2 dB)
Bas 100 - 315Hz
(-) | neredeyse hiç bas yok - ortalama olarak medyandan 17.2% daha düşük
(±) | Bas doğrusallığı ortalamadır (9.2% delta - önceki frekans)
Ortalar 400 - 2000 Hz
(+) | dengeli ortalar - medyandan yalnızca 4.3% uzakta
(+) | orta frekanslar doğrusaldır (4.3% deltadan önceki frekansa)
Yüksekler 2 - 16 kHz
(+) | dengeli yüksekler - medyandan yalnızca 3.7% uzakta
(+) | yüksekler doğrusaldır (4.5% deltadan önceki frekansa)
Toplam 100 - 16.000 Hz
(+) | genel ses doğrusaldır (14.9% ortancaya göre fark)
Aynı sınıfla karşılaştırıldığında
» Bu sınıftaki tüm test edilen cihazların %17%'si daha iyi, 11% benzer, 72% daha kötüydü
» En iyisinin deltası 12% idi, ortalama 18% idi, en kötüsü 23% idi
Test edilen tüm cihazlarla karşılaştırıldığında
» Test edilen tüm cihazların %18'si daha iyi, 4 benzer, % 78 daha kötüydü
» En iyisinin deltası 4% idi, ortalama 24% idi, en kötüsü 134% idi
Asus ROG Ally Z1 Extreme ses analizi
(+) | hoparlörler nispeten yüksek sesle çalabilir (82.1 dB)
Bas 100 - 315Hz
(-) | neredeyse hiç bas yok - ortalama olarak medyandan 15.5% daha düşük
(±) | Bas doğrusallığı ortalamadır (8.4% delta - önceki frekans)
Ortalar 400 - 2000 Hz
(+) | dengeli ortalar - medyandan yalnızca 3.1% uzakta
(+) | orta frekanslar doğrusaldır (3% deltadan önceki frekansa)
Yüksekler 2 - 16 kHz
(+) | dengeli yüksekler - medyandan yalnızca 1.9% uzakta
(+) | yüksekler doğrusaldır (2.3% deltadan önceki frekansa)
Toplam 100 - 16.000 Hz
(+) | genel ses doğrusaldır (13.5% ortancaya göre fark)
Aynı sınıfla karşılaştırıldığında
» Bu sınıftaki tüm test edilen cihazların %25%'si daha iyi, 5% benzer, 71% daha kötüydü
» En iyisinin deltası 5% idi, ortalama 18% idi, en kötüsü 45% idi
Test edilen tüm cihazlarla karşılaştırıldığında
» Test edilen tüm cihazların %13'si daha iyi, 4 benzer, % 84 daha kötüydü
» En iyisinin deltası 4% idi, ortalama 24% idi, en kötüsü 134% idi
Lenovo Legion Go ses analizi
(±) | hoparlör ses yüksekliği ortalama ama iyi (73.1 dB)
Bas 100 - 315Hz
(-) | neredeyse hiç bas yok - ortalama olarak medyandan 16.4% daha düşük
(±) | Bas doğrusallığı ortalamadır (8.1% delta - önceki frekans)
Ortalar 400 - 2000 Hz
(±) | daha yüksek ortalar - ortalama olarak medyandan 5.2% daha yüksek
(+) | orta frekanslar doğrusaldır (6% deltadan önceki frekansa)
Yüksekler 2 - 16 kHz
(±) | daha yüksek en yüksekler - ortalama olarak medyandan 5.7% daha yüksek
(±) | Yükseklerin doğrusallığı ortalamadır (9.7% delta - önceki frekans)
Toplam 100 - 16.000 Hz
(±) | Genel sesin doğrusallığı ortalamadır (22.7% ortancaya göre fark)
Aynı sınıfla karşılaştırıldığında
» Bu sınıftaki tüm test edilen cihazların %89%'si daha iyi, 6% benzer, 6% daha kötüydü
» En iyisinin deltası 12% idi, ortalama 18% idi, en kötüsü 23% idi
Test edilen tüm cihazlarla karşılaştırıldığında
» Test edilen tüm cihazların %65'si daha iyi, 6 benzer, % 30 daha kötüydü
» En iyisinin deltası 4% idi, ortalama 24% idi, en kötüsü 134% idi
Valve Steam Deck 1 TB OLED ses analizi
(+) | hoparlörler nispeten yüksek sesle çalabilir (82.7 dB)
Bas 100 - 315Hz
(-) | neredeyse hiç bas yok - ortalama olarak medyandan 22% daha düşük
(±) | Bas doğrusallığı ortalamadır (14.7% delta - önceki frekans)
Ortalar 400 - 2000 Hz
(+) | dengeli ortalar - medyandan yalnızca 1% uzakta
(+) | orta frekanslar doğrusaldır (2.1% deltadan önceki frekansa)
Yüksekler 2 - 16 kHz
(+) | dengeli yüksekler - medyandan yalnızca 1.9% uzakta
(+) | yüksekler doğrusaldır (6.1% deltadan önceki frekansa)
Toplam 100 - 16.000 Hz
(+) | genel ses doğrusaldır (12.9% ortancaya göre fark)
Aynı sınıfla karşılaştırıldığında
» Bu sınıftaki tüm test edilen cihazların %6%'si daha iyi, 6% benzer, 89% daha kötüydü
» En iyisinin deltası 12% idi, ortalama 18% idi, en kötüsü 23% idi
Test edilen tüm cihazlarla karşılaştırıldığında
» Test edilen tüm cihazların %11'si daha iyi, 3 benzer, % 87 daha kötüydü
» En iyisinin deltası 4% idi, ortalama 24% idi, en kötüsü 134% idi
Güç yönetimi - Kısa pil ömrü
Güç tüketimi
MSI'ın oyun el bilgisayarı pek de verimli değil. Tam parlaklıkta, test cihazı rölantideyken zaten 12 watt kullanıyor. Stres testi sırasında, birkaç saniye sonra yaklaşık 54 watt'ta dengelenmeden önce sadece anlık olarak 65 watt'a ulaştı. Oyun oynarken de yaklaşık 55 watt'a ulaşıyor, yani birlikte verilen 65 watt'lık güç kaynağı yeterince güçlü.
| Kapalı / Bekleme modu | |
| Boşta | |
| Çalışırken |
|
Key:
min: | |
| MSI Claw Ultra 7 155H, Arc 8-Core, Kioxia BG5 KBG50ZNS1T02, IPS, 1920x1080, 7" | Valve Steam Deck 1 TB OLED Steam Deck OLED APU, Radeon Radeon Steam Deck 8CU, Phison ESMP001TKB5C3, OLED, 1280x800, 7.4" | Lenovo Legion Go Z1 Extreme, Radeon 780M, WD PC SN740 512GB SDDPMQD-512G-1101, IPS, 2560x1600, 8.8" | Asus ROG Ally Z1 Extreme Z1 Extreme, Radeon 780M, Micron 2400 MTFDKBK512QFM, IPS, 1920x1080, 7" | ONEXPLAYER 2 Pro AR18 R7 7840U, Radeon 780M, , IPS, 2560x1600, 8.4" | Ayaneo Kun R7 7840U, Radeon 780M, Phison M.2 2280 E18 4000GB, IPS, 2560x1600, 8.4" | Ortalama Intel Arc 8-Core iGPU | Sınıf ortalaması Handheld / UMPC | |
|---|---|---|---|---|---|---|---|---|
| Power Consumption | 42% | -13% | 26% | 16% | -58% | 5% | 10% | |
| Idle Minimum * | 7.8 | 4.5 42% | 11.5 -47% | 4.2 46% | 6.66 15% | 14 -79% | 5.34 ? 32% | 7.38 ? 5% |
| Idle Average * | 11.5 | 7.21 37% | 12 -4% | 6.1 47% | 7.11 38% | 17.56 -53% | 8.54 ? 26% | 9.43 ? 18% |
| Idle Maximum * | 11.8 | 9.66 18% | 17.4 -47% | 6.3 47% | 11.7 1% | 27 -129% | 11.9 ? -1% | 12.9 ? -9% |
| Load Average * | 53.1 | 22.86 57% | 45 15% | 56.6 -7% | 46.708 12% | 38.1 28% | 54 ? -2% | 40 ? 25% |
| Cyberpunk 2077 ultra * | 54.4 | |||||||
| Load Maximum * | 64.6 | 27.8 57% | 54 16% | 67.2 -4% | 56.7 12% | 101 -56% | 84.9 ? -31% | 57.3 ? 11% |
| Witcher 3 ultra * | 42.6 | 64.1 | 53.1 | 83.5 |
* ... daha küçük daha iyidir
Power consumption Witcher 3 / stress test
Çalışma Zamanları
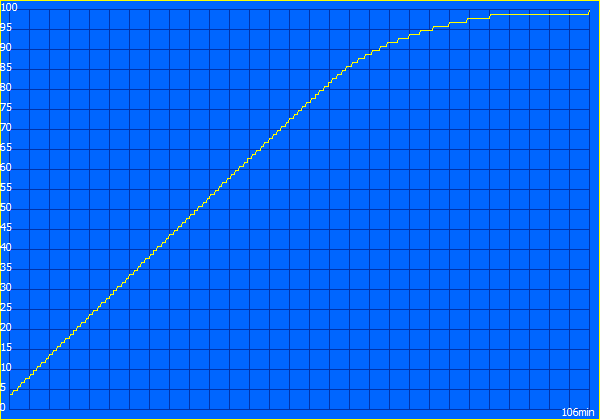
MSI cihaza 53 Wh'lik bir batarya yerleştirdi, bu nedenle elbette normal batarya testlerimizi gerçekleştirdik. WLAN testi sırasında, iki rakip hala eşit seviyedeydi ancak video testinde, Claw el cihazı, önemli ölçüde daha küçük pil ile ROG Ally karşısında yenilgiyi kabul etmek zorunda kaldı. Öte yandan, oyun oynarken pil ömrü çok daha önemli ve burada AAA oyunları oynarken test yaklaşık 80 dakika sonra sona erdi. Süper Pil modunu (20 watt TDP) kullanarak biraz daha uzun süre oynayabilirsiniz, ancak bu durumda çözünürlüğü ve ayrıntıları daha da azaltmanız gerekir ve Cyberpunk 2077 gibi oyunlar artık 1080p'de bile düşük ayrıntılarla sorunsuz çalışmaz. Öte yandan, emülatörler için, birkaç saatlik çalışma sürelerini mümkün kılmak için TDP'yi manuel olarak daha da azaltabilmeyi isterdik. Cihaz açıkken tamamen şarj olması 106 dakika sürüyor; yaklaşık bir saat sonra %80'i tekrar kullanılabilir hale geliyor.
| MSI Claw Ultra 7 155H, Arc 8-Core, 53 Wh | Valve Steam Deck 1 TB OLED Steam Deck OLED APU, Radeon Radeon Steam Deck 8CU, 50 Wh | Lenovo Legion Go Z1 Extreme, Radeon 780M, 49.2 Wh | Asus ROG Ally Z1 Extreme Z1 Extreme, Radeon 780M, 40 Wh | ONEXPLAYER 2 Pro AR18 R7 7840U, Radeon 780M, 65 Wh | Ayaneo Kun R7 7840U, Radeon 780M, 75 Wh | Sınıf ortalaması Handheld / UMPC | |
|---|---|---|---|---|---|---|---|
| Pil Çalışma Süresi | 20% | -23% | 4% | 39% | -3% | 15% | |
| H.264 | 527 | 568 8% | 629 ? 19% | ||||
| WiFi v1.3 | 466 | 559 20% | 358 -23% | 465 0% | 648 39% | 602 29% | 575 ? 23% |
| Cyberpunk 2077 ultra 150cd | 76 | ||||||
| Load | 76 | 50 -34% | 79.3 ? 4% | ||||
| Witcher 3 ultra | 57 | 72 | 101 | 86.5 ? |
Artılar
Eksiler
Karar - MSI Claw, Intel Meteor Lake işlemcisinin bir sonucu olarak acı çekiyor


MSI Claw oyun el bilgisayarı, kapsamlı testimiz sırasında bizi etkilemeyi başaramadı. Genel olarak konsepti, bir yıl önce piyasaya sürülen 7 inç ekranlı Asus ROG Ally ile benzerlik gösteriyor. Ancak MSI, AMD'nin bir çipini tercih etmedi; bunun yerine Intel Meteor Lake işlemciye güveniyor. Bu da birkaç sorunu beraberinde getiriyor ve diğer üreticilerin neden aynı yolu izlemediğini gösteriyor. Daha yüksek güç tüketimine rağmen, oyun performansı diğer AMD el cihazlarına göre biraz daha kötü ve aynı zamanda soğutma ünitesinin de işi zor. Fanlar neredeyse her zaman aktif ve toplamda Claw piyasadaki en gürültülü el cihazlarından biri.
Öte yandan MSI Claw, kumanda kolları/düğmeleri ve oyun yazılımı gibi diğer alanlarda üzerimizde iyi bir izlenim bıraktı. Değişken bir yenileme hızı görmek istesek de ekranı genel olarak iyi. Dahası, ek bir USB bağlantısı faydalı olabilirdi. Teorik olarak, M.2 2230 SSD'si değiştirilebilir ancak bunu yapmak için tüm kasayı sökmeniz ve tekrar bir araya getirirken yeni bir termal macun uygulamanız gerekir.
MSI Claw oyun el bilgisayarı, mevcut Intel CPU'ların oyun el bilgisayarları için uygun olmadığını etkileyici bir şekilde göstermektedir. AMD rakiplerine kıyasla daha zayıf oyun performansı ve daha yüksek fiyatı nedeniyle Intel el bilgisayarı tavsiyemize layık değil.
Görünüşe göre MSI bu sorunu çoktan tespit etmiş ve Claw'ın piyasaya sürülmesinden sadece üç ay sonra halefibu model, daha verimli bir Intel Lunar Lake işlemci ve daha hızlı bir iGPU ile birlikte daha büyük bir ekrana sahip olacak. Ancak bu modelin piyasaya sürülmesi birkaç ay alacaktır.
800$'ın üzerindeki yüksek fiyatı nedeniyle Claw el bilgisayarını tercih etmek kesinlikle mantıklı değil. Daha büyük Legion Git sadece 750 ABD Doları (daha küçük SSD ile) ve hatta ROG Ally halihazırda 700 ABD Dolarının altında bir fiyata bulunabilmektedir. Ayrıca, halefi olan ROG Ally X-önümüzdeki ay piyasaya sürülecek ve önemli iyileştirmeler (daha konforlu kasa, 80 Wh pil, 1 TB M.2 2280 SSD, 24 GB RAM, 2x USB) içerecek ve 1.000 ABD dolarının biraz altında bir fiyata satılacak. En son çıkan Buhar Güvertesi OLED 1 TB SSD ile çok daha ucuzdur ve fiyatı 630 ABD doları civarındadır.
Lütfen dikkat: Derecelendirme sistemimizi güncelledik ve 8. sürümün sonuçları 7. sürümün sonuçları ile karşılaştırılamaz.
Fiyat ve bulunabilirlik
Şu anda MSI Claw'ın 512 GB SSD'li test yapılandırması Amazon'dan 649 ABD doları indirimli fiyatla satın alınabiliyor.
MSI Claw
- 06/19/2024 v8
Andreas Osthoff
Şeffaflık
İncelenecek cihazların seçimi editör ekibimiz tarafından yapılır. Test örneği, bu incelemenin amacı doğrultusunda üretici veya perakendeci tarafından yazara ödünç olarak sağlanmıştır. Borç verenin bu inceleme üzerinde herhangi bir etkisi olmadığı gibi, üretici de yayınlanmadan önce bu incelemenin bir kopyasını almamıştır. Bu incelemeyi yayınlama zorunluluğu yoktu. İncelemelerimiz karşılığında asla tazminat veya ödeme kabul etmiyoruz. Bağımsız bir medya şirketi olarak Notebookcheck, üreticilerin, perakendecilerin veya yayıncıların otoritesine tabi değildir.
Notebookcheck bu şekilde test yapıyor
Notebookcheck, tüm sonuçların karşılaştırılabilir olmasını sağlamak için her yıl yüzlerce dizüstü bilgisayarı ve akıllı telefonu standart prosedürler kullanarak bağımsız olarak inceliyor. Yaklaşık 20 yıldır test yöntemlerimizi sürekli olarak geliştirdik ve bu süreçte endüstri standartlarını belirledik. Test laboratuvarlarımızda deneyimli teknisyenler ve editörler tarafından yüksek kaliteli ölçüm ekipmanları kullanılmaktadır. Bu testler çok aşamalı bir doğrulama sürecini içerir. Karmaşık derecelendirme sistemimiz, nesnelliği koruyan yüzlerce sağlam temellere dayanan ölçüm ve kıyaslamaya dayanmaktadır.Price comparison

