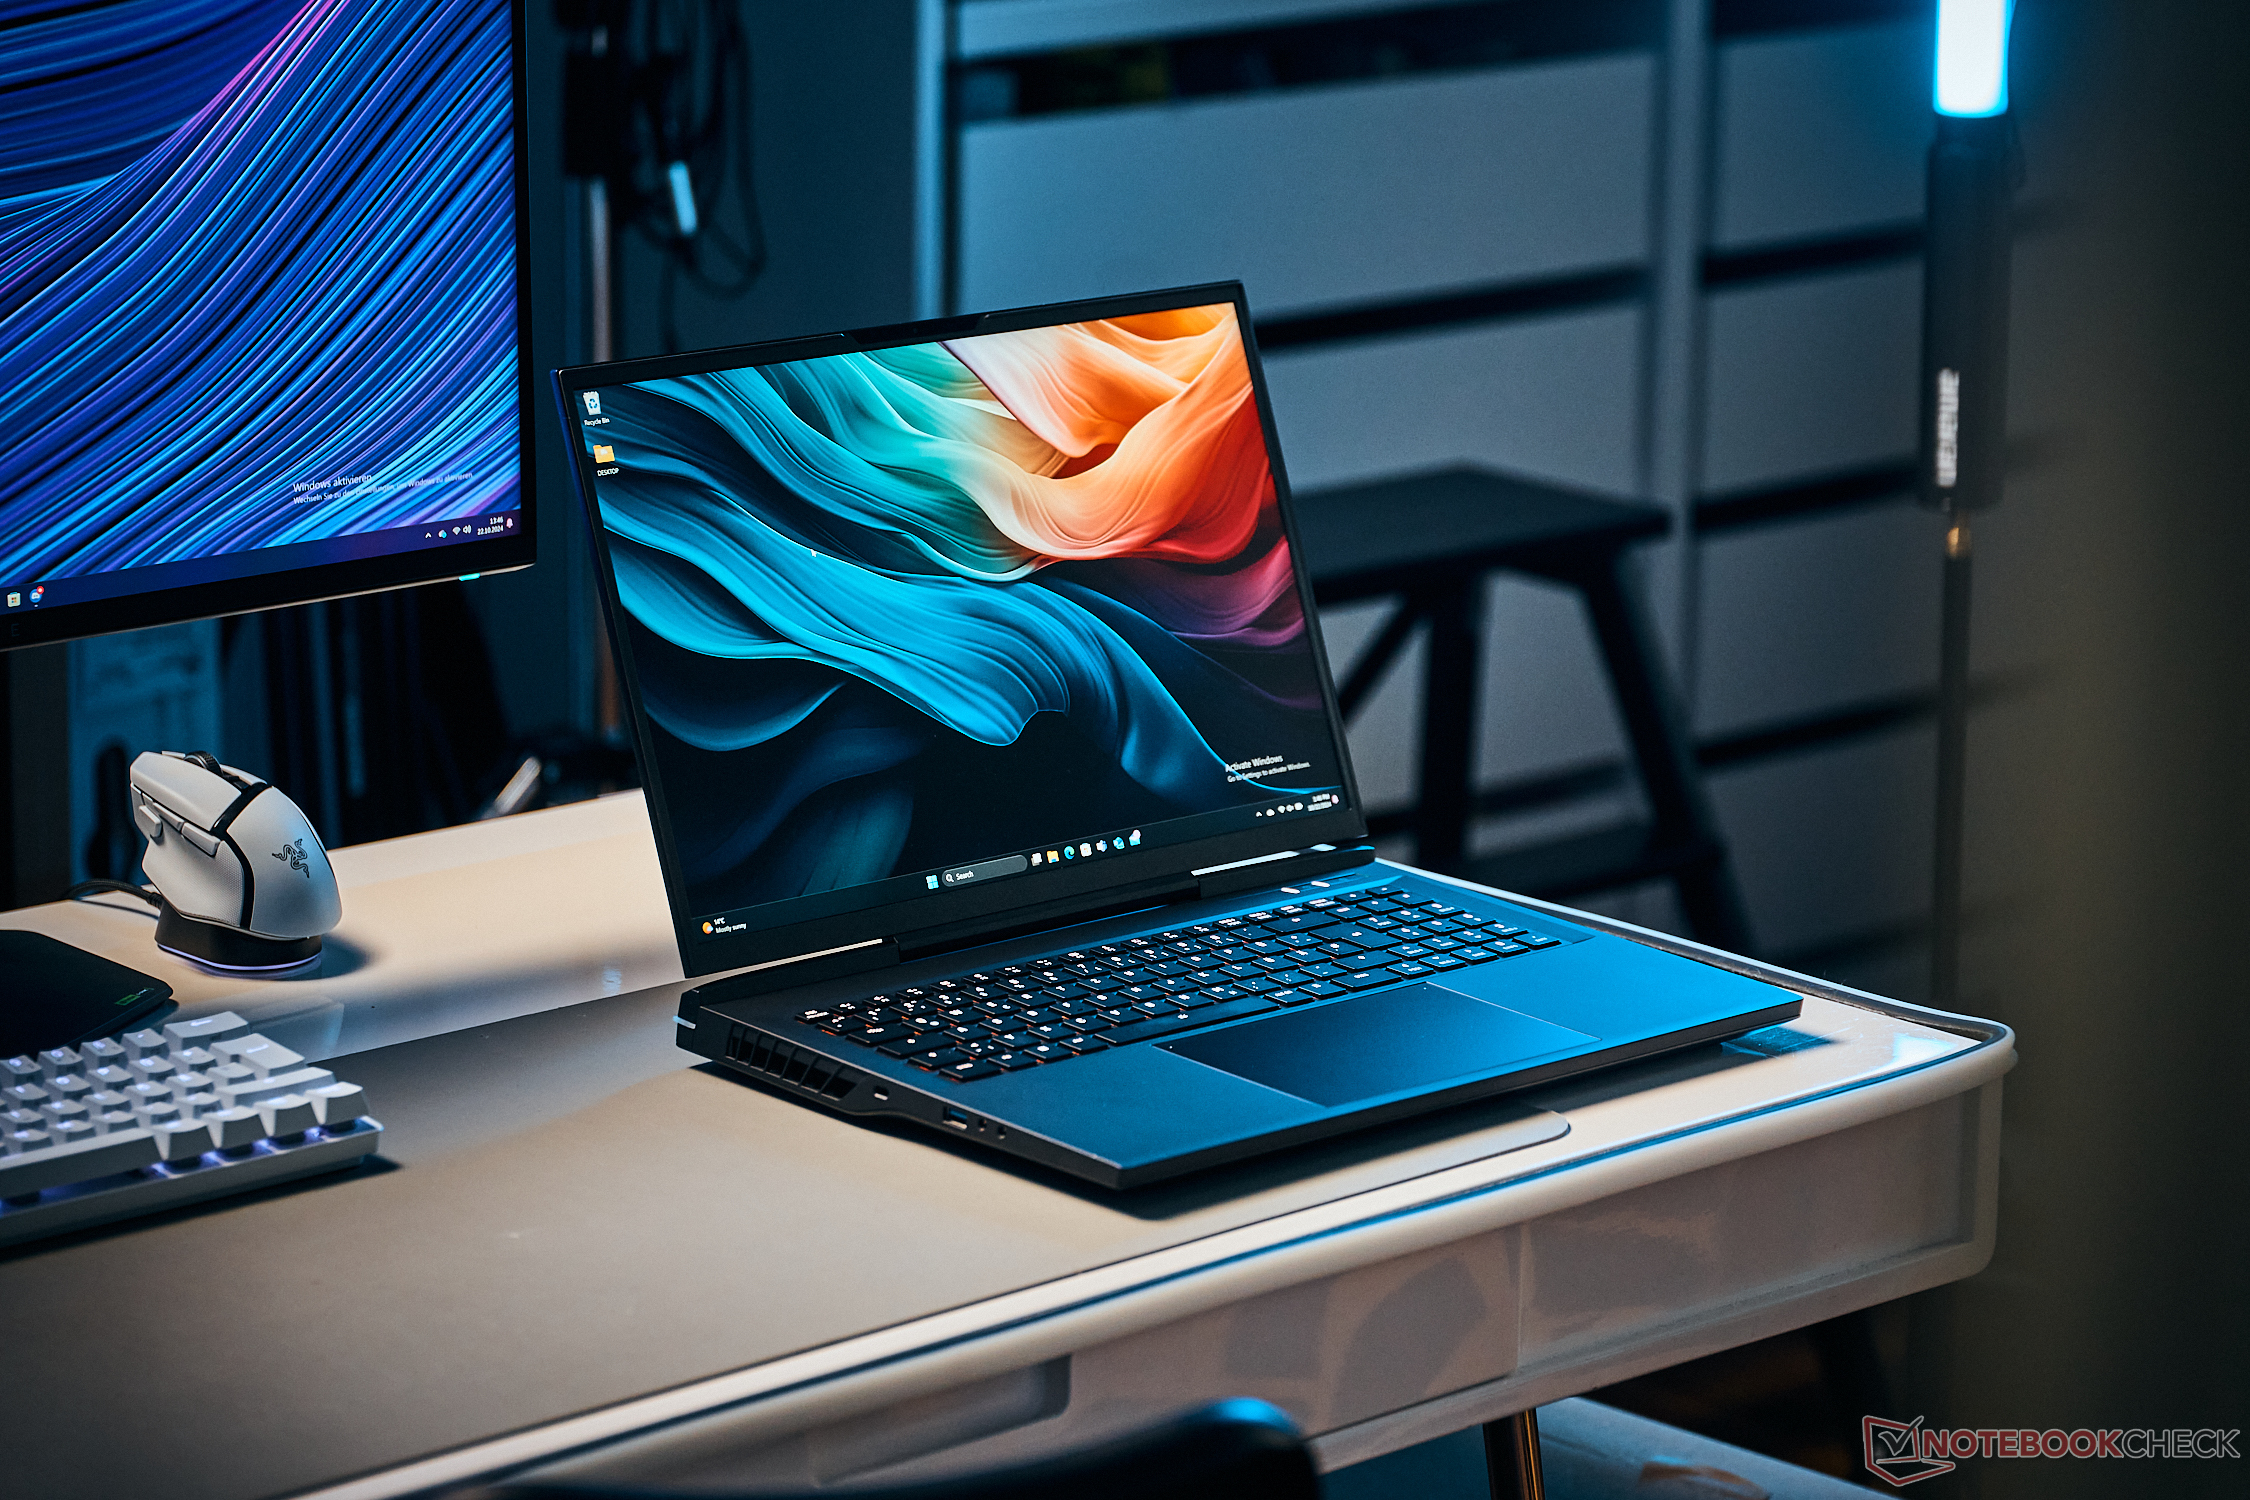
XMG Neo 17 E24 incelemesi - İsteğe bağlı su soğutmalı hızlı oyun dizüstü bilgisayarı
RTX 4080 dizüstü bilgisayar ve mekanik klavye.
XMG Neo 17 ile piyasadaki en hızlı bileşenlerle donatılabilen safkan bir oyuncuya sahip olursunuz. Mekanik Cherry klavye ve harici su soğutma sistemi de opsiyonel olarak sunuluyor, bu da sadece sıcaklıkları değil aynı zamanda arka plan gürültüsünü de azaltıyor.Andreas Osthoff, 👁 Andreas Osthoff (Çeviren DeepL / Ninh Duy) Yayınlandı 🇺🇸 🇩🇪 ...
Karar - XMG Neo 17 oyun performansına odaklanıyor
XMG Neo 17, testte bileşenlerin maksimum performansına odaklanan güçlü bir oyun dizüstü bilgisayarı olarak kendini gösteriyor. Intel Core i9-14900HX tüm konfigürasyonlarda işlemci olarak kullanılırken, özel Nvidia GPU'lar hız aşırtılabiliyor. Sonuç, bugüne kadar test ettiğimiz en hızlı RTX 4080 dizüstü bilgisayarlardan biri. Bu, oyun oynamak için de çok uygun olan hızlı 240 Hz QHD panel için yeterli performans sağlar. İsteğe bağlı harici Oasis su soğutma devresi geliştirildi ve artık işlemciyi de kapsıyor. Sonuç, önemli ölçüde daha düşük sıcaklıklar ve dolayısıyla oyun oynarken daha düşük gürültü seviyesidir.
Oyuncu bilgisayarı diğer alanlarda da iyi bir performans sergiliyor: yeterli sayıda bağlantı noktası mevcut, kasa kaliteli ve opsiyonel mekanik Cherry klavye çok iyi ama aynı zamanda çok gürültülü. RAM/SSD kapasitesi de yapılandırılabilir ve daha sonraki bir tarihte yükseltme yapmak sorun olmaz. 17 inçlik dizüstü bilgisayar nispeten büyük ve 3 kg'ın biraz altında hafif değil. Soğutma ünitesi Oasis su soğutması olmadan da iyi bir iş çıkarıyor, ancak oyun oynarken fanlar çok gürültülü oluyor ve kulaklık kullanmanız gerekiyor.
Fiyat açısından, 3.000 Euro'dan fazlası elbette pazarlık değildir, ancak bunun nedeni esas olarak GeForce GPU'dur. Safkan bir oyuncu arıyorsanız ve su soğutmadan da yararlanmak istiyorsanız, XMG Neo 17 kesinlikle iyi bir seçimdir.
Artılar
Eksiler
Fiyat ve bulunabilirlik
Schenker Neo 17 E24 yapılandırılabilir ve doğrudan Bestware'den sipariş edilebilir. Başlangıç fiyatı RTX 4060 dizüstü bilgisayar ile yapılandırma için 1.949 Euro ve RTX 4080 dizüstü bilgisayar için 2.924 Euro'dur.
Karşılaştırılan olası alternatifler
Resim | Modeli / incelemeler | Geizhals | Ağırlık | Yükseklik | Ekran |
|---|---|---|---|---|---|
| SCHENKER XMG Neo 17 E24 Intel Core i9-14900HX ⎘ NVIDIA GeForce RTX 4080 Laptop GPU ⎘ 32 GB Bellek, 1024 GB SSD | Listenpreis 3189€ | 2.9 kg | 27 mm | 17.00" 2560x1600 178 PPI IPS | |
| Medion Erazer Beast X40 2024 Intel Core i9-14900HX ⎘ NVIDIA GeForce RTX 4090 Laptop GPU ⎘ 32 GB Bellek, 1024 GB SSD | Listenpreis 4000 Euro | 2.9 kg | 36 mm | 17.00" 2560x1600 178 PPI IPS | |
| HP Omen 17-db0079ng AMD Ryzen 7 8845HS ⎘ NVIDIA GeForce RTX 4070 Laptop GPU ⎘ 32 GB Bellek, 1024 GB SSD | Listenpreis 1900€ | 2.8 kg | 30.1 mm | 17.30" 2560x1440 170 PPI IPS | |
| Eurocom Raptor X17 Core i9-14900HX Intel Core i9-14900HX ⎘ NVIDIA GeForce RTX 4090 Laptop GPU ⎘ 32 GB Bellek, 2048 GB SSD | Listenpreis 4500 USD | 3.4 kg | 24.9 mm | 17.30" 3840x2160 255 PPI IPS | |
| MSI GE78HX 13VH-070US Intel Core i9-13950HX ⎘ NVIDIA GeForce RTX 4080 Laptop GPU ⎘ 32 GB Bellek, 2048 GB SSD | Listenpreis 3600 USD | 3 kg | 23 mm | 17.00" 2560x1600 178 PPI IPS |
Top 10
» Top 10 Multimedia Notebook listesi
» Top 10 oyun notebooku
» Top 10 bütçeye uygun Ofis/İş Notebook Listesi
» Top 10 Premium Ofis/İş notebookları
» Top 10 Çalışma istasyonu laptopları
» Top 10 Subnotebook listesi
» Top 10 Ultrabooklar
» En iyi 10 dönüştürülebilir modeli
» Seçimi en iyi 10 tablet
» Notebookcheck Top 10 Windows Tabletleri
» Top 10 Subnotebook listesi
» NotebookCheck tarafından incelenen en iyi Notebook ekranları
» Notebookcheck'in 500 Euro altındaki en iyi 10 Notebook listesi
» NotebookCheck tarafından seçilen 300 Euro altındaki en iyi 10 Notebook
» Notebookcheck'in 500 Euro altındaki en iyi 10 Notebook listesi
» Notebookcheck'in Top 10 akıllı telefon listesi
» Notebookcheck'in Top 10 hafif oyun notebookları
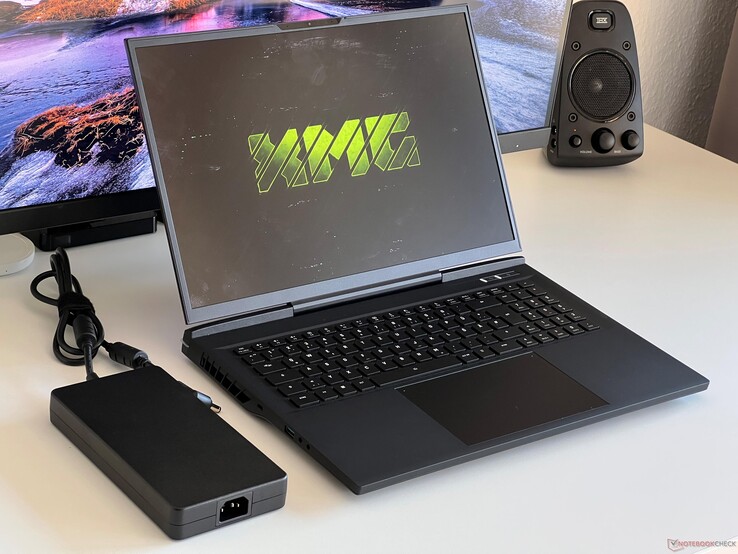
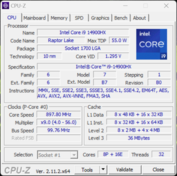
XMG Neo 17 E24 ile Schenker, 240 Hz QHD panele (G-Sync) sahip 17 inçlik güçlü bir oyun dizüstü bilgisayarı sunuyor. İşlemci her zaman Intel'in Core i9-14900HX'idir ve grafik kartı için aşağıdakiler arasında seçim yapabilirsiniz Nvidia GeForce RTX 4060 Dizüstü Bilgisayar ve diğer tüm modeller GeForce RTX 4090 dizüstü bilgisayar. RAM/SSD bellek kapsamlı bir şekilde yapılandırılabilir ve mekanik klavyeye ek olarak, dizüstü bilgisayarın soğutma kapasitesini önemli ölçüde artırabilen harici Oasis su soğutma sistemi de bir seçenek olarak mevcuttur.
Test cihazımız özel olarak tasarlanmış GeForce RTX 4080 dizüstü bilgisayar GPU, 32 GB RAM ve Samsung'dan 1 TB SSD, mekanik Cherry klavye dahil fiyatı 3,182 Euro'ya çıkarıyor (temel fiyat 1,948 Euro). Ayrıca Oasis su soğutma sistemi (199 €) ile birlikte RTX 4090 dizüstü bilgisayarlı Neo 17'nin bazı kıyaslamalarına da göz atıyoruz.
Teknik Özellikler
Kasa ve ekipman
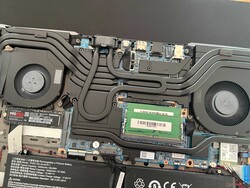
Siyah metal şasiye ve kauçuk taban ünitesine zaten aşinayız Medion Erazer Beastbu da aynı barebone'a dayanıyor. Arkada bir LED şerit ve kapakta bir XMG logosu var, ancak bunun dışında can sıkıcı üretici etiketleri yok. Genel stabilite çok iyi, ancak 2,9 kg'ın biraz altındaki ağırlığı ve 2,7 cm yüksekliği ile Neo 17 de hafif değil. Alt kasa kapağı nispeten kolay bir şekilde çıkarılabilir (su soğutma bağlantısındaki iki vidanın da gevşetilmesi gerekir) ve RAM, 2x M.2-2280 SSD veya WLAN modülü dahil olmak üzere tüm önemli bileşenlere erişebilirsiniz.
Yeterli USB bağlantı noktalarına ek olarak Thunderbolt 4 ve HDMI da mevcut olduğundan bağlantı yelpazesi çok geniştir. Kart okuyucu, referans kartımızla (Angelbird AV Pro V60) birlikte ortalama aktarım hızlarına ulaşıyor ve 1080p web kamerası yeterince keskin fotoğraflar çekiyor. Intel'in Wi-Fi 6E modülü (AX211) referans yönlendiricimizle birlikte çok iyi aktarım hızlarına ulaşıyor, ancak en son Wi-Fi 7 standardı henüz desteklenmiyor.
| SD Card Reader | |
| average JPG Copy Test (av. of 3 runs) | |
| Sınıf ortalaması Gaming (19 - 197.3, n=68, son 2 yıl) | |
| SCHENKER XMG Neo 17 E24 (Angelbird AV Pro V60) | |
| Medion Erazer Beast X40 2024 (AV PRO microSD 128 GB V60) | |
| MSI GE78HX 13VH-070US (Angelibird AV Pro V60) | |
| maximum AS SSD Seq Read Test (1GB) | |
| Sınıf ortalaması Gaming (25.8 - 263, n=67, son 2 yıl) | |
| Medion Erazer Beast X40 2024 (AV PRO microSD 128 GB V60) | |
| MSI GE78HX 13VH-070US (Angelibird AV Pro V60) | |
| SCHENKER XMG Neo 17 E24 (Angelbird AV Pro V60) | |
| Networking | |
| SCHENKER XMG Neo 17 E24 | |
| iperf3 transmit AXE11000 | |
| iperf3 receive AXE11000 | |
| Medion Erazer Beast X40 2024 | |
| iperf3 transmit AXE11000 | |
| iperf3 receive AXE11000 | |
| HP Omen 17-db0079ng | |
| iperf3 transmit AXE11000 | |
| iperf3 receive AXE11000 | |
| Eurocom Raptor X17 Core i9-14900HX | |
| iperf3 transmit AXE11000 | |
| iperf3 receive AXE11000 | |
| iperf3 transmit AXE11000 6GHz | |
| iperf3 receive AXE11000 6GHz | |
| MSI GE78HX 13VH-070US | |
| iperf3 transmit AXE11000 | |
| iperf3 receive AXE11000 | |
| iperf3 transmit AXE11000 6GHz | |
| iperf3 receive AXE11000 6GHz | |

Giriş aygıtları - Mekanik Cherry klavye
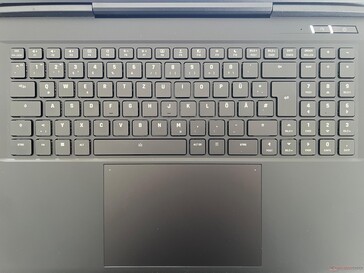
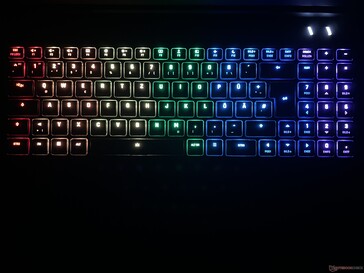
Neo 17, 4 aydınlatma bölgesine sahip geleneksel bir membran klavye veya ayrı tuş aydınlatmalı mekanik bir klavye (95 Euro ek ücret) ile sunulmaktadır. Test cihazımızda da Cherry'nin dokunsal anahtarları (MX ULP) kullanıldı. Bunlar adlarının hakkını veriyor ve çok dokunsal ve hassas bir yazma hissi sunuyor, ancak tuşlar aynı zamanda çok gürültülü. Seçiminizi yaparken bu kesinlikle göz önünde bulundurulmalıdır. Büyük cam ClickPad (15 x 9,5 cm) sorunsuz çalışıyor.
Ekran - 240 Hz ile QHD
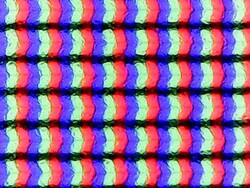
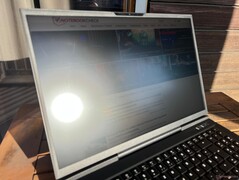
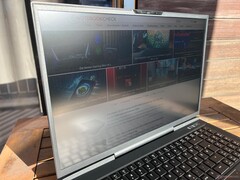
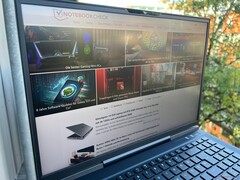
Mat yüzeyli 17 inç IPS ekran 2.560 x 1.600 piksel (16:10) çözünürlük sunar ve hızlı tepki süreleri ve 240 Hz frekansı sayesinde oyun oynamak için çok uygundur. Öznel görüntü kalitesi de çok iyi. PWM kullanılmıyor ve halelerle ilgili önemli bir sorun yok.
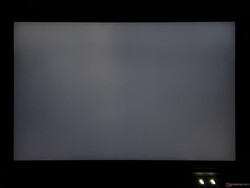
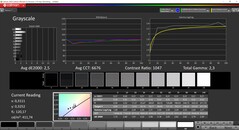
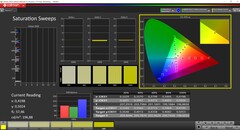
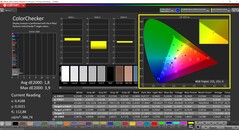
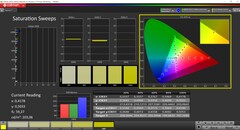
Ortalama parlaklık 400 cd/m² civarındadır, ancak siyah seviyesi 0,39 ile biraz daha yüksektir. Bu da 1.000:1'in biraz üzerinde bir maksimum kontrast oranıyla sonuçlanıyor ki bu da gayet iyi. Panel açık havada daha da parlak olmalı. Fabrika kalibrasyonu zaten çok iyi, ancak kalibrasyonumuzla ekranı daha da optimize edebiliriz. İlgili profil sağdaki kutudan ücretsiz olarak indirilebilir. Tam sRGB kapsamı ile birlikte panel, görüntüleri/videoları düzenlemek için de uygundur.
| |||||||||||||||||||||||||
Aydınlatma: 88 %
Batarya modunda parlaklık: 412 cd/m²
Kontrast: 1056:1 (Siyah: 0.39 cd/m²)
ΔE Color 1.8 | 0.5-29.43 Ø4.87, calibrated: 0.9
ΔE Greyscale 2.5 | 0.5-98 Ø5.1
69.6% AdobeRGB 1998 (Argyll 2.2.0 3D)
98.4% sRGB (Argyll 2.2.0 3D)
69% Display P3 (Argyll 2.2.0 3D)
Gamma: 2.3
| SCHENKER XMG Neo 17 E24 NE170QDM-NZ1, IPS, 2560x1600, 17", 240 Hz | Medion Erazer Beast X40 2024 BOE NE170QDM-NZ1, IPS, 2560x1600, 17", 240 Hz | HP Omen 17-db0079ng BOE0B67, IPS, 2560x1440, 17.3", 240 Hz | Eurocom Raptor X17 Core i9-14900HX BOE CQ NE173QUM-NY1, IPS, 3840x2160, 17.3", 144 Hz | MSI GE78HX 13VH-070US AU Optronics B170QAN01.2, IPS, 2560x1600, 17", 240 Hz | |
|---|---|---|---|---|---|
| Display | -0% | -3% | 20% | 22% | |
| Display P3 Coverage | 69 | 68.1 -1% | 66.2 -4% | 95.9 39% | 97.6 41% |
| sRGB Coverage | 98.4 | 99.5 1% | 95.5 -3% | 99.8 1% | 99.9 2% |
| AdobeRGB 1998 Coverage | 69.6 | 69 -1% | 68.1 -2% | 84.2 21% | 86.5 24% |
| Response Times | 4% | -17% | -40% | 38% | |
| Response Time Grey 50% / Grey 80% * | 12.1 ? | 11.7 ? 3% | 14.4 ? -19% | 14.8 ? -22% | 4.2 ? 65% |
| Response Time Black / White * | 7.2 ? | 6.9 ? 4% | 8.3 ? -15% | 11.4 ? -58% | 6.4 ? 11% |
| PWM Frequency | |||||
| Screen | 14% | -9% | -25% | -51% | |
| Brightness middle | 412 | 422 2% | 363 -12% | 544.6 32% | 398.6 -3% |
| Brightness | 401 | 388 -3% | 341 -15% | 507 26% | 384 -4% |
| Brightness Distribution | 88 | 87 -1% | 84 -5% | 77 -12% | 89 1% |
| Black Level * | 0.39 | 0.42 -8% | 0.38 3% | 0.48 -23% | 0.46 -18% |
| Contrast | 1056 | 1005 -5% | 955 -10% | 1135 7% | 867 -18% |
| Colorchecker dE 2000 * | 1.8 | 1.42 21% | 1.74 3% | 3.38 -88% | 4.05 -125% |
| Colorchecker dE 2000 max. * | 3.9 | 1.97 49% | 5.39 -38% | 7.13 -83% | 8.68 -123% |
| Colorchecker dE 2000 calibrated * | 0.9 | 0.7 22% | 1.43 -59% | 1.03 -14% | 1.02 -13% |
| Greyscale dE 2000 * | 2.5 | 1.2 52% | 1.3 48% | 4.3 -72% | 6.5 -160% |
| Gamma | 2.3 96% | 2.078 106% | 2.235 98% | 2.42 91% | 2.11 104% |
| CCT | 6676 97% | 6581 99% | 6346 102% | 7356 88% | 7518 86% |
| Toplam Ortalama (Program / Ayarlar) | 6% /
10% | -10% /
-9% | -15% /
-18% | 3% /
-23% |
* ... daha küçük daha iyidir
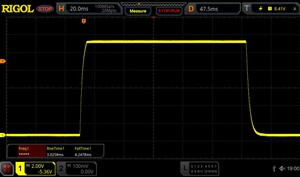
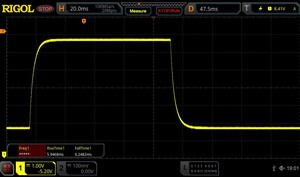
Yanıt Sürelerini Görüntüle
| ↔ Tepki Süresi Siyahtan Beyaza | ||
|---|---|---|
| 7.2 ms ... yükseliş ↗ ve sonbahar↘ birleşimi | ↗ 3 ms yükseliş | |
| ↘ 4.2 ms sonbahar | ||
| Ekran, testlerimizde çok hızlı yanıt oranları gösteriyor ve hızlı oyun oynamaya çok uygun olmalı. Karşılaştırıldığında, test edilen tüm cihazlar 0.1 (minimum) ile 240 (maksimum) ms arasında değişir. » Tüm cihazların 18 %'si daha iyi. Bu, ölçülen yanıt süresinin test edilen tüm cihazların ortalamasından (20.8 ms) daha iyi olduğu anlamına gelir. | ||
| ↔ Tepki Süresi %50 Griden %80 Griye | ||
| 12.1 ms ... yükseliş ↗ ve sonbahar↘ birleşimi | ↗ 5.9 ms yükseliş | |
| ↘ 6.2 ms sonbahar | ||
| Ekran, testlerimizde iyi yanıt oranları gösteriyor ancak rekabetçi oyuncular için çok yavaş olabilir. Karşılaştırıldığında, test edilen tüm cihazlar 0.165 (minimum) ile 636 (maksimum) ms arasında değişir. » Tüm cihazların 23 %'si daha iyi. Bu, ölçülen yanıt süresinin test edilen tüm cihazların ortalamasından (32.5 ms) daha iyi olduğu anlamına gelir. | ||
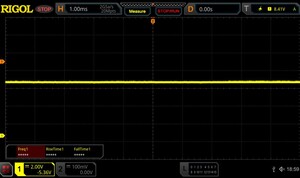
Ekran Titremesi / PWM (Darbe Genişliği Modülasyonu)
| Ekran titriyor / PWM algılanmadı | |||
Karşılaştırıldığında: Test edilen tüm cihazların %53 %'si ekranı karartmak için PWM kullanmıyor. PWM tespit edilirse, ortalama 8516 (minimum: 5 - maksimum: 343500) Hz ölçüldü. | |||
Performans - Raptor Lake-HX
Neo 17 özel olarak şu özelliklerle donatılmıştır Intel Core i9-14900HX. standart olarak 16 GB RAM takılıdır, ancak iki SO-DIMM yuvası sayesinde 96 GB'a kadar mümkündür (ek ücret 260 Euro).
Test koşulları
XMG Neo 17, aşağıdaki tabloda özetlediğimiz çeşitli enerji profilleri sunmaktadır. Enthusiast moduna kıyasla gürültü farkı az olduğundan, kıyaslamalarımız ve ölçümlerimiz için Overboost modunu kullandık. Üretici ayrıca bir Deep Dive neo 17 ve enerji profilleri hakkında daha fazla teknik arka plan bilgisi için.
| Enerji profili | CPU TDP | CB R23 Multi | GPU TDP | Time Spy Grafik | CP 2077 Ultra QHD | Maks. fan hacmi |
|---|---|---|---|---|---|---|
| Dengeli | 45 W | 14.899 puan | 130 W | 10.778 puan | 73,9 FPS | 43,1 dB(A) |
| Meraklı | 75 W | 22.027 puan | 150 W | 18.021 puan | 78,6 FPS | 49,9 dB(A) |
| Overboost | 160/140 W | 31.740 puan | 175 W | 19.155 puan | 80,7 FPS | 51,9 dB(A) |
İşlemci - Core i9-14900HX
Intel Core i9-14900HX hala en hızlı mobil işlemcilerden biridir ve yaklaşan Arrow Lake yongaları ile bu durumun değişmesi pek olası değildir. İşlemcinin güç dağıtımı mükemmeldir, kısa süreler için 160 watt ve sürekli olarak 140 watt tüketebilir. Kullanıcı için bu çok yüksek ve sabit performans anlamına geliyor. Ancak, CPU'nun maksimum 35 watt tüketmesine izin verildiği için pil modunda önemli kayıplar beklenmelidir, bu da çok çekirdekli testlerde performansta %65'lik bir düşüşe karşılık gelir. Diğer CPU kıyaslamaları şurada mevcuttur teknoloji̇ bölümümüz.
Cinebench R15 Multi loop
Cinebench R23: Multi Core | Single Core
Cinebench R20: CPU (Multi Core) | CPU (Single Core)
Cinebench R15: CPU Multi 64Bit | CPU Single 64Bit
Blender: v2.79 BMW27 CPU
7-Zip 18.03: 7z b 4 | 7z b 4 -mmt1
Geekbench 6.4: Multi-Core | Single-Core
Geekbench 5.5: Multi-Core | Single-Core
HWBOT x265 Benchmark v2.2: 4k Preset
LibreOffice : 20 Documents To PDF
R Benchmark 2.5: Overall mean
| CPU Performance Rating | |
| SCHENKER XMG Neo 17 E24 | |
| MSI GE78HX 13VH-070US -2! | |
| Ortalama Intel Core i9-14900HX | |
| Eurocom Raptor X17 Core i9-14900HX | |
| Medion Erazer Beast X40 2024 | |
| Sınıf ortalaması Gaming | |
| HP Omen 17-db0079ng | |
| Cinebench R23 / Multi Core | |
| MSI GE78HX 13VH-070US | |
| SCHENKER XMG Neo 17 E24 | |
| Eurocom Raptor X17 Core i9-14900HX | |
| Ortalama Intel Core i9-14900HX (17078 - 36249, n=37) | |
| Medion Erazer Beast X40 2024 | |
| Sınıf ortalaması Gaming (5668 - 39652, n=151, son 2 yıl) | |
| HP Omen 17-db0079ng | |
| Cinebench R23 / Single Core | |
| SCHENKER XMG Neo 17 E24 | |
| Medion Erazer Beast X40 2024 | |
| Ortalama Intel Core i9-14900HX (1720 - 2245, n=37) | |
| MSI GE78HX 13VH-070US | |
| Eurocom Raptor X17 Core i9-14900HX | |
| Sınıf ortalaması Gaming (1136 - 2252, n=151, son 2 yıl) | |
| HP Omen 17-db0079ng | |
| Cinebench R20 / CPU (Multi Core) | |
| MSI GE78HX 13VH-070US | |
| SCHENKER XMG Neo 17 E24 | |
| Eurocom Raptor X17 Core i9-14900HX | |
| Ortalama Intel Core i9-14900HX (6579 - 13832, n=37) | |
| Medion Erazer Beast X40 2024 | |
| Sınıf ortalaması Gaming (2179 - 15517, n=151, son 2 yıl) | |
| HP Omen 17-db0079ng | |
| Cinebench R20 / CPU (Single Core) | |
| SCHENKER XMG Neo 17 E24 | |
| Medion Erazer Beast X40 2024 | |
| Ortalama Intel Core i9-14900HX (657 - 859, n=37) | |
| Eurocom Raptor X17 Core i9-14900HX | |
| MSI GE78HX 13VH-070US | |
| Sınıf ortalaması Gaming (439 - 866, n=151, son 2 yıl) | |
| HP Omen 17-db0079ng | |
| Cinebench R15 / CPU Multi 64Bit | |
| MSI GE78HX 13VH-070US | |
| SCHENKER XMG Neo 17 E24 | |
| Eurocom Raptor X17 Core i9-14900HX | |
| Ortalama Intel Core i9-14900HX (3263 - 5589, n=38) | |
| Sınıf ortalaması Gaming (905 - 6074, n=154, son 2 yıl) | |
| Medion Erazer Beast X40 2024 | |
| HP Omen 17-db0079ng | |
| Cinebench R15 / CPU Single 64Bit | |
| SCHENKER XMG Neo 17 E24 | |
| Medion Erazer Beast X40 2024 | |
| Ortalama Intel Core i9-14900HX (247 - 323, n=37) | |
| MSI GE78HX 13VH-070US | |
| Eurocom Raptor X17 Core i9-14900HX | |
| Sınıf ortalaması Gaming (191.9 - 343, n=151, son 2 yıl) | |
| HP Omen 17-db0079ng | |
| Blender / v2.79 BMW27 CPU | |
| HP Omen 17-db0079ng | |
| Sınıf ortalaması Gaming (81 - 555, n=144, son 2 yıl) | |
| Medion Erazer Beast X40 2024 | |
| Ortalama Intel Core i9-14900HX (91 - 206, n=37) | |
| Eurocom Raptor X17 Core i9-14900HX | |
| SCHENKER XMG Neo 17 E24 | |
| MSI GE78HX 13VH-070US | |
| 7-Zip 18.03 / 7z b 4 | |
| MSI GE78HX 13VH-070US | |
| SCHENKER XMG Neo 17 E24 | |
| Eurocom Raptor X17 Core i9-14900HX | |
| Ortalama Intel Core i9-14900HX (66769 - 136645, n=37) | |
| Medion Erazer Beast X40 2024 | |
| Sınıf ortalaması Gaming (23795 - 144064, n=149, son 2 yıl) | |
| HP Omen 17-db0079ng | |
| 7-Zip 18.03 / 7z b 4 -mmt1 | |
| Medion Erazer Beast X40 2024 | |
| SCHENKER XMG Neo 17 E24 | |
| MSI GE78HX 13VH-070US | |
| Ortalama Intel Core i9-14900HX (5452 - 7545, n=37) | |
| Eurocom Raptor X17 Core i9-14900HX | |
| Sınıf ortalaması Gaming (4199 - 7573, n=149, son 2 yıl) | |
| HP Omen 17-db0079ng | |
| Geekbench 6.4 / Multi-Core | |
| SCHENKER XMG Neo 17 E24 | |
| Eurocom Raptor X17 Core i9-14900HX | |
| Ortalama Intel Core i9-14900HX (13158 - 19665, n=37) | |
| Medion Erazer Beast X40 2024 | |
| Sınıf ortalaması Gaming (5340 - 21668, n=119, son 2 yıl) | |
| HP Omen 17-db0079ng | |
| Geekbench 6.4 / Single-Core | |
| Medion Erazer Beast X40 2024 | |
| SCHENKER XMG Neo 17 E24 | |
| Ortalama Intel Core i9-14900HX (2419 - 3129, n=37) | |
| Eurocom Raptor X17 Core i9-14900HX | |
| Sınıf ortalaması Gaming (1490 - 3219, n=119, son 2 yıl) | |
| HP Omen 17-db0079ng | |
| Geekbench 5.5 / Multi-Core | |
| MSI GE78HX 13VH-070US | |
| SCHENKER XMG Neo 17 E24 | |
| Ortalama Intel Core i9-14900HX (8618 - 23194, n=37) | |
| Medion Erazer Beast X40 2024 | |
| Sınıf ortalaması Gaming (4557 - 25855, n=148, son 2 yıl) | |
| HP Omen 17-db0079ng | |
| Eurocom Raptor X17 Core i9-14900HX | |
| Geekbench 5.5 / Single-Core | |
| Medion Erazer Beast X40 2024 | |
| SCHENKER XMG Neo 17 E24 | |
| MSI GE78HX 13VH-070US | |
| Ortalama Intel Core i9-14900HX (1669 - 2210, n=37) | |
| Sınıf ortalaması Gaming (986 - 2423, n=148, son 2 yıl) | |
| HP Omen 17-db0079ng | |
| Eurocom Raptor X17 Core i9-14900HX | |
| HWBOT x265 Benchmark v2.2 / 4k Preset | |
| MSI GE78HX 13VH-070US | |
| Eurocom Raptor X17 Core i9-14900HX | |
| SCHENKER XMG Neo 17 E24 | |
| Ortalama Intel Core i9-14900HX (16.8 - 38.9, n=37) | |
| Medion Erazer Beast X40 2024 | |
| Sınıf ortalaması Gaming (6.72 - 42.9, n=148, son 2 yıl) | |
| HP Omen 17-db0079ng | |
| LibreOffice / 20 Documents To PDF | |
| HP Omen 17-db0079ng | |
| Sınıf ortalaması Gaming (19 - 96.6, n=147, son 2 yıl) | |
| MSI GE78HX 13VH-070US | |
| Medion Erazer Beast X40 2024 | |
| Ortalama Intel Core i9-14900HX (19 - 85.1, n=37) | |
| SCHENKER XMG Neo 17 E24 | |
| Eurocom Raptor X17 Core i9-14900HX | |
| R Benchmark 2.5 / Overall mean | |
| HP Omen 17-db0079ng | |
| Sınıf ortalaması Gaming (0.3609 - 0.759, n=150, son 2 yıl) | |
| Ortalama Intel Core i9-14900HX (0.3604 - 0.4859, n=37) | |
| Eurocom Raptor X17 Core i9-14900HX | |
| MSI GE78HX 13VH-070US | |
| SCHENKER XMG Neo 17 E24 | |
| Medion Erazer Beast X40 2024 | |
* ... daha küçük daha iyidir
AIDA64: FP32 Ray-Trace | FPU Julia | CPU SHA3 | CPU Queen | FPU SinJulia | FPU Mandel | CPU AES | CPU ZLib | FP64 Ray-Trace | CPU PhotoWorxx
| Performance Rating | |
| Eurocom Raptor X17 Core i9-14900HX | |
| SCHENKER XMG Neo 17 E24 | |
| MSI GE78HX 13VH-070US | |
| Ortalama Intel Core i9-14900HX | |
| HP Omen 17-db0079ng | |
| Medion Erazer Beast X40 2024 | |
| Sınıf ortalaması Gaming | |
| AIDA64 / FP32 Ray-Trace | |
| SCHENKER XMG Neo 17 E24 | |
| MSI GE78HX 13VH-070US | |
| Eurocom Raptor X17 Core i9-14900HX | |
| HP Omen 17-db0079ng | |
| Ortalama Intel Core i9-14900HX (13098 - 33474, n=36) | |
| Sınıf ortalaması Gaming (4986 - 81639, n=147, son 2 yıl) | |
| Medion Erazer Beast X40 2024 | |
| AIDA64 / FPU Julia | |
| SCHENKER XMG Neo 17 E24 | |
| MSI GE78HX 13VH-070US | |
| Eurocom Raptor X17 Core i9-14900HX | |
| Ortalama Intel Core i9-14900HX (67573 - 166040, n=36) | |
| HP Omen 17-db0079ng | |
| Sınıf ortalaması Gaming (25360 - 252486, n=147, son 2 yıl) | |
| Medion Erazer Beast X40 2024 | |
| AIDA64 / CPU SHA3 | |
| Eurocom Raptor X17 Core i9-14900HX | |
| SCHENKER XMG Neo 17 E24 | |
| MSI GE78HX 13VH-070US | |
| Ortalama Intel Core i9-14900HX (3589 - 7979, n=36) | |
| Medion Erazer Beast X40 2024 | |
| Sınıf ortalaması Gaming (1339 - 10389, n=147, son 2 yıl) | |
| HP Omen 17-db0079ng | |
| AIDA64 / CPU Queen | |
| Eurocom Raptor X17 Core i9-14900HX | |
| SCHENKER XMG Neo 17 E24 | |
| MSI GE78HX 13VH-070US | |
| Ortalama Intel Core i9-14900HX (118405 - 148966, n=36) | |
| Medion Erazer Beast X40 2024 | |
| HP Omen 17-db0079ng | |
| Sınıf ortalaması Gaming (50699 - 200651, n=147, son 2 yıl) | |
| AIDA64 / FPU SinJulia | |
| MSI GE78HX 13VH-070US | |
| SCHENKER XMG Neo 17 E24 | |
| Eurocom Raptor X17 Core i9-14900HX | |
| Ortalama Intel Core i9-14900HX (10475 - 18517, n=36) | |
| HP Omen 17-db0079ng | |
| Medion Erazer Beast X40 2024 | |
| Sınıf ortalaması Gaming (4800 - 32988, n=147, son 2 yıl) | |
| AIDA64 / FPU Mandel | |
| SCHENKER XMG Neo 17 E24 | |
| MSI GE78HX 13VH-070US | |
| Eurocom Raptor X17 Core i9-14900HX | |
| Ortalama Intel Core i9-14900HX (32543 - 83662, n=36) | |
| HP Omen 17-db0079ng | |
| Sınıf ortalaması Gaming (12321 - 134044, n=147, son 2 yıl) | |
| Medion Erazer Beast X40 2024 | |
| AIDA64 / CPU AES | |
| Eurocom Raptor X17 Core i9-14900HX | |
| Ortalama Intel Core i9-14900HX (86964 - 241777, n=36) | |
| SCHENKER XMG Neo 17 E24 | |
| MSI GE78HX 13VH-070US | |
| Sınıf ortalaması Gaming (19065 - 328679, n=147, son 2 yıl) | |
| Medion Erazer Beast X40 2024 | |
| HP Omen 17-db0079ng | |
| AIDA64 / CPU ZLib | |
| MSI GE78HX 13VH-070US | |
| Eurocom Raptor X17 Core i9-14900HX | |
| SCHENKER XMG Neo 17 E24 | |
| Ortalama Intel Core i9-14900HX (1054 - 2292, n=36) | |
| Medion Erazer Beast X40 2024 | |
| Sınıf ortalaması Gaming (373 - 2531, n=147, son 2 yıl) | |
| HP Omen 17-db0079ng | |
| AIDA64 / FP64 Ray-Trace | |
| MSI GE78HX 13VH-070US | |
| SCHENKER XMG Neo 17 E24 | |
| Eurocom Raptor X17 Core i9-14900HX | |
| HP Omen 17-db0079ng | |
| Ortalama Intel Core i9-14900HX (6809 - 18349, n=36) | |
| Sınıf ortalaması Gaming (2540 - 43430, n=147, son 2 yıl) | |
| Medion Erazer Beast X40 2024 | |
| AIDA64 / CPU PhotoWorxx | |
| Eurocom Raptor X17 Core i9-14900HX | |
| MSI GE78HX 13VH-070US | |
| SCHENKER XMG Neo 17 E24 | |
| Medion Erazer Beast X40 2024 | |
| Ortalama Intel Core i9-14900HX (23903 - 54702, n=36) | |
| HP Omen 17-db0079ng | |
| Sınıf ortalaması Gaming (10805 - 60161, n=147, son 2 yıl) | |
Sistem performansı
Neo 17, sentetik sistem kıyaslamalarında da etkileyici, ancak burada rekabet genellikle çok yakın. Günlük kullanımda bu, grafik kartını değiştirirken kısa bir takılma olsa da son derece duyarlı bir sistem anlamına geliyor. Ancak, bu tamamen normaldir ve iGPU'yu tamamen devre dışı bırakarak önlenebilir.
CrossMark: Overall | Productivity | Creativity | Responsiveness
WebXPRT 3: Overall
WebXPRT 4: Overall
Mozilla Kraken 1.1: Total
| PCMark 10 / Score | |
| Medion Erazer Beast X40 2024 | |
| MSI GE78HX 13VH-070US | |
| Ortalama Intel Core i9-14900HX, NVIDIA GeForce RTX 4080 Laptop GPU (7703 - 9223, n=7) | |
| SCHENKER XMG Neo 17 E24 | |
| Sınıf ortalaması Gaming (5776 - 9852, n=133, son 2 yıl) | |
| HP Omen 17-db0079ng | |
| PCMark 10 / Essentials | |
| Ortalama Intel Core i9-14900HX, NVIDIA GeForce RTX 4080 Laptop GPU (11255 - 12600, n=7) | |
| MSI GE78HX 13VH-070US | |
| SCHENKER XMG Neo 17 E24 | |
| Medion Erazer Beast X40 2024 | |
| Sınıf ortalaması Gaming (9057 - 12600, n=133, son 2 yıl) | |
| HP Omen 17-db0079ng | |
| PCMark 10 / Productivity | |
| Medion Erazer Beast X40 2024 | |
| SCHENKER XMG Neo 17 E24 | |
| MSI GE78HX 13VH-070US | |
| Ortalama Intel Core i9-14900HX, NVIDIA GeForce RTX 4080 Laptop GPU (6662 - 11410, n=7) | |
| HP Omen 17-db0079ng | |
| Sınıf ortalaması Gaming (6662 - 14612, n=133, son 2 yıl) | |
| PCMark 10 / Digital Content Creation | |
| Medion Erazer Beast X40 2024 | |
| MSI GE78HX 13VH-070US | |
| Ortalama Intel Core i9-14900HX, NVIDIA GeForce RTX 4080 Laptop GPU (14211 - 16246, n=7) | |
| SCHENKER XMG Neo 17 E24 | |
| Sınıf ortalaması Gaming (6807 - 18475, n=133, son 2 yıl) | |
| HP Omen 17-db0079ng | |
| CrossMark / Overall | |
| Eurocom Raptor X17 Core i9-14900HX | |
| Ortalama Intel Core i9-14900HX, NVIDIA GeForce RTX 4080 Laptop GPU (1992 - 2334, n=7) | |
| Medion Erazer Beast X40 2024 | |
| SCHENKER XMG Neo 17 E24 | |
| MSI GE78HX 13VH-070US | |
| Sınıf ortalaması Gaming (1247 - 2344, n=114, son 2 yıl) | |
| HP Omen 17-db0079ng | |
| CrossMark / Productivity | |
| Eurocom Raptor X17 Core i9-14900HX | |
| Medion Erazer Beast X40 2024 | |
| Ortalama Intel Core i9-14900HX, NVIDIA GeForce RTX 4080 Laptop GPU (1812 - 2204, n=7) | |
| MSI GE78HX 13VH-070US | |
| SCHENKER XMG Neo 17 E24 | |
| Sınıf ortalaması Gaming (1299 - 2204, n=114, son 2 yıl) | |
| HP Omen 17-db0079ng | |
| CrossMark / Creativity | |
| Ortalama Intel Core i9-14900HX, NVIDIA GeForce RTX 4080 Laptop GPU (2327 - 2500, n=7) | |
| SCHENKER XMG Neo 17 E24 | |
| Eurocom Raptor X17 Core i9-14900HX | |
| Medion Erazer Beast X40 2024 | |
| Sınıf ortalaması Gaming (1275 - 2660, n=114, son 2 yıl) | |
| MSI GE78HX 13VH-070US | |
| HP Omen 17-db0079ng | |
| CrossMark / Responsiveness | |
| Eurocom Raptor X17 Core i9-14900HX | |
| Ortalama Intel Core i9-14900HX, NVIDIA GeForce RTX 4080 Laptop GPU (1520 - 2254, n=7) | |
| Medion Erazer Beast X40 2024 | |
| Sınıf ortalaması Gaming (1030 - 2330, n=114, son 2 yıl) | |
| MSI GE78HX 13VH-070US | |
| SCHENKER XMG Neo 17 E24 | |
| HP Omen 17-db0079ng | |
| WebXPRT 3 / Overall | |
| Eurocom Raptor X17 Core i9-14900HX | |
| SCHENKER XMG Neo 17 E24 | |
| Ortalama Intel Core i9-14900HX, NVIDIA GeForce RTX 4080 Laptop GPU (310 - 345, n=7) | |
| Medion Erazer Beast X40 2024 | |
| MSI GE78HX 13VH-070US | |
| Sınıf ortalaması Gaming (215 - 480, n=127, son 2 yıl) | |
| HP Omen 17-db0079ng | |
| WebXPRT 4 / Overall | |
| SCHENKER XMG Neo 17 E24 | |
| Ortalama Intel Core i9-14900HX, NVIDIA GeForce RTX 4080 Laptop GPU (300 - 321, n=7) | |
| Eurocom Raptor X17 Core i9-14900HX | |
| Medion Erazer Beast X40 2024 | |
| MSI GE78HX 13VH-070US | |
| Sınıf ortalaması Gaming (176.4 - 335, n=115, son 2 yıl) | |
| Mozilla Kraken 1.1 / Total | |
| HP Omen 17-db0079ng | |
| Sınıf ortalaması Gaming (409 - 674, n=139, son 2 yıl) | |
| MSI GE78HX 13VH-070US | |
| Eurocom Raptor X17 Core i9-14900HX | |
| Ortalama Intel Core i9-14900HX, NVIDIA GeForce RTX 4080 Laptop GPU (437 - 446, n=7) | |
| SCHENKER XMG Neo 17 E24 | |
| Medion Erazer Beast X40 2024 | |
* ... daha küçük daha iyidir
| PCMark 10 Score | 8694 puan | |
Yardım | ||
| AIDA64 / Memory Copy | |
| Medion Erazer Beast X40 2024 | |
| SCHENKER XMG Neo 17 E24 | |
| MSI GE78HX 13VH-070US | |
| Eurocom Raptor X17 Core i9-14900HX | |
| Ortalama Intel Core i9-14900HX (38028 - 83392, n=36) | |
| HP Omen 17-db0079ng | |
| Sınıf ortalaması Gaming (21750 - 97515, n=147, son 2 yıl) | |
| AIDA64 / Memory Read | |
| SCHENKER XMG Neo 17 E24 | |
| MSI GE78HX 13VH-070US | |
| Medion Erazer Beast X40 2024 | |
| Ortalama Intel Core i9-14900HX (43306 - 87568, n=36) | |
| Eurocom Raptor X17 Core i9-14900HX | |
| Sınıf ortalaması Gaming (22956 - 102937, n=147, son 2 yıl) | |
| HP Omen 17-db0079ng | |
| AIDA64 / Memory Write | |
| HP Omen 17-db0079ng | |
| Medion Erazer Beast X40 2024 | |
| SCHENKER XMG Neo 17 E24 | |
| MSI GE78HX 13VH-070US | |
| Eurocom Raptor X17 Core i9-14900HX | |
| Ortalama Intel Core i9-14900HX (37146 - 80589, n=36) | |
| Sınıf ortalaması Gaming (22297 - 108954, n=147, son 2 yıl) | |
| AIDA64 / Memory Latency | |
| HP Omen 17-db0079ng | |
| Sınıf ortalaması Gaming (59.5 - 259, n=147, son 2 yıl) | |
| Eurocom Raptor X17 Core i9-14900HX | |
| Ortalama Intel Core i9-14900HX (76.1 - 105, n=36) | |
| MSI GE78HX 13VH-070US | |
| SCHENKER XMG Neo 17 E24 | |
| Medion Erazer Beast X40 2024 | |
* ... daha küçük daha iyidir
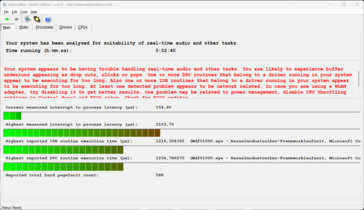
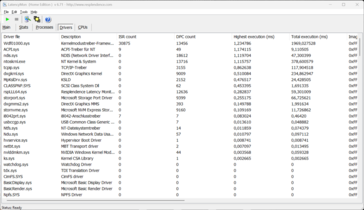
DPC gecikme süreleri
| DPC Latencies / LatencyMon - interrupt to process latency (max), Web, Youtube, Prime95 | |
| MSI GE78HX 13VH-070US | |
| SCHENKER XMG Neo 17 E24 | |
| HP Omen 17-db0079ng | |
| Medion Erazer Beast X40 2024 | |
| Eurocom Raptor X17 Core i9-14900HX | |
* ... daha küçük daha iyidir
Yığın depolama
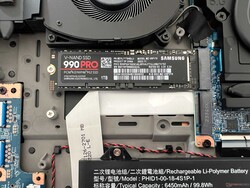
Neo 17, PCIe 4.0 x4 üzerinden bağlanan iki adet hızlı M.2-2280 yuvası sunmaktadır. Test cihazına, yüksek aktarım hızlarına ulaşan ve piyasadaki en hızlı SSD'lerden biri olan Samsung 990 Pro'nun 1 TB versiyonu takılmıştır. Ayrıca performans, sürekli yük altında bile tamamen sabit kalmaktadır. İlk çalıştırmadan sonra kullanıcının kullanımına 864 GB sunulur. Diğer SSD kıyaslamalarını bulabilirsiniz burada.
* ... daha küçük daha iyidir
Continuous read: DiskSpd Read Loop, Queue Depth 8
Grafik kartı
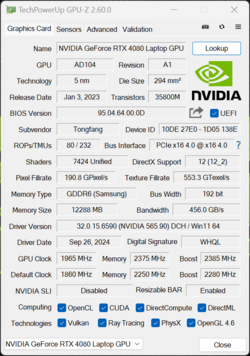
Test cihazımızda, özel Nvidia GeForce RTX 4080 Dizüstü Bilgisayar 12 GB VRAM ile yüklüdür. Grafik kartı maksimum 175 watt (150 watt TGP + 25 watt Dynamic Boost) tüketebilir, böylece Neo 17 GPU'yu tam olarak kullanabilir. Advanced Optimus grafik anahtarlama sayesinde oyun performansı olağanüstü ve RTX 4080 dizüstü bilgisayar doğal QHD çözünürlük için tamamen yeterli. Buna ek olarak, performans sürekli yük altında bile tamamen sabit kalıyor.
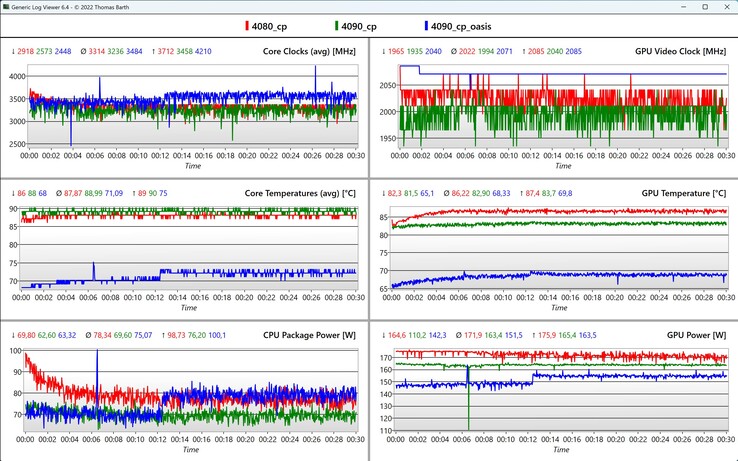
Cyberpunk 2077 döngümüzdeki CPU/GPU verilerini karşılaştırırken, CPU/GPU sıcaklıkları yaklaşık 20 °C daha düşük olduğu için harici su soğutmanın avantajı çok net bir şekilde ortaya çıkıyor, bu nedenle fanların da daha az çalışması gerekiyor.
Pil modunda, GPU'nun güç tüketimi 52 watt ile sınırlıdır, bu nedenle GPU performansı yaklaşık %53 daha düşüktür. Daha fazla GPU kıyaslaması mevcuttur burada.
| 3DMark Performance Rating - Percent | |
| Eurocom Raptor X17 Core i9-14900HX | |
| SCHENKER Neo 17 2024 Engineering Sample -1! | |
| Medion Erazer Beast X40 2024 | |
| SCHENKER XMG Neo 17 E24 | |
| MSI GE78HX 13VH-070US | |
| Ortalama NVIDIA GeForce RTX 4080 Laptop GPU | |
| HP Omen 17-db0079ng | |
| Sınıf ortalaması Gaming | |
| 3DMark 11 - 1280x720 Performance GPU | |
| SCHENKER Neo 17 2024 Engineering Sample | |
| Medion Erazer Beast X40 2024 | |
| Eurocom Raptor X17 Core i9-14900HX | |
| SCHENKER XMG Neo 17 E24 | |
| MSI GE78HX 13VH-070US | |
| Ortalama NVIDIA GeForce RTX 4080 Laptop GPU (45199 - 63128, n=24) | |
| HP Omen 17-db0079ng | |
| Sınıf ortalaması Gaming (10741 - 72178, n=143, son 2 yıl) | |
| 3DMark 11 Performance | 45722 puan | |
| 3DMark Fire Strike Score | 34851 puan | |
| 3DMark Time Spy Score | 18980 puan | |
Yardım | ||
| Blender / v3.3 Classroom OPTIX/RTX | |
| HP Omen 17-db0079ng | |
| Sınıf ortalaması Gaming (10 - 95, n=143, son 2 yıl) | |
| Ortalama NVIDIA GeForce RTX 4080 Laptop GPU (13 - 20, n=22) | |
| MSI GE78HX 13VH-070US | |
| SCHENKER XMG Neo 17 E24 | |
| Eurocom Raptor X17 Core i9-14900HX | |
| Medion Erazer Beast X40 2024 | |
| Blender / v3.3 Classroom CUDA | |
| Sınıf ortalaması Gaming (16 - 175, n=145, son 2 yıl) | |
| HP Omen 17-db0079ng | |
| Ortalama NVIDIA GeForce RTX 4080 Laptop GPU (21 - 28, n=23) | |
| MSI GE78HX 13VH-070US | |
| SCHENKER XMG Neo 17 E24 | |
| Eurocom Raptor X17 Core i9-14900HX | |
| Medion Erazer Beast X40 2024 | |
| Blender / v3.3 Classroom CPU | |
| HP Omen 17-db0079ng | |
| Sınıf ortalaması Gaming (123 - 962, n=150, son 2 yıl) | |
| Medion Erazer Beast X40 2024 | |
| Ortalama NVIDIA GeForce RTX 4080 Laptop GPU (177 - 337, n=23) | |
| Eurocom Raptor X17 Core i9-14900HX | |
| SCHENKER XMG Neo 17 E24 | |
| MSI GE78HX 13VH-070US | |
* ... daha küçük daha iyidir
| Performance Rating - Percent | |
| Eurocom Raptor X17 Core i9-14900HX -1! | |
| SCHENKER Neo 17 2024 Engineering Sample -2! | |
| Medion Erazer Beast X40 2024 -1! | |
| SCHENKER XMG Neo 17 E24 | |
| MSI GE78HX 13VH-070US -2! | |
| Sınıf ortalaması Gaming | |
| HP Omen 17-db0079ng -1! | |
| Cyberpunk 2077 2.2 Phantom Liberty - 1920x1080 Ultra Preset (FSR off) | |
| Eurocom Raptor X17 Core i9-14900HX | |
| SCHENKER XMG Neo 17 E24 | |
| Medion Erazer Beast X40 2024 | |
| HP Omen 17-db0079ng | |
| Sınıf ortalaması Gaming (6.76 - 158, n=90, son 2 yıl) | |
| Baldur's Gate 3 - 1920x1080 Ultra Preset | |
| Eurocom Raptor X17 Core i9-14900HX | |
| Sınıf ortalaması Gaming (34.5 - 208, n=57, son 2 yıl) | |
| SCHENKER XMG Neo 17 E24 | |
| GTA V - 1920x1080 Highest Settings possible AA:4xMSAA + FX AF:16x | |
| Eurocom Raptor X17 Core i9-14900HX | |
| SCHENKER XMG Neo 17 E24 | |
| SCHENKER Neo 17 2024 Engineering Sample | |
| Medion Erazer Beast X40 2024 | |
| Sınıf ortalaması Gaming (12.1 - 168.2, n=132, son 2 yıl) | |
| HP Omen 17-db0079ng | |
| MSI GE78HX 13VH-070US | |
| Final Fantasy XV Benchmark - 1920x1080 High Quality | |
| SCHENKER Neo 17 2024 Engineering Sample | |
| Medion Erazer Beast X40 2024 | |
| SCHENKER XMG Neo 17 E24 | |
| MSI GE78HX 13VH-070US | |
| HP Omen 17-db0079ng | |
| Sınıf ortalaması Gaming (19.2 - 201, n=144, son 2 yıl) | |
| Strange Brigade - 1920x1080 ultra AA:ultra AF:16 | |
| Eurocom Raptor X17 Core i9-14900HX | |
| SCHENKER Neo 17 2024 Engineering Sample | |
| Medion Erazer Beast X40 2024 | |
| SCHENKER XMG Neo 17 E24 | |
| MSI GE78HX 13VH-070US | |
| Sınıf ortalaması Gaming (38.9 - 420, n=140, son 2 yıl) | |
| HP Omen 17-db0079ng | |
| Dota 2 Reborn - 1920x1080 ultra (3/3) best looking | |
| Eurocom Raptor X17 Core i9-14900HX | |
| Medion Erazer Beast X40 2024 | |
| SCHENKER Neo 17 2024 Engineering Sample | |
| SCHENKER XMG Neo 17 E24 | |
| Sınıf ortalaması Gaming (65.1 - 220, n=148, son 2 yıl) | |
| MSI GE78HX 13VH-070US | |
| HP Omen 17-db0079ng | |
| X-Plane 11.11 - 1920x1080 high (fps_test=3) | |
| Eurocom Raptor X17 Core i9-14900HX | |
| Medion Erazer Beast X40 2024 | |
| SCHENKER XMG Neo 17 E24 | |
| MSI GE78HX 13VH-070US | |
| SCHENKER Neo 17 2024 Engineering Sample | |
| Sınıf ortalaması Gaming (32.8 - 166.2, n=151, son 2 yıl) | |
| HP Omen 17-db0079ng | |
Cyberpunk 2077 Ultra FPS chart
| düşük | orta | yüksek | ultra | QHD DLSS | QHD | 4K | |
|---|---|---|---|---|---|---|---|
| GTA V (2015) | 181.7 | 143.4 | 135.1 | 163.7 | |||
| Dota 2 Reborn (2015) | 220 | 197.1 | 194 | 179.7 | |||
| Final Fantasy XV Benchmark (2018) | 226 | 215 | 173.9 | 134.4 | |||
| X-Plane 11.11 (2018) | 202 | 176.8 | 138.9 | ||||
| Far Cry 5 (2018) | 179 | 162 | 157 | ||||
| Strange Brigade (2018) | 381 | 347 | 239 | 122 | |||
| Shadow of the Tomb Raider (2018) | 212 | 176 | |||||
| Far Cry 6 (2021) | 156 | 141 | |||||
| F1 23 (2023) | 321 | 111.6 | 70.7 | 35.5 | |||
| Baldur's Gate 3 (2023) | 231 | 143 | 122.2 | 111.8 | 88.3 | ||
| Cyberpunk 2077 2.2 Phantom Liberty (2023) | 101.1 | 146.9 | 133.8 | 121.3 | 110.1 | 80.7 | |
| Assassin's Creed Mirage (2023) | 197 | 153 | 129 | ||||
| Call of Duty Modern Warfare 3 2023 (2023) | 180 | 171 | 123 | ||||
| Avatar Frontiers of Pandora (2023) | 125 | 97 | 66 | ||||
| F1 24 (2024) | 304 | 323 | 289 | 112.2 | 71.2 |
Emisyonlar ve Enerji
Gürültü emisyonları
İki fanlı soğutma temelde geçen yılın modeliyle aynıdır, ancak Neo 17'nin RTX 4080/4090 dizüstü bilgisayar ile yapılandırmaları, artık doğrudan CPU üzerinden geçen su soğutması için değiştirilmiş bir kanal sunar. Fanlar her zaman çalışıyor, ancak çok basit görevler sırasında (internette gezinme, e-postalar, videolar) yalnızca çok düşük bir ses duyabilirsiniz. Ancak oyun oynarken, 52 dB(A) ile önemli ölçüde daha yüksek ses çıkarır. Daha yüksek sesli rakipler olmasına rağmen, oyun oynarken yine de kulaklık kullanmalısınız. Kıyaslamalar/oyunlar sırasında hafif bir bobin sesi de vardı.
Ses yüksekliği
| Boşta |
| 28.1 / 28.1 / 28.1 dB |
| HDD |
| 0 dB |
| Çalışırken |
| 43.1 / 51.9 dB |
 | ||
30 dB sessiz 40 dB(A) duyulabilirlik 50 dB(A) gürültülü |
||
min: | ||
| SCHENKER XMG Neo 17 E24 NVIDIA GeForce RTX 4080 Laptop GPU, i9-14900HX, Samsung 990 Pro 1 TB | Medion Erazer Beast X40 2024 NVIDIA GeForce RTX 4090 Laptop GPU, i9-14900HX, Phison E18-1TB-PHISON-SSD-BICS5 | HP Omen 17-db0079ng NVIDIA GeForce RTX 4070 Laptop GPU, R7 8845HS, WD PC SN560 SDDPNQE-1T00 | Eurocom Raptor X17 Core i9-14900HX NVIDIA GeForce RTX 4090 Laptop GPU, i9-14900HX, Corsair MP700 Pro 2TB | MSI GE78HX 13VH-070US NVIDIA GeForce RTX 4080 Laptop GPU, i9-13950HX, Samsung PM9A1 MZVL22T0HBLB | |
|---|---|---|---|---|---|
| Noise | -6% | -2% | -7% | -0% | |
| kapalı / ortam * | 23.3 | 25 -7% | 25 -7% | 23.7 -2% | 23.4 -0% |
| Idle Minimum * | 28.1 | 28 -0% | 25 11% | 31.7 -13% | 24.2 14% |
| Idle Average * | 28.1 | 29 -3% | 29 -3% | 31.7 -13% | 25.6 9% |
| Idle Maximum * | 28.1 | 32 -14% | 33 -17% | 32.9 -17% | 31 -10% |
| Load Average * | 43.1 | 48 -11% | 45 -4% | 34 21% | 43.3 -0% |
| Cyberpunk 2077 ultra * | 51.9 | 48 8% | |||
| Load Maximum * | 51.9 | 52 -0% | 52 -0% | 61.6 -19% | 59.1 -14% |
| Witcher 3 ultra * | 50 | 61.6 | 56.3 |
* ... daha küçük daha iyidir
Sıcaklık
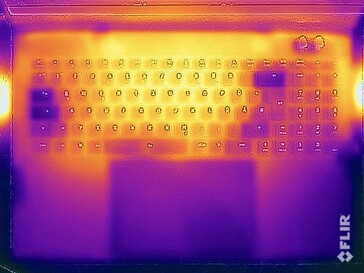
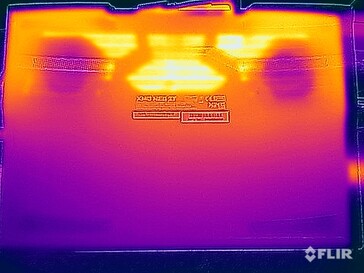
Schenker, RTX 4080 dizüstü bilgisayardan başlayarak yukarı doğru yapılandırmalarda hem CPU hem de GPU için bir sıvı metal termal arayüz kullanıyor. Kasa sıcaklıkları basit görevler sırasında serin kalıyor, ancak yük altında belirli noktalarda alt tarafta 50 °C'den fazla sıcaklık ölçtük. Ancak boyutu nedeniyle Neo 17 uyluklarınıza yerleştirilmeyecek, bu nedenle bu değerler sorun teşkil etmiyor. Klavye alanı da belirgin şekilde ısınıyor, ancak burada herhangi bir sınırlama yok. Stres testinde grafik kartı 160 watt'ta, işlemci ise yaklaşık 70 watt'ta sabitlendi.
(-) Üst taraftaki maksimum sıcaklık, 40.4 °C / 105 F ortalamasına kıyasla 46.2 °C / 115 F'dir. , Gaming sınıfı için 21.2 ile 68.8 °C arasında değişir.
(-) Alt kısım, 43.2 °C / 110 F ortalamasına kıyasla maksimum 56.7 °C / 134 F'ye kadar ısınır
(+) Boşta kullanımda, üst tarafın ortalama sıcaklığı 28.2 °C / 83 F olup, cihazın 33.9 °C / 93 F.
(-) 3: The average temperature for the upper side is 39.8 °C / 104 F, compared to the average of 33.9 °C / 93 F for the class Gaming.
(+) Avuç içi dayanakları ve dokunmatik yüzey maksimum (33.5 °C / 92.3 F) cilt sıcaklığına ulaşıyor ve bu nedenle sıcak değil.
(-) Benzer cihazların avuç içi dayanağı alanının ortalama sıcaklığı 28.9 °C / 84 F (-4.6 °C / -8.3 F) idi.
| SCHENKER XMG Neo 17 E24 Intel Core i9-14900HX, NVIDIA GeForce RTX 4080 Laptop GPU | Medion Erazer Beast X40 2024 Intel Core i9-14900HX, NVIDIA GeForce RTX 4090 Laptop GPU | HP Omen 17-db0079ng AMD Ryzen 7 8845HS, NVIDIA GeForce RTX 4070 Laptop GPU | Eurocom Raptor X17 Core i9-14900HX Intel Core i9-14900HX, NVIDIA GeForce RTX 4090 Laptop GPU | MSI GE78HX 13VH-070US Intel Core i9-13950HX, NVIDIA GeForce RTX 4080 Laptop GPU | |
|---|---|---|---|---|---|
| Heat | 1% | 14% | 1% | 10% | |
| Maximum Upper Side * | 46.2 | 47 -2% | 44 5% | 52.2 -13% | 37.4 19% |
| Maximum Bottom * | 56.7 | 54 5% | 45 21% | 53.2 6% | 45 21% |
| Idle Upper Side * | 29.8 | 30 -1% | 26 13% | 28.6 4% | 29.8 -0% |
| Idle Bottom * | 32 | 32 -0% | 27 16% | 29.8 7% | 32.4 -1% |
* ... daha küçük daha iyidir
Konuşmacı
Stereo hoparlörler özellikle iyi değil ancak ara sıra YouTube videosu izlemek için yeterli. Bununla birlikte, hoparlörler yüksek fanlar nedeniyle oyun oynamak için pek kullanışlı değildir.
SCHENKER XMG Neo 17 E24 ses analizi
(+) | hoparlörler nispeten yüksek sesle çalabilir (83.7 dB)
Bas 100 - 315Hz
(-) | neredeyse hiç bas yok - ortalama olarak medyandan 19% daha düşük
(+) | bas doğrusaldır (6% delta ile önceki frekans)
Ortalar 400 - 2000 Hz
(±) | daha yüksek ortalar - ortalama olarak medyandan 6.6% daha yüksek
(±) | Ortaların doğrusallığı ortalamadır (9.4% delta - önceki frekans)
Yüksekler 2 - 16 kHz
(+) | dengeli yüksekler - medyandan yalnızca 3.6% uzakta
(±) | Yükseklerin doğrusallığı ortalamadır (7.1% delta - önceki frekans)
Toplam 100 - 16.000 Hz
(±) | Genel sesin doğrusallığı ortalamadır (18.3% ortancaya göre fark)
Aynı sınıfla karşılaştırıldığında
» Bu sınıftaki tüm test edilen cihazların %56%'si daha iyi, 8% benzer, 35% daha kötüydü
» En iyisinin deltası 6% idi, ortalama 18% idi, en kötüsü 132% idi
Test edilen tüm cihazlarla karşılaştırıldığında
» Test edilen tüm cihazların %37'si daha iyi, 7 benzer, % 55 daha kötüydü
» En iyisinin deltası 4% idi, ortalama 24% idi, en kötüsü 134% idi
Medion Erazer Beast X40 2024 ses analizi
(+) | hoparlörler nispeten yüksek sesle çalabilir (88 dB)
Bas 100 - 315Hz
(±) | azaltılmış bas - ortalama olarak medyandan 14.7% daha düşük
(±) | Bas doğrusallığı ortalamadır (7.2% delta - önceki frekans)
Ortalar 400 - 2000 Hz
(+) | dengeli ortalar - medyandan yalnızca 3.7% uzakta
(+) | orta frekanslar doğrusaldır (5.8% deltadan önceki frekansa)
Yüksekler 2 - 16 kHz
(+) | dengeli yüksekler - medyandan yalnızca 2.8% uzakta
(+) | yüksekler doğrusaldır (6.4% deltadan önceki frekansa)
Toplam 100 - 16.000 Hz
(+) | genel ses doğrusaldır (12.1% ortancaya göre fark)
Aynı sınıfla karşılaştırıldığında
» Bu sınıftaki tüm test edilen cihazların %11%'si daha iyi, 4% benzer, 85% daha kötüydü
» En iyisinin deltası 6% idi, ortalama 18% idi, en kötüsü 132% idi
Test edilen tüm cihazlarla karşılaştırıldığında
» Test edilen tüm cihazların %8'si daha iyi, 2 benzer, % 90 daha kötüydü
» En iyisinin deltası 4% idi, ortalama 24% idi, en kötüsü 134% idi
HP Omen 17-db0079ng ses analizi
(±) | hoparlör ses yüksekliği ortalama ama iyi (80 dB)
Bas 100 - 315Hz
(-) | neredeyse hiç bas yok - ortalama olarak medyandan 19.1% daha düşük
(±) | Bas doğrusallığı ortalamadır (10.3% delta - önceki frekans)
Ortalar 400 - 2000 Hz
(+) | dengeli ortalar - medyandan yalnızca 1.9% uzakta
(+) | orta frekanslar doğrusaldır (4.4% deltadan önceki frekansa)
Yüksekler 2 - 16 kHz
(+) | dengeli yüksekler - medyandan yalnızca 3.8% uzakta
(±) | Yükseklerin doğrusallığı ortalamadır (7.8% delta - önceki frekans)
Toplam 100 - 16.000 Hz
(+) | genel ses doğrusaldır (14.3% ortancaya göre fark)
Aynı sınıfla karşılaştırıldığında
» Bu sınıftaki tüm test edilen cihazların %25%'si daha iyi, 7% benzer, 69% daha kötüydü
» En iyisinin deltası 6% idi, ortalama 18% idi, en kötüsü 132% idi
Test edilen tüm cihazlarla karşılaştırıldığında
» Test edilen tüm cihazların %16'si daha iyi, 4 benzer, % 80 daha kötüydü
» En iyisinin deltası 4% idi, ortalama 24% idi, en kötüsü 134% idi
Eurocom Raptor X17 Core i9-14900HX ses analizi
(±) | hoparlör ses yüksekliği ortalama ama iyi (74.2 dB)
Bas 100 - 315Hz
(±) | azaltılmış bas - ortalama olarak medyandan 13.4% daha düşük
(±) | Bas doğrusallığı ortalamadır (10.1% delta - önceki frekans)
Ortalar 400 - 2000 Hz
(±) | daha yüksek ortalar - ortalama olarak medyandan 6.6% daha yüksek
(±) | Ortaların doğrusallığı ortalamadır (8.6% delta - önceki frekans)
Yüksekler 2 - 16 kHz
(+) | dengeli yüksekler - medyandan yalnızca 2% uzakta
(±) | Yükseklerin doğrusallığı ortalamadır (8.5% delta - önceki frekans)
Toplam 100 - 16.000 Hz
(±) | Genel sesin doğrusallığı ortalamadır (24% ortancaya göre fark)
Aynı sınıfla karşılaştırıldığında
» Bu sınıftaki tüm test edilen cihazların %85%'si daha iyi, 5% benzer, 10% daha kötüydü
» En iyisinin deltası 6% idi, ortalama 18% idi, en kötüsü 132% idi
Test edilen tüm cihazlarla karşılaştırıldığında
» Test edilen tüm cihazların %70'si daha iyi, 7 benzer, % 23 daha kötüydü
» En iyisinin deltası 4% idi, ortalama 24% idi, en kötüsü 134% idi
MSI GE78HX 13VH-070US ses analizi
(+) | hoparlörler nispeten yüksek sesle çalabilir (84.4 dB)
Bas 100 - 315Hz
(±) | azaltılmış bas - ortalama olarak medyandan 8.3% daha düşük
(±) | Bas doğrusallığı ortalamadır (9.3% delta - önceki frekans)
Ortalar 400 - 2000 Hz
(±) | daha yüksek ortalar - ortalama olarak medyandan 6.8% daha yüksek
(+) | orta frekanslar doğrusaldır (3.4% deltadan önceki frekansa)
Yüksekler 2 - 16 kHz
(+) | dengeli yüksekler - medyandan yalnızca 2% uzakta
(+) | yüksekler doğrusaldır (2.6% deltadan önceki frekansa)
Toplam 100 - 16.000 Hz
(+) | genel ses doğrusaldır (12% ortancaya göre fark)
Aynı sınıfla karşılaştırıldığında
» Bu sınıftaki tüm test edilen cihazların %11%'si daha iyi, 4% benzer, 85% daha kötüydü
» En iyisinin deltası 6% idi, ortalama 18% idi, en kötüsü 132% idi
Test edilen tüm cihazlarla karşılaştırıldığında
» Test edilen tüm cihazların %8'si daha iyi, 2 benzer, % 90 daha kötüydü
» En iyisinin deltası 4% idi, ortalama 24% idi, en kötüsü 134% idi
Güç tüketimi
Maksimum 13 watt rölanti tüketimi, 17 inçlik büyük bir dizüstü bilgisayar için çok düşüktür. Ancak oyun oynarken, yüksek TDP/TGP değerleri göz önüne alındığında şaşırtıcı olmayan bir şekilde 300 watt civarındadır. Birlikte verilen 330 watt'lık güç kaynağı ünitesi yeterli boyutlara sahip. Ancak 2,1 watt'lık bekleme tüketimi çok yüksek.
| Kapalı / Bekleme modu | |
| Boşta | |
| Çalışırken |
|
Key:
min: | |
Power consumption Cyberpunk / Stresstest
Power consumption with external monitor
Pil ömrü
Neo 17, 150 cd/m²'de (test cihazının maksimum parlaklığının %58'i) WLAN modunda yaklaşık 6 saatlik iyi bir çalışma süresi sağlayan 99 Wh'lık bir pille donatılmıştır. Bu da büyük oyuncuları rakipleriyle kıyaslandığında orta sıralara yerleştiriyor. Cihaz açıkken tam şarj 107 dakika sürüyor ve yaklaşık 45 dakika sonra pilin %80'i tekrar kullanılabilir hale geliyor.
Notebookcheck genel değerlendirmesi
XMG Neo 17 açıkça oyun performansına odaklanıyor ve performans çok iyi. İsteğe bağlı su soğutma sayesinde sıcaklıklar ve dolayısıyla fan gürültüsü bir kez daha önemli ölçüde azaltılabilir. Ayrıca 240 Hz ve hızlı tepki sürelerine sahip mat QHD panel de oyun oynamak için çok uygun.
SCHENKER XMG Neo 17 E24
- 11/27/2024 v8
Andreas Osthoff
Şeffaflık
İncelenecek cihazların seçimi editör ekibimiz tarafından yapılır. Test örneği, bu incelemenin amacı doğrultusunda üretici veya perakendeci tarafından yazara ödünç olarak sağlanmıştır. Borç verenin bu inceleme üzerinde herhangi bir etkisi olmadığı gibi, üretici de yayınlanmadan önce bu incelemenin bir kopyasını almamıştır. Bu incelemeyi yayınlama zorunluluğu yoktu. İncelemelerimiz karşılığında asla tazminat veya ödeme kabul etmiyoruz. Bağımsız bir medya şirketi olarak Notebookcheck, üreticilerin, perakendecilerin veya yayıncıların otoritesine tabi değildir.
Notebookcheck bu şekilde test yapıyor
Notebookcheck, tüm sonuçların karşılaştırılabilir olmasını sağlamak için her yıl yüzlerce dizüstü bilgisayarı ve akıllı telefonu standart prosedürler kullanarak bağımsız olarak inceliyor. Yaklaşık 20 yıldır test yöntemlerimizi sürekli olarak geliştirdik ve bu süreçte endüstri standartlarını belirledik. Test laboratuvarlarımızda deneyimli teknisyenler ve editörler tarafından yüksek kaliteli ölçüm ekipmanları kullanılmaktadır. Bu testler çok aşamalı bir doğrulama sürecini içerir. Karmaşık derecelendirme sistemimiz, nesnelliği koruyan yüzlerce sağlam temellere dayanan ölçüm ve kıyaslamaya dayanmaktadır.















 Total Sustainability Score:


