

XMG Pro 16 Studio (Mid 24) incelemesi: Oyuncular ve içerik üreticiler için Core i9 ve RTX 4070
Yaratıcının zevki mi?
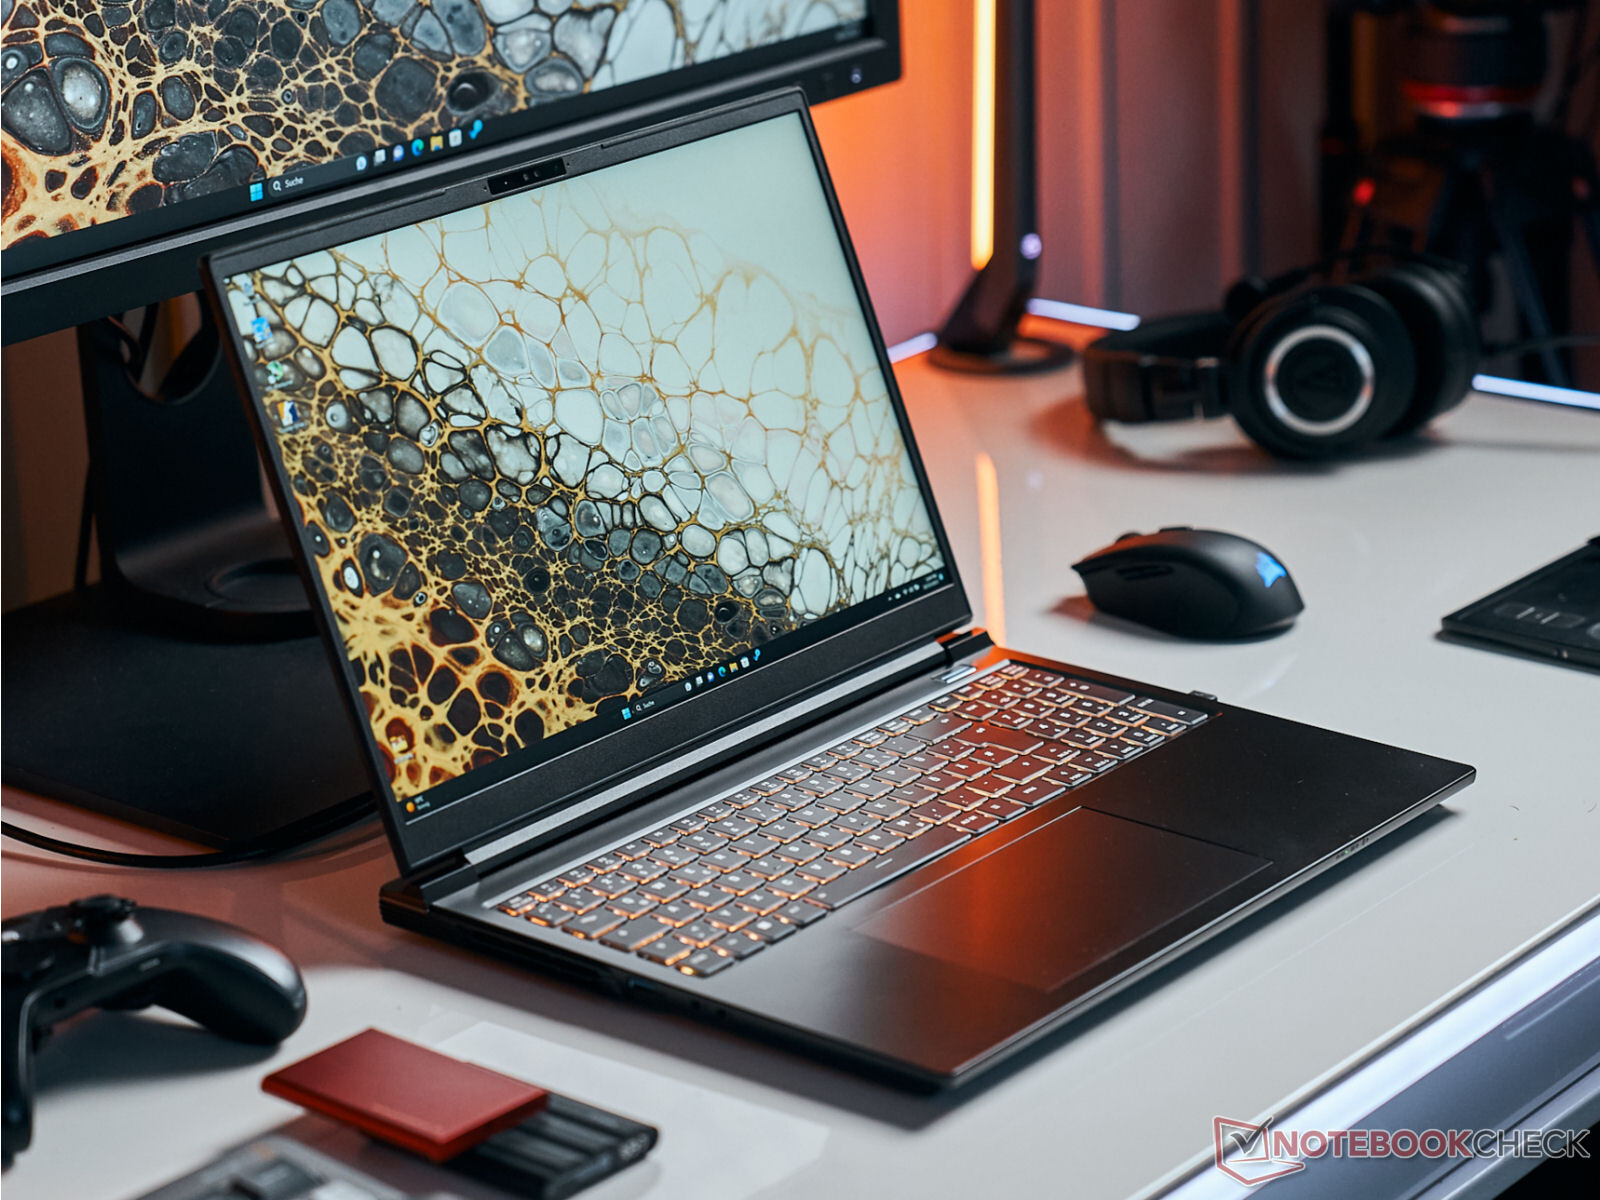
İçerik oluşturucular ve oyuncular XMG Pro 16 Studio'nun hedef pazarını oluşturuyor: Schenker, Core i9 işlemci, RTX 4070, Thunderbolt 4 portu ve 16:10 ekrandan (QHD+, 240Hz, sRGB) oluşan bir teklif hazırladı. Bir Buhar Odası kullanılarak iyi bir soğutma sağlandığı düşünülüyor.Sascha Mölck, 👁 Florian Glaser (Çeviren DeepL / Ninh Duy) Yayınlandı 🇺🇸 🇩🇪 ...
XMG Pro 16 Studio (Mid 24) oyunculara ve yaratıcılara yöneliktir. İlgili donanım gemide bulunmaktadır: Bir Core i9-14900HX, GeForce RTX 4070 ve 16:10 en boy oranına sahip kalibre edilmiş (X-Rite) 16 inç ekran. Üretici Clevo'dan bir barebone (PE60SNE-S) bunun için bir temel görevi görüyor. Bu, şu modelin halefidir XMG Pro 16 (Orta 23) görsel olarak aynı görünüyor. Rakipler arasında Lenovo Legion Pro 5 16IRX9, Acer Predator Helios Neo 16 (2024), Lenovo Legion 7 16 G9 ve Aorus 16X (2024).
Karşılaştırmalı olarak olası rakipler
Derecelendirme | Sürüm | Tarih | Modeli | Ağırlık | Yükseklik | Boyut | Çözünürlük | Fiyat |
|---|---|---|---|---|---|---|---|---|
| 81.2 % | v8 | 07/2024 | SCHENKER XMG Pro 16 Studio (Mid 24) i9-14900HX, NVIDIA GeForce RTX 4070 Laptop GPU | 2.3 kg | 19.9 mm | 16.00" | 2560x1600 | |
| 86.8 % v7 (old) | v7 (old) | 05/2024 | Acer Predator Helios Neo 16 (2024) i7-14700HX, NVIDIA GeForce RTX 4070 Laptop GPU | 2.6 kg | 25.95 mm | 16.00" | 2560x1600 | |
| 89.3 % v7 (old) | v7 (old) | 04/2024 | Lenovo Legion Pro 5 16IRX9 i9-14900HX, NVIDIA GeForce RTX 4070 Laptop GPU | 2.5 kg | 26.95 mm | 16.00" | 2560x1600 | |
| 87.4 % v7 (old) | v7 (old) | 04/2024 | Aorus 16X 2024 i9-14900HX, NVIDIA GeForce RTX 4070 Laptop GPU | 2.3 kg | 20 mm | 16.00" | 2560x1600 | |
| 90.8 % v7 (old) | v7 (old) | 04/2024 | Lenovo Legion 7 16 IRX G9 i9-14900HX, NVIDIA GeForce RTX 4070 Laptop GPU | 2.3 kg | 19.8 mm | 16.00" | 3200x2000 |
Lütfen dikkat: Derecelendirme sistemimizi yakın zamanda güncelledik ve 8. sürümün sonuçları 7. sürümün sonuçlarıyla karşılaştırılabilir değildir. Daha fazla bilgi için burada.
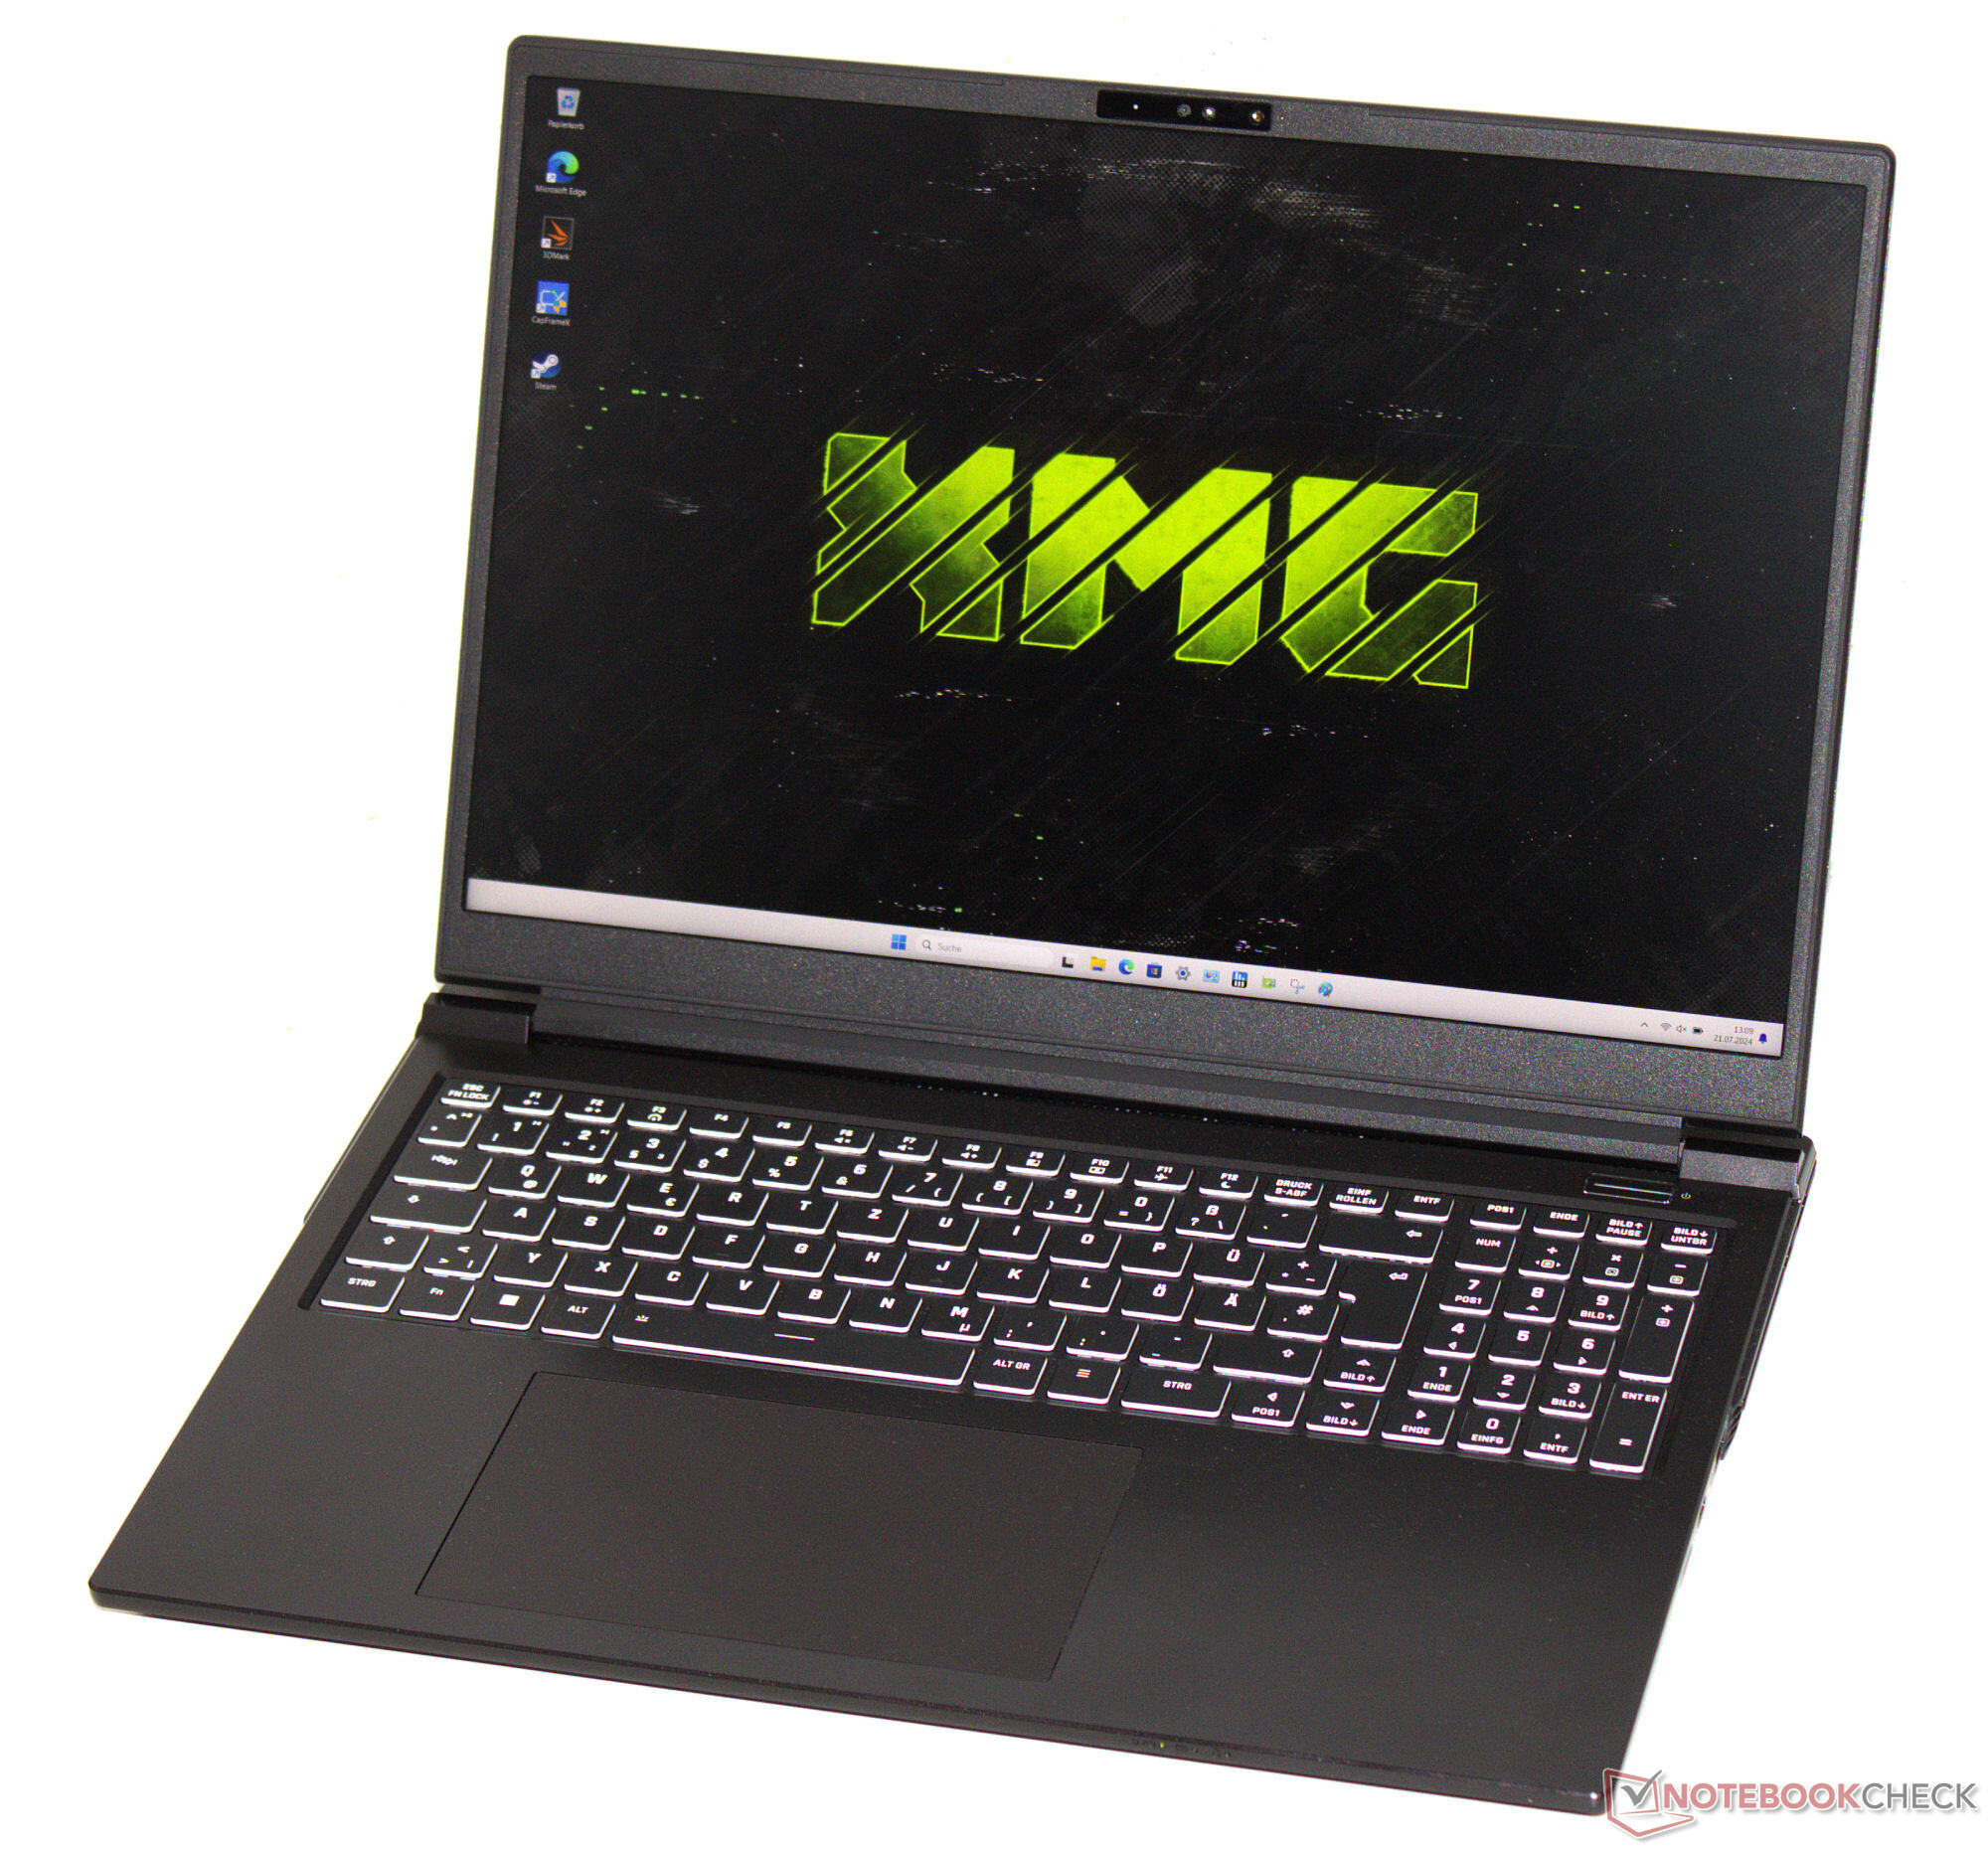
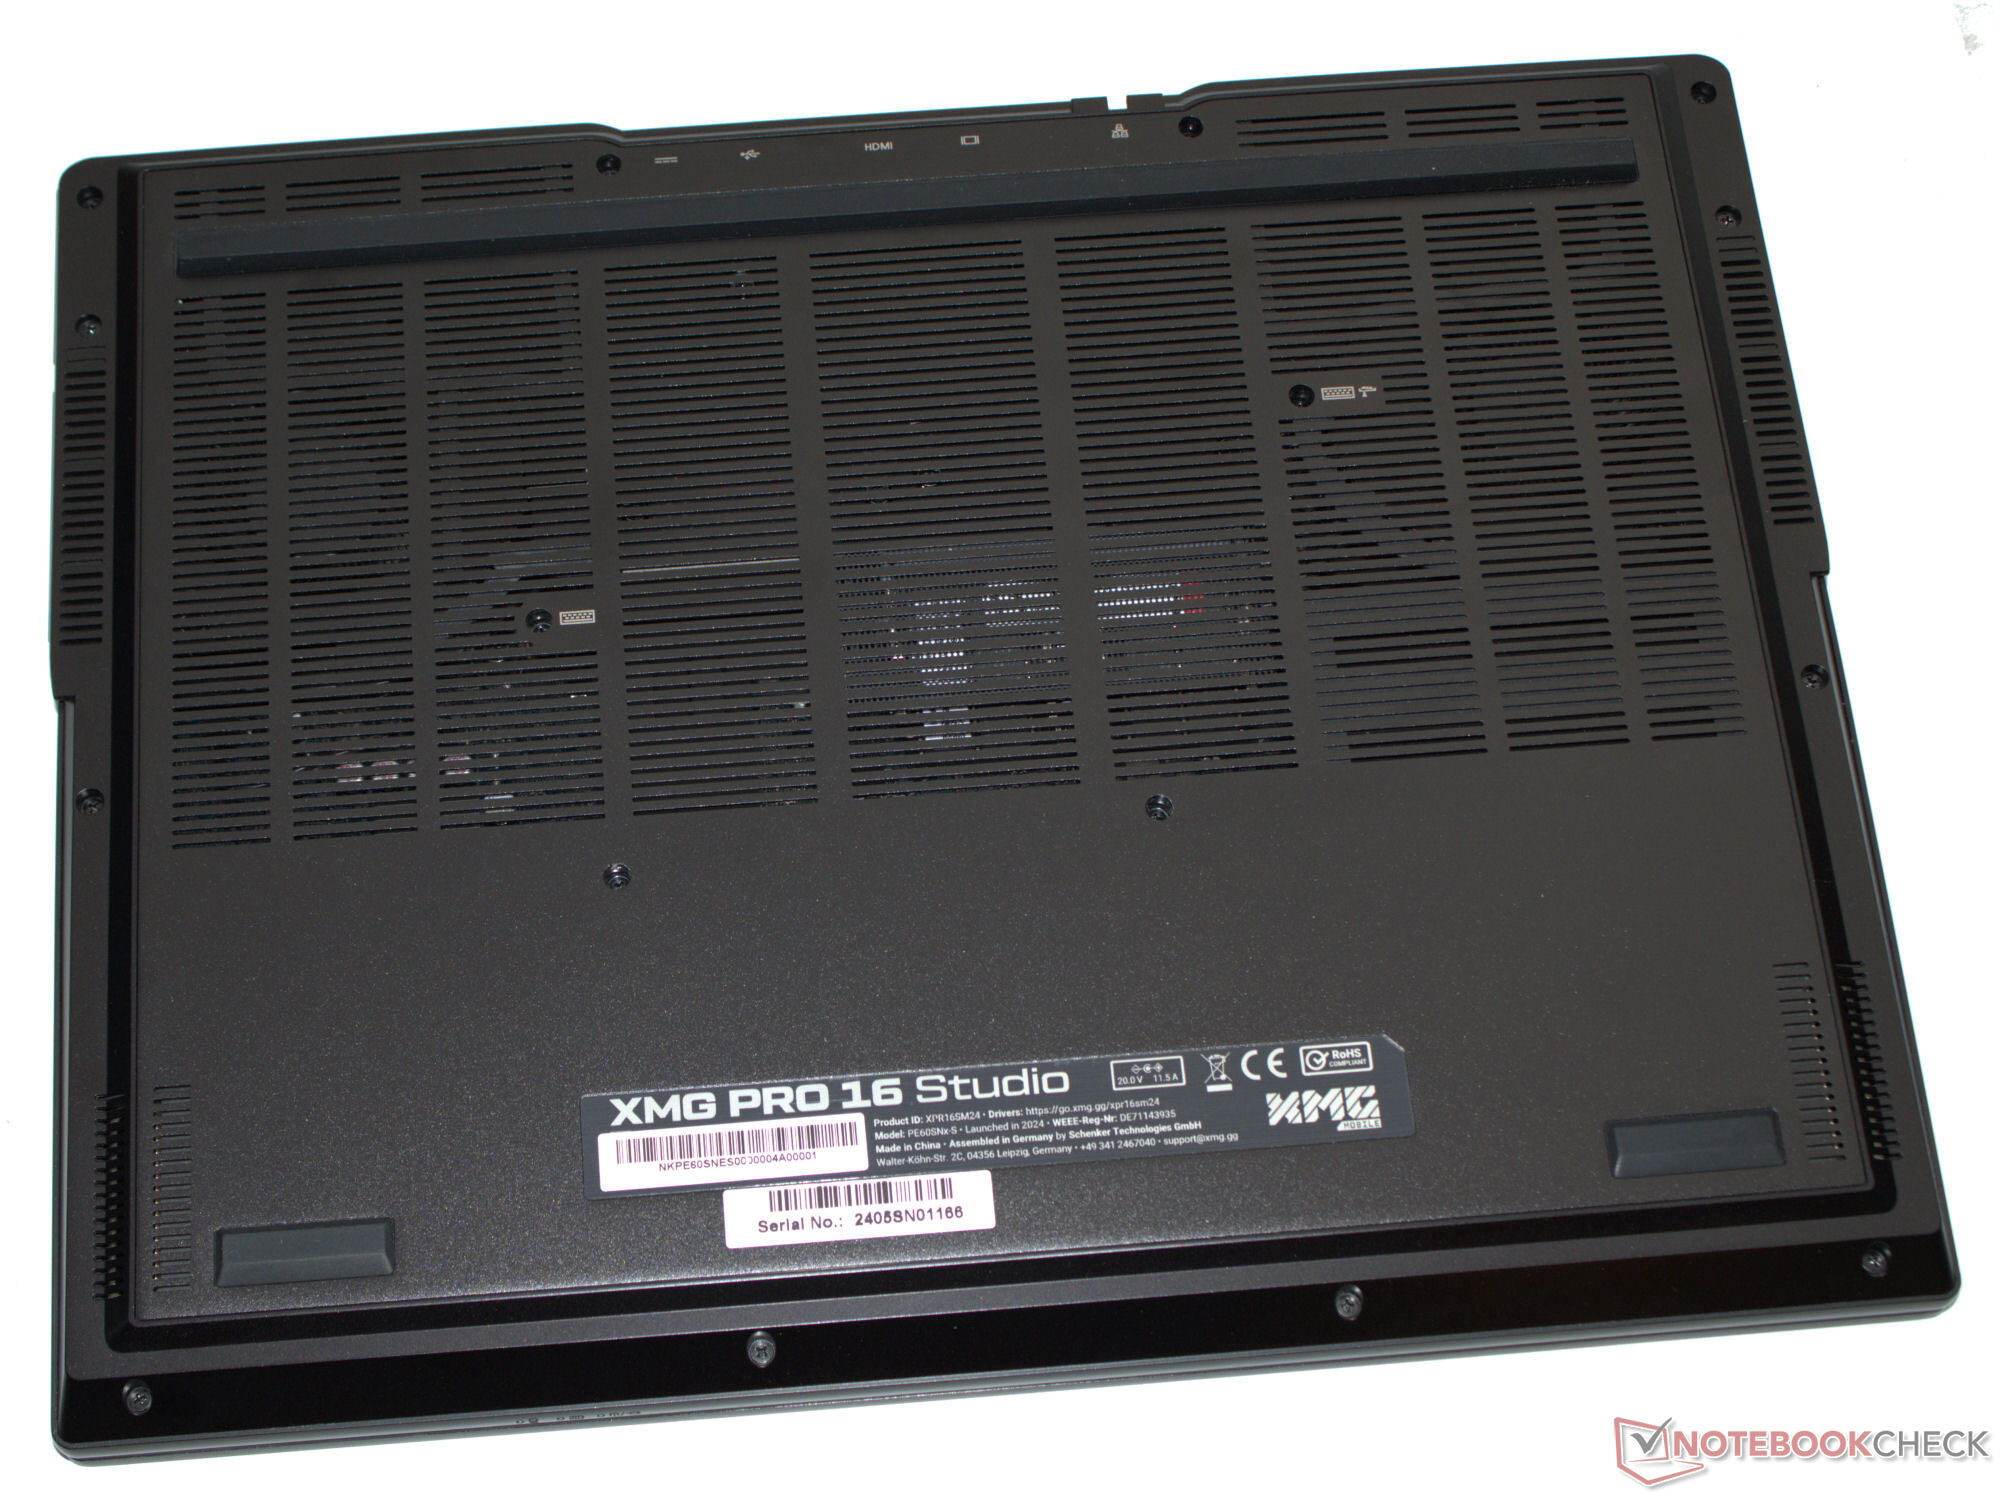
Kasa ve bağlantı - Schenker Clevo'dan bir barebone kullanıyor
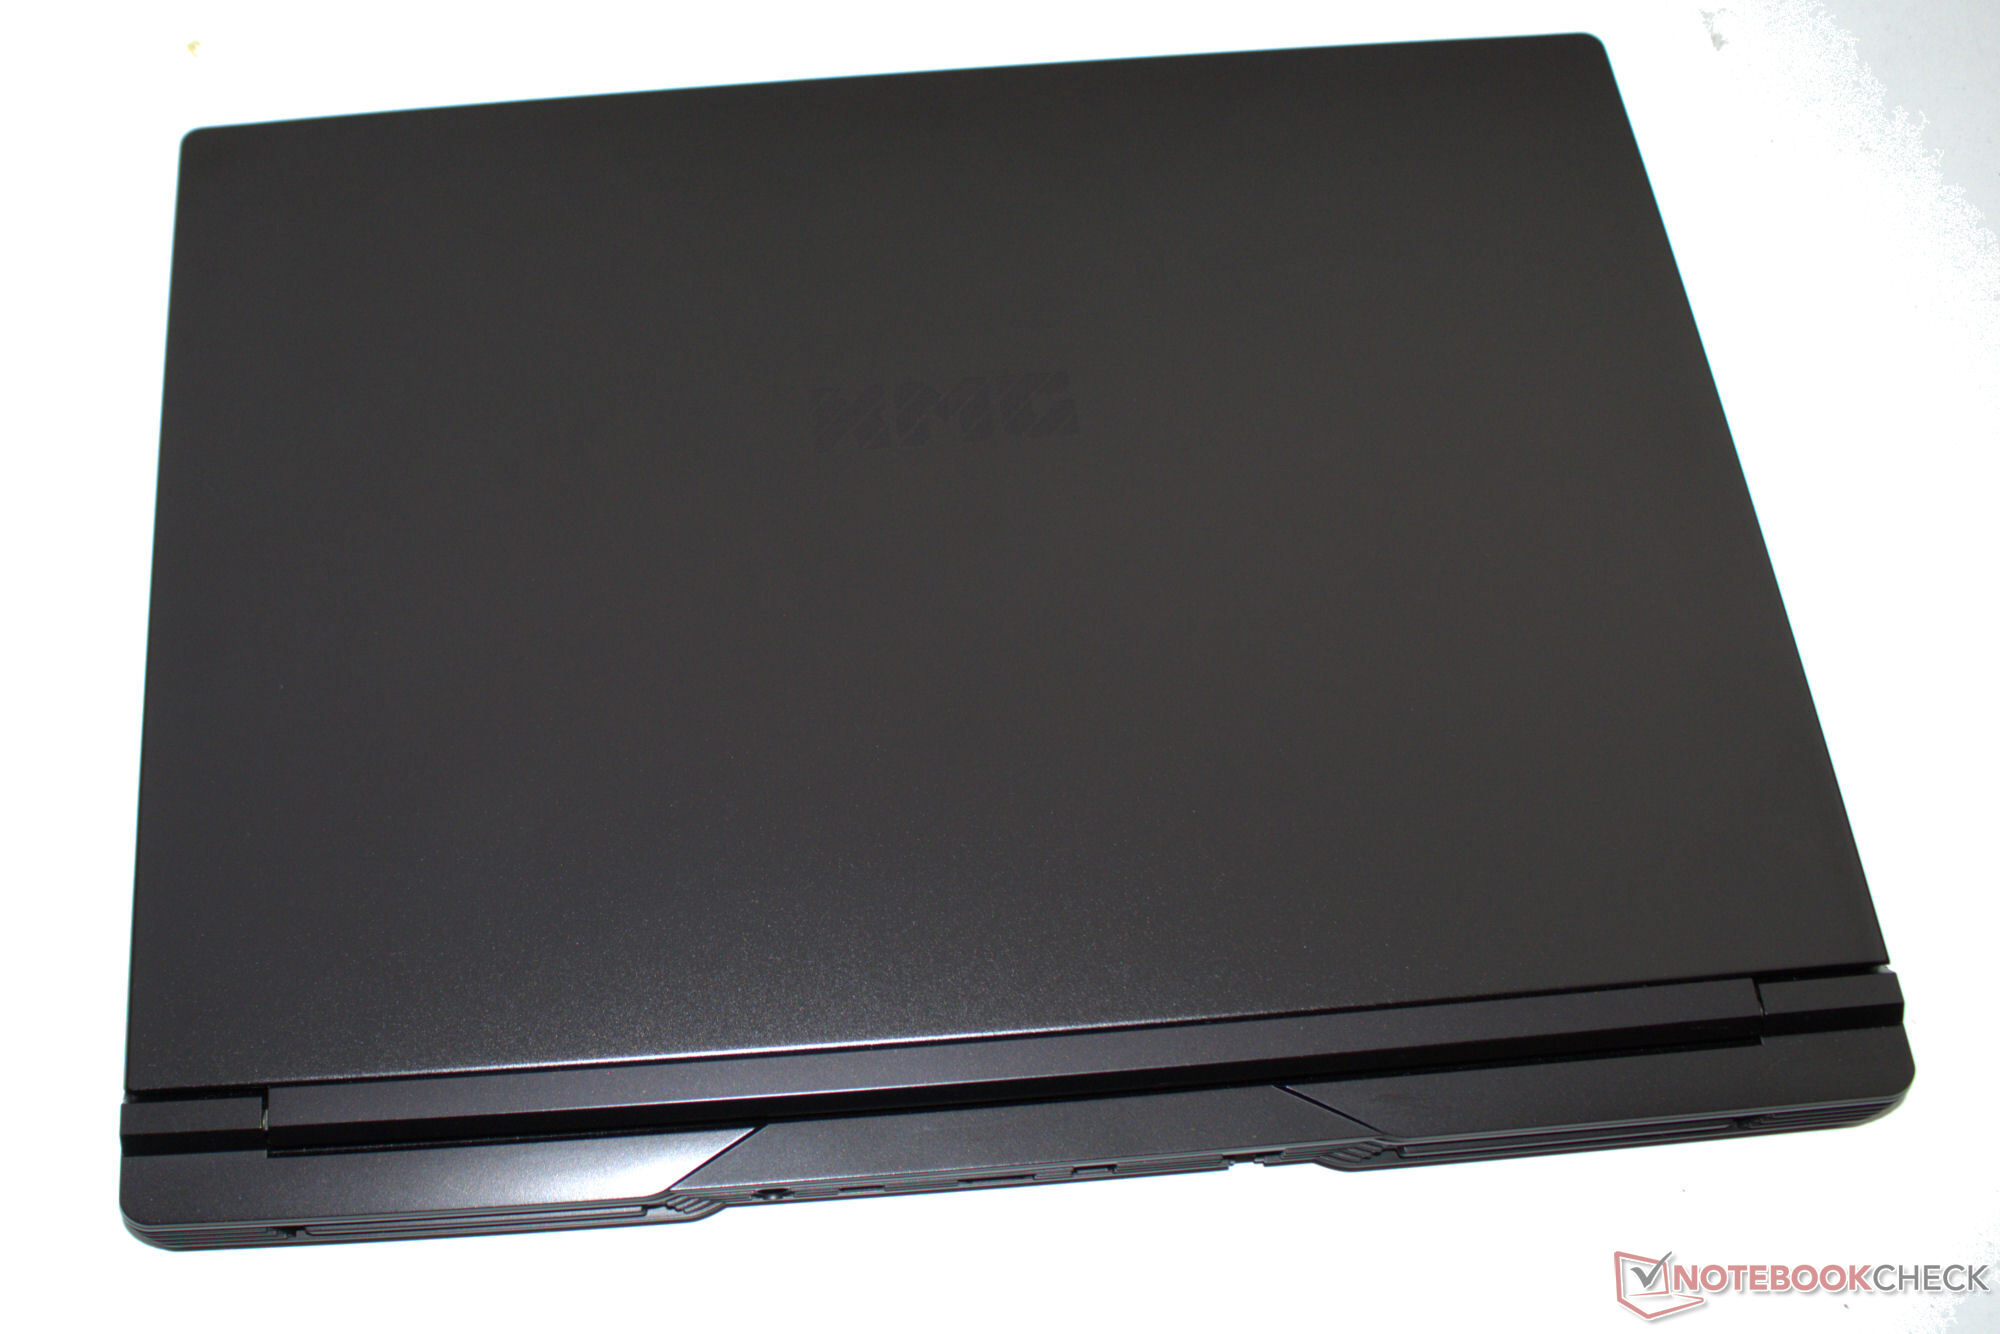
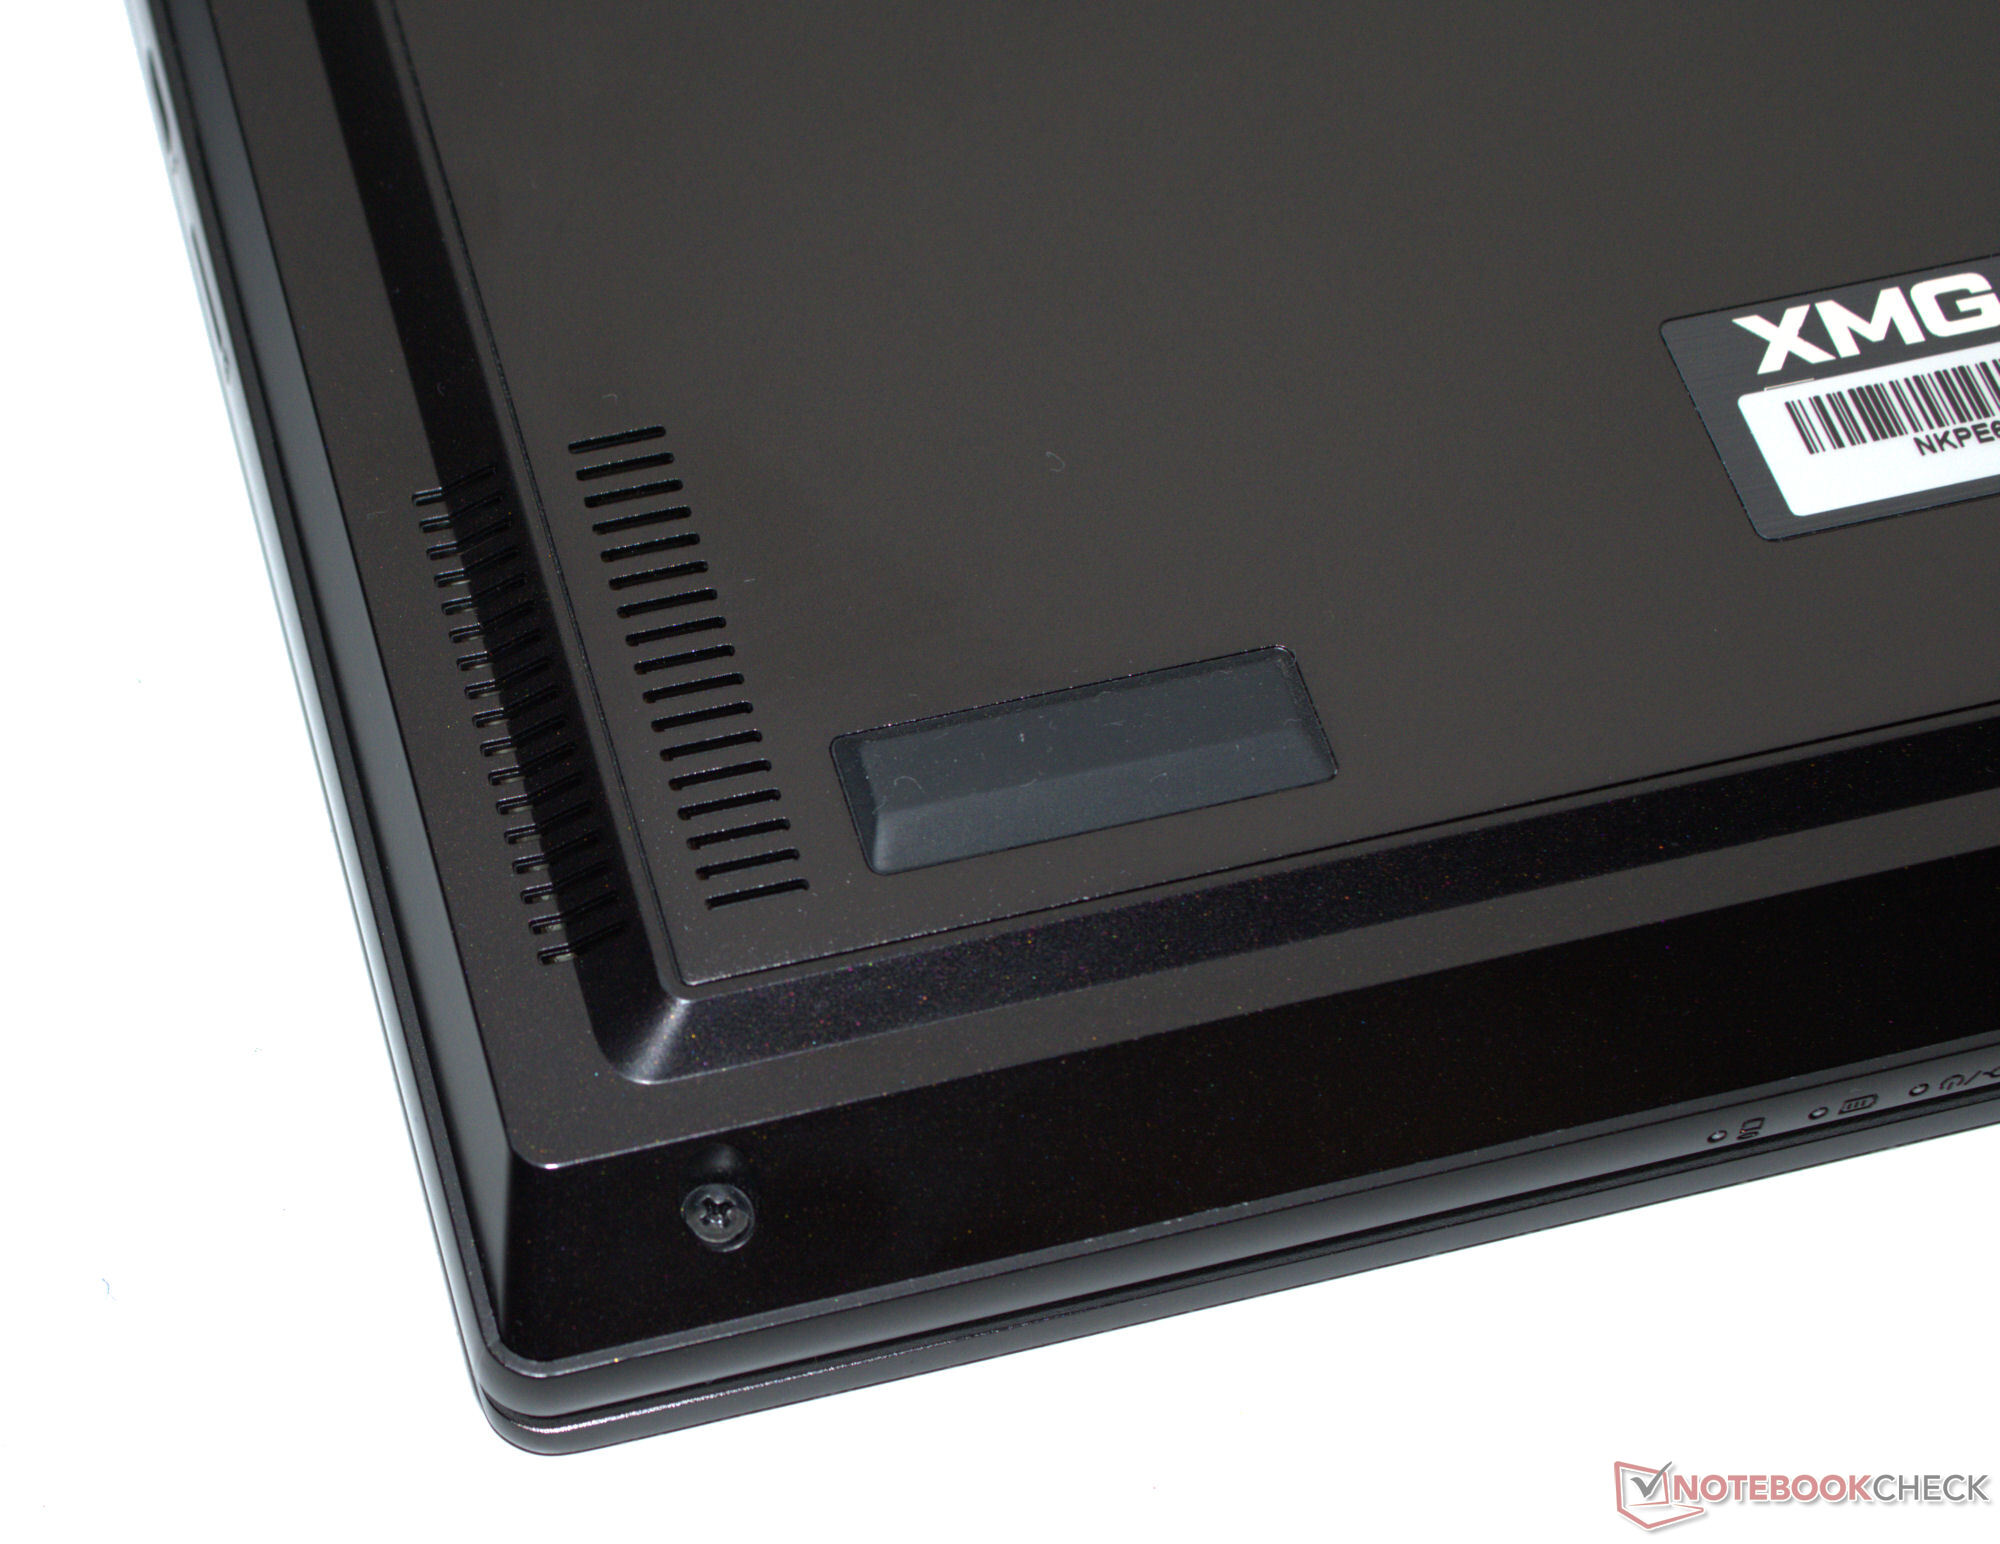
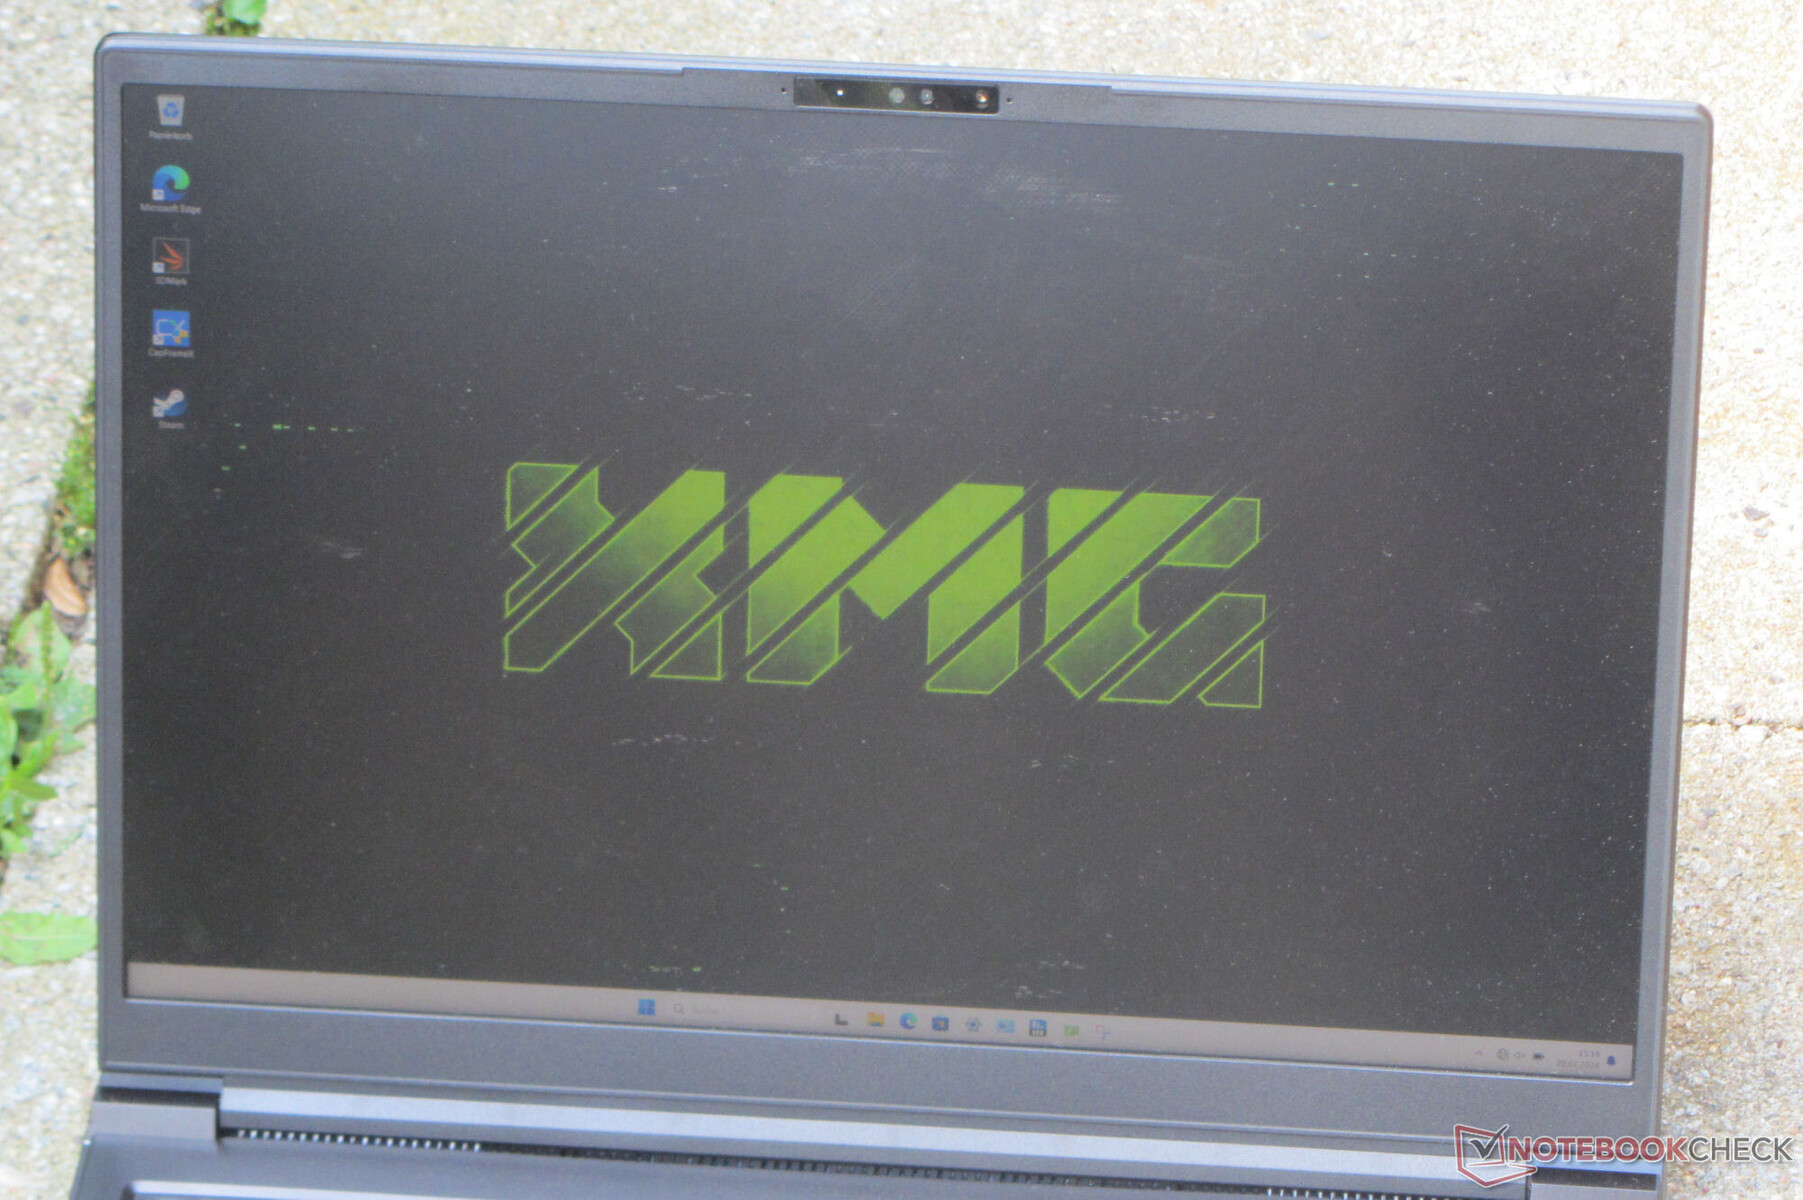
Dışarıdan bakıldığında değişen bir şey yok: En yeni Pro 16, aynı mat siyah alüminyum kasayı kullanıyor geçen yılın modeli-eğer sadece dış kasasına bakarsanız. Ana ünite ve kapak hafifçe bükülebilir, ancak yapı kalitesi iyidir. Bu kadar ciddi görünen bir kasada LED şeritleri boşuna arayacaksınız. Kapağın maksimum açılma açısı 130 derecedir.
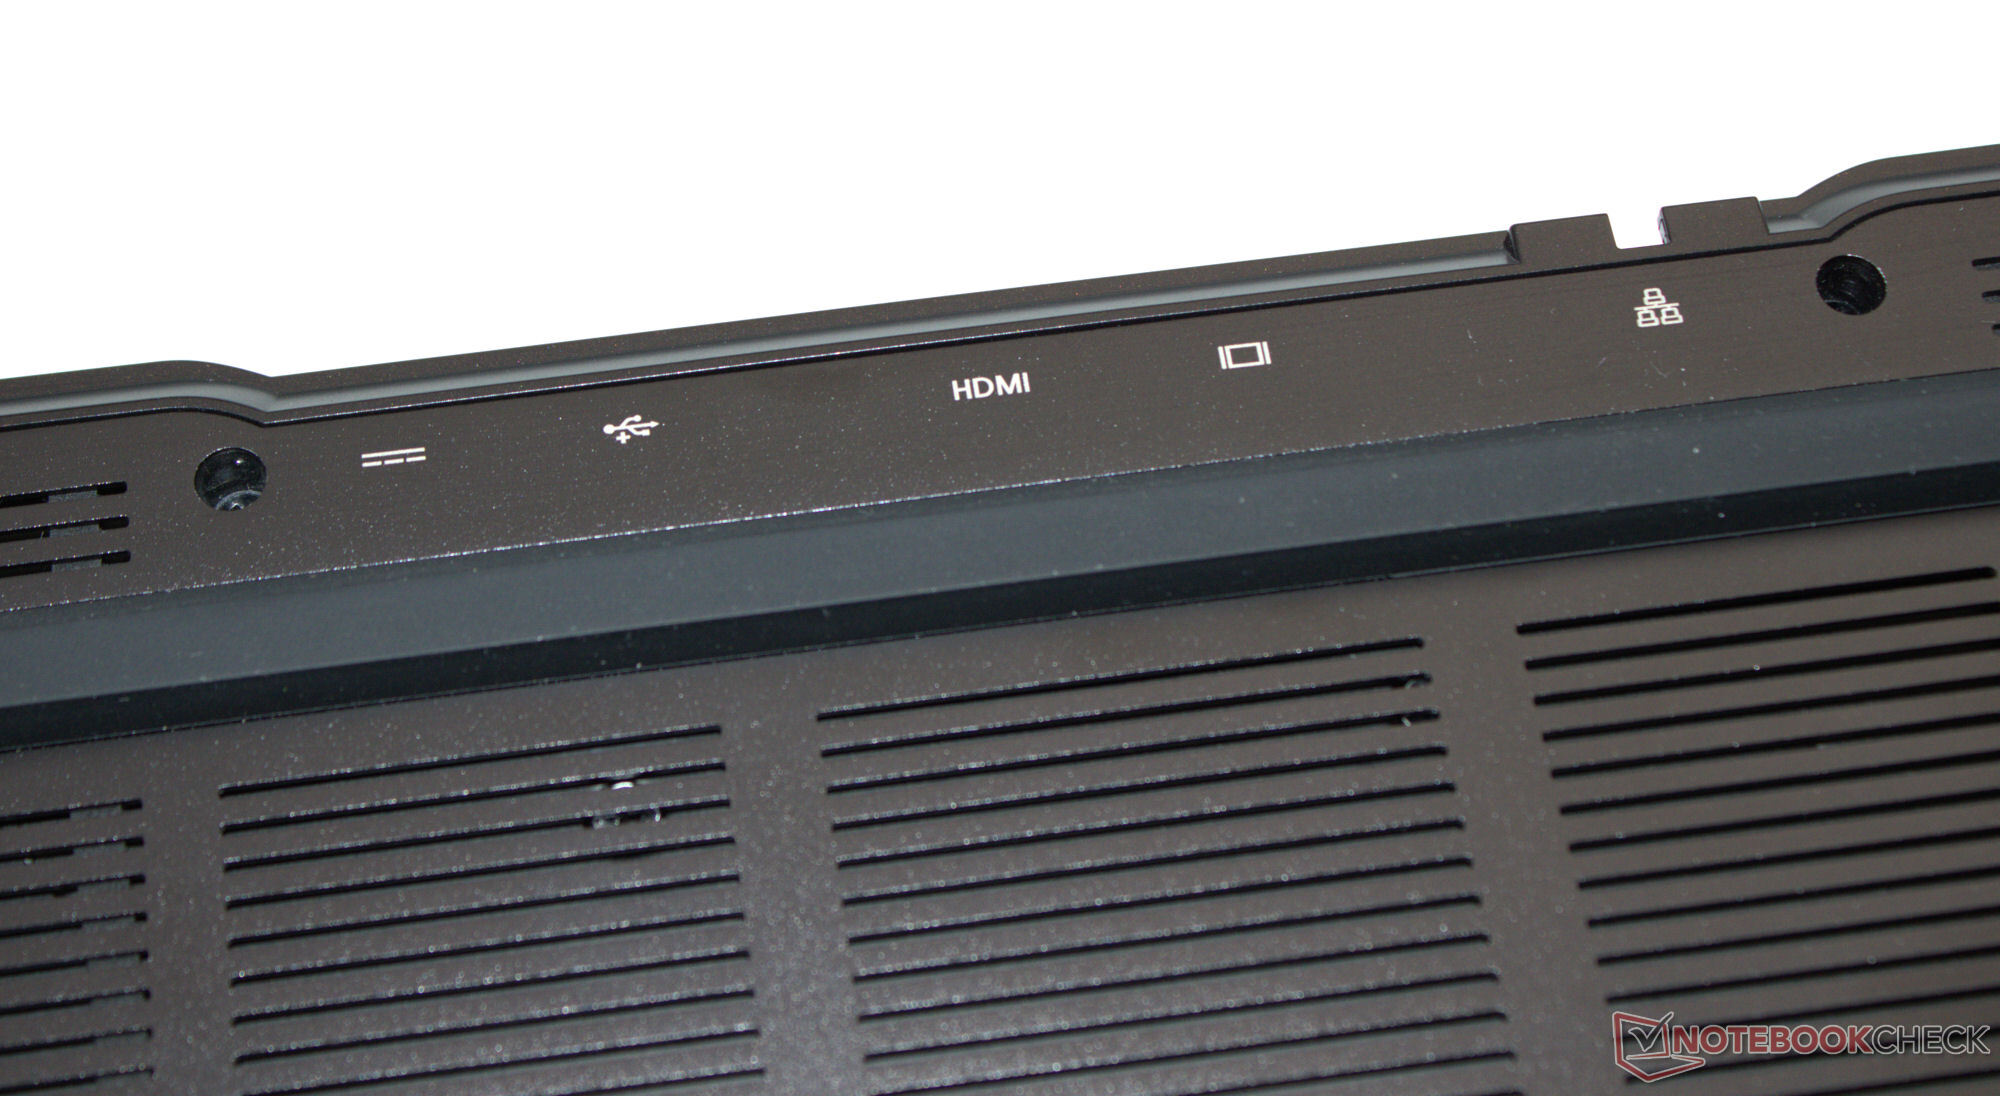
İki USB-A portu (USB 3.2 Gen 1), iki USB-C portu (1x USB 3.2 Gen 2, 1x TB 4/USB 4) ve üç video çıkışı çoğu kullanıcı için yeterli olacaktır; en kötü senaryoda bir yerleştirme istasyonuna ulaşmanız gerekebilir. TB4 portu sayesinde Güç Dağıtımı desteklenmektedir. Gigabit Ethernet portu 2,5 Gbit/sn'ye kadar veri hızlarına izin verir.
Optimum koşullar altında (yakın çevrede WiFi cihazı yok, dizüstü bilgisayar ile sunucu bilgisayar arasında kısa mesafe), Intel'in WiFi-6E çipi (AX211) iyi ila çok iyi veri hızları üretir. FHD web kamerası (2.1 MP, kapaksız) şaşırtıcı çekimler yapmıyor. MicroSD kart okuyucu (referans kart: AV PRO microSD 128 GB V60) ortalama hızdadır.


| SD Card Reader | |
| average JPG Copy Test (av. of 3 runs) | |
| Aorus 16X 2024 (AV PRO microSD 128 GB V60) | |
| Sınıf ortalaması Gaming (19 - 197.3, n=68, son 2 yıl) | |
| SCHENKER XMG Pro 16 Studio (Mid 23) (AV PRO microSD 128 GB V60) | |
| SCHENKER XMG Pro 16 Studio (Mid 24) (AV PRO microSD 128 GB V60) | |
| Lenovo Legion 7 16 IRX G9 (Angelbird AV Pro V60) | |
| Acer Predator Helios Neo 16 (2024) (AV PRO microSD 128 GB V60) | |
| maximum AS SSD Seq Read Test (1GB) | |
| Aorus 16X 2024 (AV PRO microSD 128 GB V60) | |
| Sınıf ortalaması Gaming (25.8 - 263, n=67, son 2 yıl) | |
| SCHENKER XMG Pro 16 Studio (Mid 23) (AV PRO microSD 128 GB V60) | |
| Lenovo Legion 7 16 IRX G9 (Angelbird AV Pro V60) | |
| SCHENKER XMG Pro 16 Studio (Mid 24) (AV PRO microSD 128 GB V60) | |
| Acer Predator Helios Neo 16 (2024) (AV PRO microSD 128 GB V60) | |

 NVIDIA GeForce RTX 4070 Laptop GPU, i9-14900HX, Samsung 990 Pro 1 TB")
 NVIDIA GeForce RTX 4070 Laptop GPU, i9-14900HX, Samsung 990 Pro 1 TB")
Sürdürülebilirlik
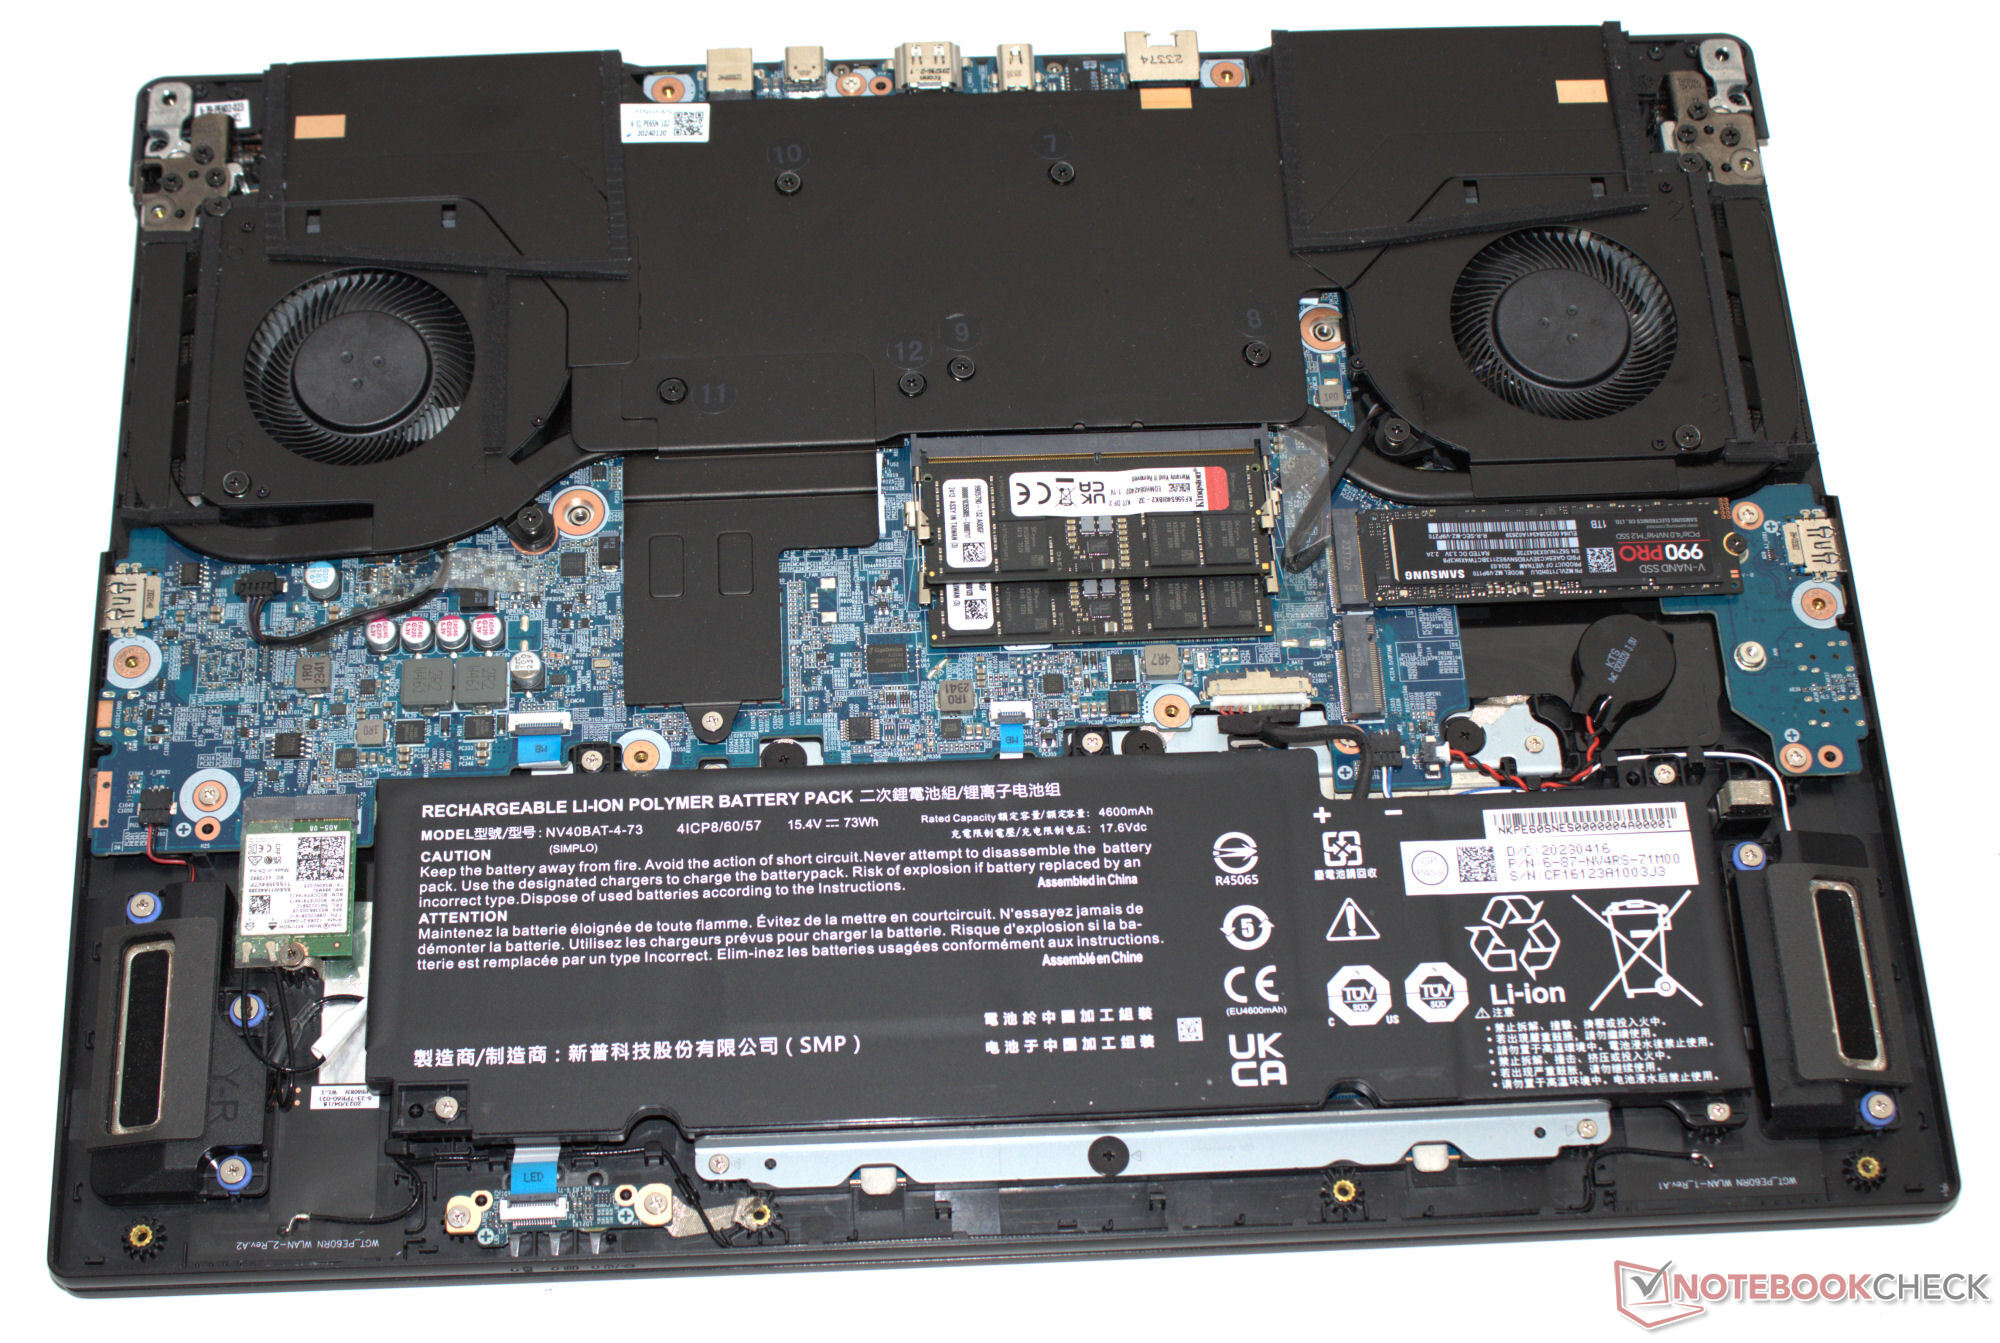
Dizüstü bilgisayar ve aksesuarları her türlü plastik kılıfla (köpük taşıyıcı, film, torba) korunur. Kullanılan plastiklerin isimleri üzerlerine basılmıştır. İstisna olarak: Kapaktaki şeffaf film kapağın üzerinde ilgili bilgiler bulunmamaktadır. Cihazın donanımına taban plakasını çıkardıktan sonra erişilebilir; böylece bakım ve onarım işlerini gerçekleştirebilirsiniz. Yazılım güncellemeleri önümüzdeki birkaç yıl için güvence altına alınmalıdır.
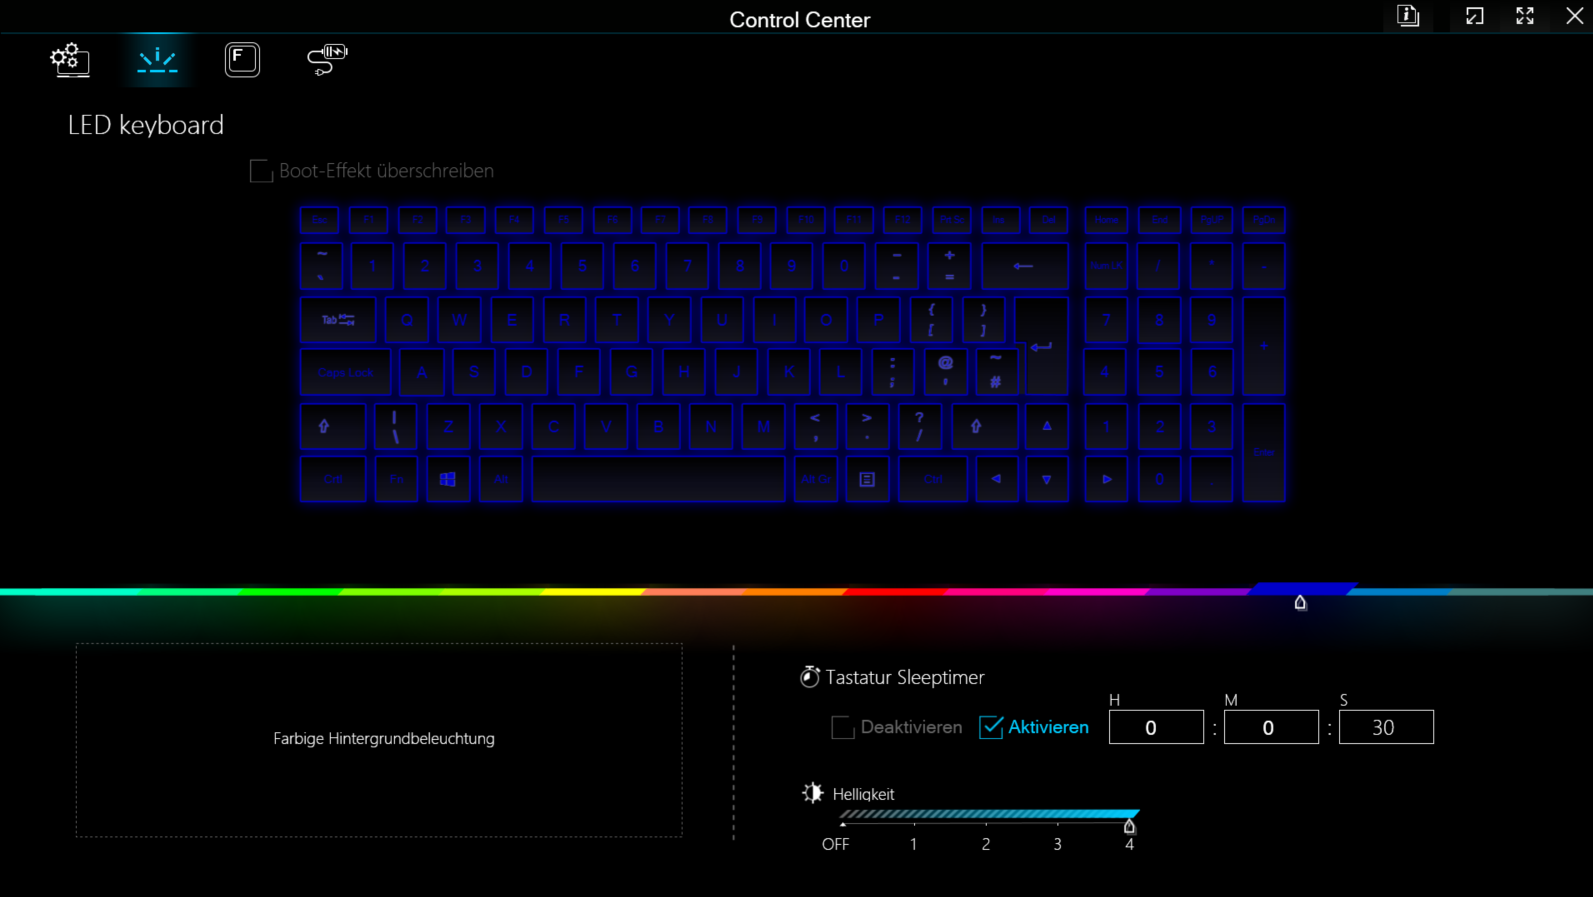
Giriş cihazları - Değiştirilebilir klavyeli XMG dizüstü bilgisayar
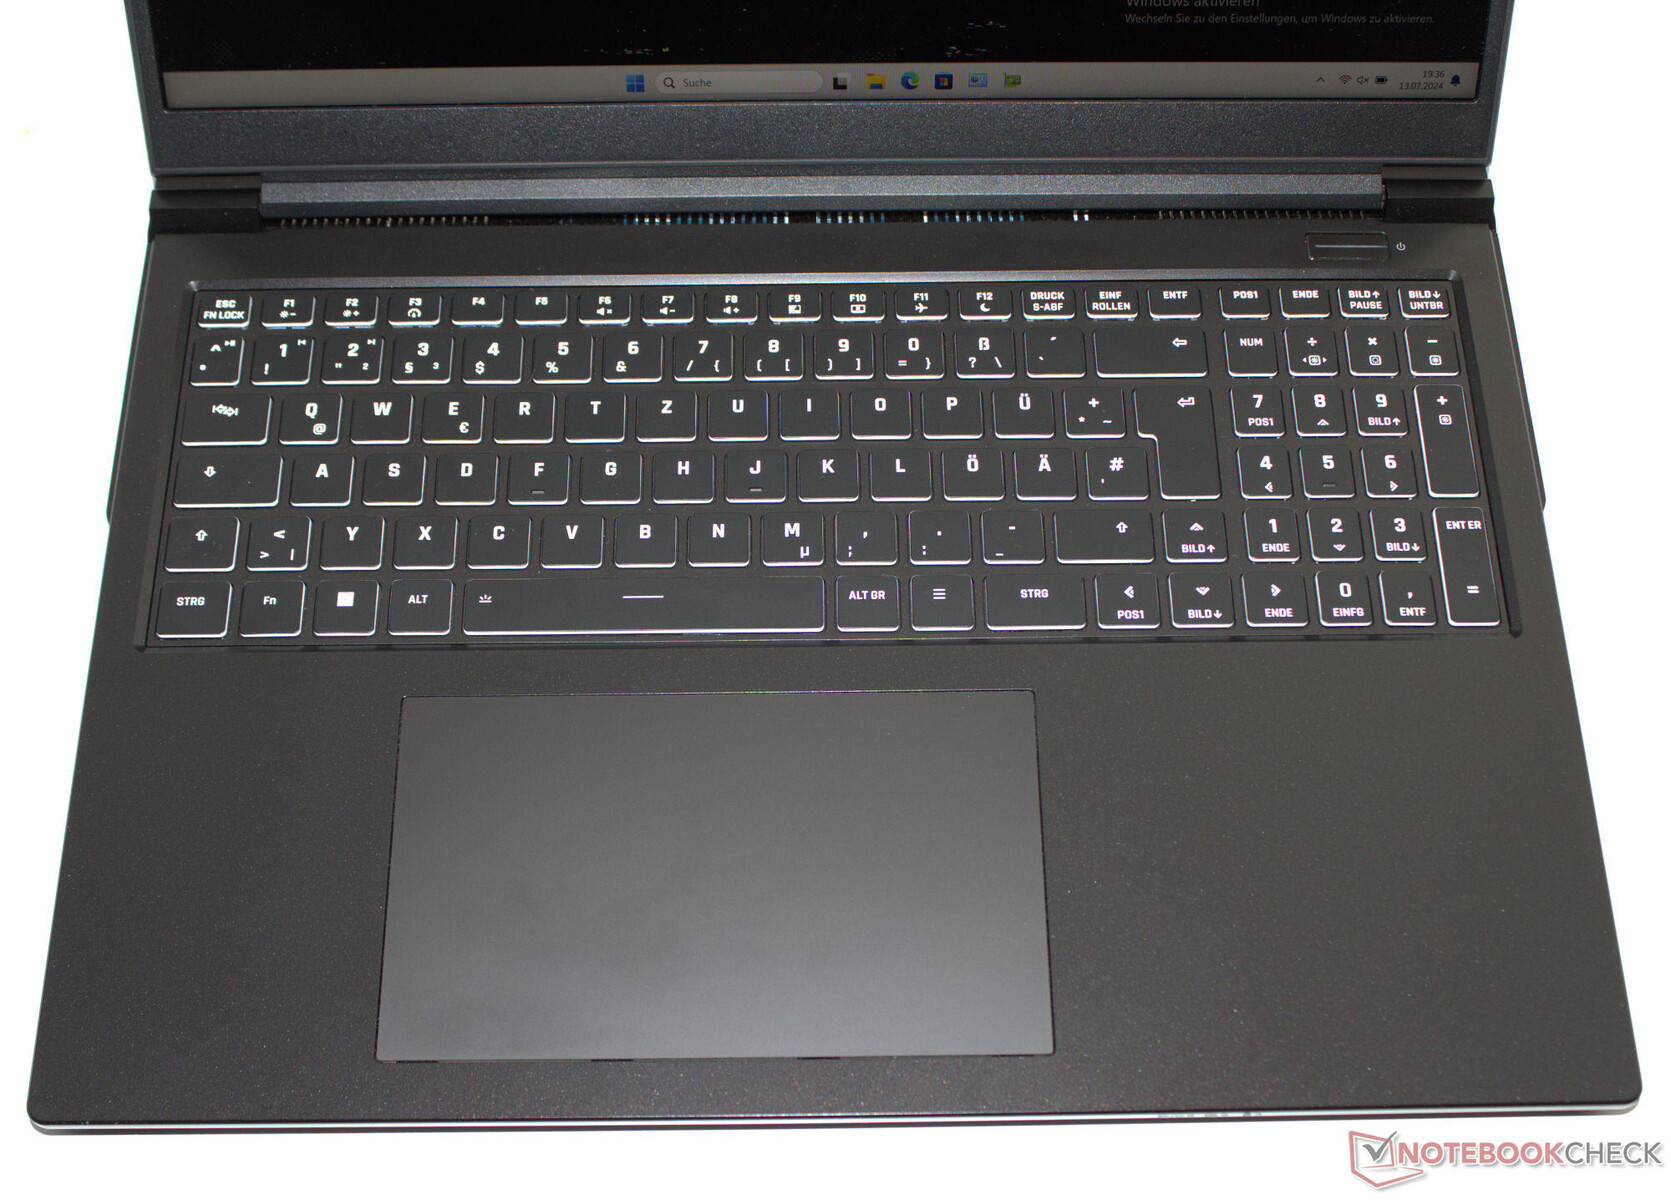
Schenker'de genellikle kural, diğer üreticiler söz konusu olduğunda ise istisnadır: Arkadan aydınlatmalı (RGB, dört seviyeli) chiclet klavye, yalnızca iki vida (ve birkaç klips) ile yerinde tutulduğundan kolayca değiştirilebilir. Düz, pürüzsüz tuşları orta hareket mesafesine ve net bir basınç noktasına sahip. Dirençleri daha keskin olabilirdi ama bu bir zevk meselesi. Klavyenin hafifçe eğilmesi günlük kullanım sırasında size engel olmamalıdır. Pozitif: Dört ok tuşu tam boyutlu. Fare işaretçisini kontrol etmek için cömertçe boyutlandırılmış çoklu dokunmatik tıklama yüzeyi (15,1 x 9,1 cm) kullanılır.
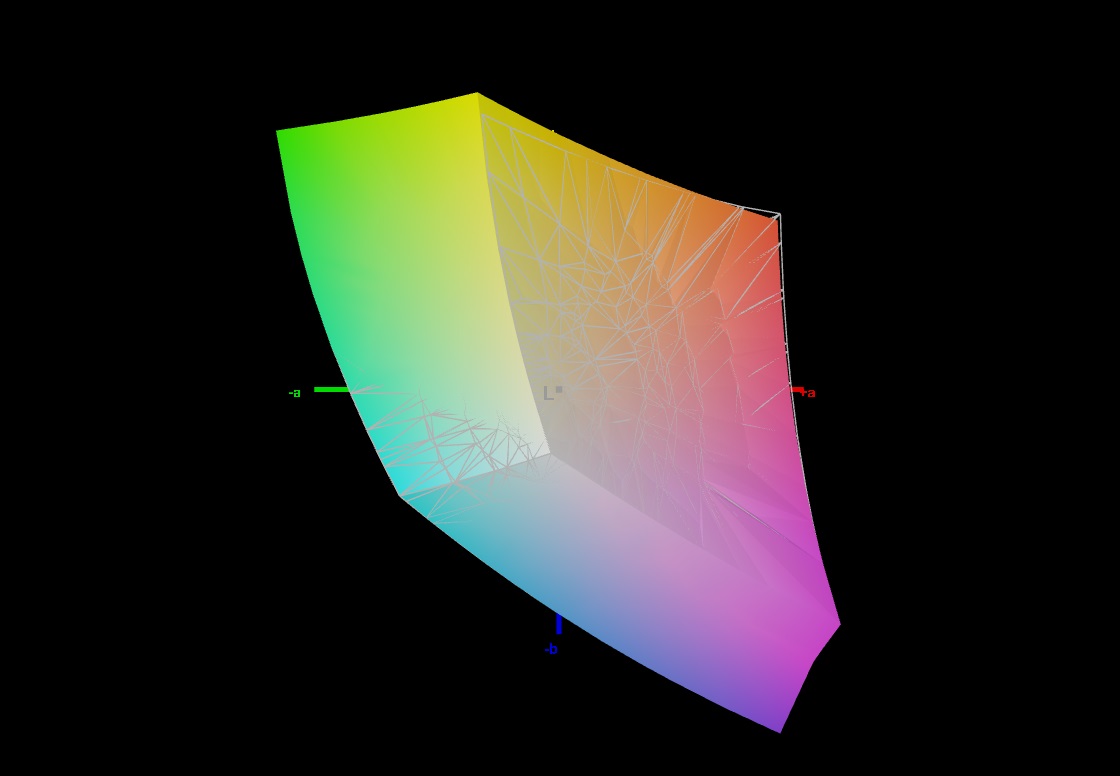
Ekran - 16:10, IPS, sRGB
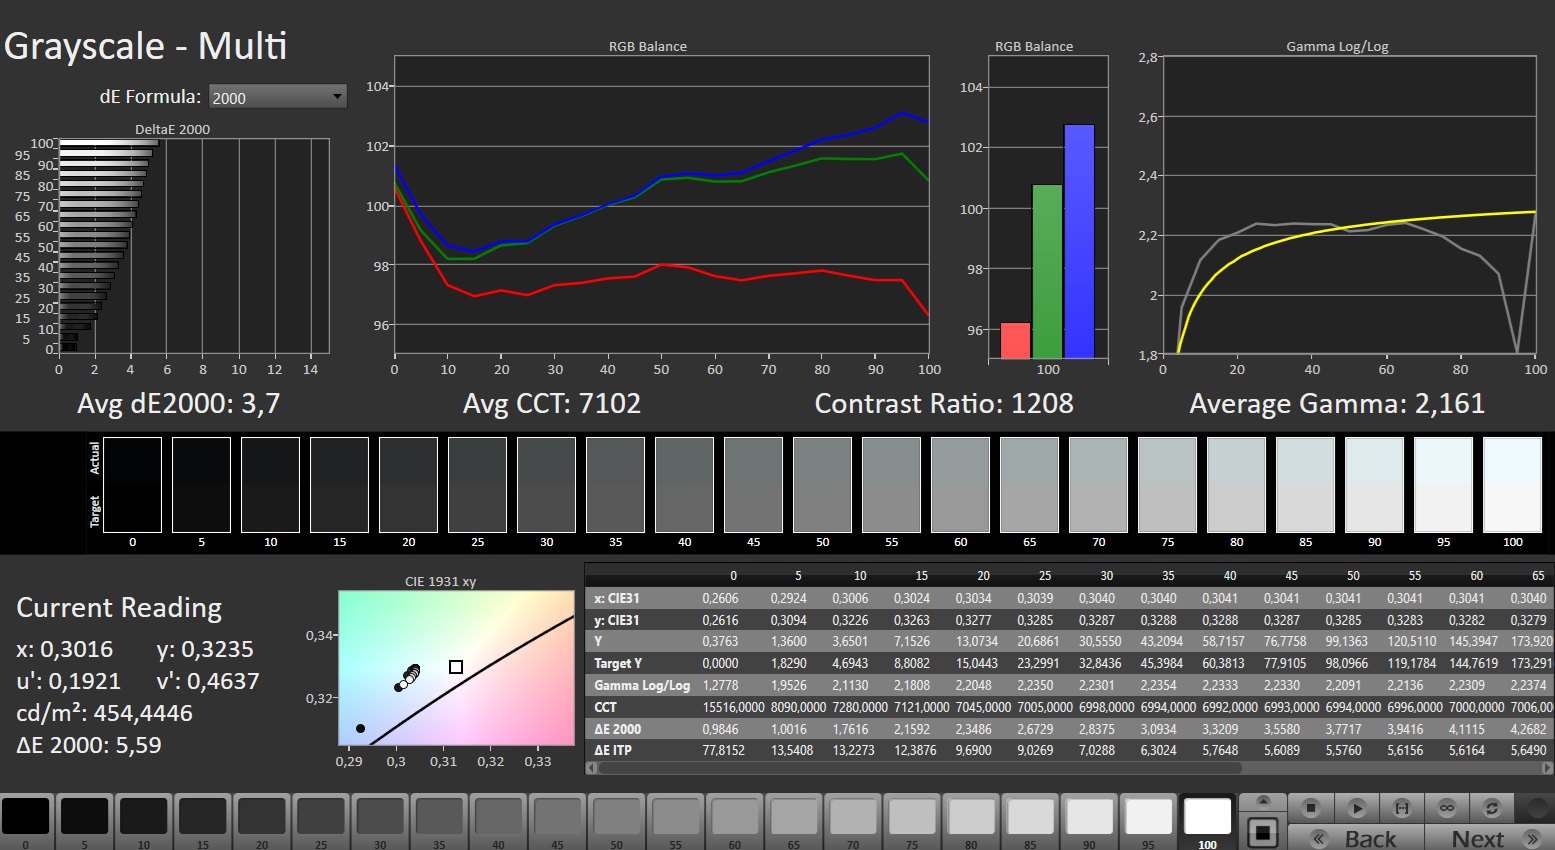
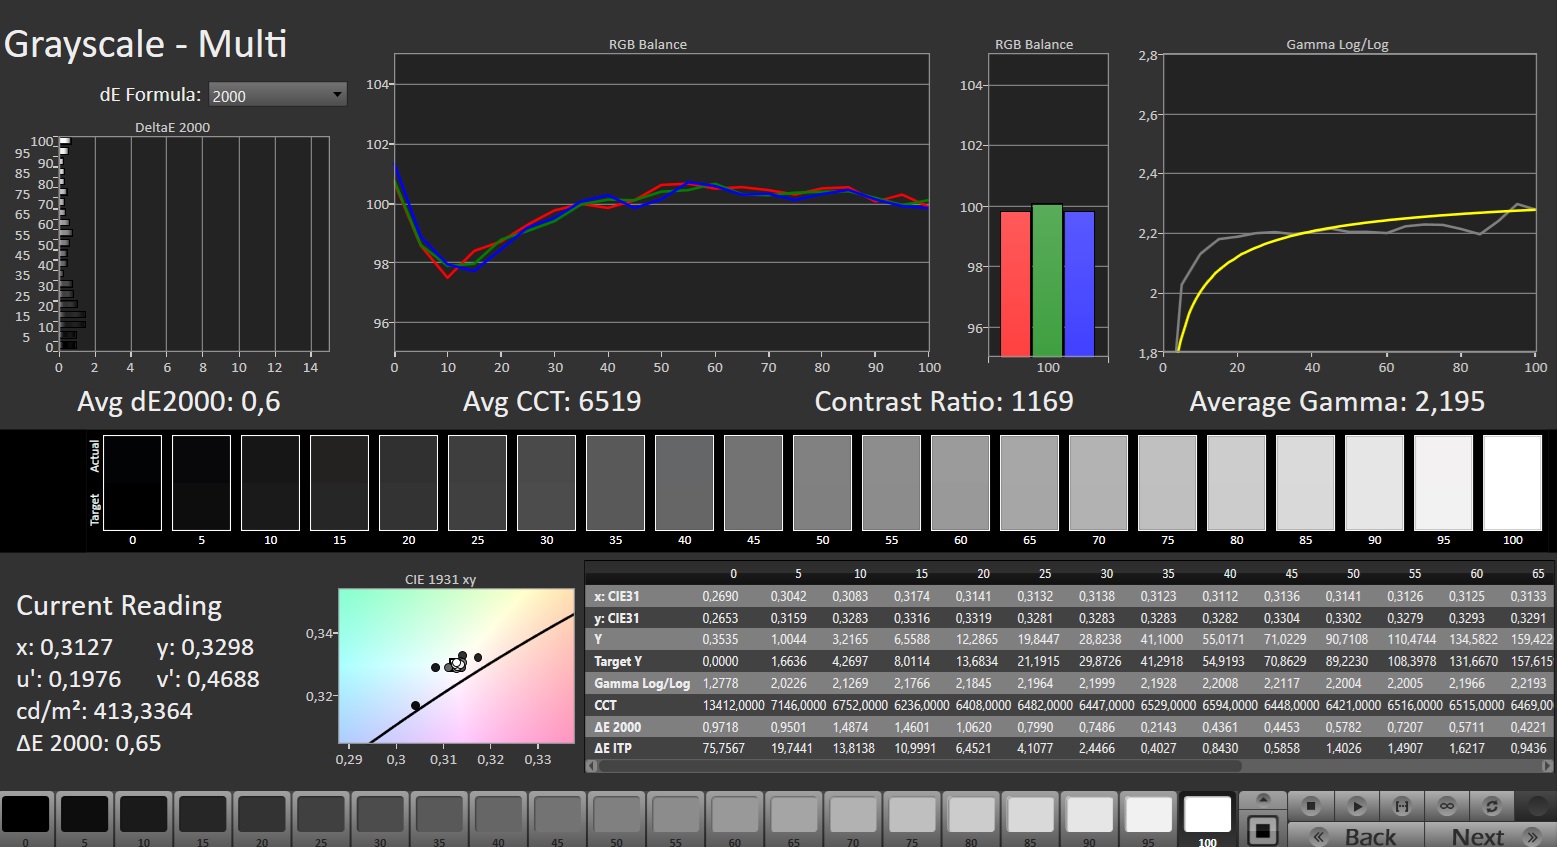
16:10 en boy oranına sahip 16 inç ekran (2.560 x 1.600 piksel) tanıdık: Dizüstü bilgisayar, BOE'nin zaten içinde kullanılan aynı IPS panelini kullanıyor pro 16'nın 2023 versiyonu. Bununla birlikte, biraz daha yüksek bir maksimum parlaklıktan yararlanıyor. Genel olarak, ekranın ölçtüğümüz değerleri iç mekan kullanımı için yeterli. Güneş çok parlak olmadığı sürece açık havada okumak mümkün olacaktır. Pozitif: Duyarlı 240 Hz panel PWM titremesi göstermiyor. Alternatif ekran seçenekleri mevcut değil.
| |||||||||||||||||||||||||
Aydınlatma: 86 %
Batarya modunda parlaklık: 416 cd/m²
Kontrast: 1095:1 (Siyah: 0.38 cd/m²)
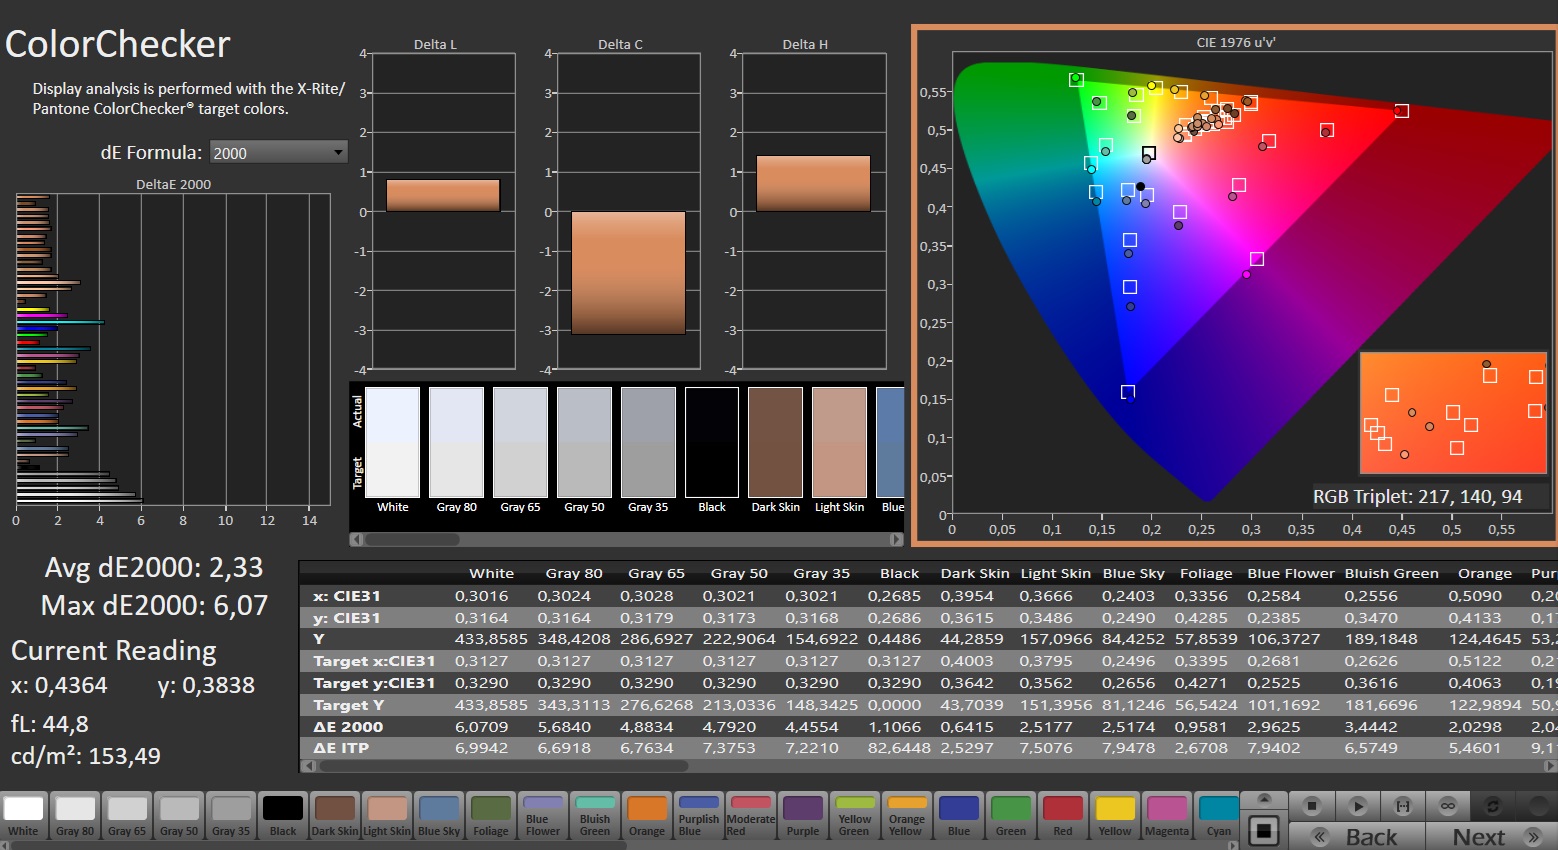
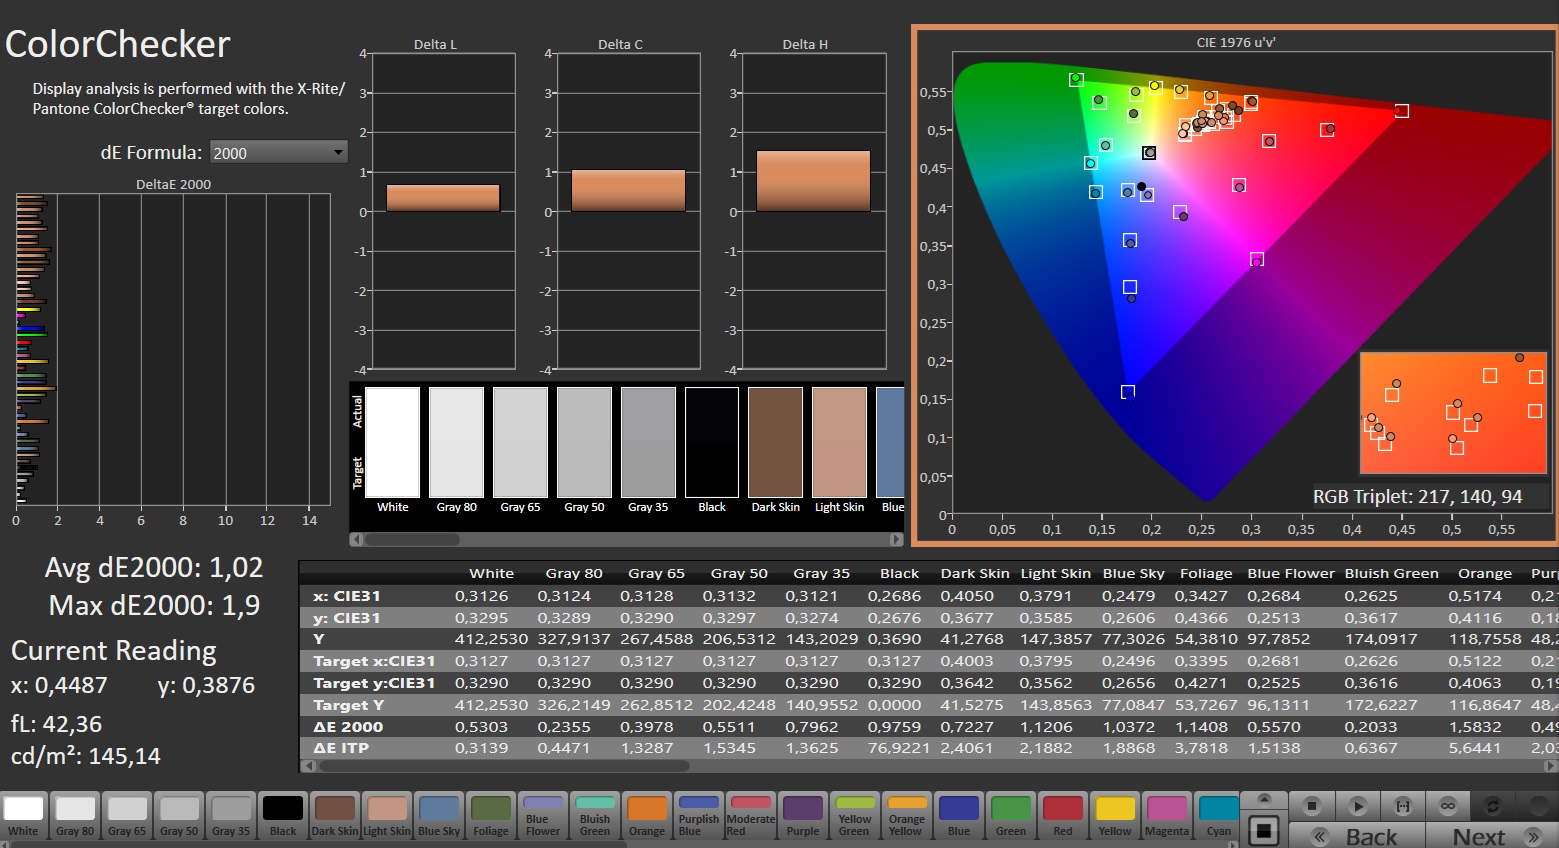
ΔE Color 2.33 | 0.5-29.43 Ø4.87, calibrated: 1.02
ΔE Greyscale 3.7 | 0.5-98 Ø5.1
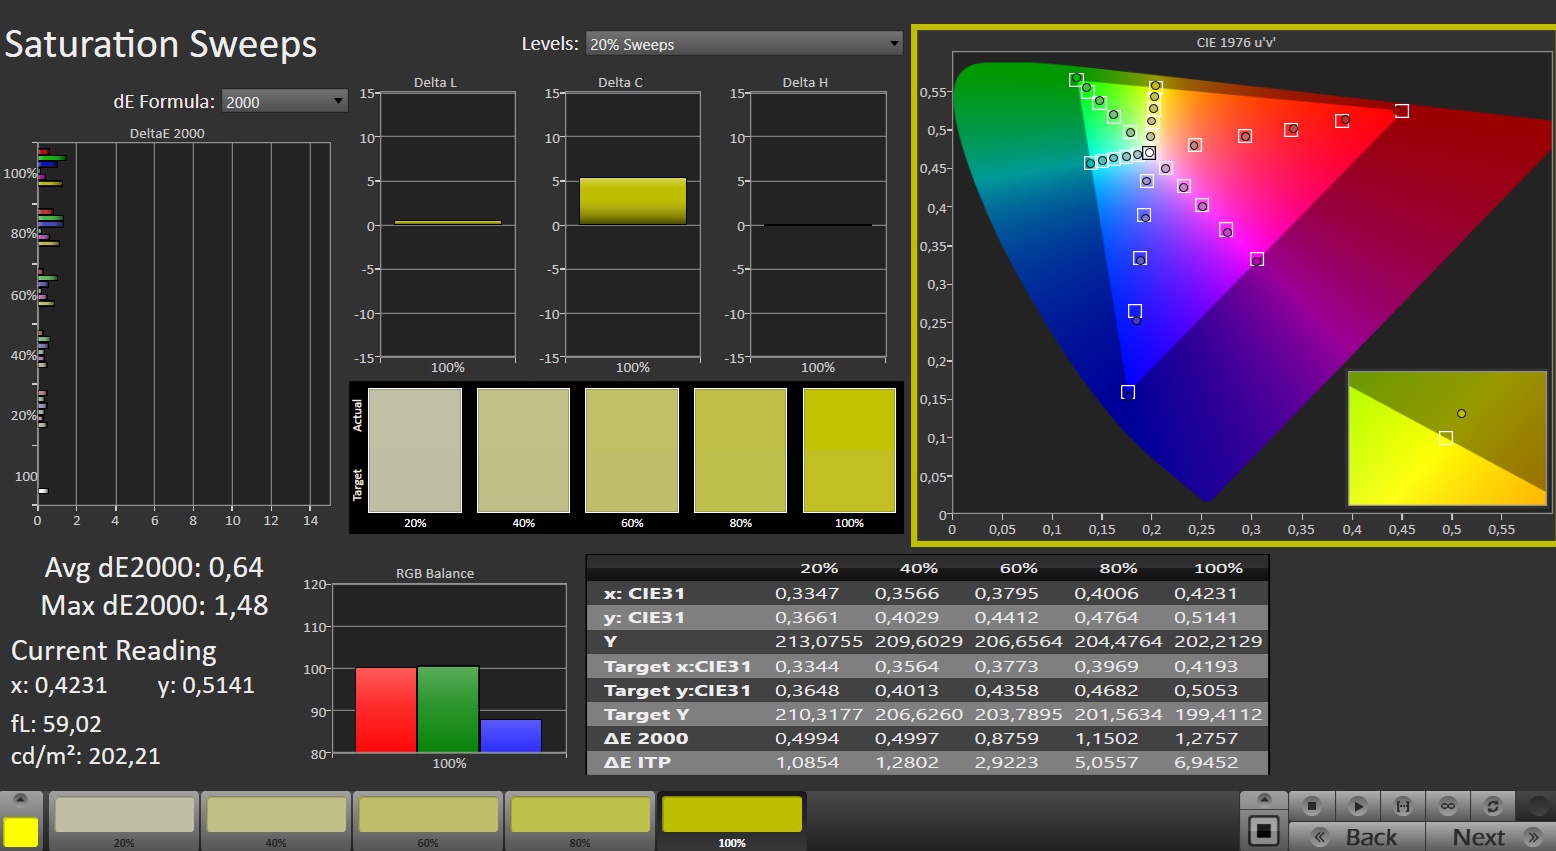
70.8% AdobeRGB 1998 (Argyll 2.2.0 3D)
99.5% sRGB (Argyll 2.2.0 3D)
68.8% Display P3 (Argyll 2.2.0 3D)
Gamma: 2.161
| SCHENKER XMG Pro 16 Studio (Mid 24) BOE CQ NE160QDM-NZ1, IPS, 2560x1600, 16" | Acer Predator Helios Neo 16 (2024) Chi Mei N160GME-GTB, LED, 2560x1600, 16" | Lenovo Legion Pro 5 16IRX9 BOE NE160QDM-NYC, IPS, 2560x1600, 16" | Aorus 16X 2024 BOE CQ NE160QDM-NY1, IPS, 2560x1600, 16" | SCHENKER XMG Pro 16 Studio (Mid 23) BOE CQ NE160QDM-NZ1, IPS, 2560x1600, 16" | Lenovo Legion 7 16 IRX G9 MNG007ZA1-2, IPS, 3200x2000, 16" | |
|---|---|---|---|---|---|---|
| Display | 20% | 0% | -2% | -0% | 21% | |
| Display P3 Coverage | 68.8 | 95.9 39% | 69.3 1% | 67.2 -2% | 69.4 1% | 95 38% |
| sRGB Coverage | 99.5 | 99.8 0% | 99.4 0% | 96.7 -3% | 98.2 -1% | 100 1% |
| AdobeRGB 1998 Coverage | 70.8 | 86.4 22% | 70.1 -1% | 69.3 -2% | 70.1 -1% | 87.2 23% |
| Response Times | 11% | -18% | 28% | -9% | -14% | |
| Response Time Grey 50% / Grey 80% * | 12.7 ? | 5 ? 61% | 11.9 ? 6% | 7.5 ? 41% | 12.2 ? 4% | 14.4 ? -13% |
| Response Time Black / White * | 6.3 ? | 8.8 ? -40% | 8.9 ? -41% | 5.4 ? 14% | 7.7 ? -22% | 7.2 ? -14% |
| PWM Frequency | ||||||
| Screen | 19% | 20% | 4% | -5% | 23% | |
| Brightness middle | 416 | 521 25% | 384 -8% | 542 30% | 349 -16% | 412 -1% |
| Brightness | 392 | 506 29% | 366 -7% | 504 29% | 348 -11% | 396 1% |
| Brightness Distribution | 86 | 85 -1% | 91 6% | 86 0% | 93 8% | 89 3% |
| Black Level * | 0.38 | 0.44 -16% | 0.35 8% | 0.45 -18% | 0.32 16% | 0.43 -13% |
| Contrast | 1095 | 1184 8% | 1097 0% | 1204 10% | 1091 0% | 958 -13% |
| Colorchecker dE 2000 * | 2.33 | 1.74 25% | 0.97 58% | 2.73 -17% | 1.98 15% | 0.9 61% |
| Colorchecker dE 2000 max. * | 6.07 | 3.88 36% | 3.57 41% | 5.29 13% | 7.56 -25% | 2 67% |
| Colorchecker dE 2000 calibrated * | 1.02 | 0.52 49% | 0.77 25% | 1.32 -29% | 1.45 -42% | 0.6 41% |
| Greyscale dE 2000 * | 3.7 | 3 19% | 1.5 59% | 2.9 22% | 3.3 11% | 1.4 62% |
| Gamma | 2.161 102% | 2.164 102% | 2.24 98% | 2.192 100% | 2.137 103% | 2.23 99% |
| CCT | 7102 92% | 6816 95% | 6709 97% | 6173 105% | 6672 97% | 6731 97% |
| Toplam Ortalama (Program / Ayarlar) | 17% /
18% | 1% /
11% | 10% /
6% | -5% /
-5% | 10% /
17% |
* ... daha küçük daha iyidir
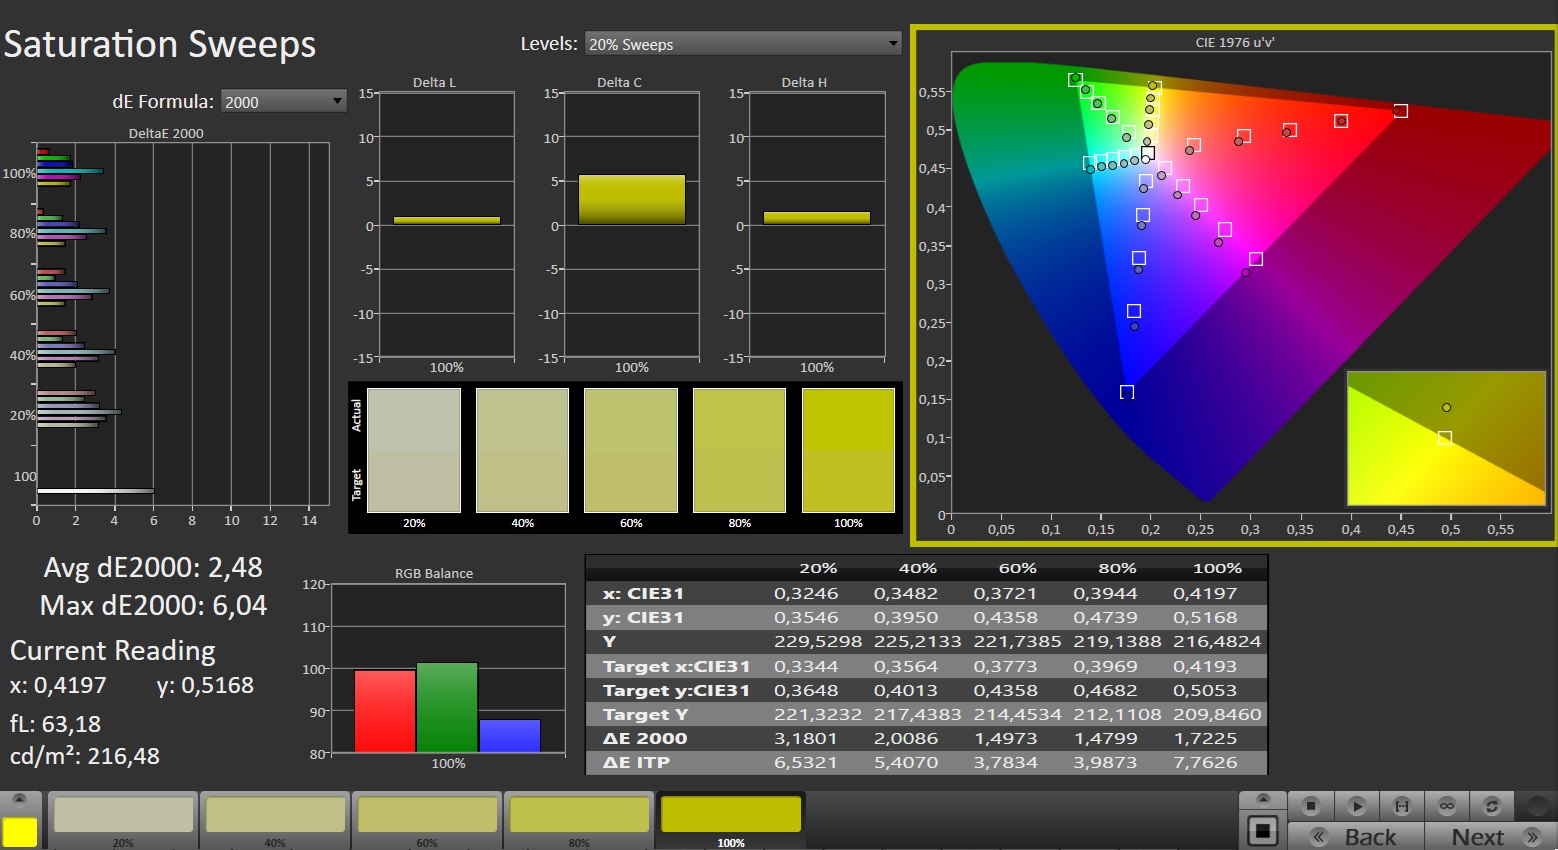
Takılan panelin renk alanı kapsamı hayal kırıklığı yaratıyor. AdobeRGB ve DCI-P3 alanları değil, yalnızca sRGB alanı yeniden üretilebiliyor. Ancak bu, çoğu rakibin ekranlarından farklı değil. Yine de, "içerik oluşturma için profesyonel bir iş istasyonu" olarak pazarlanan bir dizüstü bilgisayarın ekranı gerçekten tüm aralığı sunmalıdır. Renk üretimi daha iyi görünüyor: Hafif bir sapma olan 2,26 (hedef: DeltaE < 3), bir kalibrasyon gerçekleştirilerek 1,03'e düşürülebilir.
Yanıt Sürelerini Görüntüle
| ↔ Tepki Süresi Siyahtan Beyaza | ||
|---|---|---|
| 6.3 ms ... yükseliş ↗ ve sonbahar↘ birleşimi | ↗ 2.5 ms yükseliş | 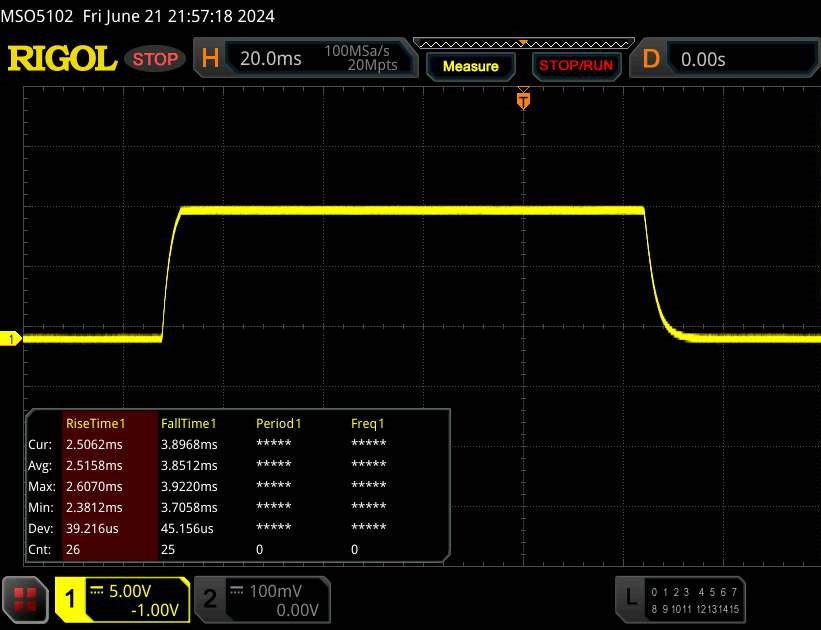 |
| ↘ 3.8 ms sonbahar | ||
| Ekran, testlerimizde çok hızlı yanıt oranları gösteriyor ve hızlı oyun oynamaya çok uygun olmalı. Karşılaştırıldığında, test edilen tüm cihazlar 0.1 (minimum) ile 240 (maksimum) ms arasında değişir. » Tüm cihazların 17 %'si daha iyi. Bu, ölçülen yanıt süresinin test edilen tüm cihazların ortalamasından (20.8 ms) daha iyi olduğu anlamına gelir. | ||
| ↔ Tepki Süresi %50 Griden %80 Griye | ||
| 12.7 ms ... yükseliş ↗ ve sonbahar↘ birleşimi | ↗ 6 ms yükseliş | 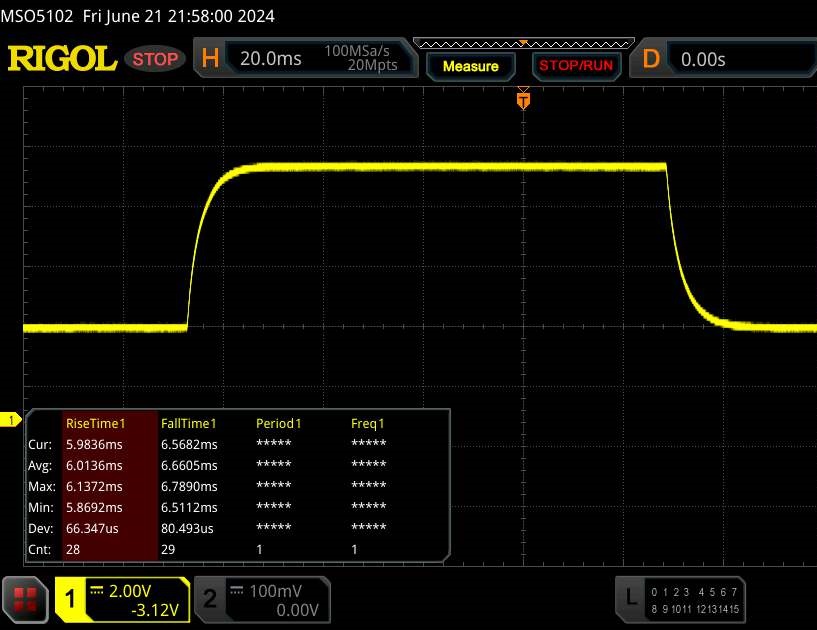 |
| ↘ 6.7 ms sonbahar | ||
| Ekran, testlerimizde iyi yanıt oranları gösteriyor ancak rekabetçi oyuncular için çok yavaş olabilir. Karşılaştırıldığında, test edilen tüm cihazlar 0.165 (minimum) ile 636 (maksimum) ms arasında değişir. » Tüm cihazların 23 %'si daha iyi. Bu, ölçülen yanıt süresinin test edilen tüm cihazların ortalamasından (32.5 ms) daha iyi olduğu anlamına gelir. | ||
Ekran Titremesi / PWM (Darbe Genişliği Modülasyonu)
| Ekran titriyor / PWM algılanmadı |  | ||
Karşılaştırıldığında: Test edilen tüm cihazların %53 %'si ekranı karartmak için PWM kullanmıyor. PWM tespit edilirse, ortalama 8516 (minimum: 5 - maksimum: 343500) Hz ölçüldü. | |||
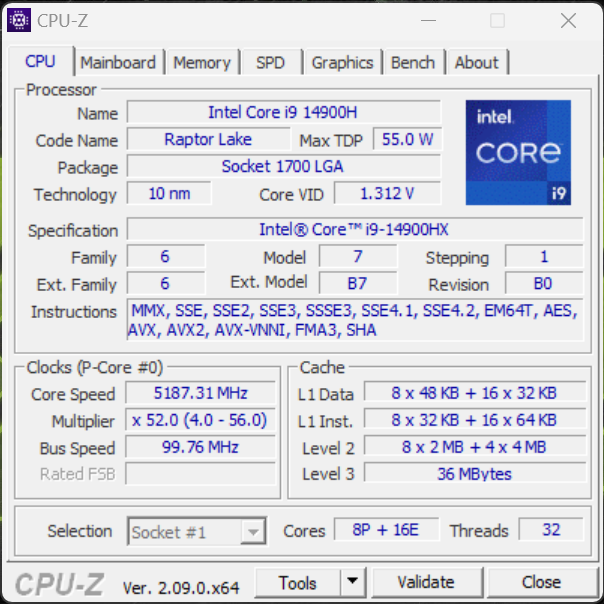
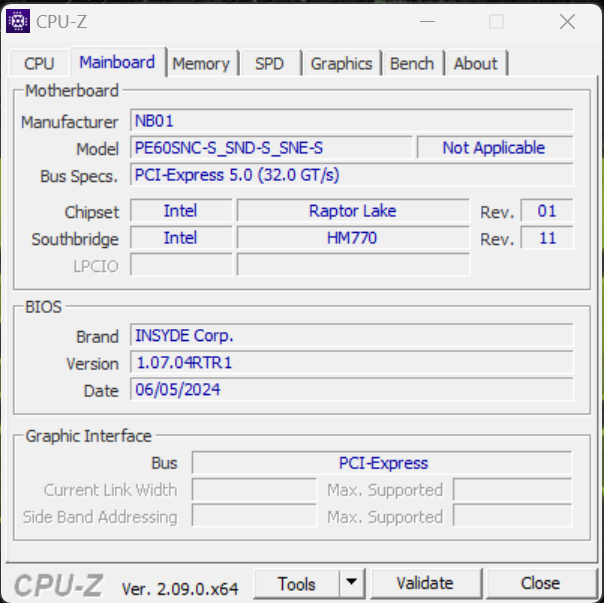
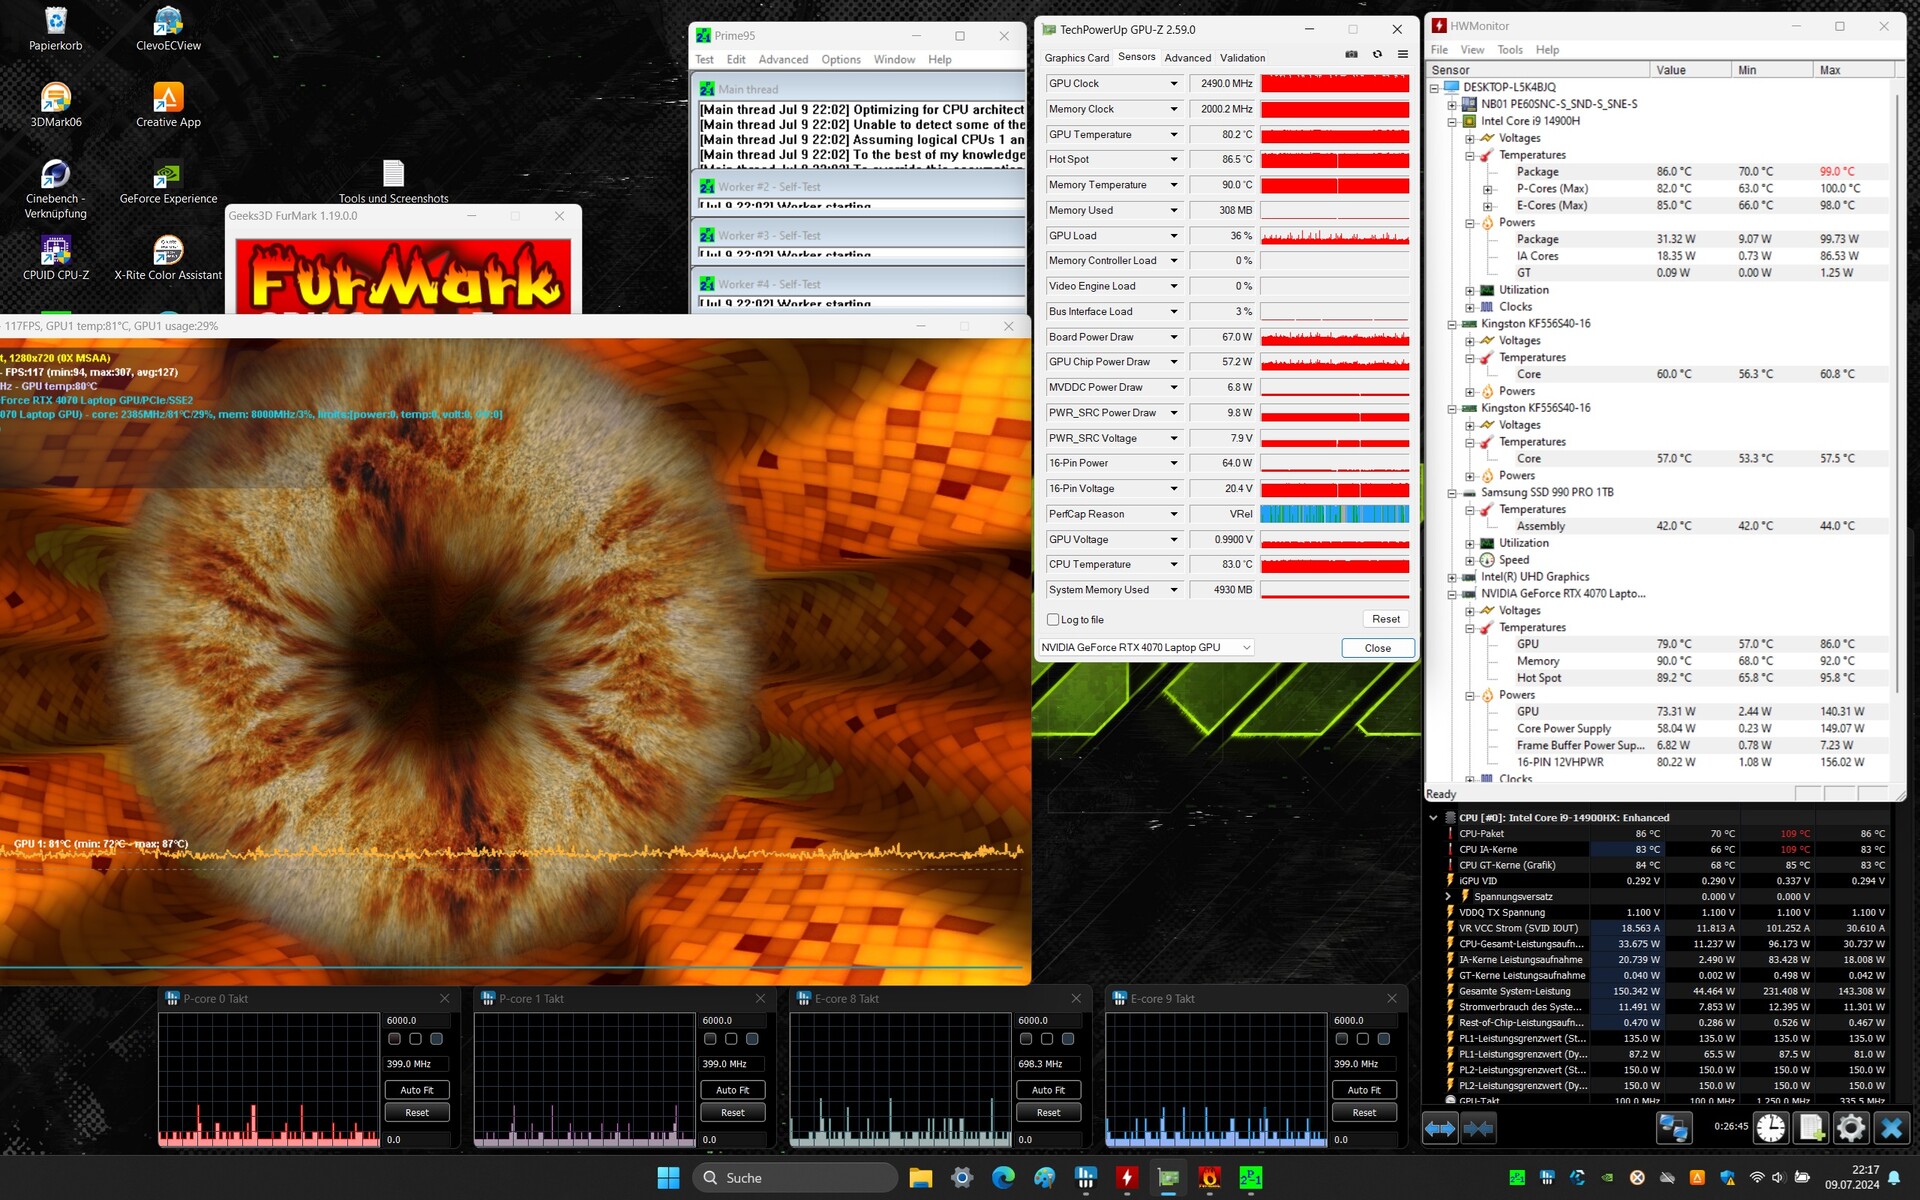
Performans - Raptor Lake Refresh, Raptor Lake'in yerini alıyor
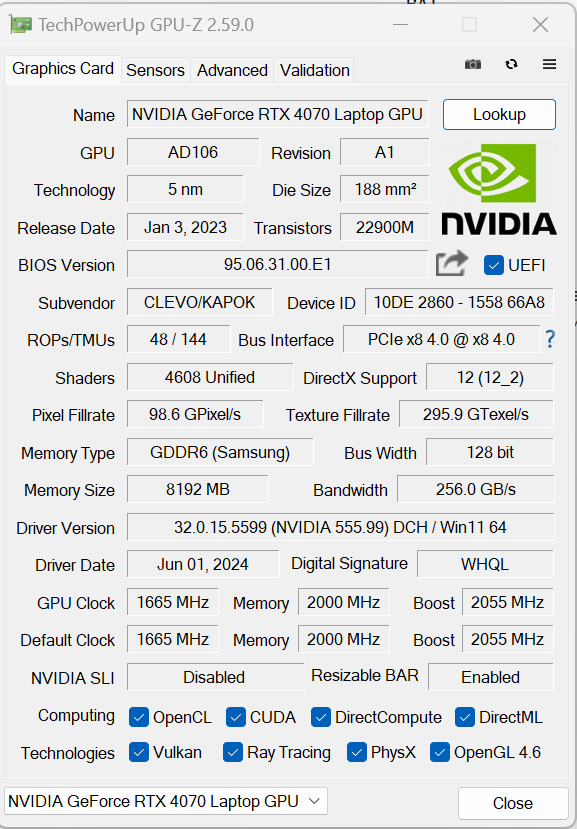
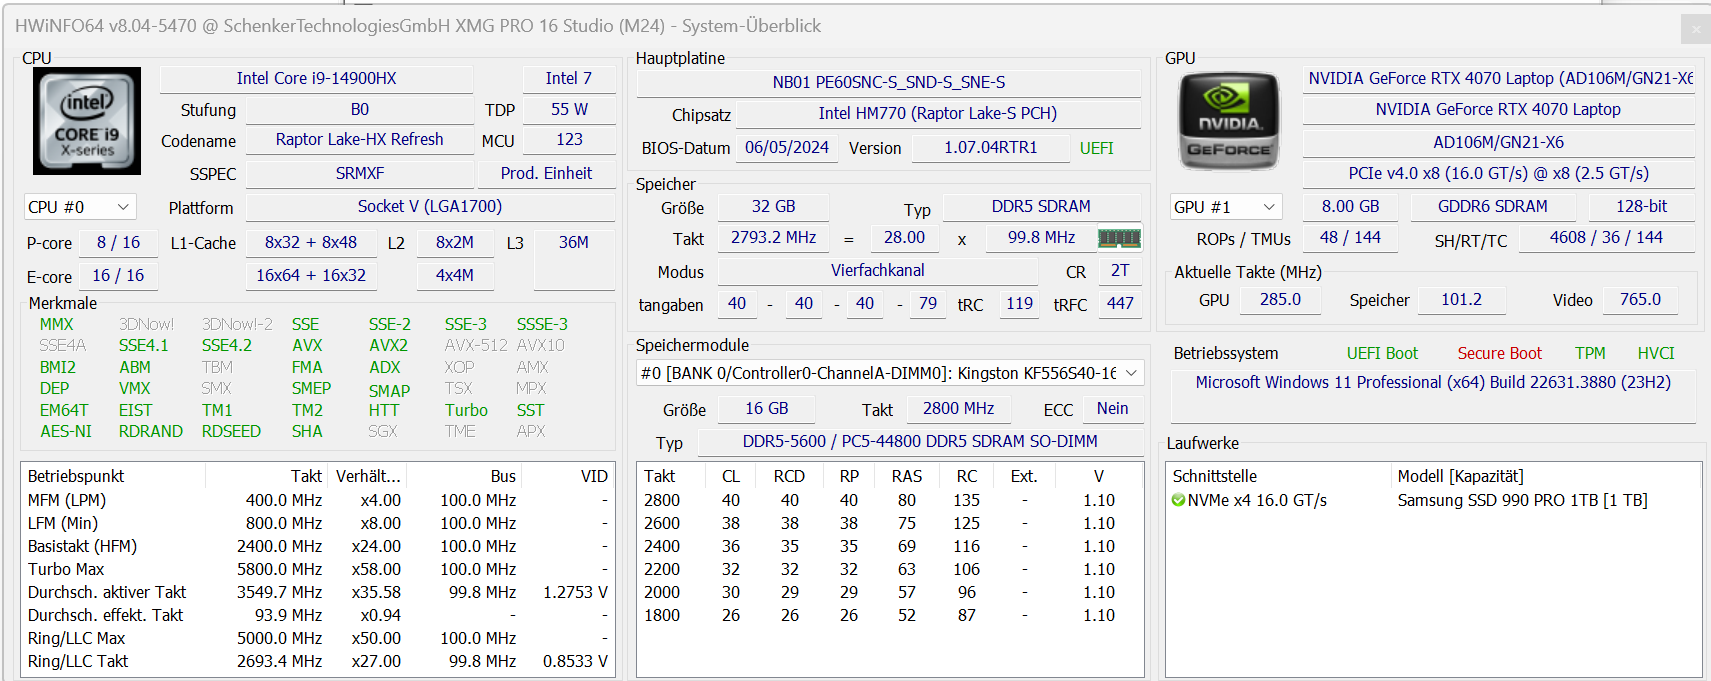
Schenker tarafından "içerik oluşturma dizüstü bilgisayarı" olarak tanımlanan XMG Pro 16 Studio (Mid 24), oyuncuları ve yaratıcıları hedefliyor. Tüm modellerde Core i9-14900HX bulunuyor ve mevcut GPU seçimi bir RTX 4060 ve bir RTX 4070 içeriyor - test cihazımız bir RTX 4070 ile donatılmıştır. Bu varyant yaklaşık 2.500 ABD doları karşılığında mevcuttur. Fiyatlar yaklaşık 1.800 ABD Dolarından başlamaktadır.
Test koşulları
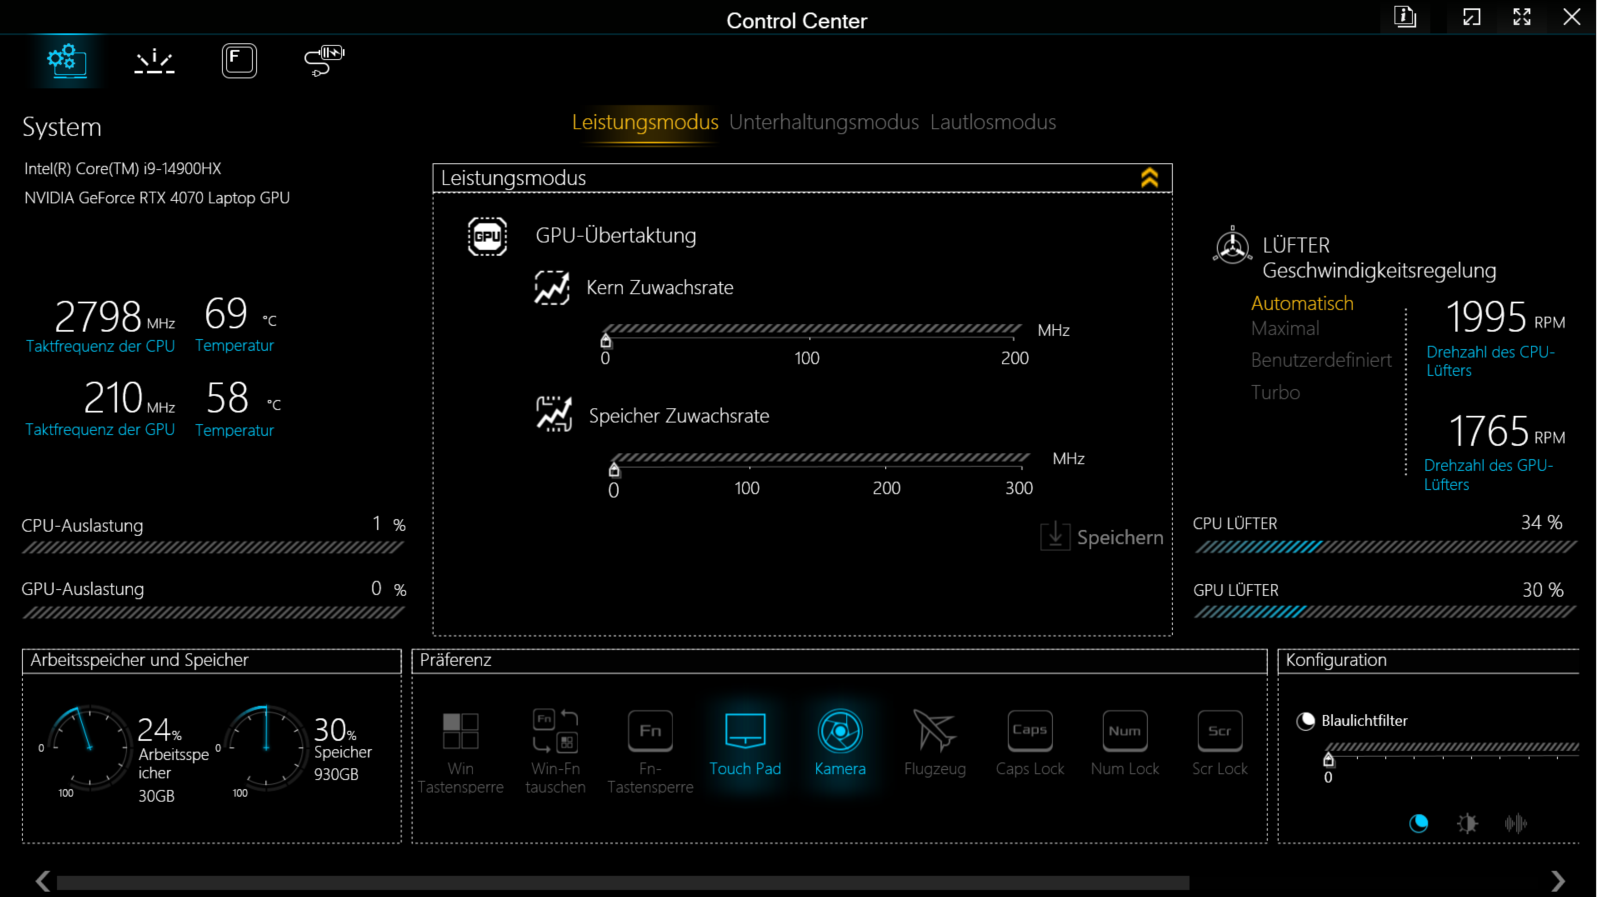
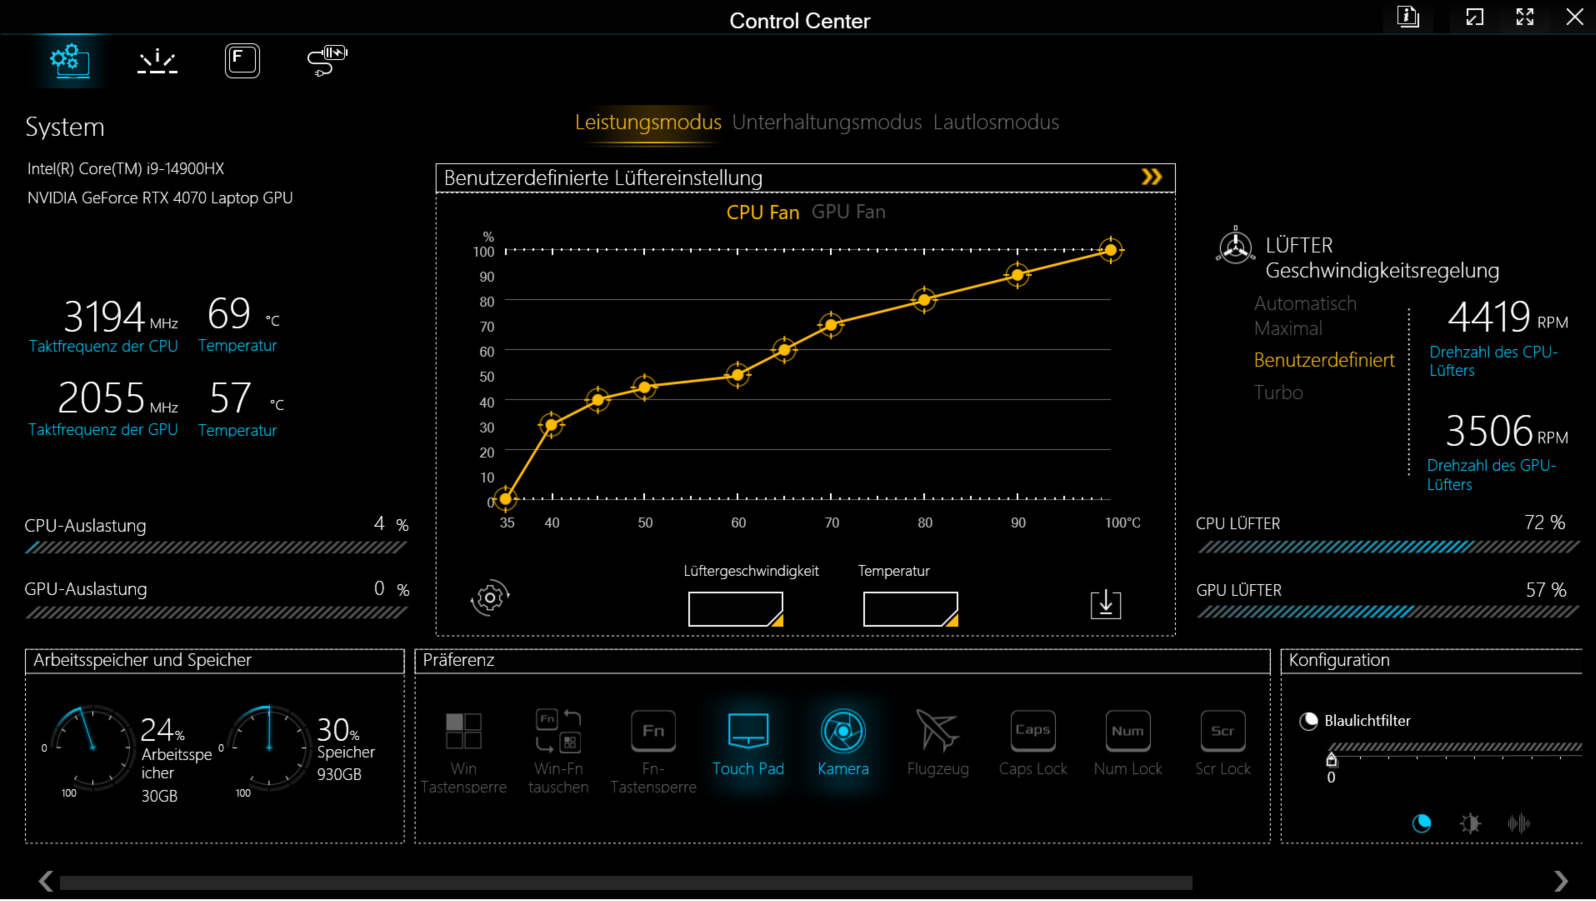
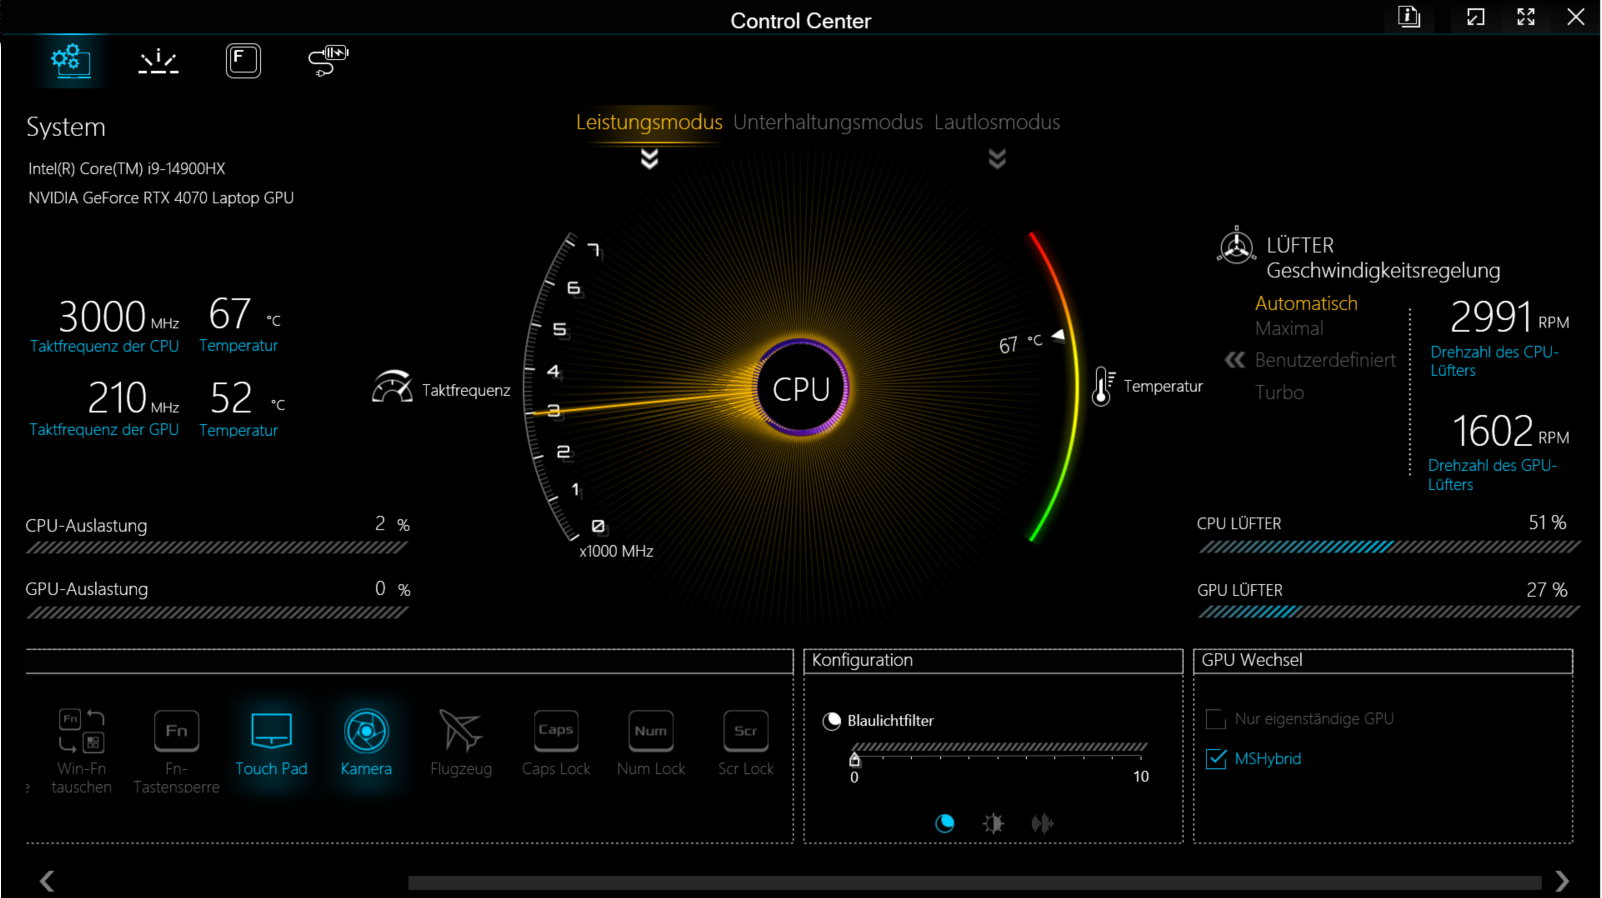
Control Center yazılımı (dizüstü bilgisayarın kontrol merkezi) kullanılarak aralarında geçiş yapılabilen üreticiye özel üç performans modu seçeneği (tabloya bakın) vardır. Biz performans (kıyaslamalar) ve sessiz (pil testleri) modlarını kullandık. Optimus aktifti.
| Performans modu | Eğlence modu | Sessiz mod (dGPU kapalı) | |
|---|---|---|---|
| Güç Sınırı 1 (HWInfo) | 135 watt | 55 watt | 25 watt |
| Güç Sınırı 2 (HWInfo) | 150 watt | 135 watt | 35 watt |
| Gürültü (CP 2077 Phantom) | 53 dB (A) | 49 dB (A) | - |
| Performans (CP 2077 Phantom) | 78 fps | 73 fps | - |
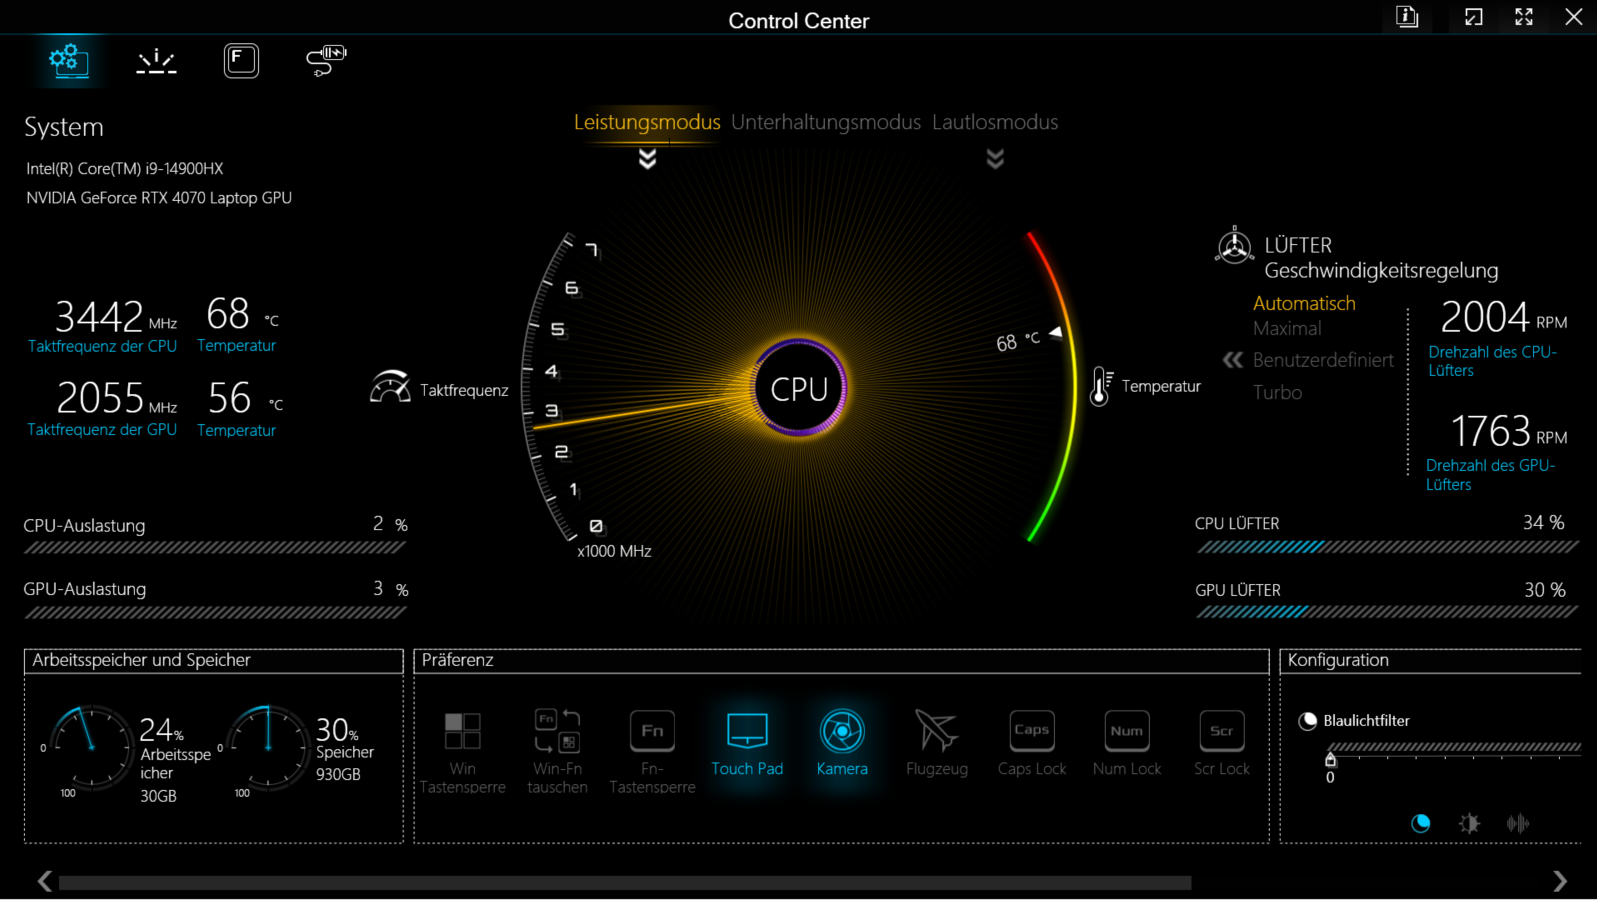
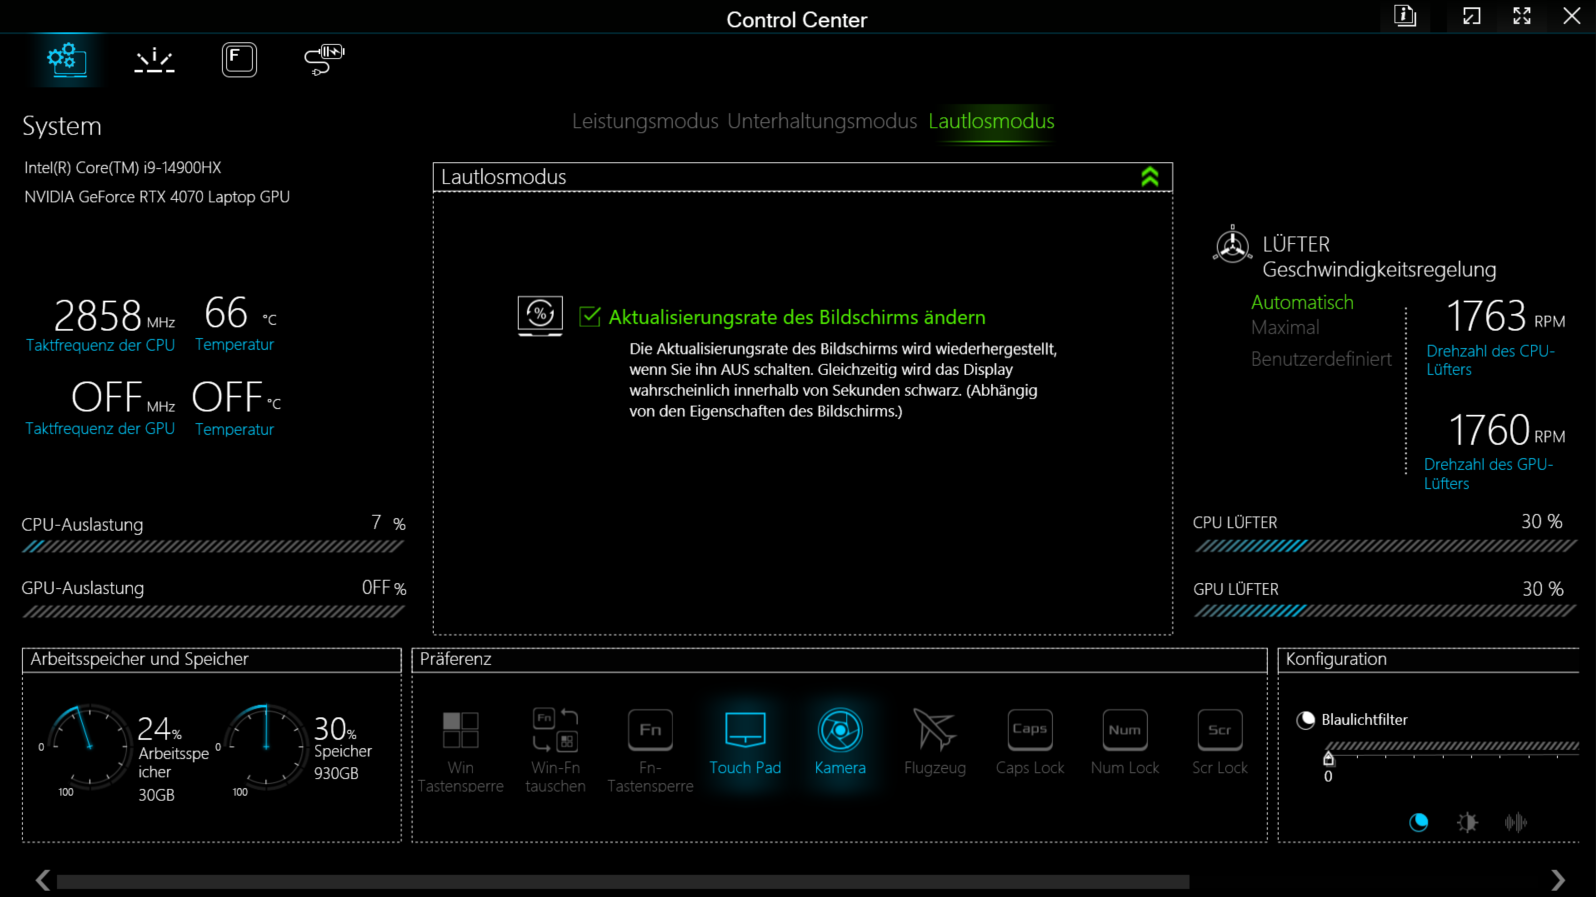
Eğlence modu ile ilgili sorunlar
"Eğlence" profili testimiz sırasında performansta önemli dalgalanmalara neden oldu. Sonuç olarak, bu profili kullanmaktan kaçındık. Test sırasında Schenker, sorunu aşmanın bir yolunu bulmayı başardı: Kontrol Merkezi'nde "sessiz mod" fan seçeneğini etkinleştirmek. Gelecekte yapılacak bir BIOS güncellemesinin bu hatayı düzelteceğini umuyoruz.
İşlemci
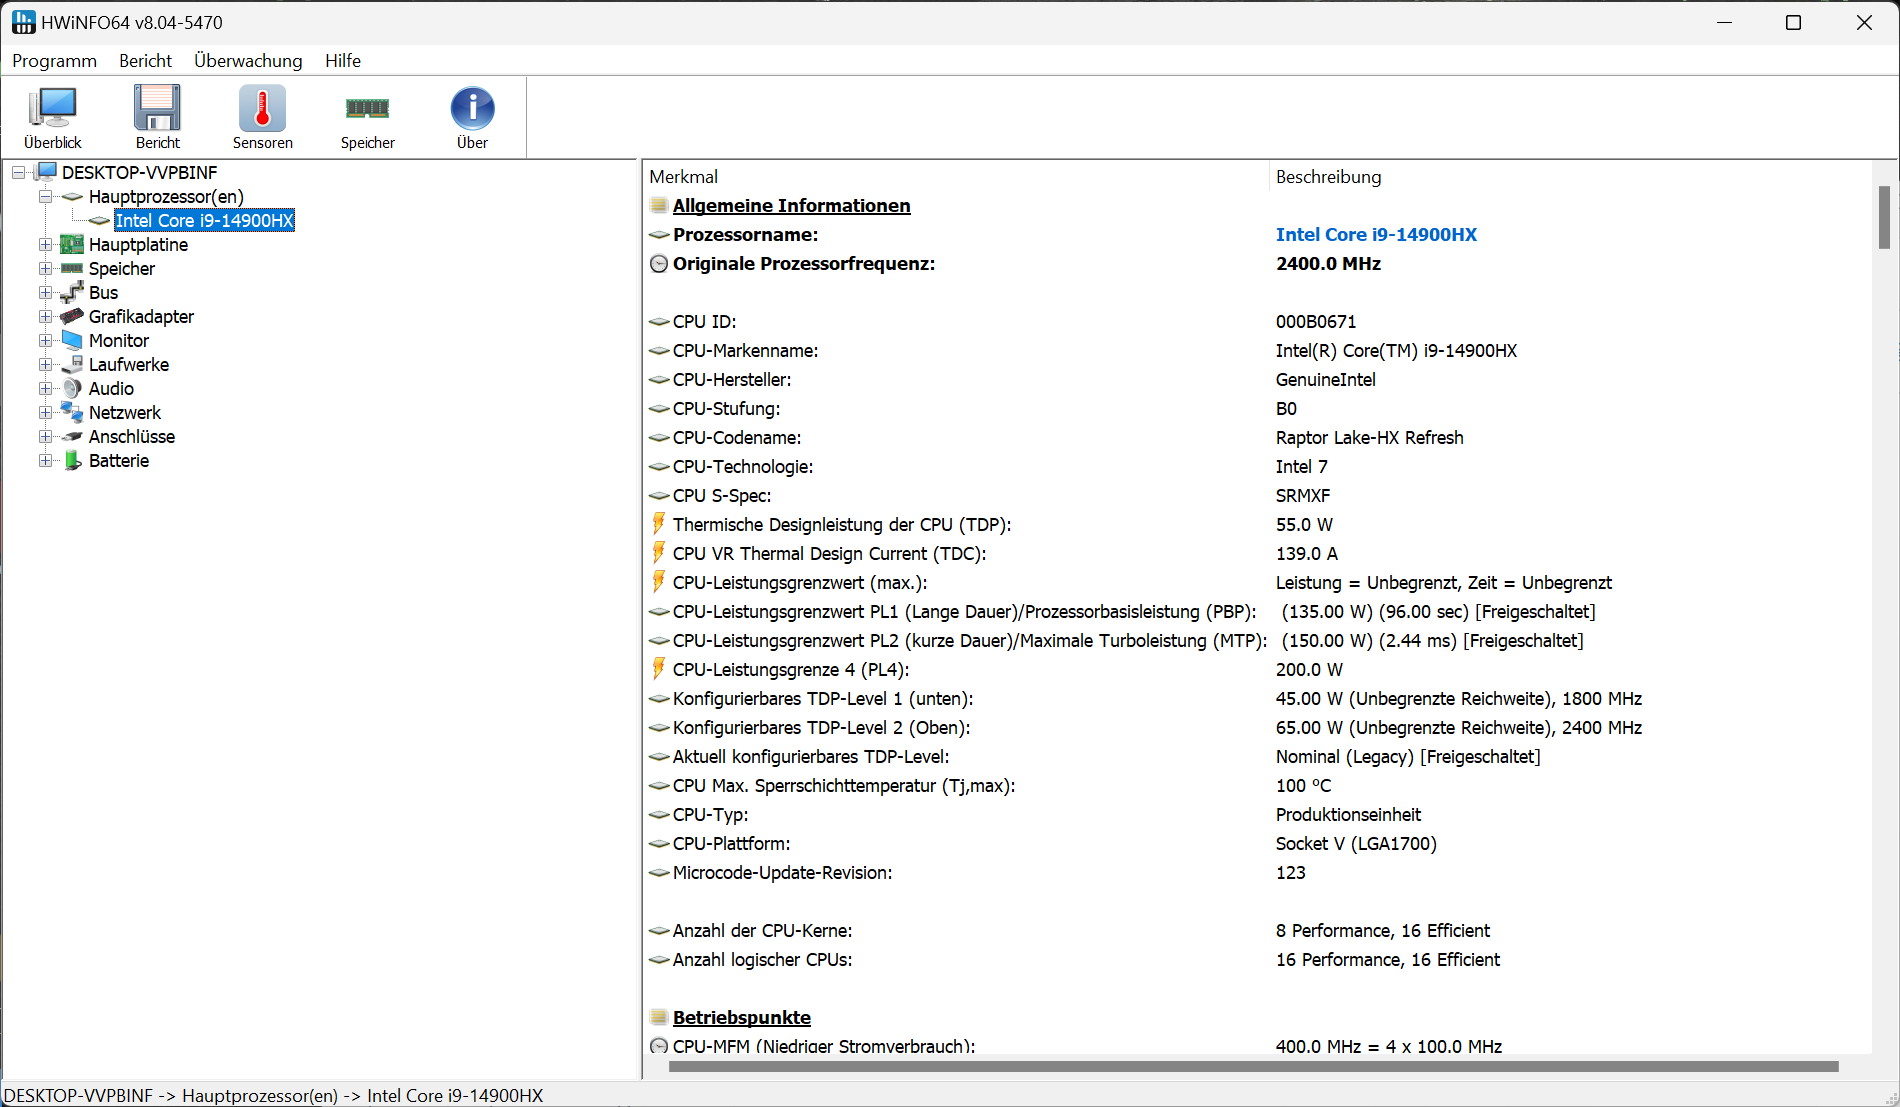
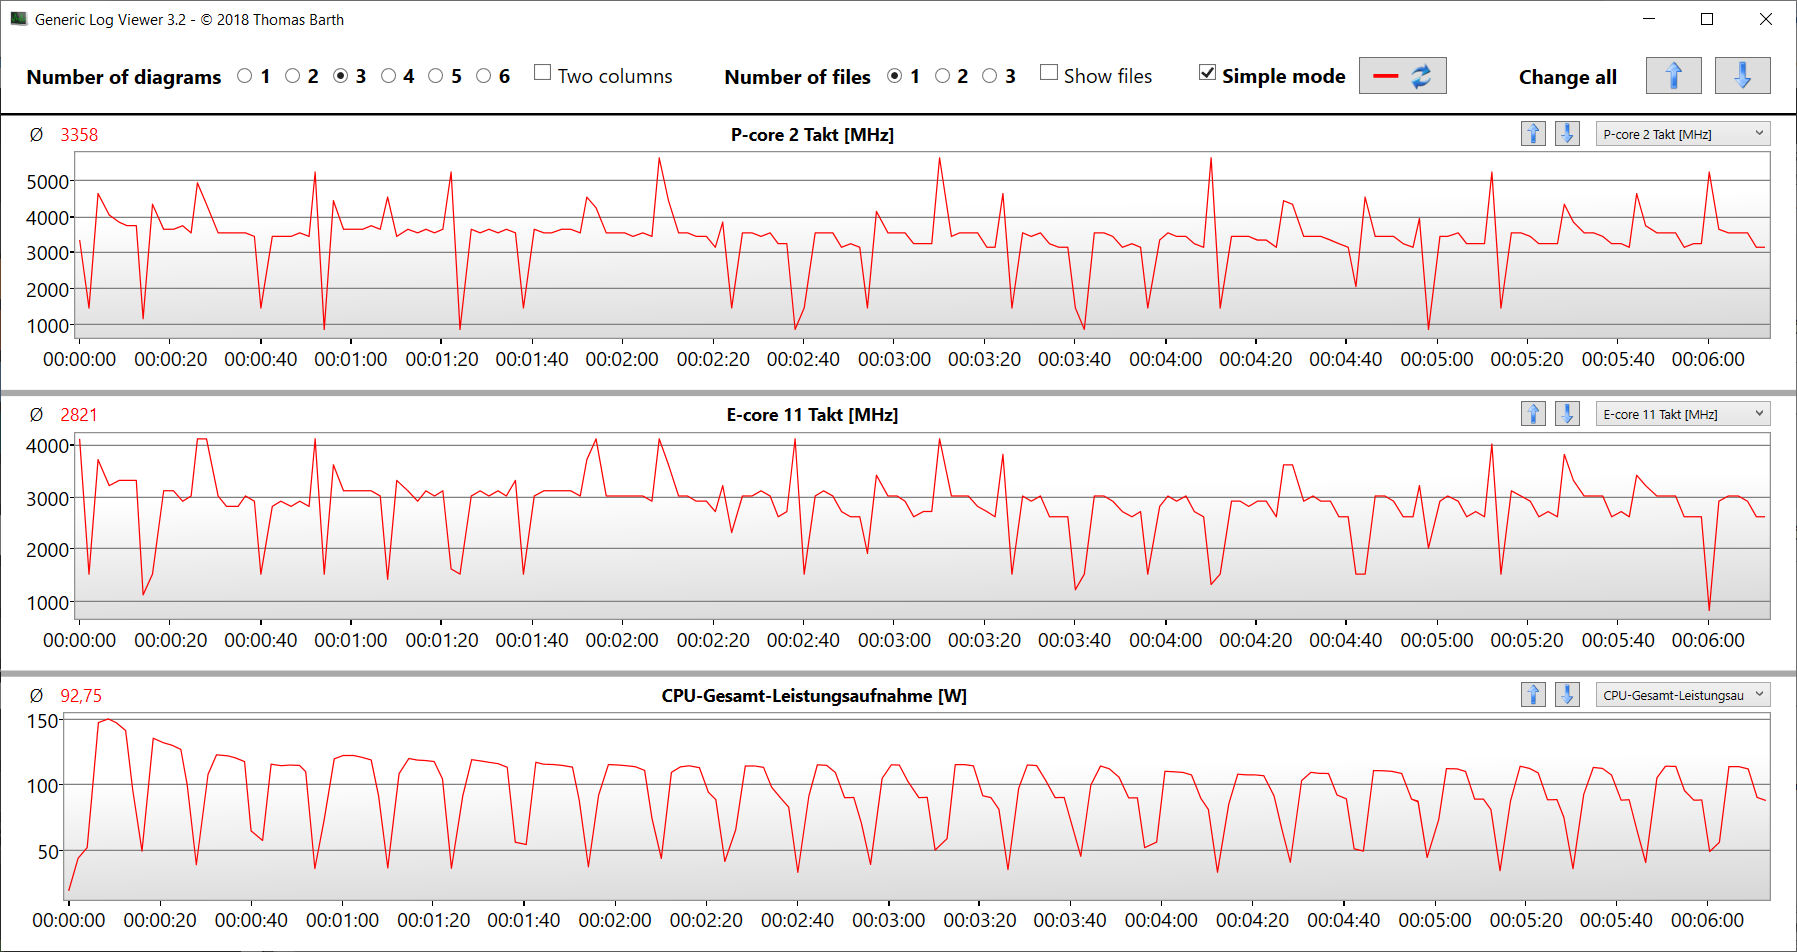
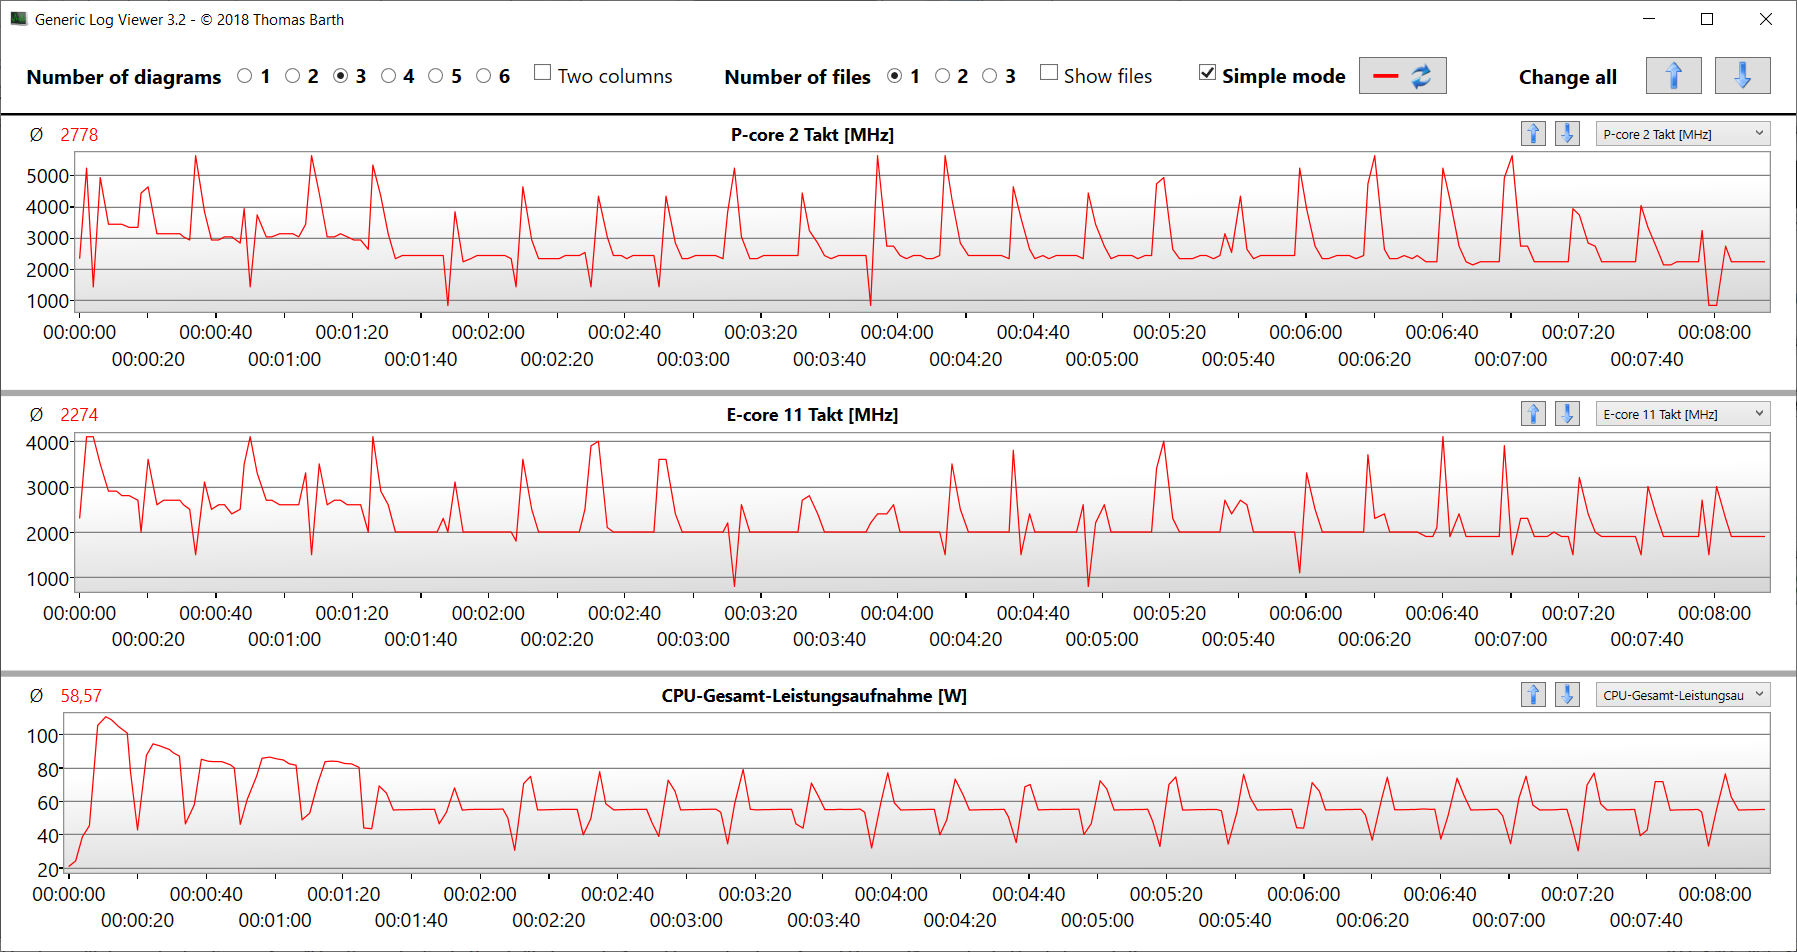
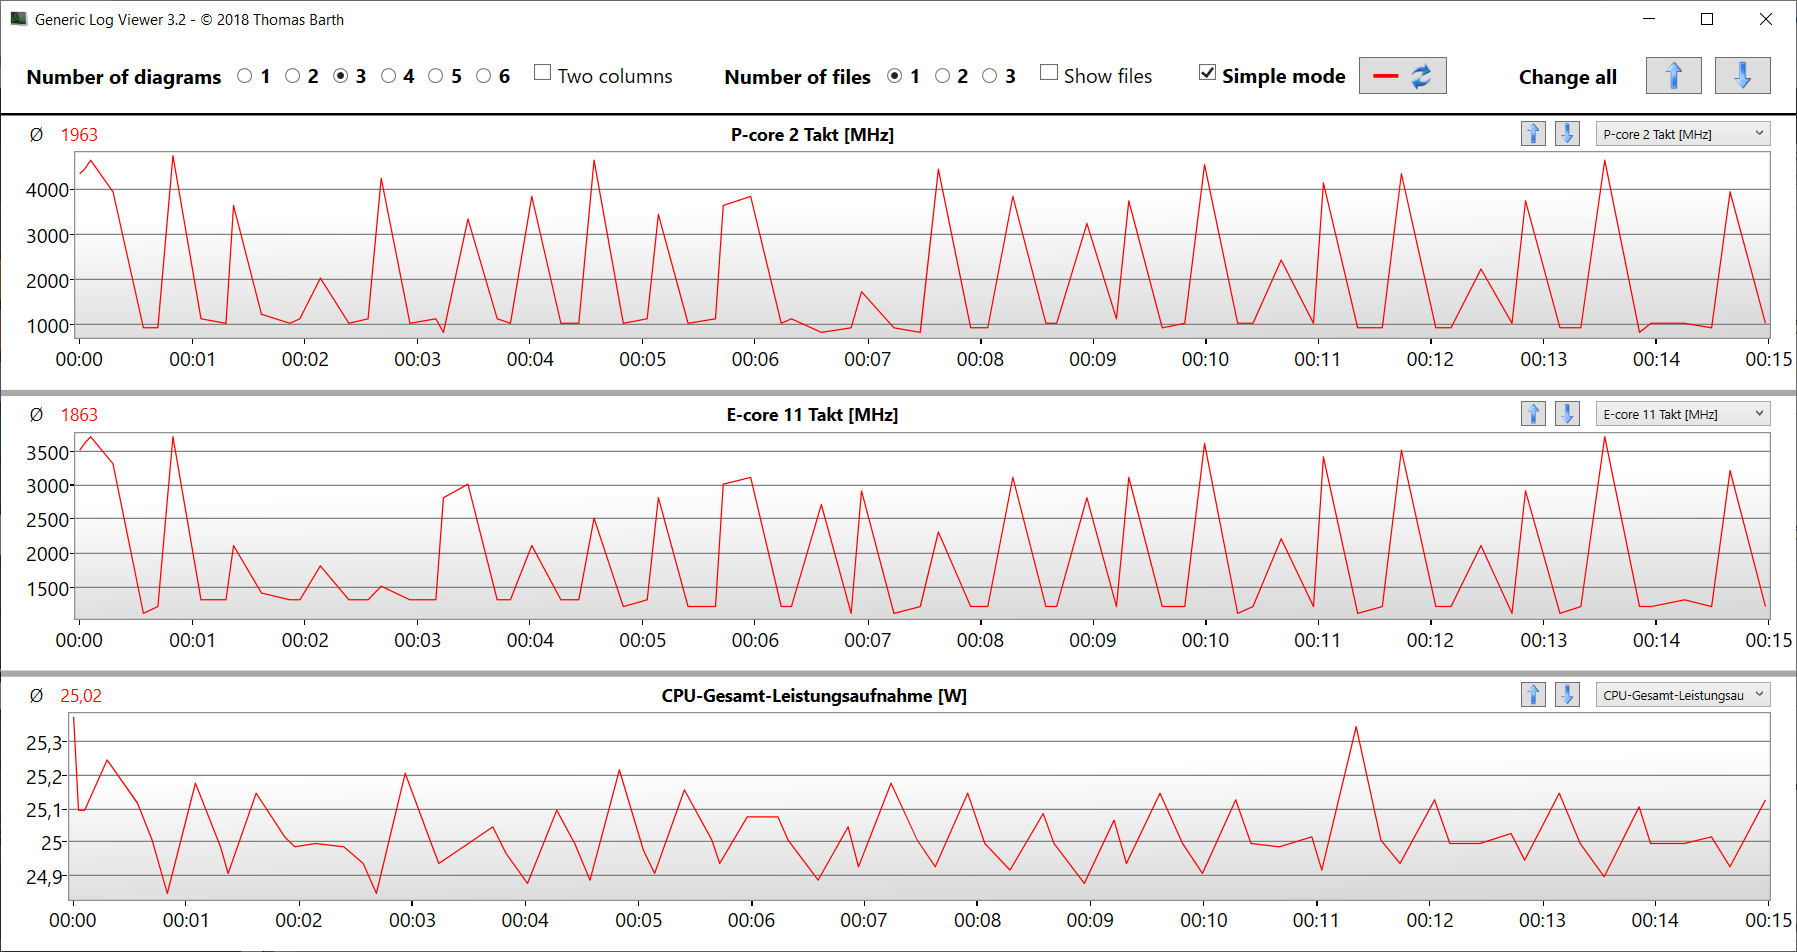
Bu Core i9-14900HX (Raptor Lake) tüm Pro 16 yapılandırma varyantları için kullanılır. 24 çekirdeği (8P + 16E) toplam 32 iş parçacığını işleyebilir. Bir sürpriz: Performans modu etkin olsa bile işlemci her zaman tam güçte çalışamıyor. Sürekli çoklu iş parçacığı yükü (CB15 Döngüsü) CPU saatinin ilk çalıştırmadan beşinci çalıştırmaya kadar önemli ölçüde düşmesine neden oldu. Bundan sonra eğri düzleşmiştir. Karşılaştırma sonuçları önceki CPU ortalamasının altındadır.
Cinebench R15 Multi continuous test
* ... daha küçük daha iyidir
AIDA64: FP32 Ray-Trace | FPU Julia | CPU SHA3 | CPU Queen | FPU SinJulia | FPU Mandel | CPU AES | CPU ZLib | FP64 Ray-Trace | CPU PhotoWorxx
| Performance Rating | |
| Lenovo Legion Pro 5 16IRX9 | |
| Ortalama Intel Core i9-14900HX | |
| Aorus 16X 2024 | |
| Lenovo Legion 7 16 IRX G9 | |
| SCHENKER XMG Pro 16 Studio (Mid 24) | |
| Acer Predator Helios Neo 16 (2024) | |
| Sınıf ortalaması Gaming | |
| SCHENKER XMG Pro 16 Studio (Mid 23) | |
| AIDA64 / FP32 Ray-Trace | |
| Lenovo Legion 7 16 IRX G9 | |
| Lenovo Legion Pro 5 16IRX9 | |
| Ortalama Intel Core i9-14900HX (13098 - 33474, n=36) | |
| Aorus 16X 2024 | |
| Sınıf ortalaması Gaming (4986 - 81639, n=147, son 2 yıl) | |
| Acer Predator Helios Neo 16 (2024) | |
| SCHENKER XMG Pro 16 Studio (Mid 24) | |
| SCHENKER XMG Pro 16 Studio (Mid 23) | |
| AIDA64 / FPU Julia | |
| Lenovo Legion Pro 5 16IRX9 | |
| Ortalama Intel Core i9-14900HX (67573 - 166040, n=36) | |
| Lenovo Legion 7 16 IRX G9 | |
| Aorus 16X 2024 | |
| SCHENKER XMG Pro 16 Studio (Mid 24) | |
| Acer Predator Helios Neo 16 (2024) | |
| Sınıf ortalaması Gaming (25360 - 252486, n=147, son 2 yıl) | |
| SCHENKER XMG Pro 16 Studio (Mid 23) | |
| AIDA64 / CPU SHA3 | |
| Lenovo Legion Pro 5 16IRX9 | |
| Ortalama Intel Core i9-14900HX (3589 - 7979, n=36) | |
| Aorus 16X 2024 | |
| Lenovo Legion 7 16 IRX G9 | |
| SCHENKER XMG Pro 16 Studio (Mid 24) | |
| Acer Predator Helios Neo 16 (2024) | |
| Sınıf ortalaması Gaming (1339 - 10389, n=147, son 2 yıl) | |
| SCHENKER XMG Pro 16 Studio (Mid 23) | |
| AIDA64 / CPU Queen | |
| Acer Predator Helios Neo 16 (2024) | |
| Lenovo Legion Pro 5 16IRX9 | |
| Lenovo Legion 7 16 IRX G9 | |
| Aorus 16X 2024 | |
| Ortalama Intel Core i9-14900HX (118405 - 148966, n=36) | |
| SCHENKER XMG Pro 16 Studio (Mid 24) | |
| Sınıf ortalaması Gaming (50699 - 200651, n=147, son 2 yıl) | |
| SCHENKER XMG Pro 16 Studio (Mid 23) | |
| AIDA64 / FPU SinJulia | |
| Lenovo Legion Pro 5 16IRX9 | |
| Ortalama Intel Core i9-14900HX (10475 - 18517, n=36) | |
| Aorus 16X 2024 | |
| Lenovo Legion 7 16 IRX G9 | |
| SCHENKER XMG Pro 16 Studio (Mid 24) | |
| Acer Predator Helios Neo 16 (2024) | |
| Sınıf ortalaması Gaming (4800 - 32988, n=147, son 2 yıl) | |
| SCHENKER XMG Pro 16 Studio (Mid 23) | |
| AIDA64 / FPU Mandel | |
| Lenovo Legion Pro 5 16IRX9 | |
| Ortalama Intel Core i9-14900HX (32543 - 83662, n=36) | |
| Aorus 16X 2024 | |
| Acer Predator Helios Neo 16 (2024) | |
| Sınıf ortalaması Gaming (12321 - 134044, n=147, son 2 yıl) | |
| SCHENKER XMG Pro 16 Studio (Mid 24) | |
| Lenovo Legion 7 16 IRX G9 | |
| SCHENKER XMG Pro 16 Studio (Mid 23) | |
| AIDA64 / CPU AES | |
| SCHENKER XMG Pro 16 Studio (Mid 23) | |
| Ortalama Intel Core i9-14900HX (86964 - 241777, n=36) | |
| Lenovo Legion Pro 5 16IRX9 | |
| Aorus 16X 2024 | |
| Lenovo Legion 7 16 IRX G9 | |
| SCHENKER XMG Pro 16 Studio (Mid 24) | |
| Sınıf ortalaması Gaming (19065 - 328679, n=147, son 2 yıl) | |
| Acer Predator Helios Neo 16 (2024) | |
| AIDA64 / CPU ZLib | |
| Lenovo Legion Pro 5 16IRX9 | |
| Ortalama Intel Core i9-14900HX (1054 - 2292, n=36) | |
| Aorus 16X 2024 | |
| SCHENKER XMG Pro 16 Studio (Mid 24) | |
| Lenovo Legion 7 16 IRX G9 | |
| Acer Predator Helios Neo 16 (2024) | |
| Sınıf ortalaması Gaming (373 - 2531, n=147, son 2 yıl) | |
| SCHENKER XMG Pro 16 Studio (Mid 23) | |
| AIDA64 / FP64 Ray-Trace | |
| Lenovo Legion Pro 5 16IRX9 | |
| Ortalama Intel Core i9-14900HX (6809 - 18349, n=36) | |
| Lenovo Legion 7 16 IRX G9 | |
| Aorus 16X 2024 | |
| Sınıf ortalaması Gaming (2540 - 43430, n=147, son 2 yıl) | |
| SCHENKER XMG Pro 16 Studio (Mid 24) | |
| Acer Predator Helios Neo 16 (2024) | |
| SCHENKER XMG Pro 16 Studio (Mid 23) | |
| AIDA64 / CPU PhotoWorxx | |
| Lenovo Legion Pro 5 16IRX9 | |
| Aorus 16X 2024 | |
| SCHENKER XMG Pro 16 Studio (Mid 24) | |
| Lenovo Legion 7 16 IRX G9 | |
| SCHENKER XMG Pro 16 Studio (Mid 23) | |
| Ortalama Intel Core i9-14900HX (23903 - 54702, n=36) | |
| Acer Predator Helios Neo 16 (2024) | |
| Sınıf ortalaması Gaming (10805 - 60161, n=147, son 2 yıl) | |
Sistem performansı
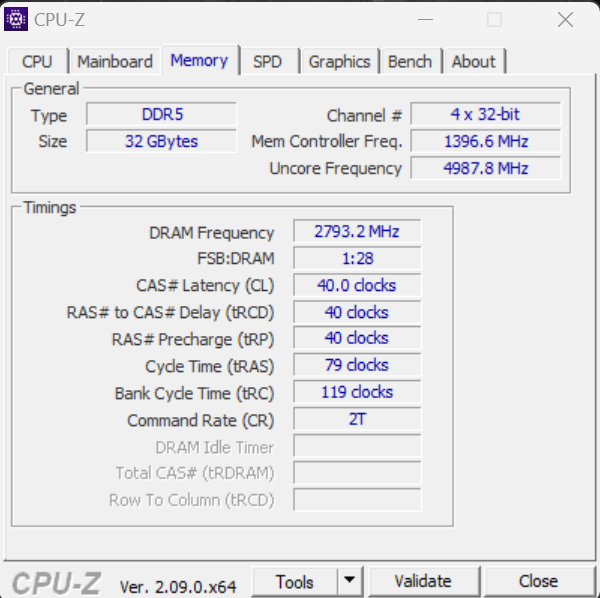
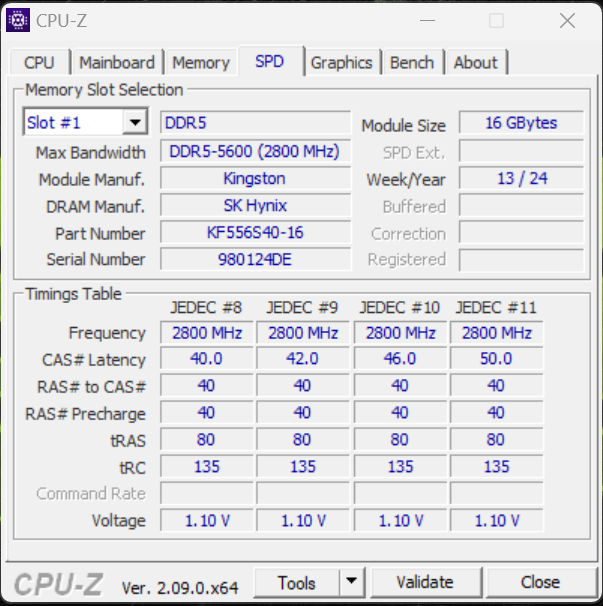
Sorunsuz çalışan sistem oyun, render ve yayın için yeterli performans sağlıyor, ancak kurulu donanım yeni rekorlar kıramıyor. RAM'in aktarım hızları DDR5-5600 RAM için normal seviyede.

CrossMark: Overall | Productivity | Creativity | Responsiveness
WebXPRT 3: Overall
WebXPRT 4: Overall
Mozilla Kraken 1.1: Total
| PCMark 10 / Score | |
| Lenovo Legion Pro 5 16IRX9 | |
| Aorus 16X 2024 | |
| Acer Predator Helios Neo 16 (2024) | |
| Ortalama Intel Core i9-14900HX, NVIDIA GeForce RTX 4070 Laptop GPU (7768 - 8550, n=8) | |
| SCHENKER XMG Pro 16 Studio (Mid 24) | |
| Lenovo Legion 7 16 IRX G9 | |
| SCHENKER XMG Pro 16 Studio (Mid 23) | |
| Sınıf ortalaması Gaming (5776 - 9852, n=133, son 2 yıl) | |
| PCMark 10 / Essentials | |
| SCHENKER XMG Pro 16 Studio (Mid 23) | |
| Acer Predator Helios Neo 16 (2024) | |
| Lenovo Legion Pro 5 16IRX9 | |
| Aorus 16X 2024 | |
| Lenovo Legion 7 16 IRX G9 | |
| Ortalama Intel Core i9-14900HX, NVIDIA GeForce RTX 4070 Laptop GPU (10104 - 11815, n=8) | |
| Sınıf ortalaması Gaming (9057 - 12600, n=133, son 2 yıl) | |
| SCHENKER XMG Pro 16 Studio (Mid 24) | |
| PCMark 10 / Productivity | |
| Aorus 16X 2024 | |
| SCHENKER XMG Pro 16 Studio (Mid 24) | |
| Ortalama Intel Core i9-14900HX, NVIDIA GeForce RTX 4070 Laptop GPU (9577 - 11103, n=8) | |
| SCHENKER XMG Pro 16 Studio (Mid 23) | |
| Acer Predator Helios Neo 16 (2024) | |
| Lenovo Legion Pro 5 16IRX9 | |
| Sınıf ortalaması Gaming (6662 - 14612, n=133, son 2 yıl) | |
| Lenovo Legion 7 16 IRX G9 | |
| PCMark 10 / Digital Content Creation | |
| Lenovo Legion Pro 5 16IRX9 | |
| Lenovo Legion 7 16 IRX G9 | |
| Ortalama Intel Core i9-14900HX, NVIDIA GeForce RTX 4070 Laptop GPU (12114 - 14827, n=8) | |
| Aorus 16X 2024 | |
| Acer Predator Helios Neo 16 (2024) | |
| SCHENKER XMG Pro 16 Studio (Mid 24) | |
| Sınıf ortalaması Gaming (6807 - 18475, n=133, son 2 yıl) | |
| SCHENKER XMG Pro 16 Studio (Mid 23) | |
| CrossMark / Overall | |
| Aorus 16X 2024 | |
| Lenovo Legion 7 16 IRX G9 | |
| Acer Predator Helios Neo 16 (2024) | |
| Ortalama Intel Core i9-14900HX, NVIDIA GeForce RTX 4070 Laptop GPU (2002 - 2312, n=7) | |
| SCHENKER XMG Pro 16 Studio (Mid 24) | |
| Lenovo Legion Pro 5 16IRX9 | |
| SCHENKER XMG Pro 16 Studio (Mid 23) | |
| Sınıf ortalaması Gaming (1247 - 2344, n=114, son 2 yıl) | |
| CrossMark / Productivity | |
| Aorus 16X 2024 | |
| Lenovo Legion 7 16 IRX G9 | |
| Acer Predator Helios Neo 16 (2024) | |
| Ortalama Intel Core i9-14900HX, NVIDIA GeForce RTX 4070 Laptop GPU (1827 - 2191, n=7) | |
| SCHENKER XMG Pro 16 Studio (Mid 24) | |
| SCHENKER XMG Pro 16 Studio (Mid 23) | |
| Lenovo Legion Pro 5 16IRX9 | |
| Sınıf ortalaması Gaming (1299 - 2204, n=114, son 2 yıl) | |
| CrossMark / Creativity | |
| Aorus 16X 2024 | |
| Acer Predator Helios Neo 16 (2024) | |
| Lenovo Legion 7 16 IRX G9 | |
| SCHENKER XMG Pro 16 Studio (Mid 24) | |
| Ortalama Intel Core i9-14900HX, NVIDIA GeForce RTX 4070 Laptop GPU (2258 - 2458, n=7) | |
| Lenovo Legion Pro 5 16IRX9 | |
| Sınıf ortalaması Gaming (1275 - 2660, n=114, son 2 yıl) | |
| SCHENKER XMG Pro 16 Studio (Mid 23) | |
| CrossMark / Responsiveness | |
| Lenovo Legion 7 16 IRX G9 | |
| Aorus 16X 2024 | |
| Ortalama Intel Core i9-14900HX, NVIDIA GeForce RTX 4070 Laptop GPU (1734 - 2330, n=7) | |
| Acer Predator Helios Neo 16 (2024) | |
| SCHENKER XMG Pro 16 Studio (Mid 23) | |
| Lenovo Legion Pro 5 16IRX9 | |
| SCHENKER XMG Pro 16 Studio (Mid 24) | |
| Sınıf ortalaması Gaming (1030 - 2330, n=114, son 2 yıl) | |
| WebXPRT 3 / Overall | |
| Lenovo Legion 7 16 IRX G9 | |
| Aorus 16X 2024 | |
| Acer Predator Helios Neo 16 (2024) | |
| Lenovo Legion Pro 5 16IRX9 | |
| Ortalama Intel Core i9-14900HX, NVIDIA GeForce RTX 4070 Laptop GPU (269 - 342, n=8) | |
| SCHENKER XMG Pro 16 Studio (Mid 23) | |
| SCHENKER XMG Pro 16 Studio (Mid 24) | |
| Sınıf ortalaması Gaming (215 - 480, n=127, son 2 yıl) | |
| WebXPRT 4 / Overall | |
| Acer Predator Helios Neo 16 (2024) | |
| SCHENKER XMG Pro 16 Studio (Mid 24) | |
| Ortalama Intel Core i9-14900HX, NVIDIA GeForce RTX 4070 Laptop GPU (291 - 304, n=6) | |
| Lenovo Legion 7 16 IRX G9 | |
| Lenovo Legion Pro 5 16IRX9 | |
| Sınıf ortalaması Gaming (176.4 - 335, n=115, son 2 yıl) | |
| Mozilla Kraken 1.1 / Total | |
| SCHENKER XMG Pro 16 Studio (Mid 23) | |
| Sınıf ortalaması Gaming (409 - 674, n=139, son 2 yıl) | |
| SCHENKER XMG Pro 16 Studio (Mid 24) | |
| Lenovo Legion Pro 5 16IRX9 | |
| Ortalama Intel Core i9-14900HX, NVIDIA GeForce RTX 4070 Laptop GPU (431 - 469, n=8) | |
| Acer Predator Helios Neo 16 (2024) | |
| Lenovo Legion 7 16 IRX G9 | |
| Aorus 16X 2024 | |
* ... daha küçük daha iyidir
| PCMark 10 Score | 8166 puan | |
Yardım | ||
| AIDA64 / Memory Copy | |
| Lenovo Legion Pro 5 16IRX9 | |
| Lenovo Legion 7 16 IRX G9 | |
| Aorus 16X 2024 | |
| SCHENKER XMG Pro 16 Studio (Mid 24) | |
| Acer Predator Helios Neo 16 (2024) | |
| Ortalama Intel Core i9-14900HX (38028 - 83392, n=36) | |
| SCHENKER XMG Pro 16 Studio (Mid 23) | |
| Sınıf ortalaması Gaming (21750 - 97515, n=147, son 2 yıl) | |
| AIDA64 / Memory Read | |
| Aorus 16X 2024 | |
| Lenovo Legion Pro 5 16IRX9 | |
| Lenovo Legion 7 16 IRX G9 | |
| SCHENKER XMG Pro 16 Studio (Mid 24) | |
| Acer Predator Helios Neo 16 (2024) | |
| Ortalama Intel Core i9-14900HX (43306 - 87568, n=36) | |
| SCHENKER XMG Pro 16 Studio (Mid 23) | |
| Sınıf ortalaması Gaming (22956 - 102937, n=147, son 2 yıl) | |
| AIDA64 / Memory Write | |
| Aorus 16X 2024 | |
| Lenovo Legion Pro 5 16IRX9 | |
| Lenovo Legion 7 16 IRX G9 | |
| SCHENKER XMG Pro 16 Studio (Mid 24) | |
| Ortalama Intel Core i9-14900HX (37146 - 80589, n=36) | |
| SCHENKER XMG Pro 16 Studio (Mid 23) | |
| Acer Predator Helios Neo 16 (2024) | |
| Sınıf ortalaması Gaming (22297 - 108954, n=147, son 2 yıl) | |
| AIDA64 / Memory Latency | |
| Sınıf ortalaması Gaming (59.5 - 259, n=147, son 2 yıl) | |
| Acer Predator Helios Neo 16 (2024) | |
| SCHENKER XMG Pro 16 Studio (Mid 23) | |
| Ortalama Intel Core i9-14900HX (76.1 - 105, n=36) | |
| SCHENKER XMG Pro 16 Studio (Mid 24) | |
| Lenovo Legion 7 16 IRX G9 | |
| Lenovo Legion Pro 5 16IRX9 | |
| Aorus 16X 2024 | |
* ... daha küçük daha iyidir
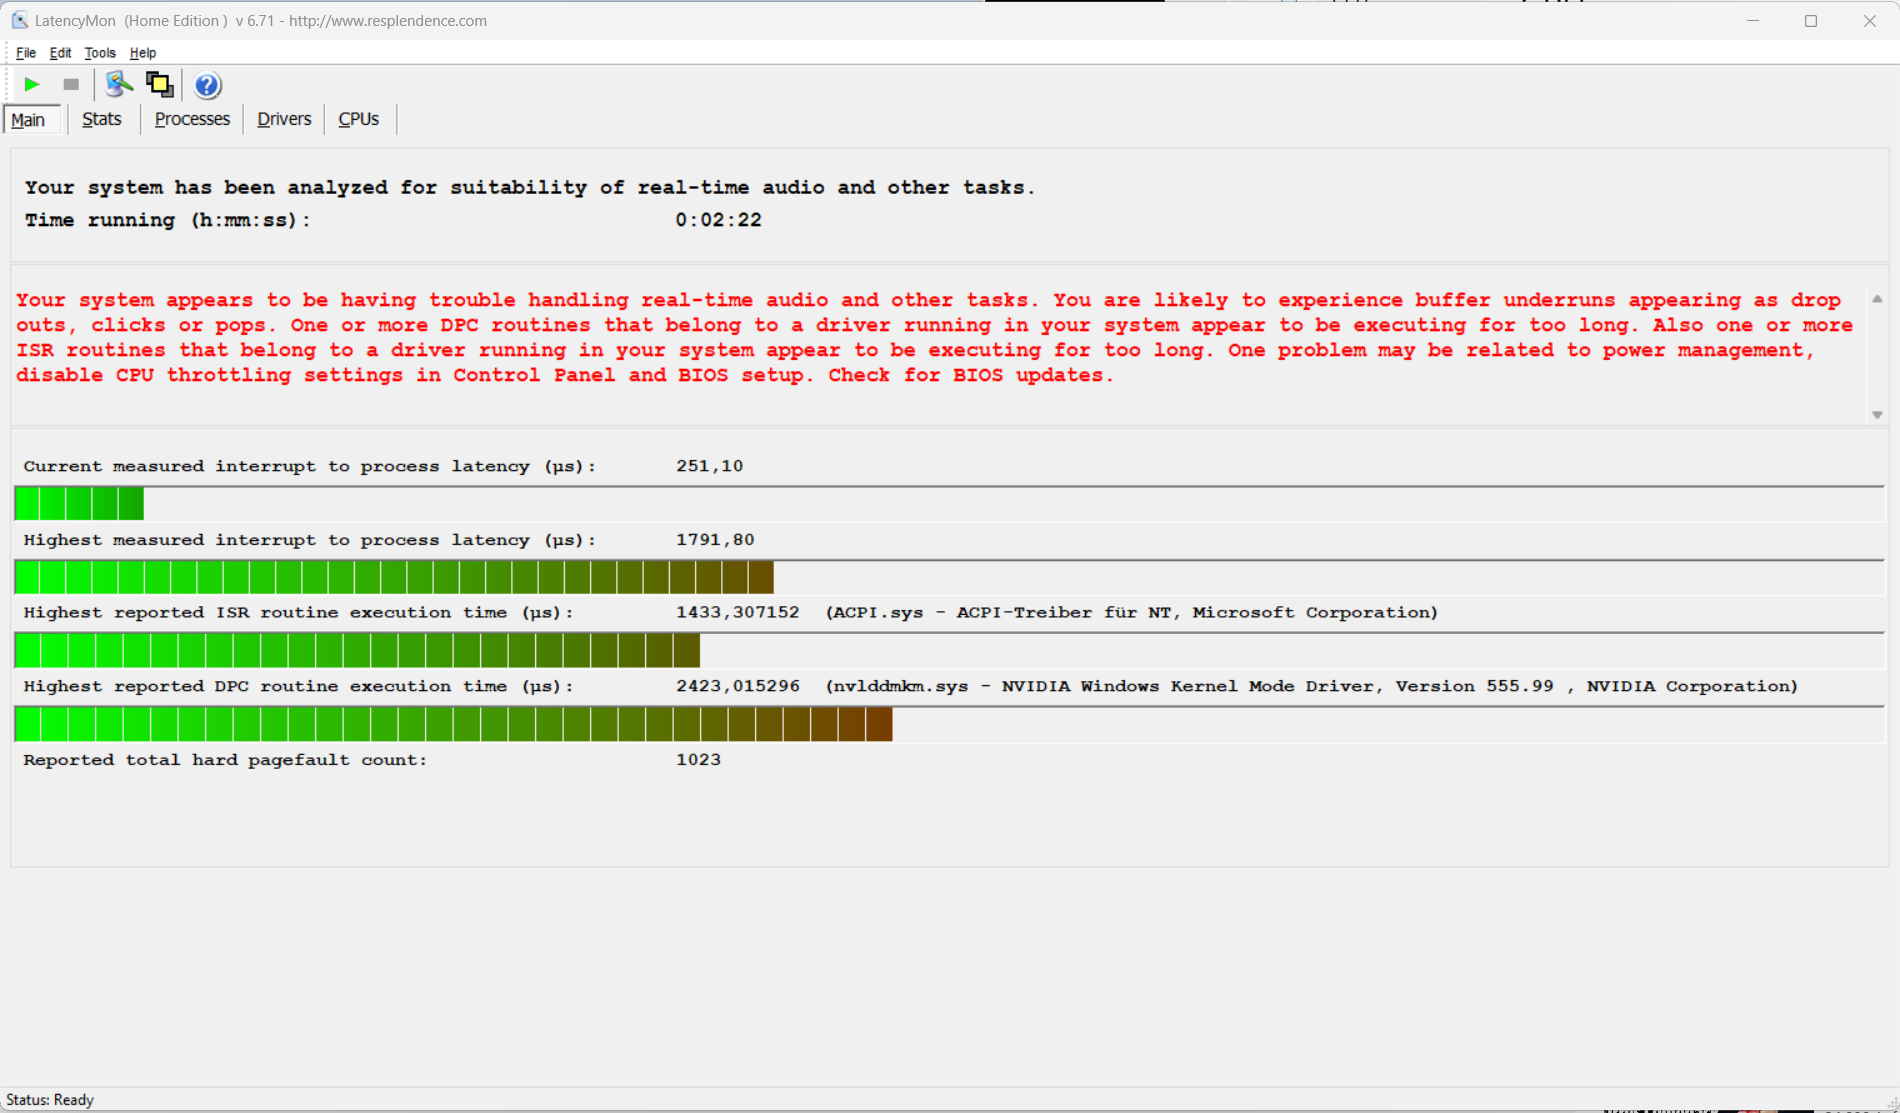
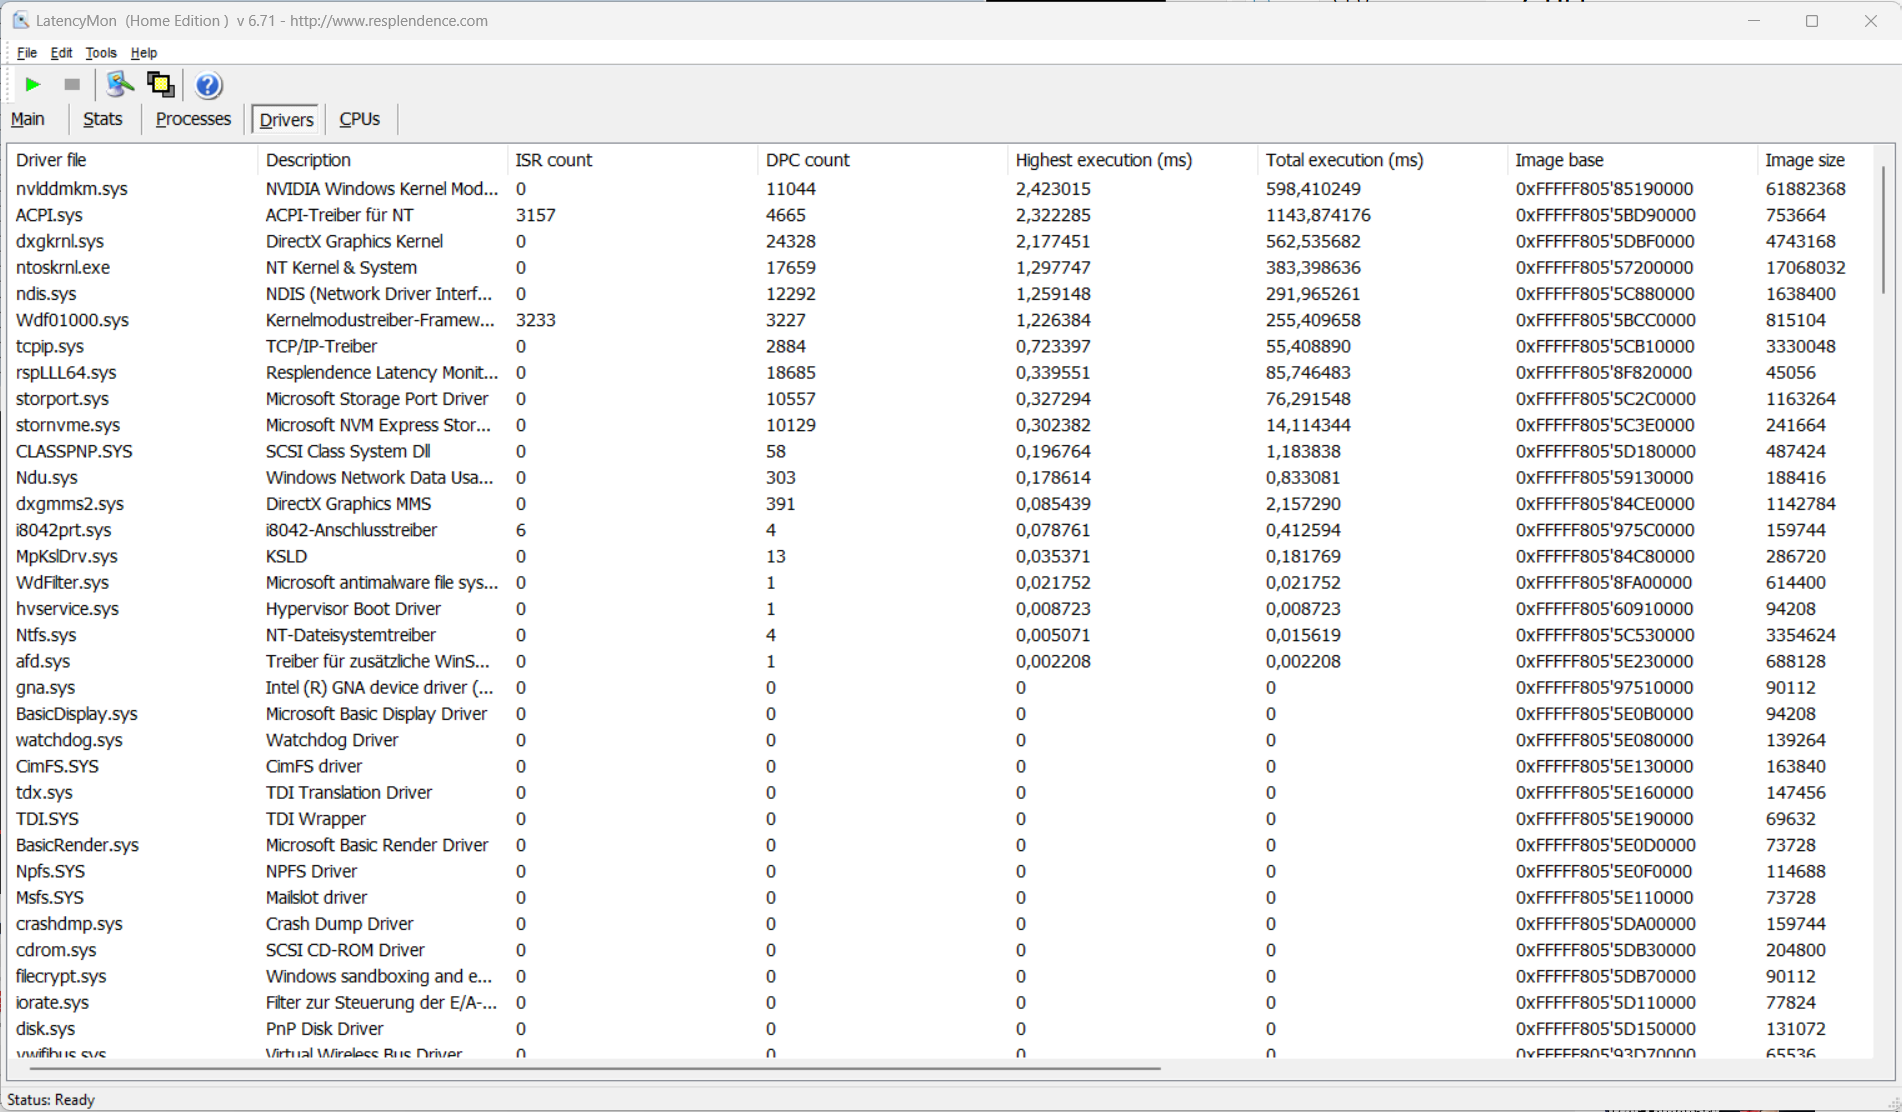
DPC gecikme süreleri
Dizüstü bilgisayarın nispeten yüksek gecikme süreleri nedeniyle, gerçek zamanlı video ve ses düzenleme amaçlanmamıştır. Ancak gelecekteki yazılım güncellemeleri bu konuda değişikliklere yol açabilir.
| DPC Latencies / LatencyMon - interrupt to process latency (max), Web, Youtube, Prime95 | |
| SCHENKER XMG Pro 16 Studio (Mid 23) | |
| SCHENKER XMG Pro 16 Studio (Mid 24) | |
| Lenovo Legion 7 16 IRX G9 | |
| Acer Predator Helios Neo 16 (2024) | |
| Aorus 16X 2024 | |
| Lenovo Legion Pro 5 16IRX9 | |
* ... daha küçük daha iyidir
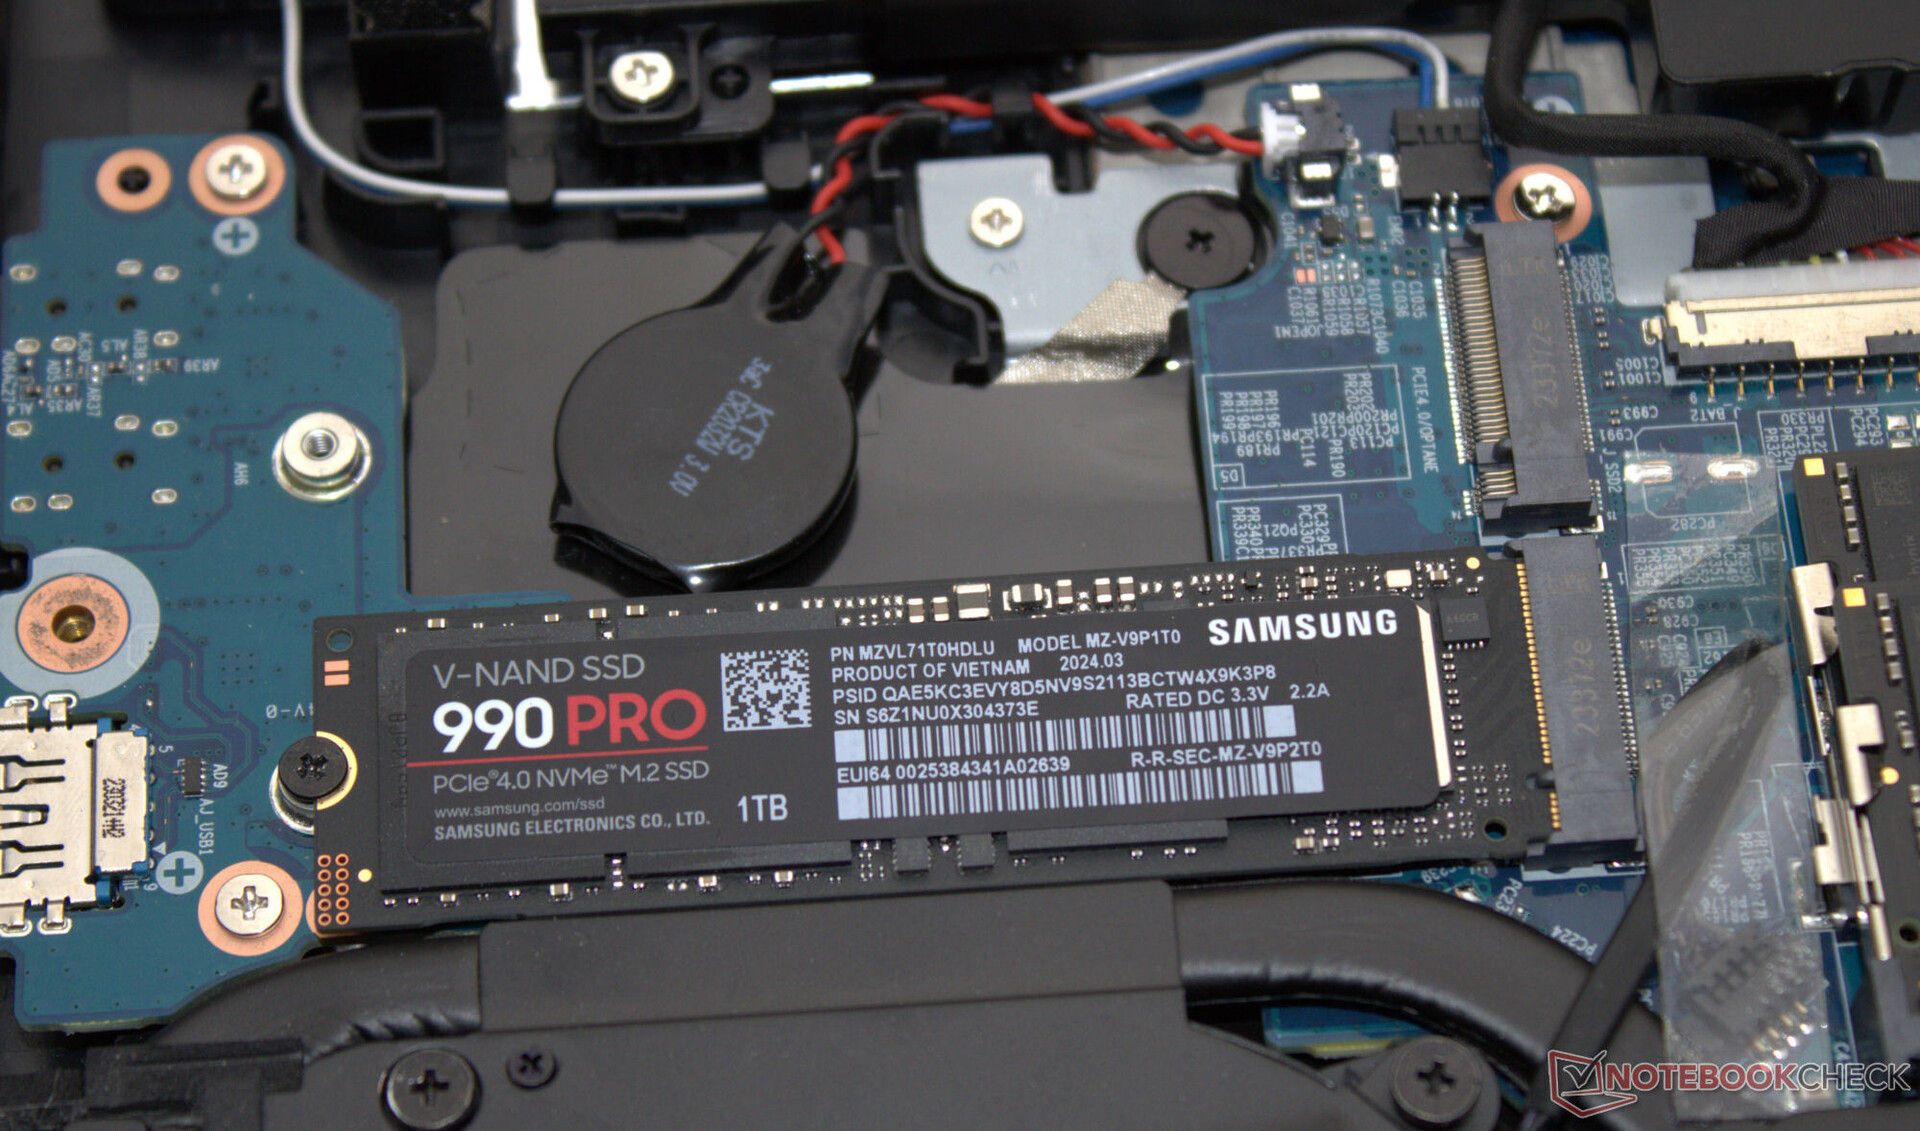
Depolama cihazları
Schenker çevrimiçi mağazasında seçim yapabileceğiniz çeşitli SSD'ler bulunmaktadır; test cihazımızda Samsung'un yıldırım hızında bir modeli (1 TB, PCIe 4, M.2-2280) bulunmaktadır. Olumlu: Isıl nedenli yavaşlama meydana gelmedi. Dizüstü bilgisayar, iki adede kadar PCIe 4 SSD (M.2-2280) barındırabilir. RAID-0/1 desteklenmektedir.

* ... daha küçük daha iyidir
Reading continuous performance: DiskSpd Read Loop, Queue Depth 8
Grafik kartı
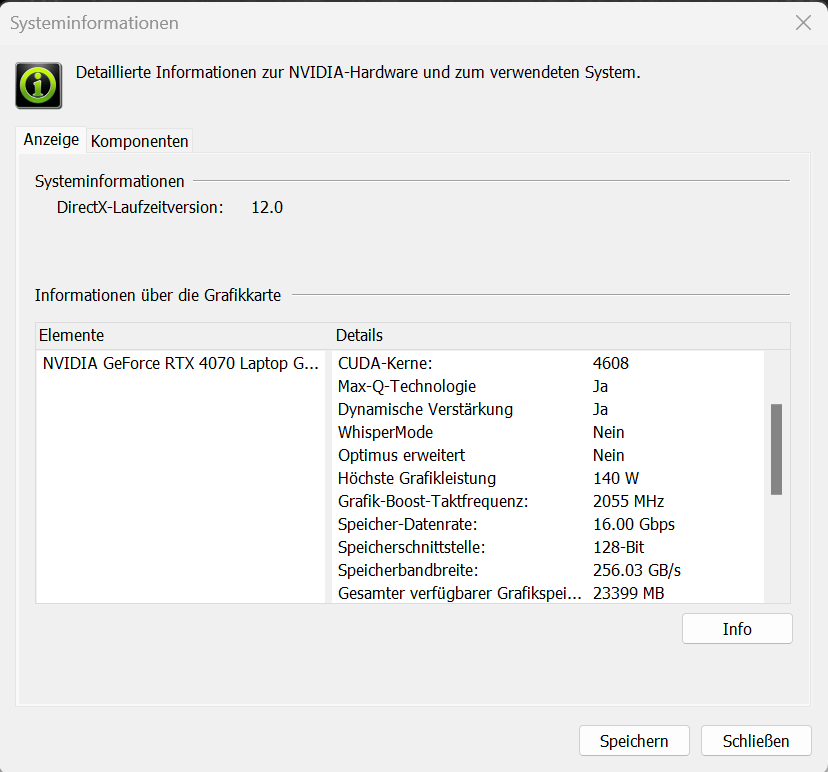
Yüksek ve maksimum ayarlarda QHD oyun oynamak, kurulu sistem için sorun değil GeForce RTX 4070 (TGP: 140 watt): GPU ortalamasının biraz üzerinde kare hızları (ve kıyaslama sonuçları) sunar. Günümüz gereksinimleri için biraz dar: GPU'nun emrinde yalnızca 8 GB VRAM (GDDR6) var. DGPU ve Optimus arasında geçiş yapmak için yeniden başlatma gerekiyor.
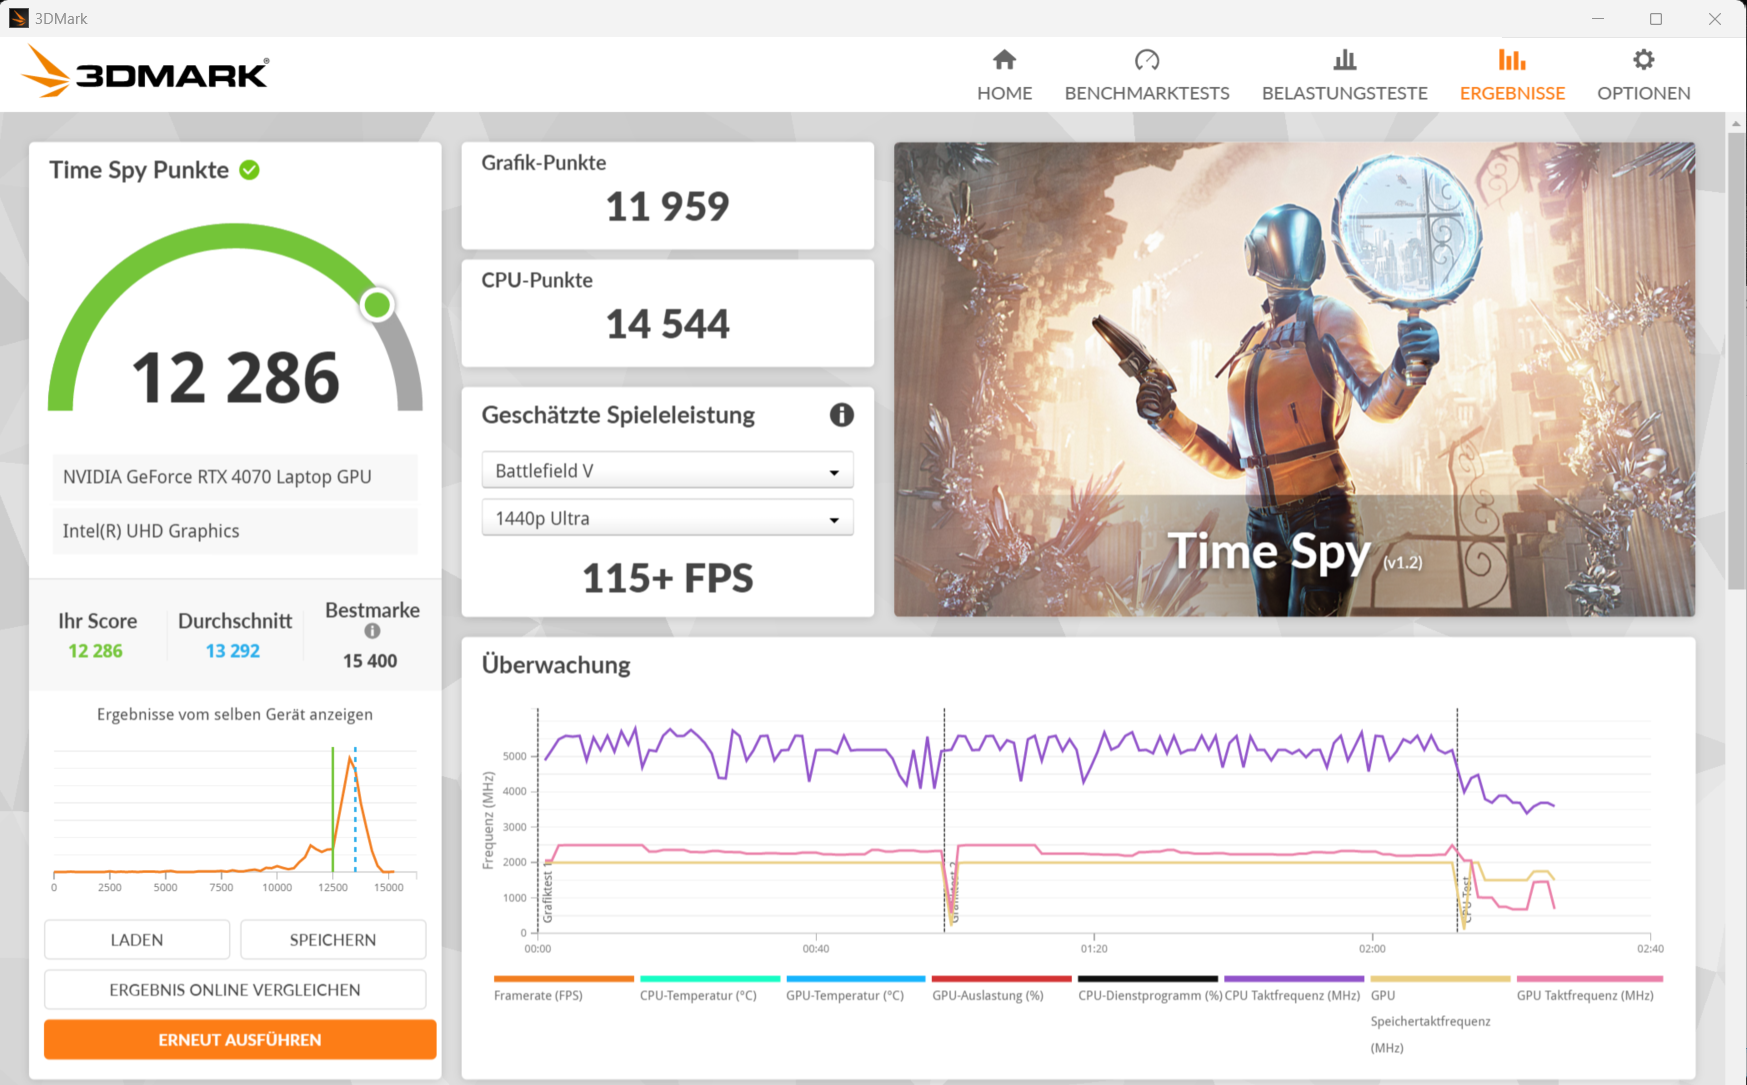

| 3DMark 11 Performance | 34173 puan | |
| 3DMark Fire Strike Score | 23584 puan | |
| 3DMark Time Spy Score | 12286 puan | |
| 3DMark Steel Nomad Score | 2598 puan | |
Yardım | ||
* ... daha küçük daha iyidir
| Cyberpunk 2077 2.2 Phantom Liberty - 1920x1080 Ultra Preset (FSR off) | |
| Sınıf ortalaması Gaming (6.76 - 158, n=90, son 2 yıl) | |
| SCHENKER XMG Pro 16 Studio (Mid 23) | |
| Lenovo Legion Pro 5 16IRX9 | |
| Lenovo Legion 7 16 IRX G9 | |
| Acer Predator Helios Neo 16 (2024) | |
| SCHENKER XMG Pro 16 Studio (Mid 24) | |
| Ortalama NVIDIA GeForce RTX 4070 Laptop GPU (30.7 - 90.7, n=38) | |
| Aorus 16X 2024 | |
| GTA V - 1920x1080 Highest Settings possible AA:4xMSAA + FX AF:16x | |
| Acer Predator Helios Neo 16 (2024) | |
| Lenovo Legion Pro 5 16IRX9 | |
| SCHENKER XMG Pro 16 Studio (Mid 24) | |
| SCHENKER XMG Pro 16 Studio (Mid 23) | |
| Lenovo Legion 7 16 IRX G9 | |
| Sınıf ortalaması Gaming (12.1 - 168.2, n=132, son 2 yıl) | |
| Ortalama NVIDIA GeForce RTX 4070 Laptop GPU (48.3 - 141.6, n=62) | |
| Aorus 16X 2024 | |
| Dragon's Dogma 2 | |
| 1920x1080 High Preset | |
| SCHENKER XMG Pro 16 Studio (Mid 24) | |
| Ortalama NVIDIA GeForce RTX 4070 Laptop GPU (61.3 - 80, n=5) | |
| Sınıf ortalaması Gaming (49.5 - 80, n=8, son 2 yıl) | |
| 2560x1440 High Preset | |
| SCHENKER XMG Pro 16 Studio (Mid 24) | |
| Ortalama NVIDIA GeForce RTX 4070 Laptop GPU (47.7 - 61.3, n=5) | |
| Sınıf ortalaması Gaming (34.6 - 61.3, n=5, son 2 yıl) | |
| Senua's Saga Hellblade 2 | |
| 1920x1080 High Preset | |
| Sınıf ortalaması Gaming (38.4 - 78.8, n=6, son 2 yıl) | |
| SCHENKER XMG Pro 16 Studio (Mid 24) | |
| Ortalama NVIDIA GeForce RTX 4070 Laptop GPU (34.3 - 51.2, n=4) | |
| 2560x1440 High Preset | |
| Sınıf ortalaması Gaming (27.1 - 57.3, n=4, son 2 yıl) | |
| SCHENKER XMG Pro 16 Studio (Mid 24) | |
| Ortalama NVIDIA GeForce RTX 4070 Laptop GPU (23.7 - 33.3, n=4) | |
| 2560x1440 High Preset + Quality DLSS | |
| Sınıf ortalaması Gaming (42.2 - 83.1, n=3, son 2 yıl) | |
| SCHENKER XMG Pro 16 Studio (Mid 24) | |
| Ortalama NVIDIA GeForce RTX 4070 Laptop GPU (42.2 - 47.8, n=2) | |
| Ghost of Tsushima | |
| 1920x1080 Very High Preset AA:T | |
| SCHENKER XMG Pro 16 Studio (Mid 24) | |
| Ortalama NVIDIA GeForce RTX 4070 Laptop GPU (55.3 - 73.7, n=5) | |
| Sınıf ortalaması Gaming (28.5 - 73.7, n=7, son 2 yıl) | |
| 2560x1440 Very High Preset AA:T | |
| SCHENKER XMG Pro 16 Studio (Mid 24) | |
| Ortalama NVIDIA GeForce RTX 4070 Laptop GPU (43.6 - 56.1, n=5) | |
| Sınıf ortalaması Gaming (22.7 - 56.1, n=5, son 2 yıl) | |
| 2560x1440 Very High Preset + Quality DLSS | |
| SCHENKER XMG Pro 16 Studio (Mid 24) | |
| Sınıf ortalaması Gaming (63.6 - 74.2, n=3, son 2 yıl) | |
| Ortalama NVIDIA GeForce RTX 4070 Laptop GPU (57 - 74.2, n=3) | |
| The First Descendant | |
| 1920x1080 Ultra Preset | |
| SCHENKER XMG Pro 16 Studio (Mid 24) | |
| Ortalama NVIDIA GeForce RTX 4070 Laptop GPU (73.7 - 83.6, n=5) | |
| Sınıf ortalaması Gaming (15.4 - 80, n=5, son 2 yıl) | |
| 2560x1440 Ultra Preset | |
| SCHENKER XMG Pro 16 Studio (Mid 24) | |
| Ortalama NVIDIA GeForce RTX 4070 Laptop GPU (48.2 - 52.5, n=5) | |
| Sınıf ortalaması Gaming (43.7 - 51.2, n=3, son 2 yıl) | |
| 2560x1440 Ultra Preset + Ultra Ray Tracing + DLSS Quality | |
| SCHENKER XMG Pro 16 Studio (Mid 24) | |
| Ortalama NVIDIA GeForce RTX 4070 Laptop GPU (48.6 - 51.8, n=2) | |
| Sınıf ortalaması Gaming (43.3 - 51.8, n=2, son 2 yıl) | |
| F1 24 | |
| 1920x1080 Ultra High Preset AA:T AF:16x | |
| Sınıf ortalaması Gaming (54.1 - 148, n=19, son 2 yıl) | |
| SCHENKER XMG Pro 16 Studio (Mid 24) | |
| Ortalama NVIDIA GeForce RTX 4070 Laptop GPU (58.4 - 78.1, n=9) | |
| 2560x1440 Ultra High Preset AA:T AF:16x | |
| Sınıf ortalaması Gaming (36.7 - 100, n=16, son 2 yıl) | |
| SCHENKER XMG Pro 16 Studio (Mid 24) | |
| Ortalama NVIDIA GeForce RTX 4070 Laptop GPU (36.8 - 50.9, n=9) | |
| 2560x1440 Ultra High Preset + Quality DLSS AF:16x | |
| Sınıf ortalaması Gaming (59.2 - 150.4, n=12, son 2 yıl) | |
| SCHENKER XMG Pro 16 Studio (Mid 24) | |
| Ortalama NVIDIA GeForce RTX 4070 Laptop GPU (57 - 73.9, n=6) | |
Cyberpunk 2077 ultra FPS diagram
| düşük | orta | yüksek | ultra | QHD DLSS | QHD | |
|---|---|---|---|---|---|---|
| GTA V (2015) | 186.7 | 184.9 | 180.9 | 126 | 95.9 | |
| Dota 2 Reborn (2015) | 231 | 196.2 | 181.6 | 160.8 | ||
| Final Fantasy XV Benchmark (2018) | 214 | 163.6 | 119.7 | 86.8 | ||
| X-Plane 11.11 (2018) | 178 | 147.3 | 119.5 | |||
| Strange Brigade (2018) | 457 | 297 | 236 | 206 | 135.9 | |
| Baldur's Gate 3 (2023) | 171.8 | 132 | 115.3 | 111.8 | 77.2 | |
| Cyberpunk 2077 2.2 Phantom Liberty (2023) | 126.3 | 112.1 | 95.5 | 82.5 | 48.6 | |
| Dragon's Dogma 2 (2024) | 81 | 70.4 | 58.5 | |||
| Ghost of Tsushima (2024) | 114.9 | 102.8 | 93 | 73.7 | 74.2 | 56.1 |
| Senua's Saga Hellblade 2 (2024) | 78.3 | 64.9 | 51.2 | 47.8 | 33.3 | |
| F1 24 (2024) | 239 | 238 | 203 | 70.4 | 45.1 | |
| The First Descendant (2024) | 171 | 110.9 | 91.3 | 80 | 51.2 |
Emisyonlar ve güç - Yüksek güç tüketimine sahip XMG Pro
Gürültü emisyonları
Cyberpunk 2077 dizüstü bilgisayarın gürültü emisyonlarını 53 dB(A)'ya(performans modu) kadar yükseltirken, eğlence profili biraz daha ılımlı değerler üretiyor. Sessiz mod, dGPU kapalı olduğu için oyun oynamak için uygun değildir. Cihazın gürültü seviyesi rölantide ve günlük kullanım sırasında (ofis, internet) daha düşüktür: Fanlar aşırı hızlanmıyor ve zaman zaman hareketsiz kalıyorlar. Bazen dizüstü bilgisayarın içinden elektronik bir çatırtı duyulabilir.
Ses yüksekliği
| Boşta |
| 28 / 31 / 35 dB |
| Çalışırken |
| 52 / 52 dB |
 | ||
30 dB sessiz 40 dB(A) duyulabilirlik 50 dB(A) gürültülü |
||
min: | ||
| SCHENKER XMG Pro 16 Studio (Mid 24) NVIDIA GeForce RTX 4070 Laptop GPU, i9-14900HX, Samsung 990 Pro 1 TB | Acer Predator Helios Neo 16 (2024) NVIDIA GeForce RTX 4070 Laptop GPU, i7-14700HX, Samsung PM9A1a MZVL21T0HDLU | Lenovo Legion Pro 5 16IRX9 NVIDIA GeForce RTX 4070 Laptop GPU, i9-14900HX, Samsung PM9A1 MZVL21T0HCLR | Aorus 16X 2024 NVIDIA GeForce RTX 4070 Laptop GPU, i9-14900HX, Gigabyte AG450E1024-SI | SCHENKER XMG Pro 16 Studio (Mid 23) NVIDIA GeForce RTX 4070 Laptop GPU, i9-13900H, Samsung 990 Pro 1 TB | Lenovo Legion 7 16 IRX G9 NVIDIA GeForce RTX 4070 Laptop GPU, i9-14900HX, SK Hynix HFS001TEJ9X115N | |
|---|---|---|---|---|---|---|
| Noise | 3% | 10% | -3% | 7% | 16% | |
| kapalı / ortam * | 25 | 25.2 -1% | 23.9 4% | 26 -4% | 25 -0% | 24.5 2% |
| Idle Minimum * | 28 | 27.8 1% | 24.3 13% | 26 7% | 26 7% | 24.5 12% |
| Idle Average * | 31 | 32 -3% | 24.3 22% | 32 -3% | 29 6% | 24.5 21% |
| Idle Maximum * | 35 | 29.6 15% | 28.9 17% | 38 -9% | 34 3% | 24.5 30% |
| Load Average * | 52 | 45.2 13% | 45.8 12% | 54 -4% | 43 17% | 34.8 33% |
| Cyberpunk 2077 ultra * | 53 | |||||
| Load Maximum * | 52 | 55.8 -7% | 56.6 -9% | 55 -6% | 48 8% | 54.1 -4% |
| Witcher 3 ultra * | 51 | 50 | 48 | 54.1 |
* ... daha küçük daha iyidir
Sıcaklık
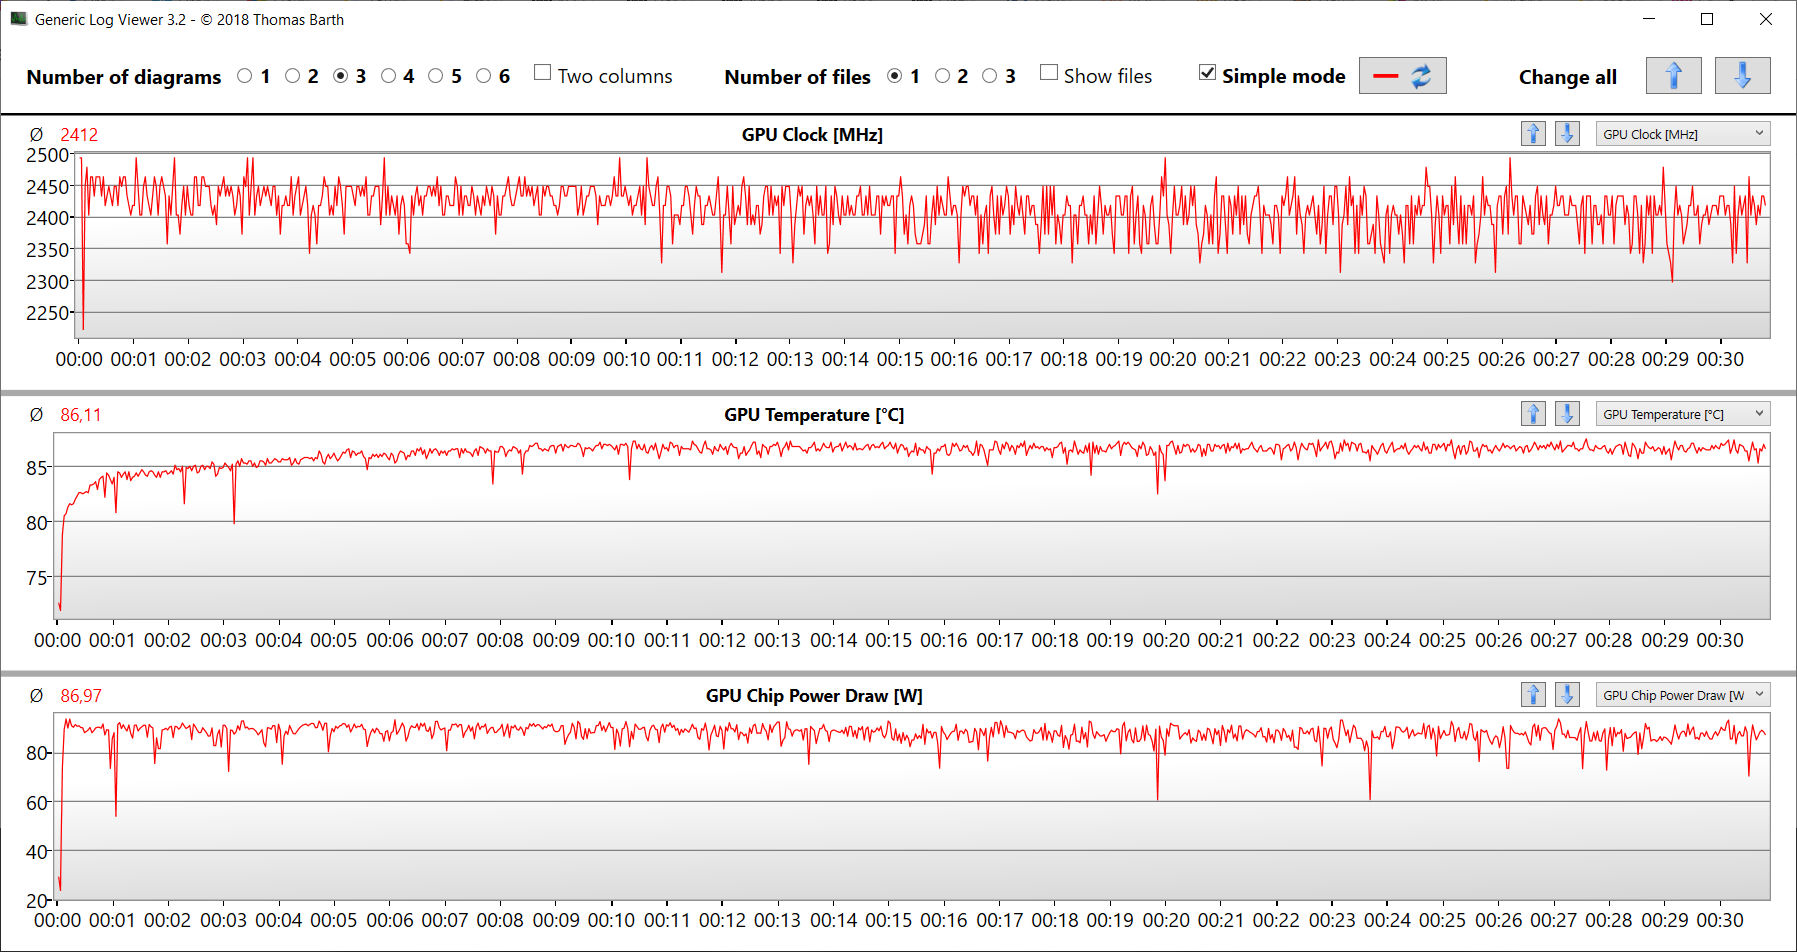
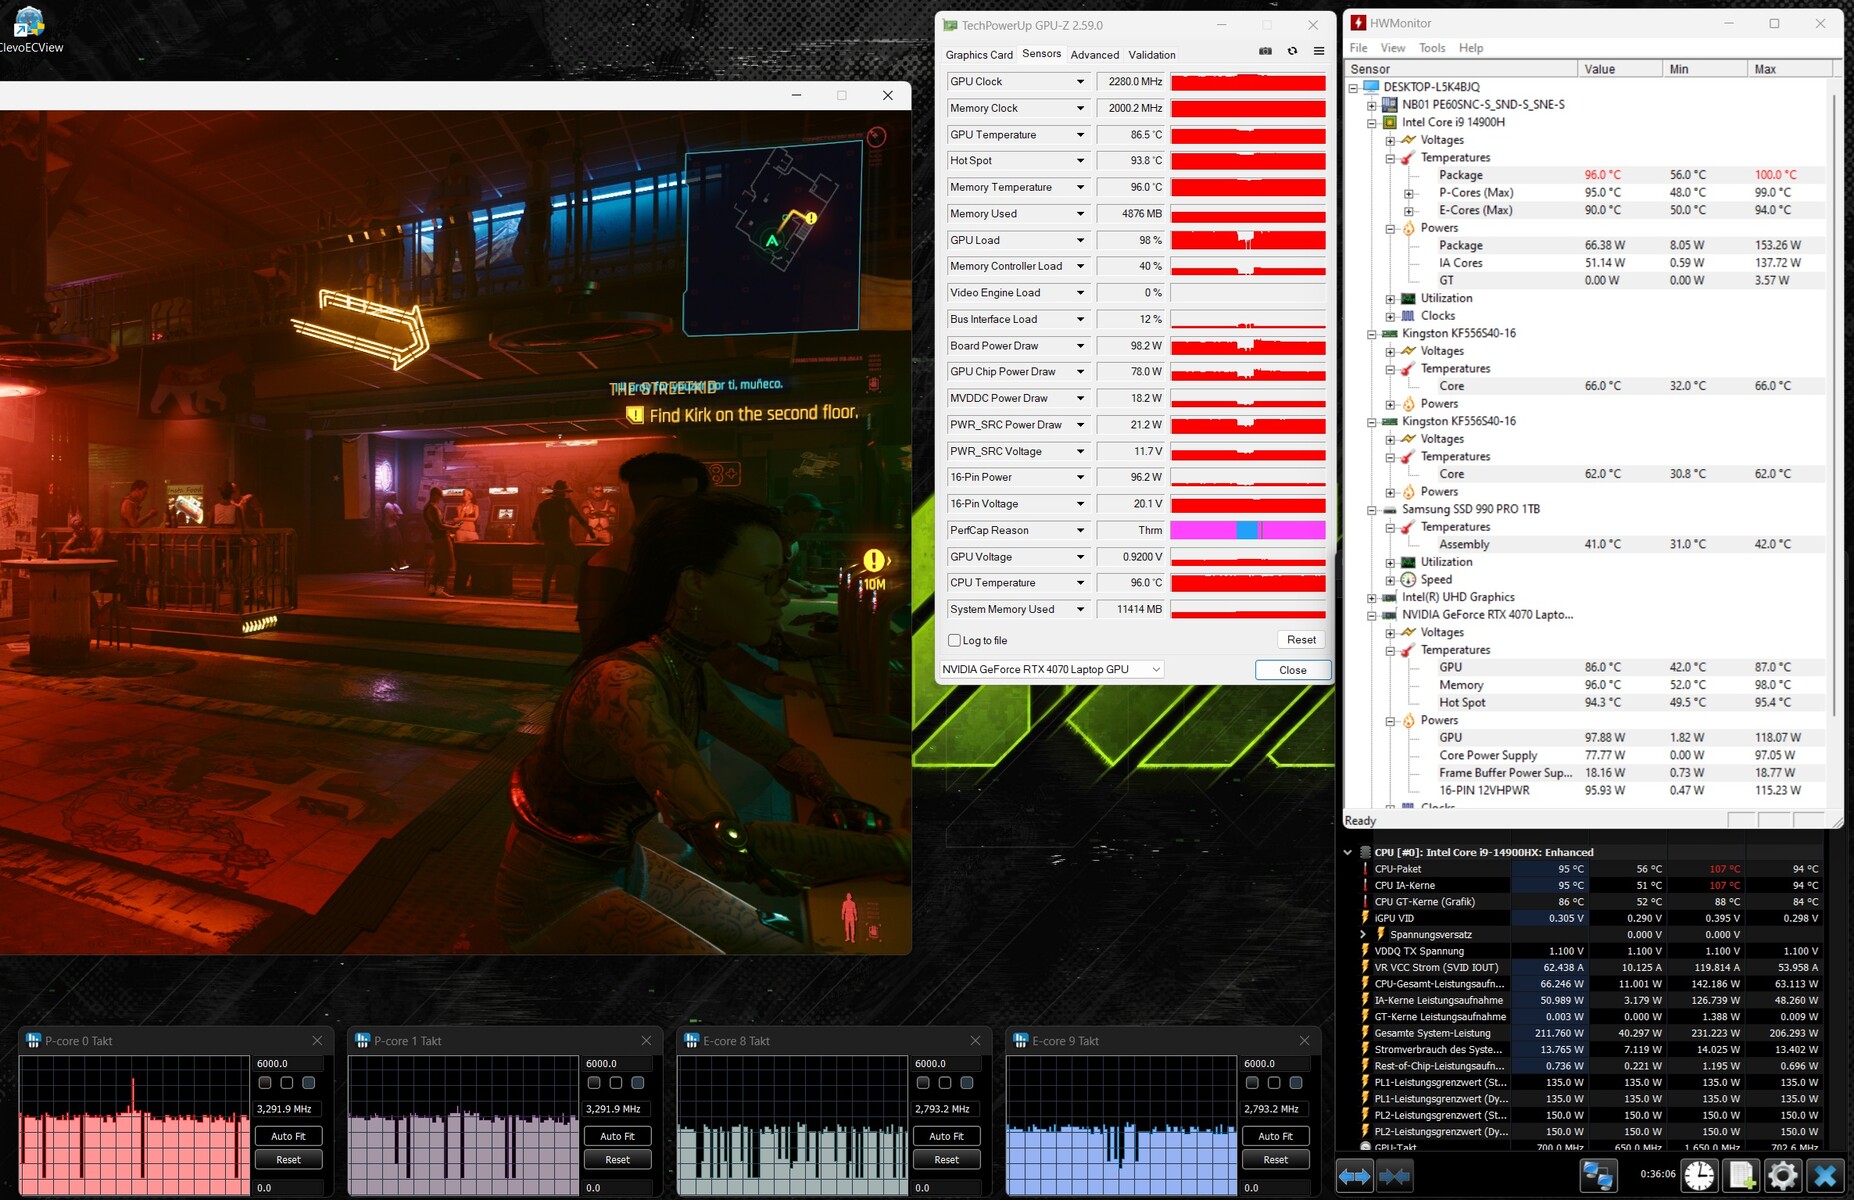
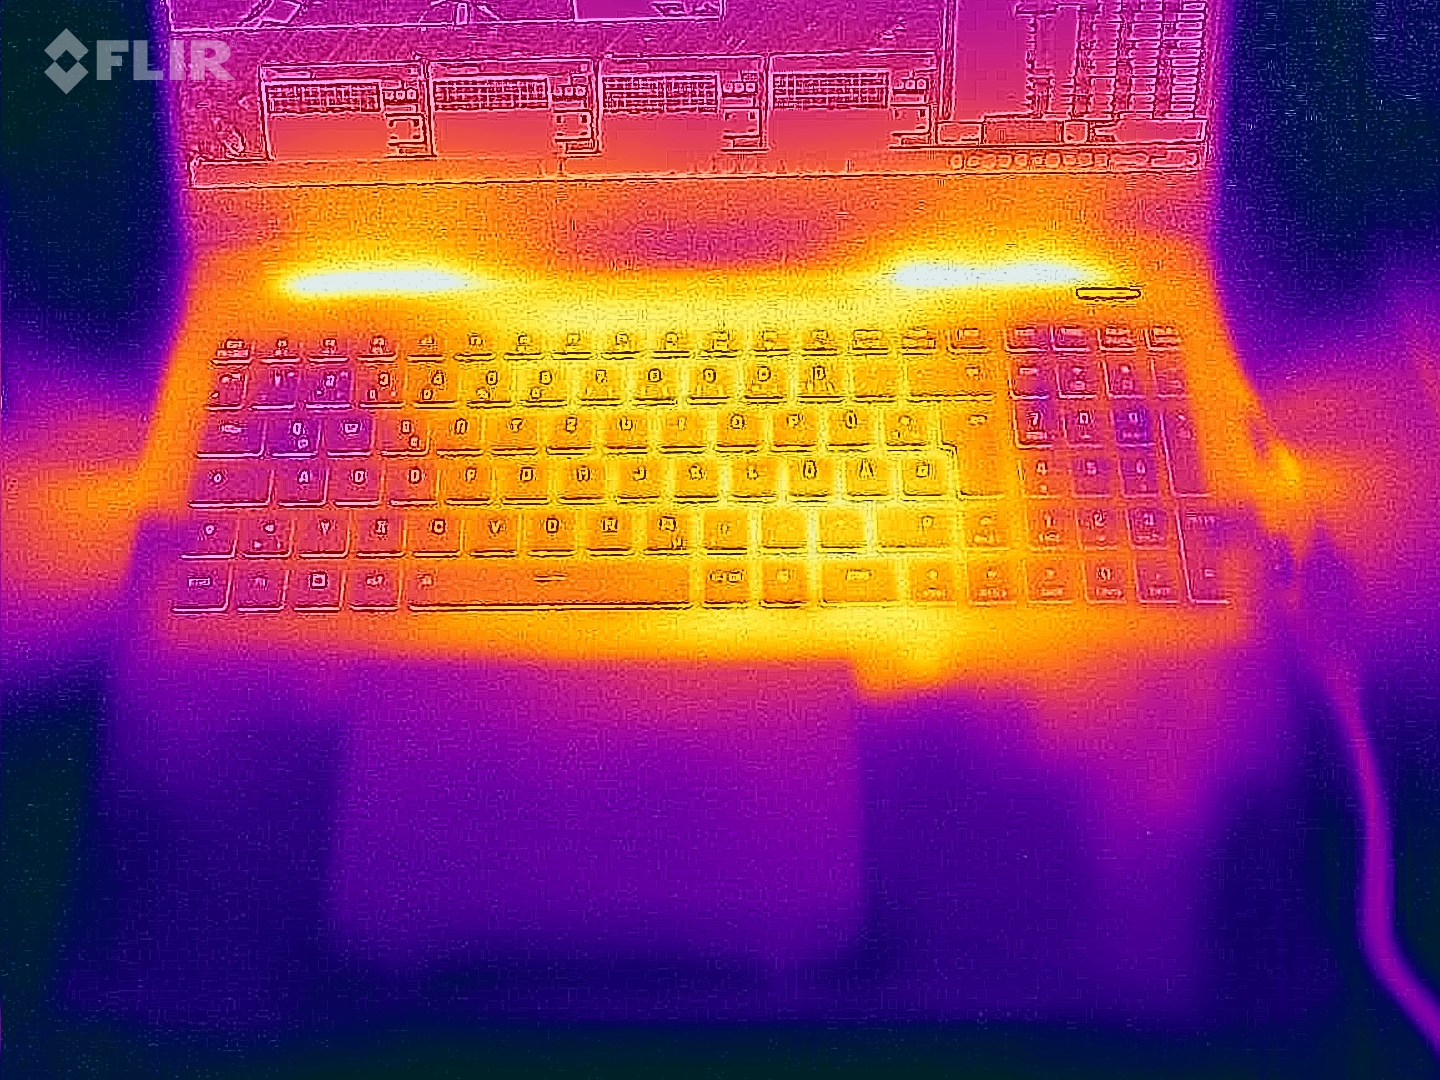
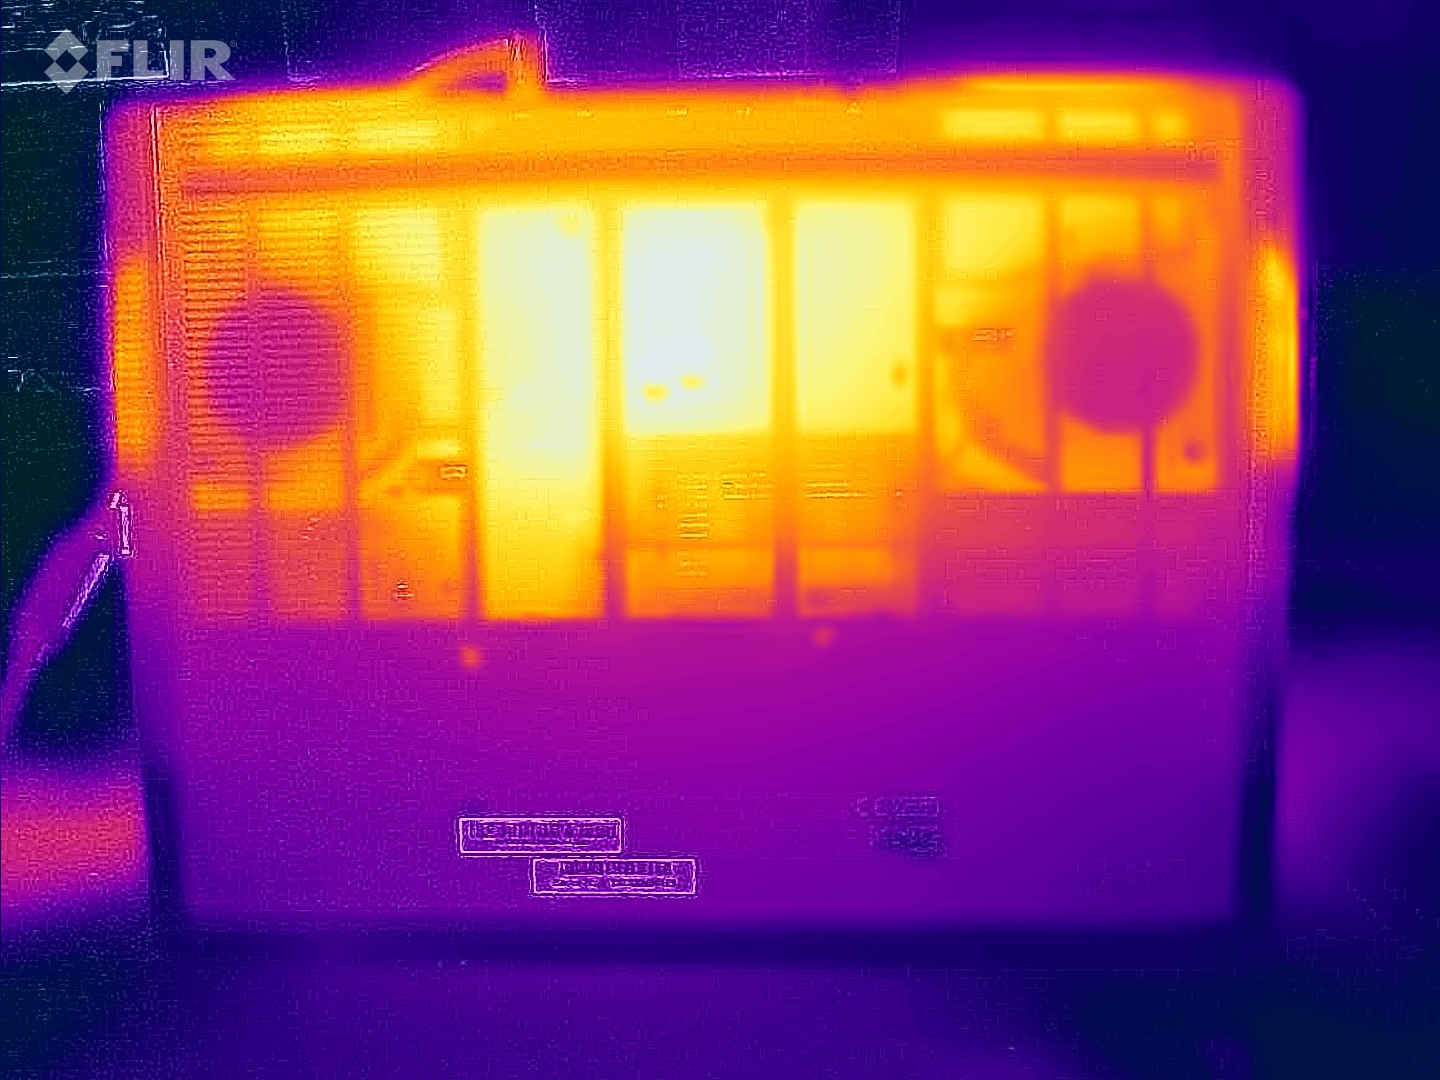
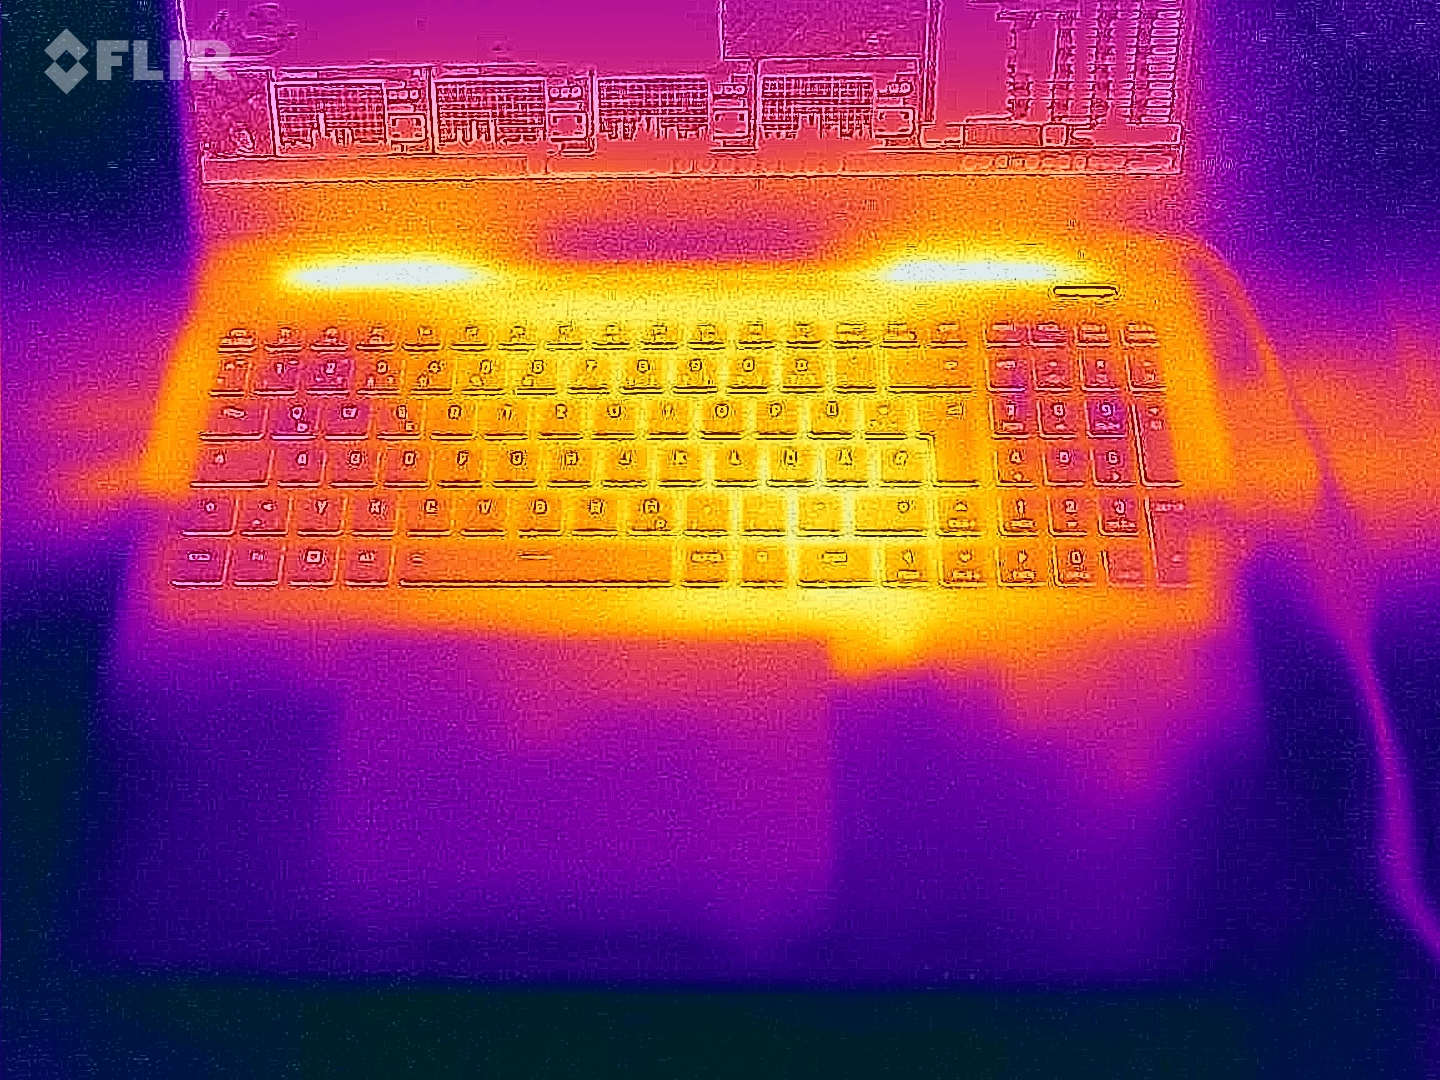
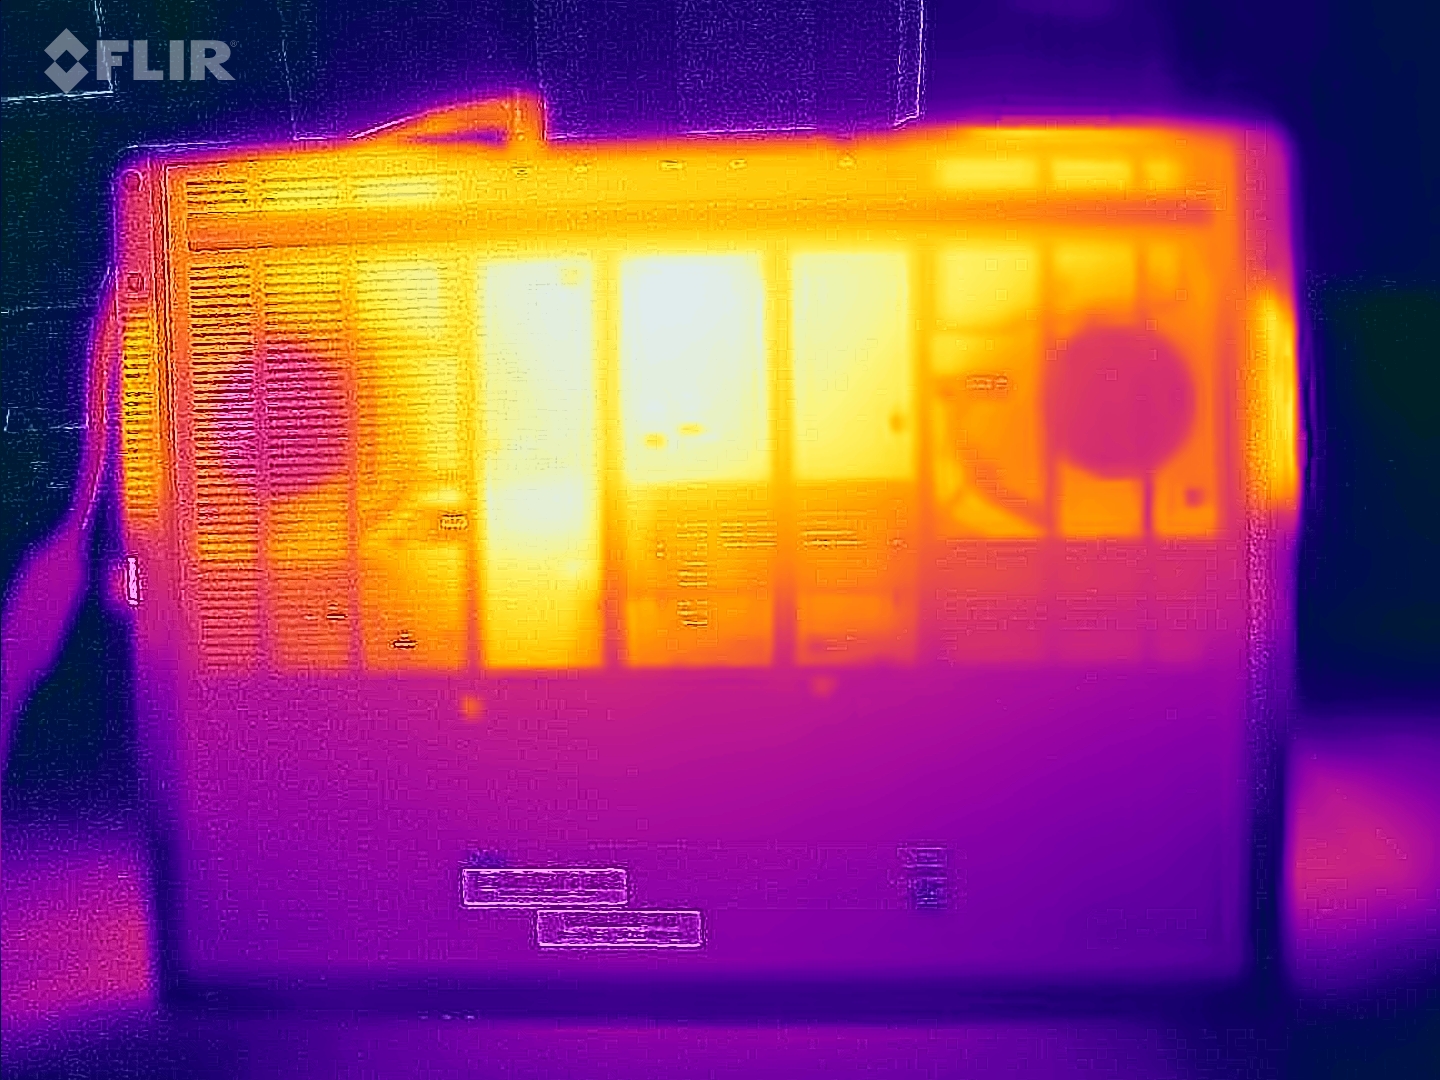
Dizüstü bilgisayar gözle görülür şekilde ısınıyor: Cyberpunk ve stres testleri belirli noktalarda 60 santigrat derecenin üzerinde sıcaklıklara neden oldu. Günlük kullanım sırasında da (ofis, internet) ortalamanın üzerinde değerlere ulaşılabiliyor. Avuç içi dayanağının sıcaklıkları o kadar kötü değil.
Aşırı stres testi senaryosu (Prime95 ve Furmark sürekli çalışmada) sistemin tam yük altındaki kararlılığını kontrol ediyor. Cihazın öncelikleri açıkça dağıtılmış: GPU tam güçte çalışırken, CPU saati (400 MHz ila 2 GHz) temel saatin altındaydı.
(-) Üst taraftaki maksimum sıcaklık, 40.4 °C / 105 F ortalamasına kıyasla 51 °C / 124 F'dir. , Gaming sınıfı için 21.2 ile 68.8 °C arasında değişir.
(-) Alt kısım, 43.2 °C / 110 F ortalamasına kıyasla maksimum 66 °C / 151 F'ye kadar ısınır
(±) Boşta kullanımda, üst tarafın ortalama sıcaklığı 32.3 °C / 90 F olup, cihazın 33.9 °C / 93 F.
(-) 3: The average temperature for the upper side is 42.2 °C / 108 F, compared to the average of 33.9 °C / 93 F for the class Gaming.
(+) Avuç içi dayanakları ve dokunmatik yüzey, maksimum 31 °C / 87.8 F ile cilt sıcaklığından daha soğuktur ve bu nedenle dokunulduğunda soğuktur.
(-) Benzer cihazların avuç içi dayanağı alanının ortalama sıcaklığı 28.9 °C / 84 F (-2.1 °C / -3.8 F) idi.
| SCHENKER XMG Pro 16 Studio (Mid 24) Intel Core i9-14900HX, NVIDIA GeForce RTX 4070 Laptop GPU | Acer Predator Helios Neo 16 (2024) Intel Core i7-14700HX, NVIDIA GeForce RTX 4070 Laptop GPU | Lenovo Legion Pro 5 16IRX9 Intel Core i9-14900HX, NVIDIA GeForce RTX 4070 Laptop GPU | Aorus 16X 2024 Intel Core i9-14900HX, NVIDIA GeForce RTX 4070 Laptop GPU | SCHENKER XMG Pro 16 Studio (Mid 23) Intel Core i9-13900H, NVIDIA GeForce RTX 4070 Laptop GPU | Lenovo Legion 7 16 IRX G9 Intel Core i9-14900HX, NVIDIA GeForce RTX 4070 Laptop GPU | |
|---|---|---|---|---|---|---|
| Heat | 9% | 11% | 14% | 2% | 22% | |
| Maximum Upper Side * | 51 | 58 -14% | 43.8 14% | 41 20% | 55 -8% | 43.7 14% |
| Maximum Bottom * | 66 | 45.2 32% | 55.4 16% | 41 38% | 66 -0% | 42.9 35% |
| Idle Upper Side * | 35 | 31.1 11% | 32.8 6% | 37 -6% | 33 6% | 29.1 17% |
| Idle Bottom * | 39 | 37.2 5% | 36 8% | 38 3% | 35 10% | 30.6 22% |
* ... daha küçük daha iyidir
Konuşmacılar
Açık bir bas eksikliği var. Bunun dışında stereo hoparlörler kabul edilebilir bir ses üretiyor. Maksimum seviyeleri biraz daha yüksek olabilirdi.
SCHENKER XMG Pro 16 Studio (Mid 24) ses analizi
(±) | hoparlör ses yüksekliği ortalama ama iyi (79 dB)
Bas 100 - 315Hz
(-) | neredeyse hiç bas yok - ortalama olarak medyandan 15.1% daha düşük
(±) | Bas doğrusallığı ortalamadır (13.6% delta - önceki frekans)
Ortalar 400 - 2000 Hz
(±) | daha yüksek ortalar - ortalama olarak medyandan 5.3% daha yüksek
(+) | orta frekanslar doğrusaldır (4.4% deltadan önceki frekansa)
Yüksekler 2 - 16 kHz
(+) | dengeli yüksekler - medyandan yalnızca 4.4% uzakta
(+) | yüksekler doğrusaldır (4.9% deltadan önceki frekansa)
Toplam 100 - 16.000 Hz
(±) | Genel sesin doğrusallığı ortalamadır (17.7% ortancaya göre fark)
Aynı sınıfla karşılaştırıldığında
» Bu sınıftaki tüm test edilen cihazların %50%'si daha iyi, 10% benzer, 40% daha kötüydü
» En iyisinin deltası 6% idi, ortalama 18% idi, en kötüsü 132% idi
Test edilen tüm cihazlarla karşılaştırıldığında
» Test edilen tüm cihazların %33'si daha iyi, 8 benzer, % 59 daha kötüydü
» En iyisinin deltası 4% idi, ortalama 24% idi, en kötüsü 134% idi
Lenovo Legion Pro 5 16IRX9 ses analizi
(±) | hoparlör ses yüksekliği ortalama ama iyi (80.7 dB)
Bas 100 - 315Hz
(-) | neredeyse hiç bas yok - ortalama olarak medyandan 19% daha düşük
(±) | Bas doğrusallığı ortalamadır (10.1% delta - önceki frekans)
Ortalar 400 - 2000 Hz
(+) | dengeli ortalar - medyandan yalnızca 4.7% uzakta
(+) | orta frekanslar doğrusaldır (5.7% deltadan önceki frekansa)
Yüksekler 2 - 16 kHz
(+) | dengeli yüksekler - medyandan yalnızca 3.3% uzakta
(+) | yüksekler doğrusaldır (5.6% deltadan önceki frekansa)
Toplam 100 - 16.000 Hz
(±) | Genel sesin doğrusallığı ortalamadır (17.2% ortancaya göre fark)
Aynı sınıfla karşılaştırıldığında
» Bu sınıftaki tüm test edilen cihazların %45%'si daha iyi, 11% benzer, 44% daha kötüydü
» En iyisinin deltası 6% idi, ortalama 18% idi, en kötüsü 132% idi
Test edilen tüm cihazlarla karşılaştırıldığında
» Test edilen tüm cihazların %29'si daha iyi, 8 benzer, % 63 daha kötüydü
» En iyisinin deltası 4% idi, ortalama 24% idi, en kötüsü 134% idi
Güç tüketimi
Boş modda, dizüstü bilgisayarın güç tüketimi çok yüksektir - benzer şekilde donatılmış önceki modelden önemli ölçüde daha yüksektir. Cyberpunk ve stres testleri hafifçe azalan, sürekli dalgalanan güç tüketimiyle çalıştırıldı. 230 watt'lık güç kaynağı ünitesi hala yeterli büyüklükte. Stres testinin başlangıcında olduğu gibi kısa süreli yük zirveleri onun için bir sorun teşkil etmiyor.
| Kapalı / Bekleme modu | |
| Boşta | |
| Çalışırken |
|
Key:
min: | |
| SCHENKER XMG Pro 16 Studio (Mid 24) NVIDIA GeForce RTX 4070 Laptop GPU, i9-14900HX, Samsung 990 Pro 1 TB | Acer Predator Helios Neo 16 (2024) NVIDIA GeForce RTX 4070 Laptop GPU, i7-14700HX, Samsung PM9A1a MZVL21T0HDLU | Lenovo Legion Pro 5 16IRX9 NVIDIA GeForce RTX 4070 Laptop GPU, i9-14900HX, Samsung PM9A1 MZVL21T0HCLR | Aorus 16X 2024 NVIDIA GeForce RTX 4070 Laptop GPU, i9-14900HX, Gigabyte AG450E1024-SI | SCHENKER XMG Pro 16 Studio (Mid 23) NVIDIA GeForce RTX 4070 Laptop GPU, i9-13900H, Samsung 990 Pro 1 TB | |
|---|---|---|---|---|---|
| Power Consumption | 11% | 23% | 22% | 43% | |
| Idle Minimum * | 31 | 26.7 14% | 12.5 60% | 13 58% | 8 74% |
| Idle Average * | 33 | 24.4 26% | 24.6 25% | 18 45% | 12 64% |
| Idle Maximum * | 41 | 32.7 20% | 24.8 40% | 35 15% | 23 44% |
| Load Average * | 114 | 122.1 -7% | 109.6 4% | 138 -21% | 94 18% |
| Cyberpunk 2077 ultra * | 218 | ||||
| Cyberpunk 2077 ultra external monitor * | 196.8 | ||||
| Load Maximum * | 250 | 241 4% | 284.9 -14% | 222 11% | 215 14% |
| Witcher 3 ultra * | 190.6 | 218 | 172.6 | 181.5 |
* ... daha küçük daha iyidir
Power consumption Cyberpunk / stress test
Power consumption with external monitor
Çalışma Zamanları
Pro 16 ayrıca pil modunda düşük yük altında selefinden daha fazla güce ihtiyaç duyuyor. Sonuç olarak, WiFi testi sırasında 5:37 saatlik bir çalışma süresi elde etti (bir komut dosyası kullanarak web sitelerine erişirken yükü eşleme). Bu da onu selefinin bir saat gerisinde bırakıyor selef-Aynı batarya kapasitesine sahip olan 73 Wh.
Artılar
Eksiler
Karar - Sorunları olan bir güç merkezi
Pro 16'nın odak noktası, GPU'nun ortalamasının biraz üzerindeki performans değerleriyle kalıcı olarak yüksek GPU gücüne dayanıyor. CPU zaten kısa bir süre sonra rahatlamak zorunda kalıyor - CB15 Loop bunu ortaya çıkardı.
XMG Pro 16 Studio (Mid 24) model bakım departmanına atanabilir. Raptor Lake'ten Raptor Lake Refresh'e geçiş dışında dizüstü bilgisayar önemli bir yeni özelliğe sahip değil.
Cihazın gürültü ve ısı gelişiminin yanı sıra boş moddaki güç tüketimi de (çok) yüksek. Dizüstü bilgisayarın ne kadar güç tükettiğiyle ilgili olarak, test örneğimizin bir kusuru olduğunu göz ardı edemeyiz. Çalışma süreleri iyi.
Kurulu 16:10 paneli (16 inç, 2.560 x 1.600 piksel, sRGB, IPS, 240 Hz) iyi, ancak bir içerik oluşturucu dizüstü bilgisayar için ön koşul olan DCI-P3 renk alanından yoksun. Cihaz yine de iki PCIe 4 SSD barındırabiliyor ve RAID 0/1 destekleniyor. Bir TB-4 bağlantı noktası, genişletme seçenekleri (harici GPU, yerleştirme) sağlar ve Power Delivery'yi destekler.
Bir alternatif de şu olabilir Aorus 16X (2024). Aynı CPU'dan biraz daha fazla işlem gücü elde edebilir, çok daha parlak bir ekrana sahiptir (Dolby Vision dahil) - ayrıca daha iyi çalışma sürelerine sahiptir.
Fiyat ve bulunabilirlik
Yeni XMG Pro 16 Studio (Mid 24) yapılandırılabilir ve bestware.com adresinden sipariş edilebilirmevcut test cihazının maliyeti yaklaşık 2.500 ABD dolarıdır.
Lütfen dikkat: Derecelendirme sistemimizi yakın zamanda güncelledik ve 8. sürümün sonuçları 7. sürümün sonuçlarıyla karşılaştırılabilir değildir. Daha fazla bilgi için burada.
SCHENKER XMG Pro 16 Studio (Mid 24)
- 07/23/2024 v8
Sascha Mölck
 Total Sustainability Score:
 Şeffaflık
İncelenecek cihazların seçimi editör ekibimiz tarafından yapılır. Test örneği, bu incelemenin amacı doğrultusunda üretici veya perakendeci tarafından yazara ödünç olarak sağlanmıştır. Borç verenin bu inceleme üzerinde herhangi bir etkisi olmadığı gibi, üretici de yayınlanmadan önce bu incelemenin bir kopyasını almamıştır. Bu incelemeyi yayınlama zorunluluğu yoktu. İncelemelerimiz karşılığında asla tazminat veya ödeme kabul etmiyoruz. Bağımsız bir medya şirketi olarak Notebookcheck, üreticilerin, perakendecilerin veya yayıncıların otoritesine tabi değildir.
Notebookcheck bu şekilde test yapıyor
Notebookcheck, tüm sonuçların karşılaştırılabilir olmasını sağlamak için her yıl yüzlerce dizüstü bilgisayarı ve akıllı telefonu standart prosedürler kullanarak bağımsız olarak inceliyor. Yaklaşık 20 yıldır test yöntemlerimizi sürekli olarak geliştirdik ve bu süreçte endüstri standartlarını belirledik. Test laboratuvarlarımızda deneyimli teknisyenler ve editörler tarafından yüksek kaliteli ölçüm ekipmanları kullanılmaktadır. Bu testler çok aşamalı bir doğrulama sürecini içerir. Karmaşık derecelendirme sistemimiz, nesnelliği koruyan yüzlerce sağlam temellere dayanan ölçüm ve kıyaslamaya dayanmaktadır.Price comparison

