

Lenovo Legion 9 16IRX9 (Legion 9i) incelemesi: RTX 4090 ne kadar üst düzey bir oyuncu?
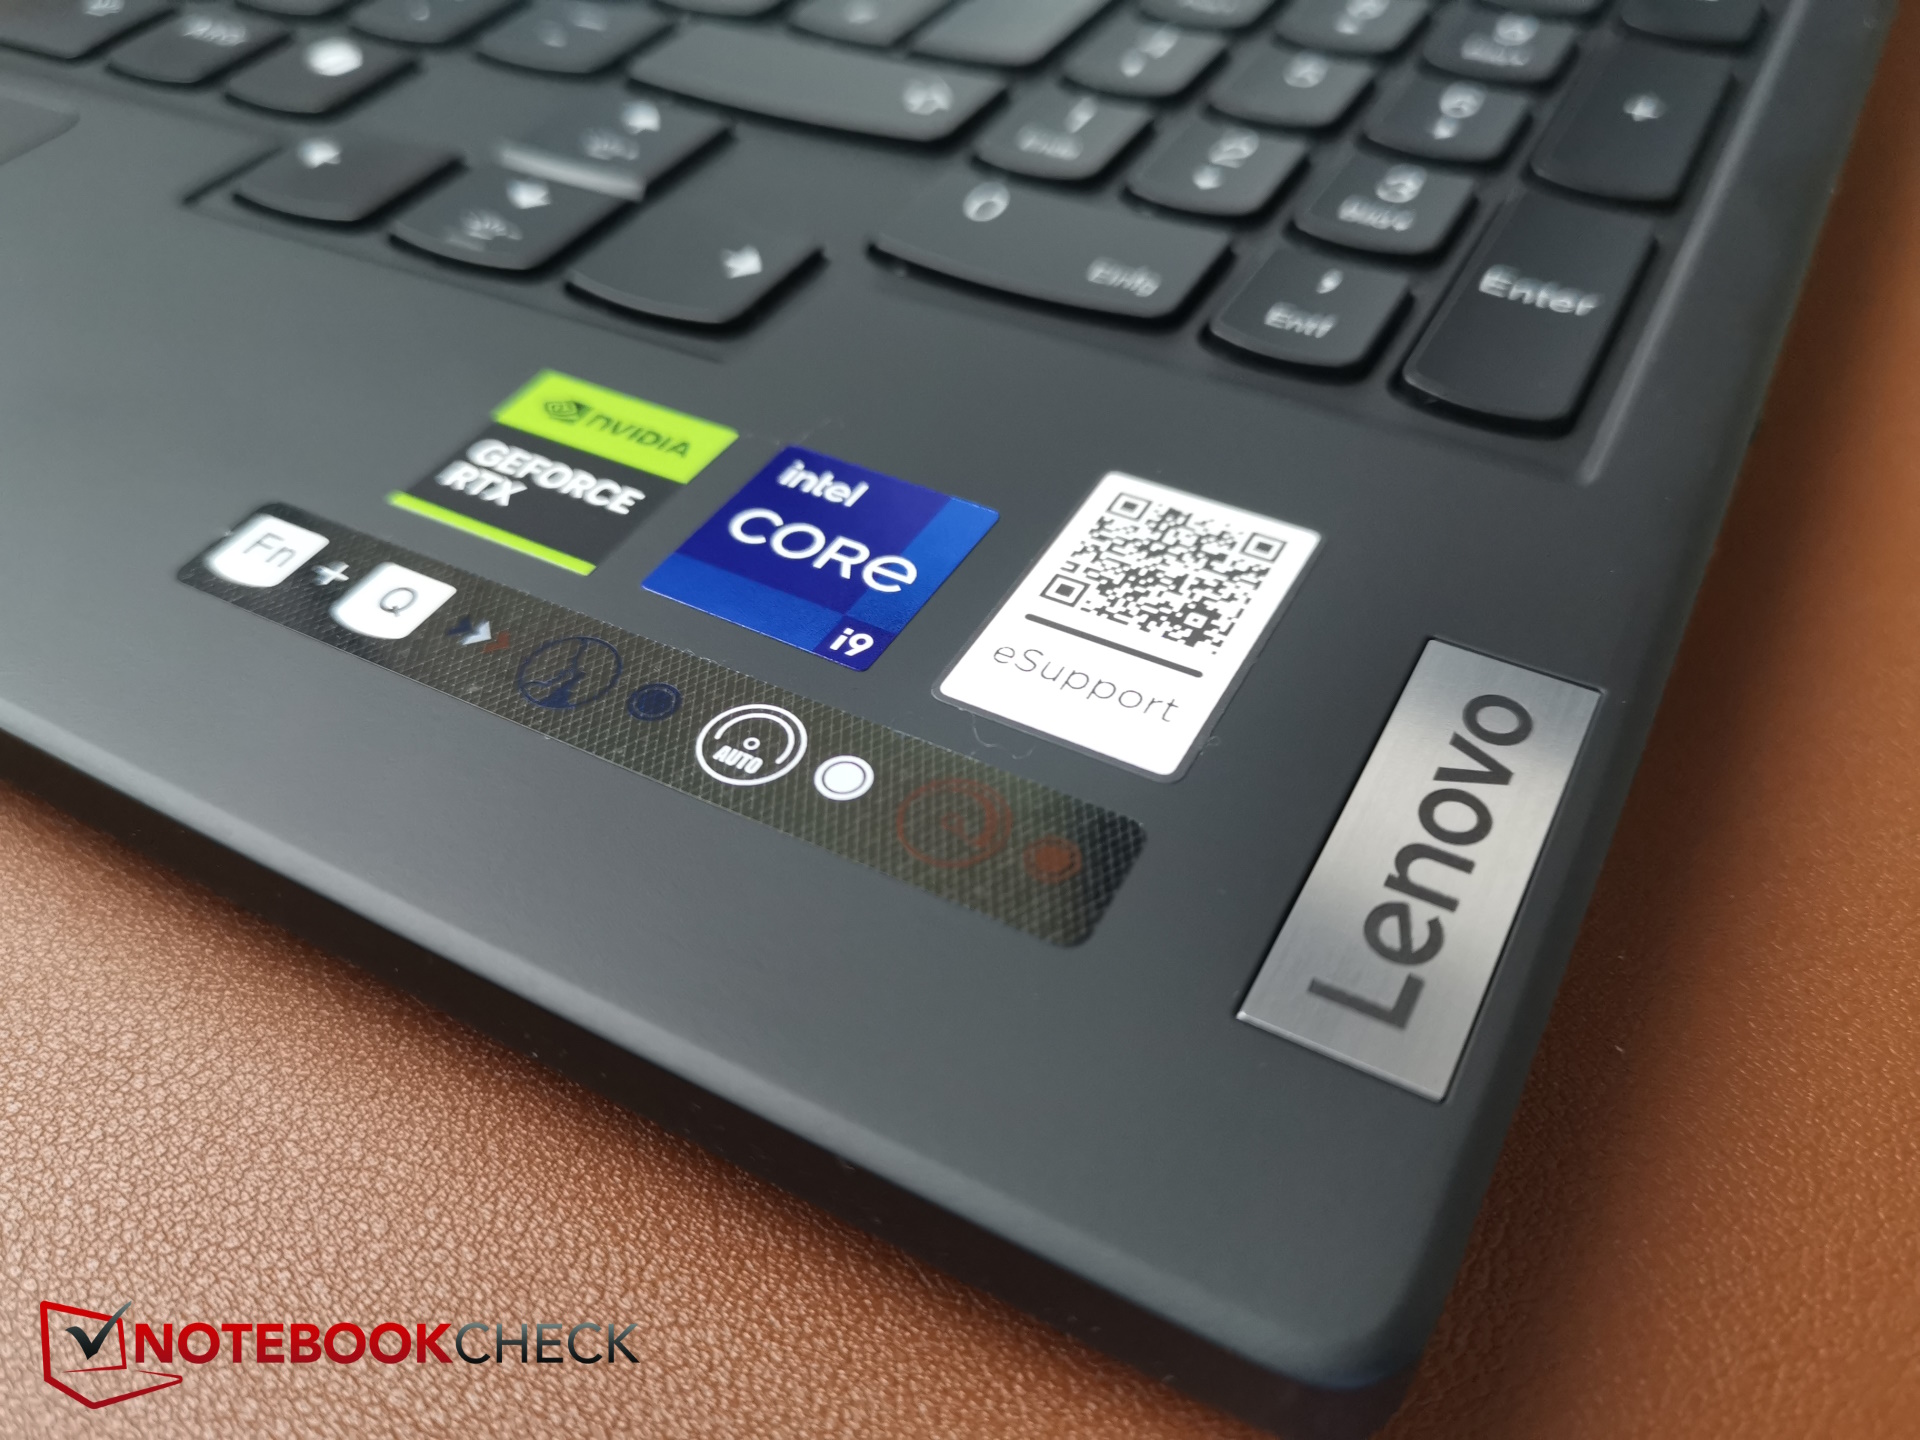
Geçen yıl Legion 9i için "Lenovo'nun bugüne kadarki en iddialı dizüstü oyun bilgisayarı" demiştik. Yeni nesil daha az iddialı olmayabilir, ancak üst düzey oyuncu için yapılan değişiklikler ciddi şekilde sınırlıdır. Sadece CPU'su en yeni 14. Intel nesli ile değiştirildi ve bu da dizüstü bilgisayarı daha fazla yapay zeka yeteneğine sahip hale getiriyor.
16 inçlik dizüstü bilgisayarlar genellikle RTX 4090ile karşılaştıracağız selefi, ve Razer Blade 16 (2024) gibi 18 inçlik oyuncuların yanı sıra Alienware m18 R2 ve Asus ROG Strix Scar 18 (2024)ve 17 inç Medion Erazer Beast X40 (2024).
Güncelleme: Bu testte bahsedilen sorunlar (kare hızı düşüşleri, düşük tek çekirdek puanı) nedeniyle üreticiyle (ajansı aracılığıyla) temasa geçtik. Potansiyel bir yedek cihaz aynı tek çekirdek puanını gösterdi (ajans tarafından ölçüldü), bu yüzden en azından bu doğrulandı. Kare hızları konusunda hala iletişim halindeyiz ve mümkün olan en kısa sürede bir yanıt yayınlayacağız.
Karşılaştırmalı olarak olası rakipler
Derecelendirme | Sürüm | Tarih | Modeli | Ağırlık | Yükseklik | Boyut | Çözünürlük | Fiyat |
|---|---|---|---|---|---|---|---|---|
| 83.9 % | v8 | 06/2024 | Lenovo Legion 9 16IRX9, RTX 4090 i9-14900HX, NVIDIA GeForce RTX 4090 Laptop GPU | 2.5 kg | 22.7 mm | 16.00" | 3200x2000 | |
| 90.2 % v7 (old) | v7 (old) | 10/2023 | Lenovo Legion 9 16IRX8 i9-13980HX, NVIDIA GeForce RTX 4090 Laptop GPU | 2.6 kg | 22.7 mm | 16.00" | 3200x2000 | |
| 91.1 % v7 (old) | v7 (old) | 02/2024 | Razer Blade 16 2024, RTX 4090 i9-14900HX, NVIDIA GeForce RTX 4090 Laptop GPU | 2.5 kg | 22 mm | 16.00" | 2560x1600 | |
| 89.5 % v7 (old) | v7 (old) | 03/2024 | Alienware m18 R2 i9-14900HX, NVIDIA GeForce RTX 4090 Laptop GPU | 4 kg | 26.7 mm | 18.00" | 2560x1600 | |
| 88.3 % v7 (old) | v7 (old) | 02/2024 | Asus ROG Strix Scar 18 G834JYR (2024) i9-14900HX, NVIDIA GeForce RTX 4090 Laptop GPU | 3.1 kg | 30.8 mm | 18.00" | 2560x1600 | |
| 89.2 % v7 (old) | v7 (old) | 02/2024 | Medion Erazer Beast X40 2024 i9-14900HX, NVIDIA GeForce RTX 4090 Laptop GPU | 2.9 kg | 36 mm | 17.00" | 2560x1600 |
Not: Derecelendirme sistemimizi yakın zamanda güncelledik ve 8. sürümün sonuçları 7. sürümün sonuçları ile karşılaştırılamaz. Daha fazla bilgi için burada .
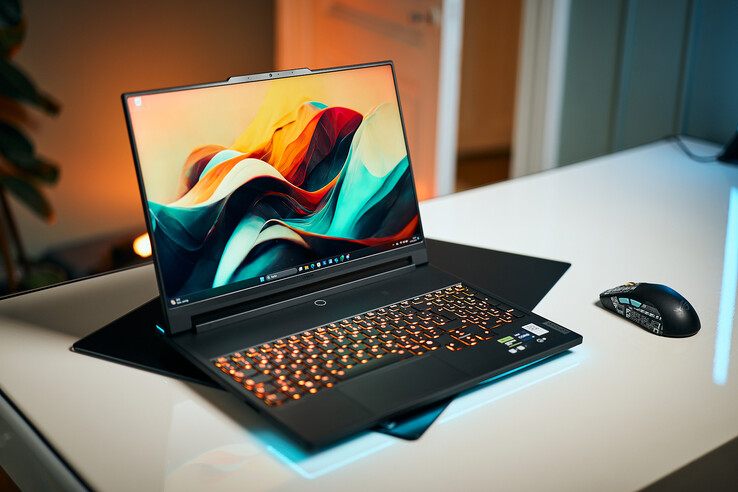
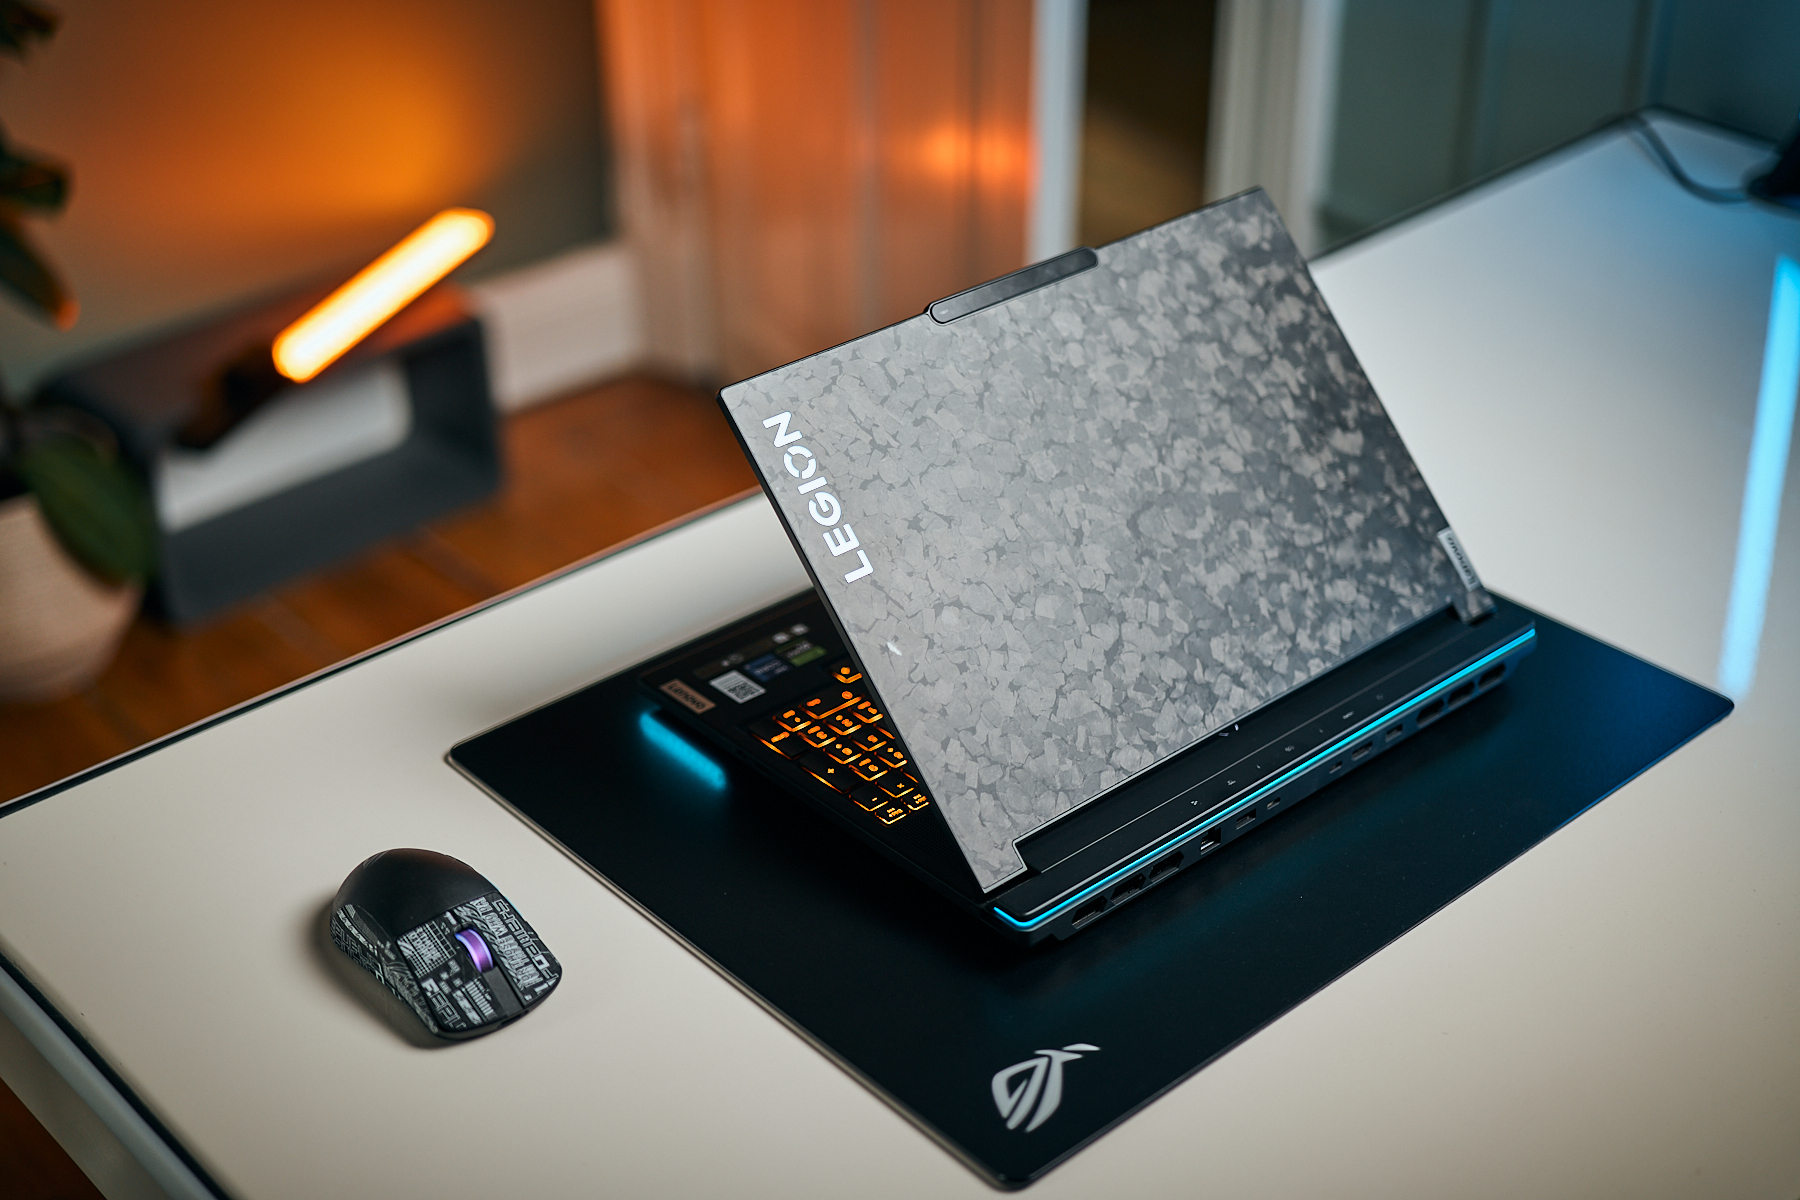
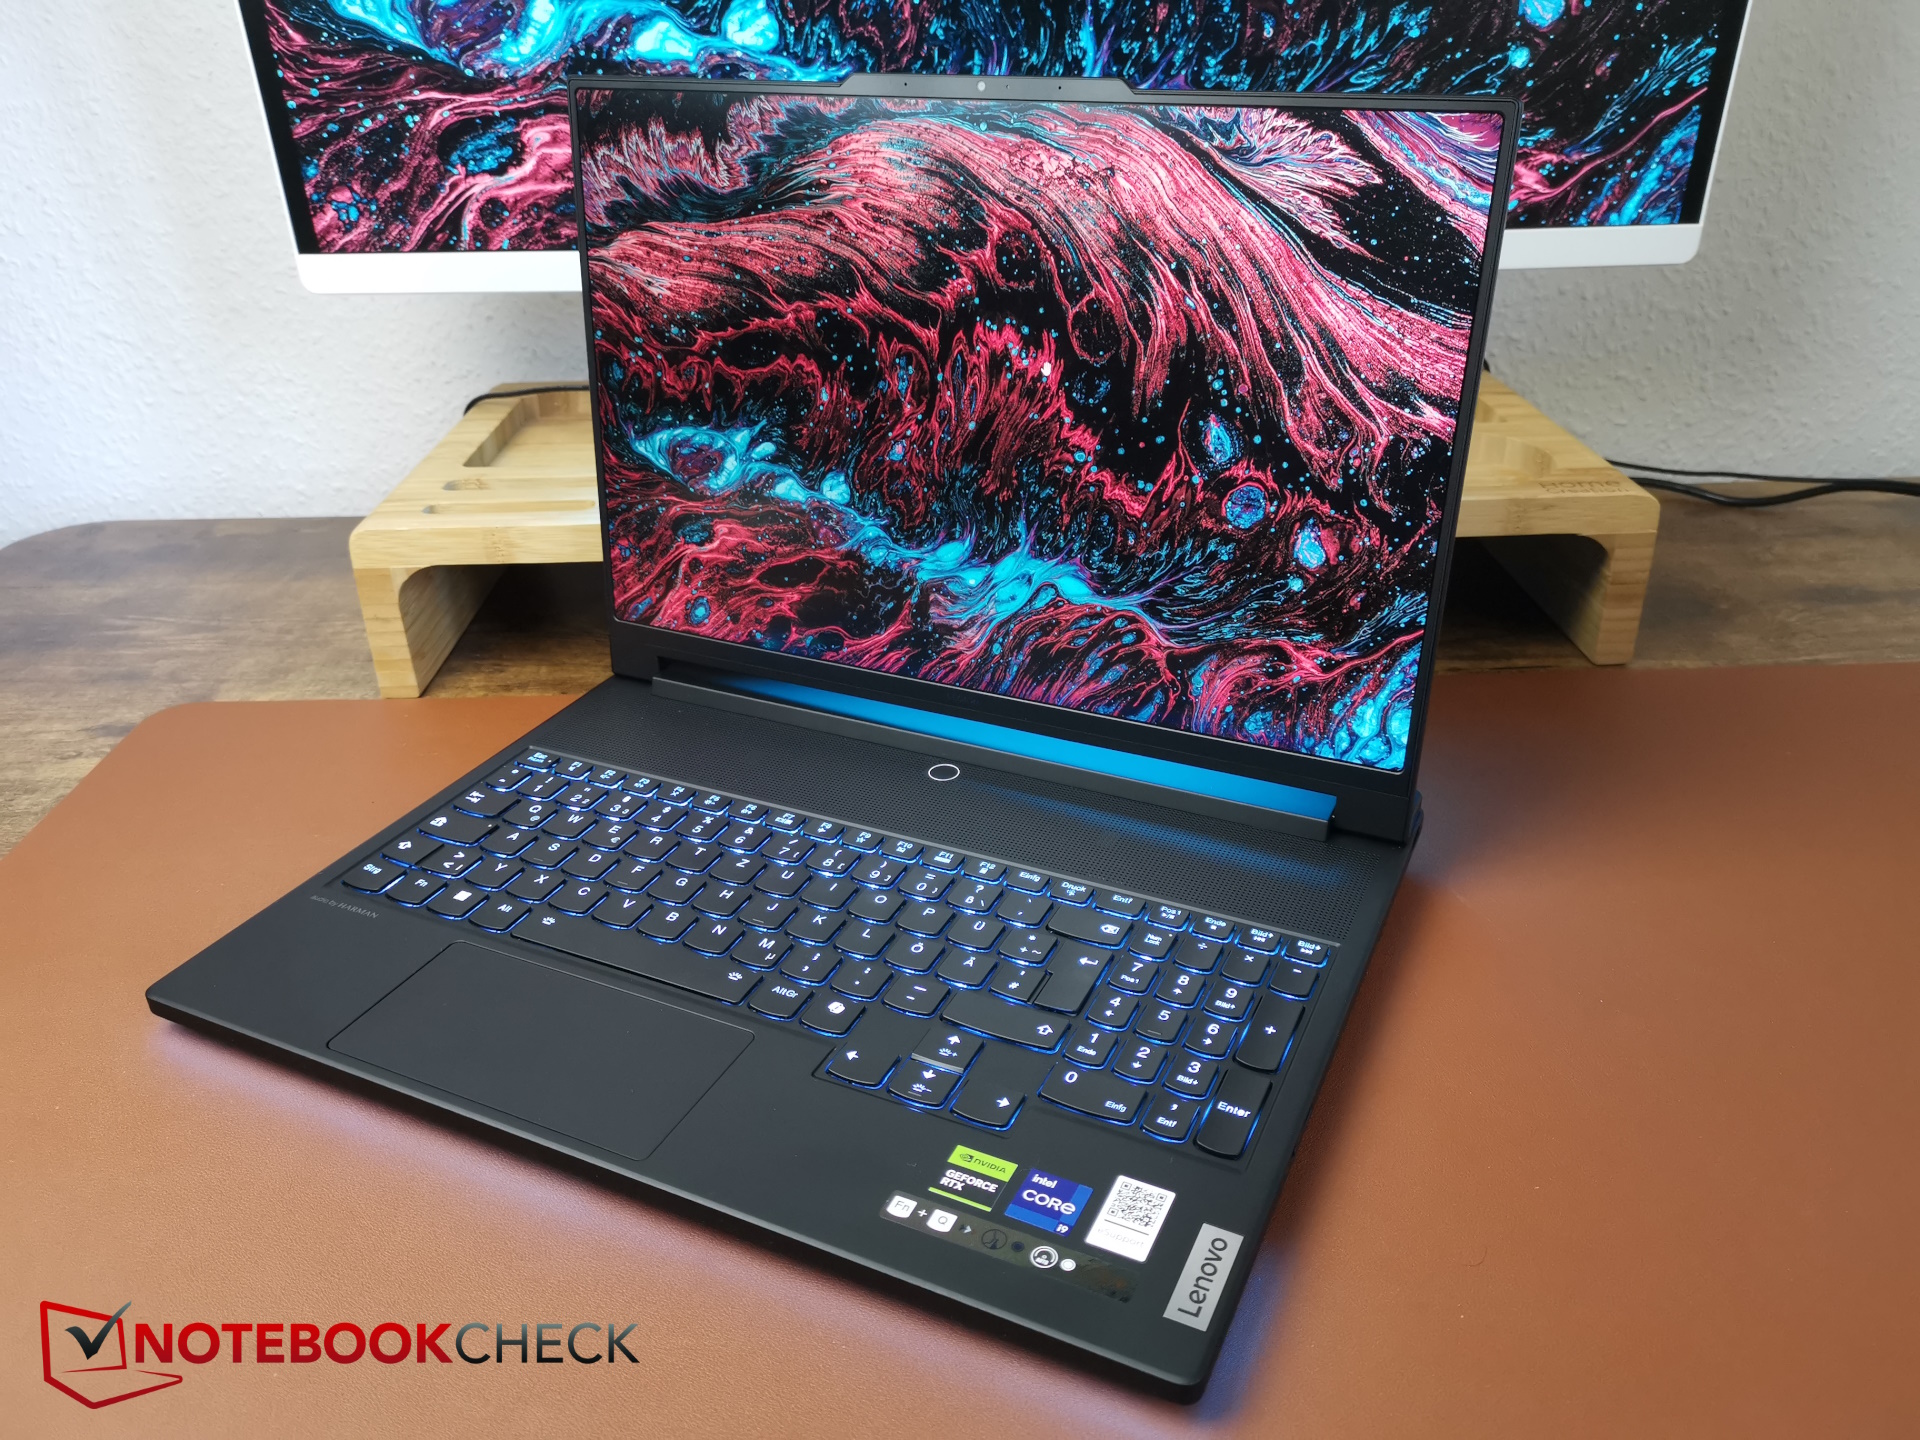
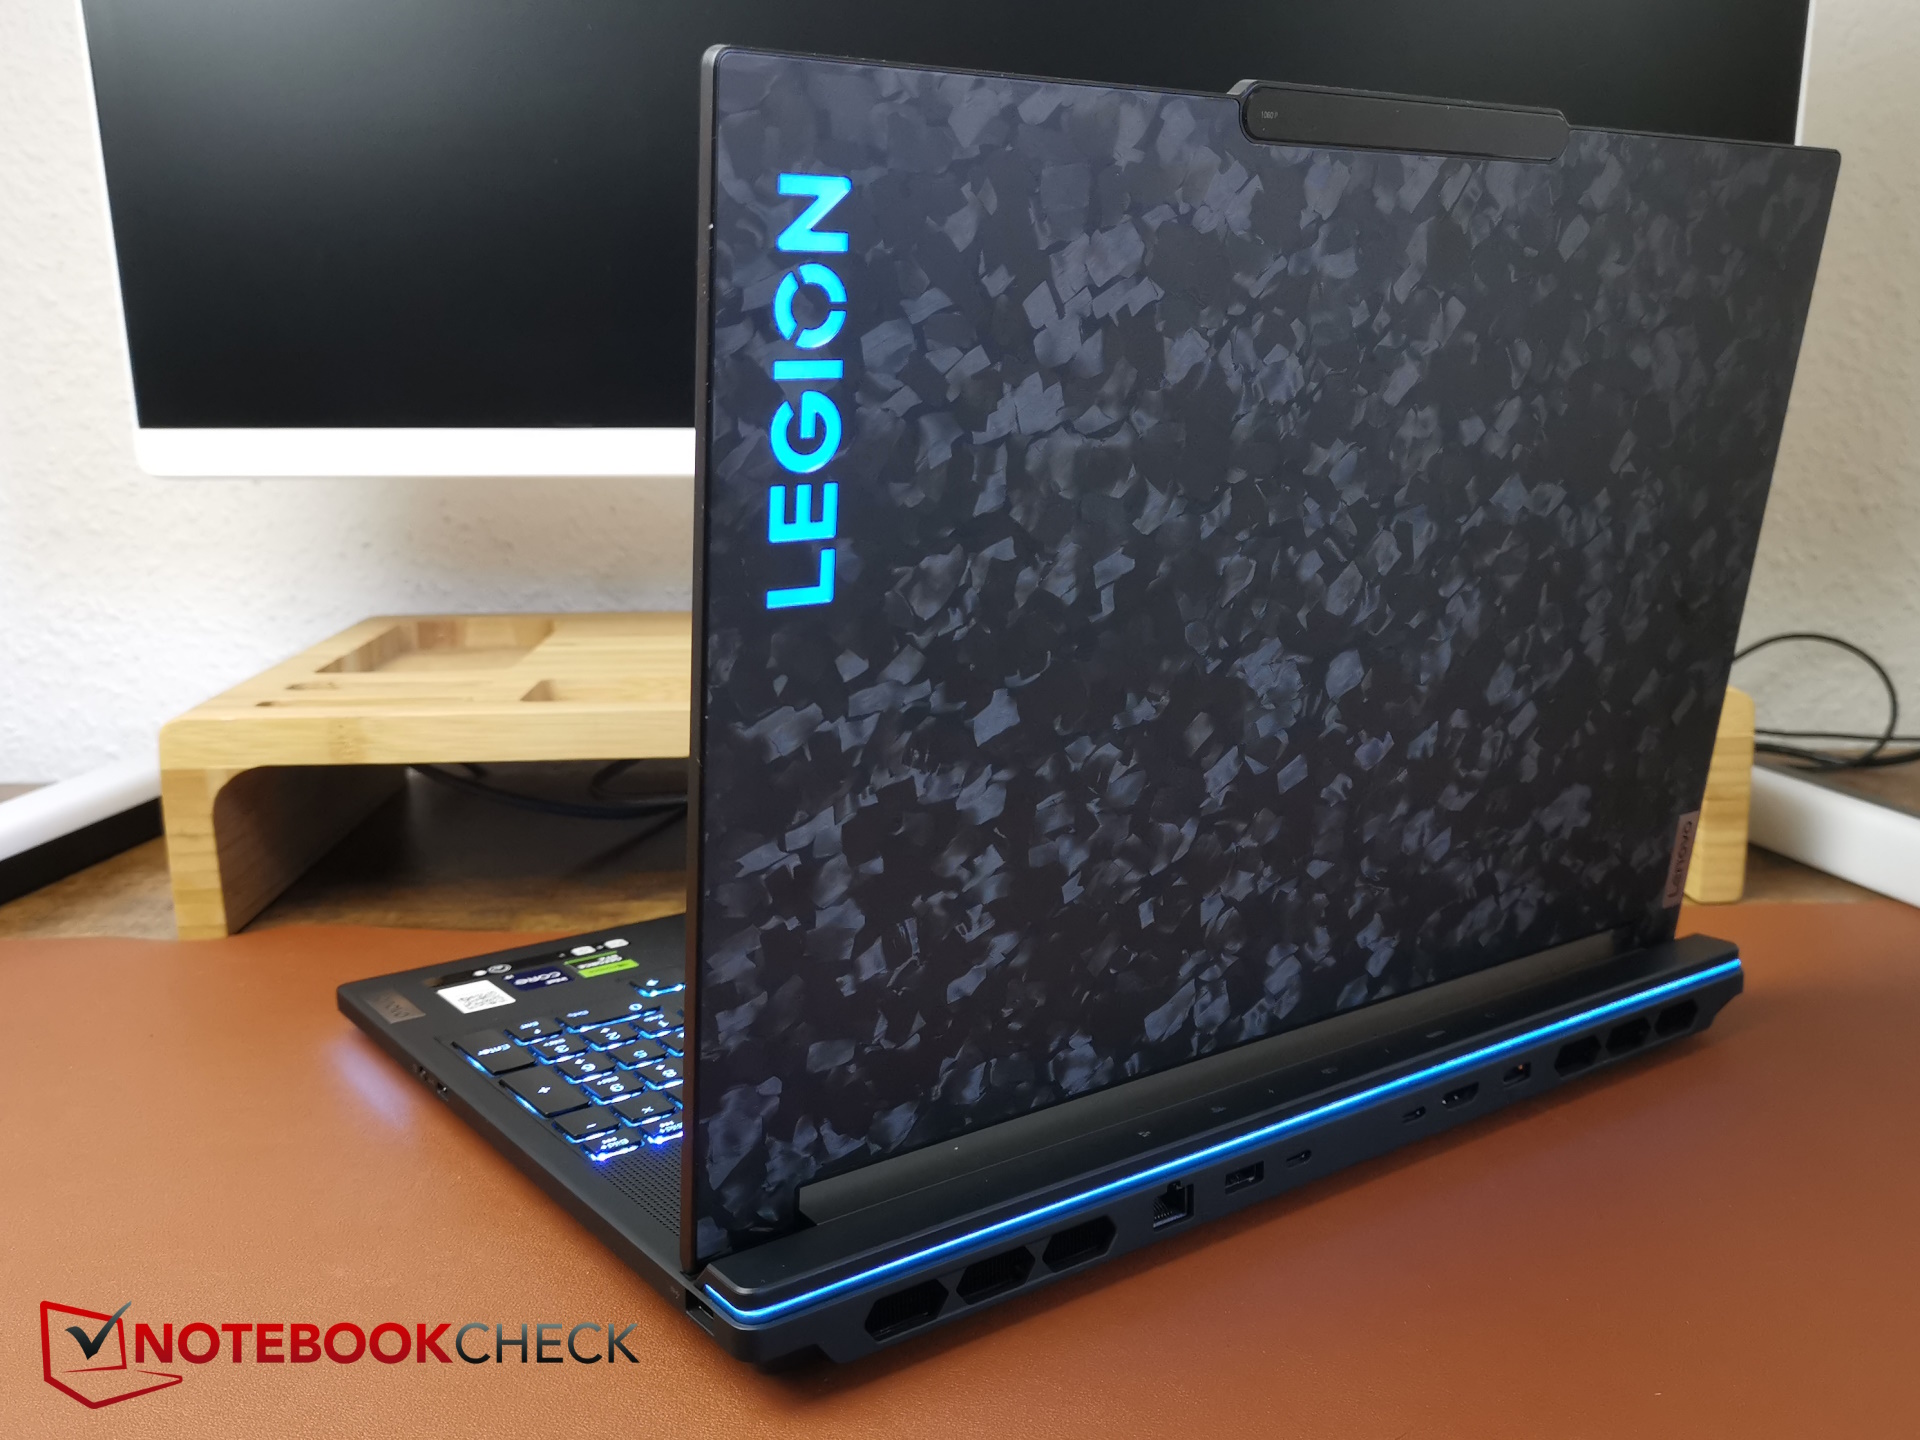
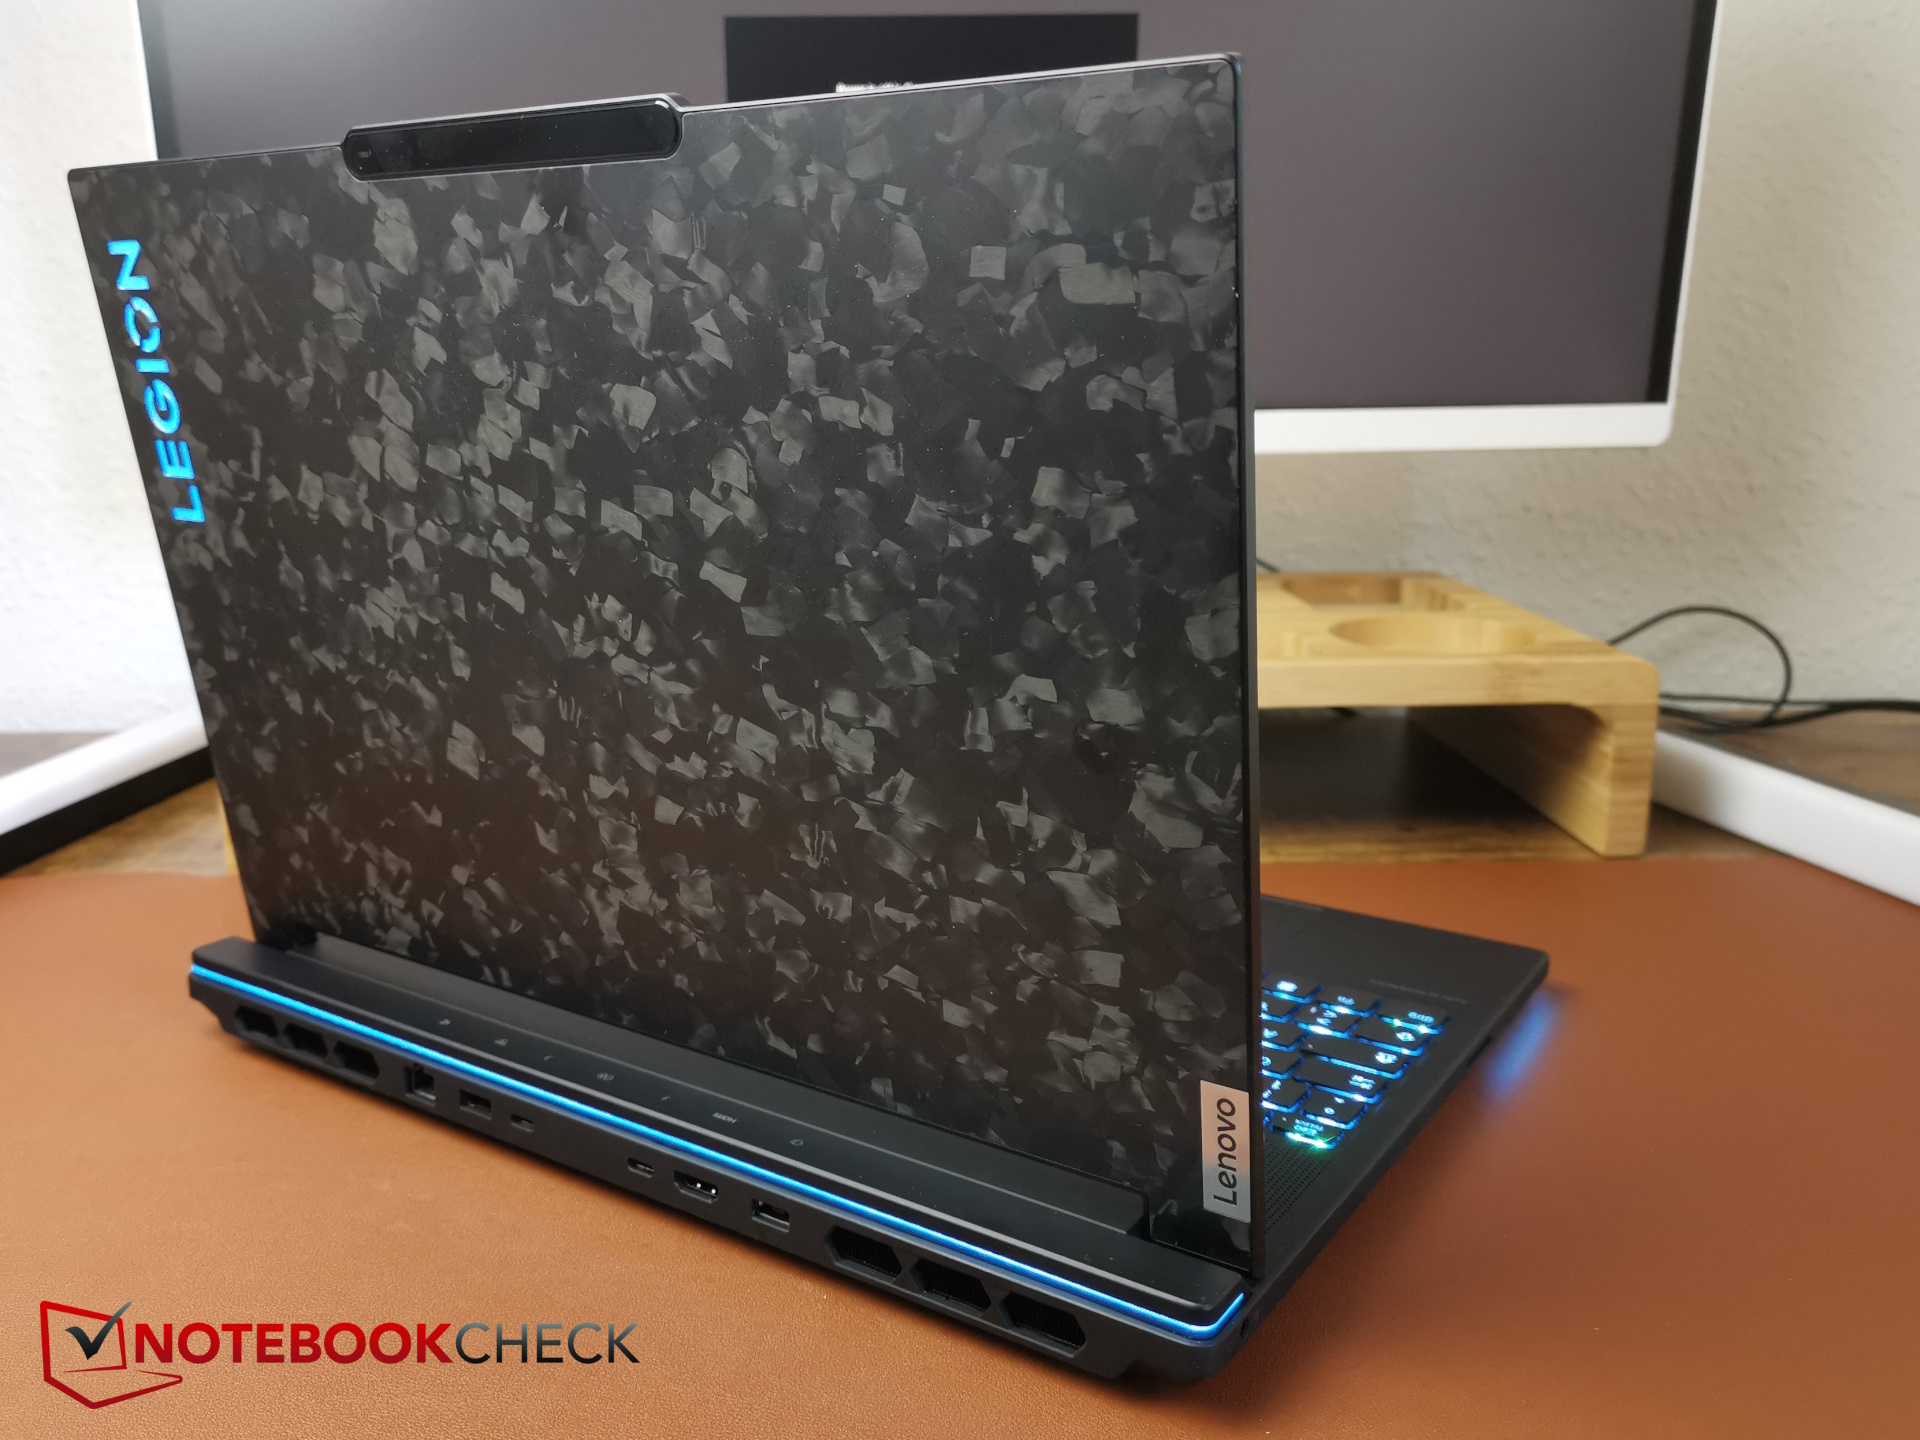
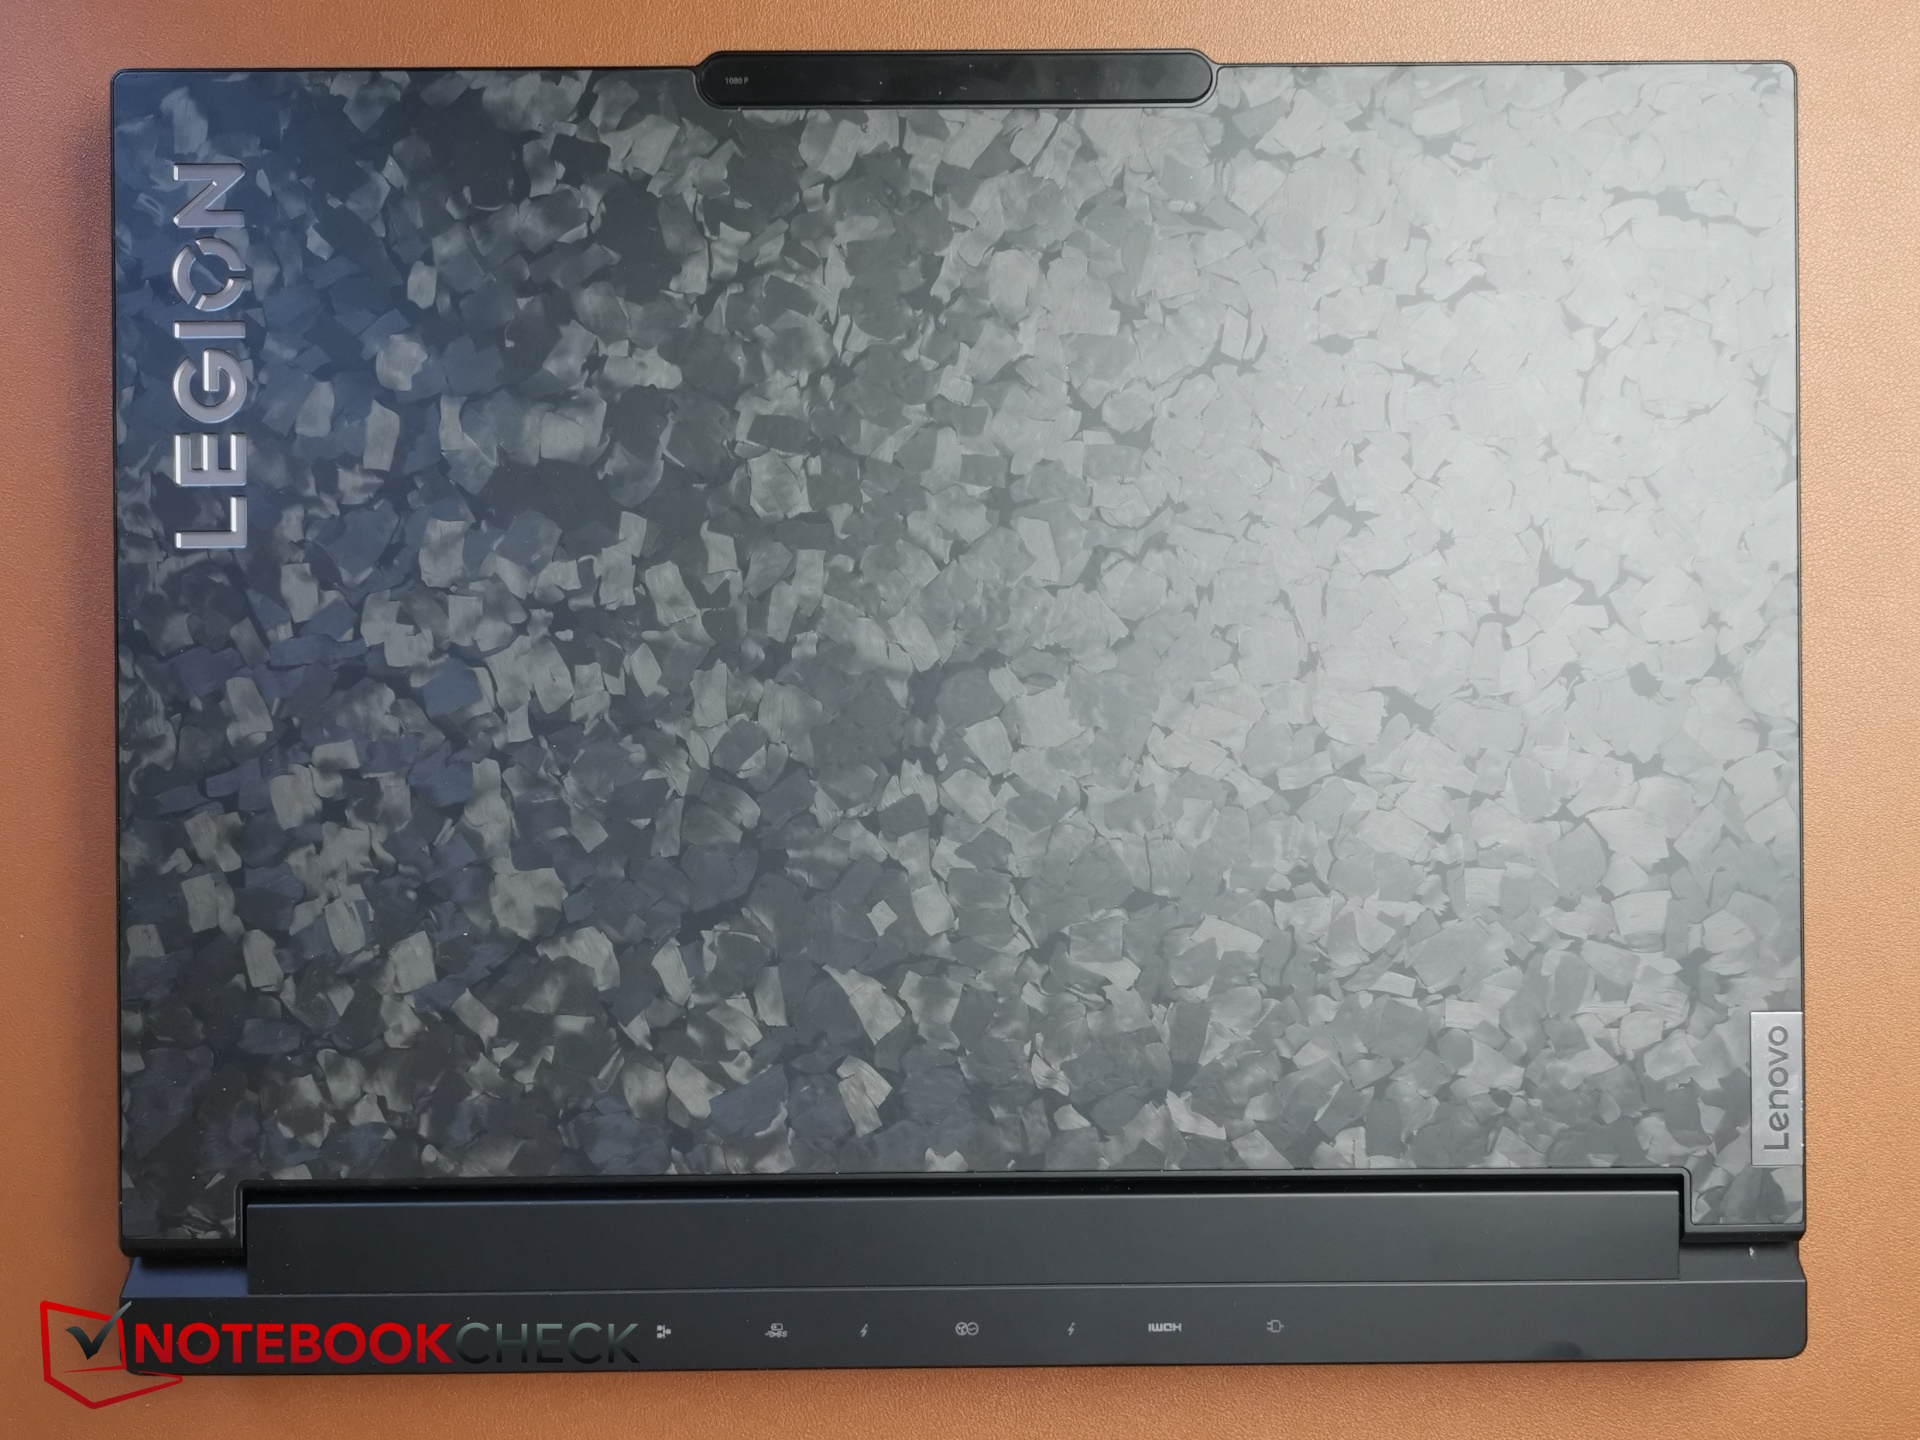
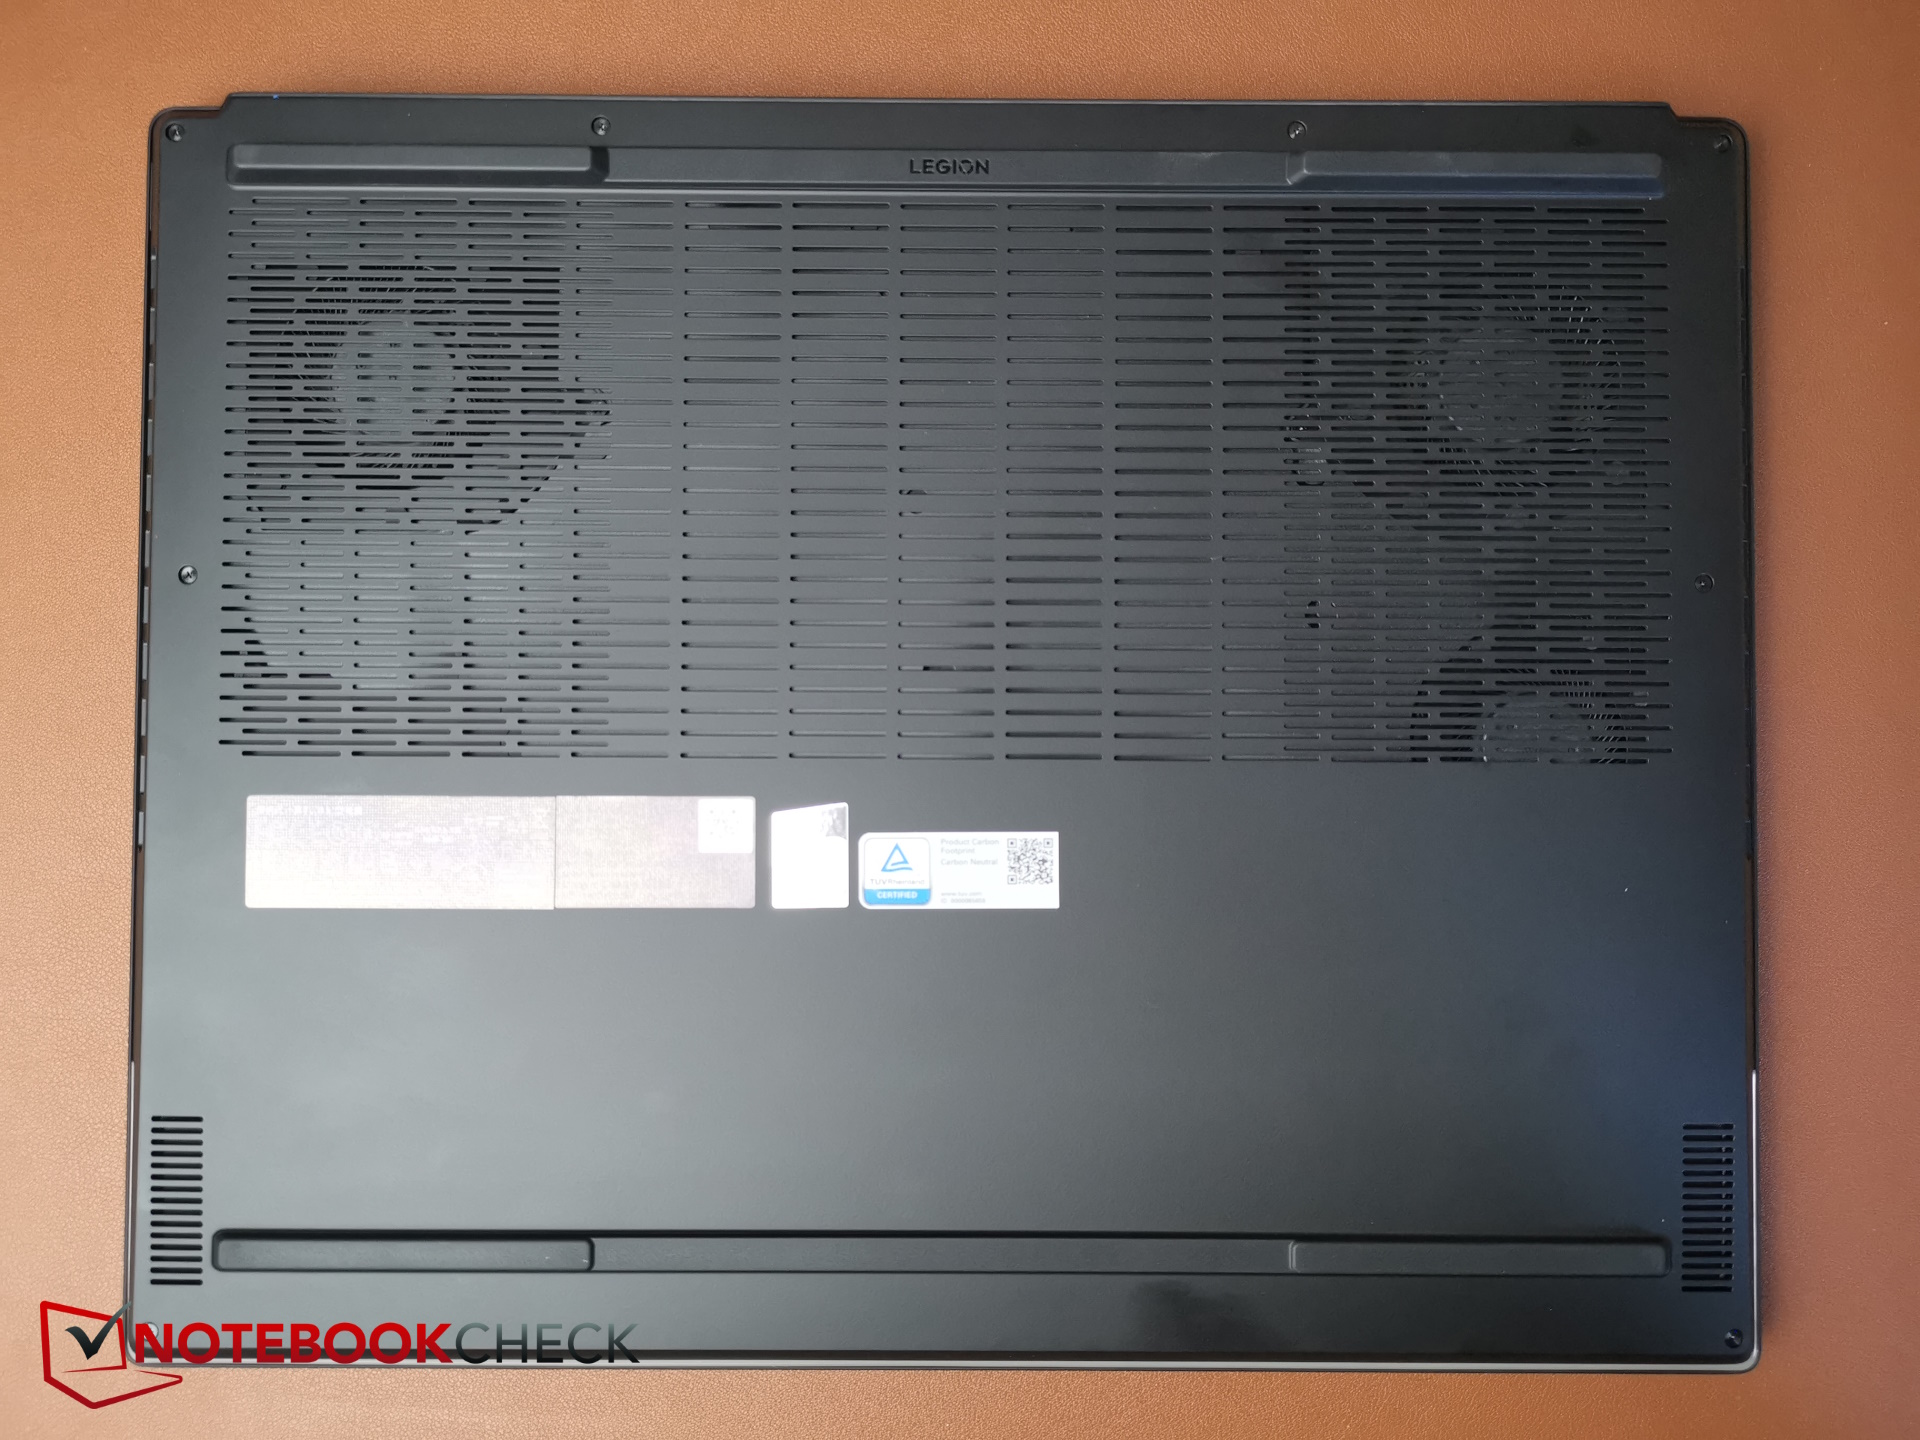
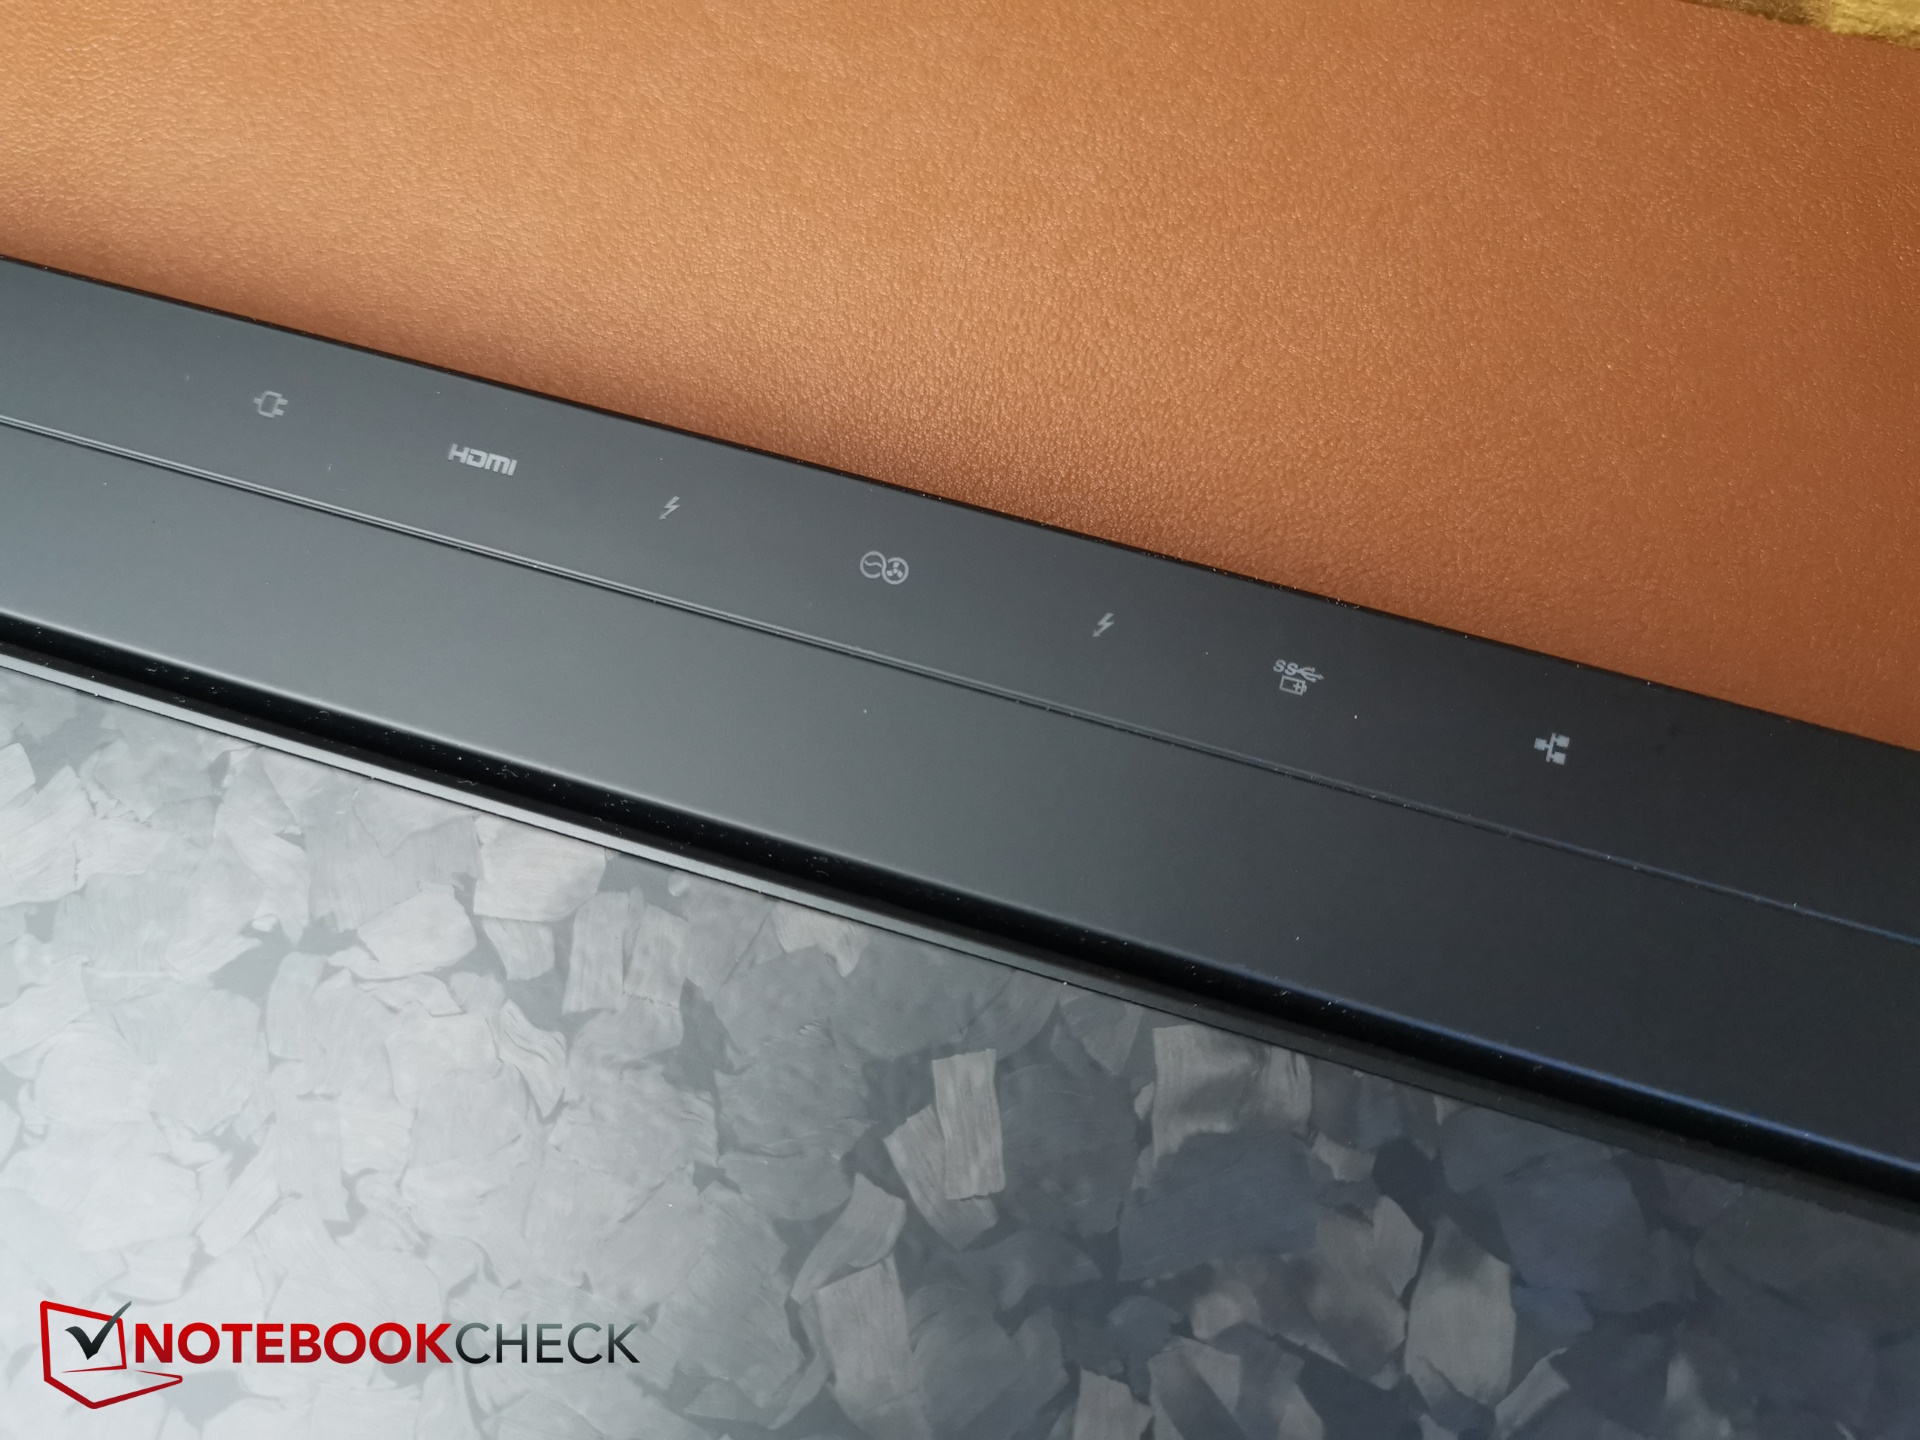
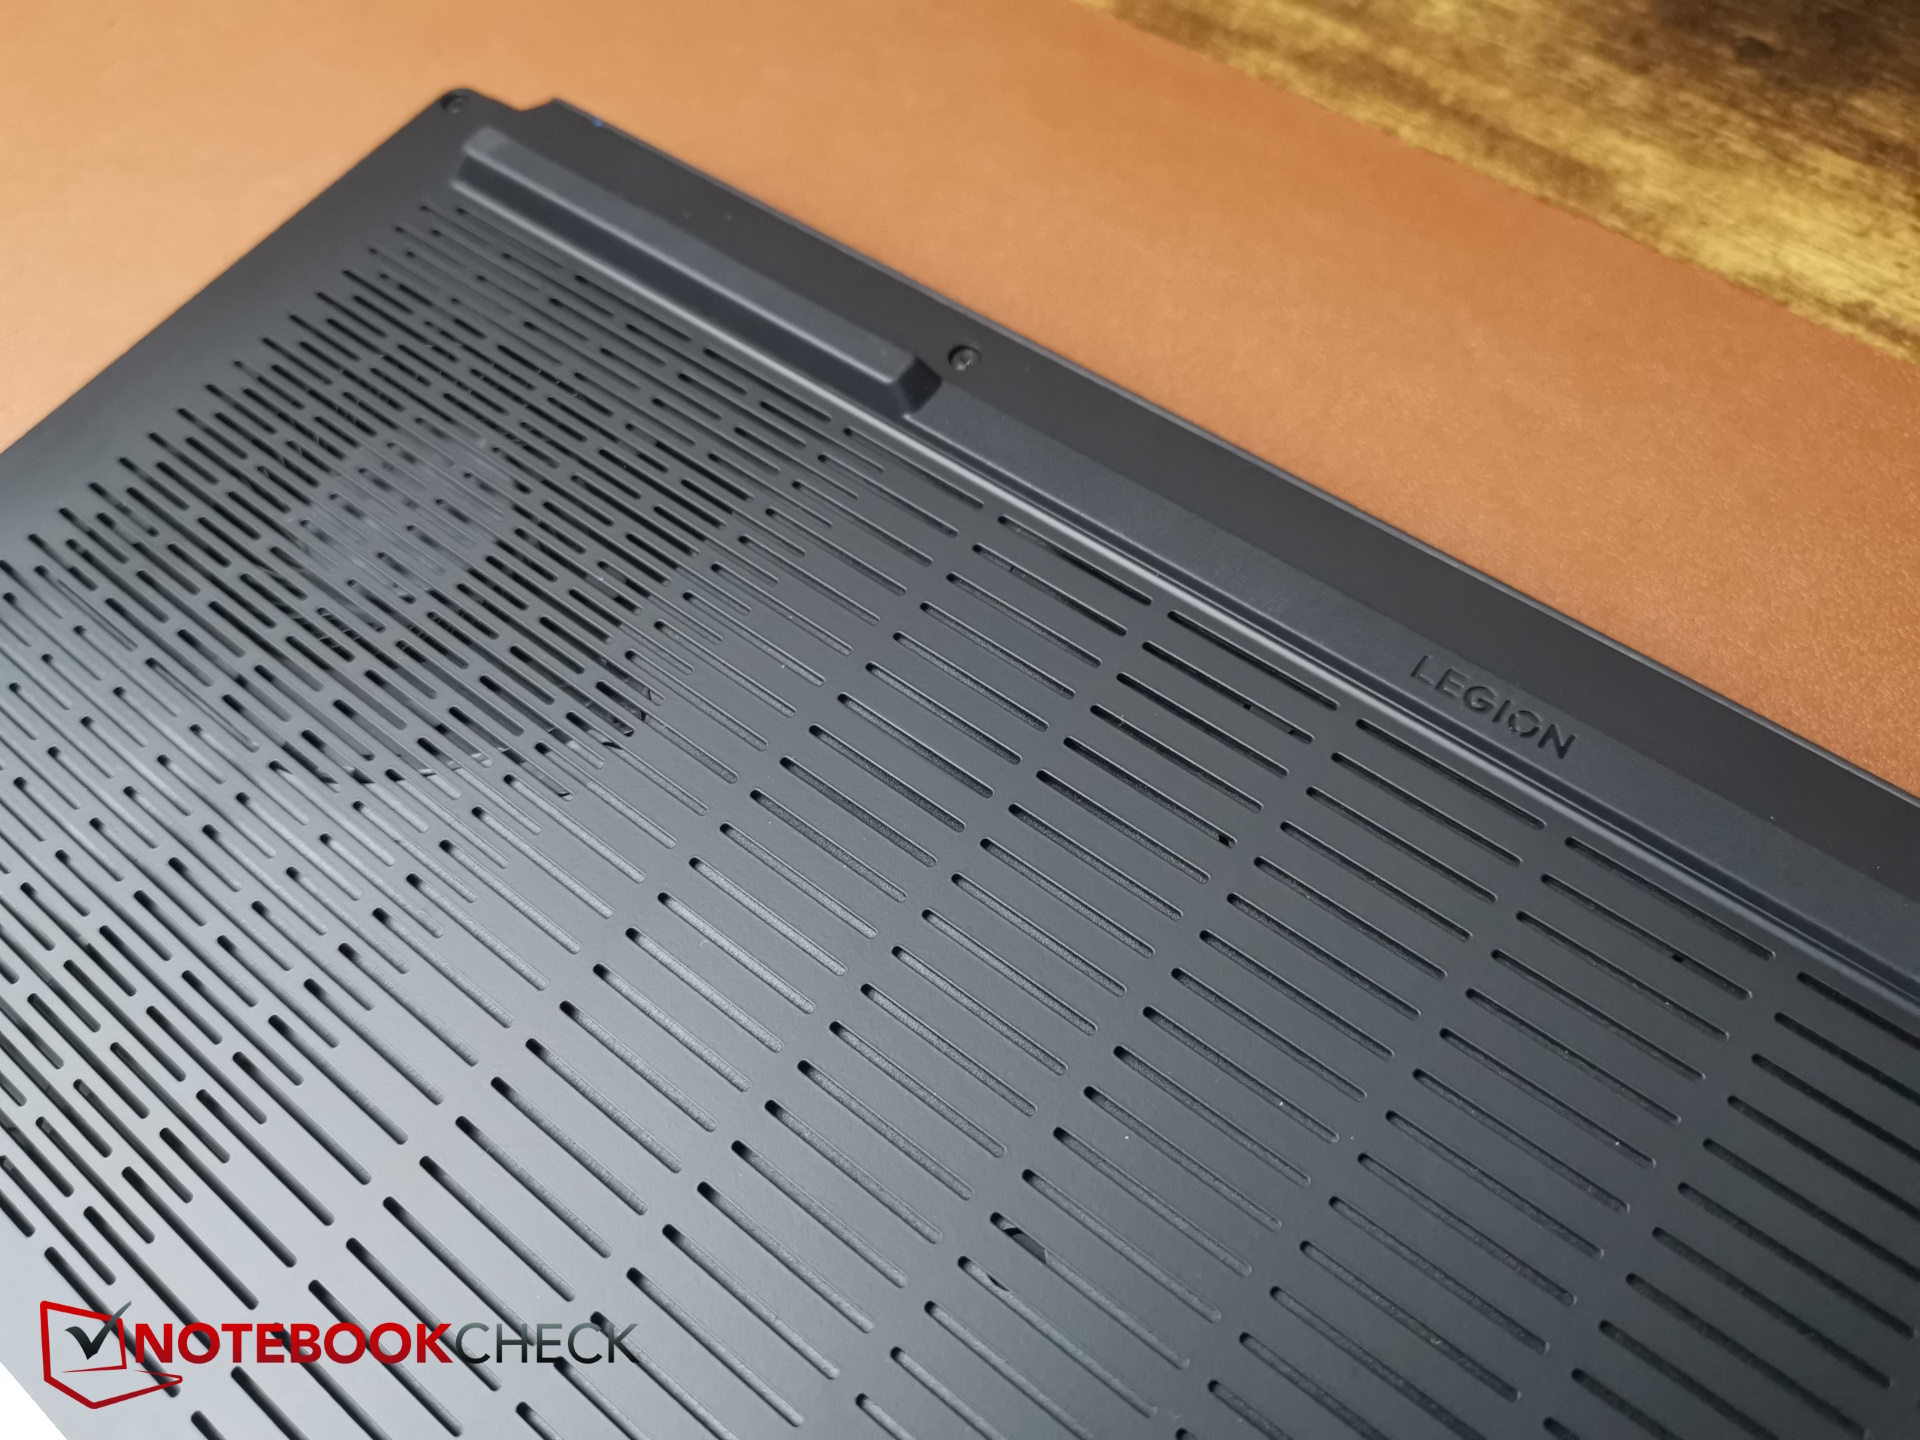
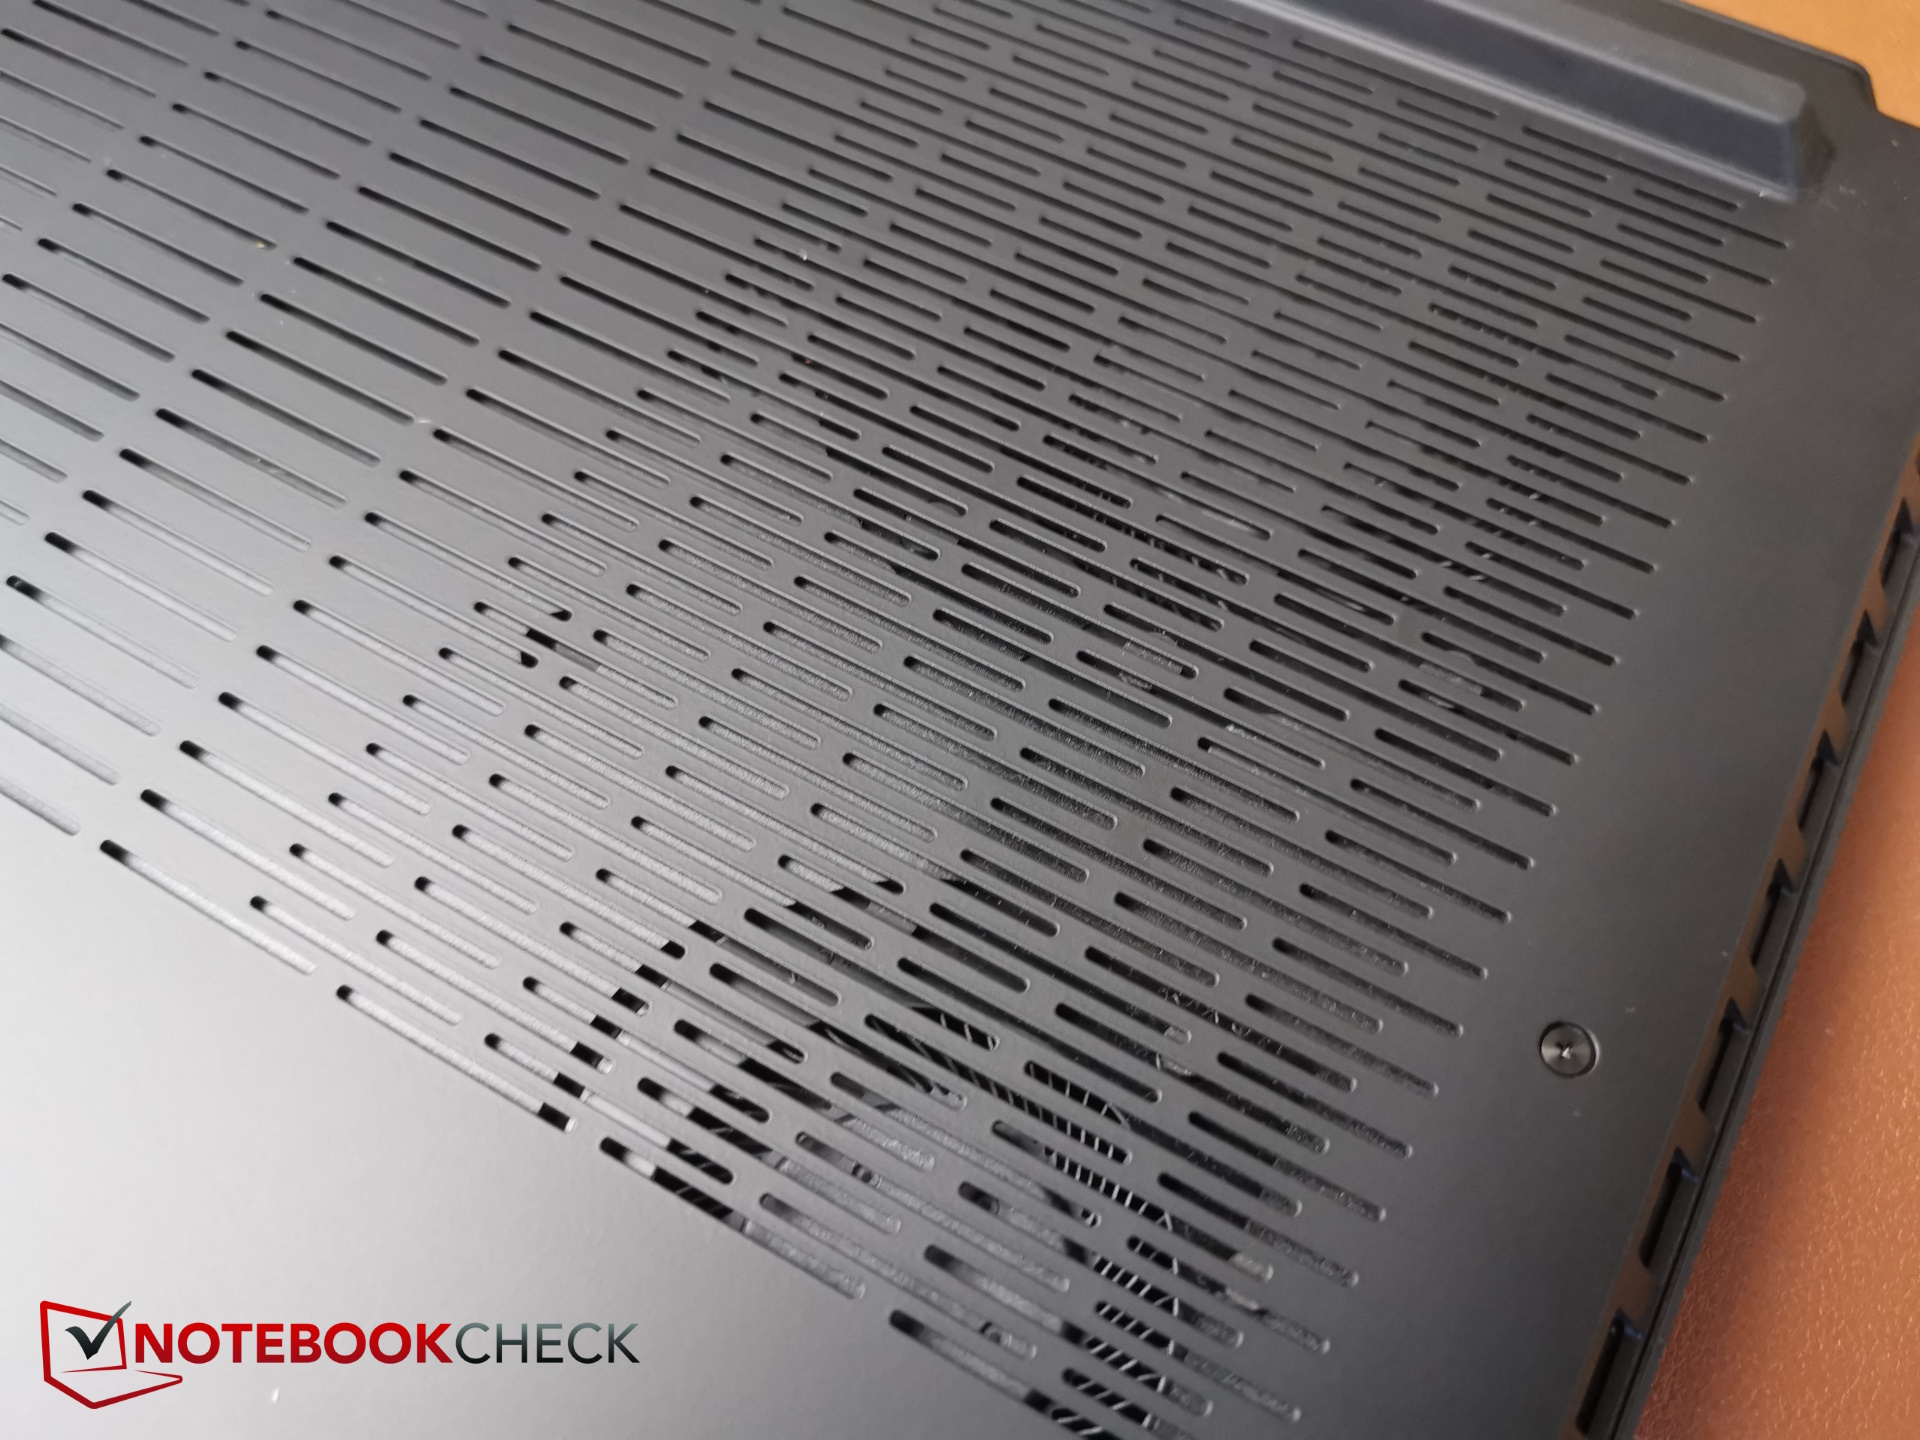
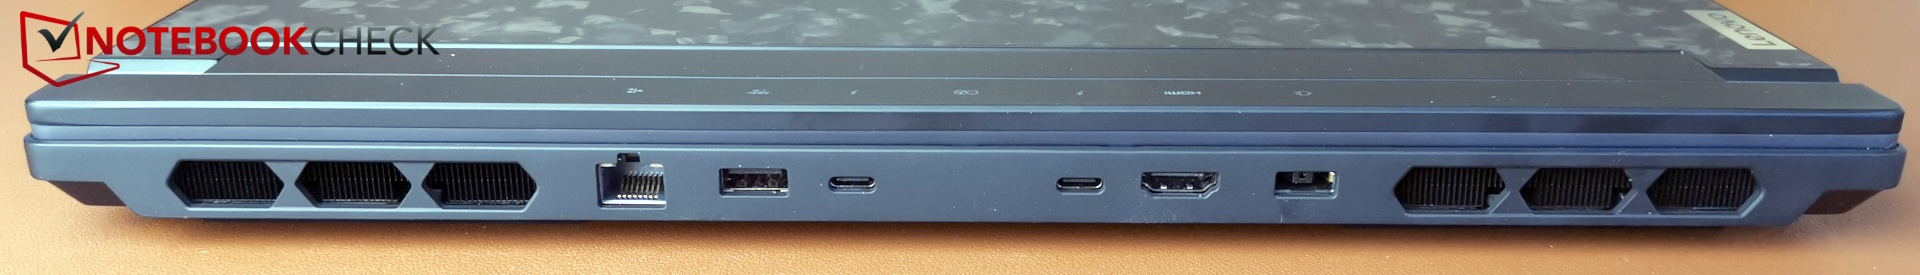
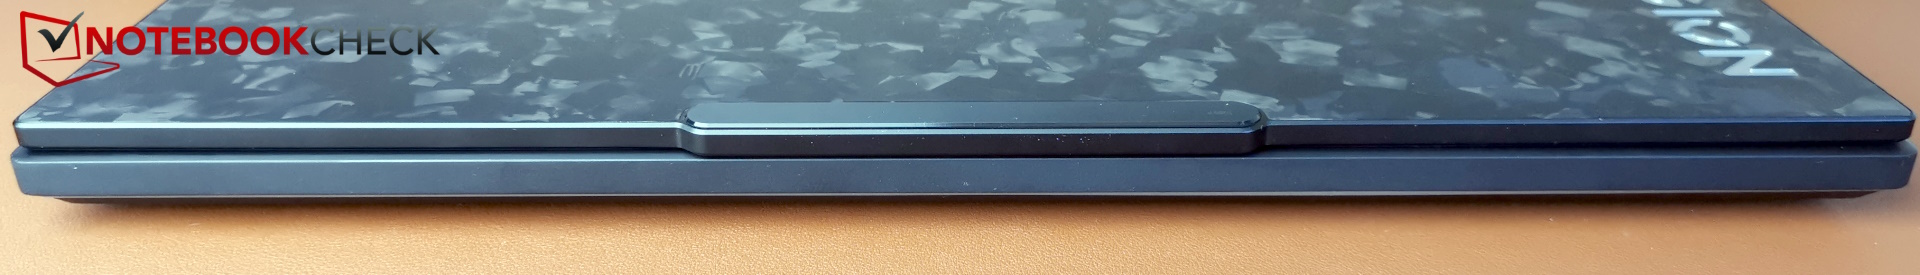
Kasa ve bağlantı - Dövme karbon
Yeni modelde en azından görsel olarak her şey aynı kaldığı için lenovo Legion 9i Gen8 incelemesi karbon dövme kasası, bakım seçenekleri ve giriş cihazları hakkında bilgi için.
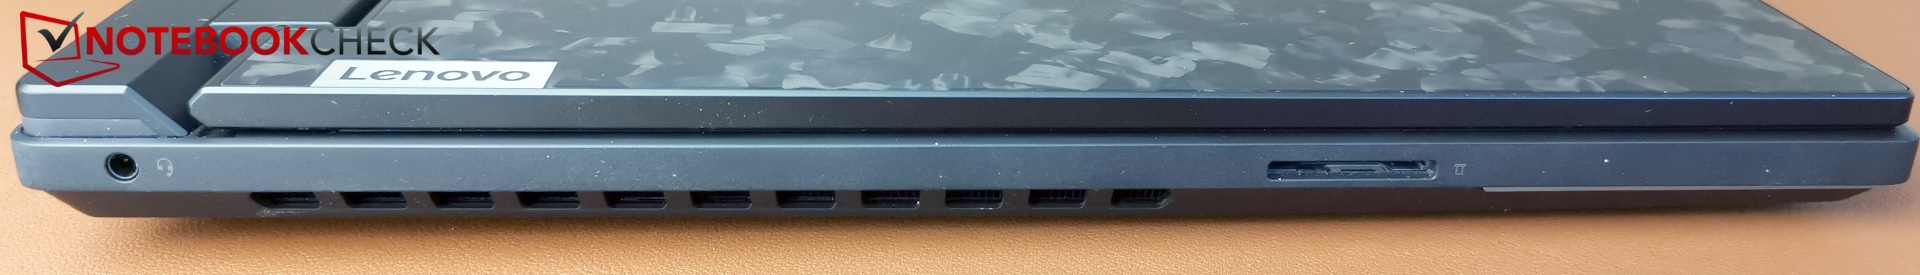
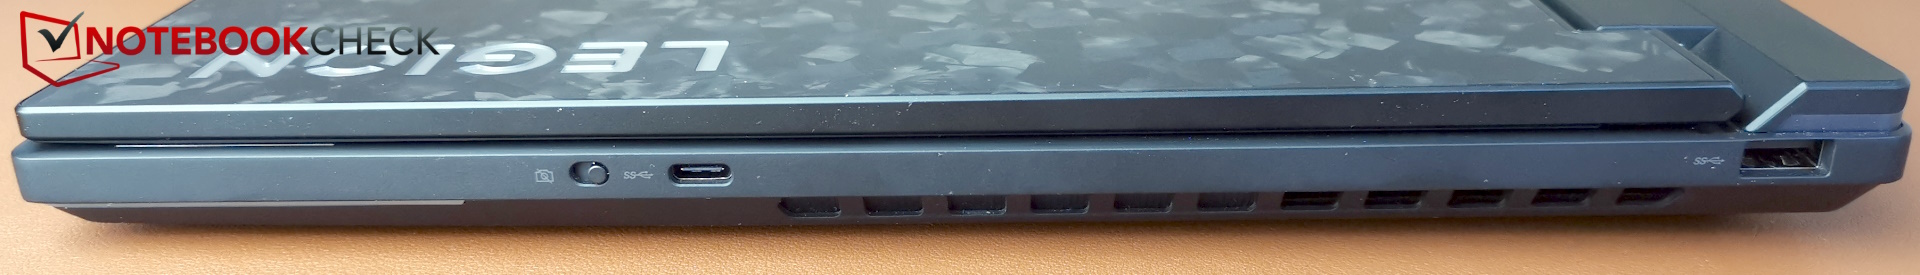
SD kart okuyucu
Üst düzey bir dizüstü bilgisayar için SD kart okuyucunun aktarım hızları hayal kırıklığı yaratıyor. Geçen yıla göre biraz daha kötü ve bir Razer Blade 16 veya Alienware m18 R2'nin aktarım hızlarından kilometrelerce uzakta.
| SD Card Reader | |
| average JPG Copy Test (av. of 3 runs) | |
| Alienware m18 R2 (Toshiba Exceria Pro SDXC 64 GB UHS-II) | |
| Razer Blade 16 2024, RTX 4090 | |
| Sınıf ortalaması Gaming (19 - 197.3, n=68, son 2 yıl) | |
| Lenovo Legion 9 16IRX8 (Toshiba Exceria Pro SDXC 64 GB UHS-II) | |
| Medion Erazer Beast X40 2024 (AV PRO microSD 128 GB V60) | |
| Lenovo Legion 9 16IRX9, RTX 4090 | |
| maximum AS SSD Seq Read Test (1GB) | |
| Alienware m18 R2 (Toshiba Exceria Pro SDXC 64 GB UHS-II) | |
| Razer Blade 16 2024, RTX 4090 | |
| Sınıf ortalaması Gaming (25.8 - 263, n=67, son 2 yıl) | |
| Medion Erazer Beast X40 2024 (AV PRO microSD 128 GB V60) | |
| Lenovo Legion 9 16IRX9, RTX 4090 | |
| Lenovo Legion 9 16IRX8 (Toshiba Exceria Pro SDXC 64 GB UHS-II) | |
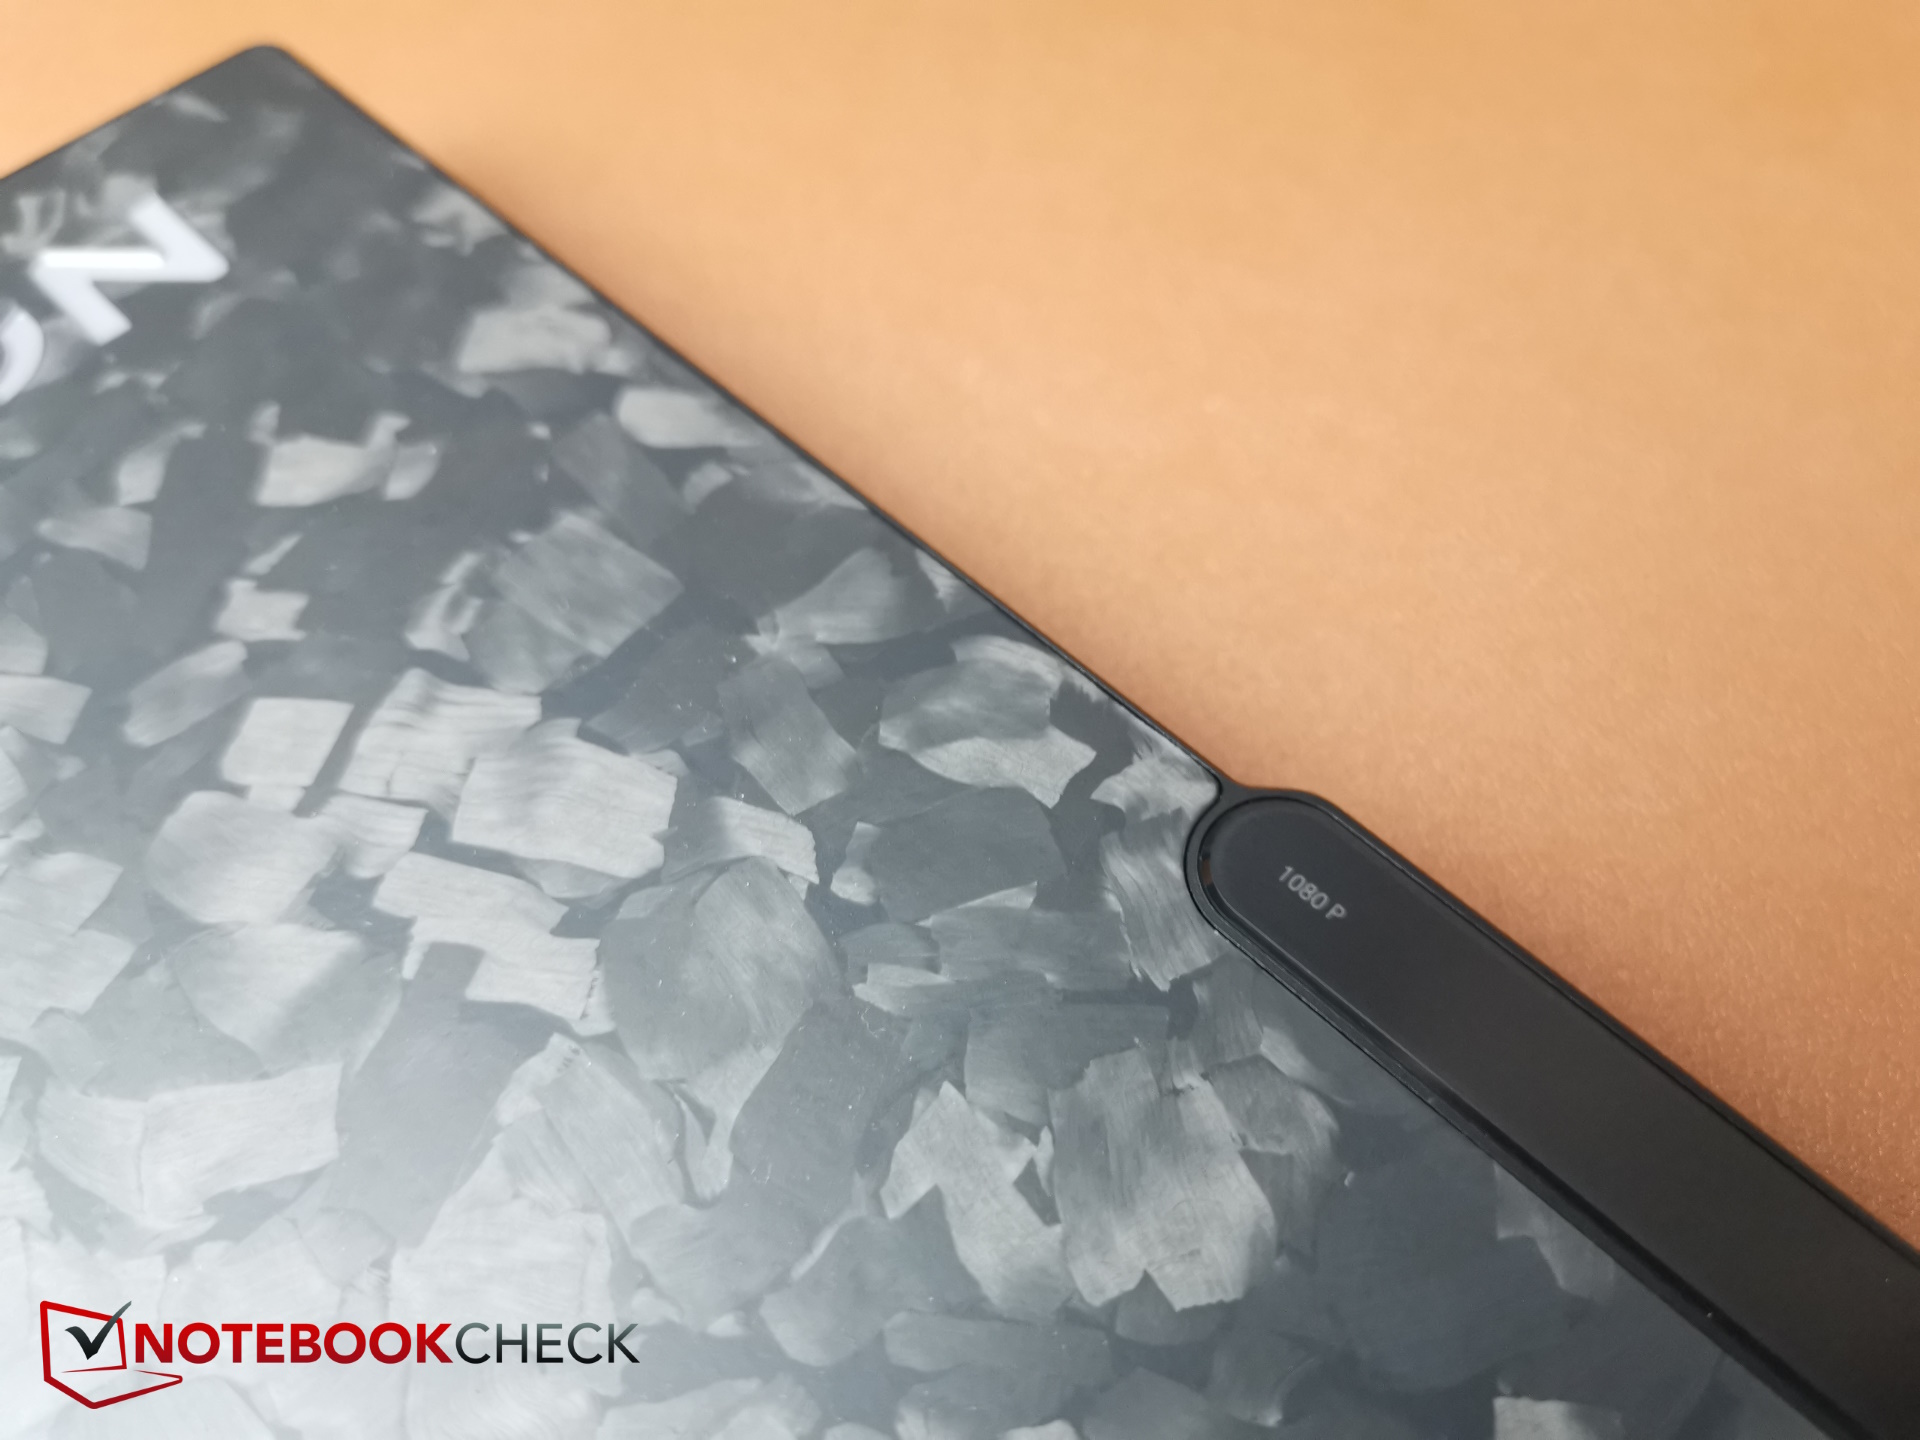
Web kamerası
1.080p Full HD web kamerası orta ila yüksek renk sapmalarına sahiptir ve görüntü keskinliği iyidir.


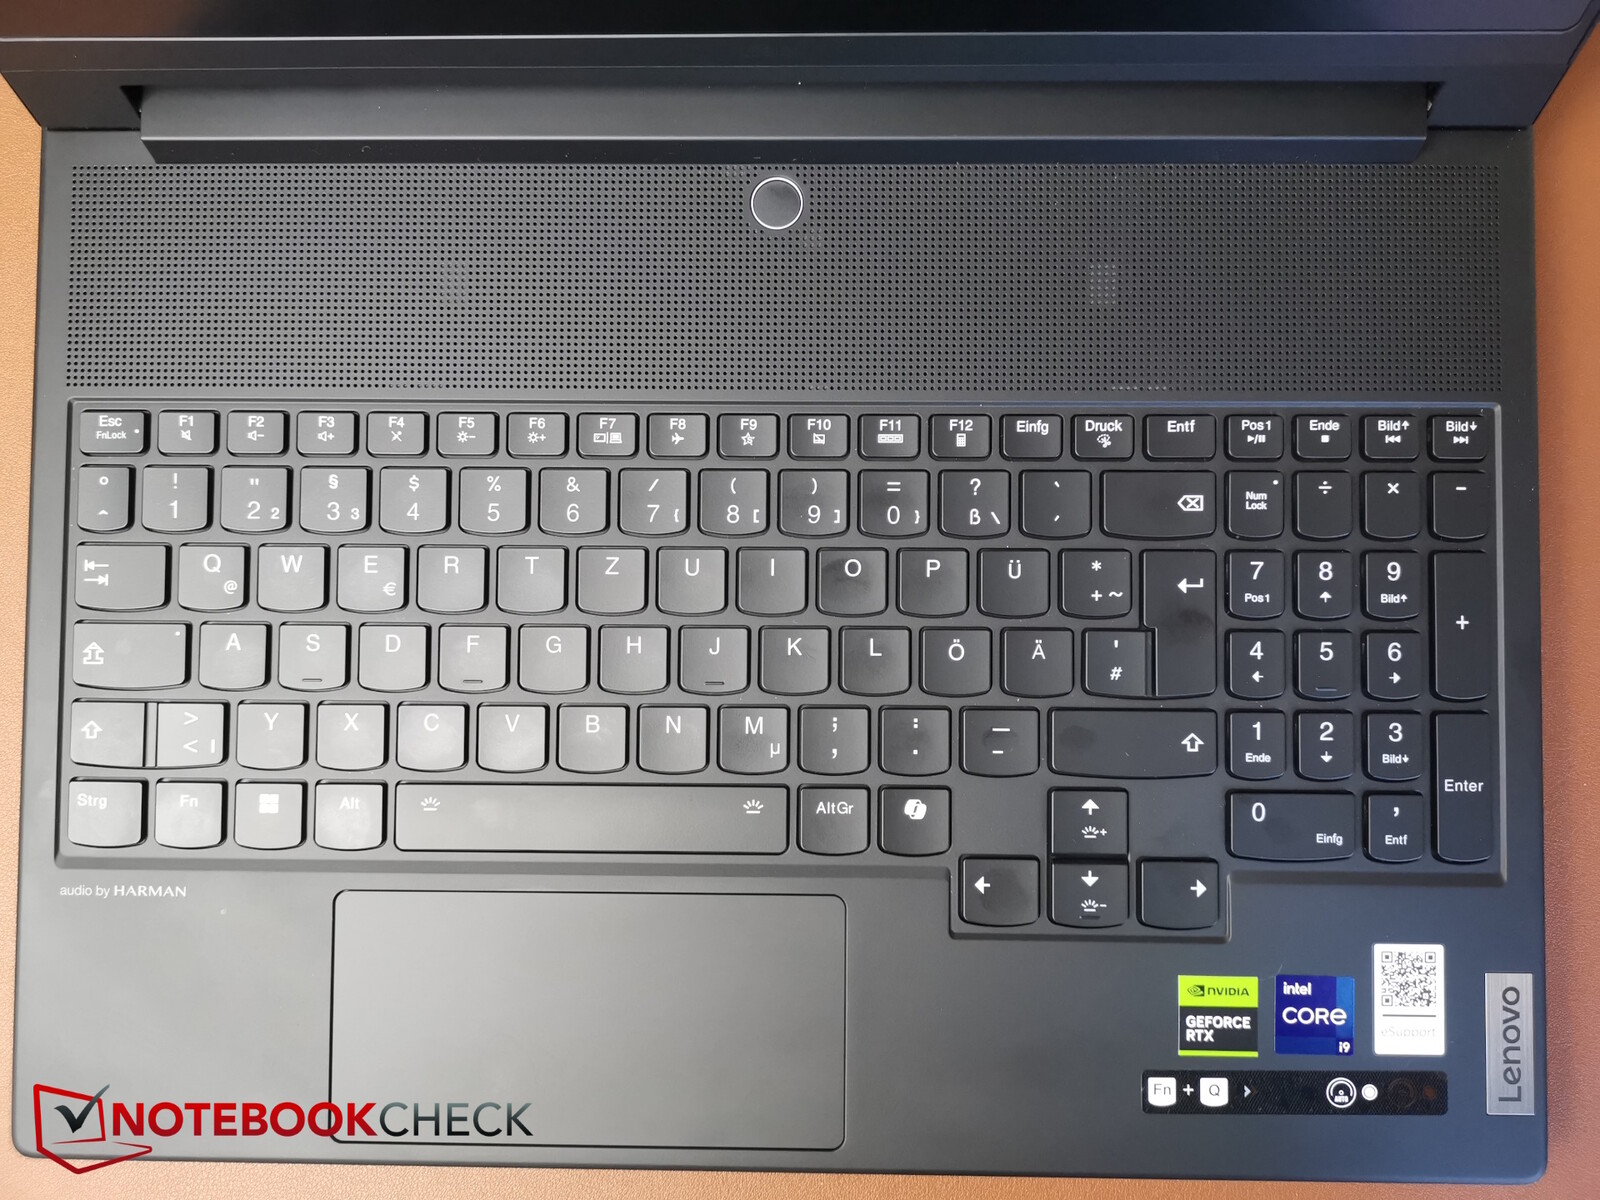
Giriş cihazları - Şimdi Co-Pilot ile
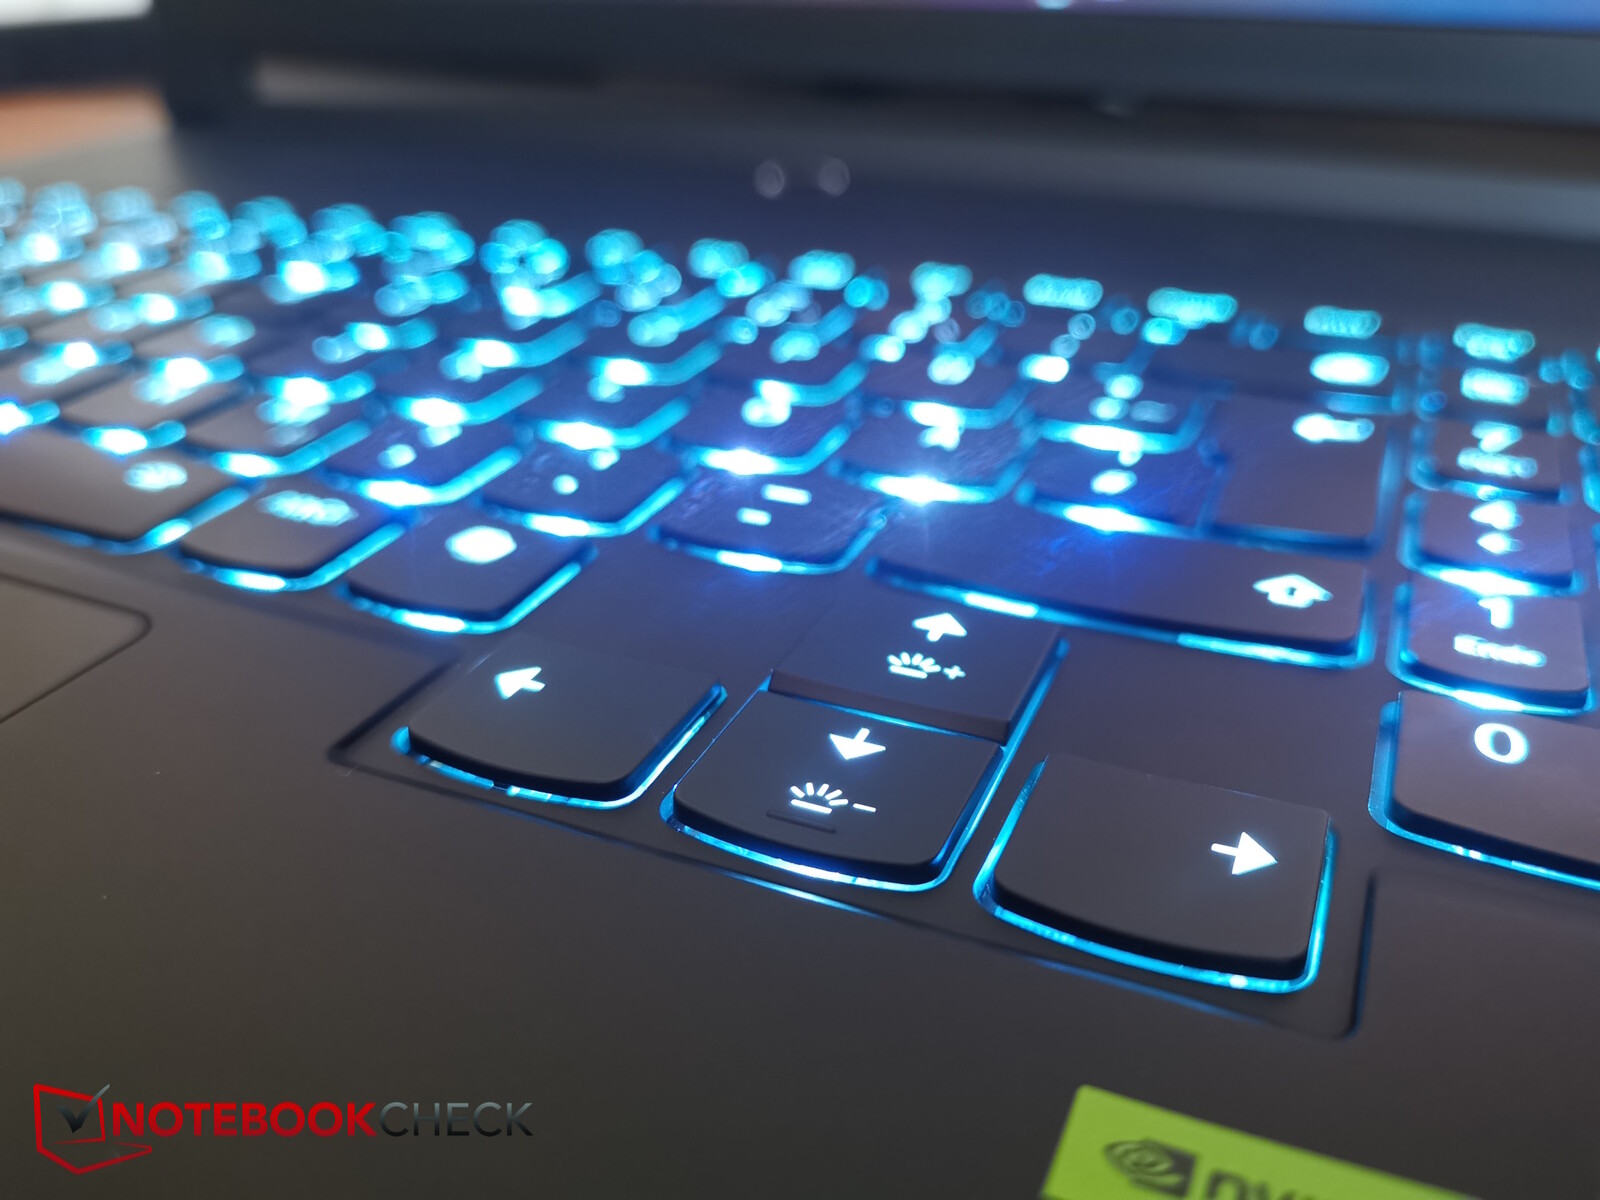
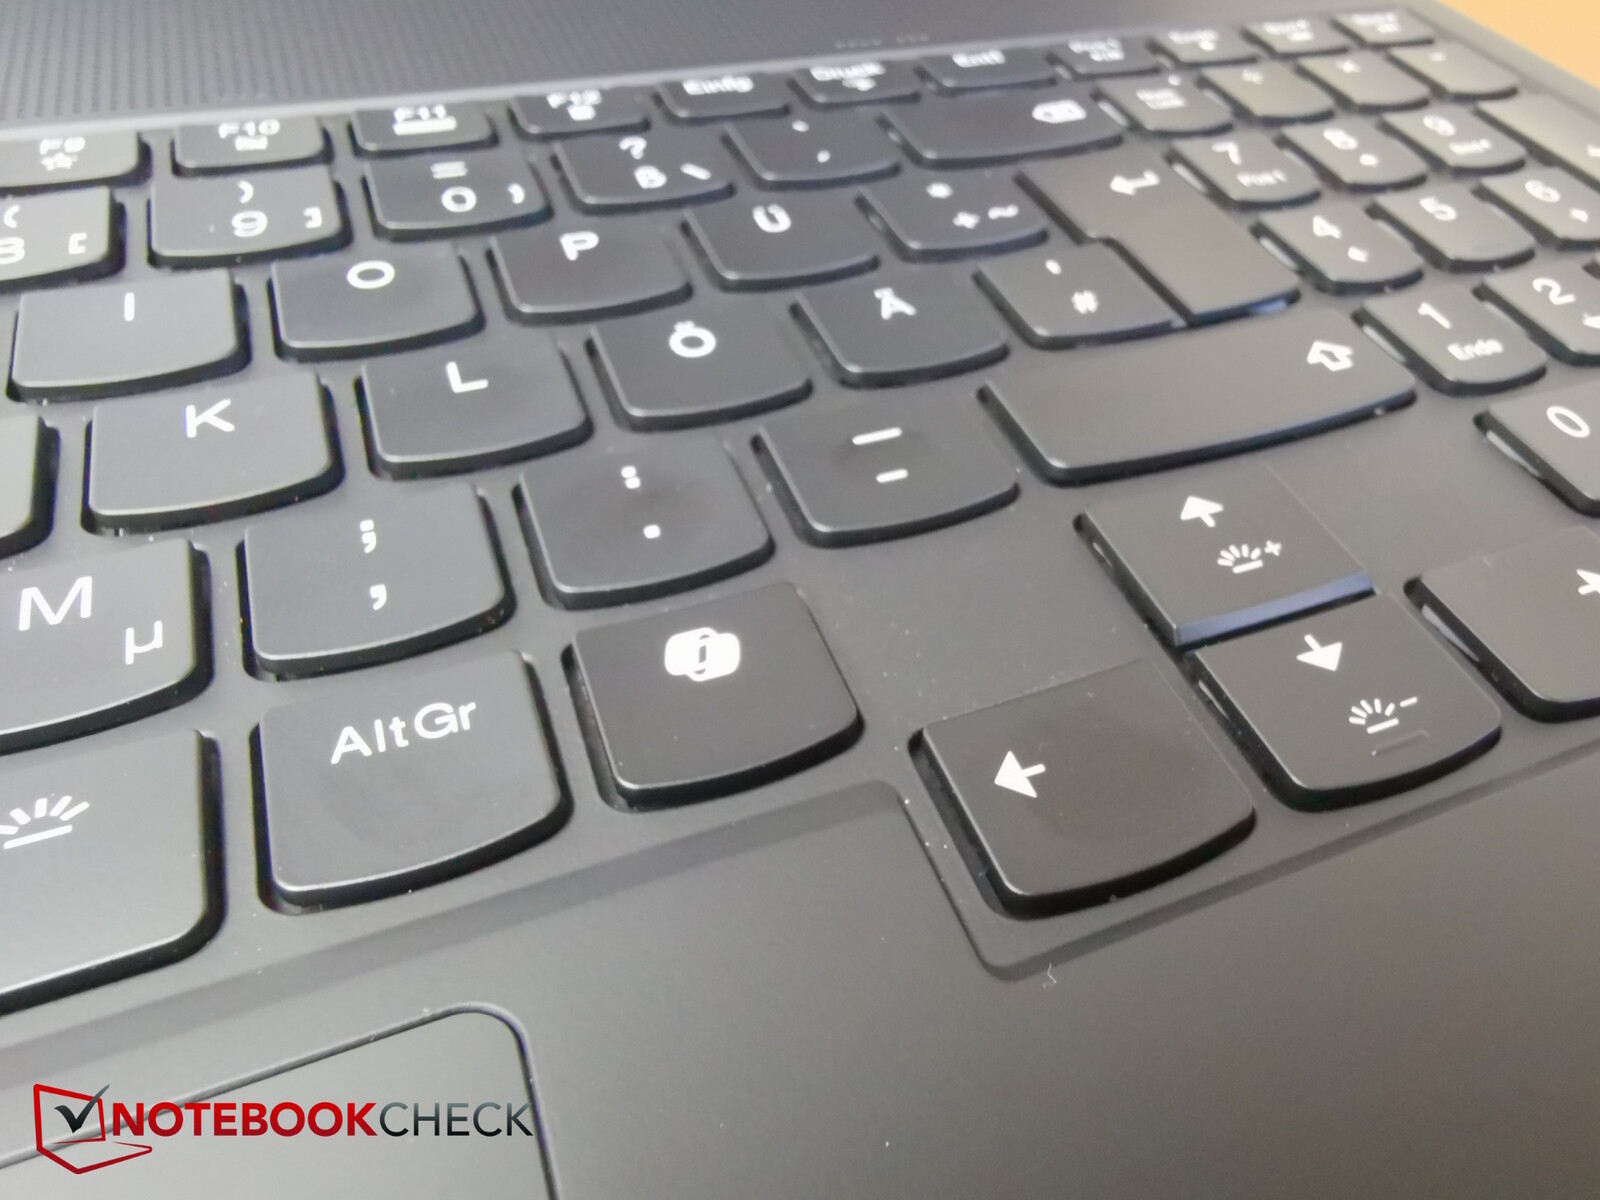
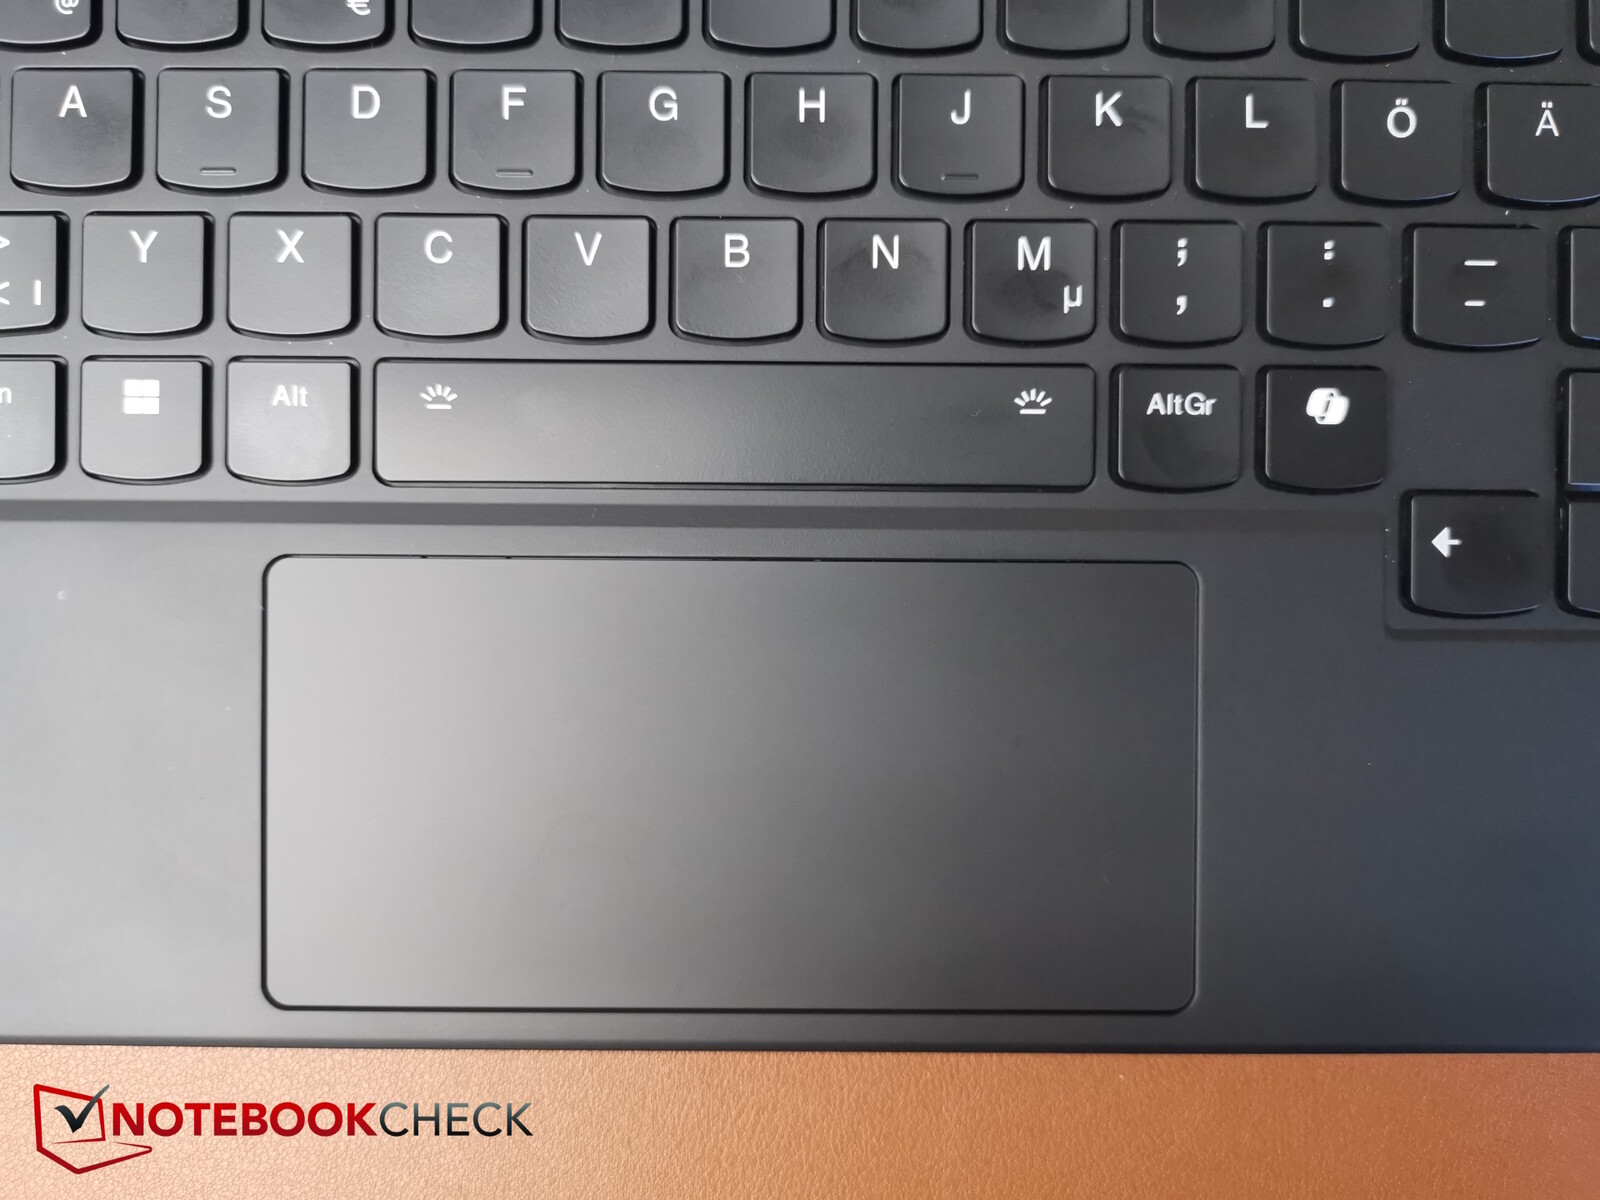
Konforlu membran klavyesi ve dokunmatik yüzeyi büyük ölçüde değişmeden kalmıştır. İkincisi hala sadece 5,9 cm ile çok dar. Klavyeye şimdi bir Co-Pilot tuşu eklendi. Sağ taraftaki Ctrl tuşu bunun için yer açmak zorunda kaldı.
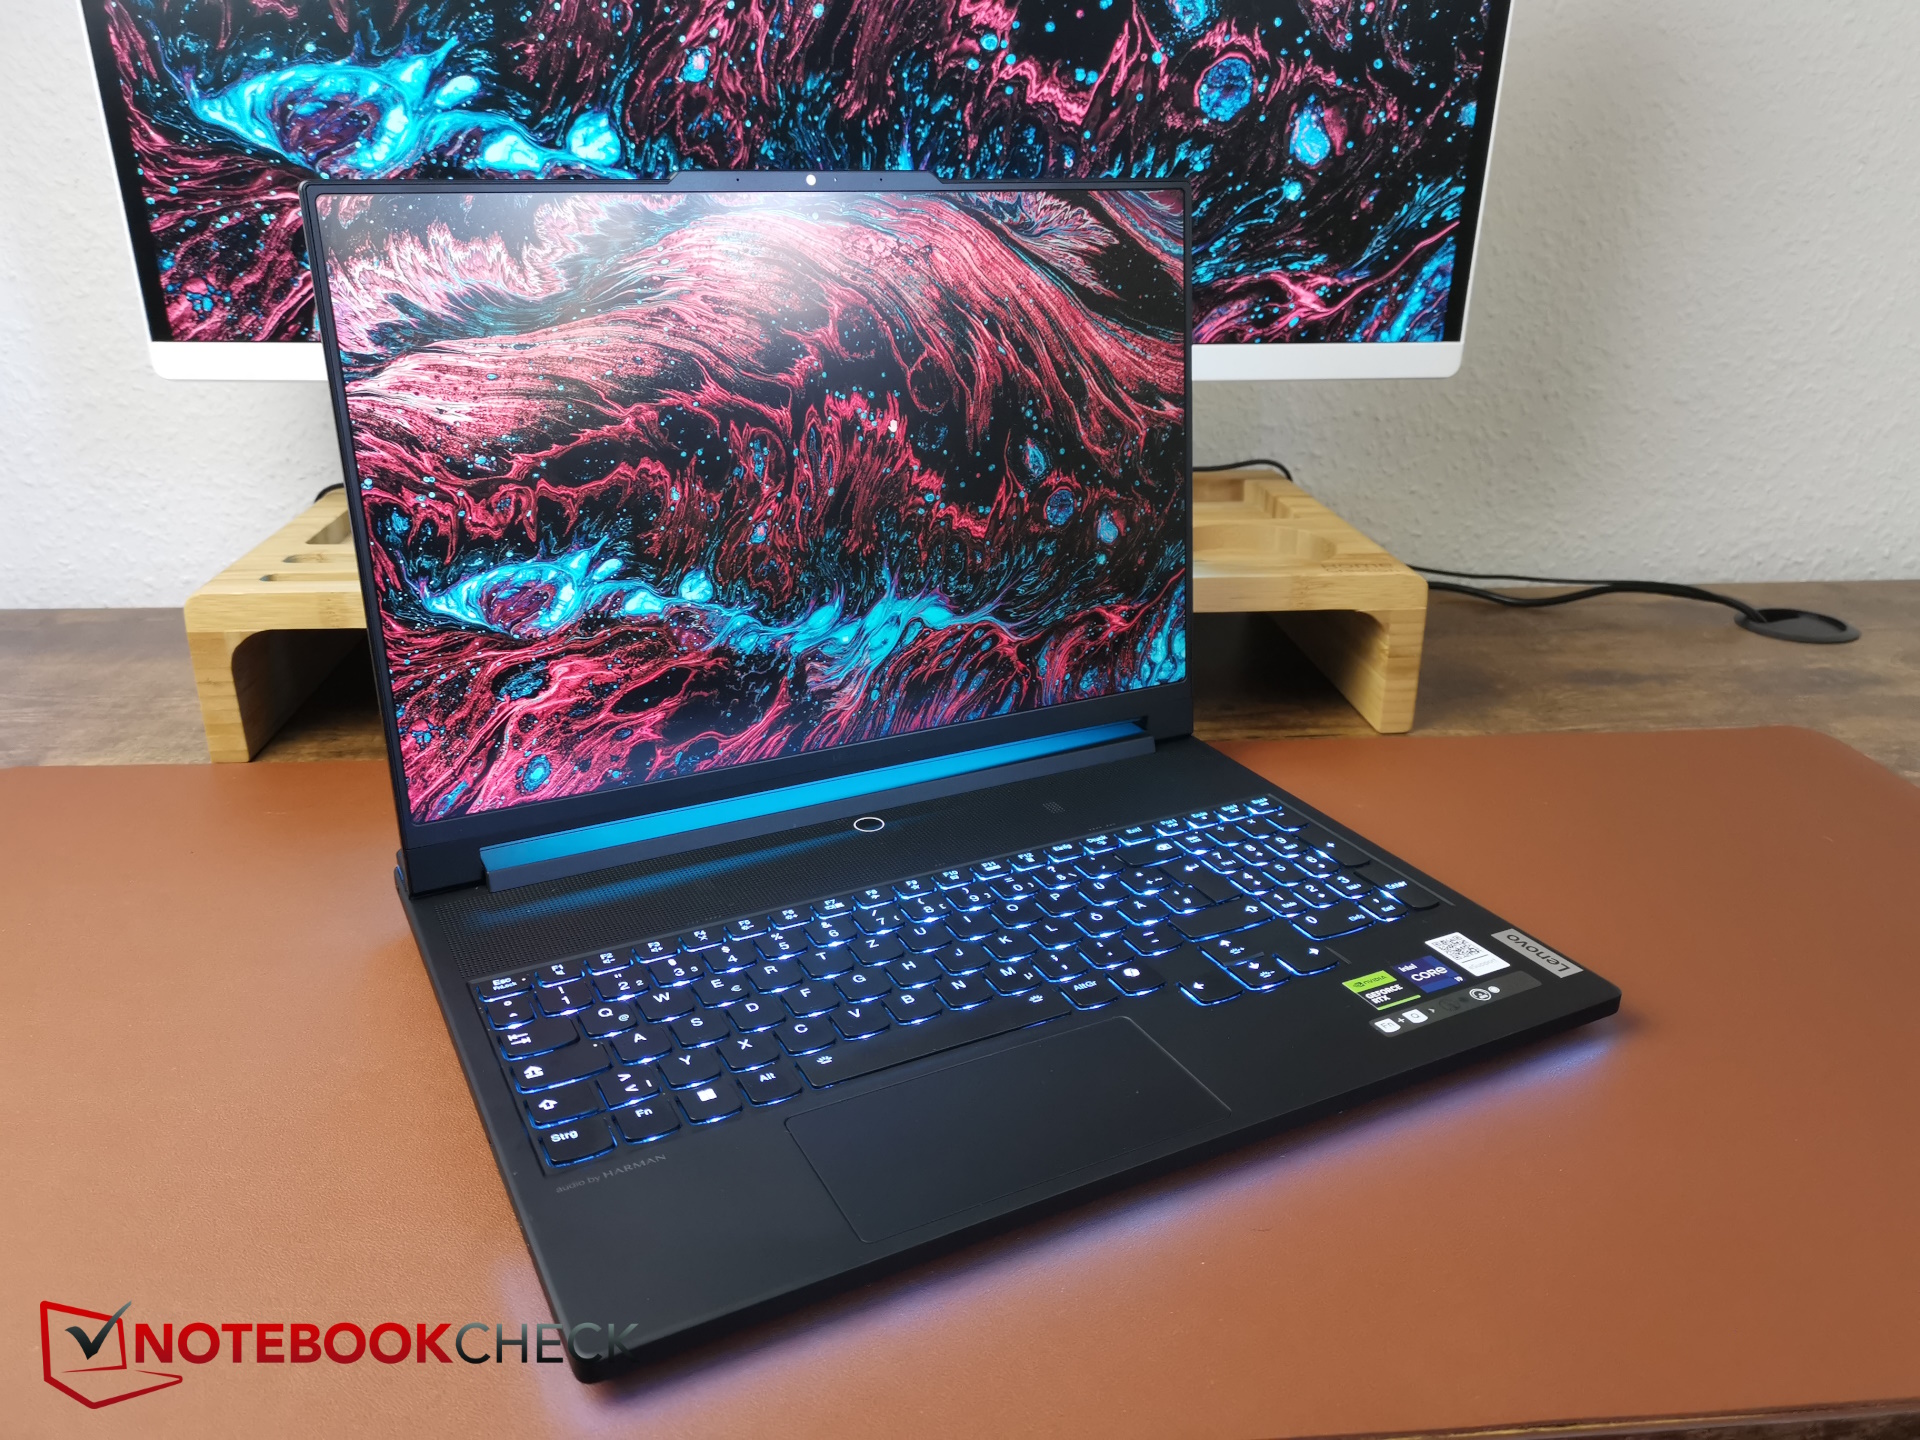
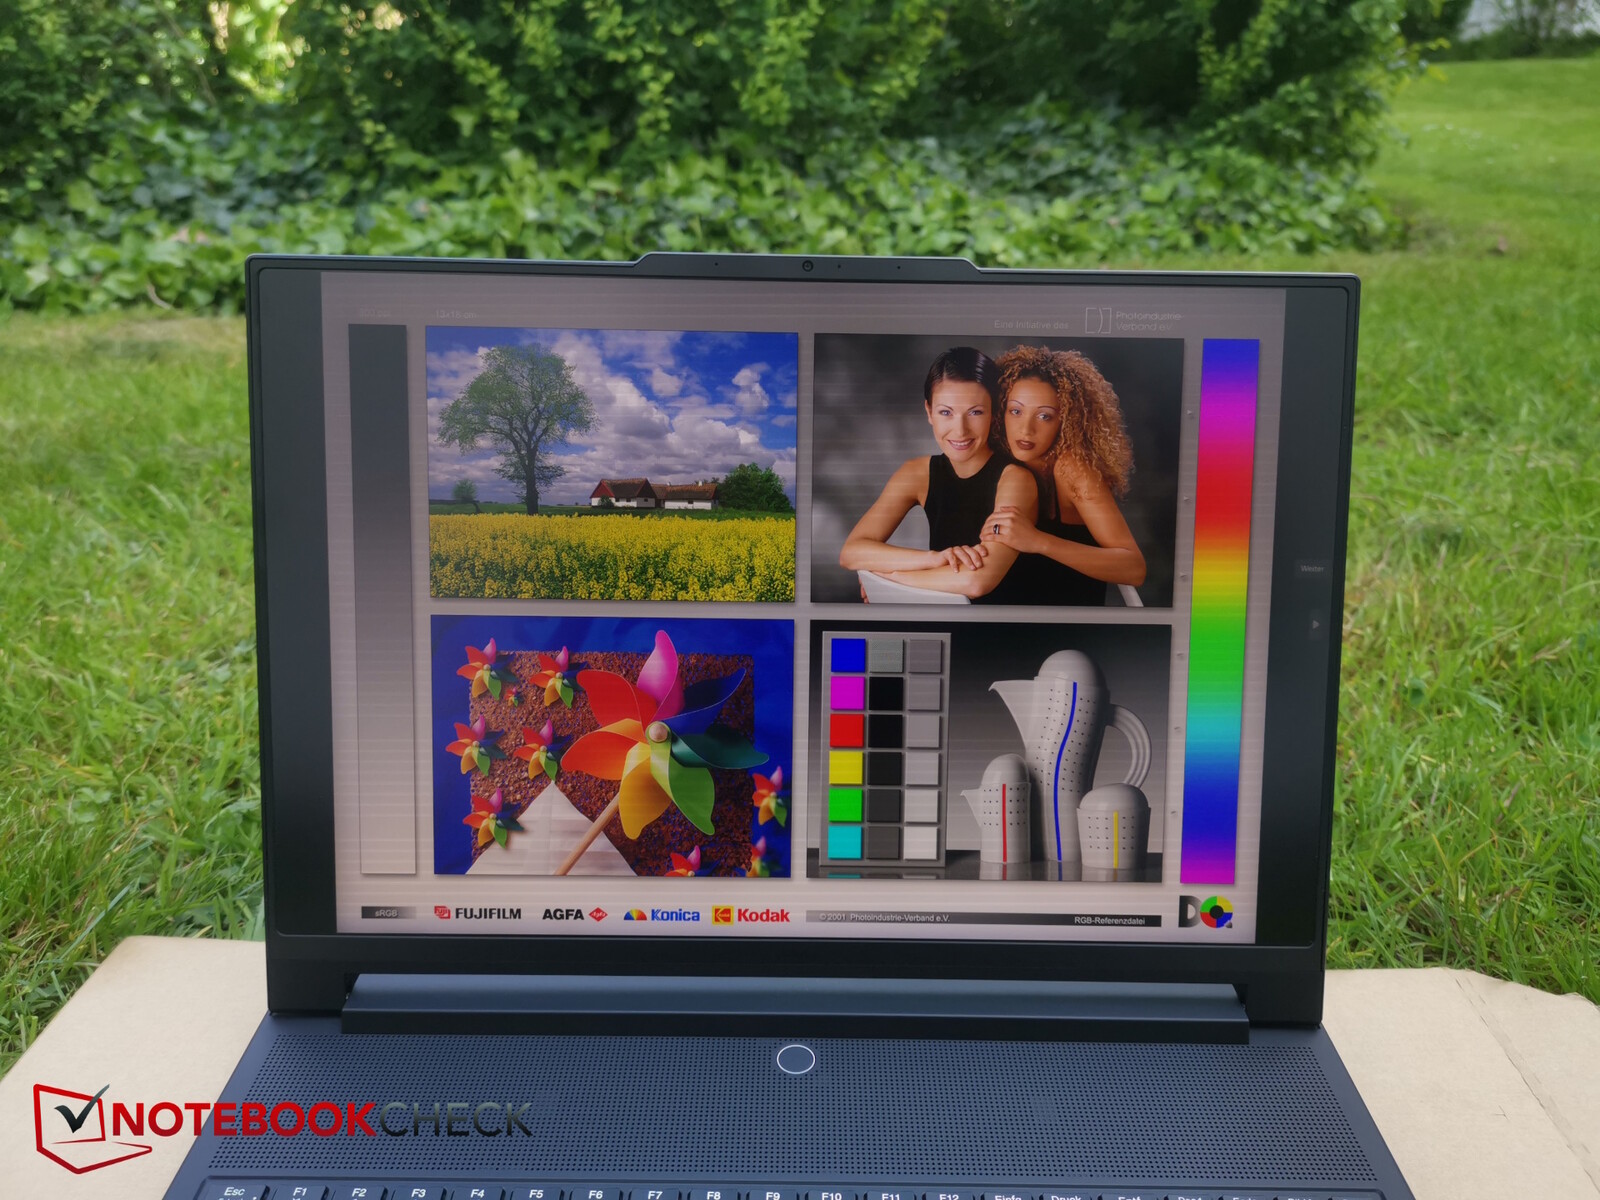
Ekran - 1.200 nit MiniLED
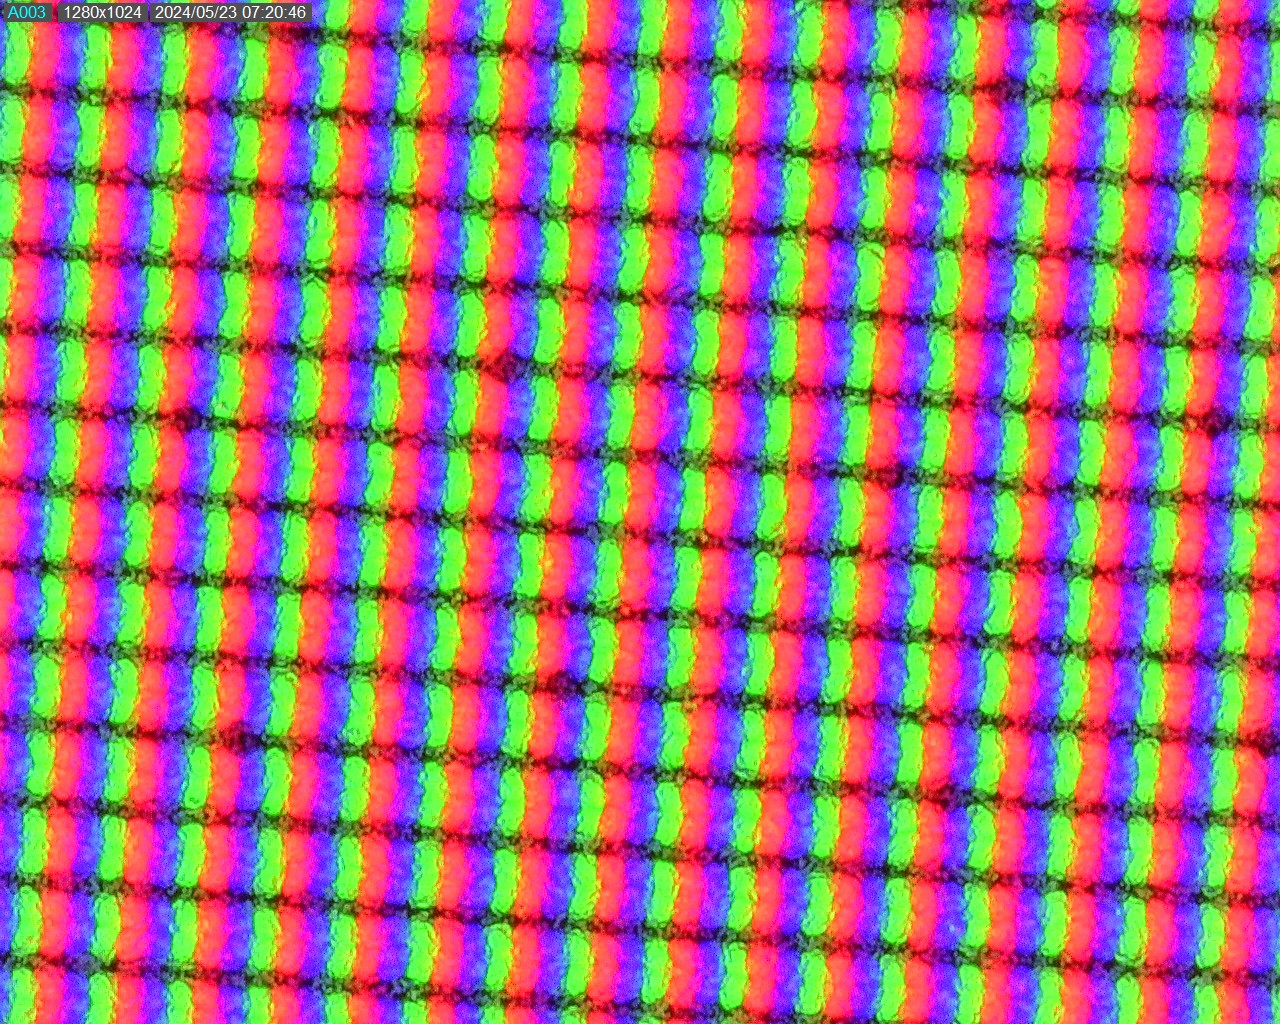
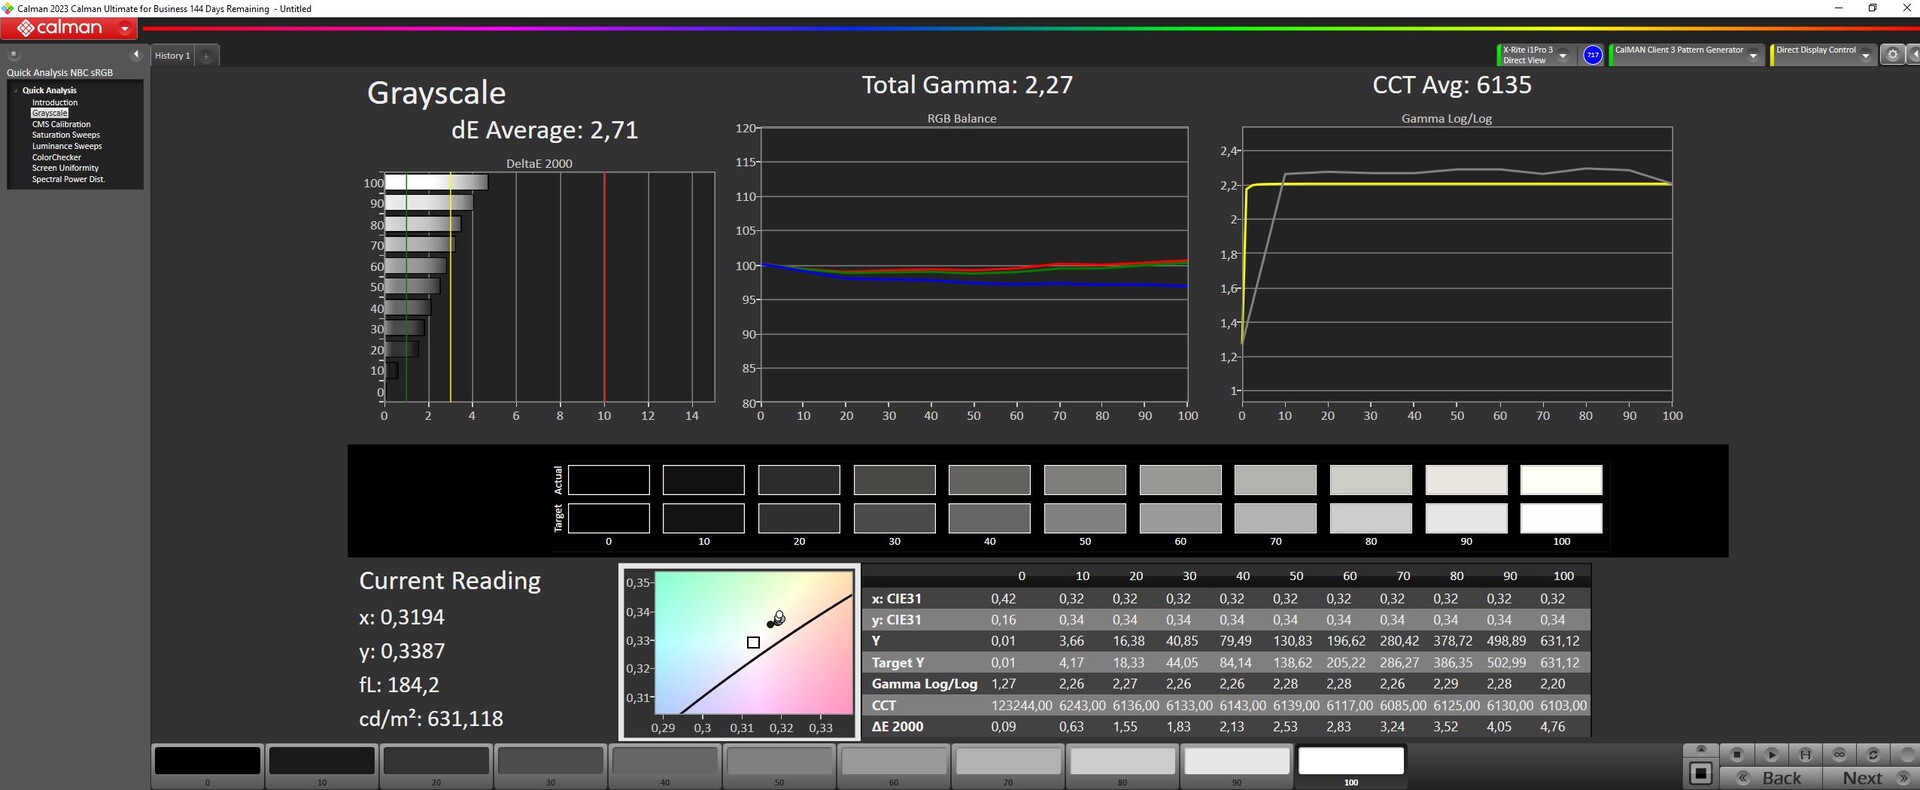
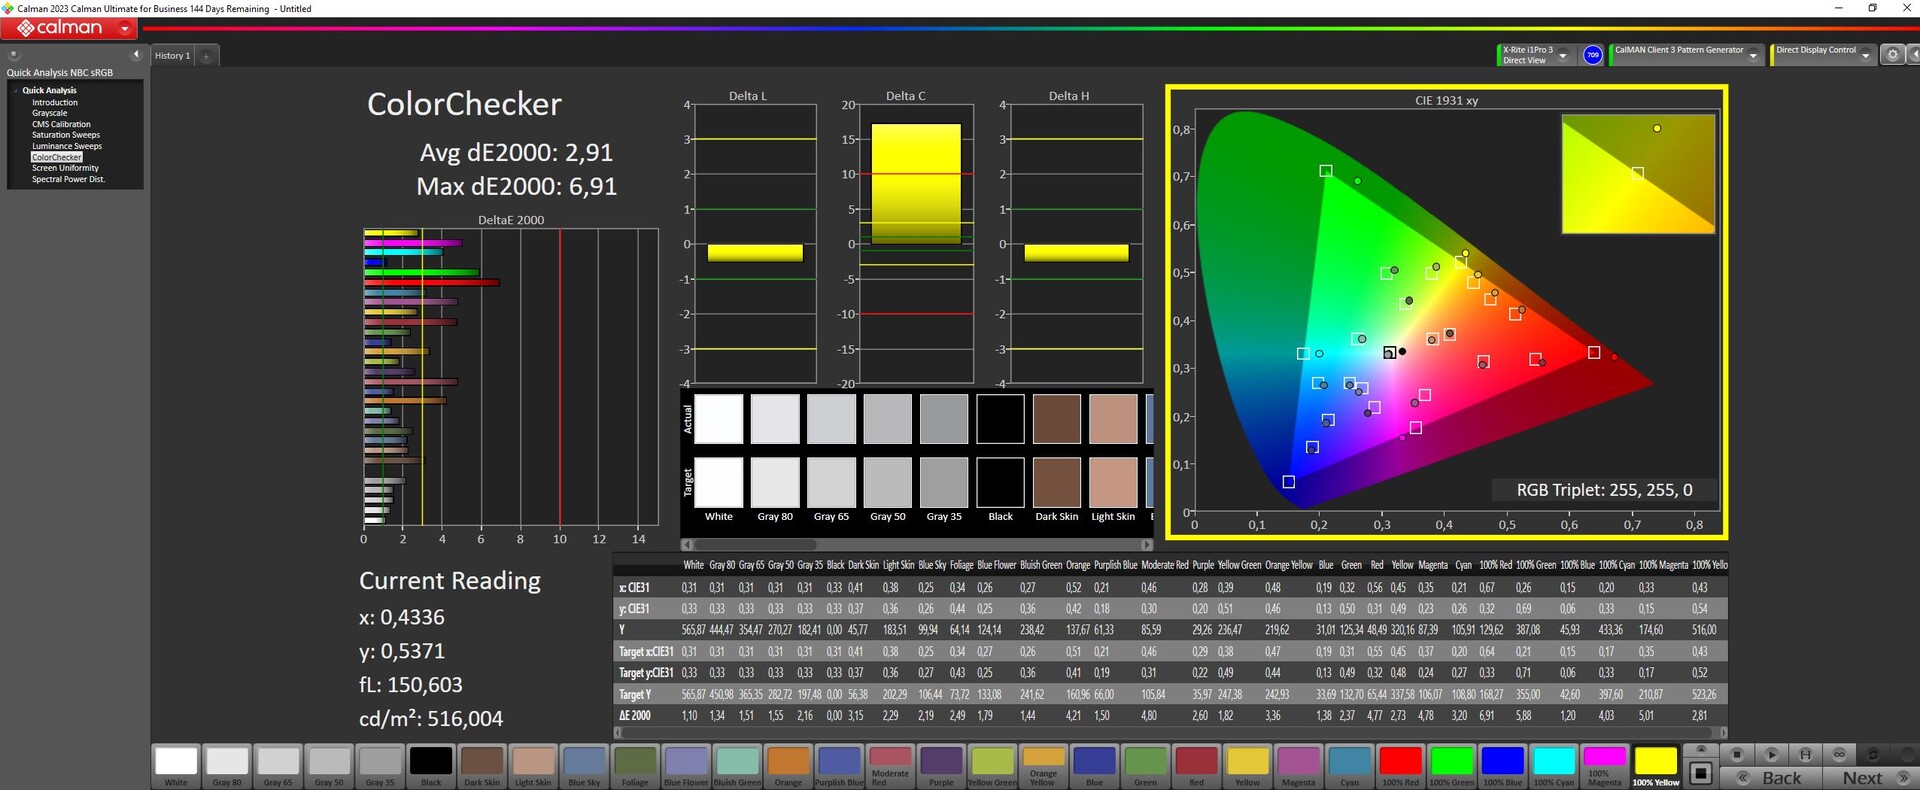
Dolby Vision ve G-Sync özellikli 16 inç 3,2K (3.200 x 2.000) mini LED ekran, Legion 9'un içindeki en önemli cazibe merkezlerinden biri olmaya devam ediyor. Ekranın 1.200 nit'e kadar parlaklığa sahip olduğu ve bu nedenle HDR 1000 standardını karşıladığı söyleniyor. Aslında HDR modunda 1.000 nitten fazlasını ölçtük.
Daha iyi renk doğruluğuna sahip SD modunda, ekran hala ortalama 664 nit ile parlıyor! Yüzde 43 ekran parlaklığında parlaklık değeri 150 nit civarındadır ve bu değer bazı pil testlerimiz için kullandığımız değerdir. Birçok bölgede kapatılabilen mini LED'ler sayesinde siyah seviyesi mükemmeldir ve bu da çok yüksek kontrastlar sağlar.
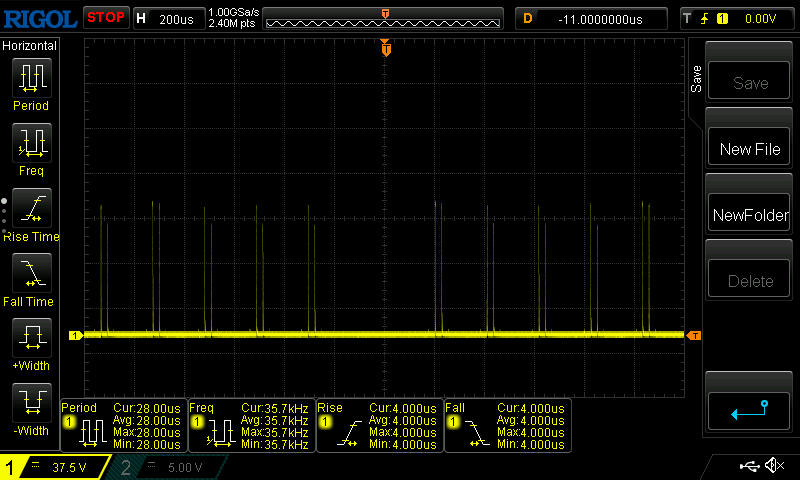
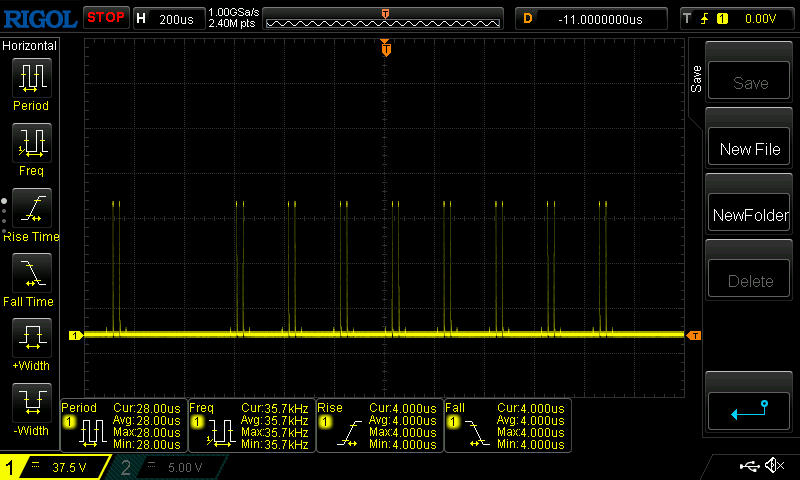
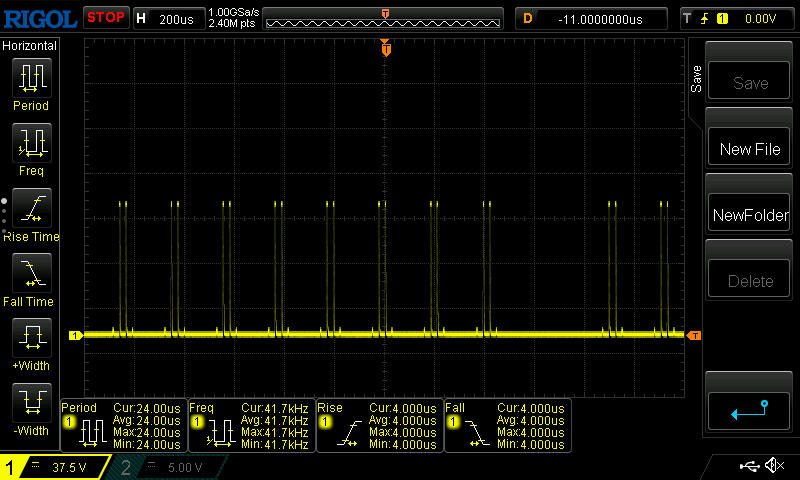
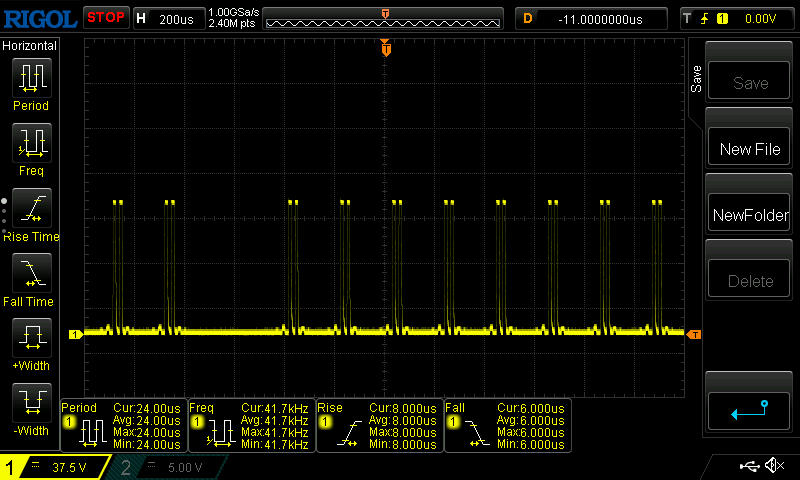
Arka ışıkta hiç akma yok ve elbette OLED seviyesinde olmasa da tepki süreleri de yeterince hızlı. PWM'yi 5 kHz ila 40 kHz gibi oldukça yüksek bir frekansta da olsa ölçebildik, bu hassas insanlar için bile sorun olmamalı.
| |||||||||||||||||||||||||
Aydınlatma: 91 %
Batarya modunda parlaklık: 630 cd/m²
Kontrast: 21033:1 (Siyah: 0.03 cd/m²)
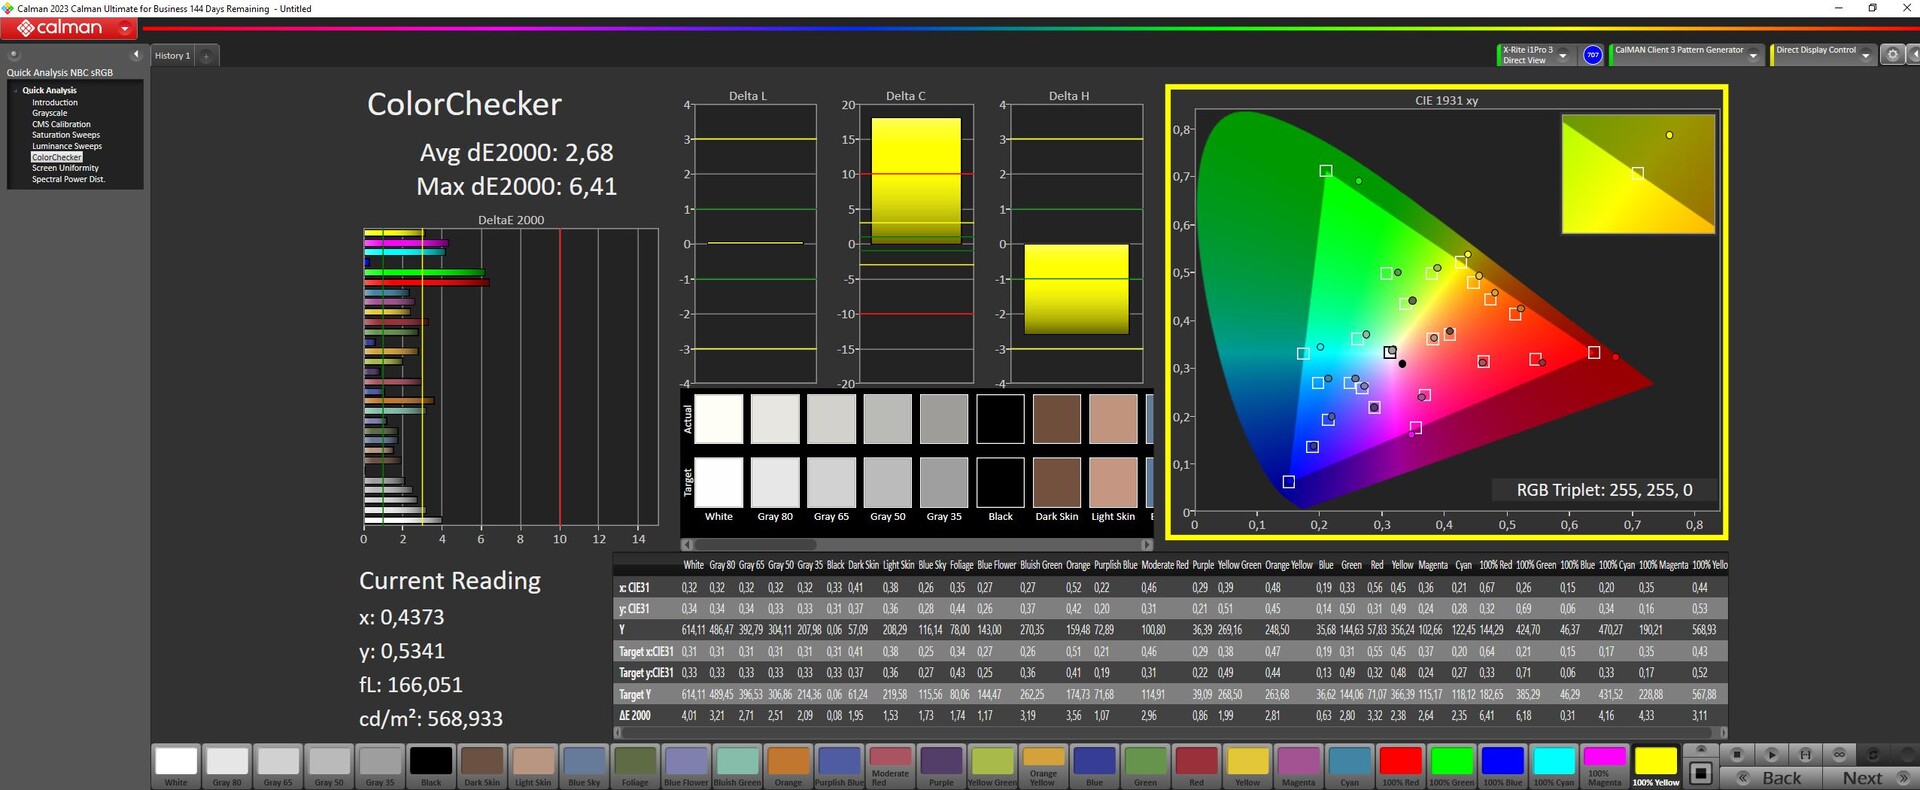
ΔE Color 2.68 | 0.5-29.43 Ø4.87, calibrated: 2.68
ΔE Greyscale 2.71 | 0.5-98 Ø5.1
86.6% AdobeRGB 1998 (Argyll 2.2.0 3D)
99.9% sRGB (Argyll 2.2.0 3D)
95.3% Display P3 (Argyll 2.2.0 3D)
Gamma: 2.27
| Lenovo Legion 9 16IRX9, RTX 4090 CSOT T3 MNG007ZA2-2, MiniLED, 3200x2000, 16" | Lenovo Legion 9 16IRX8 CSOT T3 MNG007ZA2-2, Mini-LED, 3200x2000, 16" | Razer Blade 16 2024, RTX 4090 Samsung SDC41AB (ATNA60DL03-0), OLED, 2560x1600, 16" | Alienware m18 R2 BOE NE18NZ1, IPS, 2560x1600, 18" | Asus ROG Strix Scar 18 G834JYR (2024) BOE NE180QDM-NM1, Mini LED, 2560x1600, 18" | Medion Erazer Beast X40 2024 BOE NE170QDM-NZ1, IPS, 2560x1600, 17" | |
|---|---|---|---|---|---|---|
| Display | 1% | 5% | 2% | 3% | -16% | |
| Display P3 Coverage | 95.3 | 97.2 2% | 99.1 4% | 97.8 3% | 99.9 5% | 68.1 -29% |
| sRGB Coverage | 99.9 | 99.9 0% | 99.9 0% | 99.5 0% | 100 0% | 99.5 0% |
| AdobeRGB 1998 Coverage | 86.6 | 87 0% | 95.6 10% | 88.9 3% | 90 4% | 69 -20% |
| Response Times | -12% | 37% | 27% | 1% | 19% | |
| Response Time Grey 50% / Grey 80% * | 12.6 ? | 13.3 ? -6% | 0.24 ? 98% | 5.3 ? 58% | 12 ? 5% | 11.7 ? 7% |
| Response Time Black / White * | 10 ? | 11.6 ? -16% | 0.4 ? 96% | 10.4 ? -4% | 10.7 ? -7% | 6.9 ? 31% |
| PWM Frequency | 5430 | 4742 -13% | 960 -82% | 5733 ? 6% | ||
| Screen | -0% | 21% | -107% | 14% | -136% | |
| Brightness middle | 631 | 674.9 7% | 418 -34% | 271.8 -57% | 937 48% | 422 -33% |
| Brightness | 664 | 682 3% | 420 -37% | 275 -59% | 934 41% | 388 -42% |
| Brightness Distribution | 91 | 96 5% | 98 8% | 78 -14% | 89 -2% | 87 -4% |
| Black Level * | 0.03 | 0.04 -33% | 0.02 33% | 0.27 -800% | 0.066 -120% | 0.42 -1300% |
| Contrast | 21033 | 16873 -20% | 20900 -1% | 1007 -95% | 14197 -33% | 1005 -95% |
| Colorchecker dE 2000 * | 2.68 | 2.56 4% | 1.07 60% | 2.48 7% | 1.52 43% | 1.42 47% |
| Colorchecker dE 2000 max. * | 6.41 | 4.16 35% | 4.04 37% | 5.59 13% | 2.82 56% | 1.97 69% |
| Colorchecker dE 2000 calibrated * | 2.68 | 2.47 8% | 1.07 60% | 0.56 79% | 1.21 55% | 0.7 74% |
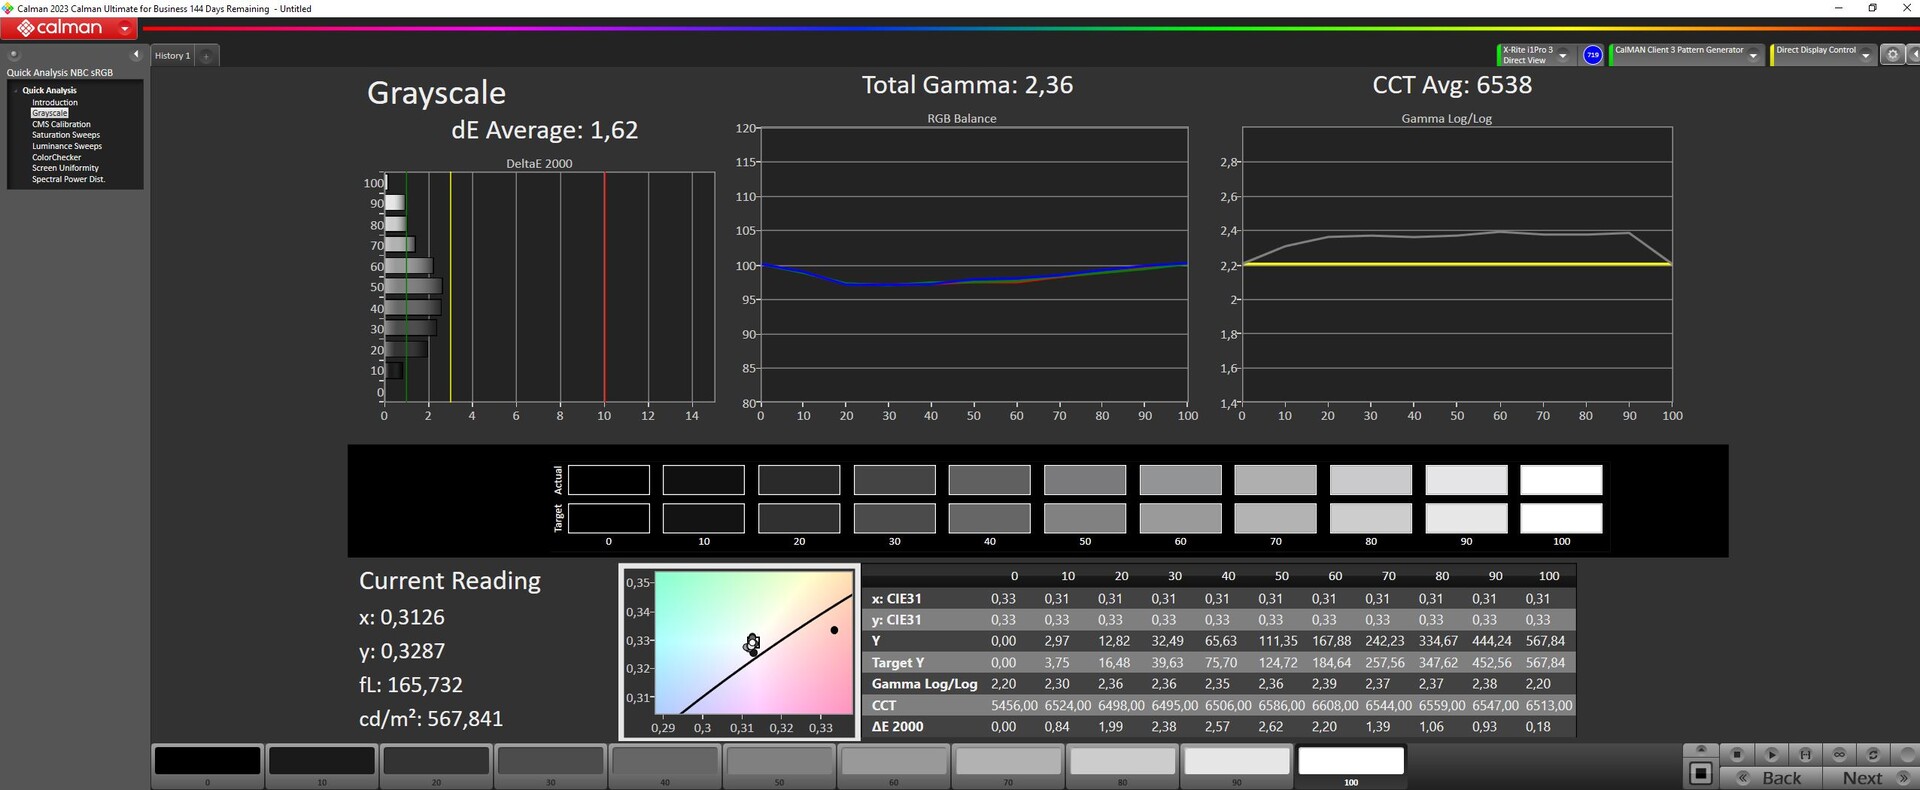
| Greyscale dE 2000 * | 2.71 | 3 -11% | 1.12 59% | 3.7 -37% | 1.7 37% | 1.2 56% |
| Gamma | 2.27 97% | 2.38 92% | 2.29 96% | 2.2 100% | 2.042 108% | 2.078 106% |
| CCT | 6135 106% | 6799 96% | 6417 101% | 6355 102% | 6578 99% | 6581 99% |
| Toplam Ortalama (Program / Ayarlar) | -4% /
-2% | 21% /
21% | -26% /
-65% | 6% /
9% | -44% /
-89% |
* ... daha küçük daha iyidir
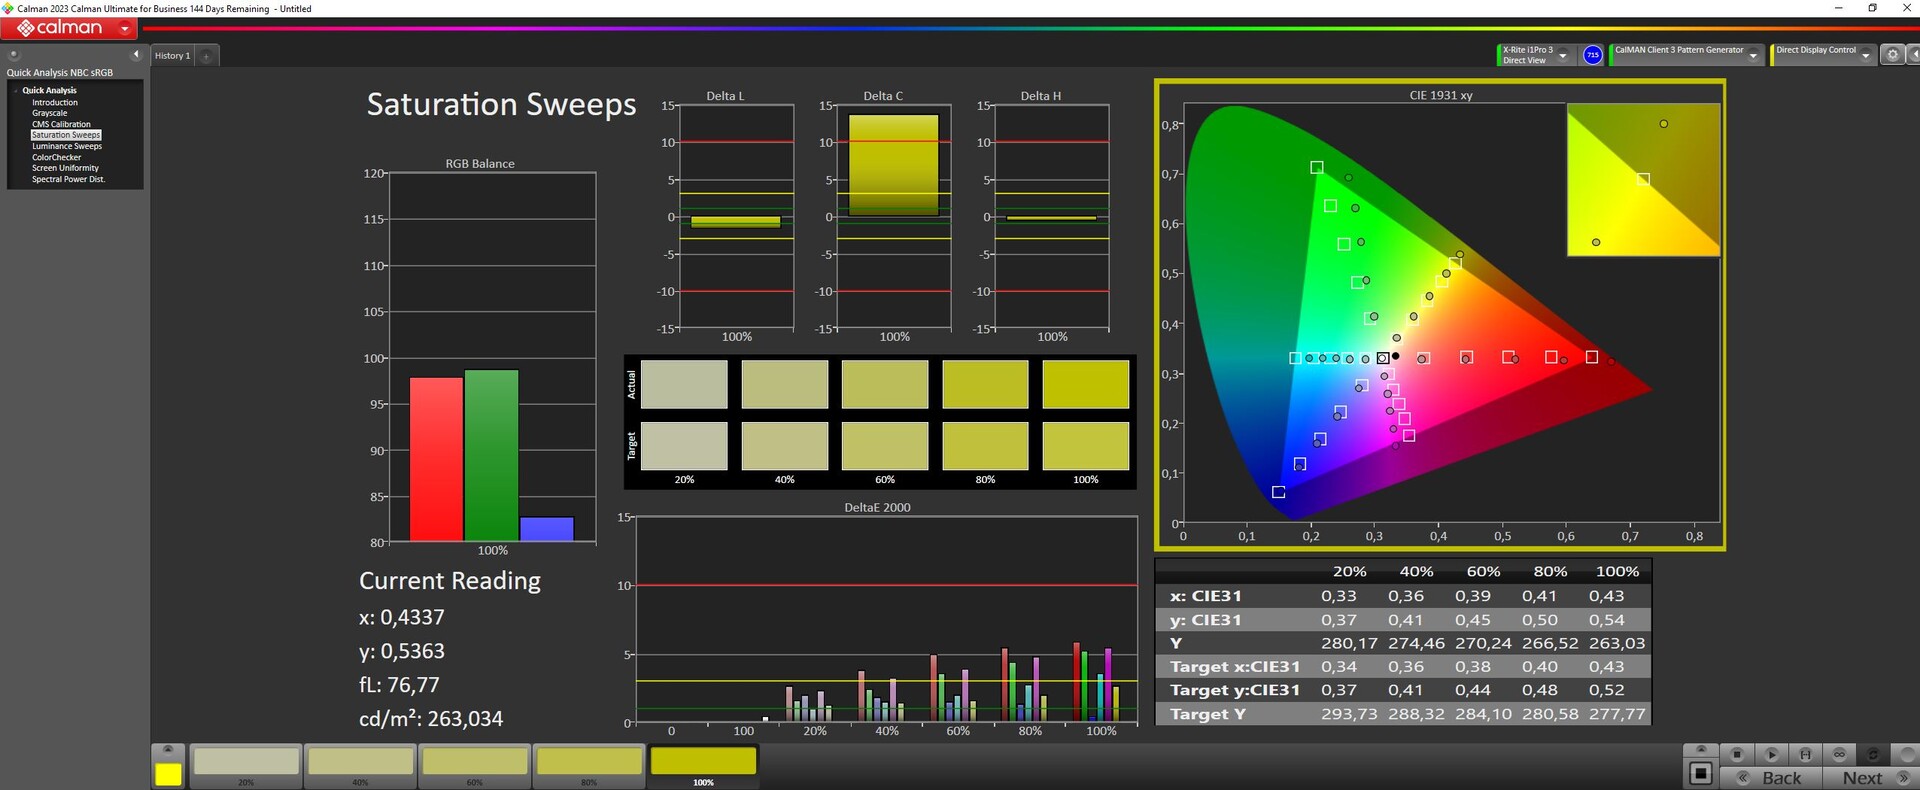
DisplayP3 yaklaşık yüzde 95, sRGB tamamen ve AdobeRGB yüzde 86 ila 87 oranında kapsanmaktadır.
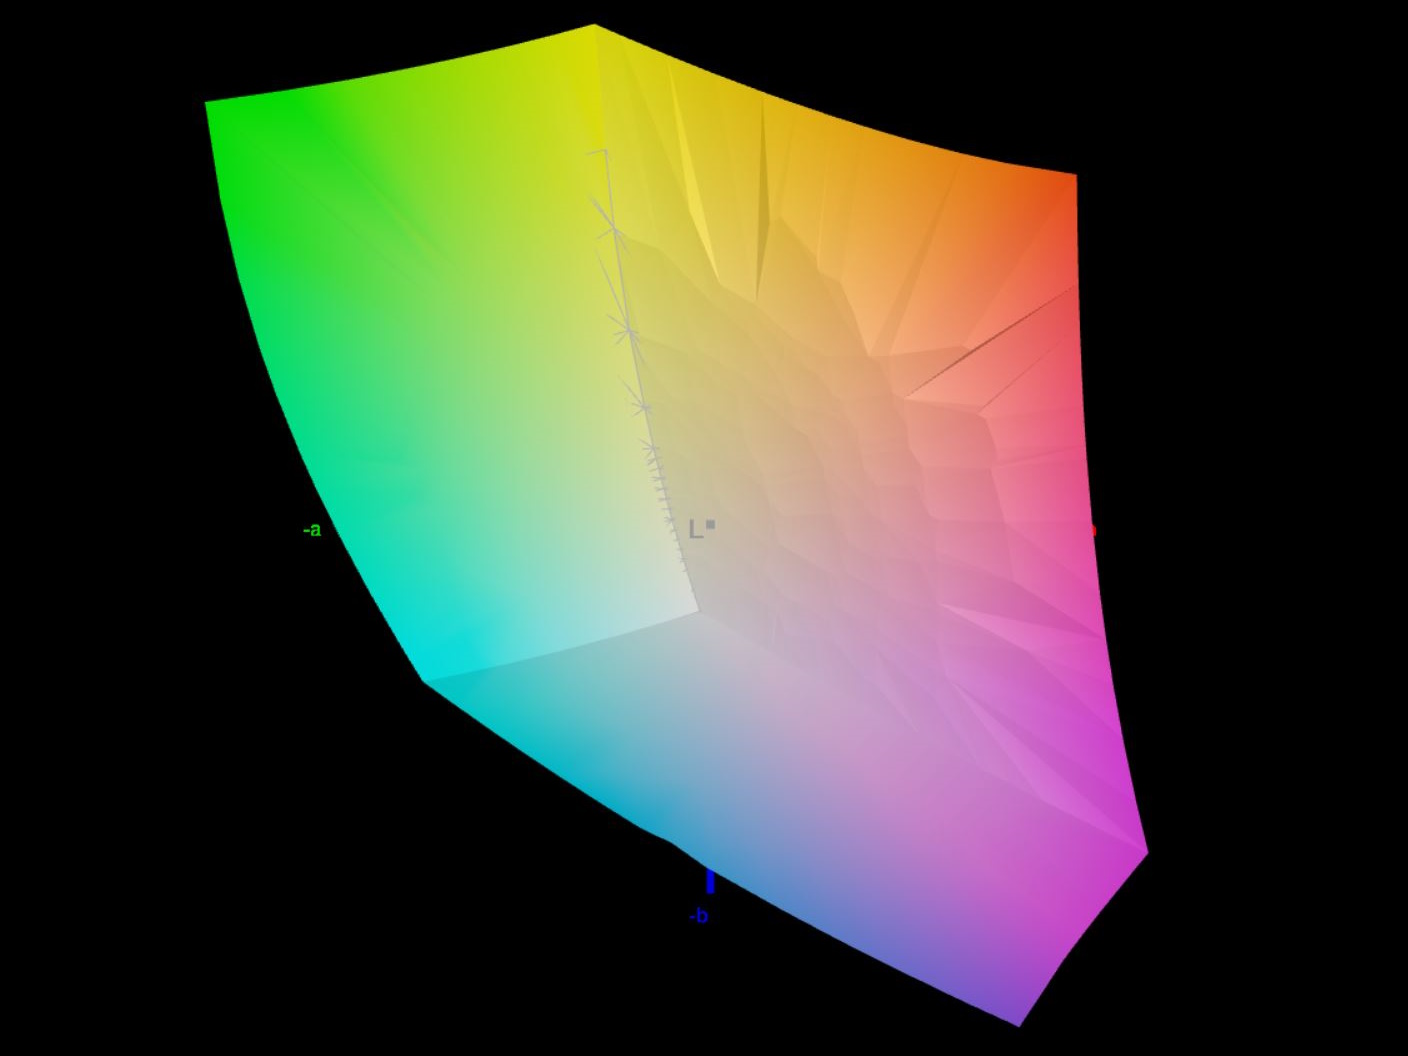
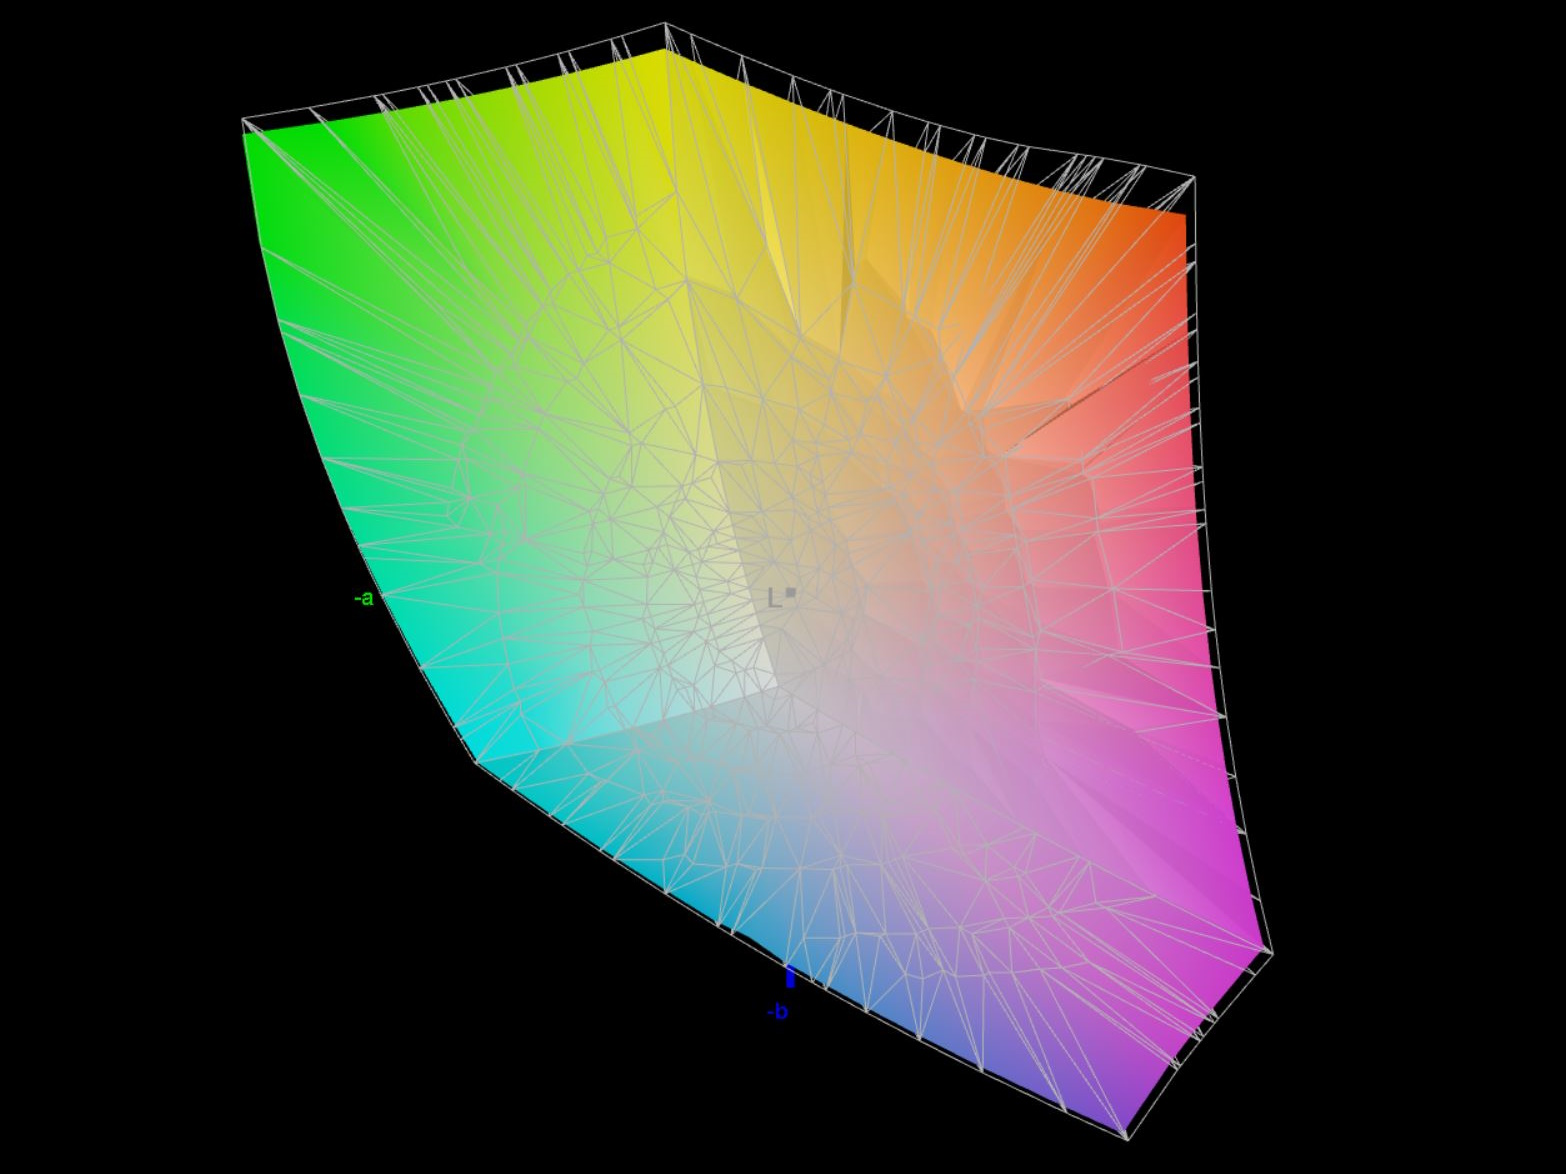
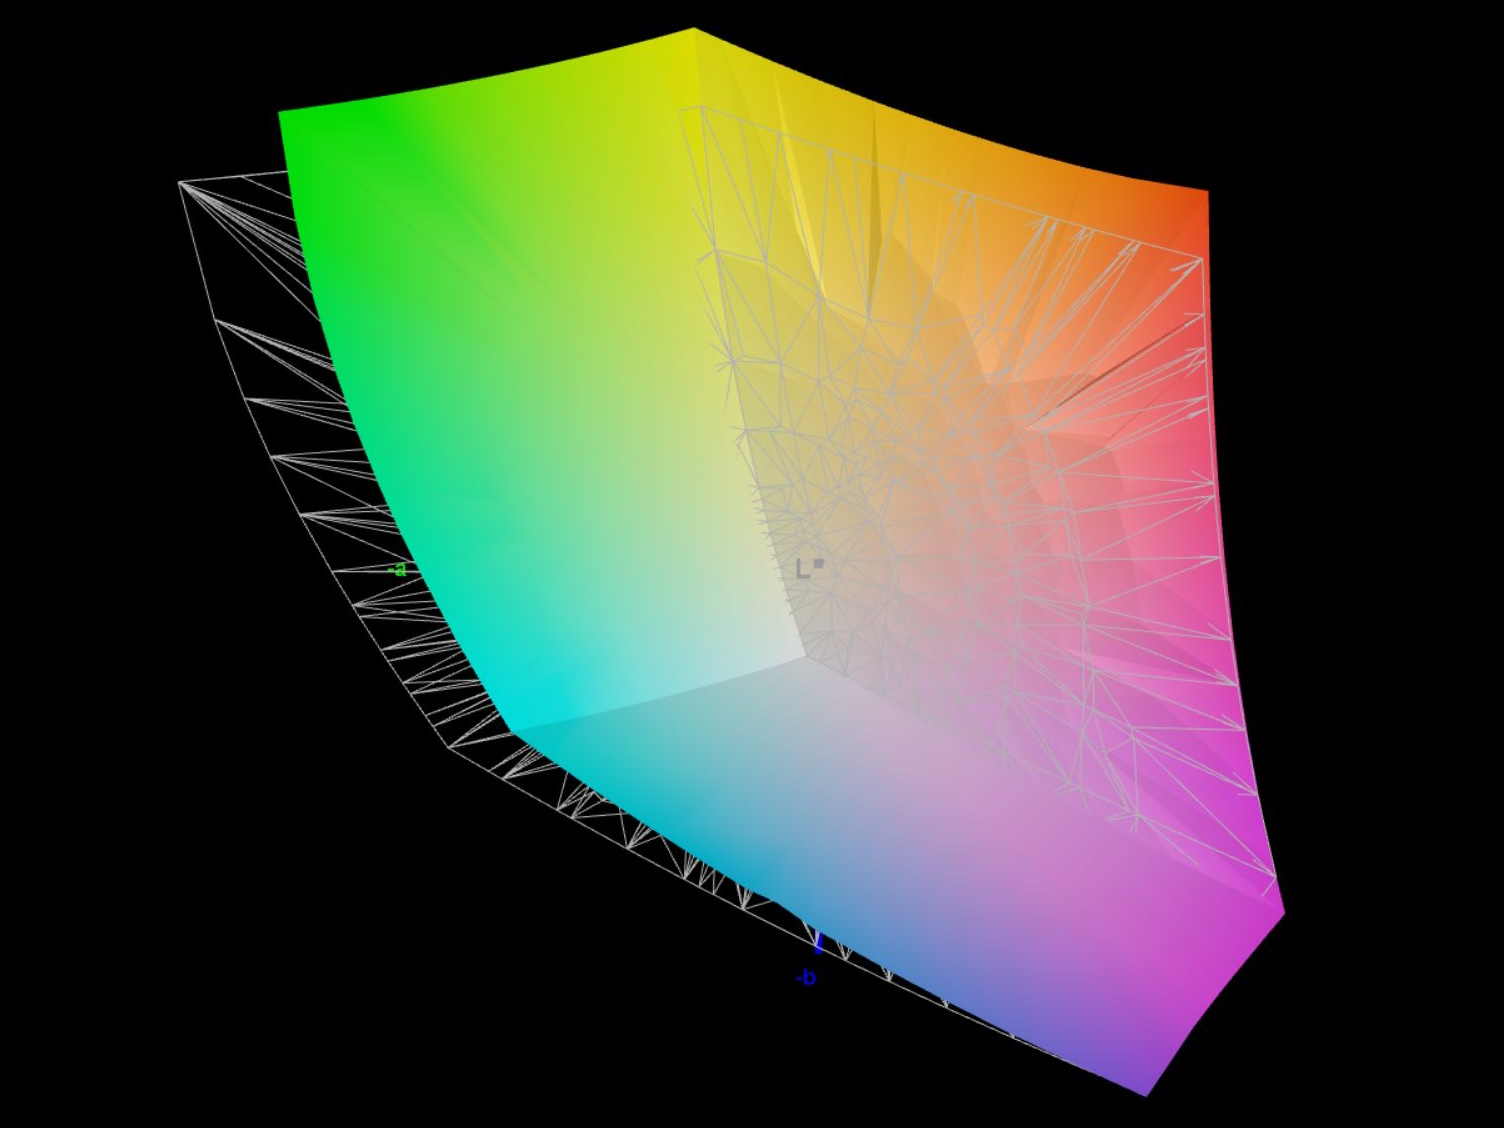
Ex çalışır, ekran P3 standardına göre uygun şekilde kalibre edilmiştir. Yeniden kalibrasyonumuz gri tonlamalı DeltaE değerlerini iyileştirdi ancak ClocChecker DeltaE değerlerini kötüleştirdi, bu yüzden çabaya değmez. Bununla birlikte, renk sapmaları 2,68 ortalama ve 6,41'e varan aykırı değerlerle ideal değildir.

Yanıt Sürelerini Görüntüle
| ↔ Tepki Süresi Siyahtan Beyaza | ||
|---|---|---|
| 10 ms ... yükseliş ↗ ve sonbahar↘ birleşimi | ↗ 5.2 ms yükseliş | 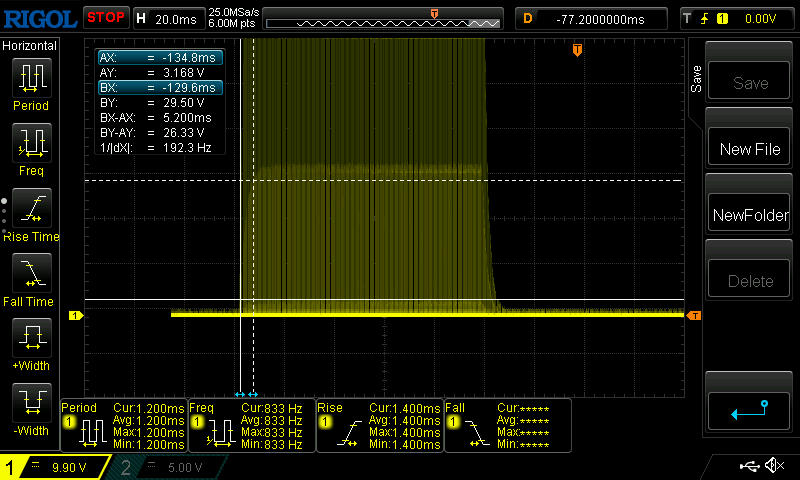 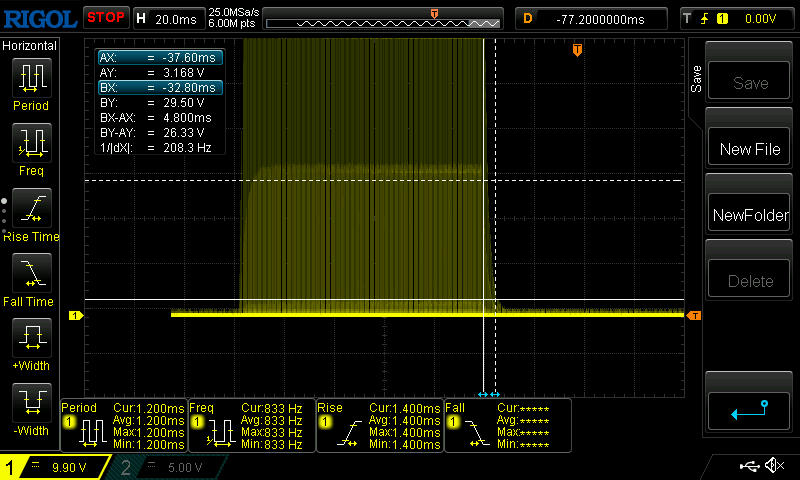 |
| ↘ 4.8 ms sonbahar | ||
| Ekran, testlerimizde iyi yanıt oranları gösteriyor ancak rekabetçi oyuncular için çok yavaş olabilir. Karşılaştırıldığında, test edilen tüm cihazlar 0.1 (minimum) ile 240 (maksimum) ms arasında değişir. » Tüm cihazların 24 %'si daha iyi. Bu, ölçülen yanıt süresinin test edilen tüm cihazların ortalamasından (20.7 ms) daha iyi olduğu anlamına gelir. | ||
| ↔ Tepki Süresi %50 Griden %80 Griye | ||
| 12.6 ms ... yükseliş ↗ ve sonbahar↘ birleşimi | ↗ 6.6 ms yükseliş | 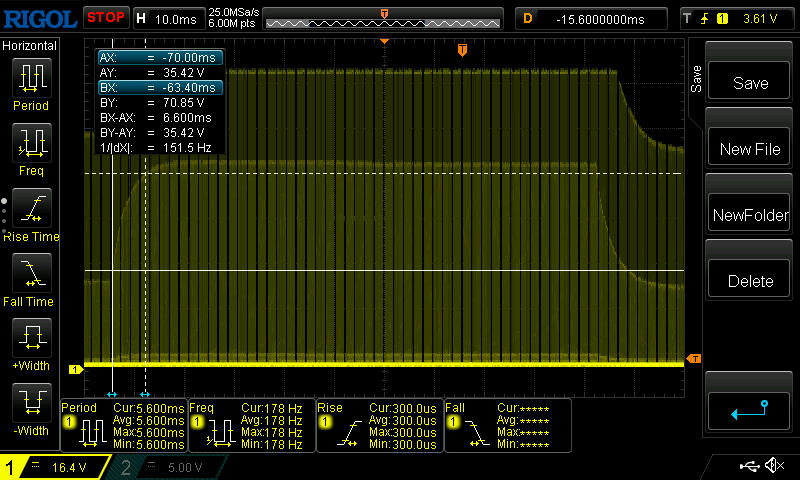 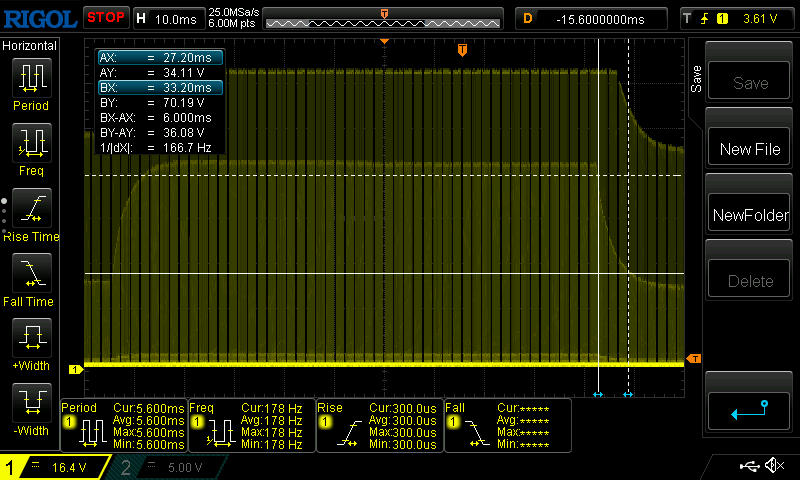 |
| ↘ 6 ms sonbahar | ||
| Ekran, testlerimizde iyi yanıt oranları gösteriyor ancak rekabetçi oyuncular için çok yavaş olabilir. Karşılaştırıldığında, test edilen tüm cihazlar 0.165 (minimum) ile 636 (maksimum) ms arasında değişir. » Tüm cihazların 23 %'si daha iyi. Bu, ölçülen yanıt süresinin test edilen tüm cihazların ortalamasından (32.5 ms) daha iyi olduğu anlamına gelir. | ||
Ekran Titremesi / PWM (Darbe Genişliği Modülasyonu)
| Ekran titriyor / PWM algılandı | 5430 Hz Amplitude: 8 % | |
Ekran arka ışığı 5430 Hz'de titriyor (en kötü durum, örneğin PWM kullanılması) . 5430 Hz frekansı oldukça yüksektir, bu nedenle PWM'ye duyarlı çoğu kullanıcı herhangi bir titremeyi fark etmemelidir. Karşılaştırıldığında: Test edilen tüm cihazların %53 %'si ekranı karartmak için PWM kullanmıyor. PWM tespit edilirse, ortalama 8492 (minimum: 5 - maksimum: 343500) Hz ölçüldü. | ||

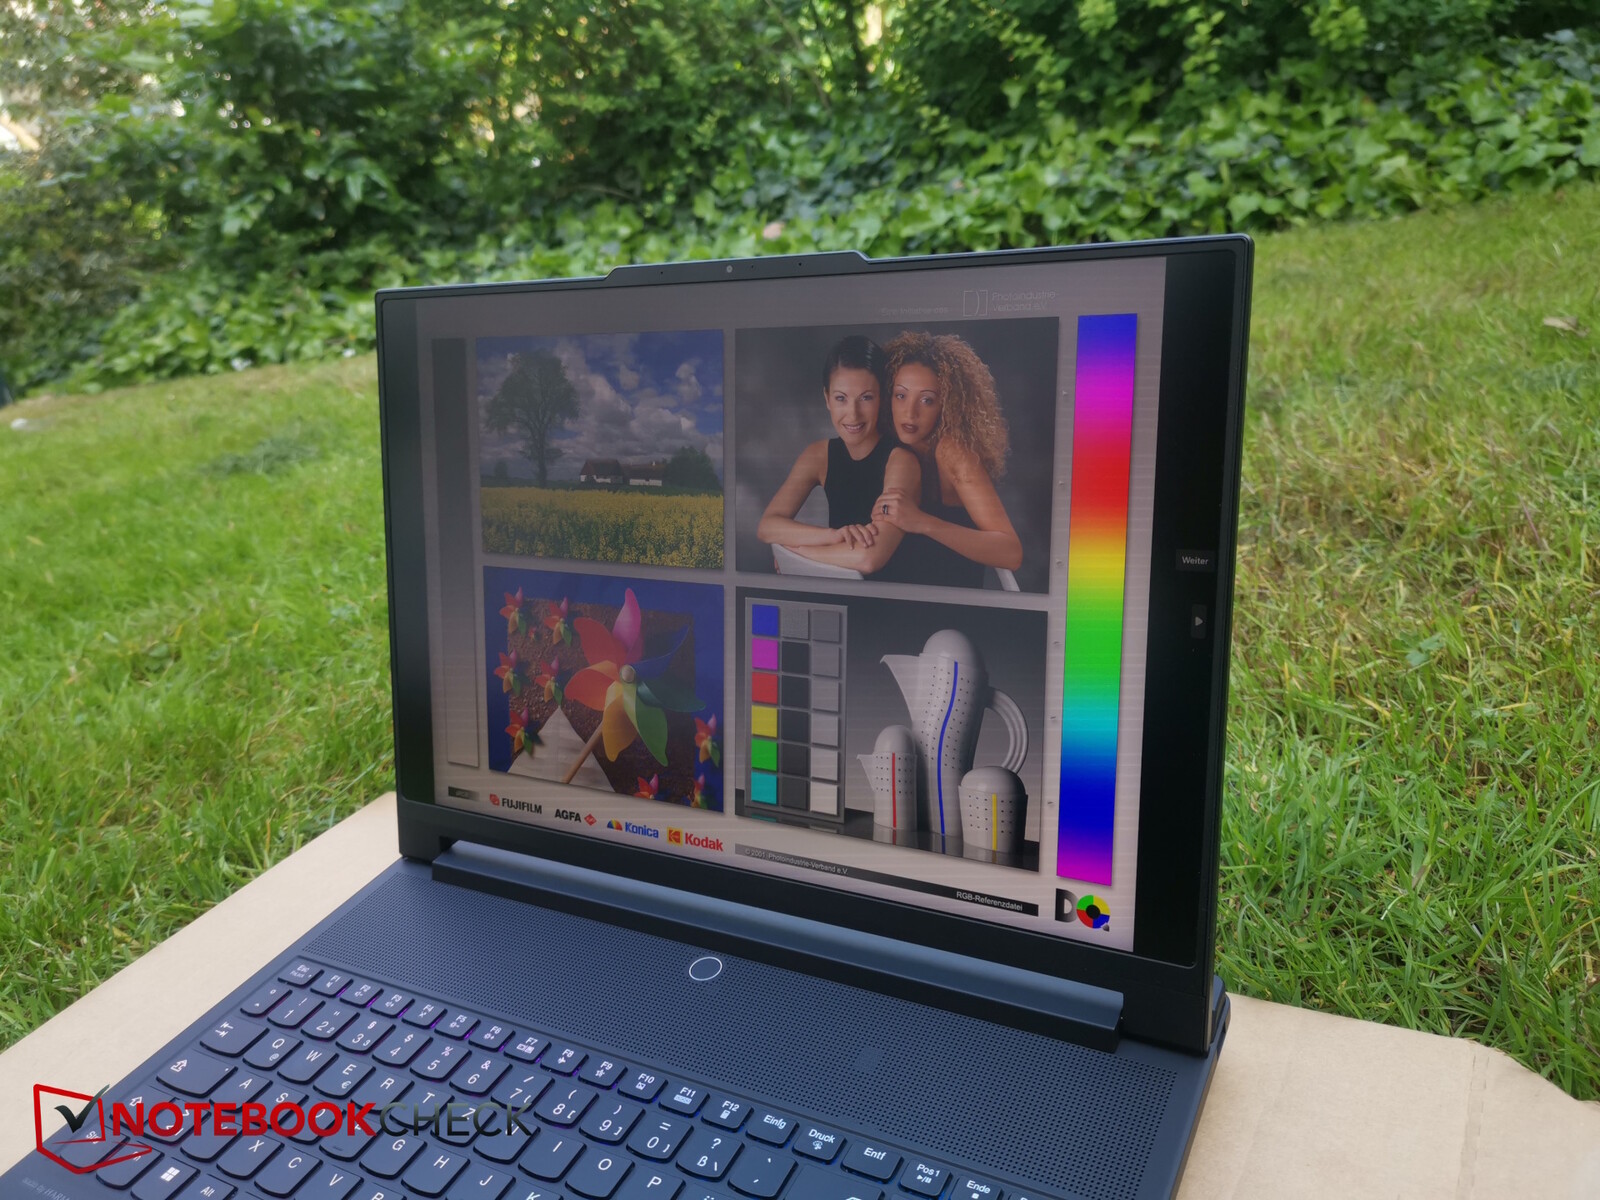
Dışarıda, ekranın yüksek parlaklığı ve mat yüzeyi sayesinde görünürlüğü oldukça iyidir. Yine de doğrudan güneş ışığından kaçınılmalıdır.

Performans - Yüksek, ancak sorunsuz değil
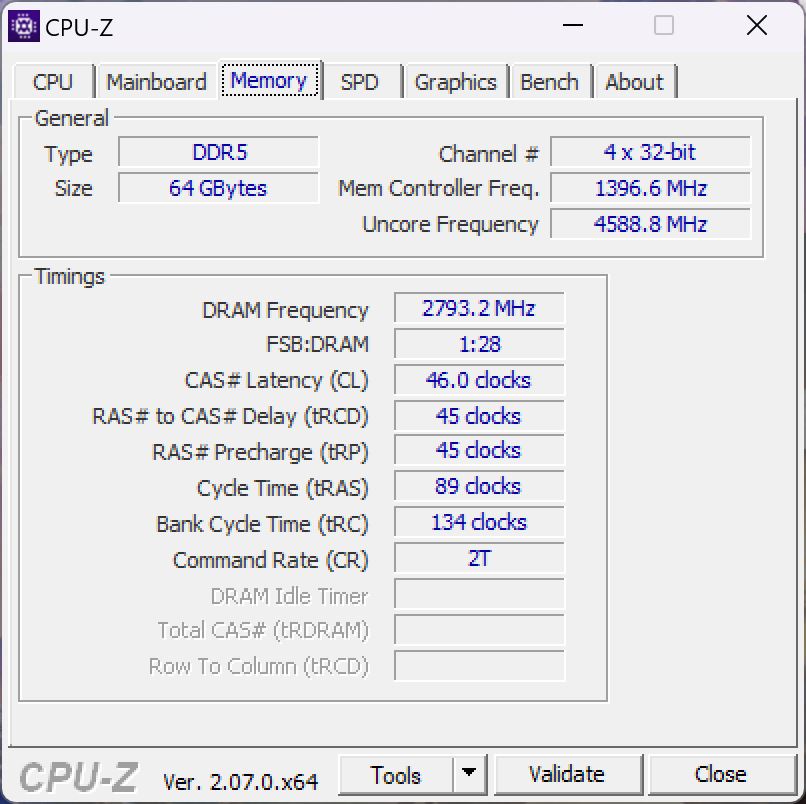
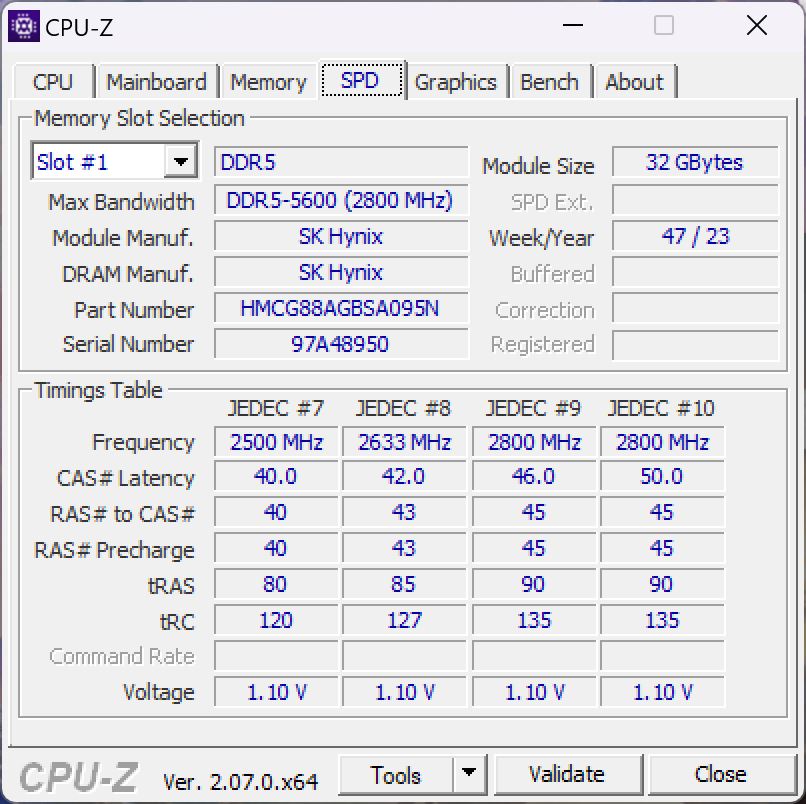
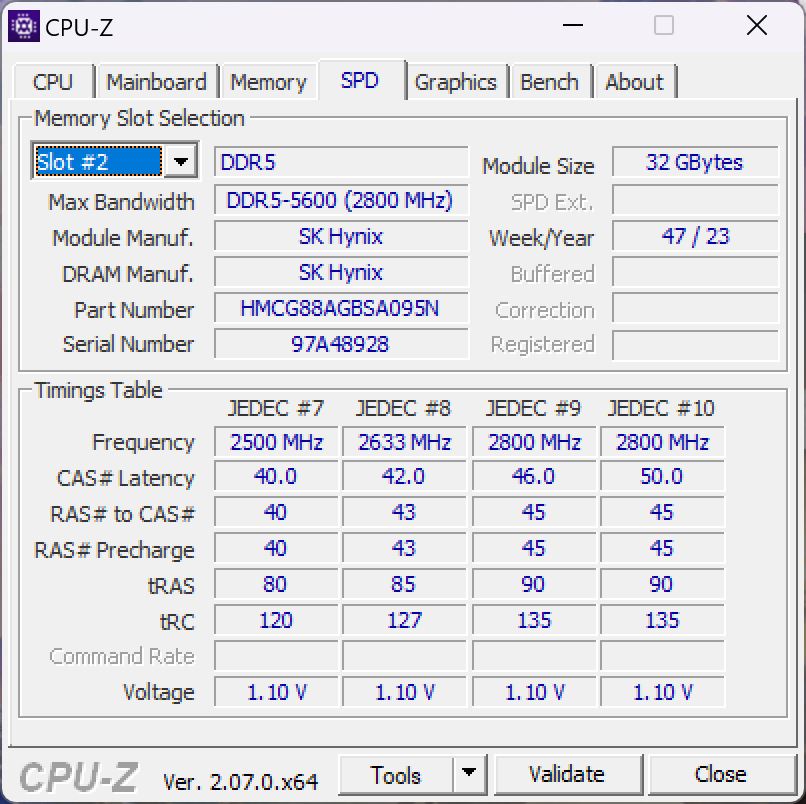
Yeni i9-14900HX ile birlikte güçlü RTX 4090 ve 64 GB RAM, Legion 9i'yi açıkça üst düzey bir oyuncu yapıyor. Arka taraftaki çıkıntılı tasarımı da bunu gösteriyor, bu nedenle cihazın potansiyel olarak yüksek performansına rağmen içerik oluşturucular daha ince alternatifler arayabilir.
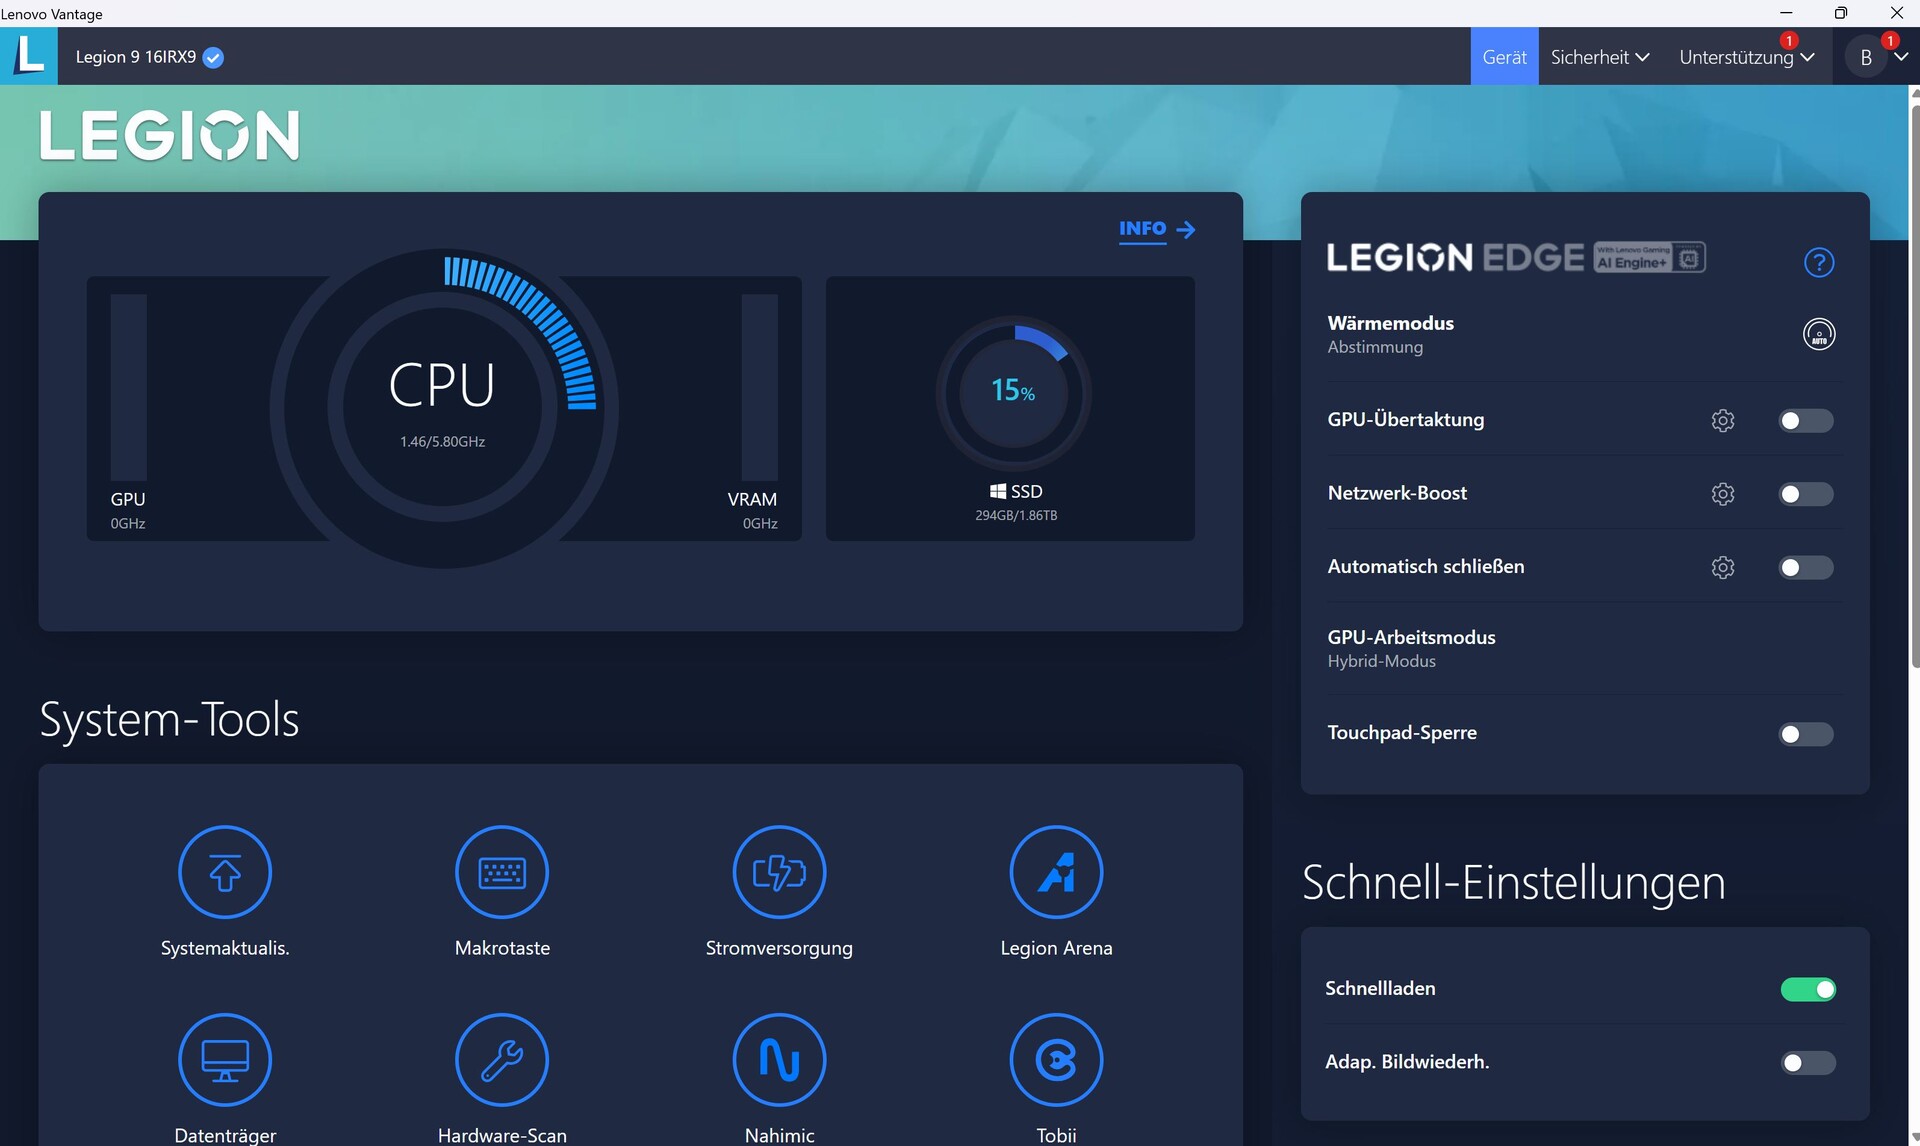
Test koşulları
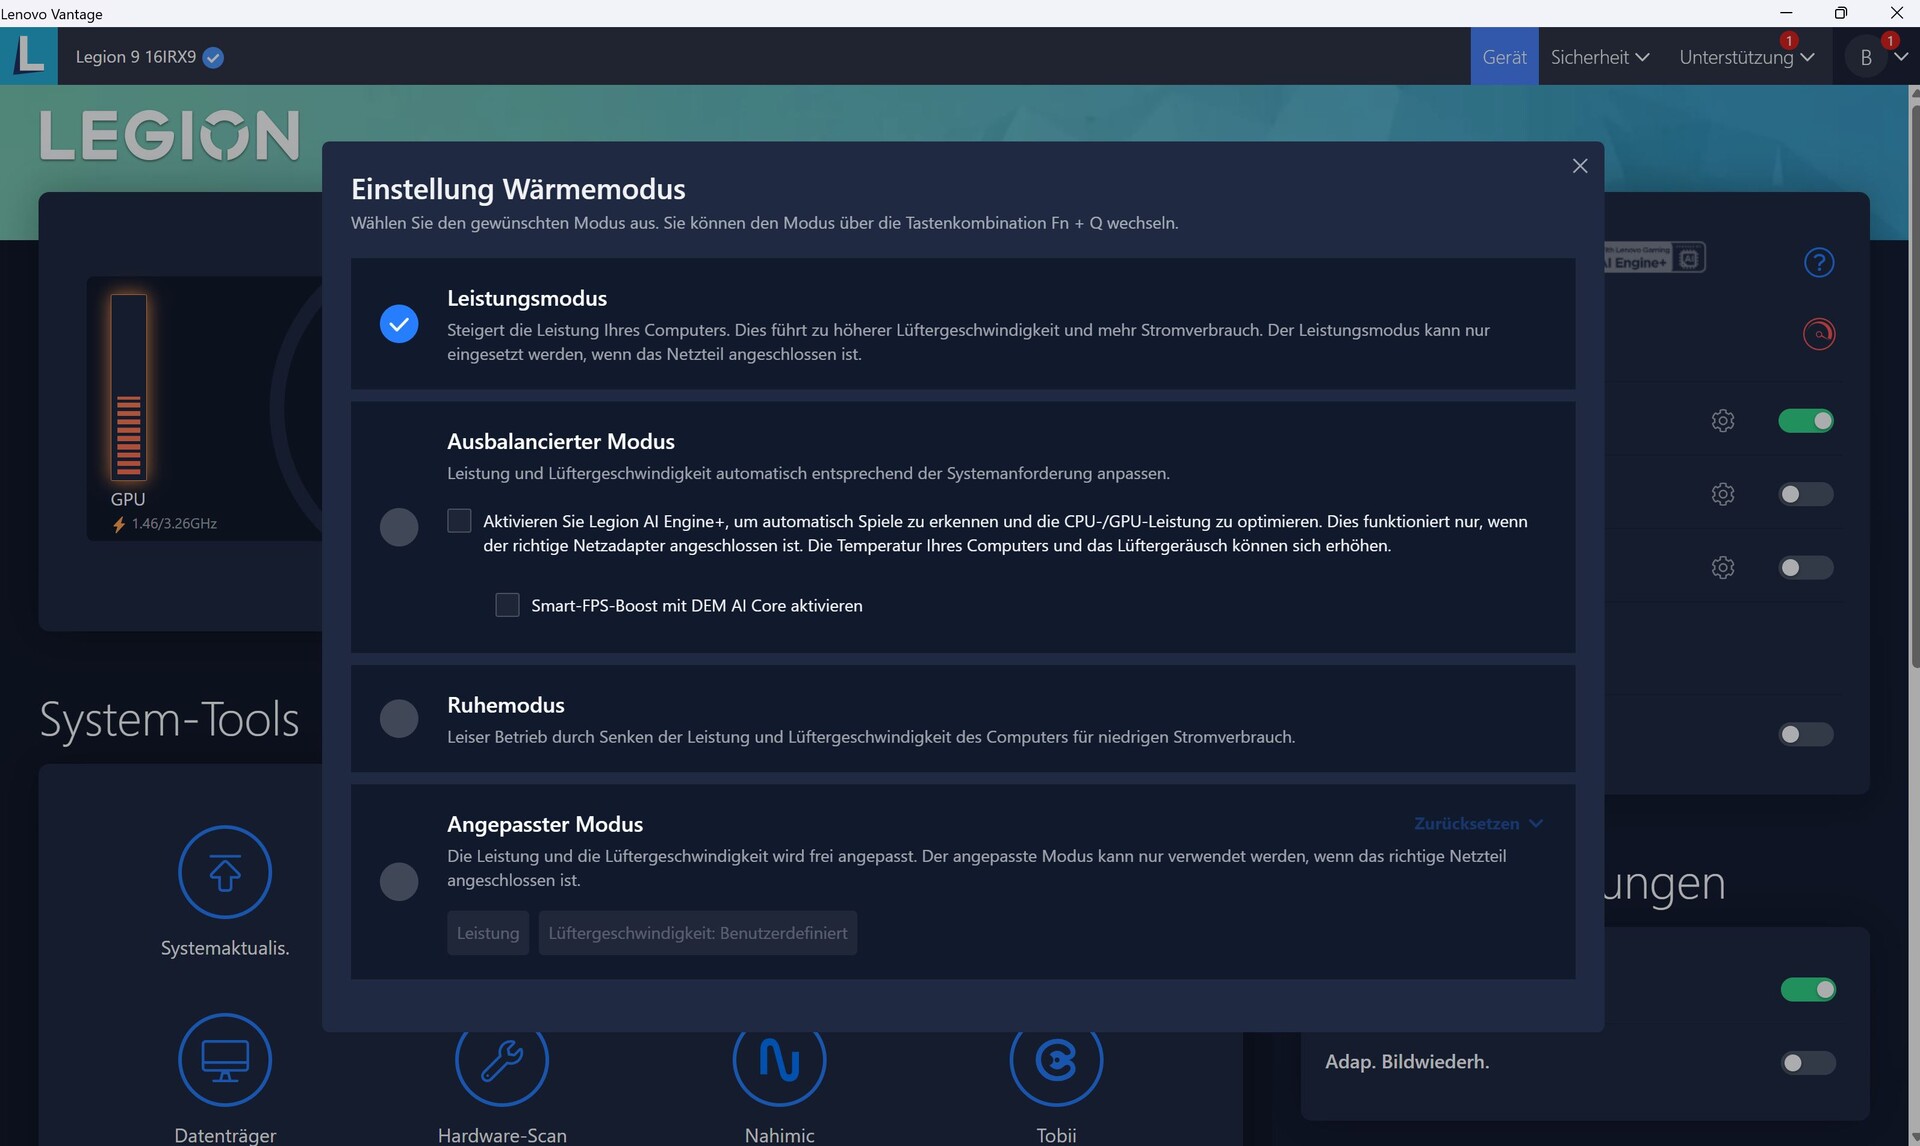
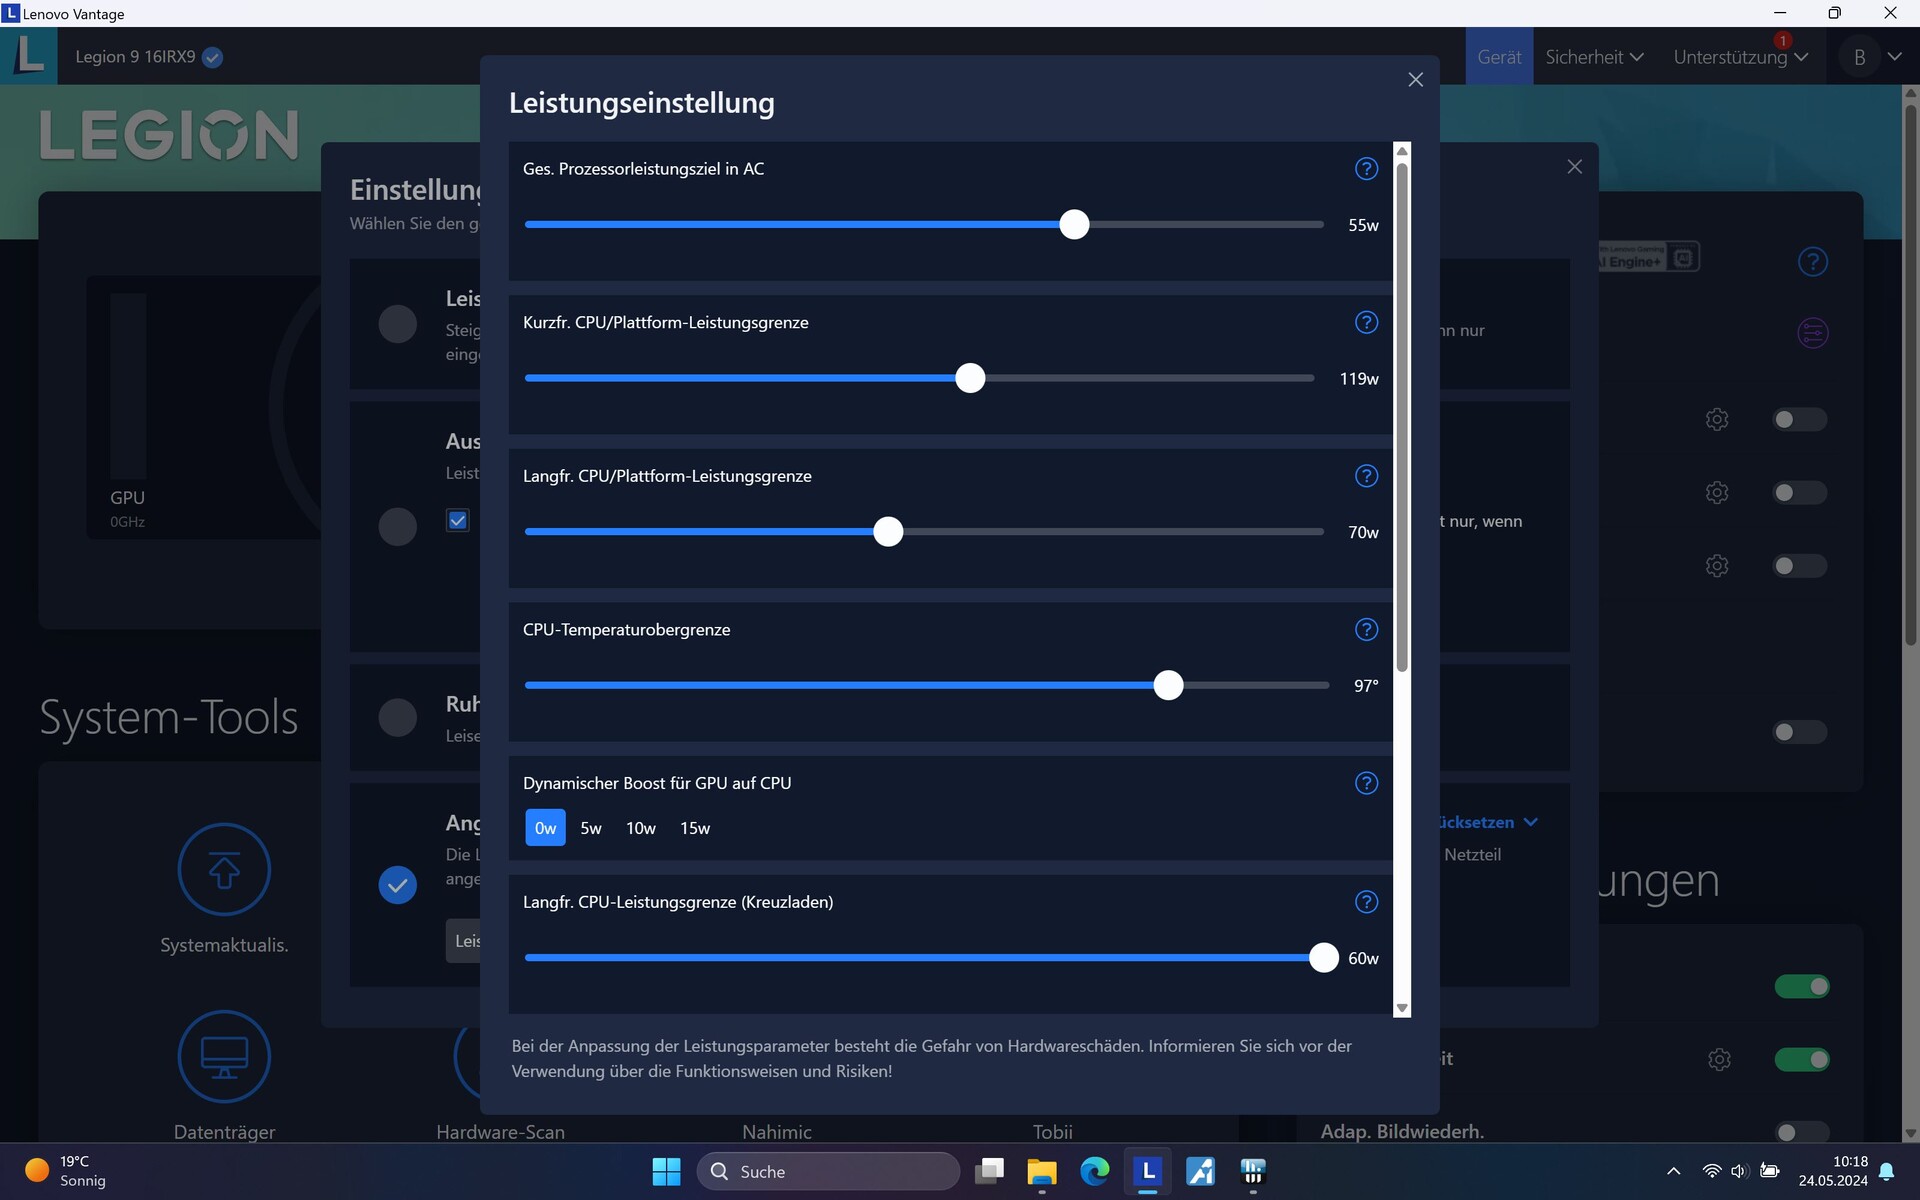
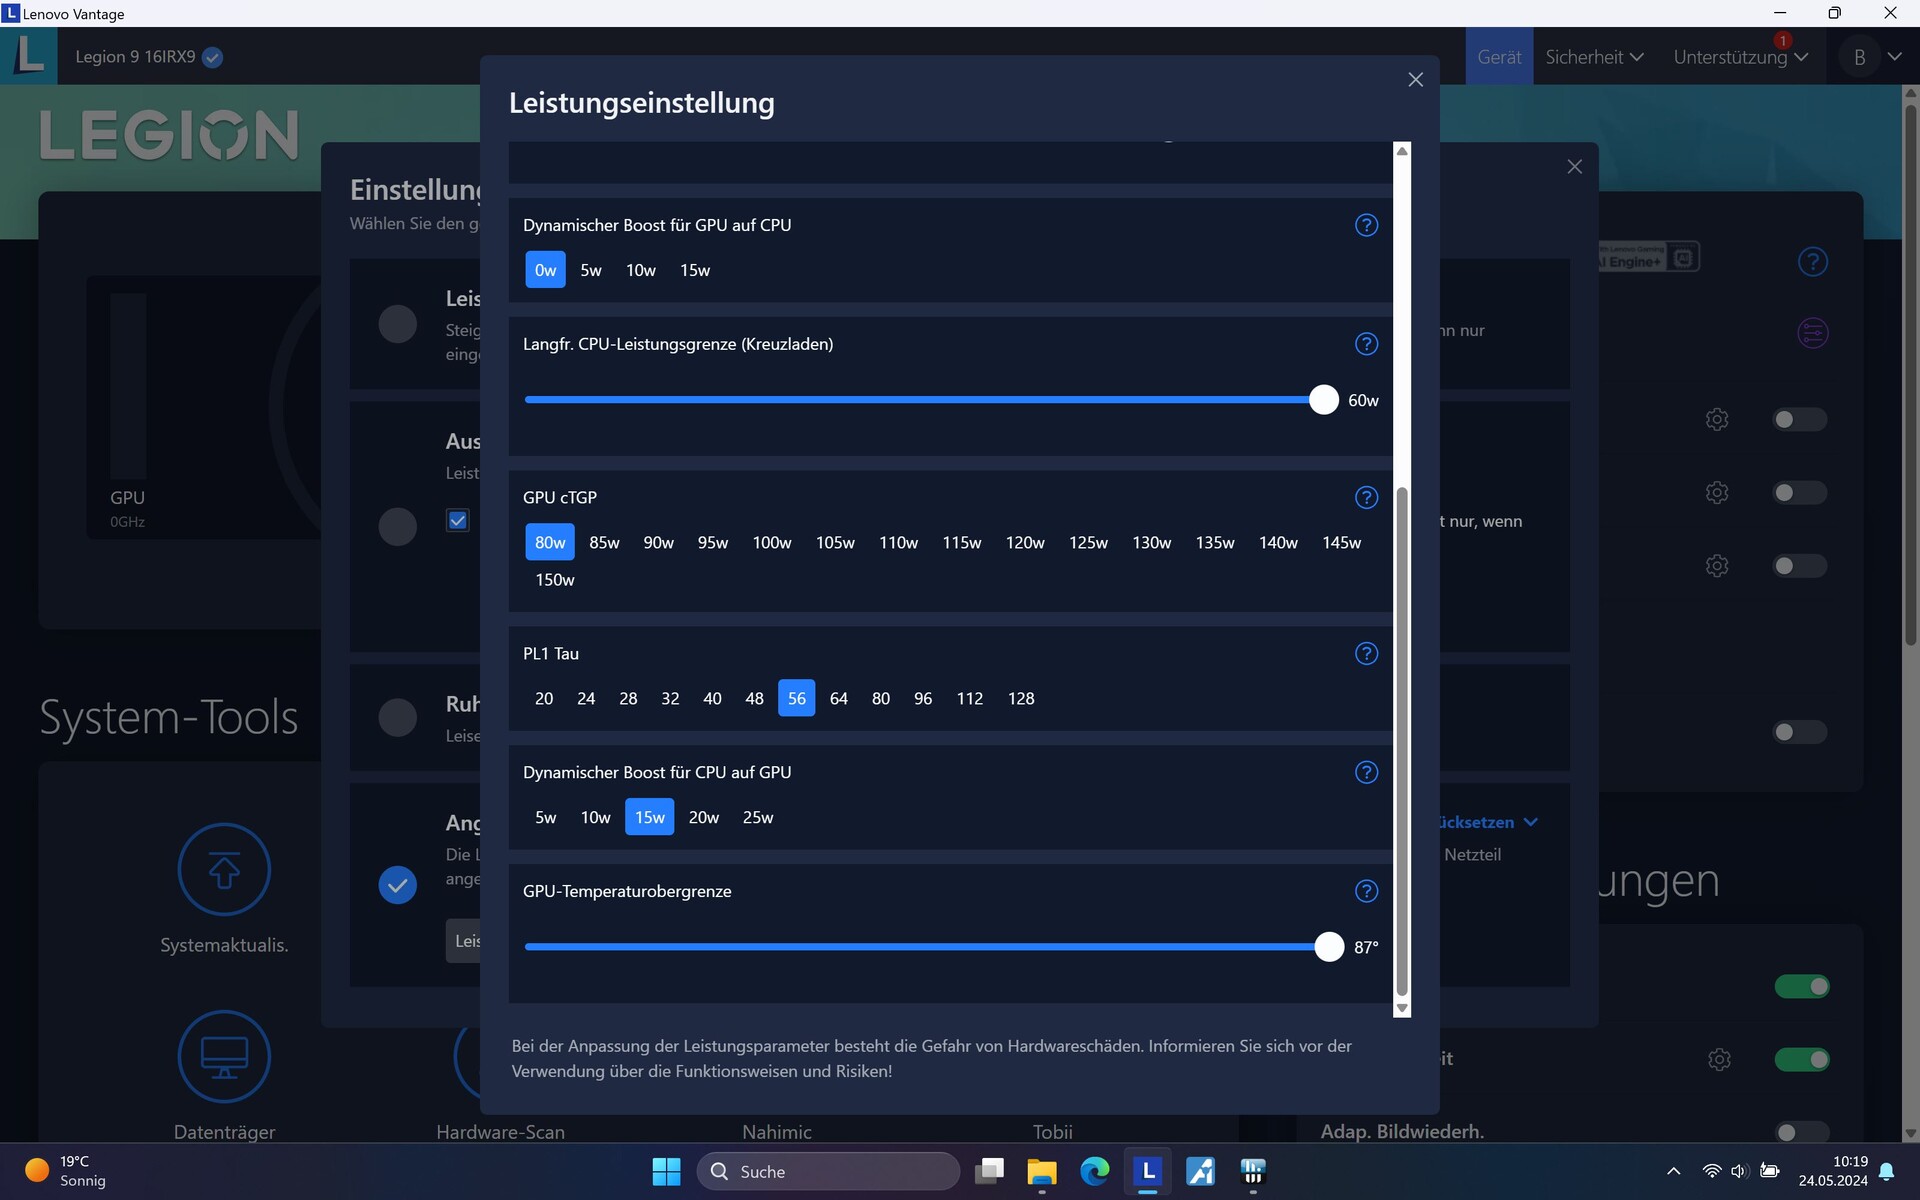
Lenovo Vantage, Legion 9'un Kontrol Merkezi'nin adıdır ve Performans, Dengeli (burada optimizasyon için AI'yı da seçebilirsiniz) ve Sessiz performans profillerini içerir. Ayrıca çeşitli parametreleri manuel olarak ayarlamanıza olanak tanıyan Özelleştirilmiş mod da var.
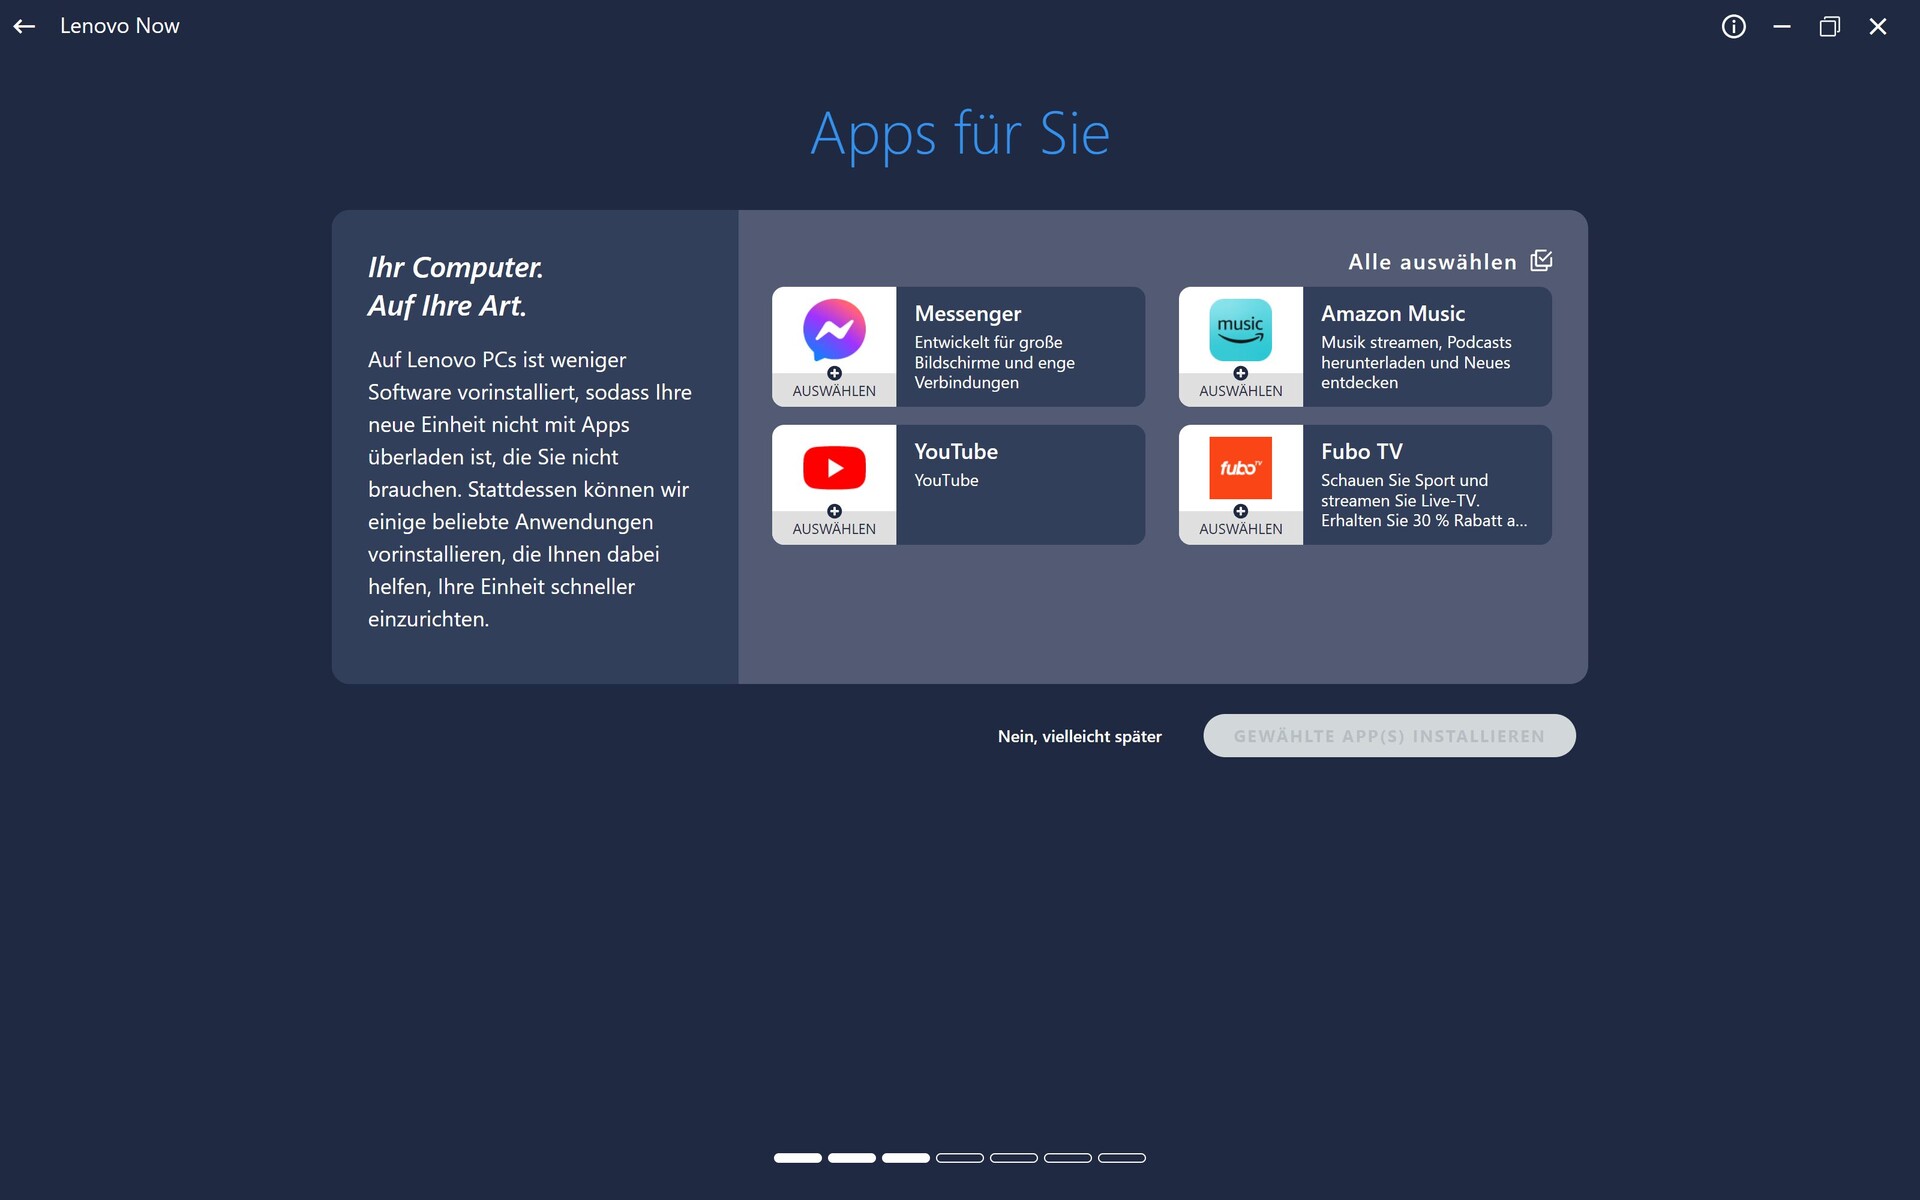
Ne yazık ki, Vantage bazen bizi reklamlarla rahatsız etti, örneğin Amazon Music, YouTube uygulamaları vb. Bunun nedeni, pazarlama mesajlarının Vantage'da varsayılan olarak etkin olması ve bunlardan rahatsız olmamak için önce bunları kapatmanız gerektiğidir.
Kıyaslamalarımız için Performans modunu seçtik, ancak GPU hız aşırtma anahtarını devre dışı bıraktık.

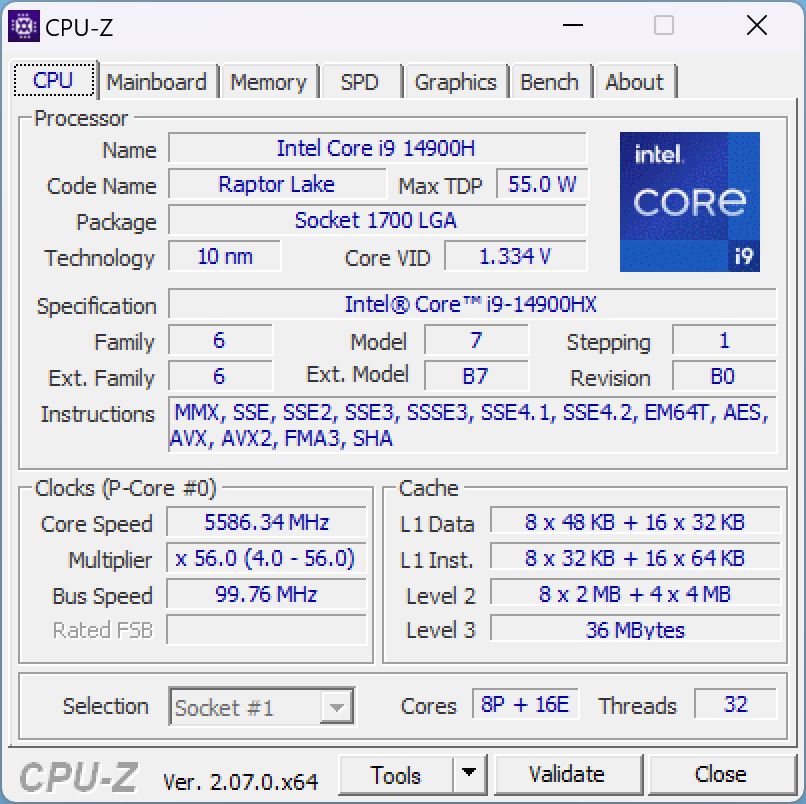
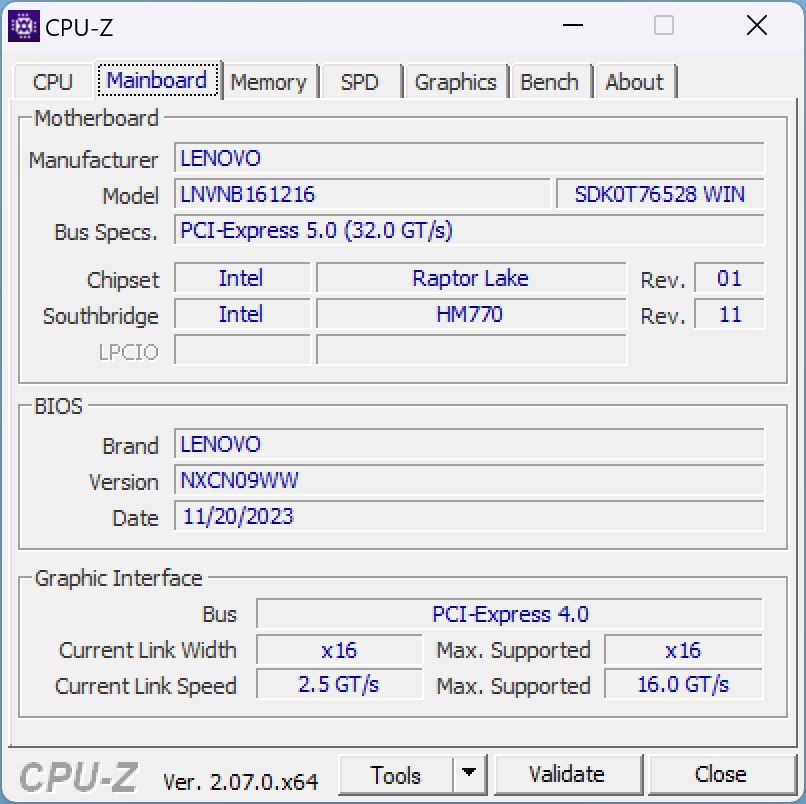
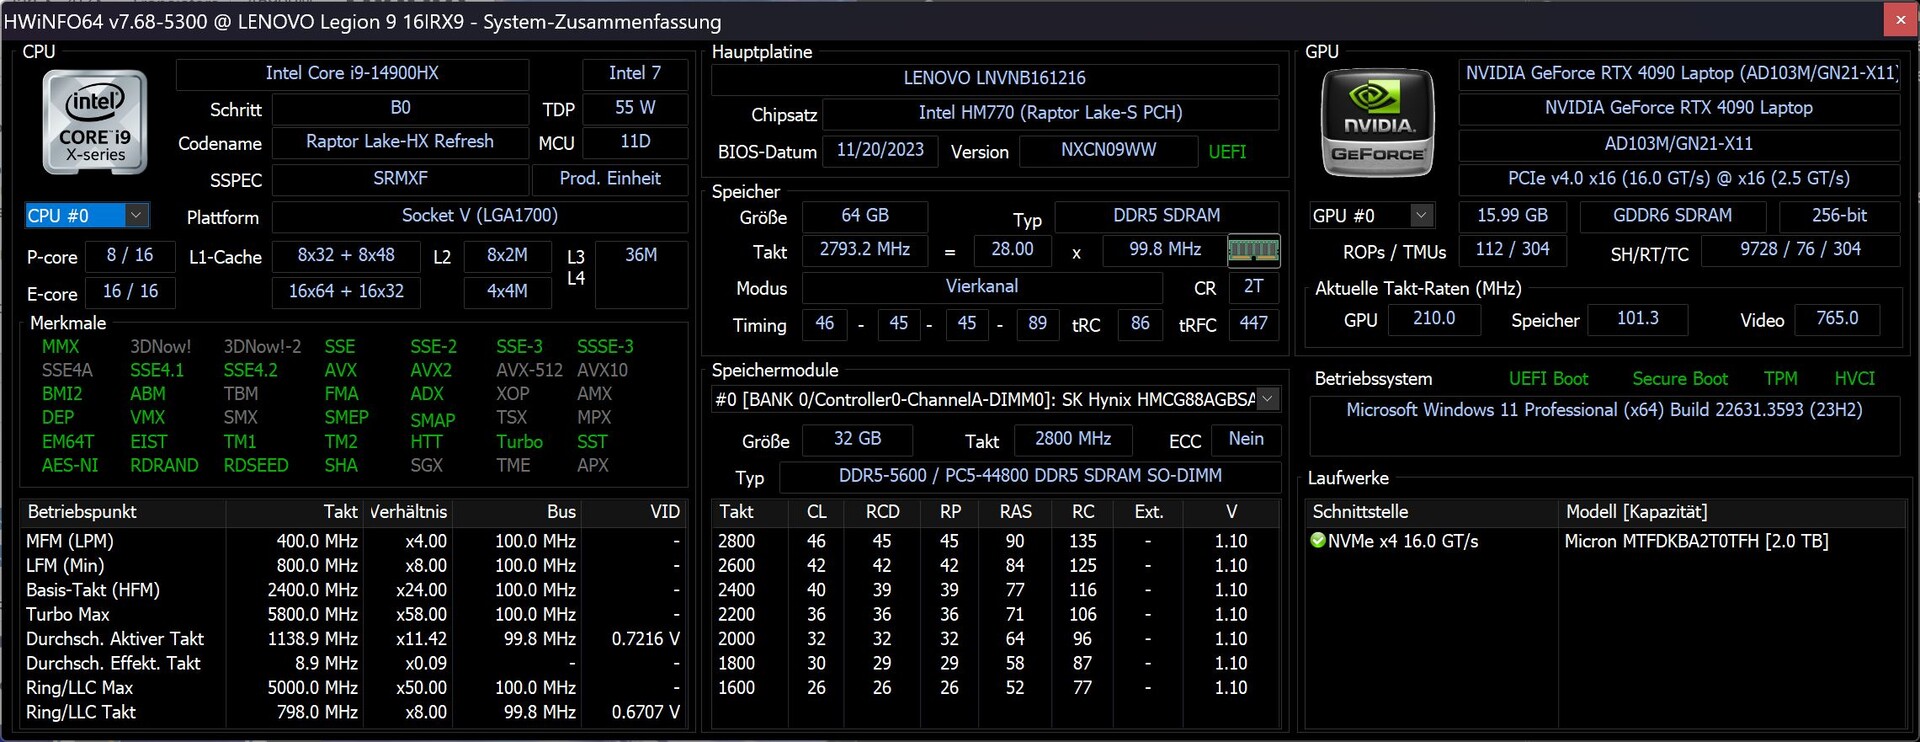
İşlemci
Bu i9-14900HX intel'in en son Raptor Lake Refresh serisinden üst düzey bir CPU'dur. 8 P çekirdeği 5,8 GHz'e kadar saat hızına sahiptir ve 16 E çekirdeğinin temel saat hızı 1,6 GHz'dir. Birlikte toplam 32 iş parçacığı işleyebilirler.
Cinebench R15 döngüsü sırasında, Legion 9i en yüksek başlangıç performansına sahipti, ancak aynı CPU'ya sahip rakiplerinden farklı olarak, performansı zaman içinde sürekli olarak düştü - yarım saat sonra yaklaşık yüzde 7,5. Daha sonra, performansı i9-13980HX ile selefinin sadece biraz üzerindeydi. Buna rağmen, Legion 9'un içindeki CPU, selefine göre performans artışı oldukça düşük olmasına rağmen karşılaştırma alanındaki en hızlı CPU'lardan biridir.
Çoklu iş parçacığı performansı şüphe götürmezken,
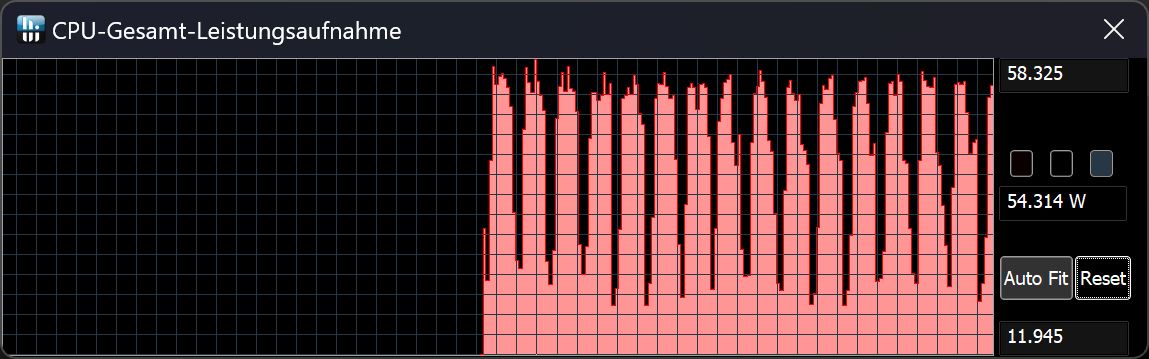
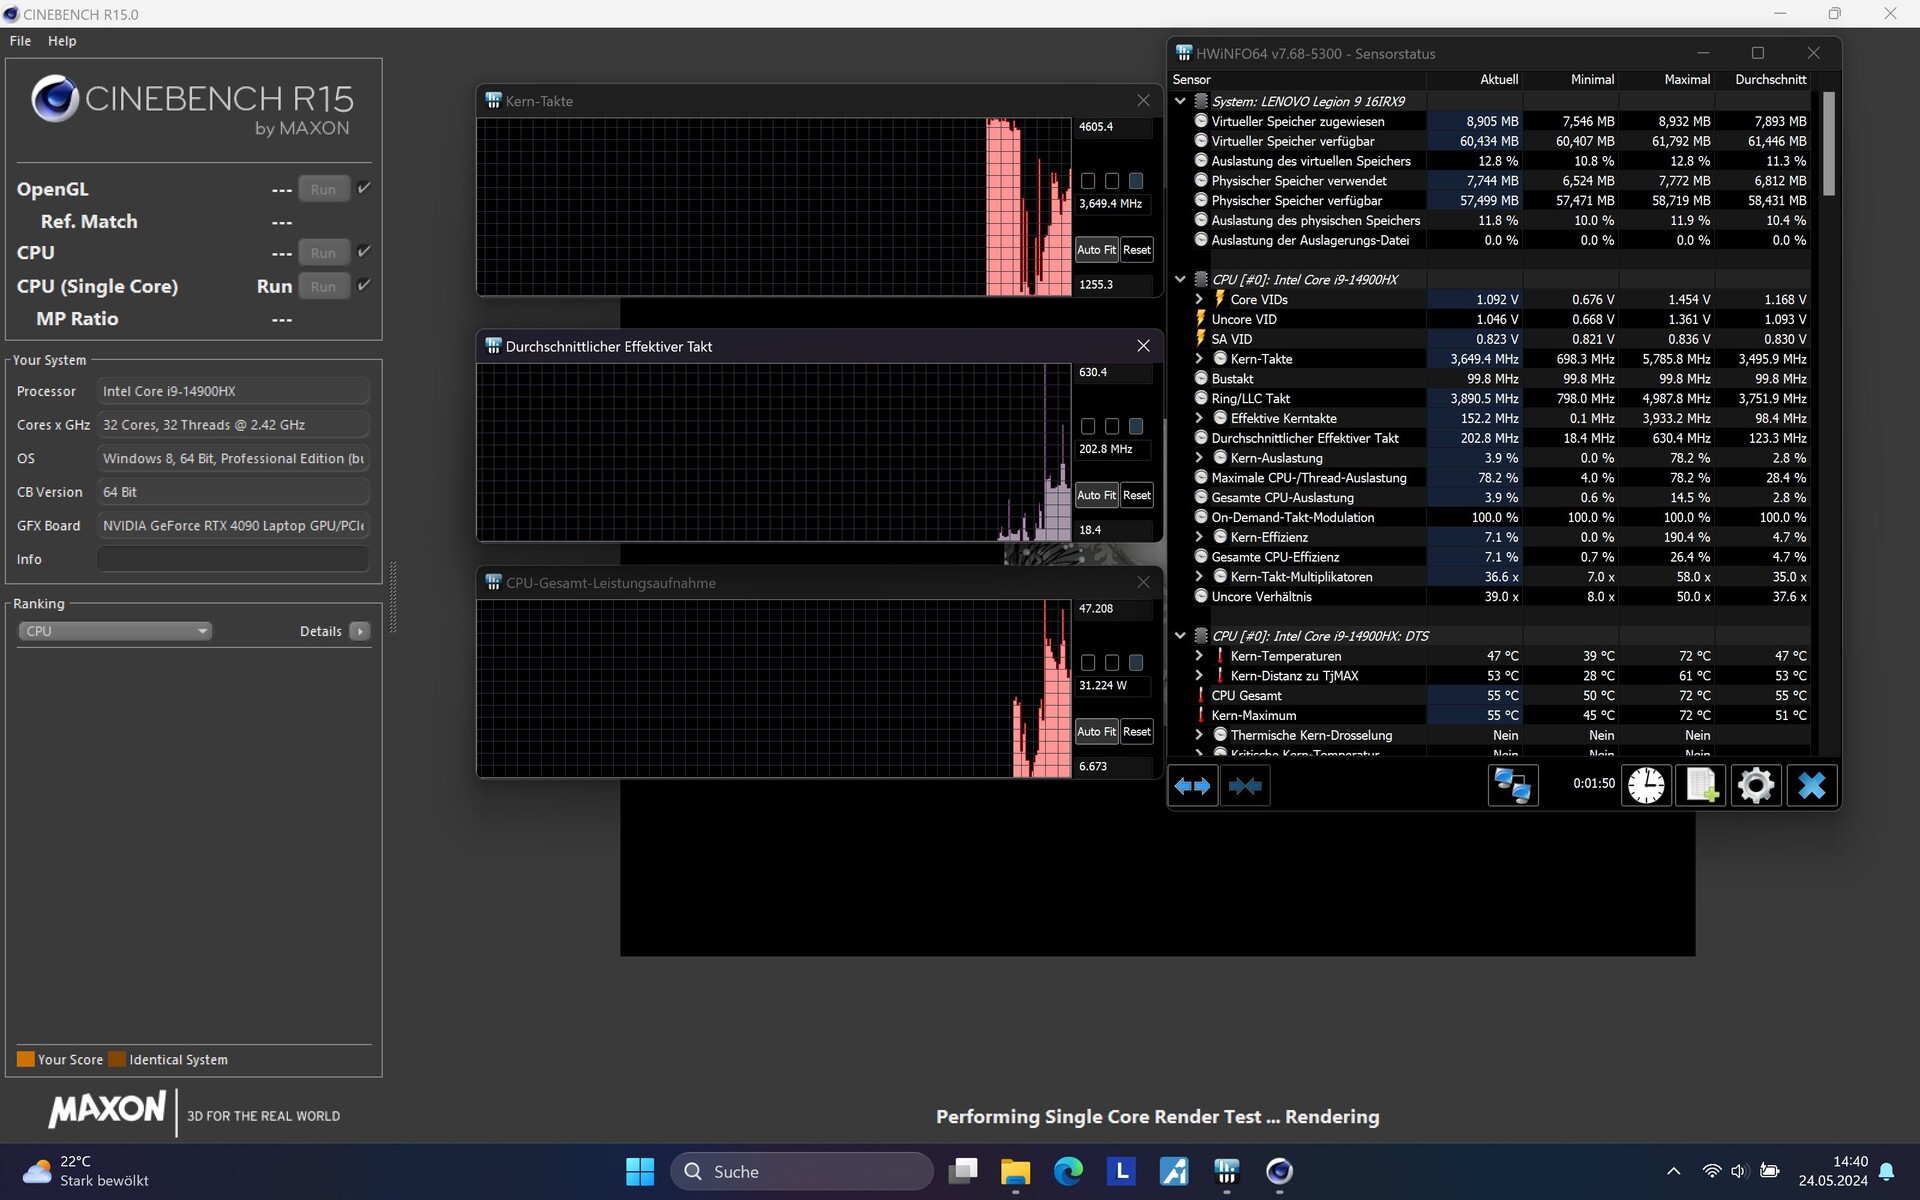
Legion 9i tüm CPU kıyaslamalarında tek çekirdek performansı söz konusu olduğunda açıkça zayıflamıştır. Bu tekrarlanabilir bir durumdu; görünüşe göre tek çekirdekli performans rezervleri Performans modunda tükenmiyor, bunun için Özelleştirilmiş modu kullanarak anahtar rakamları manuel olarak artırmanız gerekiyor.Bu nedenle temel rakamlara bir göz attık: Cinebench R15 Tek Çekirdekte, çekirdek başlangıçta 4,6 GHz'e kadar çıktı. Yaklaşık 50 saniye sonra, çekirdek saati kısa bir süreliğine 1,2 GHz'e düştü ve ardından 3 ila 3,5 GHz arasında sabitlendi. TDP 30 watt civarındaydı. Başka bir testte, düşüş önemli ölçüde daha az belirgindi.
Elektrik fişi çekildiğinde, Cinebench R15'teki çoklu iş parçacığı performansı yaklaşık yüzde 48,5 oranında düştü, yani dizüstü bilgisayarı şebekeye bağlı kullanmaya kıyasla neredeyse yarı yarıya!
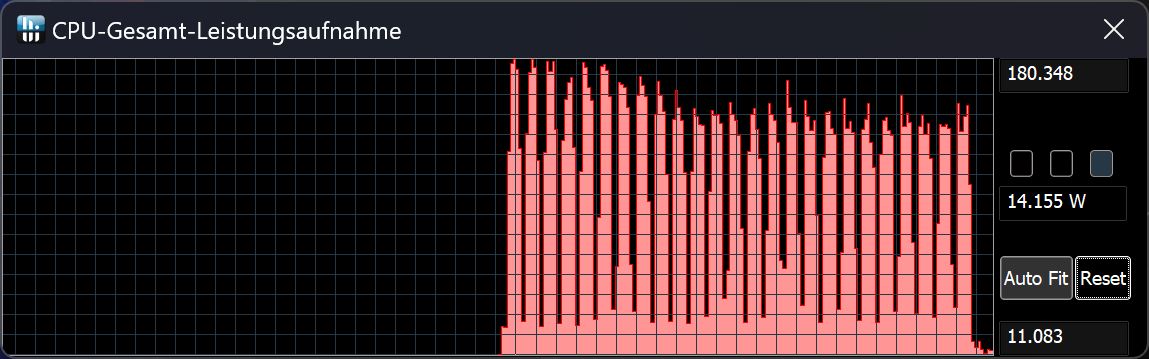
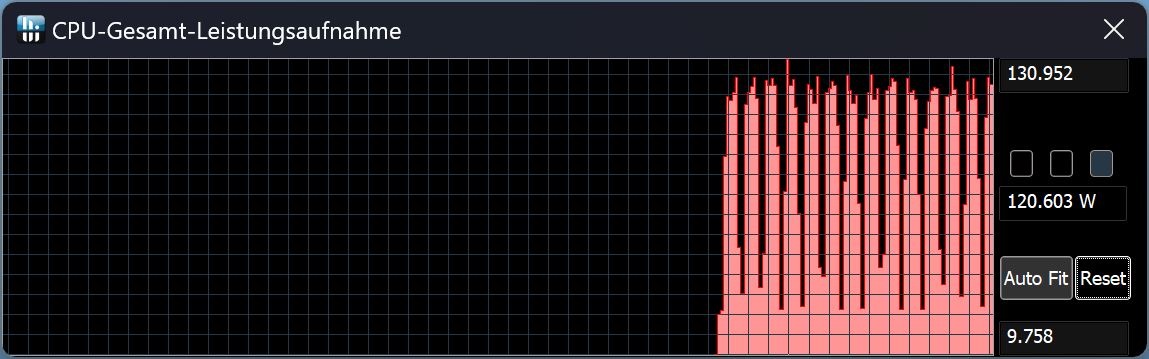
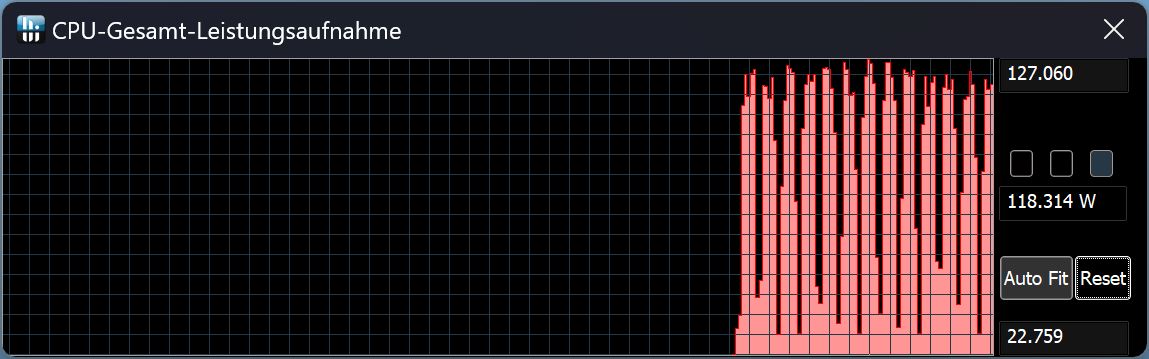
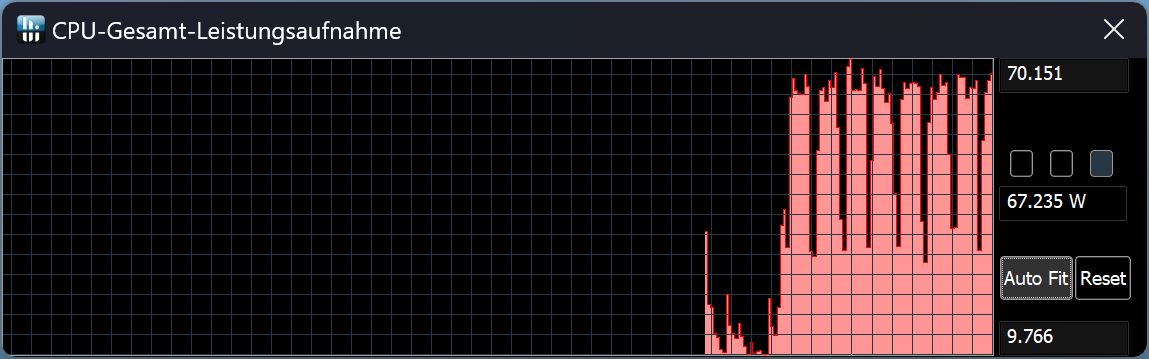
| Performans profili/ölçüm değeri | Cinebench-15-Score 1. çalıştırma | Watt cinsinden CPU güç tüketimi |
|---|---|---|
| CPU hız aşırtması olmadan performans | 4,879 | 140 - 180 |
| AI ile dengeli | 4,115 | 120 - 130 |
| AI olmadan dengeli | 4,091 | 115 - 127 |
| Sessiz | 2,938 | 65 - 70 |
| Batarya | 2,516 | 40 - 58 |
Cinebench R15 Multi continuous test
Cinebench R23: Multi Core | Single Core
Cinebench R20: CPU (Multi Core) | CPU (Single Core)
Cinebench R15: CPU Multi 64Bit | CPU Single 64Bit
Blender: v2.79 BMW27 CPU
7-Zip 18.03: 7z b 4 | 7z b 4 -mmt1
Geekbench 6.4: Multi-Core | Single-Core
Geekbench 5.5: Multi-Core | Single-Core
HWBOT x265 Benchmark v2.2: 4k Preset
LibreOffice : 20 Documents To PDF
R Benchmark 2.5: Overall mean
| CPU Performance Rating | |
| Alienware m18 R2 | |
| Lenovo Legion 9 16IRX8 | |
| Razer Blade 16 2024, RTX 4090 | |
| Asus ROG Strix Scar 18 G834JYR (2024) | |
| Ortalama Intel Core i9-14900HX | |
| Lenovo Legion 9 16IRX9, RTX 4090 | |
| Medion Erazer Beast X40 2024 | |
| Sınıf ortalaması Gaming | |
| Cinebench R23 / Multi Core | |
| Lenovo Legion 9 16IRX9, RTX 4090 | |
| Alienware m18 R2 | |
| Lenovo Legion 9 16IRX8 | |
| Razer Blade 16 2024, RTX 4090 | |
| Ortalama Intel Core i9-14900HX (17078 - 36249, n=37) | |
| Asus ROG Strix Scar 18 G834JYR (2024) | |
| Medion Erazer Beast X40 2024 | |
| Sınıf ortalaması Gaming (5668 - 39652, n=154, son 2 yıl) | |
| Cinebench R23 / Single Core | |
| Alienware m18 R2 | |
| Medion Erazer Beast X40 2024 | |
| Asus ROG Strix Scar 18 G834JYR (2024) | |
| Ortalama Intel Core i9-14900HX (1720 - 2245, n=37) | |
| Lenovo Legion 9 16IRX8 | |
| Razer Blade 16 2024, RTX 4090 | |
| Sınıf ortalaması Gaming (1136 - 2252, n=154, son 2 yıl) | |
| Lenovo Legion 9 16IRX9, RTX 4090 | |
| Cinebench R20 / CPU (Multi Core) | |
| Lenovo Legion 9 16IRX9, RTX 4090 | |
| Alienware m18 R2 | |
| Lenovo Legion 9 16IRX8 | |
| Ortalama Intel Core i9-14900HX (6579 - 13832, n=37) | |
| Razer Blade 16 2024, RTX 4090 | |
| Asus ROG Strix Scar 18 G834JYR (2024) | |
| Medion Erazer Beast X40 2024 | |
| Sınıf ortalaması Gaming (2179 - 15517, n=154, son 2 yıl) | |
| Cinebench R20 / CPU (Single Core) | |
| Medion Erazer Beast X40 2024 | |
| Alienware m18 R2 | |
| Asus ROG Strix Scar 18 G834JYR (2024) | |
| Ortalama Intel Core i9-14900HX (657 - 859, n=37) | |
| Razer Blade 16 2024, RTX 4090 | |
| Sınıf ortalaması Gaming (439 - 866, n=154, son 2 yıl) | |
| Lenovo Legion 9 16IRX8 | |
| Lenovo Legion 9 16IRX9, RTX 4090 | |
| Cinebench R15 / CPU Multi 64Bit | |
| Lenovo Legion 9 16IRX9, RTX 4090 | |
| Alienware m18 R2 | |
| Lenovo Legion 9 16IRX8 | |
| Razer Blade 16 2024, RTX 4090 | |
| Ortalama Intel Core i9-14900HX (3263 - 5589, n=38) | |
| Asus ROG Strix Scar 18 G834JYR (2024) | |
| Sınıf ortalaması Gaming (905 - 6074, n=157, son 2 yıl) | |
| Medion Erazer Beast X40 2024 | |
| Cinebench R15 / CPU Single 64Bit | |
| Alienware m18 R2 | |
| Medion Erazer Beast X40 2024 | |
| Razer Blade 16 2024, RTX 4090 | |
| Ortalama Intel Core i9-14900HX (247 - 323, n=37) | |
| Lenovo Legion 9 16IRX8 | |
| Asus ROG Strix Scar 18 G834JYR (2024) | |
| Sınıf ortalaması Gaming (191.9 - 343, n=154, son 2 yıl) | |
| Lenovo Legion 9 16IRX9, RTX 4090 | |
| Blender / v2.79 BMW27 CPU | |
| Sınıf ortalaması Gaming (81 - 555, n=147, son 2 yıl) | |
| Medion Erazer Beast X40 2024 | |
| Ortalama Intel Core i9-14900HX (91 - 206, n=37) | |
| Asus ROG Strix Scar 18 G834JYR (2024) | |
| Razer Blade 16 2024, RTX 4090 | |
| Lenovo Legion 9 16IRX9, RTX 4090 | |
| Lenovo Legion 9 16IRX8 | |
| Alienware m18 R2 | |
| 7-Zip 18.03 / 7z b 4 | |
| Lenovo Legion 9 16IRX9, RTX 4090 | |
| Alienware m18 R2 | |
| Lenovo Legion 9 16IRX8 | |
| Razer Blade 16 2024, RTX 4090 | |
| Asus ROG Strix Scar 18 G834JYR (2024) | |
| Ortalama Intel Core i9-14900HX (66769 - 136645, n=37) | |
| Medion Erazer Beast X40 2024 | |
| Sınıf ortalaması Gaming (23795 - 144064, n=152, son 2 yıl) | |
| 7-Zip 18.03 / 7z b 4 -mmt1 | |
| Medion Erazer Beast X40 2024 | |
| Asus ROG Strix Scar 18 G834JYR (2024) | |
| Alienware m18 R2 | |
| Ortalama Intel Core i9-14900HX (5452 - 7545, n=37) | |
| Razer Blade 16 2024, RTX 4090 | |
| Lenovo Legion 9 16IRX8 | |
| Sınıf ortalaması Gaming (4199 - 7573, n=152, son 2 yıl) | |
| Lenovo Legion 9 16IRX9, RTX 4090 | |
| Geekbench 6.4 / Multi-Core | |
| Alienware m18 R2 | |
| Asus ROG Strix Scar 18 G834JYR (2024) | |
| Razer Blade 16 2024, RTX 4090 | |
| Lenovo Legion 9 16IRX9, RTX 4090 | |
| Lenovo Legion 9 16IRX8 | |
| Ortalama Intel Core i9-14900HX (13158 - 19665, n=37) | |
| Medion Erazer Beast X40 2024 | |
| Sınıf ortalaması Gaming (5340 - 21668, n=123, son 2 yıl) | |
| Geekbench 6.4 / Single-Core | |
| Medion Erazer Beast X40 2024 | |
| Alienware m18 R2 | |
| Asus ROG Strix Scar 18 G834JYR (2024) | |
| Ortalama Intel Core i9-14900HX (2419 - 3129, n=37) | |
| Razer Blade 16 2024, RTX 4090 | |
| Lenovo Legion 9 16IRX8 | |
| Sınıf ortalaması Gaming (1490 - 3219, n=123, son 2 yıl) | |
| Lenovo Legion 9 16IRX9, RTX 4090 | |
| Geekbench 5.5 / Multi-Core | |
| Lenovo Legion 9 16IRX9, RTX 4090 | |
| Alienware m18 R2 | |
| Lenovo Legion 9 16IRX8 | |
| Asus ROG Strix Scar 18 G834JYR (2024) | |
| Ortalama Intel Core i9-14900HX (8618 - 23194, n=37) | |
| Razer Blade 16 2024, RTX 4090 | |
| Medion Erazer Beast X40 2024 | |
| Sınıf ortalaması Gaming (4557 - 25855, n=151, son 2 yıl) | |
| Geekbench 5.5 / Single-Core | |
| Alienware m18 R2 | |
| Medion Erazer Beast X40 2024 | |
| Lenovo Legion 9 16IRX8 | |
| Razer Blade 16 2024, RTX 4090 | |
| Asus ROG Strix Scar 18 G834JYR (2024) | |
| Ortalama Intel Core i9-14900HX (1669 - 2210, n=37) | |
| Sınıf ortalaması Gaming (986 - 2423, n=151, son 2 yıl) | |
| Lenovo Legion 9 16IRX9, RTX 4090 | |
| HWBOT x265 Benchmark v2.2 / 4k Preset | |
| Alienware m18 R2 | |
| Lenovo Legion 9 16IRX8 | |
| Lenovo Legion 9 16IRX9, RTX 4090 | |
| Razer Blade 16 2024, RTX 4090 | |
| Ortalama Intel Core i9-14900HX (16.8 - 38.9, n=37) | |
| Asus ROG Strix Scar 18 G834JYR (2024) | |
| Medion Erazer Beast X40 2024 | |
| Sınıf ortalaması Gaming (6.72 - 42.9, n=151, son 2 yıl) | |
| LibreOffice / 20 Documents To PDF | |
| Lenovo Legion 9 16IRX9, RTX 4090 | |
| Sınıf ortalaması Gaming (19 - 96.6, n=150, son 2 yıl) | |
| Razer Blade 16 2024, RTX 4090 | |
| Alienware m18 R2 | |
| Asus ROG Strix Scar 18 G834JYR (2024) | |
| Medion Erazer Beast X40 2024 | |
| Ortalama Intel Core i9-14900HX (19 - 85.1, n=37) | |
| Lenovo Legion 9 16IRX8 | |
| R Benchmark 2.5 / Overall mean | |
| Lenovo Legion 9 16IRX9, RTX 4090 | |
| Sınıf ortalaması Gaming (0.3609 - 0.759, n=153, son 2 yıl) | |
| Asus ROG Strix Scar 18 G834JYR (2024) | |
| Ortalama Intel Core i9-14900HX (0.3604 - 0.4859, n=37) | |
| Lenovo Legion 9 16IRX8 | |
| Razer Blade 16 2024, RTX 4090 | |
| Alienware m18 R2 | |
| Medion Erazer Beast X40 2024 | |
* ... daha küçük daha iyidir
AIDA64: FP32 Ray-Trace | FPU Julia | CPU SHA3 | CPU Queen | FPU SinJulia | FPU Mandel | CPU AES | CPU ZLib | FP64 Ray-Trace | CPU PhotoWorxx
| Performance Rating | |
| Alienware m18 R2 | |
| Lenovo Legion 9 16IRX9, RTX 4090 | |
| Lenovo Legion 9 16IRX8 | |
| Razer Blade 16 2024, RTX 4090 | |
| Asus ROG Strix Scar 18 G834JYR (2024) | |
| Ortalama Intel Core i9-14900HX | |
| Medion Erazer Beast X40 2024 | |
| Sınıf ortalaması Gaming | |
| AIDA64 / FP32 Ray-Trace | |
| Alienware m18 R2 | |
| Lenovo Legion 9 16IRX9, RTX 4090 | |
| Lenovo Legion 9 16IRX8 | |
| Razer Blade 16 2024, RTX 4090 | |
| Asus ROG Strix Scar 18 G834JYR (2024) | |
| Ortalama Intel Core i9-14900HX (13098 - 33474, n=36) | |
| Sınıf ortalaması Gaming (4986 - 81639, n=150, son 2 yıl) | |
| Medion Erazer Beast X40 2024 | |
| AIDA64 / FPU Julia | |
| Alienware m18 R2 | |
| Lenovo Legion 9 16IRX9, RTX 4090 | |
| Lenovo Legion 9 16IRX8 | |
| Asus ROG Strix Scar 18 G834JYR (2024) | |
| Razer Blade 16 2024, RTX 4090 | |
| Ortalama Intel Core i9-14900HX (67573 - 166040, n=36) | |
| Sınıf ortalaması Gaming (25360 - 252486, n=150, son 2 yıl) | |
| Medion Erazer Beast X40 2024 | |
| AIDA64 / CPU SHA3 | |
| Alienware m18 R2 | |
| Lenovo Legion 9 16IRX9, RTX 4090 | |
| Lenovo Legion 9 16IRX8 | |
| Asus ROG Strix Scar 18 G834JYR (2024) | |
| Razer Blade 16 2024, RTX 4090 | |
| Ortalama Intel Core i9-14900HX (3589 - 7979, n=36) | |
| Sınıf ortalaması Gaming (1339 - 10389, n=150, son 2 yıl) | |
| Medion Erazer Beast X40 2024 | |
| AIDA64 / CPU Queen | |
| Asus ROG Strix Scar 18 G834JYR (2024) | |
| Alienware m18 R2 | |
| Razer Blade 16 2024, RTX 4090 | |
| Ortalama Intel Core i9-14900HX (118405 - 148966, n=36) | |
| Lenovo Legion 9 16IRX8 | |
| Medion Erazer Beast X40 2024 | |
| Lenovo Legion 9 16IRX9, RTX 4090 | |
| Sınıf ortalaması Gaming (50699 - 200651, n=150, son 2 yıl) | |
| AIDA64 / FPU SinJulia | |
| Alienware m18 R2 | |
| Lenovo Legion 9 16IRX9, RTX 4090 | |
| Asus ROG Strix Scar 18 G834JYR (2024) | |
| Razer Blade 16 2024, RTX 4090 | |
| Lenovo Legion 9 16IRX8 | |
| Ortalama Intel Core i9-14900HX (10475 - 18517, n=36) | |
| Medion Erazer Beast X40 2024 | |
| Sınıf ortalaması Gaming (4800 - 32988, n=150, son 2 yıl) | |
| AIDA64 / FPU Mandel | |
| Alienware m18 R2 | |
| Lenovo Legion 9 16IRX9, RTX 4090 | |
| Lenovo Legion 9 16IRX8 | |
| Razer Blade 16 2024, RTX 4090 | |
| Asus ROG Strix Scar 18 G834JYR (2024) | |
| Ortalama Intel Core i9-14900HX (32543 - 83662, n=36) | |
| Sınıf ortalaması Gaming (12321 - 134044, n=150, son 2 yıl) | |
| Medion Erazer Beast X40 2024 | |
| AIDA64 / CPU AES | |
| Ortalama Intel Core i9-14900HX (86964 - 241777, n=36) | |
| Alienware m18 R2 | |
| Lenovo Legion 9 16IRX9, RTX 4090 | |
| Lenovo Legion 9 16IRX8 | |
| Razer Blade 16 2024, RTX 4090 | |
| Asus ROG Strix Scar 18 G834JYR (2024) | |
| Sınıf ortalaması Gaming (19065 - 328679, n=150, son 2 yıl) | |
| Medion Erazer Beast X40 2024 | |
| AIDA64 / CPU ZLib | |
| Alienware m18 R2 | |
| Lenovo Legion 9 16IRX9, RTX 4090 | |
| Lenovo Legion 9 16IRX8 | |
| Razer Blade 16 2024, RTX 4090 | |
| Ortalama Intel Core i9-14900HX (1054 - 2292, n=36) | |
| Asus ROG Strix Scar 18 G834JYR (2024) | |
| Medion Erazer Beast X40 2024 | |
| Sınıf ortalaması Gaming (373 - 2531, n=150, son 2 yıl) | |
| AIDA64 / FP64 Ray-Trace | |
| Alienware m18 R2 | |
| Lenovo Legion 9 16IRX8 | |
| Lenovo Legion 9 16IRX9, RTX 4090 | |
| Razer Blade 16 2024, RTX 4090 | |
| Asus ROG Strix Scar 18 G834JYR (2024) | |
| Ortalama Intel Core i9-14900HX (6809 - 18349, n=36) | |
| Sınıf ortalaması Gaming (2540 - 43430, n=150, son 2 yıl) | |
| Medion Erazer Beast X40 2024 | |
| AIDA64 / CPU PhotoWorxx | |
| Lenovo Legion 9 16IRX9, RTX 4090 | |
| Lenovo Legion 9 16IRX8 | |
| Alienware m18 R2 | |
| Asus ROG Strix Scar 18 G834JYR (2024) | |
| Razer Blade 16 2024, RTX 4090 | |
| Medion Erazer Beast X40 2024 | |
| Ortalama Intel Core i9-14900HX (23903 - 54702, n=36) | |
| Sınıf ortalaması Gaming (10805 - 60161, n=150, son 2 yıl) | |
Sistem performansı
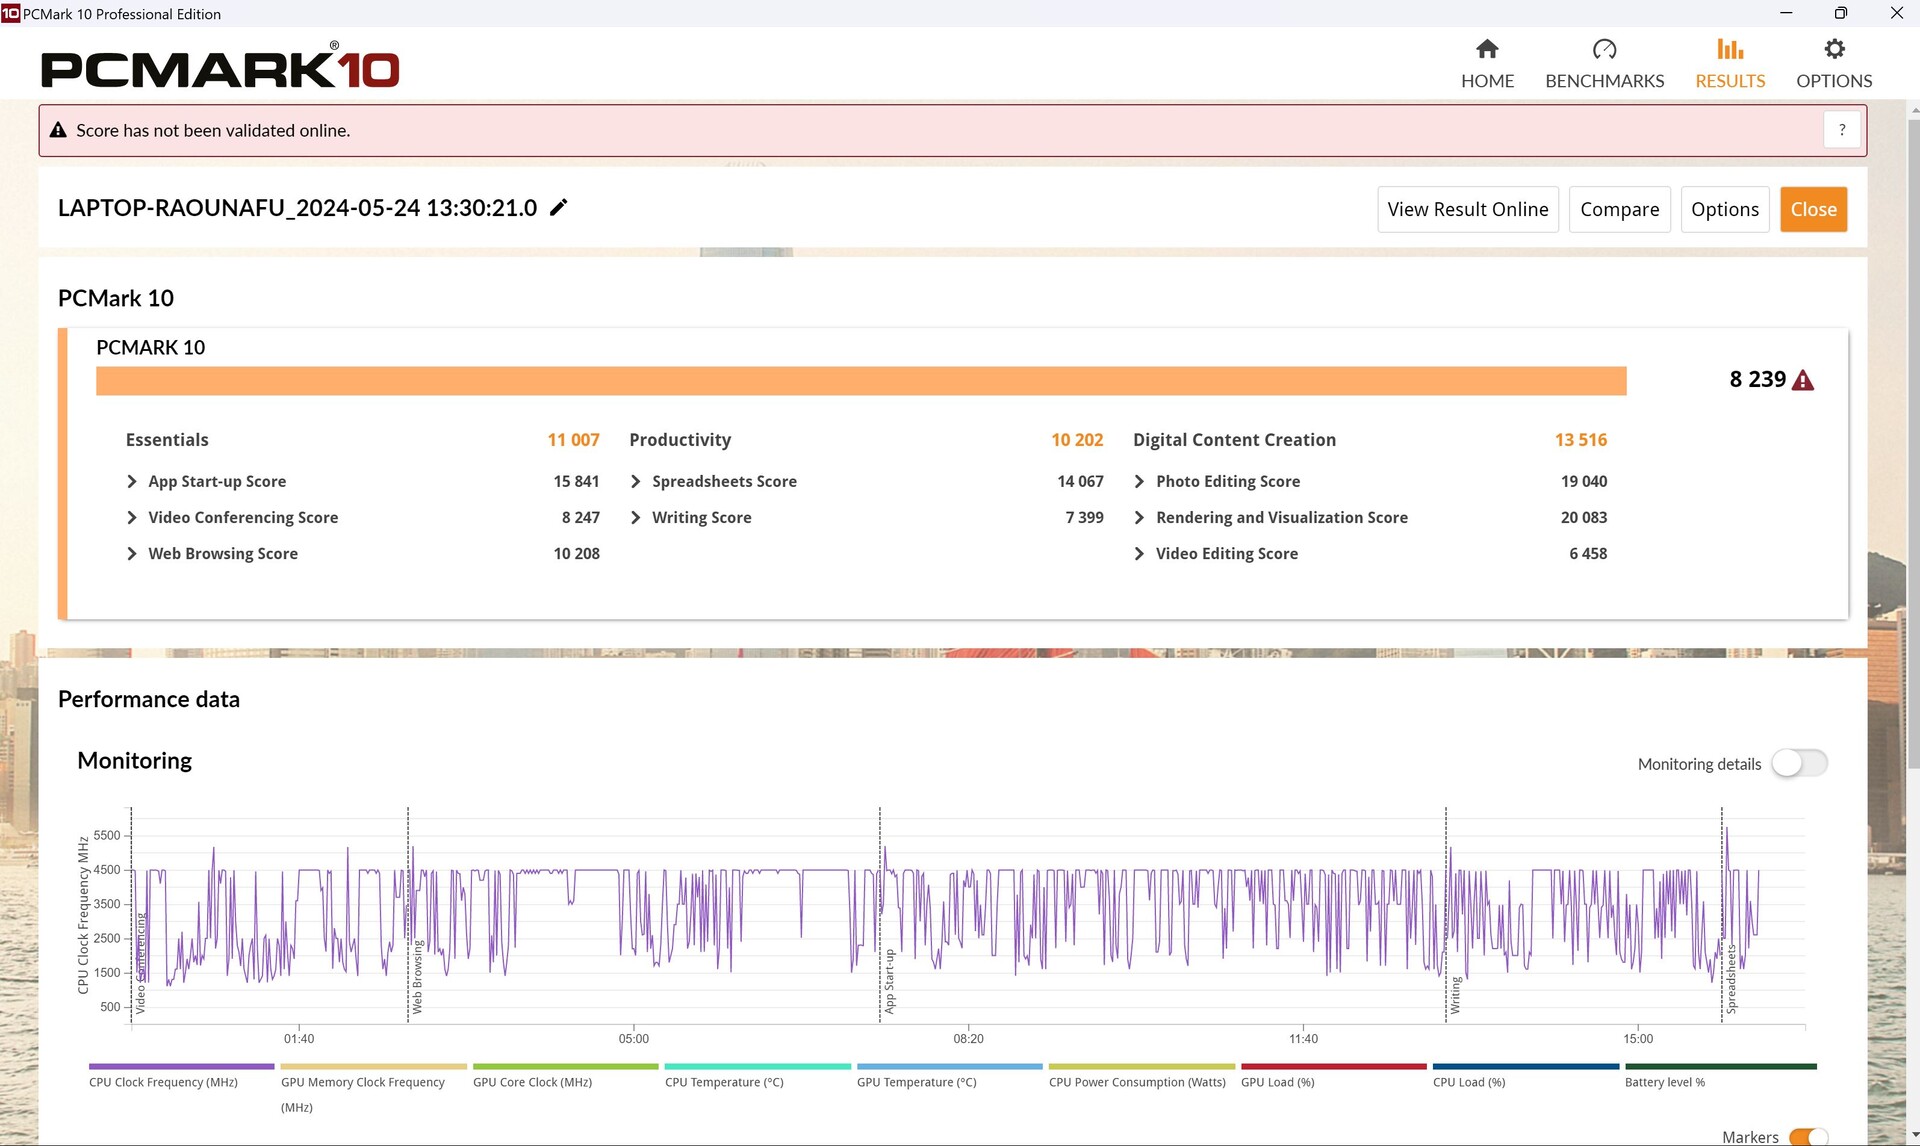
PCMark 10'daki performansı, aynı CPU/GPU kombinasyonuna sahip ortalama bir dizüstü bilgisayarın yaklaşık yüzde 5 altında kaldı. Aida ayrıca RAM'inin iyi okuma ve yazma hızları sunmasına rağmen, bellek gecikmesinin alışılmadık derecede yüksek olduğunu ve burada olduğu gibi bazı kıyaslamalarda beklenenden daha kötü sonuçlara yol açtığını gösterdi.
Öznel olarak, dizüstü bilgisayarın çoğu zaman sorunsuz çalışmasına rağmen, oyun çalıştırırken zaman zaman "aksadığını" fark ettik. Bu durum, örneğin Far Cry 5'in kare hızı grafiğinde de teyit edildi; kare hızı kısa süreliğine düşüyor ve bu durum daha sık meydana geliyor gibi görünüyor. DPC gecikme süreleri de oldukça yüksek, bir sonraki bölüme bakın. Web uygulamalarını kullanarak elde ettiği sonuçlar da sürekli olarak zayıftı.
CrossMark: Overall | Productivity | Creativity | Responsiveness
WebXPRT 3: Overall
WebXPRT 4: Overall
Mozilla Kraken 1.1: Total
| PCMark 10 / Score | |
| Alienware m18 R2 | |
| Lenovo Legion 9 16IRX8 | |
| Medion Erazer Beast X40 2024 | |
| Asus ROG Strix Scar 18 G834JYR (2024) | |
| Ortalama Intel Core i9-14900HX, NVIDIA GeForce RTX 4090 Laptop GPU (8230 - 9234, n=13) | |
| Razer Blade 16 2024, RTX 4090 | |
| Lenovo Legion 9 16IRX9, RTX 4090 | |
| Sınıf ortalaması Gaming (5776 - 9852, n=134, son 2 yıl) | |
| PCMark 10 / Essentials | |
| Lenovo Legion 9 16IRX8 | |
| Alienware m18 R2 | |
| Asus ROG Strix Scar 18 G834JYR (2024) | |
| Ortalama Intel Core i9-14900HX, NVIDIA GeForce RTX 4090 Laptop GPU (10778 - 11628, n=13) | |
| Lenovo Legion 9 16IRX9, RTX 4090 | |
| Razer Blade 16 2024, RTX 4090 | |
| Medion Erazer Beast X40 2024 | |
| Sınıf ortalaması Gaming (9057 - 12600, n=134, son 2 yıl) | |
| PCMark 10 / Productivity | |
| Medion Erazer Beast X40 2024 | |
| Alienware m18 R2 | |
| Razer Blade 16 2024, RTX 4090 | |
| Lenovo Legion 9 16IRX8 | |
| Ortalama Intel Core i9-14900HX, NVIDIA GeForce RTX 4090 Laptop GPU (9458 - 11759, n=13) | |
| Asus ROG Strix Scar 18 G834JYR (2024) | |
| Lenovo Legion 9 16IRX9, RTX 4090 | |
| Sınıf ortalaması Gaming (6662 - 14612, n=134, son 2 yıl) | |
| PCMark 10 / Digital Content Creation | |
| Alienware m18 R2 | |
| Lenovo Legion 9 16IRX8 | |
| Asus ROG Strix Scar 18 G834JYR (2024) | |
| Medion Erazer Beast X40 2024 | |
| Ortalama Intel Core i9-14900HX, NVIDIA GeForce RTX 4090 Laptop GPU (13219 - 16462, n=13) | |
| Lenovo Legion 9 16IRX9, RTX 4090 | |
| Razer Blade 16 2024, RTX 4090 | |
| Sınıf ortalaması Gaming (6807 - 19351, n=134, son 2 yıl) | |
| CrossMark / Overall | |
| Asus ROG Strix Scar 18 G834JYR (2024) | |
| Razer Blade 16 2024, RTX 4090 | |
| Medion Erazer Beast X40 2024 | |
| Ortalama Intel Core i9-14900HX, NVIDIA GeForce RTX 4090 Laptop GPU (1877 - 2344, n=10) | |
| Alienware m18 R2 | |
| Lenovo Legion 9 16IRX9, RTX 4090 | |
| Lenovo Legion 9 16IRX8 | |
| Sınıf ortalaması Gaming (1247 - 2344, n=114, son 2 yıl) | |
| CrossMark / Productivity | |
| Medion Erazer Beast X40 2024 | |
| Asus ROG Strix Scar 18 G834JYR (2024) | |
| Razer Blade 16 2024, RTX 4090 | |
| Ortalama Intel Core i9-14900HX, NVIDIA GeForce RTX 4090 Laptop GPU (1738 - 2162, n=10) | |
| Alienware m18 R2 | |
| Sınıf ortalaması Gaming (1299 - 2204, n=114, son 2 yıl) | |
| Lenovo Legion 9 16IRX8 | |
| Lenovo Legion 9 16IRX9, RTX 4090 | |
| CrossMark / Creativity | |
| Asus ROG Strix Scar 18 G834JYR (2024) | |
| Razer Blade 16 2024, RTX 4090 | |
| Alienware m18 R2 | |
| Ortalama Intel Core i9-14900HX, NVIDIA GeForce RTX 4090 Laptop GPU (2195 - 2660, n=10) | |
| Medion Erazer Beast X40 2024 | |
| Lenovo Legion 9 16IRX8 | |
| Lenovo Legion 9 16IRX9, RTX 4090 | |
| Sınıf ortalaması Gaming (1275 - 2660, n=114, son 2 yıl) | |
| CrossMark / Responsiveness | |
| Asus ROG Strix Scar 18 G834JYR (2024) | |
| Medion Erazer Beast X40 2024 | |
| Ortalama Intel Core i9-14900HX, NVIDIA GeForce RTX 4090 Laptop GPU (1478 - 2327, n=10) | |
| Razer Blade 16 2024, RTX 4090 | |
| Alienware m18 R2 | |
| Lenovo Legion 9 16IRX9, RTX 4090 | |
| Sınıf ortalaması Gaming (1030 - 2330, n=114, son 2 yıl) | |
| Lenovo Legion 9 16IRX8 | |
| WebXPRT 3 / Overall | |
| Lenovo Legion 9 16IRX8 | |
| Razer Blade 16 2024, RTX 4090 | |
| Medion Erazer Beast X40 2024 | |
| Alienware m18 R2 | |
| Ortalama Intel Core i9-14900HX, NVIDIA GeForce RTX 4090 Laptop GPU (279 - 339, n=10) | |
| Asus ROG Strix Scar 18 G834JYR (2024) | |
| Sınıf ortalaması Gaming (215 - 480, n=130, son 2 yıl) | |
| Lenovo Legion 9 16IRX9, RTX 4090 | |
| WebXPRT 4 / Overall | |
| Alienware m18 R2 | |
| Lenovo Legion 9 16IRX8 | |
| Asus ROG Strix Scar 18 G834JYR (2024) | |
| Medion Erazer Beast X40 2024 | |
| Ortalama Intel Core i9-14900HX, NVIDIA GeForce RTX 4090 Laptop GPU (246 - 309, n=8) | |
| Sınıf ortalaması Gaming (176.4 - 335, n=116, son 2 yıl) | |
| Lenovo Legion 9 16IRX9, RTX 4090 | |
| Mozilla Kraken 1.1 / Total | |
| Lenovo Legion 9 16IRX9, RTX 4090 | |
| Sınıf ortalaması Gaming (408 - 674, n=143, son 2 yıl) | |
| Ortalama Intel Core i9-14900HX, NVIDIA GeForce RTX 4090 Laptop GPU (428 - 535, n=11) | |
| Razer Blade 16 2024, RTX 4090 | |
| Asus ROG Strix Scar 18 G834JYR (2024) | |
| Lenovo Legion 9 16IRX8 | |
| Medion Erazer Beast X40 2024 | |
| Alienware m18 R2 | |
* ... daha küçük daha iyidir
| PCMark 10 Score | 8239 puan | |
Yardım | ||
| AIDA64 / Memory Copy | |
| Asus ROG Strix Scar 18 G834JYR (2024) | |
| Lenovo Legion 9 16IRX9, RTX 4090 | |
| Alienware m18 R2 | |
| Razer Blade 16 2024, RTX 4090 | |
| Lenovo Legion 9 16IRX8 | |
| Medion Erazer Beast X40 2024 | |
| Ortalama Intel Core i9-14900HX (38028 - 83392, n=36) | |
| Sınıf ortalaması Gaming (21750 - 97515, n=150, son 2 yıl) | |
| AIDA64 / Memory Read | |
| Asus ROG Strix Scar 18 G834JYR (2024) | |
| Razer Blade 16 2024, RTX 4090 | |
| Alienware m18 R2 | |
| Lenovo Legion 9 16IRX8 | |
| Medion Erazer Beast X40 2024 | |
| Lenovo Legion 9 16IRX9, RTX 4090 | |
| Ortalama Intel Core i9-14900HX (43306 - 87568, n=36) | |
| Sınıf ortalaması Gaming (22956 - 102937, n=150, son 2 yıl) | |
| AIDA64 / Memory Write | |
| Lenovo Legion 9 16IRX9, RTX 4090 | |
| Asus ROG Strix Scar 18 G834JYR (2024) | |
| Medion Erazer Beast X40 2024 | |
| Alienware m18 R2 | |
| Lenovo Legion 9 16IRX8 | |
| Razer Blade 16 2024, RTX 4090 | |
| Ortalama Intel Core i9-14900HX (37146 - 80589, n=36) | |
| Sınıf ortalaması Gaming (22297 - 108954, n=150, son 2 yıl) | |
| AIDA64 / Memory Latency | |
| Sınıf ortalaması Gaming (59.5 - 259, n=150, son 2 yıl) | |
| Lenovo Legion 9 16IRX9, RTX 4090 | |
| Alienware m18 R2 | |
| Ortalama Intel Core i9-14900HX (76.1 - 105, n=36) | |
| Lenovo Legion 9 16IRX8 | |
| Razer Blade 16 2024, RTX 4090 | |
| Asus ROG Strix Scar 18 G834JYR (2024) | |
| Medion Erazer Beast X40 2024 | |
* ... daha küçük daha iyidir
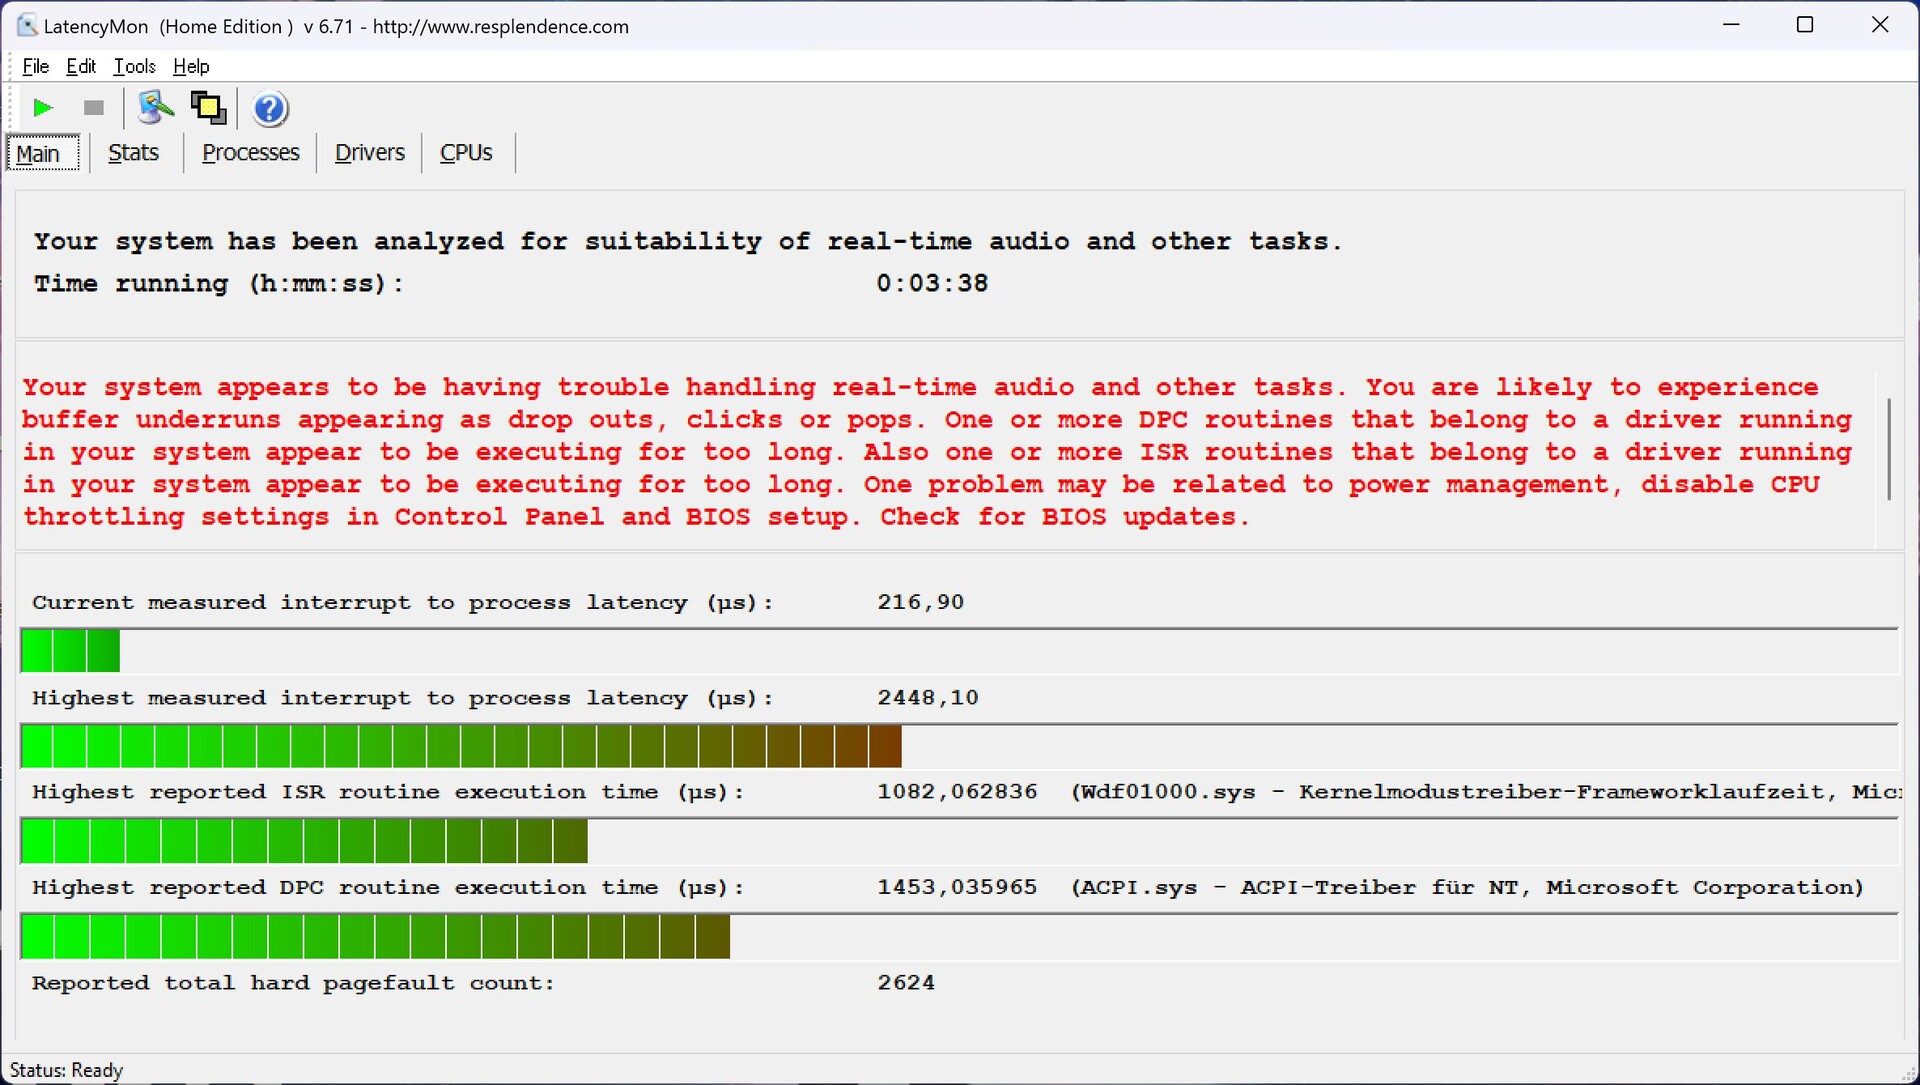
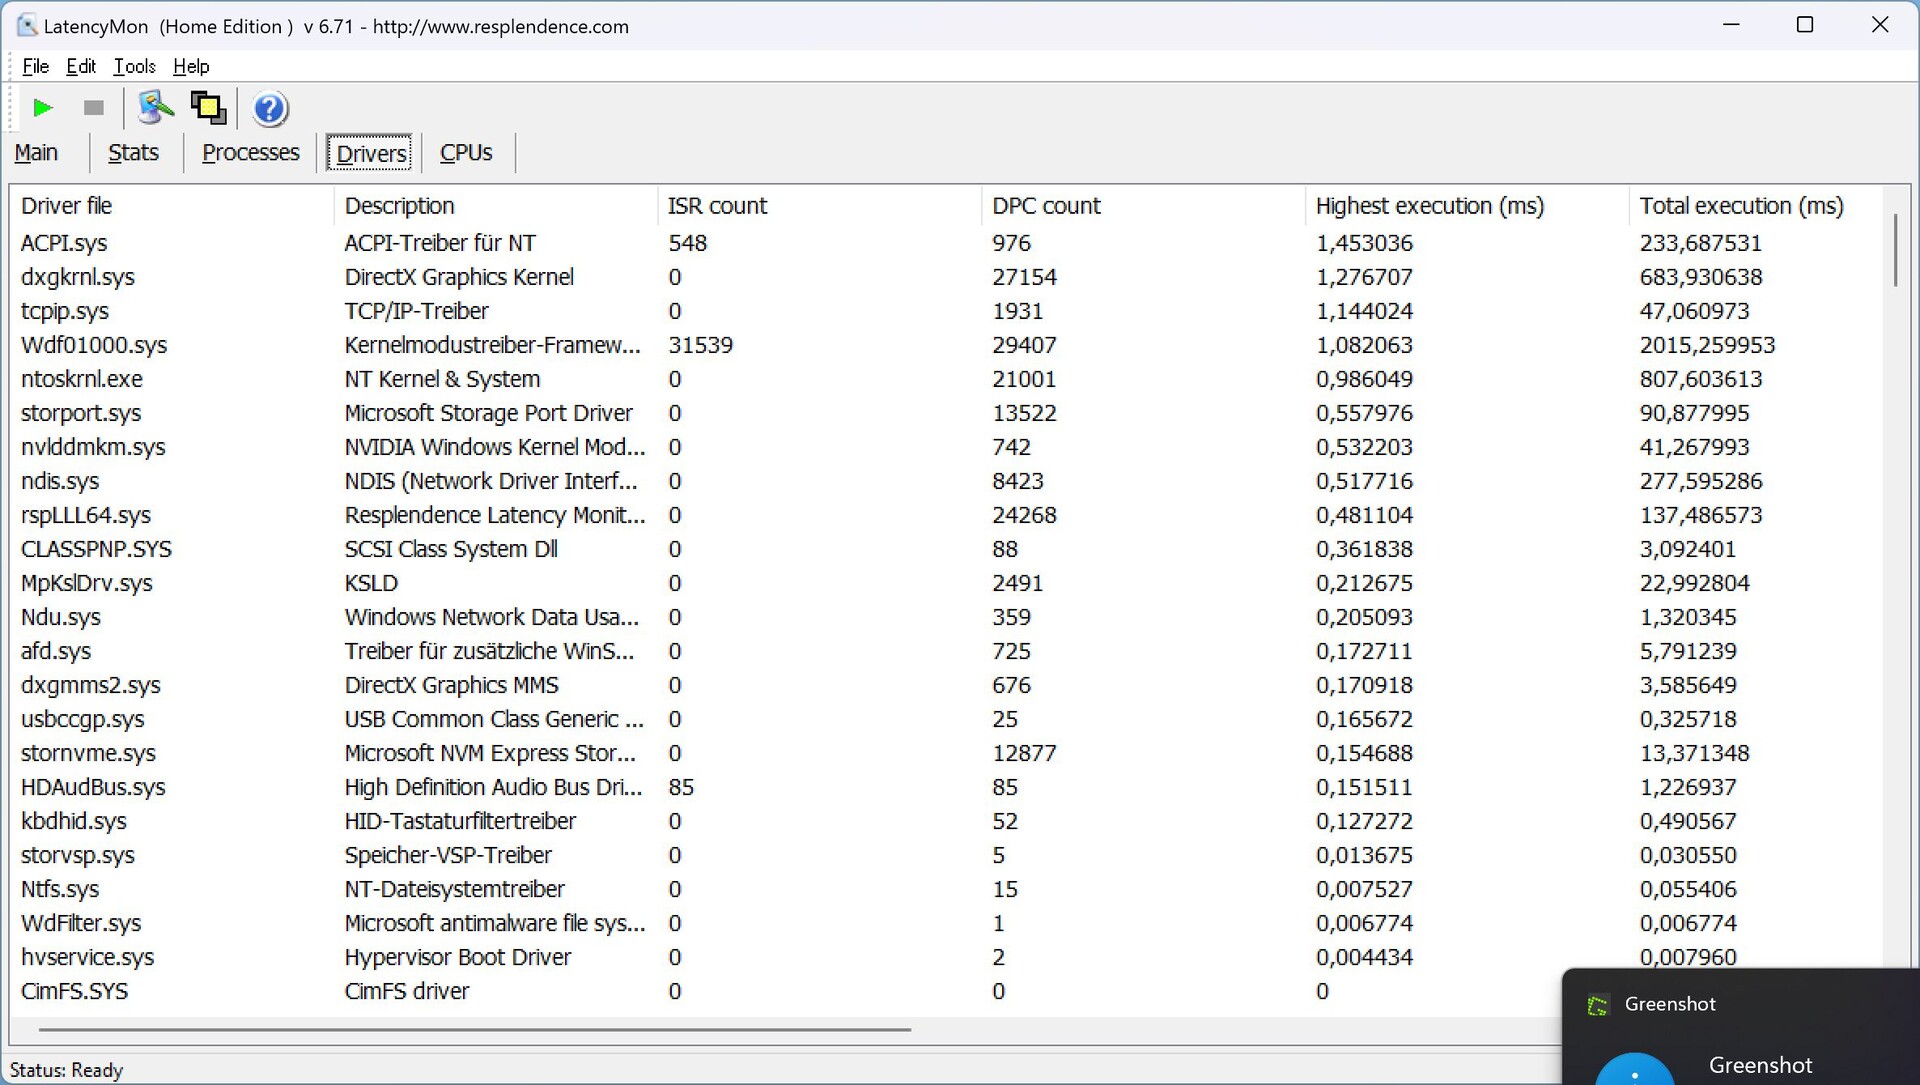
DPC gecikme süreleri
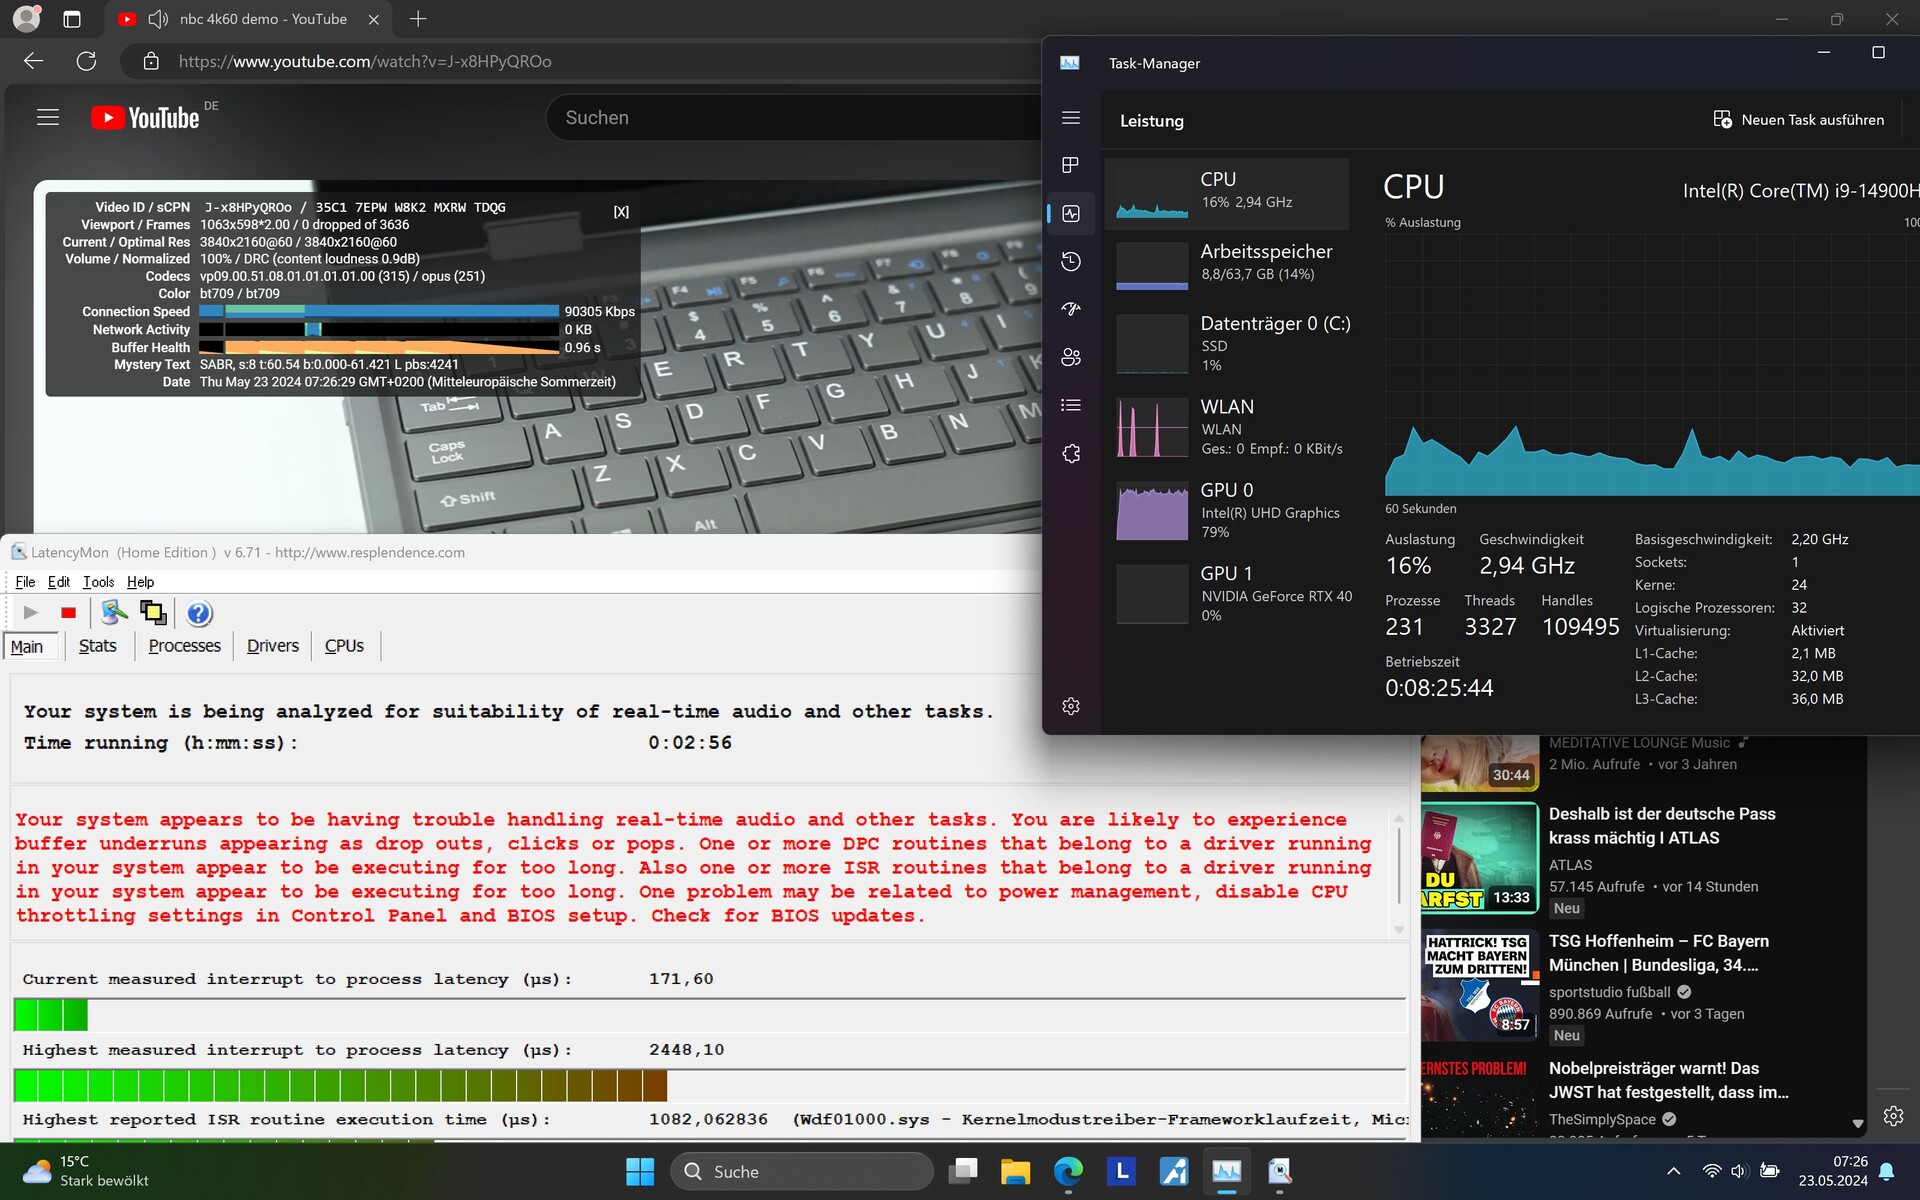
İlk gecikmeler tarayıcı açılır açılmaz meydana geldi. Web sitemizde birkaç sekme açıldığında değer minimum düzeyde arttı. Ancak, gecikme değerinin fırlamasına neden olan şey öncelikle 4K/60 fps YouTube videomuzu oynatmak oldu.
Buna ek olarak, bu durumda aktif olan dahili GPU yükü sürekli olarak alışılmadık derecede yüksek %79 seviyesindeydi; %20 civarında değerler normal olurdu! Yine de, şikayet edilecek hiçbir kare düşmesi yaşanmadı.
| DPC Latencies / LatencyMon - interrupt to process latency (max), Web, Youtube, Prime95 | |
| Alienware m18 R2 | |
| Lenovo Legion 9 16IRX9, RTX 4090 | |
| Lenovo Legion 9 16IRX8 | |
| Razer Blade 16 2024, RTX 4090 | |
| Medion Erazer Beast X40 2024 | |
| Asus ROG Strix Scar 18 G834JYR (2024) | |
* ... daha küçük daha iyidir
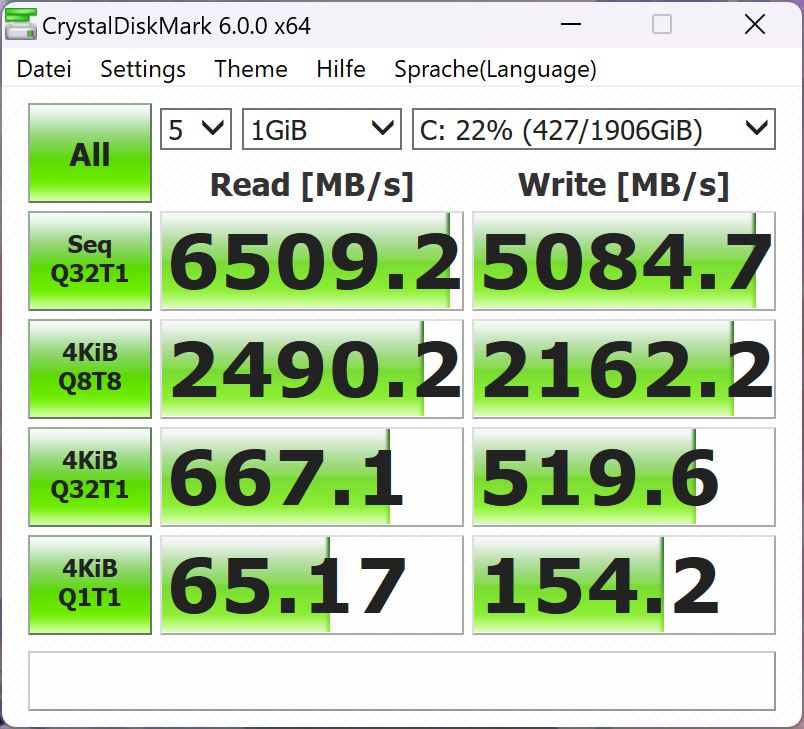
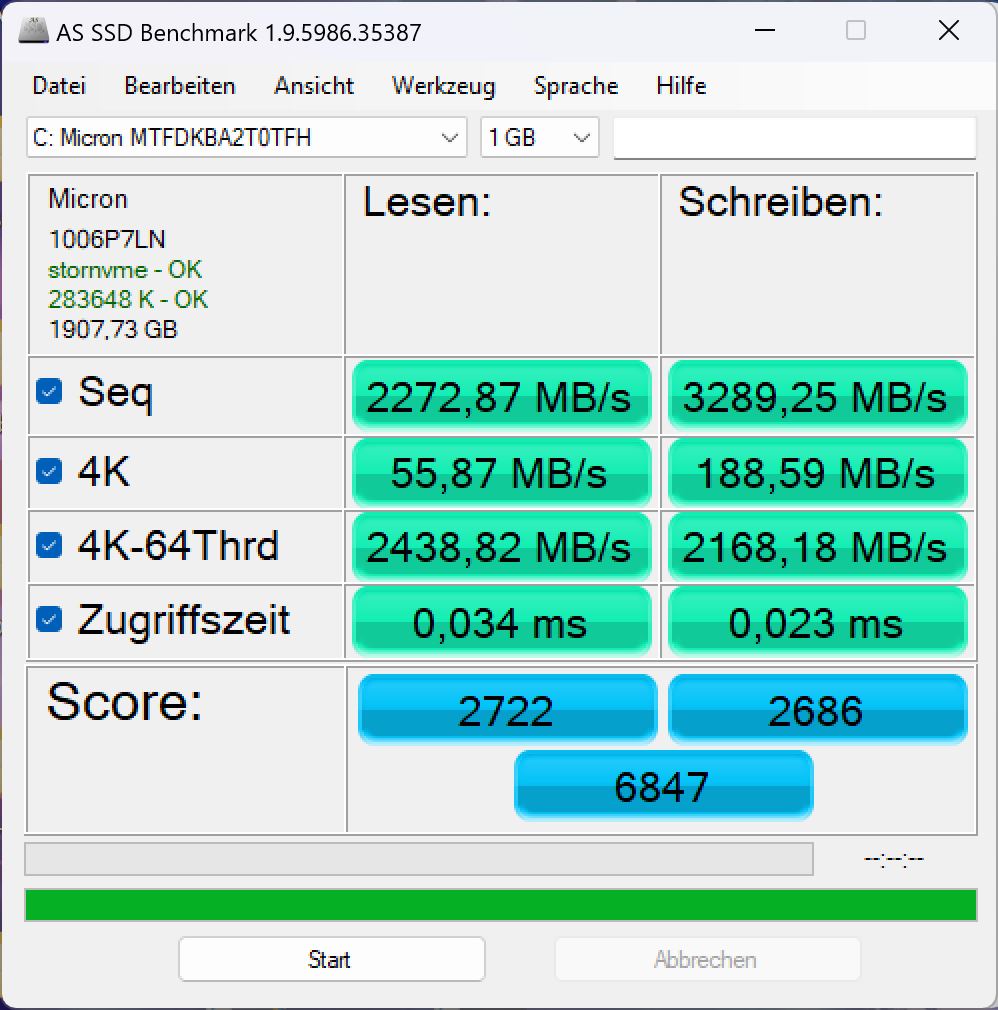
Depolama cihazı
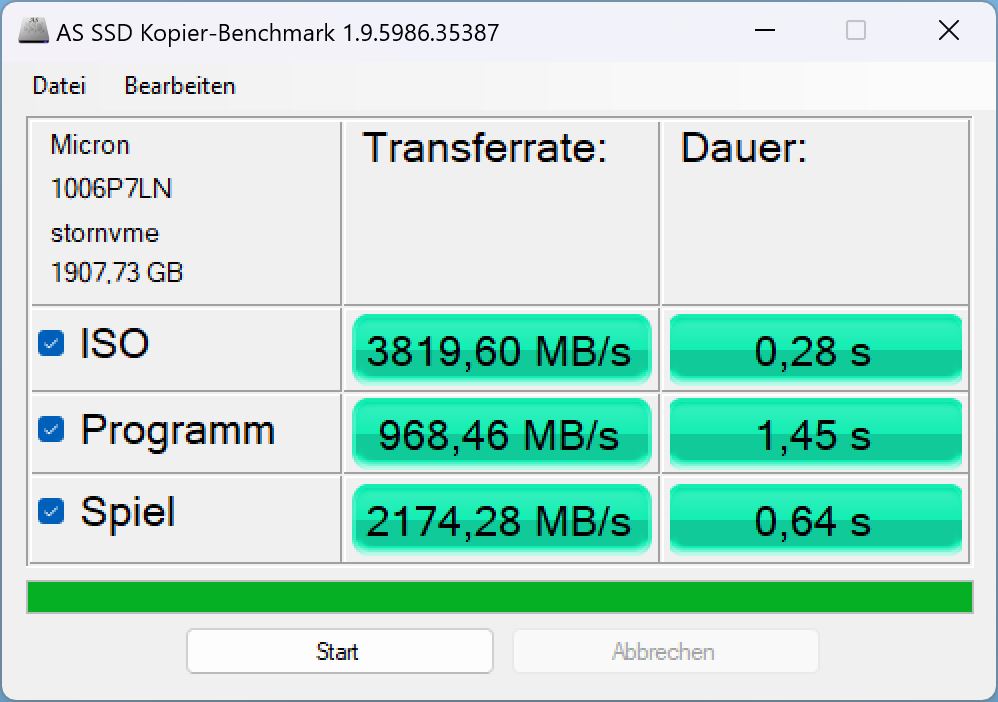
Lenovo, test modelimize 2 TB depolama alanına sahip bir Micron 3400 taktı. Bizim sıralamamızda 121. sırada SSD en iyi listesibu da en iyi ihtimalle orta sınıf olduğu anlamına gelmektedir. Micron'a göre 6.600 MB/sn'ye kadar sıralı okuma ve 5.000 MB/sn'ye kadar sıralı yazma hızlarına ulaşması gerekmektedir ancak modelimiz, veritabanımızdaki aynı SSD'ye sahip ortalama bir dizüstü bilgisayar kadar bundan uzaktı. Sadece Crystaldiskmark yüksek değerleri doğrulayabilirken, DiskSpd ve AS SSD önemli ölçüde daha düşük veri hızları ölçtü.
Dizüstü bilgisayarın sürekli yük davranışı sıra dışıdır: Diğer modeller bazen belirli bir süre sonra ısınır ve ardından yavaşlarken, Legion 9 içindeki depolama cihazı tam tersi şekilde davrandı. Testin başında performansı büyük ölçüde dalgalandı ve tekrar tekrar düştü. Ancak SSD daha sonra testin son üçte ikisi boyunca sürekli olarak maksimum hızda çalışmıştır. Bu, Legion 9i'nin soğutma sisteminin biraz geç devreye girdiğinin ya da optimum soğutma kapasitesine çok geç ulaştığının bir işareti olabilir.

* ... daha küçük daha iyidir
Reading continuous performance: DiskSpd Read Loop, Queue Depth 8
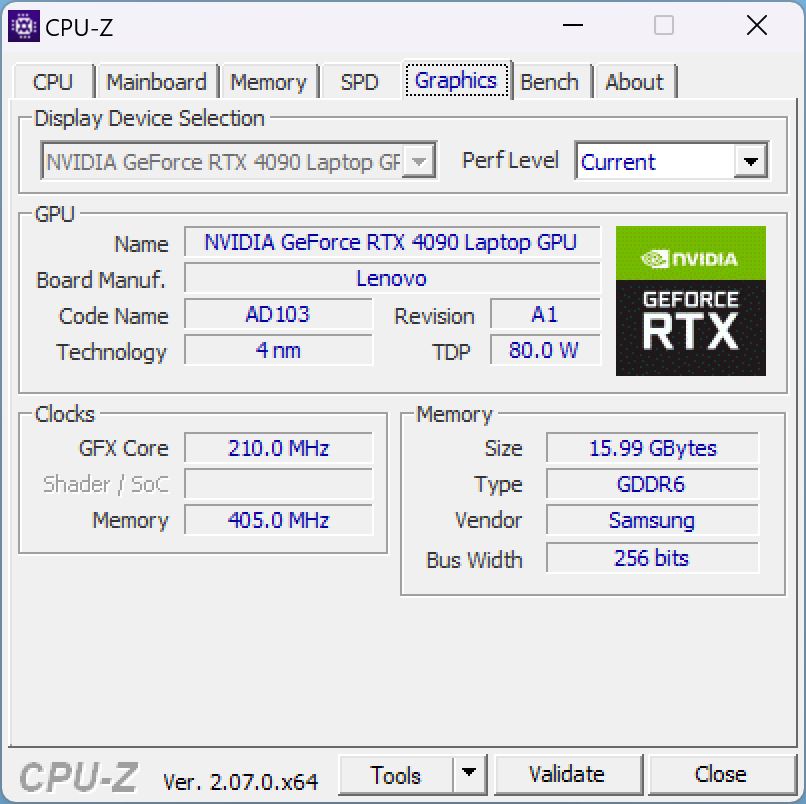
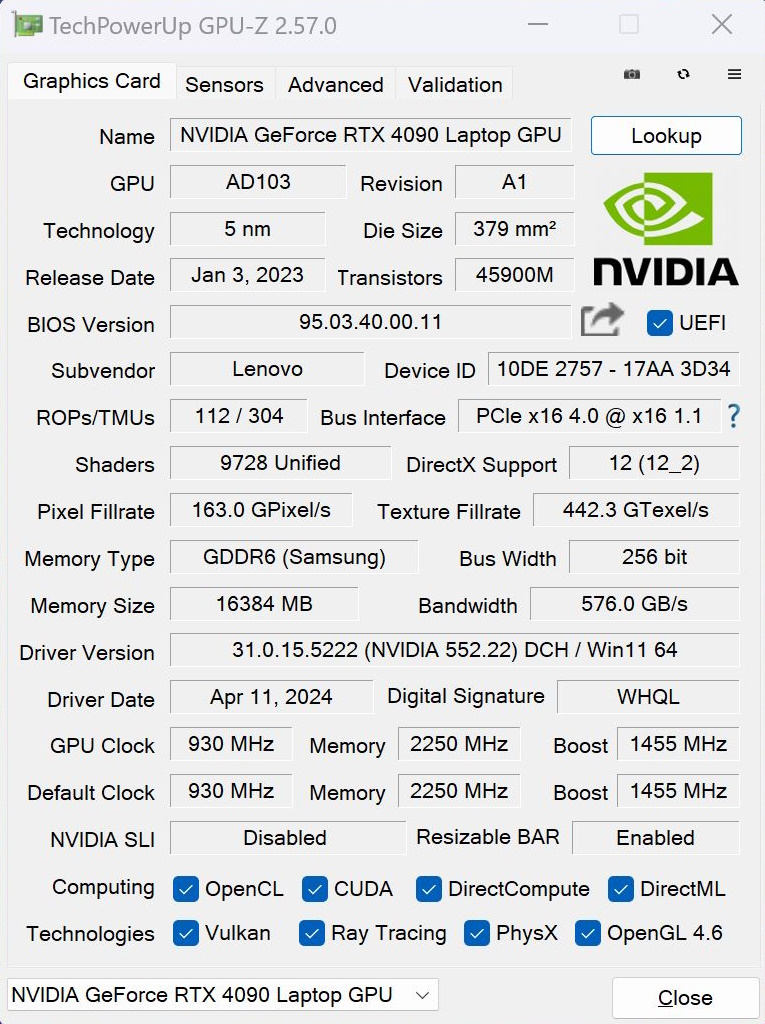
Grafik kartı
Bu Nvidia Geforce RTX 4090Legion 9i içinde dizüstü bilgisayar grafik kartlarının mevcut öncüsüdür. Buna göre, tüm güncel oyunları yüksek çözünürlükte ve maksimum detayda çalıştırabilmelidir.
Sentetik 3DMark testlerinde, performansı kabaca beklenen düzeydeydi, ancak yine de biraz daha düşüktü ve doğrudan rekabet çoğu zaman birkaç yüzde puan daha hızlıydı - tesadüfen aynı zamanda önemli ölçüde daha küçük ve daha ince Blade 16.
Dizüstü bilgisayarı güç kaynağından ayırırsanız, 3D performans söz konusu olduğunda Fire Strike puanı yaklaşık yüzde 40 düşer.
Oyun oynarken, performansı kabaca Razer Blade 16 ile karşılaştırılabilir. Yukarıda bahsedilen kısa kare hızı düşüşleri olmasaydı sonuçları muhtemelen daha yüksek olurdu. Sorunu 1 saatlik Witcher 3 testimizin kare hızı değerlerinde oldukça net bir şekilde görebilirsiniz. Kare hızı düşüşleri çoğunlukla ilk aşamalarda meydana geldi, daha sonra sistem istikrarlı bir şekilde çalıştı ve performansı rakipleriyle aynı seviyedeydi.
Sadece Skull & Bones gibi çok güncel ve zorlu oyunları çalıştırırken 4K kare hızı bazen 60 fps'nin altına düşüyor, bunun dışında tüm oyunlar 4K'da bile 60 fps'nin üzerinde sorunsuz çalışıyor.
| Performans profili/ölçüm değeri | Witcher 3 fps başlangıcı | Witcher 3 10 dakika sonra fps | Watt cinsinden tüketim | Watt cinsinden GPU güç tüketimi | MHz cinsinden ortalama GPU saati | dB cinsinden gürültü emisyonları |
|---|---|---|---|---|---|---|
| Performans | 203 | 192 | 246 | 162 | 2,120 | 55.32 |
| GPU desteği ile performans | 201 | 193 | 254 | 160,5 | 2.180 | 55,32 |
| Yapay zeka ile dengeli | 197 | 182 | 254 | 159 | 2.080 | 54,81 |
| Yapay zeka olmadan dengeli | 161 | 145 | 184 | 103 | 1.530 | 47,98 |
| Sessiz | 108 | 60 | 101 | 43 | ilk 1.000, 2 dakika sonra 800 | 32,19 |
| 3DMark 11 Performance | 46826 puan | |
| 3DMark Cloud Gate Standard Score | 67697 puan | |
| 3DMark Fire Strike Score | 34686 puan | |
| 3DMark Time Spy Score | 20099 puan | |
Yardım | ||
* ... daha küçük daha iyidir
| The Witcher 3 - 1920x1080 Ultra Graphics & Postprocessing (HBAO+) | |
| Lenovo Legion 9 16IRX8 | |
| Alienware m18 R2 | |
| Medion Erazer Beast X40 2024 | |
| Lenovo Legion 9 16IRX9, RTX 4090 | |
| Razer Blade 16 2024, RTX 4090 | |
| Asus ROG Strix Scar 18 G834JYR (2024) | |
| Sınıf ortalaması Gaming (18.4 - 214, n=118, son 2 yıl) | |
| GTA V - 1920x1080 Highest Settings possible AA:4xMSAA + FX AF:16x | |
| Lenovo Legion 9 16IRX8 | |
| Medion Erazer Beast X40 2024 | |
| Razer Blade 16 2024, RTX 4090 | |
| Alienware m18 R2 | |
| Lenovo Legion 9 16IRX9, RTX 4090 | |
| Asus ROG Strix Scar 18 G834JYR (2024) | |
| Sınıf ortalaması Gaming (12.1 - 168.2, n=132, son 2 yıl) | |
| Final Fantasy XV Benchmark - 1920x1080 High Quality | |
| Alienware m18 R2 | |
| Lenovo Legion 9 16IRX8 | |
| Medion Erazer Beast X40 2024 | |
| Asus ROG Strix Scar 18 G834JYR (2024) | |
| Lenovo Legion 9 16IRX9, RTX 4090 | |
| Razer Blade 16 2024, RTX 4090 | |
| Sınıf ortalaması Gaming (19.2 - 201, n=144, son 2 yıl) | |
| Dota 2 Reborn - 1920x1080 ultra (3/3) best looking | |
| Lenovo Legion 9 16IRX8 | |
| Medion Erazer Beast X40 2024 | |
| Razer Blade 16 2024, RTX 4090 | |
| Alienware m18 R2 | |
| Lenovo Legion 9 16IRX9, RTX 4090 | |
| Asus ROG Strix Scar 18 G834JYR (2024) | |
| Sınıf ortalaması Gaming (65.1 - 220, n=149, son 2 yıl) | |
Witcher 3 FPS diagram
| düşük | orta | yüksek | ultra | QHD | 4K DLSS | 4K FSR | 4K | |
|---|---|---|---|---|---|---|---|---|
| GTA V (2015) | 186.9 | 185.2 | 183.3 | 136.2 | 138.9 | 95 | ||
| The Witcher 3 (2015) | 540 | 494 | 370 | 203.4 | 165 | 104.5 | ||
| Dota 2 Reborn (2015) | 201 | 181.8 | 174.4 | 164.5 | 160.8 | |||
| Final Fantasy XV Benchmark (2018) | 228 | 194.9 | 165.1 | 142 | ||||
| X-Plane 11.11 (2018) | 193.5 | 166.3 | 125.6 | 109.6 | ||||
| Far Cry 5 (2018) | 201 | 173 | 166 | 155 | 146 | 104 | ||
| Strange Brigade (2018) | 499 | 403 | 387 | 369 | 290 | |||
| F1 23 (2023) | 151.5 | 149.2 | 144.6 | |||||
| Cyberpunk 2077 2.2 Phantom Liberty (2023) | 127 | 86 | ||||||
| Skull & Bones (2024) | 164 | 140 | 149 | 118 | 98 | 90 | 81 | 61 |
| F1 24 (2024) | 339 | 304 | 113.6 | 72.1 |
Emisyonlar ve güç - Gürültülü ve sıcak
Gürültü emisyonları
Masaüstünde boştayken, dizüstü bilgisayarın fanları çoğunlukla sessizdir. Ara sıra kısa süreliğine hızlanabilirler, ancak sonra tekrar sakinleşirler. Ancak, cihazı internette gezinmek gibi günlük yükler altına soktuğunuz anda, fanlar Sessiz modda bile hızla çalışmaya başlar.
3DMark06 sırasında, fanlar önce sürekli olarak 40 dB'nin biraz üzerine çıktı, sonra tekrar 35 dB'ye kadar sakinleşti ve son üçte birinde yaklaşık 39 dB'de dengelendi. Bu, sistemin soğutma ve performansını termal koşullara çok geç ayarladığının ve ancak bir süre sonra optimum değerlere yerleştiğinin bir işareti olabilir.
Oyun oynarken ve Performans modundayken, fanlar en fazla 55 dB civarında çalışır, bu da karşılaştırıldığında oldukça yüksektir; örneğin Blade 16 daha sessiz kalır. Dengeli modda (AI olmadan), dizüstü bilgisayarın gürültü emisyonları daha ılımlı bir 47 dB'ye düşer, ancak oyun performansı daha sonra gözle görülür şekilde, yani yüzde 20 ila 25 oranında azalır.
Ses yüksekliği
| Boşta |
| 23 / 23 / 23 dB |
| Çalışırken |
| 39 / 55.56 dB |
 | ||
30 dB sessiz 40 dB(A) duyulabilirlik 50 dB(A) gürültülü |
||
min: | ||
| Lenovo Legion 9 16IRX9, RTX 4090 NVIDIA GeForce RTX 4090 Laptop GPU, i9-14900HX, Micron 3400 2TB MTFDKBA2T0TFH | Lenovo Legion 9 16IRX8 NVIDIA GeForce RTX 4090 Laptop GPU, i9-13980HX, 2x SK Hynix HFS001TEJ9X115N (RAID 0) | Razer Blade 16 2024, RTX 4090 NVIDIA GeForce RTX 4090 Laptop GPU, i9-14900HX, Samsung PM9A1 MZVL22T0HBLB | Alienware m18 R2 NVIDIA GeForce RTX 4090 Laptop GPU, i9-14900HX, SK Hynix PC811 HFS002TEM9X152N | Asus ROG Strix Scar 18 G834JYR (2024) NVIDIA GeForce RTX 4090 Laptop GPU, i9-14900HX, Samsung PM9A1a MZVL22T0HDLB | Medion Erazer Beast X40 2024 NVIDIA GeForce RTX 4090 Laptop GPU, i9-14900HX, Phison E18-1TB-PHISON-SSD-BICS5 | |
|---|---|---|---|---|---|---|
| Noise | -2% | -1% | -5% | -13% | -15% | |
| kapalı / ortam * | 23 | 23.7 -3% | 23 -0% | 23.6 -3% | 24 -4% | 25 -9% |
| Idle Minimum * | 23 | 24 -4% | 23 -0% | 23.8 -3% | 27 -17% | 28 -22% |
| Idle Average * | 23 | 24 -4% | 23 -0% | 26.1 -13% | 28 -22% | 29 -26% |
| Idle Maximum * | 23 | 30.4 -32% | 27.66 -20% | 31.5 -37% | 32 -39% | 32 -39% |
| Load Average * | 39 | 30.4 22% | 43.76 -12% | 31.5 19% | 50 -28% | 48 -23% |
| Witcher 3 ultra * | 55.32 | 52.2 6% | 46.81 15% | 52.1 6% | 50 10% | 50 10% |
| Load Maximum * | 55.56 | 54.9 1% | 50.37 9% | 56.6 -2% | 52 6% | 52 6% |
* ... daha küçük daha iyidir
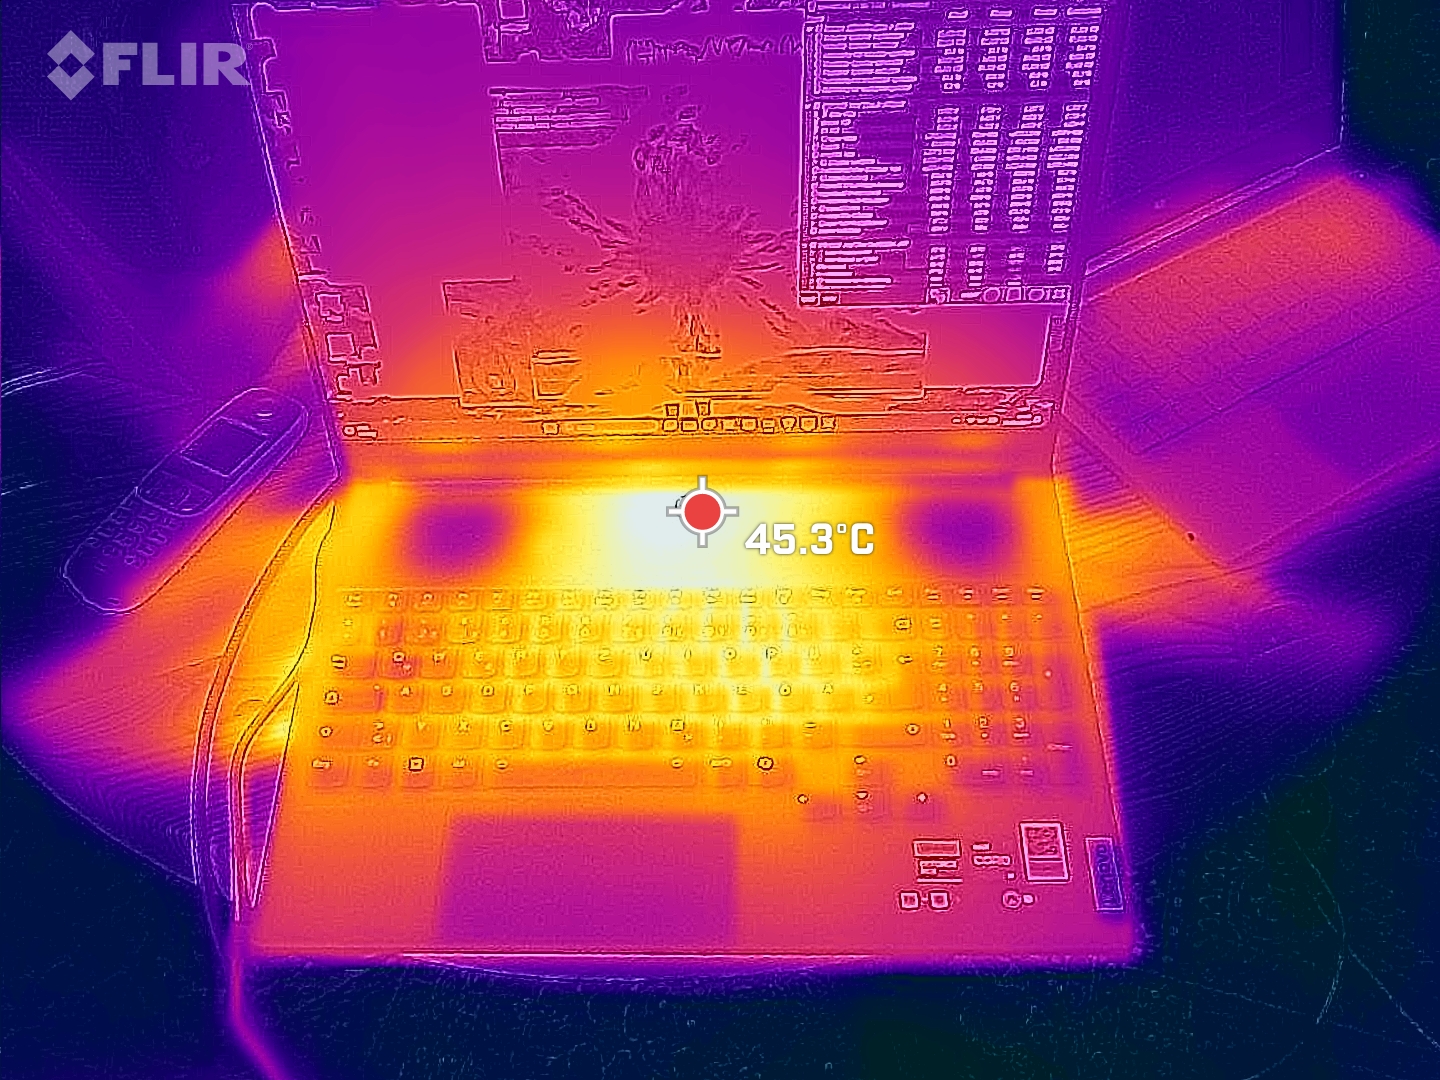
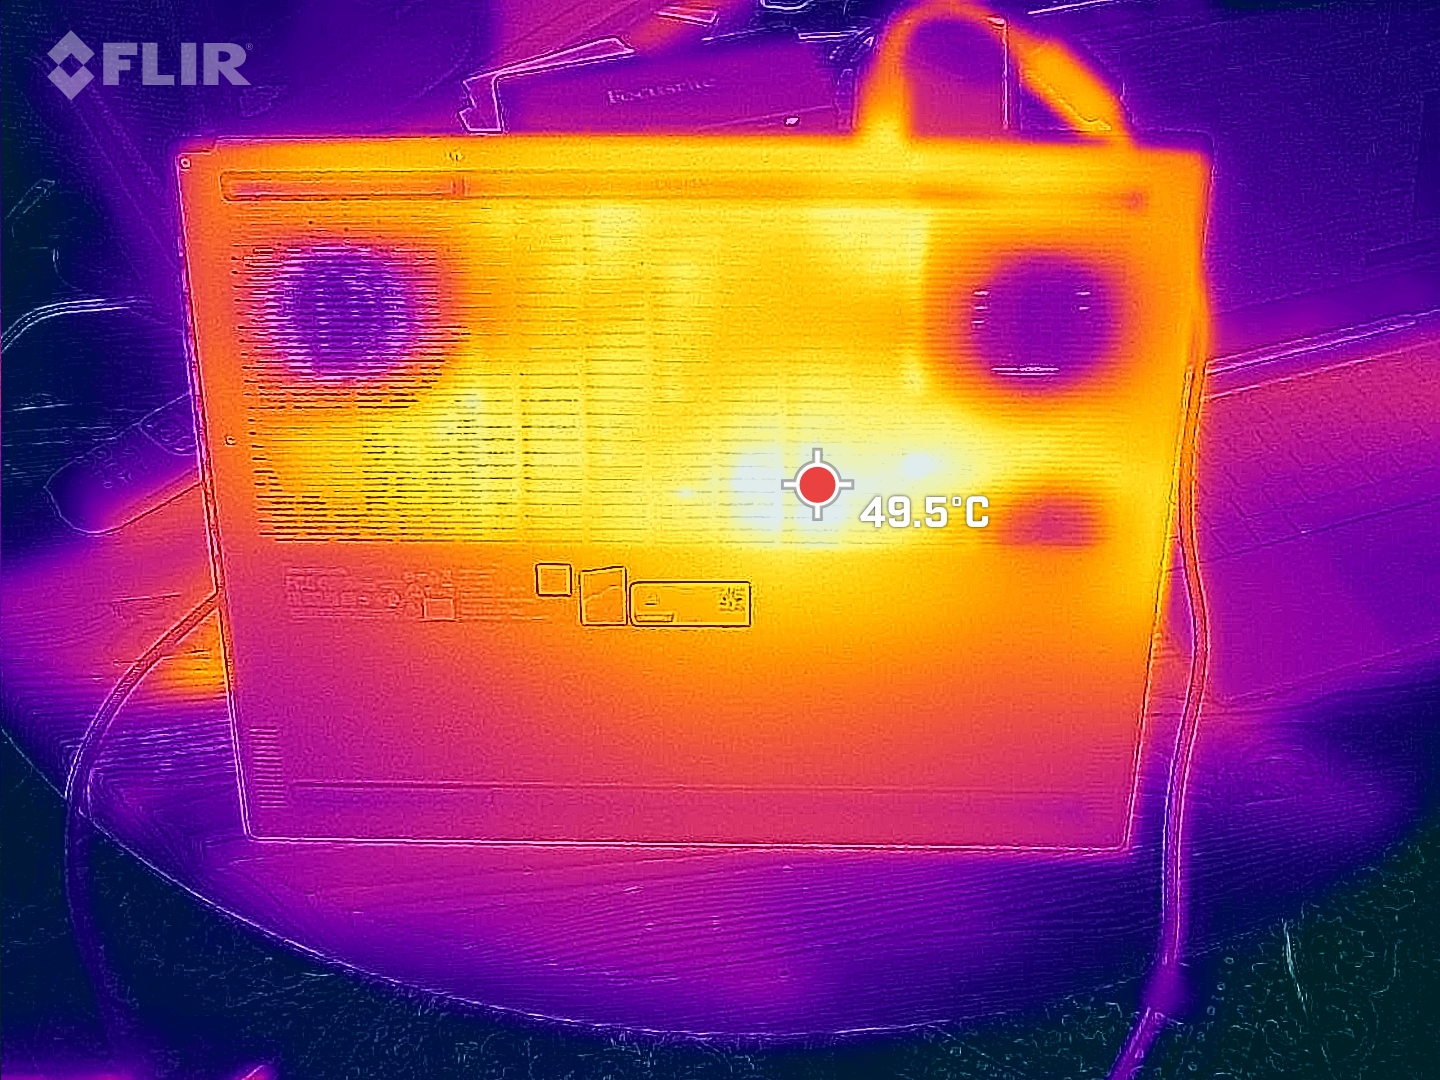
Sıcaklık
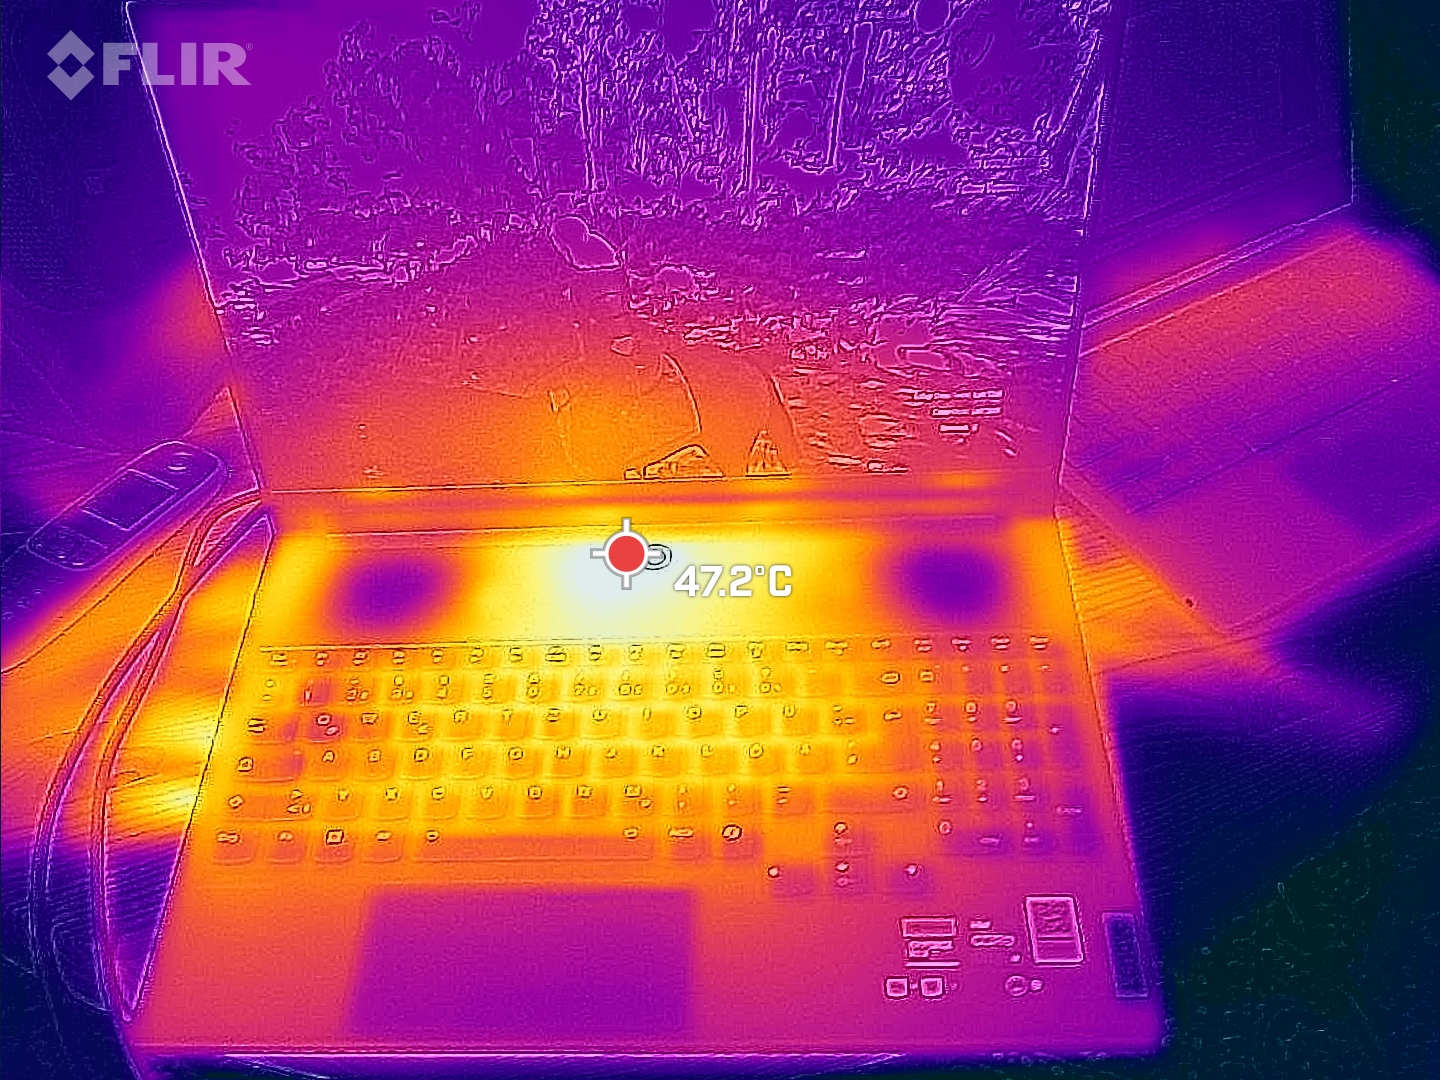
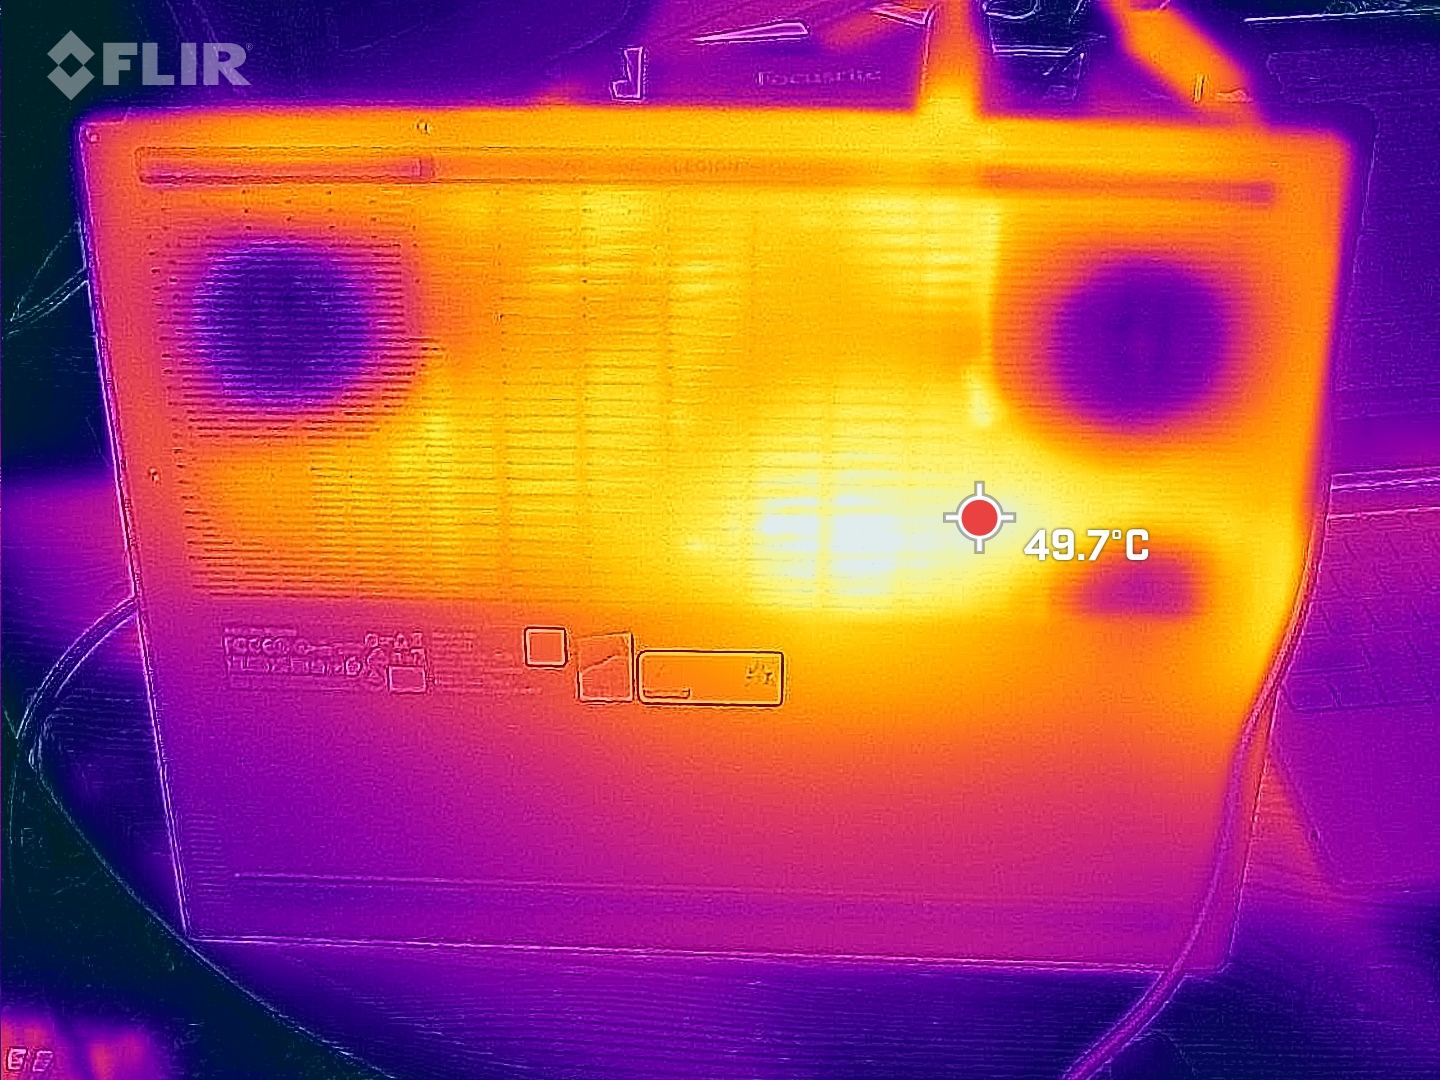
Oldukça gürültülü soğutma sistemine rağmen, dizüstü bilgisayarın sıcaklıkları karşılaştırıldığında oldukça yüksek. Oyun oynarken ve diğer ağır yükler altında sıcak noktalar merkezde ve ekrana doğru. Ayrıca WASD tuşlarının etrafı da oldukça ısınabiliyor - 46 °C ölçtük. En azından avuç içi dayanakları iyi durumda. Selefi bile bu açıdan ideal değildi, ancak Lenovo belli ki herhangi bir iyileştirme yapmamış.
(-) Üst taraftaki maksimum sıcaklık, 40.4 °C / 105 F ortalamasına kıyasla 56 °C / 133 F'dir. , Gaming sınıfı için 21.2 ile 68.8 °C arasında değişir.
(-) Alt kısım, 43.2 °C / 110 F ortalamasına kıyasla maksimum 53 °C / 127 F'ye kadar ısınır
(±) Boşta kullanımda, üst tarafın ortalama sıcaklığı 33.6 °C / 92 F olup, cihazın 33.9 °C / 93 F.
(-) The Witcher 3 oynarken, üst tarafın ortalama sıcaklığı 42.3 °C / 108 F olup, cihazın 33.9 °C / 93 F.
(±) Avuç içi dayanakları ve dokunmatik yüzey maksimum 36 °C / 96.8 F ile dokunulamayacak kadar ısınabilir.
(-) Benzer cihazların avuç içi dayanağı alanının ortalama sıcaklığı 28.9 °C / 84 F (-7.1 °C / -12.8 F) idi.
| Lenovo Legion 9 16IRX9, RTX 4090 Intel Core i9-14900HX, NVIDIA GeForce RTX 4090 Laptop GPU | Lenovo Legion 9 16IRX8 Intel Core i9-13980HX, NVIDIA GeForce RTX 4090 Laptop GPU | Razer Blade 16 2024, RTX 4090 Intel Core i9-14900HX, NVIDIA GeForce RTX 4090 Laptop GPU | Alienware m18 R2 Intel Core i9-14900HX, NVIDIA GeForce RTX 4090 Laptop GPU | Asus ROG Strix Scar 18 G834JYR (2024) Intel Core i9-14900HX, NVIDIA GeForce RTX 4090 Laptop GPU | Medion Erazer Beast X40 2024 Intel Core i9-14900HX, NVIDIA GeForce RTX 4090 Laptop GPU | |
|---|---|---|---|---|---|---|
| Heat | 11% | 21% | 9% | 17% | 13% | |
| Maximum Upper Side * | 56 | 49.6 11% | 45 20% | 41.2 26% | 49 12% | 47 16% |
| Maximum Bottom * | 53 | 48.6 8% | 45 15% | 34.6 35% | 47 11% | 54 -2% |
| Idle Upper Side * | 38 | 33.2 13% | 29 24% | 42.8 -13% | 29 24% | 30 21% |
| Idle Bottom * | 39 | 34.2 12% | 30 23% | 43.6 -12% | 31 21% | 32 18% |
* ... daha küçük daha iyidir
Konuşmacılar
İşitilebilir aralık çok doğrusaldır, yüksek ve orta tonlar iyi dengelenmiştir. Bununla birlikte, baslar doğal olarak azalmış, ancak yine de algılanabilir. Hoparlörler biraz daha güçlü, yani daha yüksek sesli olabilirdi.
Lenovo Legion 9 16IRX9, RTX 4090 ses analizi
(±) | hoparlör ses yüksekliği ortalama ama iyi (78.96 dB)
Bas 100 - 315Hz
(±) | azaltılmış bas - ortalama olarak medyandan 13.2% daha düşük
(±) | Bas doğrusallığı ortalamadır (8.9% delta - önceki frekans)
Ortalar 400 - 2000 Hz
(+) | dengeli ortalar - medyandan yalnızca 3.2% uzakta
(+) | orta frekanslar doğrusaldır (3.4% deltadan önceki frekansa)
Yüksekler 2 - 16 kHz
(+) | dengeli yüksekler - medyandan yalnızca 1.8% uzakta
(+) | yüksekler doğrusaldır (4% deltadan önceki frekansa)
Toplam 100 - 16.000 Hz
(+) | genel ses doğrusaldır (11.3% ortancaya göre fark)
Aynı sınıfla karşılaştırıldığında
» Bu sınıftaki tüm test edilen cihazların %8%'si daha iyi, 3% benzer, 89% daha kötüydü
» En iyisinin deltası 6% idi, ortalama 18% idi, en kötüsü 132% idi
Test edilen tüm cihazlarla karşılaştırıldığında
» Test edilen tüm cihazların %6'si daha iyi, 2 benzer, % 92 daha kötüydü
» En iyisinin deltası 4% idi, ortalama 24% idi, en kötüsü 134% idi
Razer Blade 16 2024, RTX 4090 ses analizi
(±) | hoparlör ses yüksekliği ortalama ama iyi (81.16 dB)
Bas 100 - 315Hz
(±) | azaltılmış bas - ortalama olarak medyandan 8.2% daha düşük
(±) | Bas doğrusallığı ortalamadır (7.4% delta - önceki frekans)
Ortalar 400 - 2000 Hz
(+) | dengeli ortalar - medyandan yalnızca 3.3% uzakta
(+) | orta frekanslar doğrusaldır (5.9% deltadan önceki frekansa)
Yüksekler 2 - 16 kHz
(+) | dengeli yüksekler - medyandan yalnızca 1.6% uzakta
(+) | yüksekler doğrusaldır (3.1% deltadan önceki frekansa)
Toplam 100 - 16.000 Hz
(+) | genel ses doğrusaldır (9.2% ortancaya göre fark)
Aynı sınıfla karşılaştırıldığında
» Bu sınıftaki tüm test edilen cihazların %3%'si daha iyi, 1% benzer, 96% daha kötüydü
» En iyisinin deltası 6% idi, ortalama 18% idi, en kötüsü 132% idi
Test edilen tüm cihazlarla karşılaştırıldığında
» Test edilen tüm cihazların %3'si daha iyi, 1 benzer, % 97 daha kötüydü
» En iyisinin deltası 4% idi, ortalama 24% idi, en kötüsü 134% idi
Güç tüketimi
Hem rölantide hem de diğer durumlarda tüketimi önceki modele kıyasla biraz daha iyi olabilir. Bununla birlikte, çok fazla değil - 18 inçlik rakipler bile en azından rölantideyken genellikle daha tutumludur.
Yeni Legion 9'un sözde sorunu, tüketim grafiklerinde tekrar görülebilir, çünkü tüketimi (ve dolayısıyla performansı) çeşitli testlerde zaman zaman çok kısa bir süre düşmüştür. Cinebench 23'te hala normal olan şey artık Witcher 3 veya Furmark testleri.
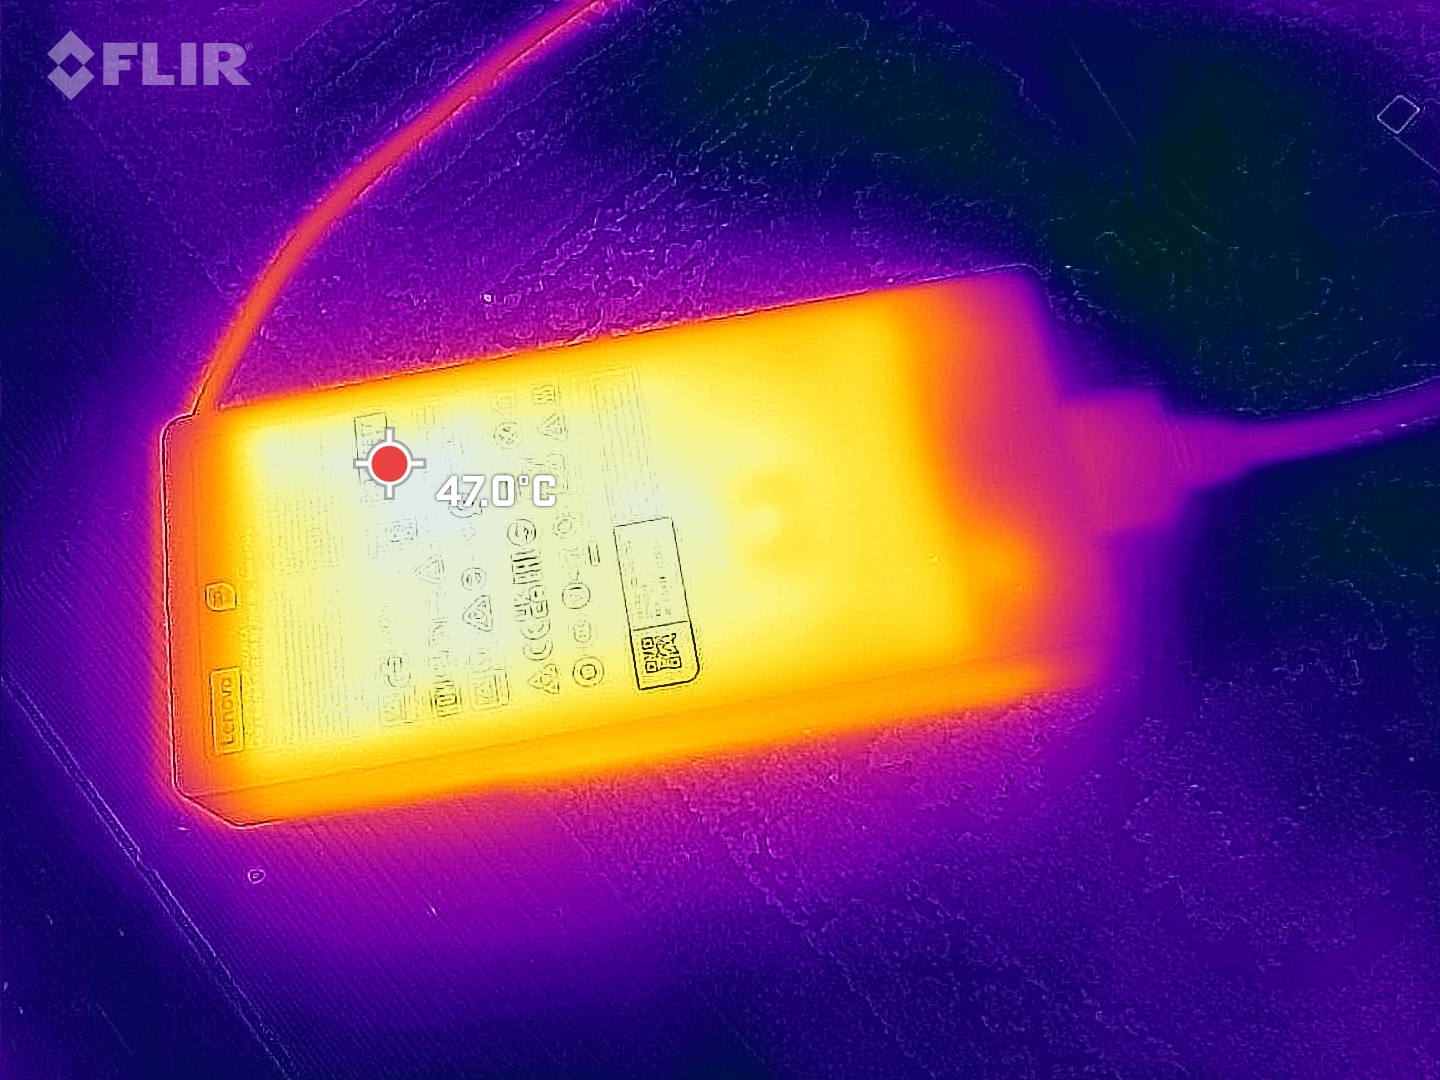
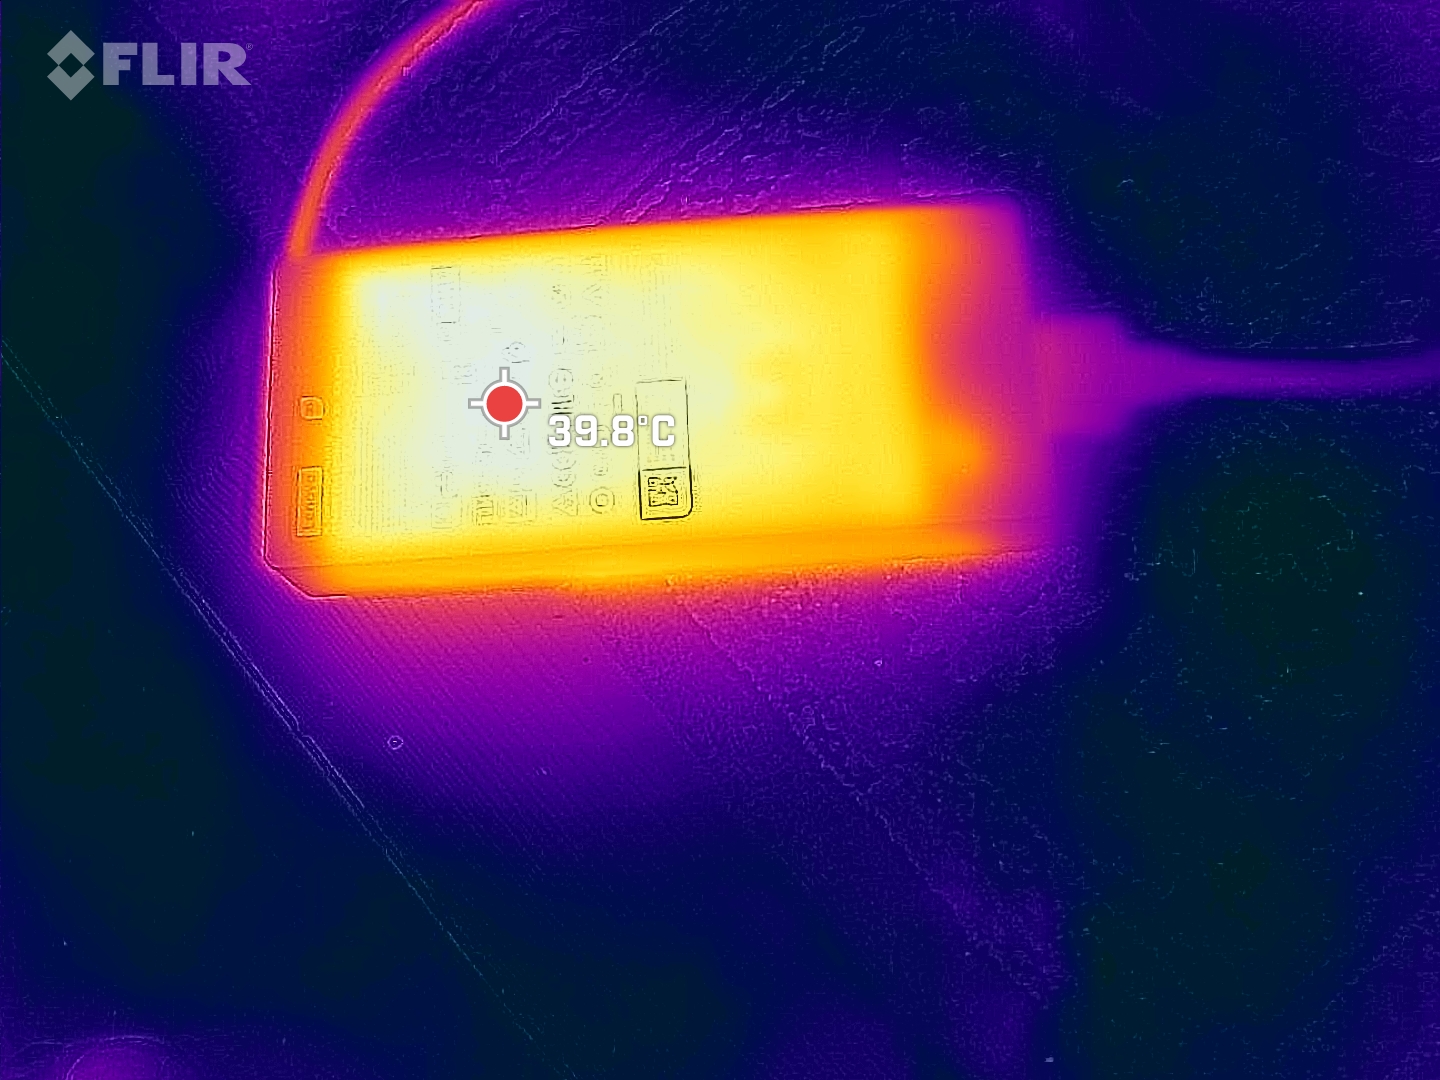
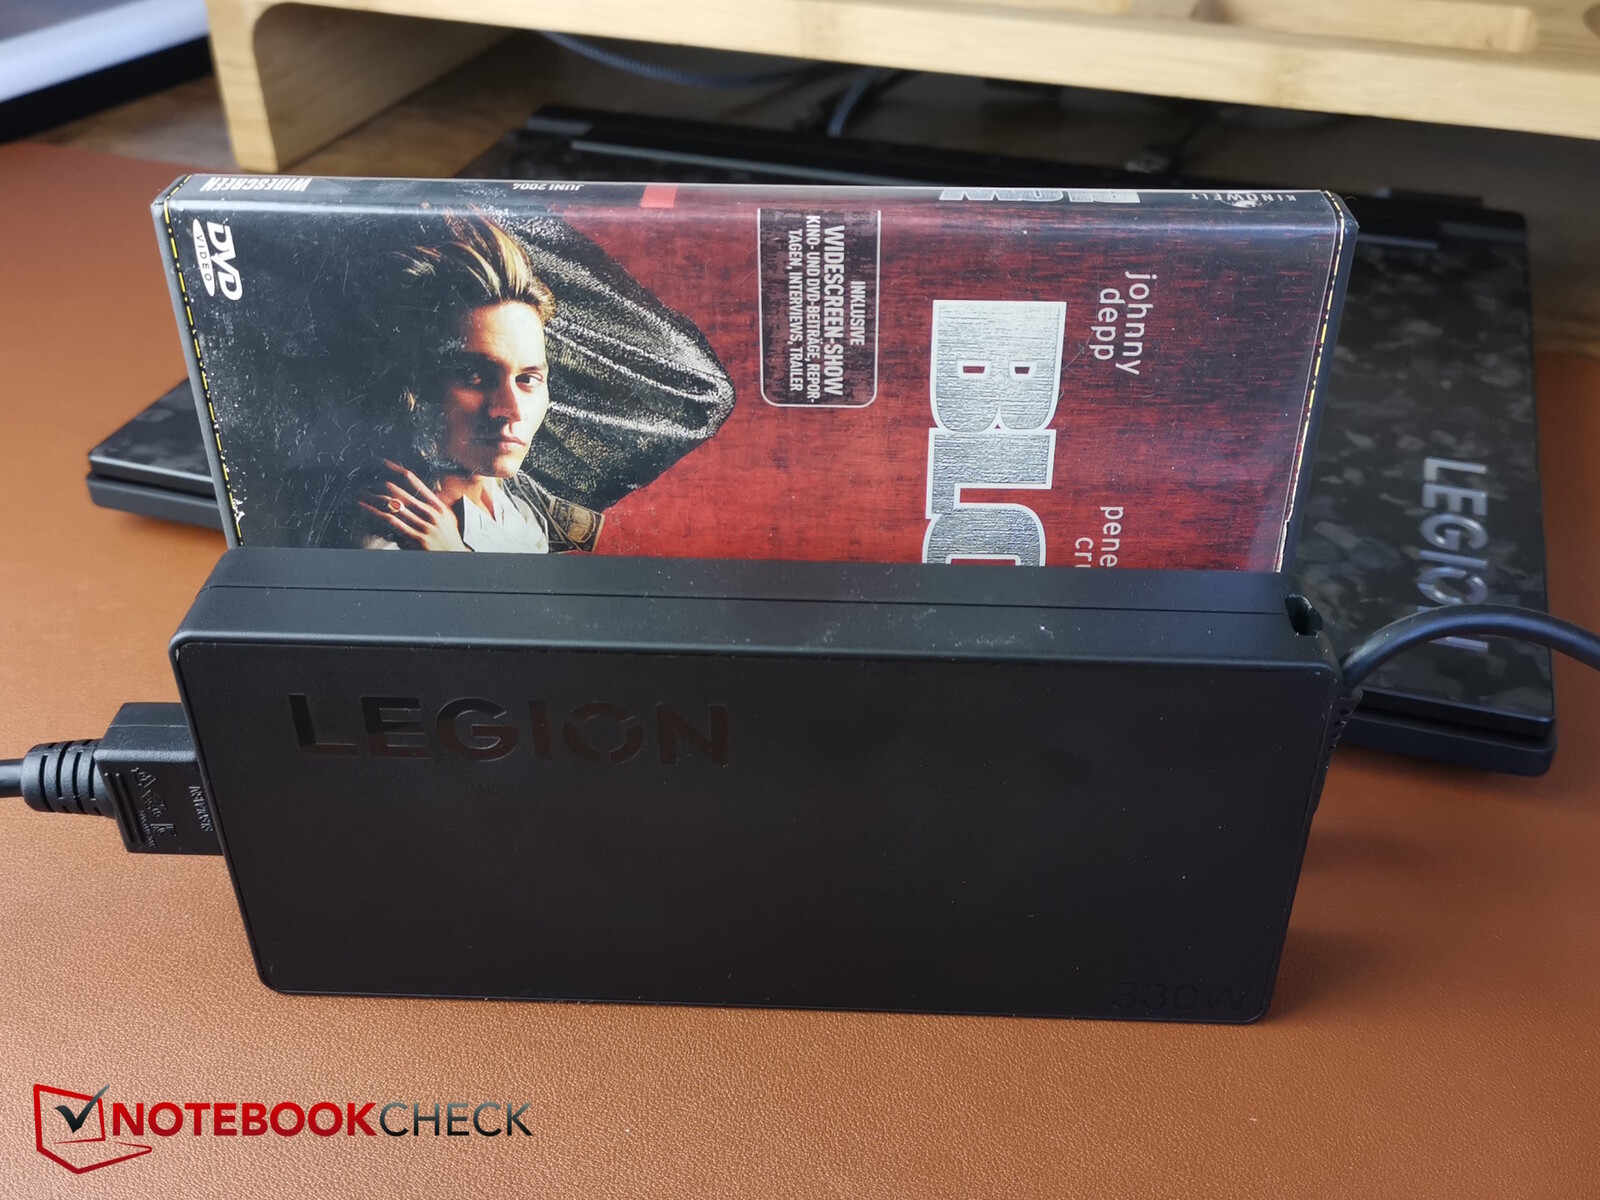
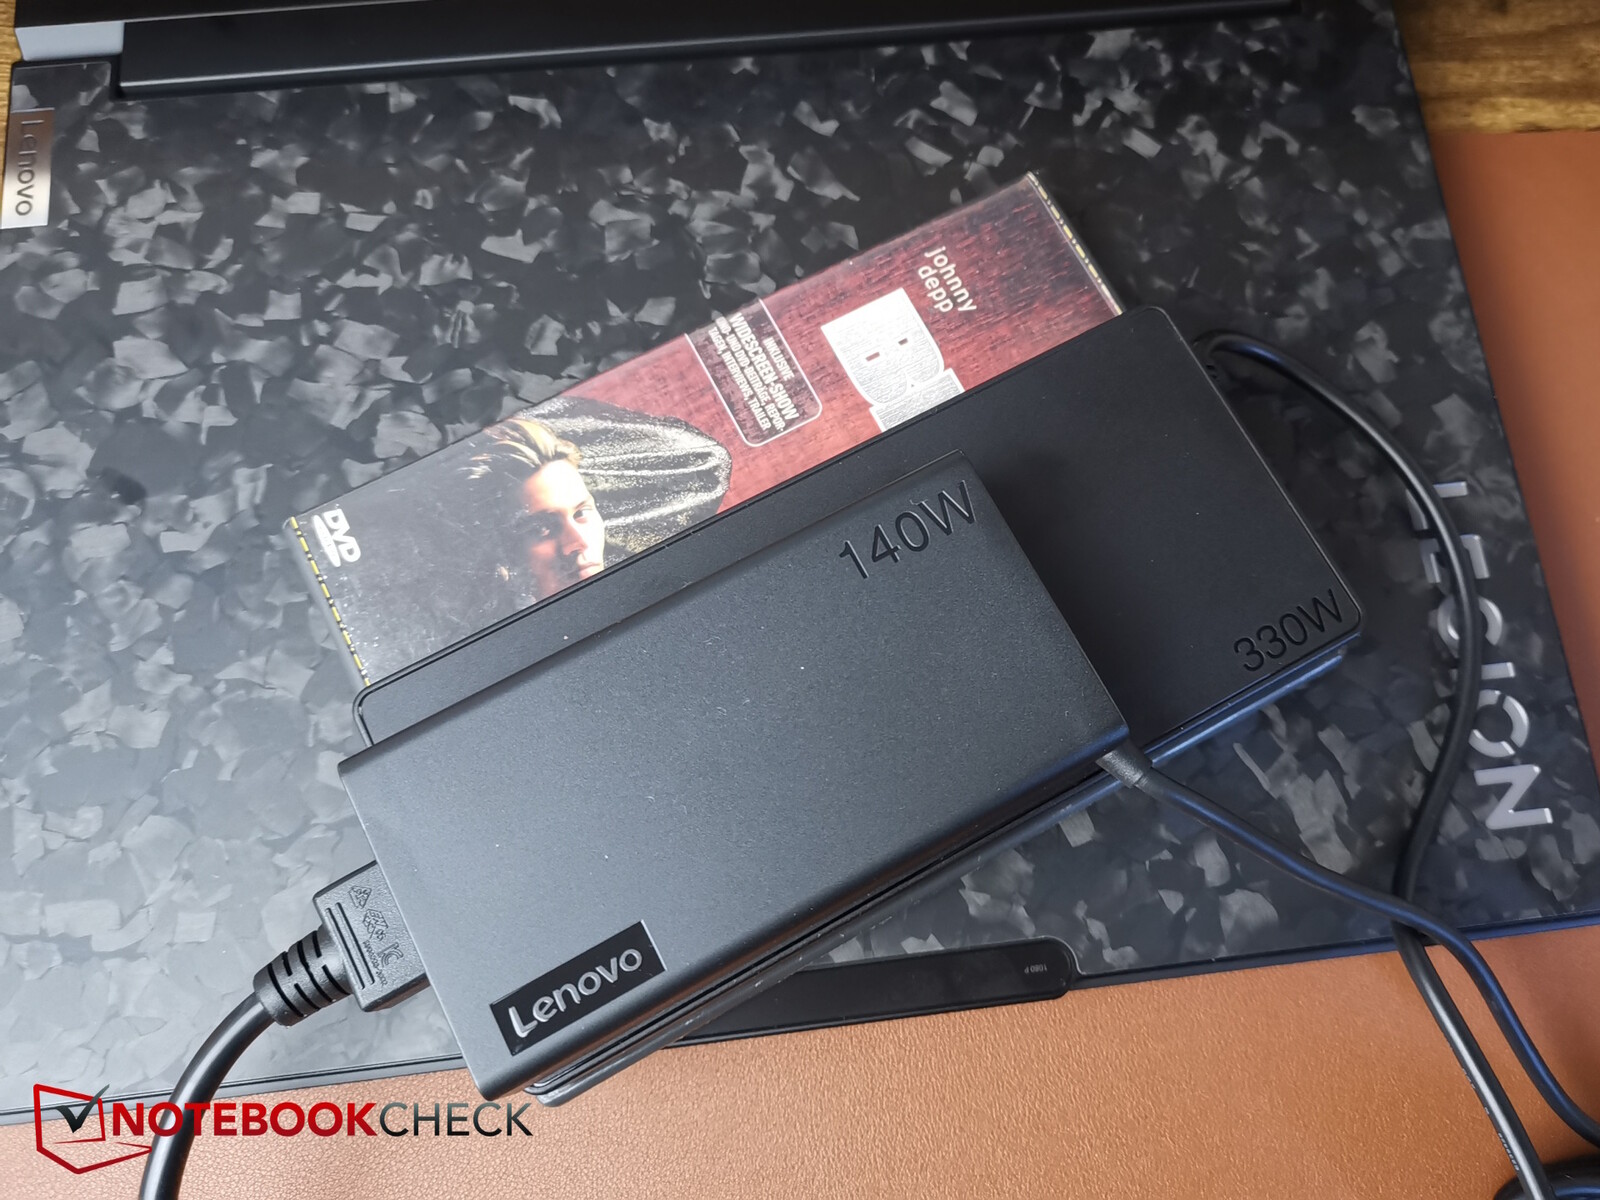
Düz ve nispeten küçük güç kaynağı ünitesini kullanarak kısa süreli maksimum 323 watt tüketim ölçtük. Bu ünite 330 watt için tasarlanmıştır ve bu nedenle dizüstü bilgisayara her durumda güç sağlamakta sorun yaşamayacaktır.
Benzersiz bir özellik: Legion 9 ayrıca 140 watt'lık çok daha küçük bir USB-C güç kaynağı ünitesi olan ikinci bir güç kaynağı ünitesiyle birlikte geliyor. Oyun oynamıyorsanız, daha küçük adaptör elbette hareket halindeyken kullanım için daha da uygundur.
| Kapalı / Bekleme modu | |
| Boşta | |
| Çalışırken |
|
Key:
min: | |
| Lenovo Legion 9 16IRX9, RTX 4090 i9-14900HX, NVIDIA GeForce RTX 4090 Laptop GPU, Micron 3400 2TB MTFDKBA2T0TFH, MiniLED, 3200x2000, 16" | Lenovo Legion 9 16IRX8 i9-13980HX, NVIDIA GeForce RTX 4090 Laptop GPU, 2x SK Hynix HFS001TEJ9X115N (RAID 0), Mini-LED, 3200x2000, 16" | Razer Blade 16 2024, RTX 4090 i9-14900HX, NVIDIA GeForce RTX 4090 Laptop GPU, Samsung PM9A1 MZVL22T0HBLB, OLED, 2560x1600, 16" | Asus ROG Strix Scar 18 G834JYR (2024) i9-14900HX, NVIDIA GeForce RTX 4090 Laptop GPU, Samsung PM9A1a MZVL22T0HDLB, Mini LED, 2560x1600, 18" | Medion Erazer Beast X40 2024 i9-14900HX, NVIDIA GeForce RTX 4090 Laptop GPU, Phison E18-1TB-PHISON-SSD-BICS5, IPS, 2560x1600, 17" | Ortalama NVIDIA GeForce RTX 4090 Laptop GPU | Sınıf ortalaması Gaming | |
|---|---|---|---|---|---|---|---|
| Power Consumption | -34% | 12% | 11% | 13% | 1% | 22% | |
| Idle Minimum * | 20.5 | 32.3 -58% | 16.9 18% | 14 32% | 7 66% | 16.2 ? 21% | 13.6 ? 34% |
| Idle Average * | 27.7 | 42.6 -54% | 17.8 36% | 17 39% | 15 46% | 23.1 ? 17% | 19 ? 31% |
| Idle Maximum * | 32.1 | 57.9 -80% | 19.6 39% | 24 25% | 33 -3% | 34.2 ? -7% | 26.4 ? 18% |
| Load Average * | 105 | 121 -15% | 128 -22% | 143 -36% | 134 -28% | 130.5 ? -24% | 103.2 ? 2% |
| Witcher 3 ultra * | 246 | 254 -3% | 243 1% | 251 -2% | 280 -14% | ||
| Load Maximum * | 323 | 297.7 8% | 328 -2% | 302 7% | 294 9% | 324 ? -0% | 247 ? 24% |
* ... daha küçük daha iyidir
Power consumption Witcher 3 / stress test
Power consumption with external monitor
Çalışma Zamanları
Dahili batarya yaklaşık 100 Wh kapasiteye sahip ve bu da rakipleriyle benzerlik gösteriyor. Bununla birlikte, çalışma süreleri genellikle daha kısadır; bu, selefinin ve MiniLED ekranlı diğer dizüstü bilgisayarların zaten mücadele etmek zorunda olduğu bir sorundur. Çalışma süreleri iyileştirilmiş olsa da, karşılaştırma cihazları (Alienware dizüstü bilgisayar hariç) pillerinden daha uzun çalışma süreleri elde ediyor. Aynı durum, örneğin MiniLED ekrana sahip Asus ROG Scar Strix için de geçerli.
Yine de, parlaklık 150 nit'e düşürüldüğünde 5 saatin biraz altında video izlemek veya internette gezinmek için yeterlidir. Asus cihazı burada 6 saatten fazla dayanıyor.
Lenovo dizüstü bilgisayar, önce Vantage yazılımında etkinleştirilmesi gereken bir hızlı şarj işlevini destekliyor. Bundan sonra, tam şarj sadece yaklaşık bir saat sürer.
| Lenovo Legion 9 16IRX9, RTX 4090 i9-14900HX, NVIDIA GeForce RTX 4090 Laptop GPU, 99.99 Wh | Lenovo Legion 9 16IRX8 i9-13980HX, NVIDIA GeForce RTX 4090 Laptop GPU, 99.9 Wh | Razer Blade 16 2024, RTX 4090 i9-14900HX, NVIDIA GeForce RTX 4090 Laptop GPU, 95.2 Wh | Alienware m18 R2 i9-14900HX, NVIDIA GeForce RTX 4090 Laptop GPU, 97 Wh | Asus ROG Strix Scar 18 G834JYR (2024) i9-14900HX, NVIDIA GeForce RTX 4090 Laptop GPU, 90 Wh | Medion Erazer Beast X40 2024 i9-14900HX, NVIDIA GeForce RTX 4090 Laptop GPU, 99.8 Wh | Sınıf ortalaması Gaming | |
|---|---|---|---|---|---|---|---|
| Pil Çalışma Süresi | -50% | 10% | 0% | 24% | 29% | 18% | |
| H.264 | 294 | 456 55% | 447 52% | 452 ? 54% | |||
| WiFi v1.3 | 290 | 159 -45% | 329 13% | 290 0% | 461 59% | 374 29% | 387 ? 33% |
| Load | 129 | 58 -55% | 79 -39% | 77 -40% | 84.7 ? -34% | ||
| Reader / Idle | 404 | 612 | 585 ? |
Artılar
Eksiler
Karar - Beklenenden daha fazla sorun
Fiyatına gelince, Lenovo Legion 9i çekici bir tasarıma, iyi malzemelere, iyi bir yapı kalitesine ve HDR1000 özellikli parlak Mini LED ekrana sahip üst düzey bir oyuncu. Rakiplerinde bulunmayan düz güç kaynağının yanı sıra 140 watt'lık ek USB-C güç kaynağı da diğer artı puanlar olarak sınıflandırılabilir.
Bununla birlikte, daha küçük Legion modelleri iyi sistem optimizasyonlarıyla etkileyiciyken, en üst model beklenenden çok daha fazla zayıflık ve sorundan muzdarip. İlk ve en önemlisi, LatencyMon testi sırasında sadece belirgin hale gelmeyen gecikme sorunlarıdır - RAM gecikmesini test ederken de fark ettik ve oyun oynarken bile bazı gözle görülür kare düşüşleri görebilirsiniz. Buna bir de alışılmadık derecede zayıf tek çekirdek performansı ekleniyor. Bir diğer büyük sorun ise yetersiz soğutma sistemi. Görünüşe göre çok geç ve bazen çok az soğutuyor, bu da örneğin SSD'nin yavaşlamasına neden oluyor. Ayrıca, yük altında çok ses çıkarıyor ve yüksek yüzey sıcaklıklarını rakipleri kadar iyi önleyemiyor. Pil ömrü iyileştirilmiş olsa da rakipleri kadar iyi değil. Yani toplamda, iyileştirme için çok yer var.
Legion 9i şık bir üst düzey oyuncu ama daha küçük Legion modellerinden farklı olarak, pahalı üst düzey model, yetersiz soğutma sistemi ve büyük gecikme sorunları gibi can sıkıcı sorunlardan muzdarip olan model oluyor.
Örneğin, daha küçük bir kasada karşılaştırılabilir performans sunan ve Legion 9i kadar çok sorunu olmayan Razer Blade 16 bir alternatif olabilir. Bunun yanı sıra, selefi aslında daha olgun bir sistem gibi hissettirdi ve hatta halef modelin birçok sorununun bir sonucu olarak daha yüksek performansa sahip. Sonuç olarak, yeni Legion 9i şu anda satın almaya değmez.
Eylül 2024 Güncellemesi: Kare hızı sorunlarını gideren bir BIOS güncellemesi geldi.
Fiyat ve bulunabilirlik
Lenovo Legion 9 16IRX9 veya Lenovo Legion 9i yapılandırmamız 3.804,66 ABD Doları karşılığında doğrudan Lenovo'dan satın alınabilir.
Not: Derecelendirme sistemimizi yakın zamanda güncelledik ve 8. sürümün sonuçları 7. sürümün sonuçları ile karşılaştırılamaz. Daha fazla bilgi için burada .
Lenovo Legion 9 16IRX9, RTX 4090
- 09/27/2024 v8
Christian Hintze
 Total Sustainability Score:
 Şeffaflık
İncelenecek cihazların seçimi editör ekibimiz tarafından yapılır. Test örneği, bu incelemenin amacı doğrultusunda üretici veya perakendeci tarafından yazara ödünç olarak sağlanmıştır. Borç verenin bu inceleme üzerinde herhangi bir etkisi olmadığı gibi, üretici de yayınlanmadan önce bu incelemenin bir kopyasını almamıştır. Bu incelemeyi yayınlama zorunluluğu yoktu. İncelemelerimiz karşılığında asla tazminat veya ödeme kabul etmiyoruz. Bağımsız bir medya şirketi olarak Notebookcheck, üreticilerin, perakendecilerin veya yayıncıların otoritesine tabi değildir.
Notebookcheck bu şekilde test yapıyor
Notebookcheck, tüm sonuçların karşılaştırılabilir olmasını sağlamak için her yıl yüzlerce dizüstü bilgisayarı ve akıllı telefonu standart prosedürler kullanarak bağımsız olarak inceliyor. Yaklaşık 20 yıldır test yöntemlerimizi sürekli olarak geliştirdik ve bu süreçte endüstri standartlarını belirledik. Test laboratuvarlarımızda deneyimli teknisyenler ve editörler tarafından yüksek kaliteli ölçüm ekipmanları kullanılmaktadır. Bu testler çok aşamalı bir doğrulama sürecini içerir. Karmaşık derecelendirme sistemimiz, nesnelliği koruyan yüzlerce sağlam temellere dayanan ölçüm ve kıyaslamaya dayanmaktadır.Price comparison

