

MSI Summit E13 AI Evo dönüştürülebilir inceleme: Core Ultra 7 ile ciddi yavaşlama sorunları
Başa çıkılamayacak kadar hızlı.
En son Summit E13 A1MTG, orijinal olarak Core-U serisi işlemci için tasarlanmış bir dizüstü bilgisayara Core Ultra-H CPU koyduğunuzda neler olduğunu gösteriyor. Kağıt üzerinde çok hızlı görünebilir, ancak daha sonra ortaya çıkan kısılma ve sıcaklık seviyelerine dikkat edilmesi gerekir.Allen Ngo, 👁 Allen Ngo (Çeviren DeepL / Ninh Duy) Yayınlandı 🇺🇸 🇫🇷 ...
Karar - Bir Adım İleri İki Adım Geri
Summit E13 AI Evo A1MTG, selefiyle kıyaslandığında bir düşüş gibi hissedilebilir. Core Ultra H CPU'su ile kağıt üzerinde kulağa hoş geliyor, ancak pratikte işlemci, Summit E13 orijinal olarak ULV Core U serisi işlemciler için tasarlandığından, aynı CPU seçeneğine sahip diğer dizüstü bilgisayarların çoğundan çok daha hızlı ve keskin bir şekilde daralıyor. Yeni model kesinlikle orijinal 2021 versiyonundan daha hızlıdır, ancak fark, aşağıdaki gibi diğer Core Ultra H dizüstü bilgisayarlarla olan deneyimimiz göz önüne alındığında olabileceği kadar geniş değildir Framework Dizüstü Bilgisayar 13.5. Pil ömrü ve çekirdek sıcaklığı gibi unsurlar da işlemci değişikliğinden zarar görüyor.
Hayal kırıklığı yaratan diğer değişiklikler arasında daha az USB-C bağlantı noktası ve MicroSD okuyucunun kaldırılması yer alıyor. Temel IPS ekran bile 120 Hz'den sadece 60 Hz'e düşürüldü ve yavaş siyah-beyaz tepki sürelerinde hiçbir iyileştirme yapılmadı.
Summit E13 dört yaşına yaklaştığına göre kasanın yeniden tasarlanmasının zamanı gelmiş olabilir. Core Ultra-H işlemci, MSI modelini diğer 13 inç dönüştürülebilir bilgisayarlardan ayırmaya yardımcı oluyor, ancak daha yüksek CPU taleplerini desteklemek için önce soğutma çözümünü geliştirerek uygulaması daha iyi bir şekilde ele alınabilirdi. Ortalamanın üzerindeki sıcaklıklar ve fan gürültüsü, yeni işlemciyi ayakta tutmak için mücadele eden bir soğutma çözümünün göstergesidir.
Artılar
Eksiler
Fiyat ve Bulunabilirlik
Amazon şu anda Summit E13 AI Evo'yu Core Ultra 7, 16 GB LPDDR5 RAM ve 1 TB SSD ile 1100 dolara sunuyor.
Karşılaştırılan olası alternatifler
Resim | Modeli / incelemeler | Fiyat | Ağırlık | Yükseklik | Ekran |
|---|---|---|---|---|---|
1. 78.6% 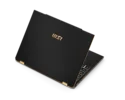 | MSI Summit E13 AI Evo A1MTG Intel Core Ultra 7 155H ⎘ Intel Arc 8-Core iGPU ⎘ 16 GB Bellek, 1024 GB SSD | Amazon: $1,099.00 Liste fiyatı: 1100 USD | 1.3 kg | 16.2 mm | 13.30" 1920x1200 170 PPI IPS |
2. 86.9% v7 (old) 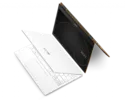 | MSI Summit E13 Flip Evo A11MT Intel Core i7-1185G7 ⎘ Intel Iris Xe Graphics G7 96EUs ⎘ 32 GB Bellek, 1024 GB SSD | Amazon: 1. $969.99 MSI Summit E13 Flip Evo (202... 2. $899.00 MSI Summit E13 Flip Evo Prof... 3. $849.00 MSI Summit E13 Flip EVO Prof... Liste fiyatı: 1900 USD | 1.4 kg | 14.9 mm | 13.40" 1920x1200 169 PPI IPS |
3. 87% v7 (old)  | Lenovo Yoga Book 9 13IMU9 Intel Core Ultra 7 155U ⎘ Intel Graphics 4-Core iGPU (Arc) ⎘ 16 GB Bellek | Amazon: $1,699.00 Liste fiyatı: 2000 USD | 1.4 kg | 15.95 mm | 13.30" 2880x1800 255 PPI OLED |
4. 88.1% v7 (old) 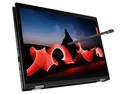 | Lenovo ThinkPad L13 Yoga G4 i7-1355U Intel Core i7-1355U ⎘ Intel Iris Xe Graphics G7 96EUs ⎘ 16 GB Bellek, 512 GB SSD | Amazon: 1. $899.98 Lenovo ThinkPad T14 Gen 5 Bu... 2. $1,369.00 Lenovo ThinkPad T14 G4 Home ... 3. $23.95 mCover Case Compatible ONLY ... Liste fiyatı: 1589 USD | 1.4 kg | 17.1 mm | 13.30" 1920x1200 170 PPI IPS |
5. 90.3% v7 (old)  | HP Elite Dragonfly Folio 13.5 G3 Intel Core i7-1265U ⎘ Intel Iris Xe Graphics G7 96EUs ⎘ 16 GB Bellek, 512 GB SSD | Amazon: 1. $19.99 New Slim 65W USB C Laptop Ch... 2. $39.99 Smatree Hard EVA Protective ... 3. $34.99 Broonel Black Leather Folio ... Liste fiyatı: 3900 USD | 1.4 kg | 17.8 mm | 13.50" 1920x1280 171 PPI IPS |
6. 89% v7 (old) 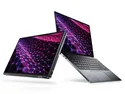 | Dell Latitude 9330 Intel Core i7-1260U ⎘ Intel Iris Xe Graphics G7 96EUs ⎘ 16 GB Bellek | Amazon: 1. $25.99 65W USB C Charger Genuine Re... 2. $42.93 Berfea Protective Cover Case... 3. $36.77 Dell Laptop Charger 90W Watt... | 1.2 kg | 14.1 mm | 13.30" 2560x1600 227 PPI IPS |
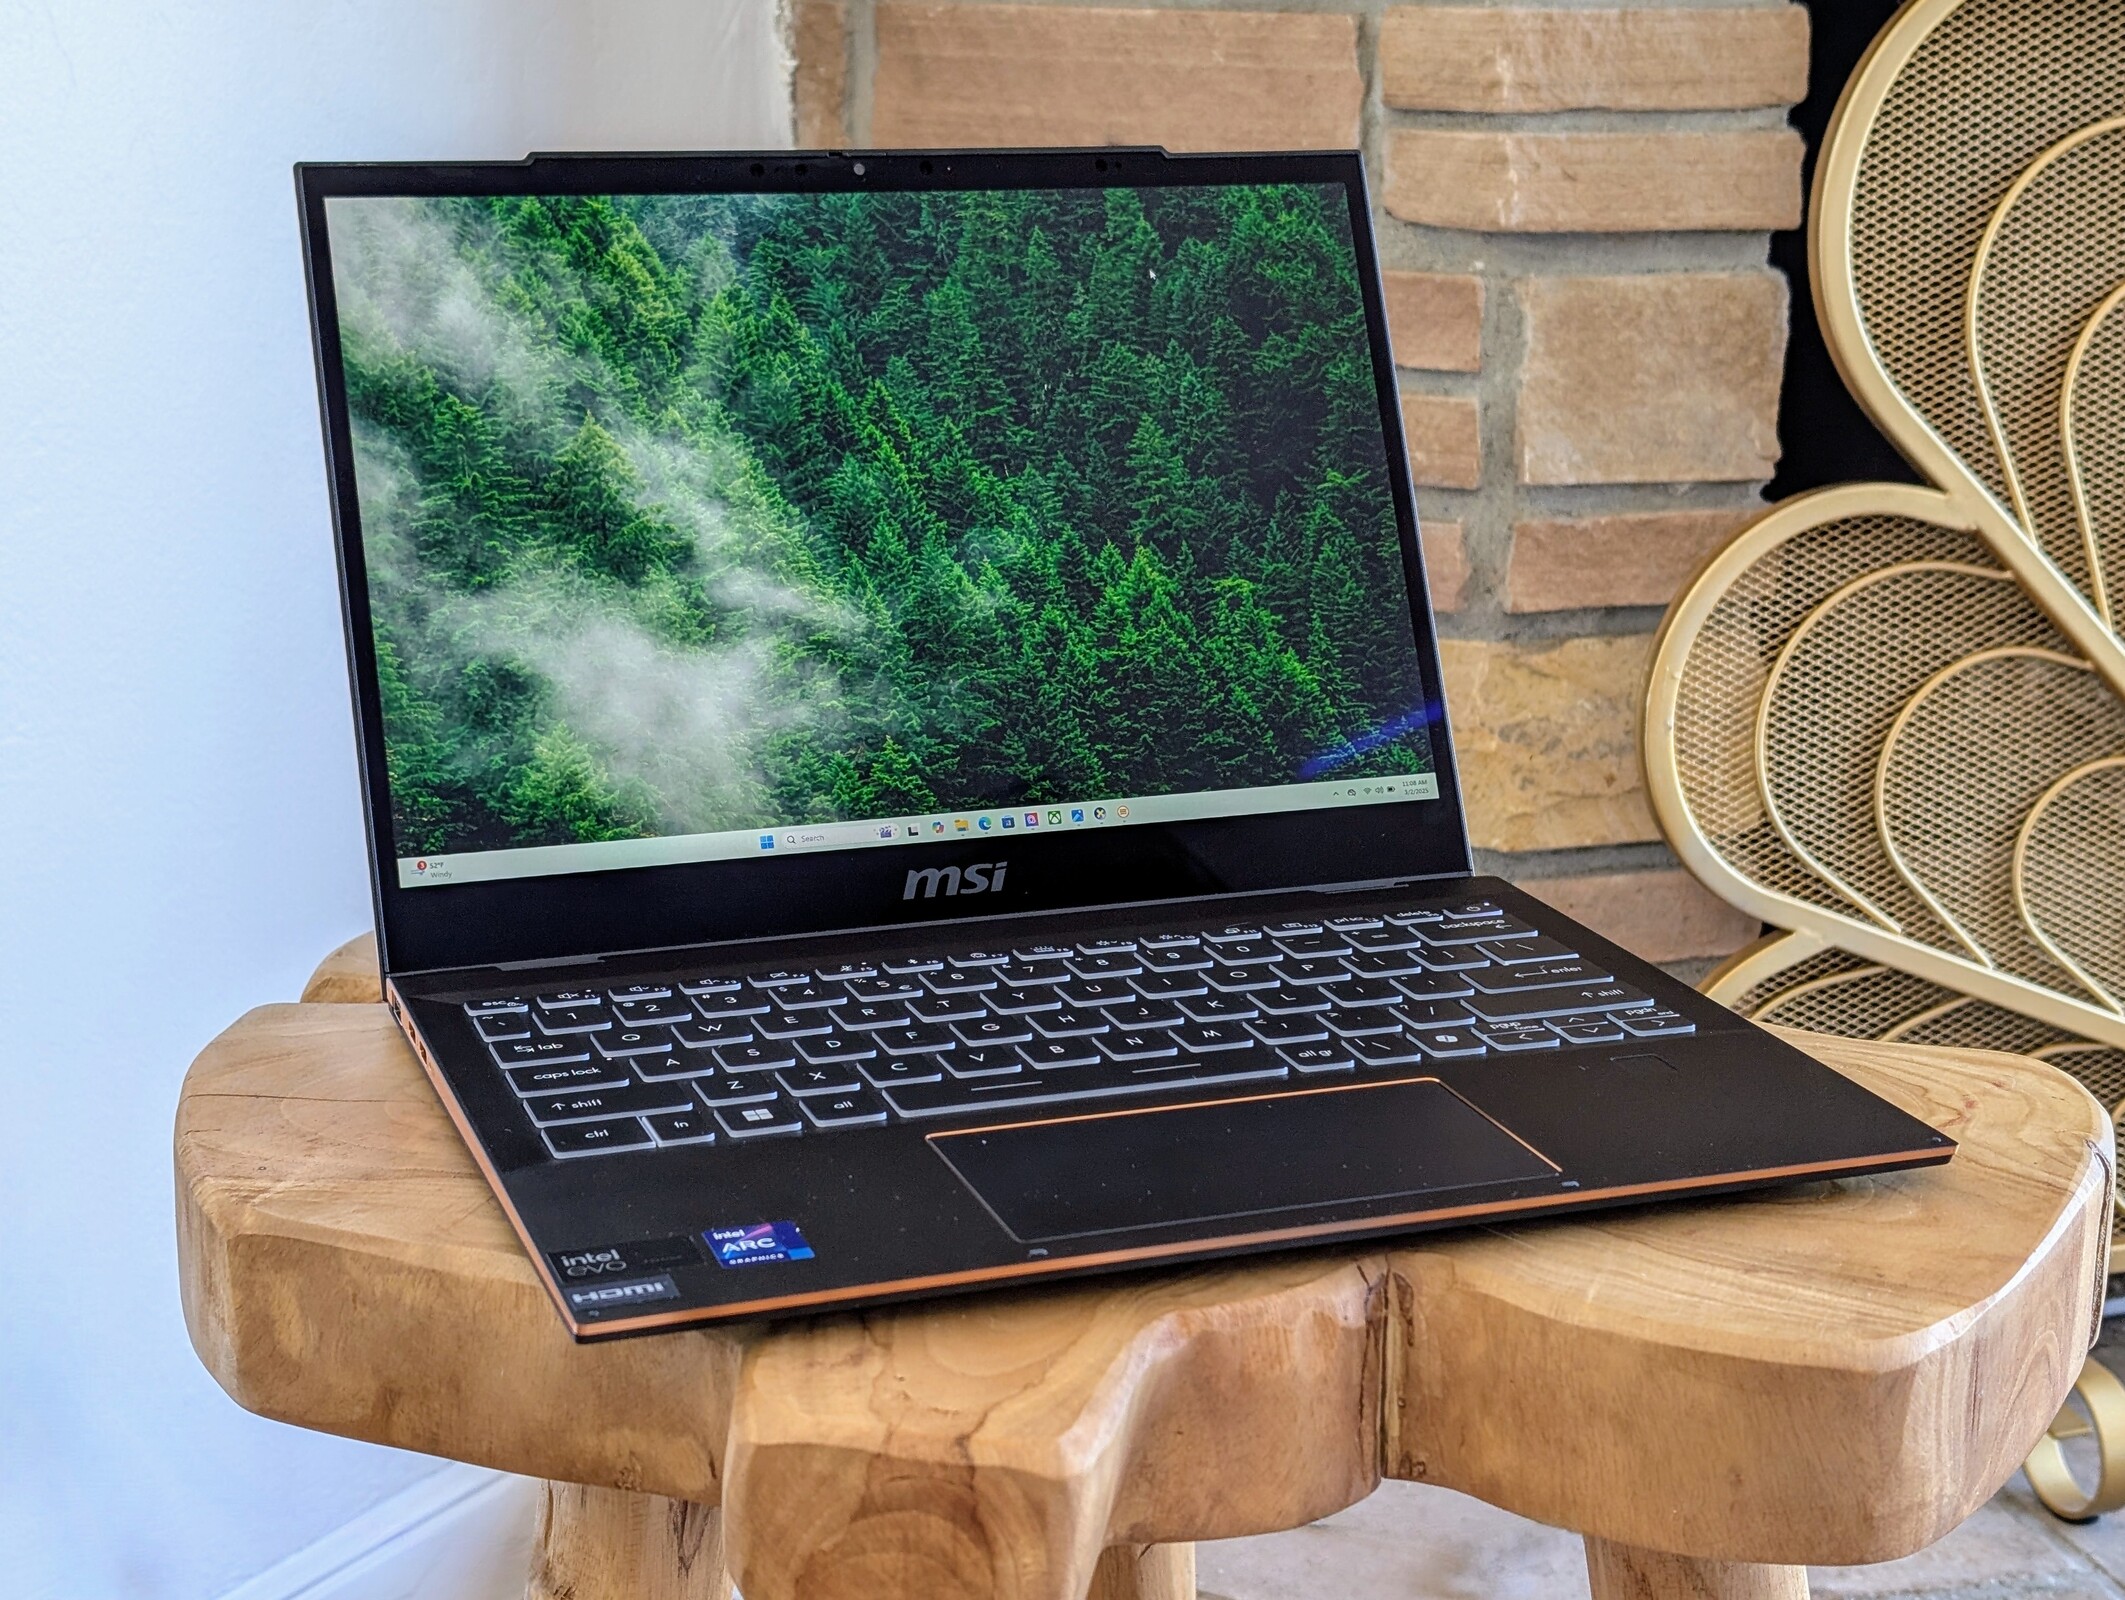
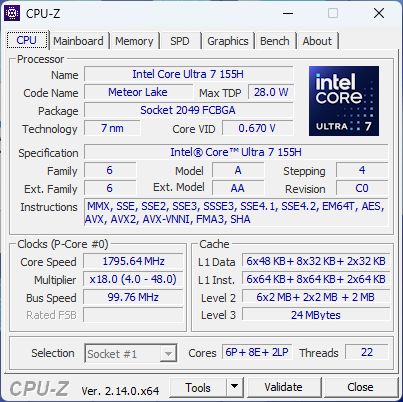
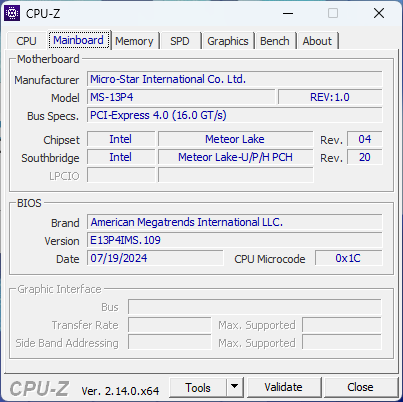
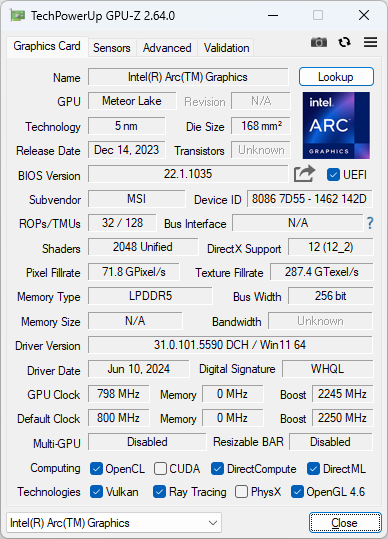
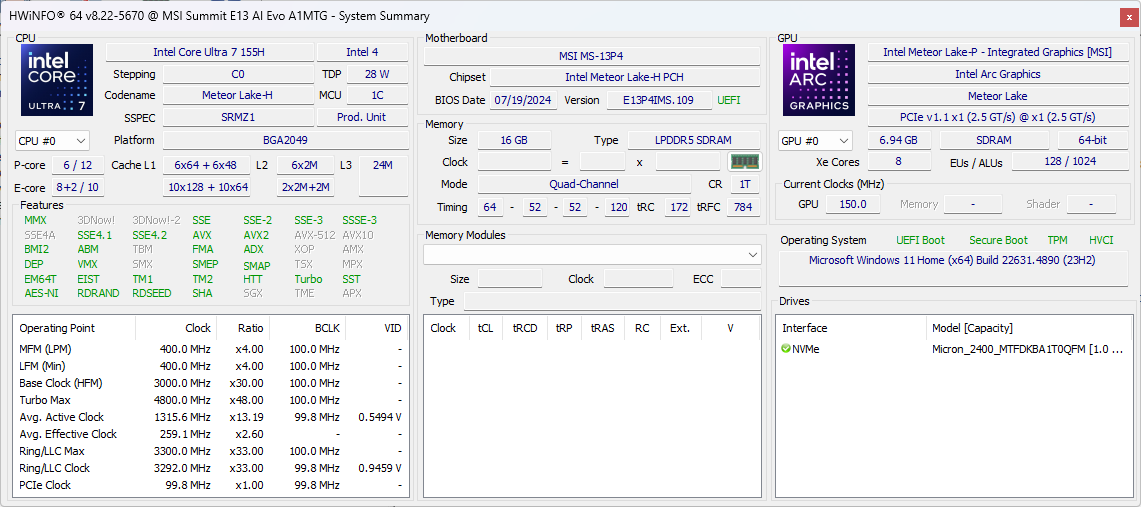
2024 Summit E13 AI Evo A1MTG, 2021 Summit E13 Flip Evo modelinin güncellenmiş versiyonudur. "Flip" takma adı bırakılmış olsa da, model hala selefi gibi 2'si 1 arada bir form faktörüdür. Model, 2021 modelindeki eski Tiger Lake-U seçeneğinin yerini alan daha yeni bir Intel Core Meteor Lake-H işlemci ile birlikte geliyor.
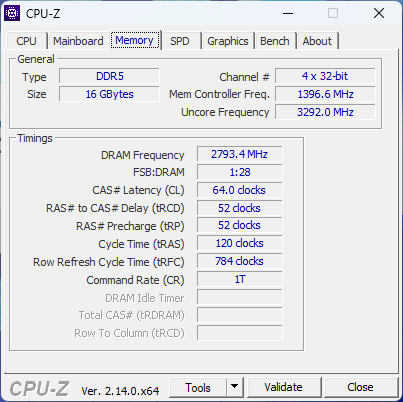
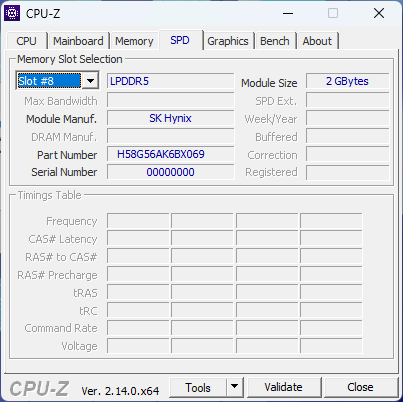
Test ünitemiz Core Ultra 7 155H CPU, 16 GB LPDDR5-5600 RAM ve 1 TB SSD ile yaklaşık 1100 $ karşılığında donatılmıştır. Diğer SKU'lar 32 GB LPDDR5-6400 RAM veya daha yavaş Core Ultra 5 125H sunabilir, ancak 1200p IPS dokunmatik ekran tüm seride sabit görünüyor.
Rakipler arasında Dell Latitude 9330, HP Elite Dragonfly Folio veya Lenovo ThinkPad L13 Yoga G4 gibi diğer 13 inçlik ofis alt dizüstü bilgisayarları yer alıyor.
Daha fazla MSI incelemesi:
Teknik Özellikler
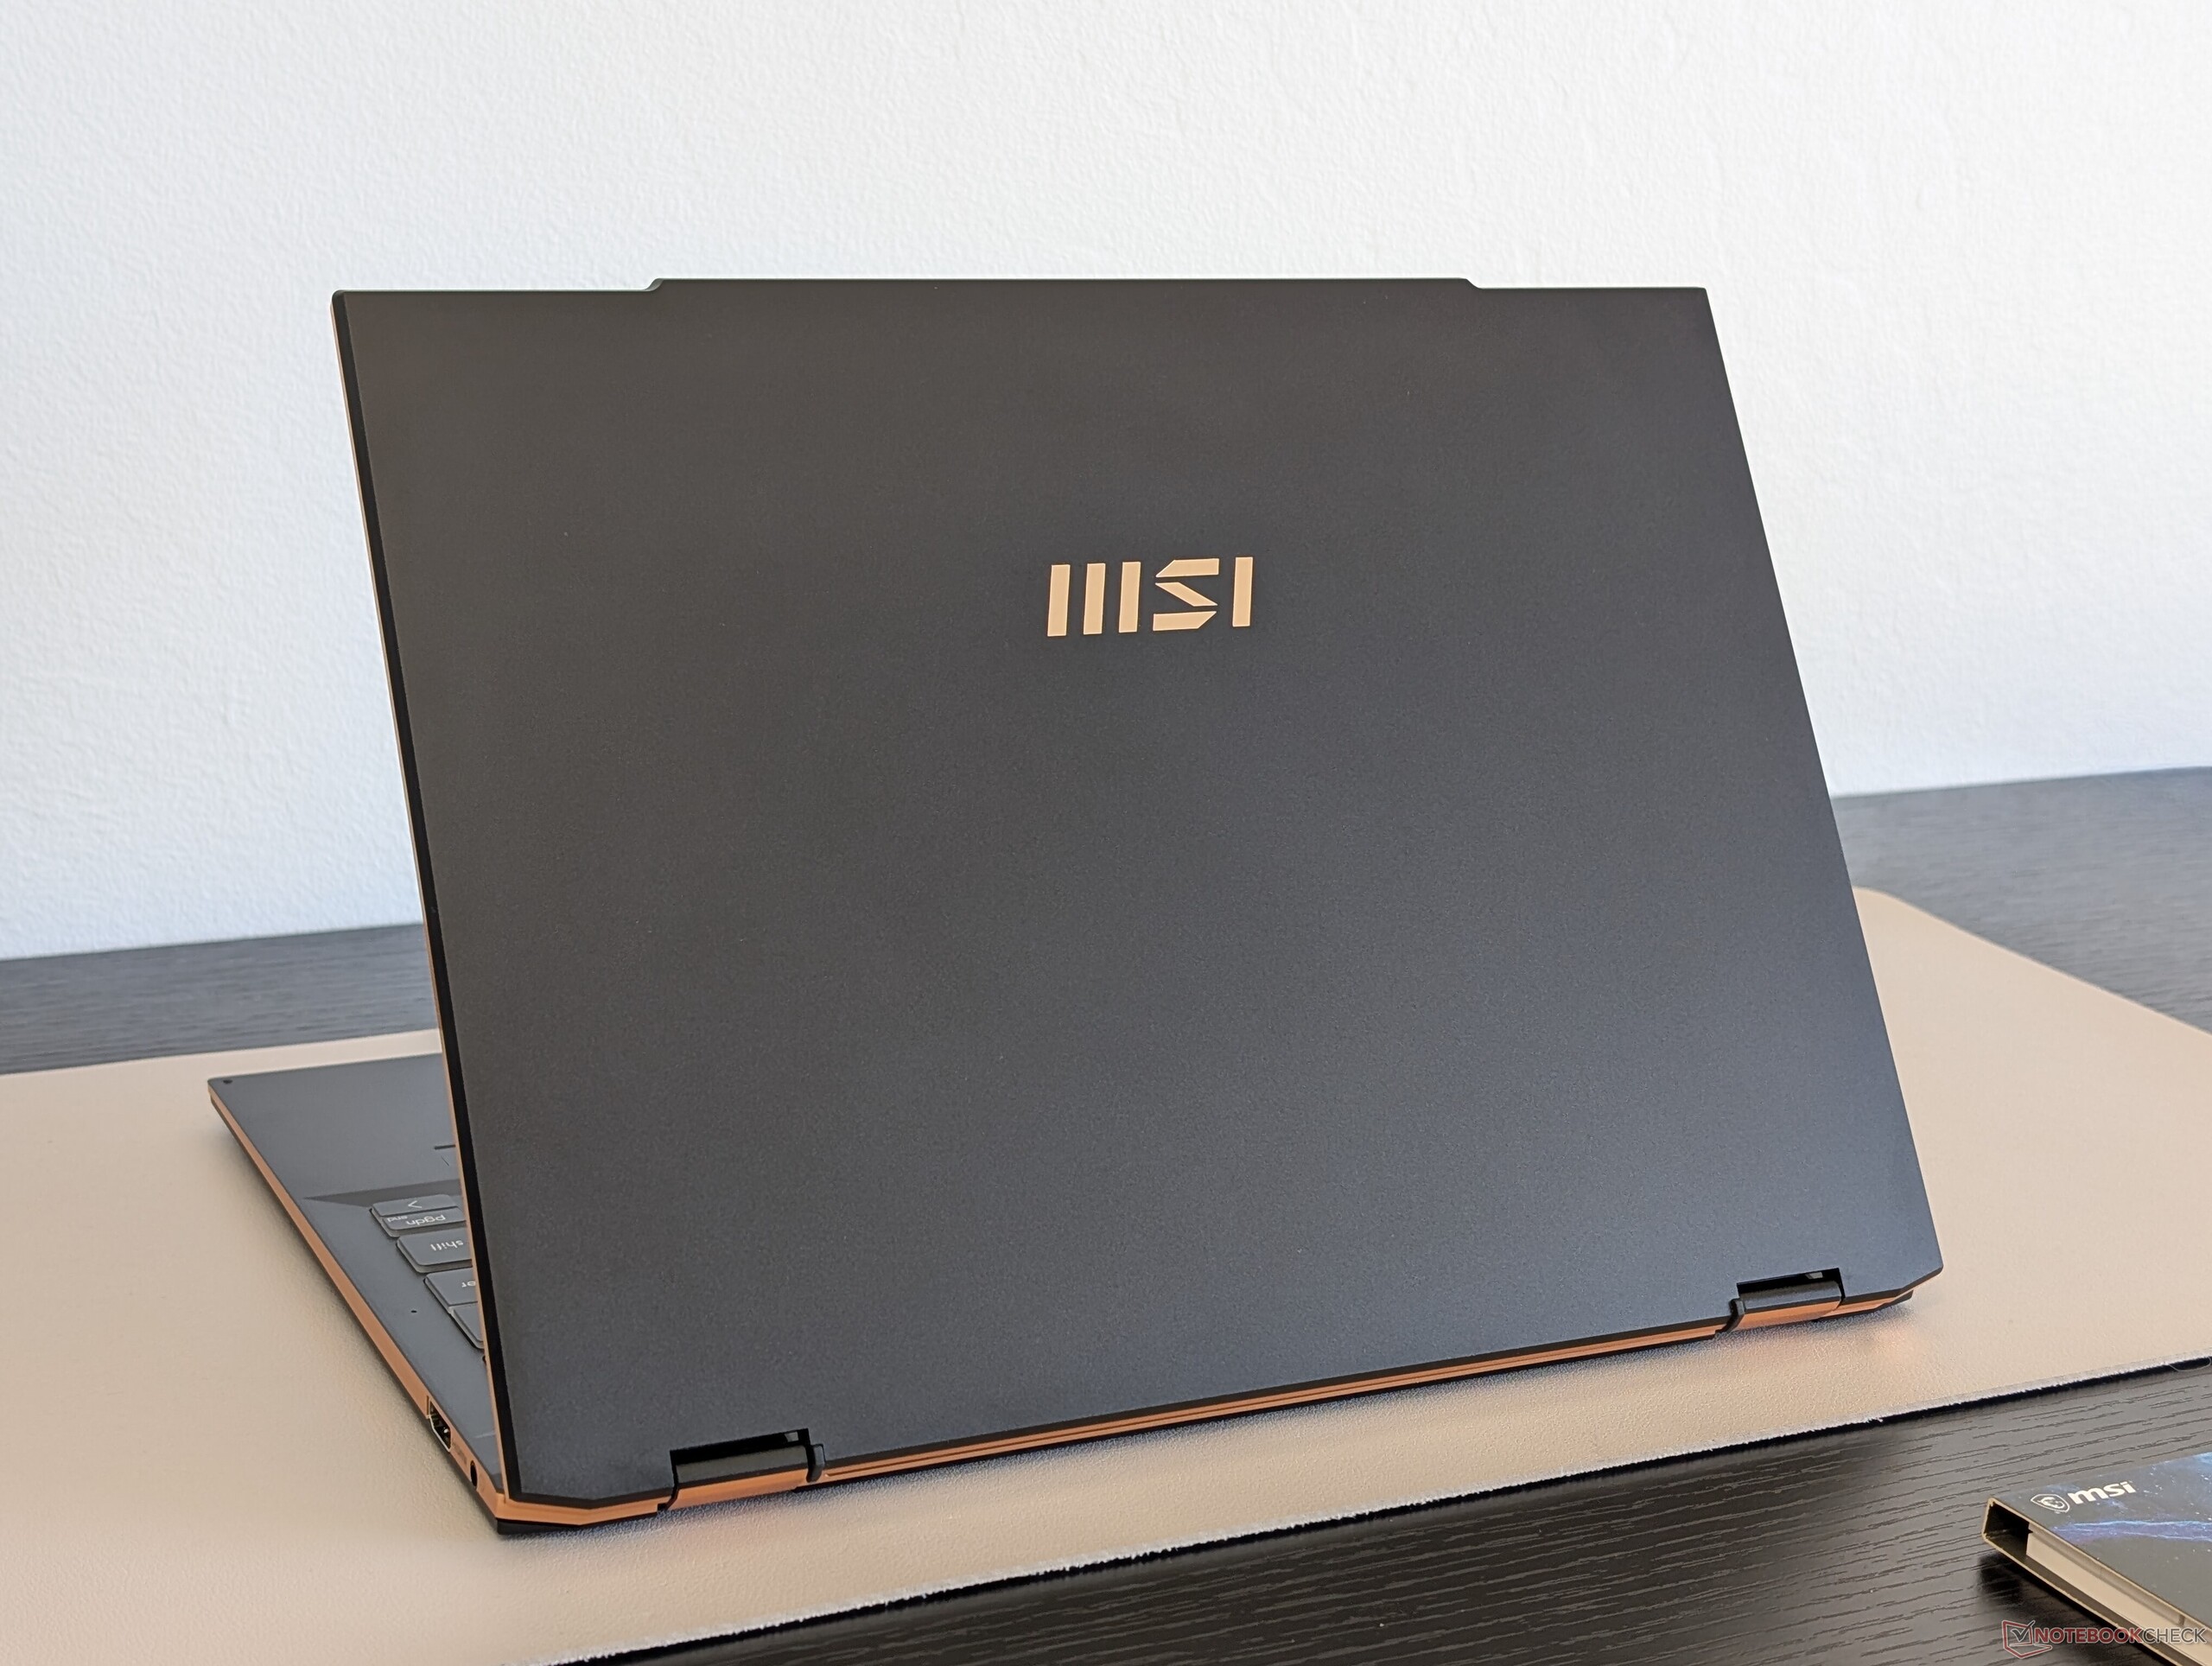
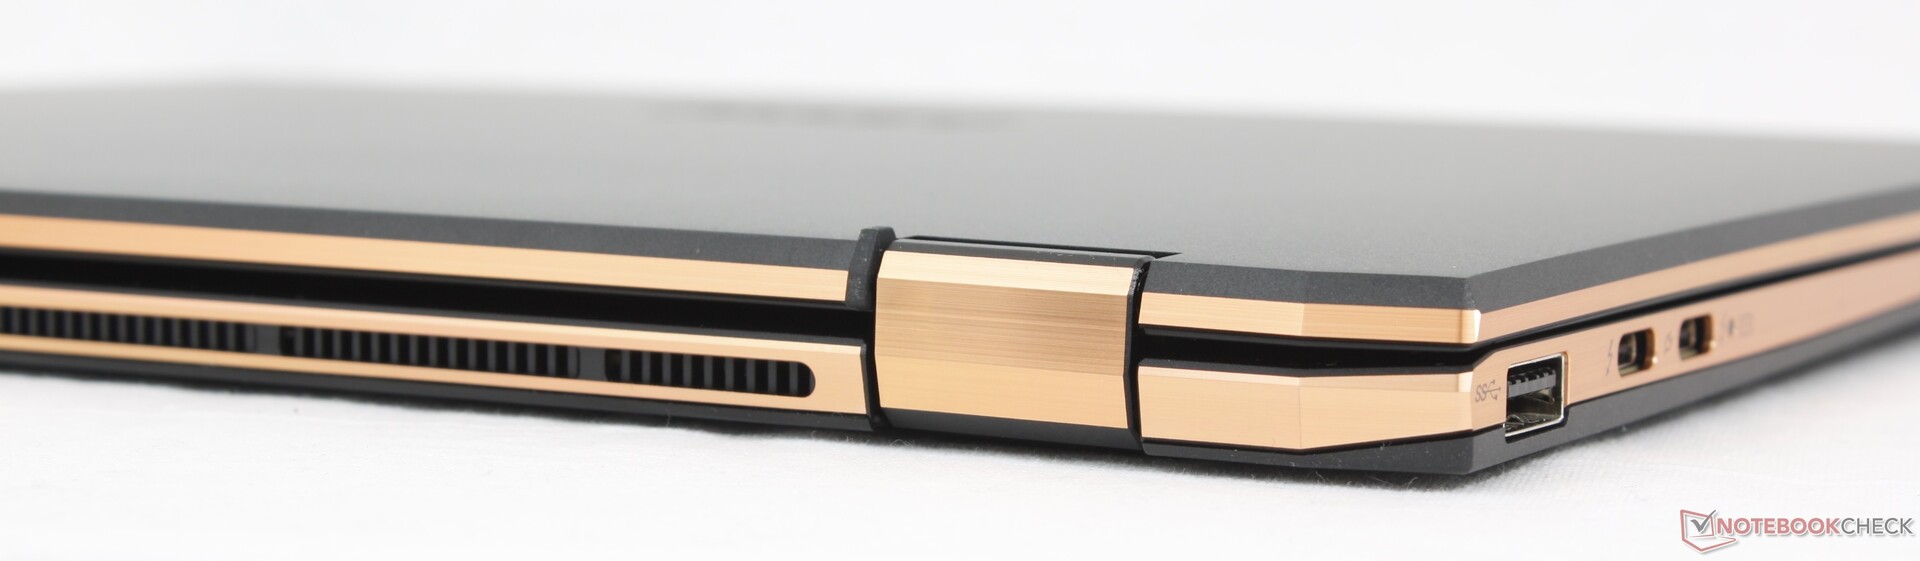
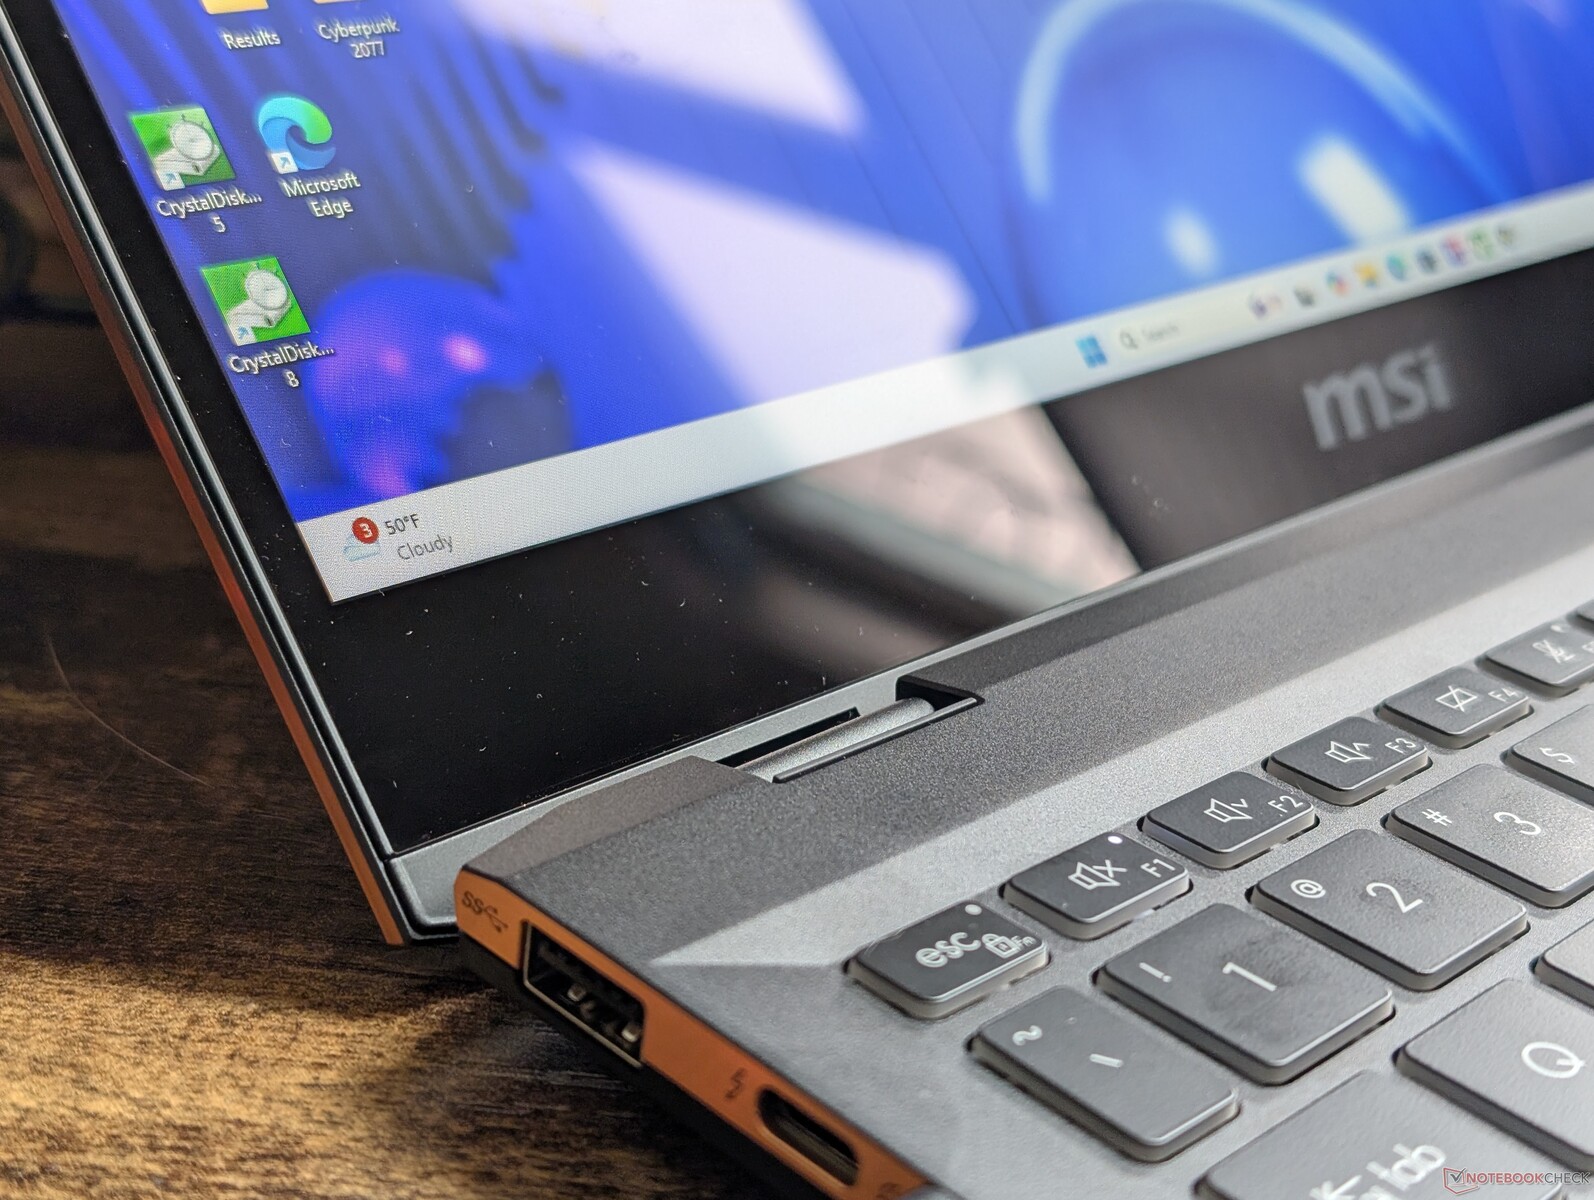
Kasa - Altın Süslemeler
2024 Summit E13, 2021 versiyonuna kıyasla farklı bağlantı noktaları ve yeni bir web kamerası deklanşörü taşıyor. Aksi takdirde, kasalar hem harici hem de dahili olarak aralarında büyük bir değişiklik olmadığı için aynıdır.
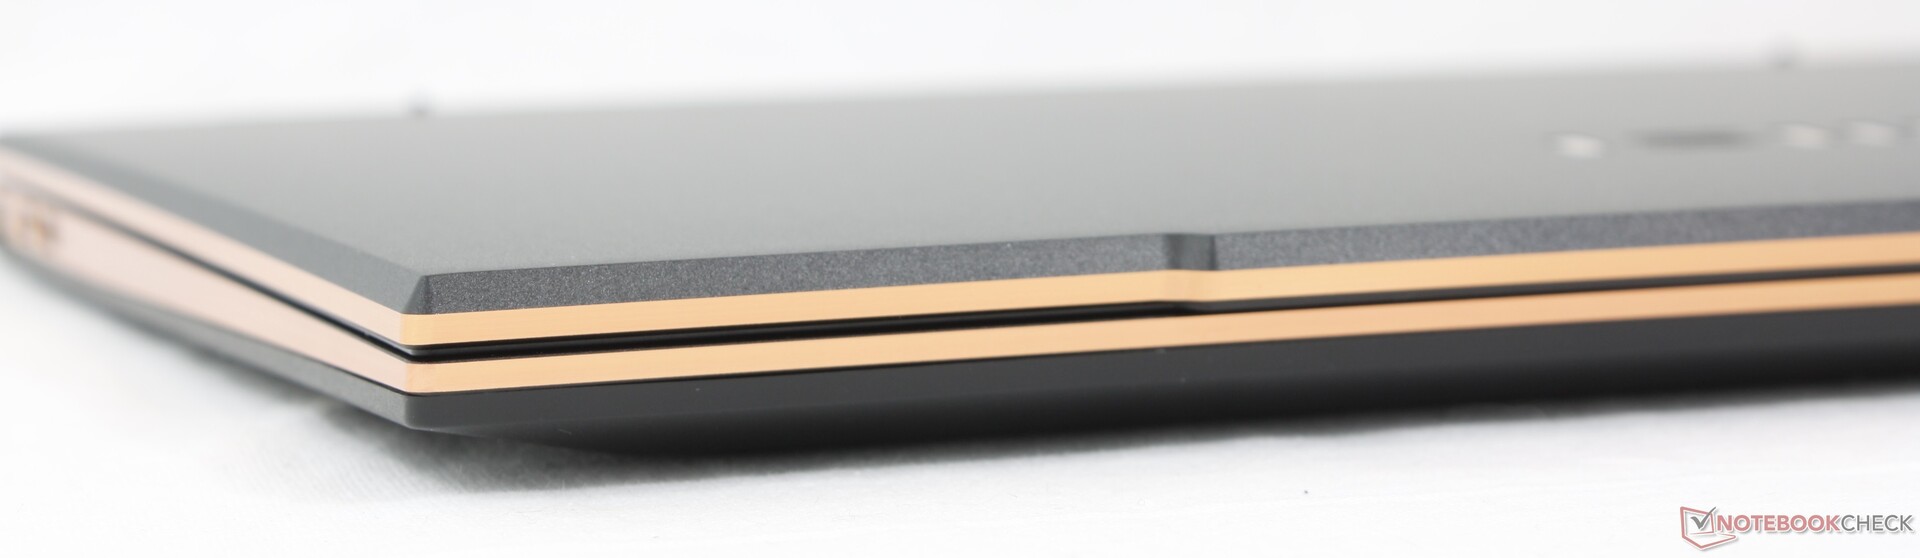
Bağlanabilirlik - Bu Yıl Yeni Limanlar
Port seçenekleri 2021 modeline göre değişti ve daha iyi olması gerekmiyor. USB-C bağlantı noktalarından biri HDMI lehine kaldırılırken MicroSD okuyucu tamamen çıkarıldı.

İletişim
| Networking | |
| iperf3 transmit AX12 | |
| MSI Summit E13 Flip Evo A11MT | |
| iperf3 receive AX12 | |
| MSI Summit E13 Flip Evo A11MT | |
| iperf3 transmit AXE11000 | |
| Lenovo ThinkPad L13 Yoga G4 i7-1355U | |
| HP Elite Dragonfly Folio 13.5 G3 | |
| Dell Latitude 9330 | |
| Lenovo Yoga Book 9 13IMU9 | |
| MSI Summit E13 AI Evo A1MTG | |
| iperf3 receive AXE11000 | |
| Lenovo ThinkPad L13 Yoga G4 i7-1355U | |
| Lenovo Yoga Book 9 13IMU9 | |
| HP Elite Dragonfly Folio 13.5 G3 | |
| Dell Latitude 9330 | |
| MSI Summit E13 AI Evo A1MTG | |
| iperf3 transmit AXE11000 6GHz | |
| HP Elite Dragonfly Folio 13.5 G3 | |
| Dell Latitude 9330 | |
| MSI Summit E13 AI Evo A1MTG | |
| Lenovo Yoga Book 9 13IMU9 | |
| iperf3 receive AXE11000 6GHz | |
| HP Elite Dragonfly Folio 13.5 G3 | |
| MSI Summit E13 AI Evo A1MTG | |
| Dell Latitude 9330 | |
| Lenovo Yoga Book 9 13IMU9 | |
Web kamerası
Web kamerası sadece IR desteği ile 1080p veya 2 MP olarak aynı kalır.


Bakım
Servis, LaptopMedia servis videosuna göre anakart düzenine kadar 2021 modeliyle benzerdir. RAM yükseltilemez ve yalnızca bir adede kadar M.2 2280 SSD desteklenir.
Sürdürülebilirlik
MSI, üretim sırasında hiçbir sürdürülebilirlik önlemi alınmadığını belirtiyor. Bunun dışında perakende kutusu çoğunlukla kağıt ve kartondan oluşuyor ve AC adaptörü için plastik ambalaj kullanılmış.
Aksesuarlar ve Garanti
Perakende kutusunda AC adaptörü ve evraklara ek olarak MSI Pen 2 aktif stylus bulunmaktadır. ABD'de satın alındığında bir yıllık sınırlı üretici garantisi geçerlidir.
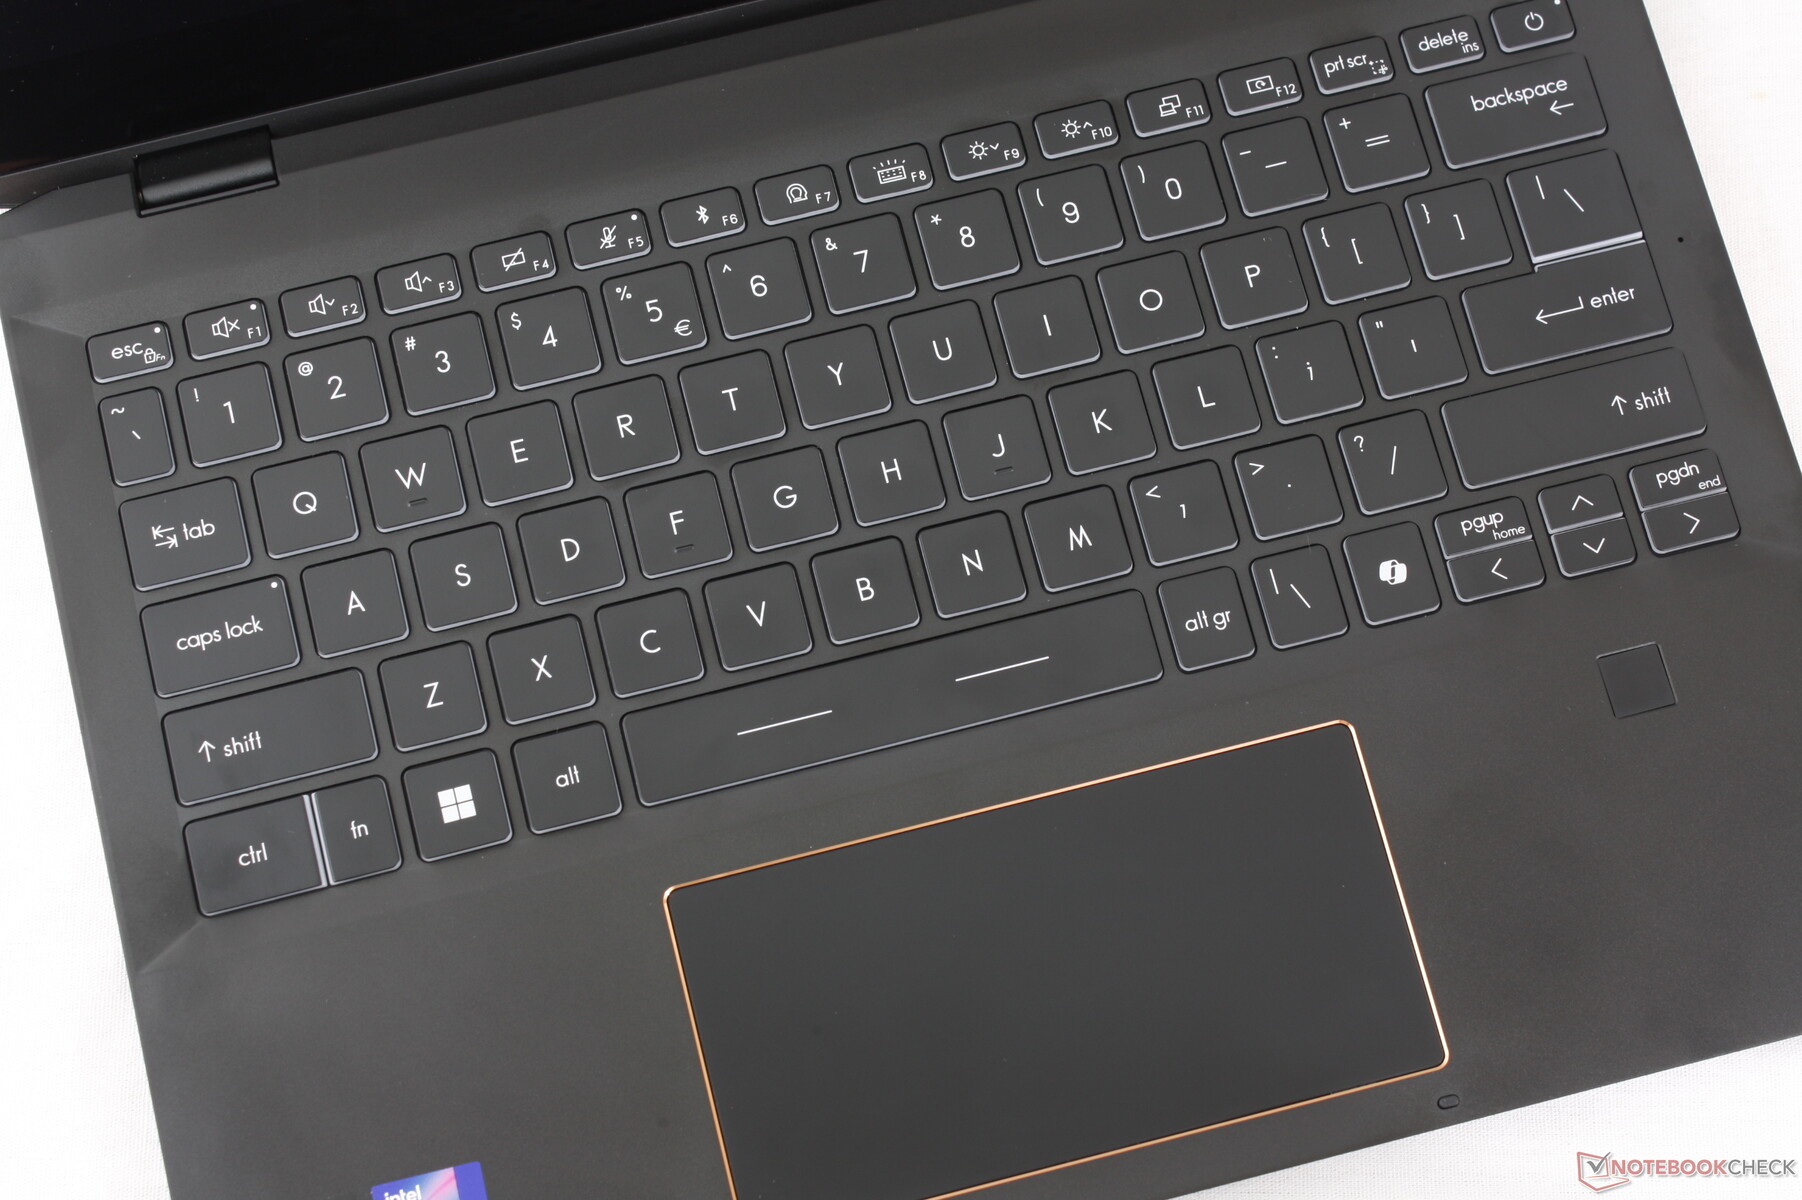
Giriş Aygıtları
Klavye ve clickpad, 2021 modeliyle aynı yazma deneyimi için genel boyut veya geri bildirim açısından değişmedi. Bu yıl yeni olan özel Co-Pilot tuşu ve biraz revize edilmiş Fn ve Ctrl tuşları. Ne yazık ki, küçük PgUp, PgDn ve ok tuşları çok sıkışık, süngerimsi ve genel olarak güvenilmez olmaya devam ediyor.
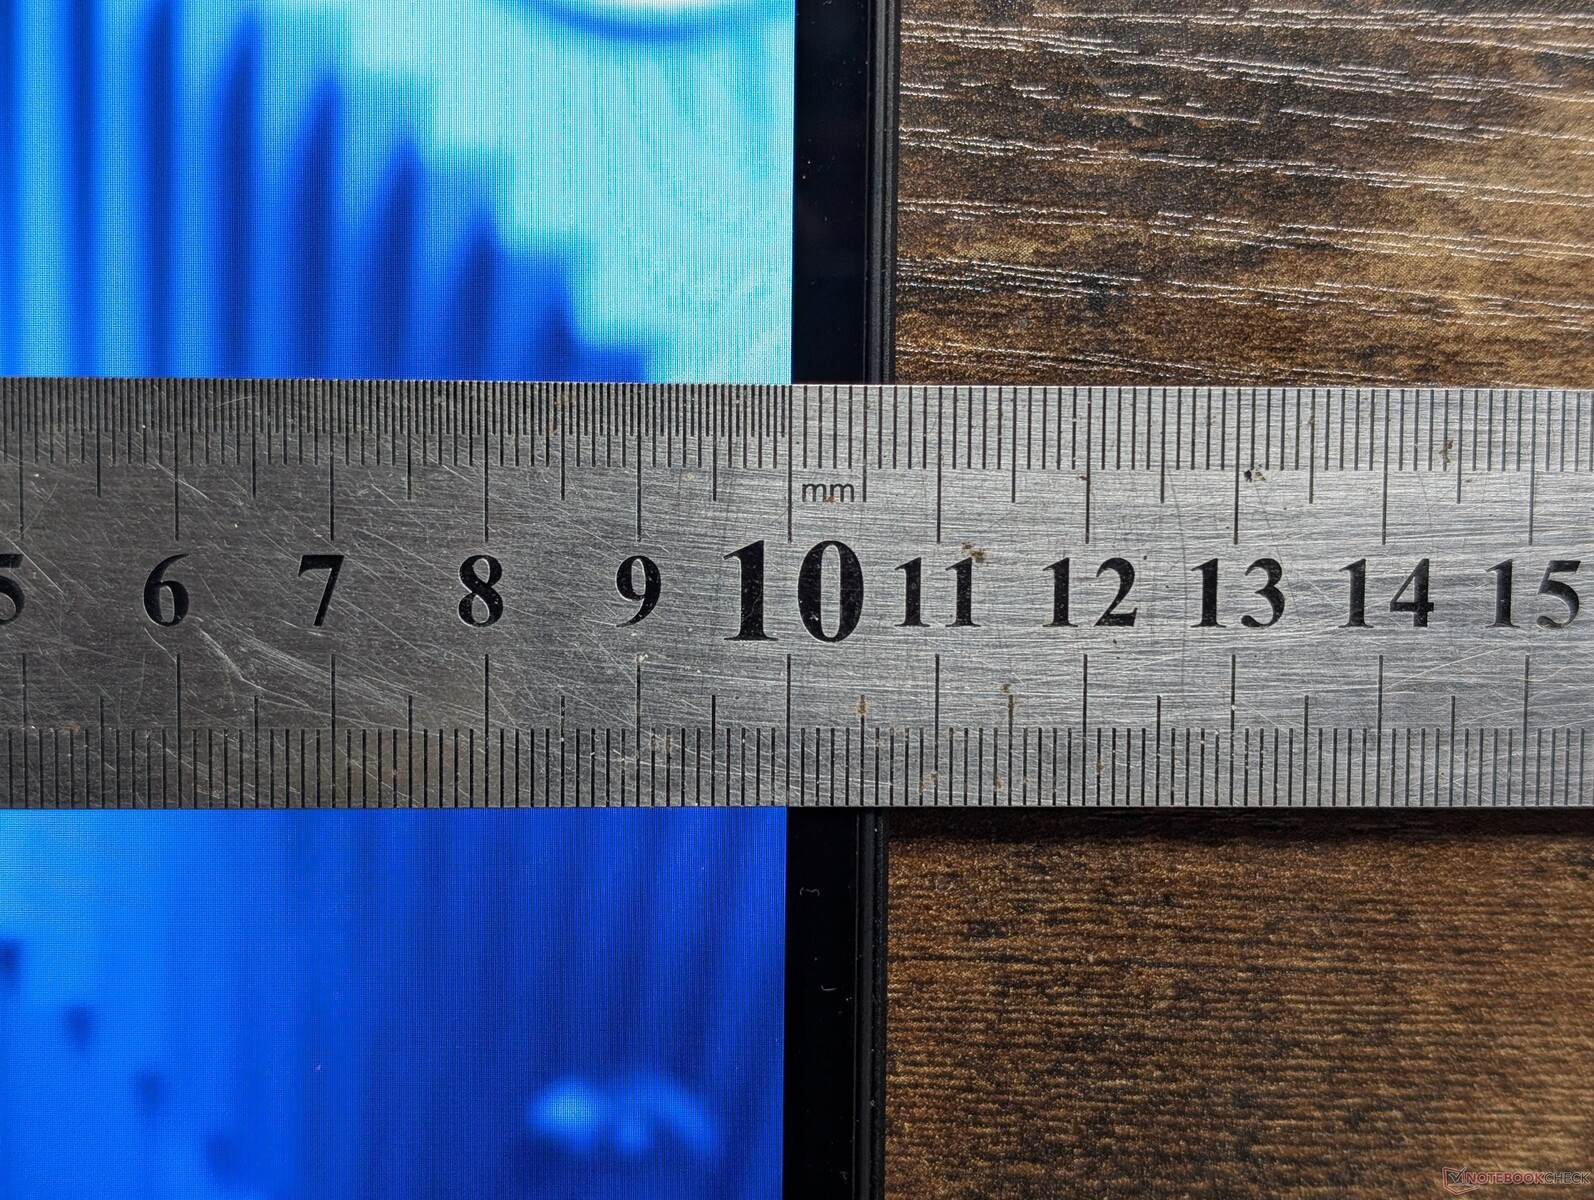
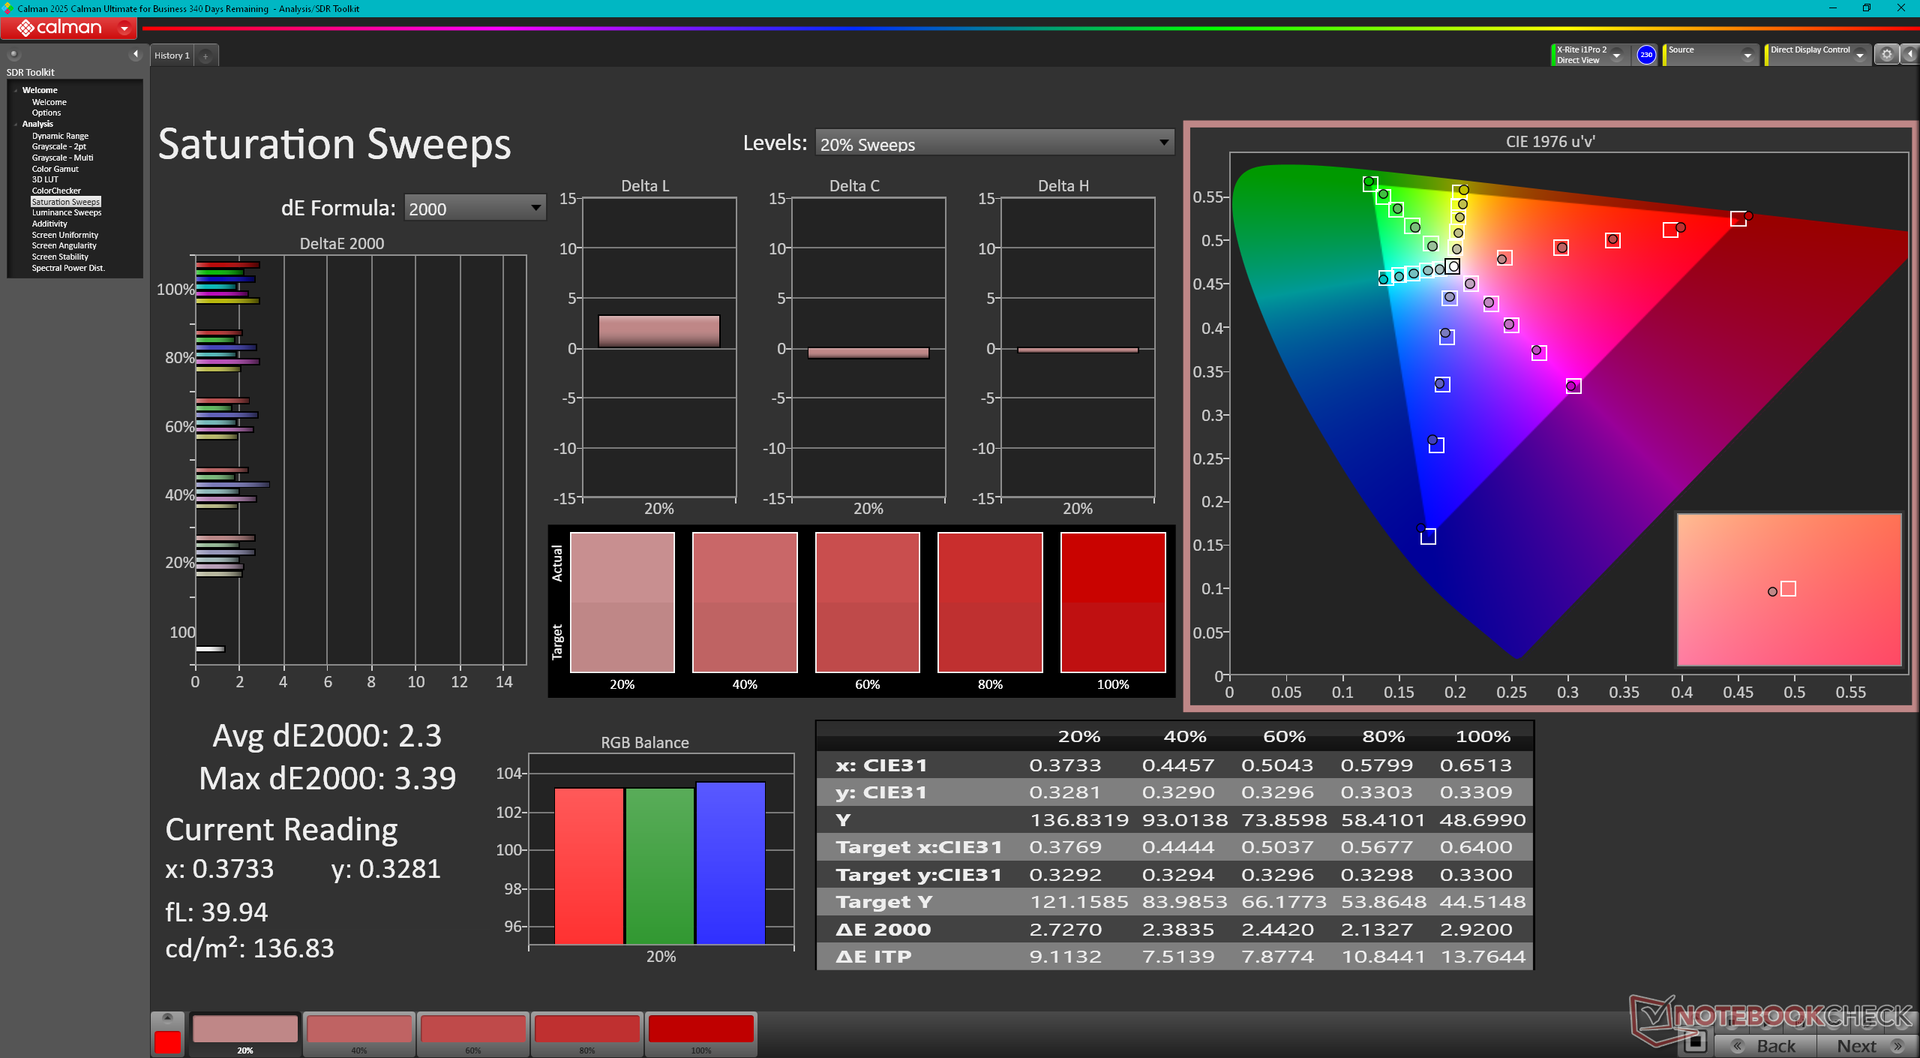
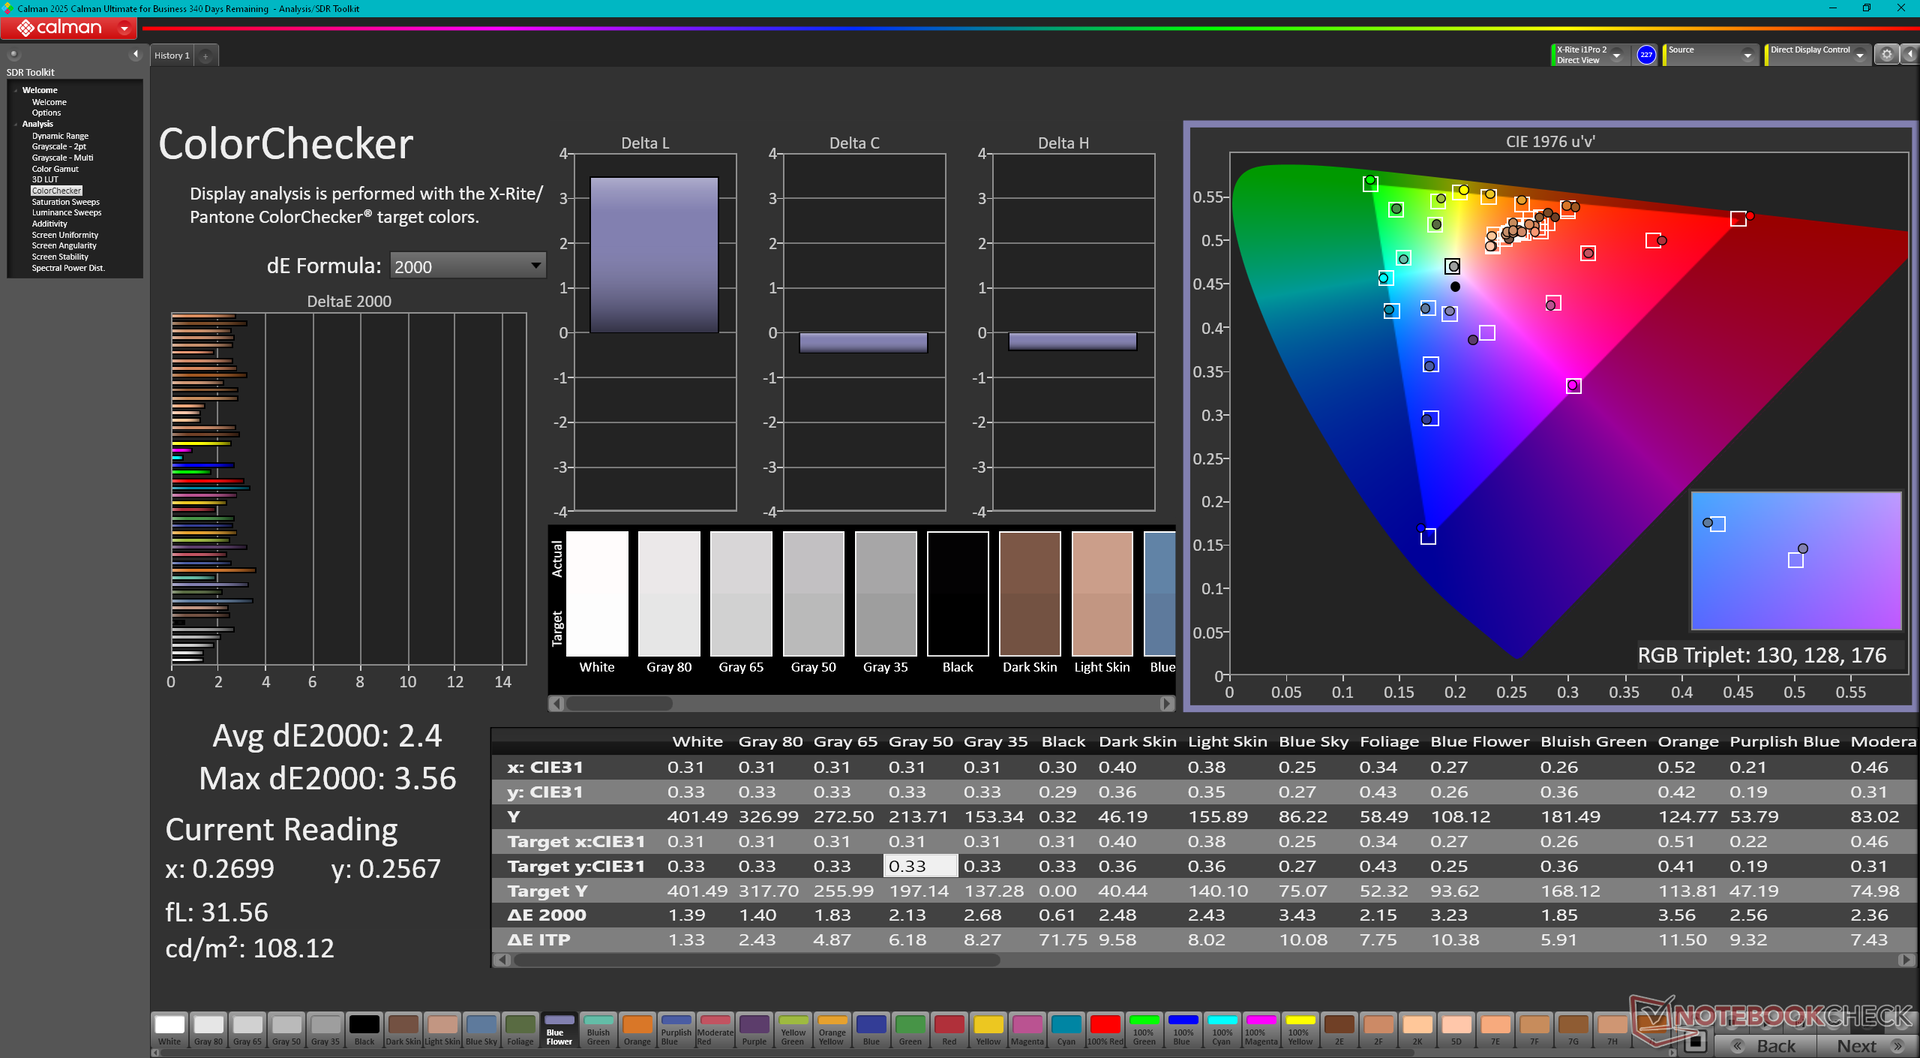
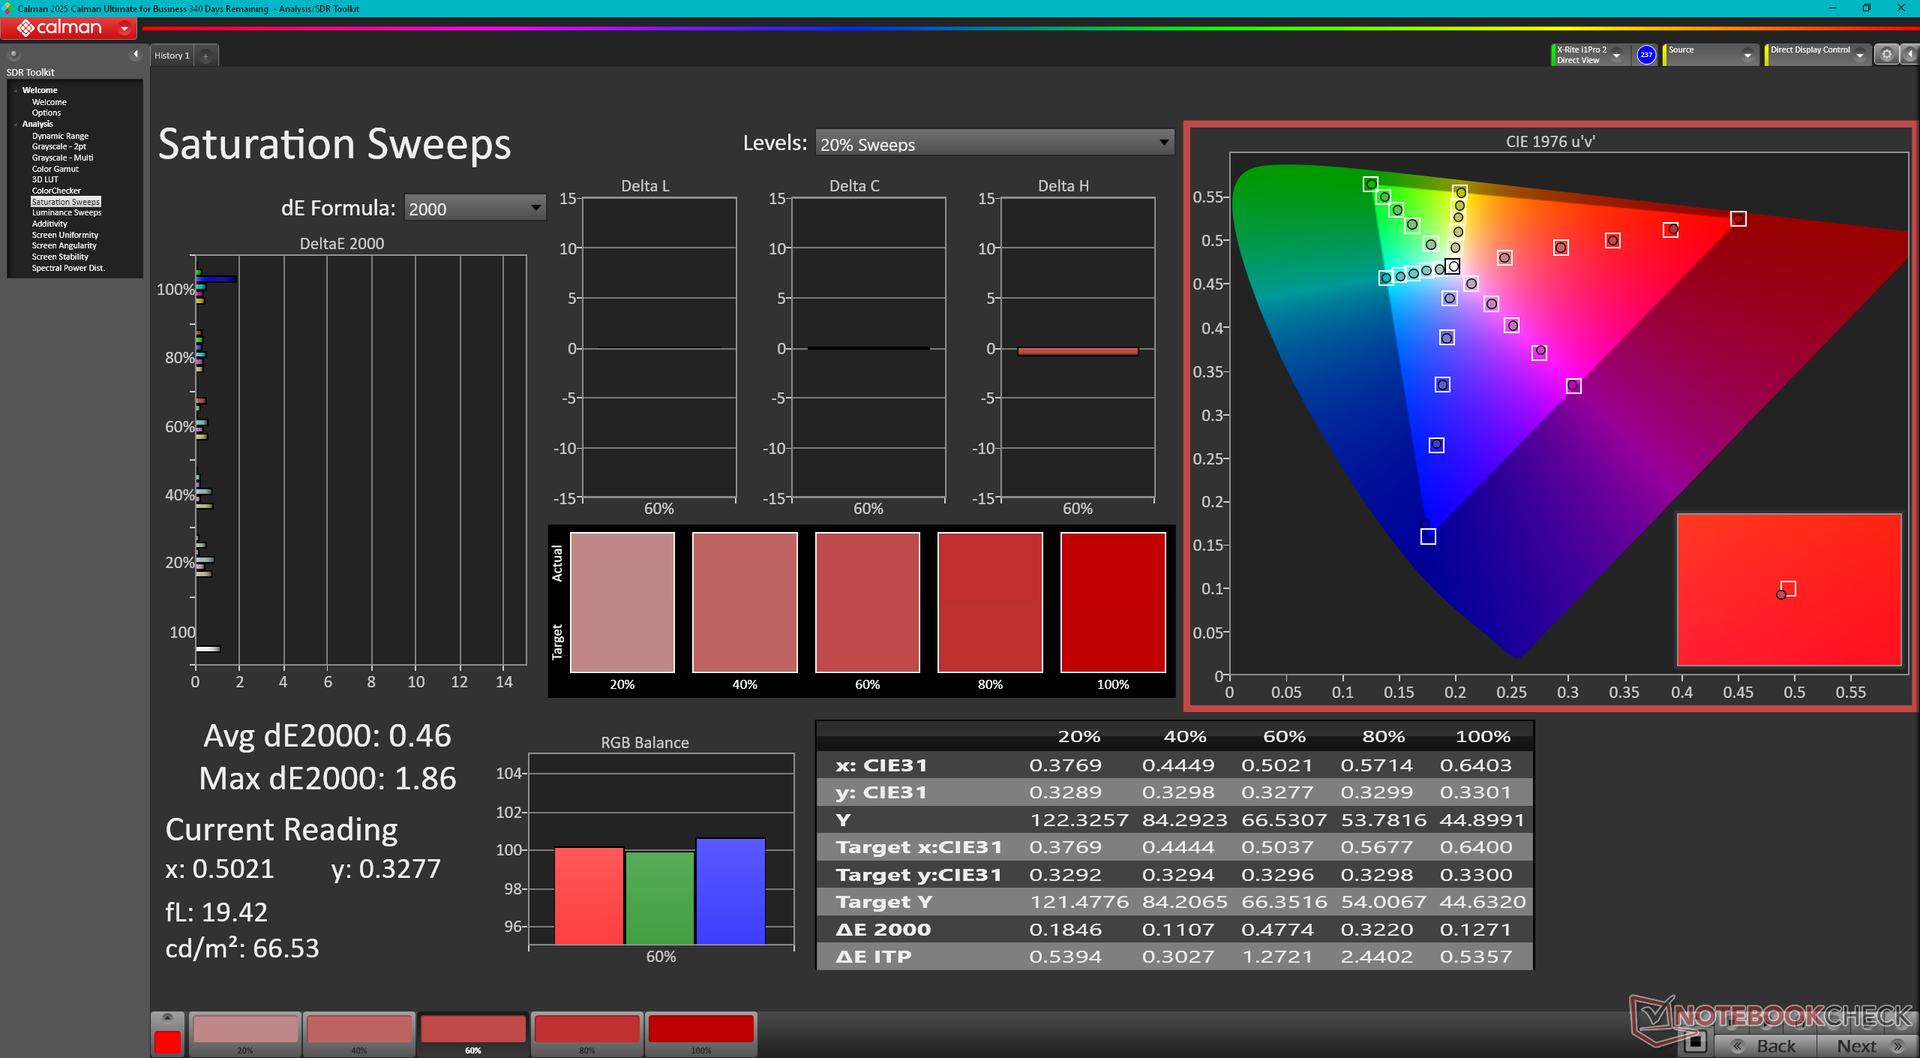
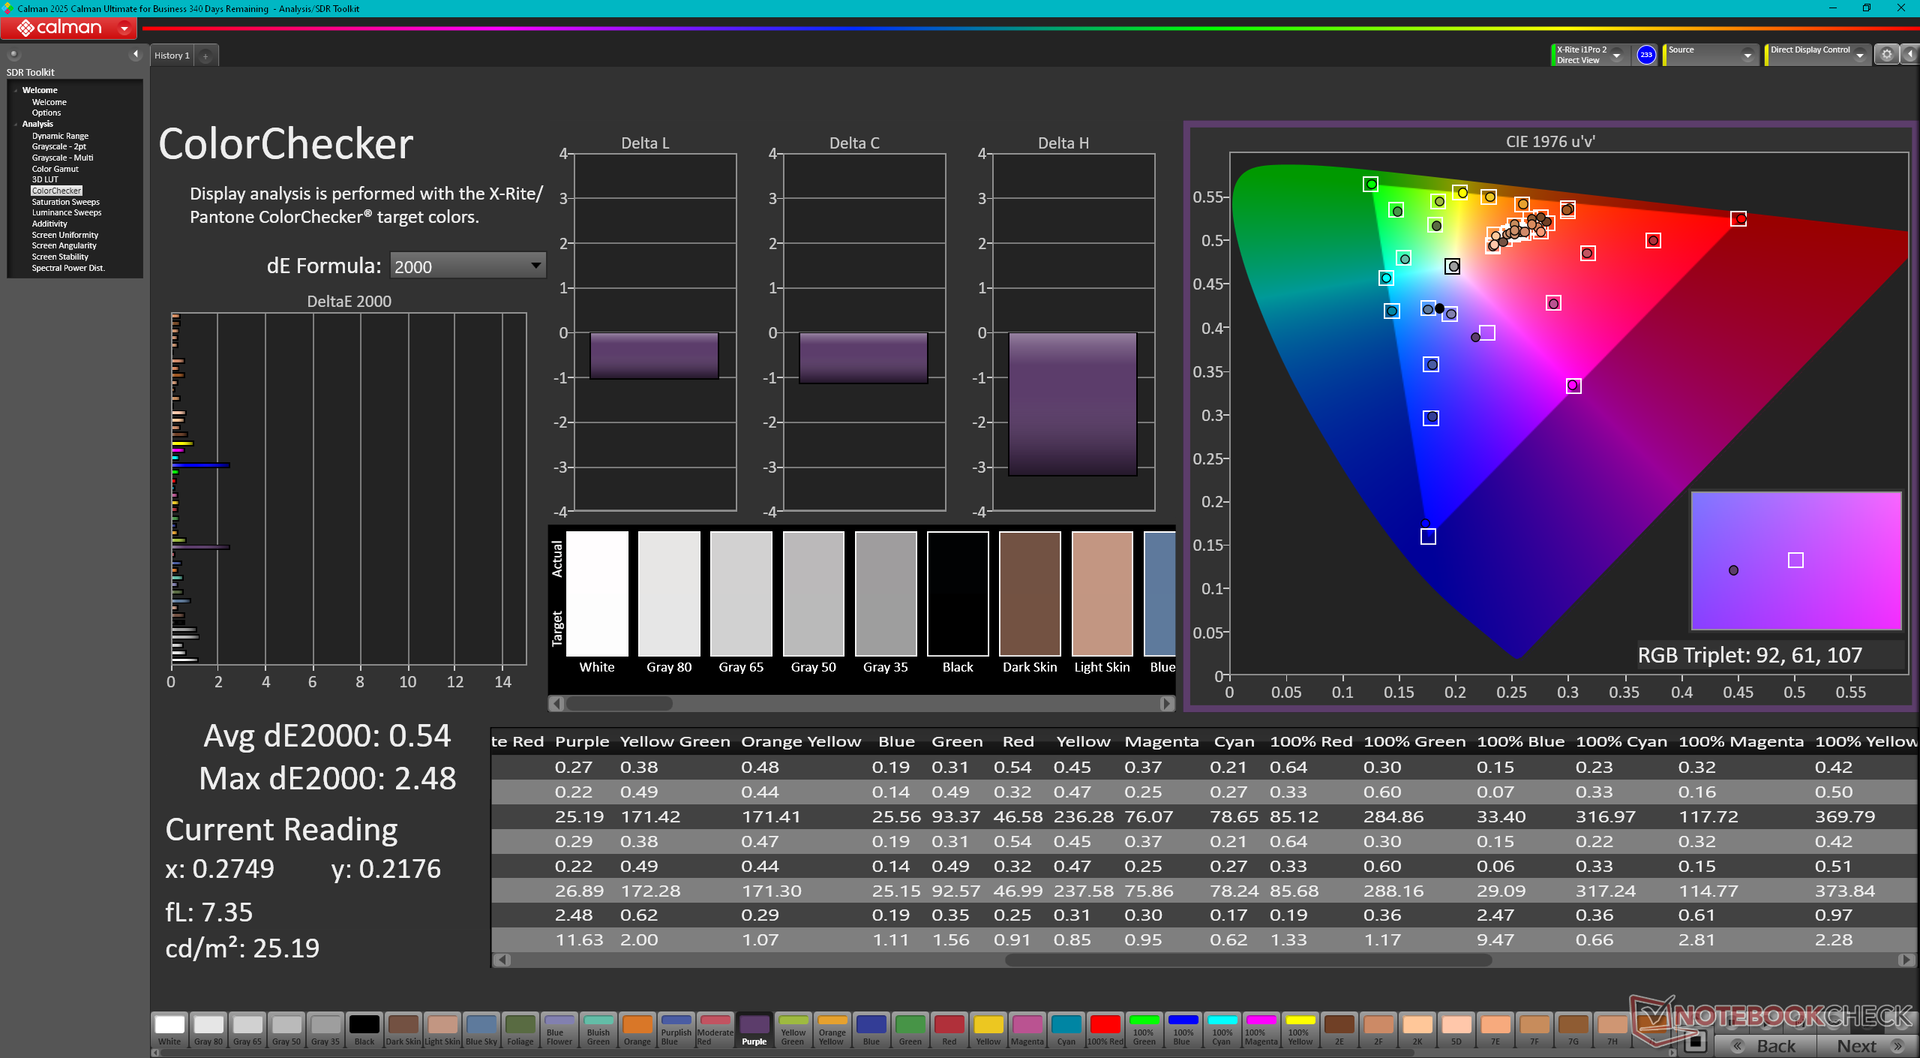
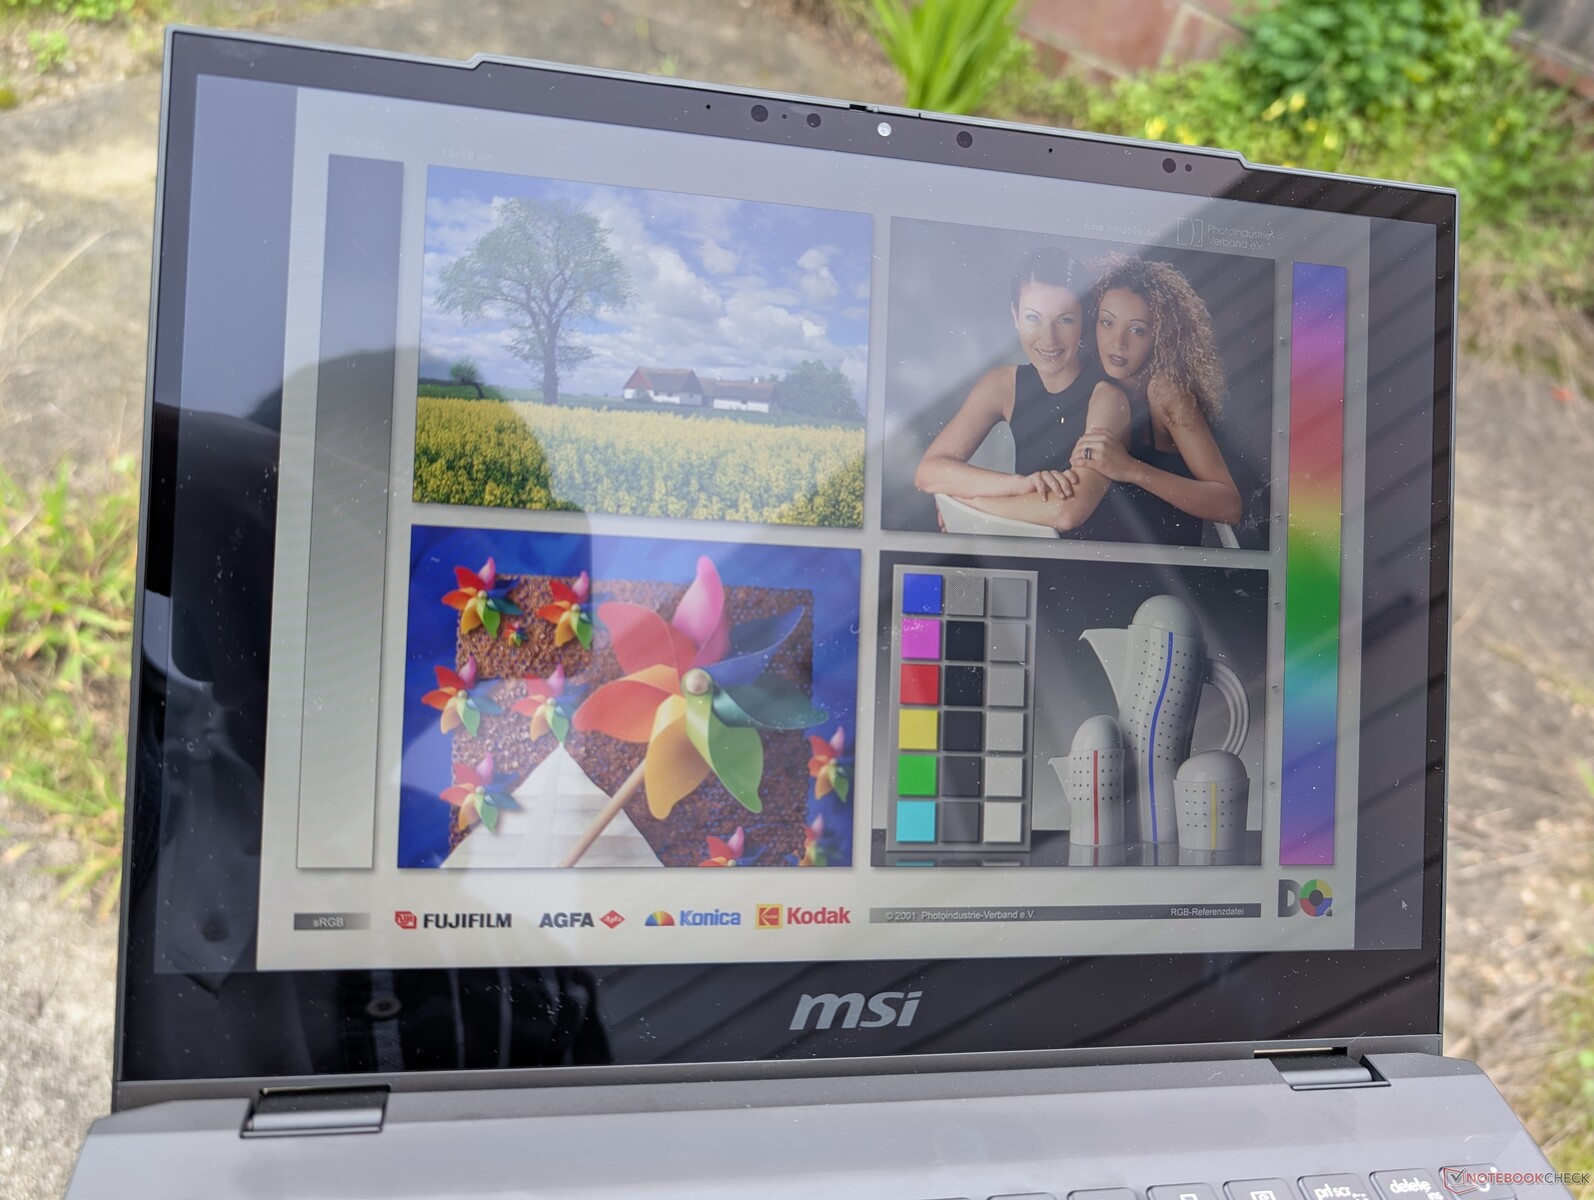
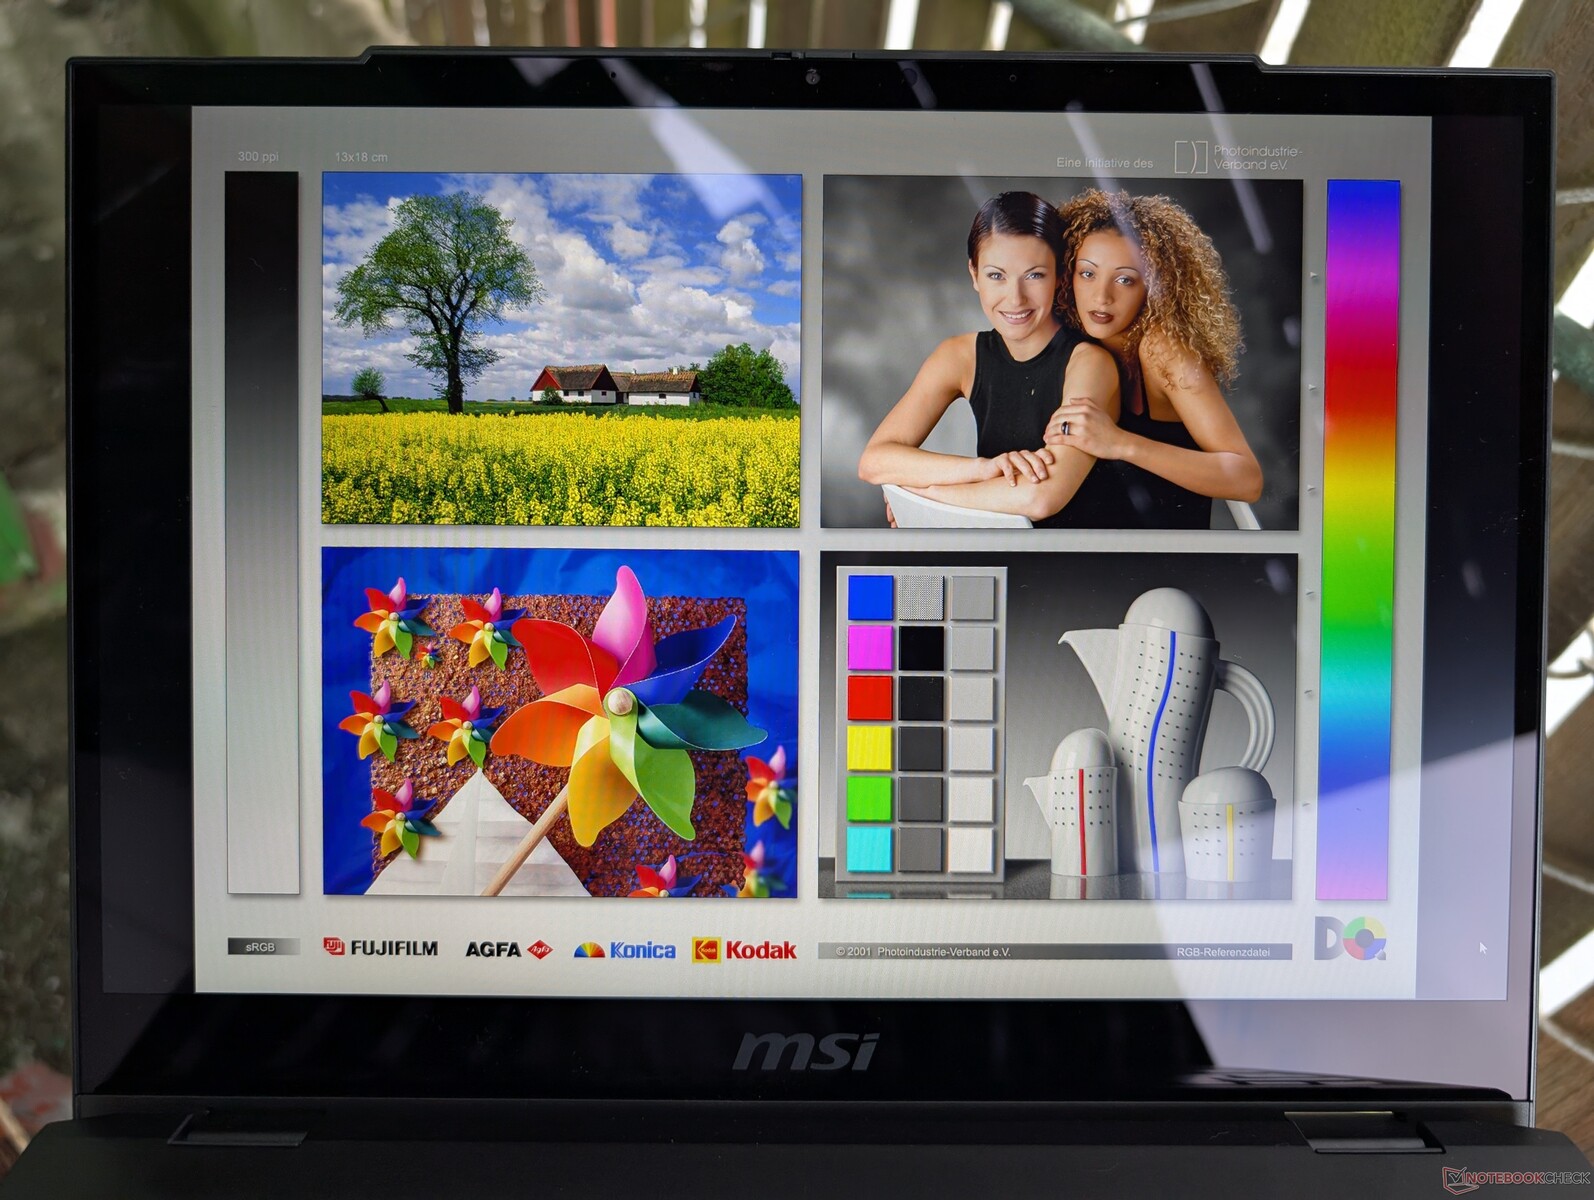
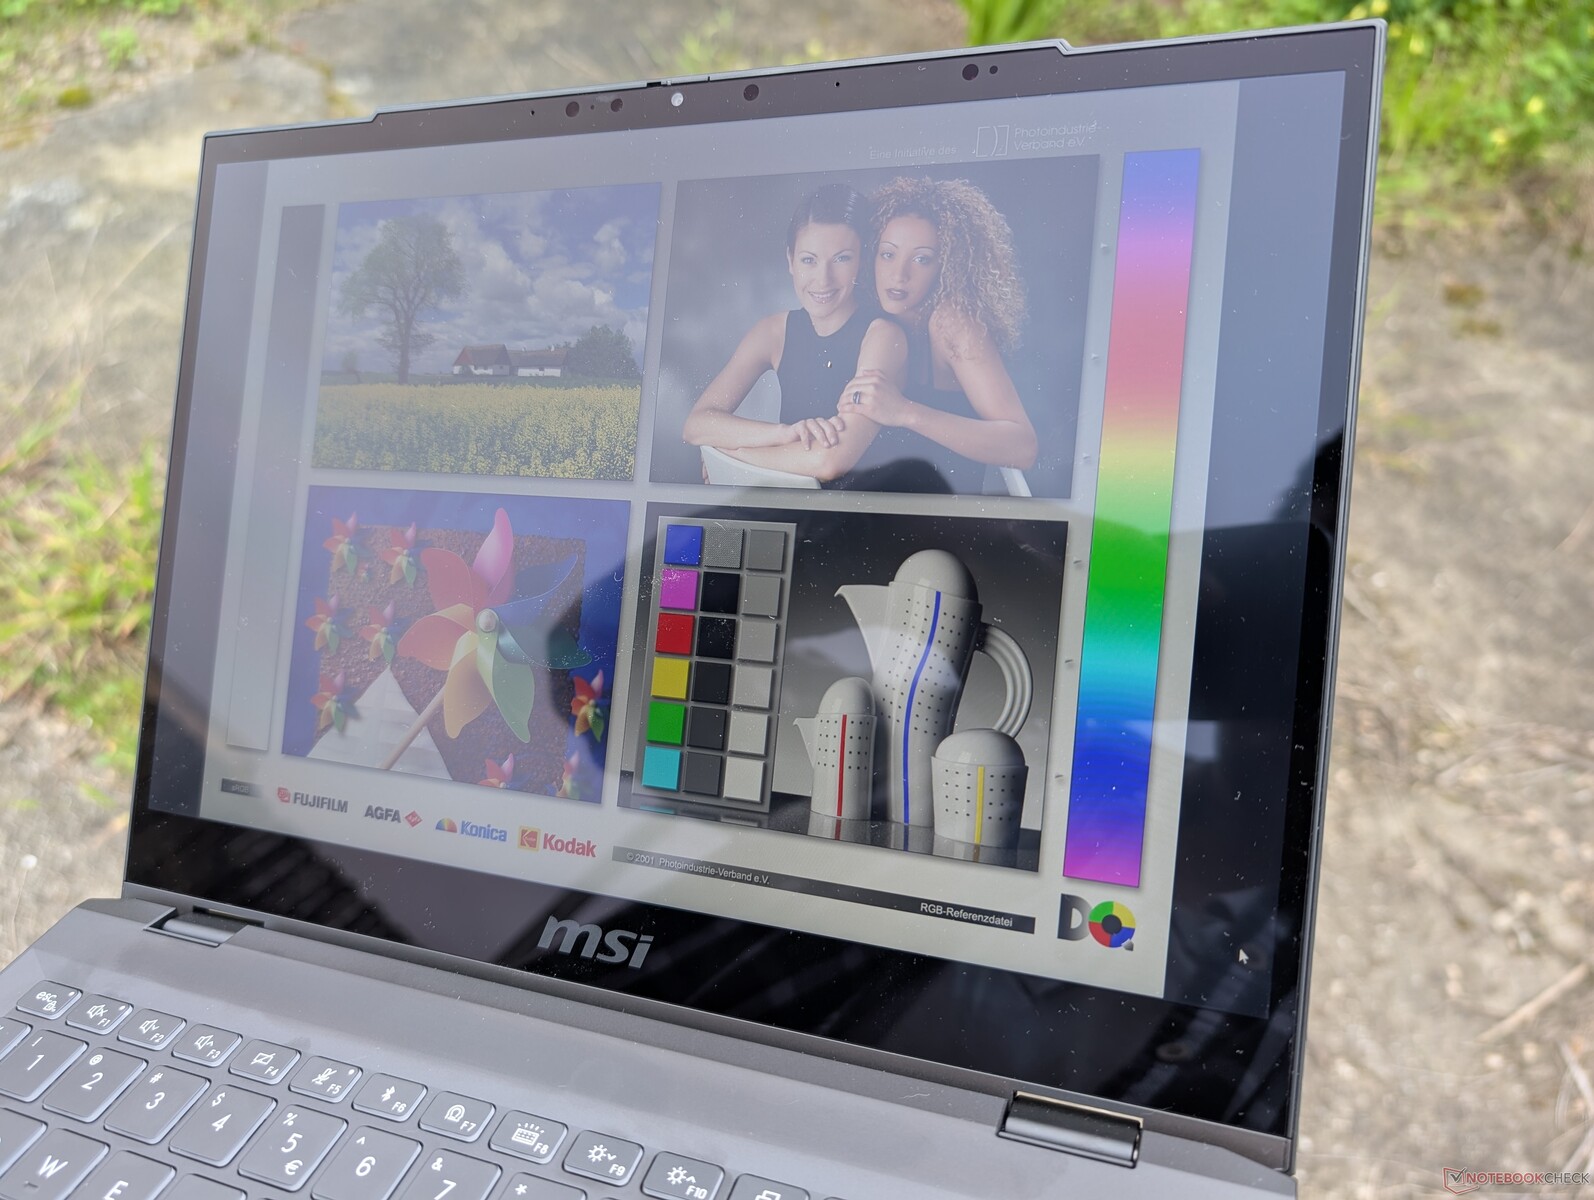
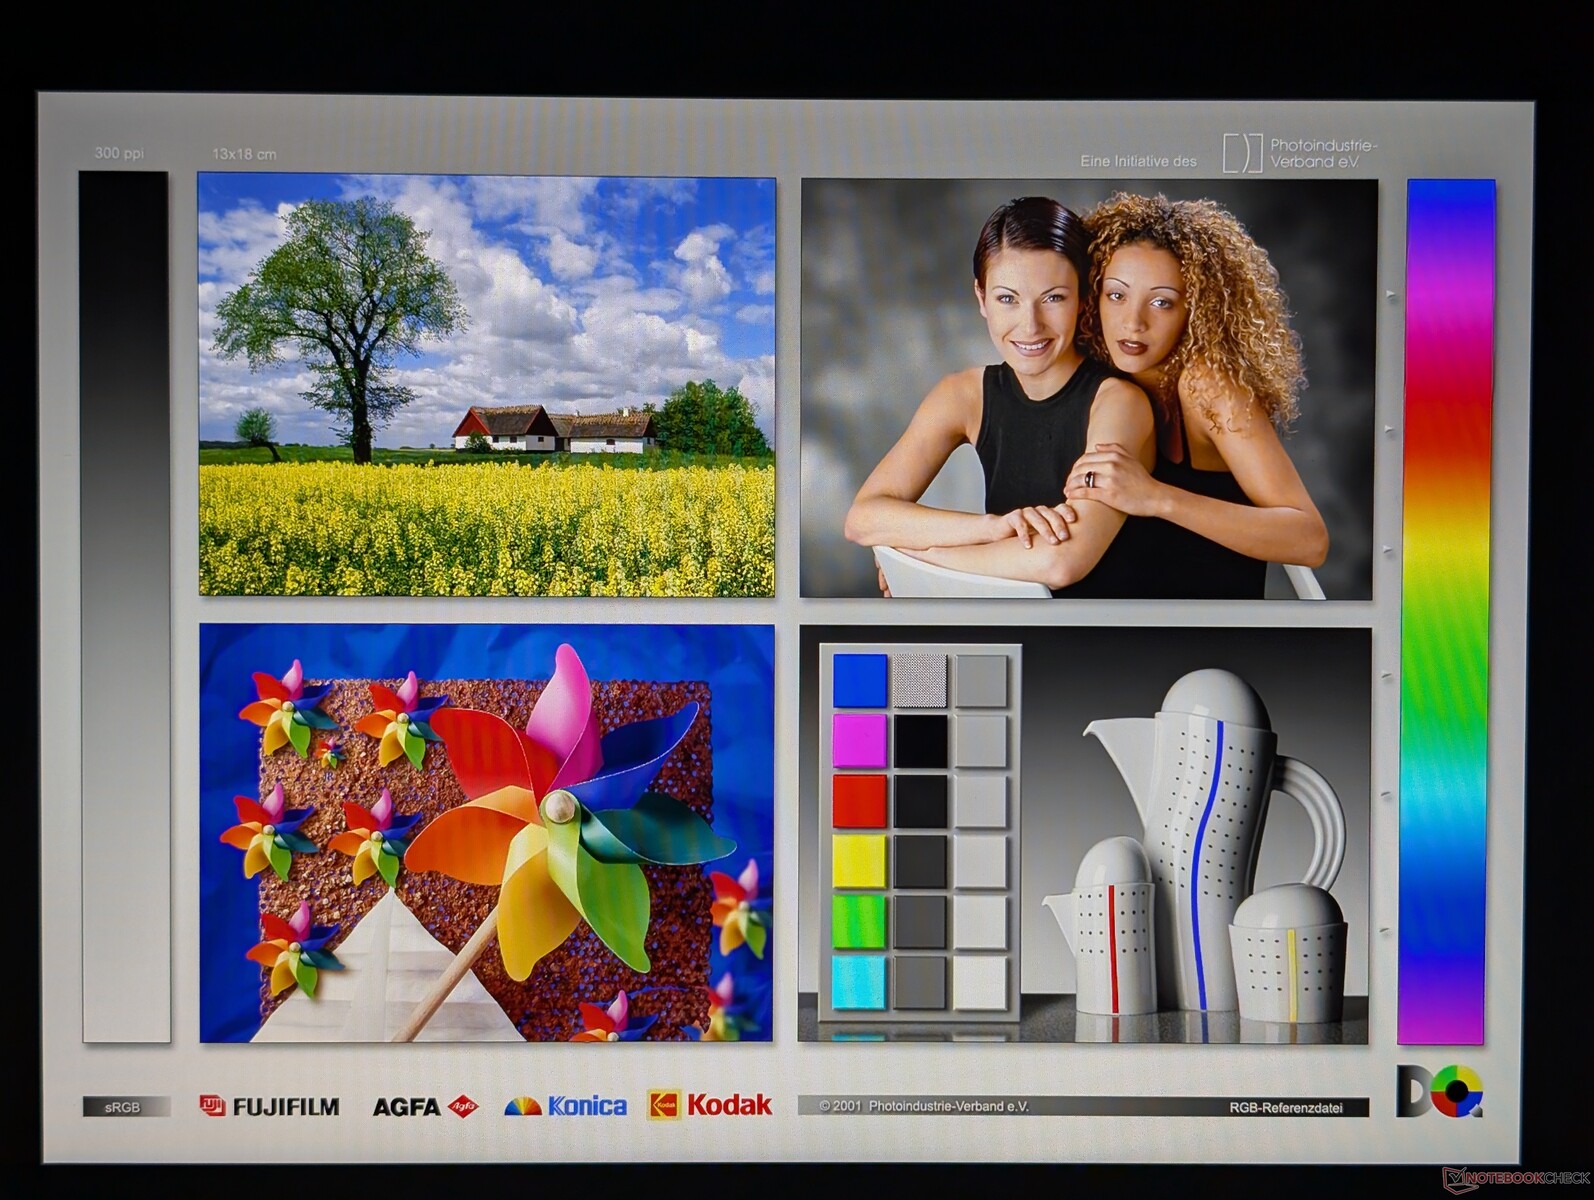
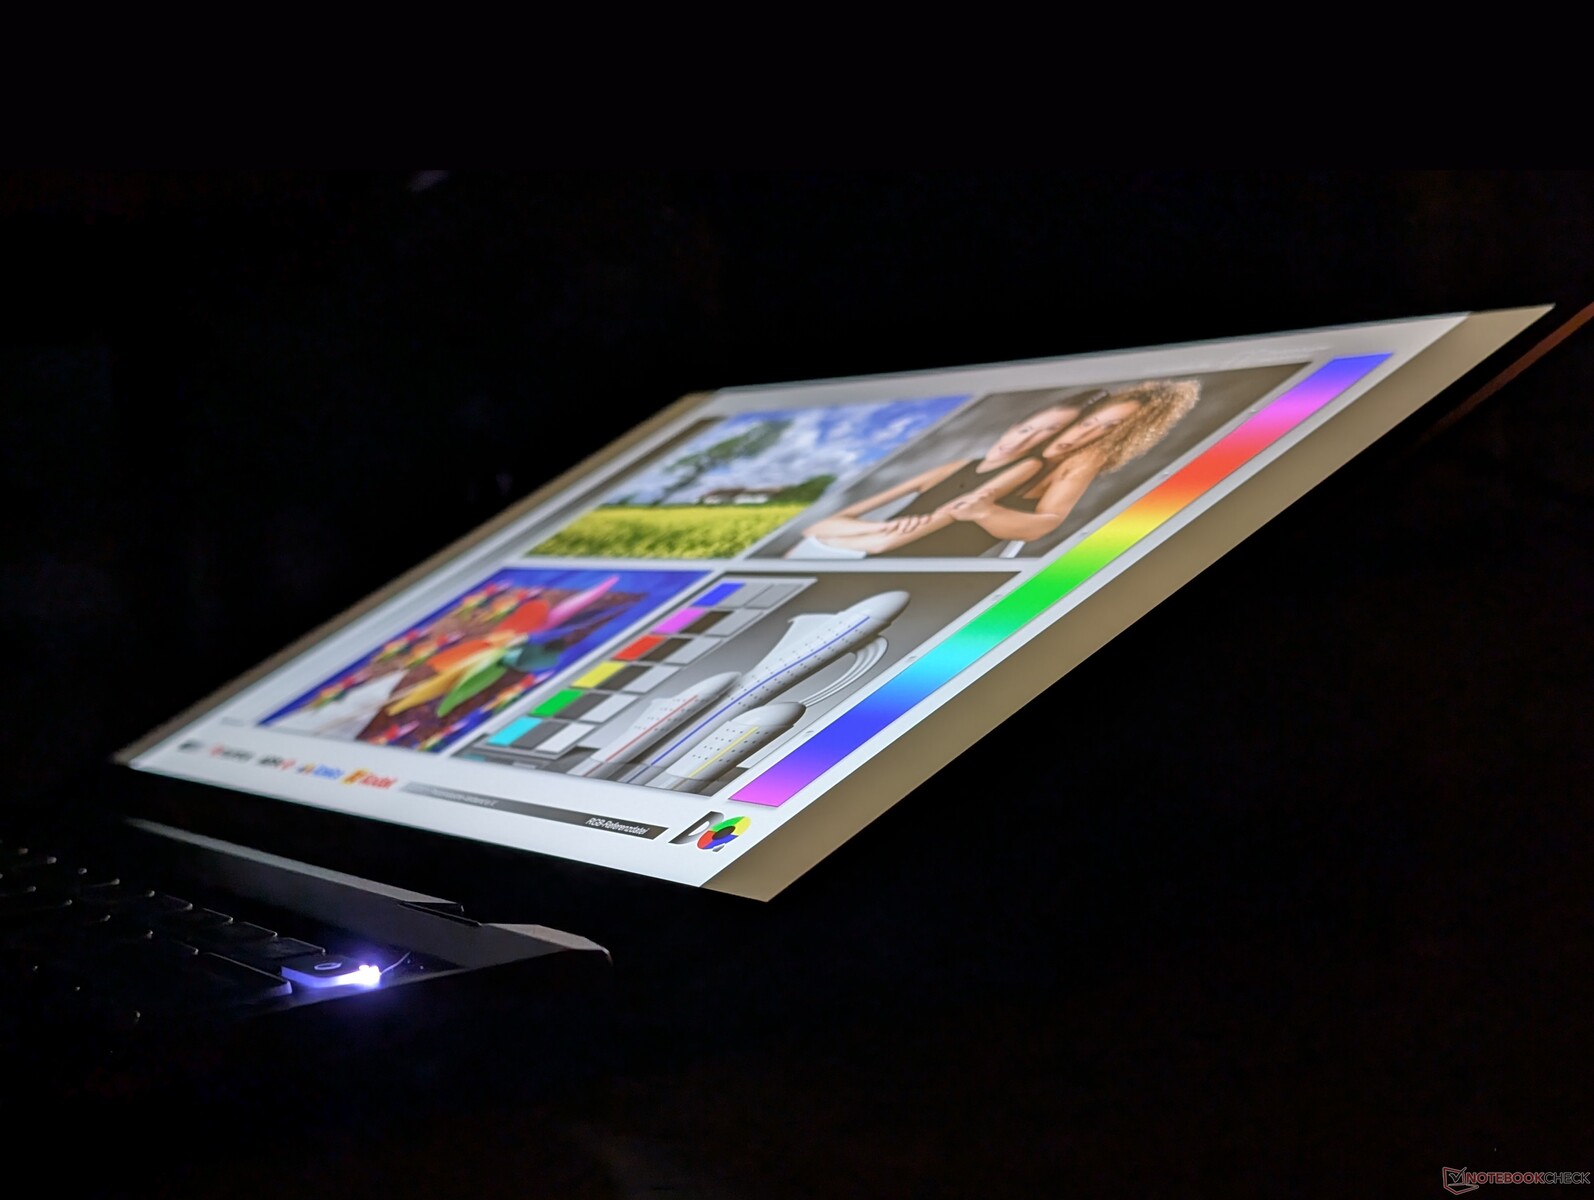
Ekran - Fiyatına Göre Sadece Ortalama
Ünitemiz 2021 modelindeki 120 Hz Sharp panel yerine 60 Hz Chi Mei panel kullanmaktadır. Chi Mei panel benzer sRGB renkleri sunuyor ancak kontrast seviyeleri biraz daha düşük. Siyah-beyaz ve gri-gri tepki süreleri, oyun dışı standartlara göre bile hala çok yavaş.
| |||||||||||||||||||||||||
Aydınlatma: 88 %
Batarya modunda parlaklık: 405.2 cd/m²
Kontrast: 1192:1 (Siyah: 0.34 cd/m²)
ΔE Color 2.4 | 0.5-29.43 Ø4.86, calibrated: 0.54
ΔE Greyscale 1.9 | 0.5-98 Ø5.1
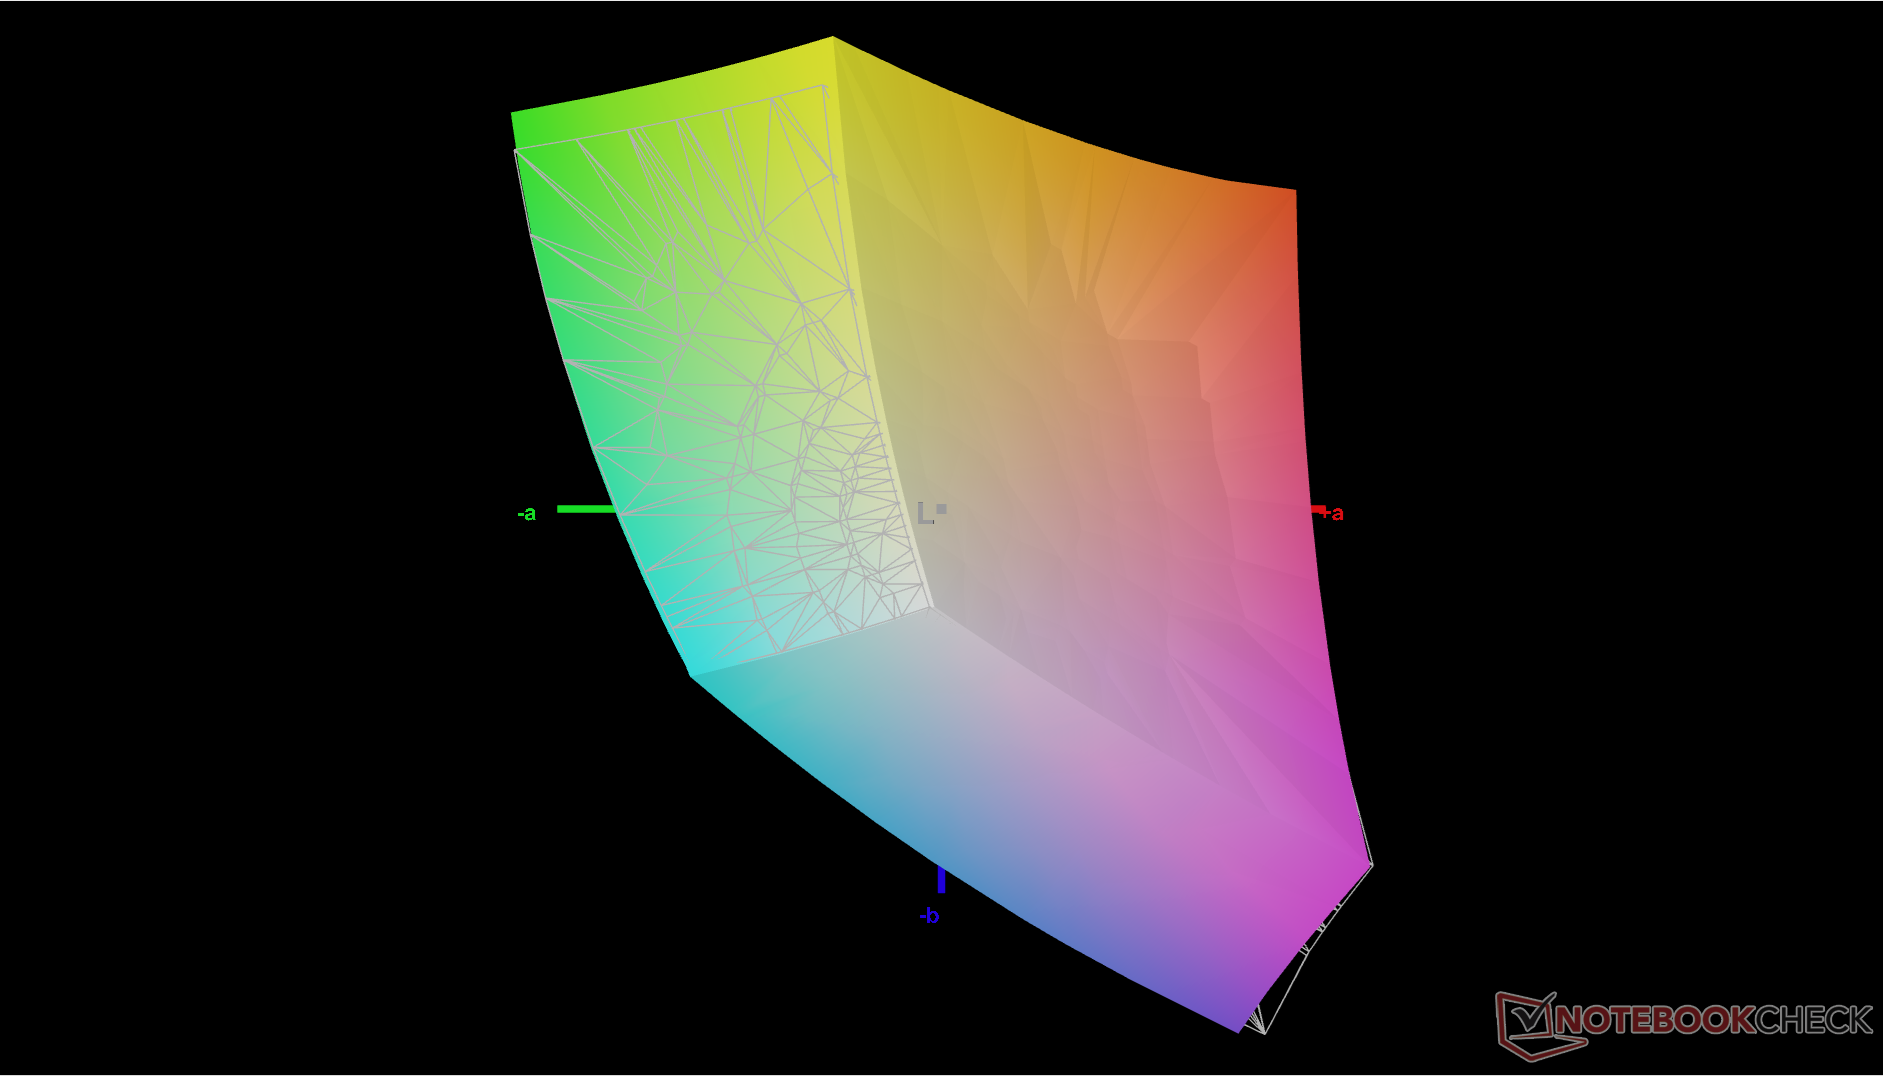
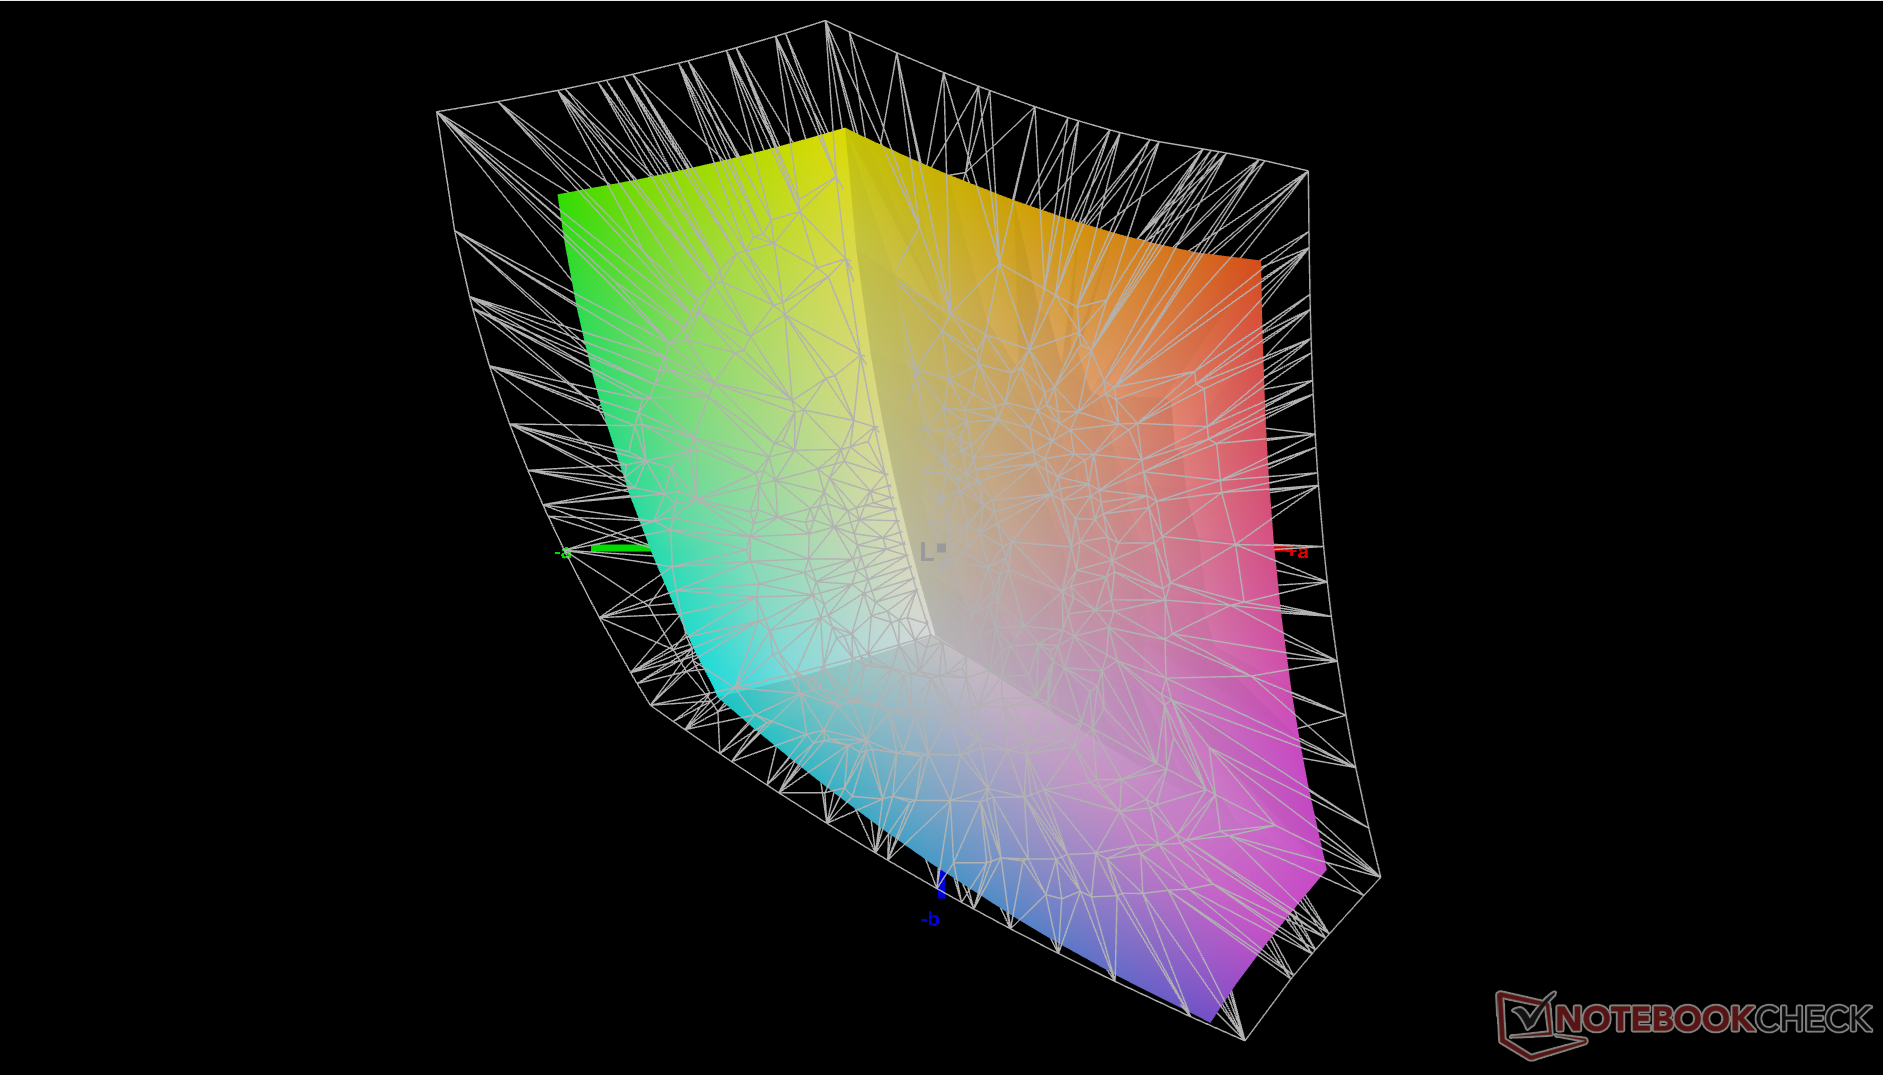
73.1% AdobeRGB 1998 (Argyll 2.2.0 3D)
98.6% sRGB (Argyll 2.2.0 3D)
71.6% Display P3 (Argyll 2.2.0 3D)
Gamma: 2
| MSI Summit E13 AI Evo A1MTG CMN13C6, IPS, 1920x1200, 13.3", 60 Hz | MSI Summit E13 Flip Evo A11MT Sharp LQ134N1JW53, IPS, 1920x1200, 13.4", 120 Hz | Lenovo Yoga Book 9 13IMU9 SDC ATNA33AA02-0, OLED, 2880x1800, 13.3", 60 Hz | Lenovo ThinkPad L13 Yoga G4 i7-1355U NV133WUM-N61, IPS, 1920x1200, 13.3", 60 Hz | HP Elite Dragonfly Folio 13.5 G3 Chi Mei CMN13C0, IPS, 1920x1280, 13.5", 60 Hz | Dell Latitude 9330 AU Optronics B133QAA, IPS, 2560x1600, 13.3", 60 Hz | |
|---|---|---|---|---|---|---|
| Display | -2% | 24% | -0% | -3% | 5% | |
| Display P3 Coverage | 71.6 | 69.8 -3% | 99.7 39% | 71.6 0% | 68.3 -5% | 77.8 9% |
| sRGB Coverage | 98.6 | 98.8 0% | 100 1% | 99.8 1% | 98.6 0% | 99.9 1% |
| AdobeRGB 1998 Coverage | 73.1 | 70.6 -3% | 97 33% | 71.9 -2% | 70.2 -4% | 77.5 6% |
| Response Times | -16% | 96% | 52% | -19% | -29% | |
| Response Time Grey 50% / Grey 80% * | 60 ? | 64 ? -7% | 1.88 ? 97% | 27.3 ? 54% | 66.8 ? -11% | 67.6 ? -13% |
| Response Time Black / White * | 35.1 ? | 44 ? -25% | 2.1 ? 94% | 17.9 ? 49% | 44.4 ? -26% | 50.4 ? -44% |
| PWM Frequency | 60 ? | |||||
| Screen | -3% | -34% | -25% | -6% | -12% | |
| Brightness middle | 405.2 | 551.3 36% | 362.6 -11% | 278.1 -31% | 369.5 -9% | 542.3 34% |
| Brightness | 372 | 517 39% | 368 -1% | 280 -25% | 350 -6% | 516 39% |
| Brightness Distribution | 88 | 91 3% | 97 10% | 92 5% | 87 -1% | 85 -3% |
| Black Level * | 0.34 | 0.37 -9% | 0.34 -0% | 0.24 29% | 0.38 -12% | |
| Contrast | 1192 | 1490 25% | 818 -31% | 1540 29% | 1427 20% | |
| Colorchecker dE 2000 * | 2.4 | 1.45 40% | 4.66 -94% | 2.6 -8% | 2.3 4% | 3.18 -33% |
| Colorchecker dE 2000 max. * | 3.56 | 2.86 20% | 7.25 -104% | 4.81 -35% | 4.34 -22% | 6.05 -70% |
| Colorchecker dE 2000 calibrated * | 0.54 | 1.7 -215% | 0.56 -4% | 0.51 6% | 0.6 -11% | 0.67 -24% |
| Greyscale dE 2000 * | 1.9 | 1.3 32% | 2.6 -37% | 3.9 -105% | 3.1 -63% | 3.1 -63% |
| Gamma | 2 110% | 2.14 103% | 2.2 100% | 2.29 96% | 2.1 105% | 2.08 106% |
| CCT | 6503 100% | 6580 99% | 6055 107% | 5877 111% | 6248 104% | 6140 106% |
| Color Space (Percent of AdobeRGB 1998) | 65 | |||||
| Color Space (Percent of sRGB) | 99 | |||||
| Toplam Ortalama (Program / Ayarlar) | -7% /
-5% | 29% /
2% | 9% /
-9% | -9% /
-7% | -12% /
-11% |
* ... daha küçük daha iyidir
Ekran kutudan çıktığında iyi bir şekilde kalibre edilmiş olabilir, ancak kendi X-Rite kalibrasyonumuz renkleri daha da iyileştirecektir. Ortalama gri tonlama ve renk DeltaE değerleri sırasıyla 0,6 ve 0,54 kadar düşük olabilir.


Yanıt Sürelerini Görüntüle
| ↔ Tepki Süresi Siyahtan Beyaza | ||
|---|---|---|
| 35.1 ms ... yükseliş ↗ ve sonbahar↘ birleşimi | ↗ 17 ms yükseliş | 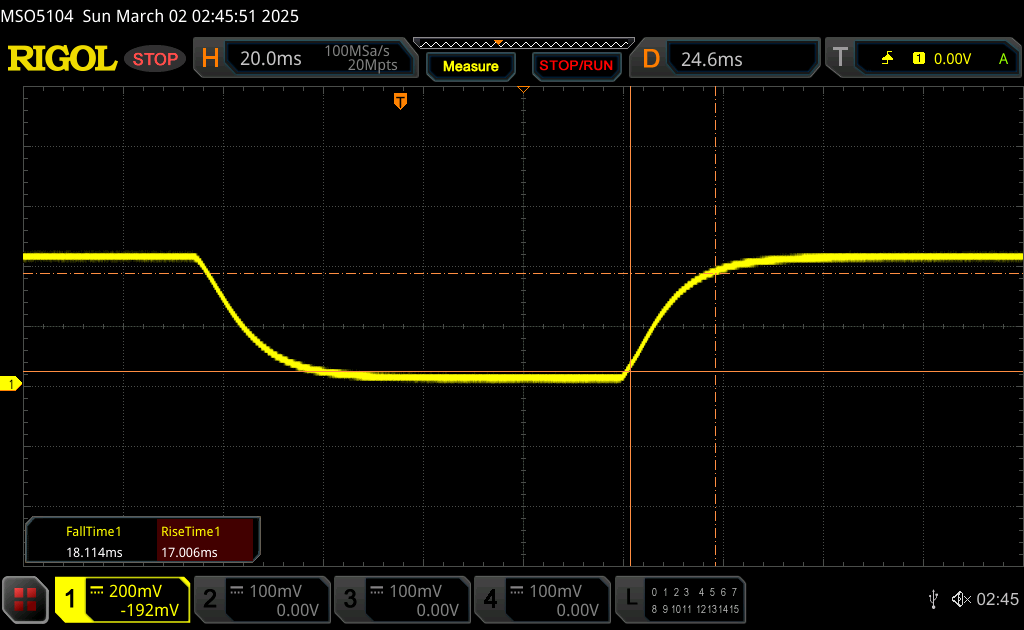 |
| ↘ 18.1 ms sonbahar | ||
| Ekran, testlerimizde yavaş yanıt oranları gösteriyor ve oyuncular için yetersiz olacaktır. Karşılaştırıldığında, test edilen tüm cihazlar 0.1 (minimum) ile 240 (maksimum) ms arasında değişir. » Tüm cihazların 92 %'si daha iyi. Bu, ölçülen yanıt süresinin test edilen tüm cihazların ortalamasından (20.7 ms) daha kötü olduğu anlamına gelir. | ||
| ↔ Tepki Süresi %50 Griden %80 Griye | ||
| 60 ms ... yükseliş ↗ ve sonbahar↘ birleşimi | ↗ 27.2 ms yükseliş | 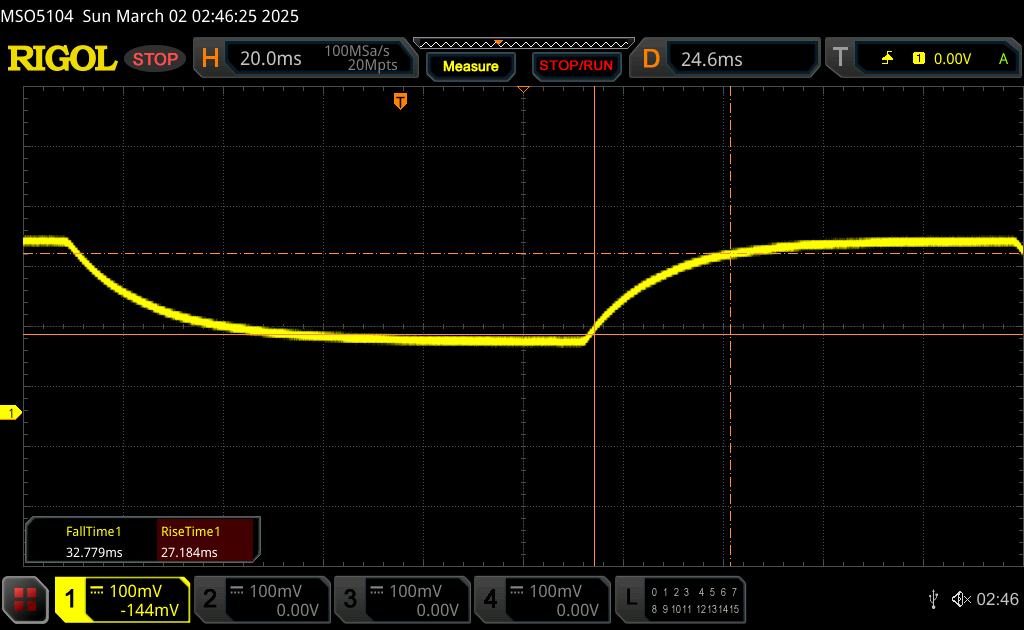 |
| ↘ 32.8 ms sonbahar | ||
| Ekran, testlerimizde yavaş yanıt oranları gösteriyor ve oyuncular için yetersiz olacaktır. Karşılaştırıldığında, test edilen tüm cihazlar 0.165 (minimum) ile 636 (maksimum) ms arasında değişir. » Tüm cihazların 95 %'si daha iyi. Bu, ölçülen yanıt süresinin test edilen tüm cihazların ortalamasından (32.4 ms) daha kötü olduğu anlamına gelir. | ||
Ekran Titremesi / PWM (Darbe Genişliği Modülasyonu)
| Ekran titriyor / PWM algılanmadı | 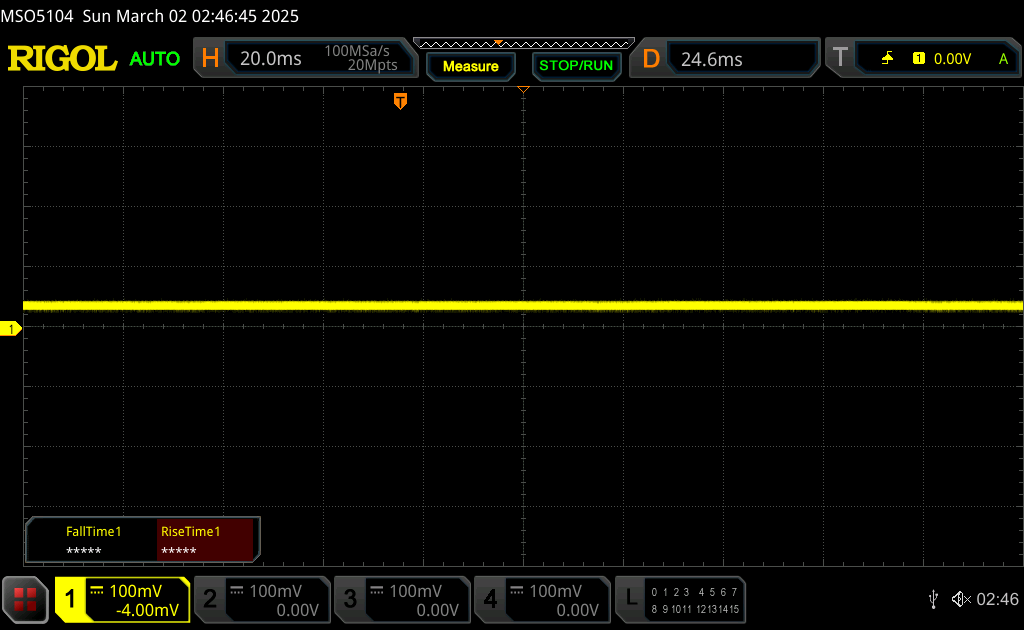 | ||
Karşılaştırıldığında: Test edilen tüm cihazların %53 %'si ekranı karartmak için PWM kullanmıyor. PWM tespit edilirse, ortalama 8482 (minimum: 5 - maksimum: 343500) Hz ölçüldü. | |||
Performans - Core Ultra-H Başa Çıkmak İçin Çok Fazla
Test Koşulları
Aşağıdaki kıyaslamaları çalıştırmadan önce Windows'u Performans moduna ve MSI Center'ı Aşırı Performans moduna ayarladık.
İşlemci
Ham çok iş parçacıklı CPU performansı, CineBench R15 xT stres testimizdeki ilk döngüden sonra yüzde 20'nin üzerinde düşüyordu. Sonuç olarak, sistemimiz veritabanımızdaki aynı donanıma sahip ortalama bir dizüstü bilgisayardan yaklaşık yüzde 20 daha yavaş performans gösterecektir Core Ultra 7 155H i̇şlemci.
Cinebench R15 Multi Loop
Cinebench R23: Multi Core | Single Core
Cinebench R20: CPU (Multi Core) | CPU (Single Core)
Cinebench R15: CPU Multi 64Bit | CPU Single 64Bit
Blender: v2.79 BMW27 CPU
7-Zip 18.03: 7z b 4 | 7z b 4 -mmt1
Geekbench 6.4: Multi-Core | Single-Core
Geekbench 5.5: Multi-Core | Single-Core
HWBOT x265 Benchmark v2.2: 4k Preset
LibreOffice : 20 Documents To PDF
R Benchmark 2.5: Overall mean
| Geekbench 6.4 / Multi-Core | |
| Asus ROG Flow Z13 GZ302EA-RU073W | |
| Ortalama Intel Core Ultra 7 155H (7732 - 13656, n=55) | |
| Framework Laptop 13.5 Ryzen 7 7840U | |
| MSI Prestige 13 AI Plus Evo A2VMG | |
| MSI Summit E13 AI Evo A1MTG | |
| Lenovo Yoga Book 9 13IMU9 | |
| Lenovo ThinkPad L13 Yoga G4 i7-1355U | |
| Geekbench 6.4 / Single-Core | |
| Asus ROG Flow Z13 GZ302EA-RU073W | |
| MSI Prestige 13 AI Plus Evo A2VMG | |
| Framework Laptop 13.5 Ryzen 7 7840U | |
| Lenovo ThinkPad L13 Yoga G4 i7-1355U | |
| Ortalama Intel Core Ultra 7 155H (1901 - 2473, n=52) | |
| Lenovo Yoga Book 9 13IMU9 | |
| MSI Summit E13 AI Evo A1MTG | |
* ... daha küçük daha iyidir
AIDA64: FP32 Ray-Trace | FPU Julia | CPU SHA3 | CPU Queen | FPU SinJulia | FPU Mandel | CPU AES | CPU ZLib | FP64 Ray-Trace | CPU PhotoWorxx
| Performance Rating | |
| Ortalama Intel Core Ultra 7 155H | |
| MSI Summit E13 AI Evo A1MTG | |
| Lenovo Yoga Book 9 13IMU9 | |
| MSI Summit E13 Flip Evo A11MT | |
| HP Elite Dragonfly Folio 13.5 G3 | |
| Lenovo ThinkPad L13 Yoga G4 i7-1355U | |
| Dell Latitude 9330 | |
| AIDA64 / FP32 Ray-Trace | |
| Ortalama Intel Core Ultra 7 155H (6670 - 18470, n=50) | |
| MSI Summit E13 AI Evo A1MTG | |
| Lenovo Yoga Book 9 13IMU9 | |
| MSI Summit E13 Flip Evo A11MT | |
| Dell Latitude 9330 | |
| HP Elite Dragonfly Folio 13.5 G3 | |
| Lenovo ThinkPad L13 Yoga G4 i7-1355U | |
| AIDA64 / FPU Julia | |
| Ortalama Intel Core Ultra 7 155H (40905 - 93181, n=50) | |
| MSI Summit E13 AI Evo A1MTG | |
| Lenovo Yoga Book 9 13IMU9 | |
| HP Elite Dragonfly Folio 13.5 G3 | |
| Dell Latitude 9330 | |
| Lenovo ThinkPad L13 Yoga G4 i7-1355U | |
| MSI Summit E13 Flip Evo A11MT | |
| AIDA64 / CPU SHA3 | |
| Ortalama Intel Core Ultra 7 155H (1940 - 4436, n=50) | |
| MSI Summit E13 AI Evo A1MTG | |
| Lenovo Yoga Book 9 13IMU9 | |
| MSI Summit E13 Flip Evo A11MT | |
| Dell Latitude 9330 | |
| Lenovo ThinkPad L13 Yoga G4 i7-1355U | |
| HP Elite Dragonfly Folio 13.5 G3 | |
| AIDA64 / CPU Queen | |
| Ortalama Intel Core Ultra 7 155H (64698 - 94181, n=50) | |
| MSI Summit E13 AI Evo A1MTG | |
| HP Elite Dragonfly Folio 13.5 G3 | |
| Lenovo ThinkPad L13 Yoga G4 i7-1355U | |
| MSI Summit E13 Flip Evo A11MT | |
| Dell Latitude 9330 | |
| Lenovo Yoga Book 9 13IMU9 | |
| AIDA64 / FPU SinJulia | |
| Ortalama Intel Core Ultra 7 155H (5639 - 10647, n=50) | |
| MSI Summit E13 AI Evo A1MTG | |
| Lenovo Yoga Book 9 13IMU9 | |
| MSI Summit E13 Flip Evo A11MT | |
| HP Elite Dragonfly Folio 13.5 G3 | |
| Lenovo ThinkPad L13 Yoga G4 i7-1355U | |
| Dell Latitude 9330 | |
| AIDA64 / FPU Mandel | |
| Ortalama Intel Core Ultra 7 155H (18236 - 47685, n=50) | |
| MSI Summit E13 AI Evo A1MTG | |
| Lenovo Yoga Book 9 13IMU9 | |
| MSI Summit E13 Flip Evo A11MT | |
| HP Elite Dragonfly Folio 13.5 G3 | |
| Dell Latitude 9330 | |
| Lenovo ThinkPad L13 Yoga G4 i7-1355U | |
| AIDA64 / CPU AES | |
| Ortalama Intel Core Ultra 7 155H (45713 - 152179, n=50) | |
| MSI Summit E13 Flip Evo A11MT | |
| MSI Summit E13 AI Evo A1MTG | |
| Lenovo Yoga Book 9 13IMU9 | |
| HP Elite Dragonfly Folio 13.5 G3 | |
| Lenovo ThinkPad L13 Yoga G4 i7-1355U | |
| Dell Latitude 9330 | |
| AIDA64 / CPU ZLib | |
| Ortalama Intel Core Ultra 7 155H (557 - 1250, n=50) | |
| MSI Summit E13 AI Evo A1MTG | |
| Lenovo Yoga Book 9 13IMU9 | |
| HP Elite Dragonfly Folio 13.5 G3 | |
| Lenovo ThinkPad L13 Yoga G4 i7-1355U | |
| Dell Latitude 9330 | |
| MSI Summit E13 Flip Evo A11MT | |
| AIDA64 / FP64 Ray-Trace | |
| Ortalama Intel Core Ultra 7 155H (3569 - 9802, n=50) | |
| MSI Summit E13 AI Evo A1MTG | |
| Lenovo Yoga Book 9 13IMU9 | |
| MSI Summit E13 Flip Evo A11MT | |
| Dell Latitude 9330 | |
| HP Elite Dragonfly Folio 13.5 G3 | |
| Lenovo ThinkPad L13 Yoga G4 i7-1355U | |
| AIDA64 / CPU PhotoWorxx | |
| Ortalama Intel Core Ultra 7 155H (32719 - 54223, n=50) | |
| Lenovo Yoga Book 9 13IMU9 | |
| HP Elite Dragonfly Folio 13.5 G3 | |
| MSI Summit E13 AI Evo A1MTG | |
| MSI Summit E13 Flip Evo A11MT | |
| Dell Latitude 9330 | |
| Lenovo ThinkPad L13 Yoga G4 i7-1355U | |
Stres Testi
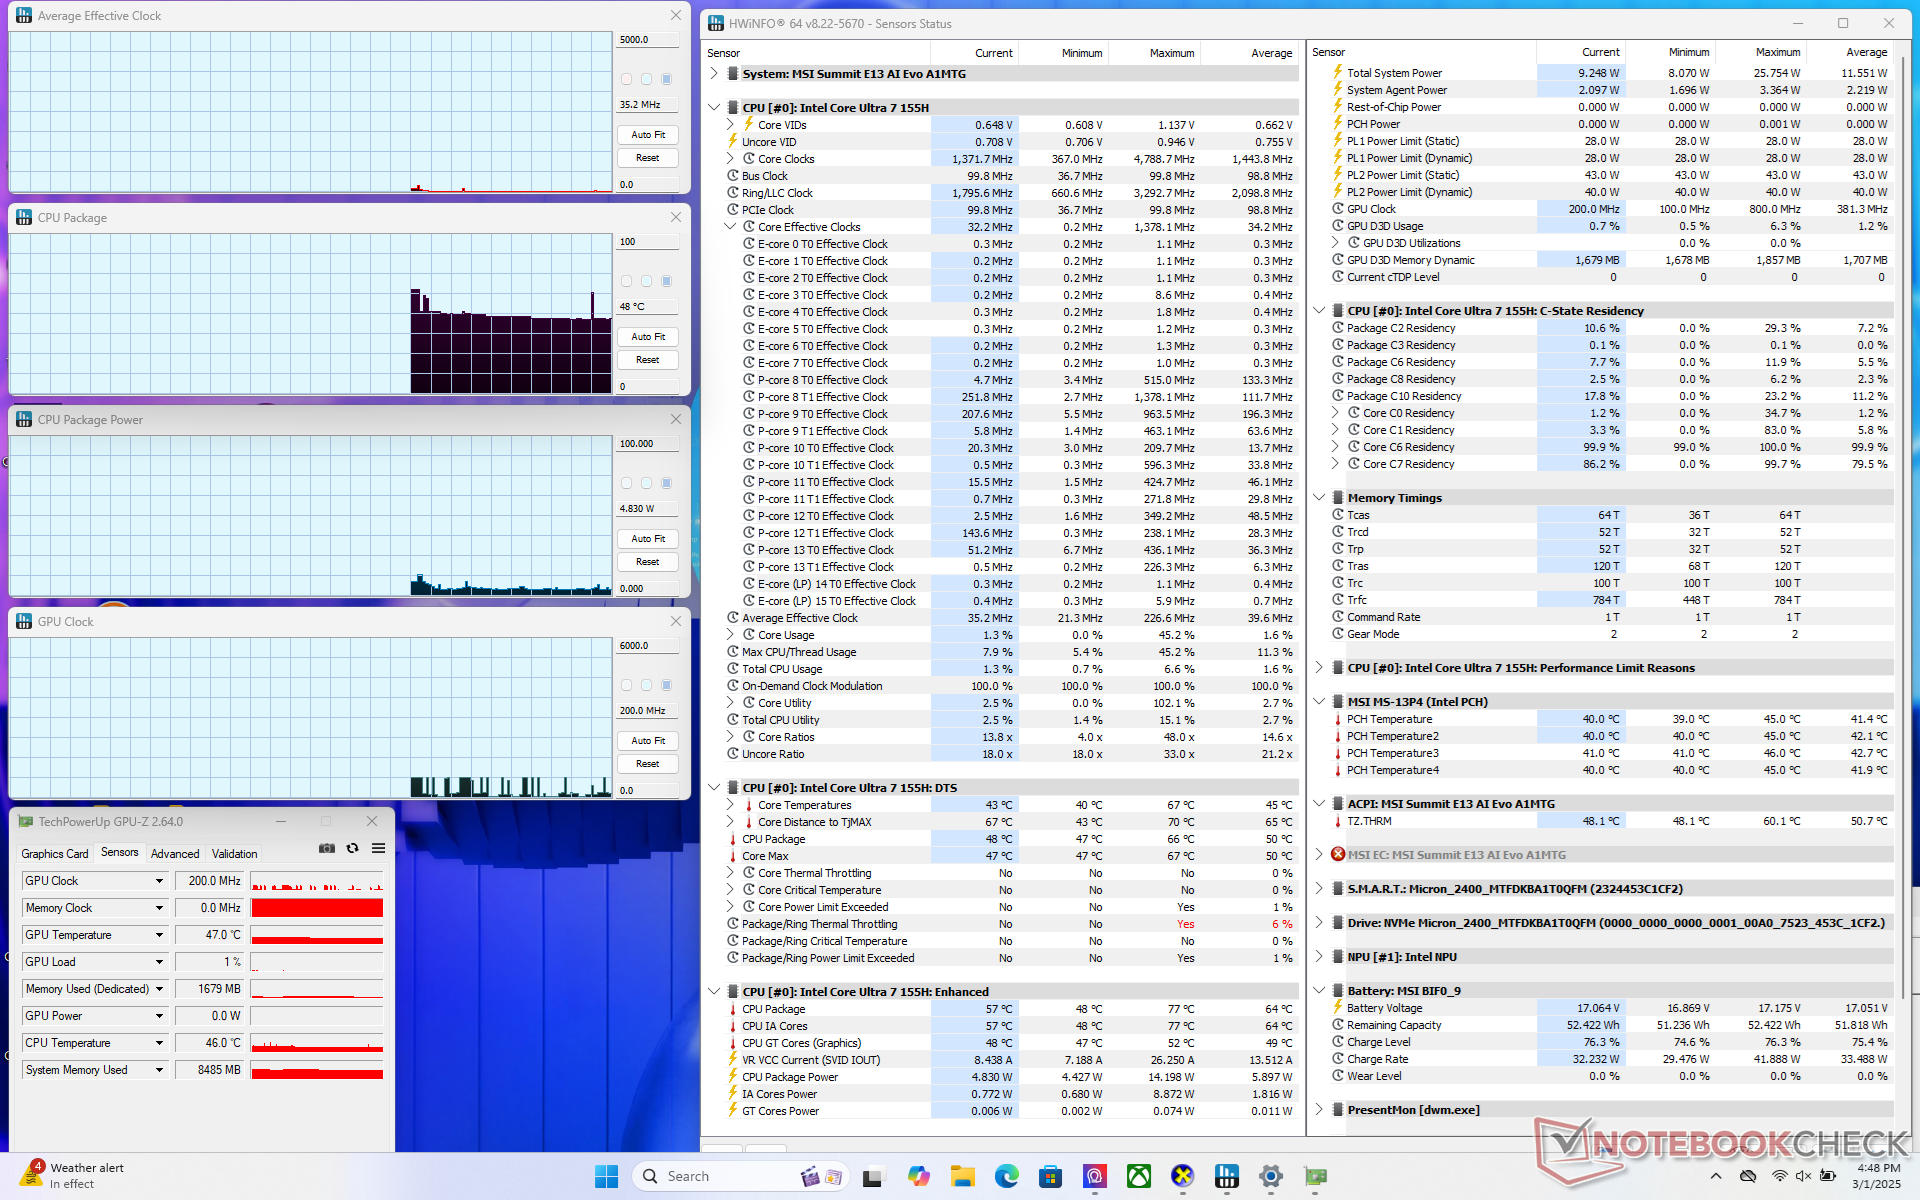
Prime95 çalıştırılırken, CPU birkaç dakika sonra 84 C çekirdek sıcaklığına ulaşana kadar 2,1 GHz ve 41 W'a yükselir. Daha sonra Cooler Boost etkinken 81 C çekirdek sıcaklığını korumak için 1,3 GHz ve 28 W'da sabitlenir. Cooler Boost devre dışı bırakılırsa çekirdek sıcaklığı yalnızca birkaç derece artar.
Cyberpunk 2077'yi çalıştırırken, GPU saat hızı, oyun içinde boştayken bile aşağıdaki ekran görüntüsünde gösterildiği gibi nispeten dengesiz olacaktır. Bu, aşağıdaki GPU Performansı bölümünde belirtildiği gibi kararsız kare hızlarını yansıtır. Çekirdek sıcaklığı da 87 C ile çok yüksek veya 2021 modeline göre 10 C'nin üzerinde daha sıcak olacaktır.
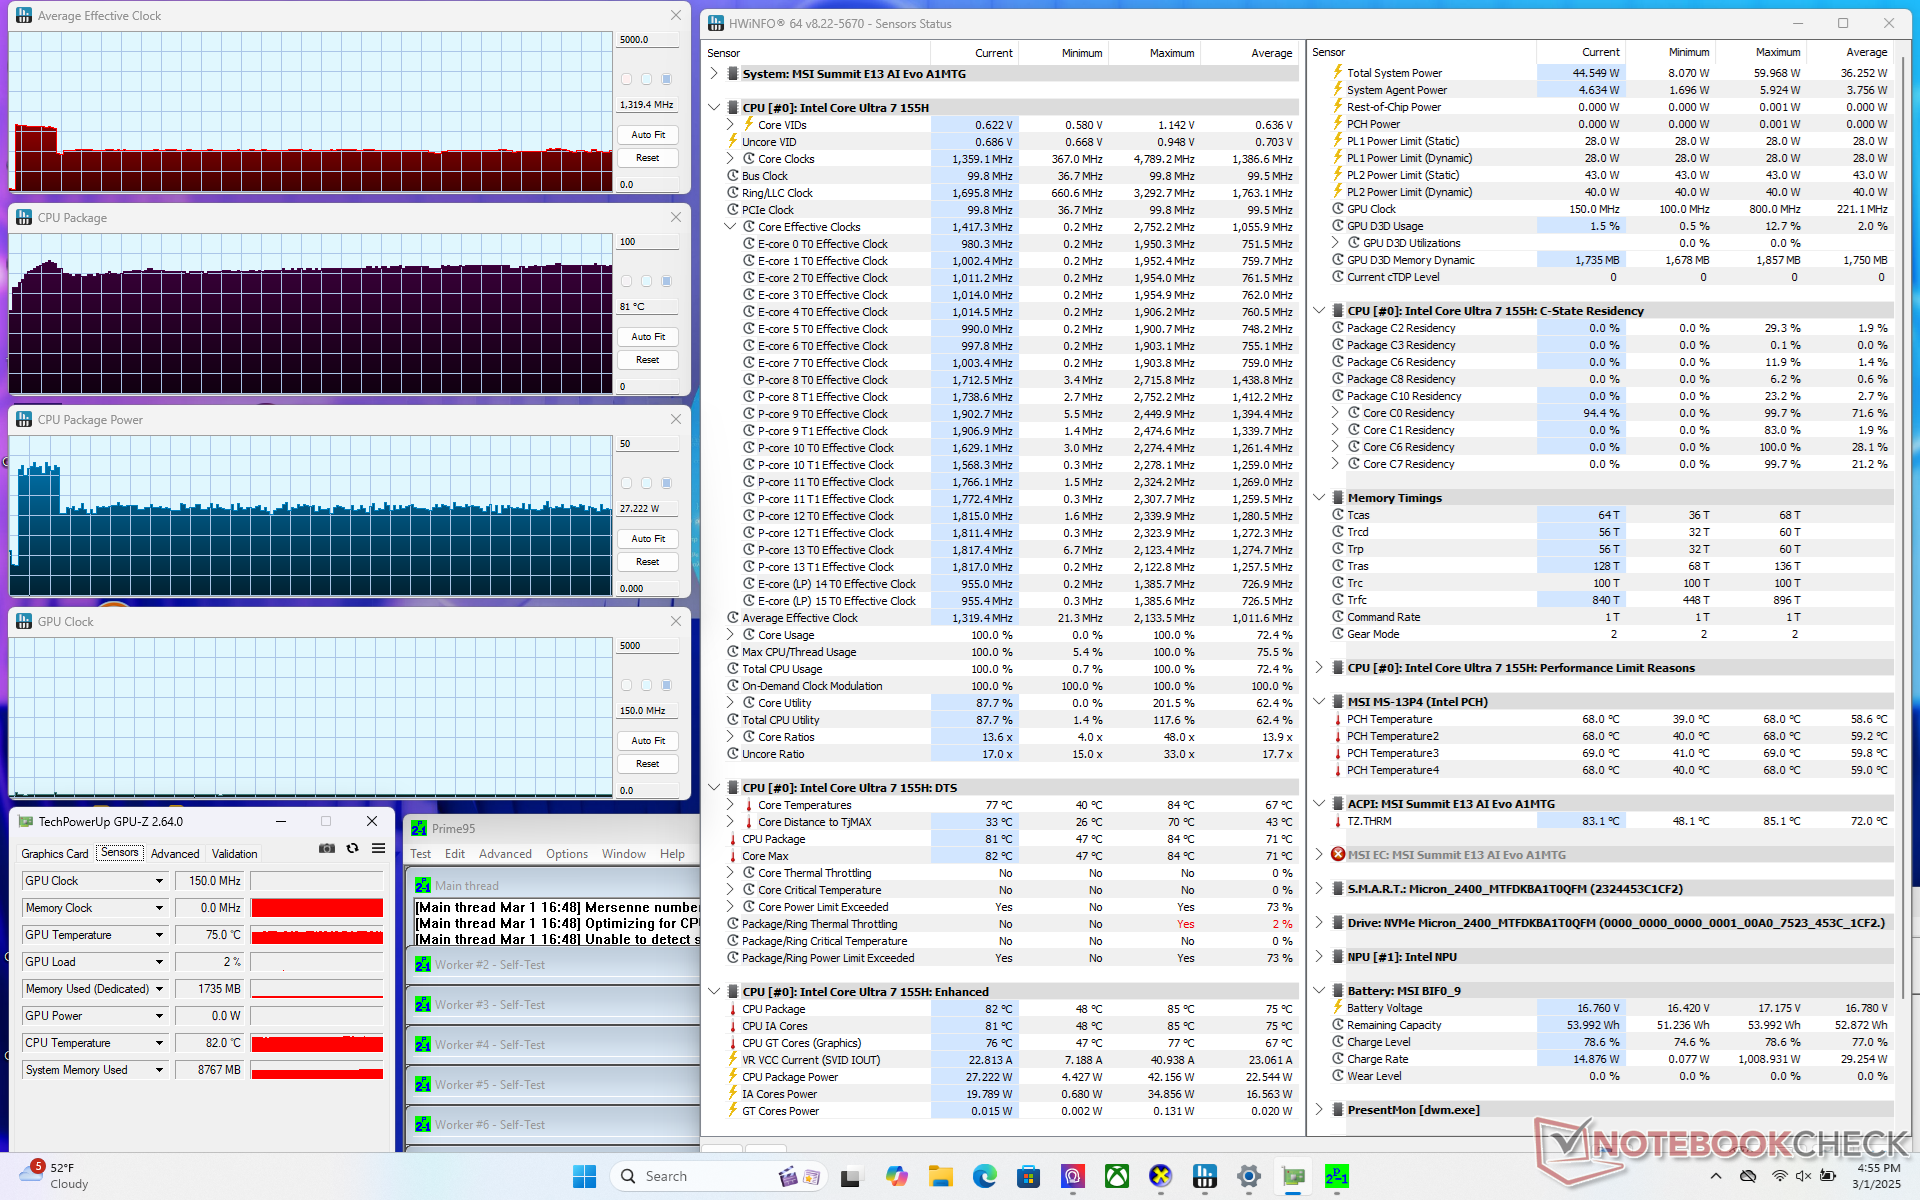
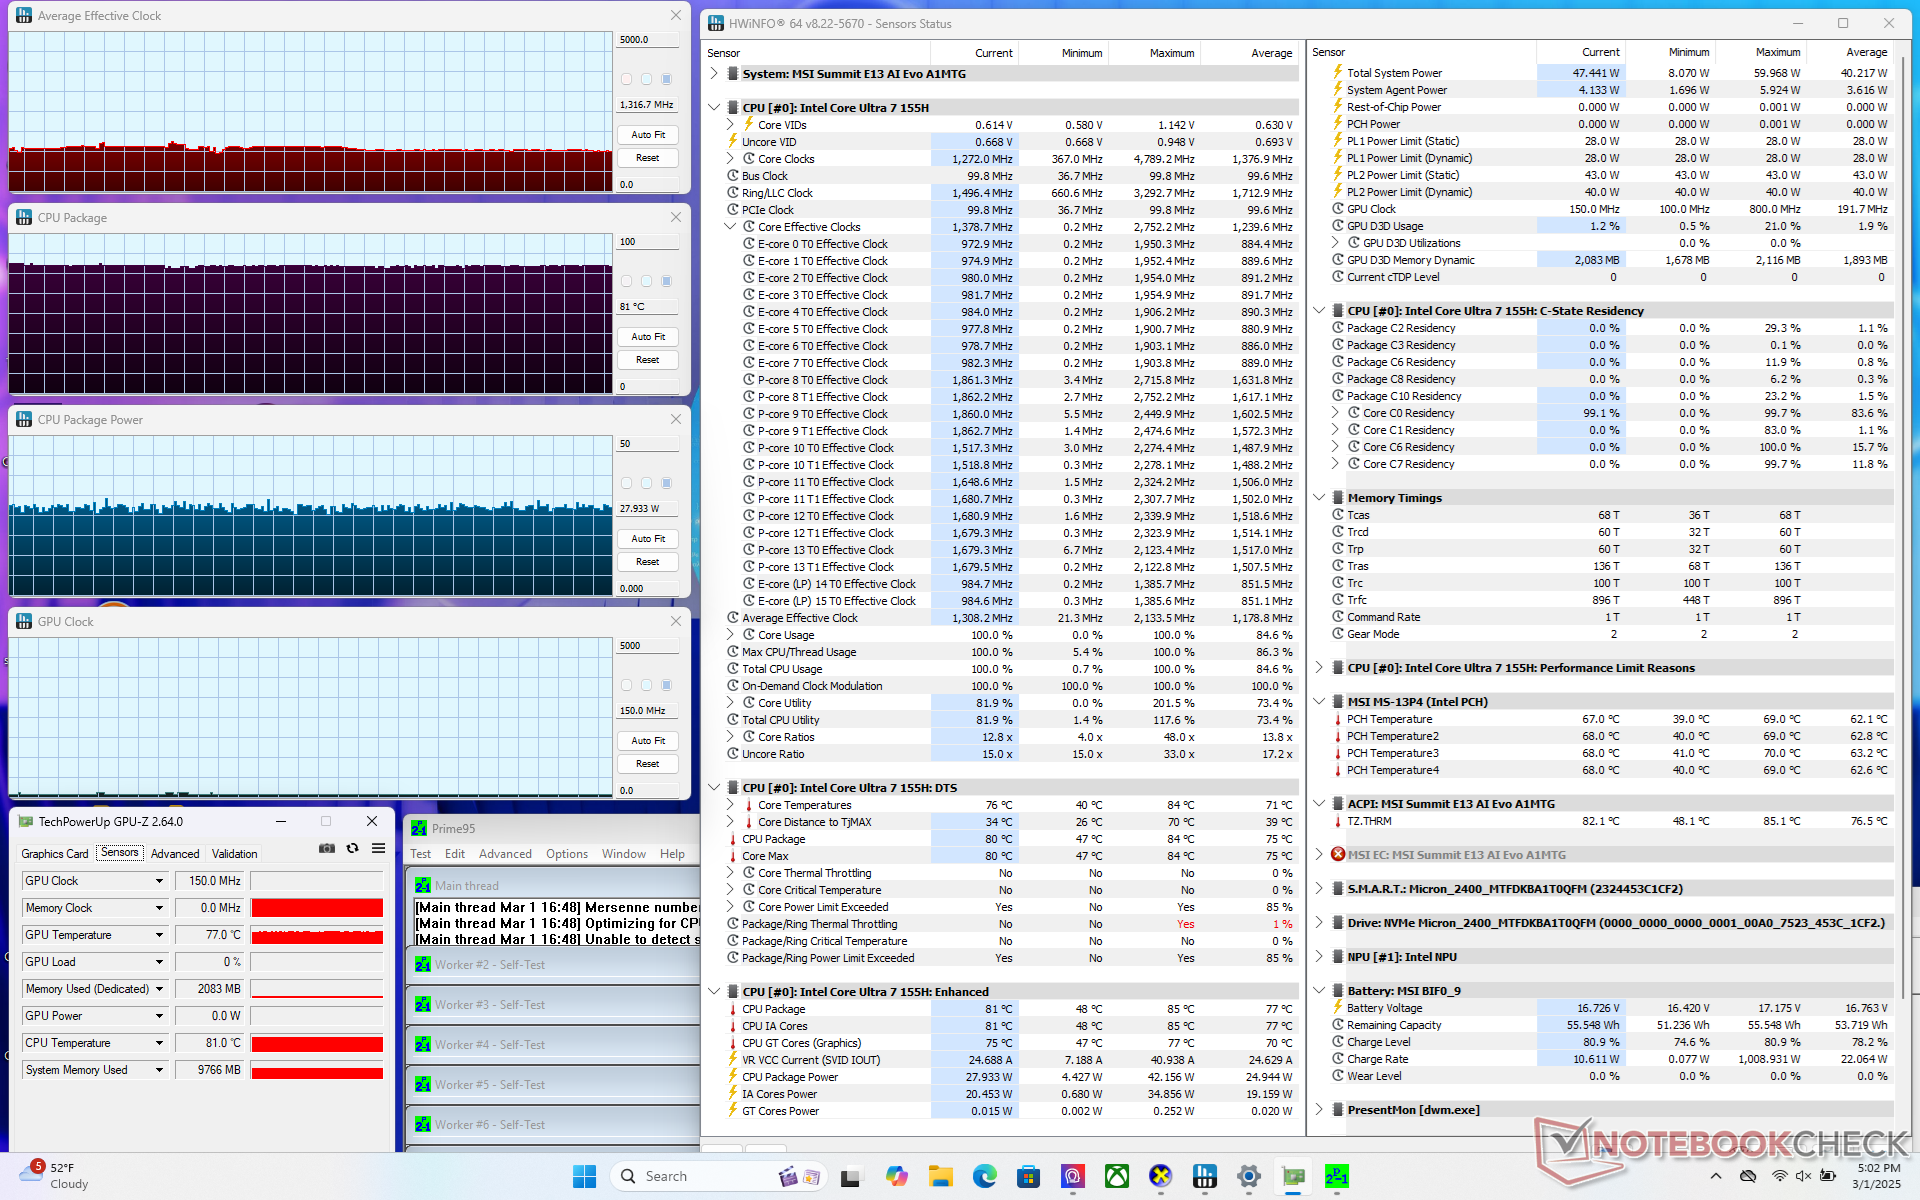
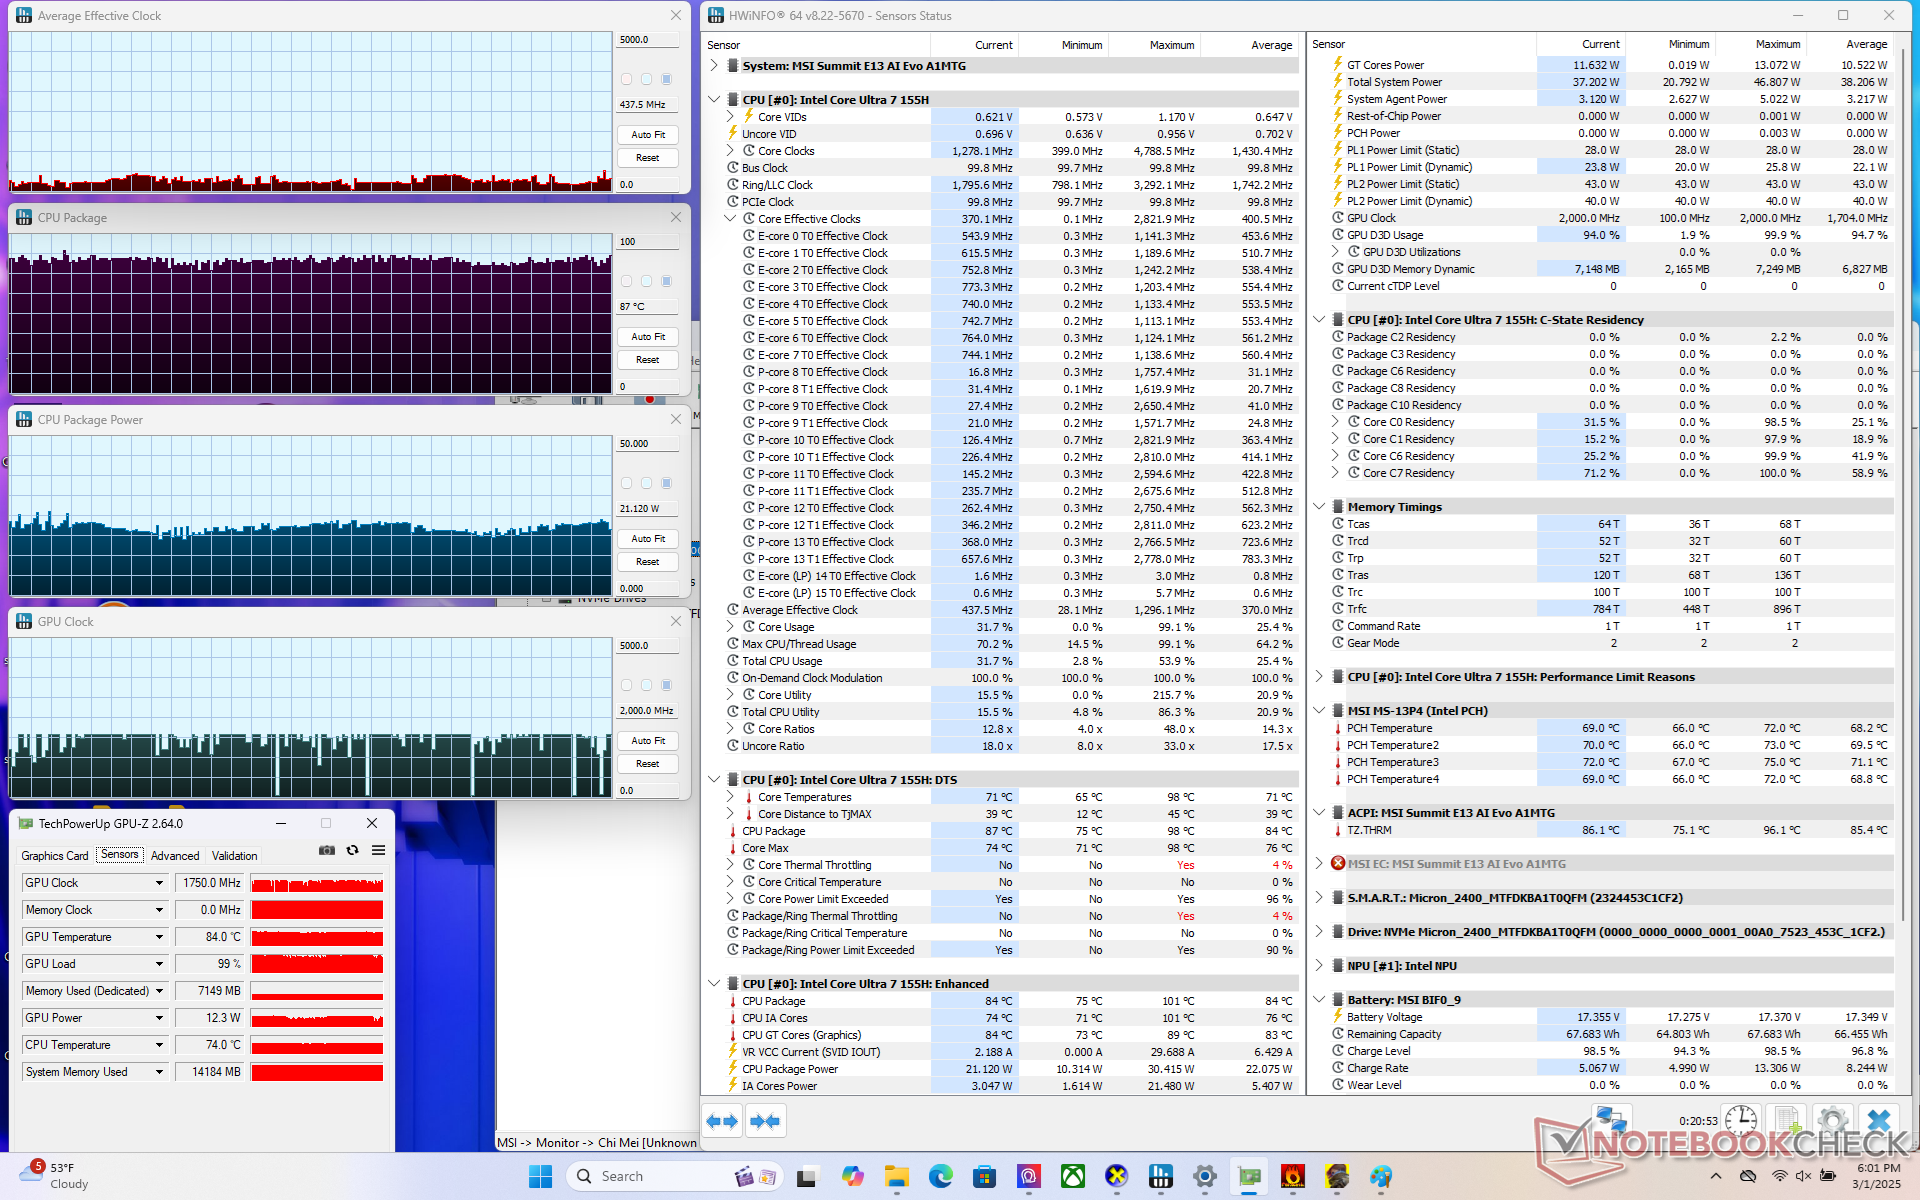
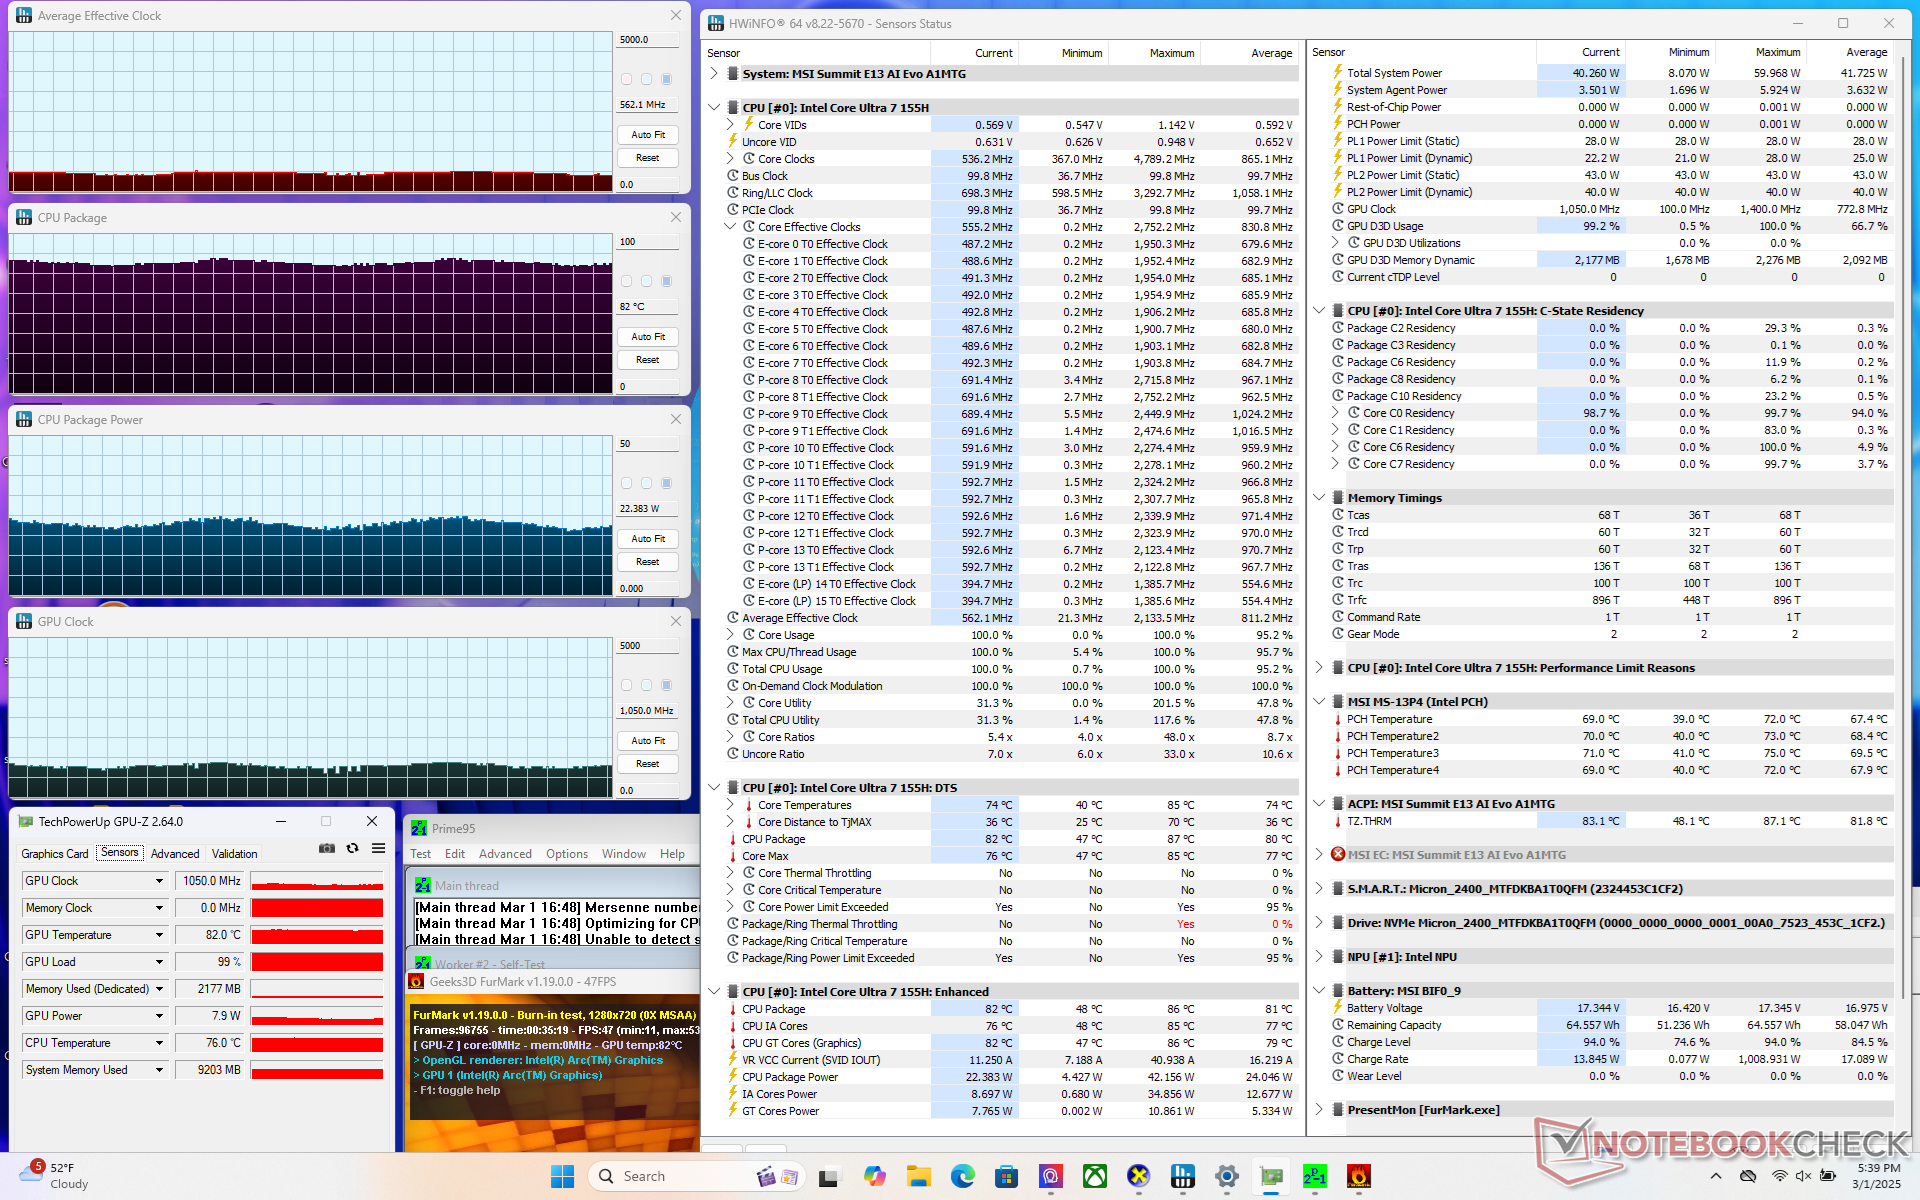
| Ortalama CPU Saati (GHz) | GPU Saati (MHz) | Ortalama CPU Sıcaklığı (°C) | |
| Sistem Boşta | -- | -- | 48 |
| Prime95 Stres (Soğutucu Güçlendirme Açık) | 1.3 | -- | 81 |
| Prime95 Stress (Cooler Boost Off) | 1.3 | -- | 81 |
| Prime95 + FurMark Stres | 0,6 | 1050 | 82 |
| Cyberpunk 2077 Stres | 0.4 | ~2000 | 87 |
Sistem Performansı
CrossMark: Overall | Productivity | Creativity | Responsiveness
WebXPRT 3: Overall
WebXPRT 4: Overall
Mozilla Kraken 1.1: Total
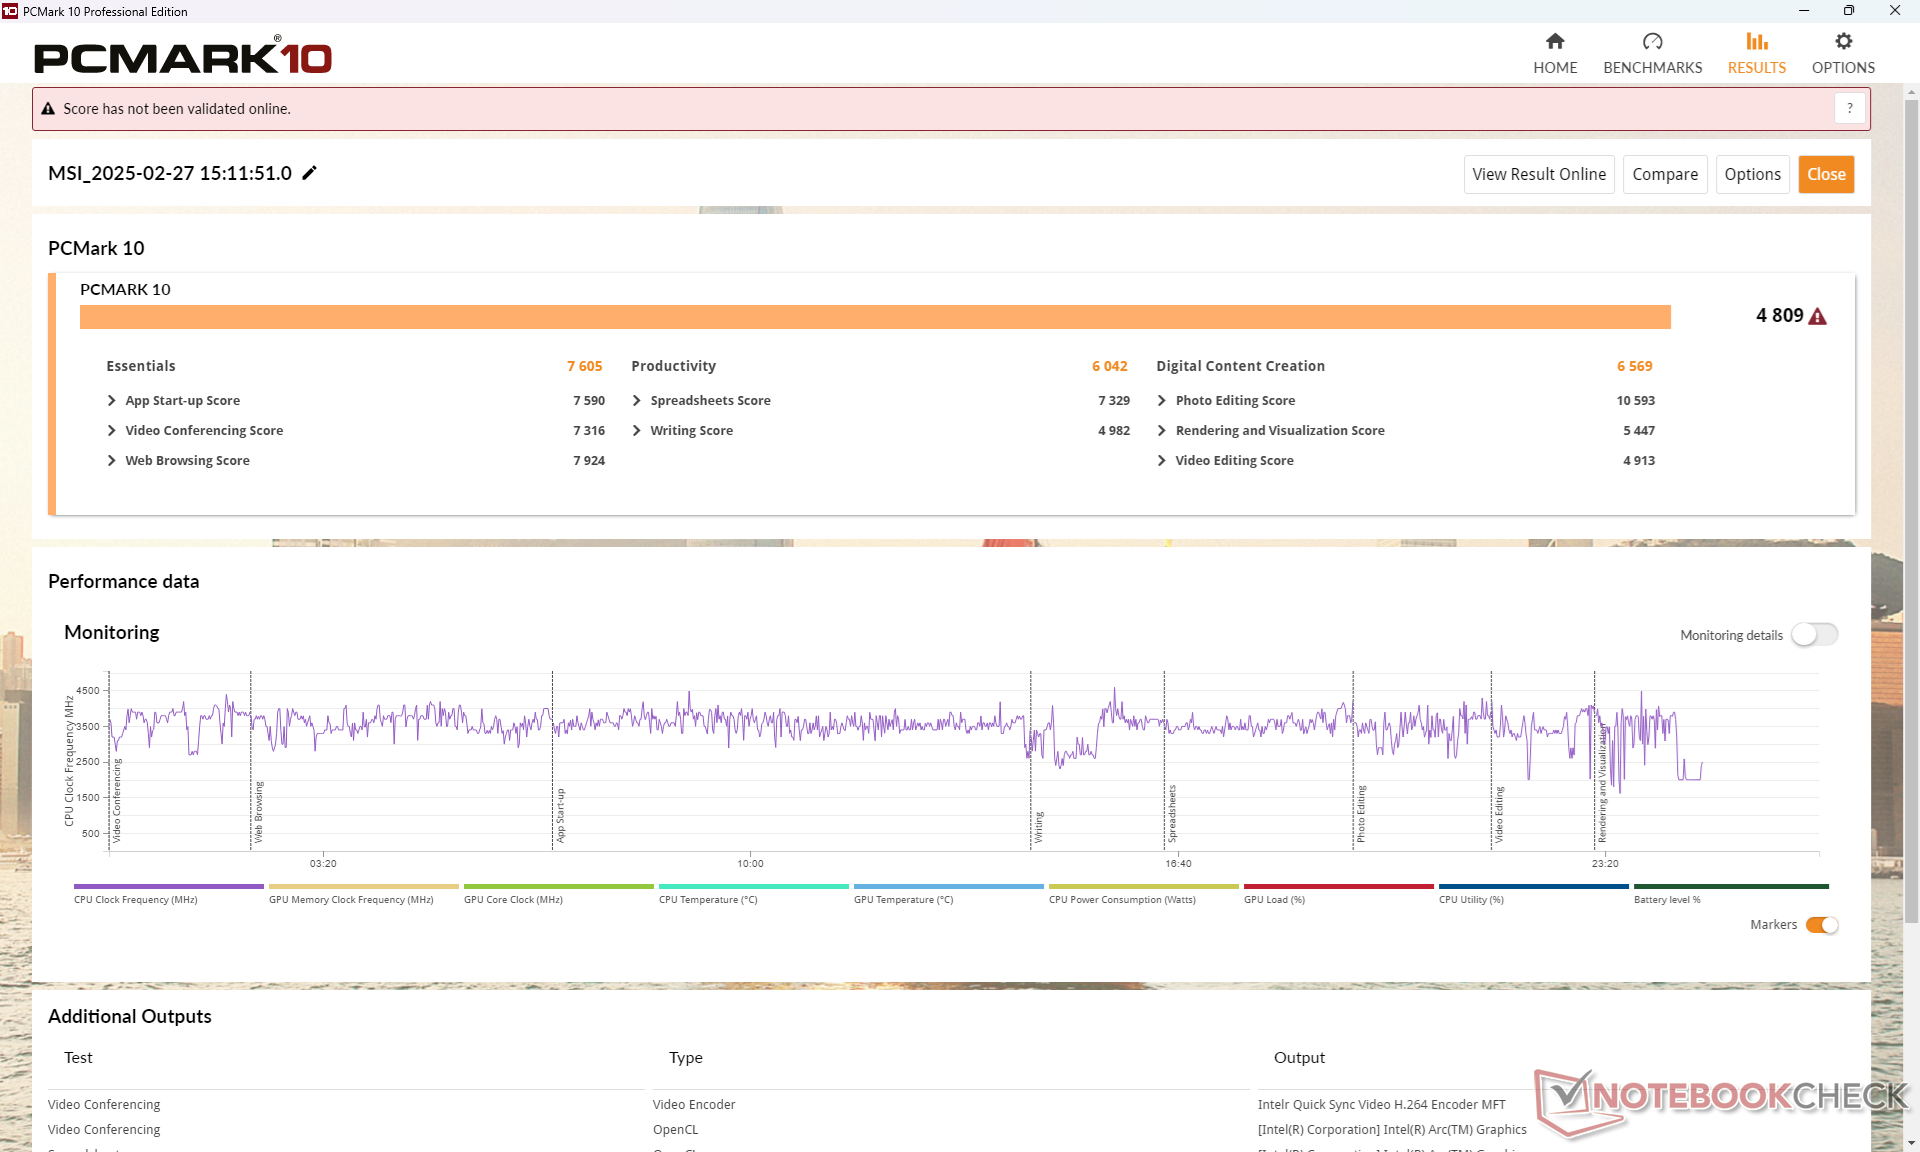
| PCMark 10 / Score | |
| Ortalama Intel Core Ultra 7 155H, Intel Arc 8-Core iGPU (4809 - 7529, n=34) | |
| Lenovo Yoga Book 9 13IMU9 | |
| Lenovo ThinkPad L13 Yoga G4 i7-1355U | |
| HP Elite Dragonfly Folio 13.5 G3 | |
| Dell Latitude 9330 | |
| MSI Summit E13 AI Evo A1MTG | |
| MSI Summit E13 Flip Evo A11MT | |
| PCMark 10 / Essentials | |
| HP Elite Dragonfly Folio 13.5 G3 | |
| Lenovo ThinkPad L13 Yoga G4 i7-1355U | |
| Lenovo Yoga Book 9 13IMU9 | |
| Ortalama Intel Core Ultra 7 155H, Intel Arc 8-Core iGPU (7605 - 11289, n=34) | |
| Dell Latitude 9330 | |
| MSI Summit E13 Flip Evo A11MT | |
| MSI Summit E13 AI Evo A1MTG | |
| PCMark 10 / Productivity | |
| Ortalama Intel Core Ultra 7 155H, Intel Arc 8-Core iGPU (6042 - 10591, n=34) | |
| Lenovo Yoga Book 9 13IMU9 | |
| Lenovo ThinkPad L13 Yoga G4 i7-1355U | |
| HP Elite Dragonfly Folio 13.5 G3 | |
| Dell Latitude 9330 | |
| MSI Summit E13 Flip Evo A11MT | |
| MSI Summit E13 AI Evo A1MTG | |
| PCMark 10 / Digital Content Creation | |
| Ortalama Intel Core Ultra 7 155H, Intel Arc 8-Core iGPU (4985 - 10709, n=34) | |
| Lenovo Yoga Book 9 13IMU9 | |
| MSI Summit E13 AI Evo A1MTG | |
| Lenovo ThinkPad L13 Yoga G4 i7-1355U | |
| HP Elite Dragonfly Folio 13.5 G3 | |
| Dell Latitude 9330 | |
| MSI Summit E13 Flip Evo A11MT | |
| CrossMark / Overall | |
| Ortalama Intel Core Ultra 7 155H, Intel Arc 8-Core iGPU (1366 - 1903, n=34) | |
| MSI Summit E13 AI Evo A1MTG | |
| HP Elite Dragonfly Folio 13.5 G3 | |
| Lenovo ThinkPad L13 Yoga G4 i7-1355U | |
| Lenovo Yoga Book 9 13IMU9 | |
| CrossMark / Productivity | |
| Ortalama Intel Core Ultra 7 155H, Intel Arc 8-Core iGPU (1291 - 1798, n=33) | |
| HP Elite Dragonfly Folio 13.5 G3 | |
| MSI Summit E13 AI Evo A1MTG | |
| Lenovo ThinkPad L13 Yoga G4 i7-1355U | |
| Lenovo Yoga Book 9 13IMU9 | |
| CrossMark / Creativity | |
| Ortalama Intel Core Ultra 7 155H, Intel Arc 8-Core iGPU (1519 - 1929, n=33) | |
| MSI Summit E13 AI Evo A1MTG | |
| HP Elite Dragonfly Folio 13.5 G3 | |
| Lenovo ThinkPad L13 Yoga G4 i7-1355U | |
| Lenovo Yoga Book 9 13IMU9 | |
| CrossMark / Responsiveness | |
| HP Elite Dragonfly Folio 13.5 G3 | |
| MSI Summit E13 AI Evo A1MTG | |
| Ortalama Intel Core Ultra 7 155H, Intel Arc 8-Core iGPU (939 - 1802, n=33) | |
| Lenovo Yoga Book 9 13IMU9 | |
| Lenovo ThinkPad L13 Yoga G4 i7-1355U | |
| WebXPRT 3 / Overall | |
| Lenovo ThinkPad L13 Yoga G4 i7-1355U | |
| HP Elite Dragonfly Folio 13.5 G3 | |
| MSI Summit E13 AI Evo A1MTG | |
| Ortalama Intel Core Ultra 7 155H, Intel Arc 8-Core iGPU (252 - 299, n=34) | |
| Lenovo Yoga Book 9 13IMU9 | |
| MSI Summit E13 Flip Evo A11MT | |
| Dell Latitude 9330 | |
| WebXPRT 4 / Overall | |
| Lenovo ThinkPad L13 Yoga G4 i7-1355U | |
| Ortalama Intel Core Ultra 7 155H, Intel Arc 8-Core iGPU (166.4 - 309, n=29) | |
| Lenovo Yoga Book 9 13IMU9 | |
| HP Elite Dragonfly Folio 13.5 G3 | |
| Dell Latitude 9330 | |
| MSI Summit E13 AI Evo A1MTG | |
| Mozilla Kraken 1.1 / Total | |
| MSI Summit E13 Flip Evo A11MT | |
| Dell Latitude 9330 | |
| HP Elite Dragonfly Folio 13.5 G3 | |
| Lenovo Yoga Book 9 13IMU9 | |
| MSI Summit E13 AI Evo A1MTG | |
| Ortalama Intel Core Ultra 7 155H, Intel Arc 8-Core iGPU (517 - 614, n=35) | |
| Lenovo ThinkPad L13 Yoga G4 i7-1355U | |
* ... daha küçük daha iyidir
| PCMark 10 Score | 4809 puan | |
Yardım | ||
| AIDA64 / Memory Copy | |
| Ortalama Intel Core Ultra 7 155H (62397 - 96791, n=50) | |
| Lenovo Yoga Book 9 13IMU9 | |
| MSI Summit E13 AI Evo A1MTG | |
| Dell Latitude 9330 | |
| HP Elite Dragonfly Folio 13.5 G3 | |
| Lenovo ThinkPad L13 Yoga G4 i7-1355U | |
| MSI Summit E13 Flip Evo A11MT | |
| AIDA64 / Memory Read | |
| Ortalama Intel Core Ultra 7 155H (60544 - 90647, n=50) | |
| MSI Summit E13 AI Evo A1MTG | |
| HP Elite Dragonfly Folio 13.5 G3 | |
| Lenovo Yoga Book 9 13IMU9 | |
| Dell Latitude 9330 | |
| MSI Summit E13 Flip Evo A11MT | |
| Lenovo ThinkPad L13 Yoga G4 i7-1355U | |
| AIDA64 / Memory Write | |
| HP Elite Dragonfly Folio 13.5 G3 | |
| MSI Summit E13 AI Evo A1MTG | |
| Ortalama Intel Core Ultra 7 155H (58692 - 93451, n=50) | |
| Lenovo ThinkPad L13 Yoga G4 i7-1355U | |
| Dell Latitude 9330 | |
| Lenovo Yoga Book 9 13IMU9 | |
| MSI Summit E13 Flip Evo A11MT | |
| AIDA64 / Memory Latency | |
| Lenovo Yoga Book 9 13IMU9 | |
| Ortalama Intel Core Ultra 7 155H (116.2 - 233, n=50) | |
| MSI Summit E13 AI Evo A1MTG | |
| HP Elite Dragonfly Folio 13.5 G3 | |
| Dell Latitude 9330 | |
| Lenovo ThinkPad L13 Yoga G4 i7-1355U | |
| MSI Summit E13 Flip Evo A11MT | |
* ... daha küçük daha iyidir
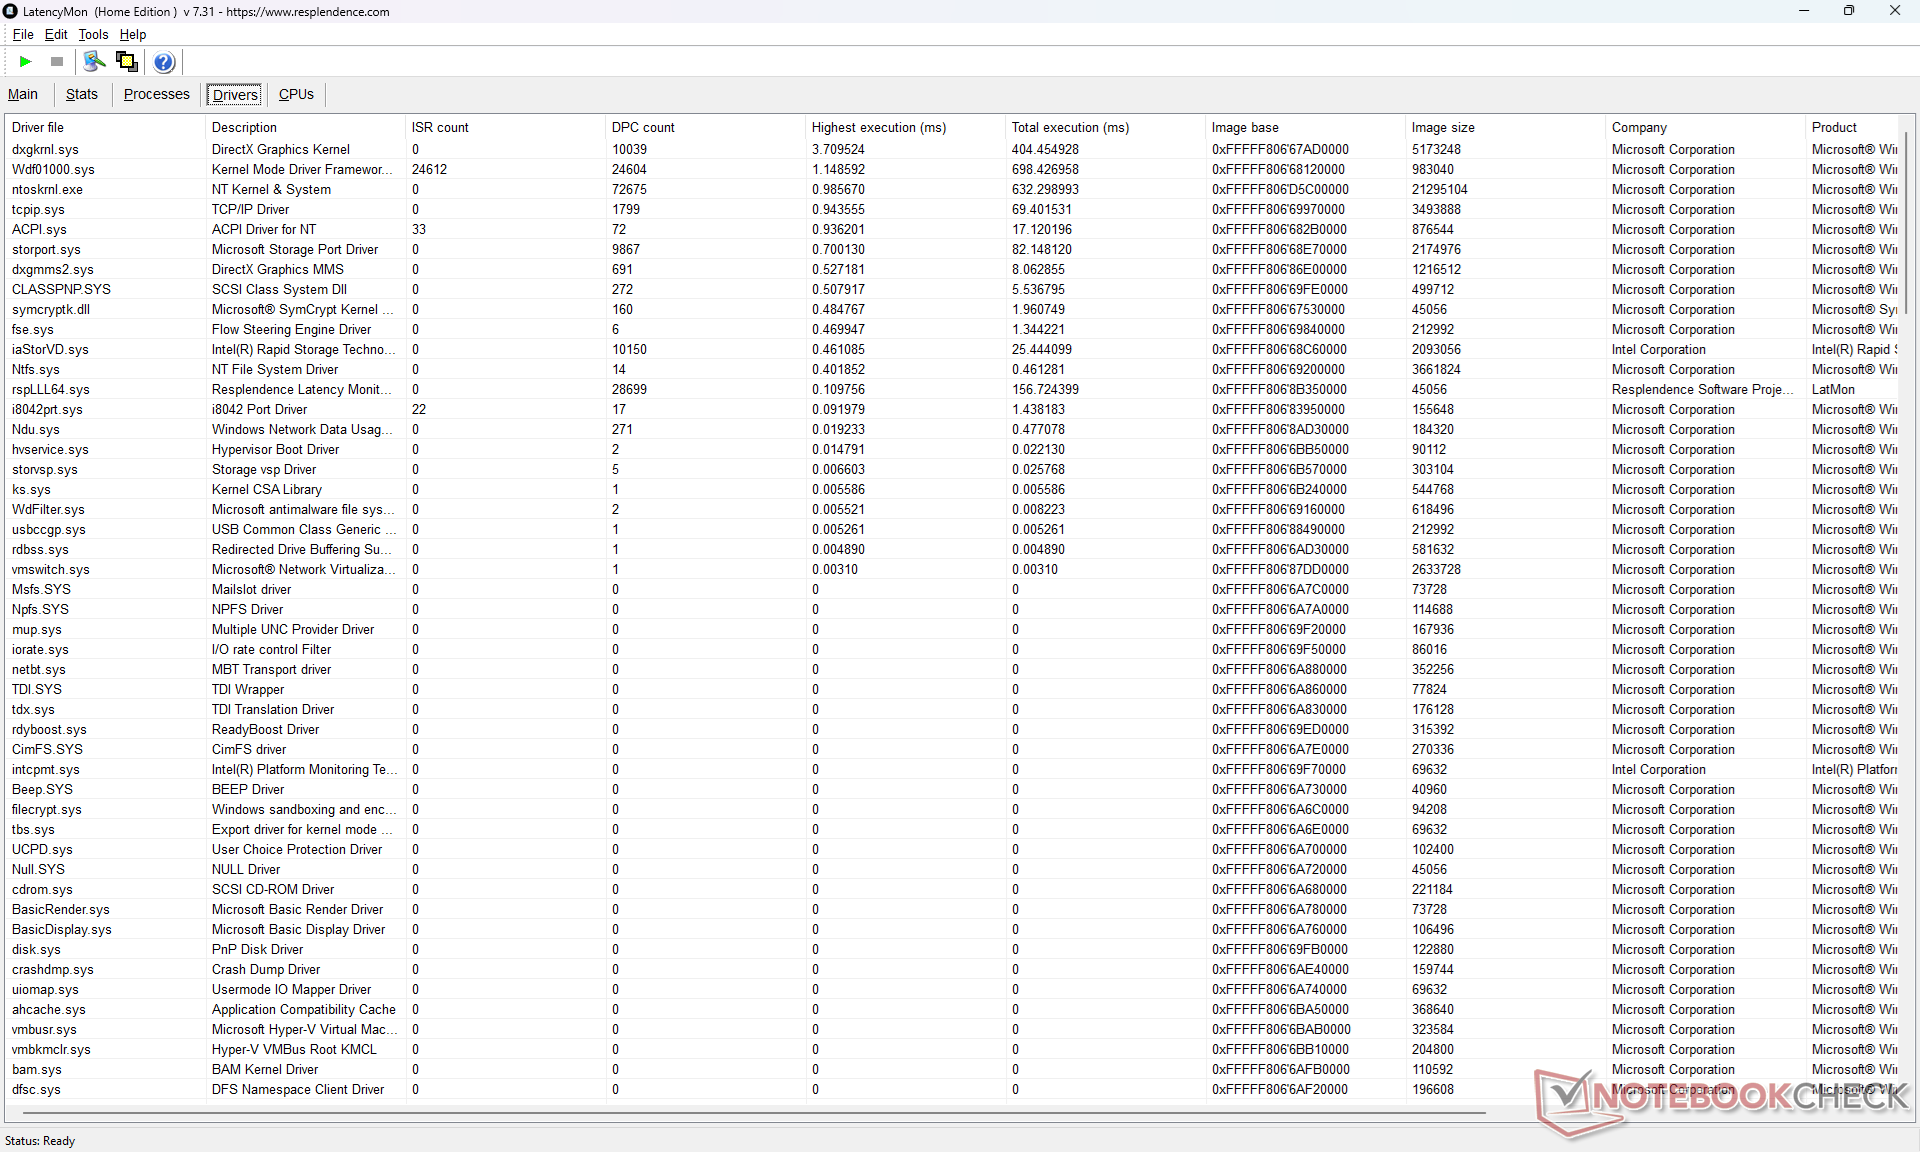
DPC Gecikme Süresi
LatencyMon, ana sayfamızın birden fazla tarayıcı sekmesini açarken DPC sorunlarını ortaya çıkarır. 4K60 video oynatımı kusurlu ancak yine de testin başlangıcında sadece 3 kare düşerek sorunsuz.
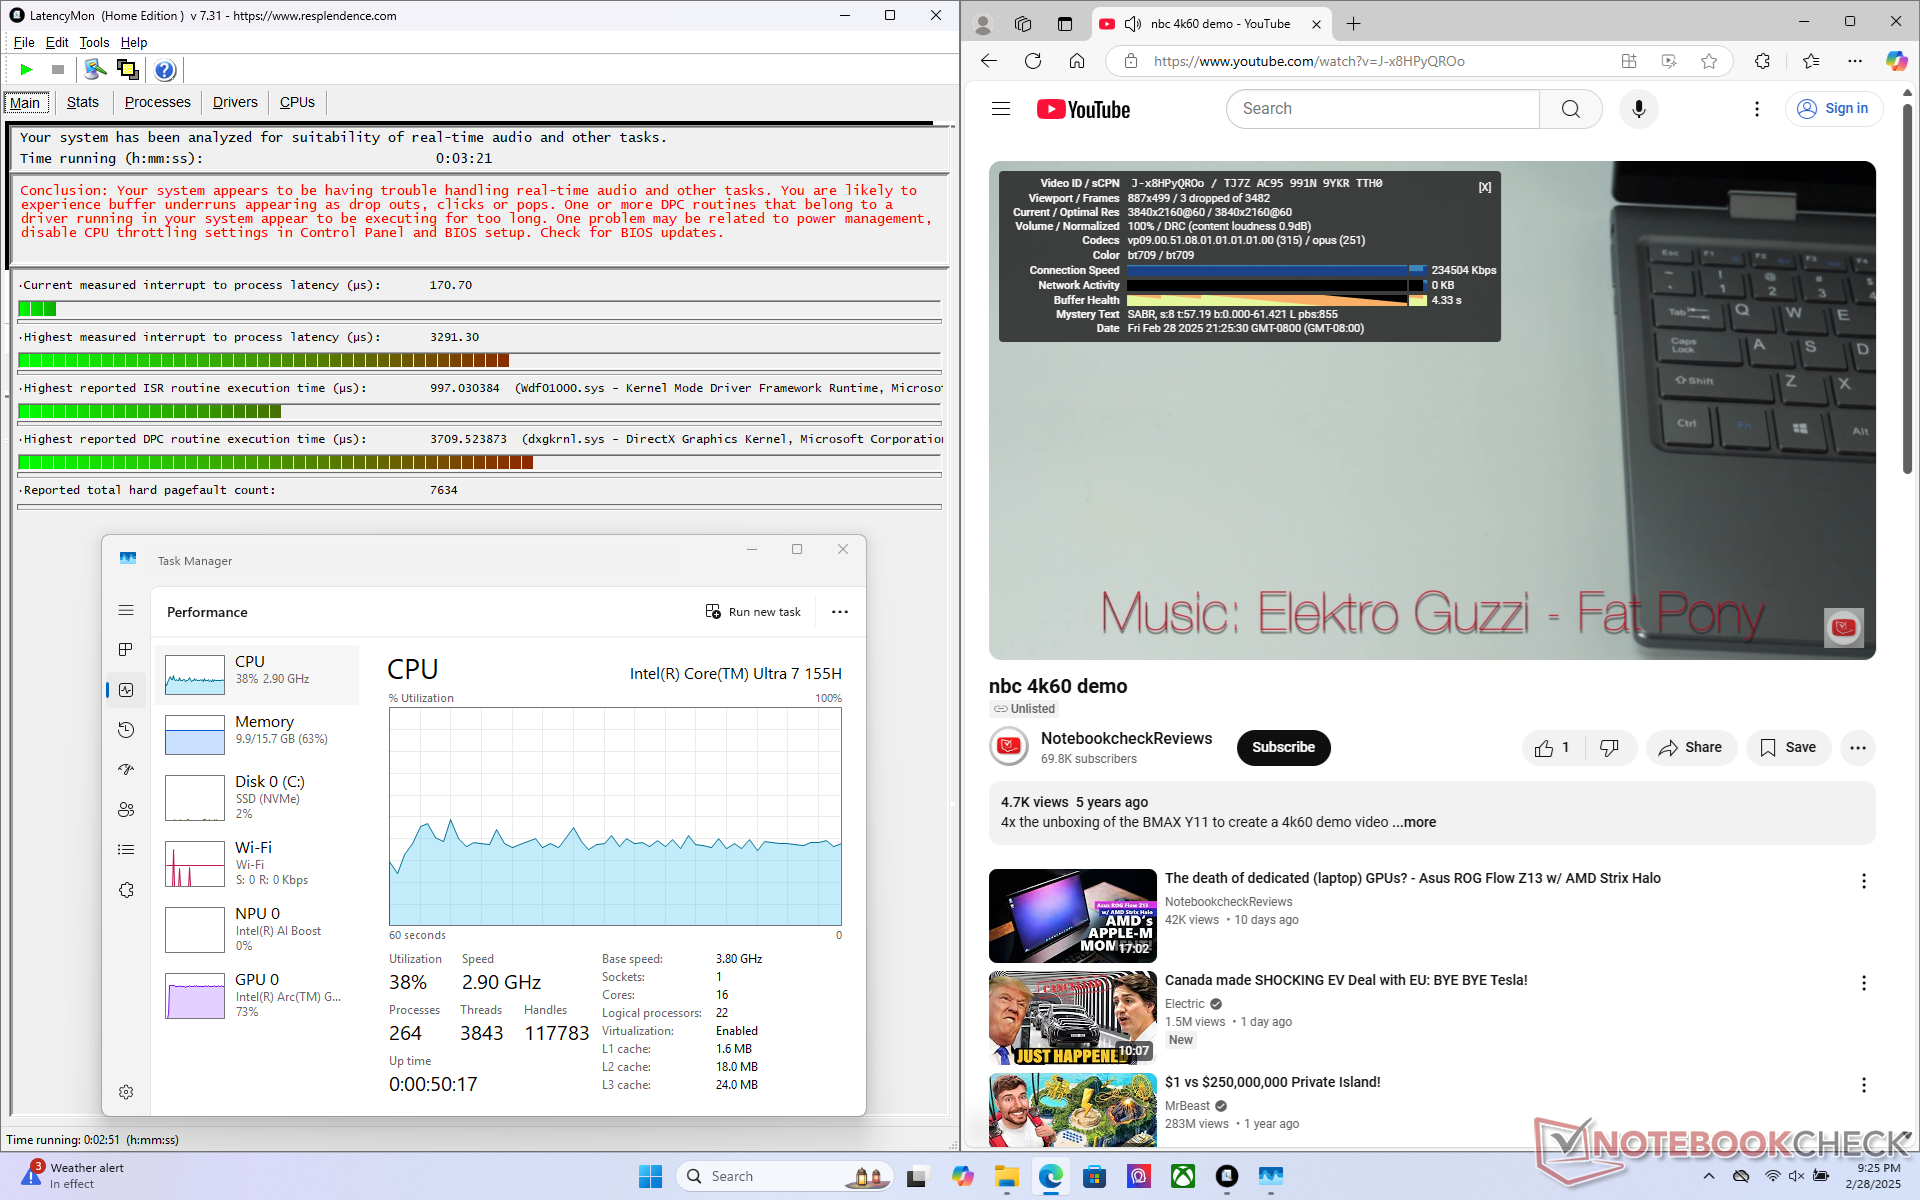
| DPC Latencies / LatencyMon - interrupt to process latency (max), Web, Youtube, Prime95 | |
| Dell Latitude 9330 | |
| HP Elite Dragonfly Folio 13.5 G3 | |
| MSI Summit E13 AI Evo A1MTG | |
| MSI Summit E13 Flip Evo A11MT | |
| Lenovo ThinkPad L13 Yoga G4 i7-1355U | |
| Lenovo Yoga Book 9 13IMU9 | |
* ... daha küçük daha iyidir
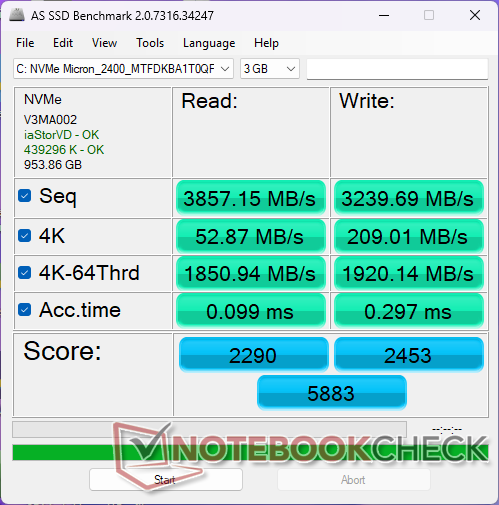
Depolama Cihazları
Bu Micron 2400 PCIe4 x4 NVMe SSD stres altında yavaşlar. Örneğin DiskSpd'yi bir döngüde çalıştırırken, transfer hızları ~4300 MB/s'ye ulaştıktan sonra testin yaklaşık 5 dakika sonrasında sadece ~2600 MB/s'ye düşüyordu.


* ... daha küçük daha iyidir
Disk Throttling: DiskSpd Read Loop, Queue Depth 8
GPU Performansı
Yukarıda bahsedilen beklenenden daha yavaş CPU performansı, beklenenden daha yavaş grafik performansına yol açmıştır. Bu Ark 8 mSI'ımız 3DMark kıyaslamalarına göre aynı entegre grafiklere sahip veritabanımızdaki ortalama dizüstü bilgisayardan yaklaşık yüzde 15 ila 25 daha yavaş performans gösteriyor.
F1 22 ve Cyberpunk 2077, ayarlar Yüksek veya Ultra'ya getirildiğinde çöküyor.
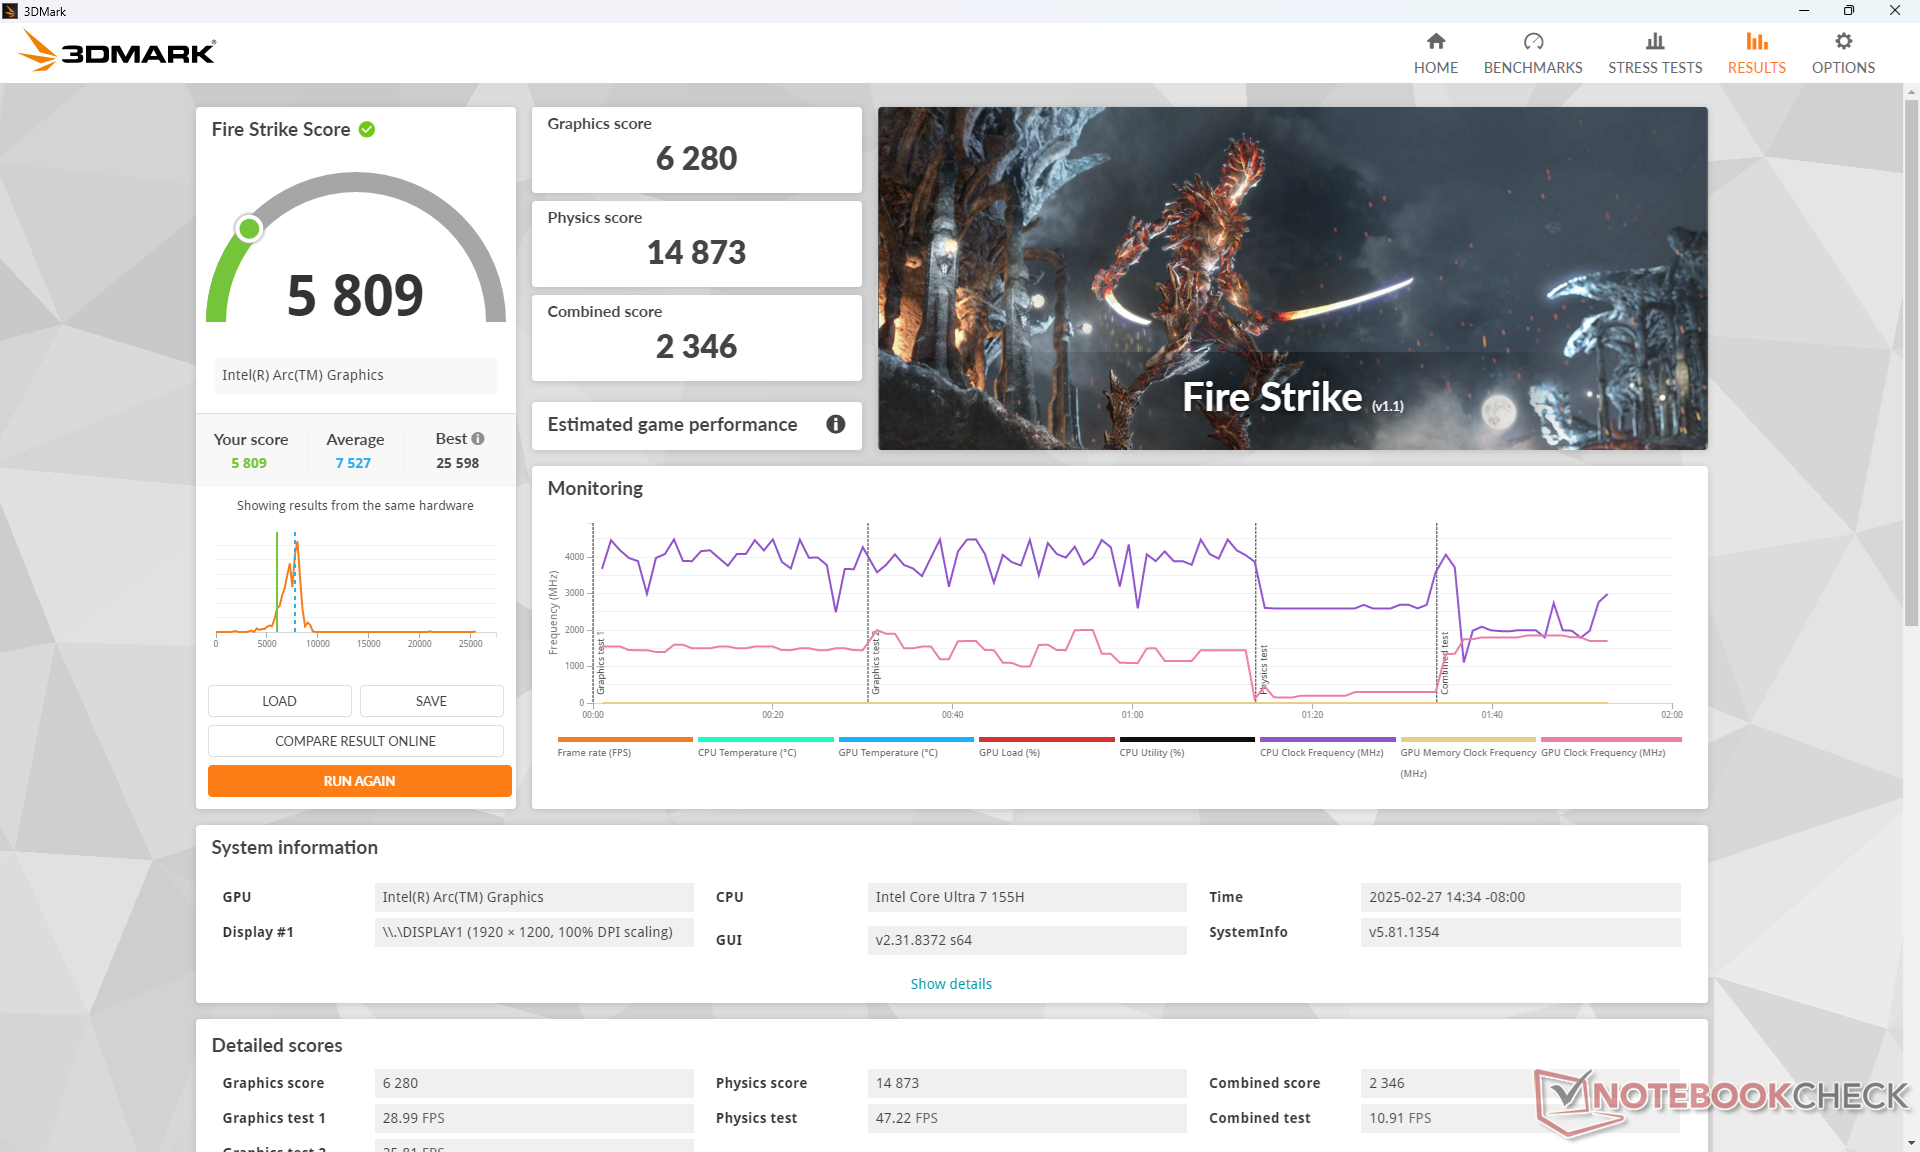
| Güç Profili | Grafik Puanı | Fizik Puanı | Birleşik Puan |
| Performans Modu | 6280 | 14873 | 2346 |
| Dengeli Mod | 5786 (-8%) | 9842 (-34%) | 1685 (-28%) |
| Akü Gücü | 5196 (-17%) | 15031 (-0%) | 2267 (-3%) |
Dengeli modda çalıştırmak, yukarıdaki Fire Strike sonuç tablomuza göre CPU performansını oldukça önemli ölçüde etkileyebilir.
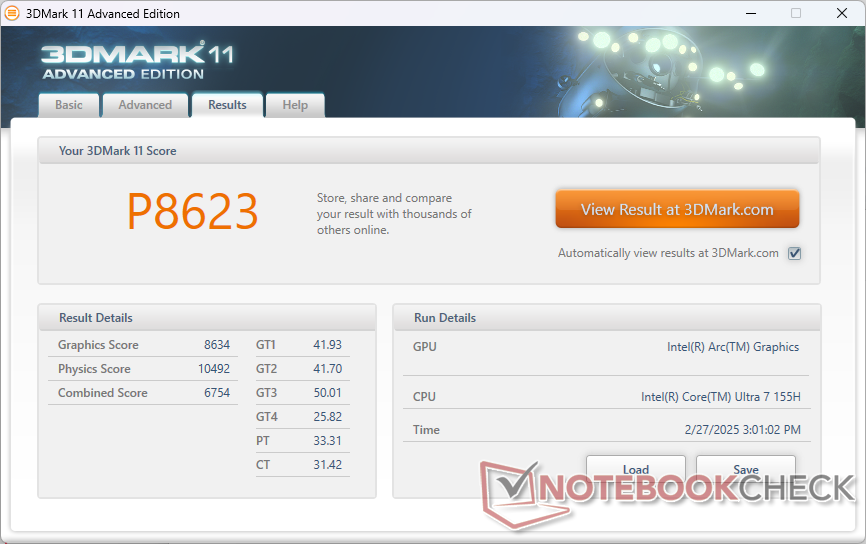
| 3DMark 11 Performance | 8623 puan | |
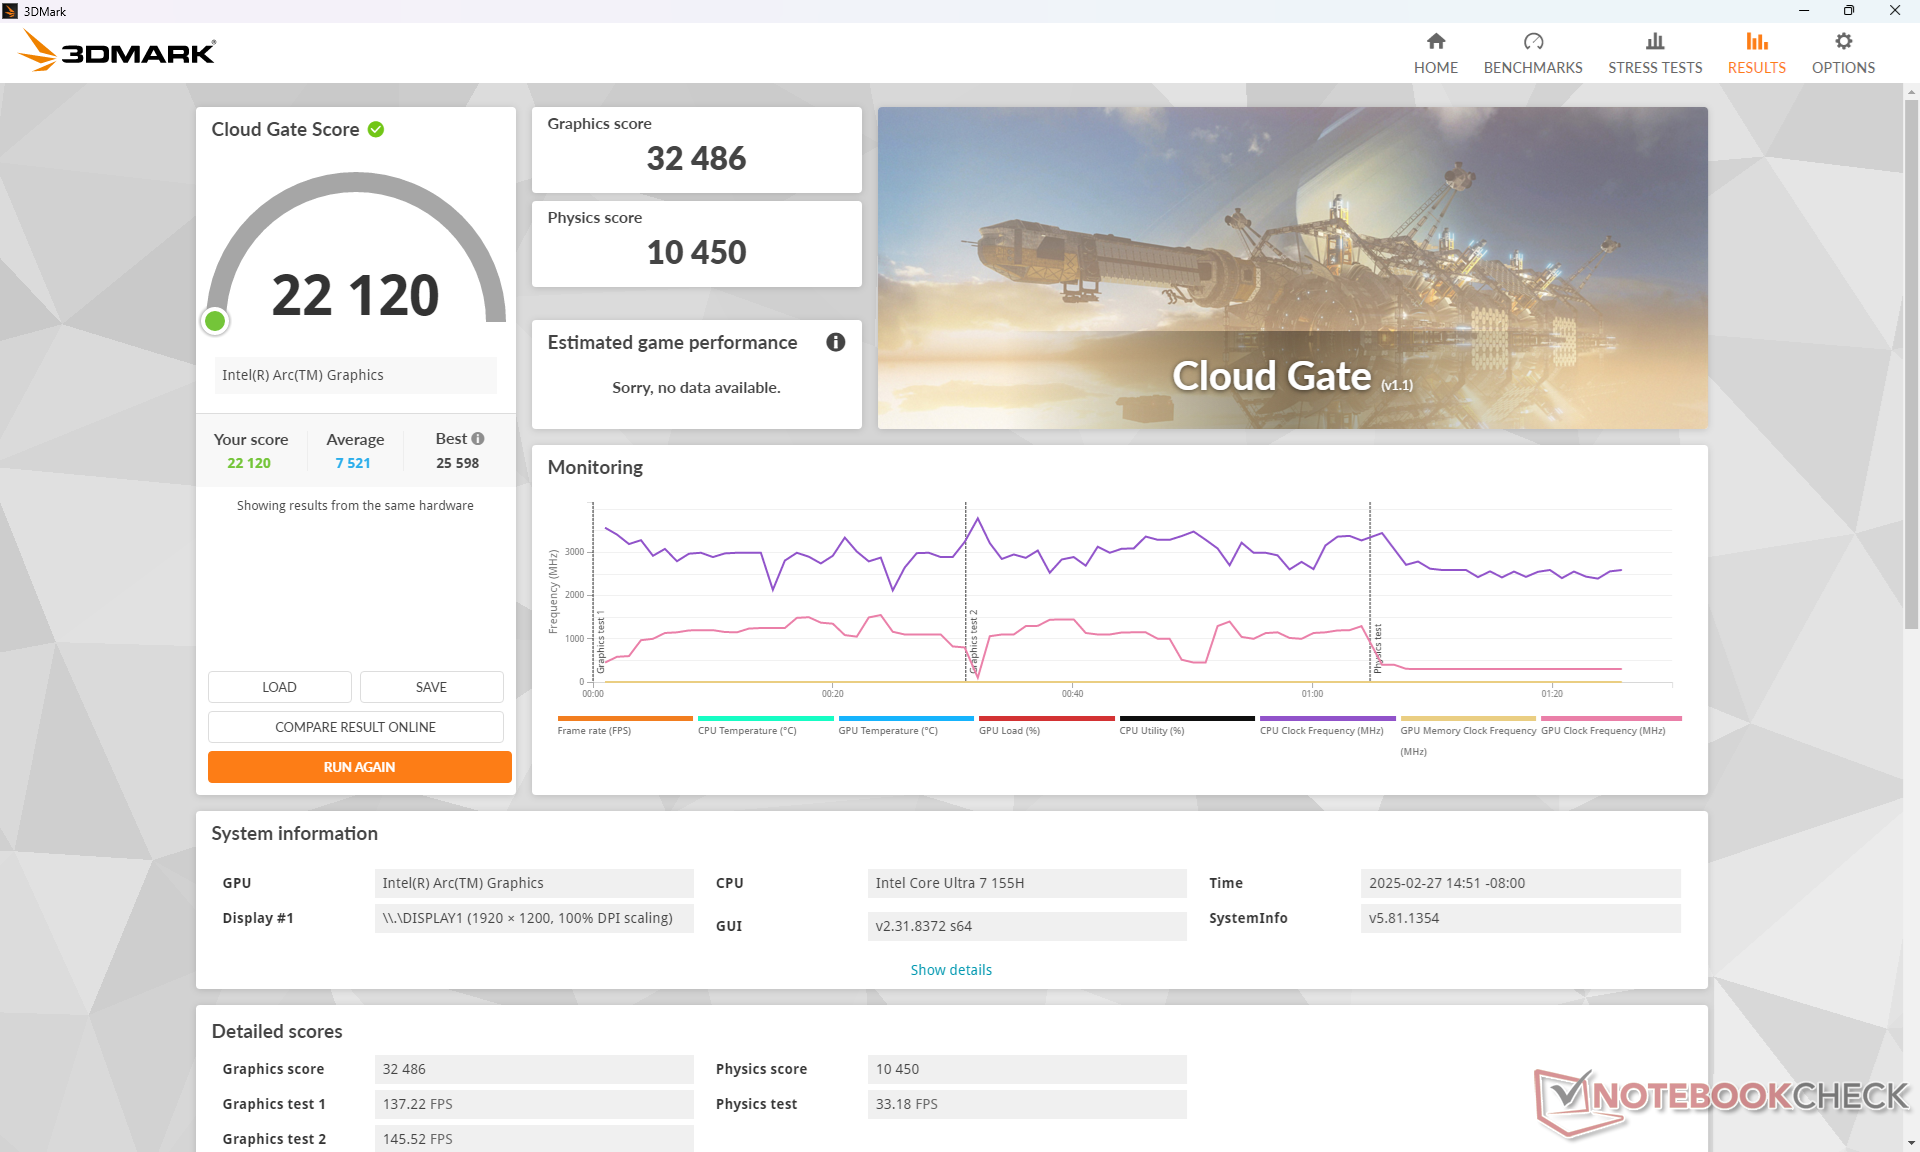
| 3DMark Cloud Gate Standard Score | 22120 puan | |
| 3DMark Fire Strike Score | 5809 puan | |
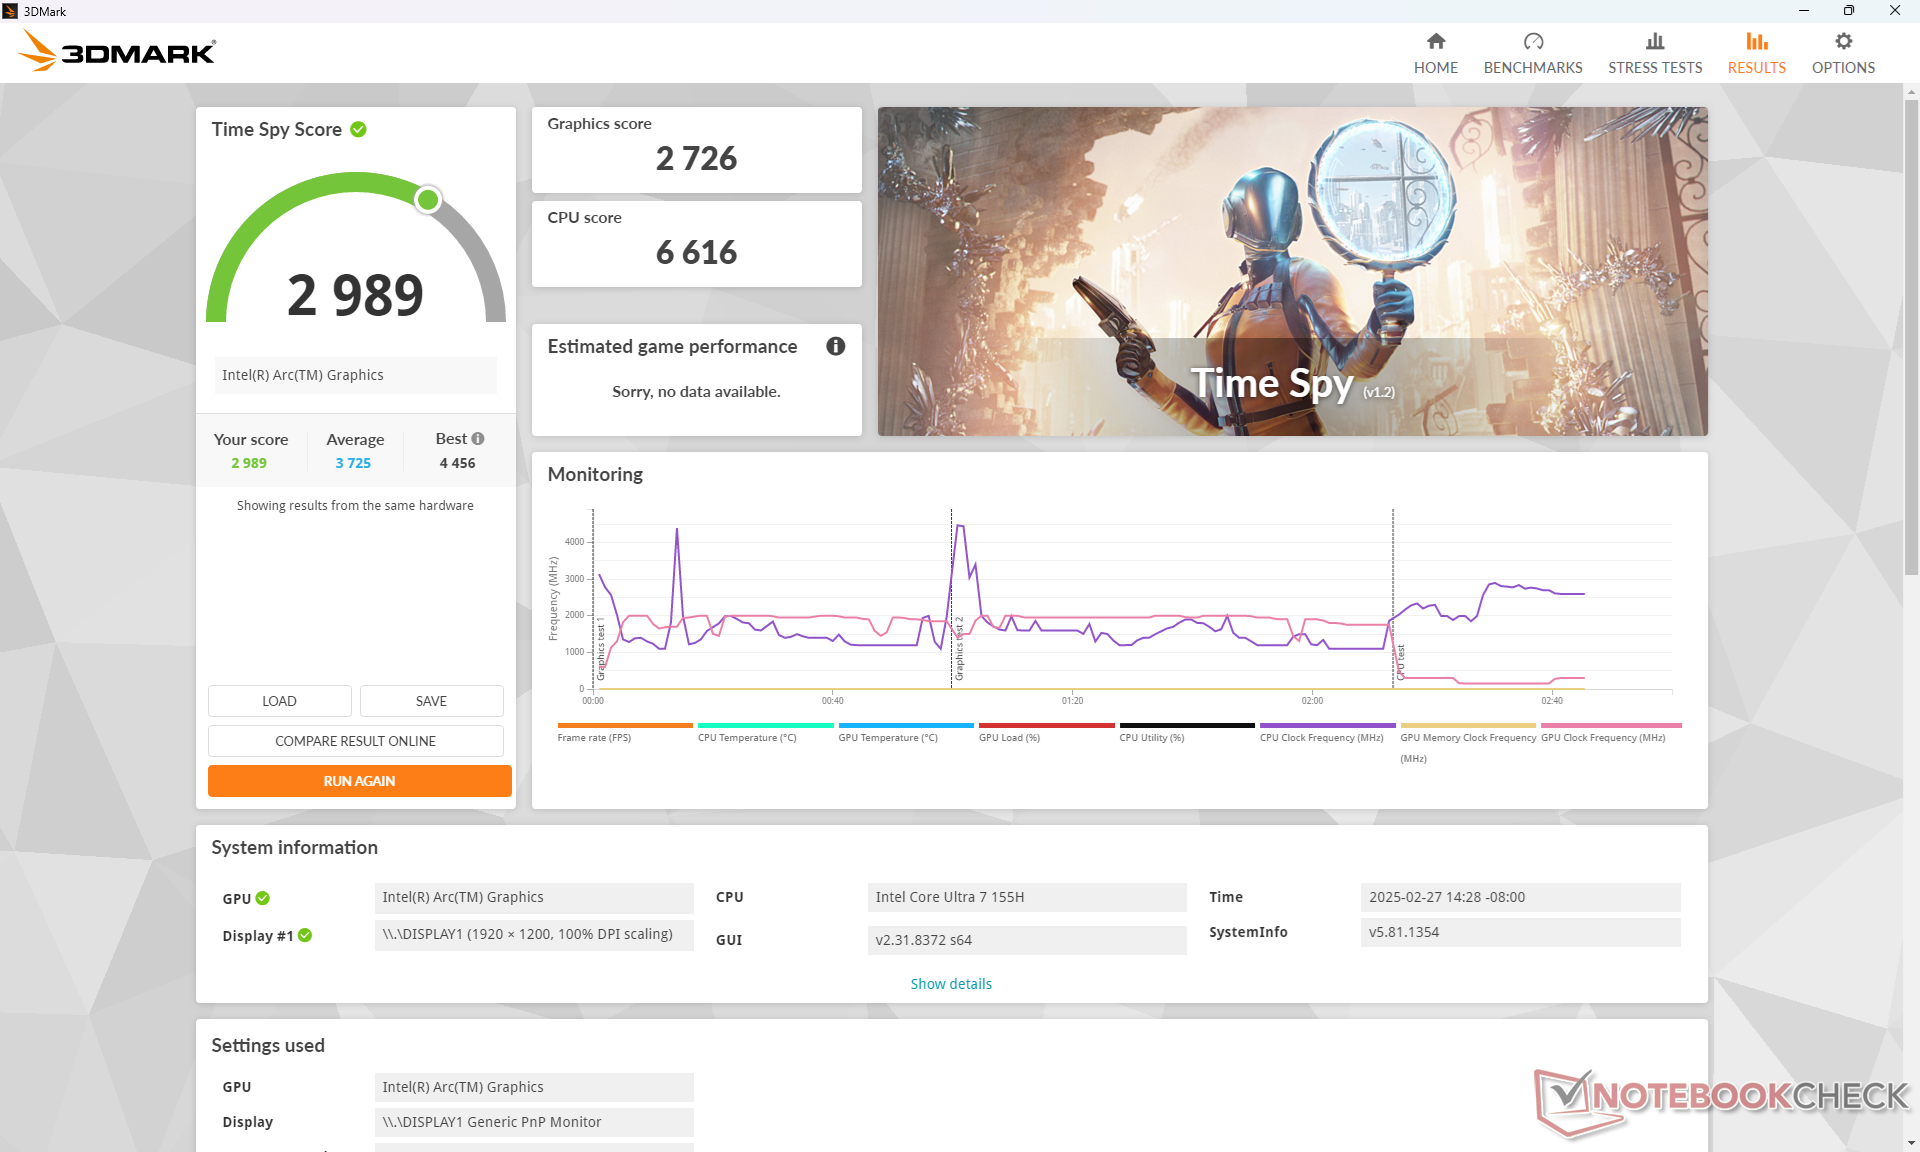
| 3DMark Time Spy Score | 2989 puan | |
Yardım | ||
* ... daha küçük daha iyidir
Oyun Performansı
Oyun performansı zayıf. Yukarıda belirtilen CPU ve GPU eksikliklerinin yanı sıra, DOTA 2 Reborn gibi iddiasız oyunları çalıştırırken bile göze çarpan gölgelenme ve takılma sorunları dikkat dağıtıcı olabilir.
| Cyberpunk 2077 2.2 Phantom Liberty | |
| 1280x720 Low Preset (FSR off) | |
| MSI Prestige 13 AI Plus Evo A2VMG | |
| Ortalama Intel Arc 8-Core iGPU (34.5 - 58, n=18) | |
| MSI Summit E13 AI Evo A1MTG | |
| Lenovo Yoga Book 9 13IMU9 | |
| 1920x1080 Low Preset (FSR off) | |
| Asus ROG Flow Z13 GZ302EA-RU073W | |
| MSI Prestige 13 AI Plus Evo A2VMG | |
| Ortalama Intel Arc 8-Core iGPU (11.3 - 38, n=36) | |
| MSI Summit E13 AI Evo A1MTG | |
| Lenovo Yoga Book 9 13IMU9 | |
| 1920x1080 Medium Preset (FSR off) | |
| Asus ROG Flow Z13 GZ302EA-RU073W | |
| MSI Prestige 13 AI Plus Evo A2VMG | |
| Ortalama Intel Arc 8-Core iGPU (9.42 - 31.4, n=34) | |
| MSI Summit E13 AI Evo A1MTG | |
| Lenovo Yoga Book 9 13IMU9 | |
| 1920x1080 High Preset (FSR off) | |
| Asus ROG Flow Z13 GZ302EA-RU073W | |
| MSI Prestige 13 AI Plus Evo A2VMG | |
| Ortalama Intel Arc 8-Core iGPU (7.3 - 27.6, n=34) | |
| Lenovo Yoga Book 9 13IMU9 | |
| 1920x1080 Ultra Preset (FSR off) | |
| Asus ROG Flow Z13 GZ302EA-RU073W | |
| MSI Prestige 13 AI Plus Evo A2VMG | |
| Ortalama Intel Arc 8-Core iGPU (13 - 24.7, n=26) | |
| Lenovo Yoga Book 9 13IMU9 | |
Cyberpunk 2077 ultra FPS Chart
| düşük | orta | yüksek | ultra | |
|---|---|---|---|---|
| GTA V (2015) | 50.6 | 51.1 | 23.9 | 12 |
| Dota 2 Reborn (2015) | 93.2 | 83.5 | 65.2 | 63 |
| Final Fantasy XV Benchmark (2018) | 49.2 | 29.4 | 20.7 | |
| X-Plane 11.11 (2018) | 46.2 | 37.5 | 31.4 | |
| Strange Brigade (2018) | 131.2 | 61.3 | 45.7 | 33.9 |
| Tiny Tina's Wonderlands (2022) | 41.5 | 31.7 | 22 | 17.7 |
| F1 22 (2022) | 57.8 | 53.5 | ||
| Baldur's Gate 3 (2023) | 22.8 | 19.5 | 16.8 | 16.3 |
| Cyberpunk 2077 2.2 Phantom Liberty (2023) | 28.3 | 23.4 |
Emisyonlar
Sistem Gürültüsü
Fan gürültüsü sadece gezinirken veya akış yaparken sessizdir, ancak daha yüksek yükler getirildiğinde oldukça hızlı bir şekilde toplanır. Ayrıca, gürültü nispeten tizdir ve bu nedenle herhangi bir RPM değişikliği fark edilebilir. Fanlar, daha zorlu Core Ultra-H CPU nedeniyle oyunlar gibi zorlu yükleri çalıştırırken diğer 13 inç iş dizüstü bilgisayarlarından daha yüksek ses çıkarır.
Ses yüksekliği
| Boşta |
| 24.1 / 24.8 / 26.5 dB |
| Çalışırken |
| 39.3 / 49.1 dB |
 | ||
30 dB sessiz 40 dB(A) duyulabilirlik 50 dB(A) gürültülü |
||
min: | ||
| MSI Summit E13 AI Evo A1MTG Arc 8-Core, Ultra 7 155H, Micron 2400 MTFDKBA1T0QFM | MSI Summit E13 Flip Evo A11MT Iris Xe G7 96EUs, i7-1185G7, Phison 1TB SM2801T24GKBB4S-E162 | Lenovo Yoga Book 9 13IMU9 Graphics 4-Core, Ultra 7 155U | Lenovo ThinkPad L13 Yoga G4 i7-1355U Iris Xe G7 96EUs, i7-1355U, Samsung PM9B1 512GB MZAL4512HBLU | HP Elite Dragonfly Folio 13.5 G3 Iris Xe G7 96EUs, i7-1265U, Samsung PM9A1 MZVL2512HCJQ | Dell Latitude 9330 Iris Xe G7 96EUs, i7-1260U | |
|---|---|---|---|---|---|---|
| Noise | 0% | 16% | 11% | 11% | 9% | |
| kapalı / ortam * | 24 | 24.5 -2% | 23.3 3% | 23.1 4% | 24.6 -3% | 23 4% |
| Idle Minimum * | 24.1 | 24.7 -2% | 23.3 3% | 23.4 3% | 24.6 -2% | 23 5% |
| Idle Average * | 24.8 | 24.7 -0% | 23.3 6% | 23.4 6% | 24.6 1% | 23.1 7% |
| Idle Maximum * | 26.5 | 26.4 -0% | 24.6 7% | 23.4 12% | 24.6 7% | 23.1 13% |
| Load Average * | 39.3 | 37.8 4% | 26.2 33% | 33.9 14% | 27.8 29% | 37.1 6% |
| Cyberpunk 2077 ultra * | 45 | |||||
| Load Maximum * | 49.1 | 48.8 1% | 27.3 44% | 36.9 25% | 33.4 32% | 40.5 18% |
| Witcher 3 ultra * | 41.4 | 27.3 | 36.9 | 33.4 | 40.6 |
* ... daha küçük daha iyidir
Sıcaklık
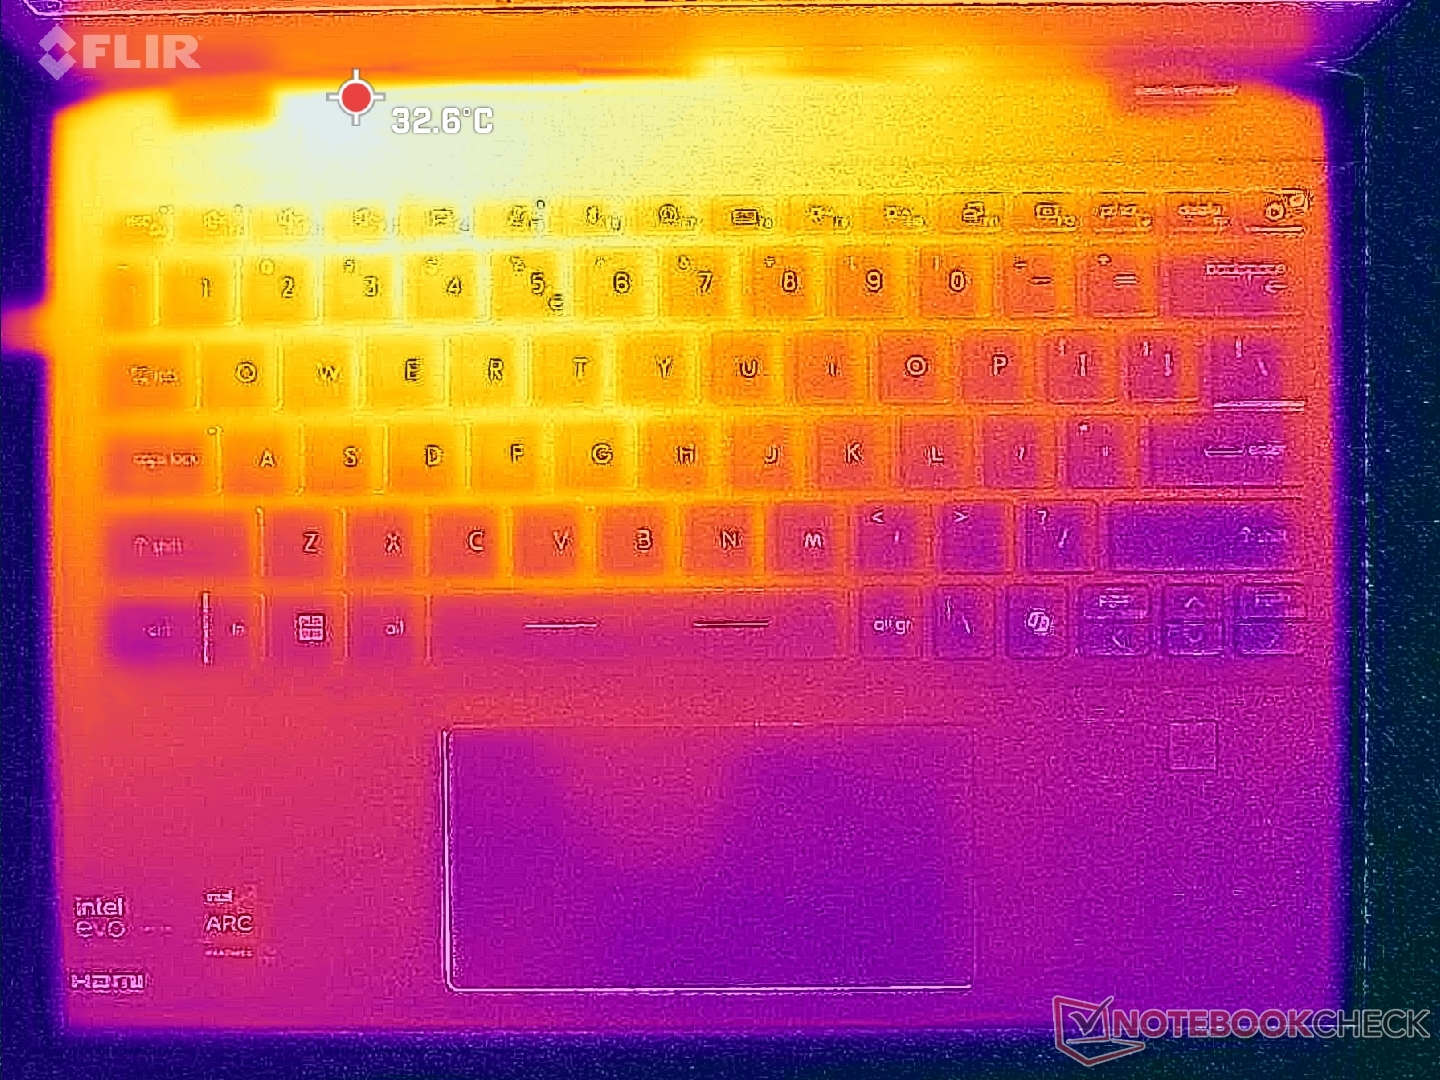
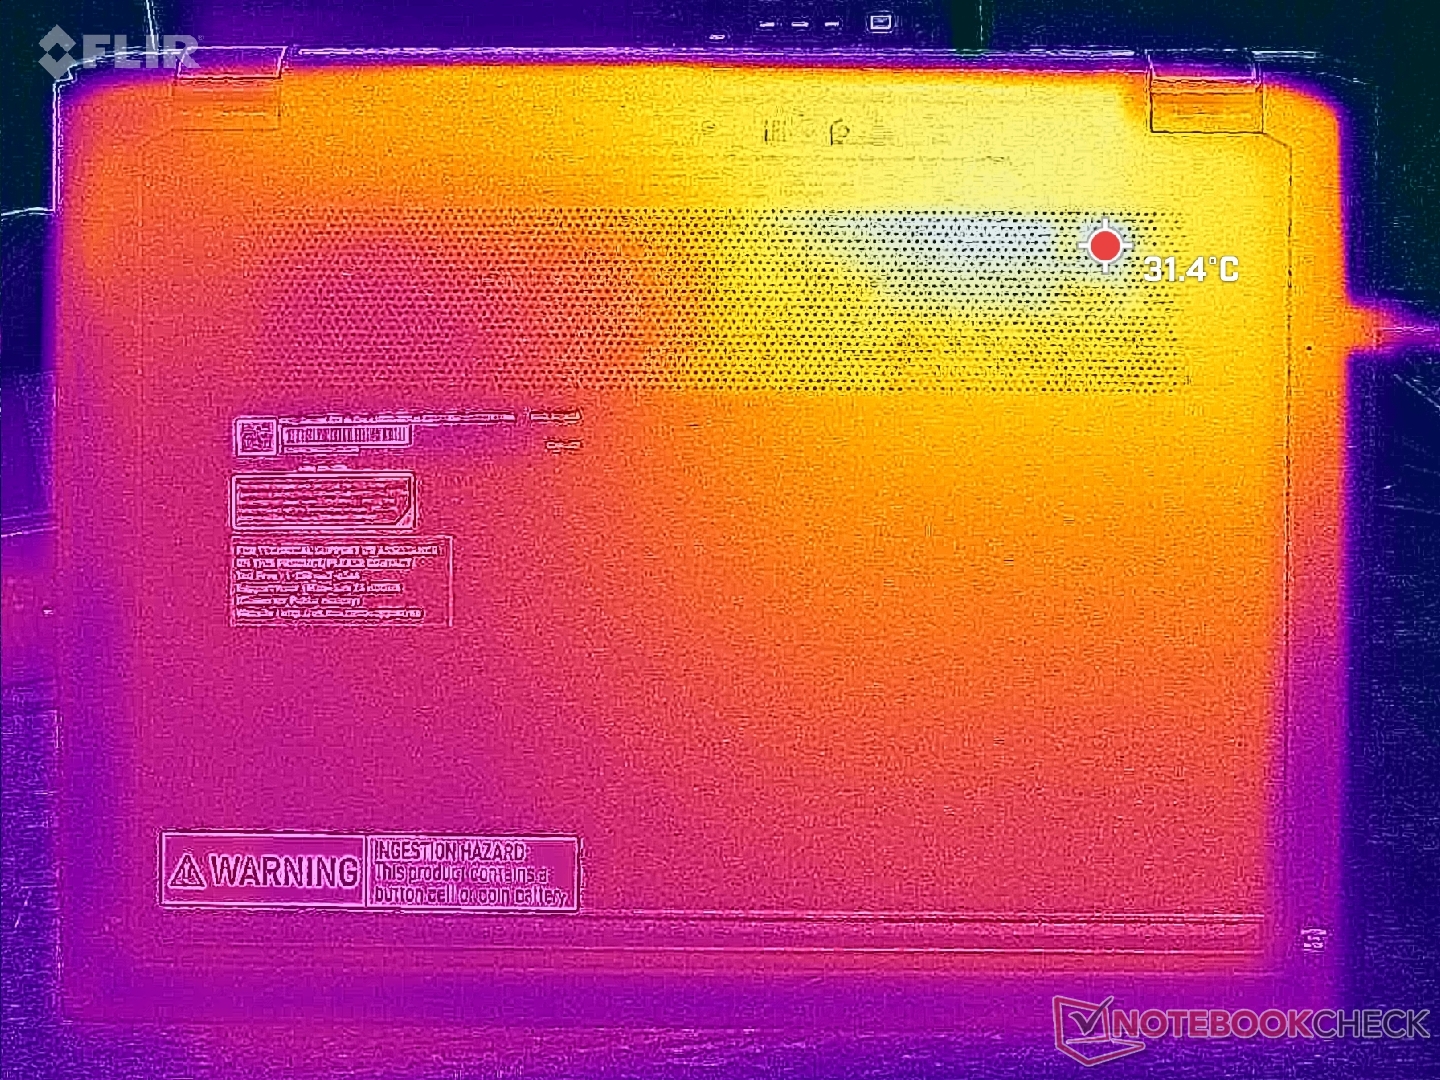
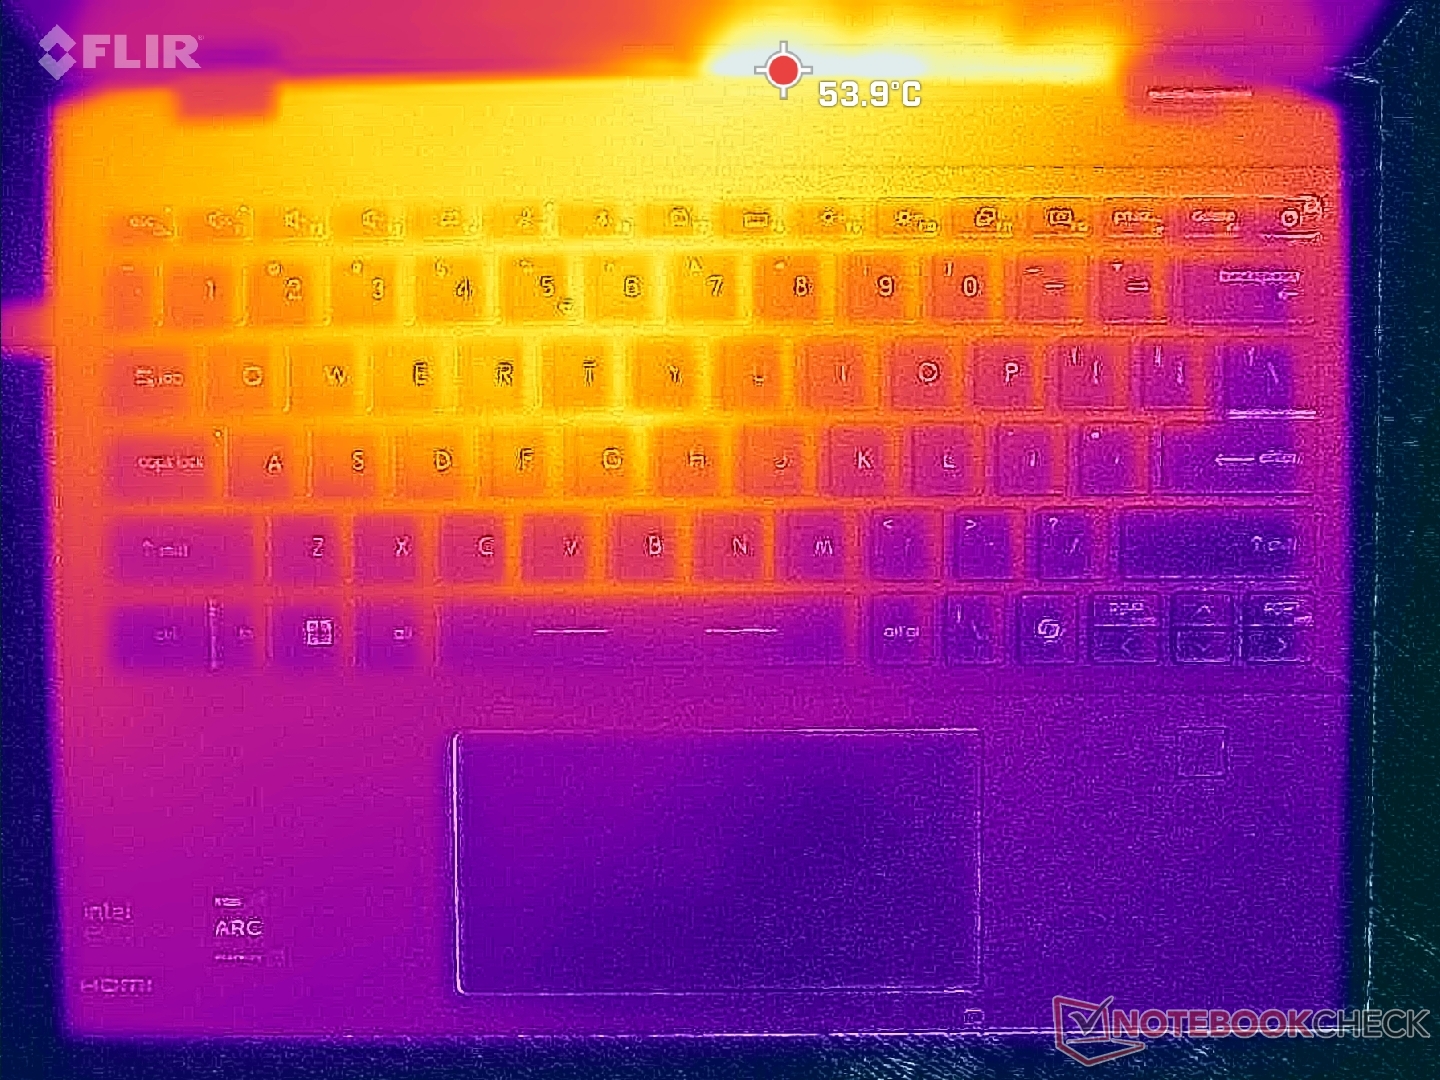
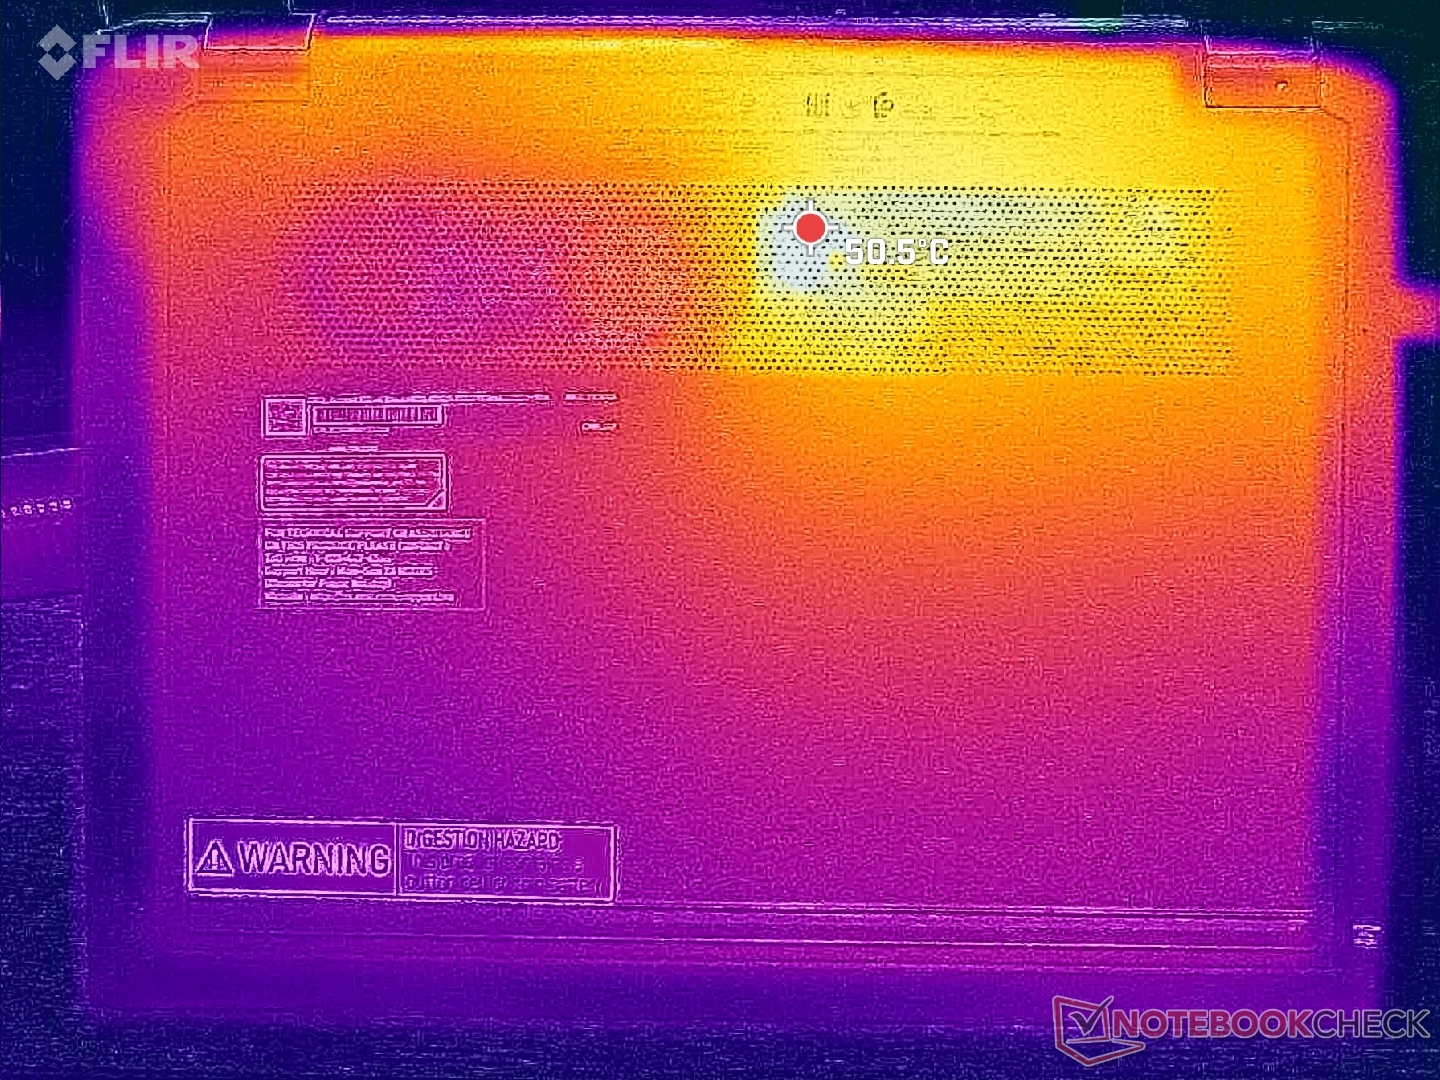
Masaüstünde rölantide çalışırken bile yüzey sıcaklıkları çok yüksektir. Sıcak noktalar, rölantide 36 C'den zorlu yükleri çalıştırırken 45 C'nin üzerine kadar değişir ve bu da diğer 13 inç dönüştürülebilirlerin çoğundan daha sıcaktır.
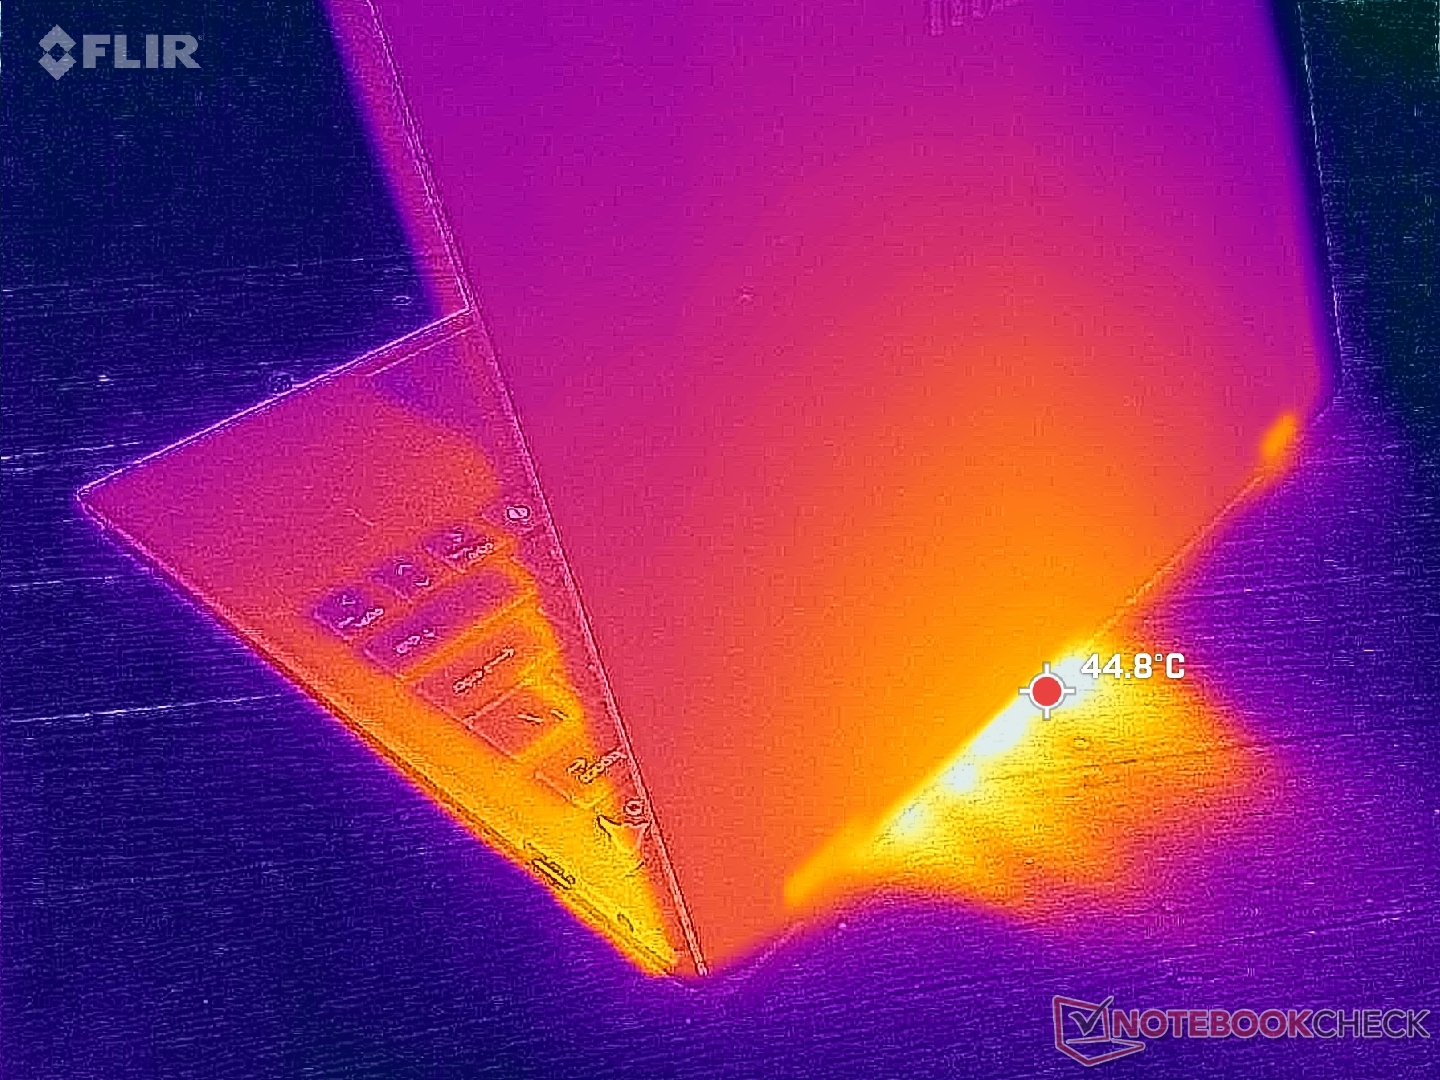
(-) Üst taraftaki maksimum sıcaklık, 35.4 °C / 96 F ortalamasına kıyasla 45.2 °C / 113 F'dir. , Convertible sınıfı için 19.6 ile 60 °C arasında değişir.
(±) Alt kısım, 36.8 °C / 98 F ortalamasına kıyasla maksimum 44.8 °C / 113 F'ye kadar ısınır
(+) Boşta kullanımda, üst tarafın ortalama sıcaklığı 30.1 °C / 86 F olup, cihazın 30.2 °C / 86 F.
(+) Avuç içi dayanakları ve dokunmatik yüzey, maksimum 28.8 °C / 83.8 F ile cilt sıcaklığından daha soğuktur ve bu nedenle dokunulduğunda soğuktur.
(±) Benzer cihazların avuç içi dayanağı alanının ortalama sıcaklığı 28 °C / 82.4 F (-0.8 °C / -1.4 F) idi.
| MSI Summit E13 AI Evo A1MTG Intel Core Ultra 7 155H, Intel Arc 8-Core iGPU | MSI Summit E13 Flip Evo A11MT Intel Core i7-1185G7, Intel Iris Xe Graphics G7 96EUs | Lenovo Yoga Book 9 13IMU9 Intel Core Ultra 7 155U, Intel Graphics 4-Core iGPU (Arc) | Lenovo ThinkPad L13 Yoga G4 i7-1355U Intel Core i7-1355U, Intel Iris Xe Graphics G7 96EUs | HP Elite Dragonfly Folio 13.5 G3 Intel Core i7-1265U, Intel Iris Xe Graphics G7 96EUs | Dell Latitude 9330 Intel Core i7-1260U, Intel Iris Xe Graphics G7 96EUs | |
|---|---|---|---|---|---|---|
| Heat | -7% | 10% | 6% | 28% | 12% | |
| Maximum Upper Side * | 45.2 | 52 -15% | 39.2 13% | 38.4 15% | 32.8 27% | 40.6 10% |
| Maximum Bottom * | 44.8 | 57.4 -28% | 41 8% | 46 -3% | 33.4 25% | 50.2 -12% |
| Idle Upper Side * | 34.8 | 30.4 13% | 32.2 7% | 31.2 10% | 24.6 29% | 25 28% |
| Idle Bottom * | 35.8 | 34.2 4% | 31.6 12% | 34.8 3% | 24.6 31% | 27.6 23% |
* ... daha küçük daha iyidir
Konuşmacılar
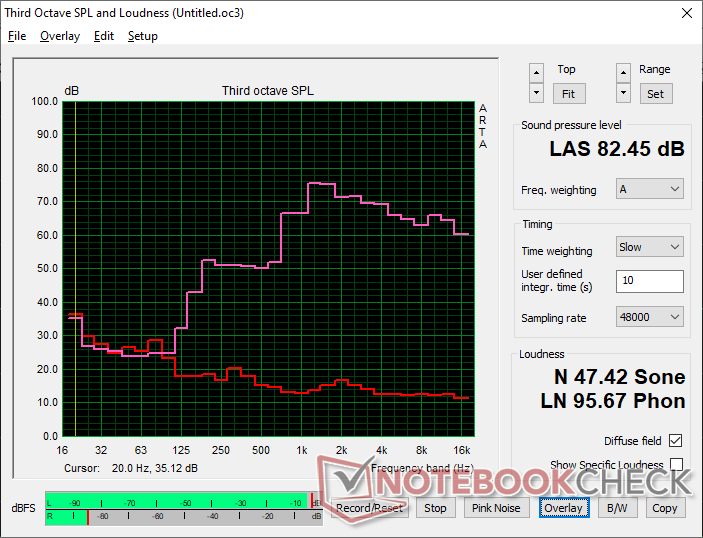
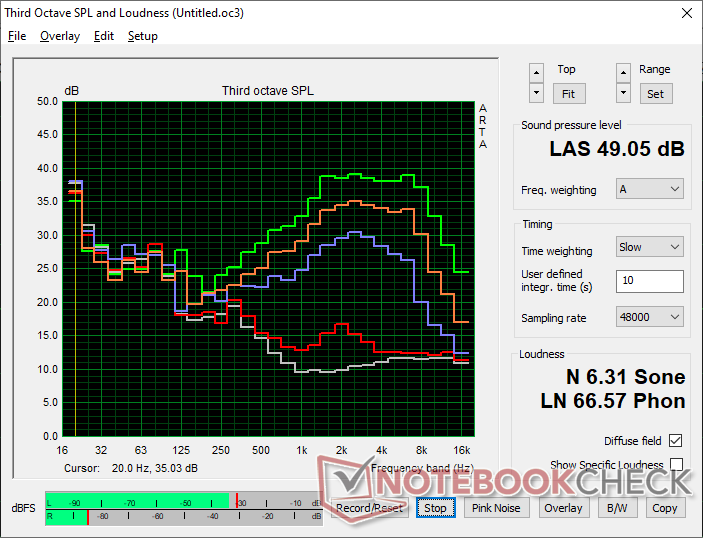
MSI Summit E13 AI Evo A1MTG ses analizi
(+) | hoparlörler nispeten yüksek sesle çalabilir (82.5 dB)
Bas 100 - 315Hz
(-) | neredeyse hiç bas yok - ortalama olarak medyandan 21.9% daha düşük
(±) | Bas doğrusallığı ortalamadır (9.9% delta - önceki frekans)
Ortalar 400 - 2000 Hz
(±) | azaltılmış orta sesler - ortalama olarak medyandan 9.2% daha düşük
(±) | Ortaların doğrusallığı ortalamadır (7.6% delta - önceki frekans)
Yüksekler 2 - 16 kHz
(+) | dengeli yüksekler - medyandan yalnızca 3.2% uzakta
(+) | yüksekler doğrusaldır (3.3% deltadan önceki frekansa)
Toplam 100 - 16.000 Hz
(±) | Genel sesin doğrusallığı ortalamadır (21.4% ortancaya göre fark)
Aynı sınıfla karşılaştırıldığında
» Bu sınıftaki tüm test edilen cihazların %55%'si daha iyi, 12% benzer, 33% daha kötüydü
» En iyisinin deltası 6% idi, ortalama 20% idi, en kötüsü 57% idi
Test edilen tüm cihazlarla karşılaştırıldığında
» Test edilen tüm cihazların %57'si daha iyi, 7 benzer, % 35 daha kötüydü
» En iyisinin deltası 4% idi, ortalama 24% idi, en kötüsü 134% idi
Apple MacBook Pro 16 2021 M1 Pro ses analizi
(+) | hoparlörler nispeten yüksek sesle çalabilir (84.7 dB)
Bas 100 - 315Hz
(+) | iyi bas - medyandan yalnızca 3.8% uzakta
(+) | bas doğrusaldır (5.2% delta ile önceki frekans)
Ortalar 400 - 2000 Hz
(+) | dengeli ortalar - medyandan yalnızca 1.3% uzakta
(+) | orta frekanslar doğrusaldır (2.1% deltadan önceki frekansa)
Yüksekler 2 - 16 kHz
(+) | dengeli yüksekler - medyandan yalnızca 1.9% uzakta
(+) | yüksekler doğrusaldır (2.7% deltadan önceki frekansa)
Toplam 100 - 16.000 Hz
(+) | genel ses doğrusaldır (4.6% ortancaya göre fark)
Aynı sınıfla karşılaştırıldığında
» Bu sınıftaki tüm test edilen cihazların %0%'si daha iyi, 0% benzer, 100% daha kötüydü
» En iyisinin deltası 5% idi, ortalama 18% idi, en kötüsü 45% idi
Test edilen tüm cihazlarla karşılaştırıldığında
» Test edilen tüm cihazların %0'si daha iyi, 0 benzer, % 100 daha kötüydü
» En iyisinin deltası 4% idi, ortalama 24% idi, en kötüsü 134% idi
Enerji Yönetimi
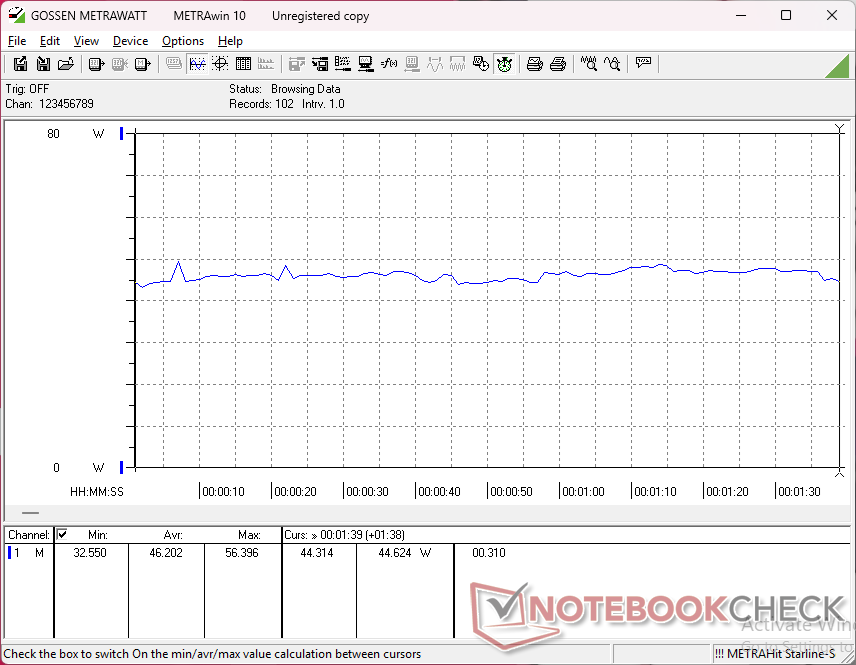
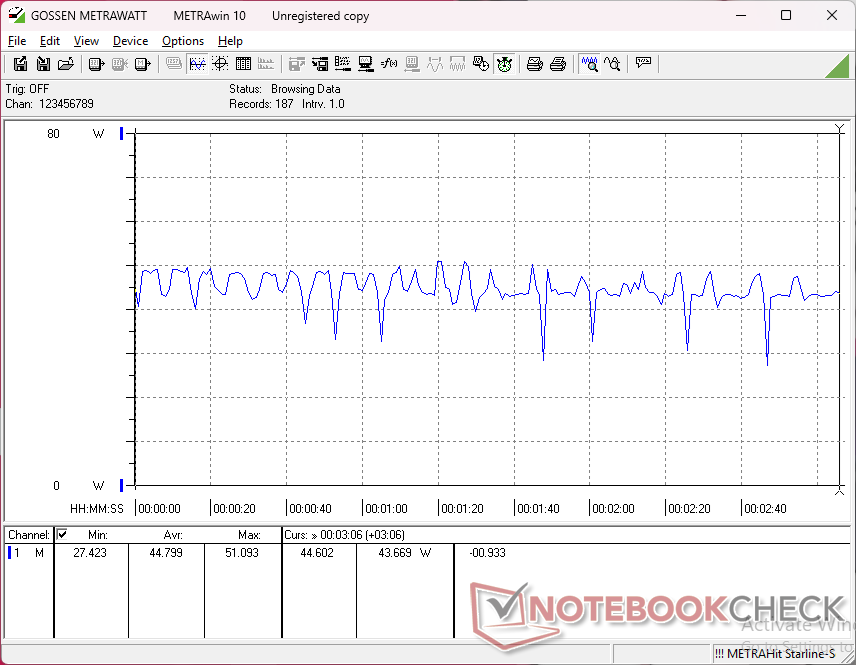
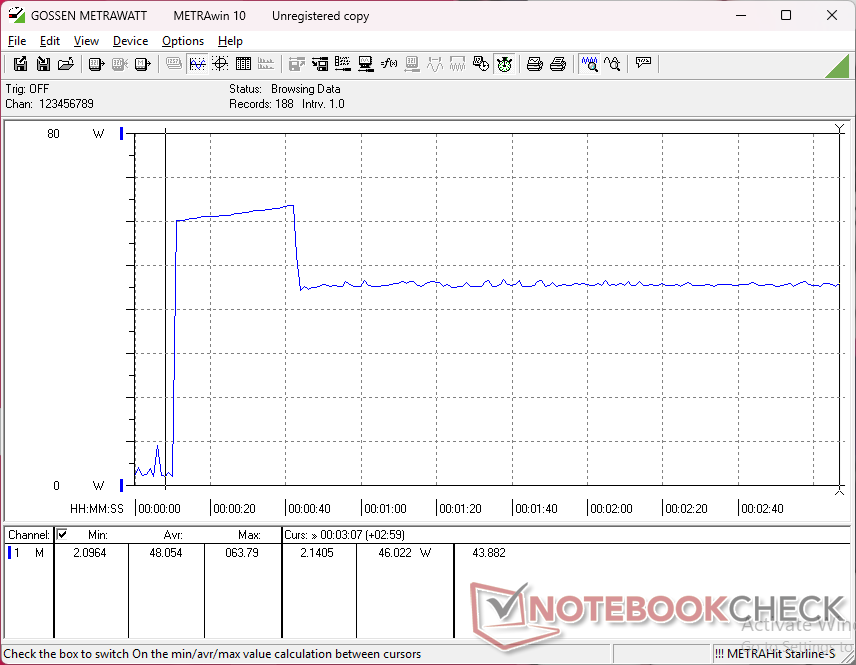
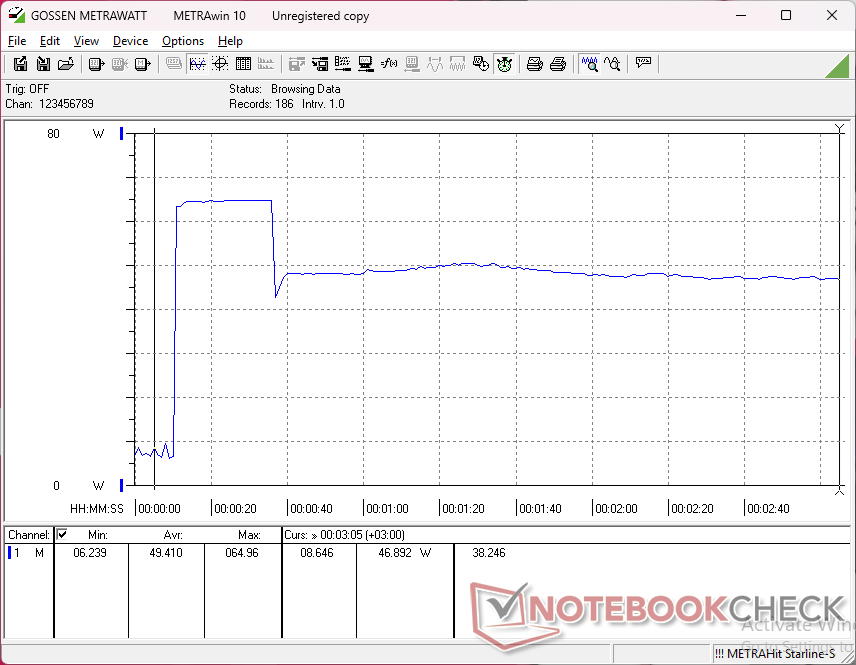
Güç Tüketimi
Cyberpunk 2077 gibi zorlu GPU yüklerini çalıştırırken güç tüketimi dengesiz olabilir, bu da yukarıda belirtilen kare hızı kesintileriyle uyumludur. Bu, şu durumun aksine Framework 13.5 tam olarak aynı Core Ultra 7 155H CPU ile birlikte gelir ancak yük altında çok daha istikrarlı bir tüketime sahiptir.
| Kapalı / Bekleme modu | |
| Boşta | |
| Çalışırken |
|
Key:
min: | |
| MSI Summit E13 AI Evo A1MTG Ultra 7 155H, Arc 8-Core, Micron 2400 MTFDKBA1T0QFM, IPS, 1920x1200, 13.3" | MSI Summit E13 Flip Evo A11MT i7-1185G7, Iris Xe G7 96EUs, Phison 1TB SM2801T24GKBB4S-E162, IPS, 1920x1200, 13.4" | Lenovo Yoga Book 9 13IMU9 Ultra 7 155U, Graphics 4-Core, , OLED, 2880x1800, 13.3" | Lenovo ThinkPad L13 Yoga G4 i7-1355U i7-1355U, Iris Xe G7 96EUs, Samsung PM9B1 512GB MZAL4512HBLU, IPS, 1920x1200, 13.3" | HP Elite Dragonfly Folio 13.5 G3 i7-1265U, Iris Xe G7 96EUs, Samsung PM9A1 MZVL2512HCJQ, IPS, 1920x1280, 13.5" | Dell Latitude 9330 i7-1260U, Iris Xe G7 96EUs, , IPS, 2560x1600, 13.3" | |
|---|---|---|---|---|---|---|
| Power Consumption | -52% | -116% | -59% | -26% | -40% | |
| Idle Minimum * | 2.3 | 4.8 -109% | 7.1 -209% | 5.5 -139% | 3.4 -48% | 4.7 -104% |
| Idle Average * | 4.8 | 8.4 -75% | 9.1 -90% | 8.3 -73% | 4.9 -2% | 8.2 -71% |
| Idle Maximum * | 5 | 8.6 -72% | 18.4 -268% | 9.1 -82% | 9.3 -86% | 8.4 -68% |
| Load Average * | 46.2 | 47.1 -2% | 51.3 -11% | 49.9 -8% | 41.9 9% | 36.8 20% |
| Cyberpunk 2077 ultra external monitor * | 41.9 | |||||
| Cyberpunk 2077 ultra * | 44.8 | |||||
| Load Maximum * | 65 | 65.9 -1% | 65.5 -1% | 60 8% | 67.5 -4% | 49.9 23% |
| Witcher 3 ultra * | 51.6 | 41.5 | 42.4 | 36.4 | 30.4 |
* ... daha küçük daha iyidir
Power Consumption Cyberpunk / Stress Test
Power Consumption external Monitor
Pil Ömrü
WLAN çalışma süresi eski Summit E13'e göre birkaç saat daha kısadır, ancak neredeyse 9,5 saatlik gerçek dünya kullanımı ile genel olarak hala iyidir.
| MSI Summit E13 AI Evo A1MTG Ultra 7 155H, Arc 8-Core, 70 Wh | MSI Summit E13 Flip Evo A11MT i7-1185G7, Iris Xe G7 96EUs, 70 Wh | Lenovo Yoga Book 9 13IMU9 Ultra 7 155U, Graphics 4-Core, 80 Wh | Lenovo ThinkPad L13 Yoga G4 i7-1355U i7-1355U, Iris Xe G7 96EUs, 46 Wh | HP Elite Dragonfly Folio 13.5 G3 i7-1265U, Iris Xe G7 96EUs, 53 Wh | Dell Latitude 9330 i7-1260U, Iris Xe G7 96EUs, 50 Wh | |
|---|---|---|---|---|---|---|
| Pil Çalışma Süresi | 18% | 7% | -35% | -1% | -1% | |
| WiFi v1.3 | 568 | 672 18% | 608 7% | 371 -35% | 565 -1% | 564 -1% |
| Reader / Idle | 1267 | 1637 | 923 | |||
| Load | 109 | 158 | 140 |
Notebookcheck Değerlendirmesi
MSI Summit E13 AI Evo A1MTG
- 03/04/2025 v8
Allen Ngo
 Total Sustainability Score:
 Şeffaflık
İncelenecek cihazların seçimi editör ekibimiz tarafından yapılır. Test örneği yazar tarafından masrafları kendisine ait olmak üzere serbestçe satın alınmıştır. Borç verenin bu inceleme üzerinde herhangi bir etkisi olmadığı gibi, üretici de yayınlanmadan önce bu incelemenin bir kopyasını almamıştır. Bu incelemeyi yayınlama zorunluluğu yoktu. İncelemelerimiz karşılığında asla tazminat veya ödeme kabul etmiyoruz. Bağımsız bir medya şirketi olarak Notebookcheck, üreticilerin, perakendecilerin veya yayıncıların otoritesine tabi değildir.
Notebookcheck bu şekilde test yapıyor
Notebookcheck, tüm sonuçların karşılaştırılabilir olmasını sağlamak için her yıl yüzlerce dizüstü bilgisayarı ve akıllı telefonu standart prosedürler kullanarak bağımsız olarak inceliyor. Yaklaşık 20 yıldır test yöntemlerimizi sürekli olarak geliştirdik ve bu süreçte endüstri standartlarını belirledik. Test laboratuvarlarımızda deneyimli teknisyenler ve editörler tarafından yüksek kaliteli ölçüm ekipmanları kullanılmaktadır. Bu testler çok aşamalı bir doğrulama sürecini içerir. Karmaşık derecelendirme sistemimiz, nesnelliği koruyan yüzlerce sağlam temellere dayanan ölçüm ve kıyaslamaya dayanmaktadır.
