

SCHENKER XMG Core 15 (M24) dizüstü bilgisayar incelemesi: Almanya'dan birinci sınıf, metal kasalı bir oyun makinesi

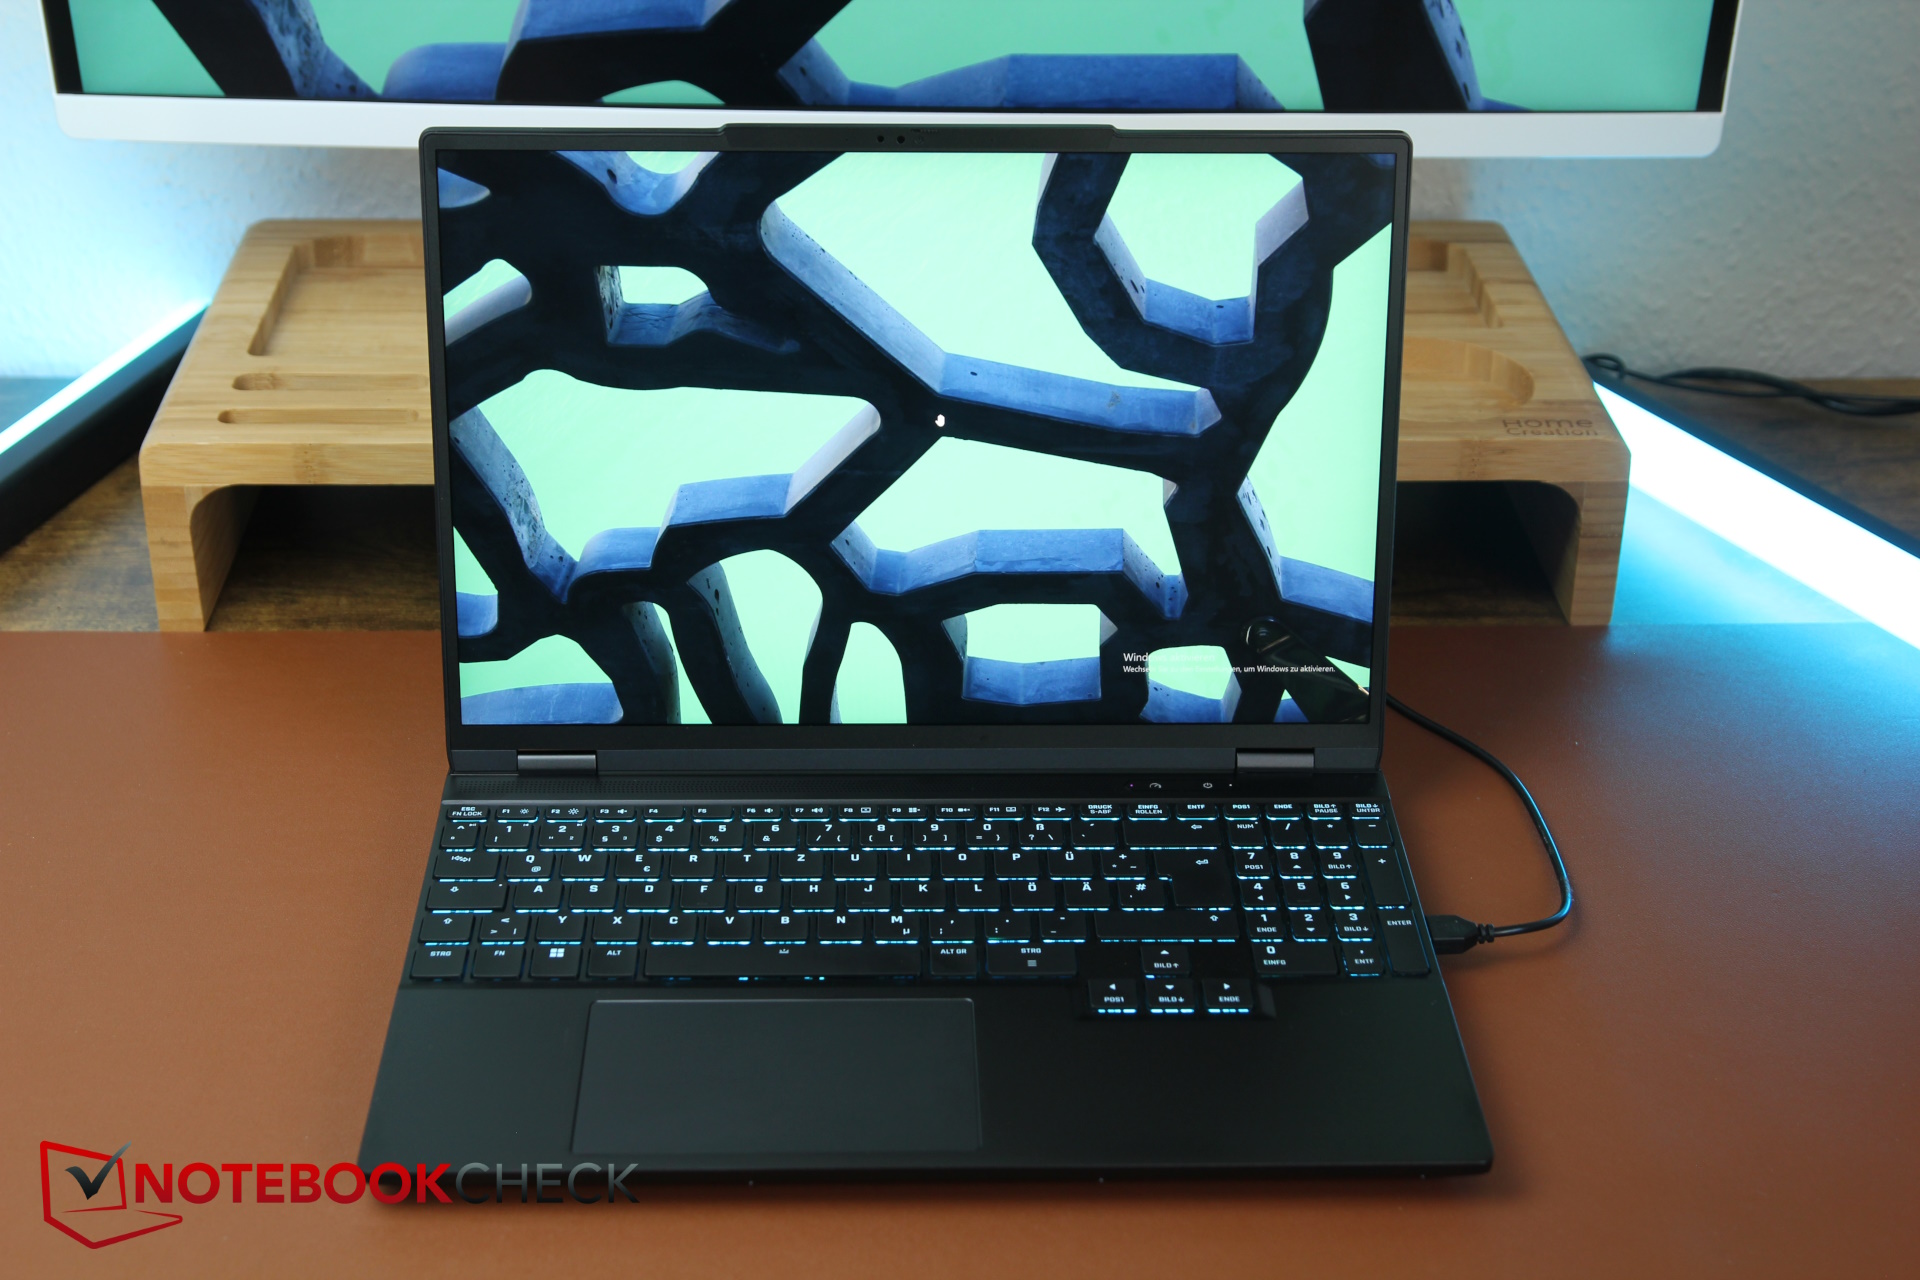
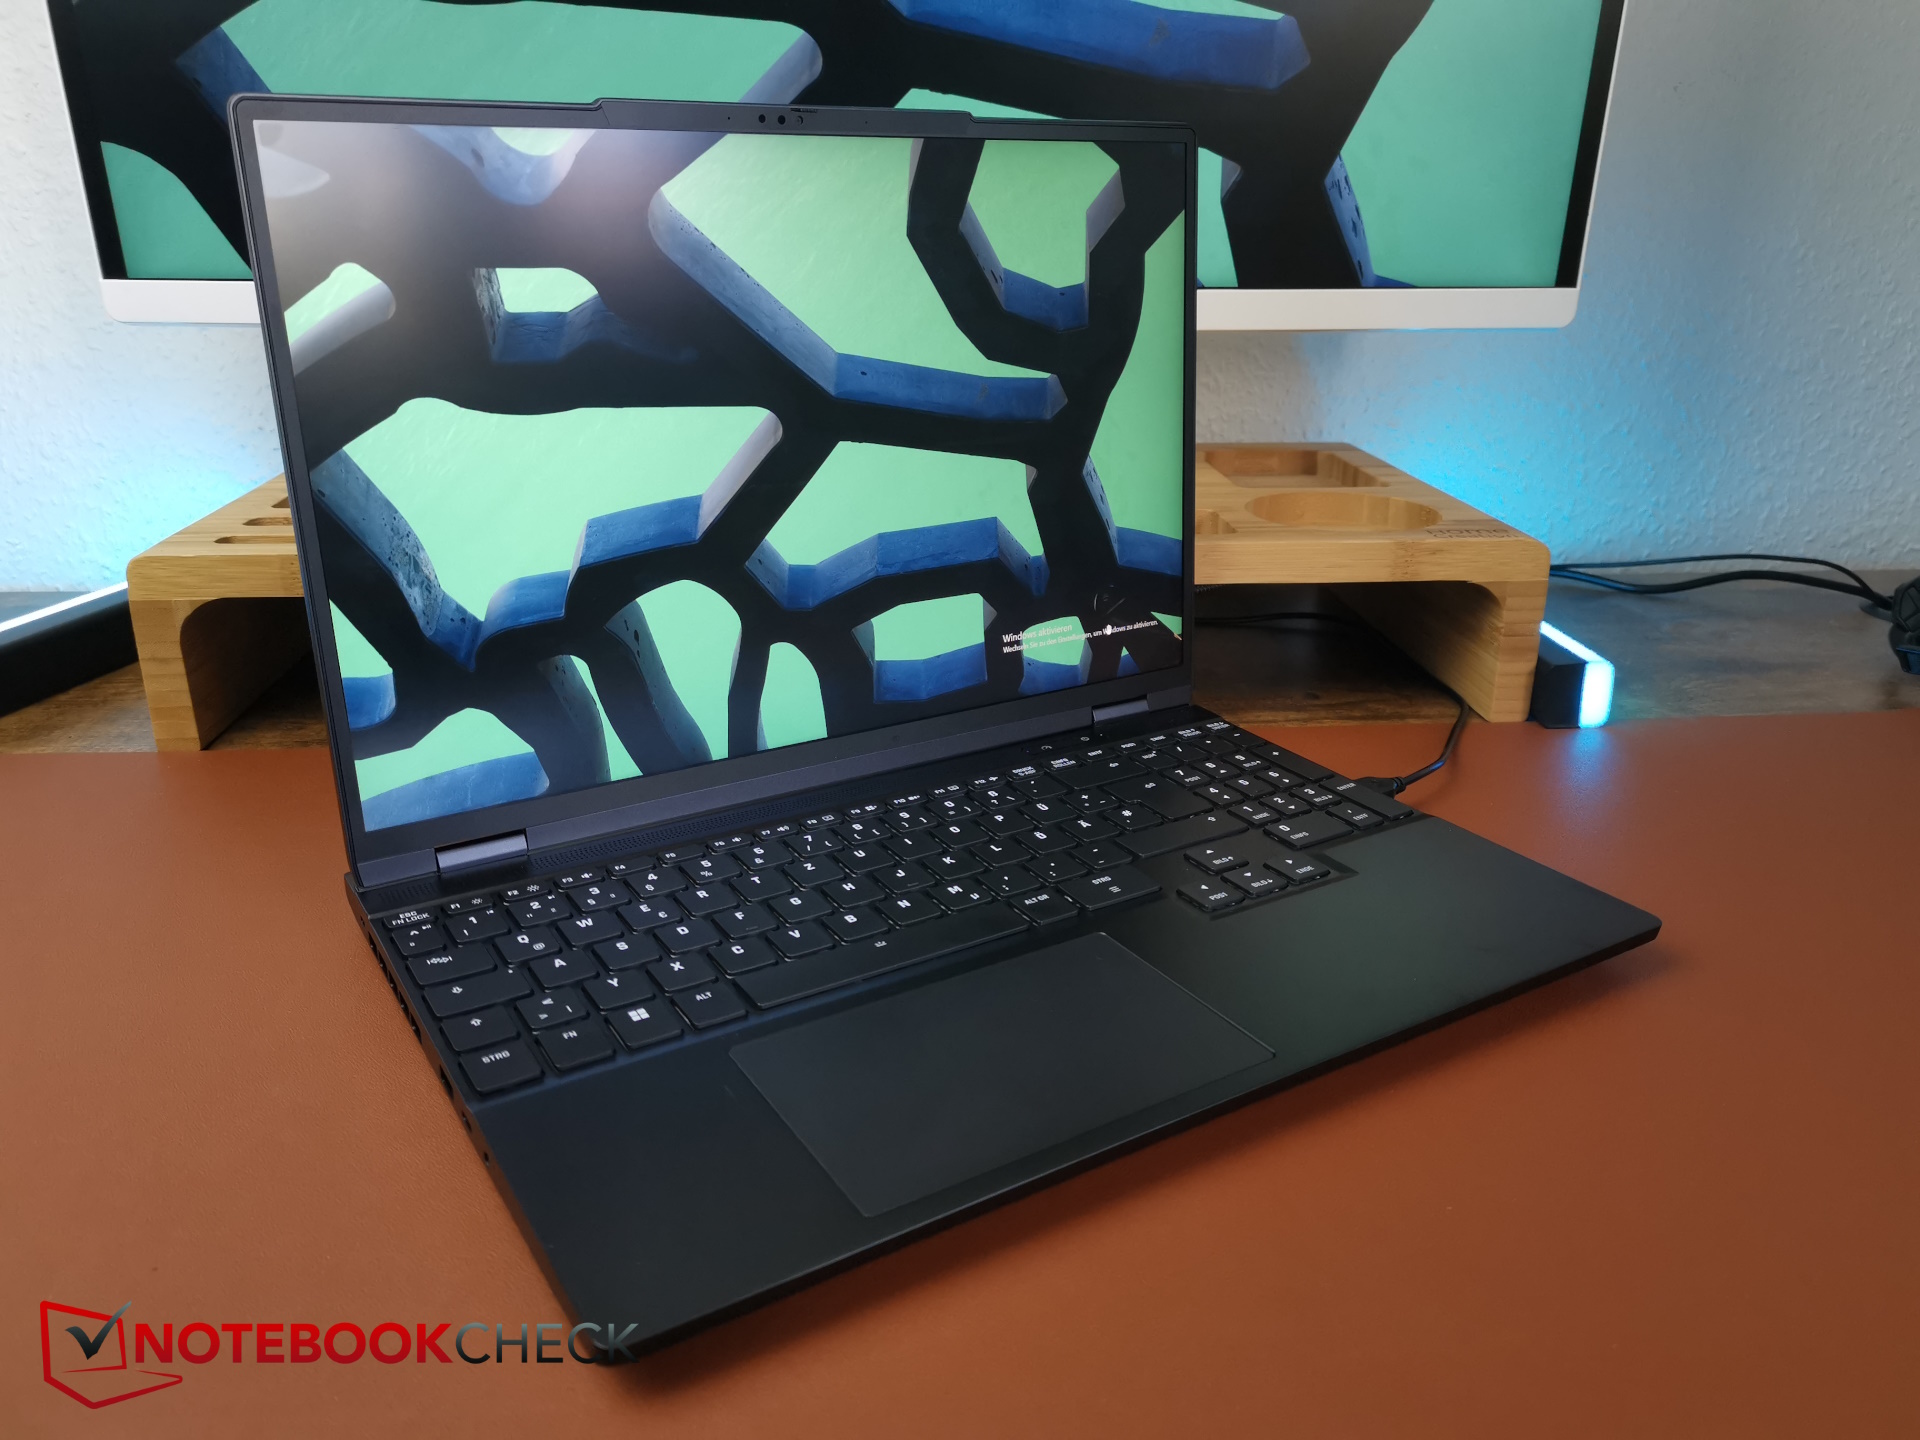
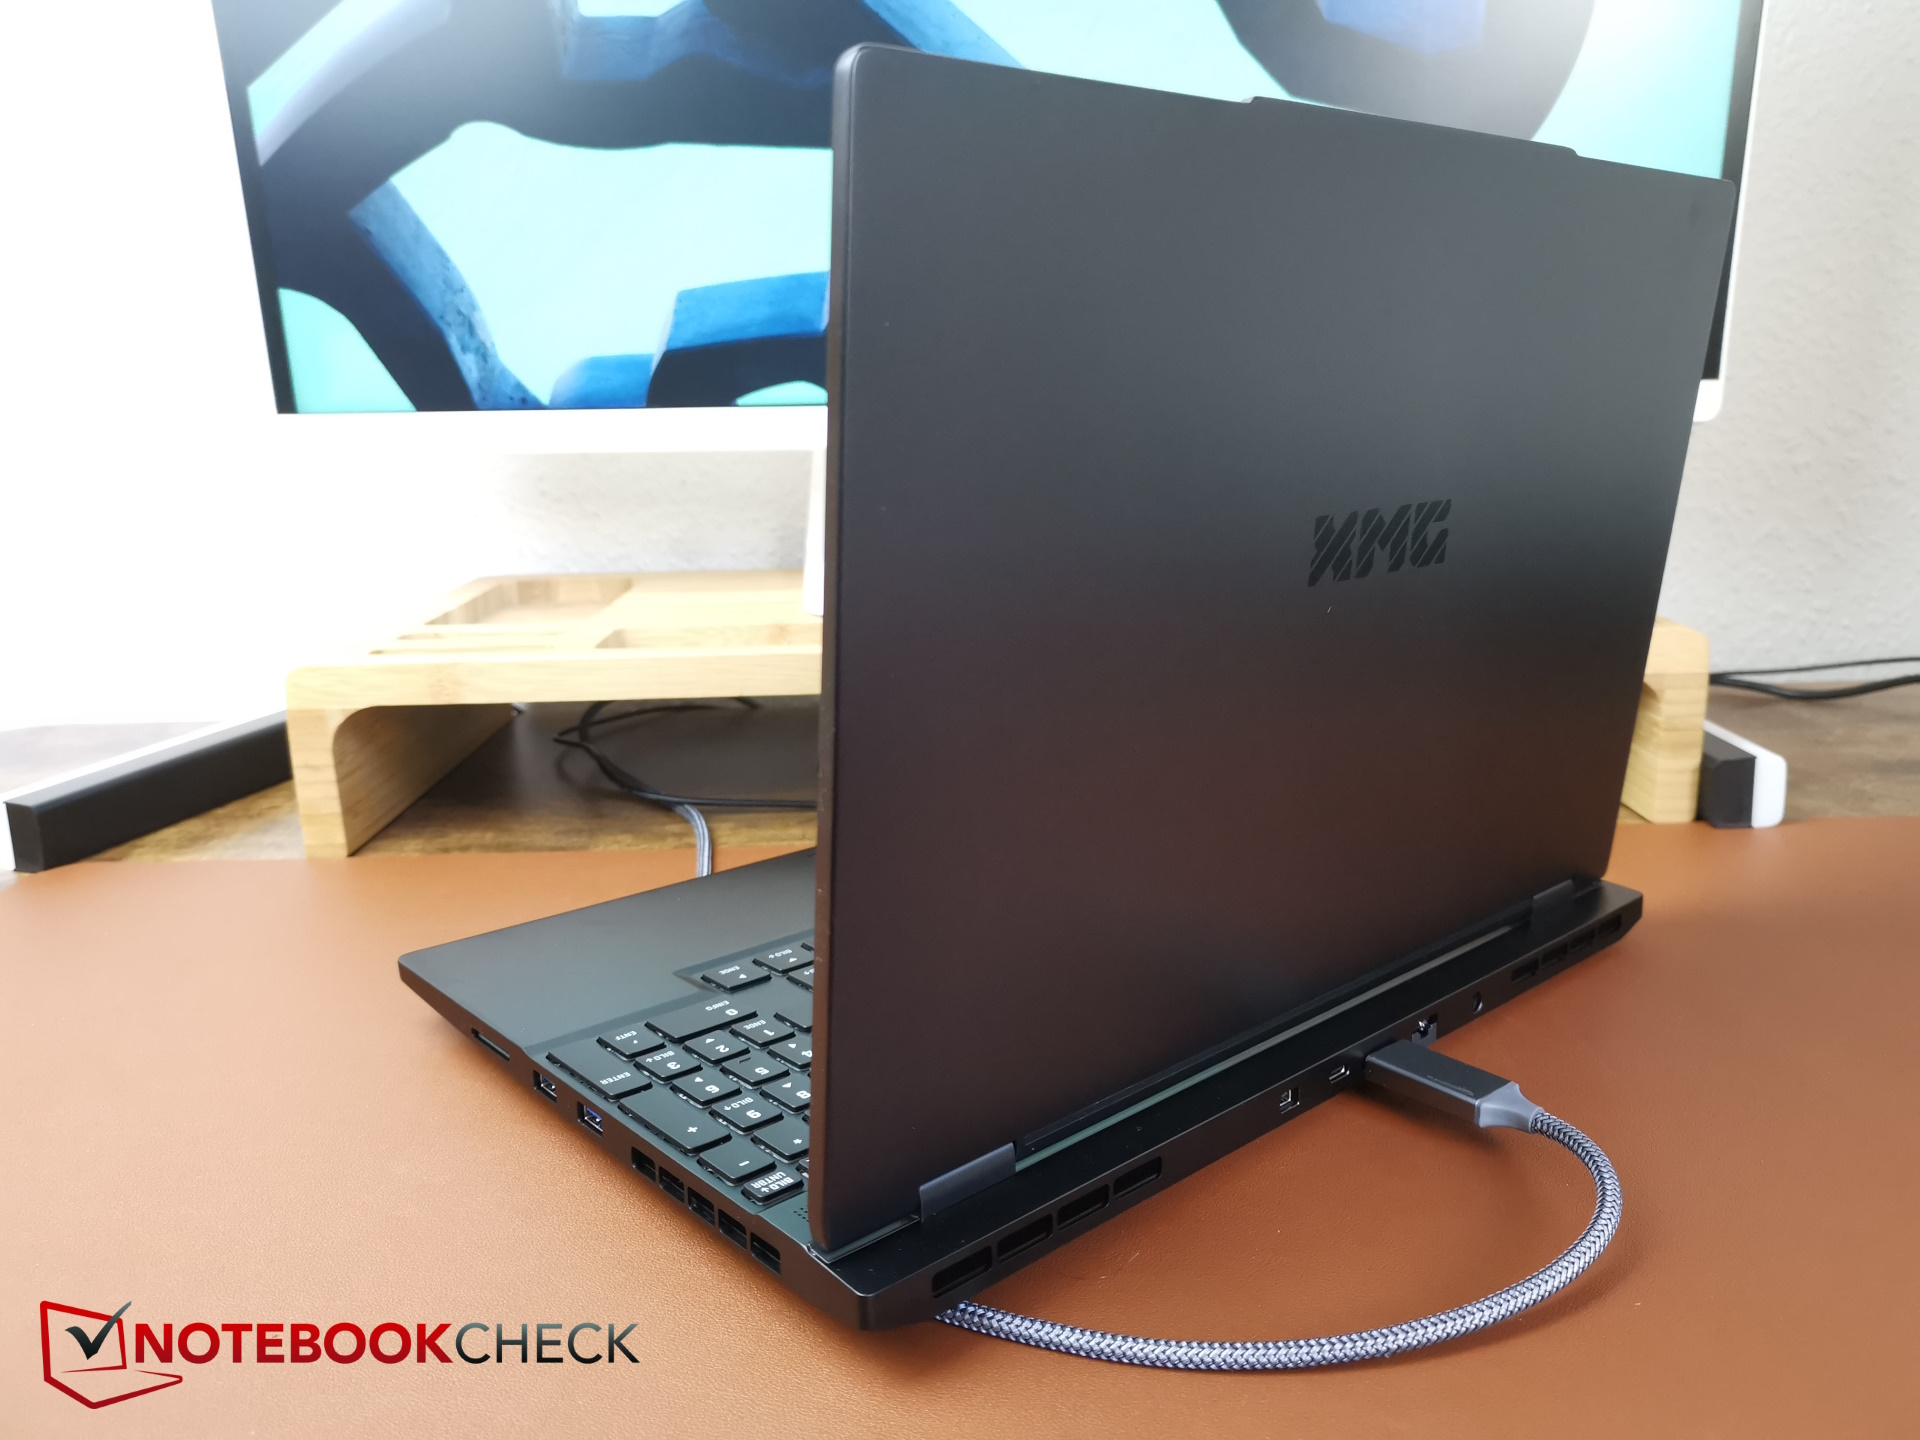
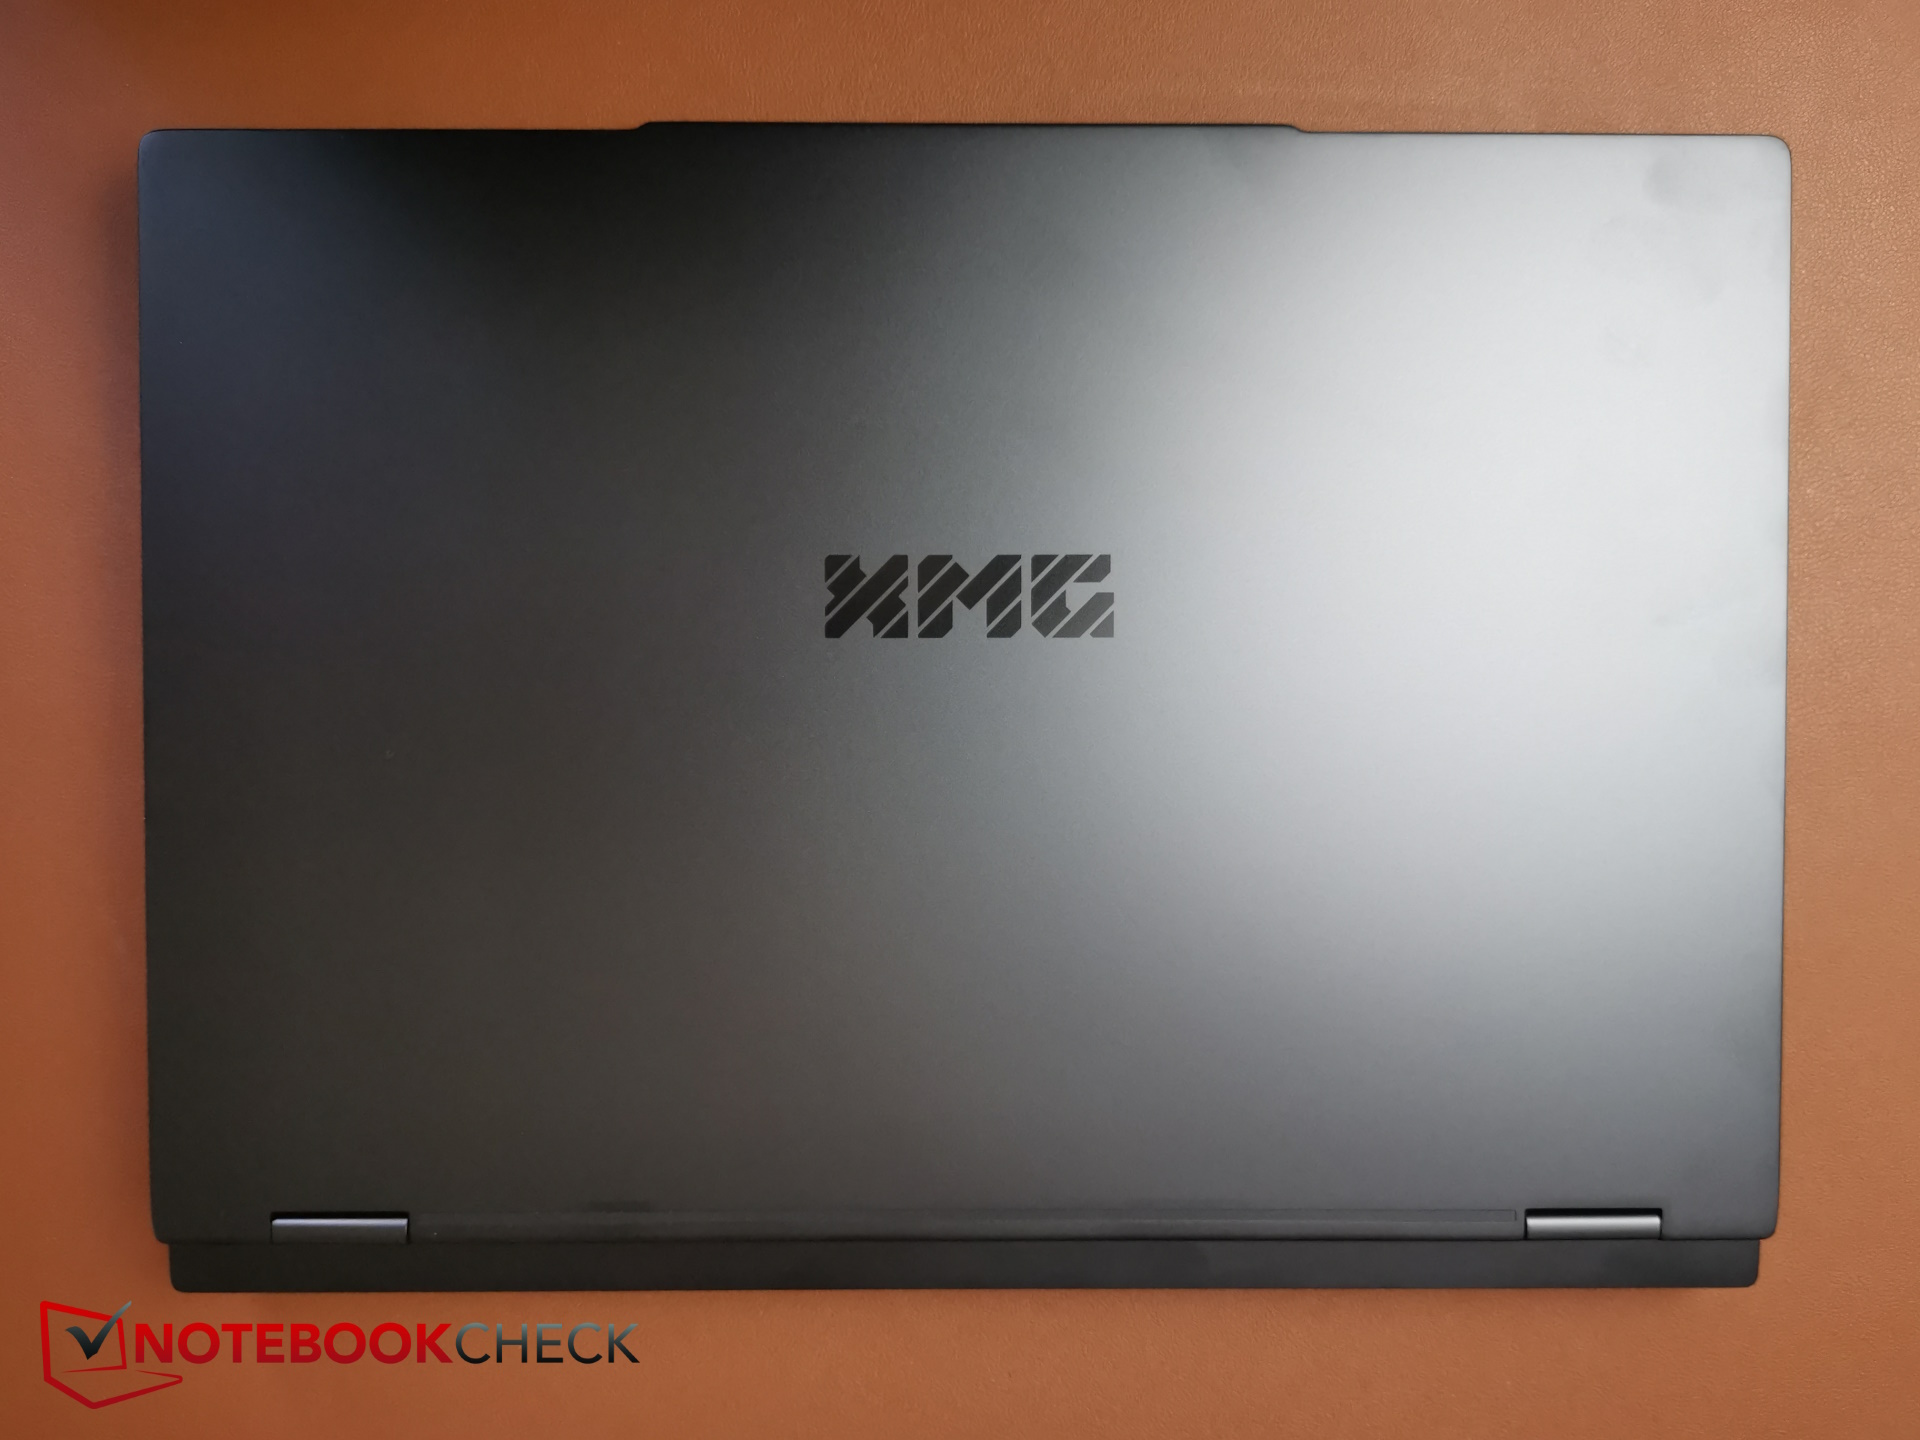
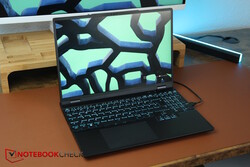
Schenker'e göre, mevcut Core 15 biraz daha sadeleştirilmiş Füzyon 15. Avantajı önemli ölçüde daha ucuz bir fiyat, ancak buna rağmen Core 15, iyi bir görünüm ve his veren şık metal kasasını koruyor. Üretici bunu "Undercover Gaming" olarak adlandırıyor çünkü alüminyum kasa, oyun dizüstü bilgisayarı çığlıkları atmadan yaratıcılara da hitap etmelidir.
Bununla birlikte, Core 15 sadece sadeleştirilmiş değil, aynı zamanda birkaç şeyi de değiştiriyor. Örneğin, dizüstü bilgisayar işlemcisi Intel Gen14 HX CPU yerine mevcut nesil AMD Ryzen'dir, bu da fiyatı biraz düşürür, ancak hiçbir şekilde daha kötü değildir.
Artık güncel bir CPU ile donatılmış neredeyse hiç 15 inçlik dizüstü bilgisayar olmadığından, 15.3 inç Core 15'i bir CPU ile gelen 16 inçlik oyun ve multimedya dizüstü bilgisayarlarla karşılaştırıyoruz RTX 4060 gibi Dell G16, the Lenovo Legion 5i 16 G9yanı sıra HP Victus 16. Buna ek olarak, elbette Fusion 15 ile karşılaştırmalar yaptık ve geçen yıldan bu yana nelerin değiştiğine bir göz attık Schenker XMG Pro 15 E23.
Dikkat edin: Yeni derecelendirme sistemimiz V8, bu da puanların artık daha düşük olduğu anlamına geliyor. Eski V7 derecelendirme sistemi V7 ile Core 15 yüzde 88 ile 89 arasında puan alıyordu. Nelerin yeni olduğunu öğrenebilirsiniz burada.
Karşılaştırmalı olarak olası rakipler
Derecelendirme | Tarih | Modeli | Ağırlık | Yükseklik | Boyut | Çözünürlük | Fiyat |
|---|---|---|---|---|---|---|---|
| 83.7 % | 06/2024 | SCHENKER XMG Core 15 (M24) R7 8845HS, NVIDIA GeForce RTX 4060 Laptop GPU | 2.1 kg | 21.9 mm | 15.30" | 2560x1600 | |
| 89.1 % v7 (old) | 02/2024 | Lenovo Legion 5 16IRX G9 i7-14650HX, NVIDIA GeForce RTX 4060 Laptop GPU | 2.4 kg | 25.2 mm | 16.00" | 2560x1600 | |
| 84.3 % v7 (old) | 05/2024 | HP Victus 16 (2024) i7-14700HX, NVIDIA GeForce RTX 4060 Laptop GPU | 2.4 kg | 23.9 mm | 16.10" | 1920x1080 | |
| 85.5 % v7 (old) | 02/2024 | Dell G16, i7-13650HX, RTX 4060 i7-13650HX, NVIDIA GeForce RTX 4060 Laptop GPU | 2.8 kg | 25.65 mm | 16.00" | 2560x1600 | |
| 88.9 % v7 (old) | 05/2024 | SCHENKER XMG Fusion 15 (Early 24) i9-14900HX, NVIDIA GeForce RTX 4070 Laptop GPU | 2.1 kg | 21.9 mm | 15.30" | 2560x1600 | |
| 86.2 % v7 (old) | SCHENKER XMG Pro 15 (E23) i9-13900HX, NVIDIA GeForce RTX 4060 Laptop GPU | 2.4 kg | 24.9 mm | 15.60" | 2560x1440 |
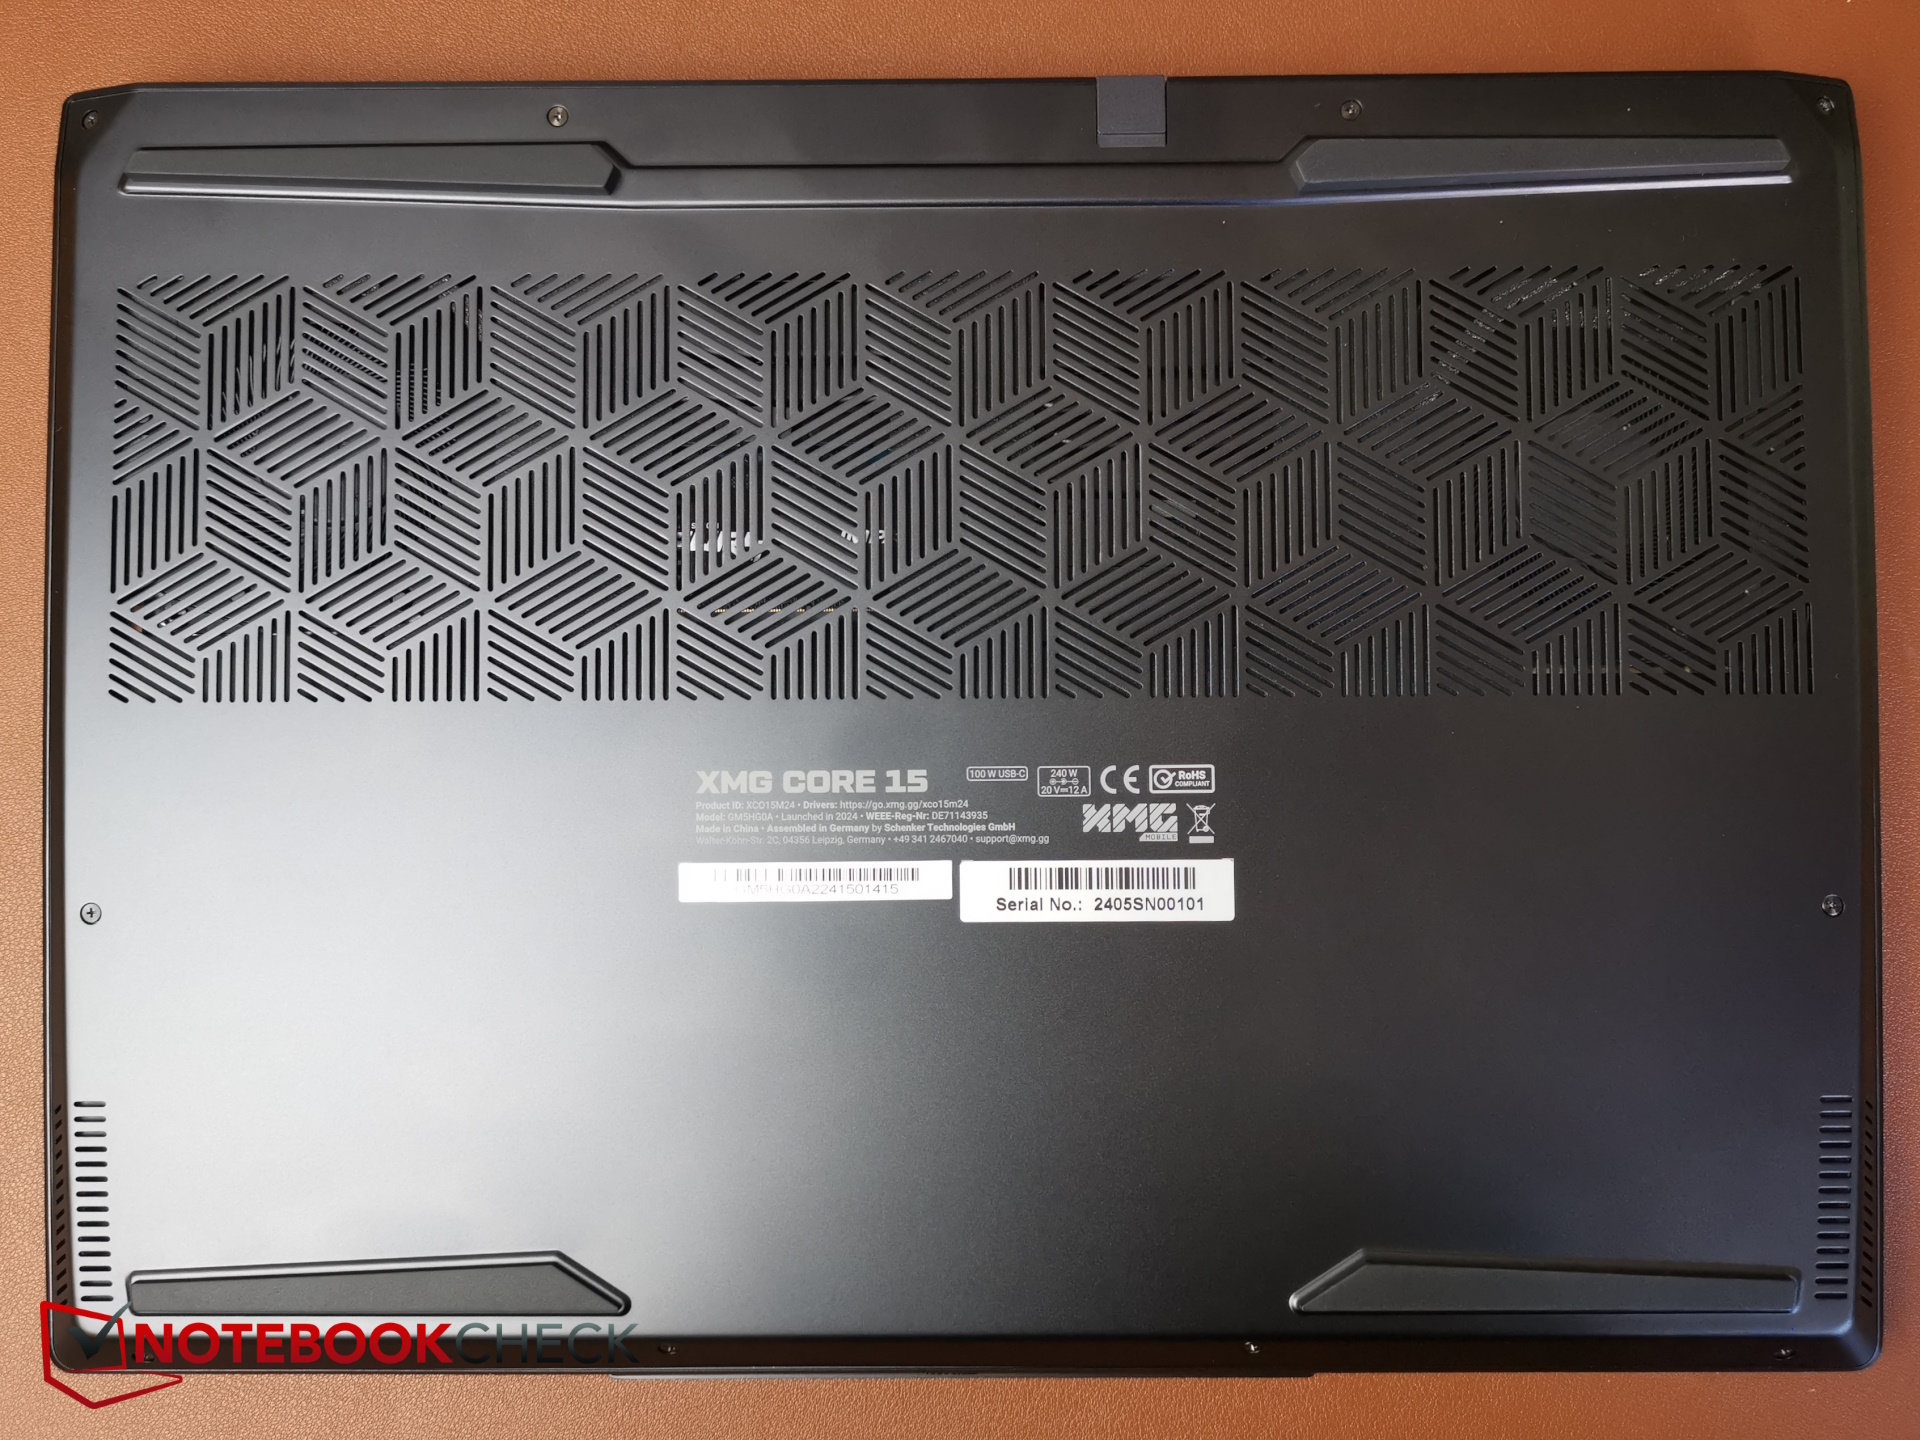
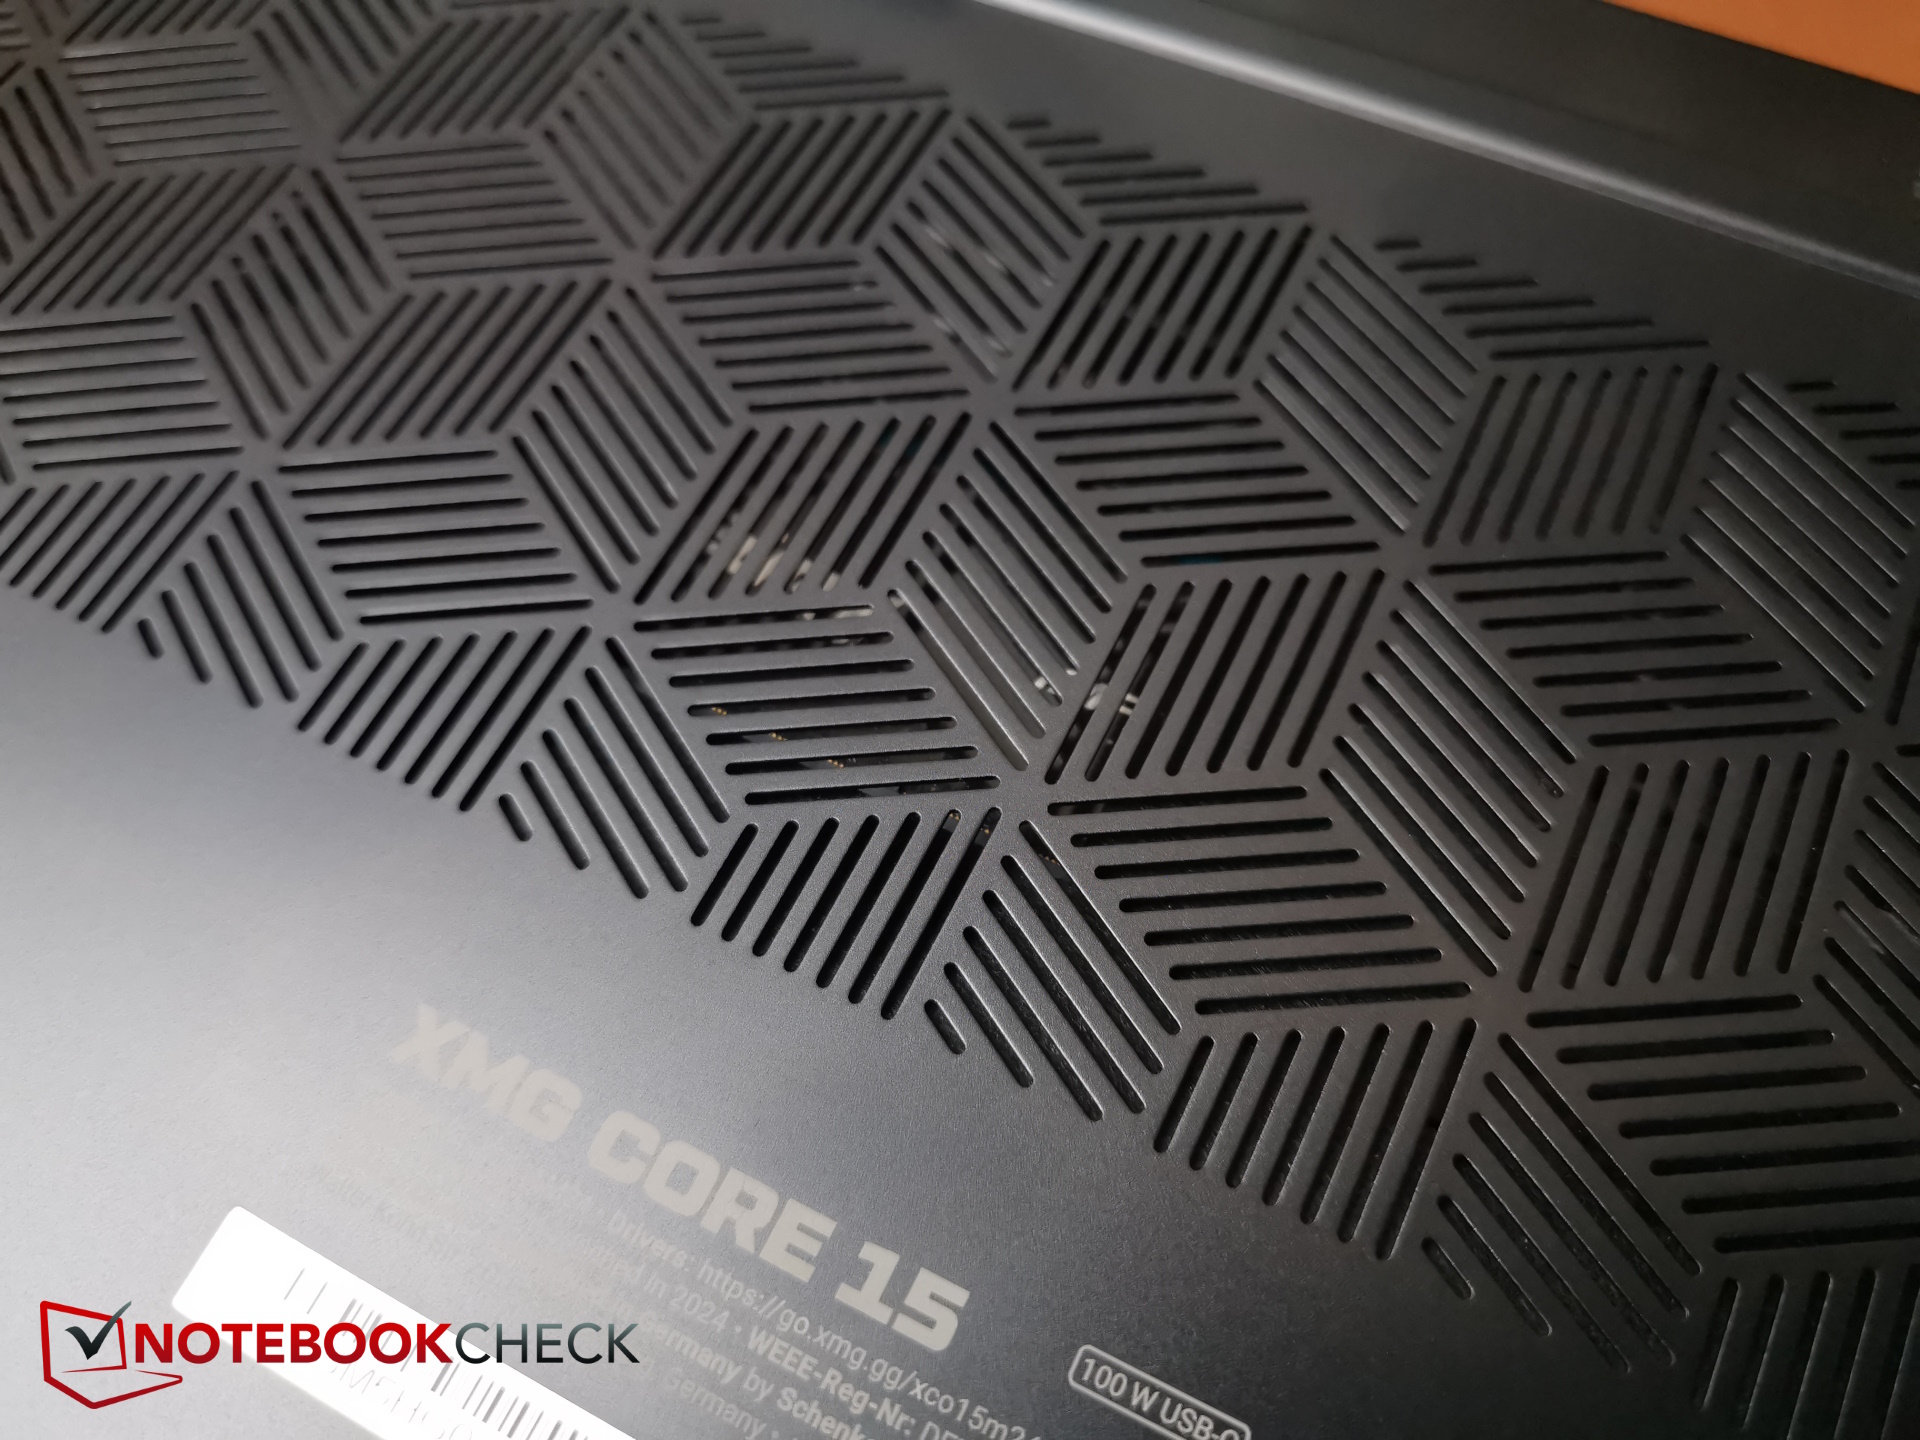
Kasa ve özellikler: Şık bir alüminyum kasa
Görsel özellikleri zaten kapsamlı bir şekilde test ettiğimiz için sizi XMG Fusion 15 incelemesi kasa, bakım, bağlantı noktaları ve giriş aygıtları hakkında daha fazla bilgi için. Burada sadece bu hususlardaki değişiklikleri listeleyeceğiz.
Boyut karşılaştırması
Şu anda, mevcut CPU'ya sahip 15 inçlik oyun makineleri neredeyse tükenmiş gibi görünüyor ve Core 15'in benzersiz özelliklerinden biri de alışılmadık 15,3 inçlik formatı. Üretici, mevcut 16 inçlik dizüstü bilgisayarların neredeyse hiç daha büyük olmadığını, yani artık neredeyse aynı boyutta bir kasada daha büyük bir ekrana sahip olabileceğinizi savunuyor.
Ancak Core 15 ile 16 inçlik rakiplerin bazılarının gözle görülür şekilde daha büyük olduğunu görebilirsiniz. Bunun da ötesinde, daha kalın ve daha ağırlar. İkinci durum, rakiplerin önemli ölçüde daha fazla plastik kullanmasına rağmen söz konusu. Bu, Core 15'in mobilite için artı puan aldığı bir alan.
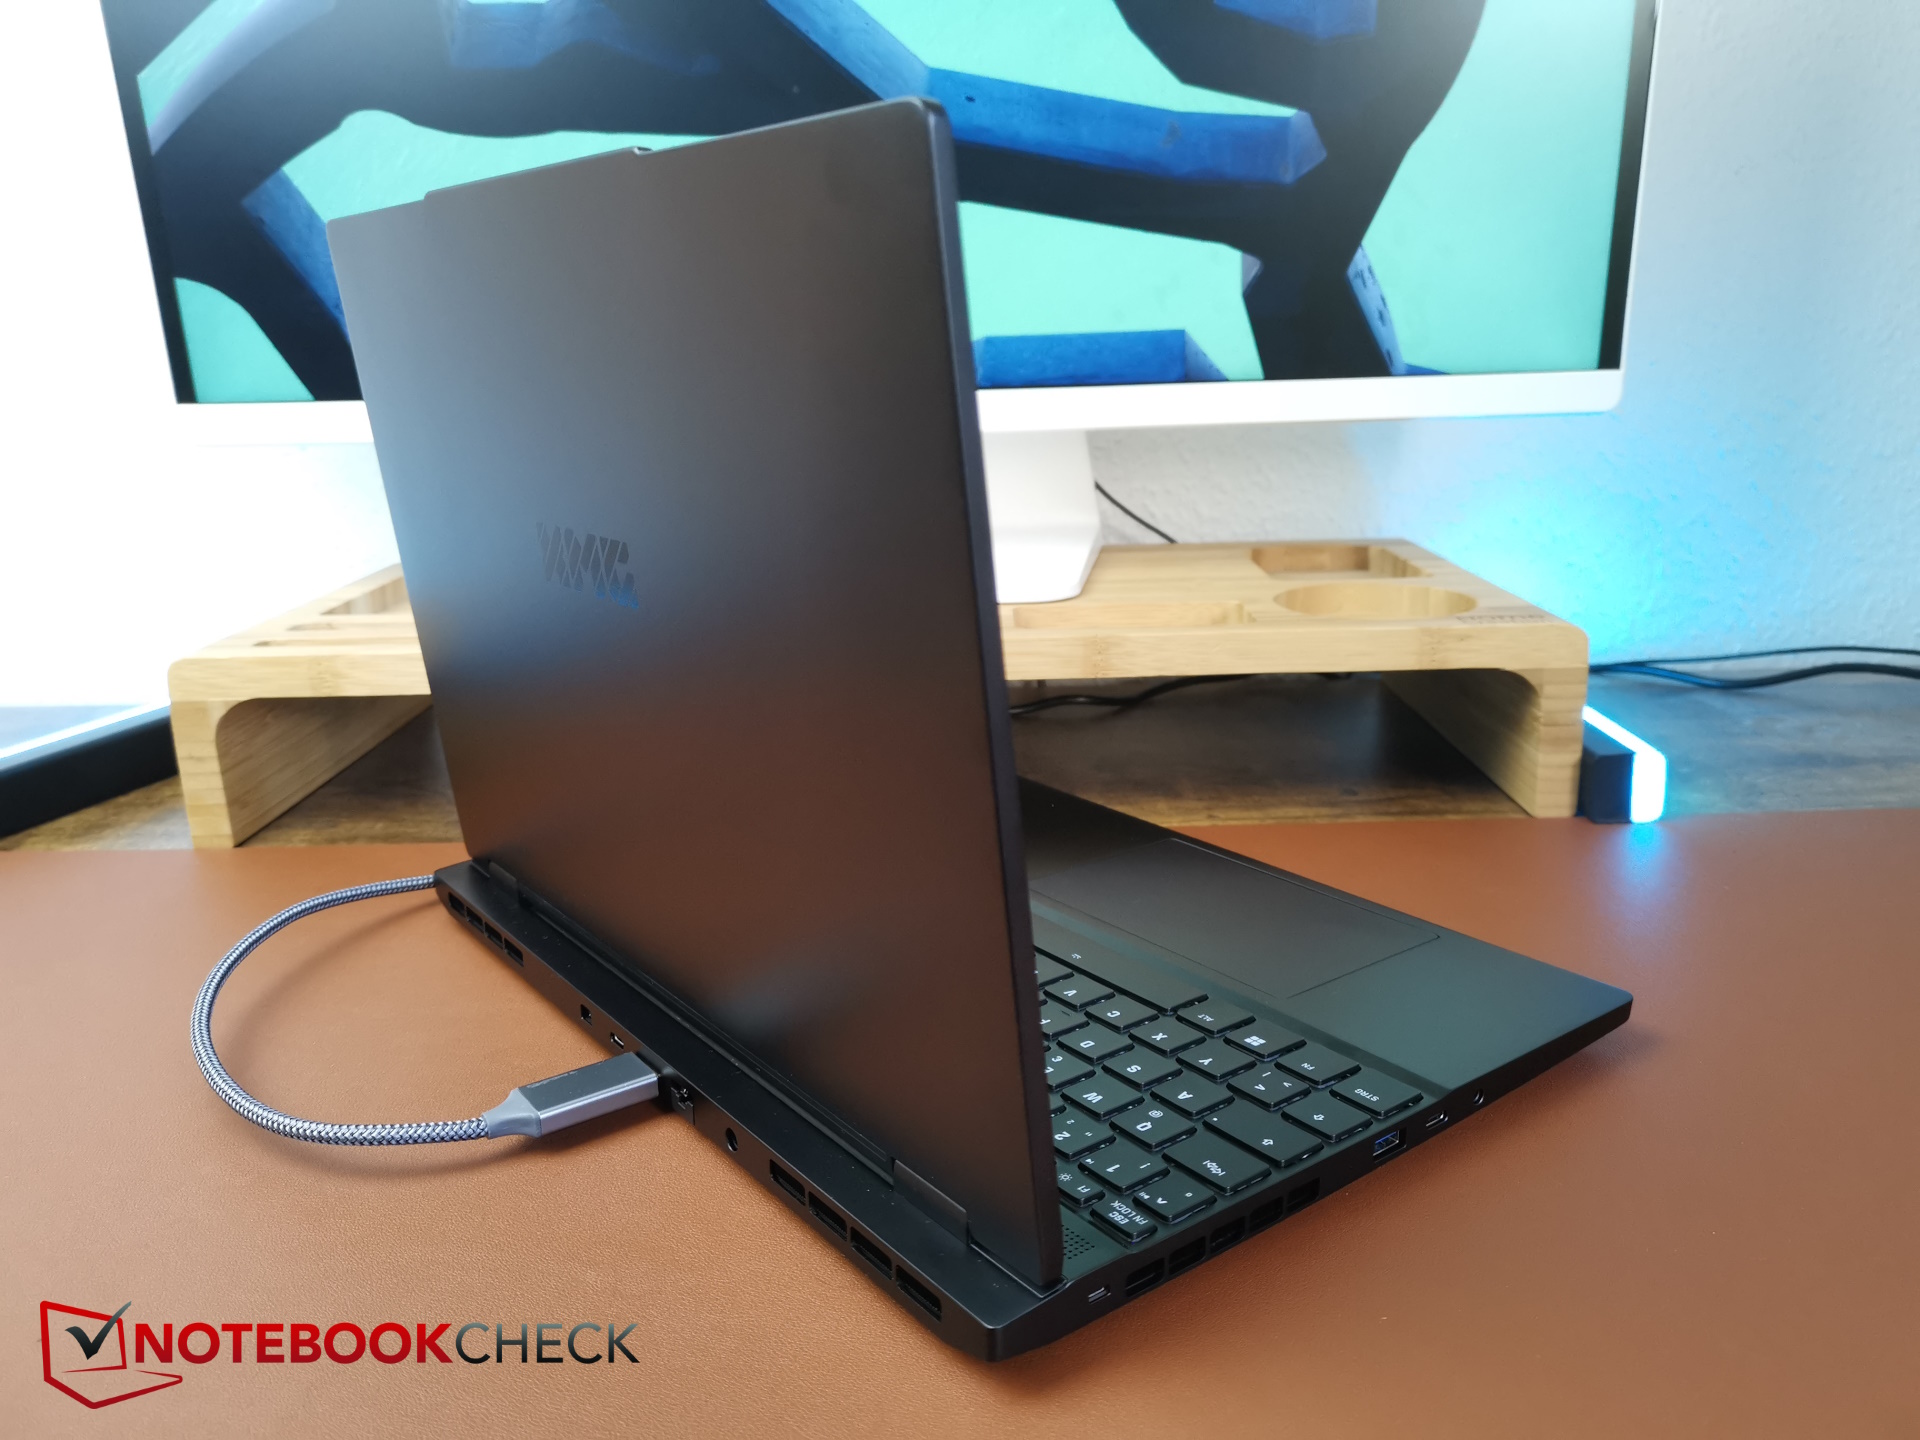
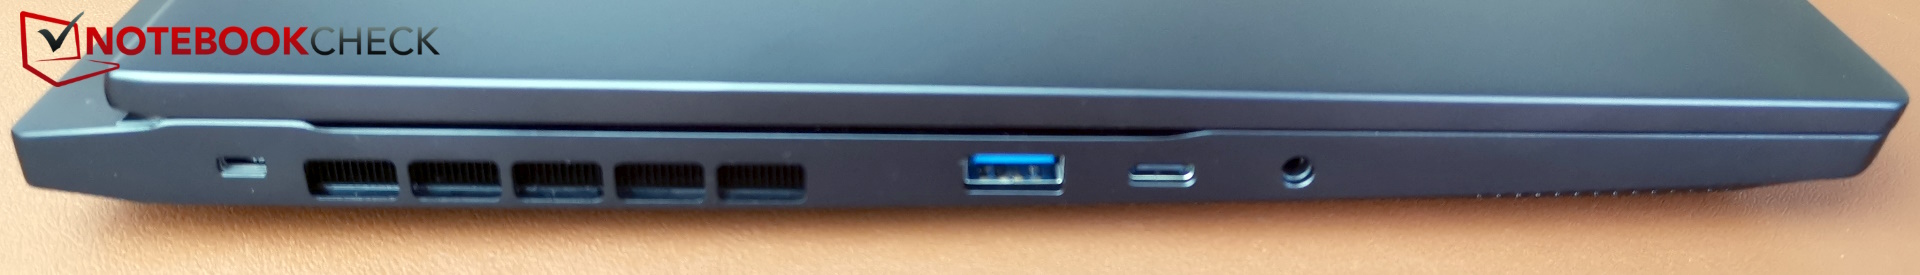
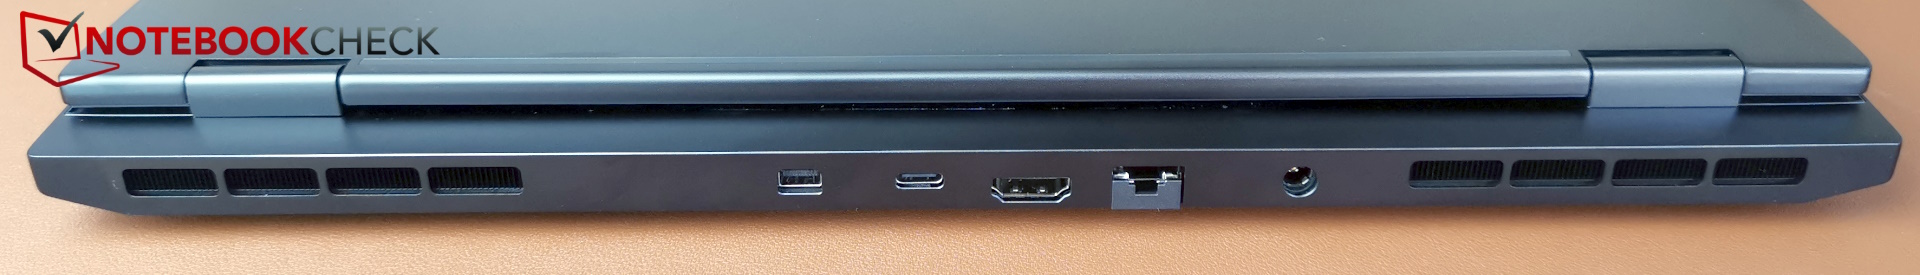
Limanlar
Intel CPU donanımlı Fusion'ın aksine AMD Core'da Thunderbolt 4 ve USB 4 bulunmuyor. Bunun yerine, 100 W'a (20V, 5 A) kadar Güç Dağıtımı sunmasına rağmen yalnızca USB-C 3.2 Gen 2'ye sahip olursunuz.
Fusion'a göre ek bir avantajı daha var: Core ile Fusion'da bulunmayan özel bir mini DisplayPort'a sahip oluyorsunuz.
İlginç bir yan not: 2023'ün başında kısa süre önce Core 15'i inceledi hala XMG Oasis adıyla anılan harici soğutma için bir su bağlantısına sahipti. Bu bağlantı noktaları artık daha yeni ve daha ince Core 15'te yok ve XMG bu üretim serisini denemekten vazgeçmiş gibi görünüyor.
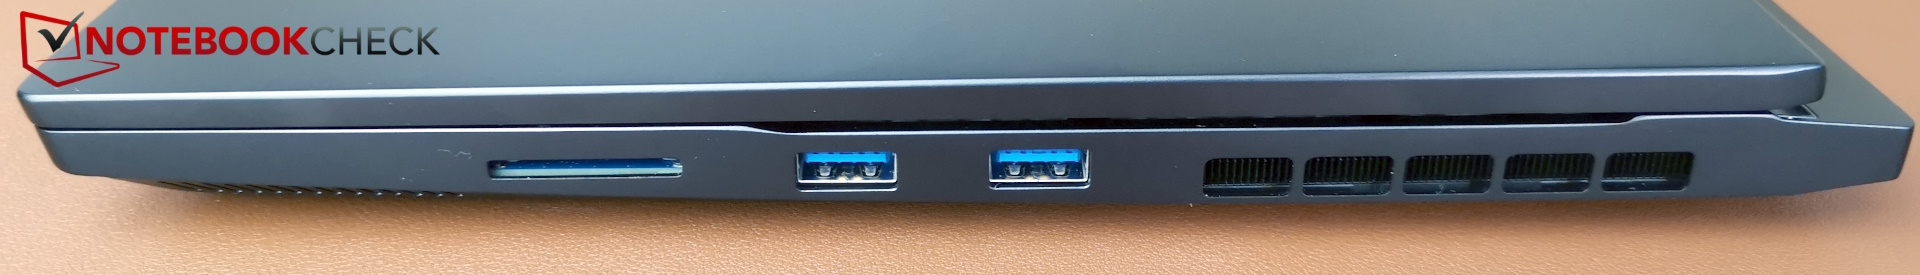
SD Kart Okuyucu
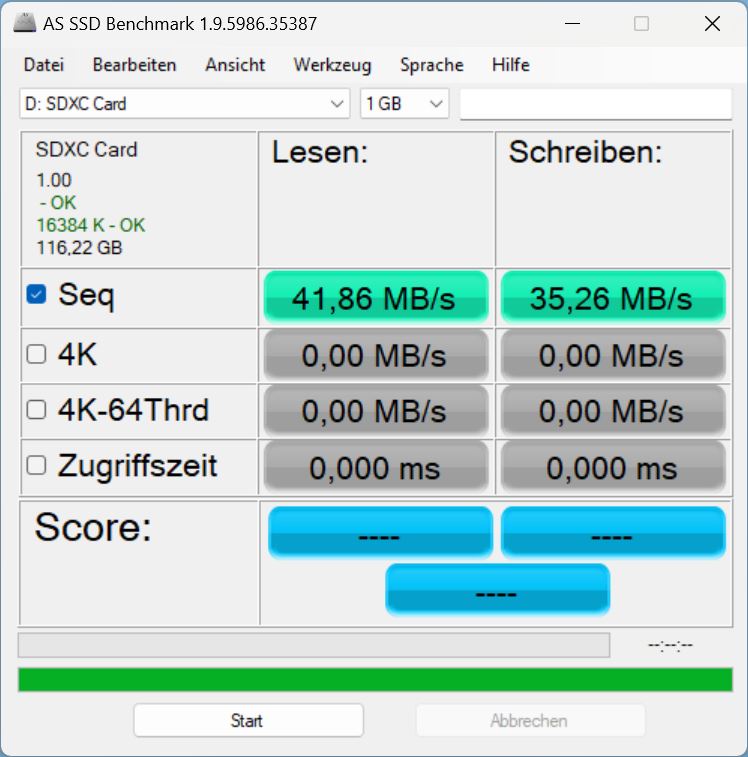
SD okuyucu tam boyutlu kartları alıyor, ancak kilitleme mekanizması yok, bu da kartların dışarıda kalması anlamına geliyor.
Ne yazık ki, Fusion 15'te bulunan ve zaten ortalama olan kart okuyucunun performansı yine yarı yarıya düşmüş, yani Core 15 bu kategorideki en yavaş performans gösteren cihazlardan biri.
| SD Card Reader | |
| average JPG Copy Test (av. of 3 runs) | |
| Sınıf ortalaması Gaming (19 - 197.3, n=68, son 2 yıl) | |
| SCHENKER XMG Pro 15 (E23) | |
| SCHENKER XMG Fusion 15 (Early 24) (AV PRO microSD 128 GB V60) | |
| SCHENKER XMG Core 15 (M24) | |
| Lenovo Legion 5 16IRX G9 | |
| maximum AS SSD Seq Read Test (1GB) | |
| Sınıf ortalaması Gaming (25.8 - 263, n=67, son 2 yıl) | |
| SCHENKER XMG Pro 15 (E23) | |
| SCHENKER XMG Fusion 15 (Early 24) (AV PRO microSD 128 GB V60) | |
| SCHENKER XMG Core 15 (M24) | |
| Lenovo Legion 5 16IRX G9 | |
İletişim
Üretici, dizüstü bilgisayarı aldıktan sonra inceleme modelimizin yanlışlıkla tıpkı Fusion 15 gibi Intel AX211 WiF ile donatıldığını bildirdi. Aslında Core 15'te durum böyle değil.
Normalde Intel AX200, Core 15'te standart olarak gelir ve yalnızca 15 dolar daha ödeyerek Wi-Fi 6E özellikli AMD Wi-Fi 6E RZ616'ya sahip olursunuz. Ancak şu anda hızını test edemiyoruz.
| Networking | |
| iperf3 transmit AXE11000 | |
| Dell G16, i7-13650HX, RTX 4060 | |
| Lenovo Legion 5 16IRX G9 | |
| SCHENKER XMG Fusion 15 (Early 24) | |
| Sınıf ortalaması Gaming (469 - 1843, n=122, son 2 yıl) | |
| SCHENKER XMG Core 15 (M24) | |
| Ortalama Intel Wi-Fi 6E AX210 (565 - 1966, n=30) | |
| SCHENKER XMG Pro 15 (E23) | |
| HP Victus 16 (2024) | |
| iperf3 receive AXE11000 | |
| SCHENKER XMG Fusion 15 (Early 24) | |
| Dell G16, i7-13650HX, RTX 4060 | |
| SCHENKER XMG Core 15 (M24) | |
| Lenovo Legion 5 16IRX G9 | |
| Sınıf ortalaması Gaming (680 - 1744, n=122, son 2 yıl) | |
| Ortalama Intel Wi-Fi 6E AX210 (715 - 1774, n=30) | |
| HP Victus 16 (2024) | |
| SCHENKER XMG Pro 15 (E23) | |

 NVIDIA GeForce RTX 4060 Laptop GPU, R7 8845HS, Samsung 990 Pro 1 TB")
 NVIDIA GeForce RTX 4060 Laptop GPU, R7 8845HS, Samsung 990 Pro 1 TB")
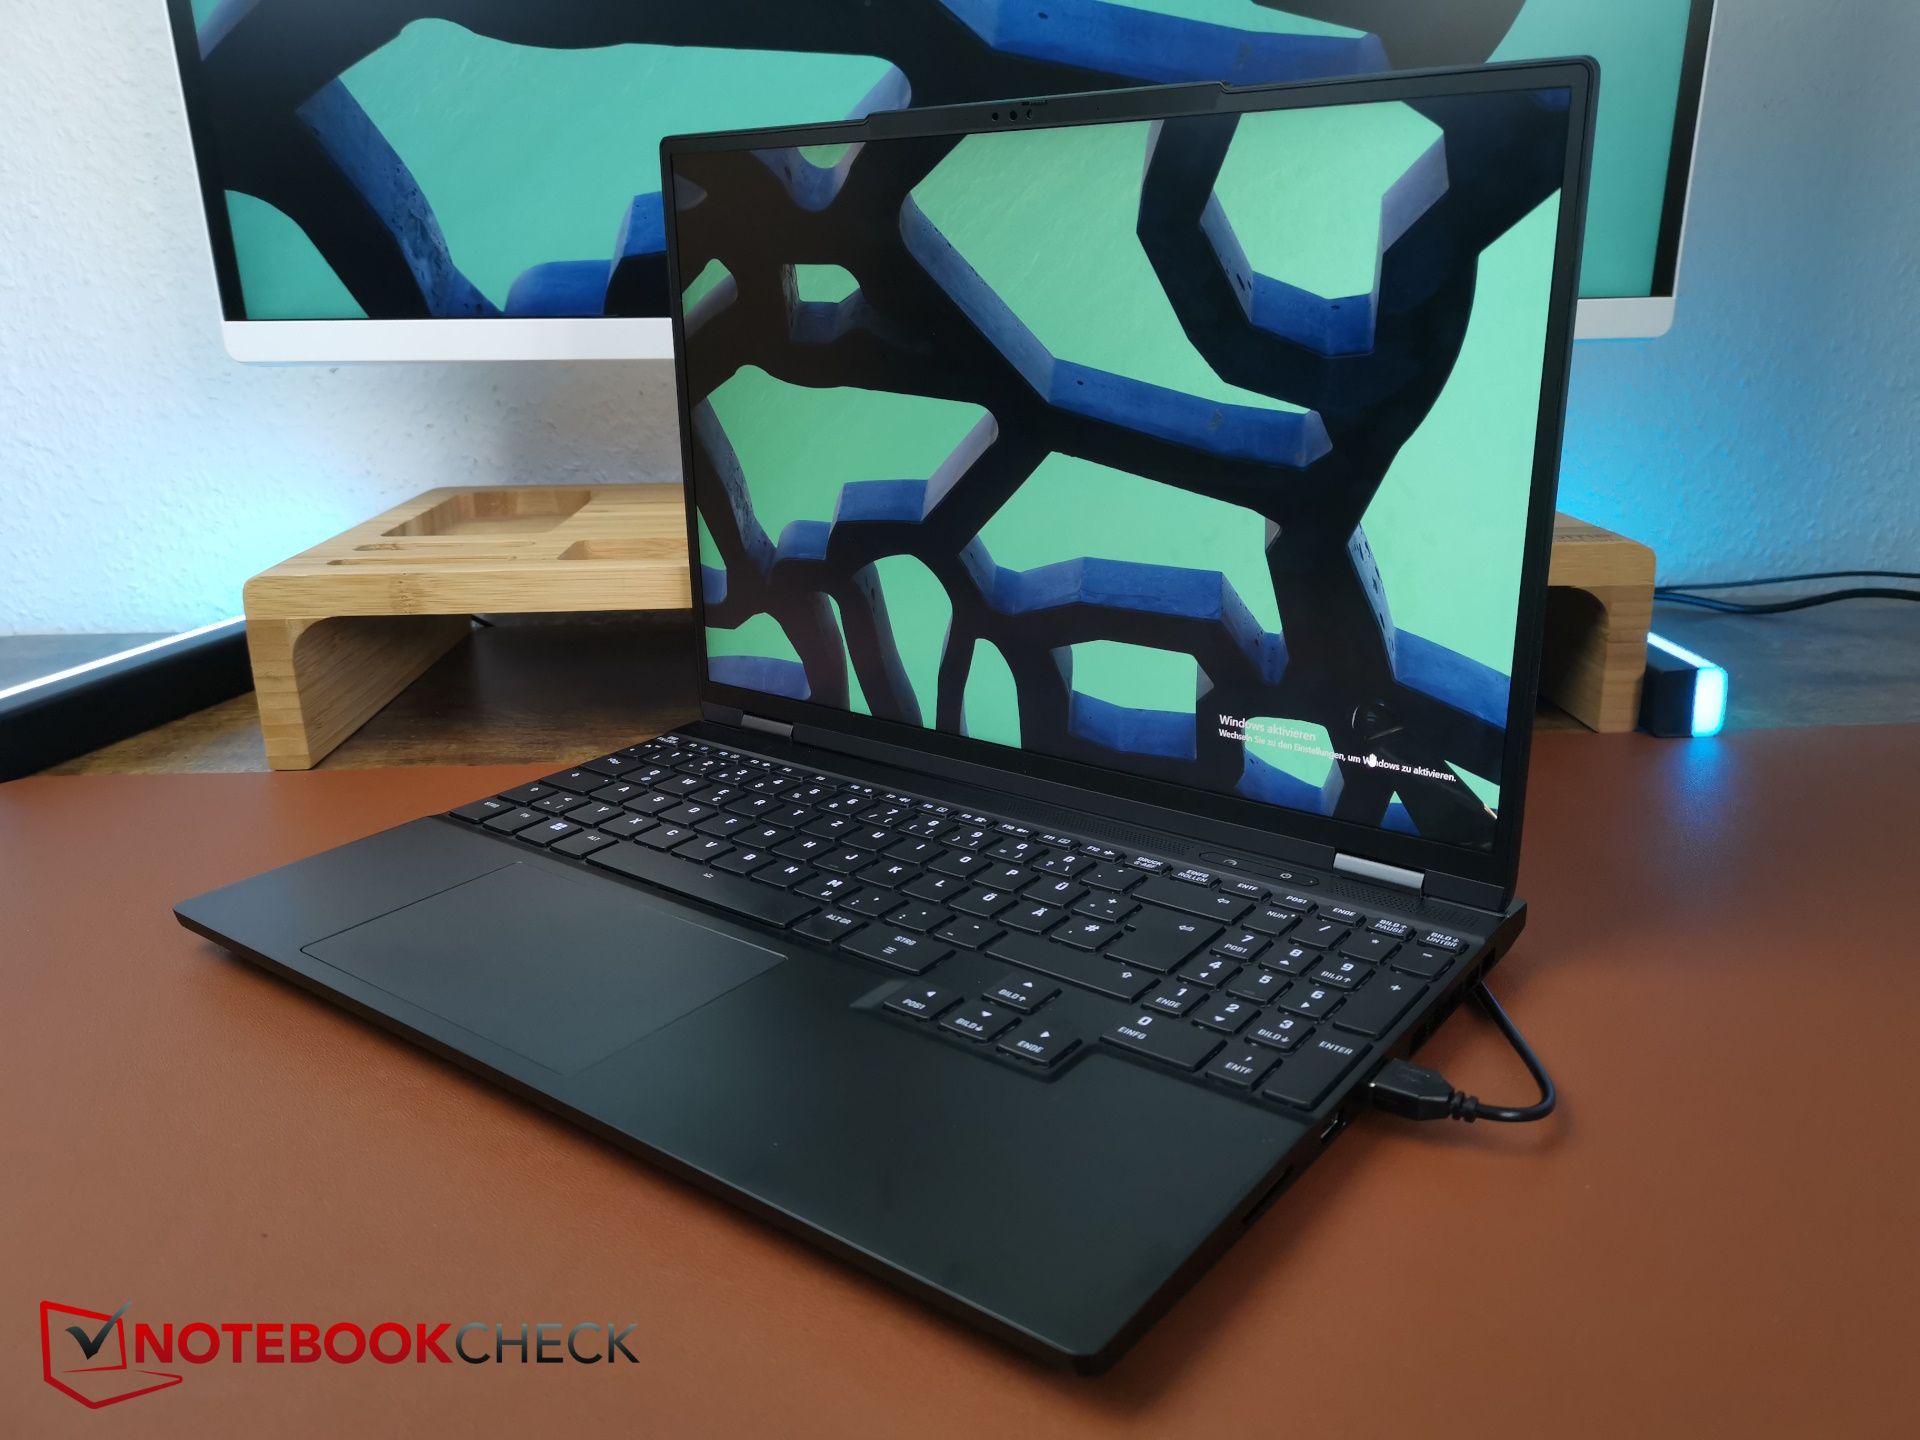
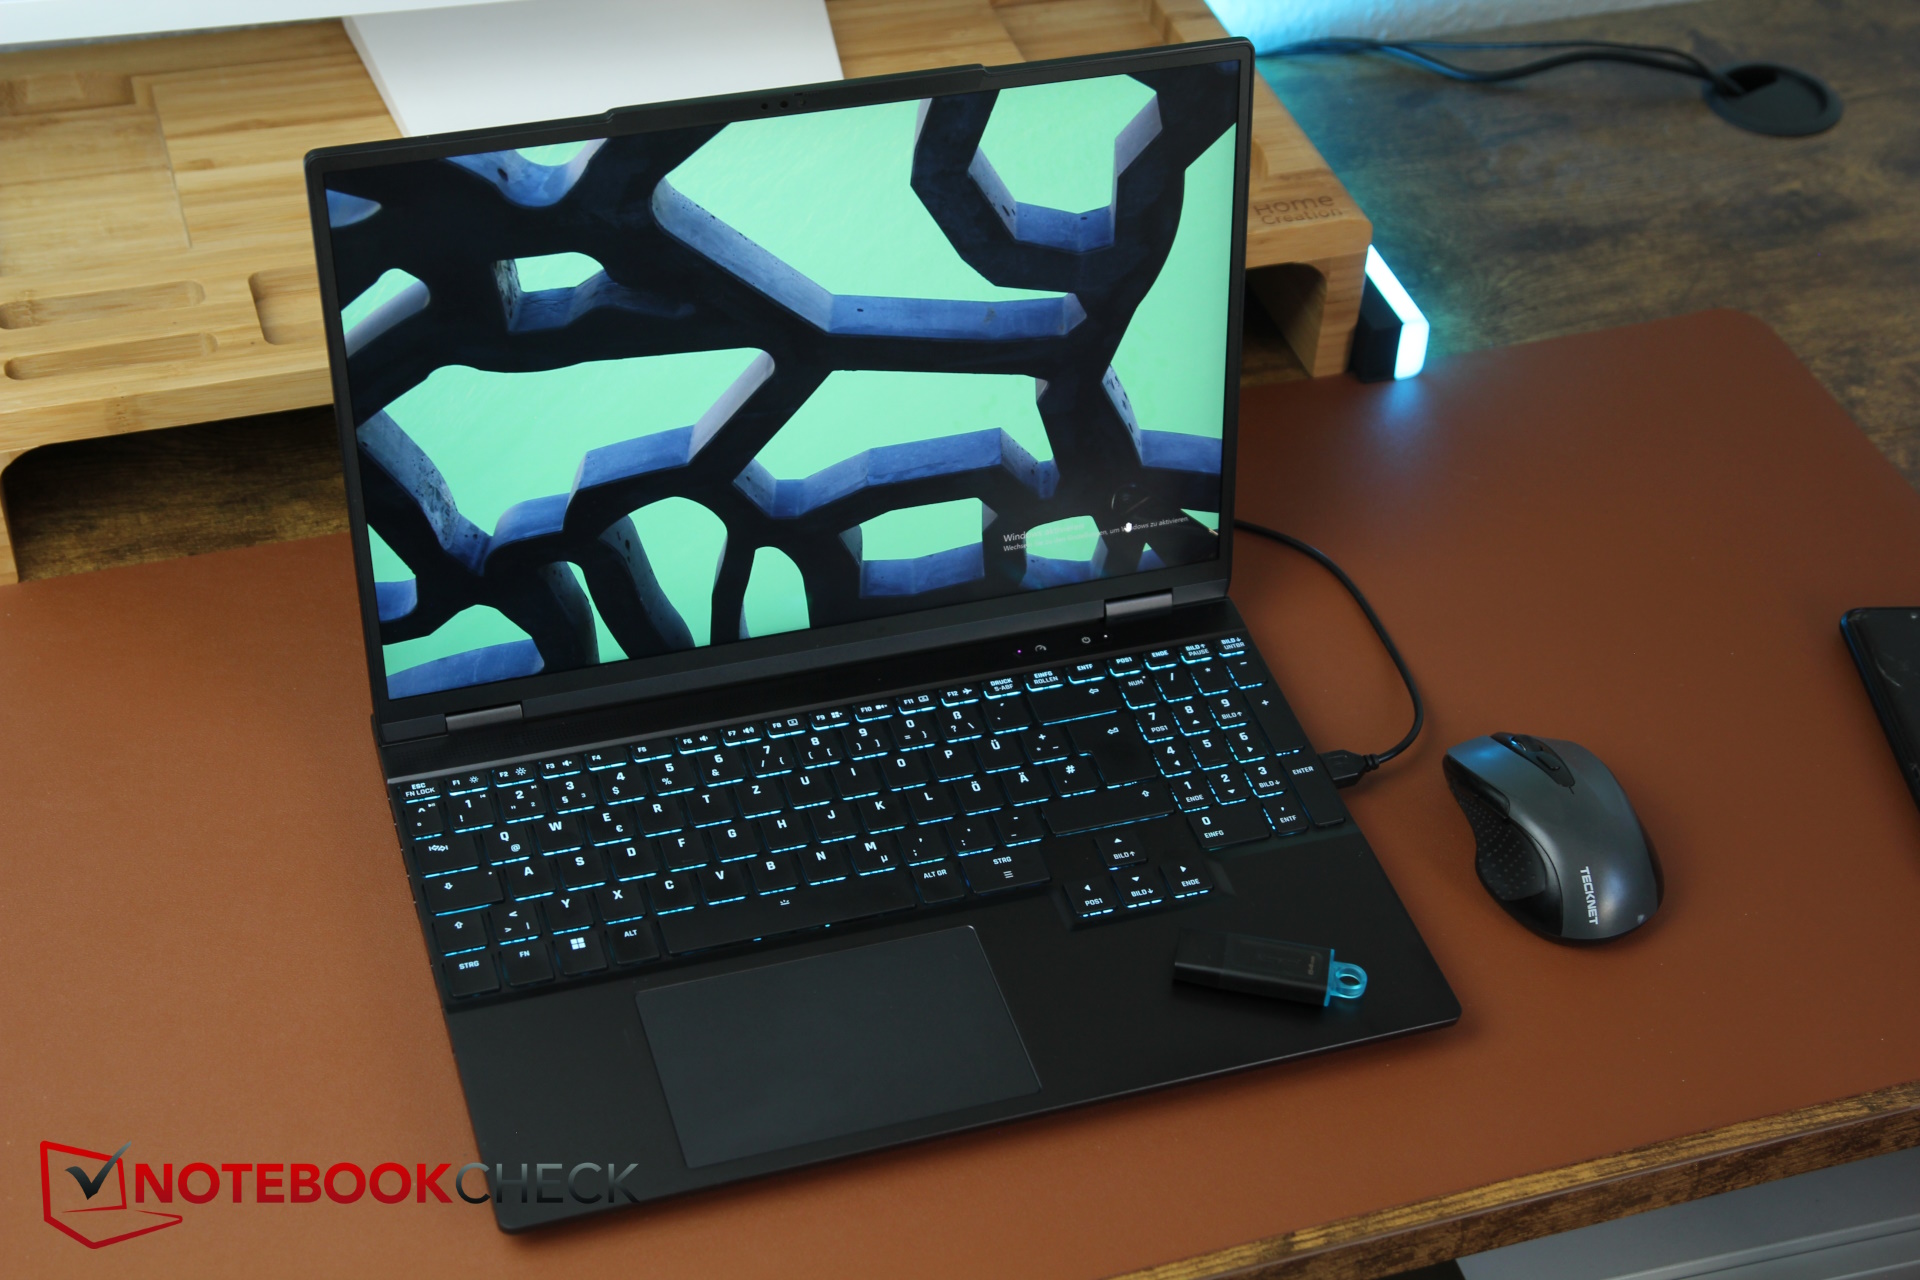
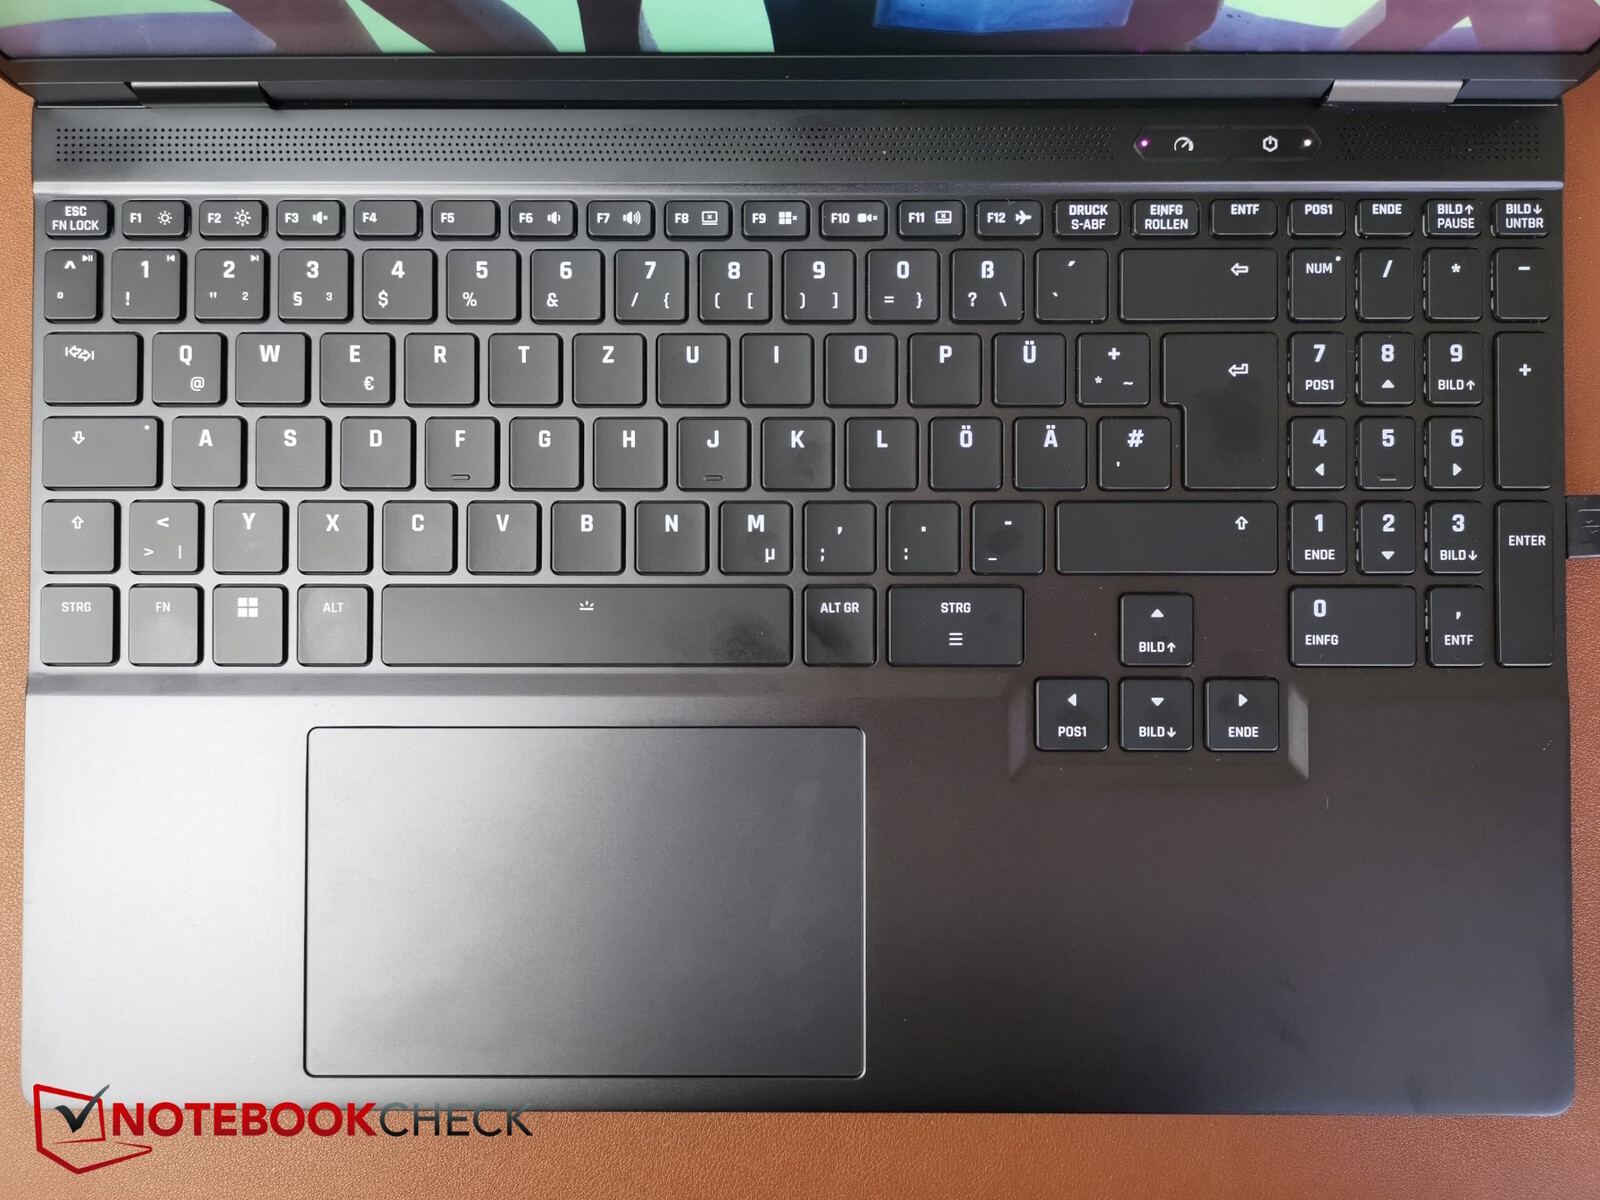
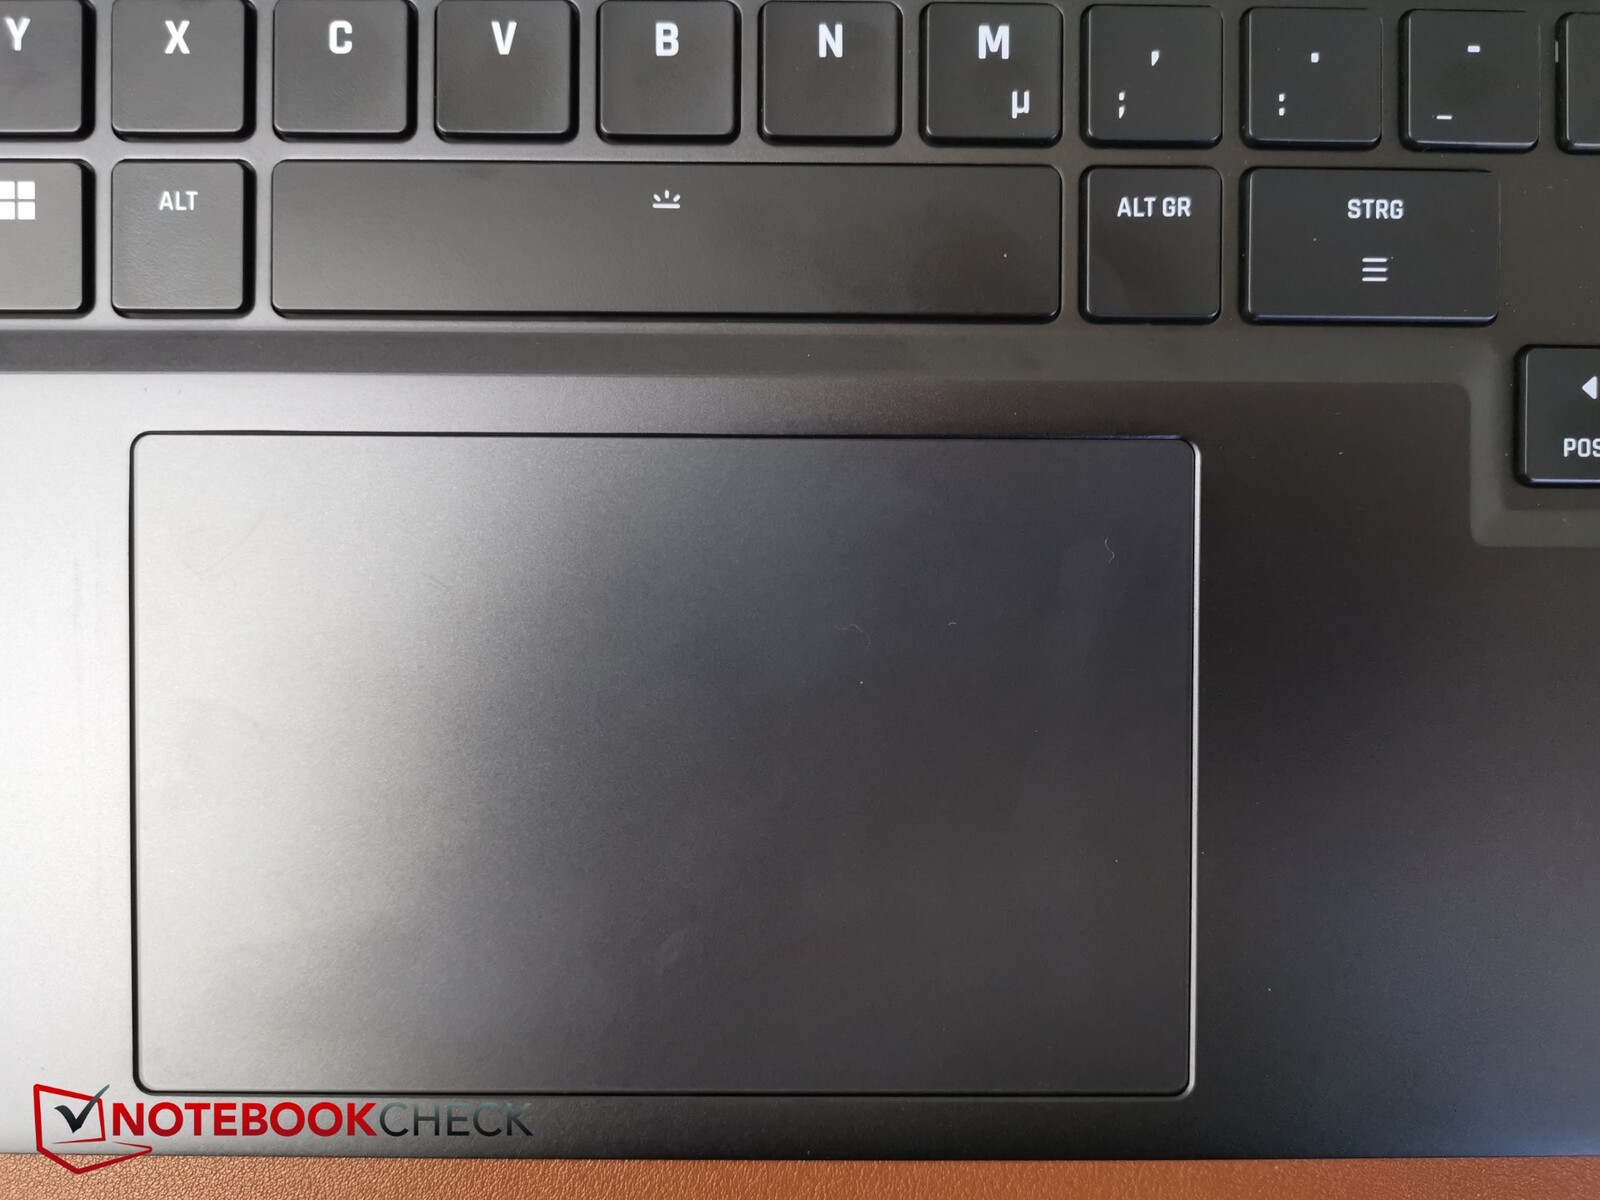
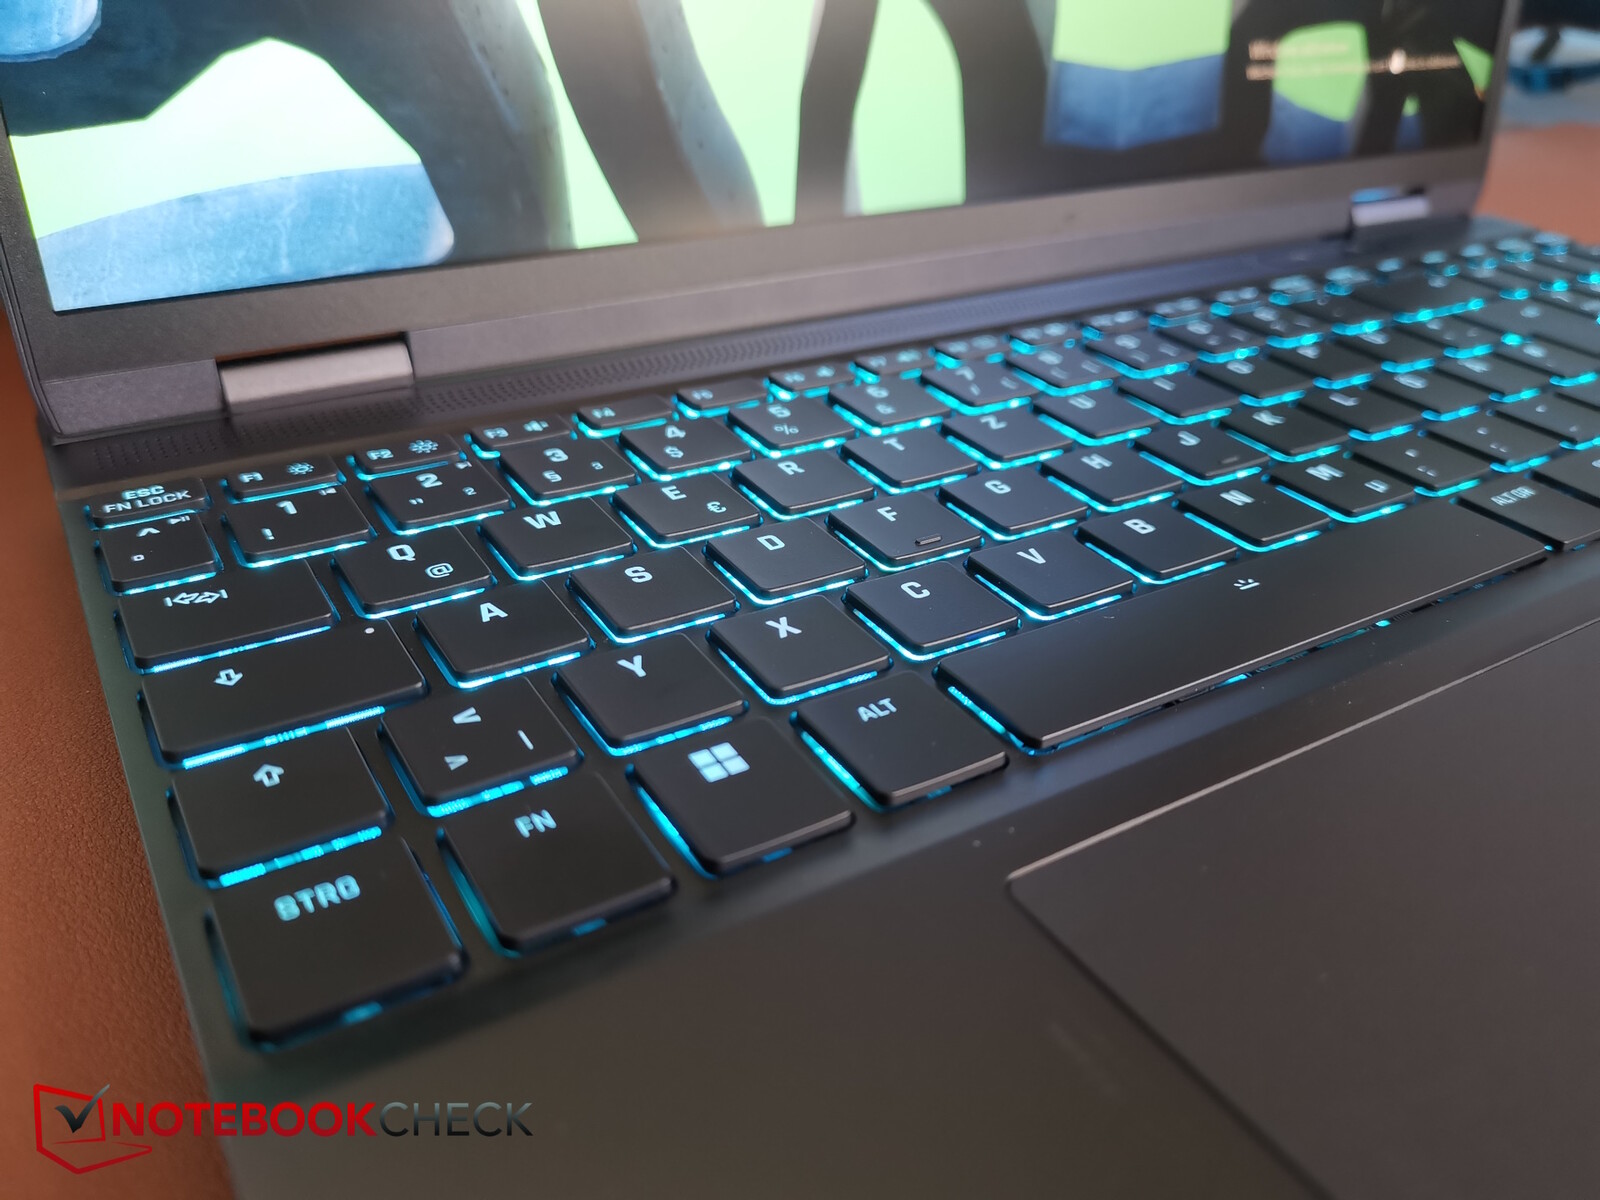
Giriş cihazları - Maksimum kullanılan alan
Fusion 15'in aksine, Core 15 ayrı RGB tuş aydınlatmasına sahip değildir. Bunun yerine sadece tek bir aydınlatma bölgesi var. Çok sayıda isteğe bağlı LED ayarına izin vermese de, her şey hala görülebilir.
En azından veri sayfasına göre, klavyede N tuşu rollover'ı ve anti-ghosting de bulunmuyor. Bununla birlikte, performans profillerini değiştirebileceğiniz tuş yerleşiktir.
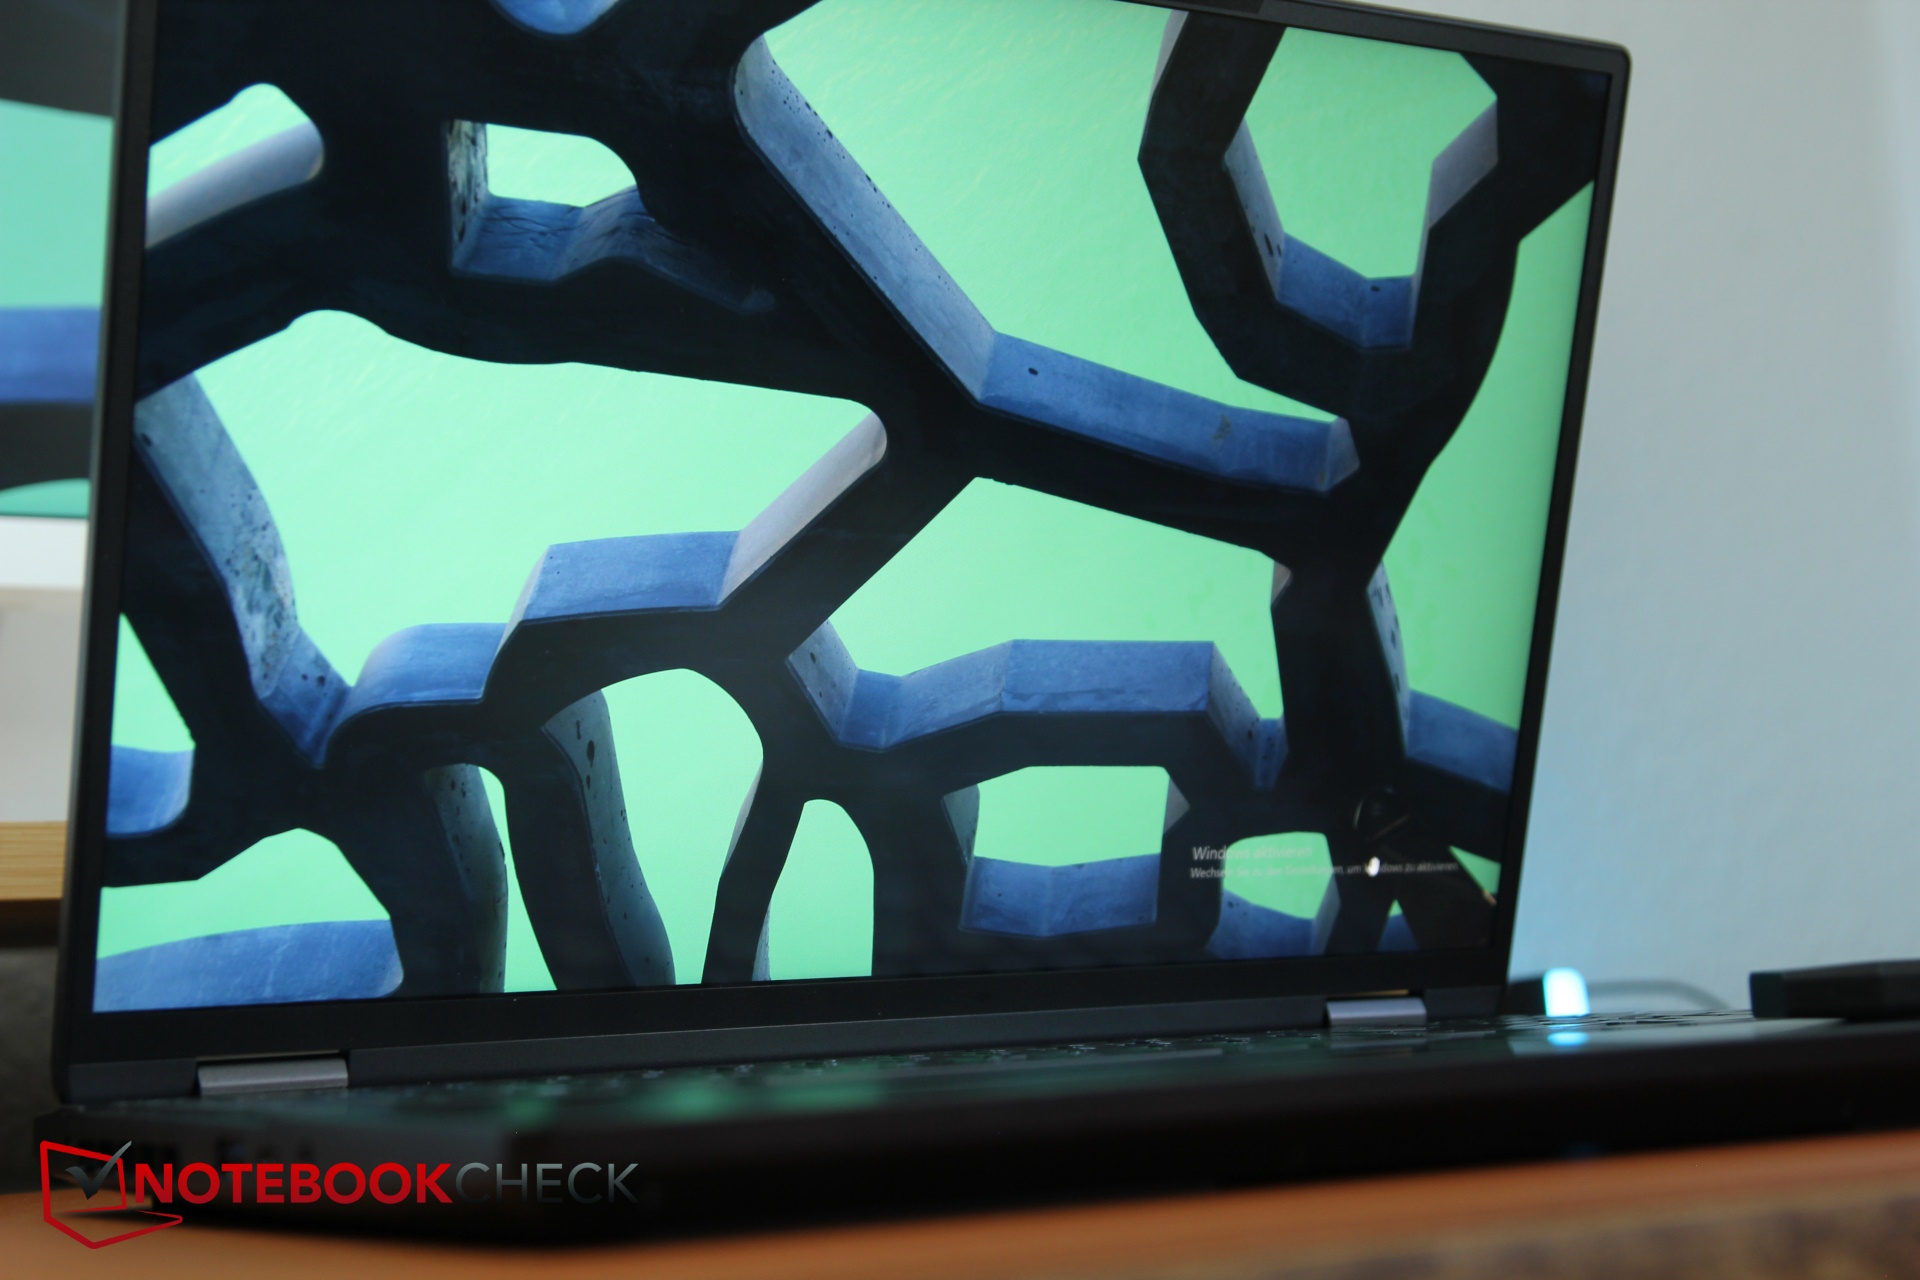
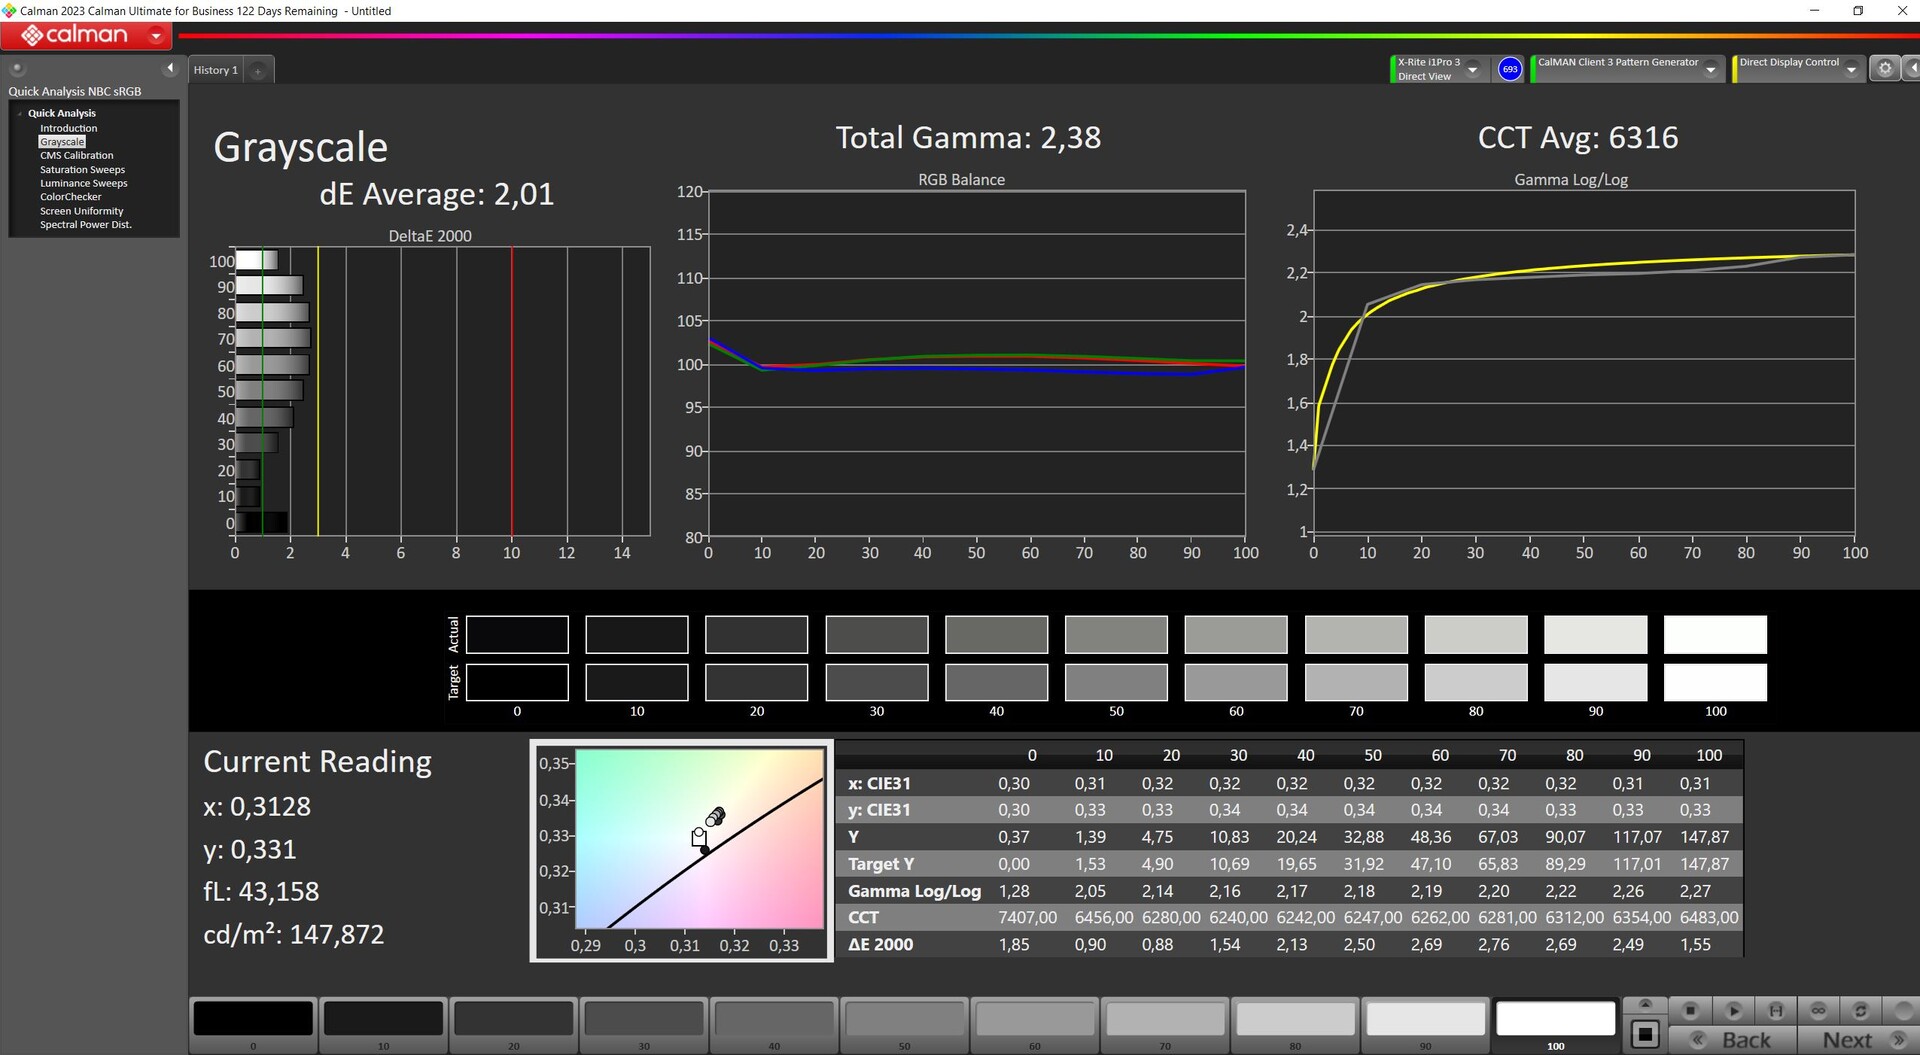
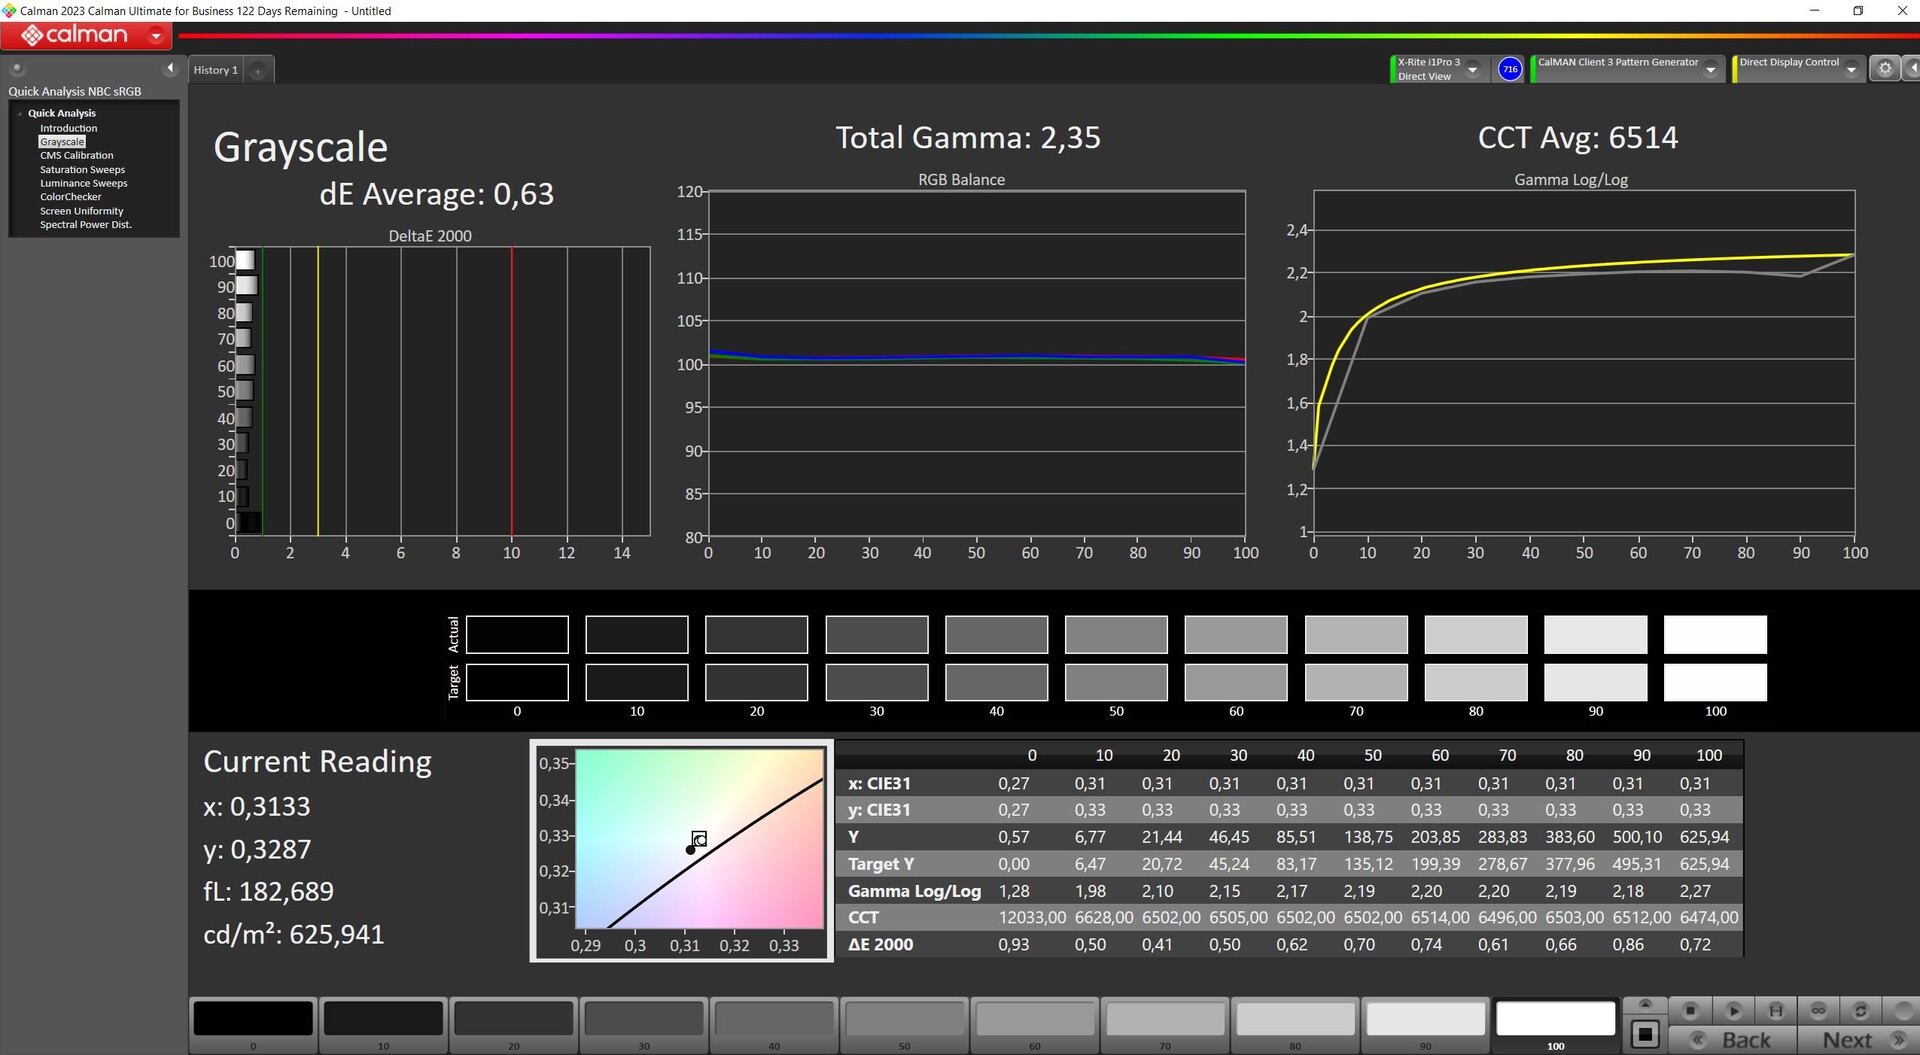
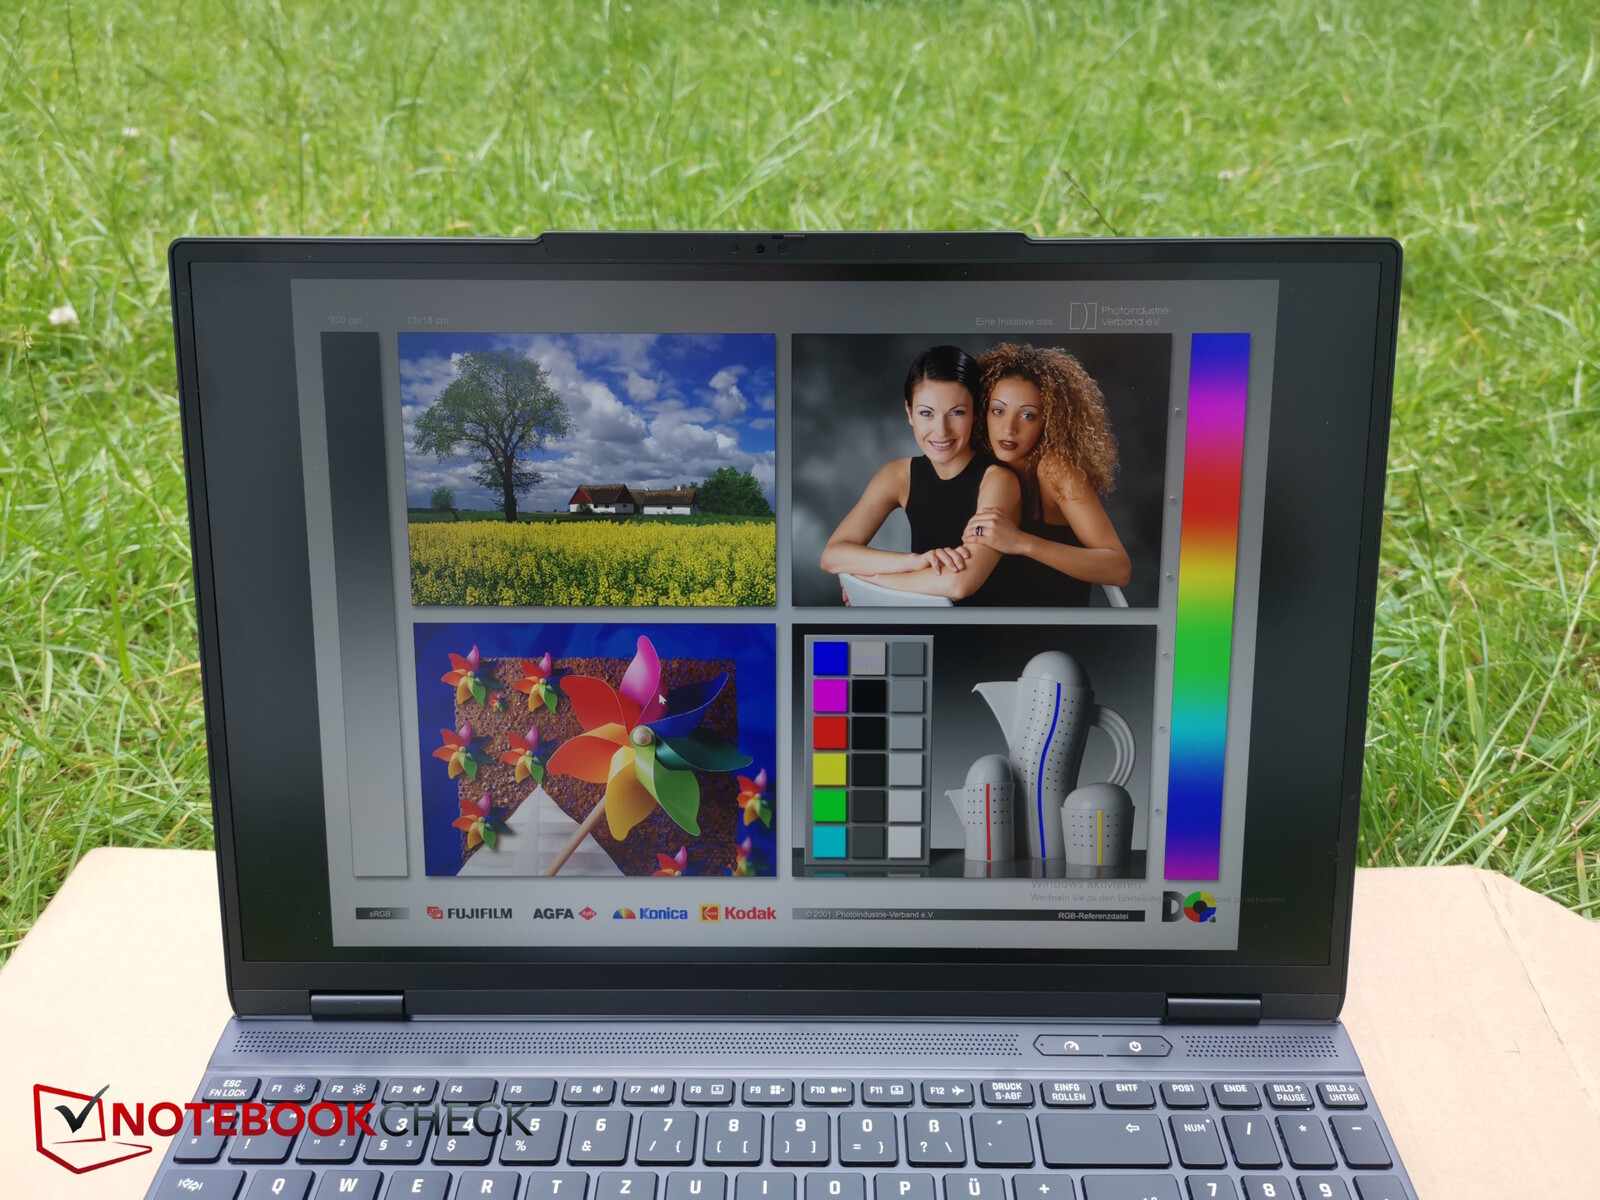
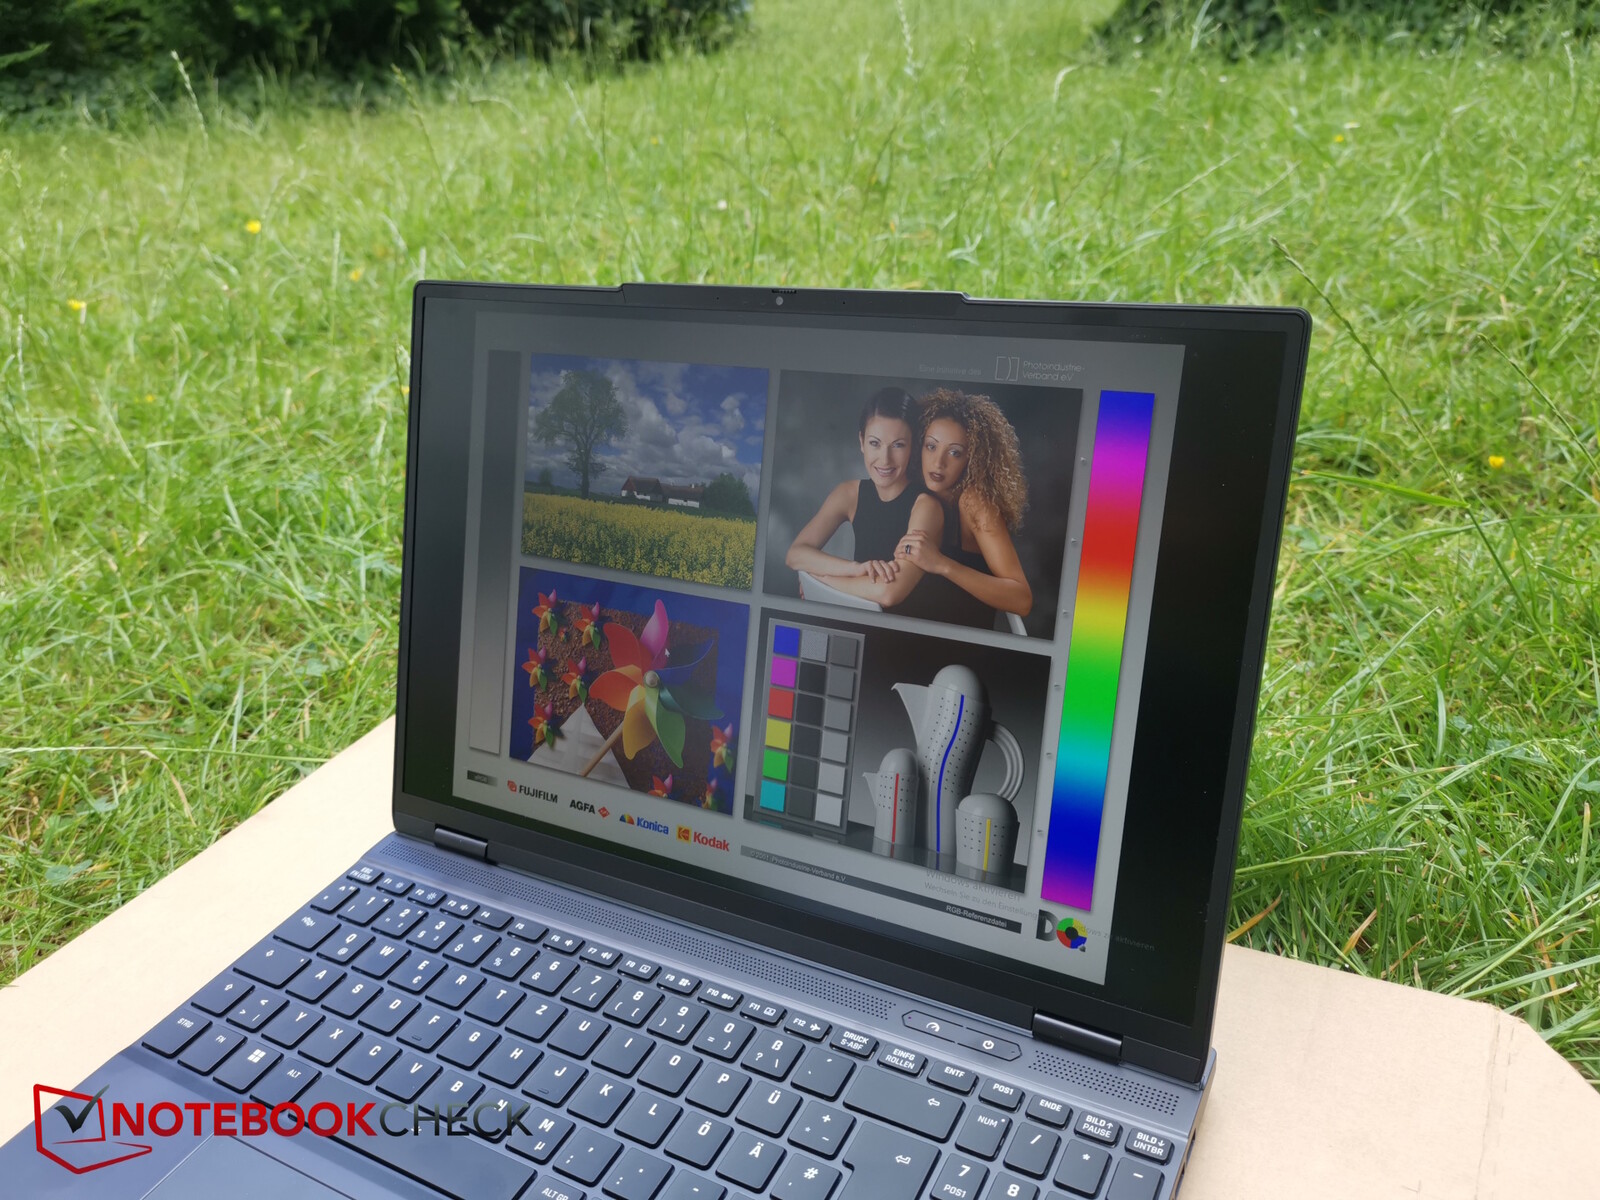
Ekran - 500 nit, sRGB, 1600p
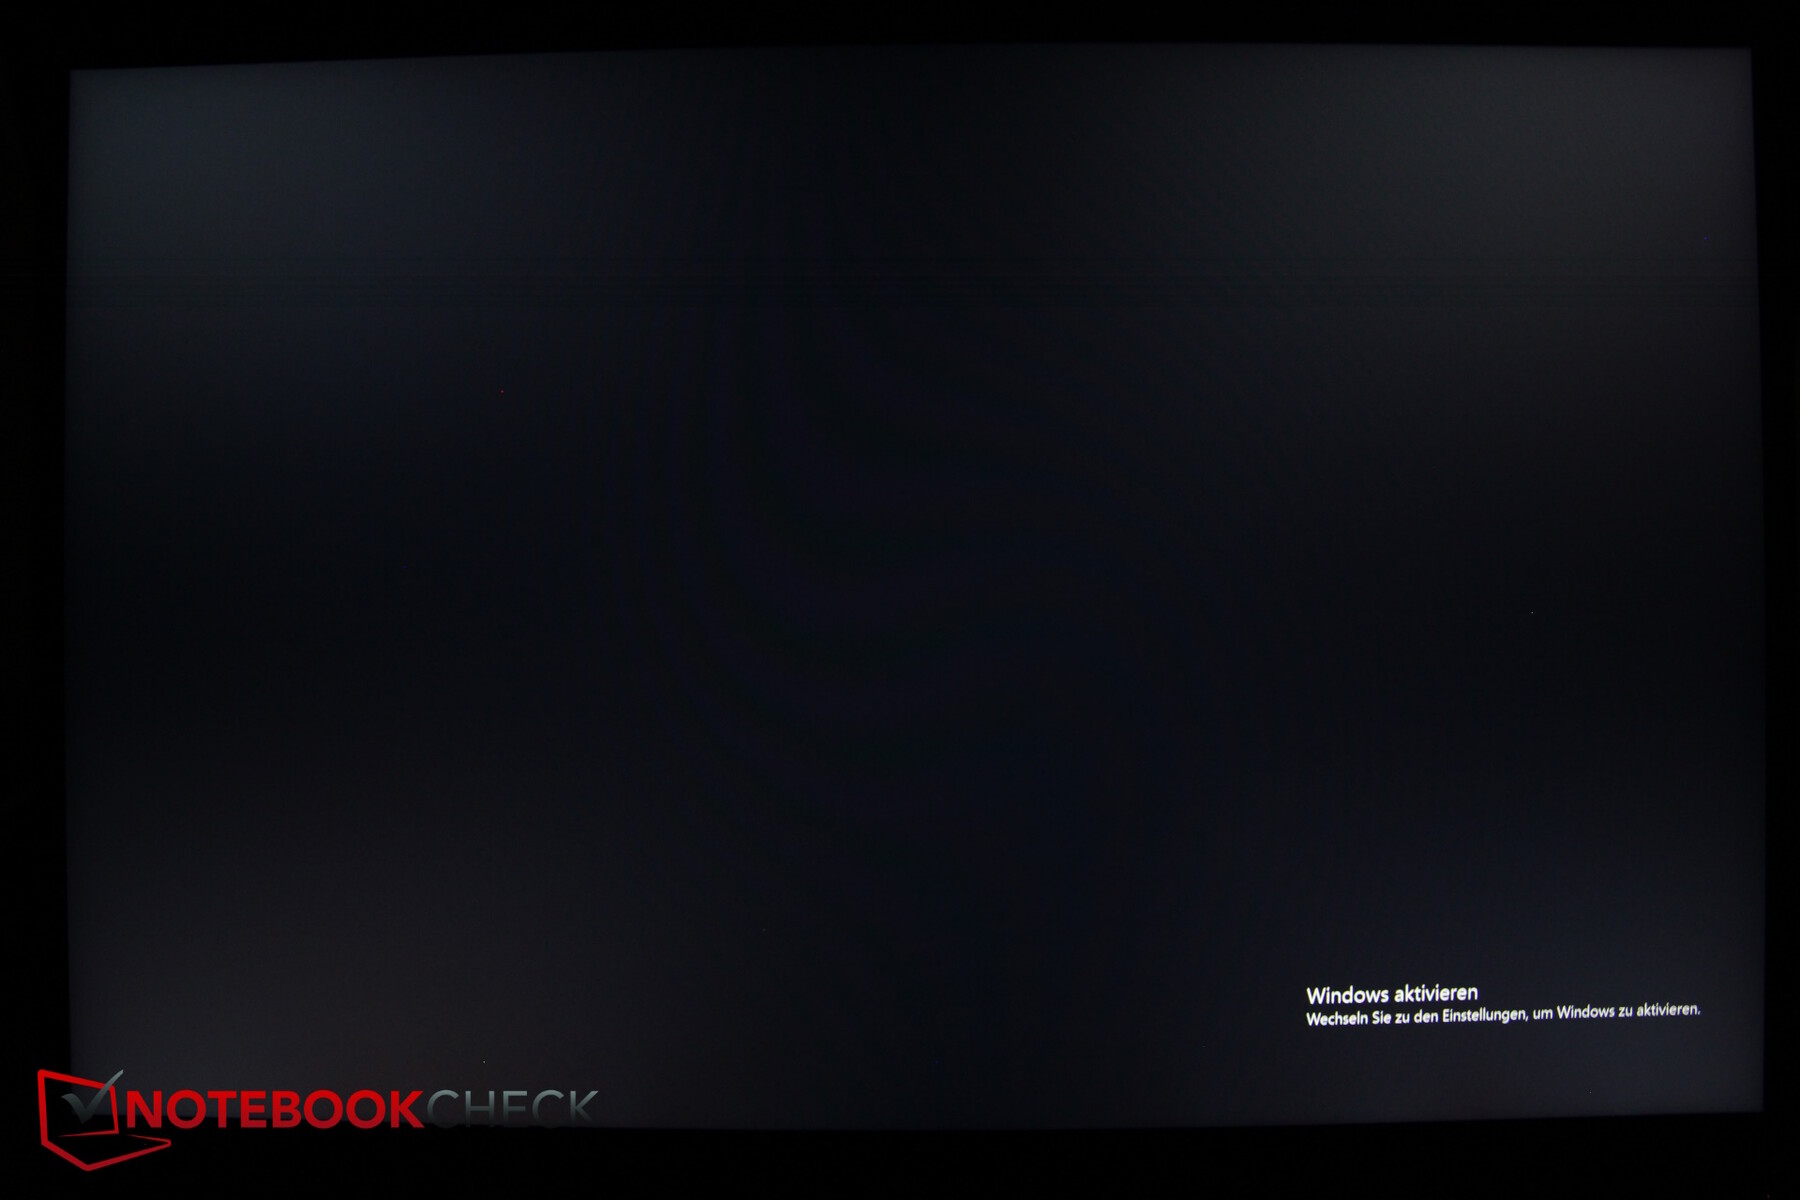
Core, Fusion ile aynı paneli kullanıyor. Önemli ölçüde daha yüksek parlaklık ölçmemize rağmen (600'e karşı 460 nit), sonuç olarak kontrastın acı çekmesiyle birlikte siyah seviyesinin pahasına geliyor.
Minimum parlaklıkta, ekranın arka aydınlatması da çok parlak ancak yine de oldukça eşit bir şekilde aydınlatılıyor.
Yaklaşık yüzde 45 parlaklıkta (150 nit) 150 nit ölçtük. Daha karanlık bir ekranla, renk doğruluğu ve söylemeye gerek yok, siyah seviyesi bir tık daha iyi
Ne yazık ki alternatif ekran seçenekleri yok ancak ekran parlak, yeterince hızlı tepki sürelerine sahip, PWM yok ve aynı şekilde arka ışık kanaması da fark edilmiyor.
| |||||||||||||||||||||||||
Aydınlatma: 91 %
Batarya modunda parlaklık: 635 cd/m²
Kontrast: 992:1 (Siyah: 0.64 cd/m²)
ΔE Color 1.89 | 0.5-29.43 Ø4.87, calibrated: 1.14
ΔE Greyscale 2.53 | 0.5-98 Ø5.1
74.6% AdobeRGB 1998 (Argyll 2.2.0 3D)
100% sRGB (Argyll 2.2.0 3D)
73.2% Display P3 (Argyll 2.2.0 3D)
Gamma: 2.36
| SCHENKER XMG Core 15 (M24) BOE NJ NE153QDM-NZ1 (BOE0C8E), IPS, 2560x1600, 15.3" | Lenovo Legion 5 16IRX G9 NE160QDM-NZ3, IPS, 2560x1600, 16" | HP Victus 16 (2024) Chi Mei CMN163E, IPS, 1920x1080, 16.1" | Dell G16, i7-13650HX, RTX 4060 Chi Mei CMN161D (160GME), IPS, 2560x1600, 16" | SCHENKER XMG Fusion 15 (Early 24) BOE NJ NE153QDM-NZ1, IPS, 2560x1600, 15.3" | SCHENKER XMG Pro 15 (E23) BOE0AD1, IPS, 2560x1440, 15.6" | |
|---|---|---|---|---|---|---|
| Display | -1% | -42% | -5% | 0% | 16% | |
| Display P3 Coverage | 73.2 | 72.4 -1% | 41.3 -44% | 67.5 -8% | 73.5 0% | 97.8 34% |
| sRGB Coverage | 100 | 100 0% | 61.7 -38% | 98.5 -1% | 100 0% | 99.9 0% |
| AdobeRGB 1998 Coverage | 74.6 | 74.1 -1% | 42.7 -43% | 69.3 -7% | 75 1% | 85.4 14% |
| Response Times | -13% | -151% | 4% | 46% | -25% | |
| Response Time Grey 50% / Grey 80% * | 9.6 ? | 12.5 ? -30% | 28.6 ? -198% | 7.6 ? 21% | 5 ? 48% | 14 ? -46% |
| Response Time Black / White * | 9.2 ? | 8.7 ? 5% | 18.7 ? -103% | 10.4 ? -13% | 5.2 ? 43% | 9.6 ? -4% |
| PWM Frequency | ||||||
| Screen | 22% | -114% | -29% | -11% | -24% | |
| Brightness middle | 635 | 526 -17% | 287 -55% | 369 -42% | 491 -23% | 322 -49% |
| Brightness | 604 | 500 -17% | 288 -52% | 344 -43% | 460 -24% | 301 -50% |
| Brightness Distribution | 91 | 87 -4% | 86 -5% | 89 -2% | 89 -2% | 85 -7% |
| Black Level * | 0.64 | 0.33 48% | 0.19 70% | 0.26 59% | 0.47 27% | 0.36 44% |
| Contrast | 992 | 1594 61% | 1511 52% | 1419 43% | 1045 5% | 894 -10% |
| Colorchecker dE 2000 * | 1.89 | 1.2 37% | 5.46 -189% | 3.04 -61% | 2.16 -14% | 1.98 -5% |
| Colorchecker dE 2000 max. * | 3.14 | 2.1 33% | 20.36 -548% | 5.56 -77% | 4.44 -41% | 5.24 -67% |
| Colorchecker dE 2000 calibrated * | 1.14 | 1 12% | 3.52 -209% | 2.35 -106% | 1.14 -0% | 1.98 -74% |
| Greyscale dE 2000 * | 2.53 | 1.3 49% | 4.8 -90% | 3.38 -34% | 3.3 -30% | 2.44 4% |
| Gamma | 2.36 93% | 2.23 99% | 2.108 104% | 2.47 89% | 2.204 100% | 2.42 91% |
| CCT | 6434 101% | 6391 102% | 6442 101% | 6040 108% | 6286 103% | 6984 93% |
| Toplam Ortalama (Program / Ayarlar) | 3% /
13% | -102% /
-104% | -10% /
-19% | 12% /
-1% | -11% /
-15% |
* ... daha küçük daha iyidir
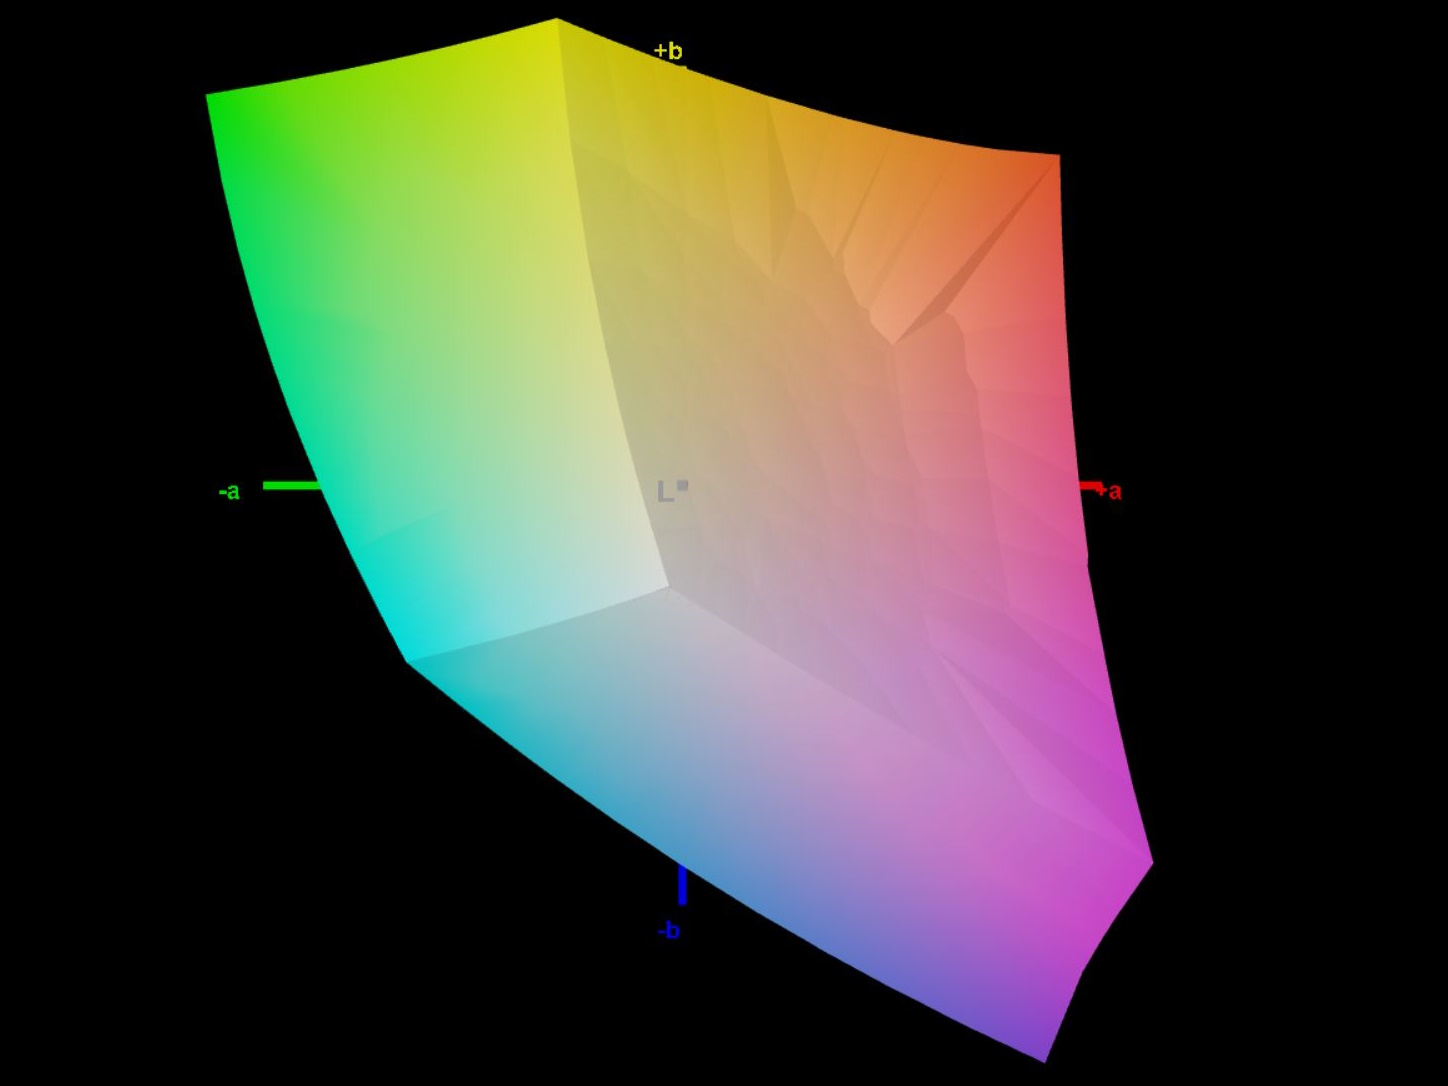
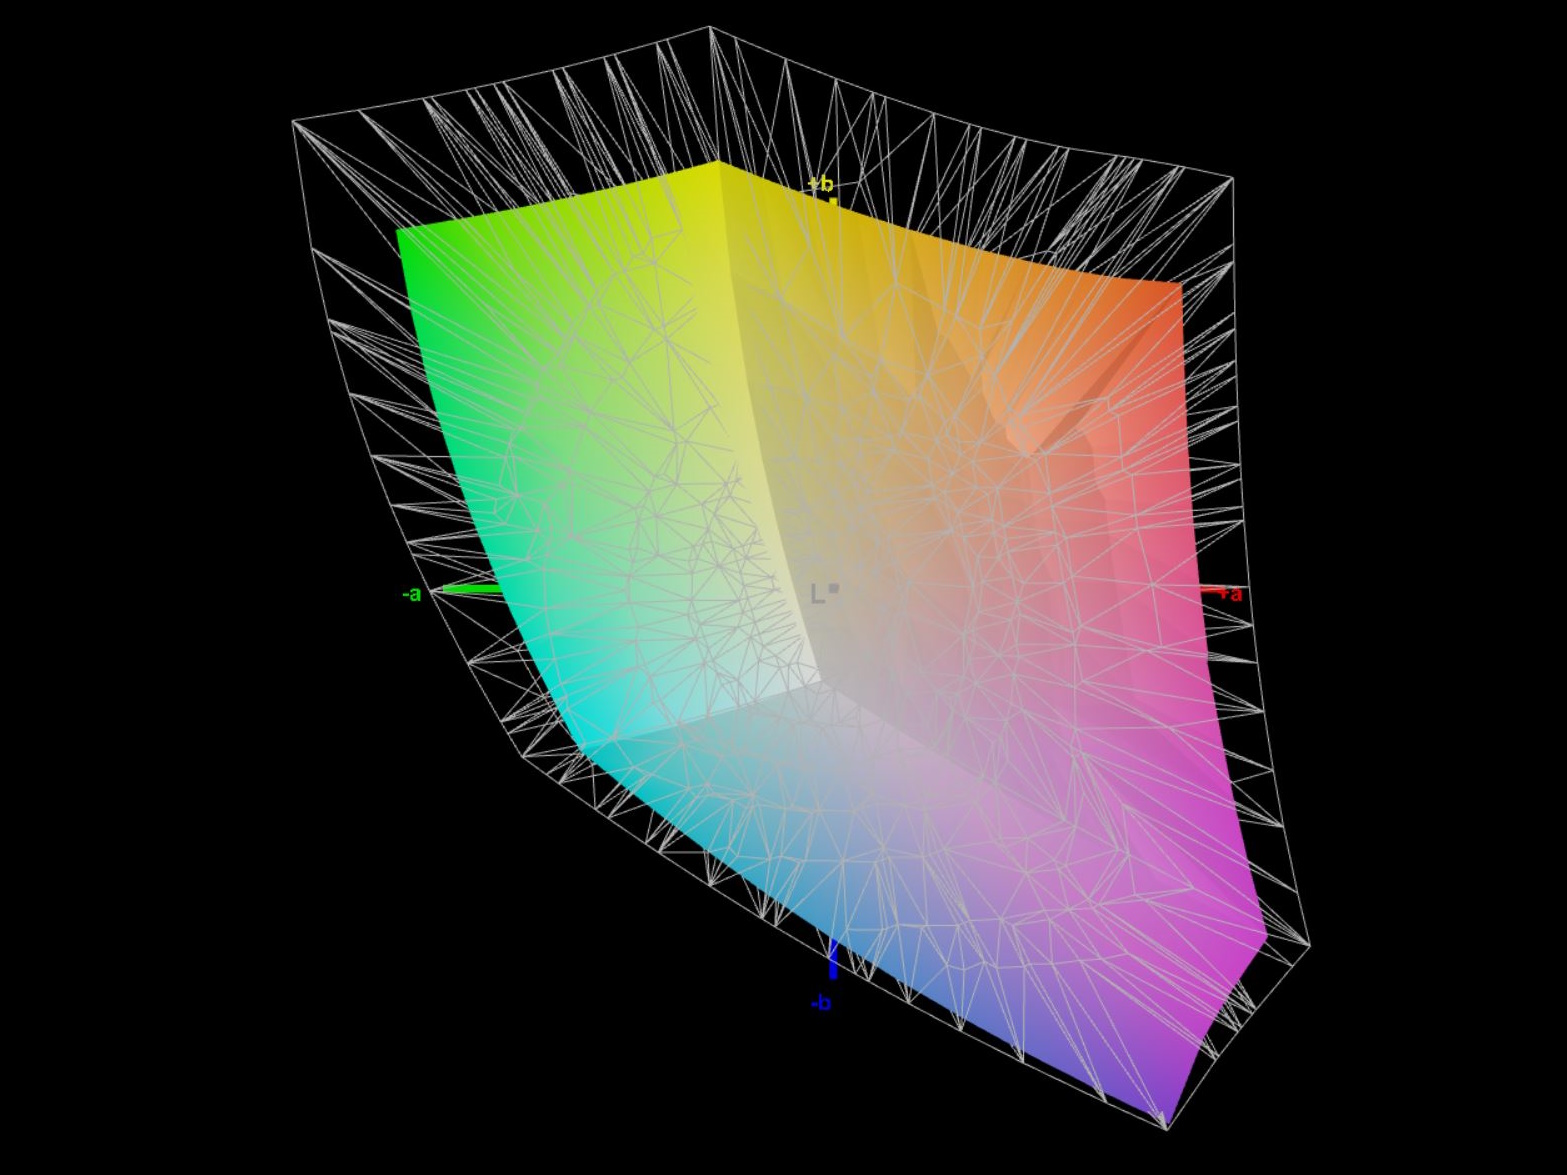
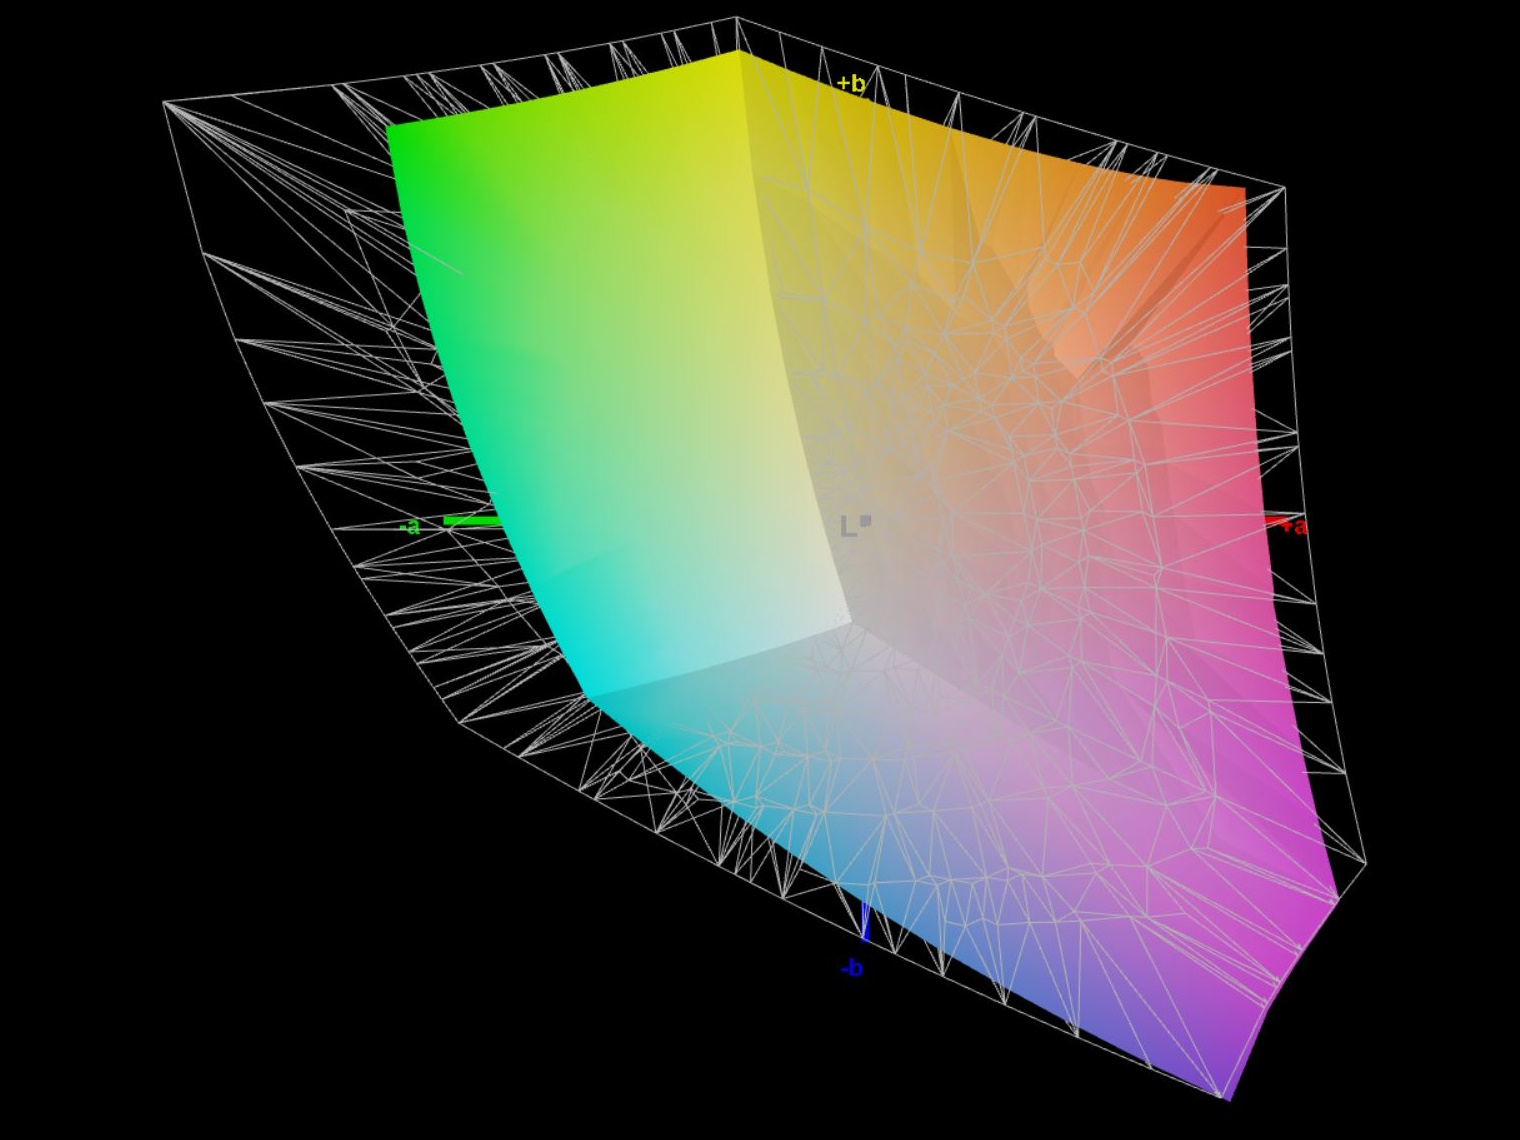
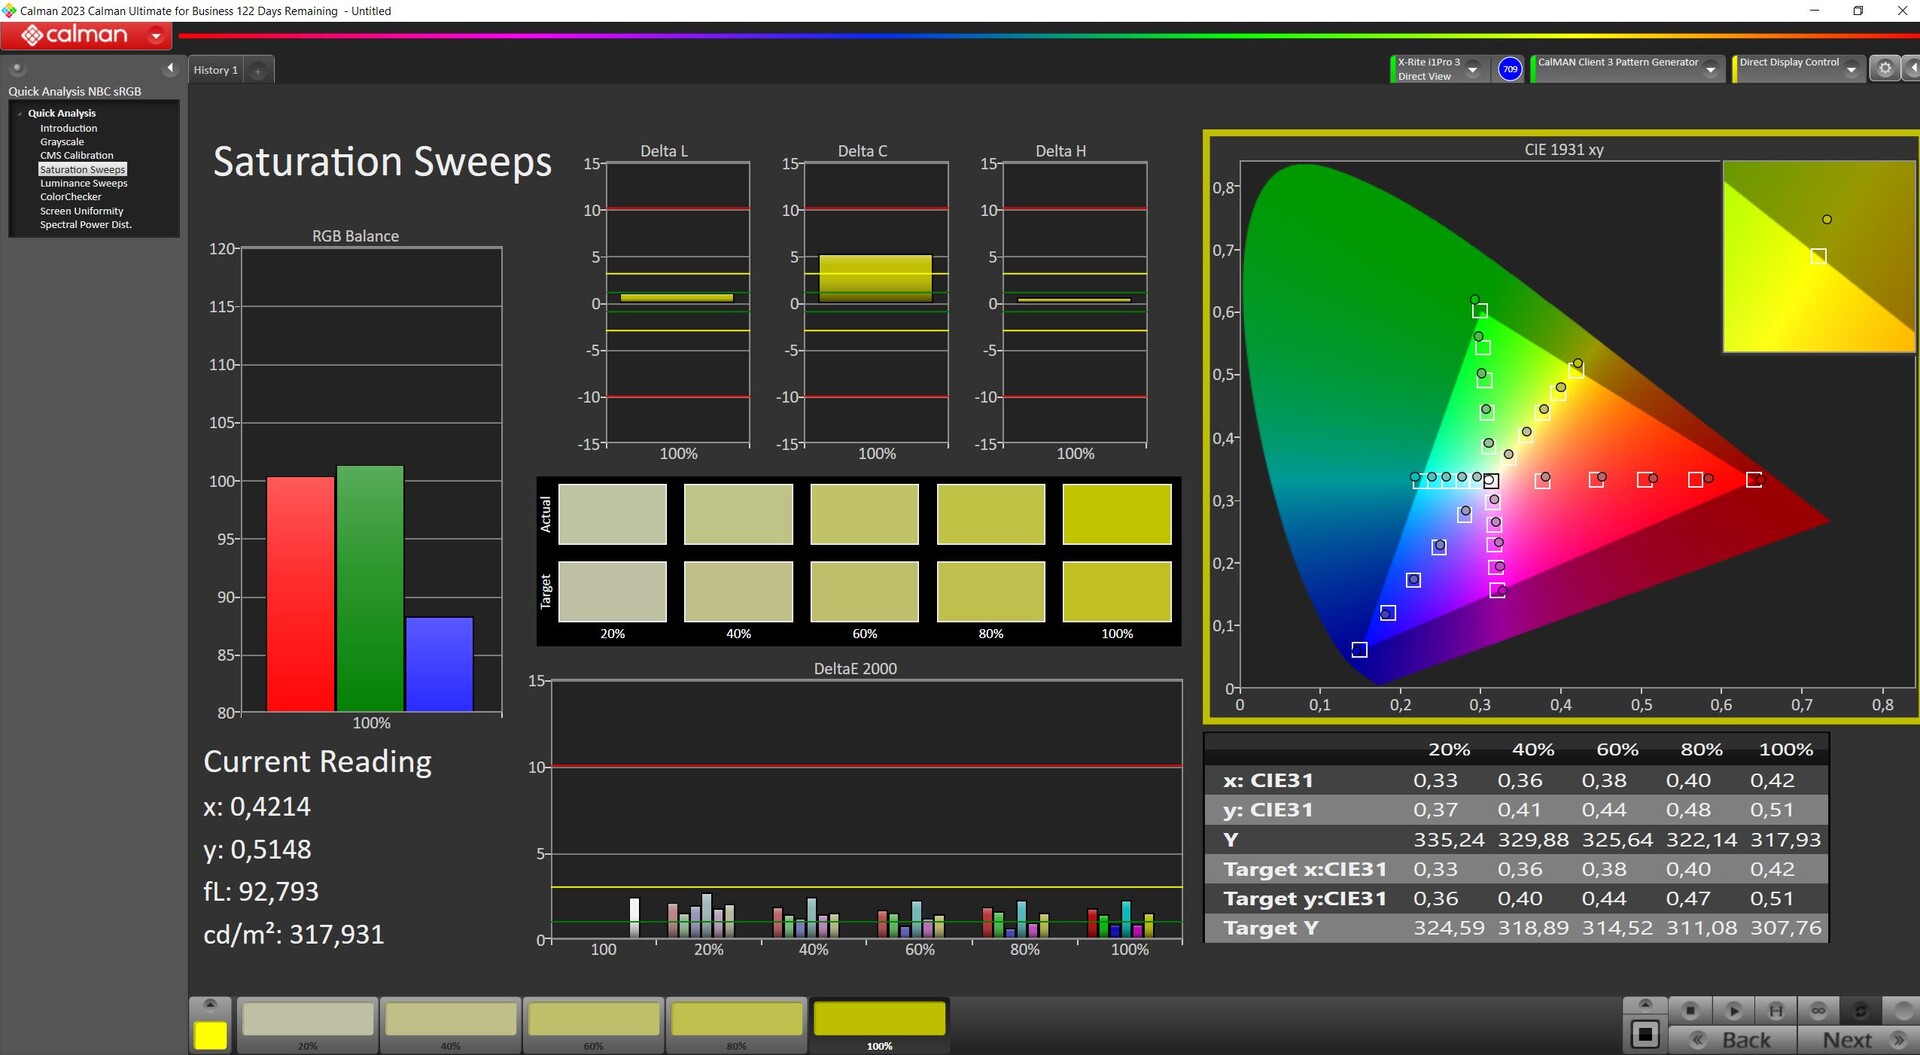
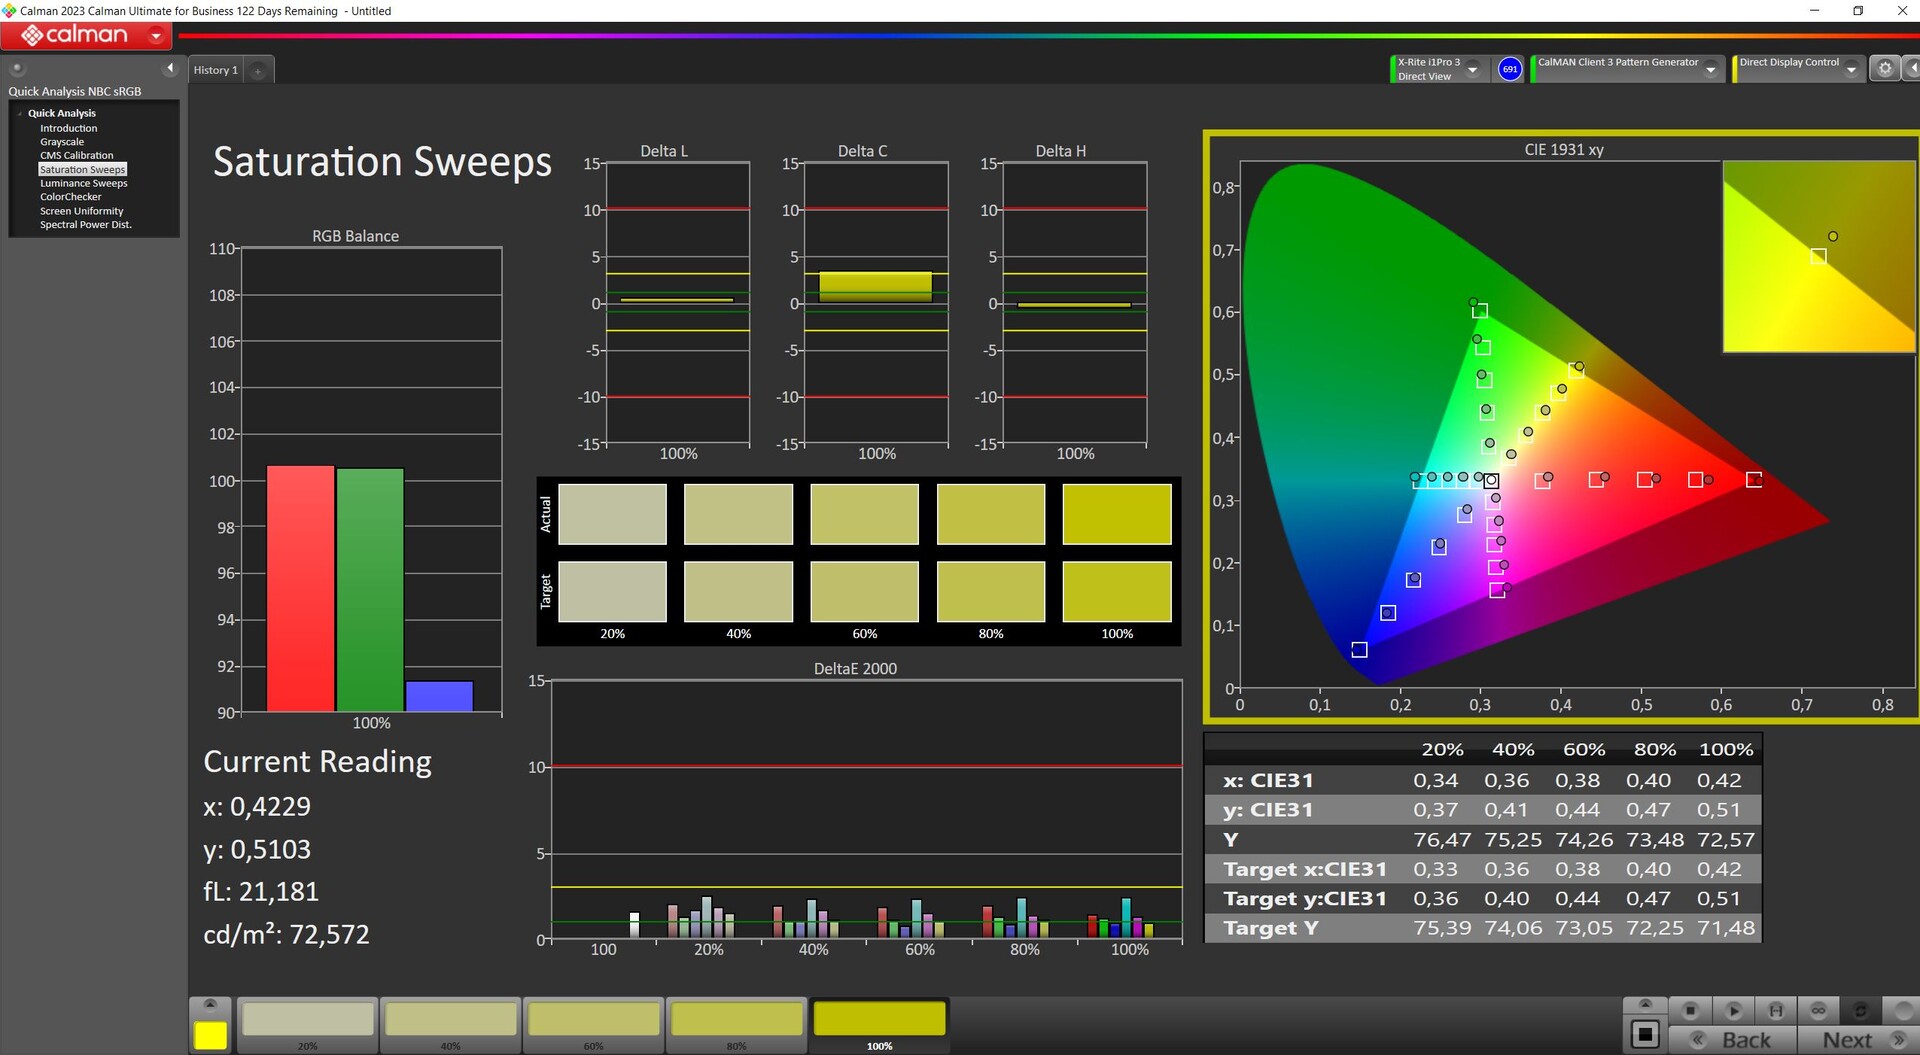
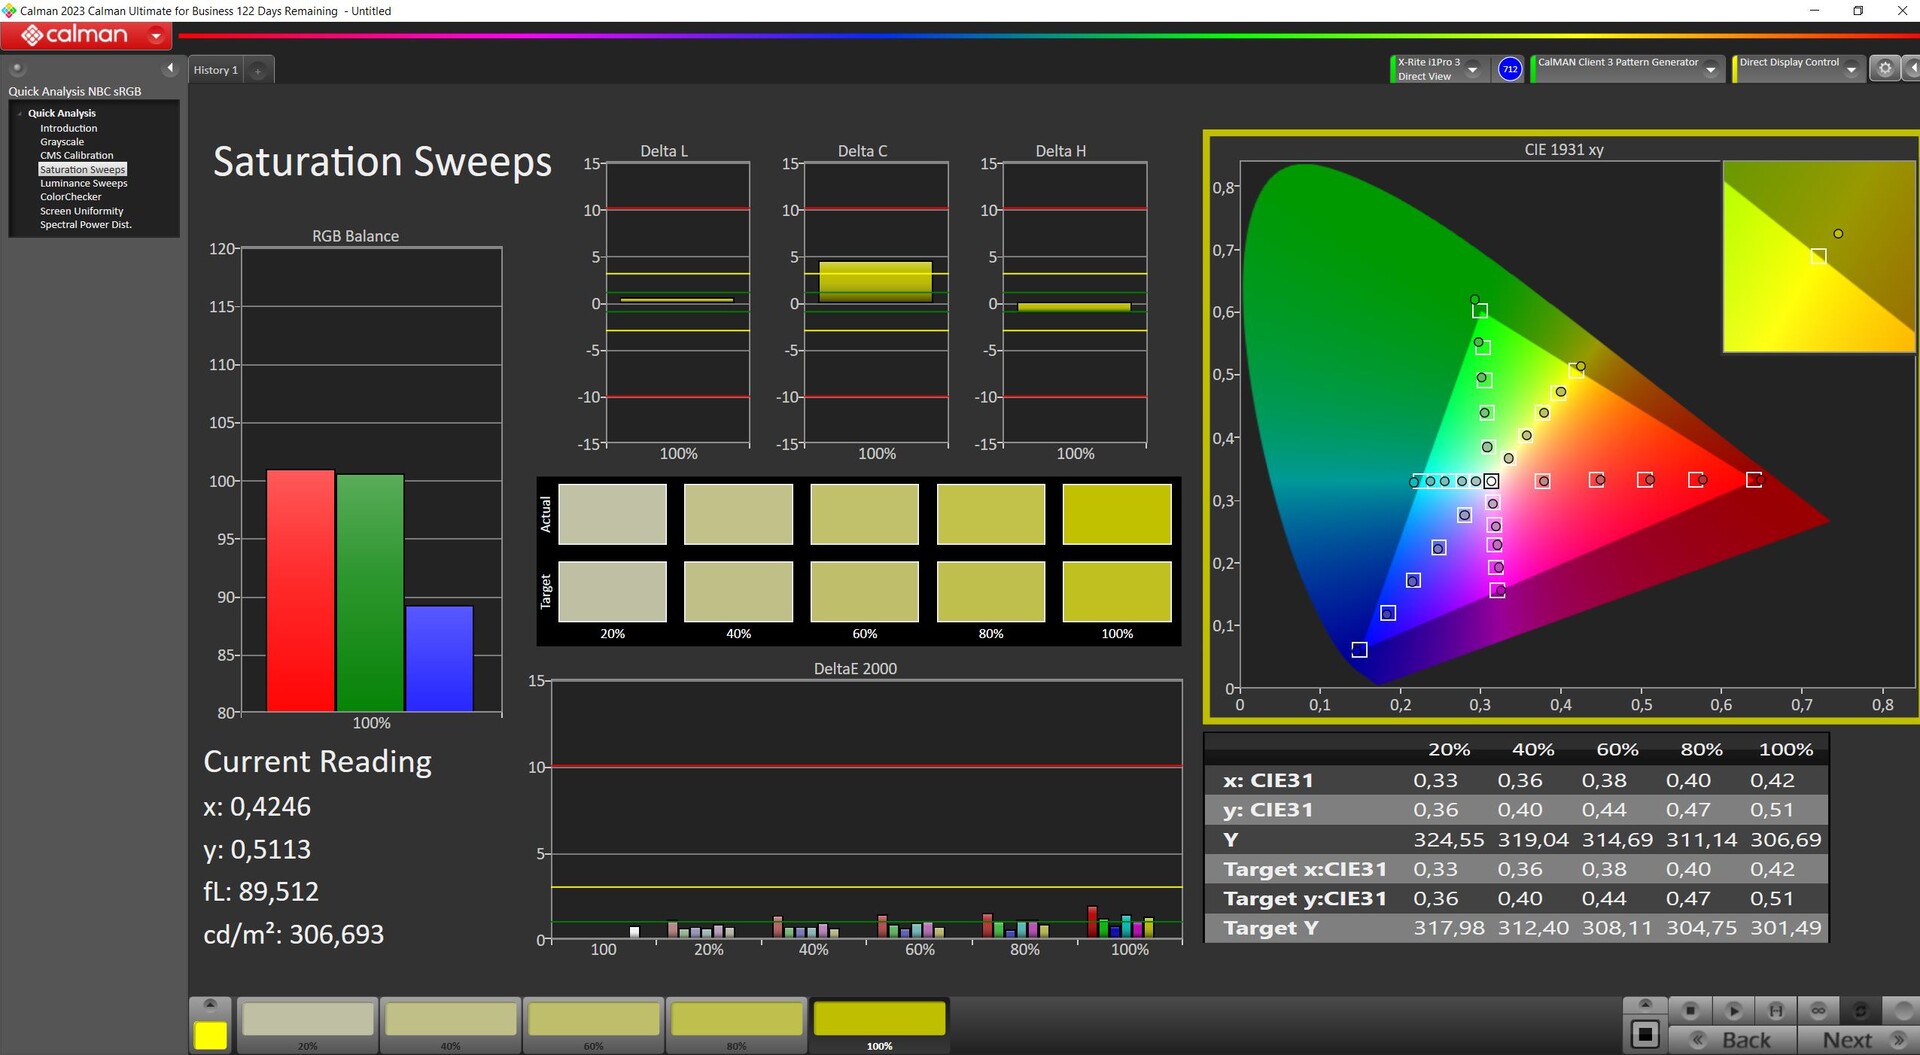
Renk alanı kapsamı
Fusion 15'te olduğu gibi, sRGB tamamen kapsanırken, P3 ve AdobeRGB yaklaşık yüzde 73 ila 75 arasında kalıyor.
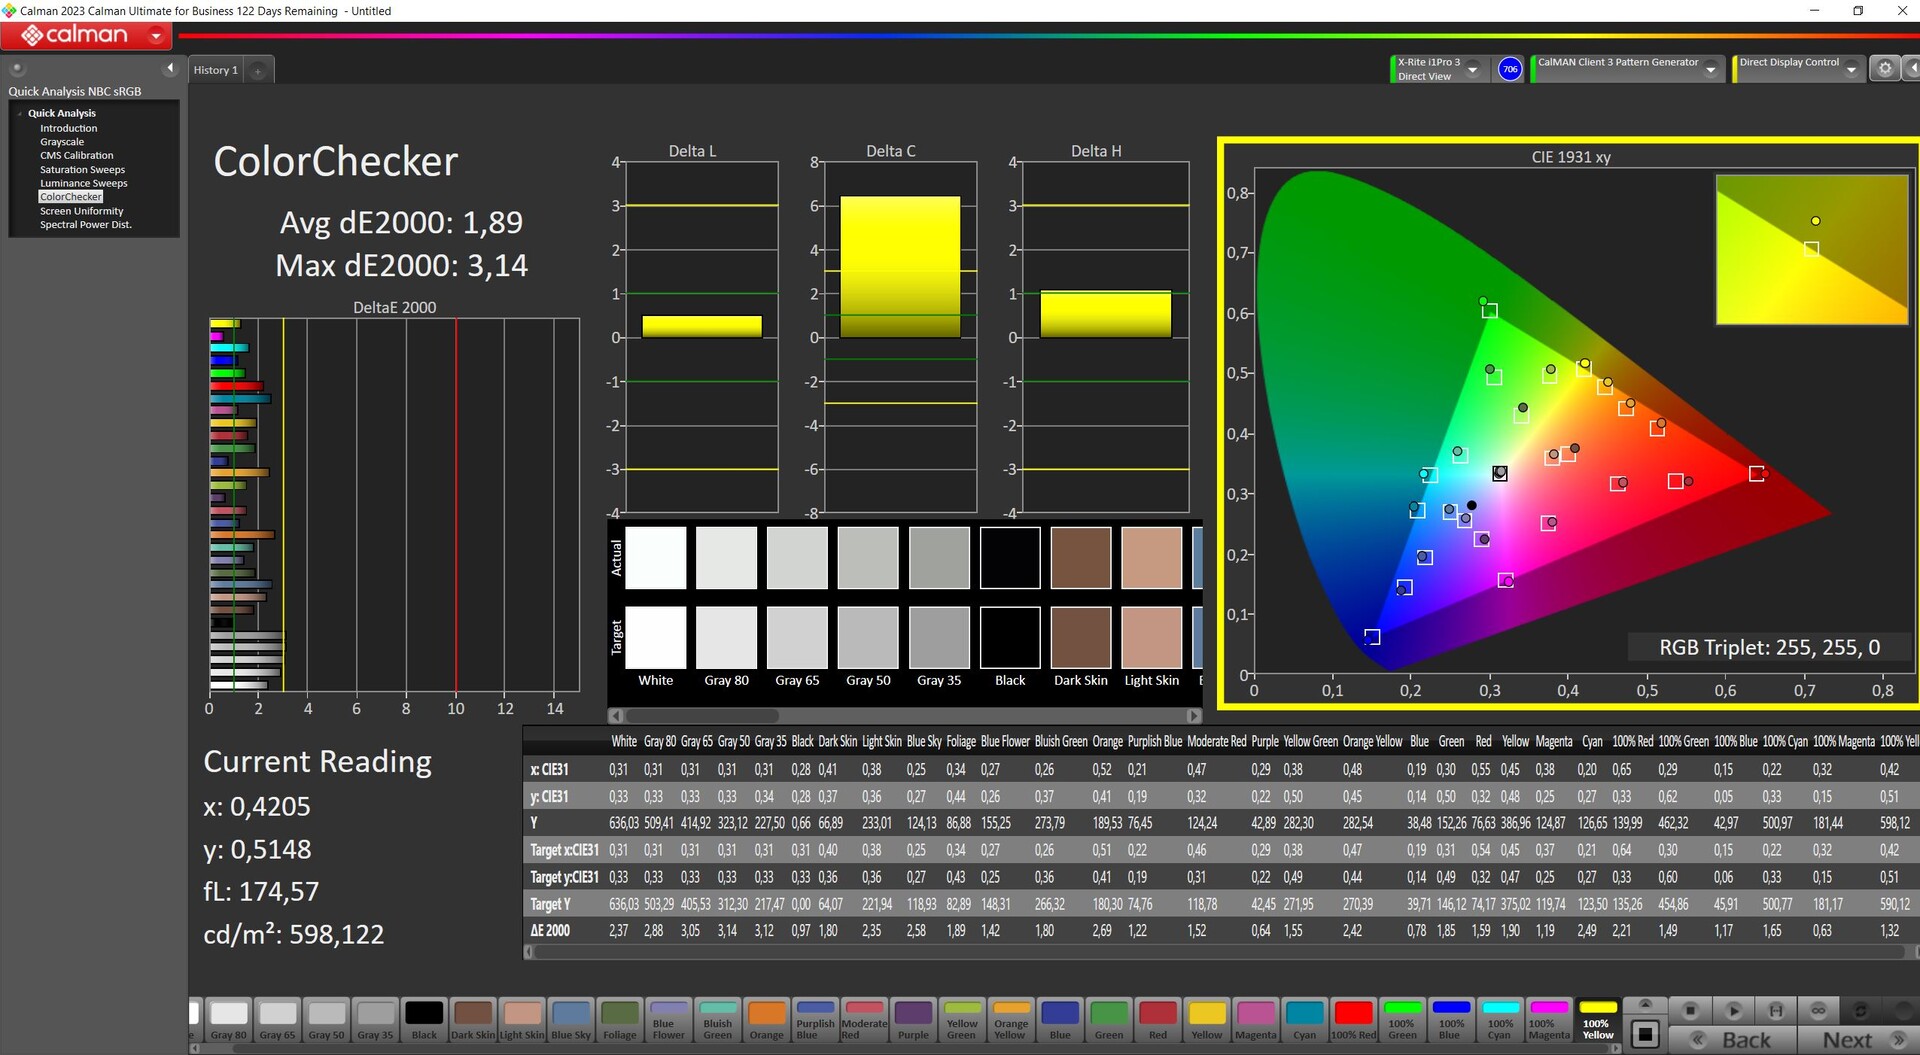
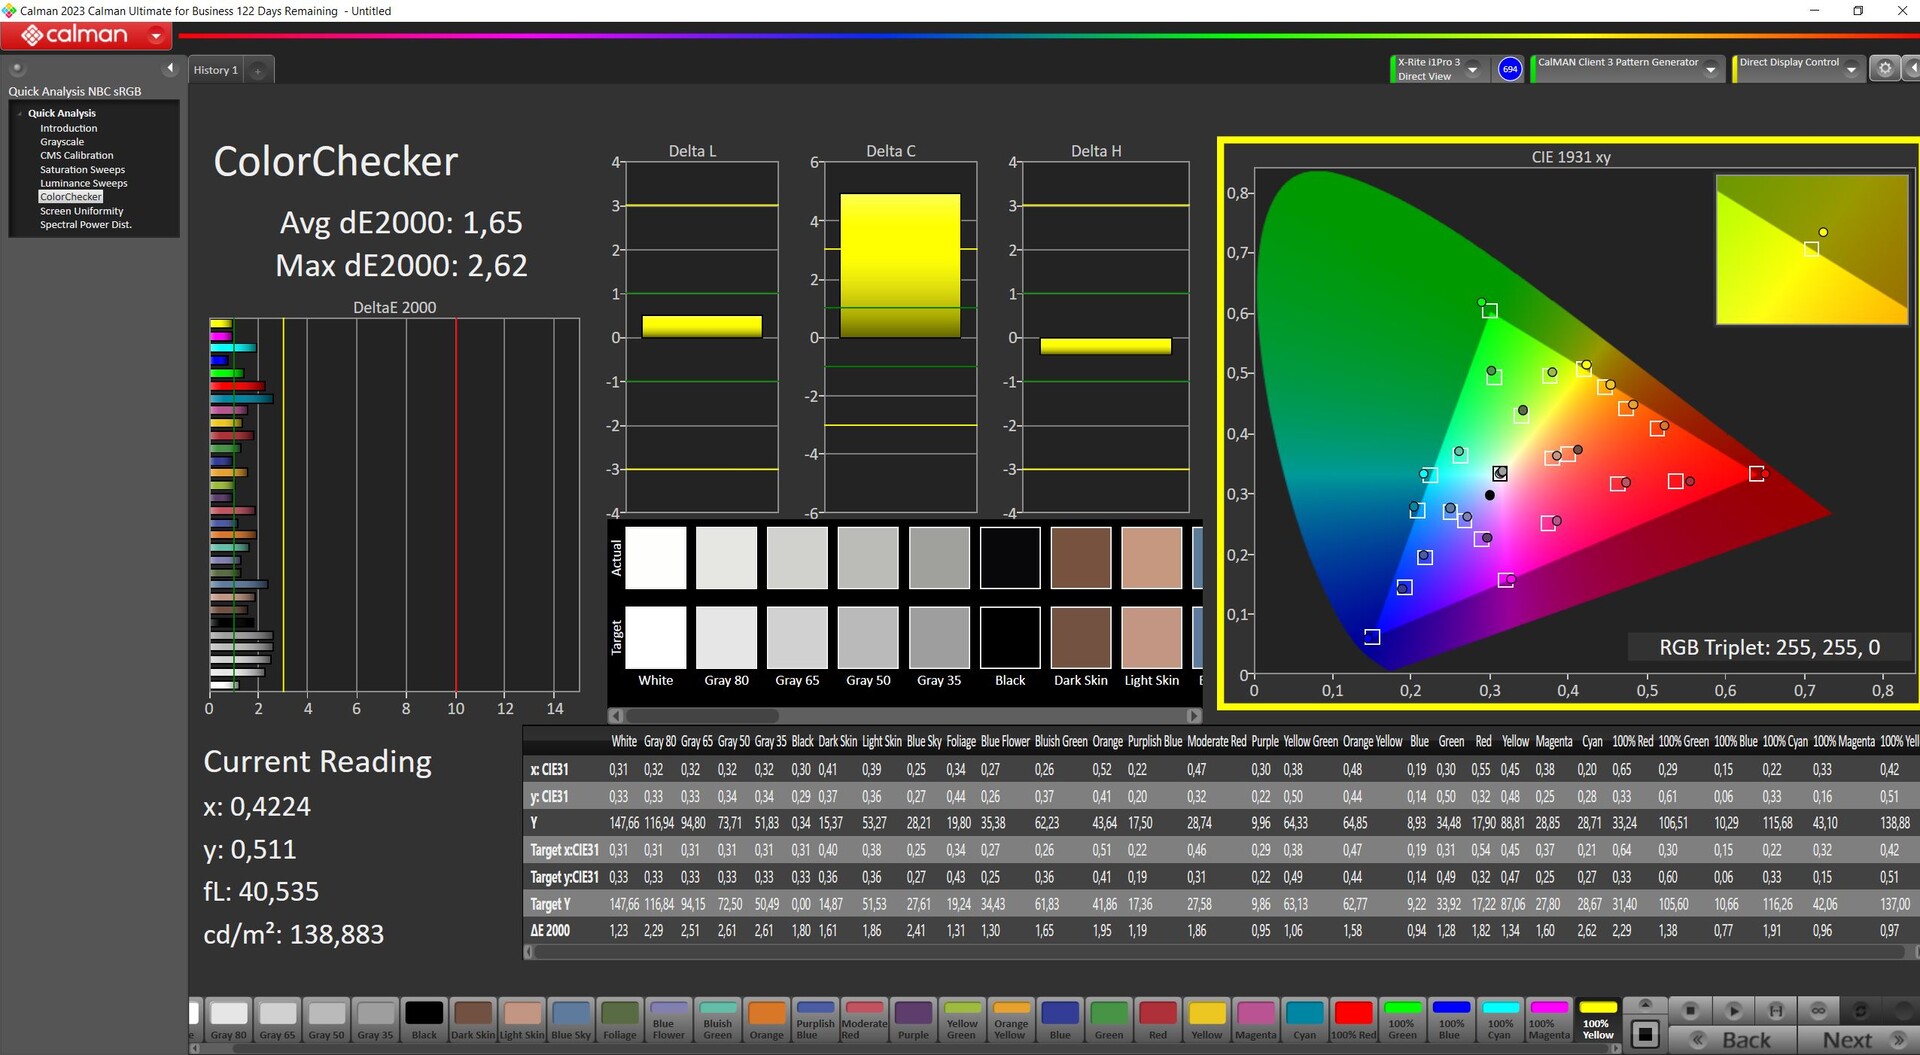
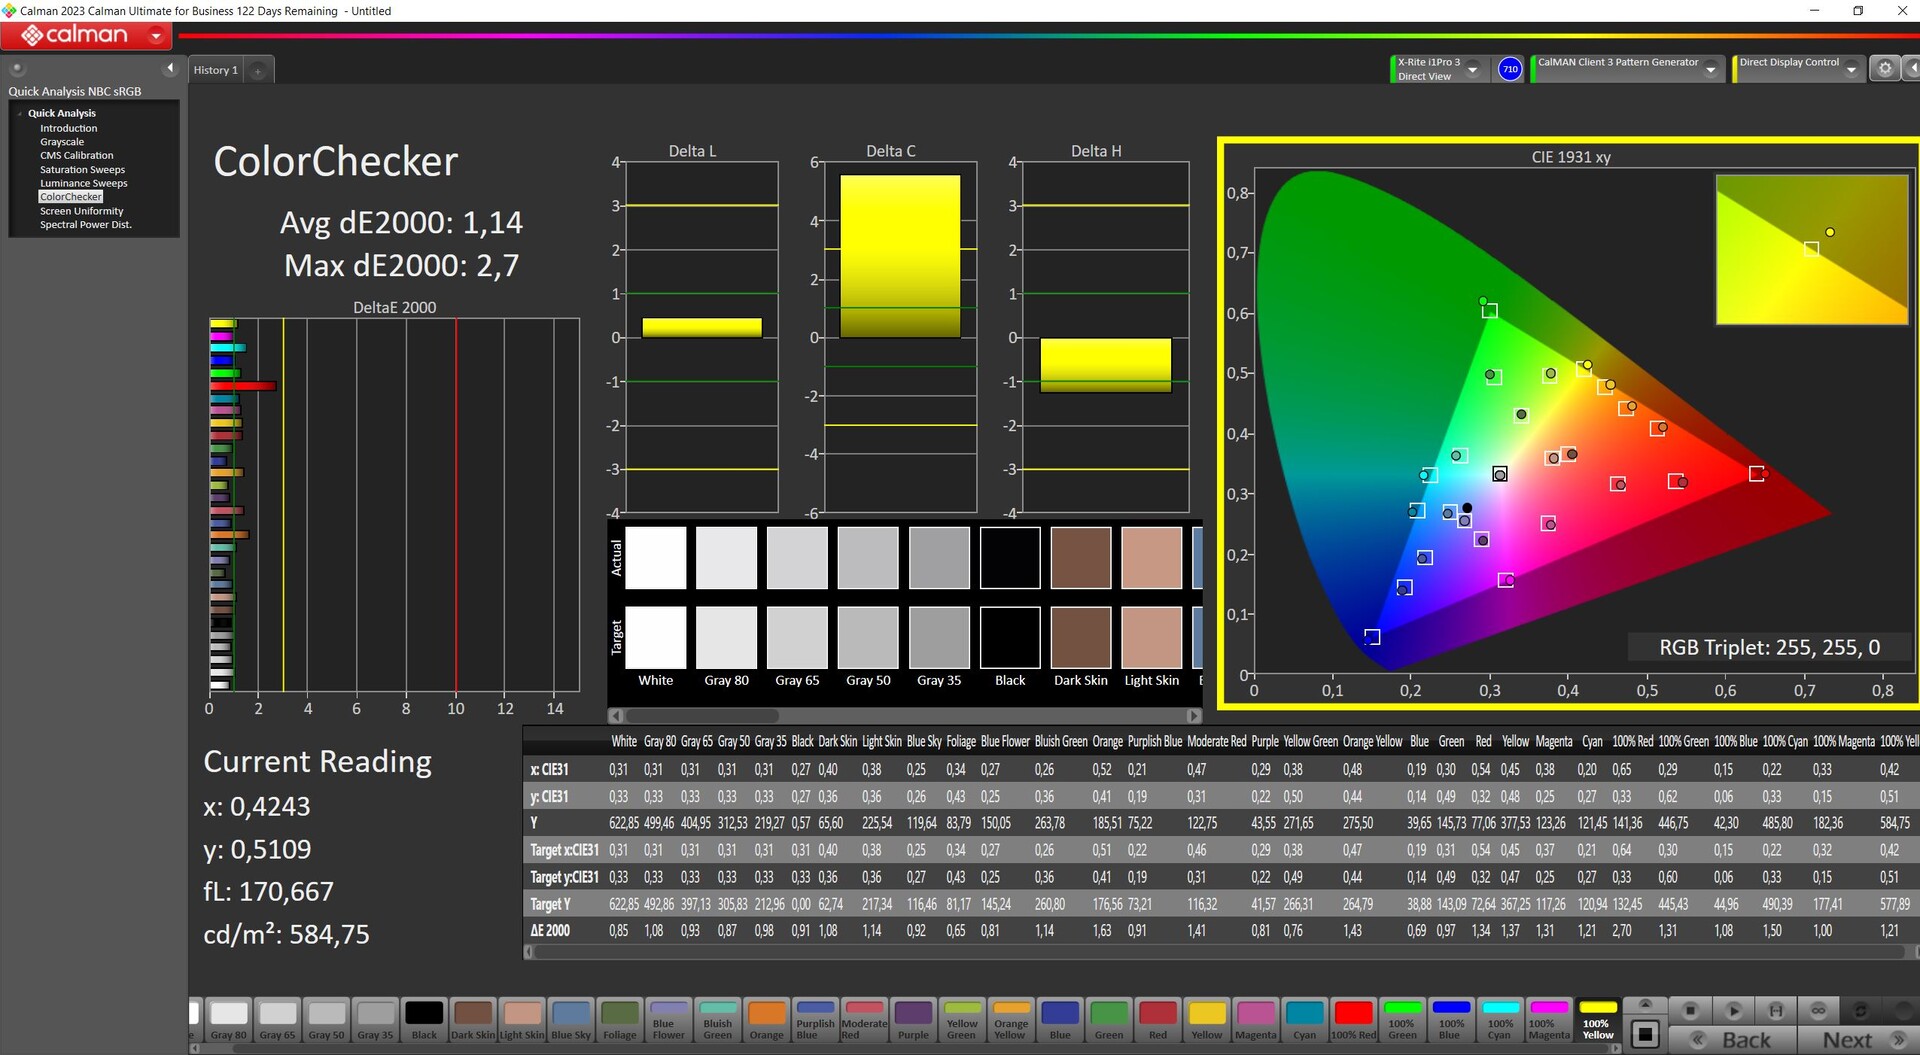
Renk doğruluğu
Kutudan çıktığı haliyle panel, 3'ten düşük DeltaE değerleriyle iyi bir şekilde kalibre edilmiş. Bununla birlikte, siyah değeri oldukça yüksek. Parlaklığı 150 nit'e düşürmek sadece durumu iyileştirmekle kalmıyor, aynı zamanda DeltaE değerlerini de biraz aşağı çekiyor.
Doğal, maksimum parlaklıkta manuel kalibrasyon, zaten iyi olan değerlere rağmen harikalar yaratıyor ve sapmaları belirgin şekilde en aza indirmeyi başarıyor. Bu nedenle panel çok iyi kalibre edilebiliyor ve bu da en azından sRGB'de çok iyi renk doğruluğu sağlıyor. Maksimum parlaklıkta, siyah değeri çok yüksek olmaya devam ediyor ve bu da kontrastın zarar görmesine neden oluyor.

Yanıt Sürelerini Görüntüle
| ↔ Tepki Süresi Siyahtan Beyaza | ||
|---|---|---|
| 9.2 ms ... yükseliş ↗ ve sonbahar↘ birleşimi | ↗ 4.6 ms yükseliş | 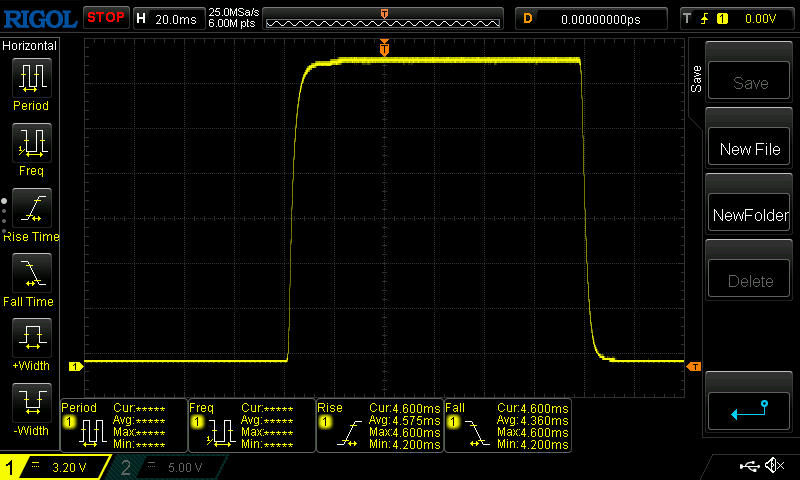 |
| ↘ 4.6 ms sonbahar | ||
| Ekran, testlerimizde hızlı yanıt oranları gösteriyor ve oyun oynamaya uygun olmalı. Karşılaştırıldığında, test edilen tüm cihazlar 0.1 (minimum) ile 240 (maksimum) ms arasında değişir. » Tüm cihazların 23 %'si daha iyi. Bu, ölçülen yanıt süresinin test edilen tüm cihazların ortalamasından (20.8 ms) daha iyi olduğu anlamına gelir. | ||
| ↔ Tepki Süresi %50 Griden %80 Griye | ||
| 9.6 ms ... yükseliş ↗ ve sonbahar↘ birleşimi | ↗ 4.6 ms yükseliş | 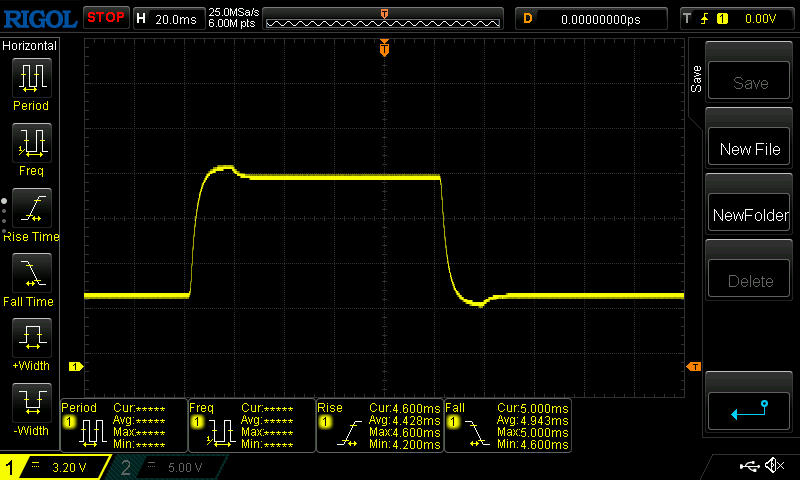 |
| ↘ 5 ms sonbahar | ||
| Ekran, testlerimizde hızlı yanıt oranları gösteriyor ve oyun oynamaya uygun olmalı. Karşılaştırıldığında, test edilen tüm cihazlar 0.165 (minimum) ile 636 (maksimum) ms arasında değişir. » Tüm cihazların 20 %'si daha iyi. Bu, ölçülen yanıt süresinin test edilen tüm cihazların ortalamasından (32.5 ms) daha iyi olduğu anlamına gelir. | ||
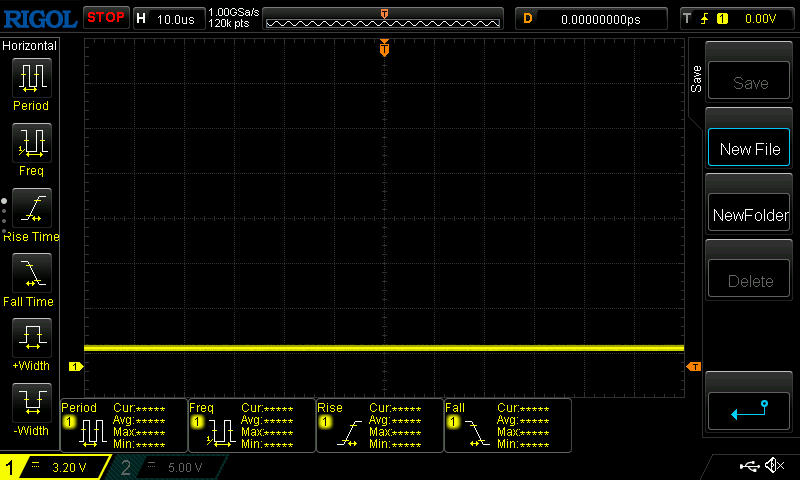
Ekran Titremesi / PWM (Darbe Genişliği Modülasyonu)
| Ekran titriyor / PWM algılanmadı | 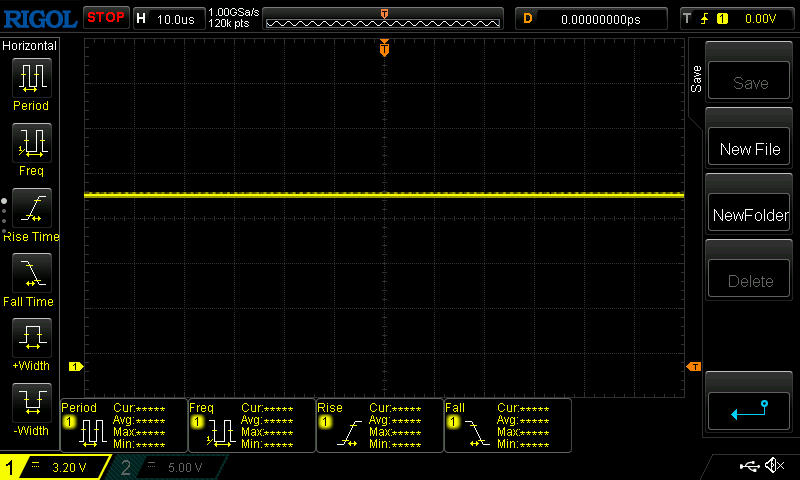 | ||
Karşılaştırıldığında: Test edilen tüm cihazların %53 %'si ekranı karartmak için PWM kullanmıyor. PWM tespit edilirse, ortalama 8516 (minimum: 5 - maksimum: 343500) Hz ölçüldü. | |||

Yüksek parlaklık ve mat ekran, cihazı gölgede kullanırken çok fazla sorun yaşamamanızı ve içeriğin yüksek oranda okunabilir kalmasını sağlar. Bununla birlikte, kontrast biraz daha yüksek olabilir ve doğrudan güneş ışığından kaçınmalısınız.

Performans - HX ve RTX 4070'li Fusion'dan %20 daha yavaş
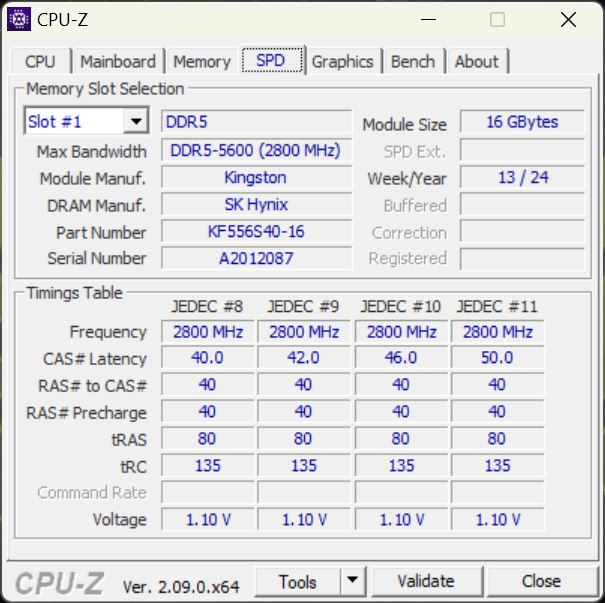
Ile Ryzen 7 8845HS, RTX 4060 ve 32 GB RAM ile XMG Core 15 kendisini orta seviye bir oyun dizüstü bilgisayarı olarak konumlandırıyor ve bu şekilde pazarlanıyor. Siyah, nispeten ince, şık ve tamamen alüminyum kasası, dizüstü bilgisayara içerik oluşturucular için de ilgi çekici olabilecek abartısız bir görünüm kazandırıyor. Bu da Schenker'in herhangi bir ek ekran seçeneği sunmamasını daha da üzücü kılıyor çünkü iyi kalibre edilmiş ekran "sadece" sRGB görüntüleyebiliyor. Bu, fotoğraf ve özellikle video editörleri için gereksiz bir anlaşma bozucu kriter olabilir. Bu nedenle gelecekte DisplayP3 seçeneklerini de görmek isteriz.
Test koşulları
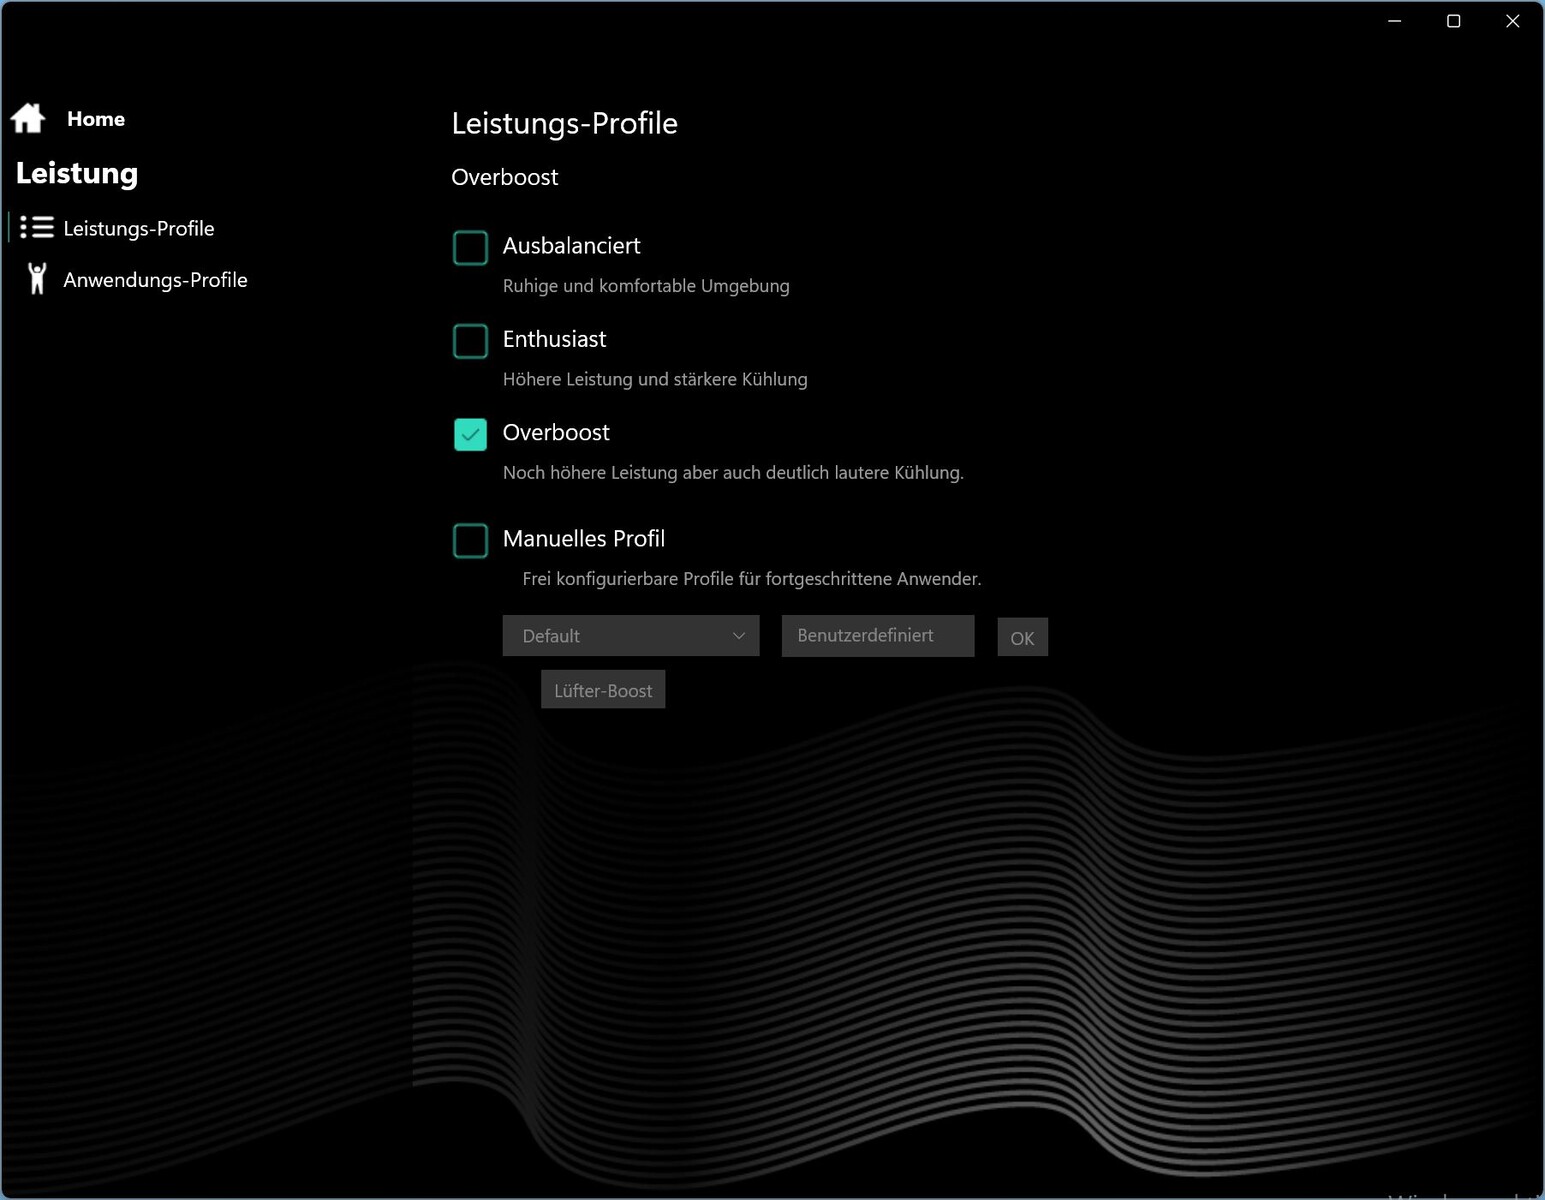
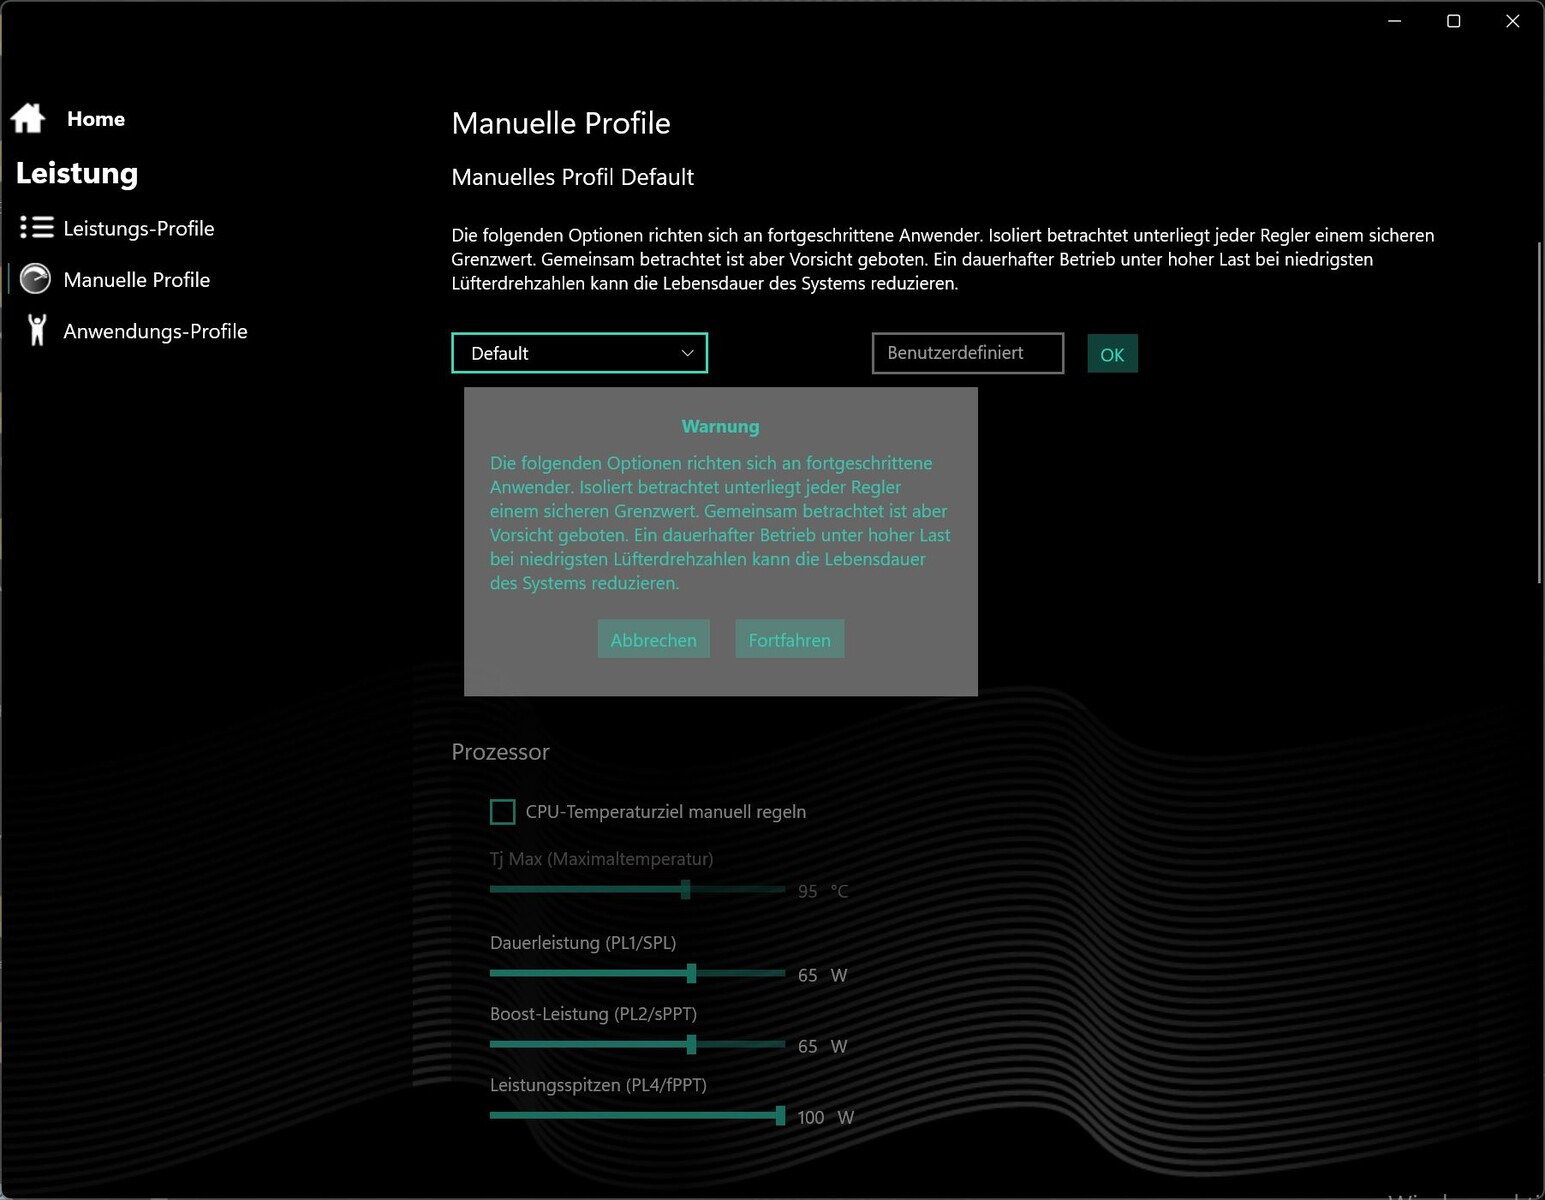
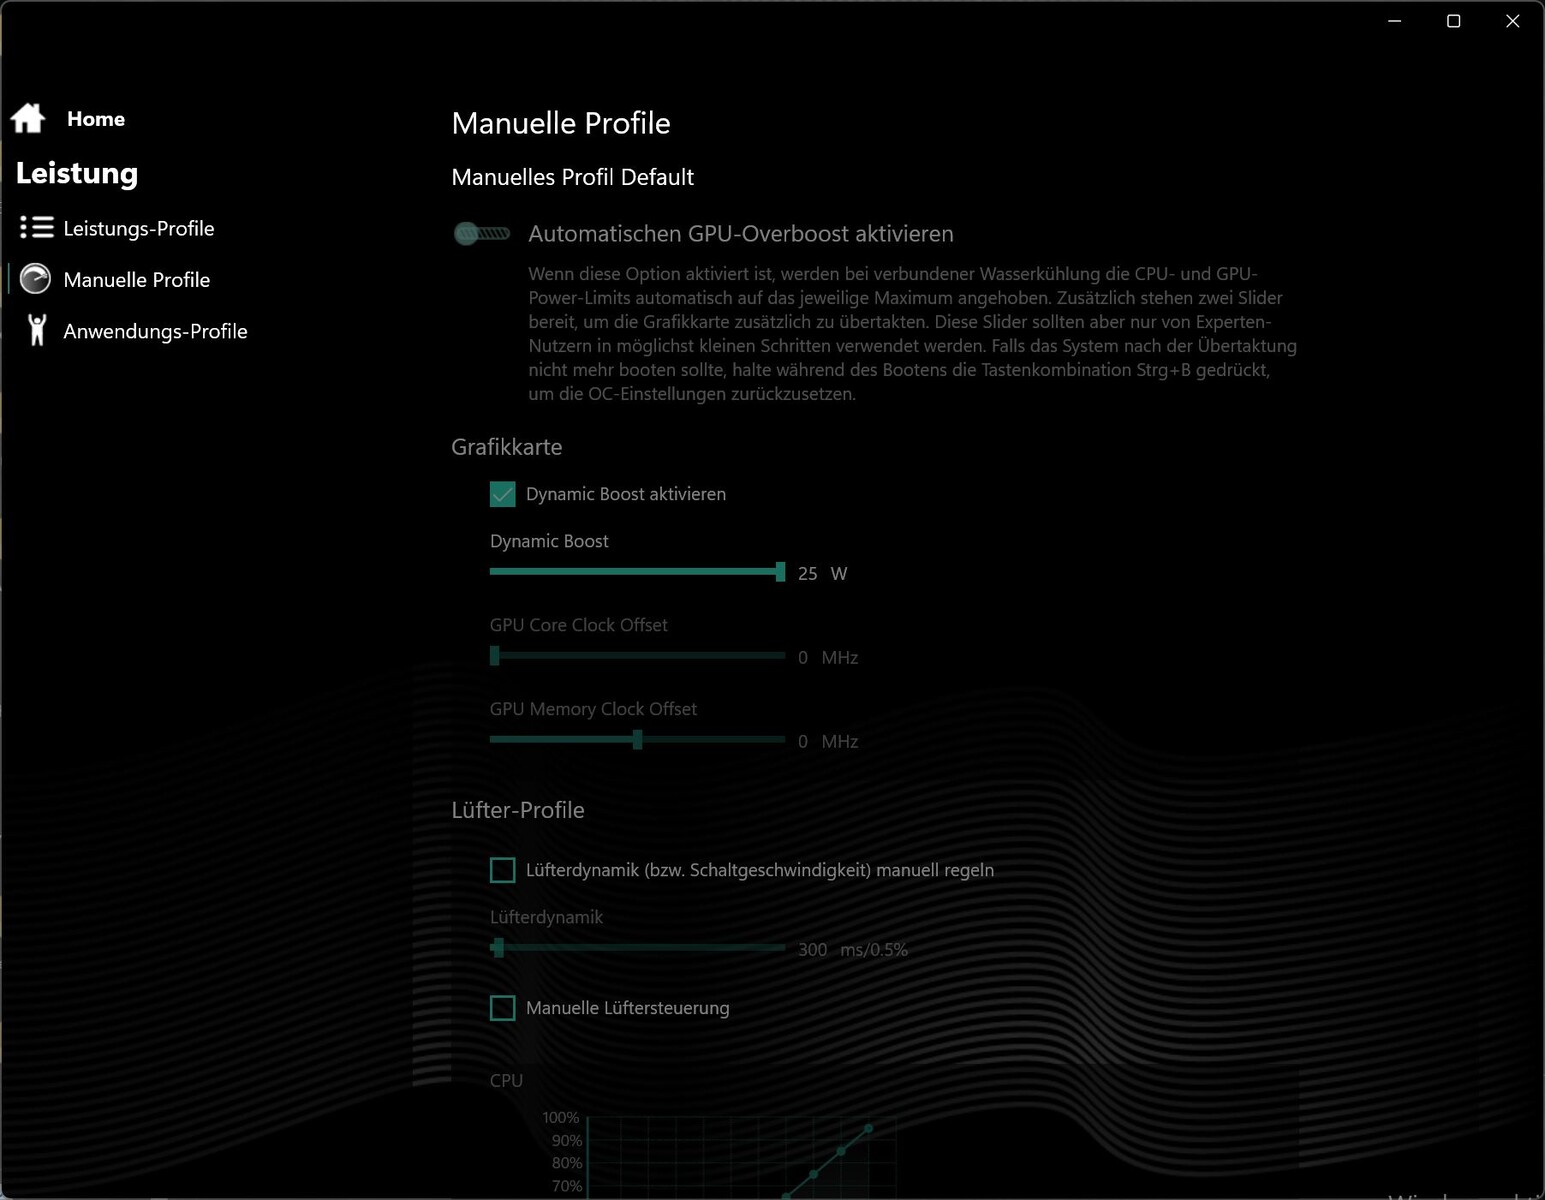
Genel Kontrol Merkezi'nde (Tulpar örneğin aynı CC'yi kullanır), 3 ön ayarlı performans profili (Balanced, Enthusiast, Overboost) ve bir manuel profil sunulmaktadır. İkincisinde, bir fan desteği etkinleştirilebilir ve CPU hedef sıcaklığı, fan eğrileri (ve daha fazlası) tanımlanabilir. MUX aracılığıyla genel ayarlar altında, GPU hibritten dGPU'ya değiştirilebilir, bu da daha sonra yeniden başlatma gerektirir.
Performans kıyaslamalarımız için Overboost modunu seçtik ve pil testinde Balanced'ı kullandık. Diğer modlara ilişkin performans değerlerini de sunuyoruz.
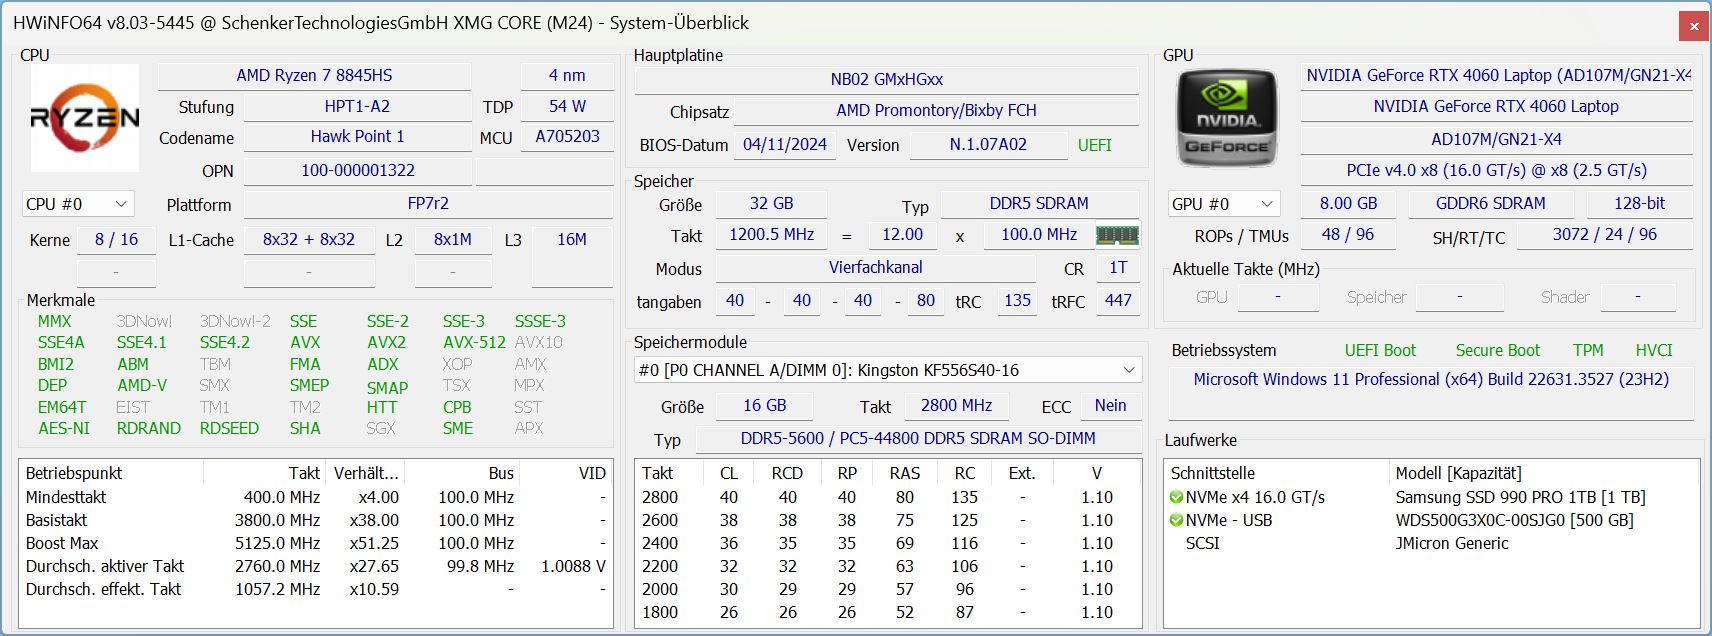
İşlemci
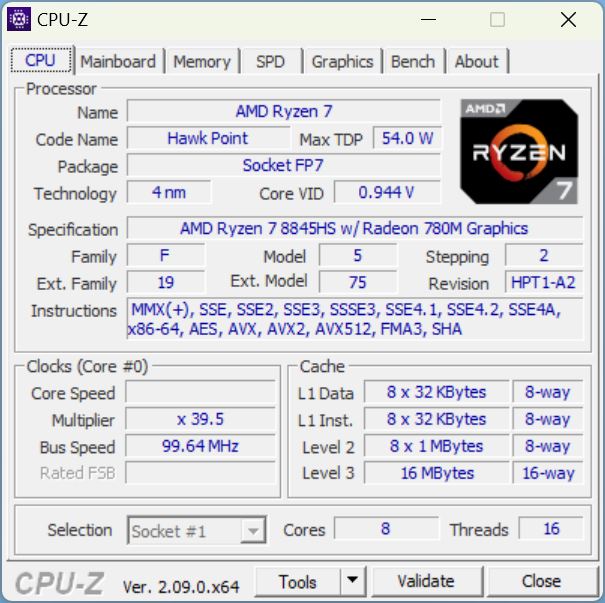
Tüm Core 15 SKU'ları aynı işlemciyle donatılmıştır. İşlemci AMD Ryzen 7 8845HS zen 4 mimarisine sahip Hawk Point serisindeki en hızlı ikinci CPU'dur. 8 çekirdeğe ve hyperthreading özelliğine sahiptir, bu da aynı anda 16 iş parçacığını işleyebileceği anlamına gelir. Çekirdeklerin temel saat hızı 3,8 GHz'dir ve ayrı ayrı 5,1 GHz'e kadar hız aşırtılabilir.
Cinebench R15 sürekli testinde, AMD Core 15'imiz çok tutarlı bir performans gösterdi ancak çoğunlukla Intel Gen14 HX CPU ile donatılmış dizüstü bilgisayarların biraz altında bir seviyede kaldı. Bu gerçekten şaşırtıcı değil çünkü AMD CPU sadece kısa süreliğine maksimum 90 W ve daha uzun bir süre boyunca 80 W çekiyor. Fusion 15'teki Intel CPU ile bu değerler 140 W ve 105 W. Sadece Dell G16, daha iyi bir başlangıç performansından sonra Core'da görülen Ryzen 7'nin tutarlı performans seviyesinin altına düşüyor.
Tüm CPU testlerinde Ryzen 7'miz tamamen hedefe ulaşıyor. Ancak ne yazık ki, Intel HX rakipleri biraz daha güçlü olduğu için Core'umuz yine son sırada yer alıyor. Bununla birlikte, Dell G16 veya HP Victus 16'nın arkasındaki fark gerçekten çok az. Legion 5i veya Intel destekli Fusion 15 önemli bir avantaja sahip.
Duvardan uzakta, Cinebench R15 çoklu çekirdek testinde yaklaşık yüzde 35'lik bir performans düşüşü var.
| Performans profili/ölçülen değer | İlk çalıştırmada Cinebench R15 puanı | W cinsinden CPU güç tüketimi |
|---|---|---|
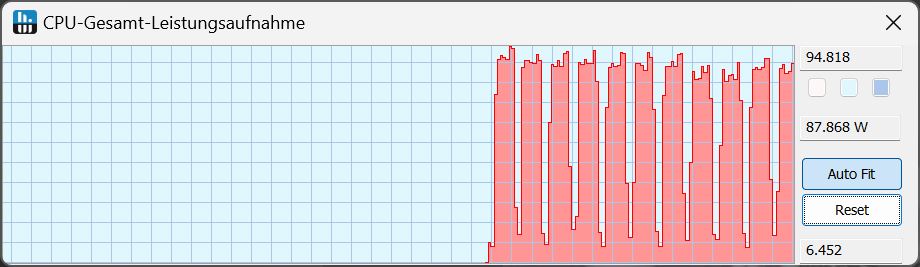
| Overboost | 2,908 | sürekli 80 - 94 |
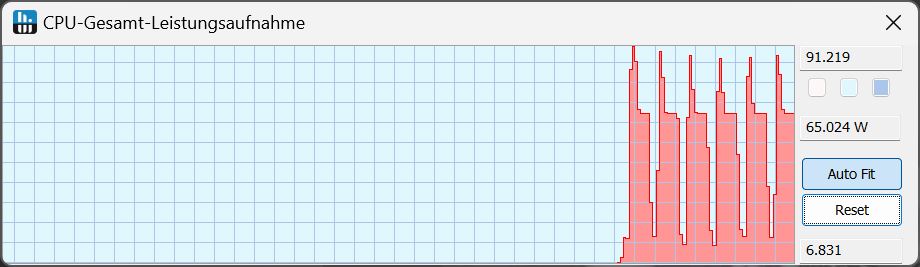
| Meraklısı | 2,749 | kısa 90, sonra 65 |
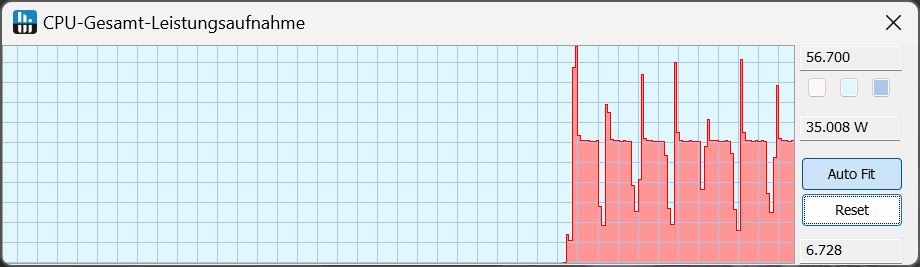
| Dengeli | 2,277 | kısa bir süre 59, sonra 35 |
| Batarya | 1,909 | kısa süreliğine 30, sonra 25 |
Cinebench R15 Multi Continuous Test
Cinebench R23: Multi Core | Single Core
Cinebench R20: CPU (Multi Core) | CPU (Single Core)
Cinebench R15: CPU Multi 64Bit | CPU Single 64Bit
Blender: v2.79 BMW27 CPU
7-Zip 18.03: 7z b 4 | 7z b 4 -mmt1
Geekbench 6.4: Multi-Core | Single-Core
Geekbench 5.5: Multi-Core | Single-Core
HWBOT x265 Benchmark v2.2: 4k Preset
LibreOffice : 20 Documents To PDF
R Benchmark 2.5: Overall mean
| CPU Performance Rating | |
| SCHENKER XMG Fusion 15 (Early 24) | |
| Lenovo Legion 5 16IRX G9 | |
| SCHENKER XMG Pro 15 (E23) -2! | |
| Sınıf ortalaması Gaming | |
| HP Victus 16 (2024) | |
| Dell G16, i7-13650HX, RTX 4060 | |
| SCHENKER XMG Core 15 (M24) | |
| Ortalama AMD Ryzen 7 8845HS | |
| Cinebench R23 / Multi Core | |
| SCHENKER XMG Pro 15 (E23) | |
| Lenovo Legion 5 16IRX G9 | |
| HP Victus 16 (2024) | |
| SCHENKER XMG Fusion 15 (Early 24) | |
| Sınıf ortalaması Gaming (5668 - 39652, n=151, son 2 yıl) | |
| Dell G16, i7-13650HX, RTX 4060 | |
| SCHENKER XMG Core 15 (M24) | |
| Ortalama AMD Ryzen 7 8845HS (14895 - 18037, n=12) | |
| Cinebench R23 / Single Core | |
| SCHENKER XMG Fusion 15 (Early 24) | |
| Lenovo Legion 5 16IRX G9 | |
| Dell G16, i7-13650HX, RTX 4060 | |
| Sınıf ortalaması Gaming (1136 - 2252, n=151, son 2 yıl) | |
| SCHENKER XMG Pro 15 (E23) | |
| SCHENKER XMG Core 15 (M24) | |
| Ortalama AMD Ryzen 7 8845HS (1623 - 1783, n=12) | |
| HP Victus 16 (2024) | |
| Cinebench R20 / CPU (Multi Core) | |
| Lenovo Legion 5 16IRX G9 | |
| SCHENKER XMG Pro 15 (E23) | |
| HP Victus 16 (2024) | |
| SCHENKER XMG Fusion 15 (Early 24) | |
| Sınıf ortalaması Gaming (2179 - 15517, n=151, son 2 yıl) | |
| Dell G16, i7-13650HX, RTX 4060 | |
| SCHENKER XMG Core 15 (M24) | |
| Ortalama AMD Ryzen 7 8845HS (5808 - 7026, n=12) | |
| Cinebench R20 / CPU (Single Core) | |
| SCHENKER XMG Fusion 15 (Early 24) | |
| Lenovo Legion 5 16IRX G9 | |
| Sınıf ortalaması Gaming (439 - 866, n=151, son 2 yıl) | |
| SCHENKER XMG Pro 15 (E23) | |
| Dell G16, i7-13650HX, RTX 4060 | |
| SCHENKER XMG Core 15 (M24) | |
| Ortalama AMD Ryzen 7 8845HS (673 - 698, n=12) | |
| HP Victus 16 (2024) | |
| Cinebench R15 / CPU Multi 64Bit | |
| SCHENKER XMG Pro 15 (E23) | |
| HP Victus 16 (2024) | |
| Lenovo Legion 5 16IRX G9 | |
| SCHENKER XMG Fusion 15 (Early 24) | |
| Sınıf ortalaması Gaming (905 - 6074, n=154, son 2 yıl) | |
| Dell G16, i7-13650HX, RTX 4060 | |
| SCHENKER XMG Core 15 (M24) | |
| Ortalama AMD Ryzen 7 8845HS (2342 - 2908, n=12) | |
| Cinebench R15 / CPU Single 64Bit | |
| Lenovo Legion 5 16IRX G9 | |
| SCHENKER XMG Fusion 15 (Early 24) | |
| SCHENKER XMG Core 15 (M24) | |
| Sınıf ortalaması Gaming (191.9 - 343, n=151, son 2 yıl) | |
| Ortalama AMD Ryzen 7 8845HS (269 - 283, n=12) | |
| Dell G16, i7-13650HX, RTX 4060 | |
| SCHENKER XMG Pro 15 (E23) | |
| HP Victus 16 (2024) | |
| Blender / v2.79 BMW27 CPU | |
| Ortalama AMD Ryzen 7 8845HS (179 - 216, n=12) | |
| SCHENKER XMG Core 15 (M24) | |
| Sınıf ortalaması Gaming (81 - 555, n=144, son 2 yıl) | |
| HP Victus 16 (2024) | |
| Dell G16, i7-13650HX, RTX 4060 | |
| SCHENKER XMG Pro 15 (E23) | |
| Lenovo Legion 5 16IRX G9 | |
| SCHENKER XMG Fusion 15 (Early 24) | |
| 7-Zip 18.03 / 7z b 4 | |
| SCHENKER XMG Fusion 15 (Early 24) | |
| Lenovo Legion 5 16IRX G9 | |
| SCHENKER XMG Pro 15 (E23) | |
| HP Victus 16 (2024) | |
| Sınıf ortalaması Gaming (23795 - 144064, n=149, son 2 yıl) | |
| Dell G16, i7-13650HX, RTX 4060 | |
| SCHENKER XMG Core 15 (M24) | |
| Ortalama AMD Ryzen 7 8845HS (62669 - 74664, n=12) | |
| 7-Zip 18.03 / 7z b 4 -mmt1 | |
| SCHENKER XMG Fusion 15 (Early 24) | |
| Lenovo Legion 5 16IRX G9 | |
| SCHENKER XMG Core 15 (M24) | |
| SCHENKER XMG Pro 15 (E23) | |
| Ortalama AMD Ryzen 7 8845HS (5197 - 6714, n=12) | |
| Sınıf ortalaması Gaming (4199 - 7573, n=149, son 2 yıl) | |
| Dell G16, i7-13650HX, RTX 4060 | |
| HP Victus 16 (2024) | |
| Geekbench 6.4 / Multi-Core | |
| SCHENKER XMG Fusion 15 (Early 24) | |
| Lenovo Legion 5 16IRX G9 | |
| HP Victus 16 (2024) | |
| Sınıf ortalaması Gaming (5340 - 21668, n=119, son 2 yıl) | |
| SCHENKER XMG Core 15 (M24) | |
| Dell G16, i7-13650HX, RTX 4060 | |
| Ortalama AMD Ryzen 7 8845HS (11073 - 14014, n=16) | |
| Geekbench 6.4 / Single-Core | |
| SCHENKER XMG Fusion 15 (Early 24) | |
| Lenovo Legion 5 16IRX G9 | |
| SCHENKER XMG Core 15 (M24) | |
| Sınıf ortalaması Gaming (1490 - 3219, n=119, son 2 yıl) | |
| Ortalama AMD Ryzen 7 8845HS (2510 - 2698, n=14) | |
| Dell G16, i7-13650HX, RTX 4060 | |
| HP Victus 16 (2024) | |
| Geekbench 5.5 / Multi-Core | |
| SCHENKER XMG Pro 15 (E23) | |
| SCHENKER XMG Fusion 15 (Early 24) | |
| Lenovo Legion 5 16IRX G9 | |
| HP Victus 16 (2024) | |
| Sınıf ortalaması Gaming (4557 - 25855, n=148, son 2 yıl) | |
| SCHENKER XMG Core 15 (M24) | |
| Dell G16, i7-13650HX, RTX 4060 | |
| Ortalama AMD Ryzen 7 8845HS (11256 - 12726, n=13) | |
| Geekbench 5.5 / Single-Core | |
| SCHENKER XMG Fusion 15 (Early 24) | |
| SCHENKER XMG Core 15 (M24) | |
| Lenovo Legion 5 16IRX G9 | |
| Ortalama AMD Ryzen 7 8845HS (1765 - 2004, n=13) | |
| Sınıf ortalaması Gaming (986 - 2423, n=148, son 2 yıl) | |
| Dell G16, i7-13650HX, RTX 4060 | |
| SCHENKER XMG Pro 15 (E23) | |
| HP Victus 16 (2024) | |
| HWBOT x265 Benchmark v2.2 / 4k Preset | |
| Lenovo Legion 5 16IRX G9 | |
| SCHENKER XMG Fusion 15 (Early 24) | |
| SCHENKER XMG Pro 15 (E23) | |
| Sınıf ortalaması Gaming (6.72 - 42.9, n=148, son 2 yıl) | |
| SCHENKER XMG Core 15 (M24) | |
| HP Victus 16 (2024) | |
| Dell G16, i7-13650HX, RTX 4060 | |
| Ortalama AMD Ryzen 7 8845HS (18.6 - 22.7, n=12) | |
| LibreOffice / 20 Documents To PDF | |
| HP Victus 16 (2024) | |
| Dell G16, i7-13650HX, RTX 4060 | |
| SCHENKER XMG Pro 15 (E23) | |
| Ortalama AMD Ryzen 7 8845HS (44.4 - 77, n=12) | |
| SCHENKER XMG Core 15 (M24) | |
| Sınıf ortalaması Gaming (19 - 96.6, n=147, son 2 yıl) | |
| Lenovo Legion 5 16IRX G9 | |
| SCHENKER XMG Fusion 15 (Early 24) | |
| R Benchmark 2.5 / Overall mean | |
| HP Victus 16 (2024) | |
| SCHENKER XMG Pro 15 (E23) | |
| Ortalama AMD Ryzen 7 8845HS (0.4304 - 0.4935, n=12) | |
| Sınıf ortalaması Gaming (0.3609 - 0.759, n=150, son 2 yıl) | |
| SCHENKER XMG Core 15 (M24) | |
| Dell G16, i7-13650HX, RTX 4060 | |
| Dell G16, i7-13650HX, RTX 4060 | |
| Lenovo Legion 5 16IRX G9 | |
| SCHENKER XMG Fusion 15 (Early 24) | |
* ... daha küçük daha iyidir
AIDA64: FP32 Ray-Trace | FPU Julia | CPU SHA3 | CPU Queen | FPU SinJulia | FPU Mandel | CPU AES | CPU ZLib | FP64 Ray-Trace | CPU PhotoWorxx
| Performance Rating | |
| SCHENKER XMG Fusion 15 (Early 24) | |
| SCHENKER XMG Core 15 (M24) | |
| Ortalama AMD Ryzen 7 8845HS | |
| Sınıf ortalaması Gaming | |
| SCHENKER XMG Pro 15 (E23) | |
| Lenovo Legion 5 16IRX G9 | |
| Dell G16, i7-13650HX, RTX 4060 | |
| HP Victus 16 (2024) | |
| AIDA64 / FP32 Ray-Trace | |
| SCHENKER XMG Core 15 (M24) | |
| Ortalama AMD Ryzen 7 8845HS (23708 - 29544, n=12) | |
| Sınıf ortalaması Gaming (4986 - 81639, n=147, son 2 yıl) | |
| SCHENKER XMG Fusion 15 (Early 24) | |
| Lenovo Legion 5 16IRX G9 | |
| Dell G16, i7-13650HX, RTX 4060 | |
| SCHENKER XMG Pro 15 (E23) | |
| HP Victus 16 (2024) | |
| AIDA64 / FPU Julia | |
| SCHENKER XMG Core 15 (M24) | |
| Ortalama AMD Ryzen 7 8845HS (99659 - 125873, n=12) | |
| Sınıf ortalaması Gaming (25360 - 252486, n=147, son 2 yıl) | |
| SCHENKER XMG Fusion 15 (Early 24) | |
| SCHENKER XMG Pro 15 (E23) | |
| Lenovo Legion 5 16IRX G9 | |
| Dell G16, i7-13650HX, RTX 4060 | |
| HP Victus 16 (2024) | |
| AIDA64 / CPU SHA3 | |
| SCHENKER XMG Fusion 15 (Early 24) | |
| SCHENKER XMG Core 15 (M24) | |
| Sınıf ortalaması Gaming (1339 - 10389, n=147, son 2 yıl) | |
| SCHENKER XMG Pro 15 (E23) | |
| Ortalama AMD Ryzen 7 8845HS (4332 - 5180, n=12) | |
| Dell G16, i7-13650HX, RTX 4060 | |
| Lenovo Legion 5 16IRX G9 | |
| HP Victus 16 (2024) | |
| AIDA64 / CPU Queen | |
| SCHENKER XMG Pro 15 (E23) | |
| SCHENKER XMG Fusion 15 (Early 24) | |
| HP Victus 16 (2024) | |
| SCHENKER XMG Core 15 (M24) | |
| Ortalama AMD Ryzen 7 8845HS (109458 - 124695, n=12) | |
| Sınıf ortalaması Gaming (50699 - 200651, n=147, son 2 yıl) | |
| Dell G16, i7-13650HX, RTX 4060 | |
| Lenovo Legion 5 16IRX G9 | |
| AIDA64 / FPU SinJulia | |
| SCHENKER XMG Core 15 (M24) | |
| Ortalama AMD Ryzen 7 8845HS (14062 - 15519, n=12) | |
| SCHENKER XMG Fusion 15 (Early 24) | |
| Sınıf ortalaması Gaming (4800 - 32988, n=147, son 2 yıl) | |
| SCHENKER XMG Pro 15 (E23) | |
| Lenovo Legion 5 16IRX G9 | |
| HP Victus 16 (2024) | |
| Dell G16, i7-13650HX, RTX 4060 | |
| AIDA64 / FPU Mandel | |
| SCHENKER XMG Core 15 (M24) | |
| Ortalama AMD Ryzen 7 8845HS (53436 - 67367, n=12) | |
| Sınıf ortalaması Gaming (12321 - 134044, n=147, son 2 yıl) | |
| SCHENKER XMG Fusion 15 (Early 24) | |
| Lenovo Legion 5 16IRX G9 | |
| Dell G16, i7-13650HX, RTX 4060 | |
| SCHENKER XMG Pro 15 (E23) | |
| HP Victus 16 (2024) | |
| AIDA64 / CPU AES | |
| SCHENKER XMG Fusion 15 (Early 24) | |
| Sınıf ortalaması Gaming (19065 - 328679, n=147, son 2 yıl) | |
| Ortalama AMD Ryzen 7 8845HS (64515 - 172642, n=12) | |
| SCHENKER XMG Pro 15 (E23) | |
| SCHENKER XMG Core 15 (M24) | |
| Lenovo Legion 5 16IRX G9 | |
| Dell G16, i7-13650HX, RTX 4060 | |
| HP Victus 16 (2024) | |
| AIDA64 / CPU ZLib | |
| SCHENKER XMG Fusion 15 (Early 24) | |
| SCHENKER XMG Pro 15 (E23) | |
| Sınıf ortalaması Gaming (373 - 2531, n=147, son 2 yıl) | |
| Lenovo Legion 5 16IRX G9 | |
| Dell G16, i7-13650HX, RTX 4060 | |
| HP Victus 16 (2024) | |
| Ortalama AMD Ryzen 7 8845HS (627 - 1080, n=12) | |
| SCHENKER XMG Core 15 (M24) | |
| AIDA64 / FP64 Ray-Trace | |
| SCHENKER XMG Core 15 (M24) | |
| Ortalama AMD Ryzen 7 8845HS (12361 - 15911, n=12) | |
| Sınıf ortalaması Gaming (2540 - 43430, n=147, son 2 yıl) | |
| SCHENKER XMG Fusion 15 (Early 24) | |
| Dell G16, i7-13650HX, RTX 4060 | |
| Lenovo Legion 5 16IRX G9 | |
| SCHENKER XMG Pro 15 (E23) | |
| HP Victus 16 (2024) | |
| AIDA64 / CPU PhotoWorxx | |
| SCHENKER XMG Pro 15 (E23) | |
| SCHENKER XMG Fusion 15 (Early 24) | |
| SCHENKER XMG Core 15 (M24) | |
| Sınıf ortalaması Gaming (10805 - 60161, n=147, son 2 yıl) | |
| HP Victus 16 (2024) | |
| Ortalama AMD Ryzen 7 8845HS (33192 - 41668, n=12) | |
| Dell G16, i7-13650HX, RTX 4060 | |
| Lenovo Legion 5 16IRX G9 | |
Sistem performansı
İnceleme sistemimiz saf CPU skoru açısından biraz geride kalsa da, PCMark 10'da HX rekabetinde liderdir. Temel konular söz konusu olduğunda, skor orta sıralarda yer alıyor, ancak üretkenlik açısından öne çıkıyor ve içerik oluşturma alanında ön sıralarda yer alıyor.
CrossMark'ta Dell G16 biraz daha kötü, diğer rakipler ise AMD Core 15'in biraz önünde.
CrossMark: Overall | Productivity | Creativity | Responsiveness
WebXPRT 3: Overall
WebXPRT 4: Overall
Mozilla Kraken 1.1: Total
| PCMark 10 / Score | |
| SCHENKER XMG Core 15 (M24) | |
| SCHENKER XMG Fusion 15 (Early 24) | |
| Ortalama AMD Ryzen 7 8845HS, NVIDIA GeForce RTX 4060 Laptop GPU (7538 - 8822, n=2) | |
| Sınıf ortalaması Gaming (5776 - 9852, n=133, son 2 yıl) | |
| Lenovo Legion 5 16IRX G9 | |
| HP Victus 16 (2024) | |
| SCHENKER XMG Pro 15 (E23) | |
| Dell G16, i7-13650HX, RTX 4060 | |
| PCMark 10 / Essentials | |
| SCHENKER XMG Fusion 15 (Early 24) | |
| SCHENKER XMG Pro 15 (E23) | |
| Lenovo Legion 5 16IRX G9 | |
| HP Victus 16 (2024) | |
| Sınıf ortalaması Gaming (9057 - 12600, n=133, son 2 yıl) | |
| SCHENKER XMG Core 15 (M24) | |
| Ortalama AMD Ryzen 7 8845HS, NVIDIA GeForce RTX 4060 Laptop GPU (9936 - 10061, n=2) | |
| Dell G16, i7-13650HX, RTX 4060 | |
| PCMark 10 / Productivity | |
| SCHENKER XMG Core 15 (M24) | |
| Ortalama AMD Ryzen 7 8845HS, NVIDIA GeForce RTX 4060 Laptop GPU (9789 - 14612, n=2) | |
| SCHENKER XMG Fusion 15 (Early 24) | |
| SCHENKER XMG Pro 15 (E23) | |
| Dell G16, i7-13650HX, RTX 4060 | |
| HP Victus 16 (2024) | |
| Sınıf ortalaması Gaming (6662 - 14612, n=133, son 2 yıl) | |
| Lenovo Legion 5 16IRX G9 | |
| PCMark 10 / Digital Content Creation | |
| SCHENKER XMG Fusion 15 (Early 24) | |
| SCHENKER XMG Core 15 (M24) | |
| Sınıf ortalaması Gaming (6807 - 18475, n=133, son 2 yıl) | |
| Ortalama AMD Ryzen 7 8845HS, NVIDIA GeForce RTX 4060 Laptop GPU (11953 - 12674, n=2) | |
| Lenovo Legion 5 16IRX G9 | |
| Dell G16, i7-13650HX, RTX 4060 | |
| HP Victus 16 (2024) | |
| SCHENKER XMG Pro 15 (E23) | |
| CrossMark / Overall | |
| SCHENKER XMG Fusion 15 (Early 24) | |
| Lenovo Legion 5 16IRX G9 | |
| SCHENKER XMG Pro 15 (E23) | |
| HP Victus 16 (2024) | |
| Sınıf ortalaması Gaming (1247 - 2344, n=114, son 2 yıl) | |
| SCHENKER XMG Core 15 (M24) | |
| Ortalama AMD Ryzen 7 8845HS, NVIDIA GeForce RTX 4060 Laptop GPU (n=1) | |
| Dell G16, i7-13650HX, RTX 4060 | |
| CrossMark / Productivity | |
| SCHENKER XMG Fusion 15 (Early 24) | |
| Lenovo Legion 5 16IRX G9 | |
| SCHENKER XMG Pro 15 (E23) | |
| Sınıf ortalaması Gaming (1299 - 2204, n=114, son 2 yıl) | |
| SCHENKER XMG Core 15 (M24) | |
| Ortalama AMD Ryzen 7 8845HS, NVIDIA GeForce RTX 4060 Laptop GPU (n=1) | |
| HP Victus 16 (2024) | |
| Dell G16, i7-13650HX, RTX 4060 | |
| CrossMark / Creativity | |
| SCHENKER XMG Fusion 15 (Early 24) | |
| Lenovo Legion 5 16IRX G9 | |
| SCHENKER XMG Pro 15 (E23) | |
| HP Victus 16 (2024) | |
| SCHENKER XMG Core 15 (M24) | |
| Ortalama AMD Ryzen 7 8845HS, NVIDIA GeForce RTX 4060 Laptop GPU (n=1) | |
| Sınıf ortalaması Gaming (1275 - 2660, n=114, son 2 yıl) | |
| Dell G16, i7-13650HX, RTX 4060 | |
| CrossMark / Responsiveness | |
| SCHENKER XMG Fusion 15 (Early 24) | |
| Lenovo Legion 5 16IRX G9 | |
| HP Victus 16 (2024) | |
| SCHENKER XMG Pro 15 (E23) | |
| Sınıf ortalaması Gaming (1030 - 2330, n=114, son 2 yıl) | |
| Dell G16, i7-13650HX, RTX 4060 | |
| SCHENKER XMG Core 15 (M24) | |
| Ortalama AMD Ryzen 7 8845HS, NVIDIA GeForce RTX 4060 Laptop GPU (n=1) | |
| WebXPRT 3 / Overall | |
| SCHENKER XMG Fusion 15 (Early 24) | |
| SCHENKER XMG Pro 15 (E23) | |
| Lenovo Legion 5 16IRX G9 | |
| SCHENKER XMG Core 15 (M24) | |
| Ortalama AMD Ryzen 7 8845HS, NVIDIA GeForce RTX 4060 Laptop GPU (305 - 305, n=2) | |
| Sınıf ortalaması Gaming (215 - 480, n=127, son 2 yıl) | |
| HP Victus 16 (2024) | |
| Dell G16, i7-13650HX, RTX 4060 | |
| WebXPRT 4 / Overall | |
| SCHENKER XMG Fusion 15 (Early 24) | |
| Lenovo Legion 5 16IRX G9 | |
| SCHENKER XMG Pro 15 (E23) | |
| Sınıf ortalaması Gaming (176.4 - 335, n=115, son 2 yıl) | |
| SCHENKER XMG Core 15 (M24) | |
| HP Victus 16 (2024) | |
| Ortalama AMD Ryzen 7 8845HS, NVIDIA GeForce RTX 4060 Laptop GPU (176.4 - 264, n=2) | |
| Mozilla Kraken 1.1 / Total | |
| HP Victus 16 (2024) | |
| SCHENKER XMG Pro 15 (E23) | |
| Ortalama AMD Ryzen 7 8845HS, NVIDIA GeForce RTX 4060 Laptop GPU (496 - 523, n=2) | |
| Dell G16, i7-13650HX, RTX 4060 | |
| Sınıf ortalaması Gaming (409 - 674, n=139, son 2 yıl) | |
| SCHENKER XMG Core 15 (M24) | |
| Lenovo Legion 5 16IRX G9 | |
| SCHENKER XMG Fusion 15 (Early 24) | |
* ... daha küçük daha iyidir
| PCMark 10 Score | 8822 puan | |
Yardım | ||
| AIDA64 / Memory Copy | |
| SCHENKER XMG Fusion 15 (Early 24) | |
| SCHENKER XMG Pro 15 (E23) | |
| SCHENKER XMG Core 15 (M24) | |
| Ortalama AMD Ryzen 7 8845HS (61459 - 71873, n=12) | |
| HP Victus 16 (2024) | |
| Sınıf ortalaması Gaming (21750 - 97515, n=147, son 2 yıl) | |
| Lenovo Legion 5 16IRX G9 | |
| Dell G16, i7-13650HX, RTX 4060 | |
| AIDA64 / Memory Read | |
| SCHENKER XMG Fusion 15 (Early 24) | |
| SCHENKER XMG Pro 15 (E23) | |
| HP Victus 16 (2024) | |
| Lenovo Legion 5 16IRX G9 | |
| Sınıf ortalaması Gaming (22956 - 102937, n=147, son 2 yıl) | |
| Dell G16, i7-13650HX, RTX 4060 | |
| SCHENKER XMG Core 15 (M24) | |
| Ortalama AMD Ryzen 7 8845HS (49866 - 61976, n=12) | |
| AIDA64 / Memory Write | |
| SCHENKER XMG Core 15 (M24) | |
| Ortalama AMD Ryzen 7 8845HS (68425 - 93239, n=12) | |
| SCHENKER XMG Pro 15 (E23) | |
| SCHENKER XMG Fusion 15 (Early 24) | |
| Sınıf ortalaması Gaming (22297 - 108954, n=147, son 2 yıl) | |
| HP Victus 16 (2024) | |
| Dell G16, i7-13650HX, RTX 4060 | |
| Lenovo Legion 5 16IRX G9 | |
| AIDA64 / Memory Latency | |
| Ortalama AMD Ryzen 7 8845HS (82.5 - 117, n=12) | |
| HP Victus 16 (2024) | |
| Sınıf ortalaması Gaming (59.5 - 259, n=147, son 2 yıl) | |
| Dell G16, i7-13650HX, RTX 4060 | |
| Lenovo Legion 5 16IRX G9 | |
| SCHENKER XMG Core 15 (M24) | |
| SCHENKER XMG Pro 15 (E23) | |
| SCHENKER XMG Fusion 15 (Early 24) | |
* ... daha küçük daha iyidir
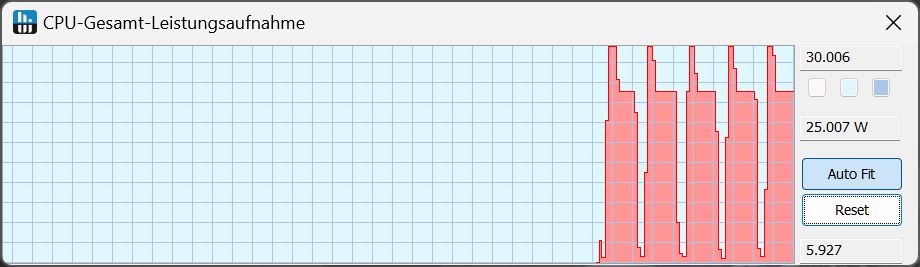
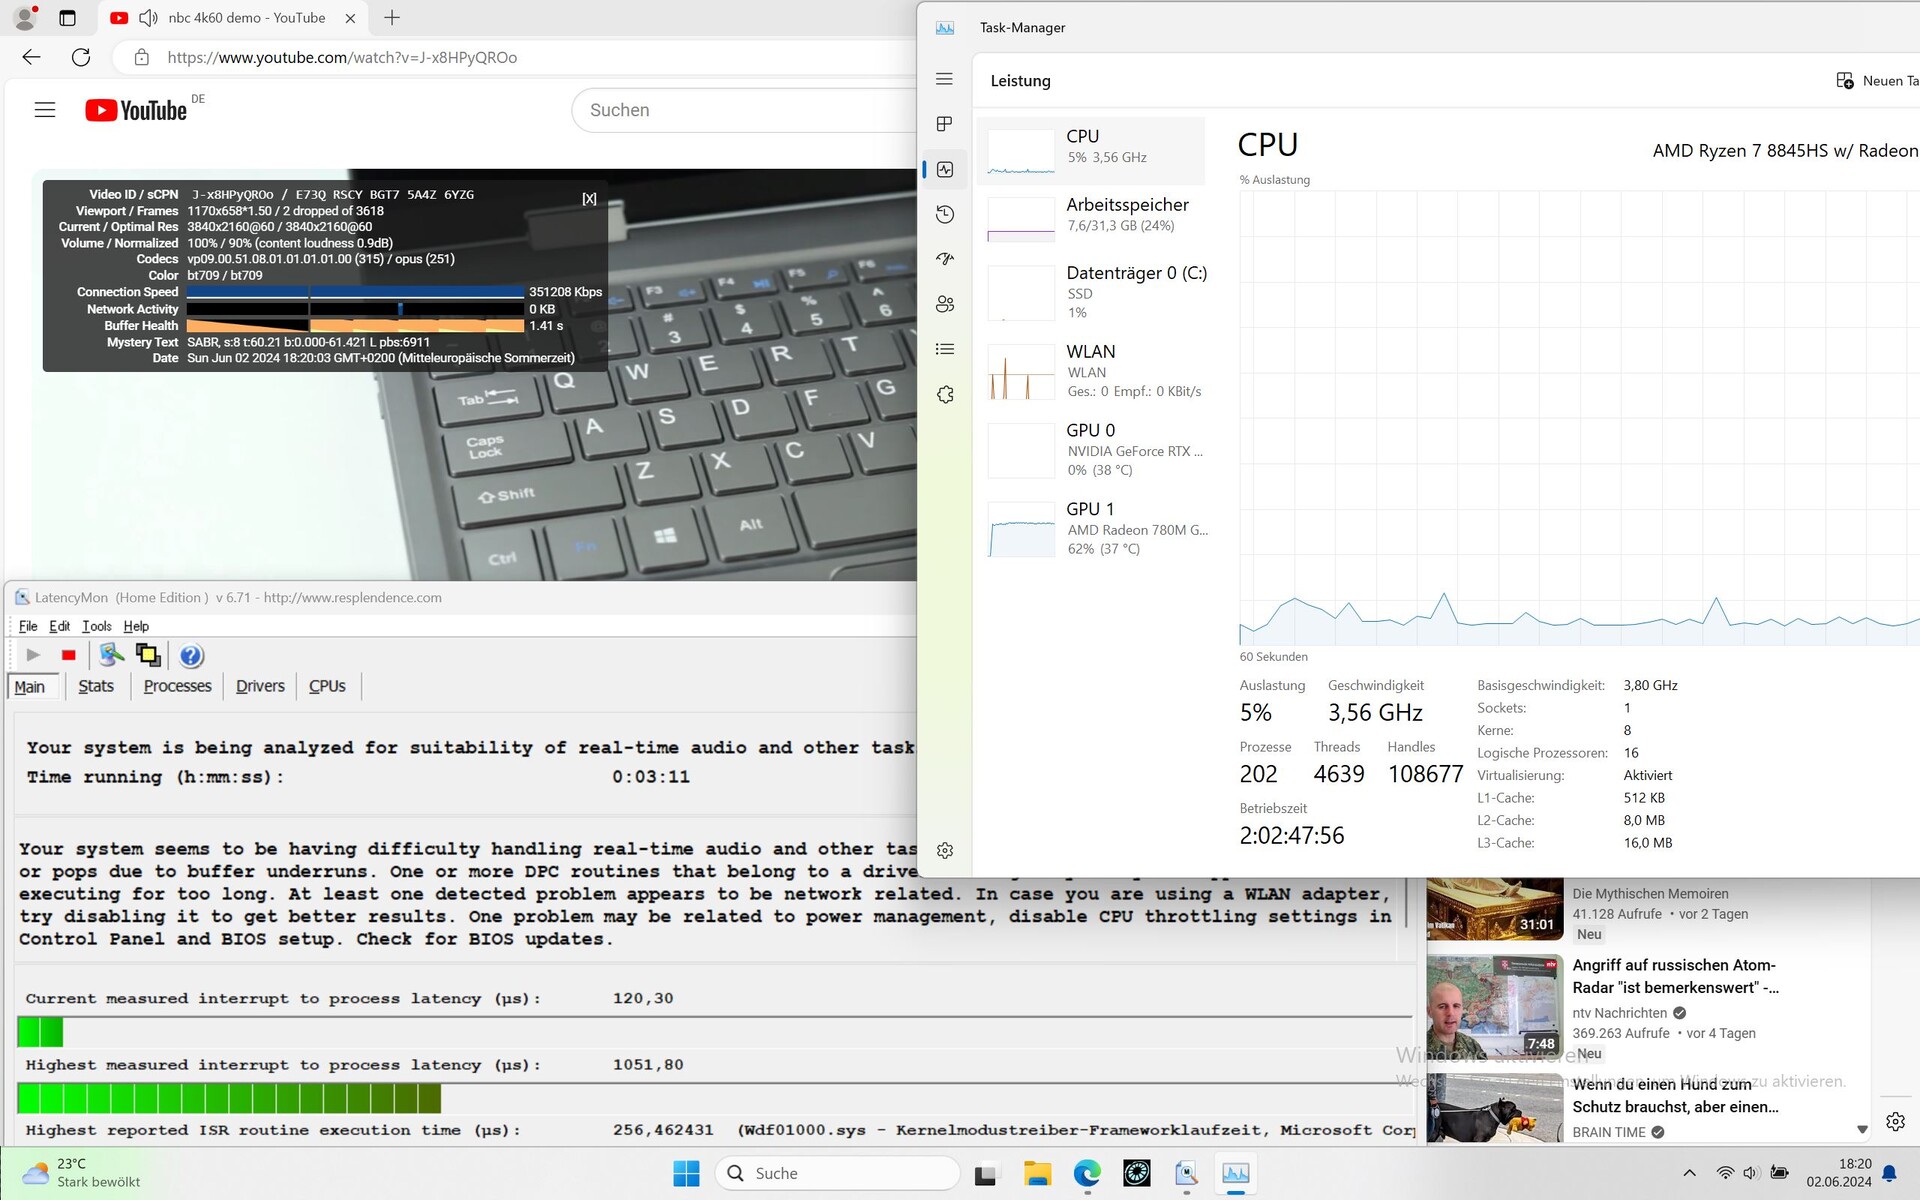
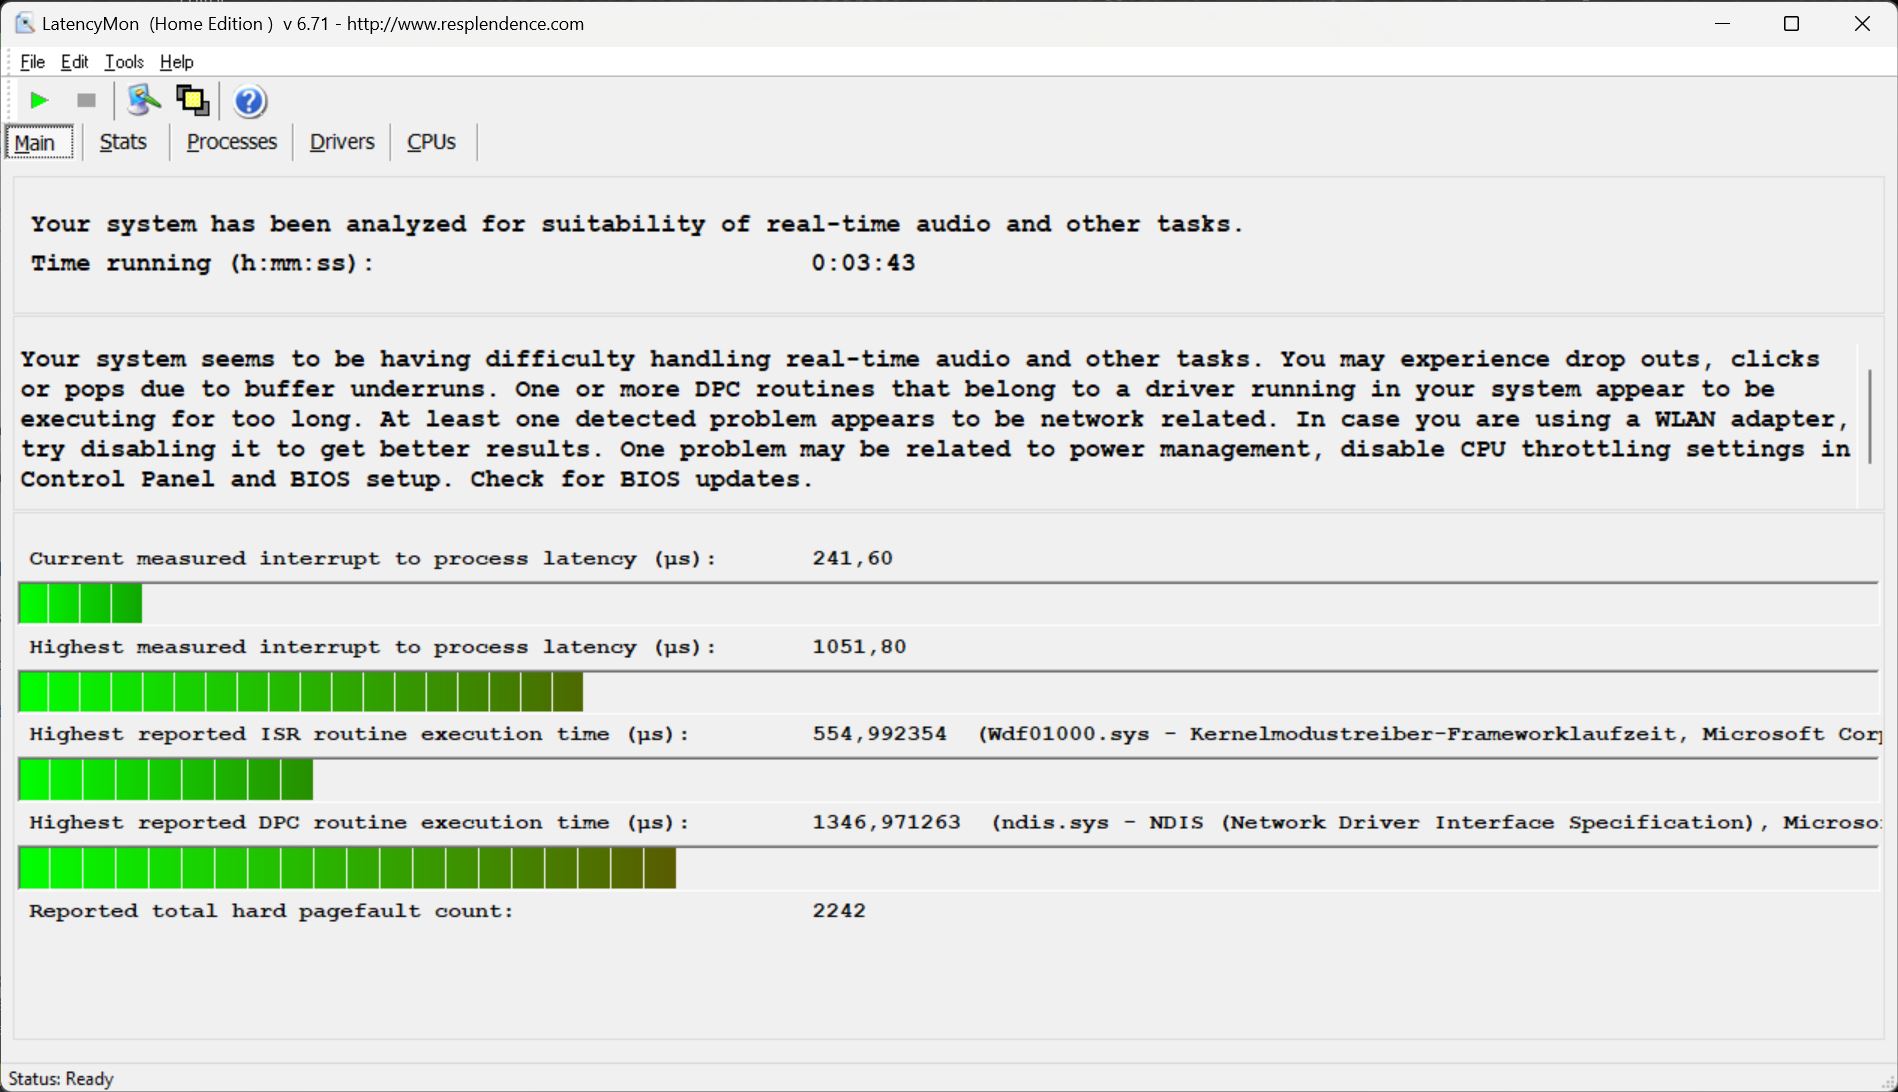
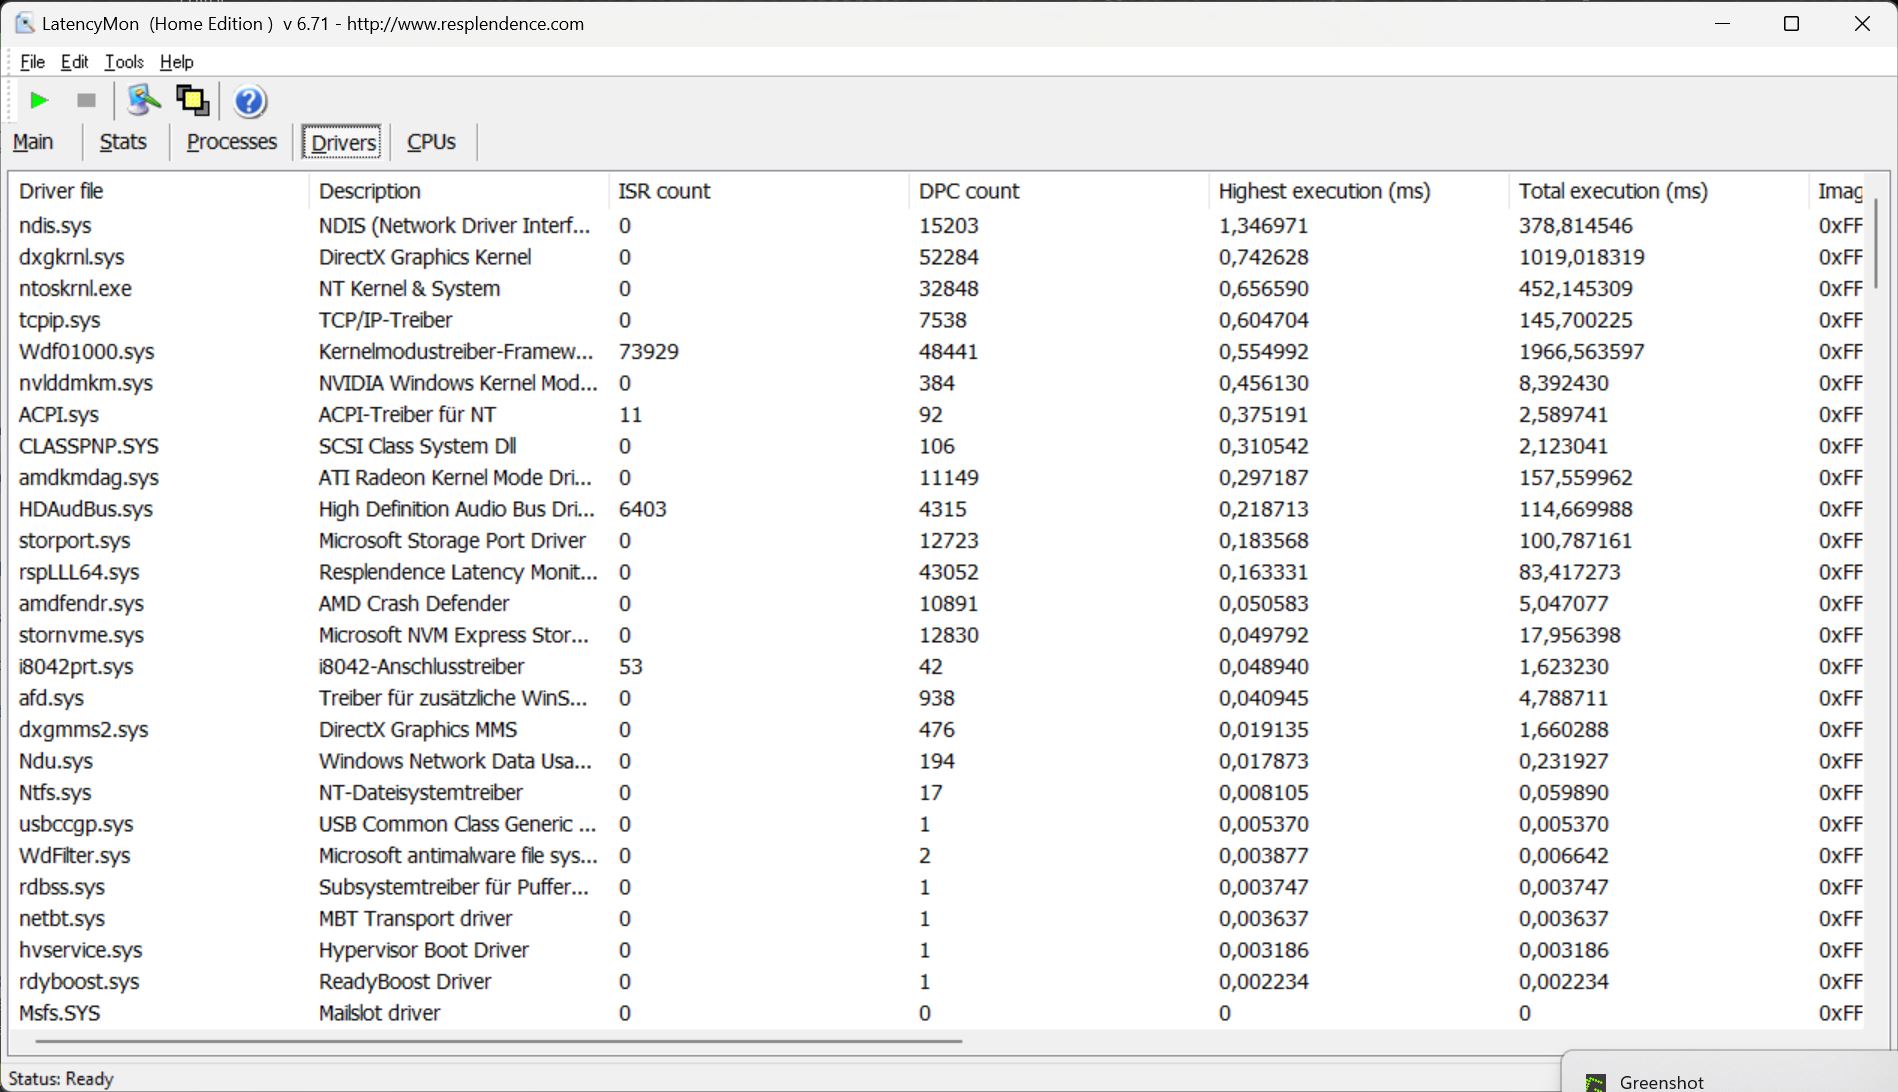
DPC gecikme süreleri
Tarayıcıyı açarken, henüz herhangi bir sorun teşkil etmeyen minimum gecikmeler vardır. Birden fazla tarayıcı sekmesi açıldığında gecikme değeri bir miktar artıyor. Bu aynı zamanda 4K/60fps YouTube video oynatımımız için de geçerli ve yüzde 62'de dahili GPU'nun yük faktörü oldukça yüksek görünüyor. Sonuç olarak iki kare düştü ve gecikme sıralamasında şerefsiz bir ikincilik elde etti.
| DPC Latencies / LatencyMon - interrupt to process latency (max), Web, Youtube, Prime95 | |
| Lenovo Legion 5 16IRX G9 | |
| SCHENKER XMG Core 15 (M24) | |
| Dell G16, i7-13650HX, RTX 4060 | |
| SCHENKER XMG Pro 15 (E23) | |
| HP Victus 16 (2024) | |
| SCHENKER XMG Fusion 15 (Early 24) | |
* ... daha küçük daha iyidir
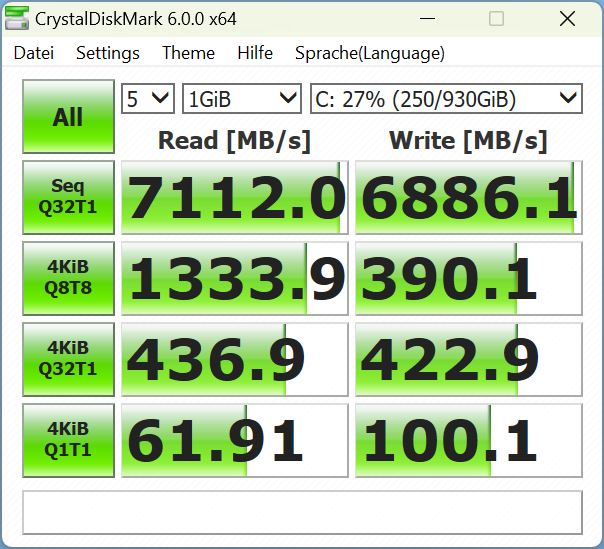
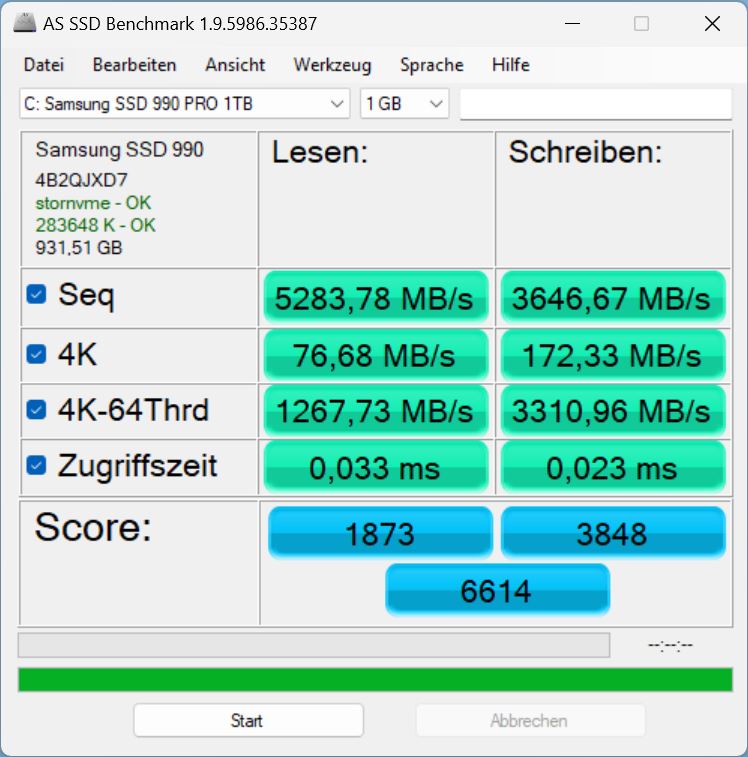
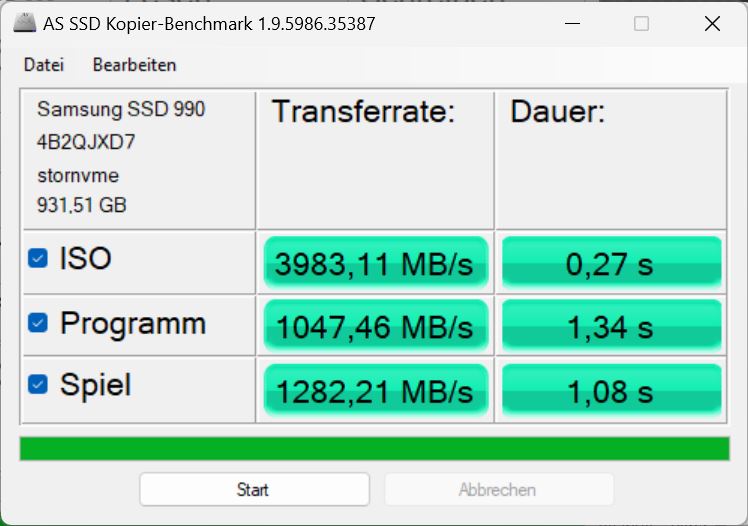
Yığın depolama
İnceleme modelimizde Schenker, 1 TB depolama alanına sahip hızlı bir Samsung 990 Pro takmıştır ve Core 15, bu üreticinin çeşitli modelleri de dahil olmak üzere altı farklı şirketin SSD'leri ile donatılabilir.
Kullanılan test yazılımına (CrystalDiskMark 6, AS SSD, Disksdp) bağlı olarak SSD daha iyi ya da daha kötü performans göstermektedir ancak sonuç olarak 990 Pro, Diskspd döngüsünü çalıştıran inceleme modelimizde de çok tutarlı yüksek performans seviyeleri gösteren çok hızlı bir PCIe 4.0 NVMe SSD olmaya devam etmektedir.

| Drive Performance Rating - Percent | |
| SCHENKER XMG Fusion 15 (Early 24) | |
| Lenovo Legion 5 16IRX G9 | |
| Ortalama Samsung 990 Pro 1 TB | |
| HP Victus 16 (2024) | |
| SCHENKER XMG Core 15 (M24) | |
| Dell G16, i7-13650HX, RTX 4060 | |
| SCHENKER XMG Pro 15 (E23) | |
| Sınıf ortalaması Gaming | |
* ... daha küçük daha iyidir
Continuous Performance Read: DiskSpd Read Loop, Queue Depth 8
Grafik kartı
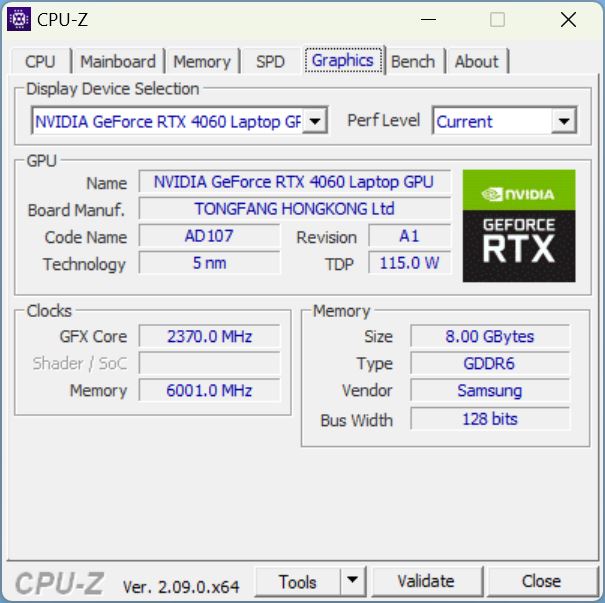
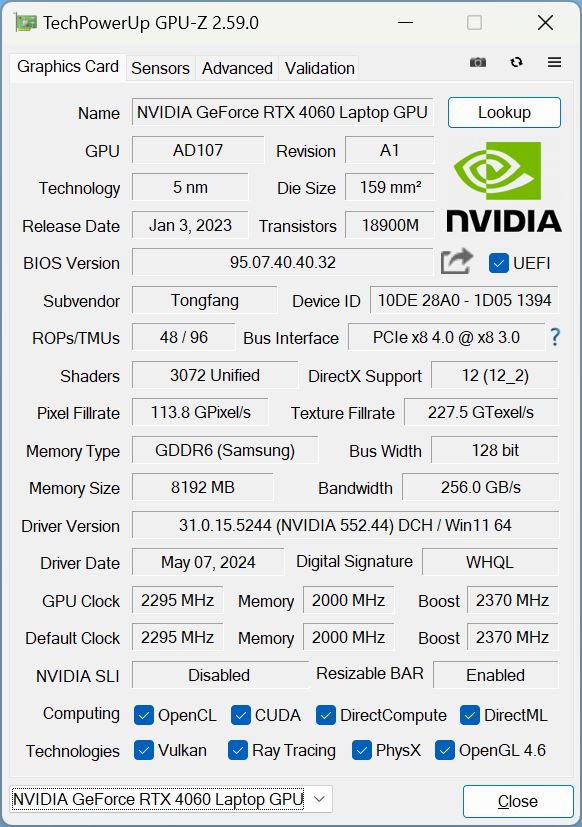
Bir Nvidia Geforce RTX 4060 gPU olarak görev yapar, ancak 200 $ ek ücret karşılığında Core 15 ayrıca bir RTX 4070 fusion 15'teki gibi.
3DMark testlerinde Core 15 son derece başarılı. Tüm testlerde RTX 4070 donanımlı Fusion bile sadece yüzde 8'lik bir avantaja sahipken Core 15, 4060 tabanlı rakiplerinin önünde ikinci sırada yer alıyor.
Oyun performansı 3DMark sonuçları kadar iyi değil ancak bu tamamen DOTA 2 Reborn veya X-Plane gibi CPU yoğun oyunlarla ilgili. Bu başlıkları bir kenara bırakırsak, CPU yoğun oyunlar söz konusu olduğunda Core 15, en iyi RTX 4060 karşılaştırma cihazlarıyla göz göze geliyor. Core 15, tüm oyunları Full HD'de 60 fps'nin üzerinde çalıştırıyor ve Cyberpunk 2077 gibi oyunlar zaman zaman 60 fps'nin altına düşse de kendi doğal QHD çözünürlüğünde bile herhangi bir sorun çıkarmıyor.
Witcher 3 grafiği, oyunun olağan gece/gündüz ritmiyle bir saatten fazla bir süre boyunca çok istikrarlı bir performans gösteriyor. Bu alanda da performans RTX 4060 rakipleriyle aynı seviyede. Aşağıdaki tabloda çeşitli performans profillerine ilişkin skorlar gösterilmekte olup tek tutarsızlık dengeli modda görülmektedir. İlk birkaç dakika boyunca, kare hızı ve tüketim ile meraklı modundakiyle aynı performansı gösteriyor, ardından kısa bir süre düşüyor ve yalnızca pil modu seviyesinde kalmayı başarıyor.
Pil modunda, 3D performansı Fire Strike adresinde yaklaşık yüzde 39 oranında düşüyor.
| Performans profili/değeri | Witcher 3 FPS (Başlangıç - 5 dakika sonra) | GPU hızı | GPU güç tüketimi | hacim | tüketim |
|---|---|---|---|---|---|
| Overboost | 103 - 101 | 2.720 MHz | 108,5 W | 50,96 dB | 167 W |
| Meraklı | 97 - 92 | 2.640 MHz | 102,7 | 49 dB | 156 W |
| Dengeli | 97 - 65 | 1.880 MHz | 47,86 W | Başlangıçta 39,75, ardından birkaç dakika sonra tutarlı bir 31 dB | Başlangıçta 154, ardından 67 W |
| 3DMark Performance Rating - Percent | |
| SCHENKER XMG Fusion 15 (Early 24) -1! | |
| Sınıf ortalaması Gaming | |
| SCHENKER XMG Core 15 (M24) | |
| Lenovo Legion 5 16IRX G9 -1! | |
| Dell G16, i7-13650HX, RTX 4060 | |
| Ortalama NVIDIA GeForce RTX 4060 Laptop GPU | |
| HP Victus 16 (2024) -1! | |
| SCHENKER XMG Pro 15 (E23) | |
| 3DMark 11 - 1280x720 Performance GPU | |
| SCHENKER XMG Fusion 15 (Early 24) | |
| Sınıf ortalaması Gaming (10741 - 72178, n=143, son 2 yıl) | |
| SCHENKER XMG Core 15 (M24) | |
| Lenovo Legion 5 16IRX G9 | |
| SCHENKER XMG Pro 15 (E23) | |
| Dell G16, i7-13650HX, RTX 4060 | |
| HP Victus 16 (2024) | |
| Ortalama NVIDIA GeForce RTX 4060 Laptop GPU (28136 - 38912, n=57) | |
| 3DMark | |
| 1280x720 Cloud Gate Standard Graphics | |
| SCHENKER XMG Core 15 (M24) | |
| Ortalama NVIDIA GeForce RTX 4060 Laptop GPU (81407 - 180228, n=29) | |
| Sınıf ortalaması Gaming (76926 - 193851, n=71, son 2 yıl) | |
| Dell G16, i7-13650HX, RTX 4060 | |
| SCHENKER XMG Pro 15 (E23) | |
| 1920x1080 Fire Strike Graphics | |
| SCHENKER XMG Fusion 15 (Early 24) | |
| Sınıf ortalaması Gaming (2913 - 56116, n=155, son 2 yıl) | |
| SCHENKER XMG Core 15 (M24) | |
| Lenovo Legion 5 16IRX G9 | |
| Dell G16, i7-13650HX, RTX 4060 | |
| HP Victus 16 (2024) | |
| SCHENKER XMG Pro 15 (E23) | |
| Ortalama NVIDIA GeForce RTX 4060 Laptop GPU (20533 - 29656, n=54) | |
| 2560x1440 Time Spy Graphics | |
| Sınıf ortalaması Gaming (2295 - 24599, n=151, son 2 yıl) | |
| SCHENKER XMG Fusion 15 (Early 24) | |
| SCHENKER XMG Core 15 (M24) | |
| Lenovo Legion 5 16IRX G9 | |
| Dell G16, i7-13650HX, RTX 4060 | |
| SCHENKER XMG Pro 15 (E23) | |
| Ortalama NVIDIA GeForce RTX 4060 Laptop GPU (7484 - 11451, n=56) | |
| HP Victus 16 (2024) | |
| 3DMark 11 Performance | 34005 puan | |
| 3DMark Cloud Gate Standard Score | 69309 puan | |
| 3DMark Fire Strike Score | 26988 puan | |
| 3DMark Time Spy Score | 11597 puan | |
Yardım | ||
* ... daha küçük daha iyidir
| Performance Rating - Percent | |
| SCHENKER XMG Fusion 15 (Early 24) | |
| Lenovo Legion 5 16IRX G9 | |
| SCHENKER XMG Pro 15 (E23) -1! | |
| Sınıf ortalaması Gaming | |
| Dell G16, i7-13650HX, RTX 4060 | |
| SCHENKER XMG Core 15 (M24) | |
| HP Victus 16 (2024) | |
| The Witcher 3 - 1920x1080 Ultra Graphics & Postprocessing (HBAO+) | |
| SCHENKER XMG Pro 15 (E23) | |
| SCHENKER XMG Fusion 15 (Early 24) | |
| Sınıf ortalaması Gaming (18.4 - 214, n=119, son 2 yıl) | |
| SCHENKER XMG Core 15 (M24) | |
| Dell G16, i7-13650HX, RTX 4060 | |
| HP Victus 16 (2024) | |
| Lenovo Legion 5 16IRX G9 | |
| GTA V - 1920x1080 Highest Settings possible AA:4xMSAA + FX AF:16x | |
| SCHENKER XMG Fusion 15 (Early 24) | |
| Lenovo Legion 5 16IRX G9 | |
| Dell G16, i7-13650HX, RTX 4060 | |
| SCHENKER XMG Core 15 (M24) | |
| Sınıf ortalaması Gaming (12.1 - 168.2, n=132, son 2 yıl) | |
| HP Victus 16 (2024) | |
| SCHENKER XMG Pro 15 (E23) | |
| Final Fantasy XV Benchmark - 1920x1080 High Quality | |
| SCHENKER XMG Fusion 15 (Early 24) | |
| Sınıf ortalaması Gaming (19.2 - 201, n=144, son 2 yıl) | |
| SCHENKER XMG Core 15 (M24) | |
| Lenovo Legion 5 16IRX G9 | |
| Dell G16, i7-13650HX, RTX 4060 | |
| HP Victus 16 (2024) | |
| Strange Brigade - 1920x1080 ultra AA:ultra AF:16 | |
| Sınıf ortalaması Gaming (38.9 - 420, n=140, son 2 yıl) | |
| SCHENKER XMG Fusion 15 (Early 24) | |
| Lenovo Legion 5 16IRX G9 | |
| SCHENKER XMG Core 15 (M24) | |
| Dell G16, i7-13650HX, RTX 4060 | |
| SCHENKER XMG Pro 15 (E23) | |
| HP Victus 16 (2024) | |
| Dota 2 Reborn - 1920x1080 ultra (3/3) best looking | |
| SCHENKER XMG Fusion 15 (Early 24) | |
| Lenovo Legion 5 16IRX G9 | |
| SCHENKER XMG Pro 15 (E23) | |
| HP Victus 16 (2024) | |
| Dell G16, i7-13650HX, RTX 4060 | |
| Sınıf ortalaması Gaming (65.1 - 220, n=148, son 2 yıl) | |
| SCHENKER XMG Core 15 (M24) | |
| X-Plane 11.11 - 1920x1080 high (fps_test=3) | |
| SCHENKER XMG Fusion 15 (Early 24) | |
| Lenovo Legion 5 16IRX G9 | |
| Dell G16, i7-13650HX, RTX 4060 | |
| SCHENKER XMG Pro 15 (E23) | |
| Sınıf ortalaması Gaming (32.8 - 166.2, n=151, son 2 yıl) | |
| HP Victus 16 (2024) | |
| SCHENKER XMG Core 15 (M24) | |
Witcher 3 FPS diagram
| düşük | orta | yüksek | ultra | QHD | 4K | |
|---|---|---|---|---|---|---|
| GTA V (2015) | 185 | 180.5 | 174.7 | 116.7 | 91.7 | |
| The Witcher 3 (2015) | 402.5 | 337.4 | 215.5 | 111.7 | 83.4 | |
| Dota 2 Reborn (2015) | 165.2 | 150.9 | 145.4 | 135.2 | 131.5 | |
| Final Fantasy XV Benchmark (2018) | 225 | 153.7 | 107.2 | 79.4 | ||
| X-Plane 11.11 (2018) | 143.5 | 125.1 | 97.2 | 90.7 | ||
| Far Cry 5 (2018) | 162 | 142 | 137 | 128 | 108 | |
| Strange Brigade (2018) | 434 | 305 | 242 | 204 | 136.3 | |
| Baldur's Gate 3 (2023) | 160.3 | 125.7 | 110.7 | 105.5 | 72.2 | |
| Cyberpunk 2077 2.2 Phantom Liberty (2023) | 136.1 | 107.2 | 91 | 93.1 | 48.2 | |
| Skull & Bones (2024) | 146 | 127 | 101 | 73 | 57 |
Emisyonlar ve Enerji - Sıcak bir patates ama ekonomik
Gürültü emisyonları
Masaüstünde boşta çalışırken fanlar çoğunlukla devre dışı kalıyor. Ancak, bir tarayıcıyı açmak ve internette gezinmek gibi en ufak bir günlük yükte bile devreye girerler ve ardından 27 dB'lik sessiz bir sesle mırıldanırlar. Bu normalde uğraşacağınız türden bir ses seviyesidir.
Ağır yük altında fan sesi 52 dB'ye kadar çıkabilir, ancak yük süresi bittiğinde tekrar çok hızlı bir şekilde sakinleşirler. Ancak daha sonra, boşta çalışırken bile uzunca bir süre sessizlik olmuyor.
Karşılaştırma yapmak gerekirse, HP Victus ve Dell G16 oyun oynarken biraz daha sessizdir ve Legion 5 daha yüksek sesle çalışırken Core 15 her iki cihazın arasında bir yerde durmaktadır.
Ses yüksekliği
| Boşta |
| 23 / 23 / 23 dB |
| Çalışırken |
| 38.92 / 52.09 dB |
 | ||
30 dB sessiz 40 dB(A) duyulabilirlik 50 dB(A) gürültülü |
||
min: | ||
| SCHENKER XMG Core 15 (M24) NVIDIA GeForce RTX 4060 Laptop GPU, R7 8845HS, Samsung 990 Pro 1 TB | Lenovo Legion 5 16IRX G9 NVIDIA GeForce RTX 4060 Laptop GPU, i7-14650HX, Samsung PM9A1 MZVL21T0HCLR | HP Victus 16 (2024) NVIDIA GeForce RTX 4060 Laptop GPU, i7-14700HX, Kioxia XG8 KXG80ZNV512G | Dell G16, i7-13650HX, RTX 4060 NVIDIA GeForce RTX 4060 Laptop GPU, i7-13650HX, WD PC SN740 SDDPNQD-1T00 | SCHENKER XMG Fusion 15 (Early 24) NVIDIA GeForce RTX 4070 Laptop GPU, i9-14900HX, Samsung 990 Pro 1 TB | SCHENKER XMG Pro 15 (E23) NVIDIA GeForce RTX 4060 Laptop GPU, i9-13900HX, Crucial P5 Plus 1TB CT1000P5PSSD8 | |
|---|---|---|---|---|---|---|
| Noise | -14% | -13% | 3% | -18% | -9% | |
| kapalı / ortam * | 23 | 24 -4% | 25 -9% | 23 -0% | 25 -9% | 24 -4% |
| Idle Minimum * | 23 | 24 -4% | 28 -22% | 23 -0% | 27 -17% | 24 -4% |
| Idle Average * | 23 | 28.8 -25% | 29 -26% | 23 -0% | 28 -22% | 24 -4% |
| Idle Maximum * | 23 | 32 -39% | 33 -43% | 27.96 -22% | 33 -43% | 24 -4% |
| Load Average * | 38.92 | 45.5 -17% | 45 -16% | 27.96 28% | 52 -34% | 53.65 -38% |
| Witcher 3 ultra * | 50.96 | 53.1 -4% | 43 16% | 47.89 6% | 51 -0% | 53.53 -5% |
| Cyberpunk 2077 ultra * | 52.06 | |||||
| Load Maximum * | 52.09 | 55.7 -7% | 48 8% | 47.89 8% | 53 -2% | 53.65 -3% |
* ... daha küçük daha iyidir
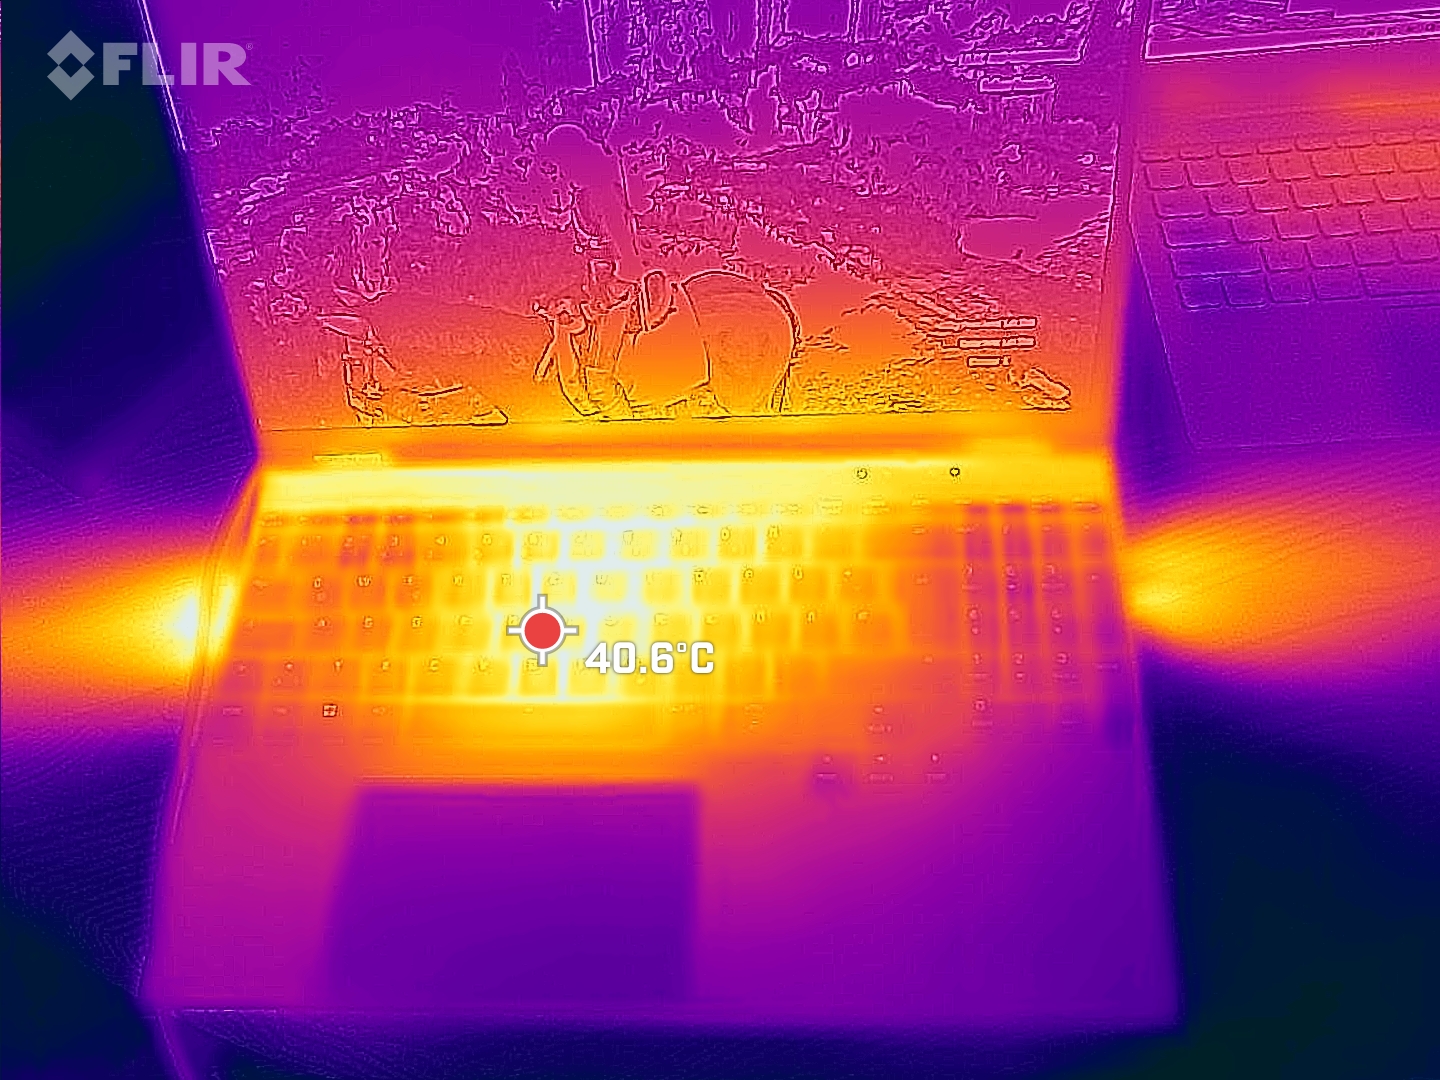
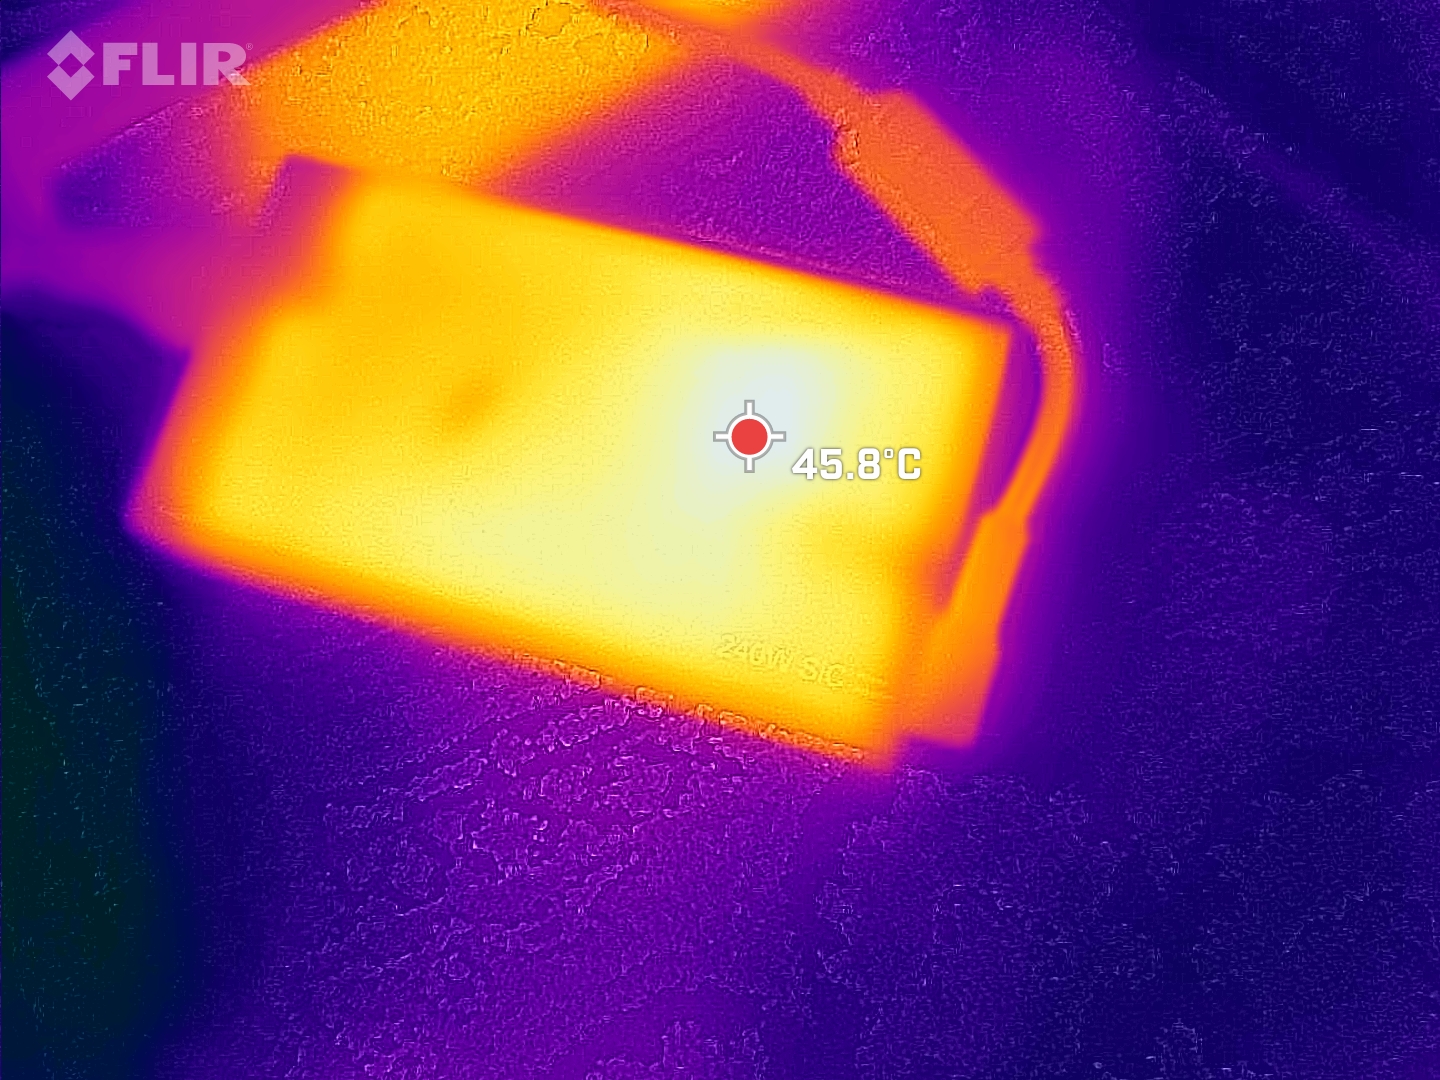
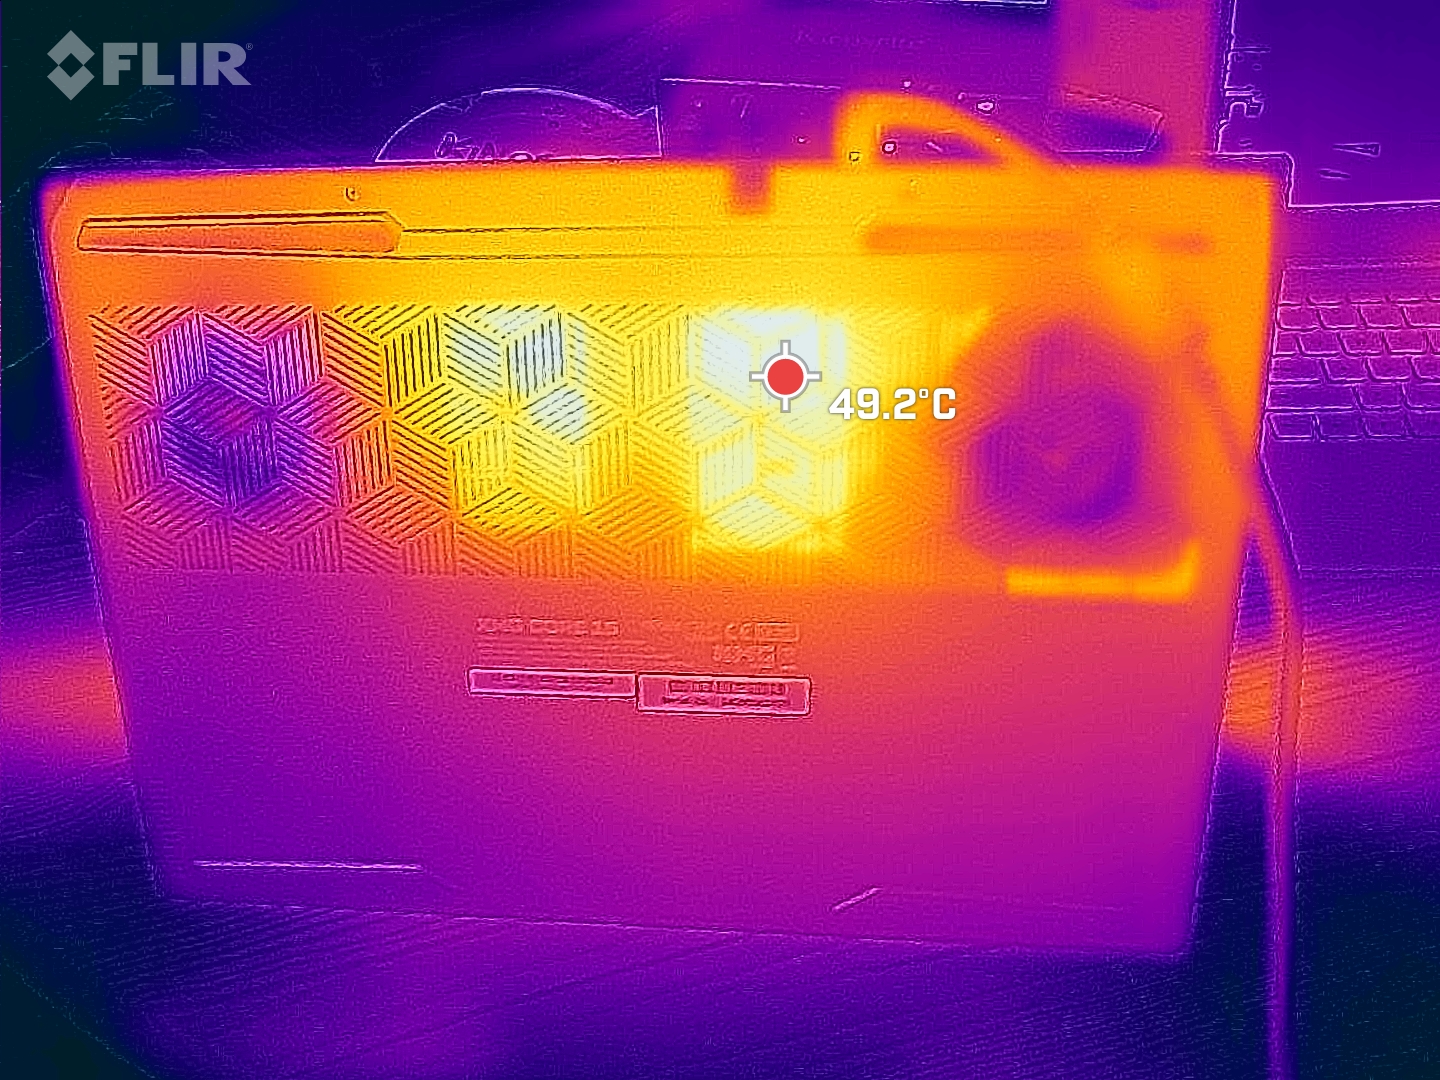
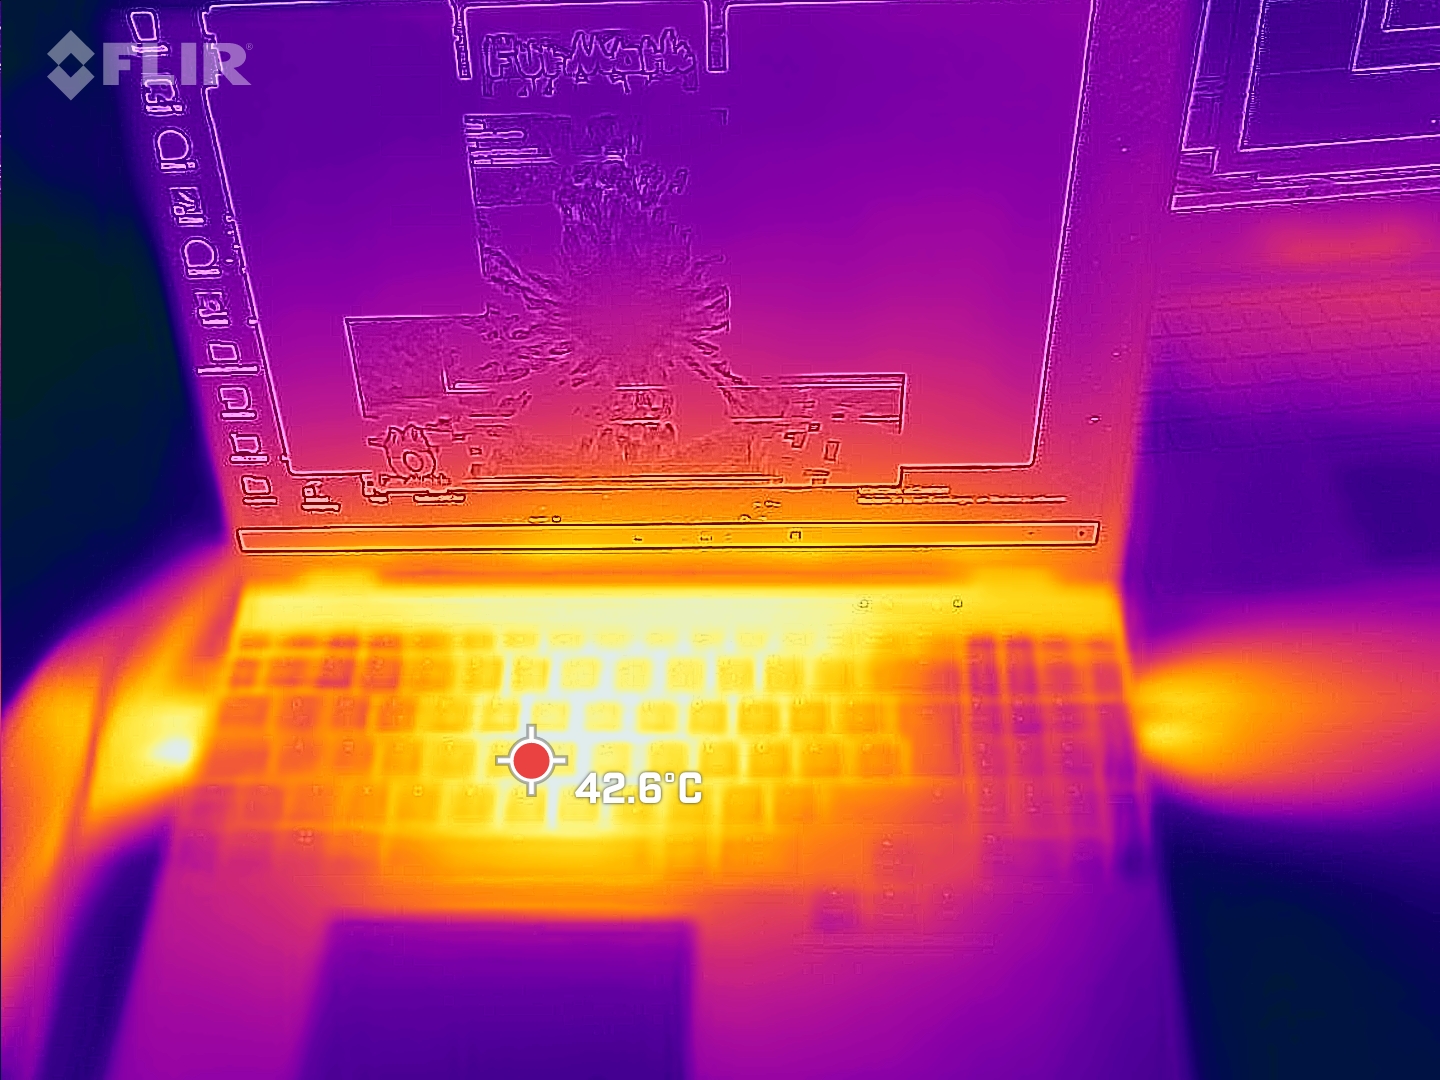
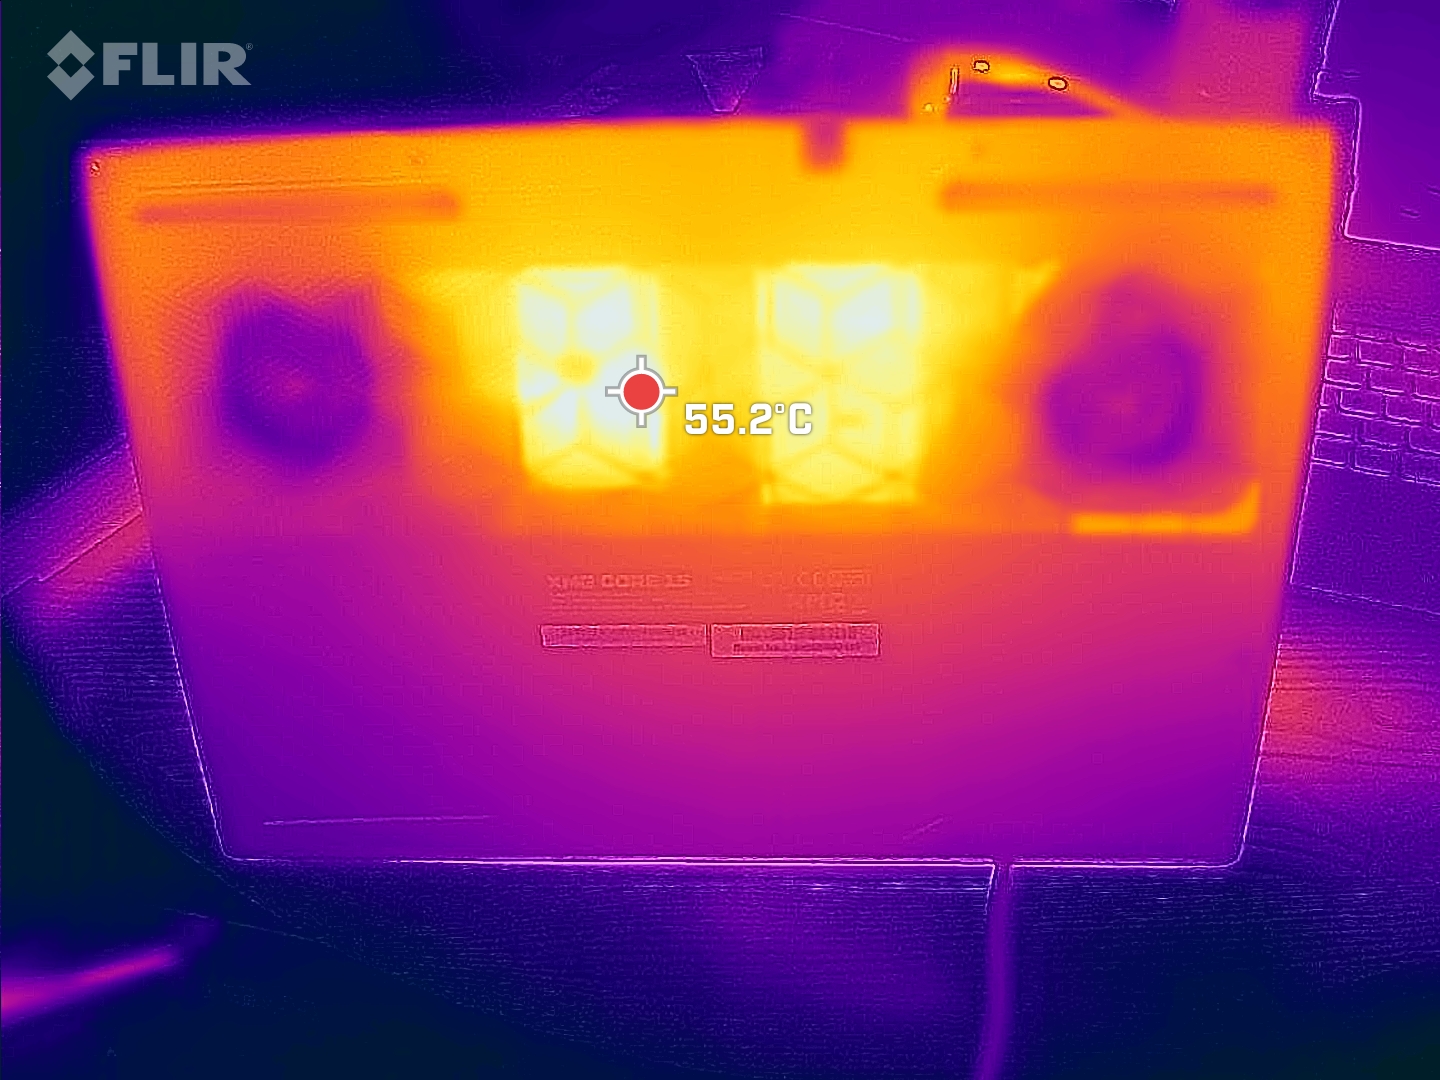
Sıcaklık
Core 15 gerçekten serin kalmıyor, metal kasa oldukça fazla ısınarak özellikle ünitenin tabanında ek bir sıcaklık kaynağı haline geliyor. Avuç içi dayanakları nispeten serin kalıyor.
Fanlar kapalıyken boşta çalışırken bile, yaklaşık 35 °C'de, oldukça ısınıyor ama makul sınırlar içinde. Oyun oynarken, cihazın tabanındaki, ekranın ortasındaki sıcak nokta 55°C'ye kadar ısınıyor ve stres testinde 60°C'nin biraz üzerine çıkıyor. Bu alanda rakipler, hatta daha güçlü GPU'ya sahip Fusion 15 bile biraz daha serin kalmayı başarıyor. Bu durum RTX 4070 konfigürasyonunu da etkileyerek olası bir termal daralmaya yol açabilir.
(-) Üst taraftaki maksimum sıcaklık, 40.4 °C / 105 F ortalamasına kıyasla 52 °C / 126 F'dir. , Gaming sınıfı için 21.2 ile 68.8 °C arasında değişir.
(-) Alt kısım, 43.2 °C / 110 F ortalamasına kıyasla maksimum 61 °C / 142 F'ye kadar ısınır
(±) Boşta kullanımda, üst tarafın ortalama sıcaklığı 32.7 °C / 91 F olup, cihazın 33.9 °C / 93 F.
(-) The Witcher 3 oynarken, üst tarafın ortalama sıcaklığı 39.2 °C / 103 F olup, cihazın 33.9 °C / 93 F.
(+) Avuç içi dayanakları ve dokunmatik yüzey maksimum (34 °C / 93.2 F) cilt sıcaklığına ulaşıyor ve bu nedenle sıcak değil.
(-) Benzer cihazların avuç içi dayanağı alanının ortalama sıcaklığı 28.9 °C / 84 F (-5.1 °C / -9.2 F) idi.
| SCHENKER XMG Core 15 (M24) AMD Ryzen 7 8845HS, NVIDIA GeForce RTX 4060 Laptop GPU | Lenovo Legion 5 16IRX G9 Intel Core i7-14650HX, NVIDIA GeForce RTX 4060 Laptop GPU | HP Victus 16 (2024) Intel Core i7-14700HX, NVIDIA GeForce RTX 4060 Laptop GPU | Dell G16, i7-13650HX, RTX 4060 Intel Core i7-13650HX, NVIDIA GeForce RTX 4060 Laptop GPU | SCHENKER XMG Fusion 15 (Early 24) Intel Core i9-14900HX, NVIDIA GeForce RTX 4070 Laptop GPU | SCHENKER XMG Pro 15 (E23) Intel Core i9-13900HX, NVIDIA GeForce RTX 4060 Laptop GPU | |
|---|---|---|---|---|---|---|
| Heat | 18% | 21% | 5% | 16% | 12% | |
| Maximum Upper Side * | 52 | 40.4 22% | 50 4% | 49 6% | 48 8% | 50 4% |
| Maximum Bottom * | 61 | 43.8 28% | 50 18% | 58 5% | 56 8% | 50 18% |
| Idle Upper Side * | 35 | 30.3 13% | 25 29% | 35 -0% | 28 20% | 33 6% |
| Idle Bottom * | 39 | 35.3 9% | 26 33% | 35 10% | 29 26% | 32 18% |
* ... daha küçük daha iyidir
Konuşmacılar
Tizler ve orta sesler doğrusal ve dengeli ancak baslar neredeyse hiç duyulmuyor ve hoparlörler de daha yüksek olabilirdi. Analog ses ekipmanlarının bağlanması 3,5 mm kulaklık girişi üzerinden gerçekleştirilebilir.
SCHENKER XMG Core 15 (M24) ses analizi
(±) | hoparlör ses yüksekliği ortalama ama iyi (79.12 dB)
Bas 100 - 315Hz
(-) | neredeyse hiç bas yok - ortalama olarak medyandan 16.7% daha düşük
(-) | bas doğrusal değildir (15.7% delta ile önceki frekans)
Ortalar 400 - 2000 Hz
(+) | dengeli ortalar - medyandan yalnızca 4.5% uzakta
(+) | orta frekanslar doğrusaldır (4.4% deltadan önceki frekansa)
Yüksekler 2 - 16 kHz
(+) | dengeli yüksekler - medyandan yalnızca 1% uzakta
(+) | yüksekler doğrusaldır (2.7% deltadan önceki frekansa)
Toplam 100 - 16.000 Hz
(+) | genel ses doğrusaldır (13.7% ortancaya göre fark)
Aynı sınıfla karşılaştırıldığında
» Bu sınıftaki tüm test edilen cihazların %20%'si daha iyi, 6% benzer, 74% daha kötüydü
» En iyisinin deltası 6% idi, ortalama 18% idi, en kötüsü 132% idi
Test edilen tüm cihazlarla karşılaştırıldığında
» Test edilen tüm cihazların %13'si daha iyi, 3 benzer, % 83 daha kötüydü
» En iyisinin deltası 4% idi, ortalama 24% idi, en kötüsü 134% idi
Apple MacBook Pro 16 2021 M1 Pro ses analizi
(+) | hoparlörler nispeten yüksek sesle çalabilir (84.7 dB)
Bas 100 - 315Hz
(+) | iyi bas - medyandan yalnızca 3.8% uzakta
(+) | bas doğrusaldır (5.2% delta ile önceki frekans)
Ortalar 400 - 2000 Hz
(+) | dengeli ortalar - medyandan yalnızca 1.3% uzakta
(+) | orta frekanslar doğrusaldır (2.1% deltadan önceki frekansa)
Yüksekler 2 - 16 kHz
(+) | dengeli yüksekler - medyandan yalnızca 1.9% uzakta
(+) | yüksekler doğrusaldır (2.7% deltadan önceki frekansa)
Toplam 100 - 16.000 Hz
(+) | genel ses doğrusaldır (4.6% ortancaya göre fark)
Aynı sınıfla karşılaştırıldığında
» Bu sınıftaki tüm test edilen cihazların %0%'si daha iyi, 0% benzer, 100% daha kötüydü
» En iyisinin deltası 5% idi, ortalama 18% idi, en kötüsü 45% idi
Test edilen tüm cihazlarla karşılaştırıldığında
» Test edilen tüm cihazların %0'si daha iyi, 0 benzer, % 100 daha kötüydü
» En iyisinin deltası 4% idi, ortalama 24% idi, en kötüsü 134% idi
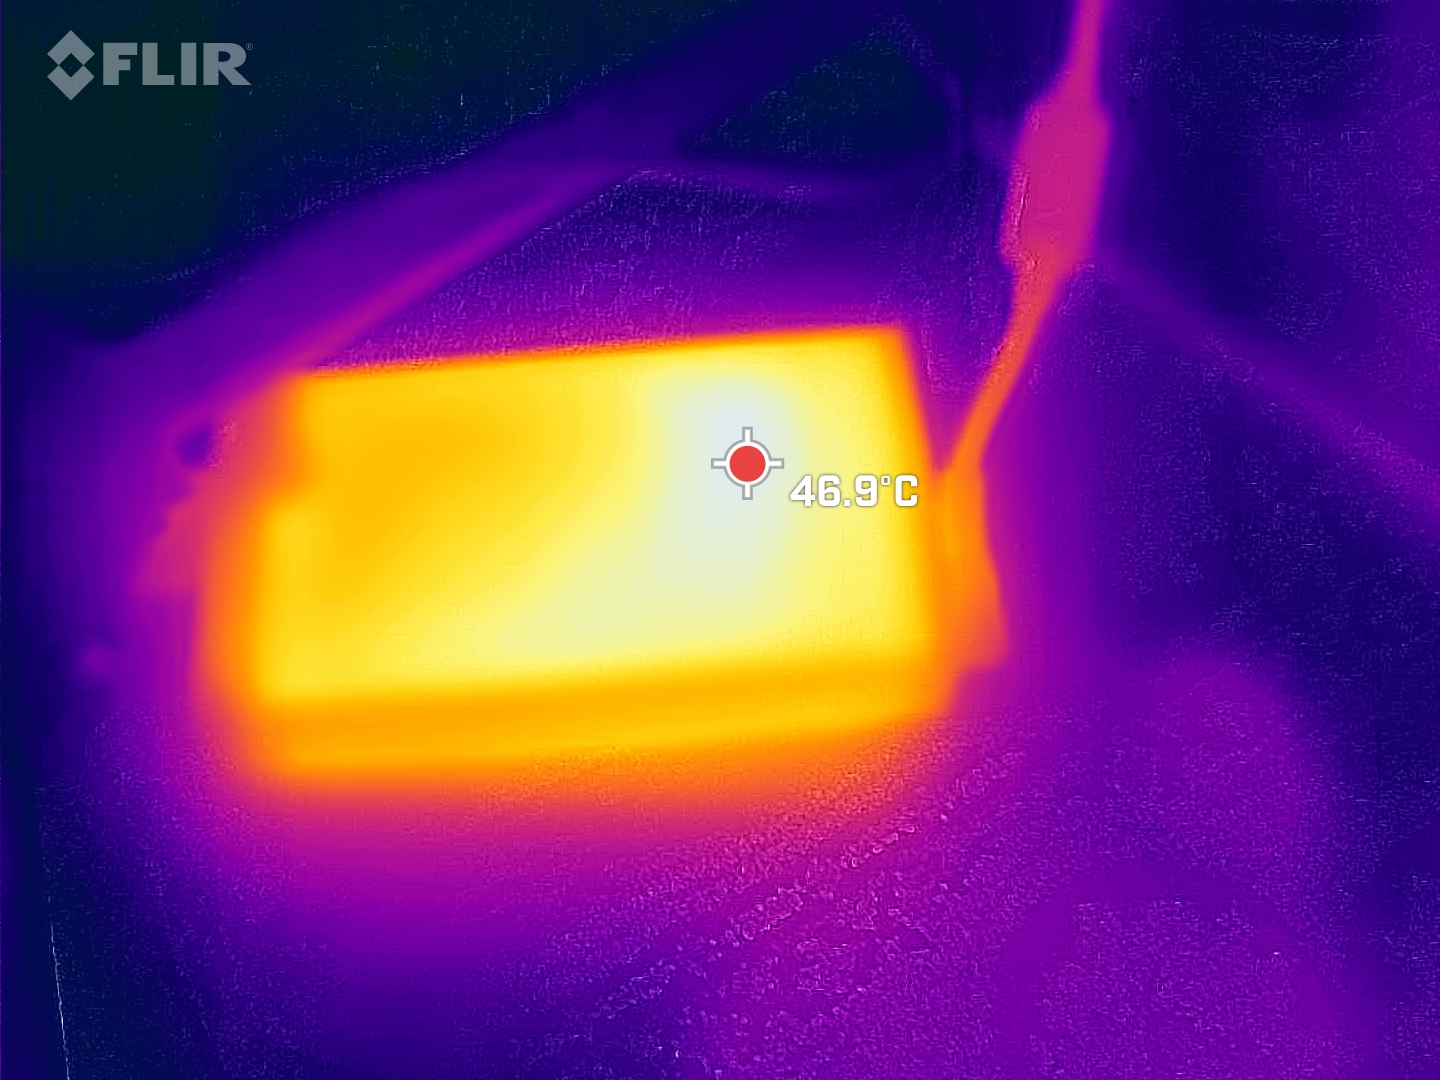
Güç tüketimi
Core 15, özellikle boşta çalışırken rakiplerinden biraz daha ekonomiktir - hepsi çok iyi. Oyun oynarken de tüketim makul seviyede kalıyor.
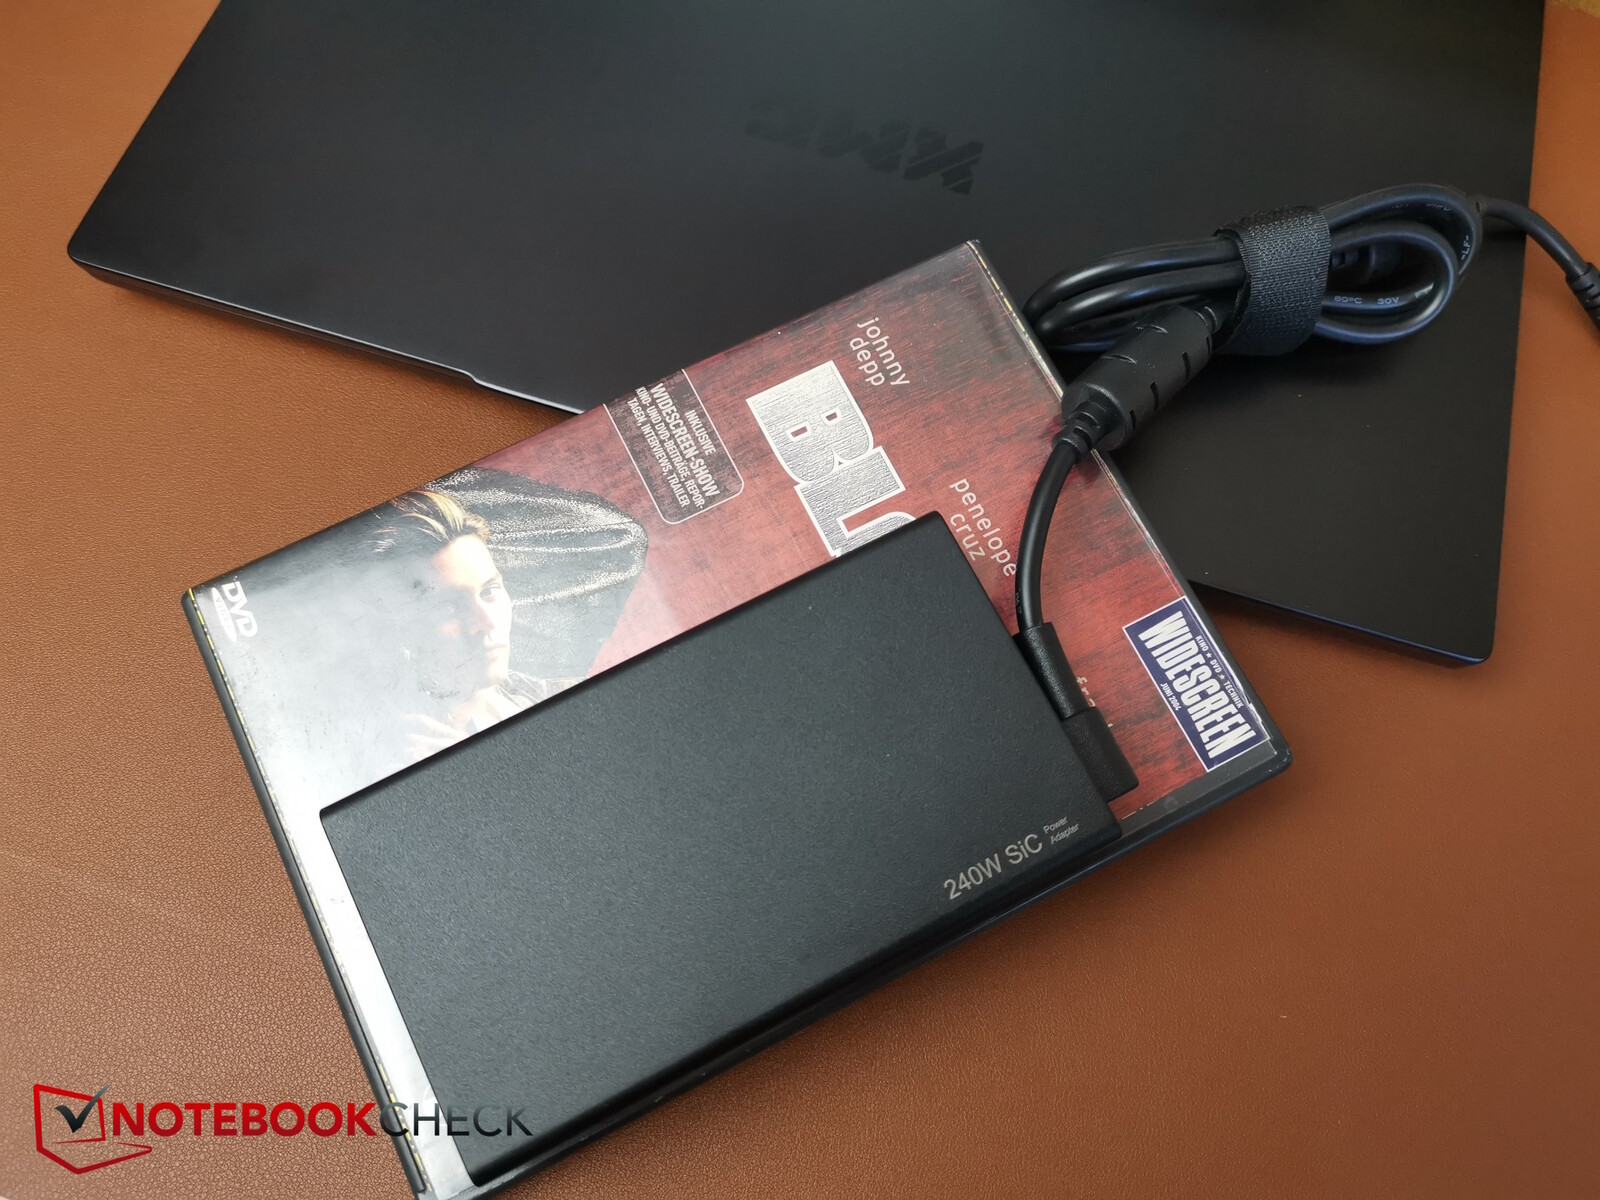
Stres testinde geçici olarak 286 W'a varan tüketim değerleri ölçtük ki bu da teorik olarak 240 W PSU'yu biraz zorlayabilir. Bununla birlikte, bu yük zirveleri gerçekten sadece geçicidir. Oyun oynarken ortalama sadece 167 W tüketim ölçtük ve bu PSU'nun her zaman üstesinden gelebileceği bir değer.
PSU'dan bahsetmişken, Schenker burada boyutlarını küçülterek iyileştirmeler yapmış gibi görünüyor. Üretici, 240 W'lık Chicony PSU yerine 240 W'lık bir ünite tercih etmiş, ancak bu ünite çok daha küçük bir form faktörüne sahip. Bu, mobilite için çok faydalı.
| Kapalı / Bekleme modu | |
| Boşta | |
| Çalışırken |
|
Key:
min: | |
| SCHENKER XMG Core 15 (M24) R7 8845HS, NVIDIA GeForce RTX 4060 Laptop GPU, Samsung 990 Pro 1 TB, IPS, 2560x1600, 15.3" | Lenovo Legion 5 16IRX G9 i7-14650HX, NVIDIA GeForce RTX 4060 Laptop GPU, Samsung PM9A1 MZVL21T0HCLR, IPS, 2560x1600, 16" | HP Victus 16 (2024) i7-14700HX, NVIDIA GeForce RTX 4060 Laptop GPU, Kioxia XG8 KXG80ZNV512G, IPS, 1920x1080, 16.1" | Dell G16, i7-13650HX, RTX 4060 i7-13650HX, NVIDIA GeForce RTX 4060 Laptop GPU, WD PC SN740 SDDPNQD-1T00, IPS, 2560x1600, 16" | SCHENKER XMG Fusion 15 (Early 24) i9-14900HX, NVIDIA GeForce RTX 4070 Laptop GPU, Samsung 990 Pro 1 TB, IPS, 2560x1600, 15.3" | SCHENKER XMG Pro 15 (E23) i9-13900HX, NVIDIA GeForce RTX 4060 Laptop GPU, Crucial P5 Plus 1TB CT1000P5PSSD8, IPS, 2560x1440, 15.6" | Ortalama NVIDIA GeForce RTX 4060 Laptop GPU | Sınıf ortalaması Gaming | |
|---|---|---|---|---|---|---|---|---|
| Power Consumption | -36% | -13% | -13% | -20% | -100% | -20% | -45% | |
| Idle Minimum * | 9.3 | 15.4 -66% | 9 3% | 11 -18% | 8 14% | 21.6 -132% | 11.5 ? -24% | 13.4 ? -44% |
| Idle Average * | 12.9 | 19.7 -53% | 15 -16% | 14.8 -15% | 14 -9% | 29 -125% | 16 ? -24% | 18.9 ? -47% |
| Idle Maximum * | 12.8 | 20.7 -62% | 23 -80% | 16.8 -31% | 26 -103% | 42.7 -234% | 20.3 ? -59% | 26.3 ? -105% |
| Witcher 3 ultra * | 167 | 191.3 -15% | 143.7 14% | 185 -11% | 192.7 -15% | 189 -13% | ||
| Load Maximum * | 286 | 246.6 14% | 241 16% | 255 11% | 244 15% | 269 6% | 210 ? 27% | 244 ? 15% |
| Load Average * | 102.6 | 123 | 103.7 | 118 | 190 | 92.9 ? | 102.7 ? |
* ... daha küçük daha iyidir
Power consumption Witcher 3 / stress test
Power consumption with an external monitor
Pil ömrü
Schenker standart olarak 80 Wh'lik bir batarya takmıştır. Bununla birlikte, yaklaşık 70 $ ek ücret karşılığında cihaz, inceleme modelimizde bulunan daha büyük bir 99,8 Wh pil ile yapılandırılabilir.
Core 15, 150 Nits azaltılmış parlaklıkta Wi-Fi veya video testinde yaklaşık 7 saat çalışmaya devam ediyor. Parlaklığı maksimuma ayarlarsanız, Wi-Fi testinde ışıklar 5 saatten az bir süre sonra söner. Genel olarak, burada çok iyi bir pil ömrü ile karşı karşıyayız, ancak Legion 80 Wh pil ile benzer bir performans sunabiliyor gibi görünüyor.
| SCHENKER XMG Core 15 (M24) R7 8845HS, NVIDIA GeForce RTX 4060 Laptop GPU, 99.8 Wh | Lenovo Legion 5 16IRX G9 i7-14650HX, NVIDIA GeForce RTX 4060 Laptop GPU, 80 Wh | HP Victus 16 (2024) i7-14700HX, NVIDIA GeForce RTX 4060 Laptop GPU, 83 Wh | Dell G16, i7-13650HX, RTX 4060 i7-13650HX, NVIDIA GeForce RTX 4060 Laptop GPU, 86 Wh | SCHENKER XMG Fusion 15 (Early 24) i9-14900HX, NVIDIA GeForce RTX 4070 Laptop GPU, 99.8 Wh | SCHENKER XMG Pro 15 (E23) i9-13900HX, NVIDIA GeForce RTX 4060 Laptop GPU, 80 Wh | Sınıf ortalaması Gaming | |
|---|---|---|---|---|---|---|---|
| Pil Çalışma Süresi | -42% | -43% | -48% | -13% | -43% | -42% | |
| H.264 | 608 | 576 -5% | 381 -37% | 602 -1% | 447 ? -26% | ||
| WiFi v1.3 | 889 | 444 -50% | 511 -43% | 378 -57% | 480 -46% | 343.1 -61% | 387 ? -56% |
| Load | 151 | 46 -70% | 76 -50% | 164 9% | 115 -24% | 84.5 ? -44% | |
| Reader / Idle | 911 | 585 ? |
Artılar
Eksiler
Karar - Potansiyel olarak geliştirilmiş soğutma ile iyi ve uygun fiyatlı
Core 15, Fusion 15'ten en az 200 dolar daha ucuzdur. Bunun bedeli ise Thunderbolt ve daha güçlü bir CPU'ya sahip olmamak. İkincisi, neredeyse yüzde 20'lik gözle görülür bir CPU performans farkıyla sonuçlanır. Ancak bu, çoğu 3D oyunda gerçekten fark edeceğiniz bir şey değil. Fusion bu alanda yüzde 20 daha hızlı olabilir ancak bunun nedeni RTX 4070'dir. RTX 4060 varyantının da aynı derecede hızlı olması gerekir.
Core'un metal kasası ile işçiliğini ve RAM ve SSD'ler açısından iyi genişletilebilirlik seçeneklerini beğendik. Klavye, 3D performansı ve pil ömrü de iyi.
"Tek" eleştiri, ağır yük altında tabanın metal yüzeyinde üretilen büyük miktarda ısıdır. Bu, üreticinin gelecekte iyileştirmeler yapması ve belki de soğutma sistemini optimize etmesi gereken bir alan.
XMG Core 15, yük altında biraz fazla ısınan metal bir kasa içeren iyi bir yapı kalitesine sahip güçlü bir 3D oyuncudur.
Göz atmaya değer bir alternatif de geçen yılın XMG Pro 15'idir. Önceki yılın HX CPU'su hala burada bulunan AMD işlemciden daha hızlı ve bunun da ötesinde Pro'da Thunderbolt 4 de var. Legion 5i de özellikle daha ucuz Campuspoint varyantıyla olası bir alternatif.
Fiyat ve bulunabilirlik
Schenker mağazasında almanya'da Core 15'in fiyatları yaklaşık 1.500 dolardan başlıyor (güncel dönüşüm oranı). Daha büyük bataryası, Wi-Fi 6E, daha fazla RAM ve Samsung 990 Pro SSD'si nedeniyle inceleme modelimizin fiyatı yaklaşık 1.700 dolar. Buna karşılık, Fusion 15'in fiyatları yaklaşık 1.600 dolardan başlıyor.
SCHENKER XMG Core 15 (M24)
- 07/17/2024 v8
Christian Hintze
 Total Sustainability Score:
 Şeffaflık
İncelenecek cihazların seçimi editör ekibimiz tarafından yapılır. Test örneği, bu incelemenin amacı doğrultusunda üretici veya perakendeci tarafından yazara ödünç olarak sağlanmıştır. Borç verenin bu inceleme üzerinde herhangi bir etkisi olmadığı gibi, üretici de yayınlanmadan önce bu incelemenin bir kopyasını almamıştır. Bu incelemeyi yayınlama zorunluluğu yoktu. İncelemelerimiz karşılığında asla tazminat veya ödeme kabul etmiyoruz. Bağımsız bir medya şirketi olarak Notebookcheck, üreticilerin, perakendecilerin veya yayıncıların otoritesine tabi değildir.
Notebookcheck bu şekilde test yapıyor
Notebookcheck, tüm sonuçların karşılaştırılabilir olmasını sağlamak için her yıl yüzlerce dizüstü bilgisayarı ve akıllı telefonu standart prosedürler kullanarak bağımsız olarak inceliyor. Yaklaşık 20 yıldır test yöntemlerimizi sürekli olarak geliştirdik ve bu süreçte endüstri standartlarını belirledik. Test laboratuvarlarımızda deneyimli teknisyenler ve editörler tarafından yüksek kaliteli ölçüm ekipmanları kullanılmaktadır. Bu testler çok aşamalı bir doğrulama sürecini içerir. Karmaşık derecelendirme sistemimiz, nesnelliği koruyan yüzlerce sağlam temellere dayanan ölçüm ve kıyaslamaya dayanmaktadır.Price comparison

