

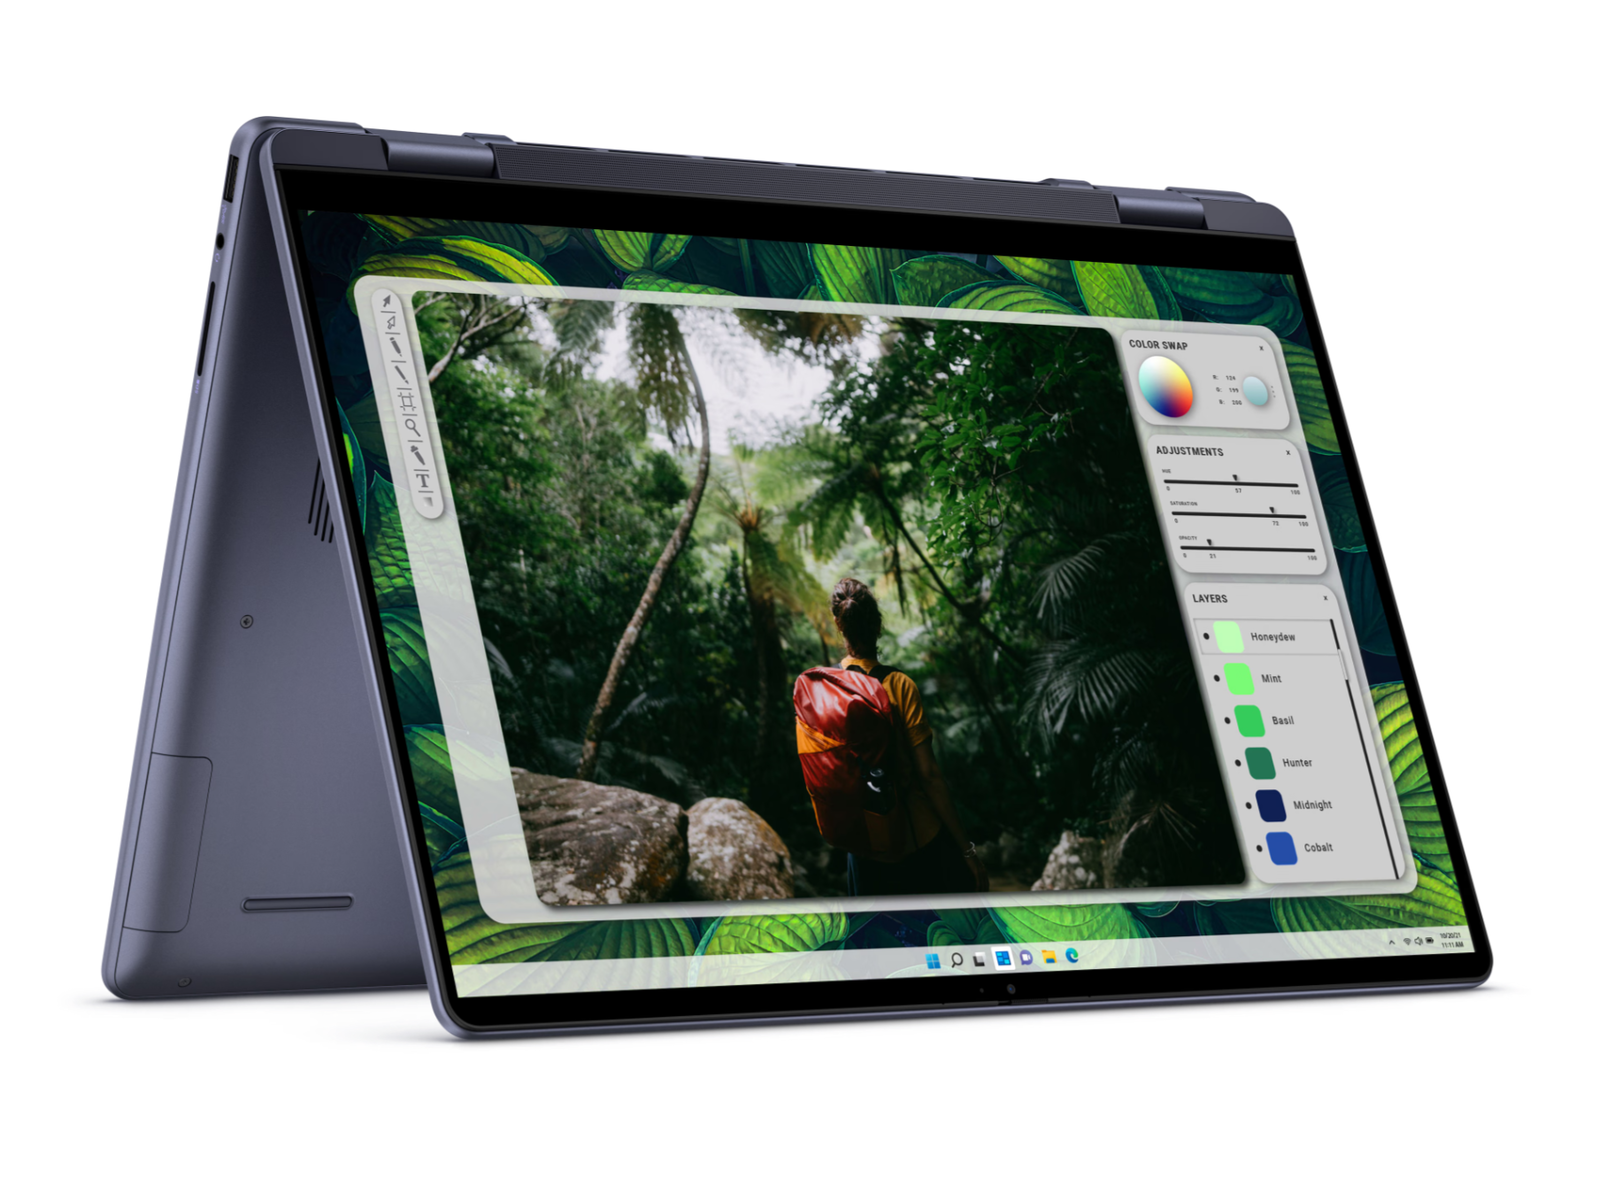
16 inç dönüştürülebilir bir mini LED: Dell Inspiron 16 7640 2'si 1 arada inceleme

2024 Inspiron 16 7640 2'si 1 arada, güncellenmiş Intel 14. nesil dahili bileşenleri ve birkaç harici değişiklikle 2023 Inspiron 16 7630 2'si 1 arada'nın yerini alıyor. Belki de en önemlisi, bu yılki modelde Inspiron 16 7630 2'si 1 arada aygıttaki 2400p OLED dokunmatik ekranın yerini alan 90 Hz 1600p mini-LED dokunmatik ekran yer alıyor. Bu arada, Inspiron 16 7635 2'si 1 arada modelindeki 60 Hz 1200p IPS dokunmatik ekran, belirli alt uç SKU'larda geri döndü.
Test ünitemiz, Meteor Lake-H Core Ultra 7 155H CPU ve entegre Arc 8 grafikleri ile yaklaşık 1000 USD karşılığında üst düzey bir yapılandırmadır. Core Ultra 5 125U ile daha düşük uçlu bir seçenek, eski 60 Hz 1200p IPS panel ile 200 $ daha ucuza mevcuttur, ancak her iki durumda da ayrı GPU seçeneği yoktur. İlginç bir şekilde, Inspiron 16 7640 2'si 1 arada hem Core-U hem de Core-H işlemci seçeneklerine sahip birkaç dönüştürülebilir cihazdan biridir, çünkü çoğu yalnızca birini sunarken diğerini sunmamaktadır.
Bu yazı yazıldığı sırada AMD Zen 4 SKU'ları mevcut değildir. Gelecekte olması halinde, bunlar muhtemelen Inspiron 16 7645 2'si 1 arada model adı altında olacak ve AMD tabanlı Inspiron 16 7635 2'si 1 arada'nın yerini alacaktır.
Inspiron 16 7640 2'si 1 arada'nın rakipleri arasında diğer orta ve üst orta seviye 16 inç dönüştürülebilir bilgisayarlar yer alıyor HP Envy x360 2'si 1 arada 16 veya Lenovo Yoga 7 2'si 1 arada 16. Ancak Dell, mini LED seçeneği ile benzersizdir.
Daha fazla Dell incelemesi:
Karşılaştırmalı olarak olası rakipler
Derecelendirme | Sürüm | Tarih | Modeli | Ağırlık | Yükseklik | Boyut | Çözünürlük | Fiyat |
|---|---|---|---|---|---|---|---|---|
| 82.1 % | v8 | 07/2024 | Dell Inspiron 16 7640 2-in-1 Ultra 7 155H, Arc 8-Core | 2.1 kg | 18.99 mm | 16.00" | 2560x1600 | |
| 83.4 % | v8 | 06/2024 | Dell Inspiron 16 Plus 7640 Ultra 7 155H, NVIDIA GeForce RTX 4060 Laptop GPU | 2.2 kg | 19.9 mm | 16.00" | 2560x1600 | |
| 87.2 % v7 (old) | v7 (old) | 05/2024 | HP Envy x360 2-in-1 16-ad0097nr R7 8840HS, Radeon 780M | 1.8 kg | 18.3 mm | 16.00" | 2880x1800 | |
| 87.9 % v7 (old) | v7 (old) | 05/2024 | Lenovo IdeaPad Pro 5 16IMH G9 Ultra 7 155H, Arc 8-Core | 1.9 kg | 17.5 mm | 16.00" | 2560x1600 | |
| 88.7 % v7 (old) | v7 (old) | 02/2024 | HP Pavilion Plus 16-ab0456tx i7-13700H, GeForce RTX 3050 6GB Laptop GPU | 1.9 kg | 19.9 mm | 16.00" | 2560x1600 | |
| 87.6 % v7 (old) | v7 (old) | 11/2023 | Asus VivoBook Pro 16 K6602VU i9-13900H, NVIDIA GeForce RTX 4050 Laptop GPU | 1.9 kg | 19 mm | 16.00" | 3200x2000 |
İpucu: Derecelendirme Sistemimizi kısa bir süre önce güncelledik ve Sürüm 8'in sonuçları Sürüm 7'nin sonuçlarıyla karşılaştırılamaz. Daha fazla bilgi için hier verfügbar.
Not: Derecelendirme sistemimizi yakın zamanda güncelledik ve 8. sürümün sonuçları 7. sürümün sonuçları ile karşılaştırılamaz. Daha fazla bilgi için burada .
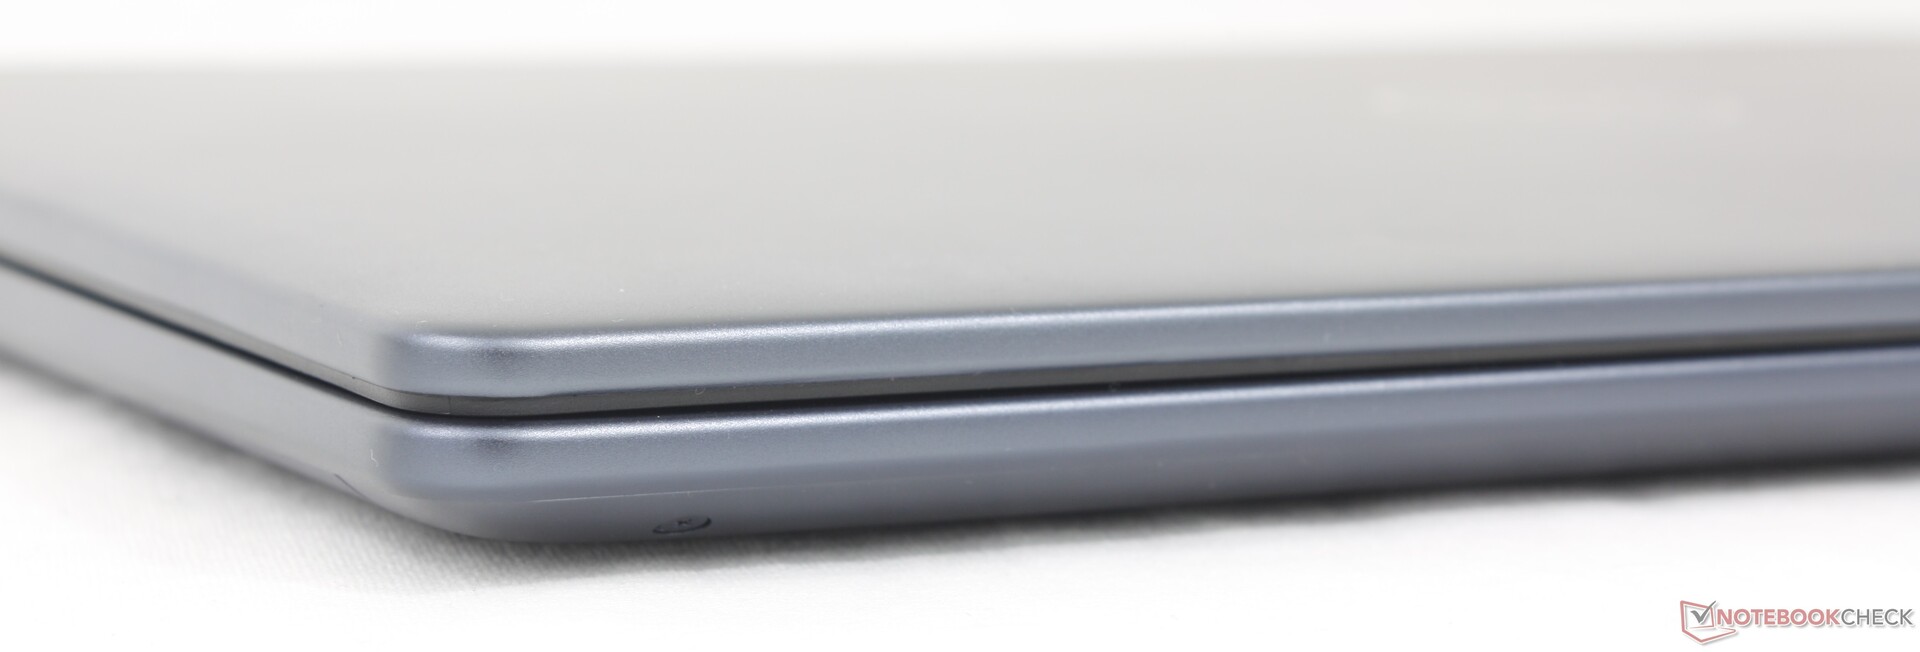
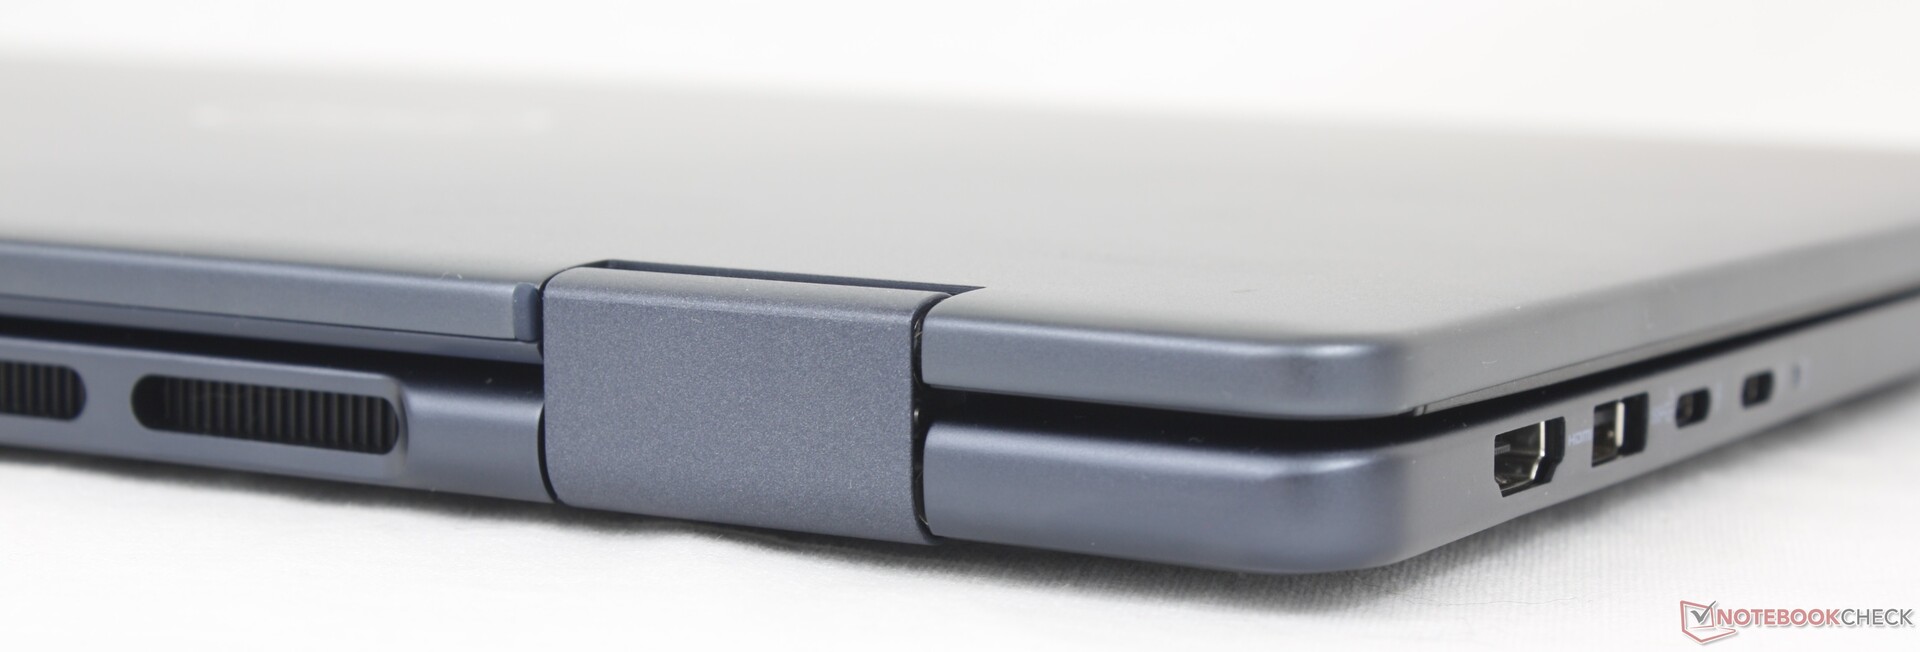
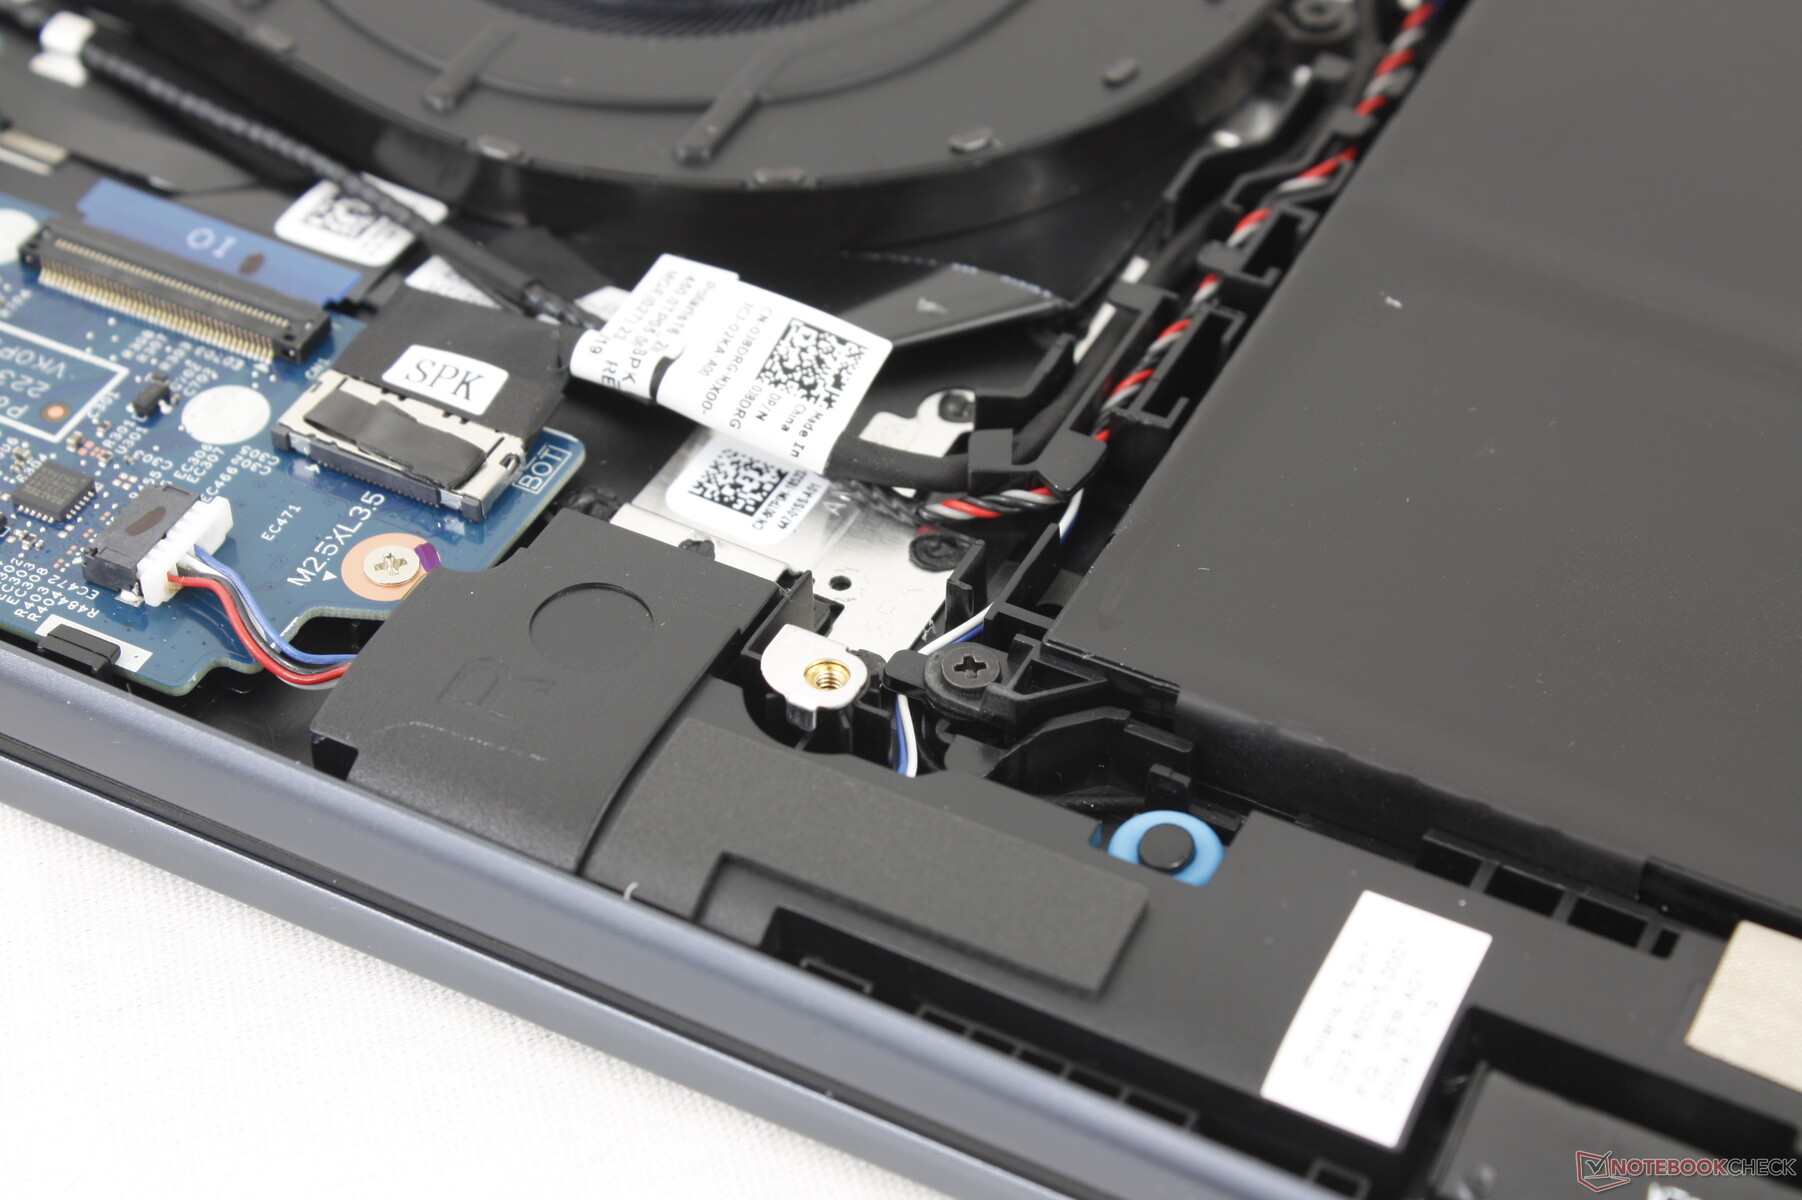
Kasa - Sağlam Ama Ağır
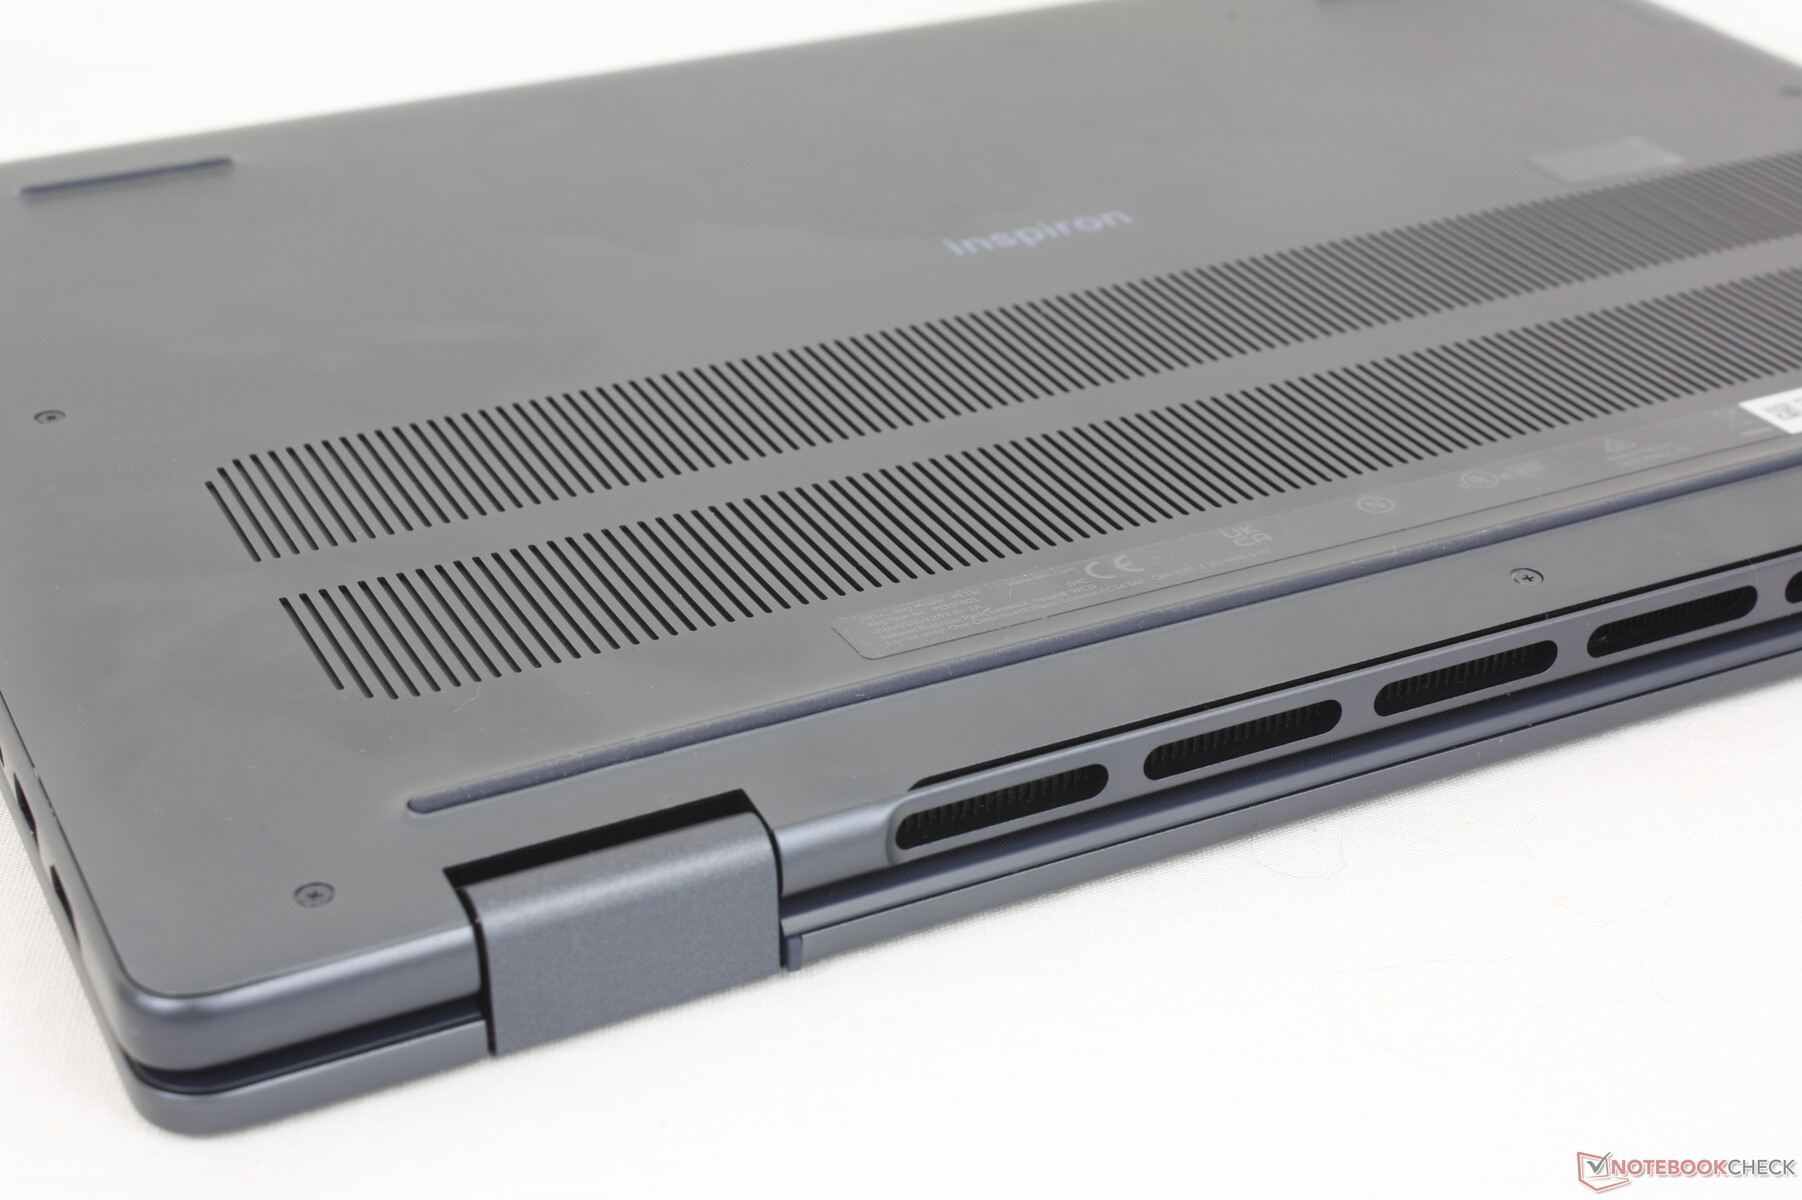
Giden modele göre birkaç dış değişiklik var. İlk olarak, avuç içi dayanağı kısmı, klavye güvertesi ile arasında daha temiz bir kenar için artık yükseltilmemiştir. İkinci olarak, alt ve arka kenardaki havalandırma ızgaraları biraz daha büyük olacak şekilde yeniden tasarlandı. Üçüncü olarak, arka kenarın kendisi daha kutu gibi bir görünüm için daha kalın.
Yukarıdaki estetik değişikliklerin dışında, kasa malzemeleri eskisi ile aynı kalarak sağlamlık veya kalite açısından önemli bir gelişme göstermiyor. Kapak ve taban hala sırasıyla alüminyum ve plastikten oluşuyor ve özellikle orta seviye bir model için sağlam ilk izlenimler için bükülme ve çökmelere karşı iyi direnç gösteriyor. Modelin yapı kalitesinden çok tablet modunda kullanımının ne kadar ağır olduğu konusunda endişeliyiz.
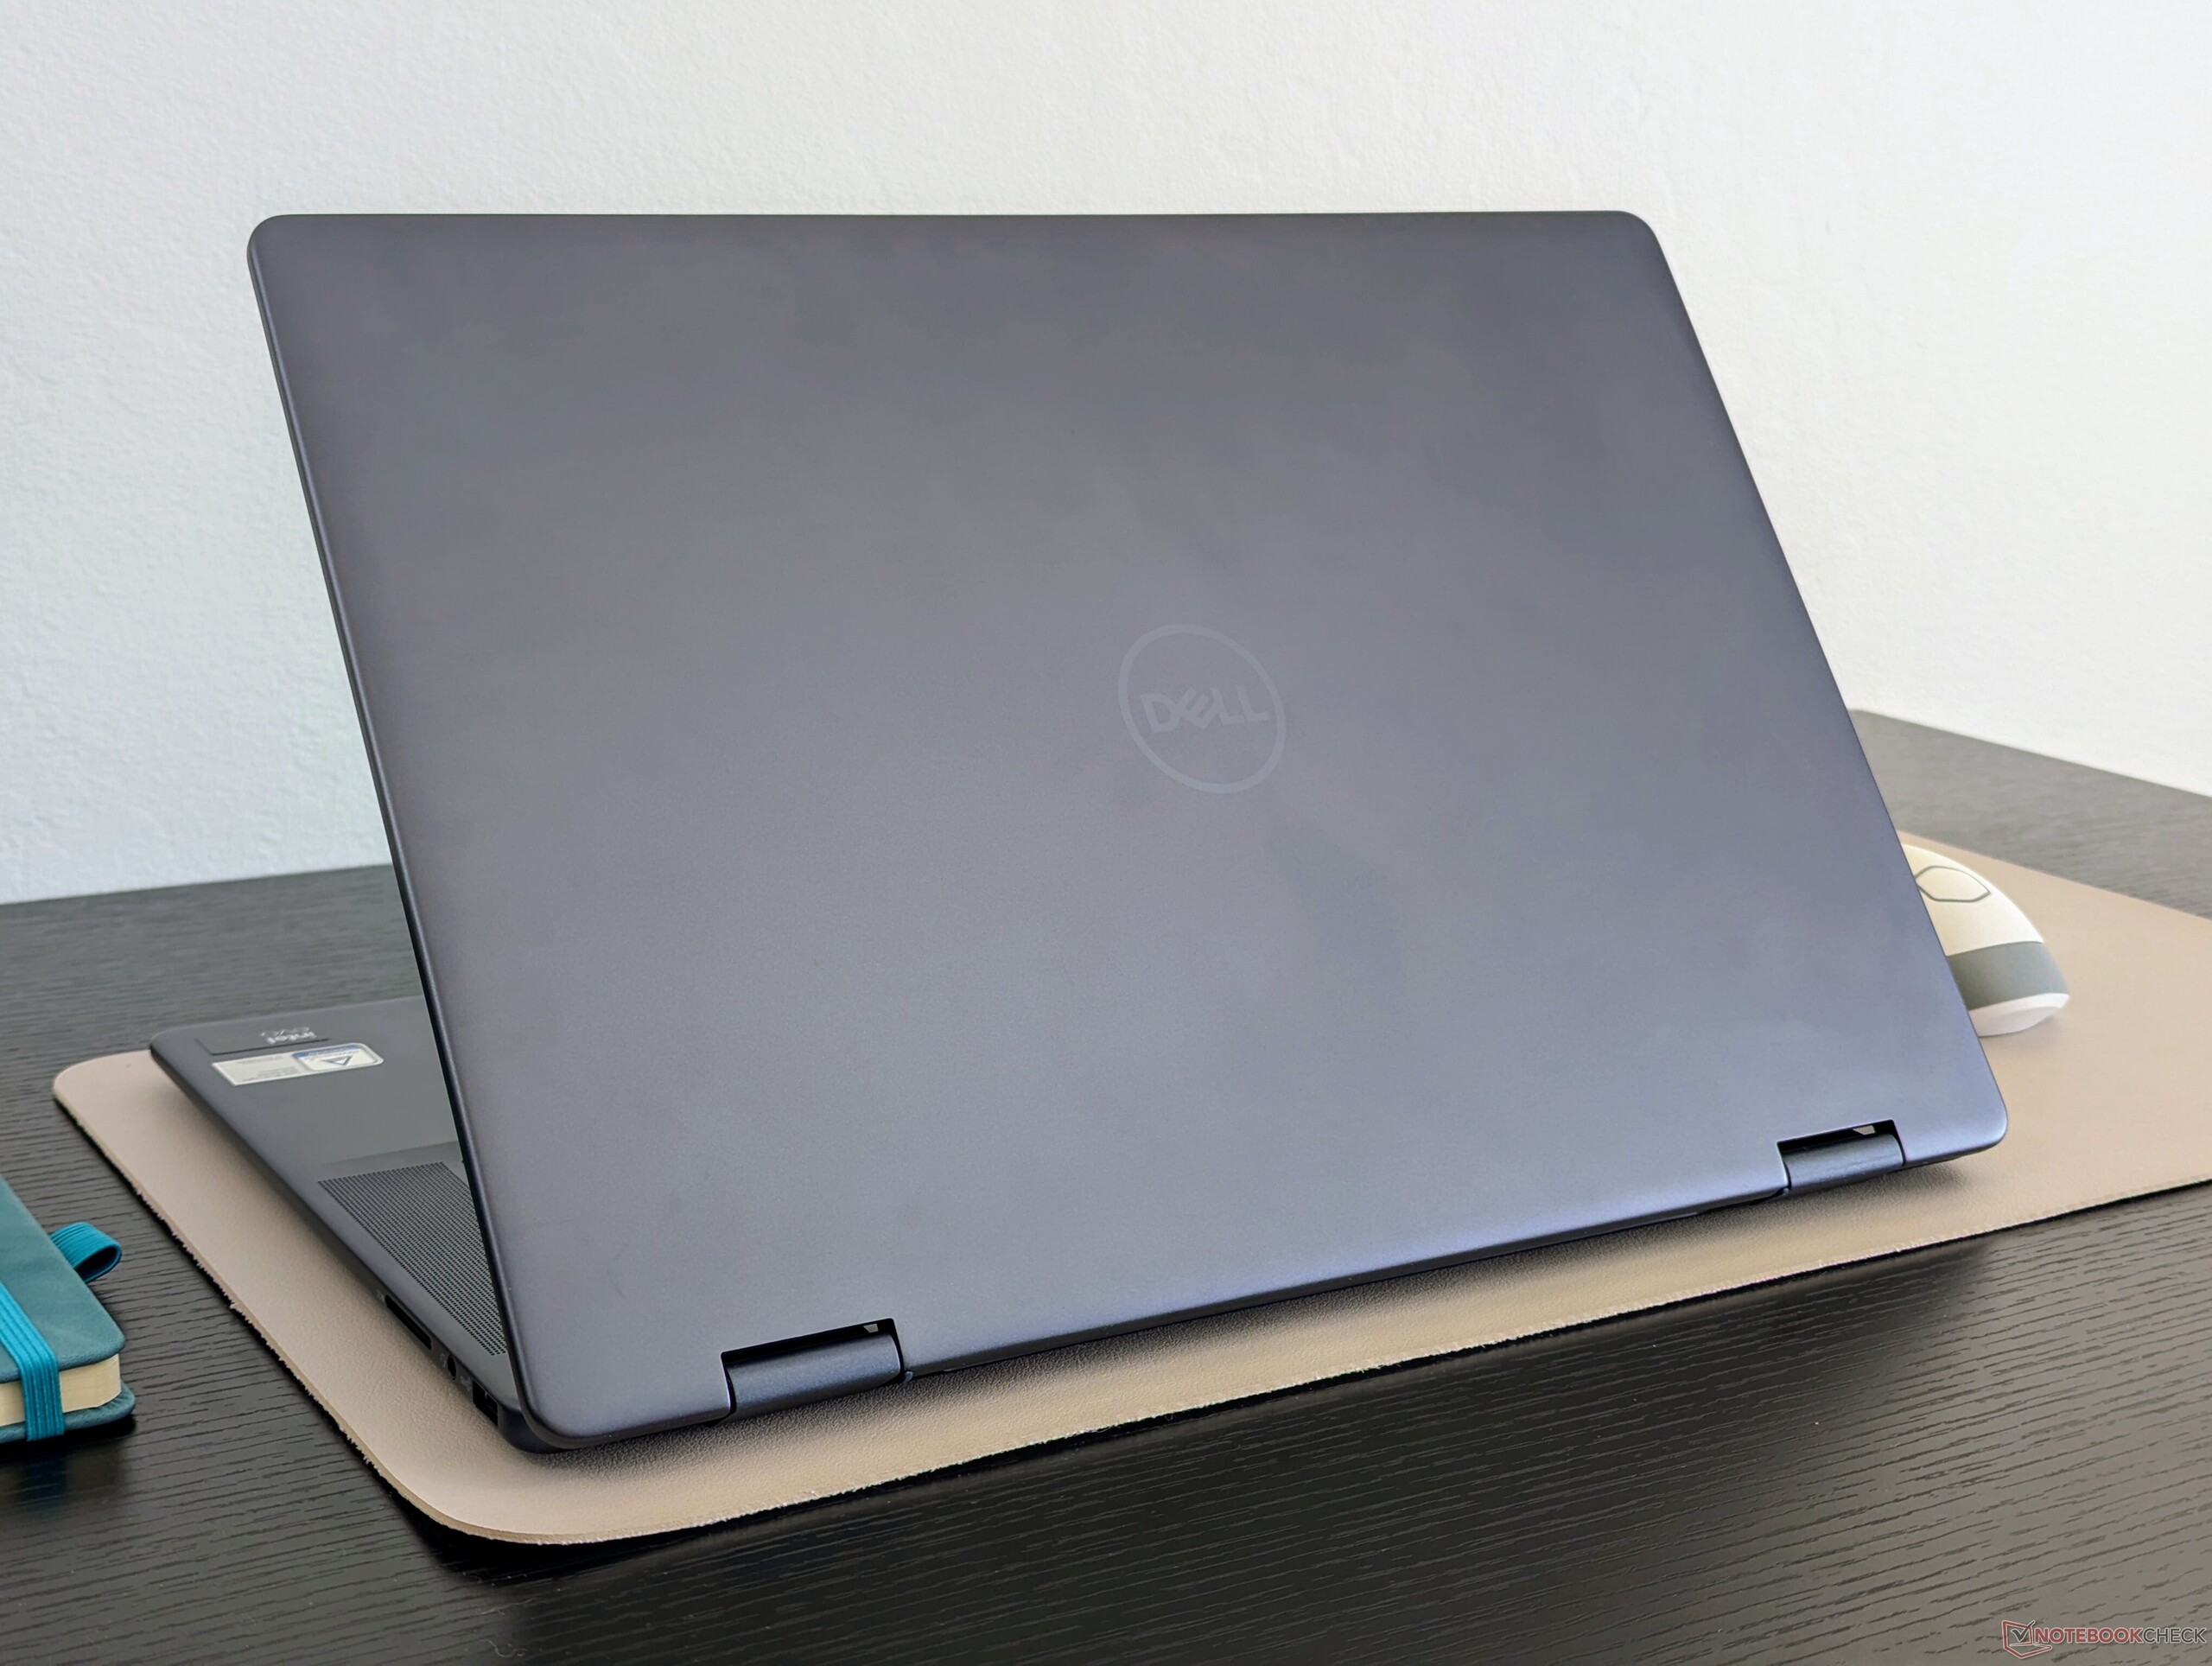
Hem boyutlar hem de ağırlık hem 2023 Inspiron 16 7630 2'si 1 arada hem de 2024 Inspiron 16 Plus 7640 kapaklı her ne kadar ikincisi ayrı bir GPU seçeneği içerse de. Daha hafif bir tasarım tercih ederdik çünkü 16 inç HP Envy x360 16 ve Samsung Galaxy Book4 Pro 360 her biri bizim Dell'imizden belirgin şekilde daha hafif. 16 inçlik bir dönüştürülebilir bilgisayar ne olursa olsun nispeten ağır olacak olsa da, Inspiron 16 7640 2'si 1 arada muhtemelen seyahat için grubun en kötülerinden biri.

Bağlanabilirlik
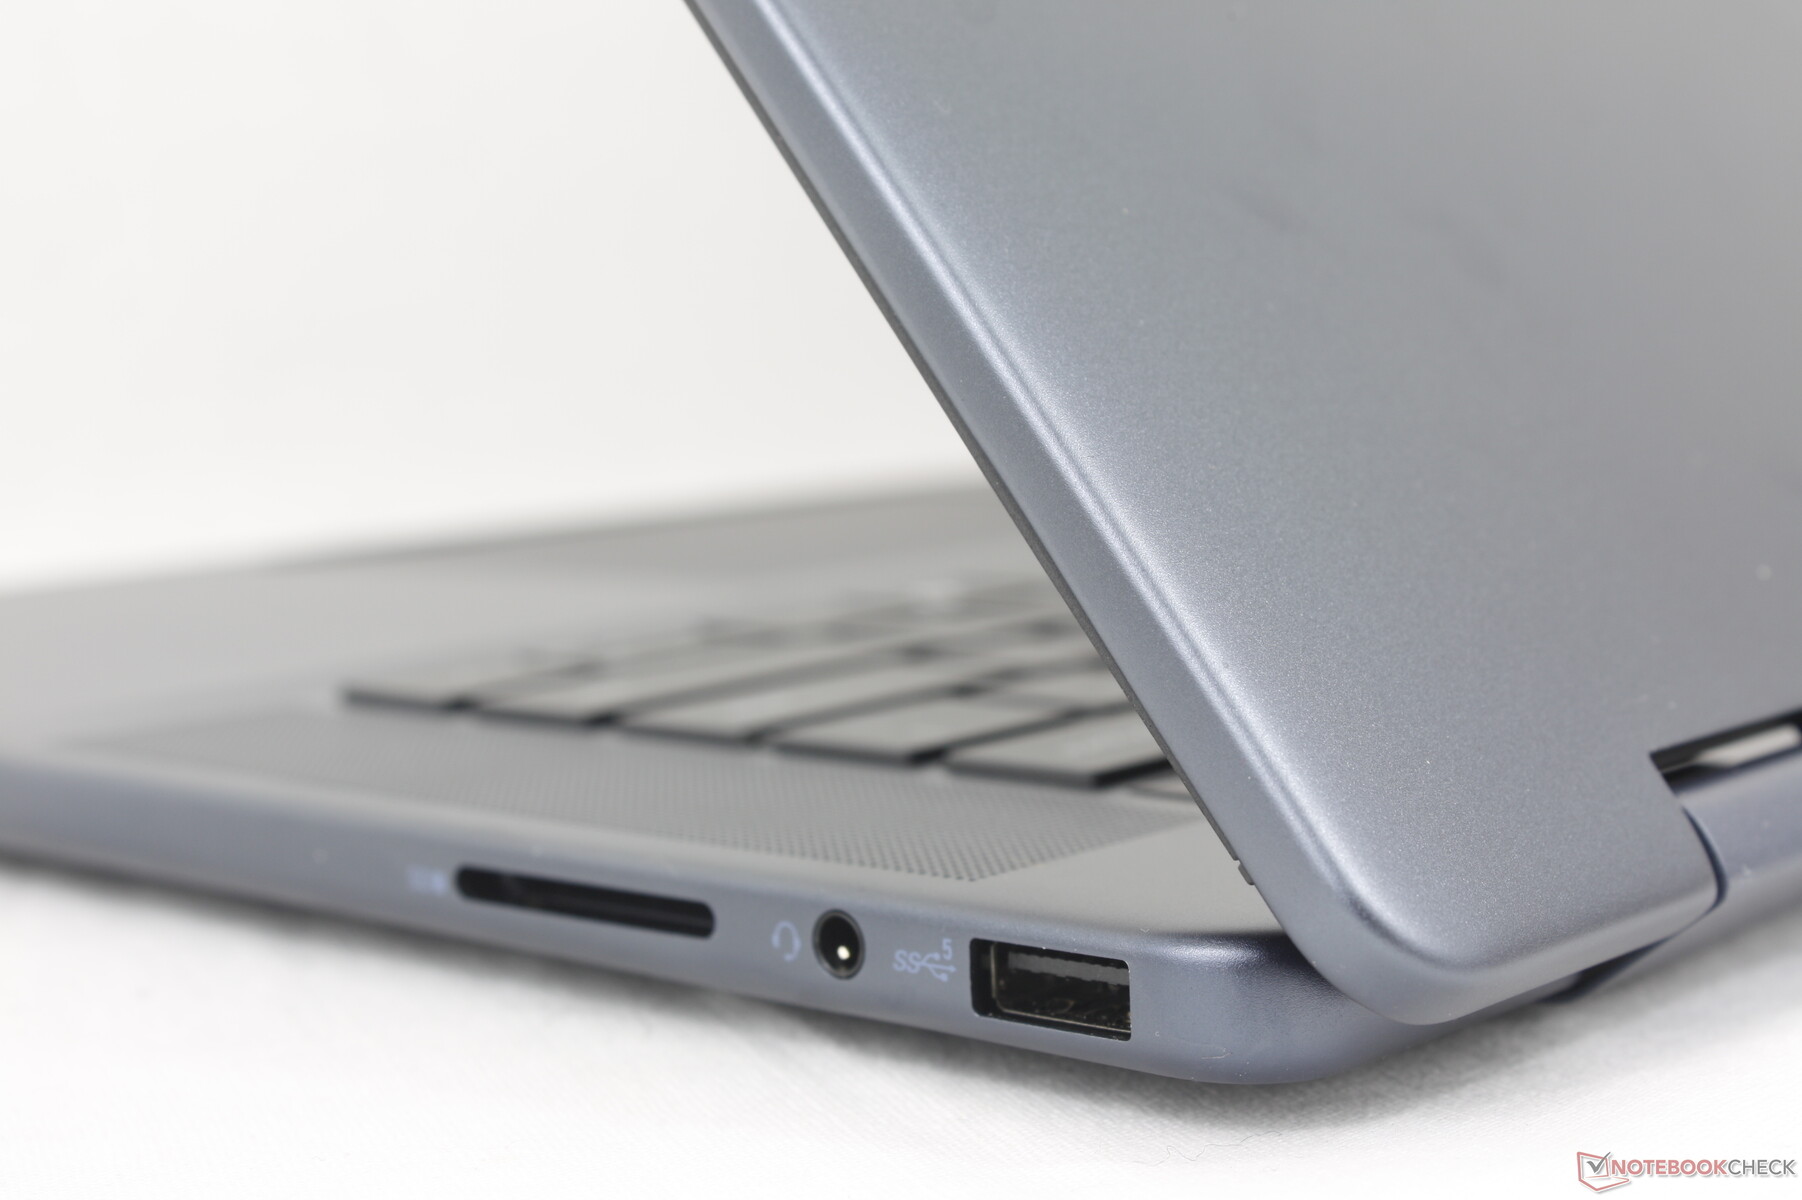
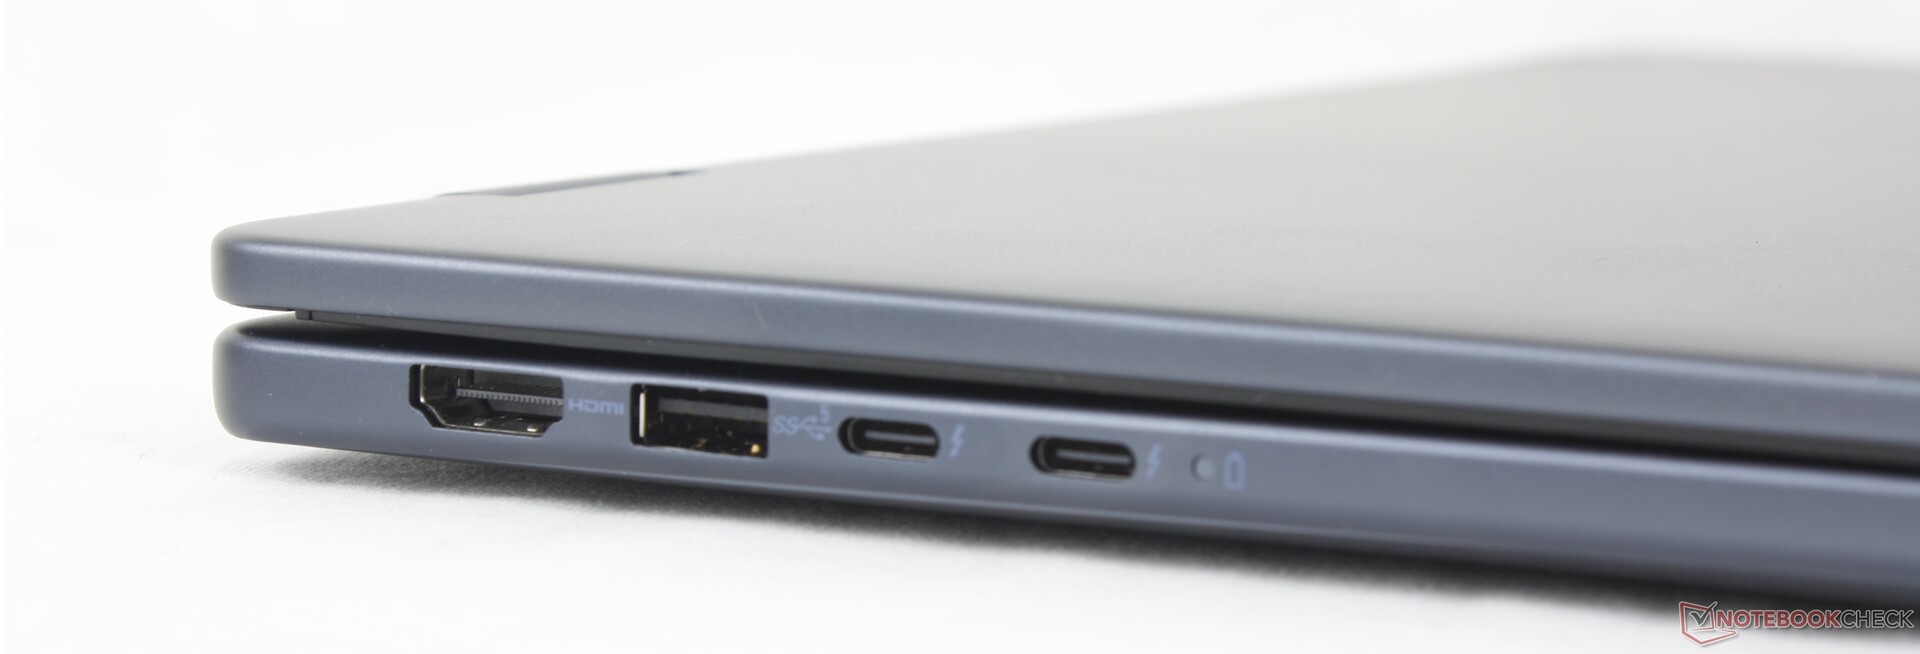
Bağlantı noktası seçenekleri ve konumlandırma Inspiron 16 7635 2'si 1 arada ya da 7630 2'si 1 arada cihazların dış görünüşlerindeki sayısız değişikliğe rağmen. Thunderbolt 4'ün yine yalnızca Intel SKU'larında mevcut olduğunu ve HDMI bağlantı noktasının yalnızca sürüm 1.4 olmaya devam ettiğini unutmayın.
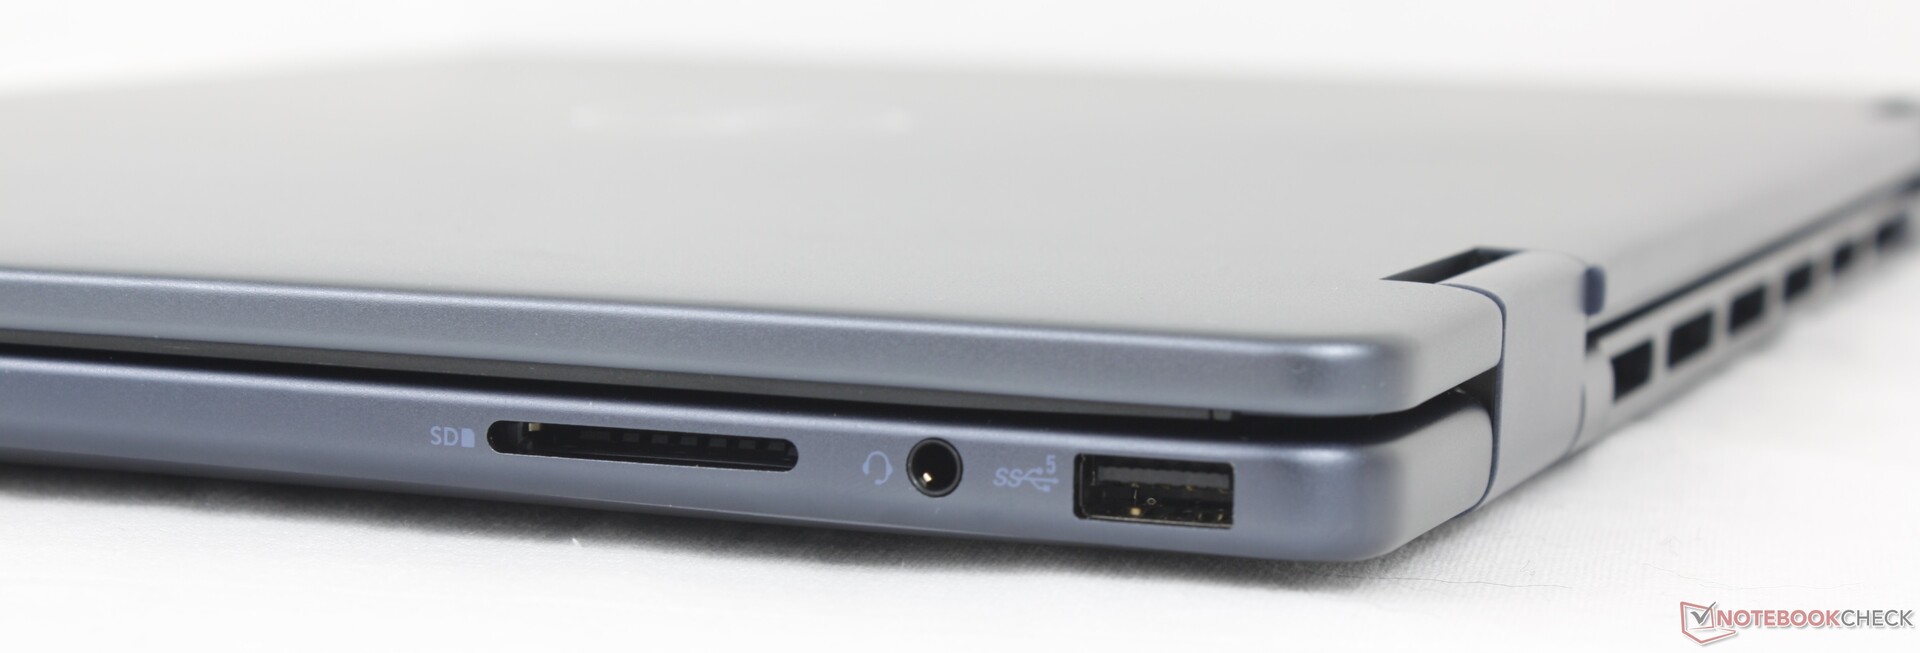
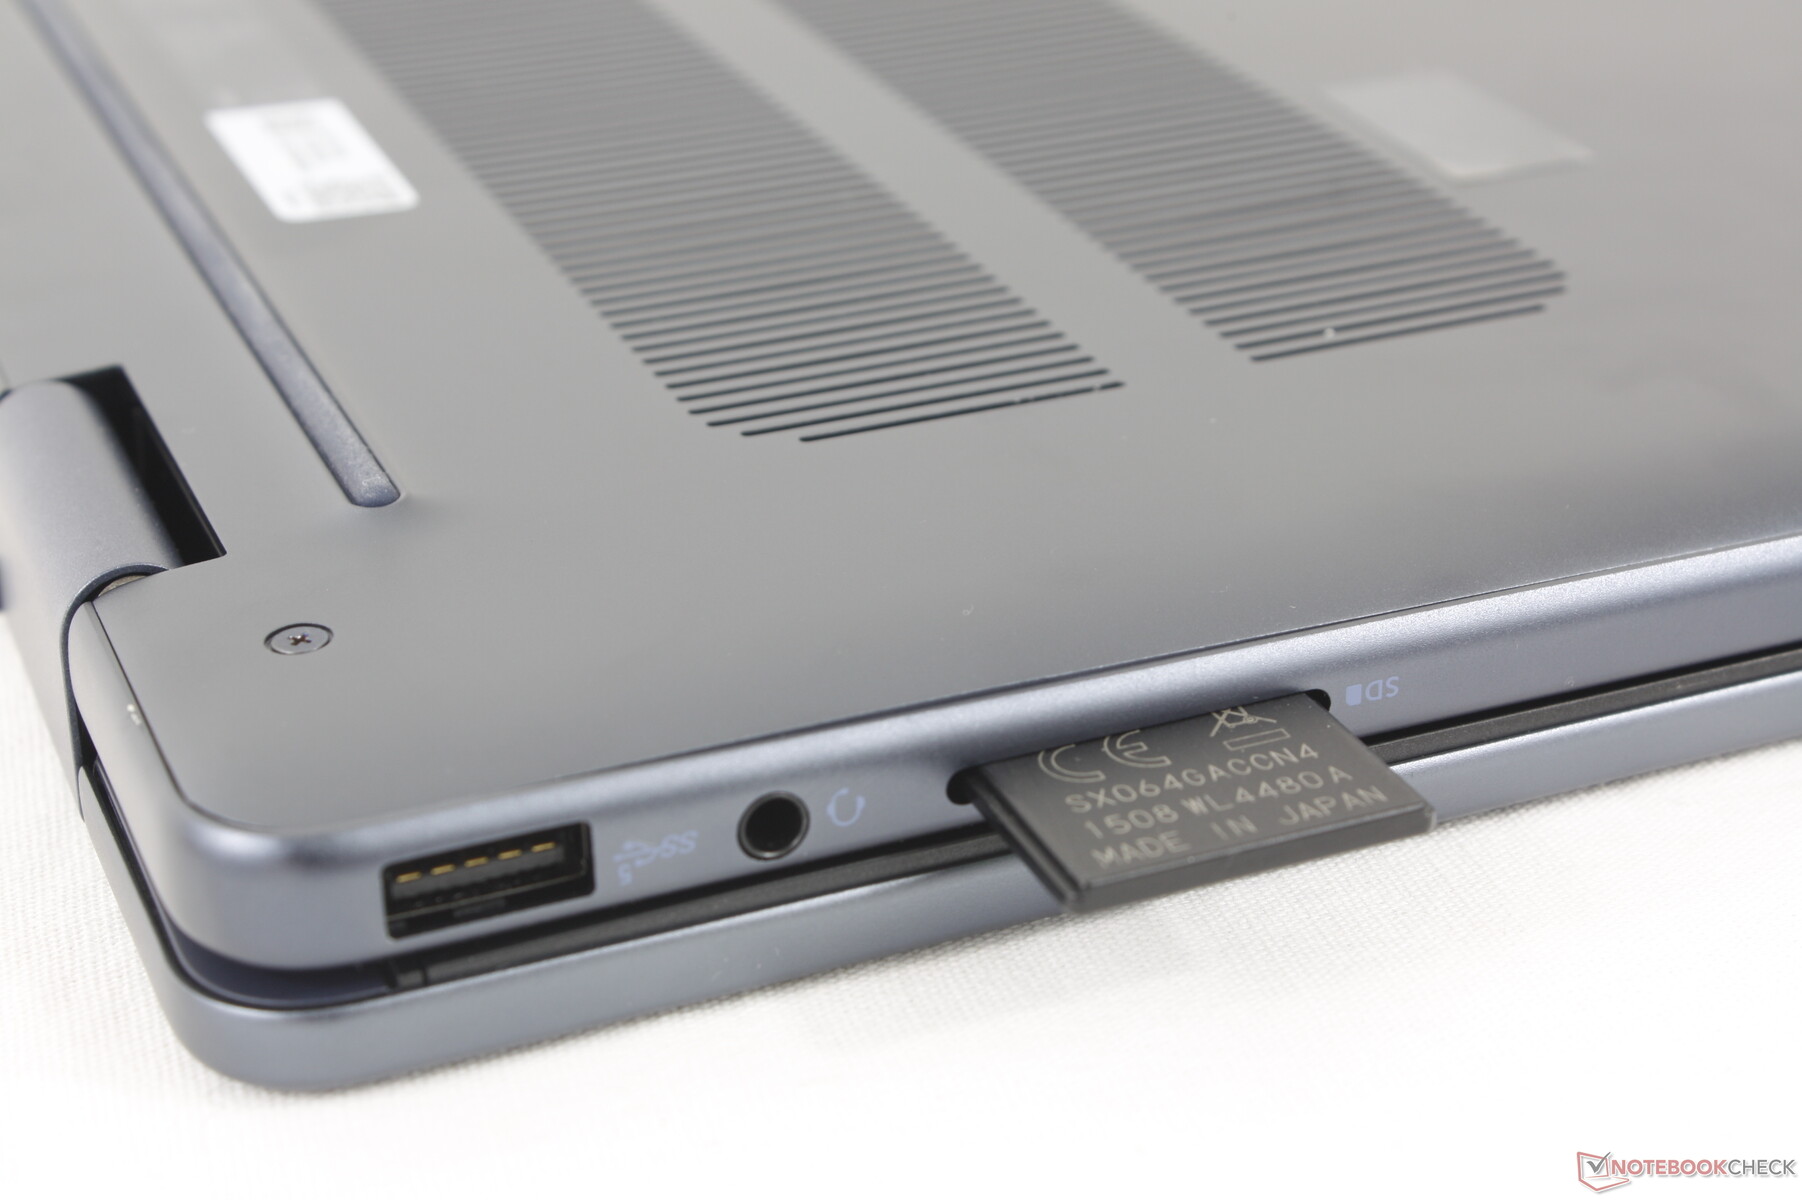
SD Kart Okuyucu
Entegre SD kart okuyucu ile aktarım hızları, 30 MB/s'nin biraz altında olan geçen yılki modele göre iyileşmedi. lenovo IdeaPad Pro 5 16 gibi 16 inçlik kapaklı modeller 2 kattan fazla daha hızlı olabilir ve XPS 16 daha da hızlıdır. SD kartlara güvenen kullanıcılar Inspiron'daki kullanışlı entegre kart okuyucuyu takdir edebilirler, ancak yavaş hızlar nedeniyle hayal kırıklığına uğrayacaklardır.
| SD Card Reader | |
| average JPG Copy Test (av. of 3 runs) | |
| Samsung Galaxy Book4 Pro 360 (Angelbird AV Pro V60) | |
| Lenovo IdeaPad Pro 5 16IMH G9 (Angelbird AV Pro V60) | |
| Dell Inspiron 16 7635 2-in-1 (PNY EliteX-Pro60 V60 256 GB) | |
| Dell Inspiron 16 7640 2-in-1 (Toshiba Exceria Pro SDXC 64 GB UHS-II) | |
| Dell Inspiron 16 Plus 7640 (Angelbird AV Pro V60) | |
| maximum AS SSD Seq Read Test (1GB) | |
| Lenovo IdeaPad Pro 5 16IMH G9 (Angelbird AV Pro V60) | |
| Samsung Galaxy Book4 Pro 360 (Angelbird AV Pro V60) | |
| Dell Inspiron 16 7635 2-in-1 (PNY EliteX-Pro60 V60 256 GB) | |
| Dell Inspiron 16 7640 2-in-1 (Toshiba Exceria Pro SDXC 64 GB UHS-II) | |
| Dell Inspiron 16 Plus 7640 (Angelbird AV Pro V60) | |
İletişim
Model, Wi-Fi 6E ve Bluetooth 5.3 bağlantısı için Inspiron 16 7640 kapaklı modelinde bulunan Intel AX211 WLAN modülü ile birlikte geliyor. Asus AXE11000 test yönlendiricimizle eşleştirildiğinde performans sabittir, ancak 6 GHz ağdaki aktarım hızları daha hızlı olabilirdi.
Web kamerası
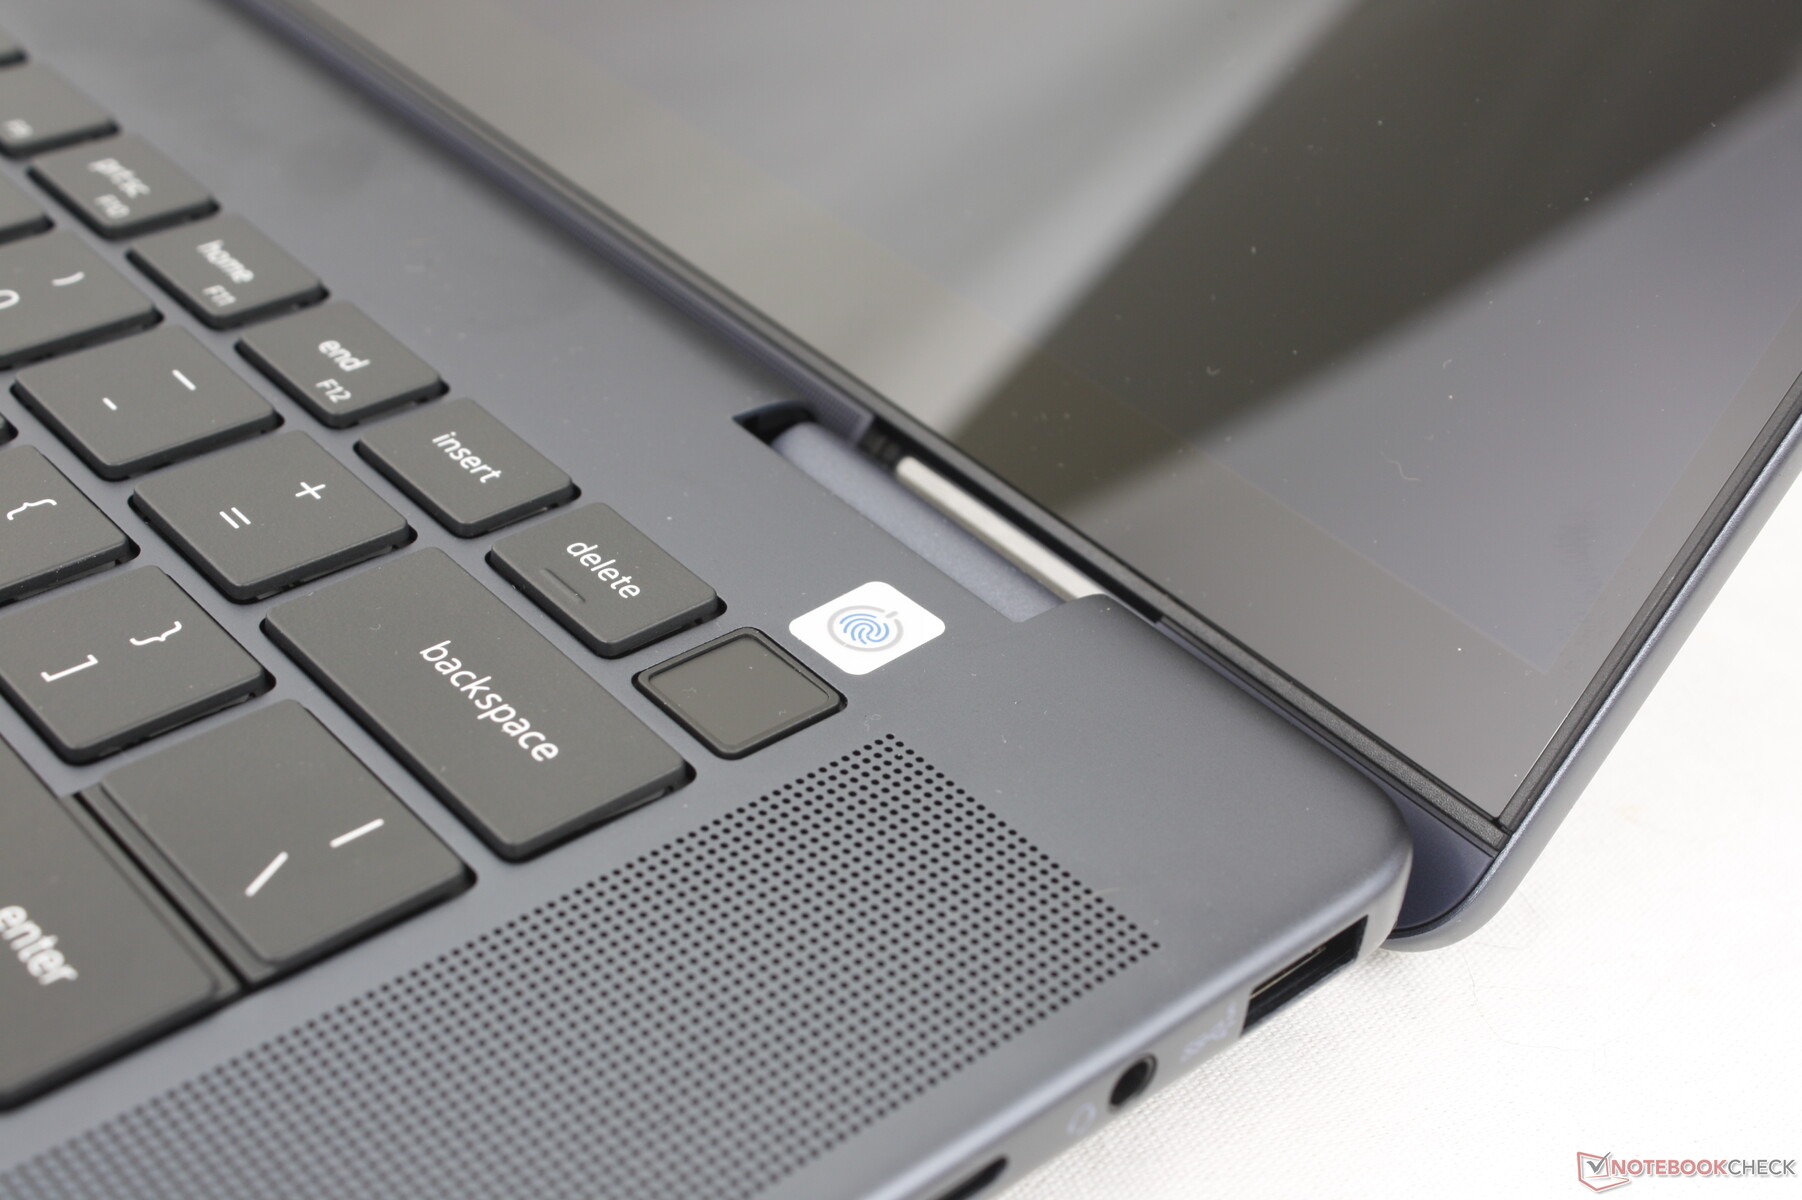
2 MP web kamerası bir kez daha IR sensörü ve fiziksel deklanşör ile standart olarak geliyor.


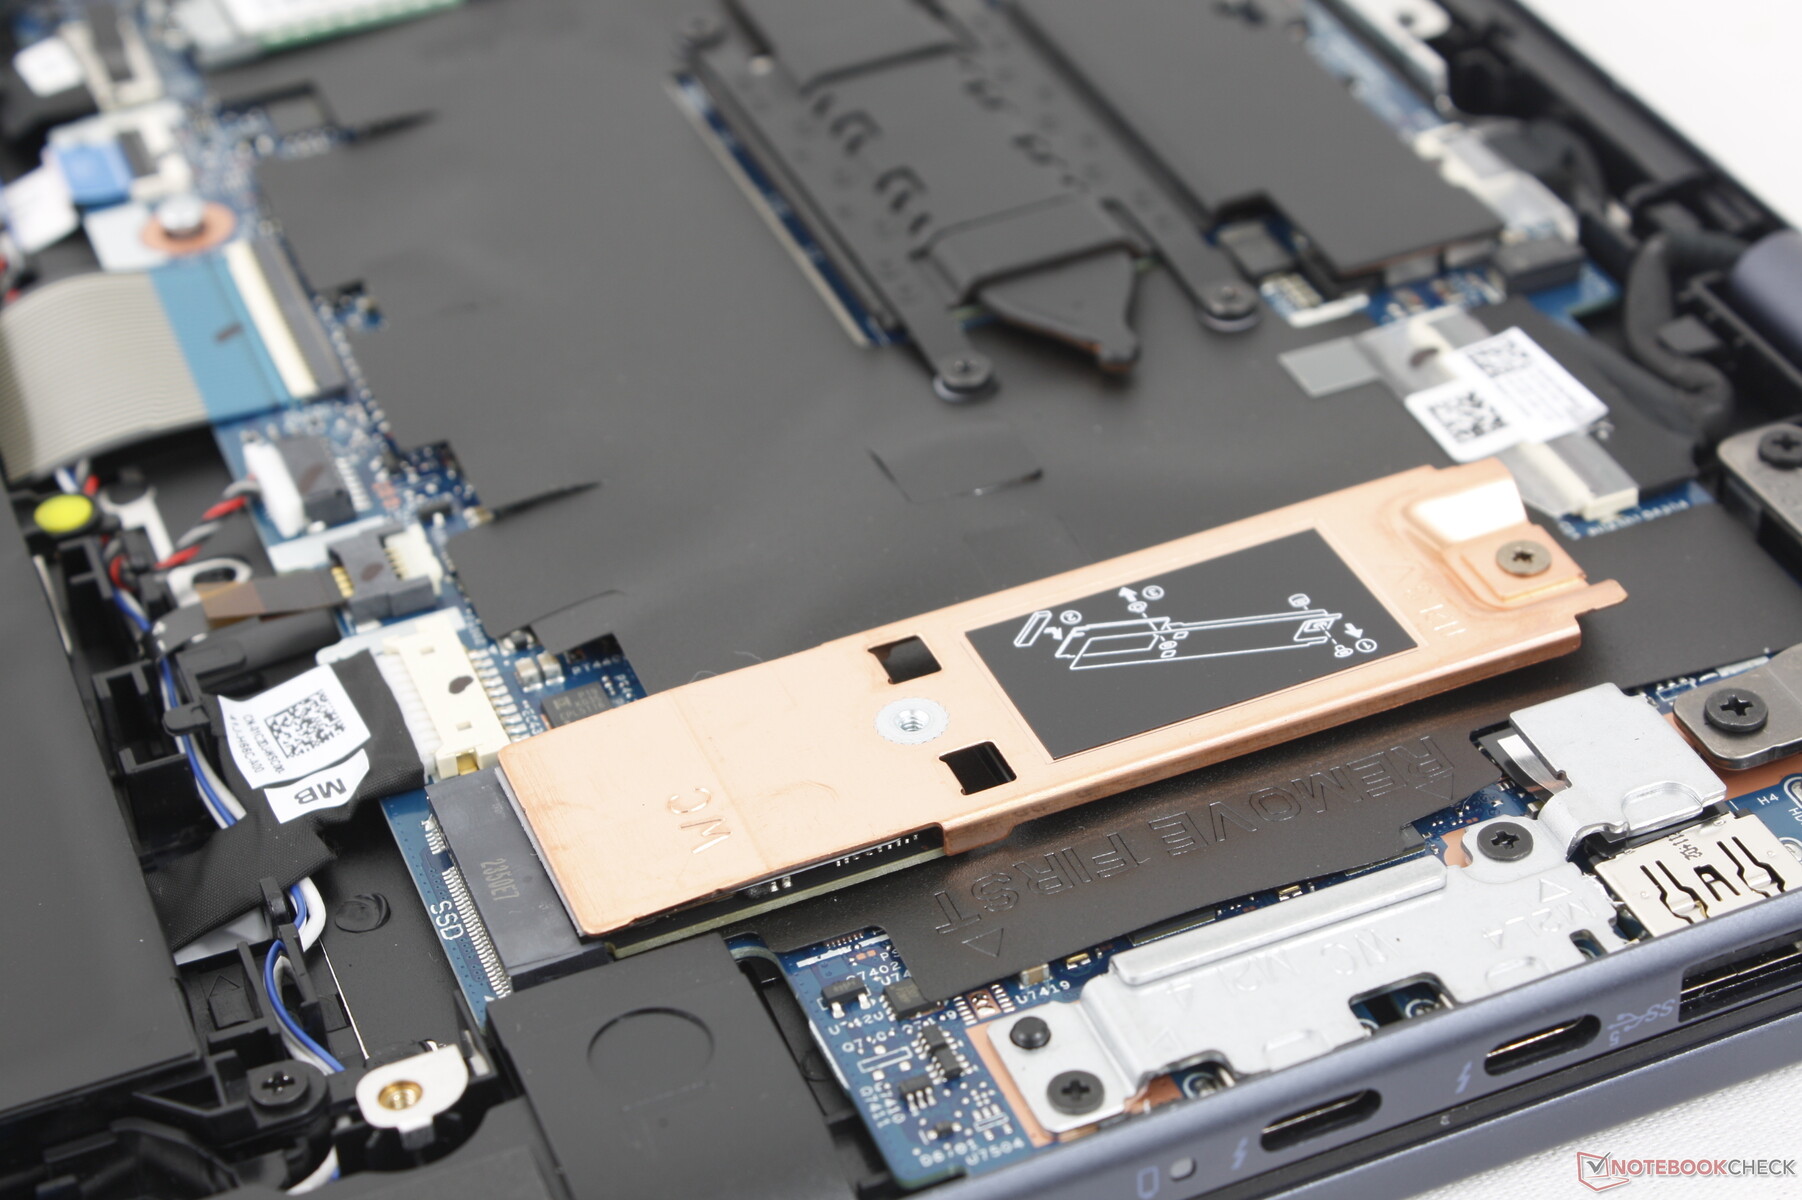
Bakım
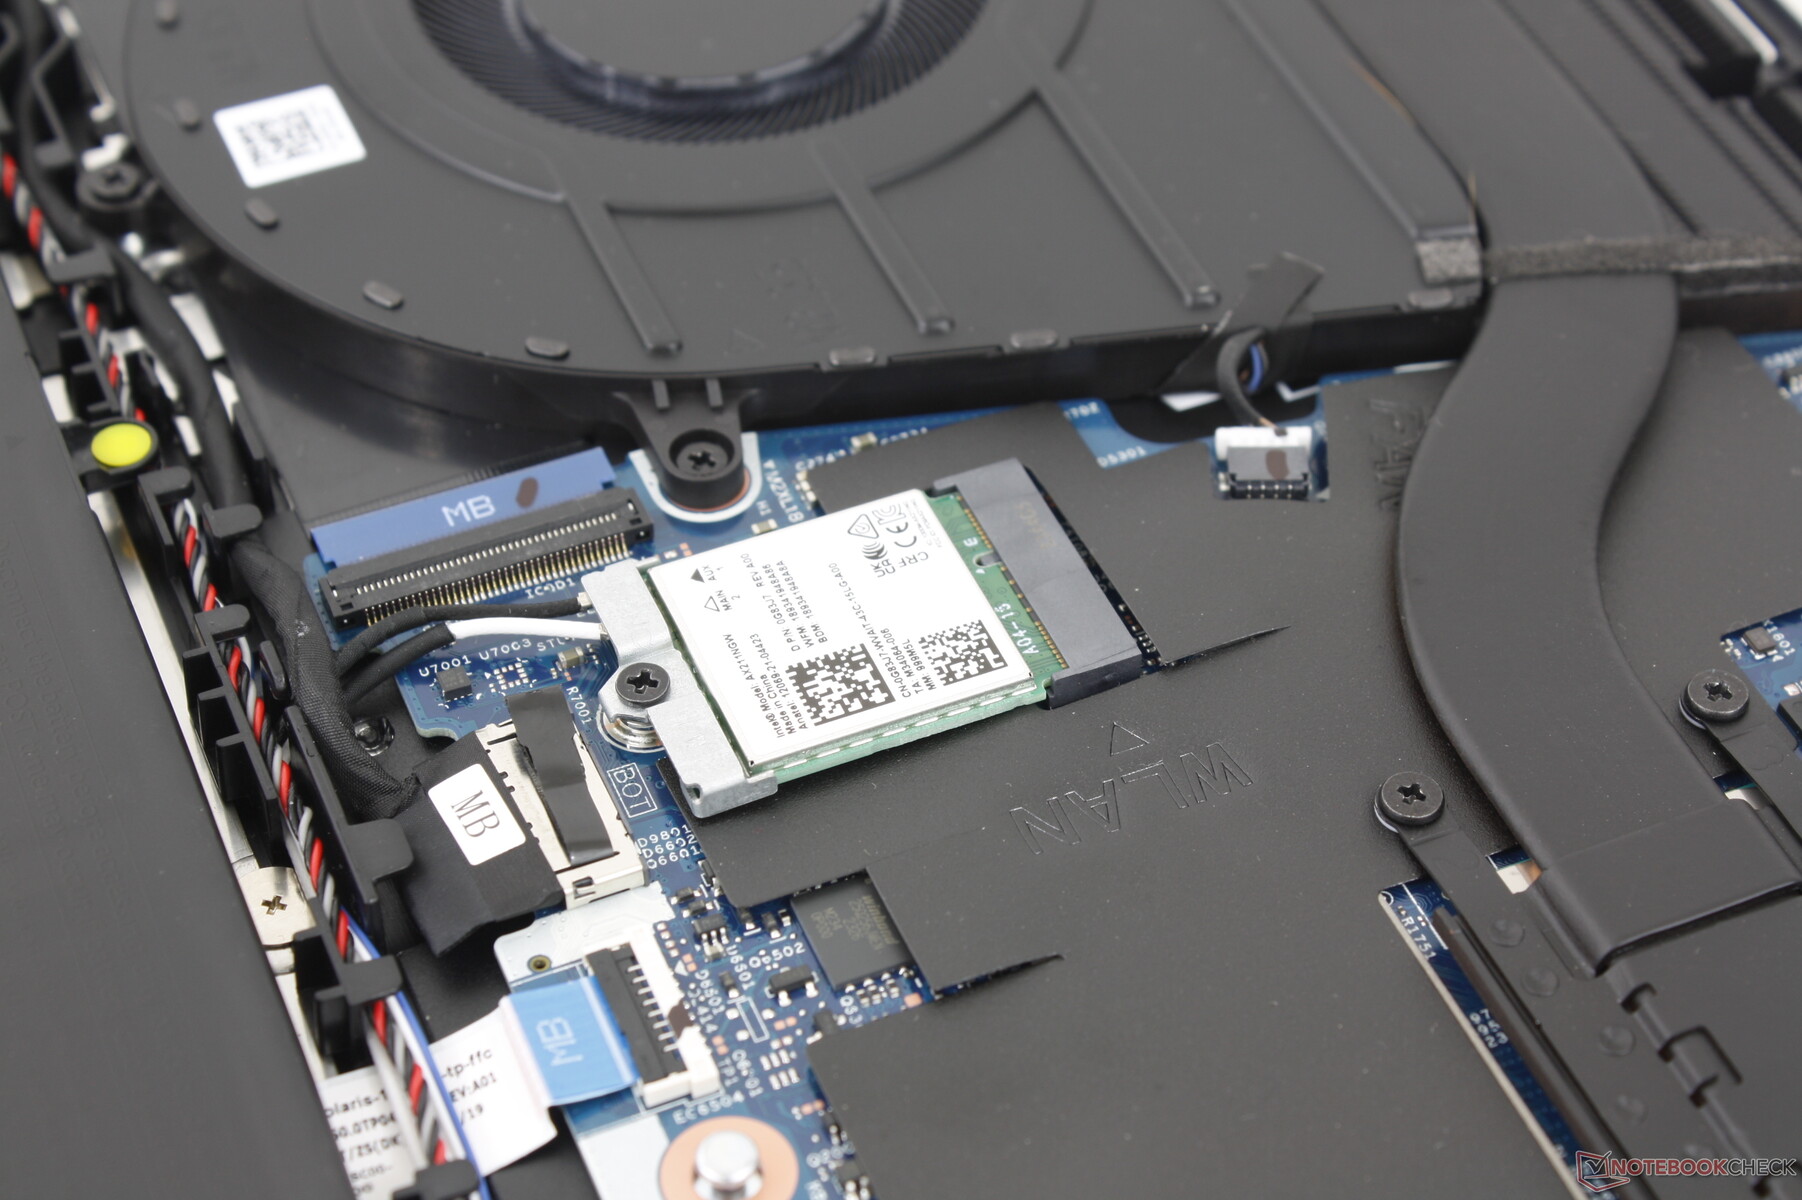
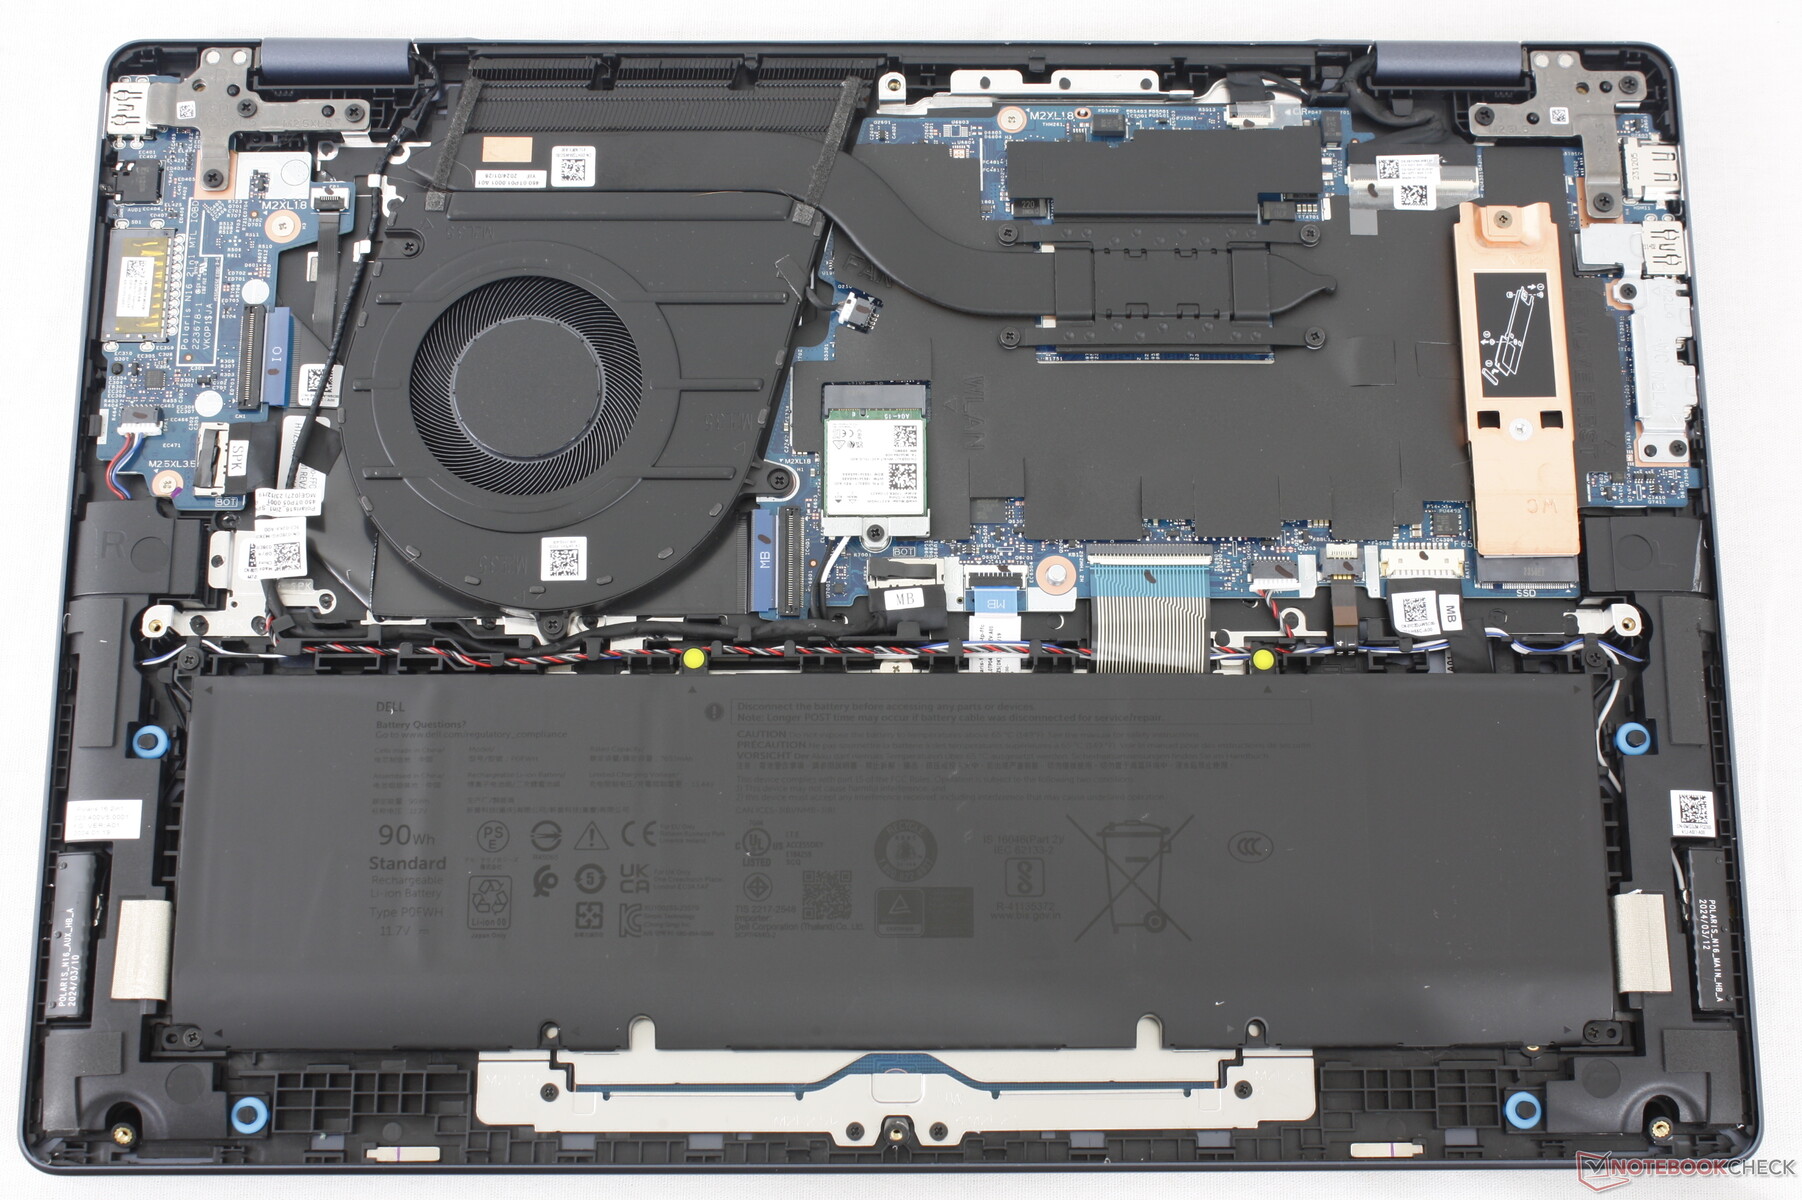
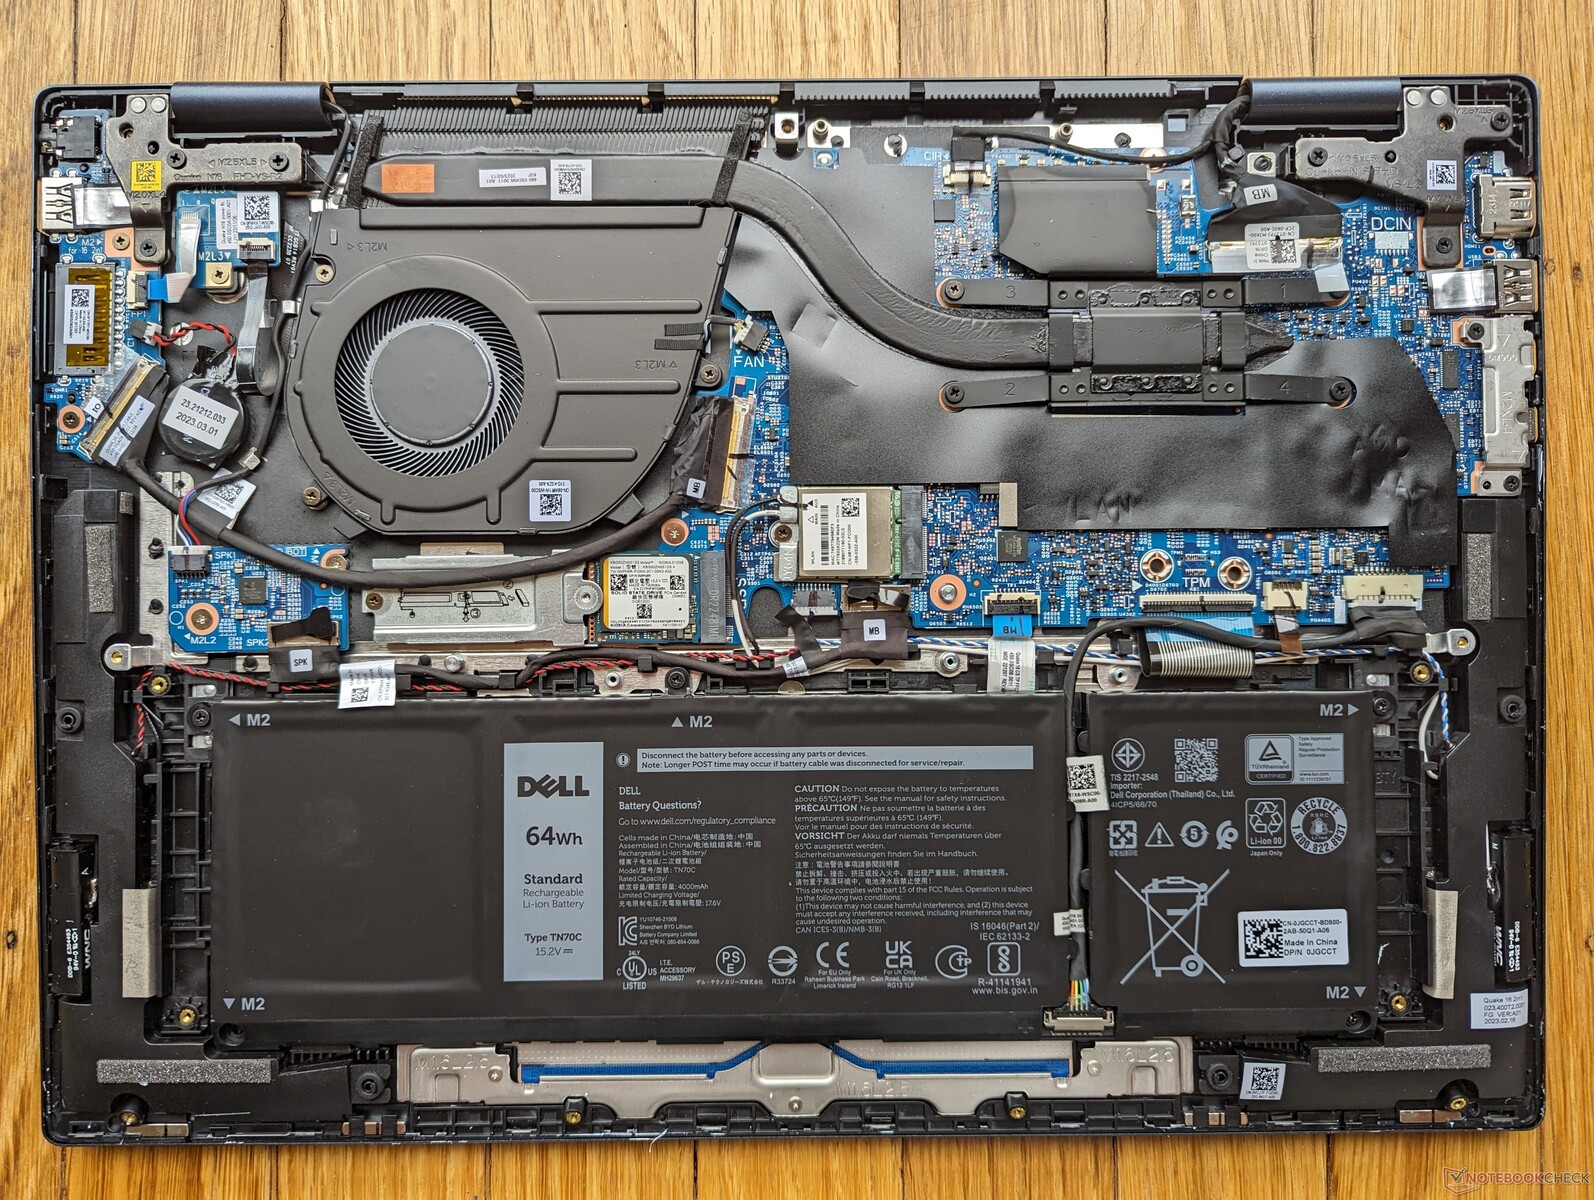
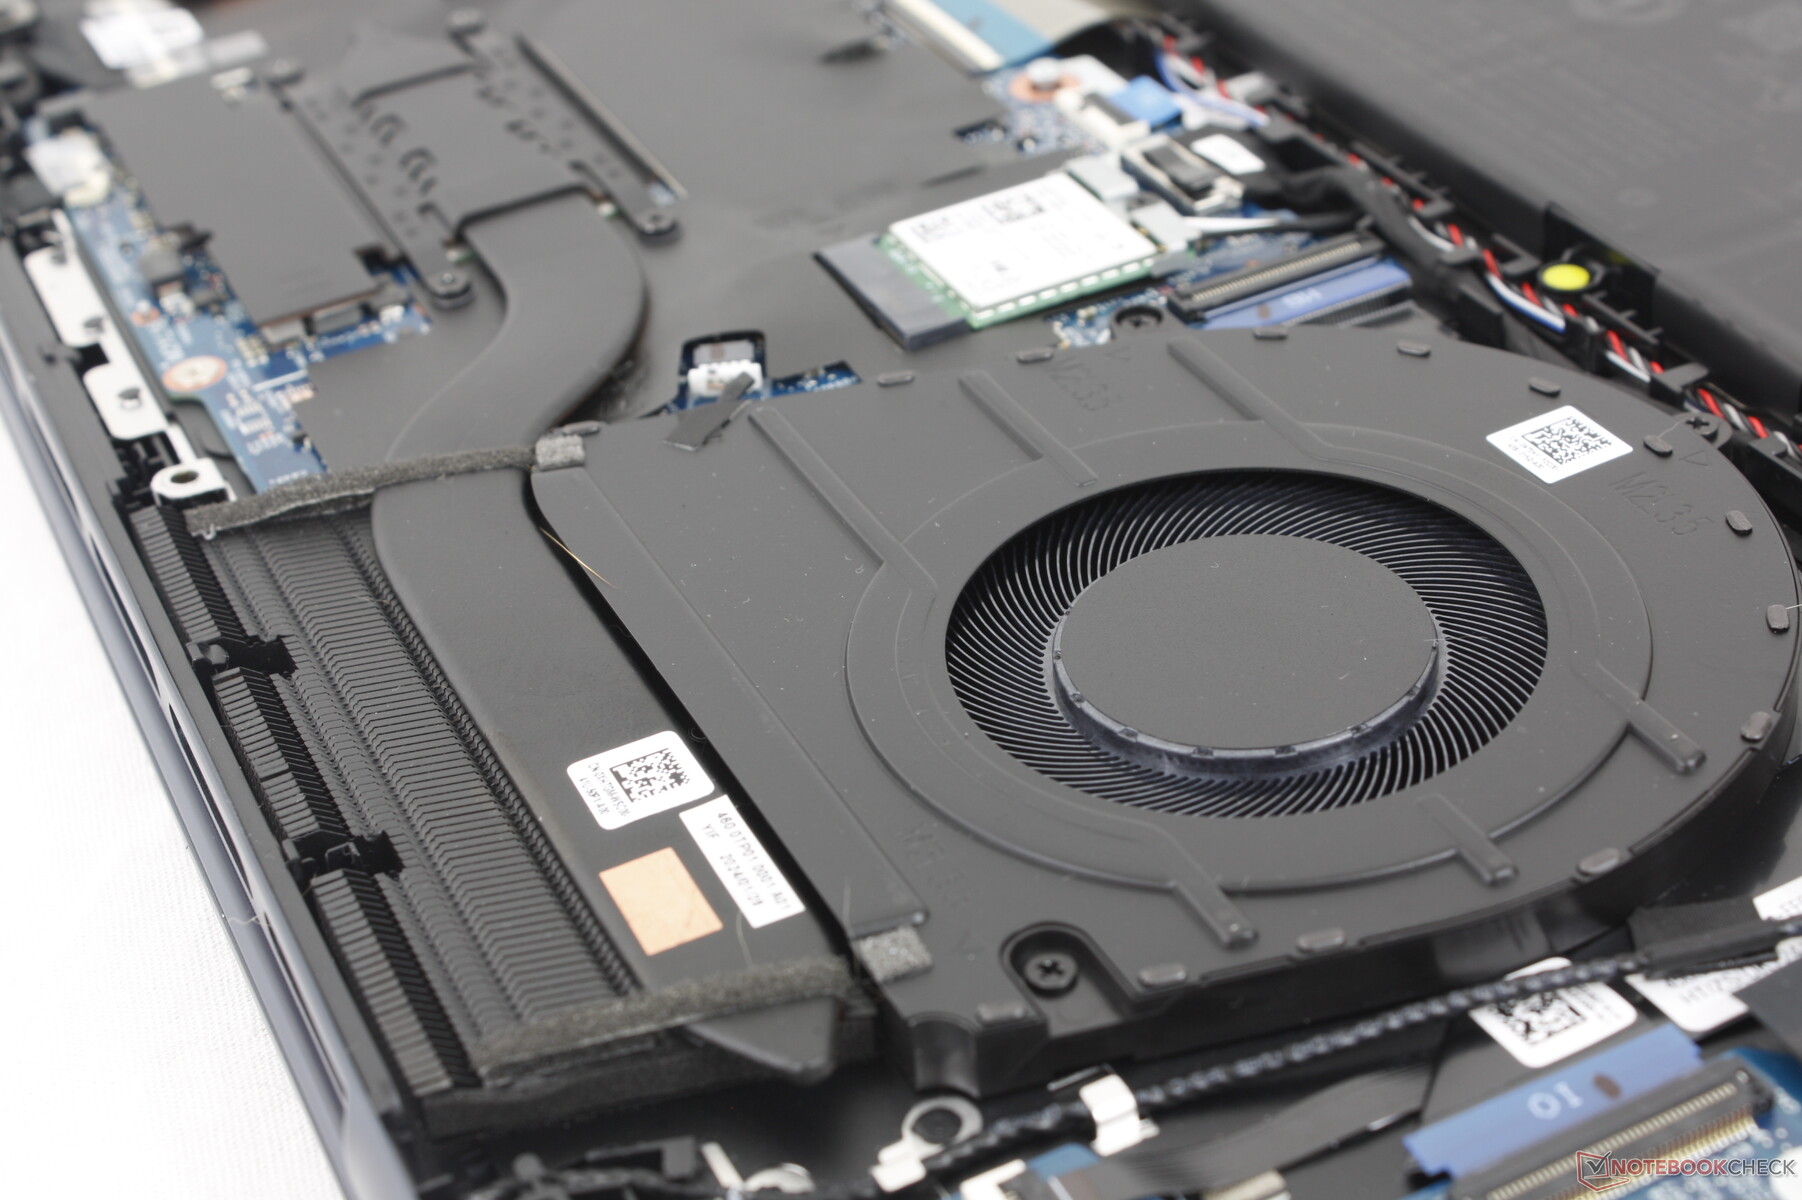
Modelimiz ile geçen yılın Inspiron 16 7635 2'si 1 arada modeli arasında birkaç dahili farklılık var. Özellikle SSD, daha büyük fan ve bataryaya yer açmak için yeniden konumlandırılırken, ısı borusu artık daha kısa uzunluğu telafi etmek için biraz daha kalın. İkincil SSD'ler desteklenmemeye devam ediyor ve RAM kullanıcı tarafından yükseltilemiyor.
Aksesuarlar ve Garanti
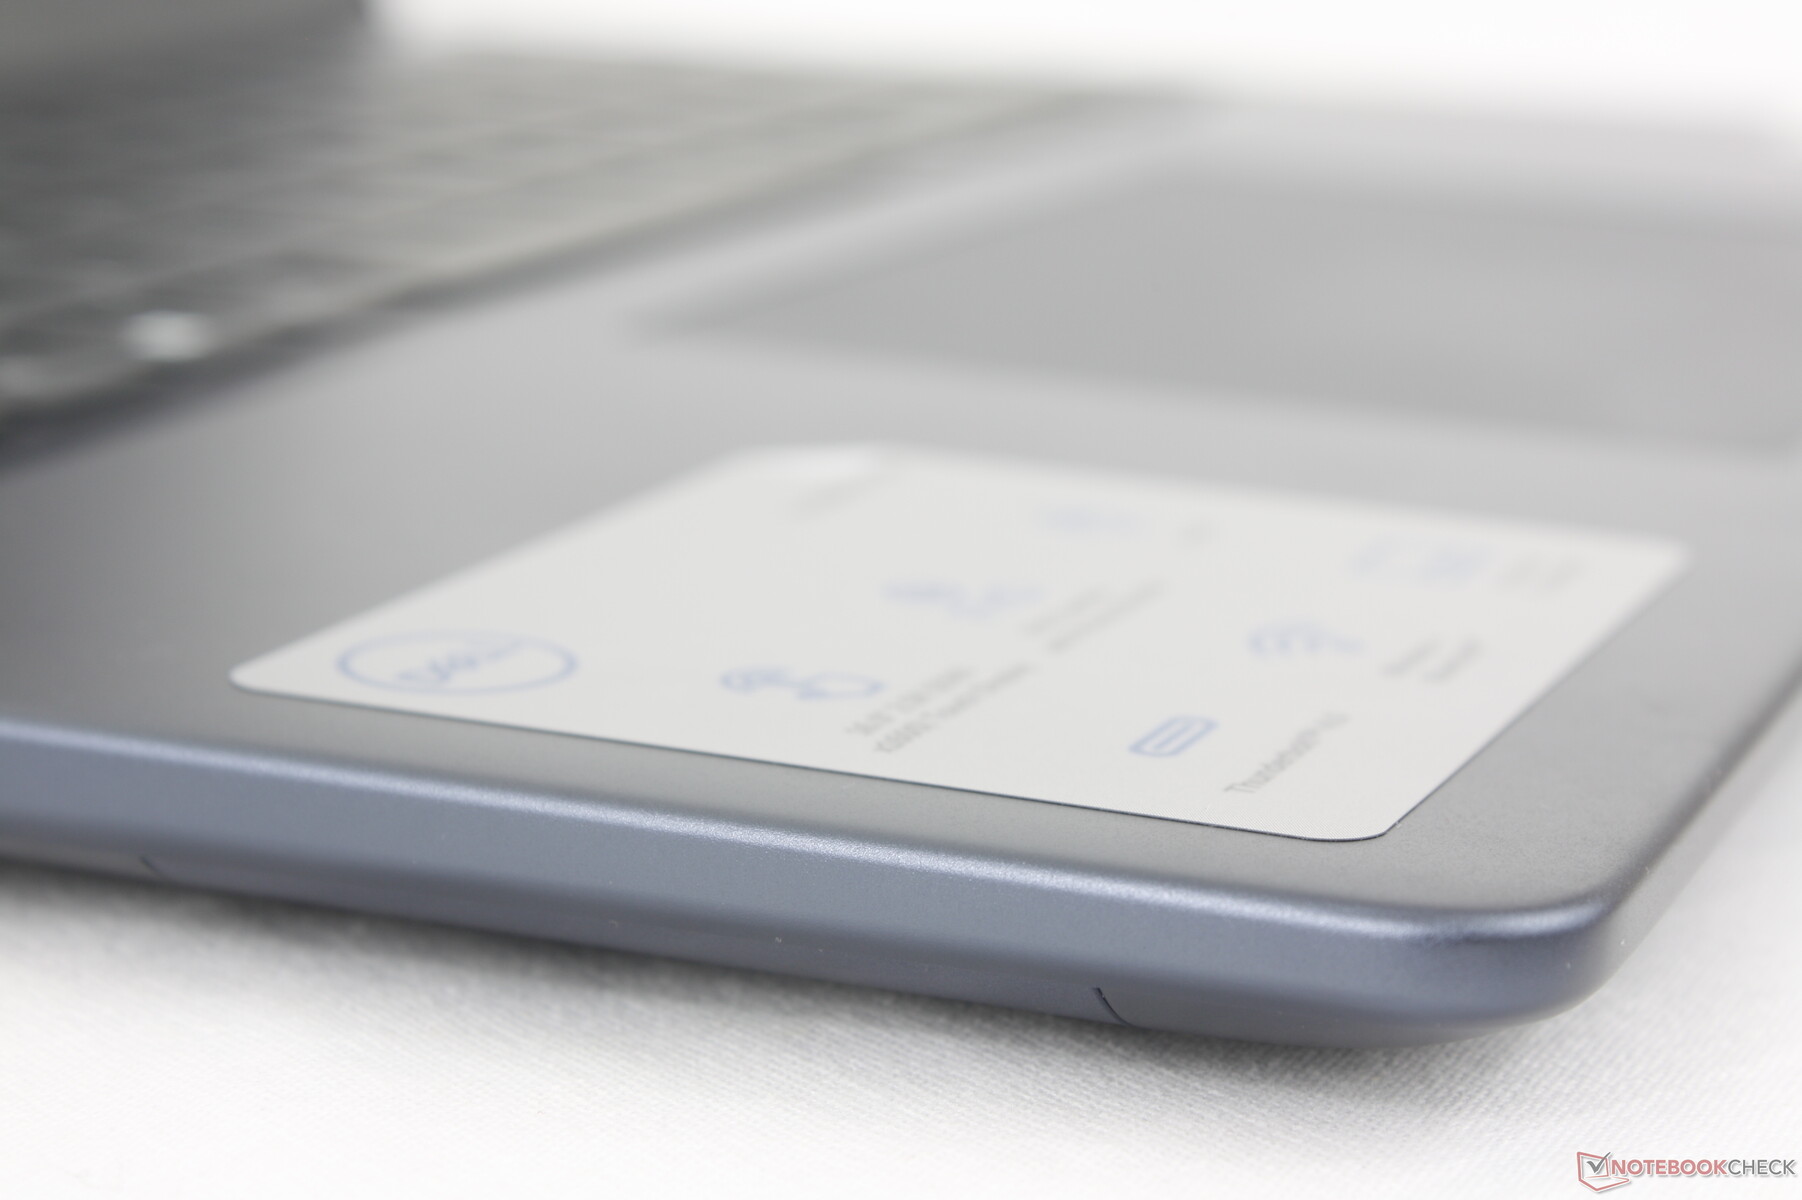
Perakende kutusunda bir aktif stylus kalem bulunur (PN5122W) evrak ve AC adaptörüne ek olarak. ABD'de satın alındığında standart bir yıllık sınırlı garanti geçerlidir.
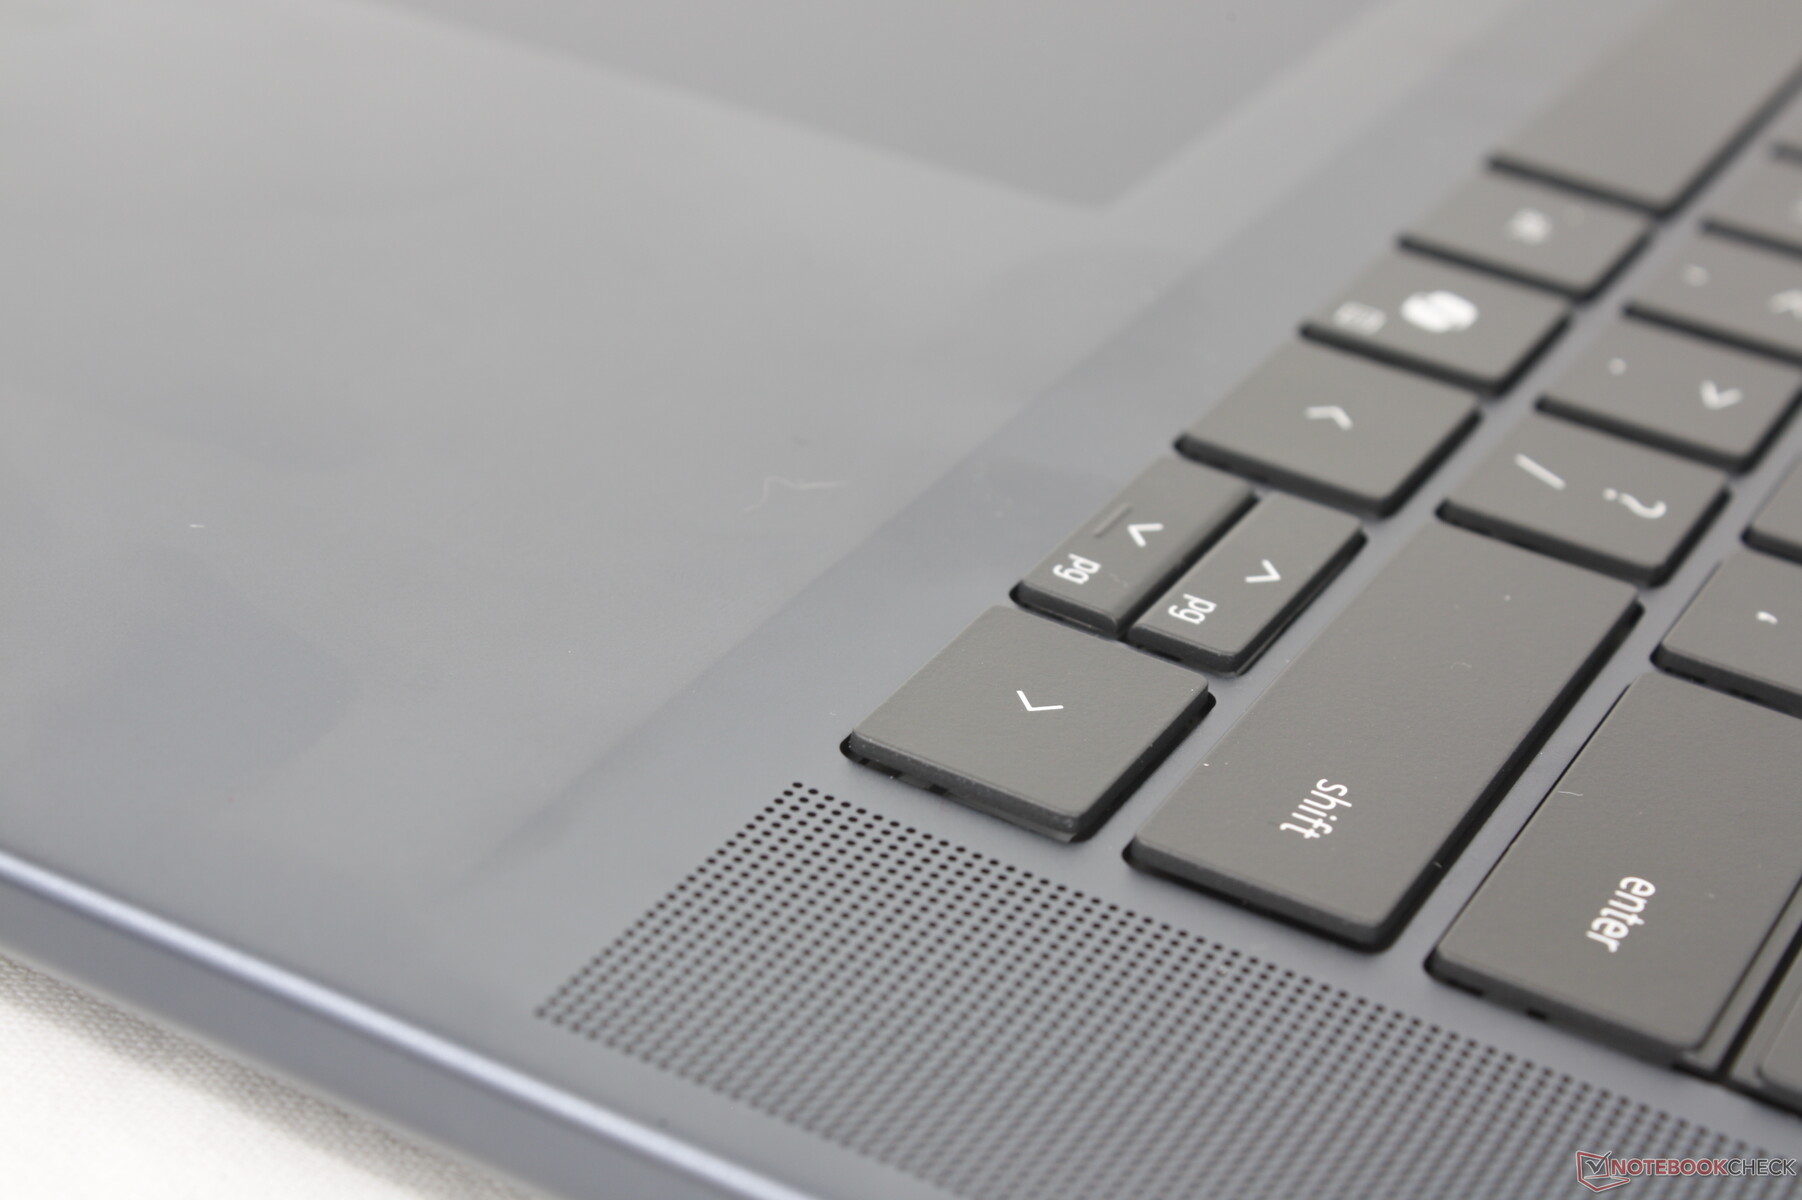
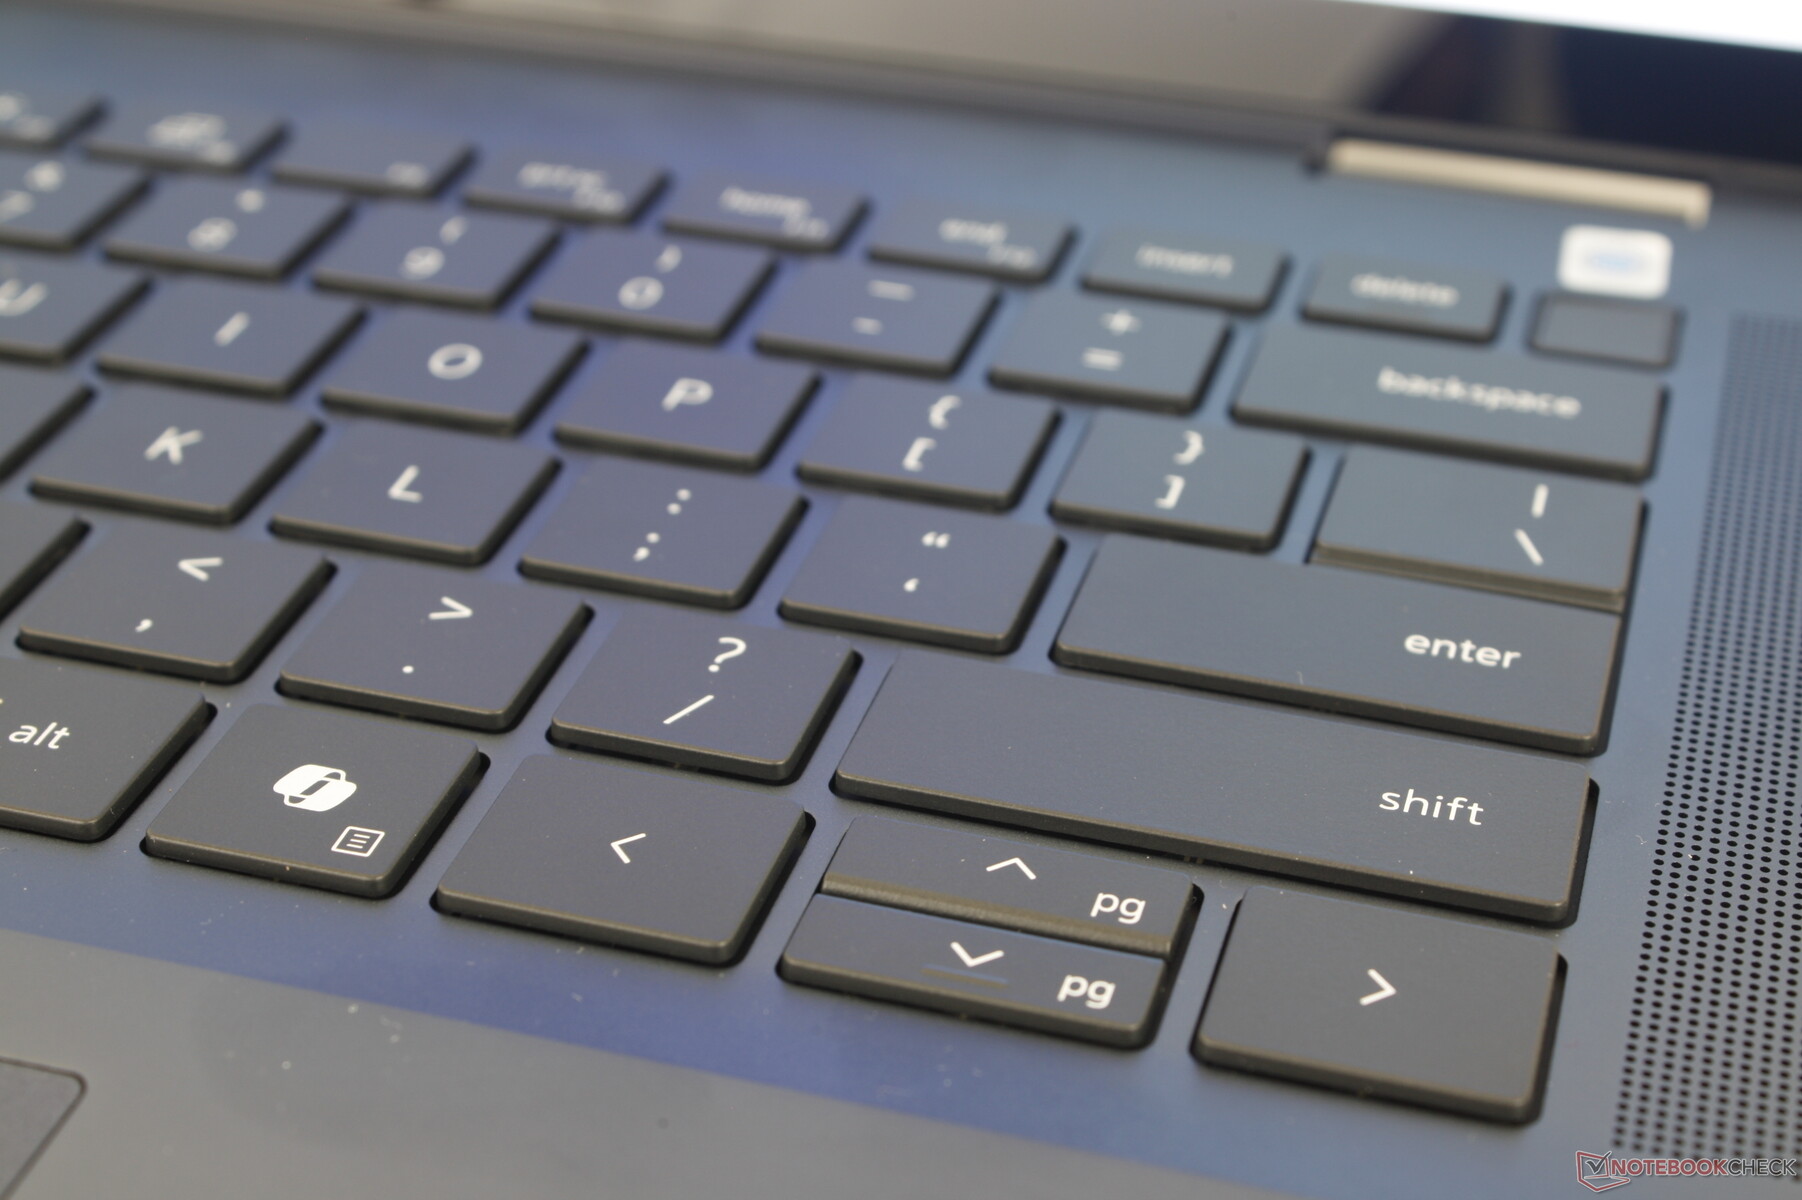
Giriş Aygıtları - İyi Ama Yine de Biraz Süngerimsi
Klavye ve Dokunmatik Yüzey
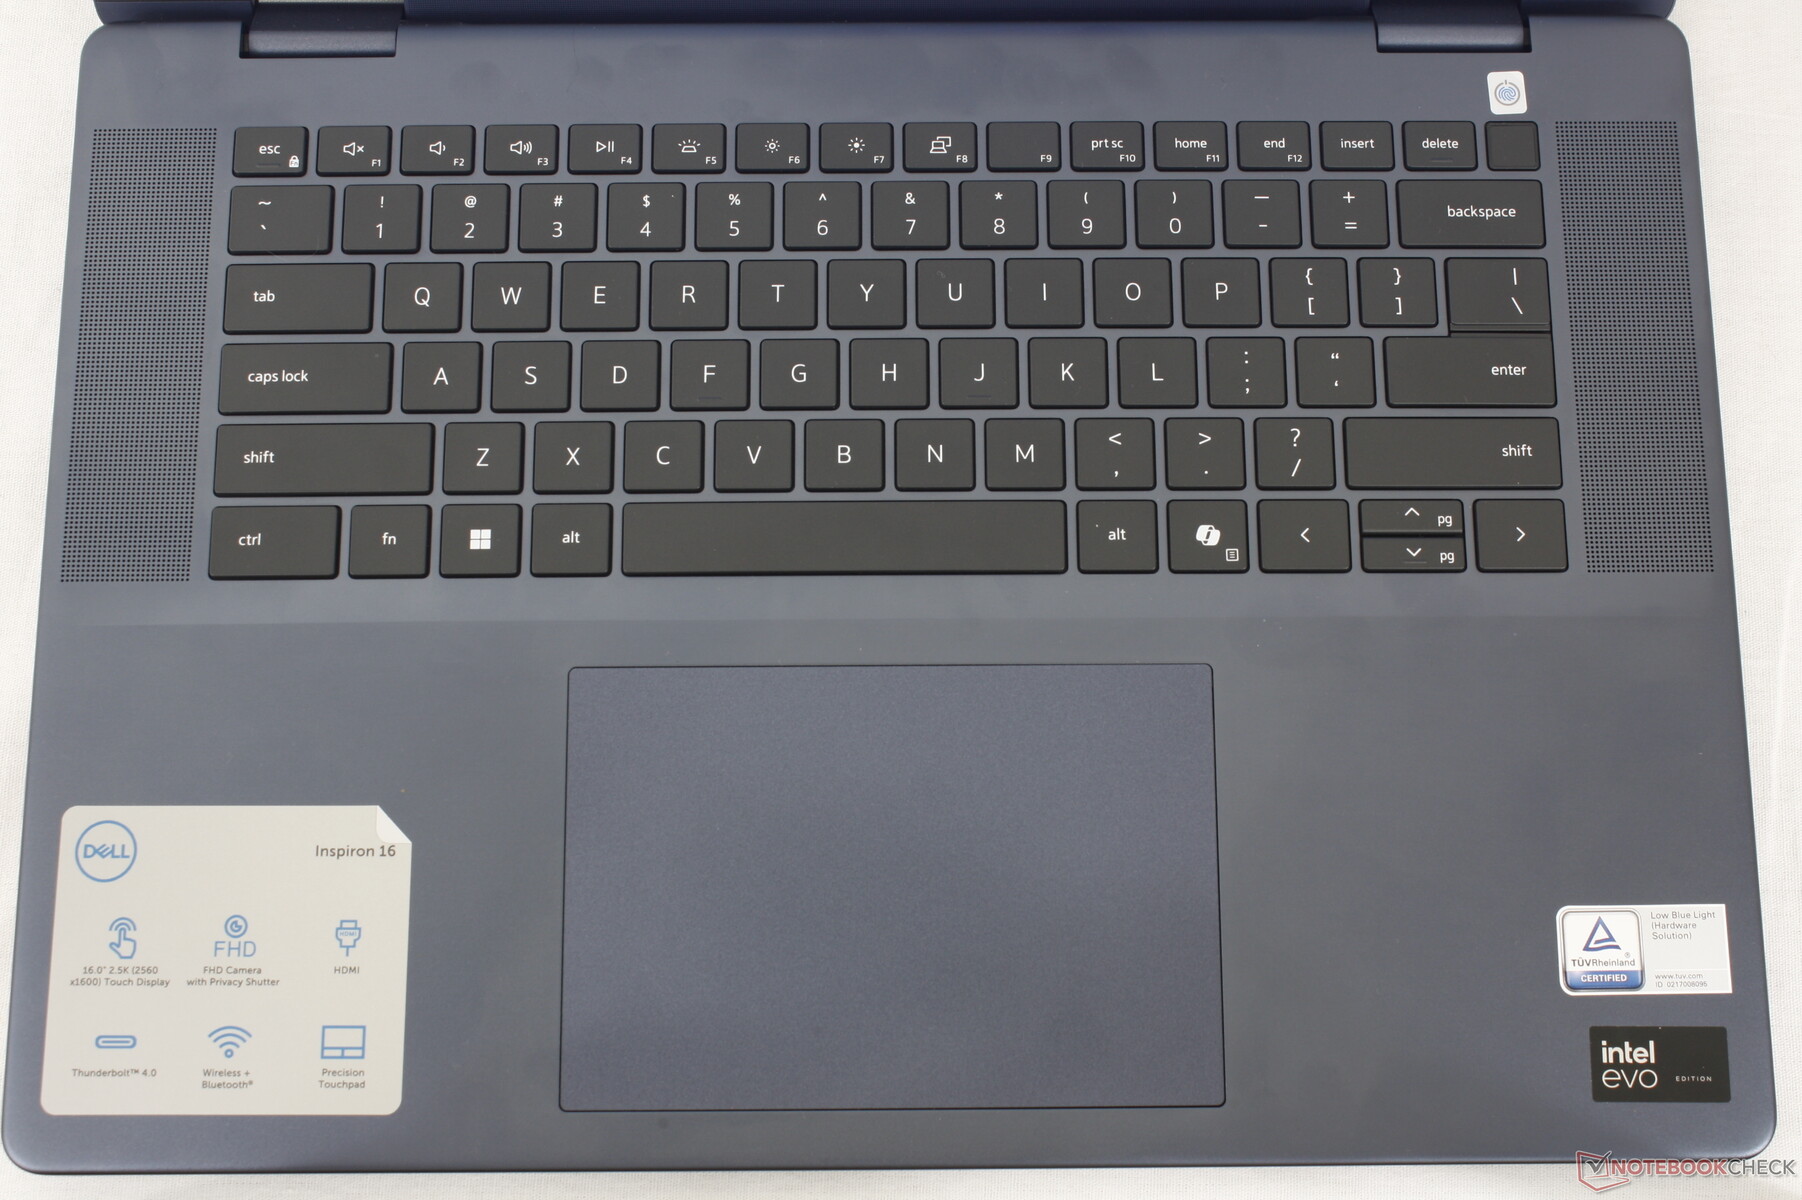
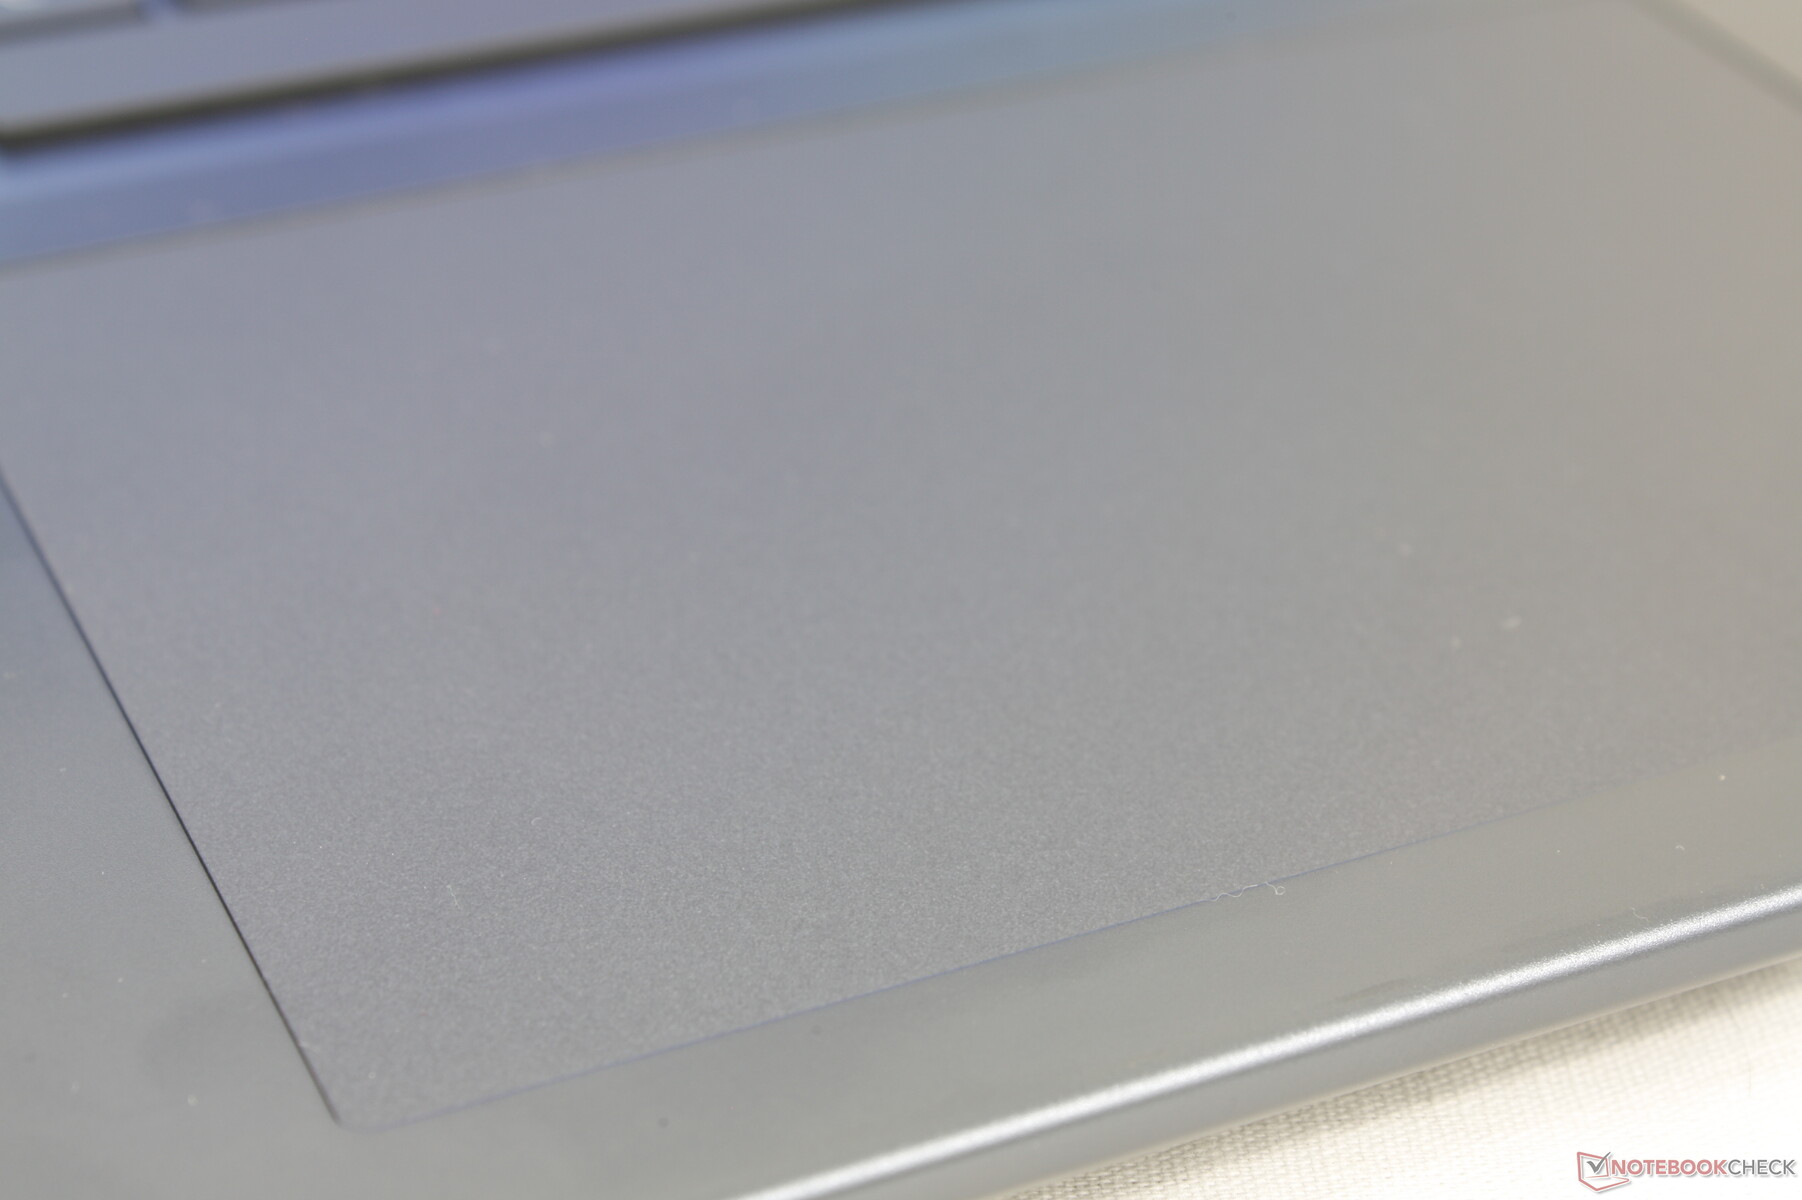
Klavye ve dokunmatik yüzey, kasanın başka yerlerindeki tüm fiziksel değişikliklere rağmen Inspiron 7630 2'si 1 arada serisinden değişmedi. Yeni modelimizde biraz daha küçük Güç düğmesi ve özel Co-Pilot tuşunun eklenmesi gibi birkaç küçük farklılık var, ancak dokunmatik yüzey boyutundan (13,3 x 9 cm) tuş geri bildirimine kadar her şey geçen yılki modelle aynı. Inspiron'daki tuşları ve clickpad'i hala HP Envy serisindeki tuşlardan ve clickpad'den daha süngerimsi ve daha az tatmin edici geri bildirime sahip bulduğumuz için bu konuda iyileştirmeler görmek güzel olurdu.

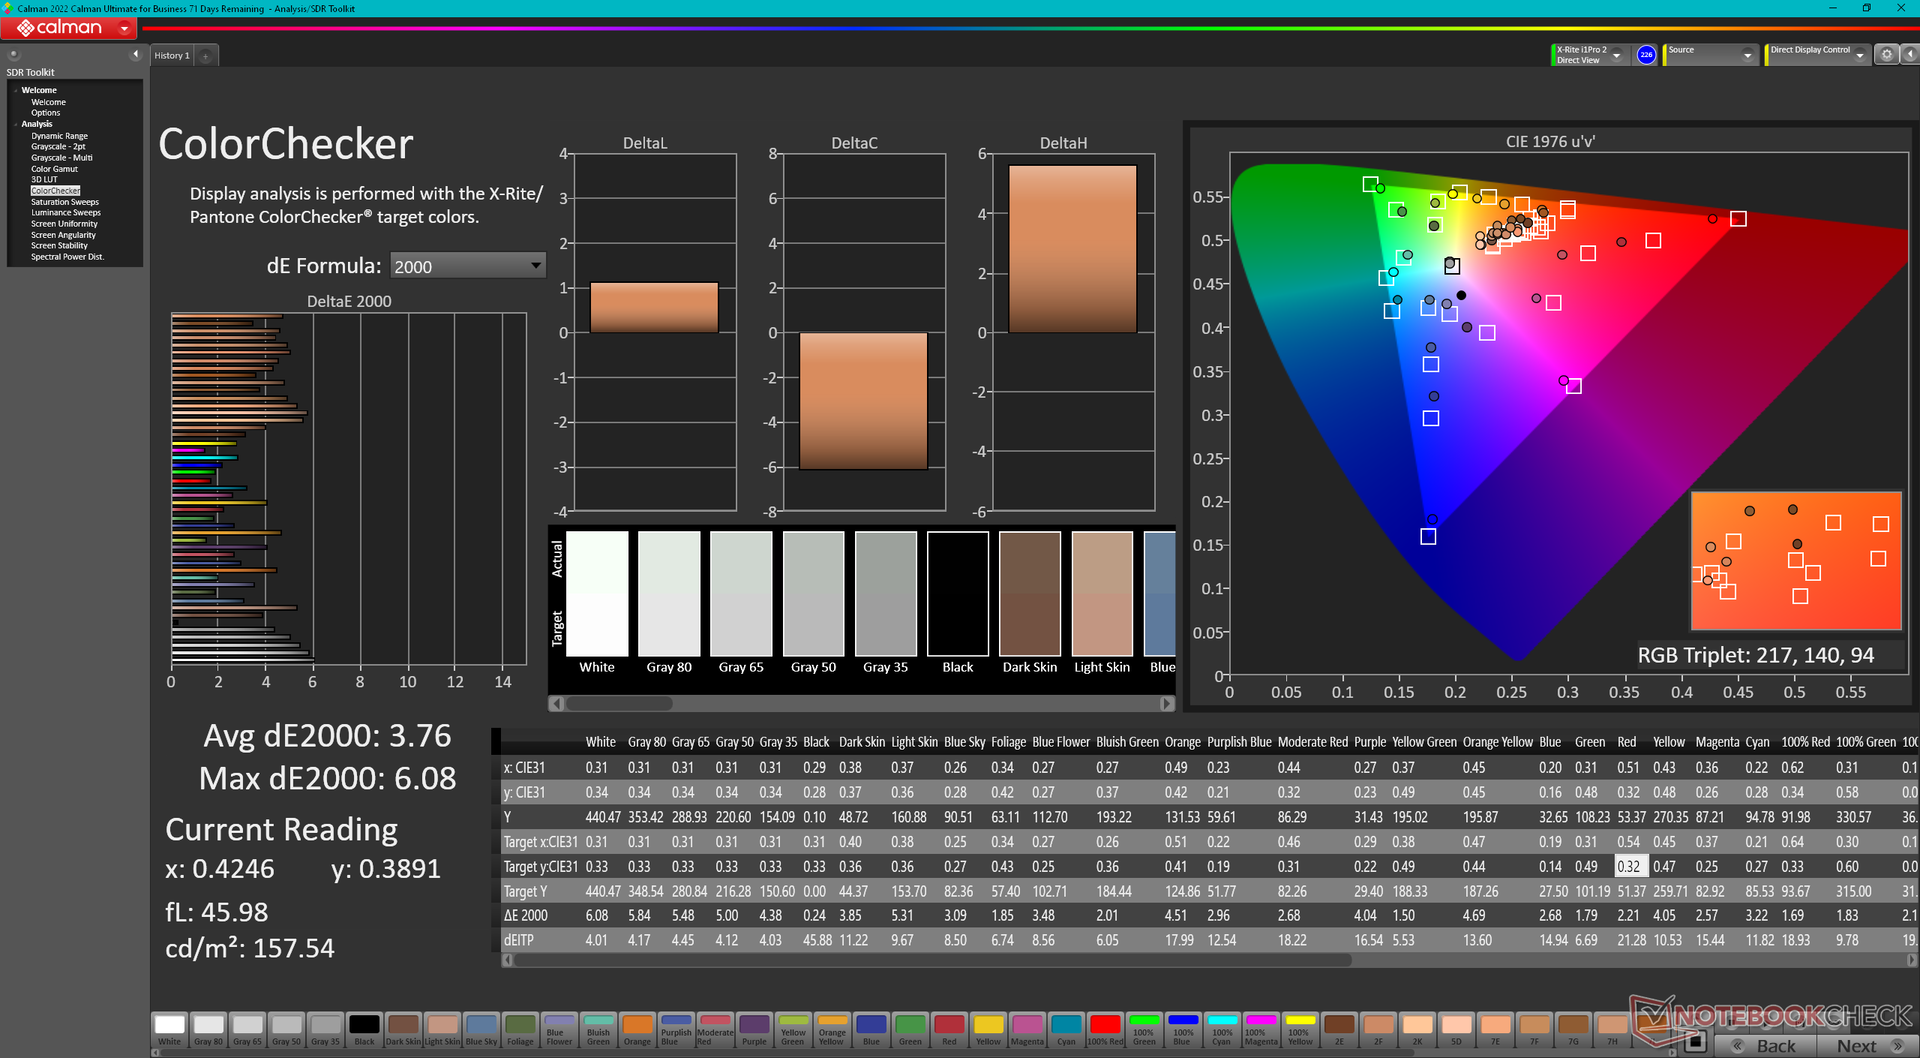
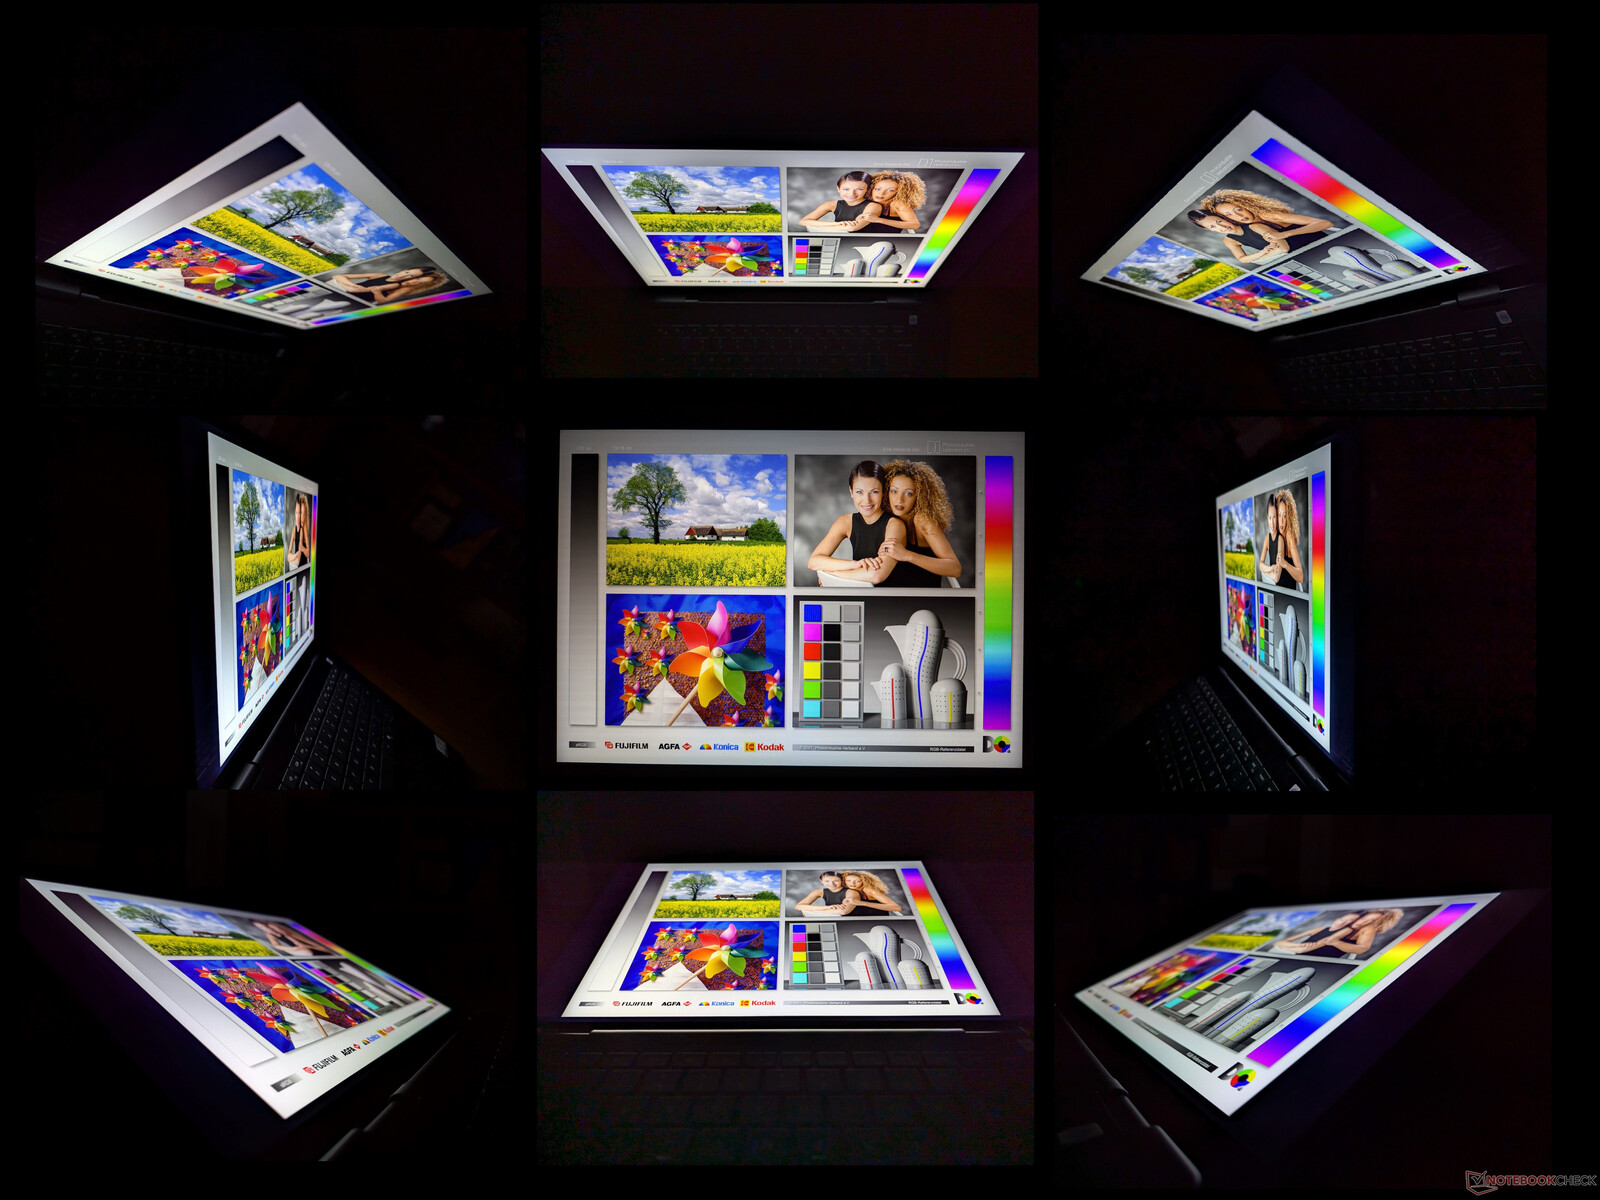
Ekran - 2,5K Mini-LED HDR600
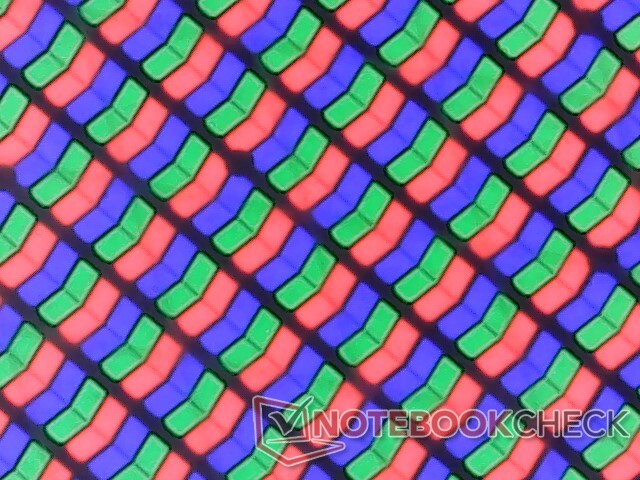
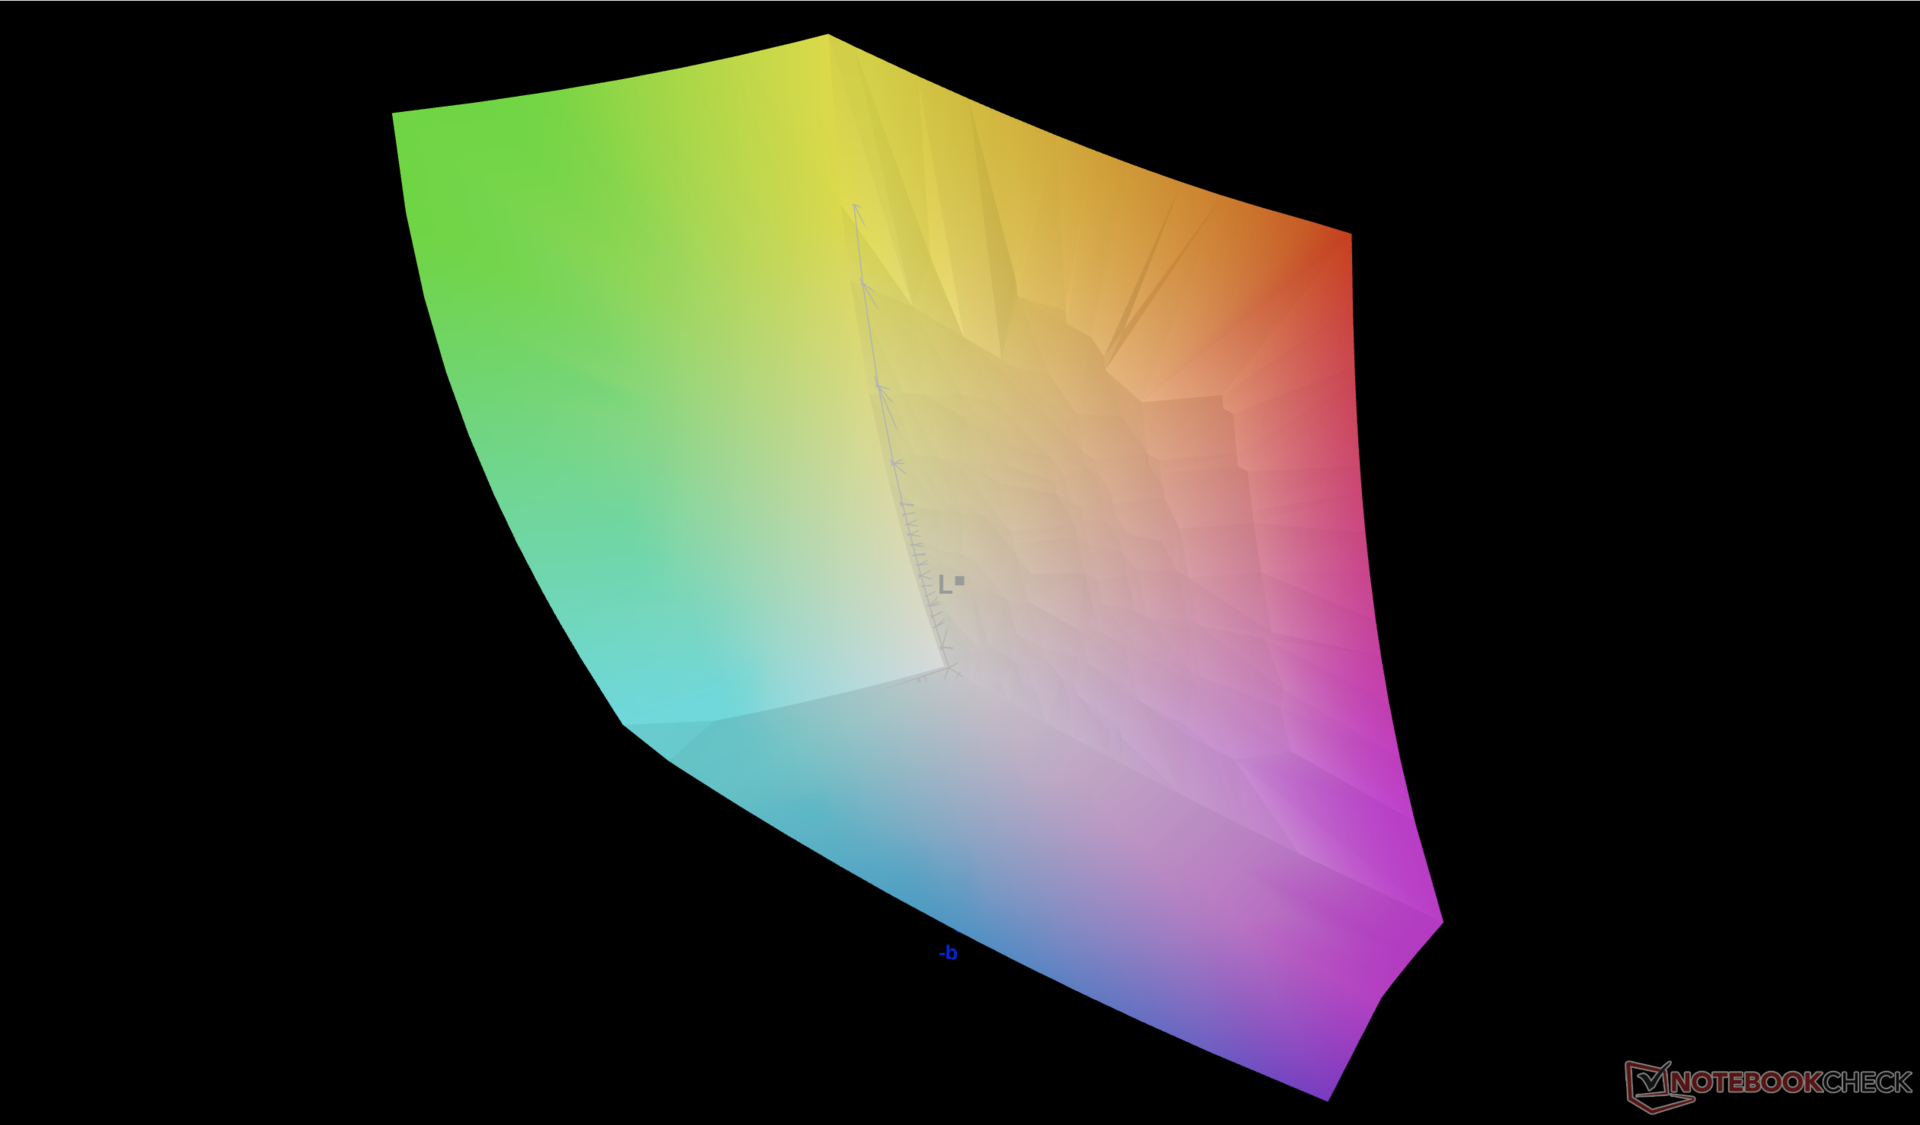
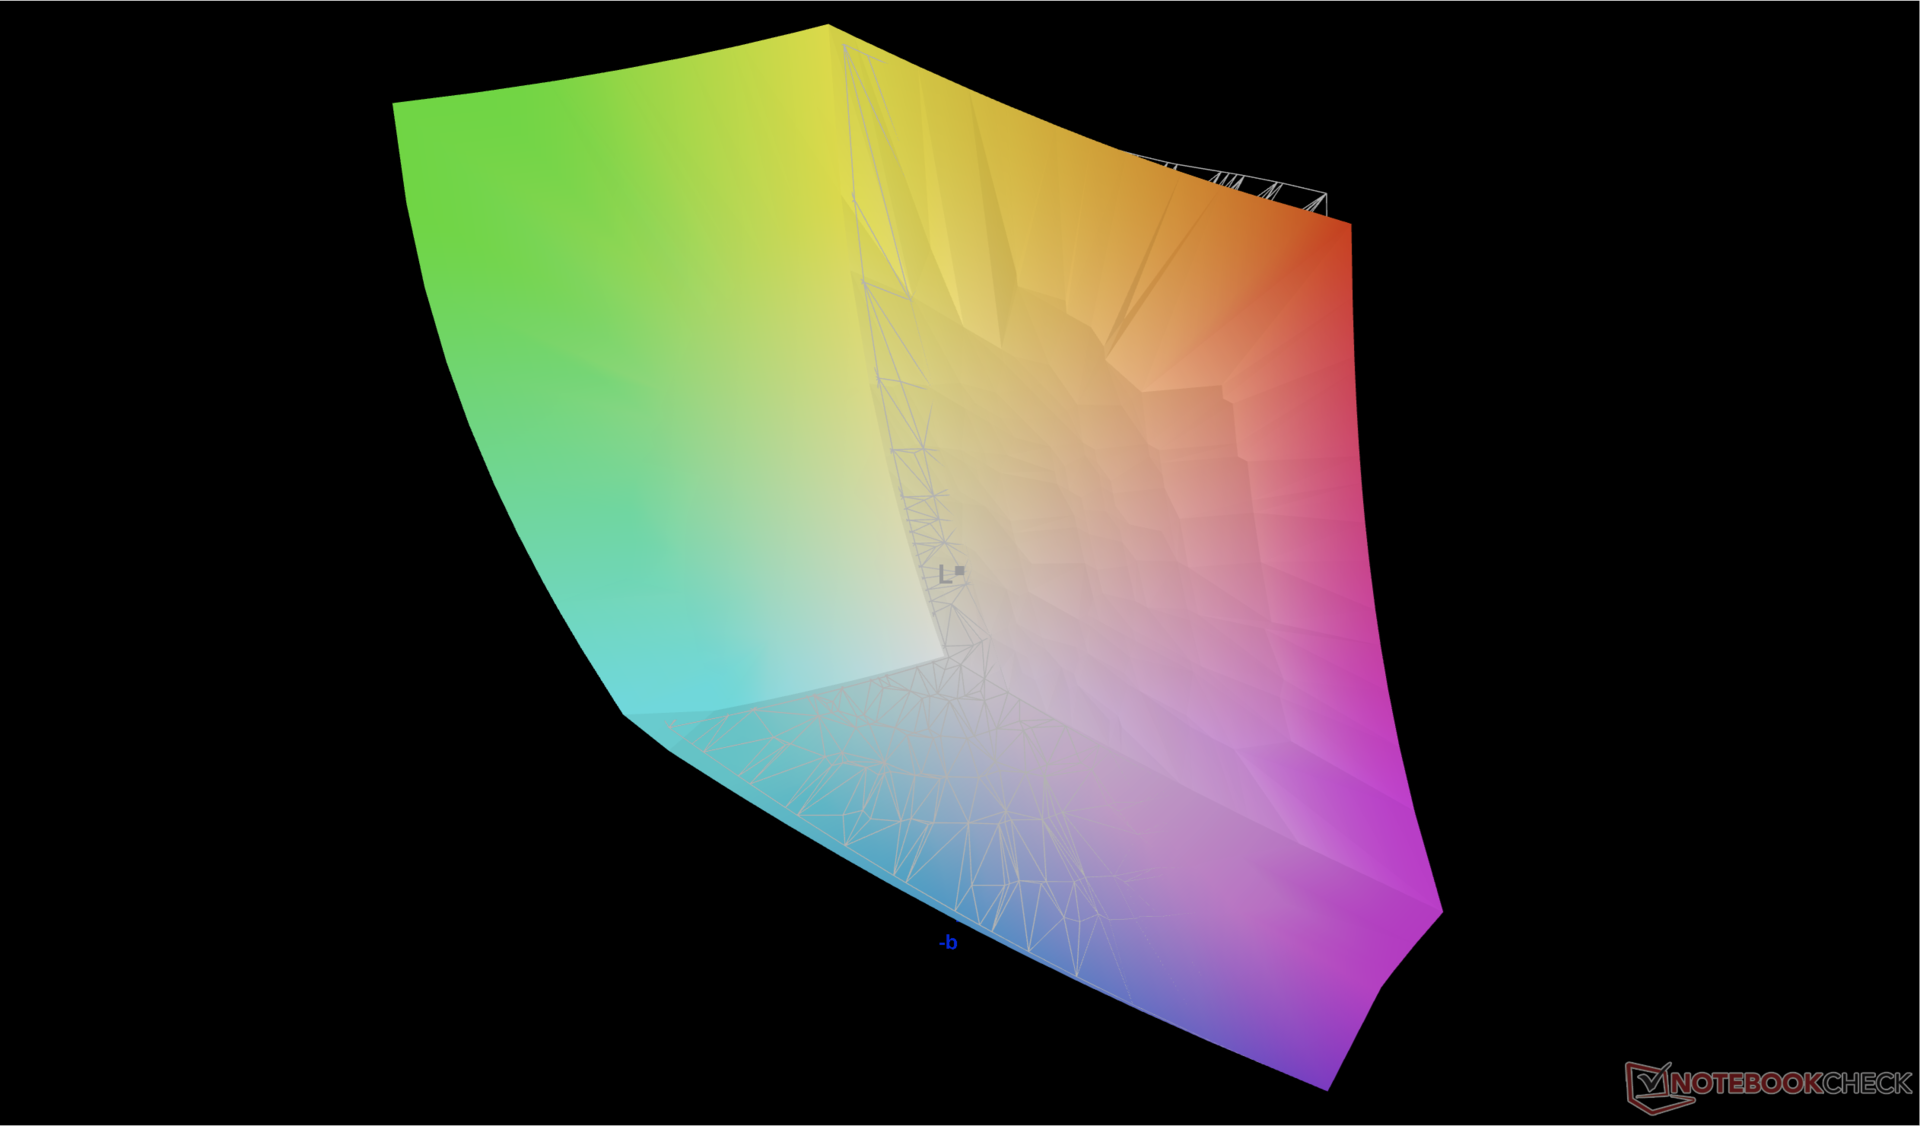
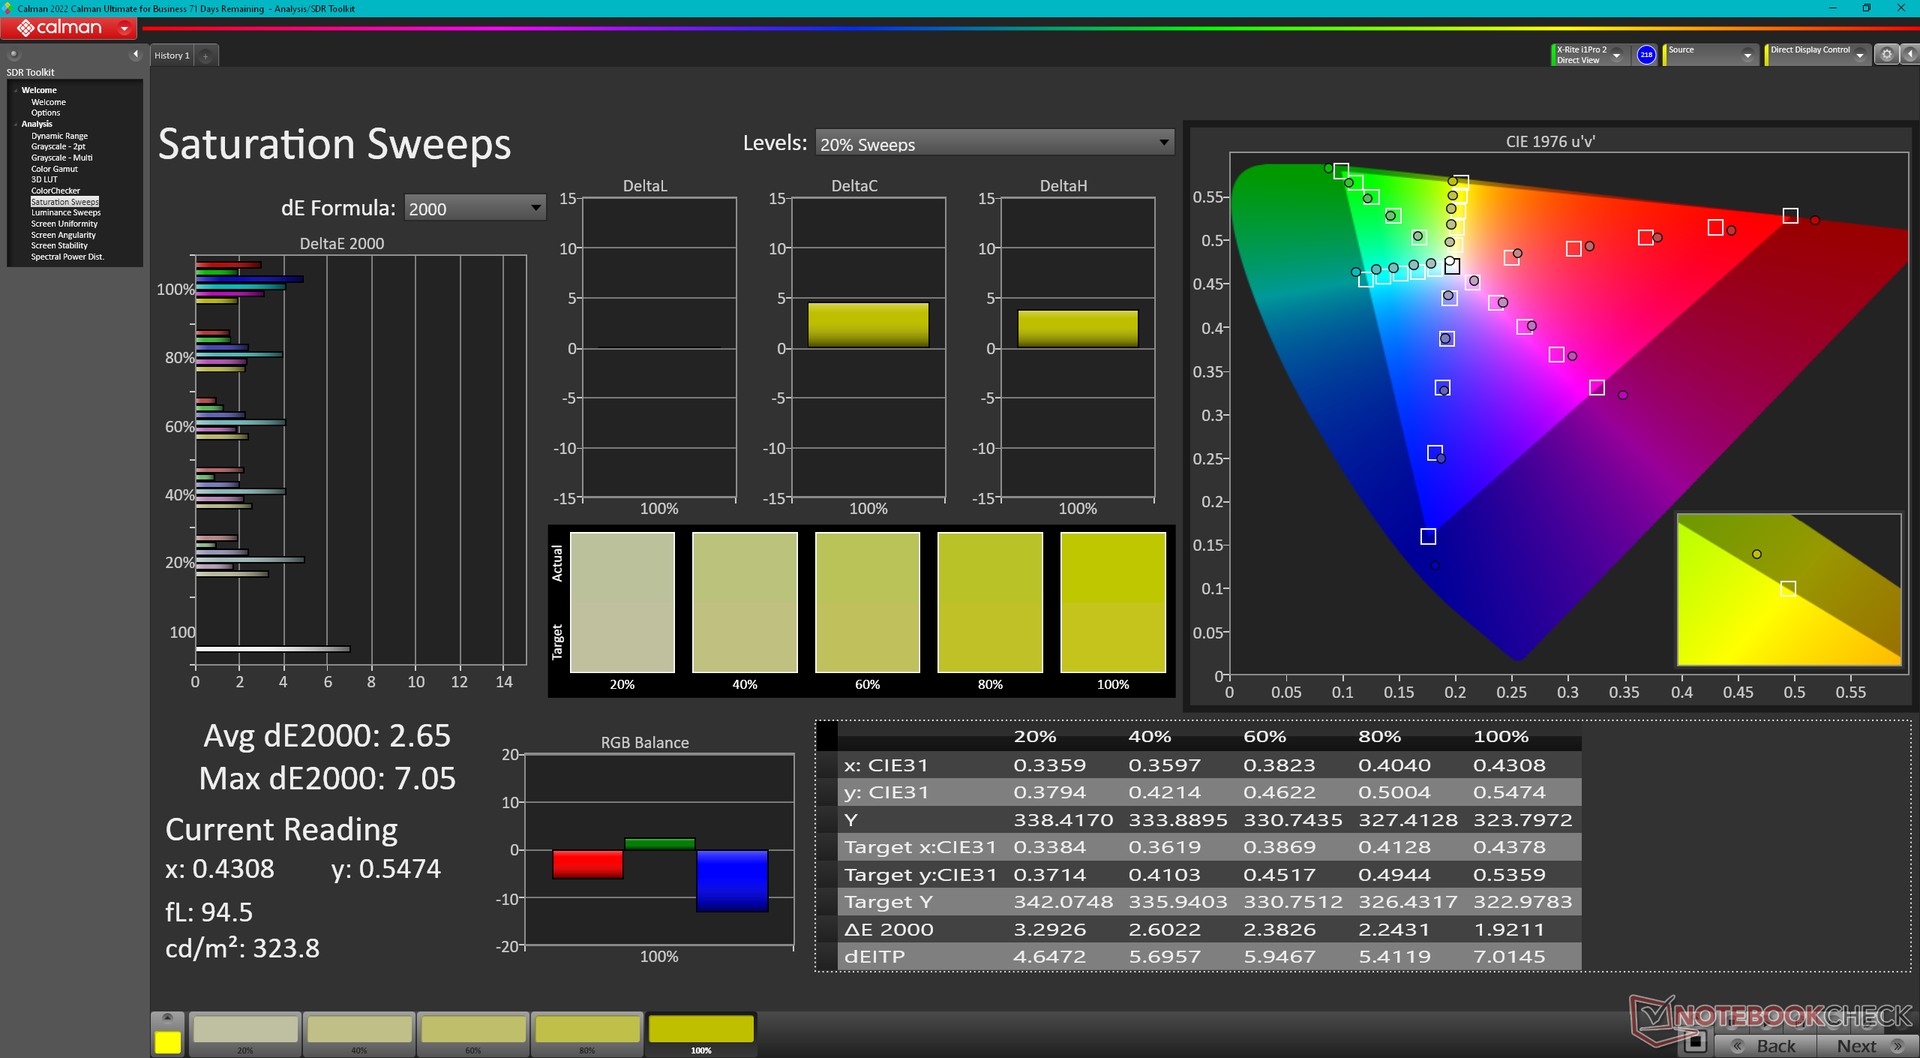
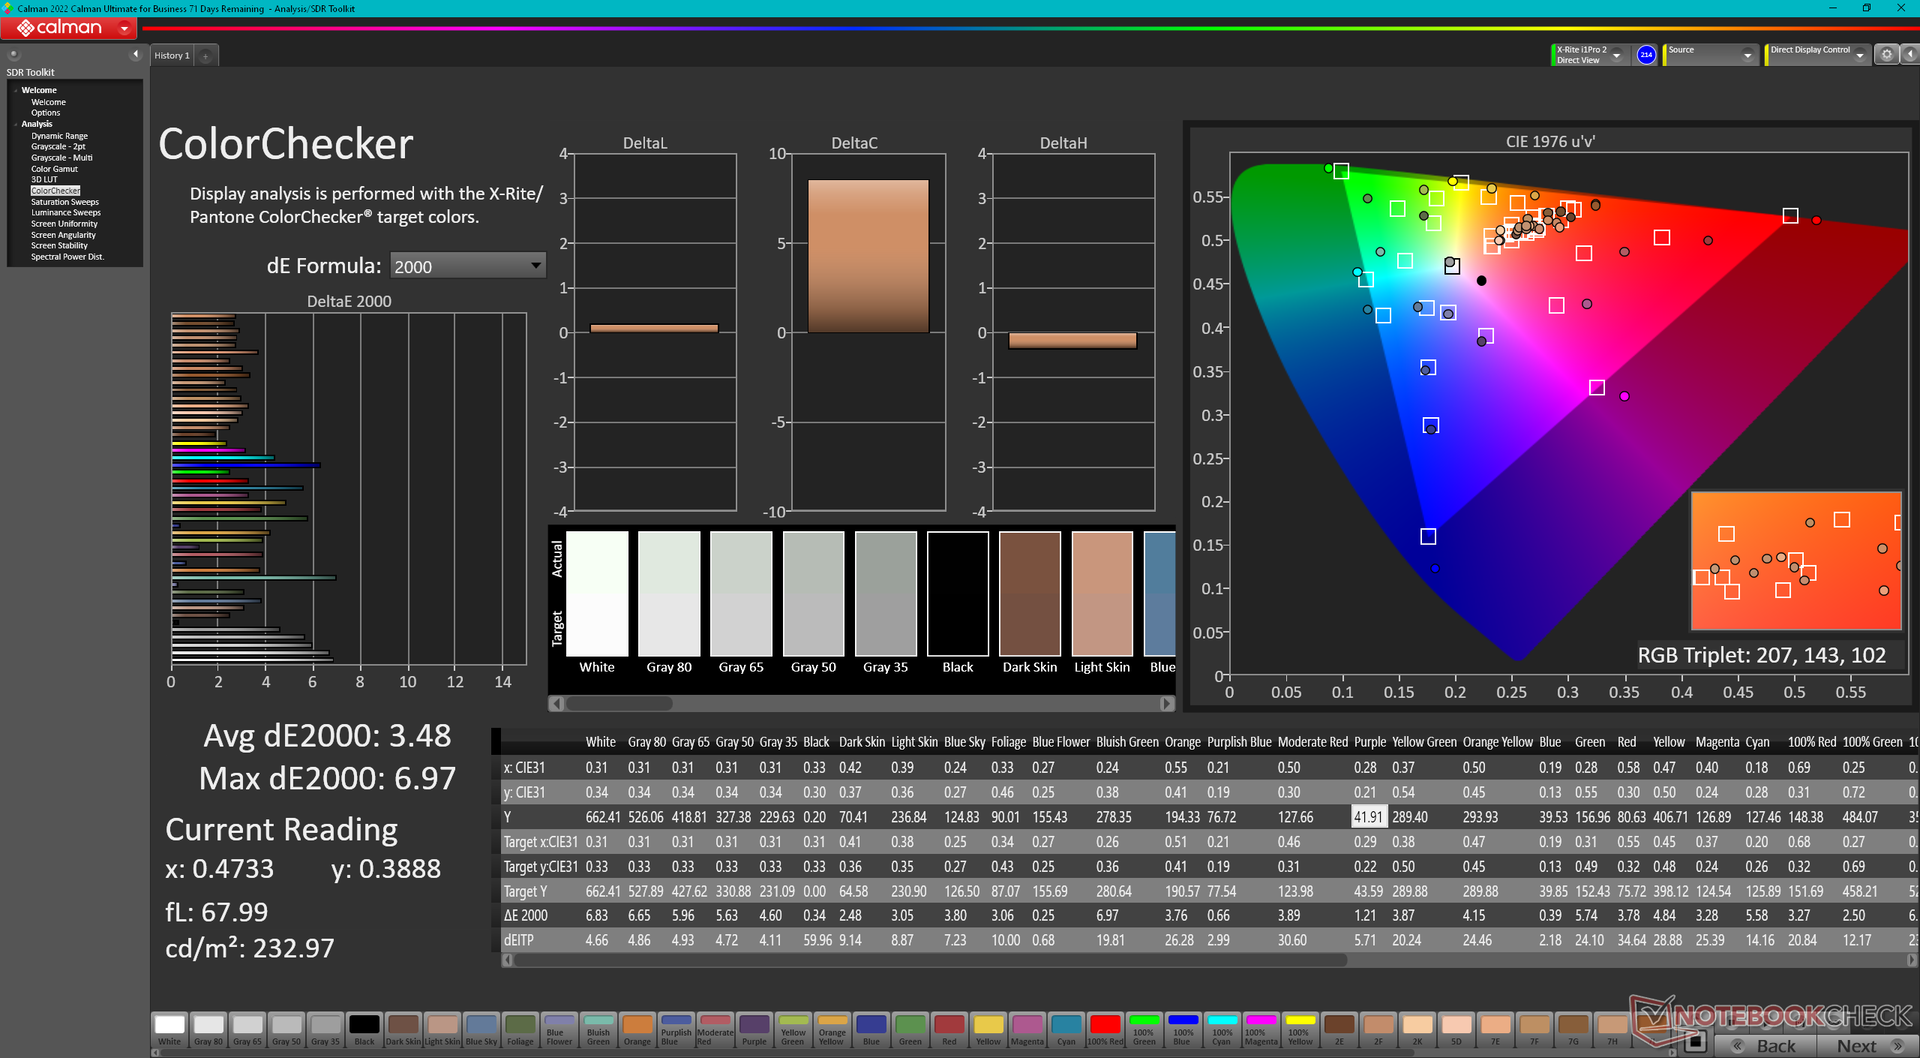
İsteğe bağlı Mini-LED panel, bu yılki Inspiron 16 2'si 1 arada için önemli bir satış noktasıdır. Bazılarında olduğu gibi 4K ve HDR1000 sunmasa da ekstrem oyun dizüstü bilgisayarları2.5K çözünürlüğü ve HDR600 desteği, 1000 dolar civarında satılan 16 inçlik bir dönüştürülebilir bilgisayar için hala etkileyici. Kullanıcılar, daha pahalı dizüstü bilgisayarlardaki diğer mini LED panellerle aynı mükemmel 3000:1 kontrast oranını ve tam DCI-P3 renklerini elde etmeye devam ediyor.
HDR kapalı olduğunda hem renkler hem de parlaklık otomatik olarak sırasıyla sRGB ve maksimum 400 nit olarak ayarlanıyor. HDR etkinleştirildiğinde renk profili DCI-P3'e dönüşürken HDR içerik oynatılırken maksimum parlaklık 663 nit'e yükseliyor.
Doğal 90 Hz yenileme hızı dikkate değerdir, ancak panel enerji tasarrufu için uyarlanabilir senkronizasyon ve Windows değişken yenileme hızı desteğinden yoksundur.
| |||||||||||||||||||||||||
Aydınlatma: 97 %
Batarya modunda parlaklık: 413 cd/m²
Kontrast: 2950:1 (Siyah: 0.14 cd/m²)
ΔE Color 3.48 | 0.5-29.43 Ø4.87
ΔE Greyscale 4.5 | 0.5-98 Ø5.1
92.5% AdobeRGB 1998 (Argyll 2.2.0 3D)
100% sRGB (Argyll 2.2.0 3D)
99.4% Display P3 (Argyll 2.2.0 3D)
Gamma: 2.15
| Dell Inspiron 16 7640 2-in-1 AU Optronics B160QAT, Mini-LED, 2560x1600, 16", 90 Hz | Dell Inspiron 16 Plus 7640 AU Optronics B160QAN, IPS, 2560x1600, 16", 120 Hz | Dell Inspiron 16 7635 2-in-1 Chi Mei 160JCA, IPS, 1920x1200, 16", 60 Hz | HP Envy x360 2-in-1 16-ad0097nr Samsung SDC41A6, OLED, 2880x1800, 16", 120 Hz | Lenovo IdeaPad Pro 5 16IMH G9 NE160QDM-NY2, IPS, 2560x1600, 16", 120 Hz | Samsung Galaxy Book4 Pro 360 ATNA60CL09-0, OLED, 2880x1800, 16", 120 Hz | |
|---|---|---|---|---|---|---|
| Display | -14% | -20% | 1% | -23% | 2% | |
| Display P3 Coverage | 99.4 | 76 -24% | 67.4 -32% | 99.6 0% | 63.3 -36% | 99.9 1% |
| sRGB Coverage | 100 | 99.8 0% | 98.2 -2% | 100 0% | 95.2 -5% | 100 0% |
| AdobeRGB 1998 Coverage | 92.5 | 76.7 -17% | 69.5 -25% | 96.5 4% | 65.3 -29% | 96.6 4% |
| Response Times | 3% | -5% | 37% | 43% | 35% | |
| Response Time Grey 50% / Grey 80% * | 15.4 ? | 25.6 ? -66% | 27.6 ? -79% | 0.8 ? 95% | 15 ? 3% | 0.49 ? 97% |
| Response Time Black / White * | 60.6 ? | 17.6 ? 71% | 18.2 ? 70% | 0.89 ? 99% | 10.3 ? 83% | 0.67 ? 99% |
| PWM Frequency | 2753.7 ? | 491.8 ? -82% | 240 ? -91% | |||
| Screen | -5% | -25% | 10% | -21% | 33% | |
| Brightness middle | 413 | 314.7 -24% | 301.3 -27% | 399.4 -3% | 368 -11% | 387 -6% |
| Brightness | 409 | 291 -29% | 269 -34% | 405 -1% | 368 -10% | 392 -4% |
| Brightness Distribution | 97 | 89 -8% | 79 -19% | 98 1% | 91 -6% | 98 1% |
| Black Level * | 0.14 | 0.28 -100% | 0.28 -100% | 0.31 -121% | ||
| Contrast | 2950 | 1124 -62% | 1076 -64% | 1187 -60% | ||
| Colorchecker dE 2000 * | 3.48 | 1.62 53% | 3.1 11% | 4.05 -16% | 2.4 31% | 1 71% |
| Colorchecker dE 2000 max. * | 6.97 | 2.94 58% | 5.5 21% | 6.69 4% | 6.5 7% | 1.9 73% |
| Greyscale dE 2000 * | 4.5 | 1.3 71% | 3.9 13% | 1.1 76% | 4.5 -0% | 1.7 62% |
| Gamma | 2.15 102% | 2.26 97% | 2.19 100% | 2.27 97% | 2.21 100% | 2.25 98% |
| CCT | 6446 101% | 6385 102% | 6186 105% | 6419 101% | 6324 103% | 6325 103% |
| Colorchecker dE 2000 calibrated * | 1.08 | 0.49 | 1.02 | 0.8 | ||
| Toplam Ortalama (Program / Ayarlar) | -5% /
-6% | -17% /
-21% | 16% /
15% | -0% /
-12% | 23% /
26% |
* ... daha küçük daha iyidir
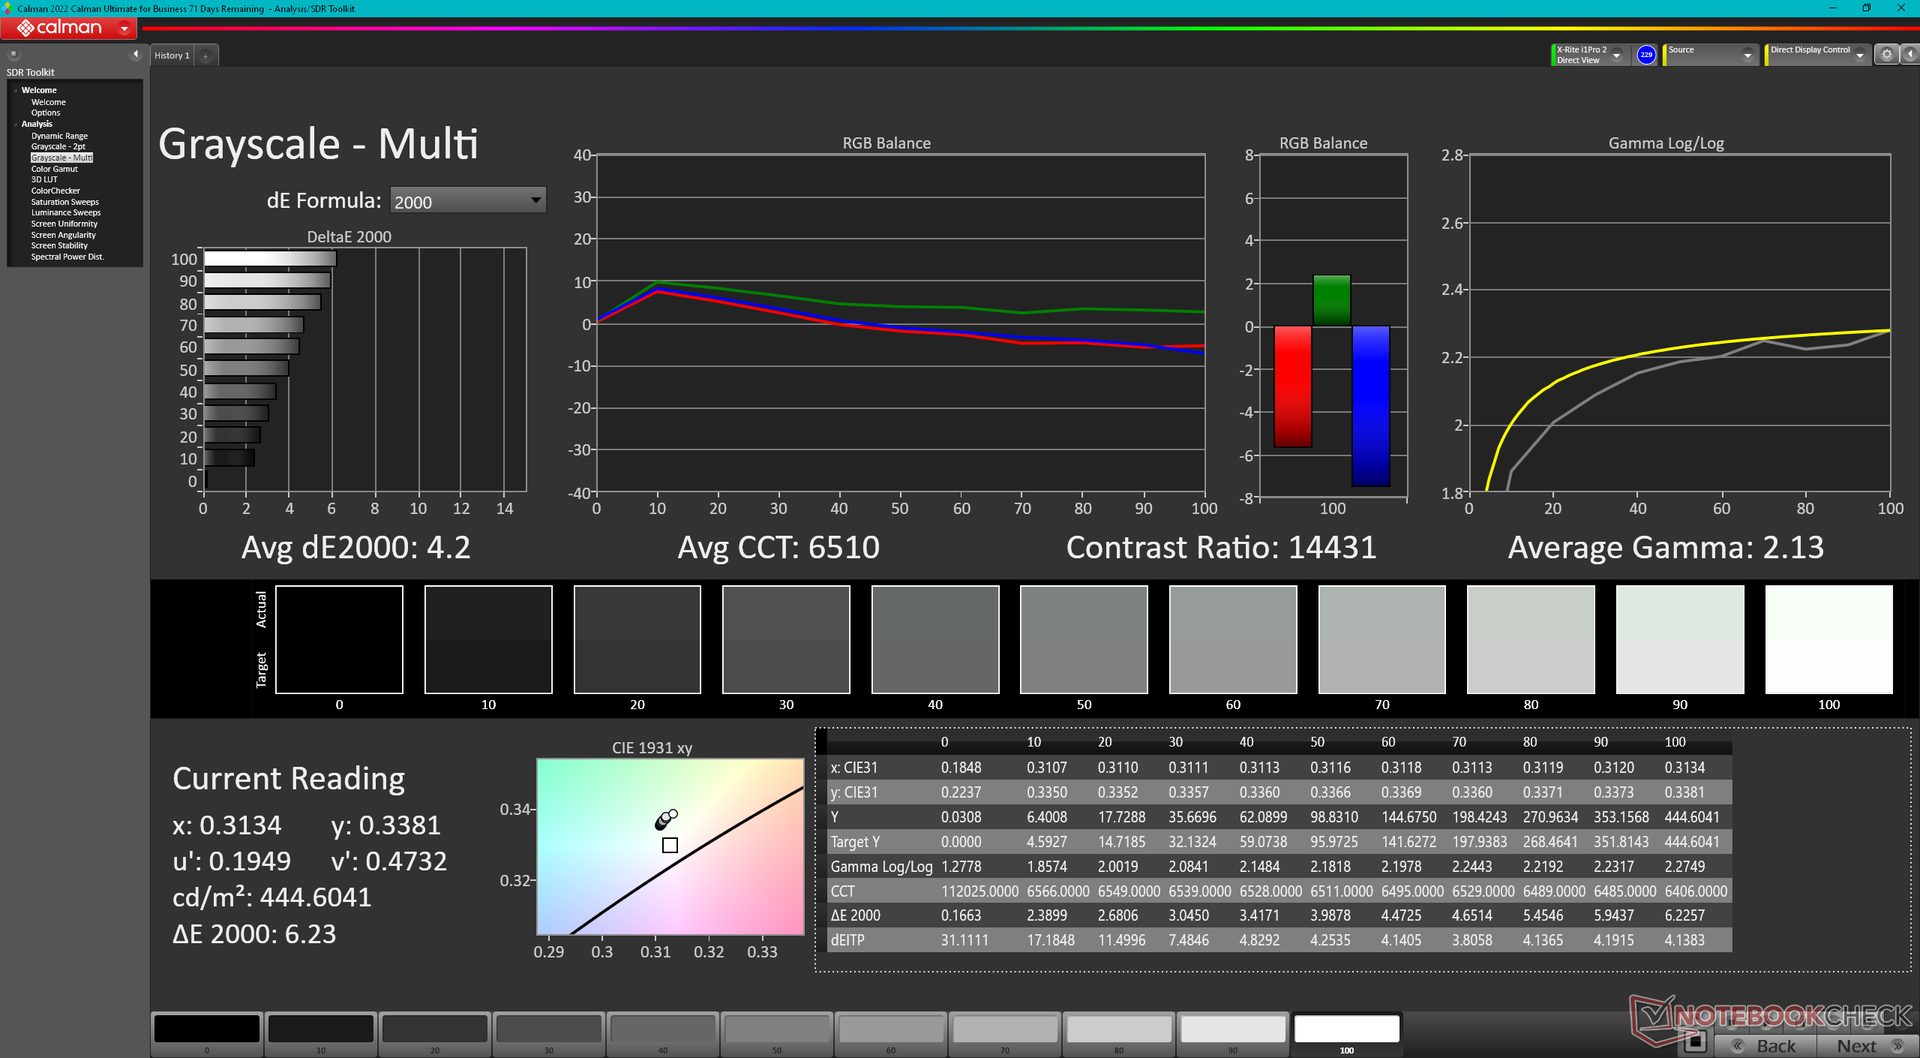
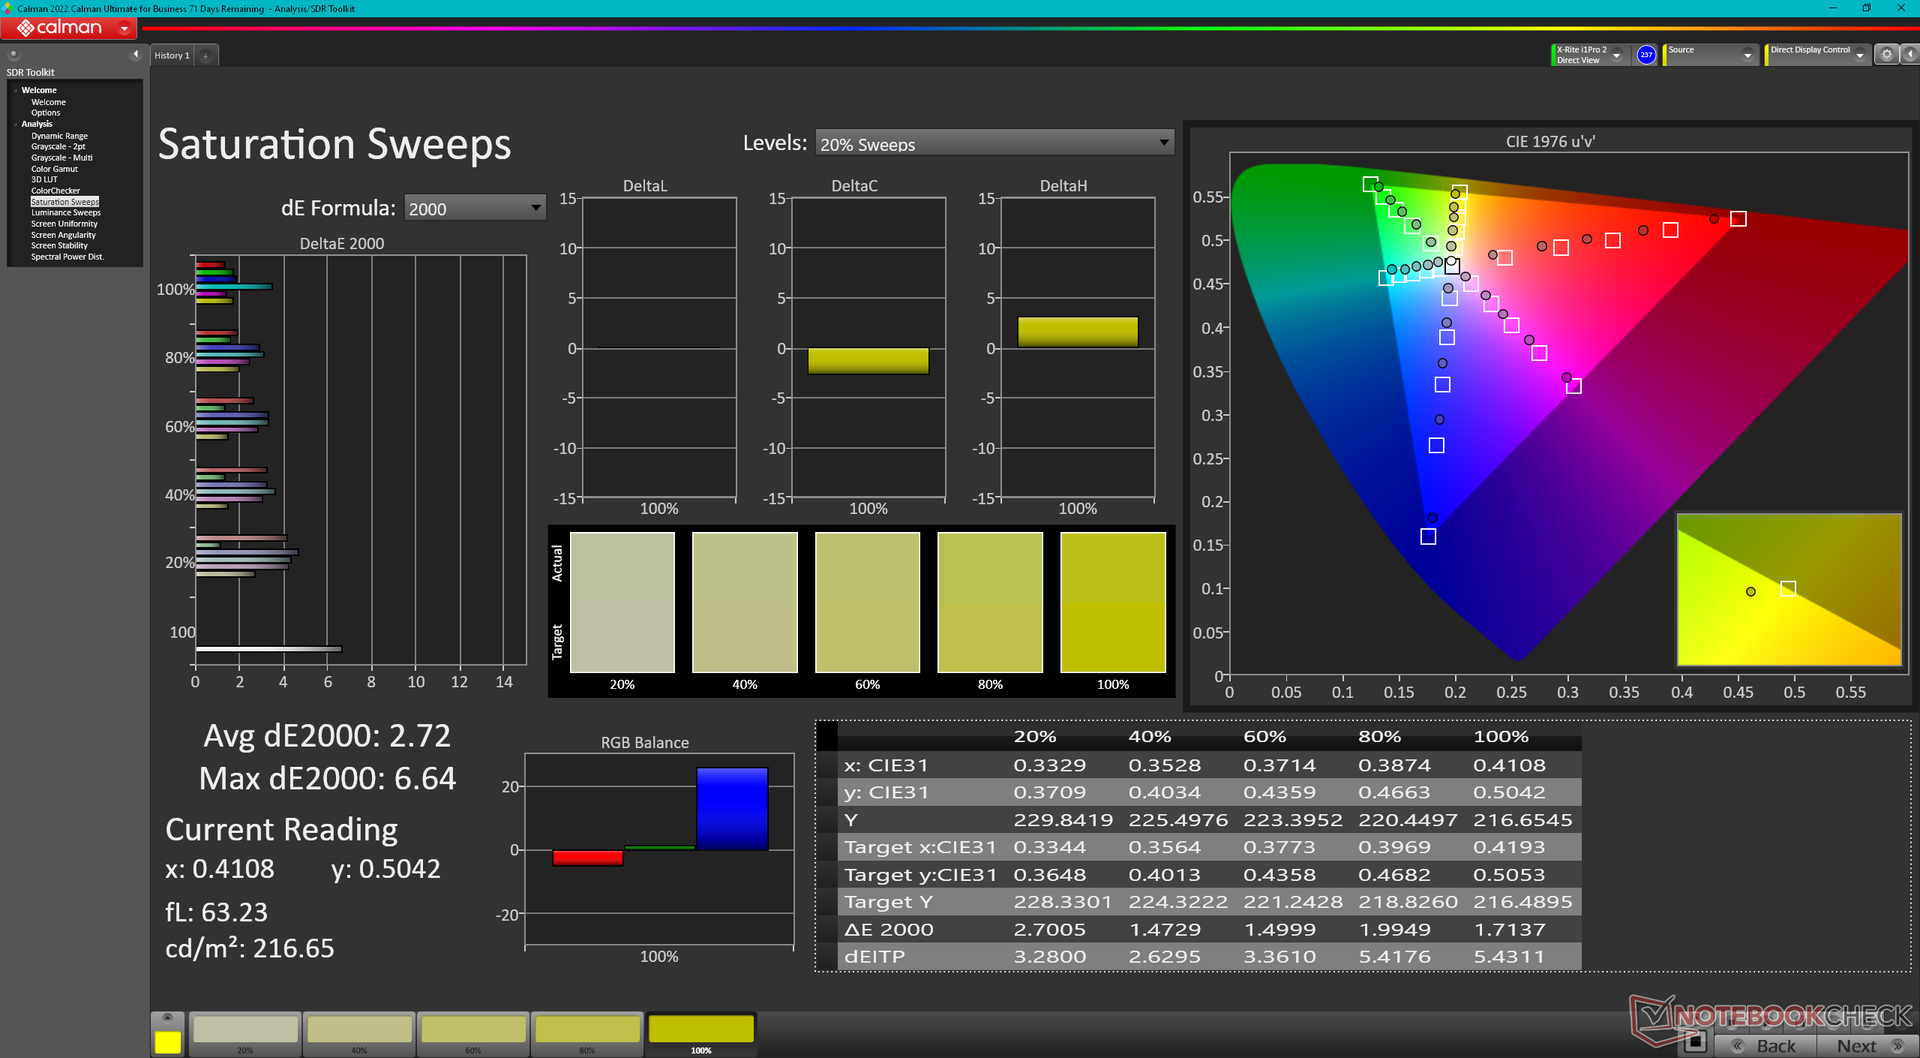
Ekran, ortalama gri tonlama ve renk DeltaE değerleri sırasıyla 4,2 ve 3,76 olan orta seviye bir bilgisayar için oldukça doğru. Bu değerler, sistemi otomatik olarak DCI-P3 renklerine geçiren HDR etkinleştirildiğinde de nispeten sabit kalacaktır. Her iki durumda da renk sıcaklığı 6500K civarında biraz fazla soğuk.

Yanıt Sürelerini Görüntüle
| ↔ Tepki Süresi Siyahtan Beyaza | ||
|---|---|---|
| 60.6 ms ... yükseliş ↗ ve sonbahar↘ birleşimi | ↗ 56.2 ms yükseliş | 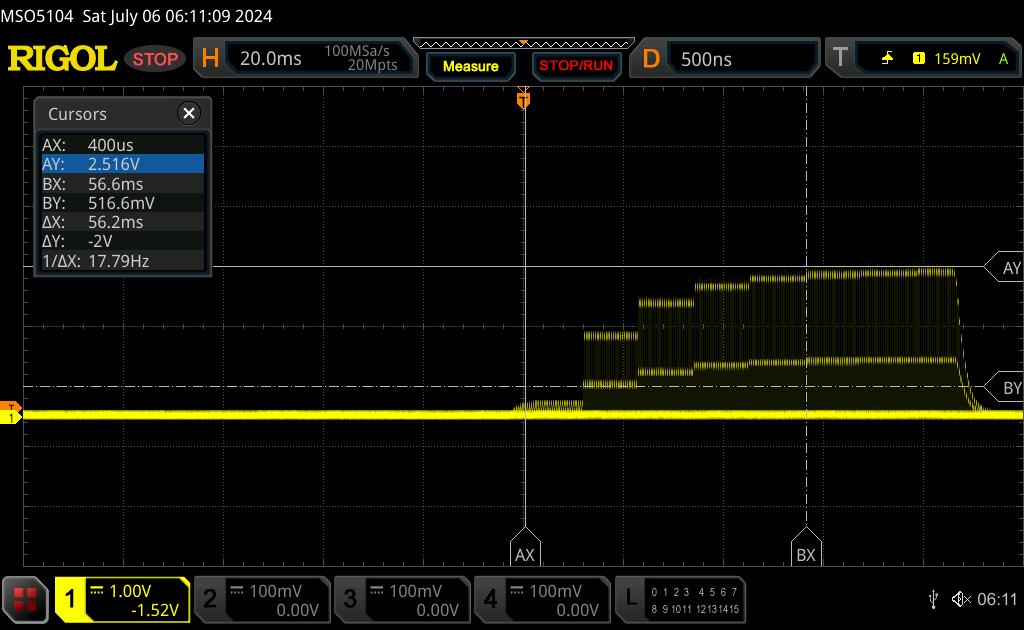 |
| ↘ 4.4 ms sonbahar | ||
| Ekran, testlerimizde yavaş yanıt oranları gösteriyor ve oyuncular için yetersiz olacaktır. Karşılaştırıldığında, test edilen tüm cihazlar 0.1 (minimum) ile 240 (maksimum) ms arasında değişir. » Tüm cihazların 100 %'si daha iyi. Bu, ölçülen yanıt süresinin test edilen tüm cihazların ortalamasından (20.8 ms) daha kötü olduğu anlamına gelir. | ||
| ↔ Tepki Süresi %50 Griden %80 Griye | ||
| 15.4 ms ... yükseliş ↗ ve sonbahar↘ birleşimi | ↗ 8.6 ms yükseliş | 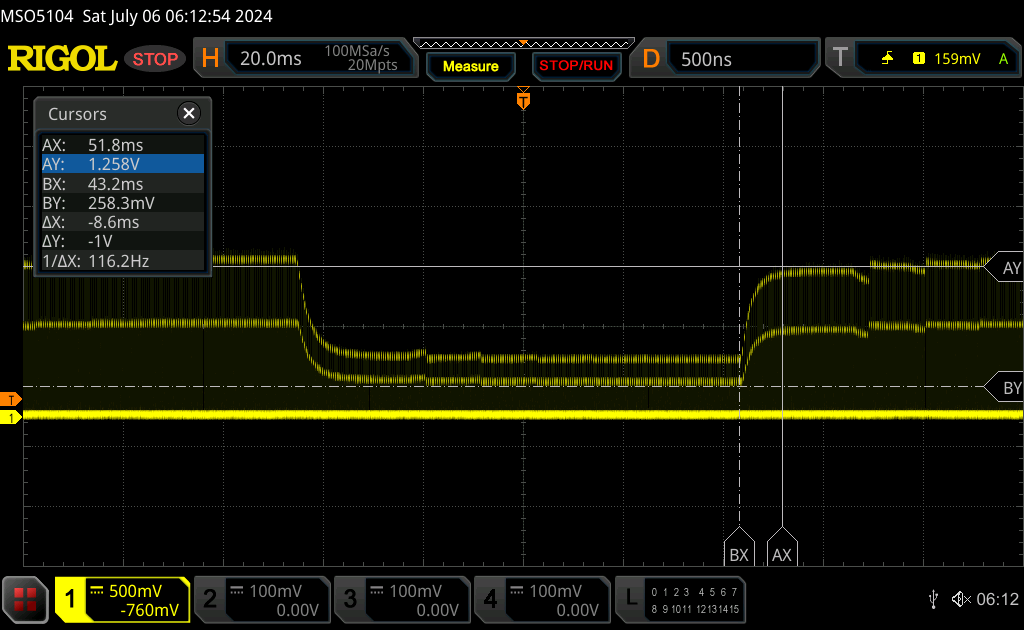 |
| ↘ 6.8 ms sonbahar | ||
| Ekran, testlerimizde iyi yanıt oranları gösteriyor ancak rekabetçi oyuncular için çok yavaş olabilir. Karşılaştırıldığında, test edilen tüm cihazlar 0.165 (minimum) ile 636 (maksimum) ms arasında değişir. » Tüm cihazların 27 %'si daha iyi. Bu, ölçülen yanıt süresinin test edilen tüm cihazların ortalamasından (32.5 ms) daha iyi olduğu anlamına gelir. | ||
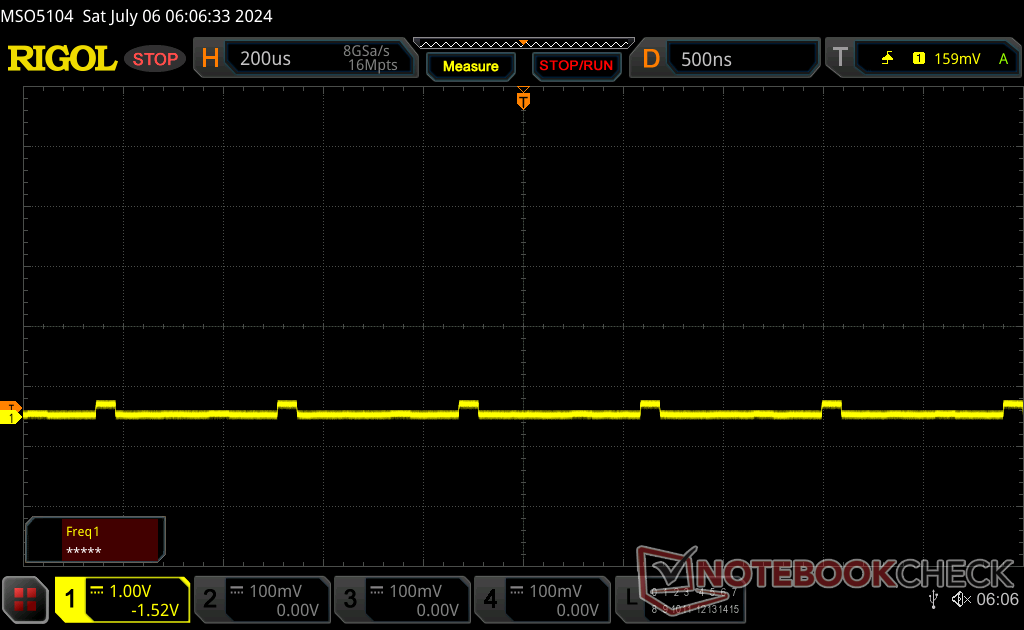
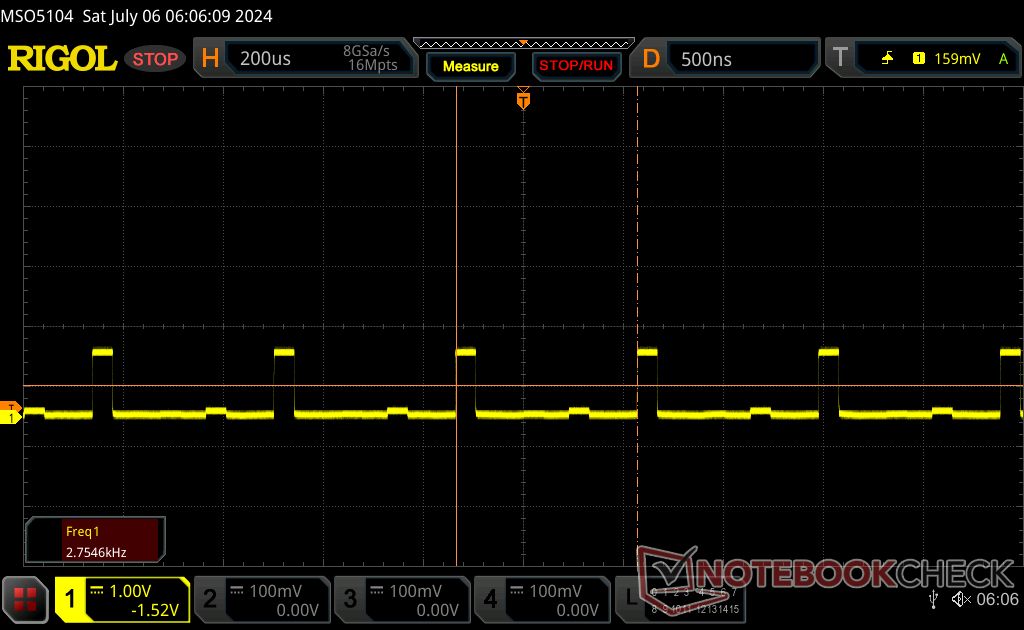
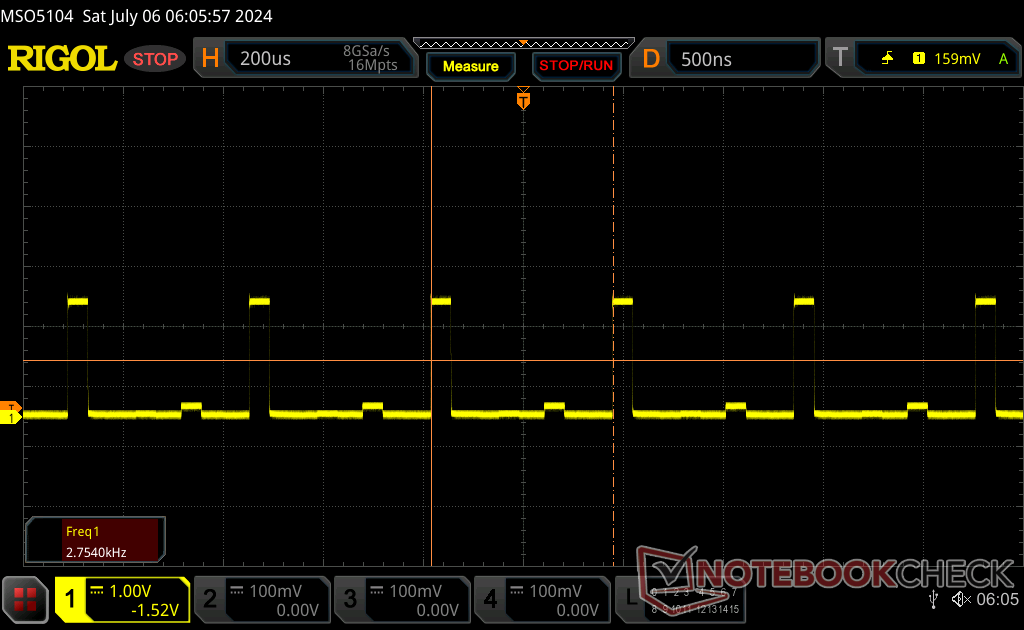
Ekran Titremesi / PWM (Darbe Genişliği Modülasyonu)
| Ekran titriyor / PWM algılandı | 2753.7 Hz | ≤ 100 % parlaklık ayarı | 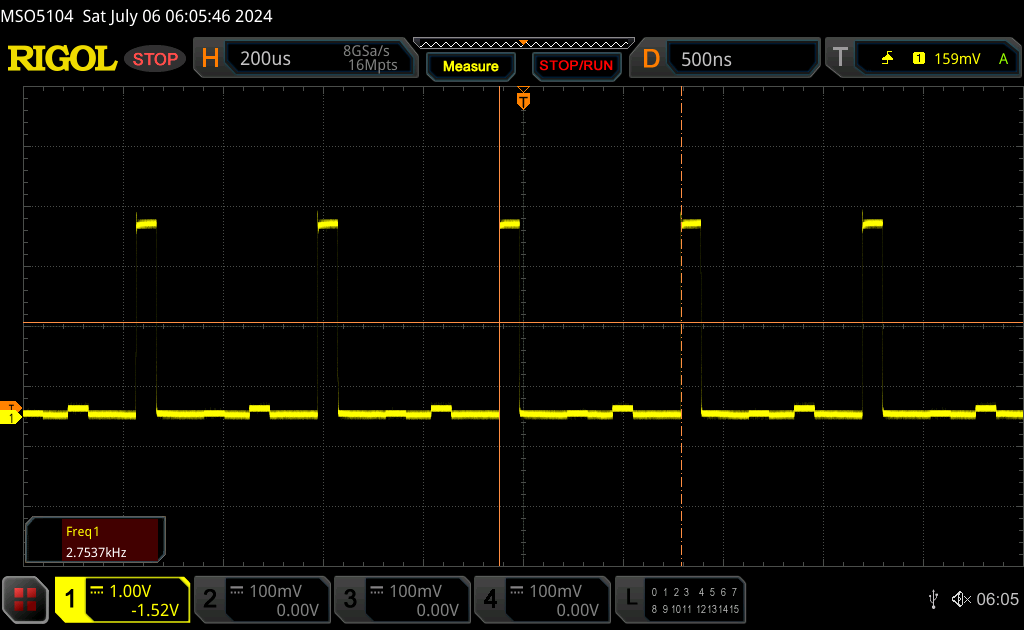 |
Ekran arka ışığı 2753.7 Hz'de titriyor (en kötü durum, örneğin PWM kullanılması) 100 % ve altındaki parlaklık ayarında titreme algılandı. Bu parlaklık ayarının üzerinde titreme veya PWM olmamalıdır. 2753.7 Hz frekansı oldukça yüksektir, bu nedenle PWM'ye duyarlı çoğu kullanıcı herhangi bir titremeyi fark etmemelidir. Karşılaştırıldığında: Test edilen tüm cihazların %53 %'si ekranı karartmak için PWM kullanmıyor. PWM tespit edilirse, ortalama 8516 (minimum: 5 - maksimum: 343500) Hz ölçüldü. | |||
Tüm parlaklık seviyelerinde 2753 Hz'lik sabit bir frekansta darbe genişliği modülasyonu veya titreme mevcuttur. Bu davranış bir mini LED panelden beklenmelidir ve frekans neyse ki çoğu izleyici için fark edilmeyecek kadar hızlıdır.

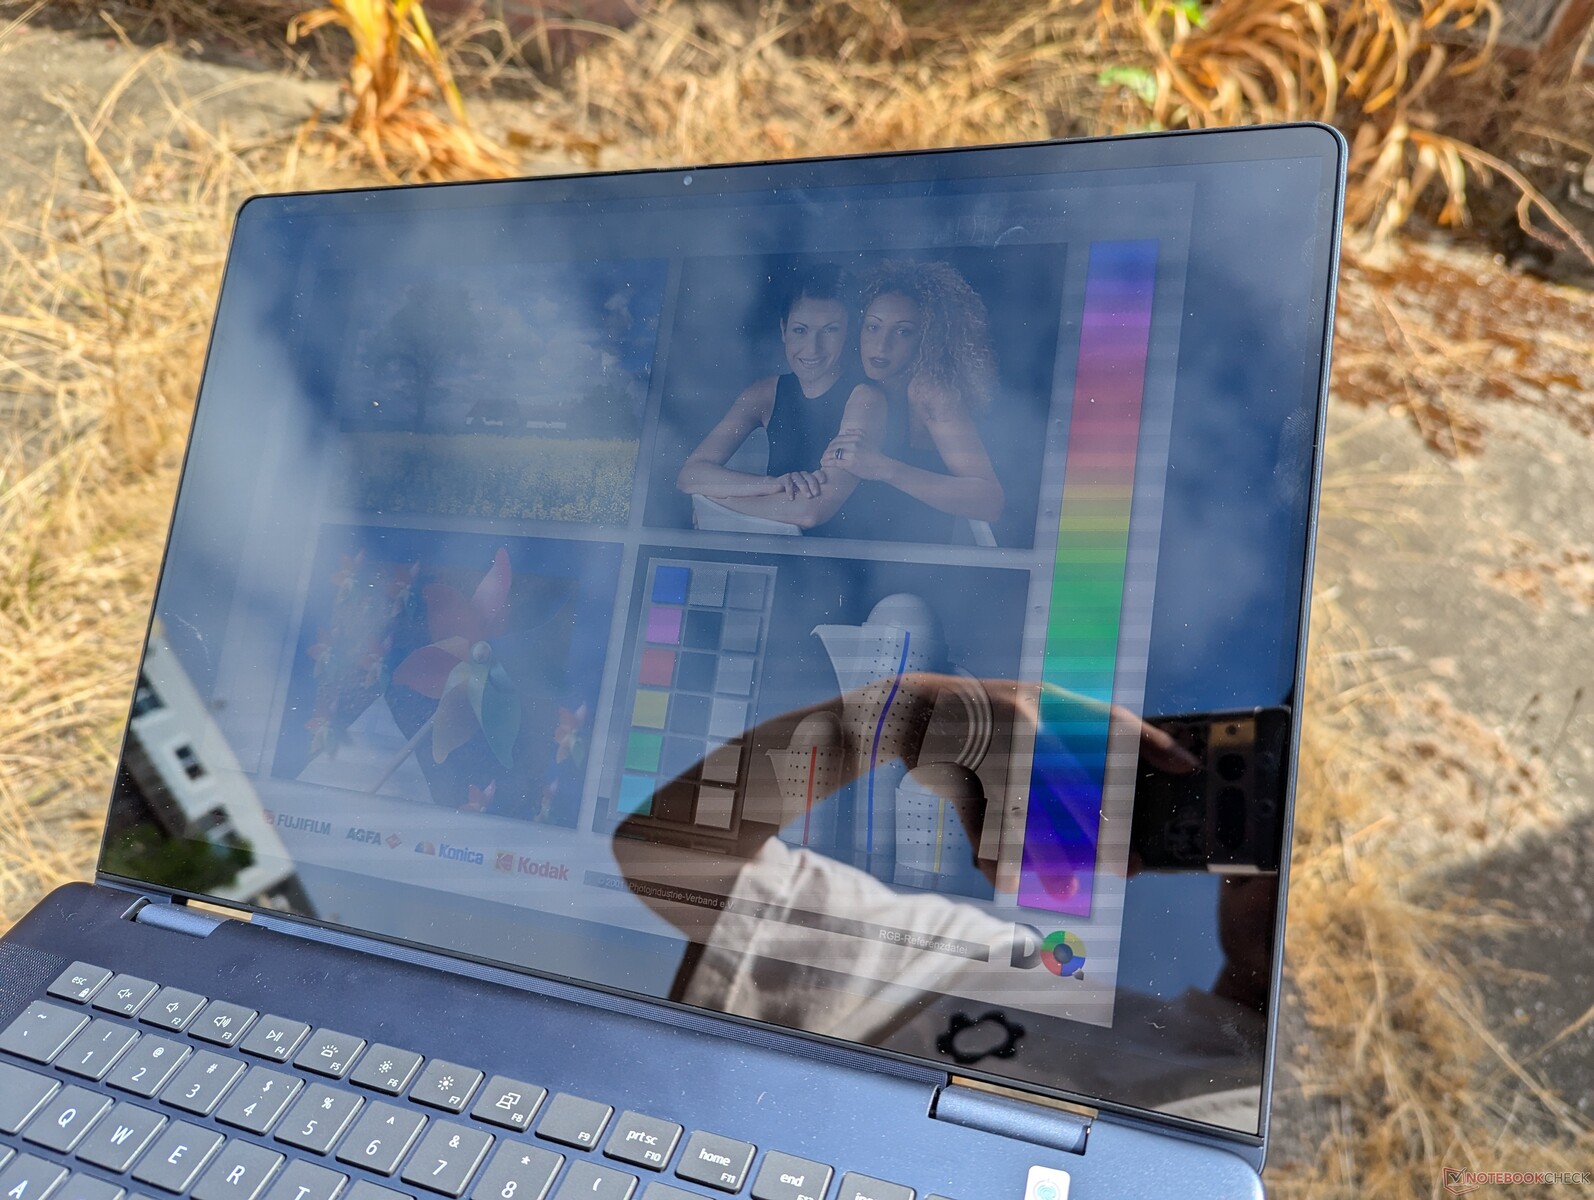
SDR modunda 400 nit veya HDR modunda 600 nit olan ekran, hem temel IPS seçeneğinden hem de giden modeldeki OLED seçeneğinden daha parlak. Inspiron 16 2'si 1 arada yine de parlamanın hızla sorun haline geldiği dış mekan koşulları için yeterince parlak değil. HDR'yi etkinleştirmenin parlaklık tavanını yükselttiği için sorunu hafifletebileceğini düşünebilirsiniz, ancak Windows HDR modunun pil gücünde kullanılamadığını unutmayın.
Performans - Bir Cabrio İçin Hızlı
Test Koşulları
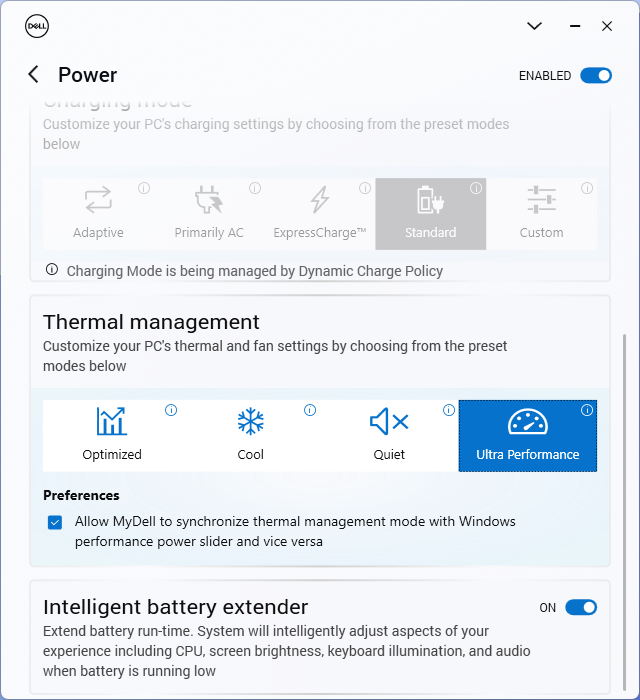
Aşağıdaki kıyaslamaları çalıştırmadan önce MyDell'i Performans moduna ayarladık. Yazılım, güç ayarları arasında geçiş yapmayı daha basit bir işlem haline getirmek için Dell güç profillerini Windows güç profilleriyle senkronize etmek için kullanışlı bir geçişe sahiptir.
İşlemci
Dönüştürülebilir bir form faktöründe Core H serisi bir CPU'ya sahip olmak bazen endişe verici olabilir çünkü üretici performansını düşük tutabilir. Neyse ki Inspiron 16 7640 2'si 1 arada için durum böyle görünmüyor çünkü Core Ultra 7 155H aynı işlemciyle donatılmış veritabanımızdaki ortalama bilgisayarın yüzde 5'i kadar performans gösterecektir. Bu, Dell modelini 16 inç boyut kategorisindeki en hızlı dönüştürülebilir bilgisayarlardan biri haline getirerek aşağıdaki gibi yüksek performanslı seçenekleri geride bırakıyor Ryzen 7 8840HS içinde HP Envy x360 16 2'si 1 arada. Aynı CPU'nun birçok oyun dizüstü bilgisayarında da bulunduğunu belirtmek gerekir ki bu da Dell dönüştürülebilir bilgisayarın işlemci performansı söz konusu olduğunda dalga geçmediğini gösterir.
Turbo Boost sürdürülebilirliği iyi ama mükemmel değil. CineBench R15 xT'yi bir döngü içinde çalıştırırken, 2680 puanlık başlangıç skorumuz sadece üç çalıştırmadan sonra yaklaşık yüzde 15 oranında düşüyordu. 16 inç istiridye kabuğu gibi Lenovo IdeaPad Pro 5 16 veya aynı CPU'ya sahip Inspiron 16 Plus 7640, aşağıdaki grafikte gösterildiği gibi daha yüksek Turbo Boost saat hızlarını daha uzun süre koruyabilmektedir.
Alt uç için yerleşme Core Ultra 5 125U yapılandırmasının çoklu iş parçacığı performansını yüzde 40 oranında önemli ölçüde etkilemesi beklenmektedir Lenovo Yoga 7 2'si 1 arada 16. Ancak Core U serisi seçeneği, pil ömrünü ham performansa tercih edenler için hala ideal olabilir.
Cinebench R15 Multi Loop
Cinebench R23: Multi Core | Single Core
Cinebench R20: CPU (Multi Core) | CPU (Single Core)
Cinebench R15: CPU Multi 64Bit | CPU Single 64Bit
Blender: v2.79 BMW27 CPU
7-Zip 18.03: 7z b 4 | 7z b 4 -mmt1
Geekbench 6.4: Multi-Core | Single-Core
Geekbench 5.5: Multi-Core | Single-Core
HWBOT x265 Benchmark v2.2: 4k Preset
LibreOffice : 20 Documents To PDF
R Benchmark 2.5: Overall mean
| CPU Performance Rating | |
| Lenovo Yoga Pro 9 16IMH9 RTX 4050 | |
| Dell Inspiron 16 Plus 7640 | |
| Dell Inspiron 16 7640 2-in-1 | |
| Ortalama Intel Core Ultra 7 155H | |
| Lenovo ThinkPad T16 G2 21K70035GE | |
| HP Envy x360 2-in-1 16-ad0097nr | |
| HP Spectre x360 2-in-1 16-f1075ng -2! | |
| Samsung Galaxy Book3 Pro 16 -2! | |
| Samsung Galaxy Book4 Pro 360 -1! | |
| LG Gram 2in1 16 16T90R - G.AA78G | |
| Asus ExpertBook B5 Flip B5602FBN -2! | |
| Acer Swift X SFX16-52G-52VE -2! | |
| Lenovo IdeaPad Flex 5 16ABR G8 -2! | |
| Lenovo Yoga 7 2-in-1 16IML9 | |
| Acer Swift Edge SFE16-42-R1GM -2! | |
| Lenovo ThinkPad E16 G1 Core i5-1335U -2! | |
| Samsung Galaxy Book3 Ultra 16, i9-13900H RTX 4070 -2! | |
| Dell Inspiron 16 7635 2-in-1 -2! | |
| Lenovo Thinkpad X1 Fold 16 | |
| Cinebench R23 / Multi Core | |
| Lenovo Yoga Pro 9 16IMH9 RTX 4050 | |
| Dell Inspiron 16 Plus 7640 | |
| Dell Inspiron 16 7640 2-in-1 | |
| Ortalama Intel Core Ultra 7 155H (9769 - 19007, n=52) | |
| Samsung Galaxy Book3 Ultra 16, i9-13900H RTX 4070 | |
| HP Envy x360 2-in-1 16-ad0097nr | |
| Lenovo ThinkPad T16 G2 21K70035GE | |
| HP Spectre x360 2-in-1 16-f1075ng | |
| LG Gram 2in1 16 16T90R - G.AA78G | |
| Lenovo IdeaPad Flex 5 16ABR G8 | |
| Acer Swift X SFX16-52G-52VE | |
| Asus ExpertBook B5 Flip B5602FBN | |
| Samsung Galaxy Book3 Pro 16 | |
| Acer Swift Edge SFE16-42-R1GM | |
| Samsung Galaxy Book4 Pro 360 | |
| Lenovo Yoga 7 2-in-1 16IML9 | |
| Lenovo ThinkPad E16 G1 Core i5-1335U | |
| Dell Inspiron 16 7635 2-in-1 | |
| Lenovo Thinkpad X1 Fold 16 | |
| Cinebench R23 / Single Core | |
| HP Spectre x360 2-in-1 16-f1075ng | |
| Lenovo Yoga Pro 9 16IMH9 RTX 4050 | |
| Asus ExpertBook B5 Flip B5602FBN | |
| Dell Inspiron 16 7640 2-in-1 | |
| HP Envy x360 2-in-1 16-ad0097nr | |
| Dell Inspiron 16 Plus 7640 | |
| Ortalama Intel Core Ultra 7 155H (1496 - 1815, n=52) | |
| Samsung Galaxy Book3 Pro 16 | |
| Lenovo ThinkPad E16 G1 Core i5-1335U | |
| Samsung Galaxy Book4 Pro 360 | |
| Lenovo ThinkPad T16 G2 21K70035GE | |
| LG Gram 2in1 16 16T90R - G.AA78G | |
| Lenovo Thinkpad X1 Fold 16 | |
| Acer Swift X SFX16-52G-52VE | |
| Lenovo Yoga 7 2-in-1 16IML9 | |
| Acer Swift Edge SFE16-42-R1GM | |
| Lenovo IdeaPad Flex 5 16ABR G8 | |
| Dell Inspiron 16 7635 2-in-1 | |
| Samsung Galaxy Book3 Ultra 16, i9-13900H RTX 4070 | |
| Cinebench R20 / CPU (Multi Core) | |
| Lenovo Yoga Pro 9 16IMH9 RTX 4050 | |
| Dell Inspiron 16 Plus 7640 | |
| Dell Inspiron 16 7640 2-in-1 | |
| Ortalama Intel Core Ultra 7 155H (3798 - 7409, n=50) | |
| Lenovo ThinkPad T16 G2 21K70035GE | |
| HP Envy x360 2-in-1 16-ad0097nr | |
| Samsung Galaxy Book3 Ultra 16, i9-13900H RTX 4070 | |
| HP Spectre x360 2-in-1 16-f1075ng | |
| Samsung Galaxy Book3 Pro 16 | |
| LG Gram 2in1 16 16T90R - G.AA78G | |
| Acer Swift X SFX16-52G-52VE | |
| Asus ExpertBook B5 Flip B5602FBN | |
| Acer Swift Edge SFE16-42-R1GM | |
| Samsung Galaxy Book4 Pro 360 | |
| Lenovo ThinkPad E16 G1 Core i5-1335U | |
| Lenovo IdeaPad Flex 5 16ABR G8 | |
| Lenovo Yoga 7 2-in-1 16IML9 | |
| Dell Inspiron 16 7635 2-in-1 | |
| Lenovo Thinkpad X1 Fold 16 | |
| Cinebench R20 / CPU (Single Core) | |
| Lenovo Yoga Pro 9 16IMH9 RTX 4050 | |
| HP Spectre x360 2-in-1 16-f1075ng | |
| Lenovo ThinkPad T16 G2 21K70035GE | |
| Asus ExpertBook B5 Flip B5602FBN | |
| Dell Inspiron 16 7640 2-in-1 | |
| Dell Inspiron 16 Plus 7640 | |
| Ortalama Intel Core Ultra 7 155H (601 - 696, n=50) | |
| Lenovo ThinkPad E16 G1 Core i5-1335U | |
| LG Gram 2in1 16 16T90R - G.AA78G | |
| Samsung Galaxy Book4 Pro 360 | |
| Samsung Galaxy Book3 Pro 16 | |
| HP Envy x360 2-in-1 16-ad0097nr | |
| Acer Swift X SFX16-52G-52VE | |
| Lenovo Thinkpad X1 Fold 16 | |
| Lenovo Yoga 7 2-in-1 16IML9 | |
| Dell Inspiron 16 7635 2-in-1 | |
| Lenovo IdeaPad Flex 5 16ABR G8 | |
| Acer Swift Edge SFE16-42-R1GM | |
| Samsung Galaxy Book3 Ultra 16, i9-13900H RTX 4070 | |
| Cinebench R15 / CPU Multi 64Bit | |
| Lenovo Yoga Pro 9 16IMH9 RTX 4050 | |
| Dell Inspiron 16 Plus 7640 | |
| Dell Inspiron 16 7640 2-in-1 | |
| Ortalama Intel Core Ultra 7 155H (1932 - 2880, n=56) | |
| LG Gram 2in1 16 16T90R - G.AA78G | |
| Samsung Galaxy Book3 Ultra 16, i9-13900H RTX 4070 | |
| Lenovo ThinkPad T16 G2 21K70035GE | |
| HP Spectre x360 2-in-1 16-f1075ng | |
| HP Envy x360 2-in-1 16-ad0097nr | |
| Asus ExpertBook B5 Flip B5602FBN | |
| Lenovo IdeaPad Flex 5 16ABR G8 | |
| Acer Swift X SFX16-52G-52VE | |
| Samsung Galaxy Book3 Pro 16 | |
| Samsung Galaxy Book4 Pro 360 | |
| Acer Swift Edge SFE16-42-R1GM | |
| Lenovo Yoga 7 2-in-1 16IML9 | |
| Lenovo ThinkPad E16 G1 Core i5-1335U | |
| Dell Inspiron 16 7635 2-in-1 | |
| Lenovo Thinkpad X1 Fold 16 | |
| Cinebench R15 / CPU Single 64Bit | |
| Lenovo Yoga Pro 9 16IMH9 RTX 4050 | |
| Lenovo ThinkPad T16 G2 21K70035GE | |
| HP Spectre x360 2-in-1 16-f1075ng | |
| HP Envy x360 2-in-1 16-ad0097nr | |
| Dell Inspiron 16 7640 2-in-1 | |
| Dell Inspiron 16 Plus 7640 | |
| Ortalama Intel Core Ultra 7 155H (99.6 - 268, n=52) | |
| Samsung Galaxy Book4 Pro 360 | |
| LG Gram 2in1 16 16T90R - G.AA78G | |
| Asus ExpertBook B5 Flip B5602FBN | |
| Samsung Galaxy Book3 Pro 16 | |
| Lenovo ThinkPad E16 G1 Core i5-1335U | |
| Acer Swift X SFX16-52G-52VE | |
| Acer Swift Edge SFE16-42-R1GM | |
| Dell Inspiron 16 7635 2-in-1 | |
| Lenovo IdeaPad Flex 5 16ABR G8 | |
| Lenovo Yoga 7 2-in-1 16IML9 | |
| Lenovo Thinkpad X1 Fold 16 | |
| Samsung Galaxy Book3 Ultra 16, i9-13900H RTX 4070 | |
| Blender / v2.79 BMW27 CPU | |
| Lenovo Thinkpad X1 Fold 16 | |
| Lenovo ThinkPad E16 G1 Core i5-1335U | |
| Samsung Galaxy Book4 Pro 360 | |
| Dell Inspiron 16 7635 2-in-1 | |
| Lenovo Yoga 7 2-in-1 16IML9 | |
| LG Gram 2in1 16 16T90R - G.AA78G | |
| Acer Swift X SFX16-52G-52VE | |
| Acer Swift Edge SFE16-42-R1GM | |
| Asus ExpertBook B5 Flip B5602FBN | |
| Samsung Galaxy Book3 Pro 16 | |
| Lenovo IdeaPad Flex 5 16ABR G8 | |
| HP Spectre x360 2-in-1 16-f1075ng | |
| HP Envy x360 2-in-1 16-ad0097nr | |
| Lenovo ThinkPad T16 G2 21K70035GE | |
| Samsung Galaxy Book3 Ultra 16, i9-13900H RTX 4070 | |
| Ortalama Intel Core Ultra 7 155H (175 - 381, n=47) | |
| Dell Inspiron 16 7640 2-in-1 | |
| Dell Inspiron 16 Plus 7640 | |
| Lenovo Yoga Pro 9 16IMH9 RTX 4050 | |
| 7-Zip 18.03 / 7z b 4 | |
| Lenovo Yoga Pro 9 16IMH9 RTX 4050 | |
| Dell Inspiron 16 7640 2-in-1 | |
| Dell Inspiron 16 Plus 7640 | |
| Ortalama Intel Core Ultra 7 155H (41739 - 70254, n=50) | |
| Lenovo ThinkPad T16 G2 21K70035GE | |
| HP Envy x360 2-in-1 16-ad0097nr | |
| Lenovo IdeaPad Flex 5 16ABR G8 | |
| Samsung Galaxy Book3 Ultra 16, i9-13900H RTX 4070 | |
| Acer Swift Edge SFE16-42-R1GM | |
| HP Spectre x360 2-in-1 16-f1075ng | |
| Asus ExpertBook B5 Flip B5602FBN | |
| Samsung Galaxy Book3 Pro 16 | |
| Acer Swift X SFX16-52G-52VE | |
| LG Gram 2in1 16 16T90R - G.AA78G | |
| Lenovo Yoga 7 2-in-1 16IML9 | |
| Dell Inspiron 16 7635 2-in-1 | |
| Lenovo ThinkPad E16 G1 Core i5-1335U | |
| Lenovo Thinkpad X1 Fold 16 | |
| 7-Zip 18.03 / 7z b 4 -mmt1 | |
| Lenovo ThinkPad T16 G2 21K70035GE | |
| HP Envy x360 2-in-1 16-ad0097nr | |
| HP Spectre x360 2-in-1 16-f1075ng | |
| Asus ExpertBook B5 Flip B5602FBN | |
| Acer Swift Edge SFE16-42-R1GM | |
| Lenovo Yoga Pro 9 16IMH9 RTX 4050 | |
| Dell Inspiron 16 Plus 7640 | |
| Dell Inspiron 16 7640 2-in-1 | |
| Lenovo IdeaPad Flex 5 16ABR G8 | |
| Ortalama Intel Core Ultra 7 155H (4594 - 5621, n=50) | |
| Samsung Galaxy Book3 Pro 16 | |
| Dell Inspiron 16 7635 2-in-1 | |
| Lenovo ThinkPad E16 G1 Core i5-1335U | |
| Samsung Galaxy Book4 Pro 360 | |
| Lenovo Thinkpad X1 Fold 16 | |
| Acer Swift X SFX16-52G-52VE | |
| LG Gram 2in1 16 16T90R - G.AA78G | |
| Lenovo Yoga 7 2-in-1 16IML9 | |
| Samsung Galaxy Book3 Ultra 16, i9-13900H RTX 4070 | |
| Geekbench 5.5 / Multi-Core | |
| Lenovo Yoga Pro 9 16IMH9 RTX 4050 | |
| Dell Inspiron 16 Plus 7640 | |
| Dell Inspiron 16 7640 2-in-1 | |
| Ortalama Intel Core Ultra 7 155H (10017 - 13556, n=52) | |
| LG Gram 2in1 16 16T90R - G.AA78G | |
| Samsung Galaxy Book3 Pro 16 | |
| Acer Swift X SFX16-52G-52VE | |
| Lenovo ThinkPad T16 G2 21K70035GE | |
| HP Envy x360 2-in-1 16-ad0097nr | |
| Samsung Galaxy Book4 Pro 360 | |
| Asus ExpertBook B5 Flip B5602FBN | |
| Samsung Galaxy Book3 Ultra 16, i9-13900H RTX 4070 | |
| HP Spectre x360 2-in-1 16-f1075ng | |
| Lenovo Yoga 7 2-in-1 16IML9 | |
| Acer Swift Edge SFE16-42-R1GM | |
| Lenovo IdeaPad Flex 5 16ABR G8 | |
| Lenovo ThinkPad E16 G1 Core i5-1335U | |
| Lenovo Thinkpad X1 Fold 16 | |
| Dell Inspiron 16 7635 2-in-1 | |
| Geekbench 5.5 / Single-Core | |
| HP Envy x360 2-in-1 16-ad0097nr | |
| Lenovo Yoga Pro 9 16IMH9 RTX 4050 | |
| Dell Inspiron 16 Plus 7640 | |
| Dell Inspiron 16 7640 2-in-1 | |
| HP Spectre x360 2-in-1 16-f1075ng | |
| Lenovo ThinkPad T16 G2 21K70035GE | |
| Ortalama Intel Core Ultra 7 155H (1462 - 1824, n=52) | |
| Samsung Galaxy Book3 Pro 16 | |
| Samsung Galaxy Book4 Pro 360 | |
| Lenovo ThinkPad E16 G1 Core i5-1335U | |
| Acer Swift X SFX16-52G-52VE | |
| Lenovo Thinkpad X1 Fold 16 | |
| LG Gram 2in1 16 16T90R - G.AA78G | |
| Lenovo Yoga 7 2-in-1 16IML9 | |
| Asus ExpertBook B5 Flip B5602FBN | |
| Acer Swift Edge SFE16-42-R1GM | |
| Dell Inspiron 16 7635 2-in-1 | |
| Lenovo IdeaPad Flex 5 16ABR G8 | |
| Samsung Galaxy Book3 Ultra 16, i9-13900H RTX 4070 | |
| HWBOT x265 Benchmark v2.2 / 4k Preset | |
| Lenovo Yoga Pro 9 16IMH9 RTX 4050 | |
| Dell Inspiron 16 Plus 7640 | |
| Dell Inspiron 16 7640 2-in-1 | |
| Ortalama Intel Core Ultra 7 155H (9.93 - 21.2, n=50) | |
| Lenovo ThinkPad T16 G2 21K70035GE | |
| HP Envy x360 2-in-1 16-ad0097nr | |
| Samsung Galaxy Book3 Ultra 16, i9-13900H RTX 4070 | |
| HP Spectre x360 2-in-1 16-f1075ng | |
| Samsung Galaxy Book3 Pro 16 | |
| Asus ExpertBook B5 Flip B5602FBN | |
| Acer Swift X SFX16-52G-52VE | |
| Acer Swift Edge SFE16-42-R1GM | |
| Lenovo IdeaPad Flex 5 16ABR G8 | |
| LG Gram 2in1 16 16T90R - G.AA78G | |
| Lenovo Yoga 7 2-in-1 16IML9 | |
| Dell Inspiron 16 7635 2-in-1 | |
| Samsung Galaxy Book4 Pro 360 | |
| Lenovo ThinkPad E16 G1 Core i5-1335U | |
| Lenovo Thinkpad X1 Fold 16 | |
| LibreOffice / 20 Documents To PDF | |
| Samsung Galaxy Book3 Ultra 16, i9-13900H RTX 4070 | |
| Acer Swift Edge SFE16-42-R1GM | |
| LG Gram 2in1 16 16T90R - G.AA78G | |
| Lenovo Thinkpad X1 Fold 16 | |
| HP Envy x360 2-in-1 16-ad0097nr | |
| Lenovo IdeaPad Flex 5 16ABR G8 | |
| Lenovo ThinkPad E16 G1 Core i5-1335U | |
| Asus ExpertBook B5 Flip B5602FBN | |
| Ortalama Intel Core Ultra 7 155H (37.5 - 79.2, n=49) | |
| Dell Inspiron 16 7635 2-in-1 | |
| Acer Swift X SFX16-52G-52VE | |
| Lenovo Yoga 7 2-in-1 16IML9 | |
| Dell Inspiron 16 7640 2-in-1 | |
| Lenovo ThinkPad T16 G2 21K70035GE | |
| Dell Inspiron 16 Plus 7640 | |
| Samsung Galaxy Book4 Pro 360 | |
| HP Spectre x360 2-in-1 16-f1075ng | |
| Samsung Galaxy Book3 Pro 16 | |
| Lenovo Yoga Pro 9 16IMH9 RTX 4050 | |
| R Benchmark 2.5 / Overall mean | |
| Samsung Galaxy Book3 Ultra 16, i9-13900H RTX 4070 | |
| LG Gram 2in1 16 16T90R - G.AA78G | |
| Lenovo IdeaPad Flex 5 16ABR G8 | |
| Acer Swift X SFX16-52G-52VE | |
| Lenovo Yoga 7 2-in-1 16IML9 | |
| Dell Inspiron 16 7635 2-in-1 | |
| Acer Swift Edge SFE16-42-R1GM | |
| Lenovo Thinkpad X1 Fold 16 | |
| Samsung Galaxy Book4 Pro 360 | |
| Samsung Galaxy Book3 Pro 16 | |
| Asus ExpertBook B5 Flip B5602FBN | |
| Dell Inspiron 16 7640 2-in-1 | |
| Ortalama Intel Core Ultra 7 155H (0.4457 - 0.53, n=49) | |
| Lenovo ThinkPad T16 G2 21K70035GE | |
| Dell Inspiron 16 Plus 7640 | |
| HP Envy x360 2-in-1 16-ad0097nr | |
| HP Spectre x360 2-in-1 16-f1075ng | |
| Lenovo Yoga Pro 9 16IMH9 RTX 4050 | |
Cinebench R23: Multi Core | Single Core
Cinebench R20: CPU (Multi Core) | CPU (Single Core)
Cinebench R15: CPU Multi 64Bit | CPU Single 64Bit
Blender: v2.79 BMW27 CPU
7-Zip 18.03: 7z b 4 | 7z b 4 -mmt1
Geekbench 6.4: Multi-Core | Single-Core
Geekbench 5.5: Multi-Core | Single-Core
HWBOT x265 Benchmark v2.2: 4k Preset
LibreOffice : 20 Documents To PDF
R Benchmark 2.5: Overall mean
* ... daha küçük daha iyidir
AIDA64: FP32 Ray-Trace | FPU Julia | CPU SHA3 | CPU Queen | FPU SinJulia | FPU Mandel | CPU AES | CPU ZLib | FP64 Ray-Trace | CPU PhotoWorxx
| Performance Rating | |
| Lenovo IdeaPad Pro 5 16IMH G9 | |
| HP Envy x360 2-in-1 16-ad0097nr | |
| Dell Inspiron 16 7640 2-in-1 | |
| Dell Inspiron 16 Plus 7640 | |
| Ortalama Intel Core Ultra 7 155H | |
| Dell Inspiron 16 7635 2-in-1 | |
| Samsung Galaxy Book4 Pro 360 | |
| AIDA64 / FP32 Ray-Trace | |
| HP Envy x360 2-in-1 16-ad0097nr | |
| Lenovo IdeaPad Pro 5 16IMH G9 | |
| Dell Inspiron 16 7640 2-in-1 | |
| Dell Inspiron 16 Plus 7640 | |
| Ortalama Intel Core Ultra 7 155H (6670 - 18470, n=50) | |
| Dell Inspiron 16 7635 2-in-1 | |
| Samsung Galaxy Book4 Pro 360 | |
| AIDA64 / FPU Julia | |
| Lenovo IdeaPad Pro 5 16IMH G9 | |
| HP Envy x360 2-in-1 16-ad0097nr | |
| Dell Inspiron 16 7640 2-in-1 | |
| Dell Inspiron 16 Plus 7640 | |
| Ortalama Intel Core Ultra 7 155H (40905 - 93181, n=50) | |
| Dell Inspiron 16 7635 2-in-1 | |
| Samsung Galaxy Book4 Pro 360 | |
| AIDA64 / CPU SHA3 | |
| Lenovo IdeaPad Pro 5 16IMH G9 | |
| HP Envy x360 2-in-1 16-ad0097nr | |
| Dell Inspiron 16 7640 2-in-1 | |
| Dell Inspiron 16 Plus 7640 | |
| Ortalama Intel Core Ultra 7 155H (1940 - 4436, n=50) | |
| Samsung Galaxy Book4 Pro 360 | |
| Dell Inspiron 16 7635 2-in-1 | |
| AIDA64 / CPU Queen | |
| HP Envy x360 2-in-1 16-ad0097nr | |
| Dell Inspiron 16 7640 2-in-1 | |
| Dell Inspiron 16 Plus 7640 | |
| Lenovo IdeaPad Pro 5 16IMH G9 | |
| Ortalama Intel Core Ultra 7 155H (64698 - 94181, n=50) | |
| Samsung Galaxy Book4 Pro 360 | |
| Dell Inspiron 16 7635 2-in-1 | |
| AIDA64 / FPU SinJulia | |
| HP Envy x360 2-in-1 16-ad0097nr | |
| Lenovo IdeaPad Pro 5 16IMH G9 | |
| Dell Inspiron 16 7640 2-in-1 | |
| Dell Inspiron 16 Plus 7640 | |
| Ortalama Intel Core Ultra 7 155H (5639 - 10647, n=50) | |
| Dell Inspiron 16 7635 2-in-1 | |
| Samsung Galaxy Book4 Pro 360 | |
| AIDA64 / FPU Mandel | |
| HP Envy x360 2-in-1 16-ad0097nr | |
| Lenovo IdeaPad Pro 5 16IMH G9 | |
| Dell Inspiron 16 7640 2-in-1 | |
| Dell Inspiron 16 Plus 7640 | |
| Dell Inspiron 16 7635 2-in-1 | |
| Ortalama Intel Core Ultra 7 155H (18236 - 47685, n=50) | |
| Samsung Galaxy Book4 Pro 360 | |
| AIDA64 / CPU AES | |
| Lenovo IdeaPad Pro 5 16IMH G9 | |
| Ortalama Intel Core Ultra 7 155H (45713 - 152179, n=50) | |
| Dell Inspiron 16 7640 2-in-1 | |
| HP Envy x360 2-in-1 16-ad0097nr | |
| Dell Inspiron 16 Plus 7640 | |
| Samsung Galaxy Book4 Pro 360 | |
| Dell Inspiron 16 7635 2-in-1 | |
| AIDA64 / CPU ZLib | |
| Lenovo IdeaPad Pro 5 16IMH G9 | |
| Dell Inspiron 16 Plus 7640 | |
| Dell Inspiron 16 7640 2-in-1 | |
| Ortalama Intel Core Ultra 7 155H (557 - 1250, n=50) | |
| HP Envy x360 2-in-1 16-ad0097nr | |
| Samsung Galaxy Book4 Pro 360 | |
| Dell Inspiron 16 7635 2-in-1 | |
| AIDA64 / FP64 Ray-Trace | |
| HP Envy x360 2-in-1 16-ad0097nr | |
| Lenovo IdeaPad Pro 5 16IMH G9 | |
| Dell Inspiron 16 7640 2-in-1 | |
| Dell Inspiron 16 Plus 7640 | |
| Ortalama Intel Core Ultra 7 155H (3569 - 9802, n=50) | |
| Dell Inspiron 16 7635 2-in-1 | |
| Samsung Galaxy Book4 Pro 360 | |
| AIDA64 / CPU PhotoWorxx | |
| Lenovo IdeaPad Pro 5 16IMH G9 | |
| Ortalama Intel Core Ultra 7 155H (32719 - 54223, n=50) | |
| Samsung Galaxy Book4 Pro 360 | |
| Dell Inspiron 16 7640 2-in-1 | |
| Dell Inspiron 16 Plus 7640 | |
| HP Envy x360 2-in-1 16-ad0097nr | |
| Dell Inspiron 16 7635 2-in-1 | |
Stres Testi
CPU, 109 C (!) gibi çok yüksek bir çekirdek paket sıcaklığına ulaşmadan önce sadece birkaç saniye süren 3,2 GHz ve 88 W'a yükseliyordu. Daha sonra 86 C'lik daha soğuk bir çekirdek sıcaklığını korumak için hızlı bir şekilde sadece 2,3 GHz ve 44 W'a düşer. Sıcaklık aralıkları yine de Inspiron 16 7635 2'si 1 arada cihazda kaydettiğimizden daha sıcaktır, özellikle de CPU'muzun eski Inspiron 16 7635 2'si 1 arada cihazdaki 70 C aralığına kıyasla yüksek 90 C aralığında stabilize olacağı oyunları çalıştırırken. Bu fark, aşağıdaki Sıcaklık bölümümüzde gösterildiği gibi genel olarak daha sıcak yüzey sıcaklıklarına da katkıda bulunacaktır.
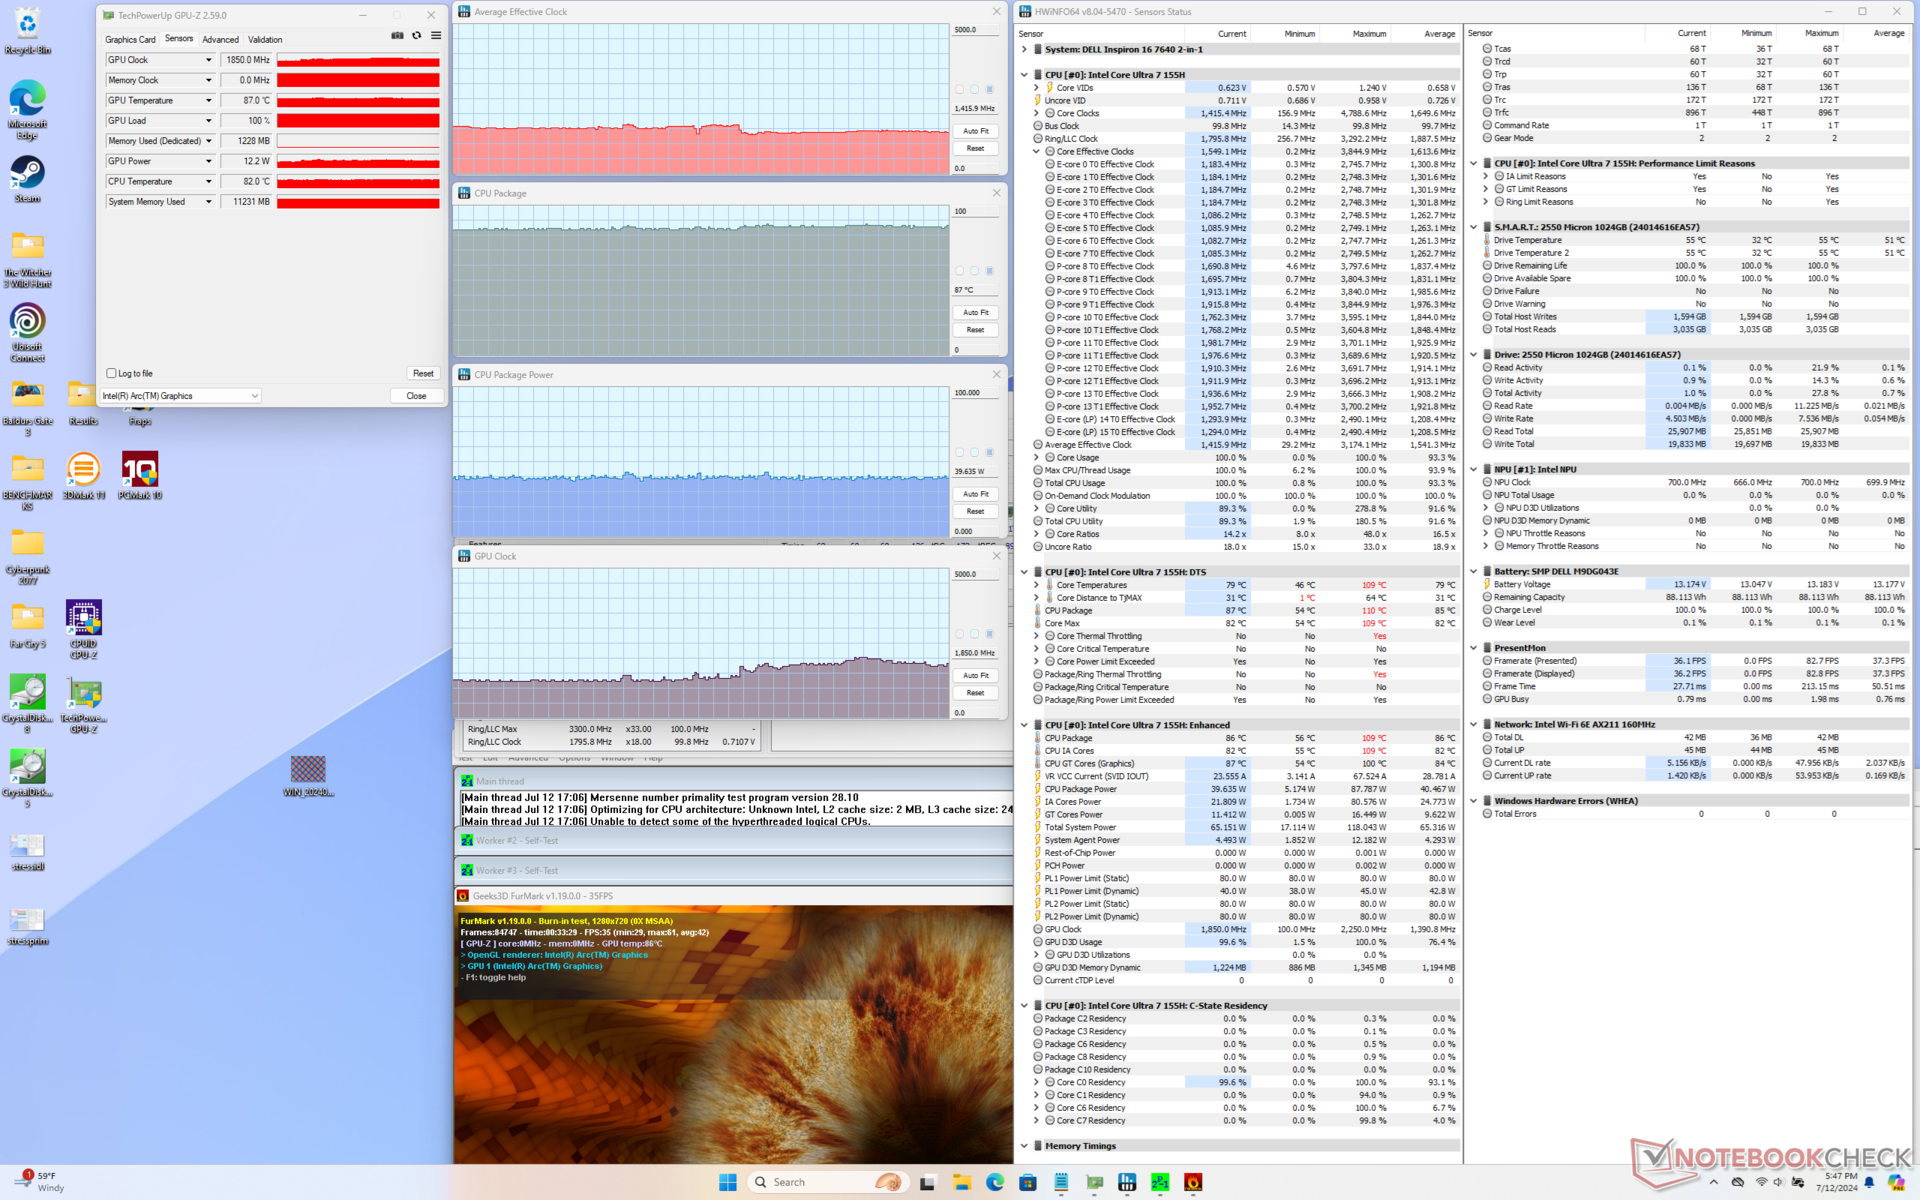
| Ortalama CPU Saati (GHz) | GPU Saati (MHz) | Ortalama CPU Sıcaklığı (°C) | |
| Sistem Boşta | -- | -- | 55 |
| Prime95 Stres | 2.3 | -- | 86 |
| Prime95 + FurMark Stres | 1.4 | 1250 - 1850 | 87 |
| Cyberpunk 2077 Stres | 0.6 | 1650 - 2250 | 90 - 98 |
Sistem Performansı
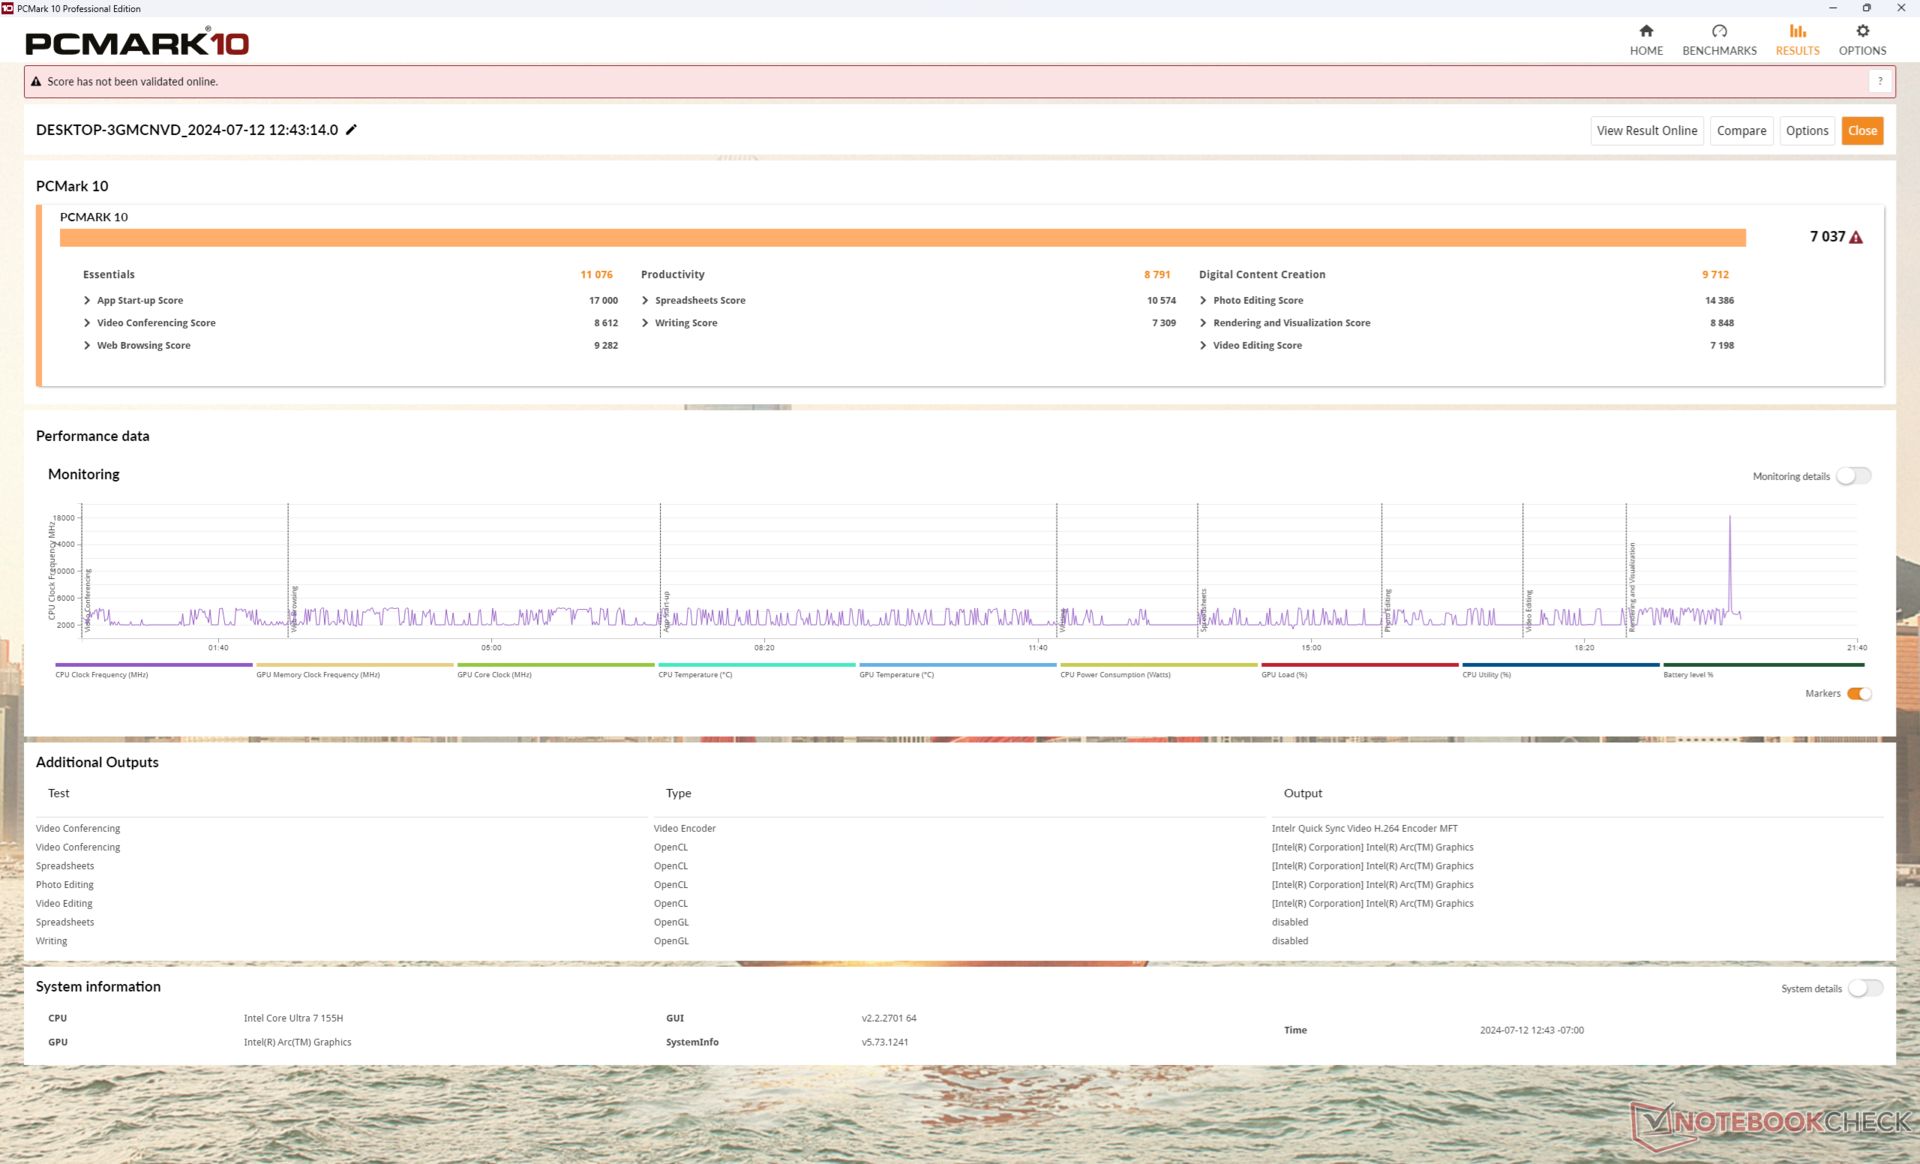
PCMark sonuçları mükemmel ve veritabanımızdaki aynı CPU ve entegre GPU'ya sahip diğer makinelerle karşılaştırılabilir. Dell için ortalama puanımız, 16 inç dönüştürülebilir makineler arasında en yüksek puanlardan biri, ancak ayrı GPU'lara sahip alternatifler HP Spectre x360 16 daha hızlı grafik performansı sunmaya devam edecektir.
CrossMark: Overall | Productivity | Creativity | Responsiveness
WebXPRT 3: Overall
WebXPRT 4: Overall
Mozilla Kraken 1.1: Total
| PCMark 10 / Score | |
| Lenovo IdeaPad Pro 5 16IMH G9 | |
| Dell Inspiron 16 Plus 7640 | |
| Dell Inspiron 16 7640 2-in-1 | |
| HP Envy x360 2-in-1 16-ad0097nr | |
| Ortalama Intel Core Ultra 7 155H, Intel Arc 8-Core iGPU (4809 - 7529, n=34) | |
| Samsung Galaxy Book4 Pro 360 | |
| Dell Inspiron 16 7635 2-in-1 | |
| PCMark 10 / Essentials | |
| Lenovo IdeaPad Pro 5 16IMH G9 | |
| Dell Inspiron 16 7640 2-in-1 | |
| Dell Inspiron 16 7635 2-in-1 | |
| Samsung Galaxy Book4 Pro 360 | |
| HP Envy x360 2-in-1 16-ad0097nr | |
| Ortalama Intel Core Ultra 7 155H, Intel Arc 8-Core iGPU (7605 - 11289, n=34) | |
| Dell Inspiron 16 Plus 7640 | |
| PCMark 10 / Productivity | |
| HP Envy x360 2-in-1 16-ad0097nr | |
| Dell Inspiron 16 7635 2-in-1 | |
| Lenovo IdeaPad Pro 5 16IMH G9 | |
| Dell Inspiron 16 7640 2-in-1 | |
| Ortalama Intel Core Ultra 7 155H, Intel Arc 8-Core iGPU (6042 - 10591, n=34) | |
| Dell Inspiron 16 Plus 7640 | |
| Samsung Galaxy Book4 Pro 360 | |
| PCMark 10 / Digital Content Creation | |
| Dell Inspiron 16 Plus 7640 | |
| Lenovo IdeaPad Pro 5 16IMH G9 | |
| Dell Inspiron 16 7640 2-in-1 | |
| Ortalama Intel Core Ultra 7 155H, Intel Arc 8-Core iGPU (4985 - 10709, n=34) | |
| HP Envy x360 2-in-1 16-ad0097nr | |
| Samsung Galaxy Book4 Pro 360 | |
| Dell Inspiron 16 7635 2-in-1 | |
| CrossMark / Overall | |
| Dell Inspiron 16 7640 2-in-1 | |
| Dell Inspiron 16 Plus 7640 | |
| Ortalama Intel Core Ultra 7 155H, Intel Arc 8-Core iGPU (1366 - 1903, n=34) | |
| HP Envy x360 2-in-1 16-ad0097nr | |
| Samsung Galaxy Book4 Pro 360 | |
| Lenovo IdeaPad Pro 5 16IMH G9 | |
| Dell Inspiron 16 7635 2-in-1 | |
| CrossMark / Productivity | |
| Dell Inspiron 16 7640 2-in-1 | |
| HP Envy x360 2-in-1 16-ad0097nr | |
| Dell Inspiron 16 Plus 7640 | |
| Ortalama Intel Core Ultra 7 155H, Intel Arc 8-Core iGPU (1291 - 1798, n=33) | |
| Samsung Galaxy Book4 Pro 360 | |
| Lenovo IdeaPad Pro 5 16IMH G9 | |
| Dell Inspiron 16 7635 2-in-1 | |
| CrossMark / Creativity | |
| Dell Inspiron 16 Plus 7640 | |
| Dell Inspiron 16 7640 2-in-1 | |
| Lenovo IdeaPad Pro 5 16IMH G9 | |
| Ortalama Intel Core Ultra 7 155H, Intel Arc 8-Core iGPU (1519 - 1929, n=33) | |
| HP Envy x360 2-in-1 16-ad0097nr | |
| Samsung Galaxy Book4 Pro 360 | |
| Dell Inspiron 16 7635 2-in-1 | |
| CrossMark / Responsiveness | |
| Samsung Galaxy Book4 Pro 360 | |
| Ortalama Intel Core Ultra 7 155H, Intel Arc 8-Core iGPU (939 - 1802, n=33) | |
| Dell Inspiron 16 7640 2-in-1 | |
| HP Envy x360 2-in-1 16-ad0097nr | |
| Dell Inspiron 16 Plus 7640 | |
| Lenovo IdeaPad Pro 5 16IMH G9 | |
| Dell Inspiron 16 7635 2-in-1 | |
| WebXPRT 3 / Overall | |
| HP Envy x360 2-in-1 16-ad0097nr | |
| Dell Inspiron 16 Plus 7640 | |
| Lenovo IdeaPad Pro 5 16IMH G9 | |
| Dell Inspiron 16 7640 2-in-1 | |
| Ortalama Intel Core Ultra 7 155H, Intel Arc 8-Core iGPU (252 - 299, n=34) | |
| Dell Inspiron 16 7635 2-in-1 | |
| Samsung Galaxy Book4 Pro 360 | |
| WebXPRT 4 / Overall | |
| Lenovo IdeaPad Pro 5 16IMH G9 | |
| Dell Inspiron 16 7640 2-in-1 | |
| Dell Inspiron 16 Plus 7640 | |
| Ortalama Intel Core Ultra 7 155H, Intel Arc 8-Core iGPU (166.4 - 309, n=29) | |
| HP Envy x360 2-in-1 16-ad0097nr | |
| Samsung Galaxy Book4 Pro 360 | |
| Dell Inspiron 16 7635 2-in-1 | |
| Mozilla Kraken 1.1 / Total | |
| Dell Inspiron 16 7635 2-in-1 | |
| Samsung Galaxy Book4 Pro 360 | |
| Ortalama Intel Core Ultra 7 155H, Intel Arc 8-Core iGPU (517 - 614, n=35) | |
| HP Envy x360 2-in-1 16-ad0097nr | |
| Dell Inspiron 16 7640 2-in-1 | |
| Dell Inspiron 16 Plus 7640 | |
| Lenovo IdeaPad Pro 5 16IMH G9 | |
* ... daha küçük daha iyidir
| PCMark 10 Score | 7037 puan | |
Yardım | ||
| AIDA64 / Memory Copy | |
| Lenovo IdeaPad Pro 5 16IMH G9 | |
| Samsung Galaxy Book4 Pro 360 | |
| Ortalama Intel Core Ultra 7 155H (62397 - 96791, n=50) | |
| Dell Inspiron 16 7640 2-in-1 | |
| HP Envy x360 2-in-1 16-ad0097nr | |
| Dell Inspiron 16 Plus 7640 | |
| Dell Inspiron 16 7635 2-in-1 | |
| AIDA64 / Memory Read | |
| Lenovo IdeaPad Pro 5 16IMH G9 | |
| Ortalama Intel Core Ultra 7 155H (60544 - 90647, n=50) | |
| Dell Inspiron 16 Plus 7640 | |
| Samsung Galaxy Book4 Pro 360 | |
| Dell Inspiron 16 7640 2-in-1 | |
| HP Envy x360 2-in-1 16-ad0097nr | |
| Dell Inspiron 16 7635 2-in-1 | |
| AIDA64 / Memory Write | |
| HP Envy x360 2-in-1 16-ad0097nr | |
| Dell Inspiron 16 7640 2-in-1 | |
| Lenovo IdeaPad Pro 5 16IMH G9 | |
| Ortalama Intel Core Ultra 7 155H (58692 - 93451, n=50) | |
| Samsung Galaxy Book4 Pro 360 | |
| Dell Inspiron 16 Plus 7640 | |
| Dell Inspiron 16 7635 2-in-1 | |
| AIDA64 / Memory Latency | |
| Dell Inspiron 16 7640 2-in-1 | |
| Ortalama Intel Core Ultra 7 155H (116.2 - 233, n=50) | |
| Lenovo IdeaPad Pro 5 16IMH G9 | |
| Samsung Galaxy Book4 Pro 360 | |
| HP Envy x360 2-in-1 16-ad0097nr | |
| Dell Inspiron 16 Plus 7640 | |
| Dell Inspiron 16 7635 2-in-1 | |
* ... daha küçük daha iyidir
DPC Gecikme Süresi
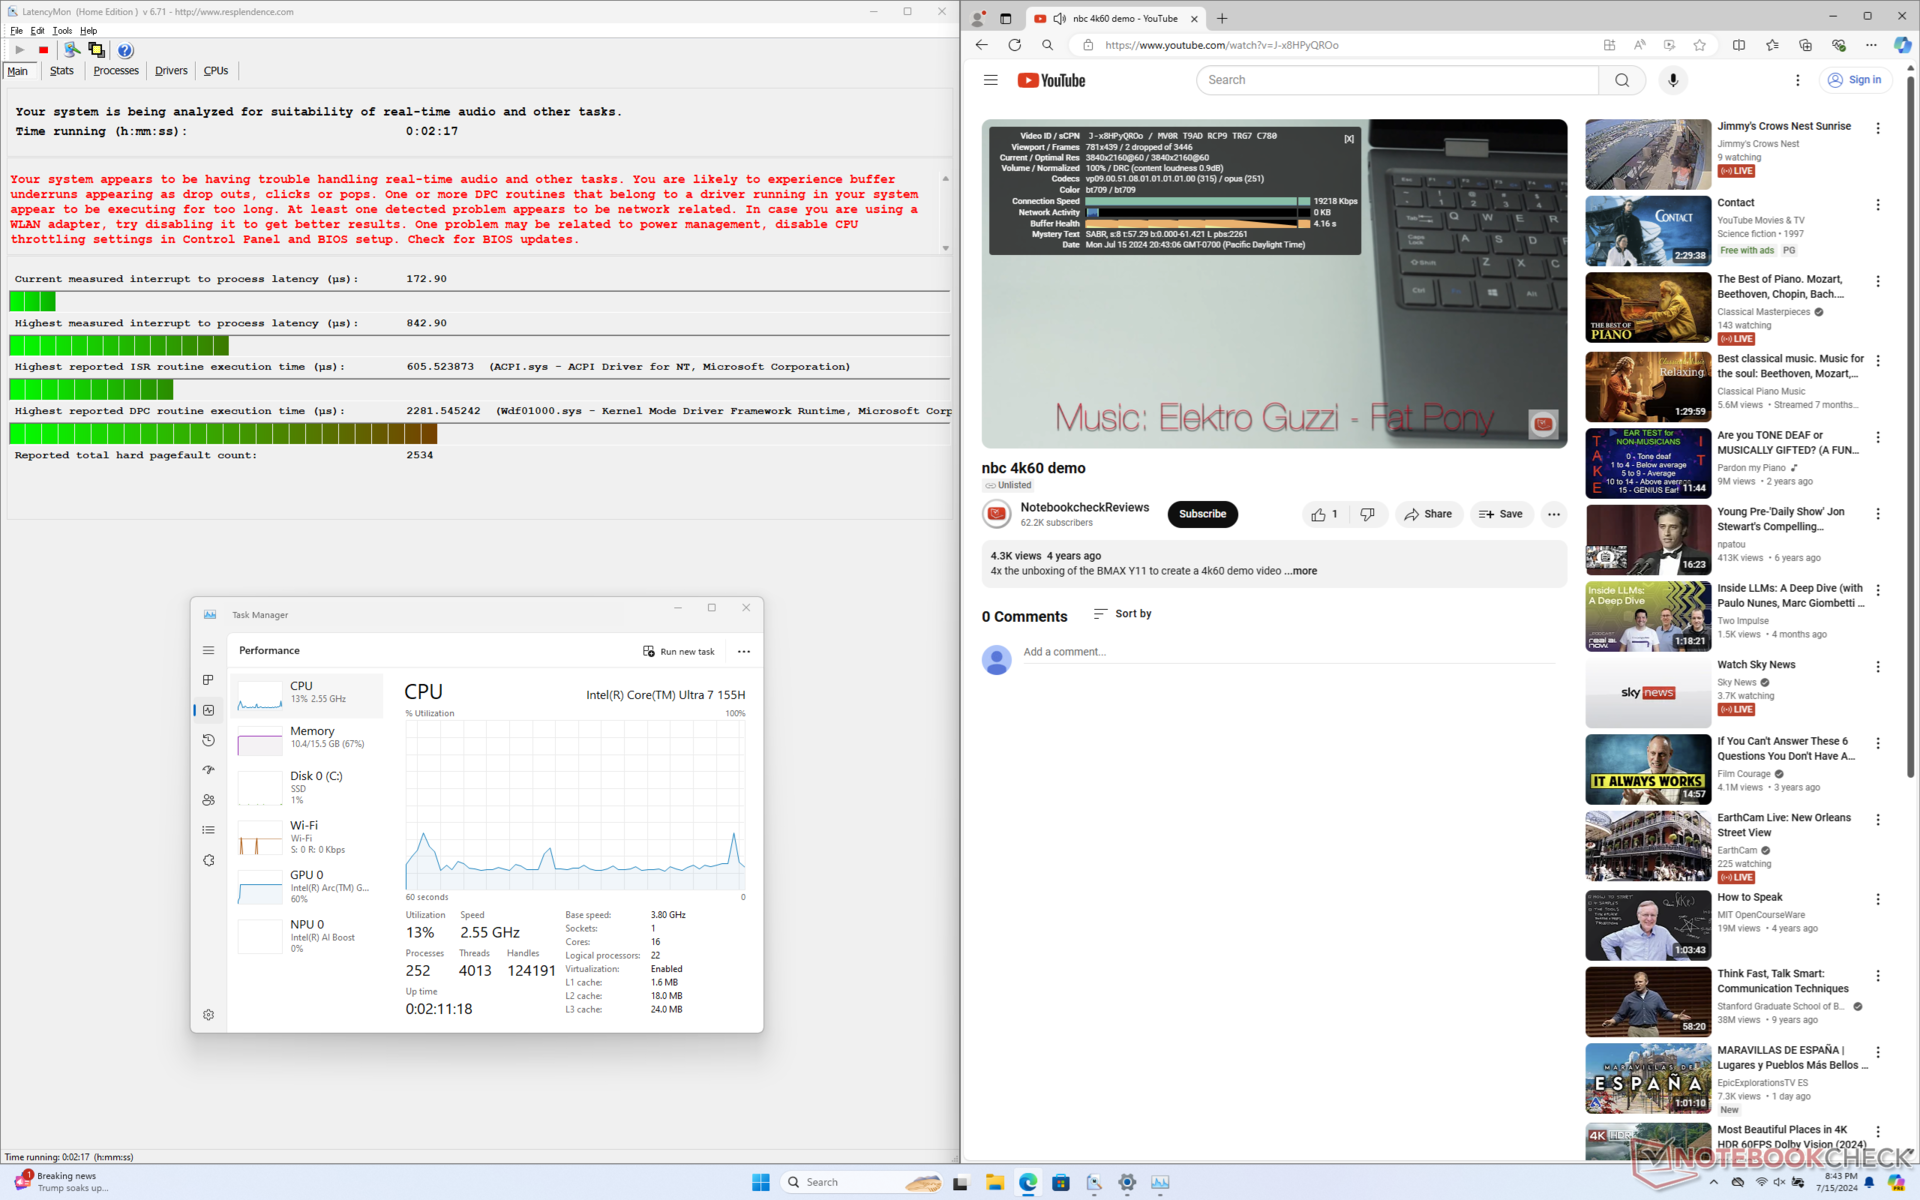
LatencyMon, ana sayfamızın birden fazla tarayıcı sekmesini açarken küçük DPC sorunları ortaya çıkarıyor. Ayrıca bir dakika süren 4K60 video testi sırasında idealde 0 olması gerekirken 2 kare düşmesi kaydedebildik. Neyse ki bu tutarsızlıklar gerçek kullanım sırasında fark edilmeyecek kadar küçük.
| DPC Latencies / LatencyMon - interrupt to process latency (max), Web, Youtube, Prime95 | |
| Samsung Galaxy Book4 Pro 360 | |
| HP Envy x360 2-in-1 16-ad0097nr | |
| Dell Inspiron 16 7640 2-in-1 | |
| Lenovo IdeaPad Pro 5 16IMH G9 | |
| Dell Inspiron 16 Plus 7640 | |
| Dell Inspiron 16 7635 2-in-1 | |
* ... daha küçük daha iyidir
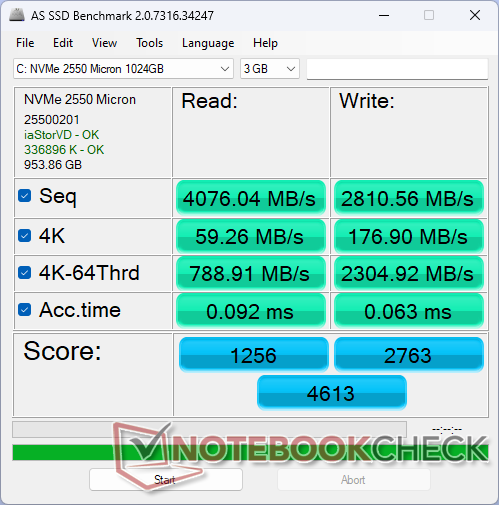
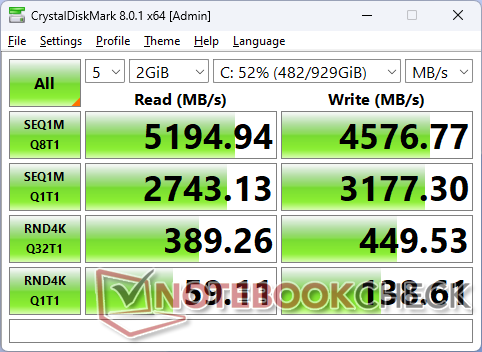
Depolama Cihazları
Dell, Inspiron serisi için SSD'lerini Kioxia, SK Hynix ve Micron dahil olmak üzere birden fazla tedarikçiden almaktadır. Bizim özel test ünitemiz şu ürünlerle birlikte gelmektedir Micron 2550 bu, 5200 MB/s'ye kadar okuma hızlarına ulaşabilen orta sınıf bir PCIe4 NVMe SSD'dir. Buna kıyasla Samsung PM9A1 gibi daha pahalı sürücüler 7000 MB/s'nin üzerine çıkabilmektedir ancak Micron 2550, Inspiron 16 2'si 1 arada gibi orta seviye bir model için yeterli ve uygundur.
Aktarım hızları, geçen yılki Inspiron 16 7635 2'si 1 arada aygıtta bulunan Kioxia BG5'in, zorlandığında herhangi bir kısılma hesaba katıldıktan sonra bile büyük farklarla önündedir.

* ... daha küçük daha iyidir
Disk Throttling: DiskSpd Read Loop, Queue Depth 8
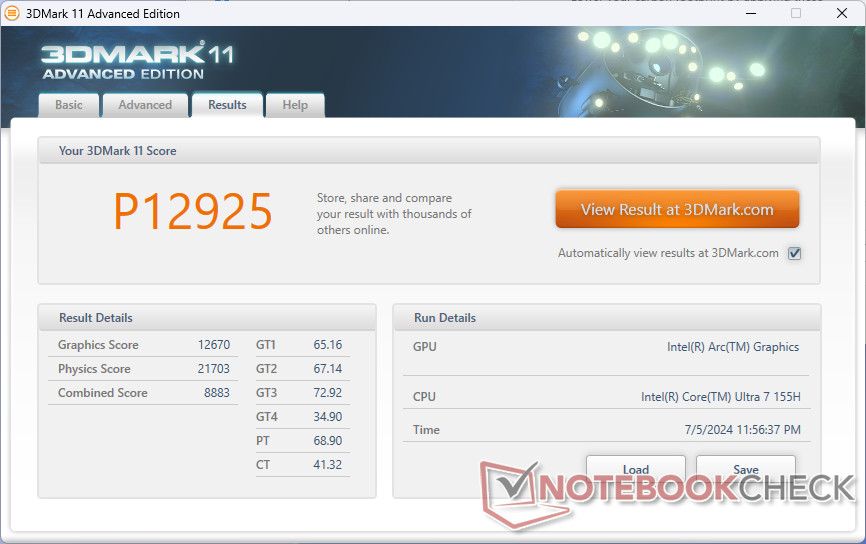
GPU Performansı
Grafik performansı oldukça iyi ve ayrı seçeneklere başvurmadan dönüştürülebilir bir cihaz için en hızlı performanslardan biri. Ekran Ark 8 GPU ile karşılaştırılabilir Radeon 780M ve yaşlıların çok önünde Iris Xe 96 EUs veya Radeon RX Vega çözümlerine birçok durumda 2 kattan fazla fark atıyor. Örneğin geçen yılki Inspiron 16 7635 2'si 1 arada bilgisayardaki Radeon RX Vega 7 neredeyse yüzde 60 geride.
Oyun seviyesinde performans ve CUDA hızlandırma isteyen kullanıcılar Spectre x360 16'yı GeForce RTX 4050 bu da Arc 8'e göre 2 kat daha fazla grafik artışı demek. Elbette Spectre bizim Dell'imizden de önemli ölçüde daha pahalı.
Arc 8 GPU'nun yalnızca Core Ultra 7 155H yapılandırmasıyla kullanılabildiğini unutmayın. Bunun yerine Core Ultra 5 125U'yu tercih etmek Ark 4 bu da grafik performansında yüzde 40 ila 45 oranında önemli bir düşüşe neden olur.
| Güç Profili | Fire Strike Grafik Puanı | Fire Strike Fizik Puanı | Birleşik Puan |
| Performans Modu | 8567 | 25687 | 2982 |
| Dengeli Mod | 8640 (-0%) | 26567 (-0%) | 2781 (-7%) |
| Akü Gücü | 7734 (-10%) | 25155 (-2%) | 2886 (-3%) |
Dengeli modda çalıştırmak, yukarıdaki tabloda yer alan Fire Strike sonuçlarımıza göre performansı en fazla minimum düzeyde etkileyecektir. Farklı güç modları arasında iyi bir tutarlılık için pil gücüyle çalışırken performans açığı sadece yüzde 10 ile beklenenden daha düşüktür.
| 3DMark Performance Rating - Percent | |
| Dell Inspiron 16 Plus 7640 -1! | |
| HP Spectre x360 16 RTX 4050 -1! | |
| Dell Inspiron 16 7640 2-in-1 | |
| Lenovo ThinkPad T16 G2 21K70035GE | |
| Ortalama Intel Arc 8-Core iGPU | |
| HP Envy x360 2-in-1 16-ad0097nr | |
| Acer Swift X SFX16-52G-52VE | |
| Acer Swift Edge SFE16-42-R1GM | |
| Asus ExpertBook B5 Flip B5602FBN | |
| Samsung Galaxy Book4 Pro 360 -1! | |
| LG Gram 2in1 16 16T90R - G.AA78G | |
| Lenovo Yoga 7 2-in-1 16IML9 | |
| HP Spectre x360 2-in-1 16-f1075ng | |
| Samsung Galaxy Book3 Pro 16 | |
| Lenovo ThinkPad E16 G1 Core i5-1335U | |
| Lenovo Thinkpad X1 Fold 16 | |
| Lenovo IdeaPad Flex 5 16ABR G8 -1! | |
| Dell Inspiron 16 7635 2-in-1 -1! | |
| 3DMark 11 - 1280x720 Performance GPU | |
| Dell Inspiron 16 Plus 7640 | |
| HP Spectre x360 16 RTX 4050 | |
| Dell Inspiron 16 7640 2-in-1 | |
| Lenovo ThinkPad T16 G2 21K70035GE | |
| HP Envy x360 2-in-1 16-ad0097nr | |
| Ortalama Intel Arc 8-Core iGPU (8064 - 13716, n=38) | |
| Acer Swift X SFX16-52G-52VE | |
| Samsung Galaxy Book4 Pro 360 | |
| Asus ExpertBook B5 Flip B5602FBN | |
| Acer Swift Edge SFE16-42-R1GM | |
| LG Gram 2in1 16 16T90R - G.AA78G | |
| Lenovo Yoga 7 2-in-1 16IML9 | |
| HP Spectre x360 2-in-1 16-f1075ng | |
| Lenovo IdeaPad Flex 5 16ABR G8 | |
| Dell Inspiron 16 7635 2-in-1 | |
| Samsung Galaxy Book3 Pro 16 | |
| Lenovo ThinkPad E16 G1 Core i5-1335U | |
| Lenovo Thinkpad X1 Fold 16 | |
| 3DMark 11 Performance | 12925 puan | |
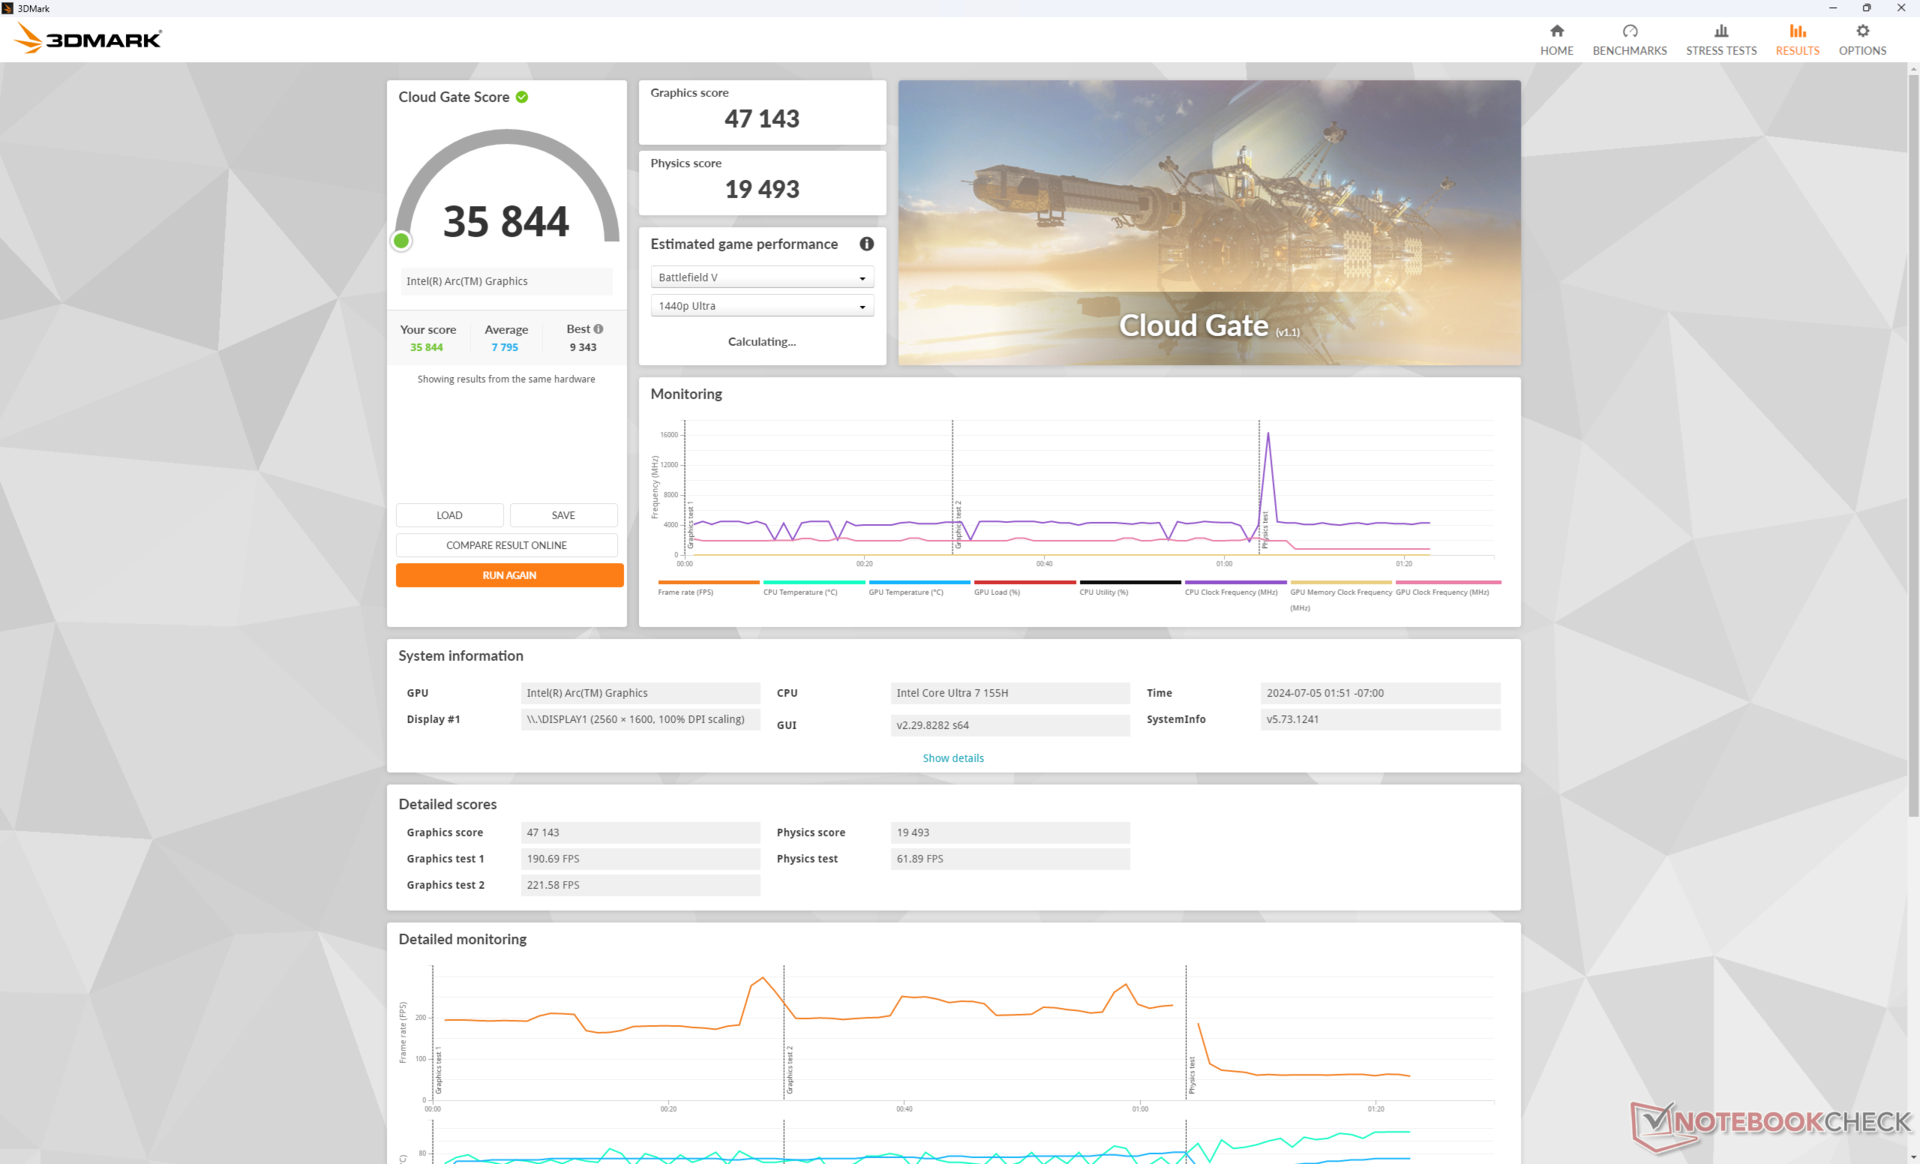
| 3DMark Cloud Gate Standard Score | 35844 puan | |
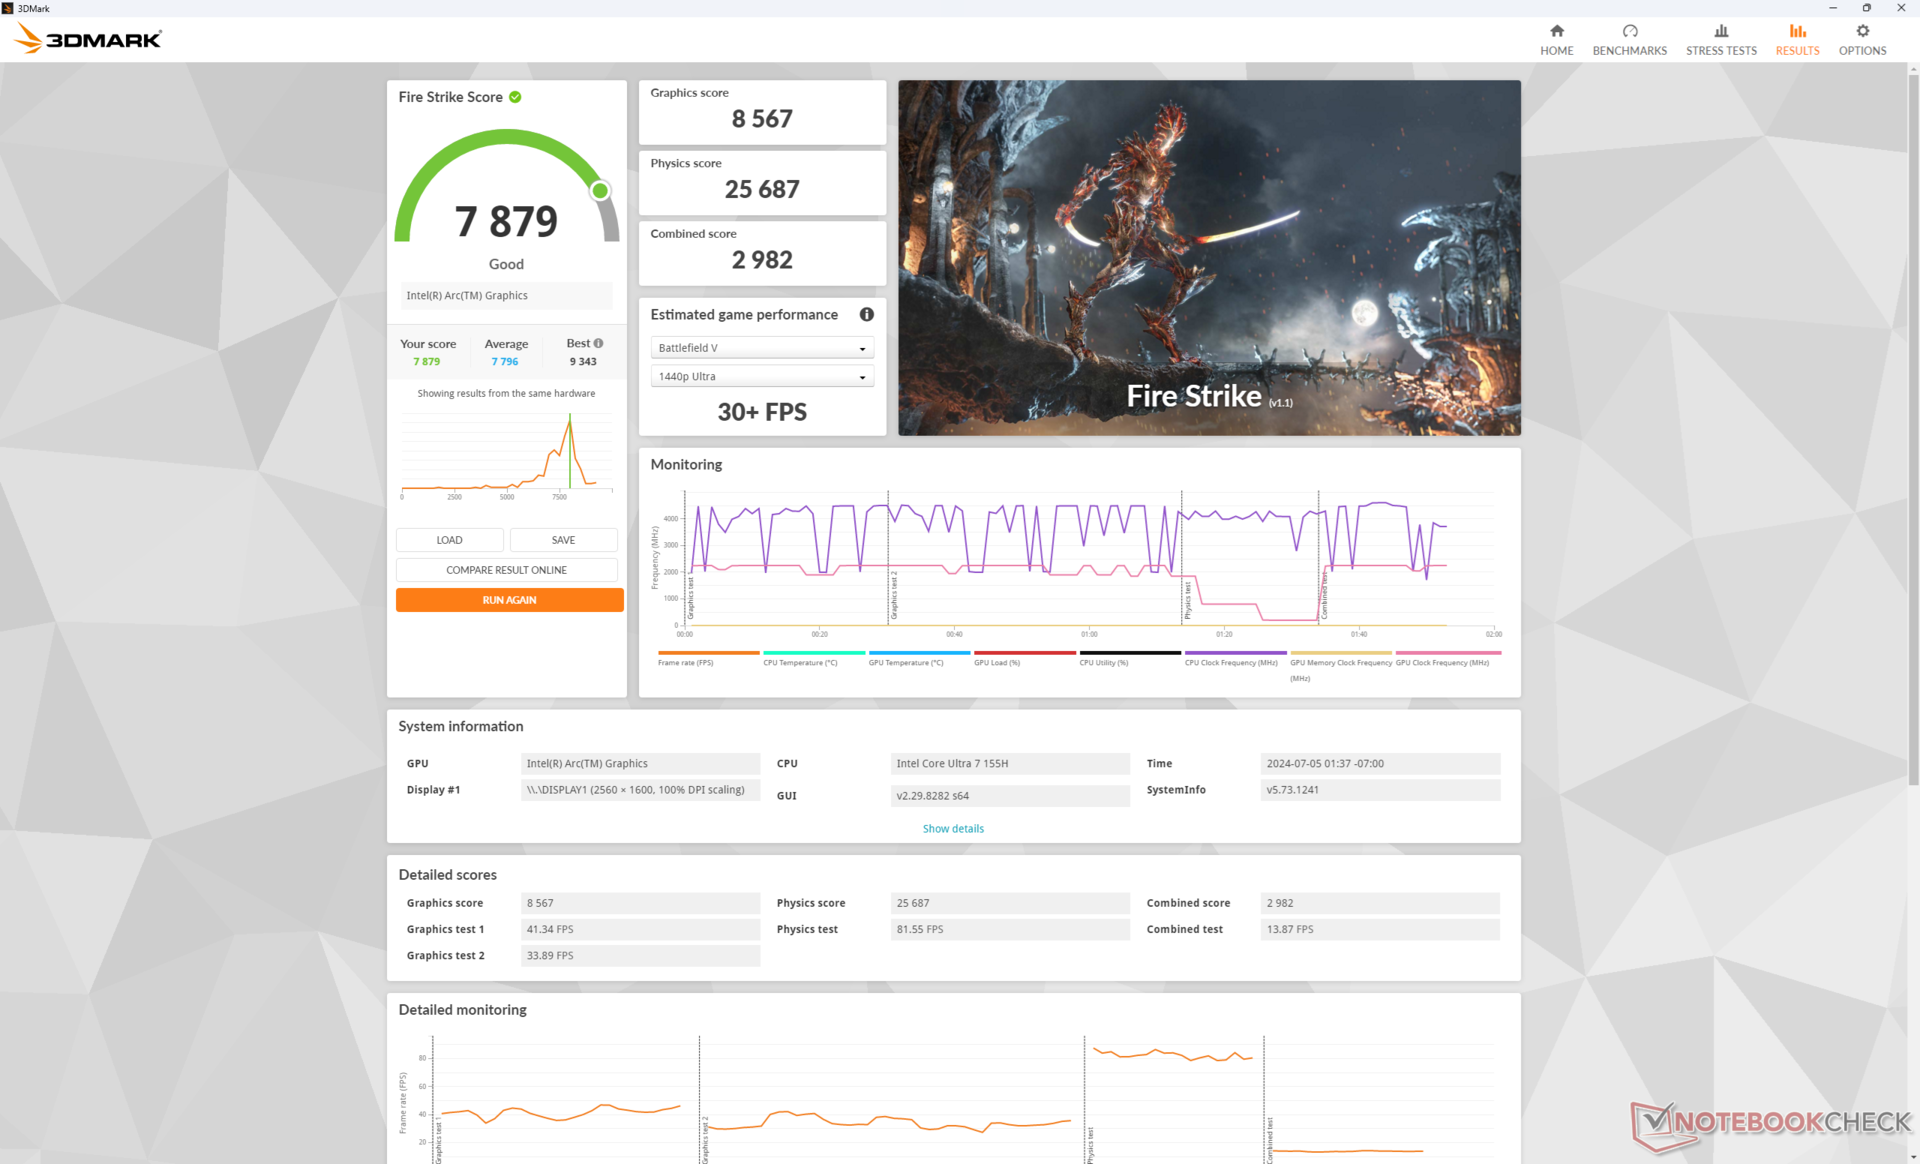
| 3DMark Fire Strike Score | 7879 puan | |
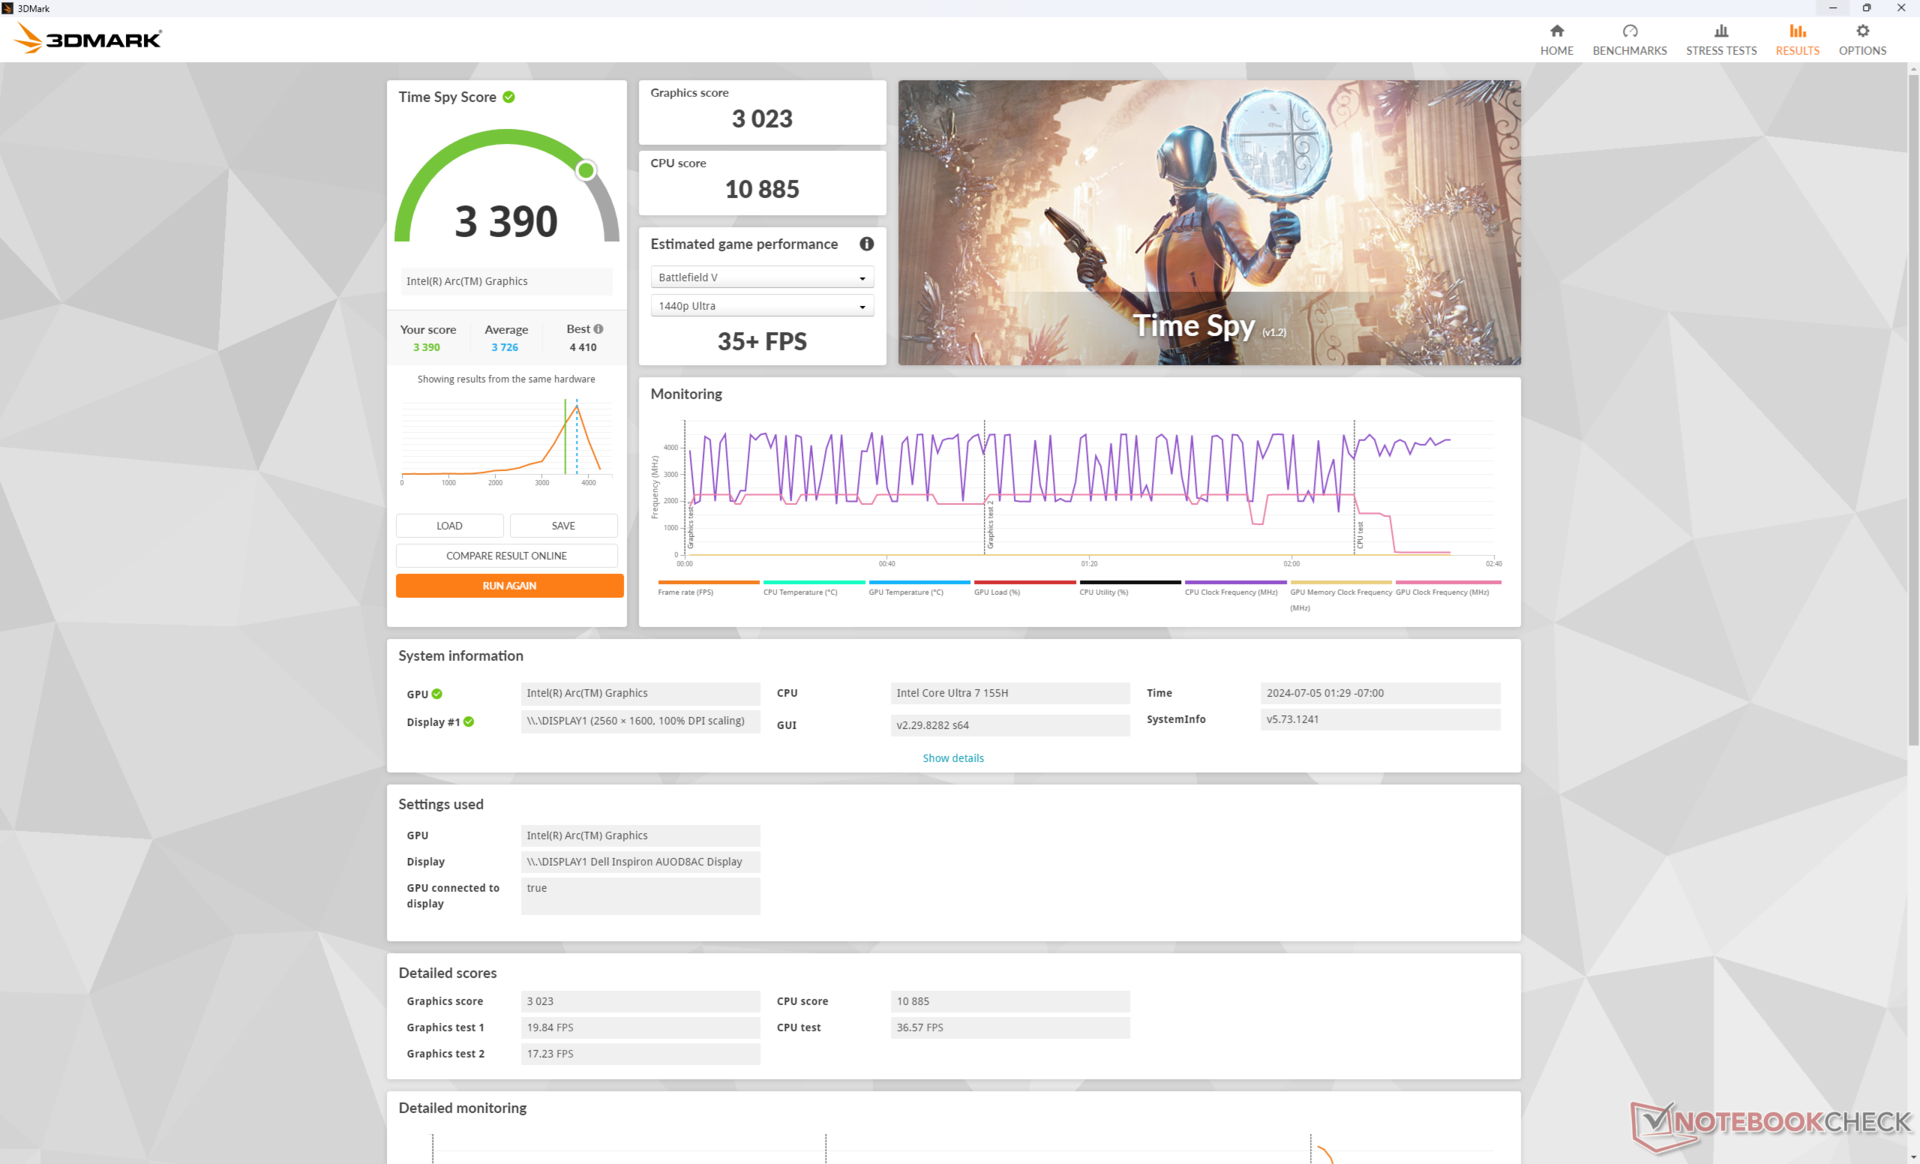
| 3DMark Time Spy Score | 3390 puan | |
Yardım | ||
| Blender | |
| v3.3 Classroom HIP/AMD | |
| Dell Inspiron 16 7635 2-in-1 | |
| Lenovo IdeaPad Flex 5 16ABR G8 | |
| Acer Swift Edge SFE16-42-R1GM | |
| v3.3 Classroom OPTIX/RTX | |
| HP Spectre x360 16 RTX 4050 | |
| Dell Inspiron 16 Plus 7640 | |
| v3.3 Classroom CUDA | |
| HP Spectre x360 16 RTX 4050 | |
| Dell Inspiron 16 Plus 7640 | |
| v3.3 Classroom CPU | |
| Lenovo Thinkpad X1 Fold 16 | |
| Samsung Galaxy Book4 Pro 360 | |
| Lenovo ThinkPad E16 G1 Core i5-1335U | |
| Dell Inspiron 16 7635 2-in-1 | |
| LG Gram 2in1 16 16T90R - G.AA78G | |
| Samsung Galaxy Book3 Pro 16 | |
| Acer Swift X SFX16-52G-52VE | |
| Acer Swift Edge SFE16-42-R1GM | |
| Asus ExpertBook B5 Flip B5602FBN | |
| Lenovo IdeaPad Flex 5 16ABR G8 | |
| HP Spectre x360 2-in-1 16-f1075ng | |
| Ortalama Intel Arc 8-Core iGPU (294 - 692, n=41) | |
| Lenovo ThinkPad T16 G2 21K70035GE | |
| HP Envy x360 2-in-1 16-ad0097nr | |
| HP Spectre x360 16 RTX 4050 | |
| Dell Inspiron 16 7640 2-in-1 | |
| Dell Inspiron 16 Plus 7640 | |
| v3.3 Classroom oneAPI/Intel | |
| Ortalama Intel Arc 8-Core iGPU (208 - 309, n=16) | |
| Dell Inspiron 16 7640 2-in-1 | |
* ... daha küçük daha iyidir
| The Witcher 3 - 1920x1080 Ultra Graphics & Postprocessing (HBAO+) | |
| Dell Inspiron 16 Plus 7640 | |
| HP Envy x360 2-in-1 16-ad0097nr | |
| Lenovo IdeaPad Pro 5 16IMH G9 | |
| Dell Inspiron 16 7640 2-in-1 | |
| Samsung Galaxy Book4 Pro 360 | |
| Dell Inspiron 16 7635 2-in-1 | |
| Final Fantasy XV Benchmark - 1920x1080 High Quality | |
| Dell Inspiron 16 Plus 7640 | |
| Lenovo IdeaPad Pro 5 16IMH G9 | |
| Dell Inspiron 16 7640 2-in-1 | |
| HP Envy x360 2-in-1 16-ad0097nr | |
| Samsung Galaxy Book4 Pro 360 | |
| Dell Inspiron 16 7635 2-in-1 | |
| Strange Brigade - 1920x1080 ultra AA:ultra AF:16 | |
| Dell Inspiron 16 Plus 7640 | |
| Lenovo IdeaPad Pro 5 16IMH G9 | |
| Dell Inspiron 16 7640 2-in-1 | |
| HP Envy x360 2-in-1 16-ad0097nr | |
| Samsung Galaxy Book4 Pro 360 | |
| Dell Inspiron 16 7635 2-in-1 | |
| Dota 2 Reborn - 1920x1080 ultra (3/3) best looking | |
| Dell Inspiron 16 Plus 7640 | |
| Lenovo IdeaPad Pro 5 16IMH G9 | |
| Dell Inspiron 16 7640 2-in-1 | |
| HP Envy x360 2-in-1 16-ad0097nr | |
| Samsung Galaxy Book4 Pro 360 | |
| Dell Inspiron 16 7635 2-in-1 | |
| X-Plane 11.11 - 1920x1080 high (fps_test=3) | |
| Dell Inspiron 16 Plus 7640 | |
| Dell Inspiron 16 7640 2-in-1 | |
| Lenovo IdeaPad Pro 5 16IMH G9 | |
| Samsung Galaxy Book4 Pro 360 | |
| HP Envy x360 2-in-1 16-ad0097nr | |
| Dell Inspiron 16 7635 2-in-1 | |
| Far Cry 5 - 1920x1080 Ultra Preset AA:T | |
| Dell Inspiron 16 Plus 7640 | |
| Lenovo IdeaPad Pro 5 16IMH G9 | |
| Dell Inspiron 16 7640 2-in-1 | |
| HP Envy x360 2-in-1 16-ad0097nr | |
Cyberpunk 2077 ultra FPS Chart
| düşük | orta | yüksek | ultra | |
|---|---|---|---|---|
| The Witcher 3 (2015) | 141.5 | 81.2 | 44.5 | 23.9 |
| Dota 2 Reborn (2015) | 101.5 | 93.3 | 77.8 | 78 |
| Final Fantasy XV Benchmark (2018) | 65 | 36.5 | 26.8 | |
| X-Plane 11.11 (2018) | 50.8 | 40.8 | 40.1 | |
| Far Cry 5 (2018) | 68 | 38 | 36 | 34 |
| Strange Brigade (2018) | 145.6 | 71.8 | 55.4 | 45.4 |
| Tiny Tina's Wonderlands (2022) | 49.2 | 37.3 | 26.4 | 21.2 |
| F1 22 (2022) | 68.8 | 65.6 | ||
| Baldur's Gate 3 (2023) | 30.8 | 27.4 | 23.7 | 22 |
| Cyberpunk 2077 2.2 Phantom Liberty (2023) | 31 | 26.3 | 21.9 |
Emisyonlar
System Noise - Loud And Proud
Daha zorlu işlemcimize rağmen 2023 modeline göre soğutma çözümünde büyük bir değişiklik olmadığından, dahili fanın eskisi kadar yüksek veya daha yüksek sesle çalışması gerekecektir ve testlerimizde tam olarak bunu kaydettik. Inspiron 16 7640 2'si 1 arada bilgisayardaki fan, daha ağır yükler geldiğinde sessizden yüksek sese doğru daha kolay hızlanıyor. Örneğin, 3DMark 06 'nın ilk benchmark sahnesinin yarısından daha kısa bir süre içinde 45 dB(A)'lık bir fan gürültüsü kaydedebildik Inspiron 16 7635 2'si 1 arada 40 dB(A) ile zirveye ulaşır. Oyun çalıştırmak da 45 dB(A) fan gürültüsüne neden olur ve bu da Dell'imizi piyasadaki en yüksek sesli 16 inçlik dönüştürülebilir cihazlardan biri yapar.

Ses yüksekliği
| Boşta |
| 22.9 / 22.9 / 25 dB |
| Çalışırken |
| 45.1 / 44.9 dB |
 | ||
30 dB sessiz 40 dB(A) duyulabilirlik 50 dB(A) gürültülü |
||
min: | ||
| Dell Inspiron 16 7640 2-in-1 Arc 8-Core, Ultra 7 155H, Micron 2550 1TB | Dell Inspiron 16 Plus 7640 NVIDIA GeForce RTX 4060 Laptop GPU, Ultra 7 155H, SK hynix BC901 HFS001TEJ4X164N | Dell Inspiron 16 7635 2-in-1 Vega 7, R5 7530U, Kioxia BG5 KBG50ZNS512G | HP Envy x360 2-in-1 16-ad0097nr Radeon 780M, R7 8840HS, KIOXIA BG5 KBG50ZNV1T02 | Lenovo IdeaPad Pro 5 16IMH G9 Arc 8-Core, Ultra 7 155H, Samsung PM9C1a MZAL81T0HDLB | Samsung Galaxy Book4 Pro 360 Arc 7-Core, Ultra 5 125H, Samsung PM9B1 512GB MZVL4512HBLU | |
|---|---|---|---|---|---|---|
| Noise | 2% | 2% | 10% | -4% | 2% | |
| kapalı / ortam * | 22.9 | 23.8 -4% | 23.6 -3% | 22.9 -0% | 24.1 -5% | 24.1 -5% |
| Idle Minimum * | 22.9 | 24.2 -6% | 23.6 -3% | 23 -0% | 24.1 -5% | 24.1 -5% |
| Idle Average * | 22.9 | 24.2 -6% | 23.6 -3% | 23 -0% | 24.1 -5% | 24.1 -5% |
| Idle Maximum * | 25 | 24.2 3% | 23.6 6% | 23 8% | 28.2 -13% | 26.4 -6% |
| Load Average * | 45.1 | 28.9 36% | 40.3 11% | 23.8 47% | 44.4 2% | 35.2 22% |
| Cyberpunk 2077 ultra * | 44.9 | |||||
| Load Maximum * | 44.9 | 51 -14% | 44.2 2% | 43.8 2% | 44.4 1% | 39.2 13% |
| Witcher 3 ultra * | 51 | 44.2 | 43.8 | 36.5 | 38.5 |
* ... daha küçük daha iyidir
Sıcaklık
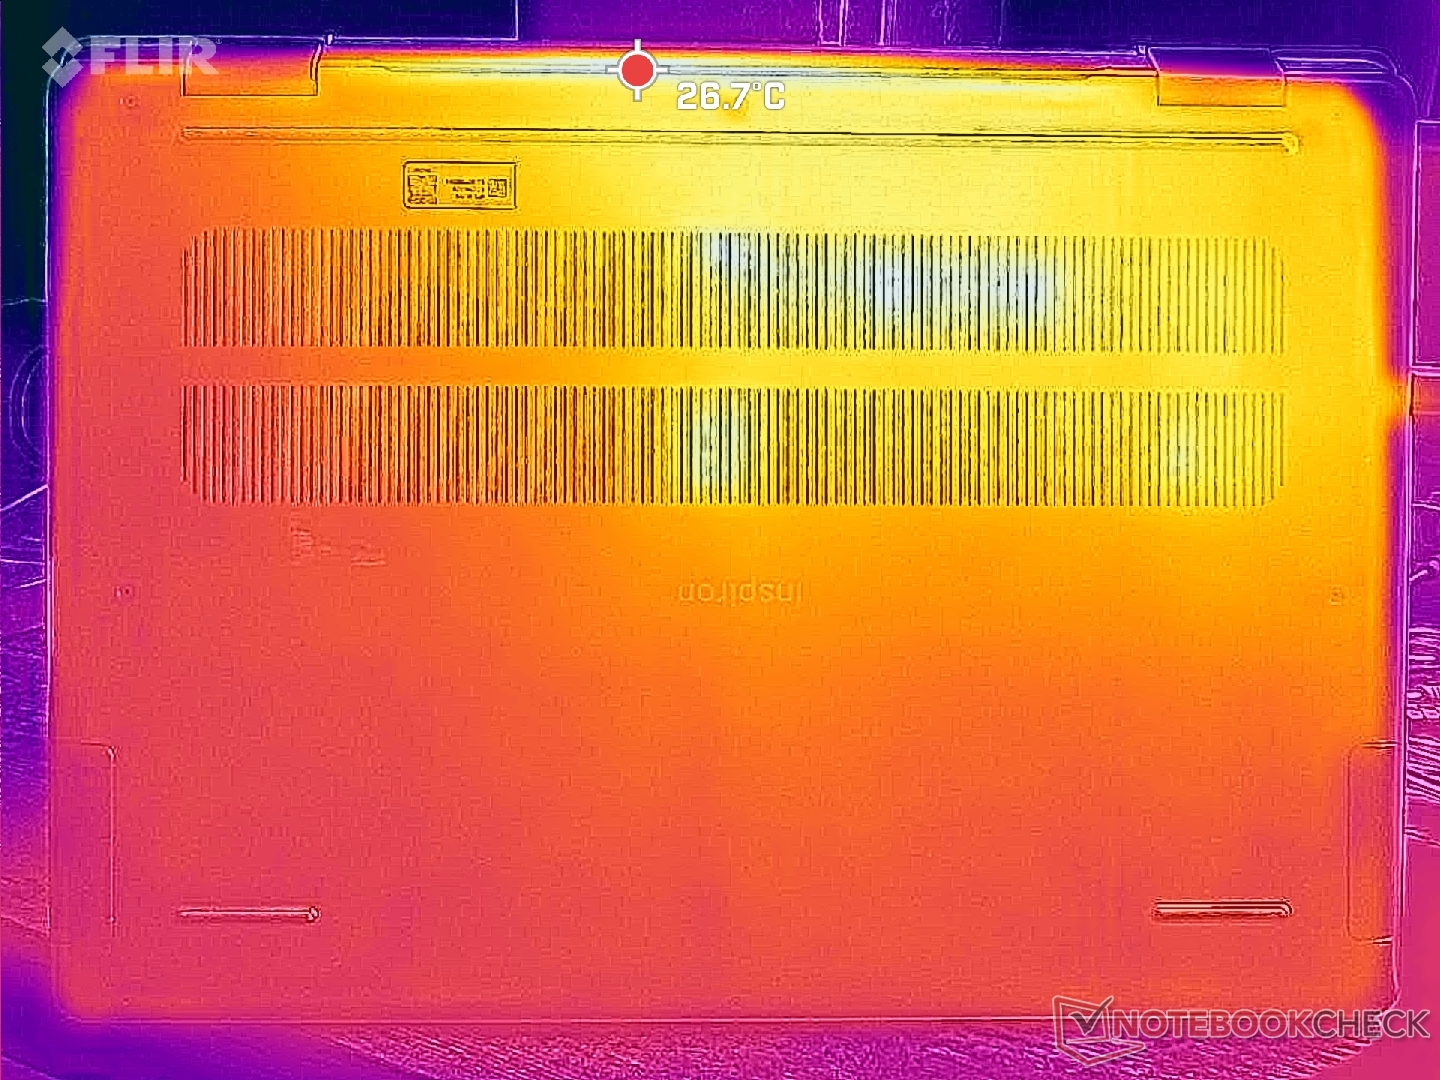
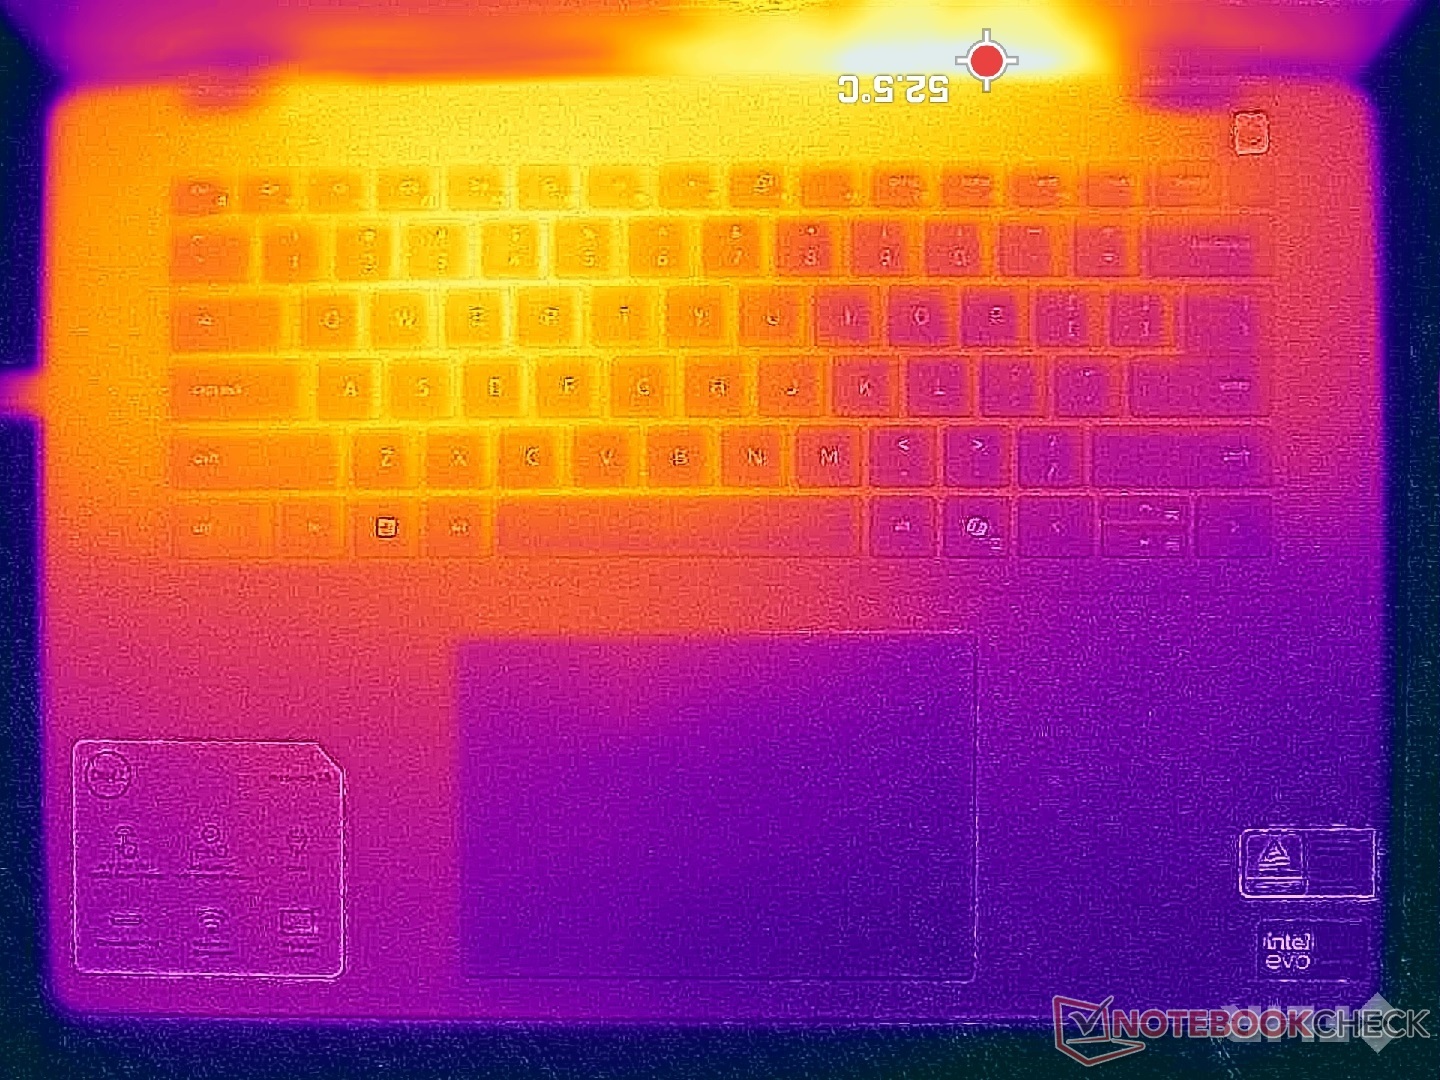
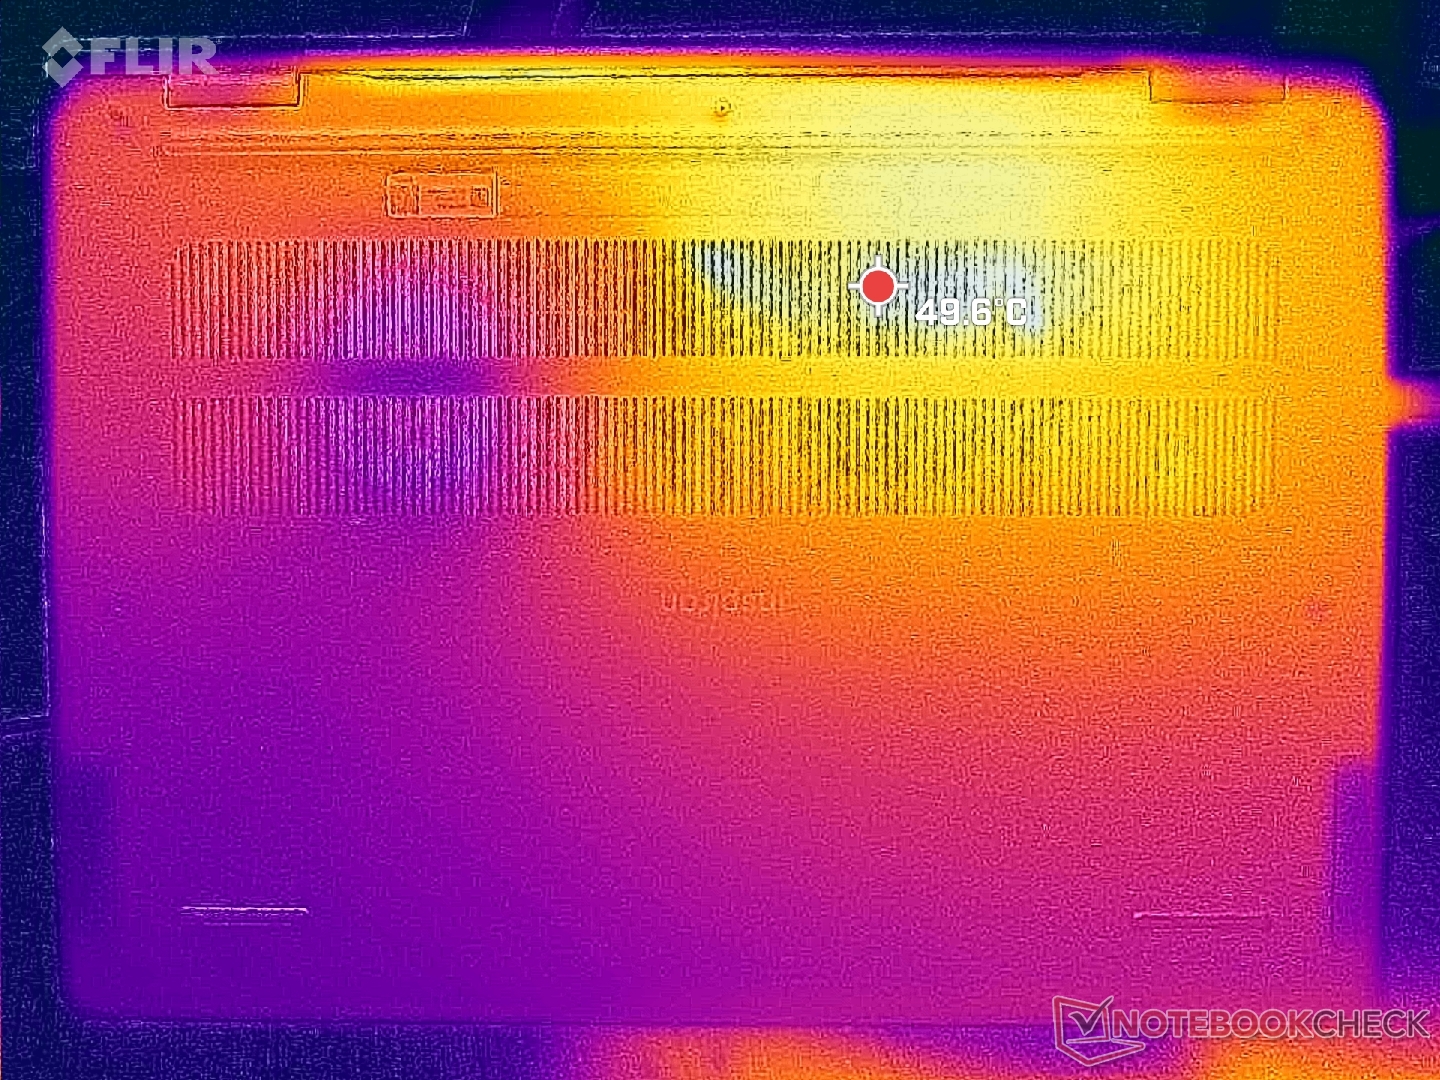
Yüzey sıcaklıkları, asimetrik soğutma çözümü nedeniyle kasanın sol yarısında sağa göre yine daha yüksektir. Ancak bu kez, daha güçlü Core H serisi CPU nedeniyle ortalama sıcaklıklar öncekinden çok daha yüksek olabilir. Örneğin ünitemizdeki sıcak noktalar, geçen yılki modelde sadece 39 C ila 42 C'ye kıyasla hem C hem de D kapaklarında 47 C'ye ulaşabilir. Bu noktalar neyse ki parmakların dokunma olasılığının daha düşük olduğu ünitenin arkasına doğru.
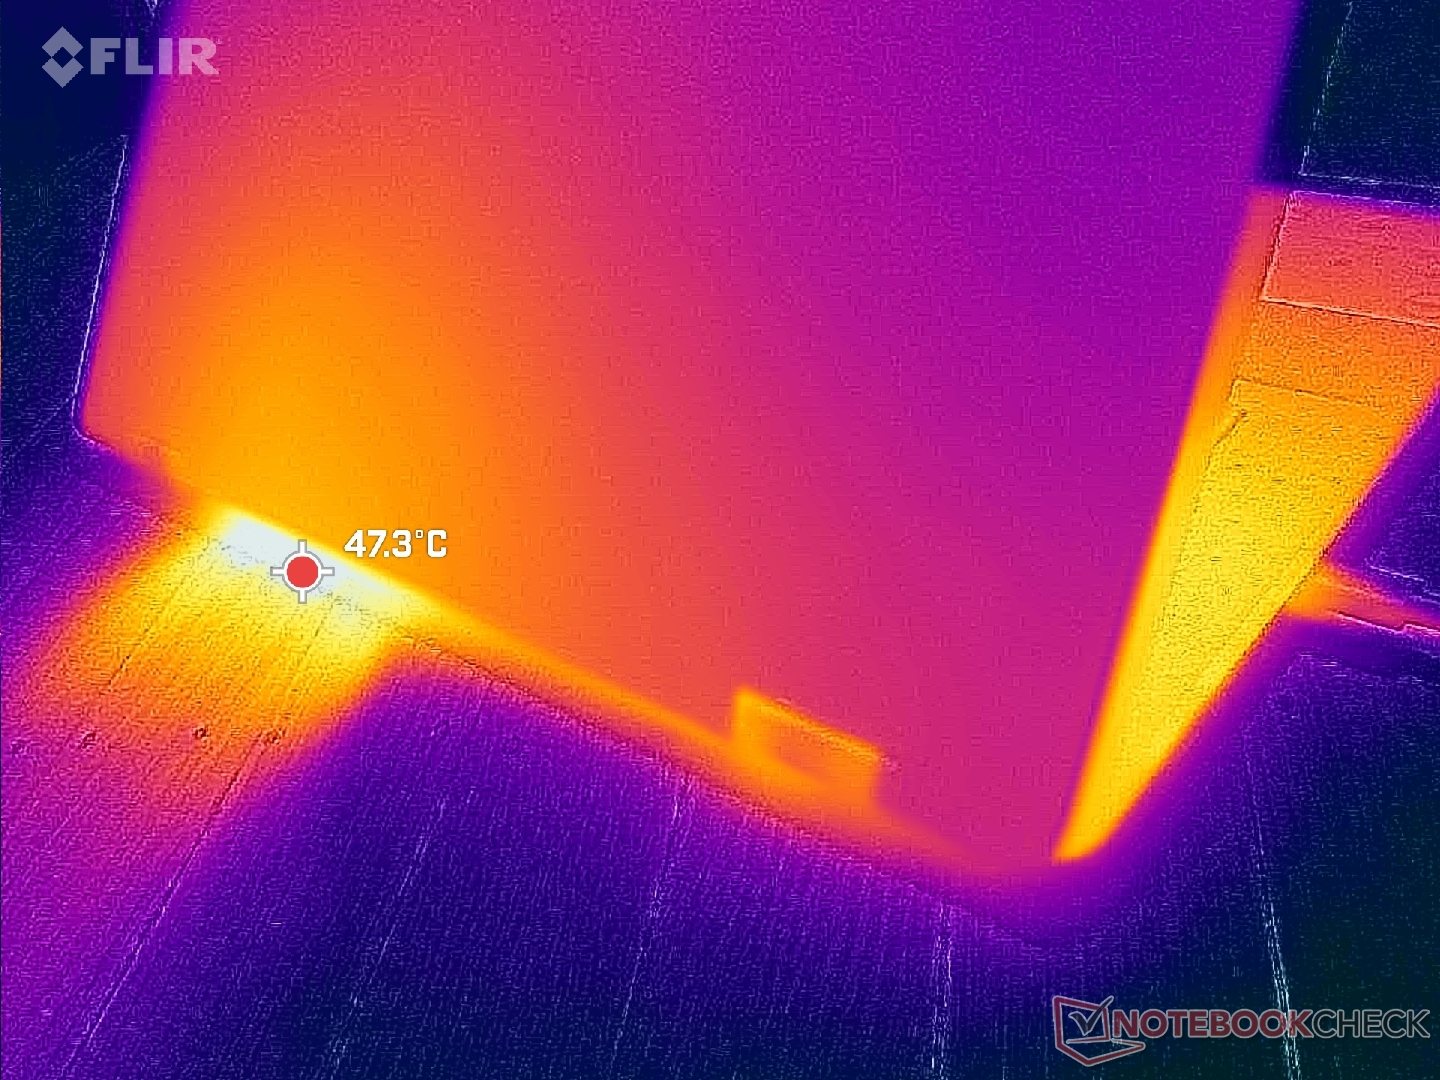
(-) Üst taraftaki maksimum sıcaklık, 35.3 °C / 96 F ortalamasına kıyasla 46.8 °C / 116 F'dir. , Convertible sınıfı için 19.6 ile 60 °C arasında değişir.
(-) Alt kısım, 36.8 °C / 98 F ortalamasına kıyasla maksimum 45.6 °C / 114 F'ye kadar ısınır
(+) Boşta kullanımda, üst tarafın ortalama sıcaklığı 29.9 °C / 86 F olup, cihazın 30.3 °C / 87 F.
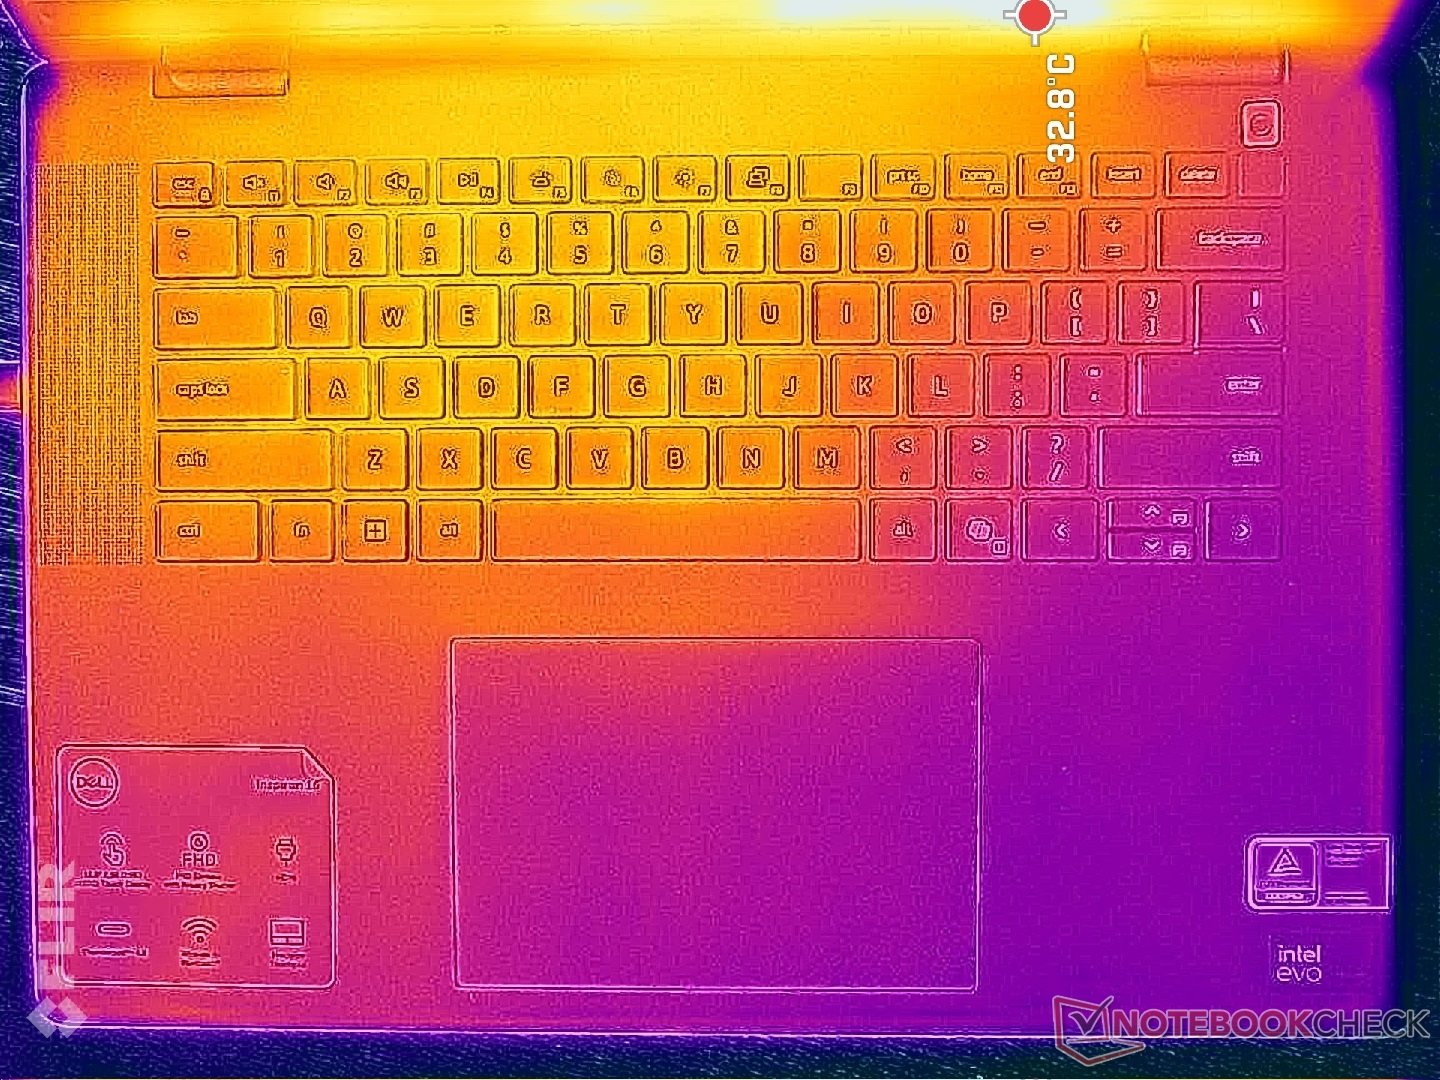
(+) Avuç içi dayanakları ve dokunmatik yüzey maksimum (33.8 °C / 92.8 F) cilt sıcaklığına ulaşıyor ve bu nedenle sıcak değil.
(-) Benzer cihazların avuç içi dayanağı alanının ortalama sıcaklığı 28 °C / 82.4 F (-5.8 °C / -10.4 F) idi.
| Dell Inspiron 16 7640 2-in-1 Intel Core Ultra 7 155H, Intel Arc 8-Core iGPU | Dell Inspiron 16 Plus 7640 Intel Core Ultra 7 155H, NVIDIA GeForce RTX 4060 Laptop GPU | Dell Inspiron 16 7635 2-in-1 AMD Ryzen 5 7530U, AMD Radeon RX Vega 7 | HP Envy x360 2-in-1 16-ad0097nr AMD Ryzen 7 8840HS, AMD Radeon 780M | Lenovo IdeaPad Pro 5 16IMH G9 Intel Core Ultra 7 155H, Intel Arc 8-Core iGPU | Samsung Galaxy Book4 Pro 360 Intel Core Ultra 5 125H, Intel Arc 7-Core iGPU | |
|---|---|---|---|---|---|---|
| Heat | 3% | 11% | 8% | 19% | 18% | |
| Maximum Upper Side * | 46.8 | 43.4 7% | 41.6 11% | 42.6 9% | 36.3 22% | 38.6 18% |
| Maximum Bottom * | 45.6 | 41.6 9% | 39 14% | 47.8 -5% | 39.1 14% | 39.2 14% |
| Idle Upper Side * | 32.2 | 32.8 -2% | 29.4 9% | 27.4 15% | 24.9 23% | 25.2 22% |
| Idle Bottom * | 31.4 | 32.4 -3% | 28.6 9% | 27.8 11% | 26.1 17% | 25.7 18% |
* ... daha küçük daha iyidir
Konuşmacılar
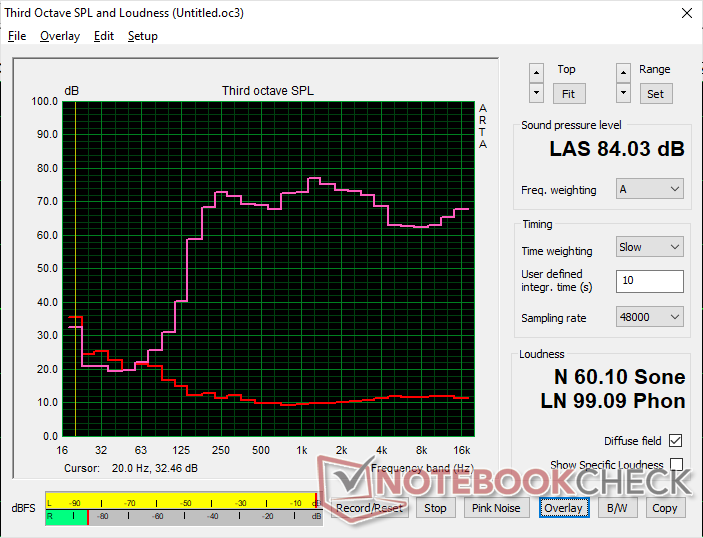
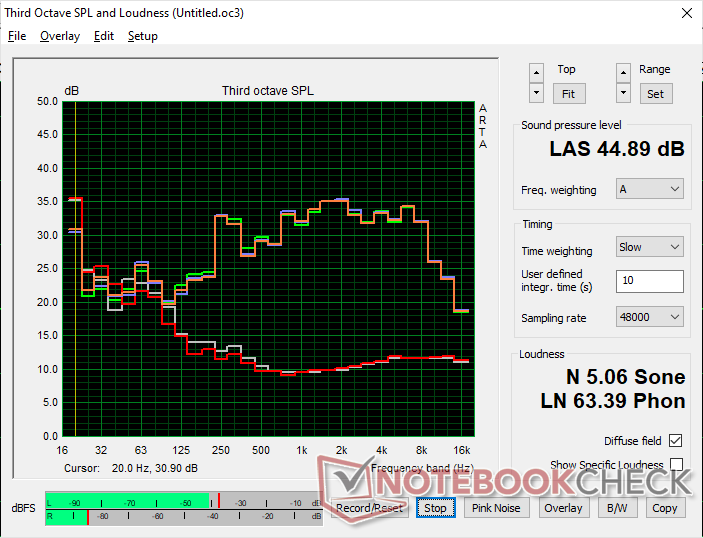
Dell Inspiron 16 7640 2-in-1 ses analizi
(+) | hoparlörler nispeten yüksek sesle çalabilir (84 dB)
Bas 100 - 315Hz
(±) | azaltılmış bas - ortalama olarak medyandan 13.9% daha düşük
(±) | Bas doğrusallığı ortalamadır (14% delta - önceki frekans)
Ortalar 400 - 2000 Hz
(+) | dengeli ortalar - medyandan yalnızca 3.6% uzakta
(+) | orta frekanslar doğrusaldır (3.6% deltadan önceki frekansa)
Yüksekler 2 - 16 kHz
(+) | dengeli yüksekler - medyandan yalnızca 4.5% uzakta
(+) | yüksekler doğrusaldır (2.8% deltadan önceki frekansa)
Toplam 100 - 16.000 Hz
(+) | genel ses doğrusaldır (12% ortancaya göre fark)
Aynı sınıfla karşılaştırıldığında
» Bu sınıftaki tüm test edilen cihazların %11%'si daha iyi, 4% benzer, 85% daha kötüydü
» En iyisinin deltası 6% idi, ortalama 20% idi, en kötüsü 57% idi
Test edilen tüm cihazlarla karşılaştırıldığında
» Test edilen tüm cihazların %8'si daha iyi, 2 benzer, % 90 daha kötüydü
» En iyisinin deltası 4% idi, ortalama 24% idi, en kötüsü 134% idi
Apple MacBook Pro 16 2021 M1 Pro ses analizi
(+) | hoparlörler nispeten yüksek sesle çalabilir (84.7 dB)
Bas 100 - 315Hz
(+) | iyi bas - medyandan yalnızca 3.8% uzakta
(+) | bas doğrusaldır (5.2% delta ile önceki frekans)
Ortalar 400 - 2000 Hz
(+) | dengeli ortalar - medyandan yalnızca 1.3% uzakta
(+) | orta frekanslar doğrusaldır (2.1% deltadan önceki frekansa)
Yüksekler 2 - 16 kHz
(+) | dengeli yüksekler - medyandan yalnızca 1.9% uzakta
(+) | yüksekler doğrusaldır (2.7% deltadan önceki frekansa)
Toplam 100 - 16.000 Hz
(+) | genel ses doğrusaldır (4.6% ortancaya göre fark)
Aynı sınıfla karşılaştırıldığında
» Bu sınıftaki tüm test edilen cihazların %0%'si daha iyi, 0% benzer, 100% daha kötüydü
» En iyisinin deltası 5% idi, ortalama 18% idi, en kötüsü 45% idi
Test edilen tüm cihazlarla karşılaştırıldığında
» Test edilen tüm cihazların %0'si daha iyi, 0 benzer, % 100 daha kötüydü
» En iyisinin deltası 4% idi, ortalama 24% idi, en kötüsü 134% idi
Enerji Yönetimi - Core-H ve Mini-LED Zorlu Olabilir
Güç Tüketimi
Masaüstünde rölantide çalışma, parlaklık ayarına bağlı olarak 6 W ile 14 W arasında bir güç gerektirir ki bu da bizim kaydettiğimizden birkaç watt daha yüksektir Inspiron 16 7635 2'si 1 arada. Elbette, daha zorlu H serisi CPU ve daha yüksek çözünürlüklü mini LED panel, genel olarak daha yüksek tüketimden sorumludur.
Oyunlar gibi daha zorlu uygulamaları çalıştırırken tüketim yine Inspiron 16 7635 2'si 1 arada bilgisayardan yüzde 40'ın üzerinde daha yüksektir. Bununla birlikte, RX Vega 7'ye göre 2 kattan fazla GPU performansı artışı ile, tüketim artışı çoğu kullanıcı için buna değecektir. Prime95 çalıştırılırken CPU yoğun görevler için de benzer bir sonuç çıkarılabilir. Pil ömrü performanstan daha çok isteniyorsa, daha ucuz ve daha yavaş Core Ultra 5 125U yapılandırmasını tercih etmenin bu konuda çok fazla güç tasarrufu sağlaması beklenir.
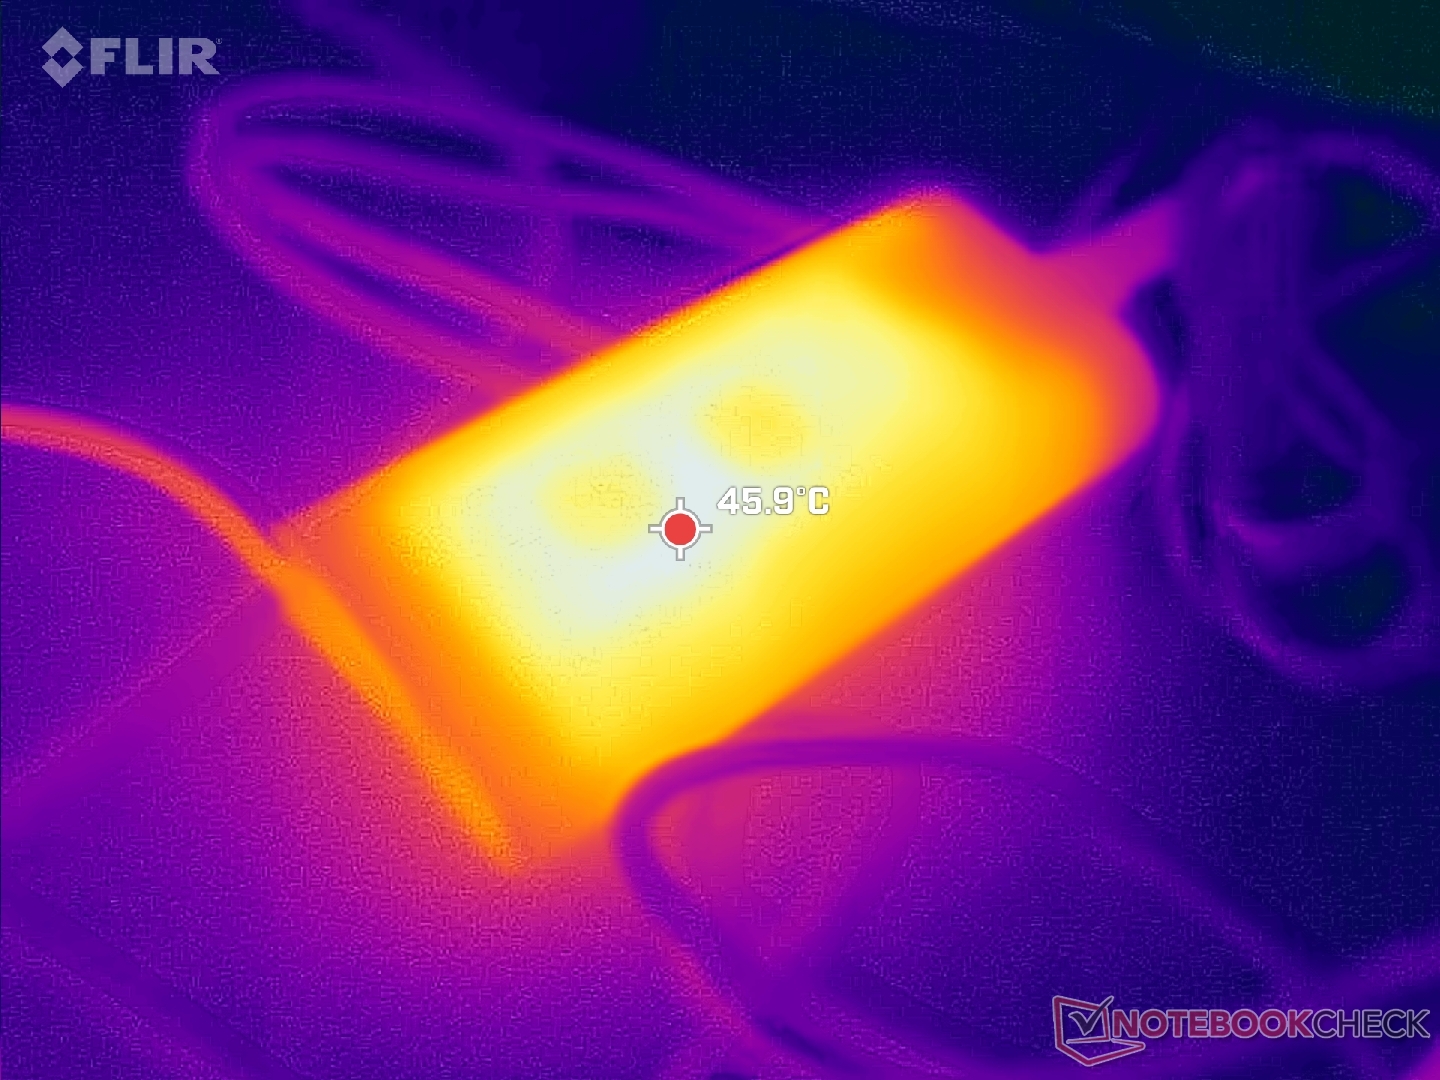
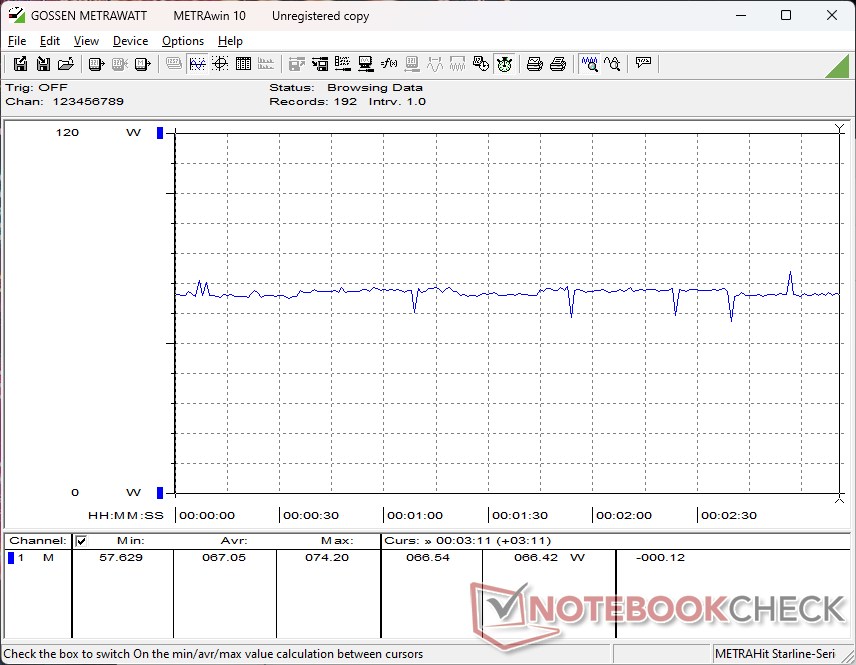
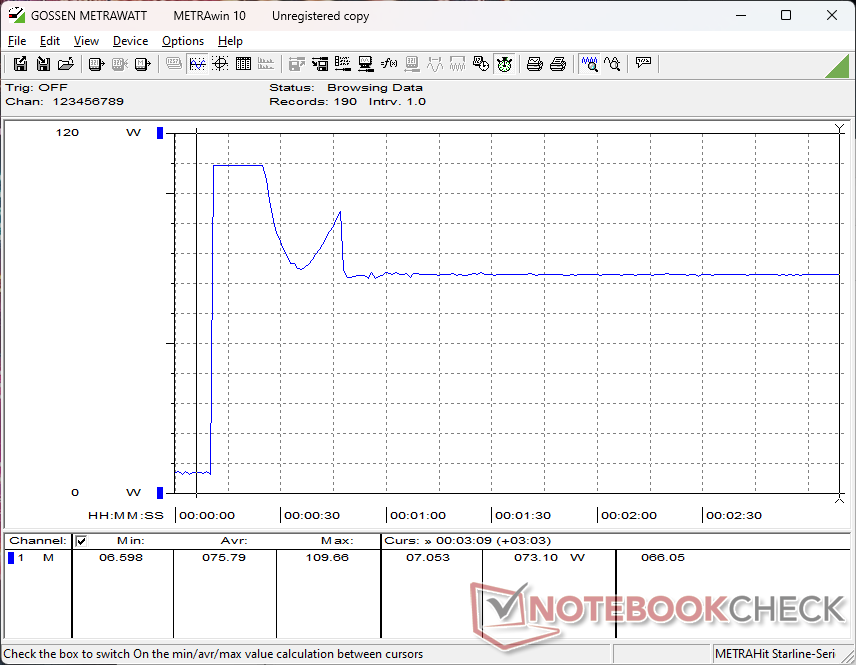
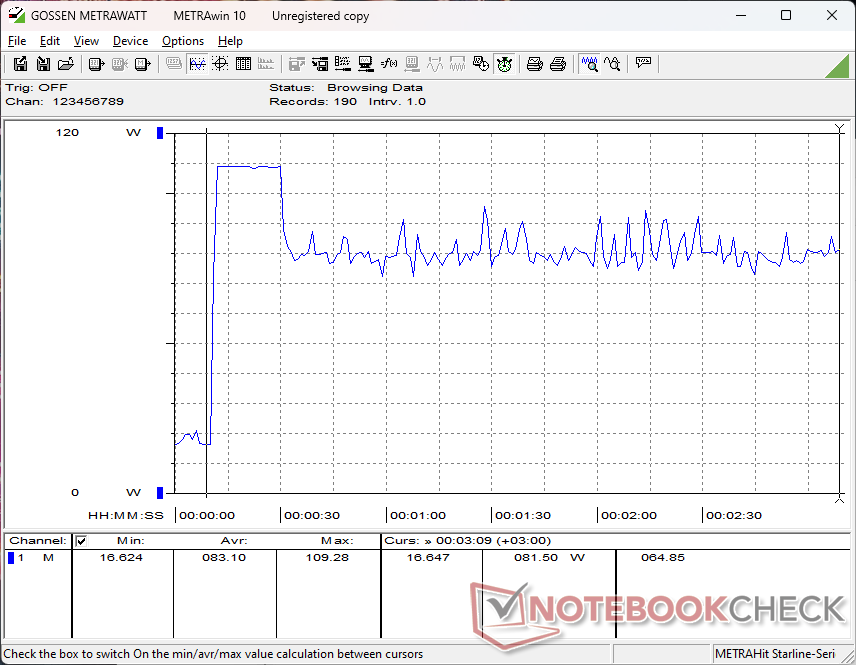
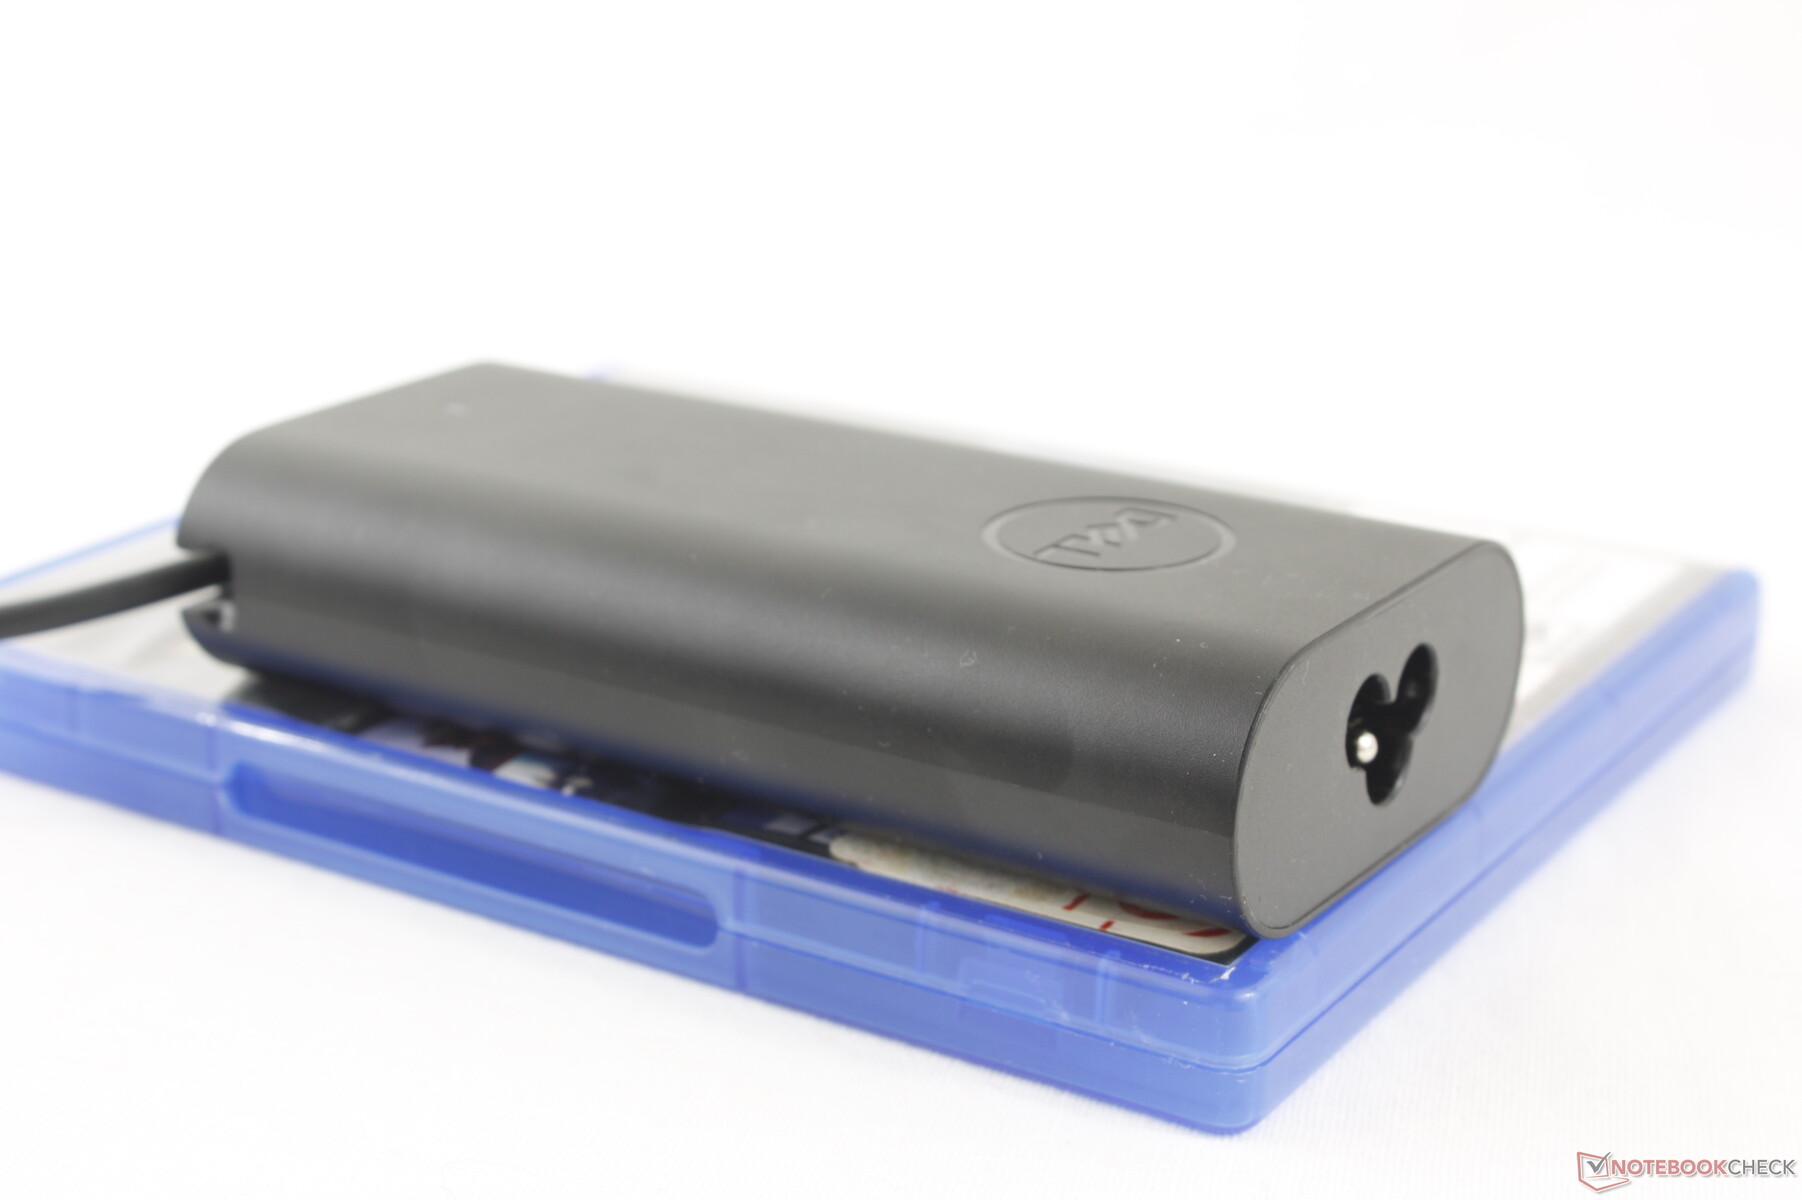
Küçük-orta boy (~12,2 x 5,9 x 2,7 cm) USB-C AC adaptörü yalnızca 100 W olarak derecelendirilmiş olsa da maksimum 110 W tüketim kaydedebildik. Bu maksimum çekim, termal sınırlamalar nedeniyle aşağıdaki grafiğimizde gösterildiği gibi yalnızca geçicidir. Bununla birlikte, Core H serisi CPU'nun daha yüksek Turbo Boost potansiyeli nedeniyle Inspiron 16 7635 2'si 1 arada aygıtta kaydettiğimizden çok daha yüksektir.

| Kapalı / Bekleme modu | |
| Boşta | |
| Çalışırken |
|
Key:
min: | |
| Dell Inspiron 16 7640 2-in-1 Ultra 7 155H, Arc 8-Core, Micron 2550 1TB, Mini-LED, 2560x1600, 16" | Dell Inspiron 16 Plus 7640 Ultra 7 155H, NVIDIA GeForce RTX 4060 Laptop GPU, SK hynix BC901 HFS001TEJ4X164N, IPS, 2560x1600, 16" | Dell Inspiron 16 7635 2-in-1 R5 7530U, Vega 7, Kioxia BG5 KBG50ZNS512G, IPS, 1920x1200, 16" | HP Envy x360 2-in-1 16-ad0097nr R7 8840HS, Radeon 780M, KIOXIA BG5 KBG50ZNV1T02, OLED, 2880x1800, 16" | Lenovo IdeaPad Pro 5 16IMH G9 Ultra 7 155H, Arc 8-Core, Samsung PM9C1a MZAL81T0HDLB, IPS, 2560x1600, 16" | Samsung Galaxy Book4 Pro 360 Ultra 5 125H, Arc 7-Core, Samsung PM9B1 512GB MZVL4512HBLU, OLED, 2880x1800, 16" | |
|---|---|---|---|---|---|---|
| Power Consumption | 7% | 35% | 26% | 22% | 44% | |
| Idle Minimum * | 6.1 | 4.2 31% | 4.8 21% | 5 18% | 3.5 43% | 3 51% |
| Idle Average * | 13.5 | 6.9 49% | 7.6 44% | 6.2 54% | 9.6 29% | 6.3 53% |
| Idle Maximum * | 13.8 | 15.2 -10% | 8.7 37% | 14.7 -7% | 9.9 28% | 6.5 53% |
| Load Average * | 63.6 | 70.4 -11% | 47.1 26% | 49.9 22% | 62.7 1% | 49.3 22% |
| Cyberpunk 2077 ultra external monitor * | 64.6 | |||||
| Cyberpunk 2077 ultra * | 67 | |||||
| Load Maximum * | 109.7 | 137.4 -25% | 56.4 49% | 65 41% | 101.2 8% | 65.5 40% |
| Witcher 3 ultra * | 115.9 | 46.6 | 54.5 | 55.8 | 45.9 |
* ... daha küçük daha iyidir
Power Consumption Cyberpunk / Stress Test
Power Consumption external Monitor
Pil Ömrü
90 Wh pil paketi, geçen yılki Inspiron 16 7635 2'si 1 arada bilgisayardaki 64 Wh paketten daha büyüktür. Buna rağmen, yukarıda belirtildiği gibi daha zorlu ekran ve CPU nedeniyle tarama testimiz sırasında çalışma süreleri neredeyse üç saat daha kısadır. Çalışma süresi farklılıkları, ekranlar aynı parlaklık seviyesi olan 150 nit'e ayarlandığında bile geçerli.
Büyük pil paketini boştan tam kapasiteye şarj etmek, diğer Ultrabook'ların çoğundaki 1,5 saate kıyasla yaklaşık 2,5 saat ile nispeten yavaştır.
| Dell Inspiron 16 7640 2-in-1 Ultra 7 155H, Arc 8-Core, 90 Wh | Dell Inspiron 16 Plus 7640 Ultra 7 155H, NVIDIA GeForce RTX 4060 Laptop GPU, 90 Wh | Dell Inspiron 16 7635 2-in-1 R5 7530U, Vega 7, 64 Wh | HP Envy x360 2-in-1 16-ad0097nr R7 8840HS, Radeon 780M, 68 Wh | Lenovo IdeaPad Pro 5 16IMH G9 Ultra 7 155H, Arc 8-Core, 84 Wh | Samsung Galaxy Book4 Pro 360 Ultra 5 125H, Arc 7-Core, 76 Wh | |
|---|---|---|---|---|---|---|
| Pil Çalışma Süresi | 16% | 23% | -12% | -9% | 0% | |
| Reader / Idle | 1310 | 1560 19% | 935 -29% | |||
| WiFi v1.3 | 686 | 799 16% | 869 27% | 459 -33% | 756 10% | 531 -23% |
| Load | 93 | 114 23% | 116 25% | 68 -27% | 114 23% | |
| H.264 | 957 | 881 |
Artılar
Eksiler
Karar - Boyut ve Performans Açısından Büyük
Inspiron 16 7640 2'si 1 arada modelin birkaç güçlü noktası var. İlk olarak, Core Ultra 7 155H ile performansı, özellikle entegre grafiklerle çalışan diğer 16 inç dönüştürülebilir cihazlarla karşılaştırıldığında en üst düzeydedir. Bu, büyük bir yavaşlama sorunu olmayan oyun sınıfı bir CPU'dur ve makineye atabileceğiniz herhangi bir içerik veya çoklu görev uygulamasından hızla geçmelidir. İkinci olarak, mini LED panel, modeli kullanışlı 2'si 1 arada form faktörü ve aktif kalem ile üst düzey bir multimedya oynatıcı olarak pekiştiriyor.
Inspiron 16 7640 2'si 1 arada büyük ve güçlü. Performansı ve ekranı fiyatına göre etkileyici olsa da, kullanıcılar bunun bedelini hantal bir kasa ve daha kısa pil ömrü ile ödüyor.
Daha yüksek performans ve daha parlak ekranlar, daha yüksek güç tüketiminin öngörülebilir maliyetiyle gelir. Daha zorlu bileşenler daha fazla ısı üretilmesine yol açarak daha yüksek fan gürültüsüne ve geçen yılki modele göre daha kısa çalışma sürelerine neden oluyor. Yukarıdaki test ve ölçümlerimizde de görüldüğü gibi bu farklar hiç de küçük değil.
Ayrıca, modelin büyük boyutu ve ağırlığı da göz ardı edilemez. Daha hafif 16 inç üstü açılır modeller mevcuttur LG Gram 16 2'si 1 arada veya Samsung Galaxy Book4 Pro 360 daha seyahat dostu bir deneyim için. Dell bile daha büyük ve daha ağır HP Spectre x360 16 özellikle ayrı GeForce grafikler sunuyor.
Inspiron 16 7640 2'si 1 arada, 1000 dolarlık makul fiyatı nedeniyle kusurlarına rağmen yine de çekici. Aynı fiyat aralığındaki diğer dizüstü bilgisayarlara karşı hız ve görüntü kalitesi söz konusu olduğunda üstünlük sağlıyor.
Fiyat ve Bulunabilirlik
Core Ultra 5 125U ve standart 1200p IPS dokunmatik ekranlı temel konfigürasyon 800$'dan başlarken, Core Ultra 7 155H ve 2.5K mini-LED konfigürasyon şu anda 1000$'a satılmaktadır.
İpucu: Derecelendirme Sistemimizi kısa bir süre önce güncelledik ve Sürüm 8'in sonuçları Sürüm 7'nin sonuçlarıyla karşılaştırılamaz. Daha fazla bilgi için hier verfügbar.
Not: Derecelendirme sistemimizi yakın zamanda güncelledik ve 8. sürümün sonuçları 7. sürümün sonuçları ile karşılaştırılamaz. Daha fazla bilgi için burada .
Dell Inspiron 16 7640 2-in-1
- 07/19/2024 v8
Allen Ngo
 Total Sustainability Score:
 Şeffaflık
İncelenecek cihazların seçimi editör ekibimiz tarafından yapılır. Test örneği, bu incelemenin amacı doğrultusunda üretici veya perakendeci tarafından yazara ödünç olarak sağlanmıştır. Borç verenin bu inceleme üzerinde herhangi bir etkisi olmadığı gibi, üretici de yayınlanmadan önce bu incelemenin bir kopyasını almamıştır. Bu incelemeyi yayınlama zorunluluğu yoktu. İncelemelerimiz karşılığında asla tazminat veya ödeme kabul etmiyoruz. Bağımsız bir medya şirketi olarak Notebookcheck, üreticilerin, perakendecilerin veya yayıncıların otoritesine tabi değildir.
Notebookcheck bu şekilde test yapıyor
Notebookcheck, tüm sonuçların karşılaştırılabilir olmasını sağlamak için her yıl yüzlerce dizüstü bilgisayarı ve akıllı telefonu standart prosedürler kullanarak bağımsız olarak inceliyor. Yaklaşık 20 yıldır test yöntemlerimizi sürekli olarak geliştirdik ve bu süreçte endüstri standartlarını belirledik. Test laboratuvarlarımızda deneyimli teknisyenler ve editörler tarafından yüksek kaliteli ölçüm ekipmanları kullanılmaktadır. Bu testler çok aşamalı bir doğrulama sürecini içerir. Karmaşık derecelendirme sistemimiz, nesnelliği koruyan yüzlerce sağlam temellere dayanan ölçüm ve kıyaslamaya dayanmaktadır.Price comparison

