Notebookcheck Logo
Teaser

Acer Nitro V 16 ANV16-41 incelemesi: Aksaklıkları olan uygun fiyatlı bir dizüstü oyun bilgisayarı

Nitro'ya mı ihtiyacınız var?

Nitro V16, fiyatına göre (Ryzen 8000 ve RTX 4060) makul bir performanstan fazlasını sunan, 1.000 dolar civarında bir dizüstü oyun bilgisayarıdır. Burada 16 inçlik cihazın diğer tüm kategorilerde de aynı başarıyı gösterip göstermediğini öğrenin. Her şey sırayla: Acer ne yazık ki önemli bir konuda başarısız oldu.
Florian Glaser, 👁 Florian Glaser (Çeviren DeepL / Ninh Duy) Published 🇺🇸 🇩🇪 ...
Ryzen (Zen) AMD Radeon Nvidia Geforce Gaming Laptop / Notebook

Karar - Acer görüntü kalitesini ihmal etmiş

Bir dizüstü bilgisayarın tavsiyemize layık olması genellikle tek bir noktaya bağlıdır. Kağıt üzerinde Nitro V 16 ANV16-41 oldukça başarılı bir izlenim bıraktı. AMD'nin 8000 nesil Ryzen işlemcileri iyi güç-hız oranlarıyla biliniyor. Test konfigürasyonumuzda yüklü olan Nvidia'nın GeForce RTX 4060'ında da durum benzer. 16 GB DDR5 RAM ve 1 TB SSD de 1.000 doların biraz üzerindeki fiyat segmentinde (hala) uygun.

IPS ekranı şu anda popüler olan 16:10 en boy oranına sahiptir ve 165 Hz yenileme hızına ve 1.920 x 1.200 piksel çözünürlüğe sahiptir. Ancak ilk bakışta fark etmediğiniz şey, birazdan daha ayrıntılı olarak açıklayacağımız gibi Acer'ın oldukça düşük bir ekran tercih etmiş olmasıdır. Özetle, özellikle renk alanı kapsamı eksiktir ve içeriğin oldukça soluk ve donuk görünmesine neden olur. Diğer disiplinlerde de -giriş aygıtları, hoparlörler, web kamerası veya pil kapasitesi- ortalama sonuçlar elde etmeye yetti. Bu arada, yükseltme ve bakım seçenekleriyle artı puan aldı: Hem RAM (iki RAM bankası) hem de yığın depolama (iki M.2 yuvası) gerektiğinde kolayca değiştirilebilir veya genişletilebilir.

Genel olarak, bazı rakiplerine bakıldığında Nitro V 16'yı tavsiye etmek hala zor. Benzer veya biraz daha yüksek bir fiyata, Core i7-14650HX ve RTX 4060'a sahip Lenovo Legion 5 16IRX G9 gibi önemli ölçüde daha iyi ekranlara sahip oyun dizüstü bilgisayarları var. Ayrıca HP Victus 16, Nubia RedMagic Titan 16 ve Asus ROG Zephyrus G16 -hepsi 16 inçlik modeller- testimizdeki diğer rakipler olarak listeledik.

Artılar

+ sağlam fiyat/performans oranı
+ orta düzeyde güç tüketimi
+ RAM değiştirilebilir
+ iki M.2 yuvası
+ USB 4

Eksiler

- kasa biraz cılız ve çok kaliteli hissettirmiyor
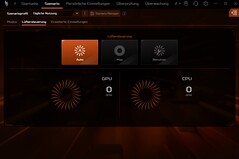
- zayıf fan kontrolü, yük altında çok yüksek ses
- hayal kırıklığı yaratan ekran (özellikle renk alanı kapsamı açısından)
- yetersiz pil kapasitesi
- kart okuyucu yok
- zayıf web kamerası

Fiyat ve bulunabilirlik

Bu yazının yazıldığı sırada Acer Nitro V 16 ANV16-41-R5AT'ı Amazon gibi çevrimiçi perakendeciler aracılığıyla şu anda 959 dolara satın alabilirsiniz.

Karşılaştırılan olası alternatifler

Image
Model / Review
Price
Weight
Height
Display
1.
76.3%
Acer Nitro V 16 ANV16-41-R5AT
AMD Ryzen 7 8845HS ⎘
NVIDIA GeForce RTX 4060 Laptop GPU ⎘
16 GB Bellek, 1024 GB SSD
List Price: 1100 EUR2.5 kg25.5 mm16.00"
1920x1200
142 PPI
IPS
2.
89.1% v7 (old)
Lenovo Legion 5 16IRX G9
Intel Core i7-14650HX ⎘
NVIDIA GeForce RTX 4060 Laptop GPU ⎘
16 GB Bellek, 1024 GB SSD
List Price: 1599€2.4 kg25.2 mm16.00"
2560x1600
189 PPI
IPS
3.
84.3% v7 (old)
HP Victus 16 (2024)
HP Victus 16 (2024)
Intel Core i7-14700HX ⎘
NVIDIA GeForce RTX 4060 Laptop GPU ⎘
16 GB Bellek, 512 GB SSD
Amazon: $1,499.00
List Price: 1499 Euro
2.4 kg23.9 mm16.10"
1920x1080
137 PPI
IPS
4.
81.2%
Nubia RedMagic Titan 16 Pro
Intel Core i9-14900HX ⎘
NVIDIA GeForce RTX 4060 Laptop GPU ⎘
16 GB Bellek, 1024 GB SSD
Amazon:
1. $67.49
atFoliX Screen Protector com...
2. $67.49
atFoliX Screen Protection Fi...
3. $65.99
atFoliX Plastic Glass Protec...
List Price: 1759 Euro
2.4 kg23.9 mm16.00"
2560x1600
189 PPI
IPS
5.
85.9%
Asus ROG Zephyrus G16 GA605WV
AMD Ryzen AI 9 HX 370 ⎘
NVIDIA GeForce RTX 4060 Laptop GPU ⎘
32 GB Bellek, 1024 GB SSD
Amazon: $1,899.00
List Price: 2599€
1.8 kg17.2 mm16.00"
2560x1600
189 PPI
OLED

Nitro V 16'nın çeşitli varyantları mevcuttur. Konfigürasyona bağlı olarak, bir Ryzen 5 8645HS ya da Ryzen 7 8845HS i̇çeride. RAM'i 16 ila 32 GB arasında değişiyor ve NVMe SSD'si her durumda 1 TB kapasiteye sahip. Ya bir GeForce RTX 4050 veya RTX 4060 görüntü işleme ile ilgilenir. Modellerin fiyatı 1.000 ila 1.400 dolar arasında değişiyor.

Teknik Özellikler

Acer Nitro V 16 ANV16-41-R5AT
İşlemci
AMD Ryzen 7 8845HS 8 x 3.8 - 5.1 GHz, 65 W PL2 / Short Burst, 54 W PL1 / Sustained, Hawk Point-HS (Zen 4)
Grafik kartı
NVIDIA GeForce RTX 4060 Laptop GPU - 8 GB VRAM, Çekirdek: 1890 MHz, Bellek: 2000 MHz, 85 W TDP, GDDR6, ForceWare 566.14, Optimus
Bellek
16 GB 
, 2x 8 GB SO-DIMM DDR5-5600, two slots (both in use)
Görüntü
16.00 inç 16:10, 1920 x 1200 pixel 142 PPI, AUO B160UAN05.B (AUOD8B1), IPS, parlak: hayır, 165 Hz
Anakart
AMD Promontory/Bixby FCH
Harddisk
Micron 2550 1TB, 1024 GB 
, NVMe-SSD, two M.2-slots (one empty)
Ses kartı
Realtek ALC245 @ AMD K19.7 - Audio Processor - High Definition Audio Controller
Bağlantılar
2 USB 3.1 Gen2, 1 USB 4.0 40 Gbps, 1 Thunderbolt, USB-C Power Delivery (PD), 1 HDMI, 1 DisplayPort, 1 Kensington Lock, Ses çıkışları: Combined (Headset/Mic)
Network
Realtek PCIe GBE Family Controller (10/100/1000MBit/s), MediaTek RZ616 (a/b/g/n = Wi-Fi 4/ac = Wi-Fi 5/ax = Wi-Fi 6/ Wi-Fi 6E 6 GHz), Bluetooth 5.3
Boyut
yükseklik x genişlik x derinlik (mm): 25.5 x 362 x 278
Batarya
57 Wh Lithium-Ion
İşletim sistemi
Microsoft Windows 11 Home
Camera
Webcam: 0.9 MP
Ek özellikler
Hoparlörler: 2.0, Klavye: Chiclet, Klavye ışığı: evet, 135 W Power Supply, NitroSense, 24 Ay Garanti
Ağırlık
2.5 kg, Güç kaynağı: 476 g
Fiyat
1100 EUR
Note: The manufacturer may use components from different suppliers including display panels, drives or memory sticks with similar specifications.


Dava

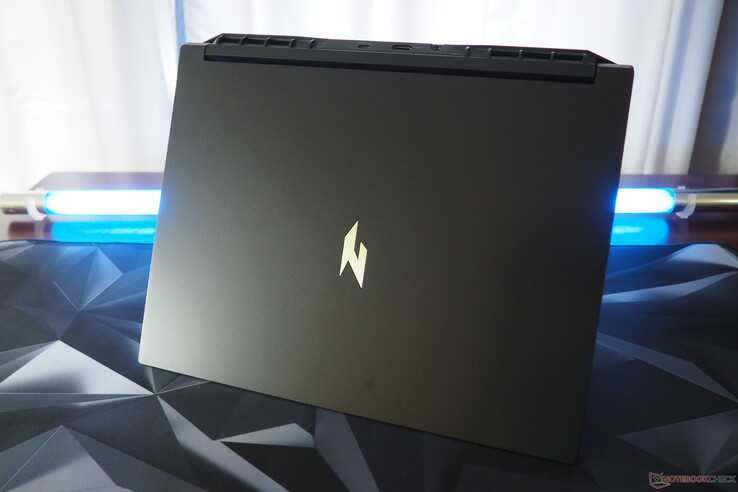
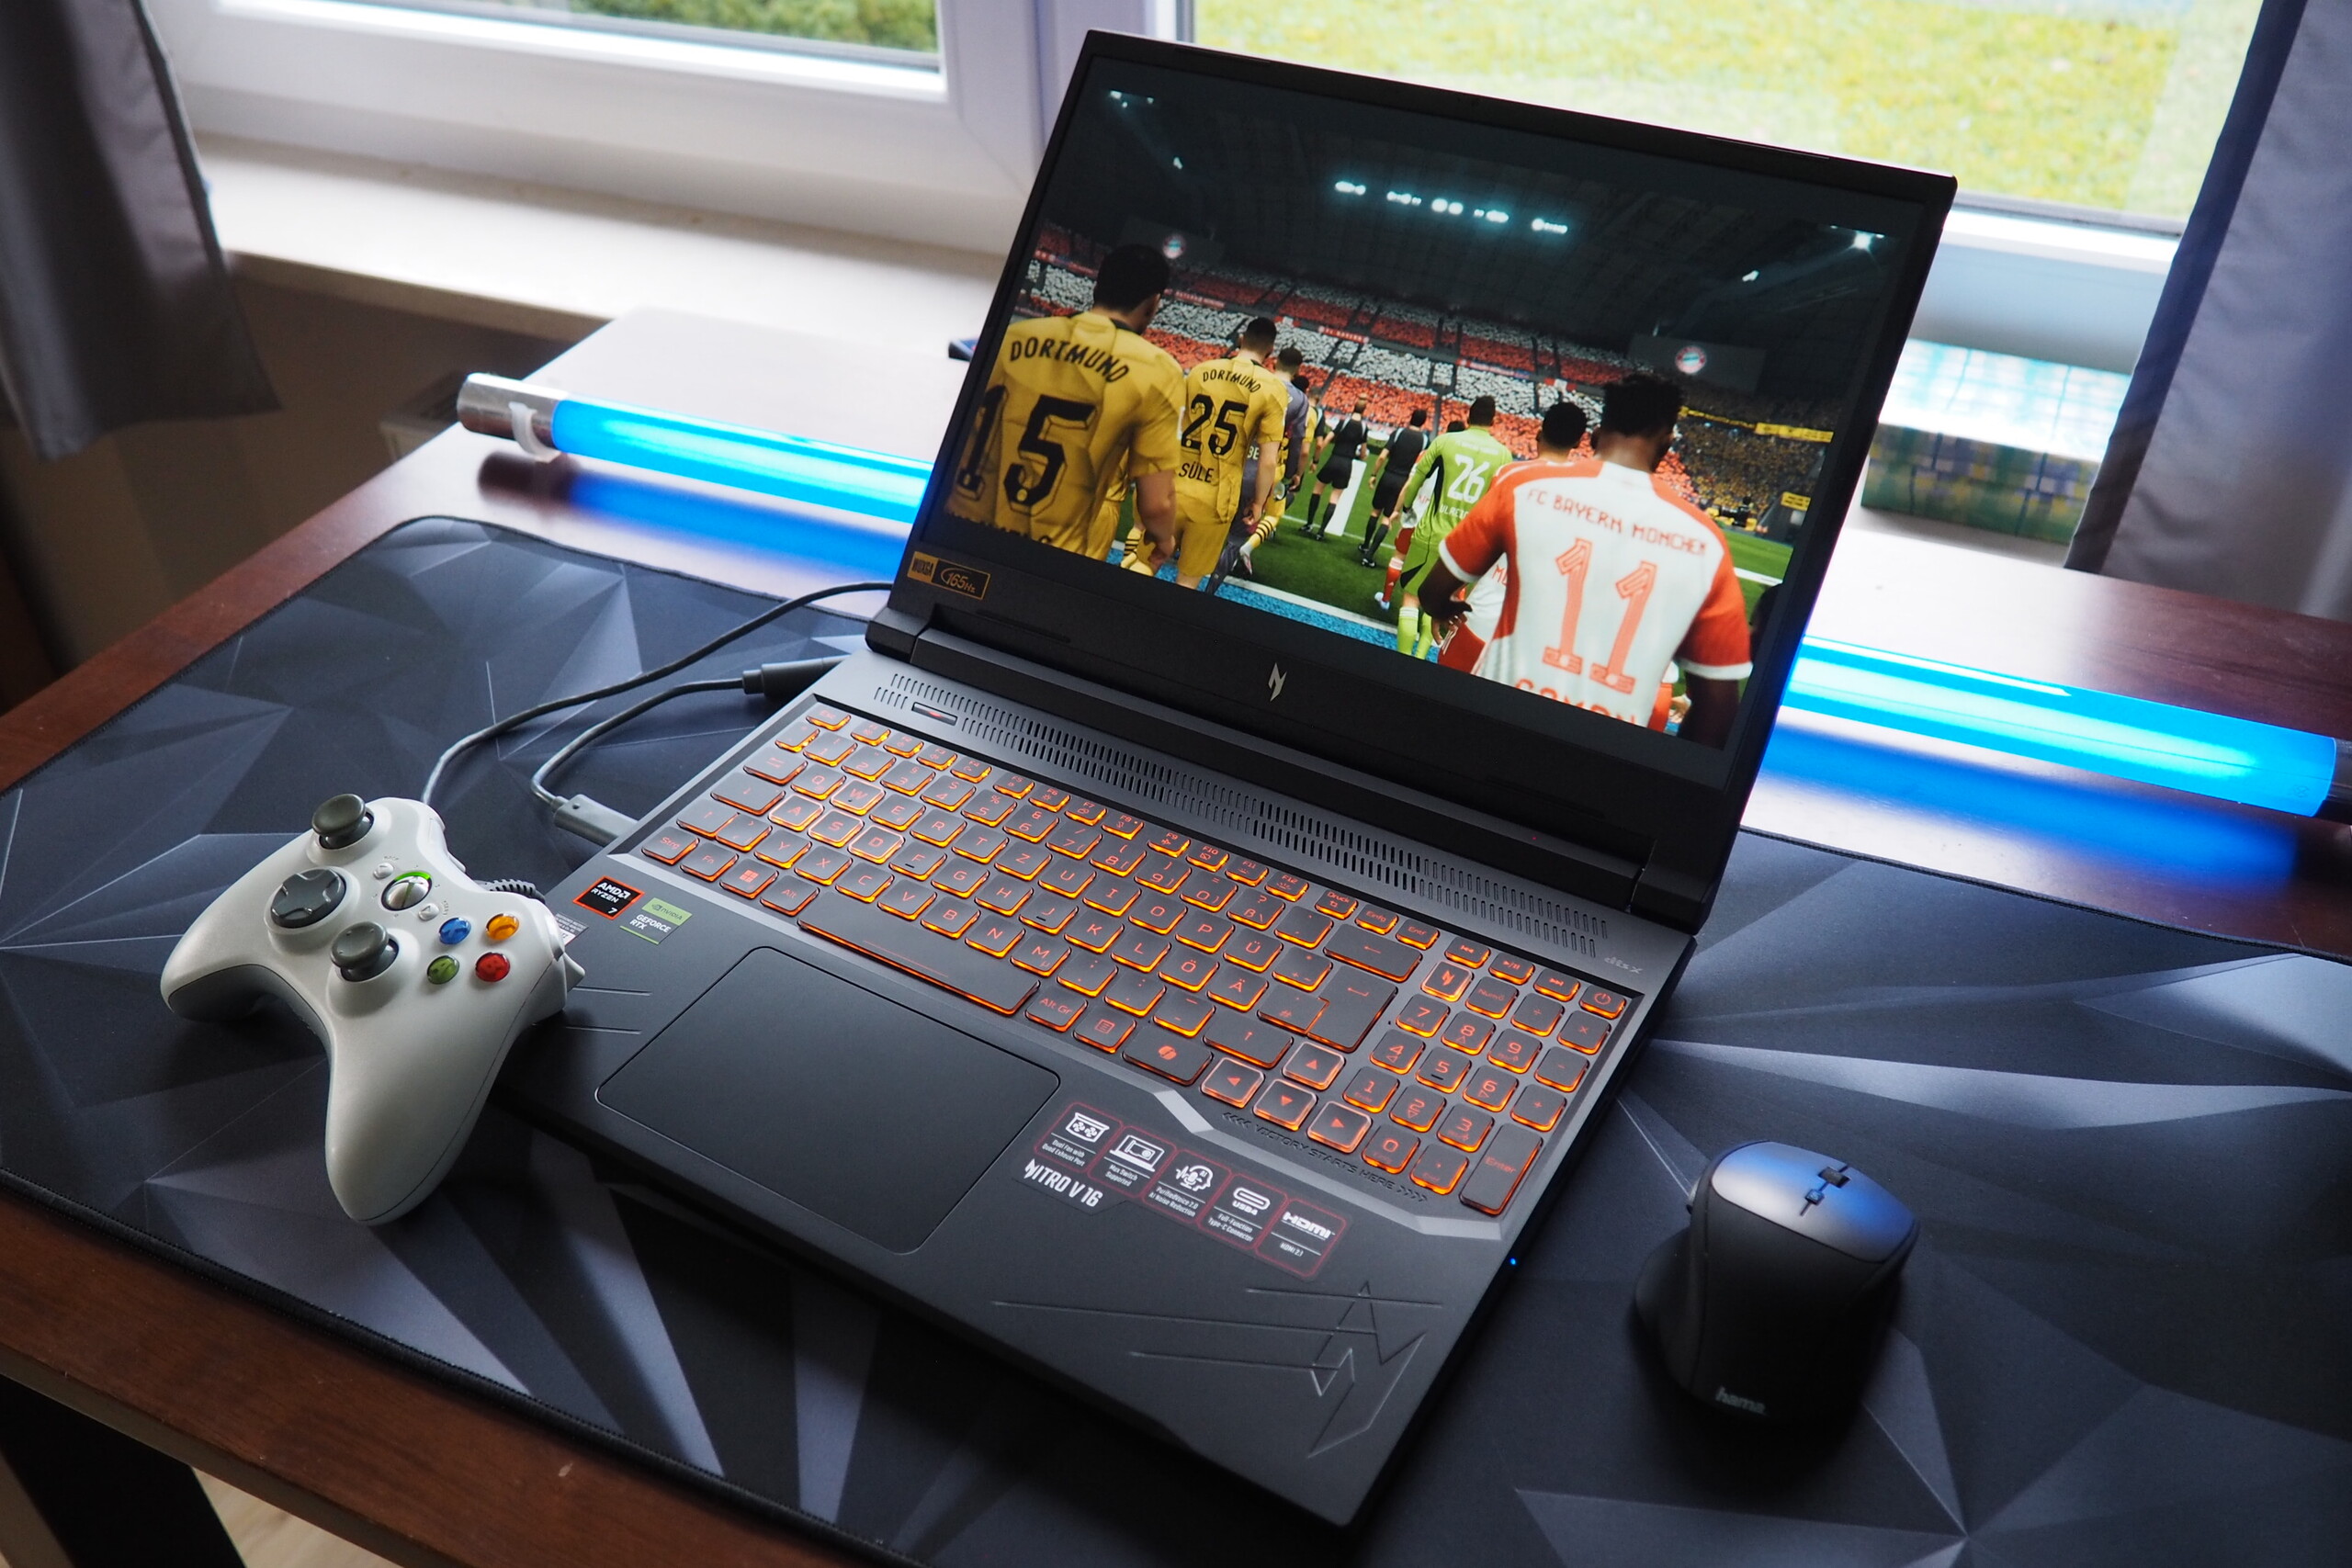
Acer Nitro V 16'nın kasası tamamen plastikten yapılmıştır, bu da ilk bakışta düzgün görünse de daha yakından incelendiğinde çok yüksek kaliteli hissettirmez ve orada burada takırdama eğilimindedir. Bununla birlikte, övgünün ötesinde olan yapı kalitesi açısından şikayet edecek bir şeyimiz yok. Menteşeleri fena iş çıkarmıyor ve ekranı tek elle kolayca açılabiliyor (maksimum açı yaklaşık 145°). Ne yazık ki, dizüstü bilgisayarın yüzeyleri, en azından koyu rengi nedeniyle, görünür parmak izlerini toplamaya eğilimlidir.

Acer Nitro V 16
Acer Nitro V 16
Acer Nitro V 16
Acer Nitro V 16
Acer Nitro V 16
Acer Nitro V 16

Nitro V 16, 2,5 kg ağırlığıyla karşılaştırma alanındaki en ağır 16 inçlik modeldir - rakiplerinin çoğu sadece biraz daha hafiftir. Sadece Zephyrus G16 ağırlığı 1,8 kg ile öne çıkıyor. Yapı yüksekliği söz konusu olduğunda tablo neredeyse aynı görünüyor. Acer cihazı 2,55 cm ile yine rakipleriyle aynı hizada yer alıyor ve sadece Asus dizüstü bilgisayar 2 cm'nin altında kalıyor.

Boyut ve ağırlık karşılaştırması

369 mm 259.4 mm 23.9 mm 2.4 kg362 mm 278 mm 25.5 mm 2.5 kg359.7 mm 262.3 mm 25.2 mm 2.4 kg358 mm 262 mm 23.9 mm 2.4 kg354 mm 246 mm 17.2 mm 1.8 kg297 mm 210 mm 1 mm 5.7 g

Bağlanabilirlik

Limanlar

Eksik kart okuyucuyu hariç tutarsanız, dizüstü bilgisayarın bağlantı noktası seçimi oldukça etkileyici. Başka bir USB-C portu daha istesek de, mevcut USB portu sürüm 4 modelidir (DisplayPort dahil). İki USB-A portu ise 3.2 Gen 2 standardını kullanıyor. Ayrıca bir HDMI 2.1 portu, bir Gigabit LAN portu, bir ses jakı ve Kensington kilitleri için bir açıklık var. Acer bazı bağlantı noktalarını cihazın arkasına yerleştirmiş, bu da harici bir fare kullanırken faydalı oluyor (anahtar kelime: boşluk).

Sol taraf: Kensington Kilidi, RJ45 Gigabit LAN, USB-A 3.2 Gen 2, ses kombinasyonu
Arka: güç kaynağı, HDMI 2.1, USB-C 4 (DisplayPort dahil)
Sağ taraf: USB-A 3.2 Gen 2

İletişim

Takılı MediaTek çipi (RZ616), referans yönlendiriciye bir metre mesafeden yaptığımız menzil testi sırasında sağlam (gönderme) ile çok iyi (alma) arasında bir performans gösterdi.

Networking
iperf3 transmit AXE11000
Asus ROG Zephyrus G16 GA605WV
Mediatek Wi-Fi 7 MT7925 Wireless LAN Card
1843 (1712min - 1964max) MBit/s +119%
Lenovo Legion 5 16IRX G9
Intel Wi-Fi 6E AX211
1489 (1329min, 1338.28P1 - 1686max) MBit/s +77%
Average of class Gaming
  (469 - 1843, n=147, last 2 years)
1231 MBit/s +46%
Average MediaTek RZ616
  (593 - 1793, n=16)
1155 MBit/s +37%
Nubia RedMagic Titan 16 Pro
Intel Wi-Fi 6E AX211
1058 (543min - 1423max) MBit/s +26%
Acer Nitro V 16 ANV16-41-R5AT
MediaTek RZ616
843 (470min - 976max) MBit/s
HP Victus 16 (2024)
Realtek RTL8852BE
776 (487min - 929max) MBit/s -8%
iperf3 receive AXE11000
Acer Nitro V 16 ANV16-41-R5AT
MediaTek RZ616
1735 (1720min - 1751max) MBit/s
Asus ROG Zephyrus G16 GA605WV
Mediatek Wi-Fi 7 MT7925 Wireless LAN Card
1712 (1678min - 1737max) MBit/s -1%
Nubia RedMagic Titan 16 Pro
Intel Wi-Fi 6E AX211
1658 (1631min - 1690max) MBit/s -4%
Average MediaTek RZ616
  (750 - 1752, n=16)
1527 MBit/s -12%
Average of class Gaming
  (680 - 1890, n=147, last 2 years)
1399 MBit/s -19%
Lenovo Legion 5 16IRX G9
Intel Wi-Fi 6E AX211
1398 (1327min, 1333.09P1 - 1464max) MBit/s -19%
HP Victus 16 (2024)
Realtek RTL8852BE
978 (960min - 990max) MBit/s -44%
05010015020025030035040045050055060065070075080085090095010001050110011501200125013001350140014501500155016001650170017501800185019001950Tooltip
Acer Nitro V 16 ANV16-41-R5AT MediaTek RZ616; iperf3 transmit AXE11000; iperf 3.1.3: Ø843 (470-976)
Lenovo Legion 5 16IRX G9 Intel Wi-Fi 6E AX211; iperf3 transmit AXE11000: Ø1489 (1329-1686)
HP Victus 16 (2024) Realtek RTL8852BE; iperf3 transmit AXE11000; iperf 3.1.3: Ø776 (487-929)
Nubia RedMagic Titan 16 Pro Intel Wi-Fi 6E AX211; iperf3 transmit AXE11000; iperf 3.1.3: Ø1040 (543-1423)
Asus ROG Zephyrus G16 GA605WV Mediatek Wi-Fi 7 MT7925 Wireless LAN Card; iperf3 transmit AXE11000; iperf 3.1.3: Ø1844 (1712-1964)
Acer Nitro V 16 ANV16-41-R5AT MediaTek RZ616; iperf3 receive AXE11000; iperf 3.1.3: Ø1734 (1720-1751)
Lenovo Legion 5 16IRX G9 Intel Wi-Fi 6E AX211; iperf3 receive AXE11000: Ø1398 (1327-1464)
HP Victus 16 (2024) Realtek RTL8852BE; iperf3 receive AXE11000; iperf 3.1.3: Ø978 (960-990)
Nubia RedMagic Titan 16 Pro Intel Wi-Fi 6E AX211; iperf3 receive AXE11000; iperf 3.1.3: Ø1658 (1631-1690)
Asus ROG Zephyrus G16 GA605WV Mediatek Wi-Fi 7 MT7925 Wireless LAN Card; iperf3 receive AXE11000; iperf 3.1.3: Ø1711 (1678-1737)

Web kamerası

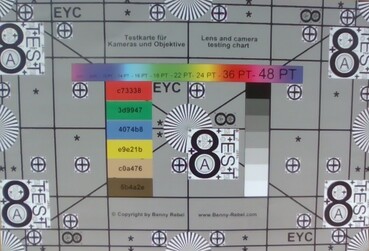
Alıcılar, web kamerasından yalnızca düşük kaliteli standart ücret bekleyebilirler. 0,9 MP model ne keskin ne de renklere sadık (resimlere bakın).

ColorChecker
15.6 ∆E
15 ∆E
19.5 ∆E
17.3 ∆E
17.9 ∆E
15.9 ∆E
12.5 ∆E
23.9 ∆E
15.4 ∆E
16.2 ∆E
15 ∆E
12 ∆E
18.3 ∆E
17.6 ∆E
15.6 ∆E
9.2 ∆E
18.2 ∆E
22 ∆E
2.3 ∆E
11.8 ∆E
18.2 ∆E
19 ∆E
18 ∆E
6.3 ∆E
ColorChecker Acer Nitro V 16 ANV16-41-R5AT: 15.52 ∆E min: 2.33 - max: 23.87 ∆E

Aksesuarlar

Acer, dizüstü bilgisayarı birkaç bilgi broşürü ve yarı kompakt 135 watt'lık bir güç kaynağı ile birlikte teslim ediyor.

Bakım

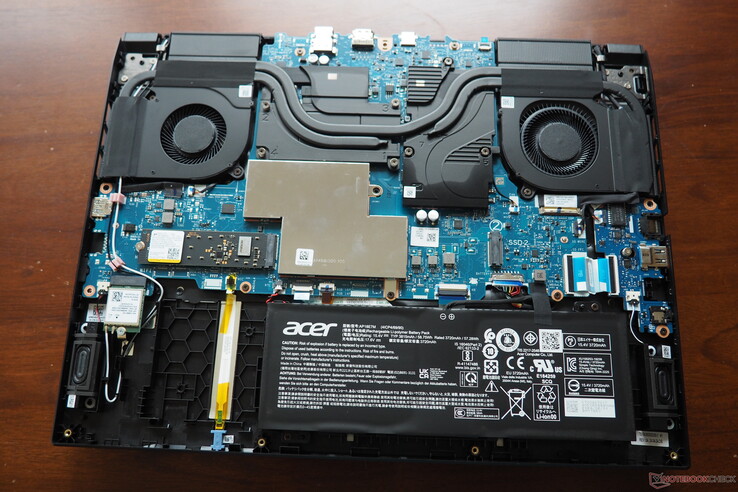
Taban plakası toplam 11 Phillips vida ile sabitlenmiştir. Başta da belirtildiği gibi, dizüstü bilgisayarın kapağının altında iki M.2 yuvası (biri boş) ve iki RAM bankası var, ancak bunlar bir kapağın arkasına gizlenmiş durumda. Pil, WLAN modülü ve soğutma sistemine de erişilebilir.

Acer Nitro V 16
Acer Nitro V 16
Acer Nitro V 16
Acer Nitro V 16
Acer Nitro V 16
Acer Nitro V 16

Sürdürülebilirlik

Üretici, cihazın ambalajı için çoğunlukla karton kullanıyor. Sadece güç kaynağı ünitesi ve dizüstü bilgisayarın kendisi plastik bir film veya kılıfla sarılmıştır.

Garanti

Dizüstü bilgisayar Amerika Birleşik Devletleri'nde standart 12 aylık garanti kapsamındadır.

Giriş cihazları

Klavye

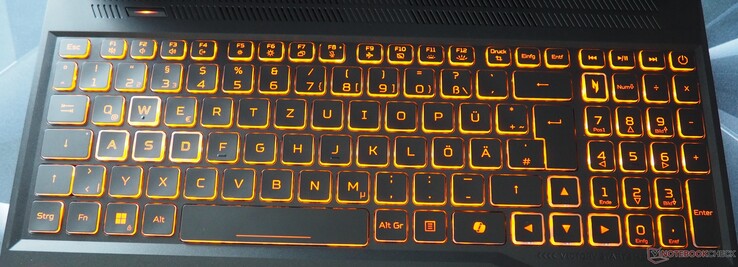
Benzer şekilde Nitro V 15bu modelin klavyesini vasat olarak tanımlayabiliriz. Biraz süngerimsi yazma hissi, sık yazı yazanları muhtemelen sınırlı ölçüde tatmin edecektir. Acer, renk vurgusu olarak turuncu aydınlatma ve harfleri tercih etmiş. İkincisini bazı açılardan görmek özellikle kolay değil. Düzeninin bazı iyi yönlerinin yanı sıra bazı olumsuzlukları da var. Olumlu tarafta, cömertçe boyutlandırılmış yön oklarından bahsetmeliyiz. Öte yandan, diğer tuşlardan ayrılmayan güç düğmesinden daha az memnun kaldık.

Acer Nitro V 16

Dokunmatik yüzey

Dokunmatik yüzey kalite açısından kabaca klavye ile aynı seviyede, yani kullanılabilir ancak gerçek bir vurgu değil. Acer hassasiyeti ve kayma özellikleri üzerinde çalışabilir. Tıklama alanları da oldukça cılız, yani ucuz görünüyor. Bununla birlikte, 12,6 x 8,2 cm'lik boyutu eleştiri için bir neden vermiyor.

Ekran

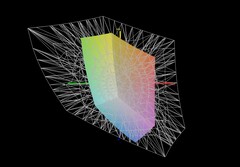
Bu da bizi Nitro V 16'nın en büyük zayıflığına, yani soluk ekranına getiriyor. 57 sRGB kapsamı, %40 AdobeRGB kapsamı ve %38 DCI-P3 kapsamı oldukça zayıf bir sonuçtur ve 2024 yılında gerçekten geçmişte kalmalıdır. Karşılaştırma cihazları arasında bu kadar zayıf bir ekran sadece HP Victus 16.

307
cd/m²
307
cd/m²
309
cd/m²
307
cd/m²
303
cd/m²
289
cd/m²
303
cd/m²
310
cd/m²
310
cd/m²
Parlaklığın yayılımı
AUO B160UAN05.B (AUOD8B1) tested with X-Rite i1Pro 2
Maksimum: 310 cd/m² (Nits) Ortalama: 305 cd/m² Minimum: 19 cd/m²
Aydınlatma: 93 %
Batarya modunda parlaklık: 303 cd/m²
Kontrast: 947:1 (Siyah: 0.32 cd/m²)
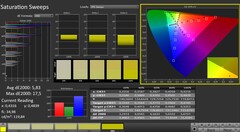
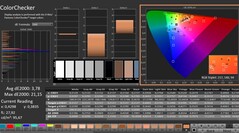
ΔE Color 5.74 | 0.5-29.43 Ø4.9, calibrated: 3.78
ΔE Greyscale 4 | 0.5-98 Ø5.2
39.6% AdobeRGB 1998 (Argyll 2.2.0 3D)
57.4% sRGB (Argyll 2.2.0 3D)
38.3% Display P3 (Argyll 2.2.0 3D)
Gamma: 2.372
Acer Nitro V 16 ANV16-41-R5AT
AUO B160UAN05.B (AUOD8B1), IPS, 1920x1200, 16", 165 Hz
Lenovo Legion 5 16IRX G9
NE160QDM-NZ3, IPS, 2560x1600, 16", 240 Hz
HP Victus 16 (2024)
Chi Mei CMN163E, IPS, 1920x1080, 16.1", 144 Hz
Nubia RedMagic Titan 16 Pro
BOE CQ NE160QDM-NZ2, IPS, 2560x1600, 16", 240 Hz
Asus ROG Zephyrus G16 GA605WV
ATNA60DL04-0, OLED, 2560x1600, 16", 240 Hz
Display
83%
8%
112%
127%
Display P3 Coverage
38.3
72.4
89%
41.3
8%
96.3
151%
99.9
161%
sRGB Coverage
57.4
100
74%
61.7
7%
100
74%
100
74%
AdobeRGB 1998 Coverage
39.6
74.1
87%
42.7
8%
84.1
112%
96.9
145%
Response Times
55%
-2%
80%
99%
Response Time Grey 50% / Grey 80% *
26.5 ?(13.1, 13.4)
12.5 ?(6.1, 6.4)
53%
28.6 ?(13.3, 15.3)
-8%
3.9 ?(1.7, 2.2)
85%
0.22 ?(0.11, 0.11)
99%
Response Time Black / White *
19.6 ?(11.6, 8)
8.7 ?(4.6, 4.1)
56%
18.7 ?(9.6, 9.1)
5%
5 ?(1.2, 3.8)
74%
0.25 ?(0.13, 0.12)
99%
PWM Frequency
960
Screen
56%
9%
31%
45%
Brightness middle
303
526
74%
287
-5%
543
79%
416
37%
Brightness
305
500
64%
288
-6%
516
69%
418
37%
Brightness Distribution
93
87
-6%
86
-8%
86
-8%
96
3%
Black Level *
0.32
0.33
-3%
0.19
41%
0.51
-59%
Contrast
947
1594
68%
1511
60%
1065
12%
Colorchecker dE 2000 *
5.74
1.2
79%
5.46
5%
3.19
44%
1.6
72%
Colorchecker dE 2000 max. *
22.69
2.1
91%
20.36
10%
7.09
69%
2.1
91%
Colorchecker dE 2000 calibrated *
3.78
1
74%
3.52
7%
0.69
82%
Greyscale dE 2000 *
4
1.3
67%
4.8
-20%
4.2
-5%
2.7
32%
Gamma
2.372 93%
2.23 99%
2.108 104%
1.999 110%
2.16 102%
CCT
7461 87%
6391 102%
6442 101%
7431 87%
6331 103%
Total Average (Program / Settings)
65% / 62%
5% / 7%
74% / 56%
90% / 77%

* ... smaller is better

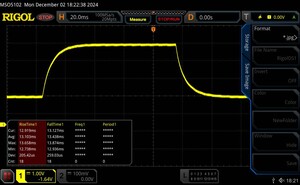
Tepki süreleri de siyahtan beyaza yaklaşık 20 ms ve griden griye 27 ms ile multimedya ve oyun gereksinimlerini sınırlı ölçüde karşılıyor. Rakiplerinin çoğu bu konuda daha iyi performans gösteriyor.

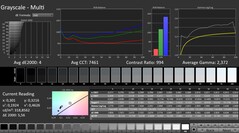
CalMAN: gri tonlama
CalMAN: gri tonlama
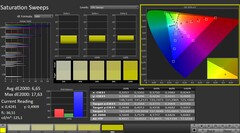
CalMAN: renk doygunluğu
CalMAN: ColorChecker
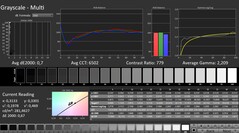
CalMAN: gri tonlama (kalibre edilmiş)
CalMAN: renk doygunluğu (kalibre edilmiş)
CalMAN: ColorChecker (kalibre edilmiş)

Dış mekan hayranları da paralarının karşılığını pek alamayacaklardır. Ortalama 303 cd/m² sadece iç mekan kullanımı için uygun bir değerdir.

Acer Nitro V 16 vs sRGB
Acer Nitro V 16 vs AdobeRGB
Acer Nitro V 16 vs DCI-P3

IPS standartlarına göre siyah seviyesi (0,32 cd/m²) ve kontrastı (947:1) iyi sayılır ama Nitro V 16'nın OLED paneller karşısında hiç şansı yok. Ekranın görüş açısı kararlılığı da benzer. Öte yandan, 16 inçlik panel tüm parlaklık seviyelerinde görüntü titremesi yapmıyor.

Gün ışığı
Gün ışığı
Alt pikseller
Alt pikseller
Görüş açıları
Görüş açıları

Display Response Times

Display response times show how fast the screen is able to change from one color to the next. Slow response times can lead to afterimages and can cause moving objects to appear blurry (ghosting). Gamers of fast-paced 3D titles should pay special attention to fast response times.
       Response Time Black to White
19.6 ms ... rise ↗ and fall ↘ combined↗ 11.6 ms rise
↘ 8 ms fall
The screen shows good response rates in our tests, but may be too slow for competitive gamers.
In comparison, all tested devices range from 0.1 (minimum) to 240 (maximum) ms. » 39 % of all devices are better.
This means that the measured response time is similar to the average of all tested devices (20.9 ms).
       Response Time 50% Grey to 80% Grey
26.5 ms ... rise ↗ and fall ↘ combined↗ 13.1 ms rise
↘ 13.4 ms fall
The screen shows relatively slow response rates in our tests and may be too slow for gamers.
In comparison, all tested devices range from 0.165 (minimum) to 636 (maximum) ms. » 33 % of all devices are better.
This means that the measured response time is better than the average of all tested devices (32.8 ms).

Screen Flickering / PWM (Pulse-Width Modulation)

To dim the screen, some notebooks will simply cycle the backlight on and off in rapid succession - a method called Pulse Width Modulation (PWM) . This cycling frequency should ideally be undetectable to the human eye. If said frequency is too low, users with sensitive eyes may experience strain or headaches or even notice the flickering altogether.
Screen flickering / PWM not detected

In comparison: 53 % of all tested devices do not use PWM to dim the display. If PWM was detected, an average of 8687 (minimum: 5 - maximum: 343500) Hz was measured.

100 parlaklık
100 parlaklık
75 parlaklık
75 parlaklık
50 parlaklık
50 parlaklık
25 parlaklık
25 parlaklık
0 parlaklık
0 parlaklık

Performans

Takılı GPU'dan (RTX 4050 veya RTX 4060) bağımsız olarak Nitro V 16, oyun dizüstü bilgisayarlarının orta sınıfında bir yerde yer alıyor. Ryzen işlemci (8645HS veya 8845HS) genellikle önümüzdeki yıllar için yeterli rezerve sahip olmalıdır.

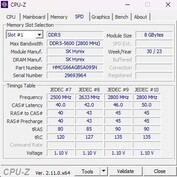
CPU-Z
CPU-Z
CPU-Z
CPU-Z
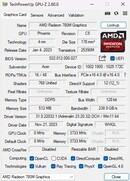
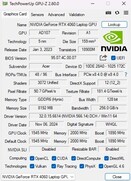
GPU-Z
GPU-Z
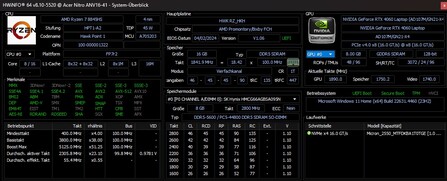
HWiNFO
 

Test koşulları

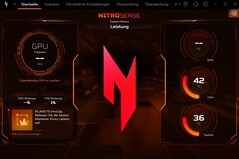
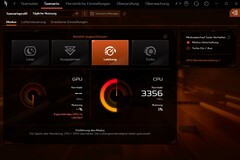
Özel bir düğmeyi kullanarak (veya NitroSense yazılımından) farklı profiller arasında geçiş yapabilirsiniz. Bunlar Eco 'dan Turbo'ya kadar değişiyor, ancak ölçümlerimize göre performans ve gürültü emisyonları söz konusu olduğunda çok az farklılık gösteriyorlar. Testimiz için Performans modunu kullandık. Dengeli profil kullanılarak yalnızca dizüstü bilgisayarın pil ömrü ölçüldü.

NitroSense
NitroSense
NitroSense
Cyberpunk 2077 Döngü dizisi (FHD/Ultra) Sessiz Dengeli Performans Turbo
Gürültü 52 dB(A) 53 dB(A) 54 dB(A) 55 dB(A)
Performans 59 fps 63 fps 64 fps 68 fps
CPU PL1 (HWiNFO) 45 watt 45 watt 54 watt 54 watt
CPU PL2 (HWiNFO) 65 watt 65 watt 65 watt 65 watt

İşlemci

Ryzen 7 8845HS, SMT aracılığıyla 16 adede kadar iş parçacığını paralel olarak işleyebilen ve oldukça hızlı bir iGPU barındıran Zen 4 neslinden sekiz çekirdekli bir modeldir Radeon 780M. Kıyaslamalar ve Cinebench döngüsü sırasında, 4 nm yonga kabaca Intel Core i7-14700HX. Ancak, 8845HS'nin daha yeni modellere karşı hiç şansı yoktu Ryzen AI 9 HX 370.

Cinebench R15 Multi continuous test

019539058578097511701365156017551950214523402535273029253120331535103705Tooltip
Acer Nitro V 16 ANV16-41-R5AT AMD Ryzen 7 8845HS: Ø2572 (2557.38-2602.64)
Lenovo Legion 5 16IRX G9 Intel Core i7-14650HX: Ø3471 (3409.19-3799.39)
HP Victus 16 (2024) Intel Core i7-14700HX: Ø2658 (2509.88-3812.18)
Nubia RedMagic Titan 16 Pro Intel Core i9-14900HX: Ø2240 (2071.36-3453.93)
Asus ROG Zephyrus G16 GA605WV AMD Ryzen AI 9 HX 370: Ø3338 (3327.79-3370.98)
CPU Performance Rating - Percent
Lenovo Legion 5 16IRX G9
Intel Core i7-14650HX
81.9 pt
Asus ROG Zephyrus G16 GA605WV
AMD Ryzen AI 9 HX 370
78.4 pt
Average of class Gaming
 
75 pt
Nubia RedMagic Titan 16 Pro
Intel Core i9-14900HX
74.7 pt
HP Victus 16 (2024)
Intel Core i7-14700HX
71.7 pt
Acer Nitro V 16 ANV16-41-R5AT
AMD Ryzen 7 8845HS
65.3 pt
Average AMD Ryzen 7 8845HS
 
64.4 pt
Cinebench R23
Multi Core
Lenovo Legion 5 16IRX G9
Intel Core i7-14650HX
24455 Points +48%
HP Victus 16 (2024)
Intel Core i7-14700HX
23887 Points +45%
Asus ROG Zephyrus G16 GA605WV
AMD Ryzen AI 9 HX 370
22724 Points +38%
Average of class Gaming
  (5668 - 36249, n=187, last 2 years)
22019 Points +33%
Nubia RedMagic Titan 16 Pro
Intel Core i9-14900HX
17078 Points +3%
Acer Nitro V 16 ANV16-41-R5AT
AMD Ryzen 7 8845HS
16501 Points
Average AMD Ryzen 7 8845HS
  (14895 - 18037, n=11)
16146 Points -2%
Single Core
Nubia RedMagic Titan 16 Pro
Intel Core i9-14900HX
2165 Points +23%
Asus ROG Zephyrus G16 GA605WV
AMD Ryzen AI 9 HX 370
1973 Points +12%
Lenovo Legion 5 16IRX G9
Intel Core i7-14650HX
1963 Points +11%
Average of class Gaming
  (1136 - 2235, n=185, last 2 years)
1893 Points +7%
Acer Nitro V 16 ANV16-41-R5AT
AMD Ryzen 7 8845HS
1762 Points
Average AMD Ryzen 7 8845HS
  (1623 - 1783, n=11)
1747 Points -1%
HP Victus 16 (2024)
Intel Core i7-14700HX
1702 Points -3%
Cinebench R20
CPU (Multi Core)
Lenovo Legion 5 16IRX G9
Intel Core i7-14650HX
9349 Points +47%
HP Victus 16 (2024)
Intel Core i7-14700HX
9244 Points +45%
Asus ROG Zephyrus G16 GA605WV
AMD Ryzen AI 9 HX 370
8843 Points +39%
Average of class Gaming
  (2179 - 13832, n=185, last 2 years)
8379 Points +32%
Nubia RedMagic Titan 16 Pro
Intel Core i9-14900HX
6579 Points +3%
Acer Nitro V 16 ANV16-41-R5AT
AMD Ryzen 7 8845HS
6362 Points
Average AMD Ryzen 7 8845HS
  (5808 - 7026, n=11)
6309 Points -1%
CPU (Single Core)
Nubia RedMagic Titan 16 Pro
Intel Core i9-14900HX
826 Points +21%
Asus ROG Zephyrus G16 GA605WV
AMD Ryzen AI 9 HX 370
777 Points +13%
Lenovo Legion 5 16IRX G9
Intel Core i7-14650HX
754 Points +10%
Average of class Gaming
  (439 - 856, n=185, last 2 years)
727 Points +6%
Acer Nitro V 16 ANV16-41-R5AT
AMD Ryzen 7 8845HS
685 Points
Average AMD Ryzen 7 8845HS
  (673 - 698, n=11)
685 Points 0%
HP Victus 16 (2024)
Intel Core i7-14700HX
651 Points -5%
Cinebench R15
CPU Multi 64Bit
HP Victus 16 (2024)
Intel Core i7-14700HX
3812 Points +46%
Lenovo Legion 5 16IRX G9
Intel Core i7-14650HX
3799 (3409.19min - 3799.39max) Points +46%
Nubia RedMagic Titan 16 Pro
Intel Core i9-14900HX
3454 Points +33%
Average of class Gaming
  (905 - 5663, n=192, last 2 years)
3445 Points +32%
Asus ROG Zephyrus G16 GA605WV
AMD Ryzen AI 9 HX 370
3371 (3327.79min - 3370.98max) Points +30%
Acer Nitro V 16 ANV16-41-R5AT
AMD Ryzen 7 8845HS
2603 (2557.38min - 2602.64max) Points
Average AMD Ryzen 7 8845HS
  (2342 - 2908, n=11)
2556 Points -2%
CPU Single 64Bit
Nubia RedMagic Titan 16 Pro
Intel Core i9-14900HX
314 Points +14%
Asus ROG Zephyrus G16 GA605WV
AMD Ryzen AI 9 HX 370
303 Points +10%
Lenovo Legion 5 16IRX G9
Intel Core i7-14650HX
287 Points +4%
Average of class Gaming
  (191.9 - 318, n=189, last 2 years)
278 Points +1%
Average AMD Ryzen 7 8845HS
  (269 - 283, n=11)
276 Points 0%
Acer Nitro V 16 ANV16-41-R5AT
AMD Ryzen 7 8845HS
275 Points
HP Victus 16 (2024)
Intel Core i7-14700HX
238 Points -13%
Blender - v2.79 BMW27 CPU
Nubia RedMagic Titan 16 Pro
Intel Core i9-14900HX
206 Seconds * -7%
Average AMD Ryzen 7 8845HS
  (179 - 216, n=11)
202 Seconds * -5%
Acer Nitro V 16 ANV16-41-R5AT
AMD Ryzen 7 8845HS
193 Seconds *
HP Victus 16 (2024)
Intel Core i7-14700HX
173 Seconds * +10%
Average of class Gaming
  (87 - 555, n=180, last 2 years)
169 Seconds * +12%
Asus ROG Zephyrus G16 GA605WV
AMD Ryzen AI 9 HX 370
145 Seconds * +25%
Lenovo Legion 5 16IRX G9
Intel Core i7-14650HX
141 Seconds * +27%
7-Zip 18.03
7z b 4
Lenovo Legion 5 16IRX G9
Intel Core i7-14650HX
93686 MIPS +33%
Average of class Gaming
  (23795 - 140932, n=184, last 2 years)
85971 MIPS +22%
HP Victus 16 (2024)
Intel Core i7-14700HX
84799 MIPS +21%
Asus ROG Zephyrus G16 GA605WV
AMD Ryzen AI 9 HX 370
82463 MIPS +17%
Acer Nitro V 16 ANV16-41-R5AT
AMD Ryzen 7 8845HS
70193 MIPS
Average AMD Ryzen 7 8845HS
  (62669 - 74664, n=11)
67906 MIPS -3%
Nubia RedMagic Titan 16 Pro
Intel Core i9-14900HX
66769 MIPS -5%
7z b 4 -mmt1
Nubia RedMagic Titan 16 Pro
Intel Core i9-14900HX
7161 MIPS +8%
Lenovo Legion 5 16IRX G9
Intel Core i7-14650HX
6695 MIPS +1%
Acer Nitro V 16 ANV16-41-R5AT
AMD Ryzen 7 8845HS
6608 MIPS
Average of class Gaming
  (4199 - 7581, n=184, last 2 years)
6324 MIPS -4%
Average AMD Ryzen 7 8845HS
  (5197 - 6714, n=11)
6288 MIPS -5%
Asus ROG Zephyrus G16 GA605WV
AMD Ryzen AI 9 HX 370
6127 MIPS -7%
HP Victus 16 (2024)
Intel Core i7-14700HX
5641 MIPS -15%
Geekbench 6.3
Multi-Core
Lenovo Legion 5 16IRX G9
Intel Core i7-14650HX
16010 Points +30%
Asus ROG Zephyrus G16 GA605WV
AMD Ryzen AI 9 HX 370
15230 Points +24%
HP Victus 16 (2024)
Intel Core i7-14700HX
14807 Points +21%
Average of class Gaming
  (5340 - 19665, n=113, last 2 years)
14205 Points +16%
Nubia RedMagic Titan 16 Pro
Intel Core i9-14900HX
13158 Points +7%
Average AMD Ryzen 7 8845HS
  (11073 - 14014, n=15)
12791 Points +4%
Acer Nitro V 16 ANV16-41-R5AT
AMD Ryzen 7 8845HS
12277 Points
Single-Core
Nubia RedMagic Titan 16 Pro
Intel Core i9-14900HX
3036 Points +14%
Asus ROG Zephyrus G16 GA605WV
AMD Ryzen AI 9 HX 370
2875 Points +8%
Lenovo Legion 5 16IRX G9
Intel Core i7-14650HX
2761 Points +4%
Acer Nitro V 16 ANV16-41-R5AT
AMD Ryzen 7 8845HS
2654 Points
Average of class Gaming
  (1490 - 3129, n=113, last 2 years)
2649 Points 0%
Average AMD Ryzen 7 8845HS
  (2510 - 2698, n=13)
2617 Points -1%
HP Victus 16 (2024)
Intel Core i7-14700HX
2378 Points -10%
Geekbench 5.5
Multi-Core
Lenovo Legion 5 16IRX G9
Intel Core i7-14650HX
16810 Points +46%
HP Victus 16 (2024)
Intel Core i7-14700HX
16732 Points +45%
Average of class Gaming
  (4557 - 23194, n=185, last 2 years)
15135 Points +31%
Asus ROG Zephyrus G16 GA605WV
AMD Ryzen AI 9 HX 370
14774 Points +28%
Nubia RedMagic Titan 16 Pro
Intel Core i9-14900HX
14270 Points +24%
Average AMD Ryzen 7 8845HS
  (11256 - 12726, n=12)
11855 Points +3%
Acer Nitro V 16 ANV16-41-R5AT
AMD Ryzen 7 8845HS
11536 Points
Single-Core
Nubia RedMagic Titan 16 Pro
Intel Core i9-14900HX
2160 Points +9%
Asus ROG Zephyrus G16 GA605WV
AMD Ryzen AI 9 HX 370
2104 Points +6%
Acer Nitro V 16 ANV16-41-R5AT
AMD Ryzen 7 8845HS
1977 Points
Lenovo Legion 5 16IRX G9
Intel Core i7-14650HX
1933 Points -2%
Average AMD Ryzen 7 8845HS
  (1765 - 2004, n=12)
1924 Points -3%
Average of class Gaming
  (986 - 2210, n=185, last 2 years)
1899 Points -4%
HP Victus 16 (2024)
Intel Core i7-14700HX
1700 Points -14%
HWBOT x265 Benchmark v2.2 - 4k Preset
Asus ROG Zephyrus G16 GA605WV
AMD Ryzen AI 9 HX 370
26.5 fps +30%
Lenovo Legion 5 16IRX G9
Intel Core i7-14650HX
25.6 fps +25%
Average of class Gaming
  (6.72 - 38.9, n=184, last 2 years)
23.6 fps +16%
HP Victus 16 (2024)
Intel Core i7-14700HX
22 fps +8%
Acer Nitro V 16 ANV16-41-R5AT
AMD Ryzen 7 8845HS
20.4 fps
Average AMD Ryzen 7 8845HS
  (18.6 - 22.7, n=11)
20 fps -2%
Nubia RedMagic Titan 16 Pro
Intel Core i9-14900HX
16.8 fps -18%
LibreOffice - 20 Documents To PDF
HP Victus 16 (2024)
Intel Core i7-14700HX
55.3 s * -2%
Acer Nitro V 16 ANV16-41-R5AT
AMD Ryzen 7 8845HS
54.1 s *
Asus ROG Zephyrus G16 GA605WV
AMD Ryzen AI 9 HX 370
53.8 s * +1%
Average AMD Ryzen 7 8845HS
  (44.4 - 77, n=11)
51 s * +6%
Average of class Gaming
  (19 - 96.6, n=181, last 2 years)
47.3 s * +13%
Lenovo Legion 5 16IRX G9
Intel Core i7-14650HX
43.8 s * +19%
Nubia RedMagic Titan 16 Pro
Intel Core i9-14900HX
34 s * +37%
R Benchmark 2.5 - Overall mean
HP Victus 16 (2024)
Intel Core i7-14700HX
0.4896 sec * -14%
Average AMD Ryzen 7 8845HS
  (0.4304 - 0.4935, n=11)
0.4528 sec * -5%
Average of class Gaming
  (0.3609 - 0.759, n=185, last 2 years)
0.4362 sec * -1%
Acer Nitro V 16 ANV16-41-R5AT
AMD Ryzen 7 8845HS
0.4304 sec *
Lenovo Legion 5 16IRX G9
Intel Core i7-14650HX
0.4195 sec * +3%
Asus ROG Zephyrus G16 GA605WV
AMD Ryzen AI 9 HX 370
0.4111 sec * +4%
Nubia RedMagic Titan 16 Pro
Intel Core i9-14900HX
0.3699 sec * +14%

* ... smaller is better

Cinebench R15 CPU Multi 64Bit
2603 Points
Cinebench R15 OpenGL 64Bit
140.6 fps
Cinebench R15 Ref. Match 64Bit
99.6 %
Cinebench R15 CPU Single 64Bit
275 Points
Cinebench R20 CPU (Multi Core)
6362 Points
Cinebench R20 CPU (Single Core)
685 Points
Cinebench R23 Single Core
1762 Points
Cinebench R23 Multi Core
16501 Points
Yardım
Performance Rating - Percent
Asus ROG Zephyrus G16 GA605WV
AMD Ryzen AI 9 HX 370, NVIDIA GeForce RTX 4060 Laptop GPU
93.1 pt
Average of class Gaming
 
77.3 pt
Average AMD Ryzen 7 8845HS
 
76.4 pt
Acer Nitro V 16 ANV16-41-R5AT
AMD Ryzen 7 8845HS, NVIDIA GeForce RTX 4060 Laptop GPU
75.1 pt
Lenovo Legion 5 16IRX G9
Intel Core i7-14650HX, NVIDIA GeForce RTX 4060 Laptop GPU
67.1 pt
HP Victus 16 (2024)
Intel Core i7-14700HX, NVIDIA GeForce RTX 4060 Laptop GPU
66.3 pt
Nubia RedMagic Titan 16 Pro
Intel Core i9-14900HX, NVIDIA GeForce RTX 4060 Laptop GPU
59.7 pt
AIDA64
FP32 Ray-Trace
Asus ROG Zephyrus G16 GA605WV
AMD Ryzen AI 9 HX 370, NVIDIA GeForce RTX 4060 Laptop GPU
36304 KRay/s +37%
Acer Nitro V 16 ANV16-41-R5AT
AMD Ryzen 7 8845HS, NVIDIA GeForce RTX 4060 Laptop GPU
26479 KRay/s
Average AMD Ryzen 7 8845HS
  (23708 - 29544, n=11)
25839 KRay/s -2%
Average of class Gaming
  (4986 - 60169, n=181, last 2 years)
22026 KRay/s -17%
Lenovo Legion 5 16IRX G9
Intel Core i7-14650HX, NVIDIA GeForce RTX 4060 Laptop GPU
19044 KRay/s -28%
HP Victus 16 (2024)
Intel Core i7-14700HX, NVIDIA GeForce RTX 4060 Laptop GPU
16932 KRay/s -36%
Nubia RedMagic Titan 16 Pro
Intel Core i9-14900HX, NVIDIA GeForce RTX 4060 Laptop GPU
13098 KRay/s -51%
FPU Julia
Asus ROG Zephyrus G16 GA605WV
AMD Ryzen AI 9 HX 370, NVIDIA GeForce RTX 4060 Laptop GPU
138436 Points +23%
Acer Nitro V 16 ANV16-41-R5AT
AMD Ryzen 7 8845HS, NVIDIA GeForce RTX 4060 Laptop GPU
112213 Points
Average AMD Ryzen 7 8845HS
  (99659 - 125873, n=11)
109203 Points -3%
Average of class Gaming
  (25360 - 252486, n=181, last 2 years)
107276 Points -4%
Lenovo Legion 5 16IRX G9
Intel Core i7-14650HX, NVIDIA GeForce RTX 4060 Laptop GPU
95271 Points -15%
HP Victus 16 (2024)
Intel Core i7-14700HX, NVIDIA GeForce RTX 4060 Laptop GPU
86338 Points -23%
Nubia RedMagic Titan 16 Pro
Intel Core i9-14900HX, NVIDIA GeForce RTX 4060 Laptop GPU
67573 Points -40%
CPU SHA3
Asus ROG Zephyrus G16 GA605WV
AMD Ryzen AI 9 HX 370, NVIDIA GeForce RTX 4060 Laptop GPU
5696 MB/s +21%
Average of class Gaming
  (1339 - 10389, n=181, last 2 years)
4933 MB/s +5%
Average AMD Ryzen 7 8845HS
  (4332 - 5180, n=11)
4708 MB/s 0%
Acer Nitro V 16 ANV16-41-R5AT
AMD Ryzen 7 8845HS, NVIDIA GeForce RTX 4060 Laptop GPU
4701 MB/s
Lenovo Legion 5 16IRX G9
Intel Core i7-14650HX, NVIDIA GeForce RTX 4060 Laptop GPU
4214 MB/s -10%
HP Victus 16 (2024)
Intel Core i7-14700HX, NVIDIA GeForce RTX 4060 Laptop GPU
4008 MB/s -15%
Nubia RedMagic Titan 16 Pro
Intel Core i9-14900HX, NVIDIA GeForce RTX 4060 Laptop GPU
3589 MB/s -24%
CPU Queen
HP Victus 16 (2024)
Intel Core i7-14700HX, NVIDIA GeForce RTX 4060 Laptop GPU
129836 Points +9%
Nubia RedMagic Titan 16 Pro
Intel Core i9-14900HX, NVIDIA GeForce RTX 4060 Laptop GPU
123488 Points +4%
Acer Nitro V 16 ANV16-41-R5AT
AMD Ryzen 7 8845HS, NVIDIA GeForce RTX 4060 Laptop GPU
118943 Points
Average of class Gaming
  (50699 - 200651, n=181, last 2 years)
117382 Points -1%
Average AMD Ryzen 7 8845HS
  (109458 - 124695, n=11)
116188 Points -2%
Lenovo Legion 5 16IRX G9
Intel Core i7-14650HX, NVIDIA GeForce RTX 4060 Laptop GPU
101500 Points -15%
Asus ROG Zephyrus G16 GA605WV
AMD Ryzen AI 9 HX 370, NVIDIA GeForce RTX 4060 Laptop GPU
94289 Points -21%
FPU SinJulia
Asus ROG Zephyrus G16 GA605WV
AMD Ryzen AI 9 HX 370, NVIDIA GeForce RTX 4060 Laptop GPU
18867 Points +25%
Acer Nitro V 16 ANV16-41-R5AT
AMD Ryzen 7 8845HS, NVIDIA GeForce RTX 4060 Laptop GPU
15106 Points
Average AMD Ryzen 7 8845HS
  (14062 - 15519, n=11)
14859 Points -2%
Average of class Gaming
  (4800 - 32988, n=181, last 2 years)
13326 Points -12%
Lenovo Legion 5 16IRX G9
Intel Core i7-14650HX, NVIDIA GeForce RTX 4060 Laptop GPU
11913 Points -21%
HP Victus 16 (2024)
Intel Core i7-14700HX, NVIDIA GeForce RTX 4060 Laptop GPU
11704 Points -23%
Nubia RedMagic Titan 16 Pro
Intel Core i9-14900HX, NVIDIA GeForce RTX 4060 Laptop GPU
10475 Points -31%
FPU Mandel
Asus ROG Zephyrus G16 GA605WV
AMD Ryzen AI 9 HX 370, NVIDIA GeForce RTX 4060 Laptop GPU
74066 Points +23%
Acer Nitro V 16 ANV16-41-R5AT
AMD Ryzen 7 8845HS, NVIDIA GeForce RTX 4060 Laptop GPU
60105 Points
Average AMD Ryzen 7 8845HS
  (53436 - 67367, n=11)
58328 Points -3%
Average of class Gaming
  (12321 - 134044, n=181, last 2 years)
53979 Points -10%
Lenovo Legion 5 16IRX G9
Intel Core i7-14650HX, NVIDIA GeForce RTX 4060 Laptop GPU
47097 Points -22%
HP Victus 16 (2024)
Intel Core i7-14700HX, NVIDIA GeForce RTX 4060 Laptop GPU
42125 Points -30%
Nubia RedMagic Titan 16 Pro
Intel Core i9-14900HX, NVIDIA GeForce RTX 4060 Laptop GPU
32543 Points -46%
CPU AES
Nubia RedMagic Titan 16 Pro
Intel Core i9-14900HX, NVIDIA GeForce RTX 4060 Laptop GPU
136951 MB/s +101%
Average of class Gaming
  (19065 - 328679, n=181, last 2 years)
109221 MB/s +60%
Average AMD Ryzen 7 8845HS
  (64515 - 172642, n=11)
95038 MB/s +40%
Lenovo Legion 5 16IRX G9
Intel Core i7-14650HX, NVIDIA GeForce RTX 4060 Laptop GPU
86485 MB/s +27%
HP Victus 16 (2024)
Intel Core i7-14700HX, NVIDIA GeForce RTX 4060 Laptop GPU
82161 MB/s +21%
Asus ROG Zephyrus G16 GA605WV
AMD Ryzen AI 9 HX 370, NVIDIA GeForce RTX 4060 Laptop GPU
80186 MB/s +18%
Acer Nitro V 16 ANV16-41-R5AT
AMD Ryzen 7 8845HS, NVIDIA GeForce RTX 4060 Laptop GPU
68109 MB/s
CPU ZLib
Asus ROG Zephyrus G16 GA605WV
AMD Ryzen AI 9 HX 370, NVIDIA GeForce RTX 4060 Laptop GPU
1489 MB/s +39%
Average of class Gaming
  (373 - 2409, n=181, last 2 years)
1373 MB/s +28%
Lenovo Legion 5 16IRX G9
Intel Core i7-14650HX, NVIDIA GeForce RTX 4060 Laptop GPU
1289 MB/s +20%
HP Victus 16 (2024)
Intel Core i7-14700HX, NVIDIA GeForce RTX 4060 Laptop GPU
1177 MB/s +9%
Acer Nitro V 16 ANV16-41-R5AT
AMD Ryzen 7 8845HS, NVIDIA GeForce RTX 4060 Laptop GPU
1075 MB/s
Nubia RedMagic Titan 16 Pro
Intel Core i9-14900HX, NVIDIA GeForce RTX 4060 Laptop GPU
1054 MB/s -2%
Average AMD Ryzen 7 8845HS
  (627 - 1080, n=11)
979 MB/s -9%
FP64 Ray-Trace
Asus ROG Zephyrus G16 GA605WV
AMD Ryzen AI 9 HX 370, NVIDIA GeForce RTX 4060 Laptop GPU
19629 KRay/s +39%
Acer Nitro V 16 ANV16-41-R5AT
AMD Ryzen 7 8845HS, NVIDIA GeForce RTX 4060 Laptop GPU
14146 KRay/s
Average AMD Ryzen 7 8845HS
  (12361 - 15911, n=11)
13740 KRay/s -3%
Average of class Gaming
  (2540 - 31796, n=181, last 2 years)
11862 KRay/s -16%
Lenovo Legion 5 16IRX G9
Intel Core i7-14650HX, NVIDIA GeForce RTX 4060 Laptop GPU
10316 KRay/s -27%
HP Victus 16 (2024)
Intel Core i7-14700HX, NVIDIA GeForce RTX 4060 Laptop GPU
9029 KRay/s -36%
Nubia RedMagic Titan 16 Pro
Intel Core i9-14900HX, NVIDIA GeForce RTX 4060 Laptop GPU
6809 KRay/s -52%
CPU PhotoWorxx
Asus ROG Zephyrus G16 GA605WV
AMD Ryzen AI 9 HX 370, NVIDIA GeForce RTX 4060 Laptop GPU
49354 MPixel/s +49%
Average of class Gaming
  (10805 - 60161, n=182, last 2 years)
40511 MPixel/s +22%
HP Victus 16 (2024)
Intel Core i7-14700HX, NVIDIA GeForce RTX 4060 Laptop GPU
39448 MPixel/s +19%
Average AMD Ryzen 7 8845HS
  (33192 - 41668, n=11)
38987 MPixel/s +17%
Lenovo Legion 5 16IRX G9
Intel Core i7-14650HX, NVIDIA GeForce RTX 4060 Laptop GPU
33763 MPixel/s +2%
Acer Nitro V 16 ANV16-41-R5AT
AMD Ryzen 7 8845HS, NVIDIA GeForce RTX 4060 Laptop GPU
33192 MPixel/s
Nubia RedMagic Titan 16 Pro
Intel Core i9-14900HX, NVIDIA GeForce RTX 4060 Laptop GPU
23970 MPixel/s -28%

Sistem performansı

Sistem performansı açısından Nitro V 16, HP Victus 16'nın hemen önünde sondan bir önceki sıraya yerleşti; ancak diğer karşılaştırma cihazlarıyla arasındaki farklar çok büyük değildi. Öznel olarak dizüstü bilgisayar güzel ve hızlı çalışıyor ve tepki veriyor.

PCMark 10 / Score
Average AMD Ryzen 7 8845HS, NVIDIA GeForce RTX 4060 Laptop GPU
  (7538 - 8822, n=2)
8180 Points +9%
Asus ROG Zephyrus G16 GA605WV
NVIDIA GeForce RTX 4060 Laptop GPU, Ryzen AI 9 HX 370, Micron 2400 MTFDKBA1T0QFM
7915 Points +5%
Nubia RedMagic Titan 16 Pro
NVIDIA GeForce RTX 4060 Laptop GPU, i9-14900HX, Samsung PM9A1 MZVL21T0HCLR
7830 Points +4%
Average of class Gaming
  (5776 - 9852, n=163, last 2 years)
7825 Points +4%
Lenovo Legion 5 16IRX G9
NVIDIA GeForce RTX 4060 Laptop GPU, i7-14650HX, Samsung PM9A1 MZVL21T0HCLR
7645 Points +1%
Acer Nitro V 16 ANV16-41-R5AT
NVIDIA GeForce RTX 4060 Laptop GPU, R7 8845HS, Micron 2550 1TB
7538 Points
HP Victus 16 (2024)
NVIDIA GeForce RTX 4060 Laptop GPU, i7-14700HX, Kioxia XG8 KXG80ZNV512G
7528 Points 0%
PCMark 10 / Essentials
Nubia RedMagic Titan 16 Pro
NVIDIA GeForce RTX 4060 Laptop GPU, i9-14900HX, Samsung PM9A1 MZVL21T0HCLR
11022 Points +11%
Average of class Gaming
  (9057 - 12600, n=162, last 2 years)
10842 Points +9%
Lenovo Legion 5 16IRX G9
NVIDIA GeForce RTX 4060 Laptop GPU, i7-14650HX, Samsung PM9A1 MZVL21T0HCLR
10804 Points +9%
HP Victus 16 (2024)
NVIDIA GeForce RTX 4060 Laptop GPU, i7-14700HX, Kioxia XG8 KXG80ZNV512G
10778 Points +8%
Asus ROG Zephyrus G16 GA605WV
NVIDIA GeForce RTX 4060 Laptop GPU, Ryzen AI 9 HX 370, Micron 2400 MTFDKBA1T0QFM
10140 Points +2%
Average AMD Ryzen 7 8845HS, NVIDIA GeForce RTX 4060 Laptop GPU
  (9936 - 10061, n=2)
9999 Points +1%
Acer Nitro V 16 ANV16-41-R5AT
NVIDIA GeForce RTX 4060 Laptop GPU, R7 8845HS, Micron 2550 1TB
9936 Points
PCMark 10 / Productivity
Average AMD Ryzen 7 8845HS, NVIDIA GeForce RTX 4060 Laptop GPU
  (9789 - 14612, n=2)
12201 Points +25%
Asus ROG Zephyrus G16 GA605WV
NVIDIA GeForce RTX 4060 Laptop GPU, Ryzen AI 9 HX 370, Micron 2400 MTFDKBA1T0QFM
9971 Points +2%
Average of class Gaming
  (6662 - 14612, n=162, last 2 years)
9918 Points +1%
HP Victus 16 (2024)
NVIDIA GeForce RTX 4060 Laptop GPU, i7-14700HX, Kioxia XG8 KXG80ZNV512G
9910 Points +1%
Acer Nitro V 16 ANV16-41-R5AT
NVIDIA GeForce RTX 4060 Laptop GPU, R7 8845HS, Micron 2550 1TB
9789 Points
Nubia RedMagic Titan 16 Pro
NVIDIA GeForce RTX 4060 Laptop GPU, i9-14900HX, Samsung PM9A1 MZVL21T0HCLR
9776 Points 0%
Lenovo Legion 5 16IRX G9
NVIDIA GeForce RTX 4060 Laptop GPU, i7-14650HX, Samsung PM9A1 MZVL21T0HCLR
9241 Points -6%
PCMark 10 / Digital Content Creation
Asus ROG Zephyrus G16 GA605WV
NVIDIA GeForce RTX 4060 Laptop GPU, Ryzen AI 9 HX 370, Micron 2400 MTFDKBA1T0QFM
13309 Points +11%
Average AMD Ryzen 7 8845HS, NVIDIA GeForce RTX 4060 Laptop GPU
  (11953 - 12674, n=2)
12314 Points +3%
Average of class Gaming
  (6807 - 18475, n=162, last 2 years)
12205 Points +2%
Lenovo Legion 5 16IRX G9
NVIDIA GeForce RTX 4060 Laptop GPU, i7-14650HX, Samsung PM9A1 MZVL21T0HCLR
12144 Points +2%
Nubia RedMagic Titan 16 Pro
NVIDIA GeForce RTX 4060 Laptop GPU, i9-14900HX, Samsung PM9A1 MZVL21T0HCLR
12091 Points +1%
Acer Nitro V 16 ANV16-41-R5AT
NVIDIA GeForce RTX 4060 Laptop GPU, R7 8845HS, Micron 2550 1TB
11953 Points
HP Victus 16 (2024)
NVIDIA GeForce RTX 4060 Laptop GPU, i7-14700HX, Kioxia XG8 KXG80ZNV512G
10841 Points -9%
CrossMark / Overall
Nubia RedMagic Titan 16 Pro
NVIDIA GeForce RTX 4060 Laptop GPU, i9-14900HX, Samsung PM9A1 MZVL21T0HCLR
2103 Points
Lenovo Legion 5 16IRX G9
NVIDIA GeForce RTX 4060 Laptop GPU, i7-14650HX, Samsung PM9A1 MZVL21T0HCLR
2092 Points
HP Victus 16 (2024)
NVIDIA GeForce RTX 4060 Laptop GPU, i7-14700HX, Kioxia XG8 KXG80ZNV512G
1923 Points
Average of class Gaming
  (1247 - 2344, n=143, last 2 years)
1915 Points
Average AMD Ryzen 7 8845HS, NVIDIA GeForce RTX 4060 Laptop GPU
  ()
1889 Points
Asus ROG Zephyrus G16 GA605WV
NVIDIA GeForce RTX 4060 Laptop GPU, Ryzen AI 9 HX 370, Micron 2400 MTFDKBA1T0QFM
1819 Points
CrossMark / Productivity
Nubia RedMagic Titan 16 Pro
NVIDIA GeForce RTX 4060 Laptop GPU, i9-14900HX, Samsung PM9A1 MZVL21T0HCLR
2042 Points
Lenovo Legion 5 16IRX G9
NVIDIA GeForce RTX 4060 Laptop GPU, i7-14650HX, Samsung PM9A1 MZVL21T0HCLR
1938 Points
Average of class Gaming
  (1299 - 2204, n=143, last 2 years)
1813 Points
Average AMD Ryzen 7 8845HS, NVIDIA GeForce RTX 4060 Laptop GPU
  ()
1789 Points
HP Victus 16 (2024)
NVIDIA GeForce RTX 4060 Laptop GPU, i7-14700HX, Kioxia XG8 KXG80ZNV512G
1782 Points
Asus ROG Zephyrus G16 GA605WV
NVIDIA GeForce RTX 4060 Laptop GPU, Ryzen AI 9 HX 370, Micron 2400 MTFDKBA1T0QFM
1637 Points
CrossMark / Creativity
Lenovo Legion 5 16IRX G9
NVIDIA GeForce RTX 4060 Laptop GPU, i7-14650HX, Samsung PM9A1 MZVL21T0HCLR
2336 Points
Asus ROG Zephyrus G16 GA605WV
NVIDIA GeForce RTX 4060 Laptop GPU, Ryzen AI 9 HX 370, Micron 2400 MTFDKBA1T0QFM
2264 Points
Nubia RedMagic Titan 16 Pro
NVIDIA GeForce RTX 4060 Laptop GPU, i9-14900HX, Samsung PM9A1 MZVL21T0HCLR
2240 Points
HP Victus 16 (2024)
NVIDIA GeForce RTX 4060 Laptop GPU, i7-14700HX, Kioxia XG8 KXG80ZNV512G
2107 Points
Average of class Gaming
  (1275 - 2660, n=143, last 2 years)
2104 Points
Average AMD Ryzen 7 8845HS, NVIDIA GeForce RTX 4060 Laptop GPU
  ()
2102 Points
CrossMark / Responsiveness
Nubia RedMagic Titan 16 Pro
NVIDIA GeForce RTX 4060 Laptop GPU, i9-14900HX, Samsung PM9A1 MZVL21T0HCLR
1899 Points
Lenovo Legion 5 16IRX G9
NVIDIA GeForce RTX 4060 Laptop GPU, i7-14650HX, Samsung PM9A1 MZVL21T0HCLR
1889 Points
HP Victus 16 (2024)
NVIDIA GeForce RTX 4060 Laptop GPU, i7-14700HX, Kioxia XG8 KXG80ZNV512G
1835 Points
Average of class Gaming
  (1030 - 2330, n=143, last 2 years)
1711 Points
Average AMD Ryzen 7 8845HS, NVIDIA GeForce RTX 4060 Laptop GPU
  ()
1613 Points
Asus ROG Zephyrus G16 GA605WV
NVIDIA GeForce RTX 4060 Laptop GPU, Ryzen AI 9 HX 370, Micron 2400 MTFDKBA1T0QFM
1293 Points
WebXPRT 3 / Overall
Nubia RedMagic Titan 16 Pro
NVIDIA GeForce RTX 4060 Laptop GPU, i9-14900HX, Samsung PM9A1 MZVL21T0HCLR
329 Points +8%
Lenovo Legion 5 16IRX G9
NVIDIA GeForce RTX 4060 Laptop GPU, i7-14650HX, Samsung PM9A1 MZVL21T0HCLR
311 Points +2%
Acer Nitro V 16 ANV16-41-R5AT
NVIDIA GeForce RTX 4060 Laptop GPU, R7 8845HS, Micron 2550 1TB
305 Points
Average AMD Ryzen 7 8845HS, NVIDIA GeForce RTX 4060 Laptop GPU
  (305 - 305, n=2)
305 Points 0%
Average of class Gaming
  (215 - 480, n=160, last 2 years)
304 Points 0%
HP Victus 16 (2024)
NVIDIA GeForce RTX 4060 Laptop GPU, i7-14700HX, Kioxia XG8 KXG80ZNV512G
276 Points -10%
WebXPRT 4 / Overall
Nubia RedMagic Titan 16 Pro
NVIDIA GeForce RTX 4060 Laptop GPU, i9-14900HX, Samsung PM9A1 MZVL21T0HCLR
309 Points +75%
Lenovo Legion 5 16IRX G9
NVIDIA GeForce RTX 4060 Laptop GPU, i7-14650HX, Samsung PM9A1 MZVL21T0HCLR
283 Points +60%
Average of class Gaming
  (176.4 - 328, n=149, last 2 years)
268 Points +52%
Asus ROG Zephyrus G16 GA605WV
NVIDIA GeForce RTX 4060 Laptop GPU, Ryzen AI 9 HX 370, Micron 2400 MTFDKBA1T0QFM
259 Points +47%
HP Victus 16 (2024)
NVIDIA GeForce RTX 4060 Laptop GPU, i7-14700HX, Kioxia XG8 KXG80ZNV512G
251 Points +42%
Average AMD Ryzen 7 8845HS, NVIDIA GeForce RTX 4060 Laptop GPU
  (176.4 - 264, n=2)
220 Points +25%
Acer Nitro V 16 ANV16-41-R5AT
NVIDIA GeForce RTX 4060 Laptop GPU, R7 8845HS, Micron 2550 1TB
176.4 Points
Mozilla Kraken 1.1 / Total
HP Victus 16 (2024)
NVIDIA GeForce RTX 4060 Laptop GPU, i7-14700HX, Kioxia XG8 KXG80ZNV512G
542 ms * -4%
Acer Nitro V 16 ANV16-41-R5AT
NVIDIA GeForce RTX 4060 Laptop GPU, R7 8845HS, Micron 2550 1TB
523 ms *
Average AMD Ryzen 7 8845HS, NVIDIA GeForce RTX 4060 Laptop GPU
  (496 - 523, n=2)
510 ms * +2%
Average of class Gaming
  (421 - 674, n=175, last 2 years)
502 ms * +4%
Lenovo Legion 5 16IRX G9
NVIDIA GeForce RTX 4060 Laptop GPU, i7-14650HX, Samsung PM9A1 MZVL21T0HCLR
486 ms * +7%
Nubia RedMagic Titan 16 Pro
NVIDIA GeForce RTX 4060 Laptop GPU, i9-14900HX, Samsung PM9A1 MZVL21T0HCLR
439 ms * +16%
Asus ROG Zephyrus G16 GA605WV
NVIDIA GeForce RTX 4060 Laptop GPU, Ryzen AI 9 HX 370, Micron 2400 MTFDKBA1T0QFM
434 ms * +17%

* ... smaller is better

PCMark 10 Score
7538 puan
Yardım
AIDA64 / Memory Copy
Asus ROG Zephyrus G16 GA605WV
AMD Ryzen AI 9 HX 370, NVIDIA GeForce RTX 4060 Laptop GPU
89564 MB/s +44%
Average AMD Ryzen 7 8845HS
  (61459 - 71873, n=11)
67394 MB/s +8%
HP Victus 16 (2024)
Intel Core i7-14700HX, NVIDIA GeForce RTX 4060 Laptop GPU
66599 MB/s +7%
Average of class Gaming
  (21842 - 94222, n=181, last 2 years)
65865 MB/s +6%
Acer Nitro V 16 ANV16-41-R5AT
AMD Ryzen 7 8845HS, NVIDIA GeForce RTX 4060 Laptop GPU
62270 MB/s
Lenovo Legion 5 16IRX G9
Intel Core i7-14650HX, NVIDIA GeForce RTX 4060 Laptop GPU
59727 MB/s -4%
Nubia RedMagic Titan 16 Pro
Intel Core i9-14900HX, NVIDIA GeForce RTX 4060 Laptop GPU
43236 MB/s -31%
AIDA64 / Memory Read
Asus ROG Zephyrus G16 GA605WV
AMD Ryzen AI 9 HX 370, NVIDIA GeForce RTX 4060 Laptop GPU
99713 MB/s +64%
HP Victus 16 (2024)
Intel Core i7-14700HX, NVIDIA GeForce RTX 4060 Laptop GPU
81049 MB/s +33%
Lenovo Legion 5 16IRX G9
Intel Core i7-14650HX, NVIDIA GeForce RTX 4060 Laptop GPU
71455 MB/s +18%
Average of class Gaming
  (23681 - 99713, n=181, last 2 years)
69737 MB/s +15%
Acer Nitro V 16 ANV16-41-R5AT
AMD Ryzen 7 8845HS, NVIDIA GeForce RTX 4060 Laptop GPU
60784 MB/s
Average AMD Ryzen 7 8845HS
  (49866 - 61976, n=11)
58208 MB/s -4%
Nubia RedMagic Titan 16 Pro
Intel Core i9-14900HX, NVIDIA GeForce RTX 4060 Laptop GPU
47588 MB/s -22%
AIDA64 / Memory Write
Asus ROG Zephyrus G16 GA605WV
AMD Ryzen AI 9 HX 370, NVIDIA GeForce RTX 4060 Laptop GPU
98802 MB/s +27%
Average AMD Ryzen 7 8845HS
  (68425 - 93239, n=11)
85626 MB/s +10%
Acer Nitro V 16 ANV16-41-R5AT
AMD Ryzen 7 8845HS, NVIDIA GeForce RTX 4060 Laptop GPU
78054 MB/s
Average of class Gaming
  (22986 - 108954, n=181, last 2 years)
67587 MB/s -13%
HP Victus 16 (2024)
Intel Core i7-14700HX, NVIDIA GeForce RTX 4060 Laptop GPU
65204 MB/s -16%
Lenovo Legion 5 16IRX G9
Intel Core i7-14650HX, NVIDIA GeForce RTX 4060 Laptop GPU
51138 MB/s -34%
Nubia RedMagic Titan 16 Pro
Intel Core i9-14900HX, NVIDIA GeForce RTX 4060 Laptop GPU
39011 MB/s -50%
AIDA64 / Memory Latency
Asus ROG Zephyrus G16 GA605WV
AMD Ryzen AI 9 HX 370, NVIDIA GeForce RTX 4060 Laptop GPU
114.2 ns * -31%
Average AMD Ryzen 7 8845HS
  (82.5 - 117, n=11)
96.9 ns * -11%
HP Victus 16 (2024)
Intel Core i7-14700HX, NVIDIA GeForce RTX 4060 Laptop GPU
96.4 ns * -10%
Average of class Gaming
  (59.5 - 259, n=181, last 2 years)
94.1 ns * -8%
Lenovo Legion 5 16IRX G9
Intel Core i7-14650HX, NVIDIA GeForce RTX 4060 Laptop GPU
89.8 ns * -3%
Acer Nitro V 16 ANV16-41-R5AT
AMD Ryzen 7 8845HS, NVIDIA GeForce RTX 4060 Laptop GPU
87.5 ns *
Nubia RedMagic Titan 16 Pro
Intel Core i9-14900HX, NVIDIA GeForce RTX 4060 Laptop GPU
79.7 ns * +9%

* ... smaller is better

DPC gecikme süreleri

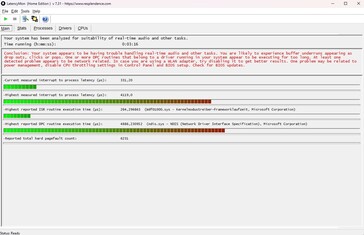
Gecikme, 16 inçlik cihazın güçlü bir noktası değildir. LatencyMon aracı, V 16'nın gerçek zamanlı ve diğer alanlarda ses işleme ile ilgili sorunları olabileceğini doğruladı. Karşılaştırma alanında sadece Zephyrus G16 başarılı oldu.

LatencyMon
LatencyMon
DPC Latencies / LatencyMon - interrupt to process latency (max), Web, Youtube, Prime95
Acer Nitro V 16 ANV16-41-R5AT
NVIDIA GeForce RTX 4060 Laptop GPU, R7 8845HS, Micron 2550 1TB
4119 μs *
Nubia RedMagic Titan 16 Pro
NVIDIA GeForce RTX 4060 Laptop GPU, i9-14900HX, Samsung PM9A1 MZVL21T0HCLR
2500.7 μs * +39%
Lenovo Legion 5 16IRX G9
NVIDIA GeForce RTX 4060 Laptop GPU, i7-14650HX, Samsung PM9A1 MZVL21T0HCLR
2024.9 μs * +51%
HP Victus 16 (2024)
NVIDIA GeForce RTX 4060 Laptop GPU, i7-14700HX, Kioxia XG8 KXG80ZNV512G
853.9 μs * +79%
Asus ROG Zephyrus G16 GA605WV
NVIDIA GeForce RTX 4060 Laptop GPU, Ryzen AI 9 HX 370, Micron 2400 MTFDKBA1T0QFM
566.1 μs * +86%

* ... smaller is better

Depolama cihazı

Acer, Micron 2550 gibi sağlam bir NVMe SSD tercih etmiştir. Okuma ya da yazma sırasında ne yavaş ne de özellikle hızlıdır. DiskSpd kullanılarak yapılan uzun vadeli testte, uzun vadede bazı küçük düşüşler gözlemledik, ancak SSD performansı diğer cihazlarda önemli ölçüde daha fazla dalgalandı veya çok daha fazla düştü (örn Lenovo Legion 5 ve HP Victus 16).

Micron 2550 1TB
CDM 5/6 Read Seq Q32T1: 4809 MB/s
CDM 5/6 Write Seq Q32T1: 2218 MB/s
CDM 5/6 Read 4K Q32T1: 581.6 MB/s
CDM 5/6 Write 4K Q32T1: 339.6 MB/s
CDM 5 Read Seq: 2116 MB/s
CDM 5 Write Seq: 2312 MB/s
CDM 5/6 Read 4K: 51.26 MB/s
CDM 5/6 Write 4K: 270.2 MB/s
Drive Performance Rating - Percent
Lenovo Legion 5 16IRX G9
Samsung PM9A1 MZVL21T0HCLR
95 pt
Nubia RedMagic Titan 16 Pro
Samsung PM9A1 MZVL21T0HCLR
90 pt
HP Victus 16 (2024)
Kioxia XG8 KXG80ZNV512G
80.4 pt
Average of class Gaming
 
79.5 pt
Acer Nitro V 16 ANV16-41-R5AT
Micron 2550 1TB
64.1 pt
Average Micron 2550 1TB
 
58.7 pt
Asus ROG Zephyrus G16 GA605WV
Micron 2400 MTFDKBA1T0QFM
46.8 pt
DiskSpd
seq read
Lenovo Legion 5 16IRX G9
Samsung PM9A1 MZVL21T0HCLR
4182 (4112.68min - 4181.96max) MB/s +93%
Nubia RedMagic Titan 16 Pro
Samsung PM9A1 MZVL21T0HCLR
3795 (3728.41min - 3794.55max) MB/s +75%
Average of class Gaming
  (1319 - 7045, n=163, last 2 years)
3475 MB/s +61%
HP Victus 16 (2024)
Kioxia XG8 KXG80ZNV512G
3469 (3344.35min - 3469.11max) MB/s +60%
Average Micron 2550 1TB
  (2165 - 2799, n=4)
2631 MB/s +22%
Asus ROG Zephyrus G16 GA605WV
Micron 2400 MTFDKBA1T0QFM
2267 (2202.85min - 2267.15max) MB/s +5%
Acer Nitro V 16 ANV16-41-R5AT
Micron 2550 1TB
2165 (2154.82min - 2165.1max) MB/s
seq write
Lenovo Legion 5 16IRX G9
Samsung PM9A1 MZVL21T0HCLR
4064 (3527.07min - 4064.49max) MB/s +26%
HP Victus 16 (2024)
Kioxia XG8 KXG80ZNV512G
3895 (3747.67min - 3894.8max) MB/s +21%
Average of class Gaming
  (535 - 9307, n=163, last 2 years)
3827 MB/s +19%
Nubia RedMagic Titan 16 Pro
Samsung PM9A1 MZVL21T0HCLR
3625 (3598.44min - 3624.51max) MB/s +13%
Average Micron 2550 1TB
  (3150 - 3470, n=4)
3302 MB/s +3%
Acer Nitro V 16 ANV16-41-R5AT
Micron 2550 1TB
3219 (533.93min - 3218.71max) MB/s
Asus ROG Zephyrus G16 GA605WV
Micron 2400 MTFDKBA1T0QFM
2542 (2385.77min - 2541.75max) MB/s -21%
seq q8 t1 read
HP Victus 16 (2024)
Kioxia XG8 KXG80ZNV512G
6933 (6552.34min - 6933.16max) MB/s +41%
Nubia RedMagic Titan 16 Pro
Samsung PM9A1 MZVL21T0HCLR
6654 (5651.22min - 6654.47max) MB/s +35%
Lenovo Legion 5 16IRX G9
Samsung PM9A1 MZVL21T0HCLR
6651 (5971.64min - 6651.33max) MB/s +35%
Average of class Gaming
  (2594 - 16089, n=163, last 2 years)
6317 MB/s +29%
Average Micron 2550 1TB
  (4912 - 5200, n=4)
5122 MB/s +4%
Asus ROG Zephyrus G16 GA605WV
Micron 2400 MTFDKBA1T0QFM
4946 (3626.31min - 4945.75max) MB/s +1%
Acer Nitro V 16 ANV16-41-R5AT
Micron 2550 1TB
4912 (3899.82min - 4911.74max) MB/s
seq q8 t1 write
Nubia RedMagic Titan 16 Pro
Samsung PM9A1 MZVL21T0HCLR
4990 (4969.33min - 4989.54max) MB/s +124%
Lenovo Legion 5 16IRX G9
Samsung PM9A1 MZVL21T0HCLR
4952 (4919.08min - 4952.42max) MB/s +123%
Average of class Gaming
  (539 - 14571, n=163, last 2 years)
4866 MB/s +119%
HP Victus 16 (2024)
Kioxia XG8 KXG80ZNV512G
4392 (3922.93min - 4391.65max) MB/s +97%
Average Micron 2550 1TB
  (2225 - 4612, n=4)
3983 MB/s +79%
Asus ROG Zephyrus G16 GA605WV
Micron 2400 MTFDKBA1T0QFM
3387 (3154.75min - 3386.9max) MB/s +52%
Acer Nitro V 16 ANV16-41-R5AT
Micron 2550 1TB
2225 (711.19min - 2225.08max) MB/s
4k q1 t1 read
Lenovo Legion 5 16IRX G9
Samsung PM9A1 MZVL21T0HCLR
83.9 (83.66min - 83.86max) MB/s +64%
Nubia RedMagic Titan 16 Pro
Samsung PM9A1 MZVL21T0HCLR
66.2 (61.1min - 66.24max) MB/s +29%
Average of class Gaming
  (30.6 - 95.9, n=163, last 2 years)
65.9 MB/s +29%
Average Micron 2550 1TB
  (51.2 - 78.1, n=4)
63.5 MB/s +24%
Acer Nitro V 16 ANV16-41-R5AT
Micron 2550 1TB
51.2 (50.26min - 51.15max) MB/s
HP Victus 16 (2024)
Kioxia XG8 KXG80ZNV512G
46.2 (45.32min - 46.24max) MB/s -10%
Asus ROG Zephyrus G16 GA605WV
Micron 2400 MTFDKBA1T0QFM
40.3 (40.03min - 40.33max) MB/s -21%
4k q1 t1 write
Acer Nitro V 16 ANV16-41-R5AT
Micron 2550 1TB
273 (270.95min - 273.28max) MB/s
HP Victus 16 (2024)
Kioxia XG8 KXG80ZNV512G
251 (249.24min - 250.87max) MB/s -8%
Lenovo Legion 5 16IRX G9
Samsung PM9A1 MZVL21T0HCLR
246 (236.18min - 245.56max) MB/s -10%
Nubia RedMagic Titan 16 Pro
Samsung PM9A1 MZVL21T0HCLR
241 (231.88min - 240.59max) MB/s -12%
Average of class Gaming
  (78 - 397, n=163, last 2 years)
223 MB/s -18%
Average Micron 2550 1TB
  (141.2 - 273, n=4)
178.7 MB/s -35%
Asus ROG Zephyrus G16 GA605WV
Micron 2400 MTFDKBA1T0QFM
93.9 (77.46min - 93.94max) MB/s -66%
4k q32 t16 read
Lenovo Legion 5 16IRX G9
Samsung PM9A1 MZVL21T0HCLR
4010 (4002.81min - 4009.85max) MB/s +466%
Nubia RedMagic Titan 16 Pro
Samsung PM9A1 MZVL21T0HCLR
3822 (3797.23min - 3821.59max) MB/s +439%
HP Victus 16 (2024)
Kioxia XG8 KXG80ZNV512G
3330 (3310.23min - 3329.64max) MB/s +370%
Average of class Gaming
  (417 - 6172, n=163, last 2 years)
2587 MB/s +265%
Acer Nitro V 16 ANV16-41-R5AT
Micron 2550 1TB
709 (708.4min - 709.45max) MB/s
Asus ROG Zephyrus G16 GA605WV
Micron 2400 MTFDKBA1T0QFM
550 (536.5min - 549.61max) MB/s -22%
Average Micron 2550 1TB
  (416 - 709, n=4)
532 MB/s -25%
4k q32 t16 write
Nubia RedMagic Titan 16 Pro
Samsung PM9A1 MZVL21T0HCLR
3539 (3004.21min - 3539.13max) MB/s +94%
Lenovo Legion 5 16IRX G9
Samsung PM9A1 MZVL21T0HCLR
2646 (2422.02min - 2645.88max) MB/s +45%
HP Victus 16 (2024)
Kioxia XG8 KXG80ZNV512G
2405 (937.07min - 2405.2max) MB/s +32%
Average of class Gaming
  (162.3 - 4869, n=163, last 2 years)
2141 MB/s +17%
Acer Nitro V 16 ANV16-41-R5AT
Micron 2550 1TB
1824 (254.66min - 1823.53max) MB/s
Average Micron 2550 1TB
  (350 - 1824, n=4)
727 MB/s -60%
Asus ROG Zephyrus G16 GA605WV
Micron 2400 MTFDKBA1T0QFM
313 (297.37min - 312.94max) MB/s -83%
AS SSD
Score Total
Lenovo Legion 5 16IRX G9
Samsung PM9A1 MZVL21T0HCLR
8677 Points +95%
Nubia RedMagic Titan 16 Pro
Samsung PM9A1 MZVL21T0HCLR
8192 Points +84%
HP Victus 16 (2024)
Kioxia XG8 KXG80ZNV512G
7423 Points +67%
Average of class Gaming
  (2271 - 13854, n=155, last 2 years)
6753 Points +52%
Acer Nitro V 16 ANV16-41-R5AT
Micron 2550 1TB
4451 Points
Average Micron 2550 1TB
  (3379 - 4613, n=4)
3979 Points -11%
Asus ROG Zephyrus G16 GA605WV
Micron 2400 MTFDKBA1T0QFM
3564 Points -20%
Score Read
Lenovo Legion 5 16IRX G9
Samsung PM9A1 MZVL21T0HCLR
3242 Points +116%
Nubia RedMagic Titan 16 Pro
Samsung PM9A1 MZVL21T0HCLR
3136 Points +109%
HP Victus 16 (2024)
Kioxia XG8 KXG80ZNV512G
3007 Points +100%
Average of class Gaming
  (776 - 4721, n=155, last 2 years)
2448 Points +63%
Acer Nitro V 16 ANV16-41-R5AT
Micron 2550 1TB
1500 Points
Average Micron 2550 1TB
  (1001 - 1500, n=4)
1207 Points -20%
Asus ROG Zephyrus G16 GA605WV
Micron 2400 MTFDKBA1T0QFM
954 Points -36%
Score Write
Lenovo Legion 5 16IRX G9
Samsung PM9A1 MZVL21T0HCLR
3846 Points +77%
Nubia RedMagic Titan 16 Pro
Samsung PM9A1 MZVL21T0HCLR
3524 Points +62%
Average of class Gaming
  (515 - 7208, n=155, last 2 years)
3116 Points +44%
HP Victus 16 (2024)
Kioxia XG8 KXG80ZNV512G
2919 Points +34%
Average Micron 2550 1TB
  (1912 - 2763, n=4)
2194 Points +1%
Asus ROG Zephyrus G16 GA605WV
Micron 2400 MTFDKBA1T0QFM
2185 Points +1%
Acer Nitro V 16 ANV16-41-R5AT
Micron 2550 1TB
2171 Points
Seq Read
Lenovo Legion 5 16IRX G9
Samsung PM9A1 MZVL21T0HCLR
5413 MB/s +26%
HP Victus 16 (2024)
Kioxia XG8 KXG80ZNV512G
5247.63 MB/s +22%
Nubia RedMagic Titan 16 Pro
Samsung PM9A1 MZVL21T0HCLR
5097.01 MB/s +19%
Average of class Gaming
  (2260 - 12763, n=155, last 2 years)
4953 MB/s +15%
Acer Nitro V 16 ANV16-41-R5AT
Micron 2550 1TB
4290.67 MB/s
Average Micron 2550 1TB
  (4005 - 4291, n=4)
4095 MB/s -5%
Asus ROG Zephyrus G16 GA605WV
Micron 2400 MTFDKBA1T0QFM
3863 MB/s -10%
Seq Write
HP Victus 16 (2024)
Kioxia XG8 KXG80ZNV512G
4617.83 MB/s +12%
Acer Nitro V 16 ANV16-41-R5AT
Micron 2550 1TB
4126 MB/s
Lenovo Legion 5 16IRX G9
Samsung PM9A1 MZVL21T0HCLR
3979 MB/s -4%
Average of class Gaming
  (495 - 11316, n=155, last 2 years)
3775 MB/s -9%
Nubia RedMagic Titan 16 Pro
Samsung PM9A1 MZVL21T0HCLR
3690.18 MB/s -11%
Average Micron 2550 1TB
  (2090 - 4126, n=4)
2931 MB/s -29%
Asus ROG Zephyrus G16 GA605WV
Micron 2400 MTFDKBA1T0QFM
2555 MB/s -38%
4K Read
Lenovo Legion 5 16IRX G9
Samsung PM9A1 MZVL21T0HCLR
81.2 MB/s +7%
Acer Nitro V 16 ANV16-41-R5AT
Micron 2550 1TB
75.62 MB/s
Nubia RedMagic Titan 16 Pro
Samsung PM9A1 MZVL21T0HCLR
69.73 MB/s -8%
Average Micron 2550 1TB
  (59.3 - 75.6, n=4)
65.9 MB/s -13%
Average of class Gaming
  (27.8 - 112.1, n=155, last 2 years)
64.9 MB/s -14%
HP Victus 16 (2024)
Kioxia XG8 KXG80ZNV512G
51.41 MB/s -32%
Asus ROG Zephyrus G16 GA605WV
Micron 2400 MTFDKBA1T0QFM
27.8 MB/s -63%
4K Write
HP Victus 16 (2024)
Kioxia XG8 KXG80ZNV512G
218.1 MB/s +1%
Acer Nitro V 16 ANV16-41-R5AT
Micron 2550 1TB
216.65 MB/s
Average of class Gaming
  (79.4 - 512, n=155, last 2 years)
211 MB/s -3%
Average Micron 2550 1TB
  (176.9 - 218, n=4)
207 MB/s -4%
Nubia RedMagic Titan 16 Pro
Samsung PM9A1 MZVL21T0HCLR
204.43 MB/s -6%
Lenovo Legion 5 16IRX G9
Samsung PM9A1 MZVL21T0HCLR
194.6 MB/s -10%
Asus ROG Zephyrus G16 GA605WV
Micron 2400 MTFDKBA1T0QFM
185.4 MB/s -14%
4K-64 Read
Lenovo Legion 5 16IRX G9
Samsung PM9A1 MZVL21T0HCLR
2619 MB/s +163%
Nubia RedMagic Titan 16 Pro
Samsung PM9A1 MZVL21T0HCLR
2556.31 MB/s +157%
HP Victus 16 (2024)
Kioxia XG8 KXG80ZNV512G
2430.71 MB/s +144%
Average of class Gaming
  (451 - 3475, n=155, last 2 years)
1882 MB/s +89%
Acer Nitro V 16 ANV16-41-R5AT
Micron 2550 1TB
995.45 MB/s
Average Micron 2550 1TB
  (537 - 995, n=4)
731 MB/s -27%
Asus ROG Zephyrus G16 GA605WV
Micron 2400 MTFDKBA1T0QFM
539 MB/s -46%
4K-64 Write
Lenovo Legion 5 16IRX G9
Samsung PM9A1 MZVL21T0HCLR
3253 MB/s +111%
Nubia RedMagic Titan 16 Pro
Samsung PM9A1 MZVL21T0HCLR
2950.72 MB/s +91%
Average of class Gaming
  (277 - 5909, n=155, last 2 years)
2530 MB/s +64%
HP Victus 16 (2024)
Kioxia XG8 KXG80ZNV512G
2238.92 MB/s +45%
Asus ROG Zephyrus G16 GA605WV
Micron 2400 MTFDKBA1T0QFM
1744 MB/s +13%
Average Micron 2550 1TB
  (1424 - 2305, n=4)
1694 MB/s +10%
Acer Nitro V 16 ANV16-41-R5AT
Micron 2550 1TB
1542.24 MB/s
Access Time Read
HP Victus 16 (2024)
Kioxia XG8 KXG80ZNV512G
0.137 ms * -174%
Average Micron 2550 1TB
  (0.05 - 0.092, n=4)
0.0795 ms * -59%
Average of class Gaming
  (0.016 - 0.379, n=154, last 2 years)
0.05554 ms * -11%
Nubia RedMagic Titan 16 Pro
Samsung PM9A1 MZVL21T0HCLR
0.052 ms * -4%
Acer Nitro V 16 ANV16-41-R5AT
Micron 2550 1TB
0.05 ms *
Asus ROG Zephyrus G16 GA605WV
Micron 2400 MTFDKBA1T0QFM
0.027 ms * +46%
Lenovo Legion 5 16IRX G9
Samsung PM9A1 MZVL21T0HCLR
0.021 ms * +58%
Access Time Write
Asus ROG Zephyrus G16 GA605WV
Micron 2400 MTFDKBA1T0QFM
0.139 ms * -348%
Average Micron 2550 1TB
  (0.031 - 0.063, n=4)
0.0495 ms * -60%
Average of class Gaming
  (0.011 - 1.028, n=155, last 2 years)
0.04707 ms * -52%
Acer Nitro V 16 ANV16-41-R5AT
Micron 2550 1TB
0.031 ms *
Nubia RedMagic Titan 16 Pro
Samsung PM9A1 MZVL21T0HCLR
0.021 ms * +32%
Lenovo Legion 5 16IRX G9
Samsung PM9A1 MZVL21T0HCLR
0.02 ms * +35%
HP Victus 16 (2024)
Kioxia XG8 KXG80ZNV512G
0.019 ms * +39%

* ... smaller is better

Reading continuous performance: DiskSpd Read Loop, Queue Depth 8

035070010501400175021002450280031503500385042004550490052505600595063006650Tooltip
Acer Nitro V 16 ANV16-41-R5AT Micron 2550 1TB; diskspd 2.0.17 f: Ø4582 (3749.76-4895.8)
Lenovo Legion 5 16IRX G9 Samsung PM9A1 MZVL21T0HCLR; diskspd 2.0.17 f: Ø4118 (3284.7-6662.02)
HP Victus 16 (2024) Kioxia XG8 KXG80ZNV512G; diskspd 2.0.17 f: Ø5625 (4912.19-6954.3)
Nubia RedMagic Titan 16 Pro Samsung PM9A1 MZVL21T0HCLR; diskspd 2.0.17 f: Ø6623 (5874.12-6660.14)
Asus ROG Zephyrus G16 GA605WV Micron 2400 MTFDKBA1T0QFM; diskspd 2.0.17 f: Ø4865 (4284.24-4950.91)

Grafik kartı

GeForce RTX 4060 son yılların açık ara en başarılı dizüstü oyun ekran kartlarından biri. Nvidia'nın Ada Lovelace neslinin orta sınıf modeli 3.072 shader birimi ve 8 GB GDDR6 VRAM ile donatılmıştır. Olduğu gibi RTX 4070vRAM'i artık bazı oyunları çalıştırırken sınırlarına ulaştı, bu yüzden tutkulu oyuncular muhtemelen bir dizüstü bilgisayarı tercih etmelidir RTX 4080 (12 GB). Nitro V 16'nın 85 watt'lık ılımlı TGP'sine rağmen, 16 inçlik model, bazıları 100 watt'ın üzerinde TGP ile çalışan rakiplerine karşı sentetik grafik testlerinde oldukça iyi performans gösterdi.

3DMark Performance Rating - Percent
Average of class Gaming
 
100 pt
Lenovo Legion 5 16IRX G9
NVIDIA GeForce RTX 4060 Laptop GPU, Intel Core i7-14650HX
85.7 pt
Nubia RedMagic Titan 16 Pro
NVIDIA GeForce RTX 4060 Laptop GPU, Intel Core i9-14900HX
82.4 pt
HP Victus 16 (2024)
NVIDIA GeForce RTX 4060 Laptop GPU, Intel Core i7-14700HX
79.9 pt
Average NVIDIA GeForce RTX 4060 Laptop GPU
 
78.6 pt
Acer Nitro V 16 ANV16-41-R5AT
NVIDIA GeForce RTX 4060 Laptop GPU, AMD Ryzen 7 8845HS
75.6 pt
Asus ROG Zephyrus G16 GA605WV
NVIDIA GeForce RTX 4060 Laptop GPU, AMD Ryzen AI 9 HX 370
73.1 pt
3DMark 11 - 1280x720 Performance GPU
Average of class Gaming
  (1029 - 72178, n=181, last 2 years)
44043 Points +32%
Lenovo Legion 5 16IRX G9
NVIDIA GeForce RTX 4060 Laptop GPU, Intel Core i7-14650HX
37410 Points +12%
Nubia RedMagic Titan 16 Pro
NVIDIA GeForce RTX 4060 Laptop GPU, Intel Core i9-14900HX
36548 Points +9%
HP Victus 16 (2024)
NVIDIA GeForce RTX 4060 Laptop GPU, Intel Core i7-14700HX
35045 Points +5%
Average NVIDIA GeForce RTX 4060 Laptop GPU
  (28136 - 38912, n=56)
34832 Points +4%
Acer Nitro V 16 ANV16-41-R5AT
NVIDIA GeForce RTX 4060 Laptop GPU, AMD Ryzen 7 8845HS
33404 Points
Asus ROG Zephyrus G16 GA605WV
NVIDIA GeForce RTX 4060 Laptop GPU, AMD Ryzen AI 9 HX 370
32517 Points -3%
3DMark
1920x1080 Fire Strike Graphics
Average of class Gaming
  (781 - 53059, n=193, last 2 years)
31600 Points +24%
Lenovo Legion 5 16IRX G9
NVIDIA GeForce RTX 4060 Laptop GPU, Intel Core i7-14650HX
27474 Points +7%
HP Victus 16 (2024)
NVIDIA GeForce RTX 4060 Laptop GPU, Intel Core i7-14700HX
26844 Points +5%
Nubia RedMagic Titan 16 Pro
NVIDIA GeForce RTX 4060 Laptop GPU, Intel Core i9-14900HX
26573 Points +4%
Average NVIDIA GeForce RTX 4060 Laptop GPU
  (20533 - 29656, n=53)
25748 Points +1%
Acer Nitro V 16 ANV16-41-R5AT
NVIDIA GeForce RTX 4060 Laptop GPU, AMD Ryzen 7 8845HS
25565 Points
Asus ROG Zephyrus G16 GA605WV
NVIDIA GeForce RTX 4060 Laptop GPU, AMD Ryzen AI 9 HX 370
23753 Points -7%
2560x1440 Time Spy Graphics
Average of class Gaming
  (224 - 22717, n=188, last 2 years)
13211 Points +43%
Lenovo Legion 5 16IRX G9
NVIDIA GeForce RTX 4060 Laptop GPU, Intel Core i7-14650HX
11267 Points +22%
Nubia RedMagic Titan 16 Pro
NVIDIA GeForce RTX 4060 Laptop GPU, Intel Core i9-14900HX
10575 Points +14%
HP Victus 16 (2024)
NVIDIA GeForce RTX 4060 Laptop GPU, Intel Core i7-14700HX
9937 Points +7%
Average NVIDIA GeForce RTX 4060 Laptop GPU
  (7484 - 11451, n=55)
9936 Points +7%
Asus ROG Zephyrus G16 GA605WV
NVIDIA GeForce RTX 4060 Laptop GPU, AMD Ryzen AI 9 HX 370
9286 Points 0%
Acer Nitro V 16 ANV16-41-R5AT
NVIDIA GeForce RTX 4060 Laptop GPU, AMD Ryzen 7 8845HS
9254 Points
3DMark 11 Performance
29566 puan
3DMark Ice Storm Standard Score
166948 puan
3DMark Cloud Gate Standard Score
64085 puan
3DMark Fire Strike Score
23112 puan
3DMark Time Spy Score
9511 puan
Yardım
Blender
v3.3 Classroom OPTIX/RTX
Acer Nitro V 16 ANV16-41-R5AT
NVIDIA GeForce RTX 4060 Laptop GPU, AMD Ryzen 7 8845HS
25 Seconds *
Lenovo Legion 5 16IRX G9
NVIDIA GeForce RTX 4060 Laptop GPU, Intel Core i7-14650HX
23 Seconds * +8%
Asus ROG Zephyrus G16 GA605WV
NVIDIA GeForce RTX 4060 Laptop GPU, AMD Ryzen AI 9 HX 370
23 Seconds * +8%
Average NVIDIA GeForce RTX 4060 Laptop GPU
  (19 - 28, n=52)
23 Seconds * +8%
HP Victus 16 (2024)
NVIDIA GeForce RTX 4060 Laptop GPU, Intel Core i7-14700HX
22 Seconds * +12%
Nubia RedMagic Titan 16 Pro
NVIDIA GeForce RTX 4060 Laptop GPU, Intel Core i9-14900HX
22 Seconds * +12%
Average of class Gaming
  (9 - 95, n=177, last 2 years)
20.7 Seconds * +17%
v3.3 Classroom CUDA
Asus ROG Zephyrus G16 GA605WV
NVIDIA GeForce RTX 4060 Laptop GPU, AMD Ryzen AI 9 HX 370
44 Seconds * -5%
Nubia RedMagic Titan 16 Pro
NVIDIA GeForce RTX 4060 Laptop GPU, Intel Core i9-14900HX
44 Seconds * -5%
Average NVIDIA GeForce RTX 4060 Laptop GPU
  (39 - 53, n=52)
43.2 Seconds * -3%
Acer Nitro V 16 ANV16-41-R5AT
NVIDIA GeForce RTX 4060 Laptop GPU, AMD Ryzen 7 8845HS
42 Seconds *
Lenovo Legion 5 16IRX G9
NVIDIA GeForce RTX 4060 Laptop GPU, Intel Core i7-14650HX
41 Seconds * +2%
HP Victus 16 (2024)
NVIDIA GeForce RTX 4060 Laptop GPU, Intel Core i7-14700HX
41 Seconds * +2%
Average of class Gaming
  (16 - 175, n=182, last 2 years)
36.1 Seconds * +14%
v3.3 Classroom CPU
Nubia RedMagic Titan 16 Pro
NVIDIA GeForce RTX 4060 Laptop GPU, Intel Core i9-14900HX
394 Seconds * -26%
HP Victus 16 (2024)
NVIDIA GeForce RTX 4060 Laptop GPU, Intel Core i7-14700HX
312 Seconds * -0%
Acer Nitro V 16 ANV16-41-R5AT
NVIDIA GeForce RTX 4060 Laptop GPU, AMD Ryzen 7 8845HS
312 Seconds *
Average NVIDIA GeForce RTX 4060 Laptop GPU
  (189 - 452, n=52)
311 Seconds * -0%
Average of class Gaming
  (138 - 962, n=186, last 2 years)
293 Seconds * +6%
Lenovo Legion 5 16IRX G9
NVIDIA GeForce RTX 4060 Laptop GPU, Intel Core i7-14650HX
247 Seconds * +21%
Asus ROG Zephyrus G16 GA605WV
NVIDIA GeForce RTX 4060 Laptop GPU, AMD Ryzen AI 9 HX 370
221 Seconds * +29%

* ... smaller is better

Oyun performansı

Günlük oyunlar sırasında Nitro, en azından karşılaştırma alanına kıyasla bocalama eğilimindedir. Diğer RTX 4060 dizüstü bilgisayarların bazen %20'den fazla daha hızlı olduğunu ölçtük. Prensip olarak RTX 4060, neredeyse tüm modern oyunları ekranın doğal çözünürlüğünde maksimum ayarlarda sorunsuz bir şekilde çalıştıracak kadar güçlüdür. Yalnızca aşağıdaki gibi aşırı zorlu ve/veya kötü optimize edilmiş oyunlar oynarken Yıldız Savaşları Haydutları azaltılmış ayrıntılarla yetinmeniz veya DLSS kullanmanız gerekecektir.

Performance Rating - Percent
Lenovo Legion 5 16IRX G9 -1!
Intel Core i7-14650HX, NVIDIA GeForce RTX 4060 Laptop GPU
95.7 pt
Average of class Gaming
 
95.4 pt
Nubia RedMagic Titan 16 Pro
Intel Core i9-14900HX, NVIDIA GeForce RTX 4060 Laptop GPU
89.1 pt
Average NVIDIA GeForce RTX 4060 Laptop GPU
 
82.4 pt
HP Victus 16 (2024) -1!
Intel Core i7-14700HX, NVIDIA GeForce RTX 4060 Laptop GPU
82.3 pt
Asus ROG Zephyrus G16 GA605WV
AMD Ryzen AI 9 HX 370, NVIDIA GeForce RTX 4060 Laptop GPU
74.9 pt
Acer Nitro V 16 ANV16-41-R5AT
AMD Ryzen 7 8845HS, NVIDIA GeForce RTX 4060 Laptop GPU
74.1 pt
Cyberpunk 2077 2.1 Phantom Liberty - 1920x1080 Ultra Preset (FSR off)
Average of class Gaming
  (6.76 - 144.7, n=82, last 2 years)
86.5 fps +30%
Lenovo Legion 5 16IRX G9
Intel Core i7-14650HX, NVIDIA GeForce RTX 4060 Laptop GPU
81.8 (19.5min) fps +23%
Nubia RedMagic Titan 16 Pro
Intel Core i9-14900HX, NVIDIA GeForce RTX 4060 Laptop GPU
74.7 (62min) fps +13%
Average NVIDIA GeForce RTX 4060 Laptop GPU
  (56.4 - 93.1, n=30)
71.5 fps +8%
HP Victus 16 (2024)
Intel Core i7-14700HX, NVIDIA GeForce RTX 4060 Laptop GPU
67.1 (20.8min) fps +1%
Asus ROG Zephyrus G16 GA605WV
AMD Ryzen AI 9 HX 370, NVIDIA GeForce RTX 4060 Laptop GPU
66.4 (55.7min) fps 0%
Acer Nitro V 16 ANV16-41-R5AT
AMD Ryzen 7 8845HS, NVIDIA GeForce RTX 4060 Laptop GPU
66.4 (56min) fps
Baldur's Gate 3 - 1920x1080 Ultra Preset
Average of class Gaming
  (34.5 - 208, n=47, last 2 years)
104 fps +29%
Nubia RedMagic Titan 16 Pro
Intel Core i9-14900HX, NVIDIA GeForce RTX 4060 Laptop GPU
96.5 (62.4min, 71.2P0.1, 81.3P1) fps +19%
Average NVIDIA GeForce RTX 4060 Laptop GPU
  (66.5 - 105.5, n=18)
84.6 fps +5%
Asus ROG Zephyrus G16 GA605WV
AMD Ryzen AI 9 HX 370, NVIDIA GeForce RTX 4060 Laptop GPU
82.9 fps +2%
Acer Nitro V 16 ANV16-41-R5AT
AMD Ryzen 7 8845HS, NVIDIA GeForce RTX 4060 Laptop GPU
80.9 (25.2min, 31.9P0.1, 55.1P1) fps
GTA V - 1920x1080 Highest Settings possible AA:4xMSAA + FX AF:16x
Lenovo Legion 5 16IRX G9
Intel Core i7-14650HX, NVIDIA GeForce RTX 4060 Laptop GPU
120.2 (4.33min, 76.9P1) fps +15%
Nubia RedMagic Titan 16 Pro
Intel Core i9-14900HX, NVIDIA GeForce RTX 4060 Laptop GPU
118.4 (4.07min, 83.3P1) fps +13%
Average of class Gaming
  (12.1 - 167.7, n=168, last 2 years)
114 fps +9%
HP Victus 16 (2024)
Intel Core i7-14700HX, NVIDIA GeForce RTX 4060 Laptop GPU
110.2 (8.03min, 76.9P1) fps +5%
Average NVIDIA GeForce RTX 4060 Laptop GPU
  (76.9 - 126.3, n=47)
107.6 fps +3%
Acer Nitro V 16 ANV16-41-R5AT
AMD Ryzen 7 8845HS, NVIDIA GeForce RTX 4060 Laptop GPU
104.6 (17.5min, 71.4P1) fps
Asus ROG Zephyrus G16 GA605WV
AMD Ryzen AI 9 HX 370, NVIDIA GeForce RTX 4060 Laptop GPU
100.1 (4.02min, 66.7P1) fps -4%
Final Fantasy XV Benchmark - 1920x1080 High Quality
Average of class Gaming
  (19.2 - 201, n=180, last 2 years)
120.5 fps +25%
Lenovo Legion 5 16IRX G9
Intel Core i7-14650HX, NVIDIA GeForce RTX 4060 Laptop GPU
106.3 fps +11%
Nubia RedMagic Titan 16 Pro
Intel Core i9-14900HX, NVIDIA GeForce RTX 4060 Laptop GPU
105.4 fps +10%
HP Victus 16 (2024)
Intel Core i7-14700HX, NVIDIA GeForce RTX 4060 Laptop GPU
98.1 fps +2%
Average NVIDIA GeForce RTX 4060 Laptop GPU
  (75.1 - 109.8, n=50)
97.3 fps +1%
Acer Nitro V 16 ANV16-41-R5AT
AMD Ryzen 7 8845HS, NVIDIA GeForce RTX 4060 Laptop GPU
96.1 fps
Asus ROG Zephyrus G16 GA605WV
AMD Ryzen AI 9 HX 370, NVIDIA GeForce RTX 4060 Laptop GPU
90.7 fps -6%
Strange Brigade - 1920x1080 ultra AA:ultra AF:16
Average of class Gaming
  (38.9 - 421, n=176, last 2 years)
230 fps +36%
Lenovo Legion 5 16IRX G9
Intel Core i7-14650HX, NVIDIA GeForce RTX 4060 Laptop GPU
210 fps +24%
Nubia RedMagic Titan 16 Pro
Intel Core i9-14900HX, NVIDIA GeForce RTX 4060 Laptop GPU
189.2 (10.3min, 139.1P1) fps +11%
Average NVIDIA GeForce RTX 4060 Laptop GPU
  (135.3 - 210, n=49)
181.3 fps +7%
HP Victus 16 (2024)
Intel Core i7-14700HX, NVIDIA GeForce RTX 4060 Laptop GPU
179 (76.4min, 130.3P1) fps +5%
Asus ROG Zephyrus G16 GA605WV
AMD Ryzen AI 9 HX 370, NVIDIA GeForce RTX 4060 Laptop GPU
174.9 (77.7min, 128P1) fps +3%
Acer Nitro V 16 ANV16-41-R5AT
AMD Ryzen 7 8845HS, NVIDIA GeForce RTX 4060 Laptop GPU
169.7 (30.6min, 122.4P1) fps
Dota 2 Reborn - 1920x1080 ultra (3/3) best looking
Lenovo Legion 5 16IRX G9
Intel Core i7-14650HX, NVIDIA GeForce RTX 4060 Laptop GPU
168.7 (146.8min) fps +29%
Average of class Gaming
  (65.1 - 220, n=185, last 2 years)
151.4 fps +16%
HP Victus 16 (2024)
Intel Core i7-14700HX, NVIDIA GeForce RTX 4060 Laptop GPU
149.7 (130.4min) fps +15%
Nubia RedMagic Titan 16 Pro
Intel Core i9-14900HX, NVIDIA GeForce RTX 4060 Laptop GPU
146.9 (123.2min) fps +13%
Average NVIDIA GeForce RTX 4060 Laptop GPU
  (115 - 183.8, n=52)
145 fps +11%
Asus ROG Zephyrus G16 GA605WV
AMD Ryzen AI 9 HX 370, NVIDIA GeForce RTX 4060 Laptop GPU
139.2 (118.4min) fps +7%
Acer Nitro V 16 ANV16-41-R5AT
AMD Ryzen 7 8845HS, NVIDIA GeForce RTX 4060 Laptop GPU
130.5 (112.8min) fps
X-Plane 11.11 - 1920x1080 high (fps_test=3)
Lenovo Legion 5 16IRX G9
Intel Core i7-14650HX, NVIDIA GeForce RTX 4060 Laptop GPU
130.9 fps +116%
Nubia RedMagic Titan 16 Pro
Intel Core i9-14900HX, NVIDIA GeForce RTX 4060 Laptop GPU
117.2 fps +93%
Average of class Gaming
  (32.8 - 166.2, n=192, last 2 years)
108.5 fps +79%
Average NVIDIA GeForce RTX 4060 Laptop GPU
  (60.7 - 141.1, n=53)
102.1 fps +68%
HP Victus 16 (2024)
Intel Core i7-14700HX, NVIDIA GeForce RTX 4060 Laptop GPU
100.3 fps +65%
Asus ROG Zephyrus G16 GA605WV
AMD Ryzen AI 9 HX 370, NVIDIA GeForce RTX 4060 Laptop GPU
66.5 fps +10%
Acer Nitro V 16 ANV16-41-R5AT
AMD Ryzen 7 8845HS, NVIDIA GeForce RTX 4060 Laptop GPU
60.7 fps
düşükortayüksekultra
GTA V (2015) 175.8 167.8 104.6
Dota 2 Reborn (2015) 161.6 156 138.3 130.5
Final Fantasy XV Benchmark (2018) 205 130.8 96.1
X-Plane 11.11 (2018) 87.1 87.7 60.7
Strange Brigade (2018) 251 200 169.7
Baldur's Gate 3 (2023) 98.3 83.1 80.9
Cyberpunk 2077 2.1 Phantom Liberty (2023) 90.6 77.2 66.4
Prince of Persia The Lost Crown (2024) 345 340 337
Star Wars Outlaws (2024) 42.6 35.6 29.1
Space Marine 2 (2024) 76.9 76 67.8
Final Fantasy XVI (2024) 64 54.8 50.4
God of War Ragnarök (2024) 102.8 88 80.2
Until Dawn (2024) 80.1 56.8 43.2
Call of Duty Black Ops 6 (2024) 116 80 76
Stalker 2 (2024) 54.1 48.1 40.2
Cyberpunk 2077 2.1 Phantom Liberty
1920x1080 Medium Preset (FSR off)
Lenovo Legion 5 16IRX G9
Intel Core i7-14650HX, NVIDIA GeForce RTX 4060 Laptop GPU
110.4 (18.7min) fps +22%
Average of class Gaming
  (7.27 - 185.2, n=60, last 2 years)
101.2 fps +12%
Nubia RedMagic Titan 16 Pro
Intel Core i9-14900HX, NVIDIA GeForce RTX 4060 Laptop GPU
101.1 (86.5min) fps +12%
Average NVIDIA GeForce RTX 4060 Laptop GPU
  (77.7 - 110.4, n=22)
93.8 fps +4%
Acer Nitro V 16 ANV16-41-R5AT
AMD Ryzen 7 8845HS, NVIDIA GeForce RTX 4060 Laptop GPU
90.6 (78min) fps
HP Victus 16 (2024)
Intel Core i7-14700HX, NVIDIA GeForce RTX 4060 Laptop GPU
90 (47.2min) fps -1%
Asus ROG Zephyrus G16 GA605WV
AMD Ryzen AI 9 HX 370, NVIDIA GeForce RTX 4060 Laptop GPU
90 (77.6min) fps -1%
1920x1080 High Preset (FSR off)
Lenovo Legion 5 16IRX G9
Intel Core i7-14650HX, NVIDIA GeForce RTX 4060 Laptop GPU
95.3 (18.5min) fps +23%
Average of class Gaming
  (7.4 - 164.5, n=61, last 2 years)
92.1 fps +19%
Nubia RedMagic Titan 16 Pro
Intel Core i9-14900HX, NVIDIA GeForce RTX 4060 Laptop GPU
86.2 (73min) fps +12%
Average NVIDIA GeForce RTX 4060 Laptop GPU
  (65.2 - 102, n=25)
80.6 fps +4%
Acer Nitro V 16 ANV16-41-R5AT
AMD Ryzen 7 8845HS, NVIDIA GeForce RTX 4060 Laptop GPU
77.2 (66min) fps
HP Victus 16 (2024)
Intel Core i7-14700HX, NVIDIA GeForce RTX 4060 Laptop GPU
76.9 (24min) fps 0%
Asus ROG Zephyrus G16 GA605WV
AMD Ryzen AI 9 HX 370, NVIDIA GeForce RTX 4060 Laptop GPU
75.2 (64min) fps -3%
1920x1080 Ultra Preset (FSR off)
Average of class Gaming
  (6.76 - 144.7, n=82, last 2 years)
86.5 fps +30%
Lenovo Legion 5 16IRX G9
Intel Core i7-14650HX, NVIDIA GeForce RTX 4060 Laptop GPU
81.8 (19.5min) fps +23%
Nubia RedMagic Titan 16 Pro
Intel Core i9-14900HX, NVIDIA GeForce RTX 4060 Laptop GPU
74.7 (62min) fps +13%
Average NVIDIA GeForce RTX 4060 Laptop GPU
  (56.4 - 93.1, n=30)
71.5 fps +8%
HP Victus 16 (2024)
Intel Core i7-14700HX, NVIDIA GeForce RTX 4060 Laptop GPU
67.1 (20.8min) fps +1%
Asus ROG Zephyrus G16 GA605WV
AMD Ryzen AI 9 HX 370, NVIDIA GeForce RTX 4060 Laptop GPU
66.4 (55.7min) fps 0%
Acer Nitro V 16 ANV16-41-R5AT
AMD Ryzen 7 8845HS, NVIDIA GeForce RTX 4060 Laptop GPU
66.4 (56min) fps

GPU'nun performansının daha uzun süreler boyunca sabit kalıp kalmadığını test etmek için Cyberpunk 2077. Bu konuda herhangi bir anormallik tespit etmedik.

Cyberpunk 2077 ultra FPS diagram

05101520253035404550556065Tooltip
Acer Nitro V 16 ANV16-41-R5AT R7 8845HS, NVIDIA GeForce RTX 4060 Laptop GPU: Ø64.2 (61.7-64.8)
Nubia RedMagic Titan 16 Pro i9-14900HX, NVIDIA GeForce RTX 4060 Laptop GPU: Ø67.6 (60.1-69.2)
Asus ROG Zephyrus G16 GA605WV Ryzen AI 9 HX 370, NVIDIA GeForce RTX 4060 Laptop GPU: Ø62.3 (54.5-62.9)

Emisyonlar

Gürültü emisyonları

Ekranının yanı sıra, Nitro V 16'nın karışık fan kontrolü en büyük zayıflıklarından biri olarak ortaya çıktı. Dengeli modda bile, tarayıcı açmak gibi küçük şeyler gerçekleştiğinde fanlar gereksiz yere hızlanma eğilimindedir. İleri geri hız atlamaları pratikte oldukça can sıkıcı olabiliyor, bu yüzden Acer bu konuda kesinlikle iyileştirmeler yapmalı. 16 inçlik cihaz genel olarak yük altında oldukça gürültülüdür. 50 dB(A)'nın üzeri kesinlikle bir kulaklık kullanılmasını gerektiriyor.

Ses yüksekliği

Boşta
25 / 28 / 37 dB
Çalışırken
51 / 52 dB
  red to green bar
 
 
30 dB
sessiz
40 dB(A)
duyulabilirlik
50 dB(A)
gürültülü
 
min: dark, med: mid, max: light   Earthworks M23R, Arta (15 cm uzaklık)   environment noise: 25 dB(A)
dB(A) 0102030405060708090Deep BassMiddle BassHigh BassLower RangeMidsHigher MidsLower HighsMid HighsUpper HighsSuper Highs2048.447.94346.140.241.12542.243.540.942.840.837.63148.84751.747.847.246.14034.830.232.132.231.228.55043.526.628.233.232.132.56331.330.52524.324.730.58025.119.217.316.815.522.910024.517.315.314.113.82312528.620.12014.214.826.816027.220.717.816.615.326.920030.124.220.620.819.230.725028.821.318.118.416.529.331529.320.918.814.513.630.340032.62416.713.213.733.950033.325.822.511.81234.763036.326.418.51111.537.580037.526.816.410.31338.8100039.327.616.711.111.640.1125041.429.21711.311.442.5160042.829.416.911.411.343.5200041.328.815.212.31241.9250039.924.213.812.812.240.8315039.220.213.713.812.739.2400038.220.61514.613.239.150003718.81413.913.837.3630034.116.213.914.414.634.7800029.814.91414.214.431.51000027.416.313.913.814.628.61250021.414.513.113.114.523.11600019.216.313.213.212.619.1SPL50.837.528.325.425.351.6N7.12.410.70.77.5median 33.3median 20.9median 16.4median 13.8median 13.6median 34.7Delta5.64.72.11.21.36.2hearing rangehide median Fan NoiseAcer Nitro V 16 ANV16-41-R5AT
Acer Nitro V 16 ANV16-41-R5AT
R7 8845HS, NVIDIA GeForce RTX 4060 Laptop GPU
Lenovo Legion 5 16IRX G9
i7-14650HX, NVIDIA GeForce RTX 4060 Laptop GPU
HP Victus 16 (2024)
i7-14700HX, NVIDIA GeForce RTX 4060 Laptop GPU
Nubia RedMagic Titan 16 Pro
i9-14900HX, NVIDIA GeForce RTX 4060 Laptop GPU
Asus ROG Zephyrus G16 GA605WV
Ryzen AI 9 HX 370, NVIDIA GeForce RTX 4060 Laptop GPU
Noise
4%
3%
-10%
6%
off / environment *
25
24
4%
25
-0%
26
-4%
24.6
2%
Idle Minimum *
25
24
4%
28
-12%
35
-40%
28.6
-14%
Idle Average *
28
28.8
-3%
29
-4%
36
-29%
28.6
-2%
Idle Maximum *
37
32
14%
33
11%
40
-8%
28.6
23%
Load Average *
51
45.5
11%
45
12%
49
4%
42.8
16%
Cyberpunk 2077 ultra *
54
50
7%
48.3
11%
Load Maximum *
52
55.7
-7%
48
8%
52
-0%
48.3
7%
Witcher 3 ultra *
53.1
43

* ... smaller is better

Sıcaklık

Öte yandan, sıcaklıkları testimiz sırasında kabul edilebilir bir aralıkta kaldı. Kasanın alt kısmı yük altında bazen neredeyse 50 °C'ye kadar ısınsa da, üst kısım maksimum 42 °C ile çok fazla ısınmadı. Rölanti modunda durum, yani üst ve alt kısım arasındaki oran benzer görünüyordu.

Maksimum yük
 39 °C41 °C38 °C 
 35 °C37 °C34 °C 
 28 °C30 °C29 °C 
Maksimum: 41 °C
Ortalama: 34.6 °C
49 °C47 °C44 °C
41 °C43 °C44 °C
29 °C29 °C28 °C
Maksimum: 49 °C
Ortalama: 39.3 °C
Güç kaynağı  46 °C | Oda sıcaklığı 21 °C | Fluke t3000FC (calibrated), Voltcraft IR-900
(±) The average temperature for the upper side under maximal load is 34.6 °C / 94 F, compared to the average of 33.9 °C / 93 F for the devices in the class Gaming.
(±) The maximum temperature on the upper side is 41 °C / 106 F, compared to the average of 40.5 °C / 105 F, ranging from 21.2 to 68.8 °C for the class Gaming.
(-) The bottom heats up to a maximum of 49 °C / 120 F, compared to the average of 43.2 °C / 110 F
(+) In idle usage, the average temperature for the upper side is 30.1 °C / 86 F, compared to the device average of 33.9 °C / 93 F.
(±) 3: The average temperature for the upper side is 34.9 °C / 95 F, compared to the average of 33.9 °C / 93 F for the class Gaming.
(+) The palmrests and touchpad are cooler than skin temperature with a maximum of 30 °C / 86 F and are therefore cool to the touch.
(±) The average temperature of the palmrest area of similar devices was 28.9 °C / 84 F (-1.1 °C / -2 F).
Acer Nitro V 16 ANV16-41-R5AT
R7 8845HS, NVIDIA GeForce RTX 4060 Laptop GPU
Lenovo Legion 5 16IRX G9
i7-14650HX, NVIDIA GeForce RTX 4060 Laptop GPU
HP Victus 16 (2024)
i7-14700HX, NVIDIA GeForce RTX 4060 Laptop GPU
Nubia RedMagic Titan 16 Pro
i9-14900HX, NVIDIA GeForce RTX 4060 Laptop GPU
Asus ROG Zephyrus G16 GA605WV
Ryzen AI 9 HX 370, NVIDIA GeForce RTX 4060 Laptop GPU
Heat
6%
7%
-6%
3%
Maximum Upper Side *
41
40.4
1%
50
-22%
50
-22%
48.2
-18%
Maximum Bottom *
49
43.8
11%
50
-2%
58
-18%
51.3
-5%
Idle Upper Side *
32
30.3
5%
25
22%
31
3%
28
12%
Idle Bottom *
37
35.3
5%
26
30%
32
14%
28.8
22%

* ... smaller is better

Stres testi

Dizüstü bilgisayarın bileşenleri hakkında da endişelenmenize gerek yok. Hem Cyberpunk 2077 'yi çalıştırırken hem de Furmark ve Prime95 araçlarını kullanarak yapılan stres testi sırasında CPU ve GPU 70 °C'nin hemen altında sabitlendi, bu da tamamen zararsız.

Furmark & Prime95
Furmark & Prime95
Furmark & Prime95
Furmark & Prime95
Furmark & Prime95
Furmark & Prime95
Cyberpunk 2077
Cyberpunk 2077
Cyberpunk 2077
Cyberpunk 2077
Cyberpunk 2077
Cyberpunk 2077

Konuşmacılar

2.0 sistemi 82 dB(A) gibi iyi bir maksimum seviye sunuyor, ancak çoğu dizüstü bilgisayardan bildiğimiz gibi baslar söz konusu olduğunda zayıflık gösteriyor. Ses kalitesi ara sıra YouTube videoları vb. için yeterlidir, ancak daha yoğun medya keyfi için (filmler, müzik, oyunlar, ...) mümkünse harici hoparlörler veya bir kulaklık bağlamalısınız.

dB(A) 0102030405060708090Deep BassMiddle BassHigh BassLower RangeMidsHigher MidsLower HighsMid HighsUpper HighsSuper Highs2040.242.62540.8383147.244.54031.233.15032.128.26324.729.98015.520.810013.818.912514.827.216015.336.120019.247.325016.560.531513.663.940013.769.65001270.563011.574.38001374.2100011.672.2125011.469.9160011.370.720001269.6250012.267315012.769.4400013.268.4500013.867.2630014.666.1800014.470.51000014.674.11250014.572.31600012.667.6SPL25.382.5N0.757.5median 13.6median 69.4Delta1.36.526.325.821.422.12624.925.127.622.532.523.448.72655.818.860.922.167.2267019.372.317.674.217.774.319.575.31571.711.871.311.27410.574.21072.710.17210.67210.97511.374.811.671.71269.71269.612.371.112.669.61270.111.269.824.784.70.666.6median 12median 71.73.42.2hearing rangehide median Pink NoiseAcer Nitro V 16 ANV16-41-R5ATApple MacBook Pro 16 2021 M1 Pro
Frequency diagram (checkboxes can be checked and unchecked to compare devices)
Acer Nitro V 16 ANV16-41-R5AT audio analysis

(+) | speakers can play relatively loud (82 dB)
Bass 100 - 315 Hz
(-) | nearly no bass - on average 27.1% lower than median
(±) | linearity of bass is average (14% delta to prev. frequency)
Mids 400 - 2000 Hz
(+) | balanced mids - only 2% away from median
(+) | mids are linear (3.8% delta to prev. frequency)
Highs 2 - 16 kHz
(+) | balanced highs - only 2.1% away from median
(+) | highs are linear (4.2% delta to prev. frequency)
Overall 100 - 16.000 Hz
(±) | linearity of overall sound is average (16% difference to median)
Compared to same class
» 36% of all tested devices in this class were better, 6% similar, 57% worse
» The best had a delta of 6%, average was 18%, worst was 132%
Compared to all devices tested
» 22% of all tested devices were better, 5% similar, 73% worse
» The best had a delta of 4%, average was 25%, worst was 134%

Apple MacBook Pro 16 2021 M1 Pro audio analysis

(+) | speakers can play relatively loud (84.7 dB)
Bass 100 - 315 Hz
(+) | good bass - only 3.8% away from median
(+) | bass is linear (5.2% delta to prev. frequency)
Mids 400 - 2000 Hz
(+) | balanced mids - only 1.3% away from median
(+) | mids are linear (2.1% delta to prev. frequency)
Highs 2 - 16 kHz
(+) | balanced highs - only 1.9% away from median
(+) | highs are linear (2.7% delta to prev. frequency)
Overall 100 - 16.000 Hz
(+) | overall sound is linear (4.6% difference to median)
Compared to same class
» 0% of all tested devices in this class were better, 0% similar, 100% worse
» The best had a delta of 5%, average was 18%, worst was 45%
Compared to all devices tested
» 0% of all tested devices were better, 0% similar, 100% worse
» The best had a delta of 4%, average was 25%, worst was 134%

Güç yönetimi

Güç tüketimi

Ryzen CPU'su sayesinde Nitro V 16, test alanımızdaki en tutumlu temsilcidir. boş modda 9 ila 13 watt ve yük altında 61 ila 134 watt, bazı durumlarda Intel rekabeti tarafından açıkça aşıldı.

Anlık tüketim
Kapalı / Bekleme modudarklight 0.1 / 0.8 Watt
Boştadarkmidlight 9 / 10 / 13 Watt
Çalışırken midlight 61 / 134 Watt
 color bar
Key: min: dark, med: mid, max: light        Metrahit Energy
Acer Nitro V 16 ANV16-41-R5AT
R7 8845HS, NVIDIA GeForce RTX 4060 Laptop GPU
Lenovo Legion 5 16IRX G9
i7-14650HX, NVIDIA GeForce RTX 4060 Laptop GPU
HP Victus 16 (2024)
i7-14700HX, NVIDIA GeForce RTX 4060 Laptop GPU
Nubia RedMagic Titan 16 Pro
i9-14900HX, NVIDIA GeForce RTX 4060 Laptop GPU
Asus ROG Zephyrus G16 GA605WV
Ryzen AI 9 HX 370, NVIDIA GeForce RTX 4060 Laptop GPU
Average of class Gaming
 
Power Consumption
-76%
-62%
-80%
-13%
-82%
Idle Minimum *
9
15.4
-71%
9
-0%
16
-78%
6.9
23%
Idle Average *
10
19.7
-97%
15
-50%
19
-90%
12.6
-26%
Idle Maximum *
13
20.7
-59%
23
-77%
27
-108%
13
-0%
Load Average *
61
102.6
-68%
123
-102%
123
-102%
84.1
-38%
Cyberpunk 2077 ultra *
118.9
184.3
-55%
127.2
-7%
Cyberpunk 2077 ultra external monitor *
116.3
174.2
-50%
124.5
-7%
Load Maximum *
134
246.6
-84%
241
-80%
240
-79%
177.6
-33%
Witcher 3 ultra *
191.3
143.7

* ... smaller is better

Power consumption Cyberpunk / stress test

0102030405060708090100110120130Tooltip
Acer Nitro V 16 ANV16-41-R5AT; 1280x720 Prime95 28.10 and Furmark 1.25: Ø121.9 (115.9-134)
Acer Nitro V 16 ANV16-41-R5AT; Idle 150cd/m2: Ø10 (9-13.3)
Acer Nitro V 16 ANV16-41-R5AT; Cyberpunk 2077 FHD ultra no FSR 150cd: Ø118.9 (115.6-122.8)

Power consumption with external monitor

0102030405060708090100110120Tooltip
Acer Nitro V 16 ANV16-41-R5AT; Prime95 V2810 Stress (external Monitor): Ø85.6 (84.8-99.4)
Acer Nitro V 16 ANV16-41-R5AT; Cinebench R23 Multi (external Monitor): Ø86.4 (84.1-99.1)
Acer Nitro V 16 ANV16-41-R5AT; 1280x720 FurMark 1.19 GPU Stress Test (external Monitor): Ø111.1 (103-119.7)
Acer Nitro V 16 ANV16-41-R5AT; Idle 1min (external Monitor): Ø16.5 (14.1-23.4)
Acer Nitro V 16 ANV16-41-R5AT; Cyberpunk 2077 FHD ultra no FSR (external Monitor): Ø116.3 (114-121.6)

Çalışma Zamanları

Pil ömrünün tamamen en iyisi olmadığı gerçeği, esas olarak yetersiz kapasitesinden kaynaklanmaktadır. Dizüstü bilgisayarın kasasında daha fazla yer olmasına rağmen Acer, V 16'ya yalnızca 57 Wh kapasite vermiştir. Diğer yandan rakipleri 80 ila 90 Wh'a kadar çıkabiliyor. Sonuç olarak, WLAN testimizde parlaklığın 150 cd/m²'ye düşürülmesiyle elde edilen 6 saatin biraz altındaki süre vasattır. Başka bir deyişle: Burada iyileştirme için hala çok yer var.
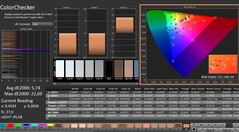


Batarya ömrü
WiFi Websurfing
5h 56min
Acer Nitro V 16 ANV16-41-R5AT
R7 8845HS, NVIDIA GeForce RTX 4060 Laptop GPU, 57 Wh
Lenovo Legion 5 16IRX G9
i7-14650HX, NVIDIA GeForce RTX 4060 Laptop GPU, 80 Wh
HP Victus 16 (2024)
i7-14700HX, NVIDIA GeForce RTX 4060 Laptop GPU, 83 Wh
Nubia RedMagic Titan 16 Pro
i9-14900HX, NVIDIA GeForce RTX 4060 Laptop GPU, 80.1 Wh
Asus ROG Zephyrus G16 GA605WV
Ryzen AI 9 HX 370, NVIDIA GeForce RTX 4060 Laptop GPU, 90 Wh
Average of class Gaming
 
Battery Runtime
25%
44%
-21%
34%
6%
WiFi v1.3
356
444
25%
511
44%
280
-21%
478
34%
H.264
576
316
824
Load
46
76
103
Reader / Idle
481

Notebookcheck toplam değerlendirme

Daha güçlü bir ekran ve daha iyi fan kontrolü ile Acer Nitro V 16, fiyatına göre oldukça etkileyici bir dizüstü oyun bilgisayarı olabilir. Ancak mevcut haliyle birçok rakibi geride bırakıyor.
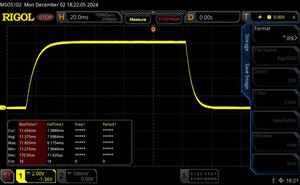
Acer Nitro V 16 ANV16-41-R5AT - 12/04/2024 v8
Florian Glaser

İşcilik
73 / 98 → 74%
Klavye
74%
Mouse
72%
Bağlanılabilirlik
64 / 80 → 81%
Ağırlık
60 / 10-68 → 86%
Batarya
68 / 95 → 72%
Görüntü
74%
Oyun performansı
78%
Uygulama performansı
85%
AI Performance
88%
Isınma
87 / 95 → 91%
Ses
60 / 90 → 67%
Audio
76%
Camera
32 / 75 → 43%
Ortalama
59%
76%
Gaming - Ortalama Ağırlık
CO2 Emissions
No Data
Materials
0%
Packaging
50%
Power Use
83.1%
Repairability
50%
Software Updates
22.3%
Recycle Logo Total Sustainability Score: 34.2%

Transparency

The selection of devices to be reviewed is made by our editorial team. The test sample was provided to the author as a loan by the manufacturer or retailer for the purpose of this review. The lender had no influence on this review, nor did the manufacturer receive a copy of this review before publication. There was no obligation to publish this review. We never accept compensation or payment in return for our reviews. As an independent media company, Notebookcheck is not subjected to the authority of manufacturers, retailers or publishers.

This is how Notebookcheck is testing

Every year, Notebookcheck independently reviews hundreds of laptops and smartphones using standardized procedures to ensure that all results are comparable. We have continuously developed our test methods for around 20 years and set industry standards in the process. In our test labs, high-quality measuring equipment is utilized by experienced technicians and editors. These tests involve a multi-stage validation process. Our complex rating system is based on hundreds of well-founded measurements and benchmarks, which maintains objectivity. Further information on our test methods can be found here.

Please share our article, every link counts!
Mail Logo
> Notebooklar Hakkında Aradığınız Herşey > İnceleme > Acer Nitro V 16 ANV16-41 incelemesi: Aksaklıkları olan uygun fiyatlı bir dizüstü oyun bilgisayarı
Florian Glaser, 2024-12- 7 (Update: 2024-12- 7)