

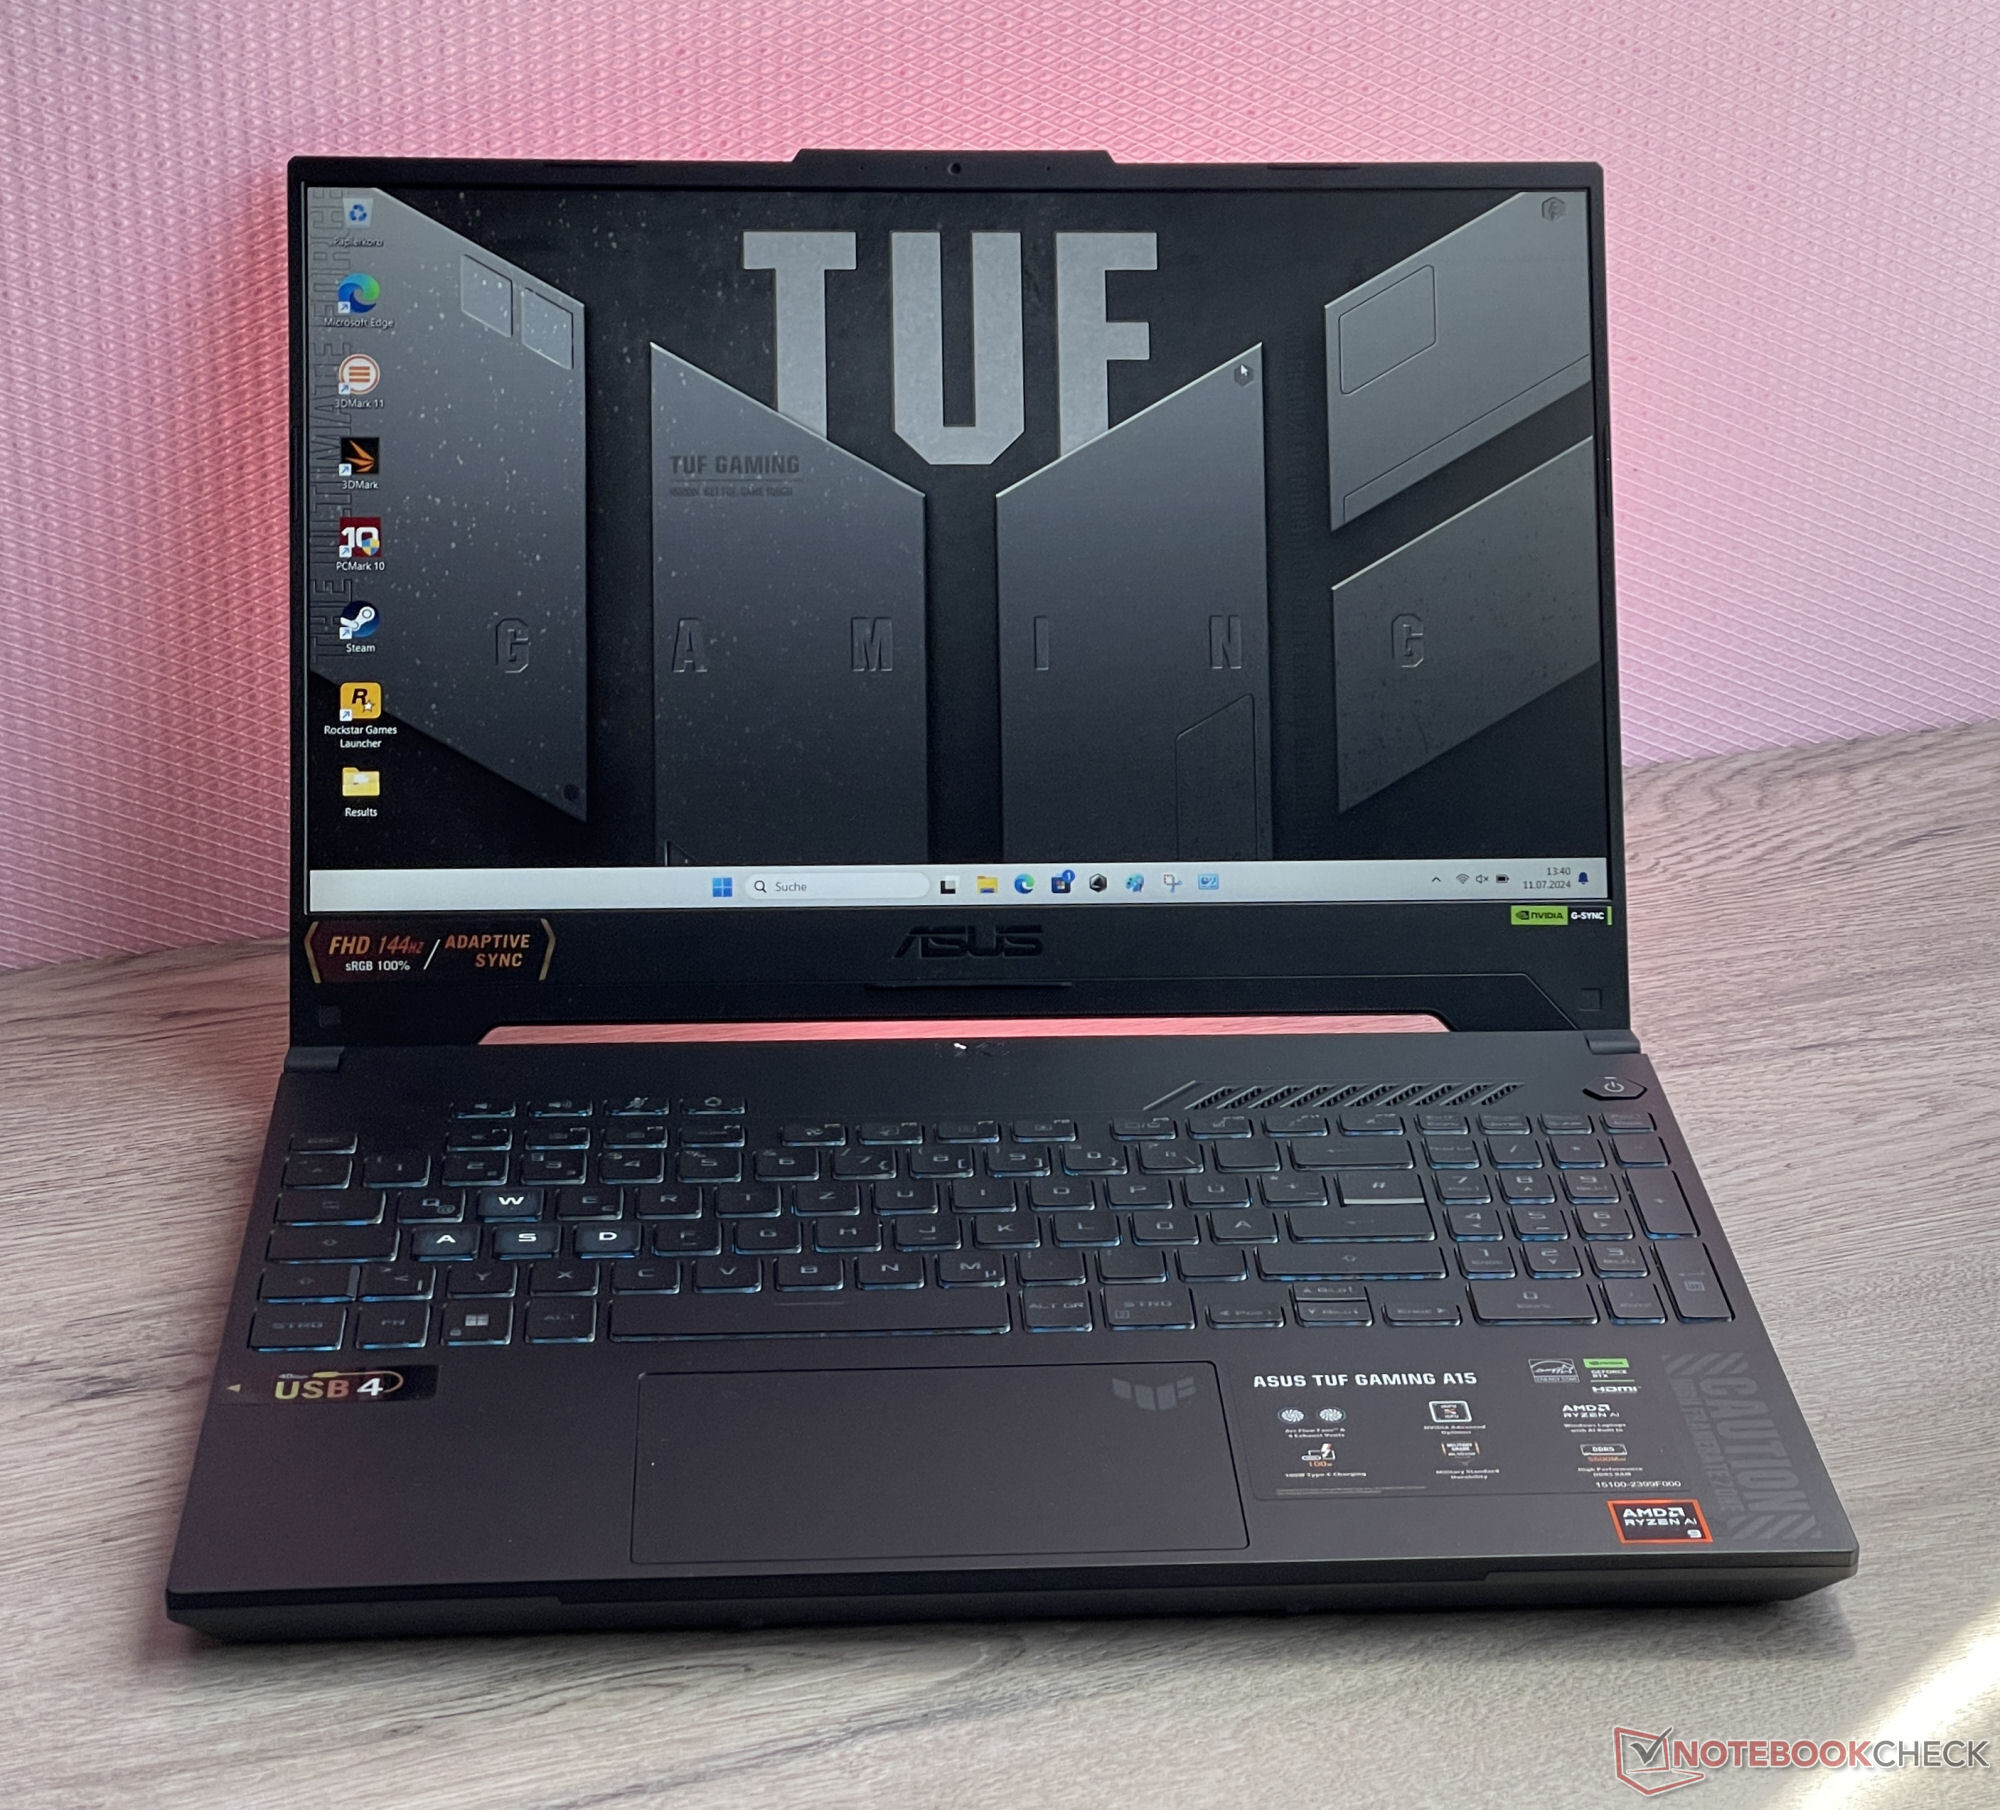
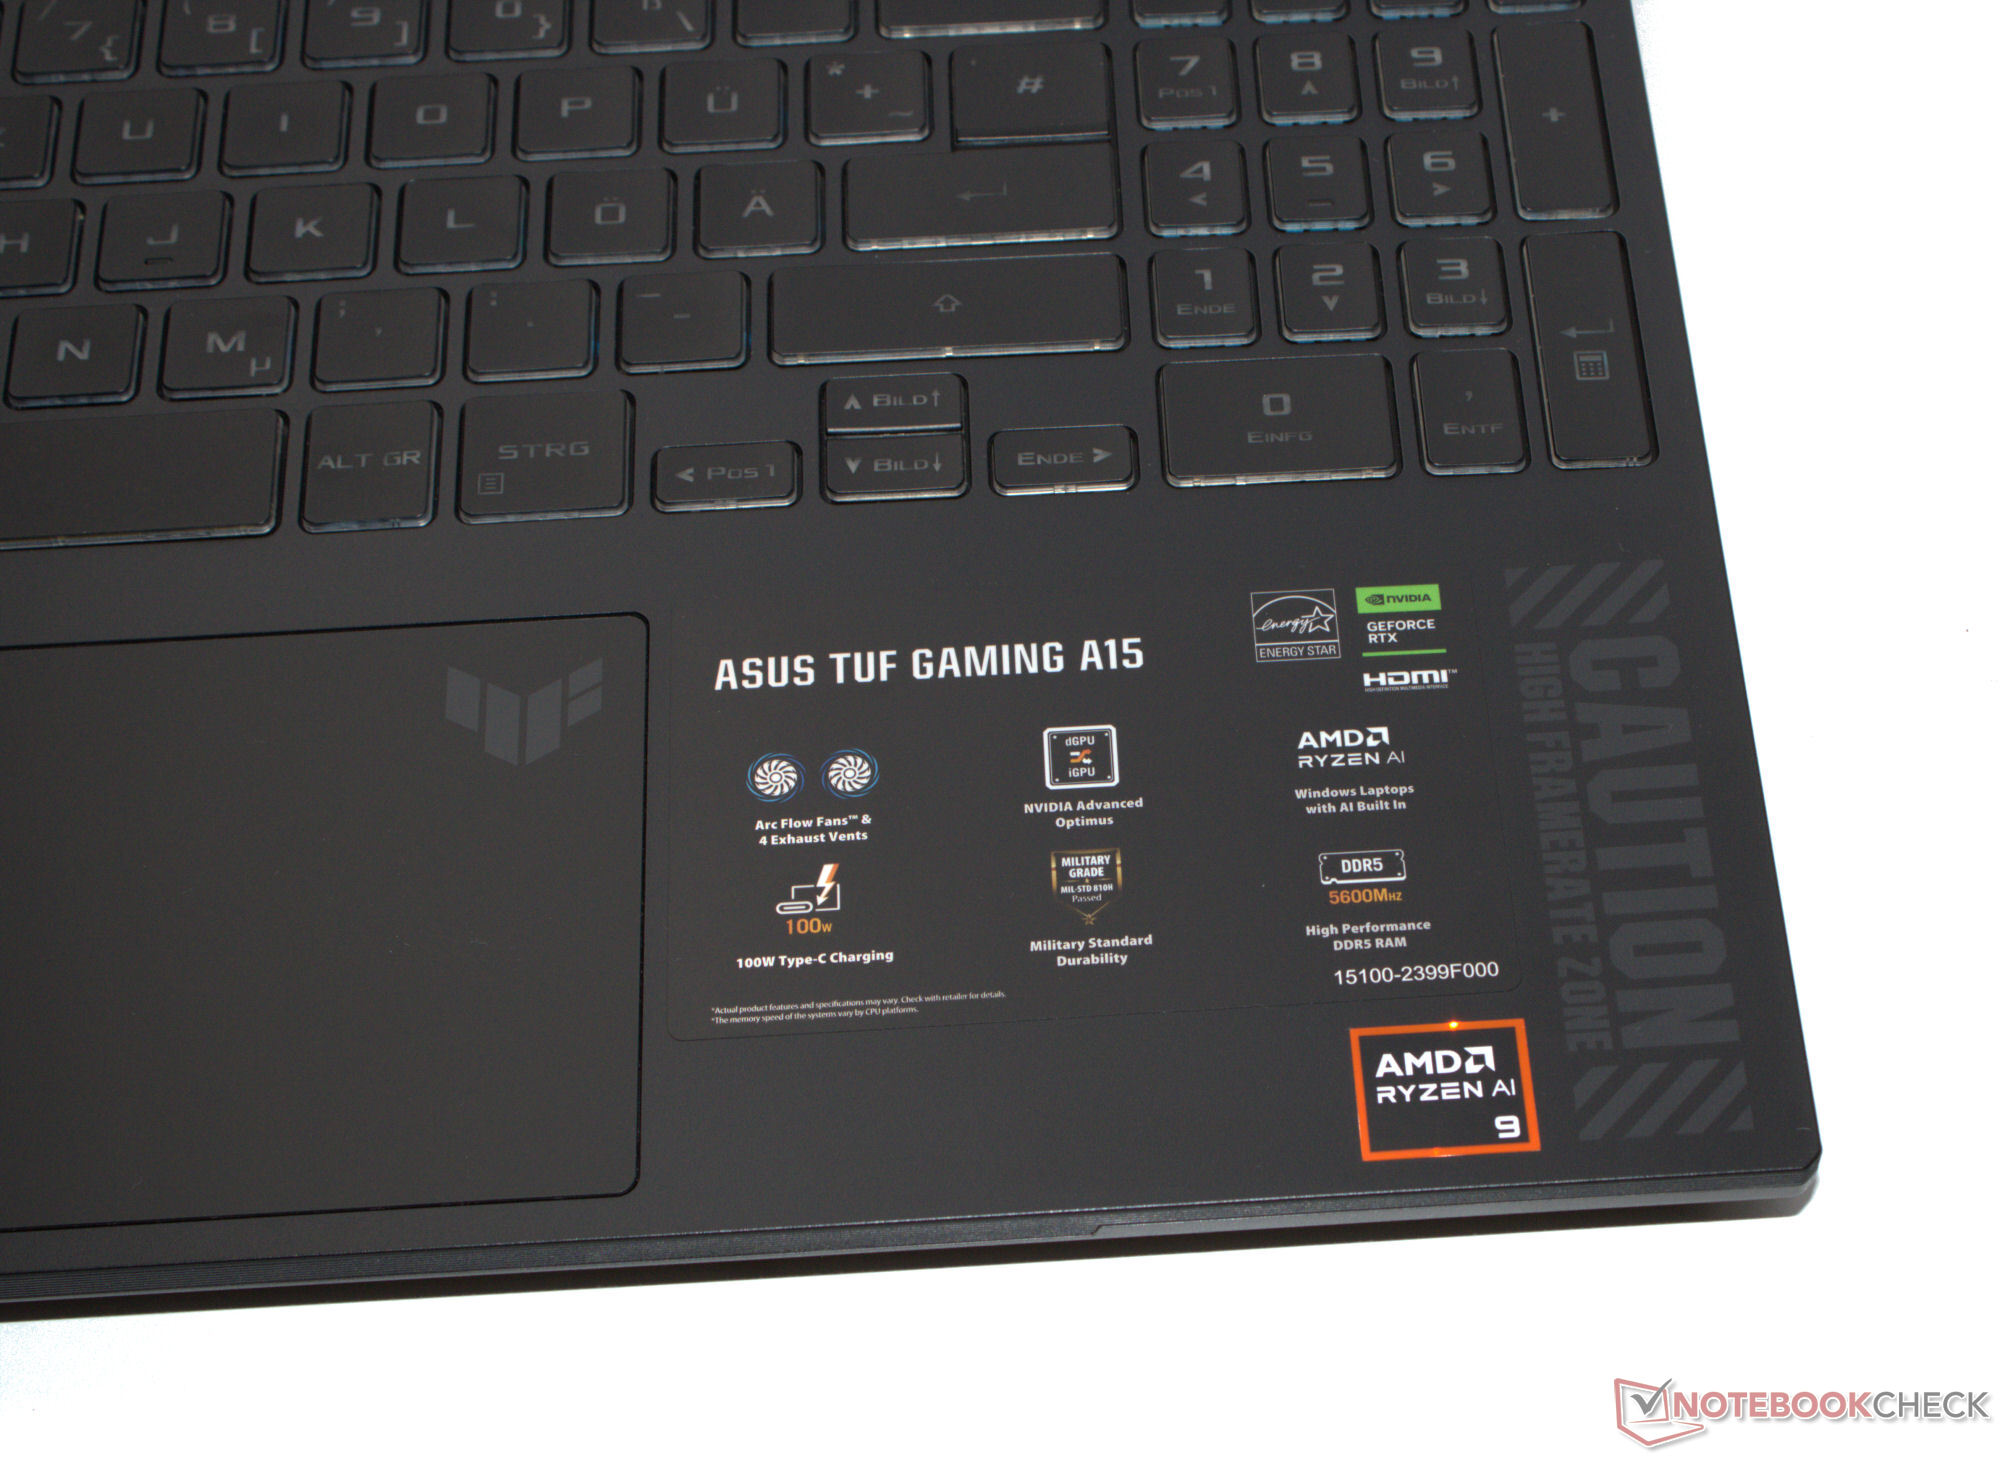
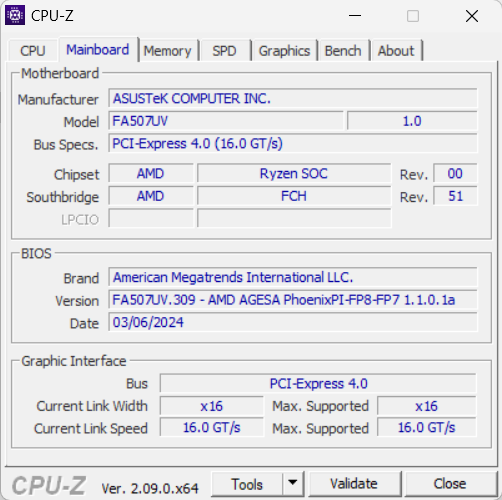
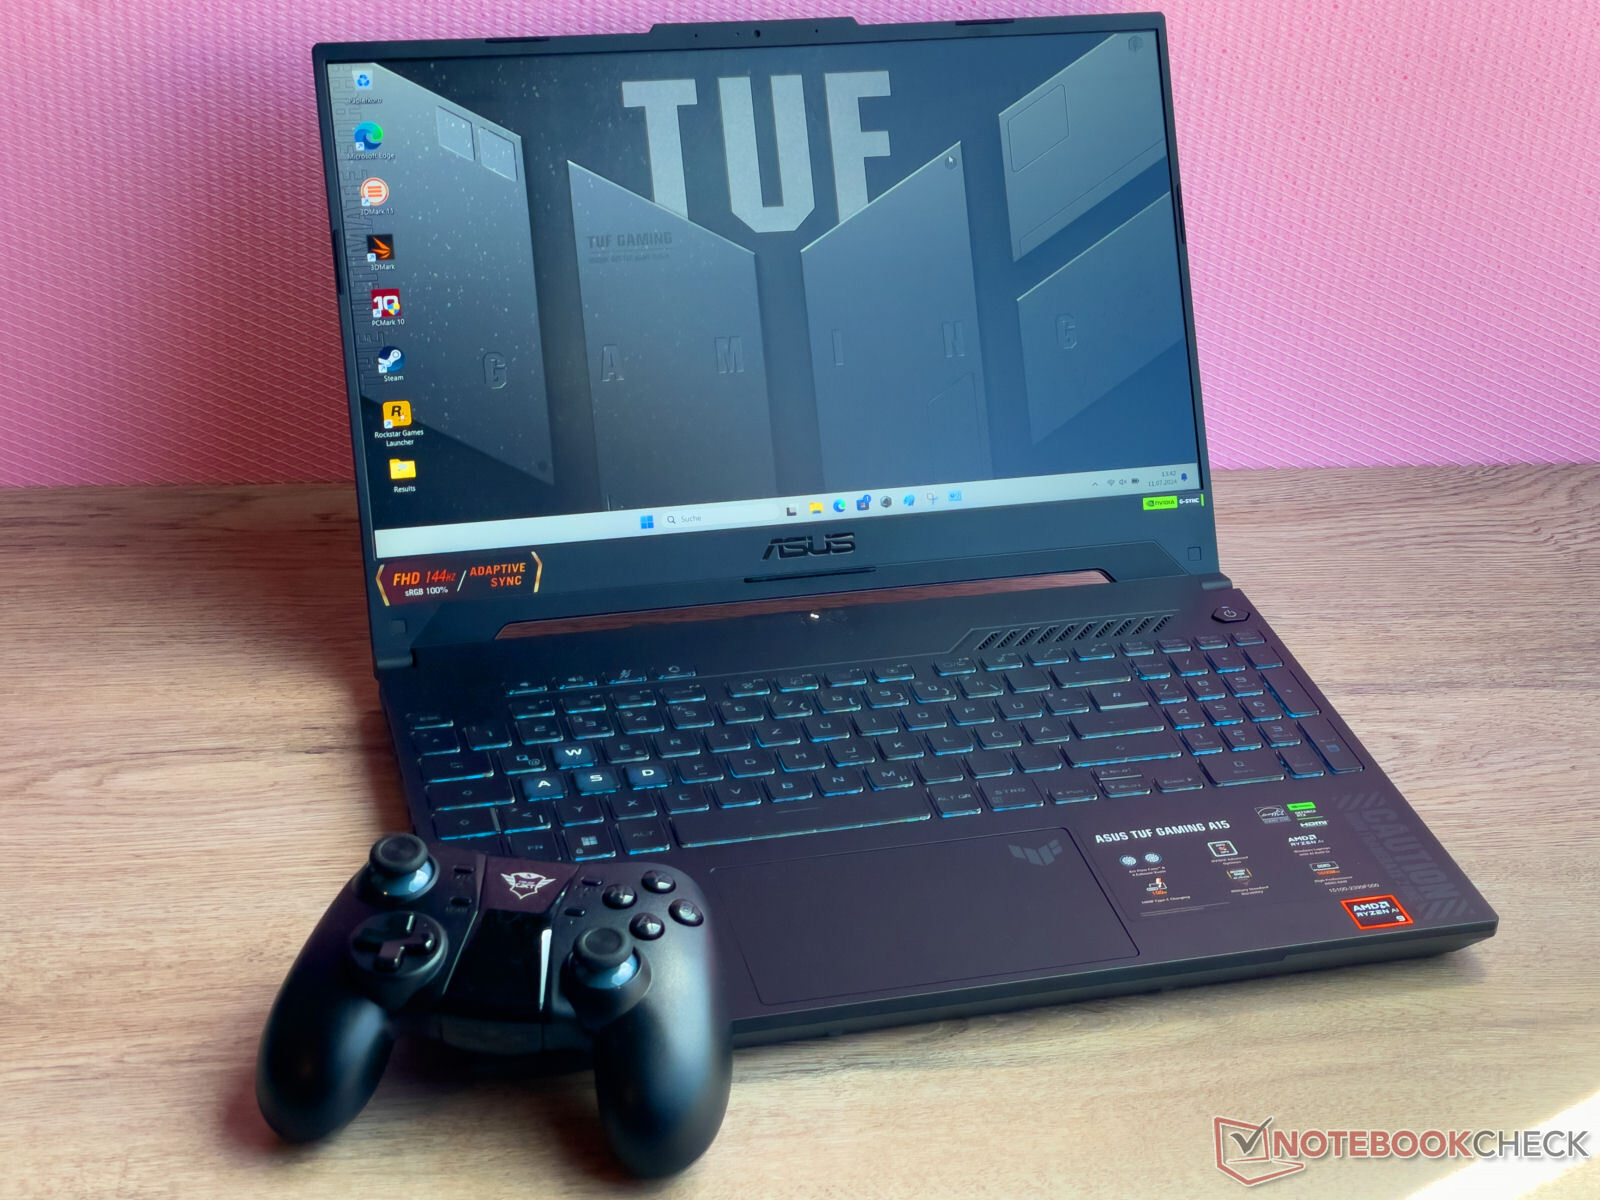
Asus TUF Gaming A15 (2024) incelemesi: RTX 4060 gücü, makul fiyat, uzun pil ömrü

"TUF Gaming", fiyat skalasının alt ucundaki oyun dizüstü bilgisayarlarıyla eşanlamlıdır: Ryzen 9 8945H, GeForce RTX 4060, 16 GB RAM, 512 GB SSD ve yaklaşık 1.399 dolarlık fiyatıyla uygun fiyatlı orta sınıf bir oyun dizüstü bilgisayarı. Rekabet, aşağıdaki gibi cihazlar şeklinde bulunabilir Lenovo LOQ 15IRX9, the Gigabyte G6X 9KG (2024), the Dell G16, the XMG Core 15 (M24) ve HP Victus 16 (2024).
Bu, bir önceki yılın kardeş modeli olan Geçen yıl incelediğimiz A15. Birincil fark Ryzen 7000'den Ryzen 8000'e geçiştir.
Karşılaştırmalı olarak olası rakipler
Derecelendirme | Sürüm | Tarih | Modeli | Ağırlık | Yükseklik | Boyut | Çözünürlük | Fiyat |
|---|---|---|---|---|---|---|---|---|
| 80.3 % | v8 | 07/2024 | Asus TUF Gaming A15 FA507UV R9 8945H, NVIDIA GeForce RTX 4060 Laptop GPU | 2.1 kg | 22.4 mm | 15.60" | 1920x1080 | |
| 79 % | v8 | 07/2024 | Lenovo LOQ 15IRX9 i5-13450HX, NVIDIA GeForce RTX 4060 Laptop GPU | 2.4 kg | 23.9 mm | 15.60" | 1920x1080 | |
| 84.3 % v7 (old) | v7 (old) | 05/2024 | HP Victus 16 (2024) i7-14700HX, NVIDIA GeForce RTX 4060 Laptop GPU | 2.4 kg | 23.9 mm | 16.10" | 1920x1080 | |
| 83.2 % v7 (old) | v7 (old) | 03/2024 | Gigabyte G6X 9KG (2024) i7-13650HX, NVIDIA GeForce RTX 4060 Laptop GPU | 2.6 kg | 25.1 mm | 16.00" | 1920x1200 | |
| 83.7 % | v8 | 06/2024 | SCHENKER XMG Core 15 (M24) R7 8845HS, NVIDIA GeForce RTX 4060 Laptop GPU | 2.1 kg | 21.9 mm | 15.30" | 2560x1600 | |
| 85.5 % v7 (old) | v7 (old) | 02/2024 | Dell G16, i7-13650HX, RTX 4060 i7-13650HX, NVIDIA GeForce RTX 4060 Laptop GPU | 2.8 kg | 25.65 mm | 16.00" | 2560x1600 |
Not: Derecelendirme sistemimizi yakın zamanda güncelledik ve 8. sürümün sonuçları 7. sürümün sonuçları ile karşılaştırılamaz. Daha fazla bilgi için burada.
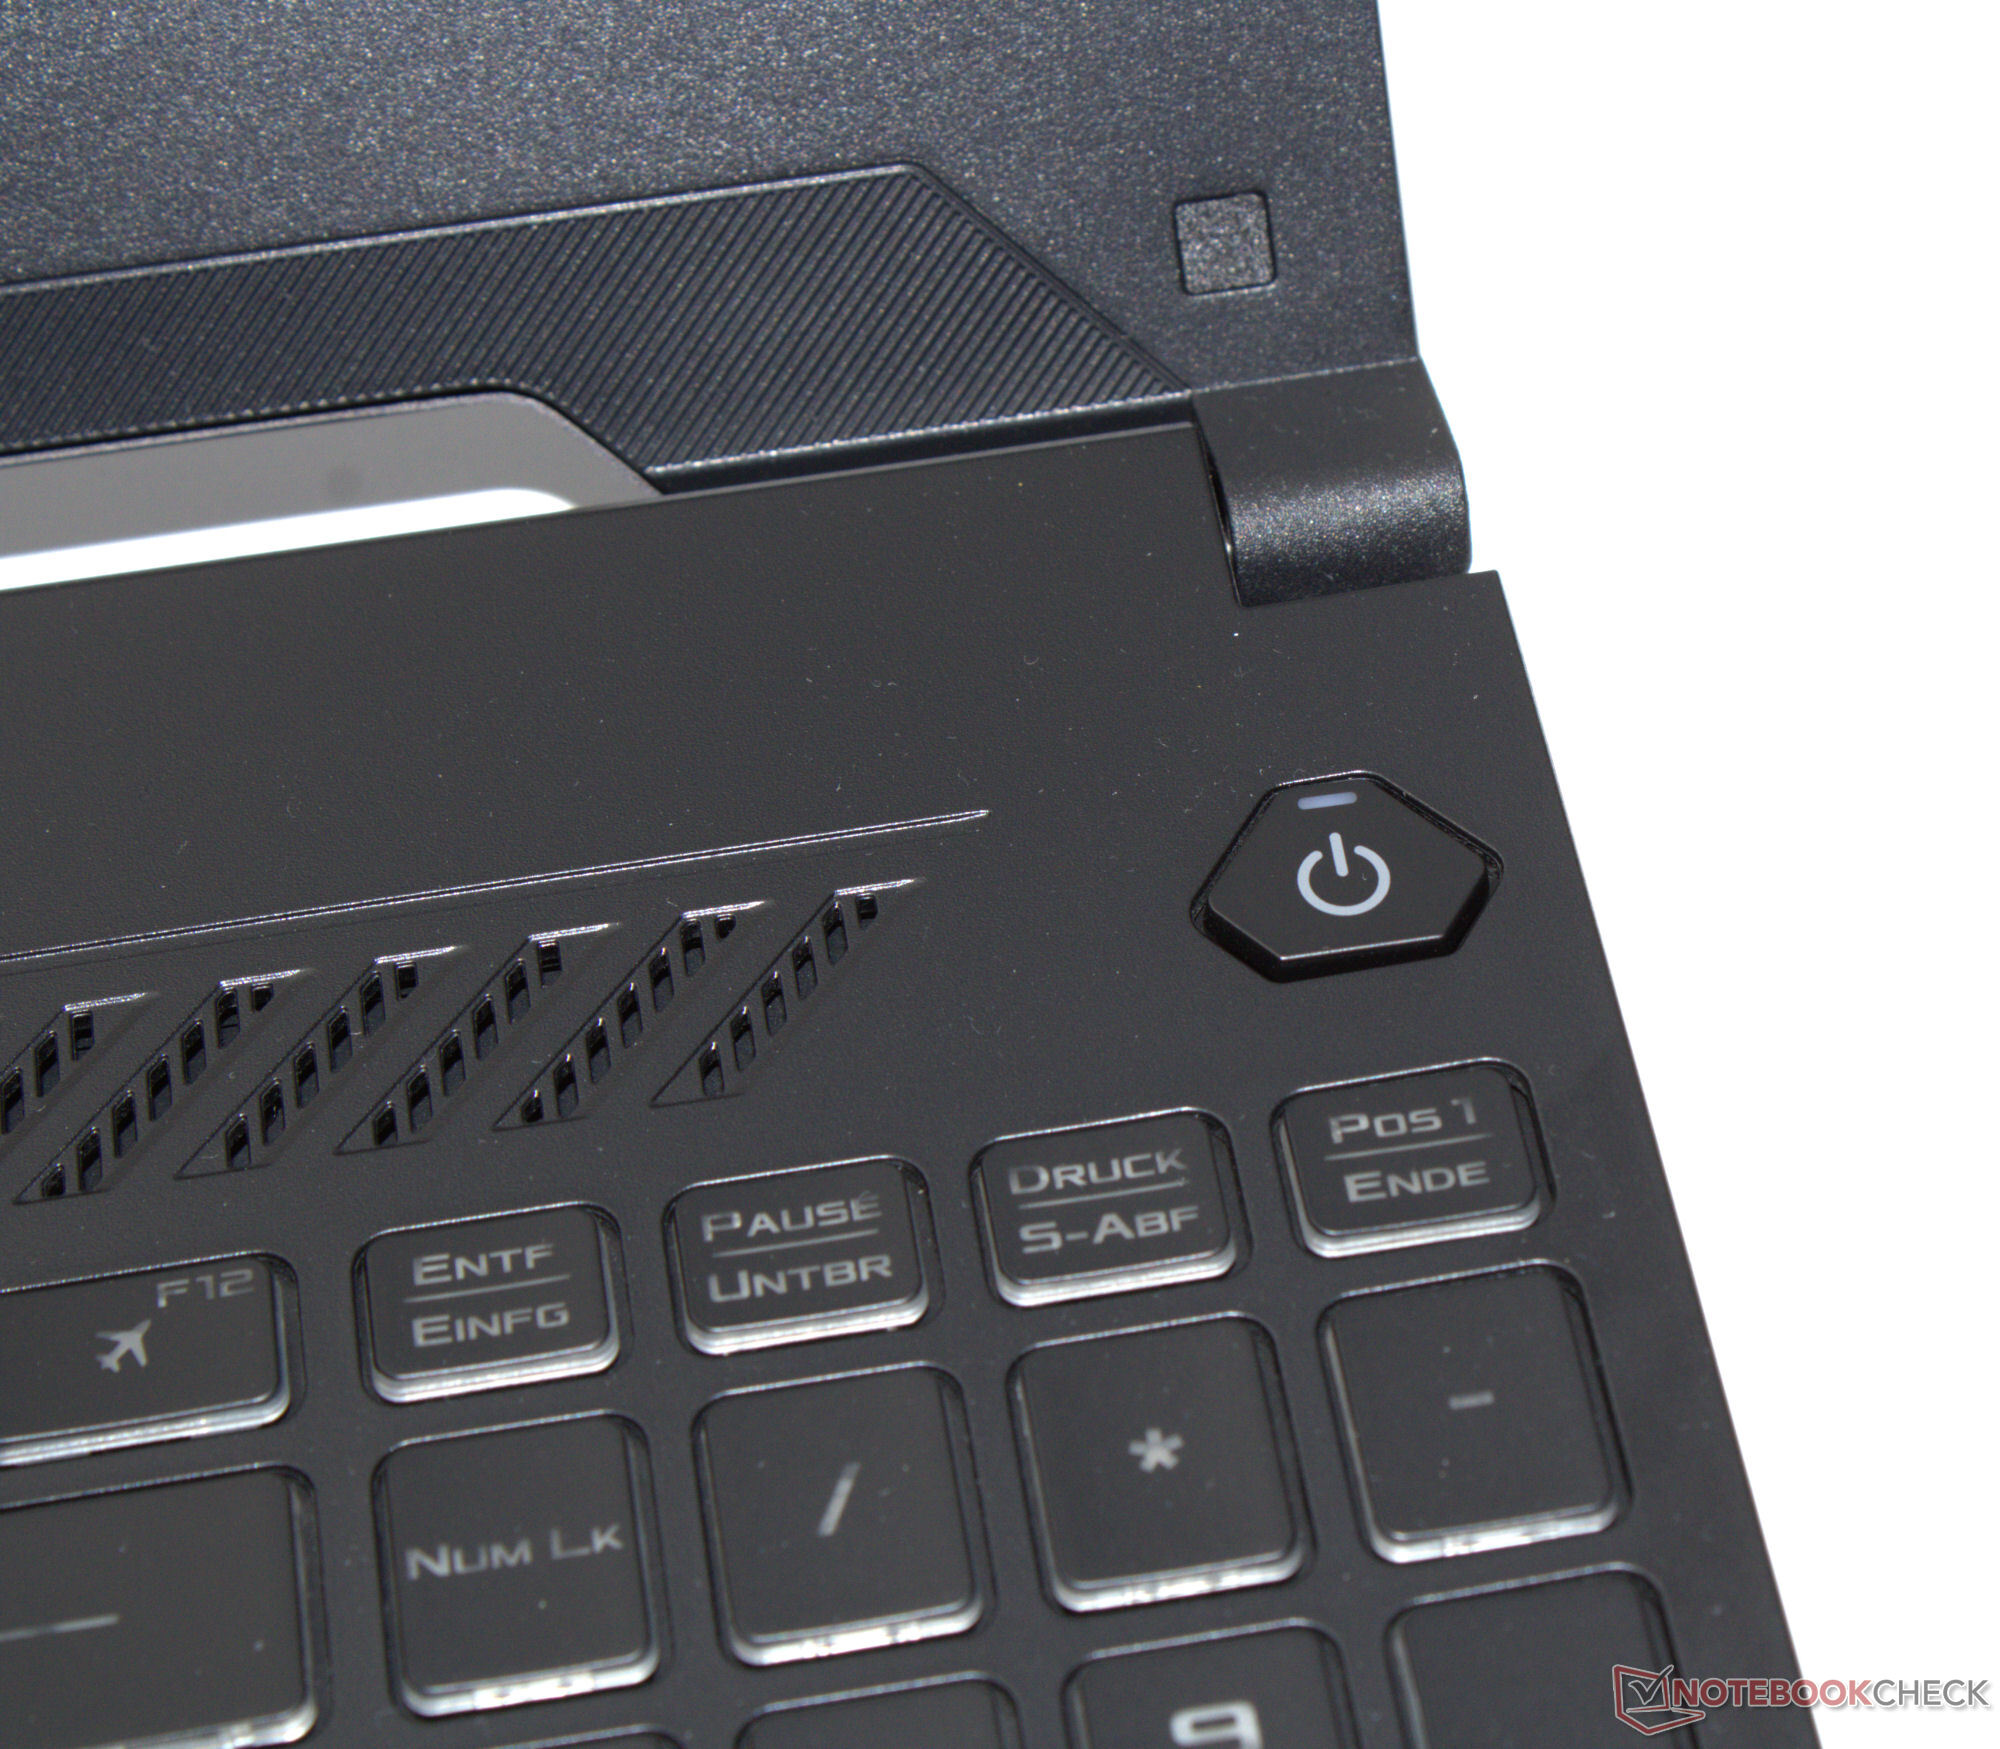
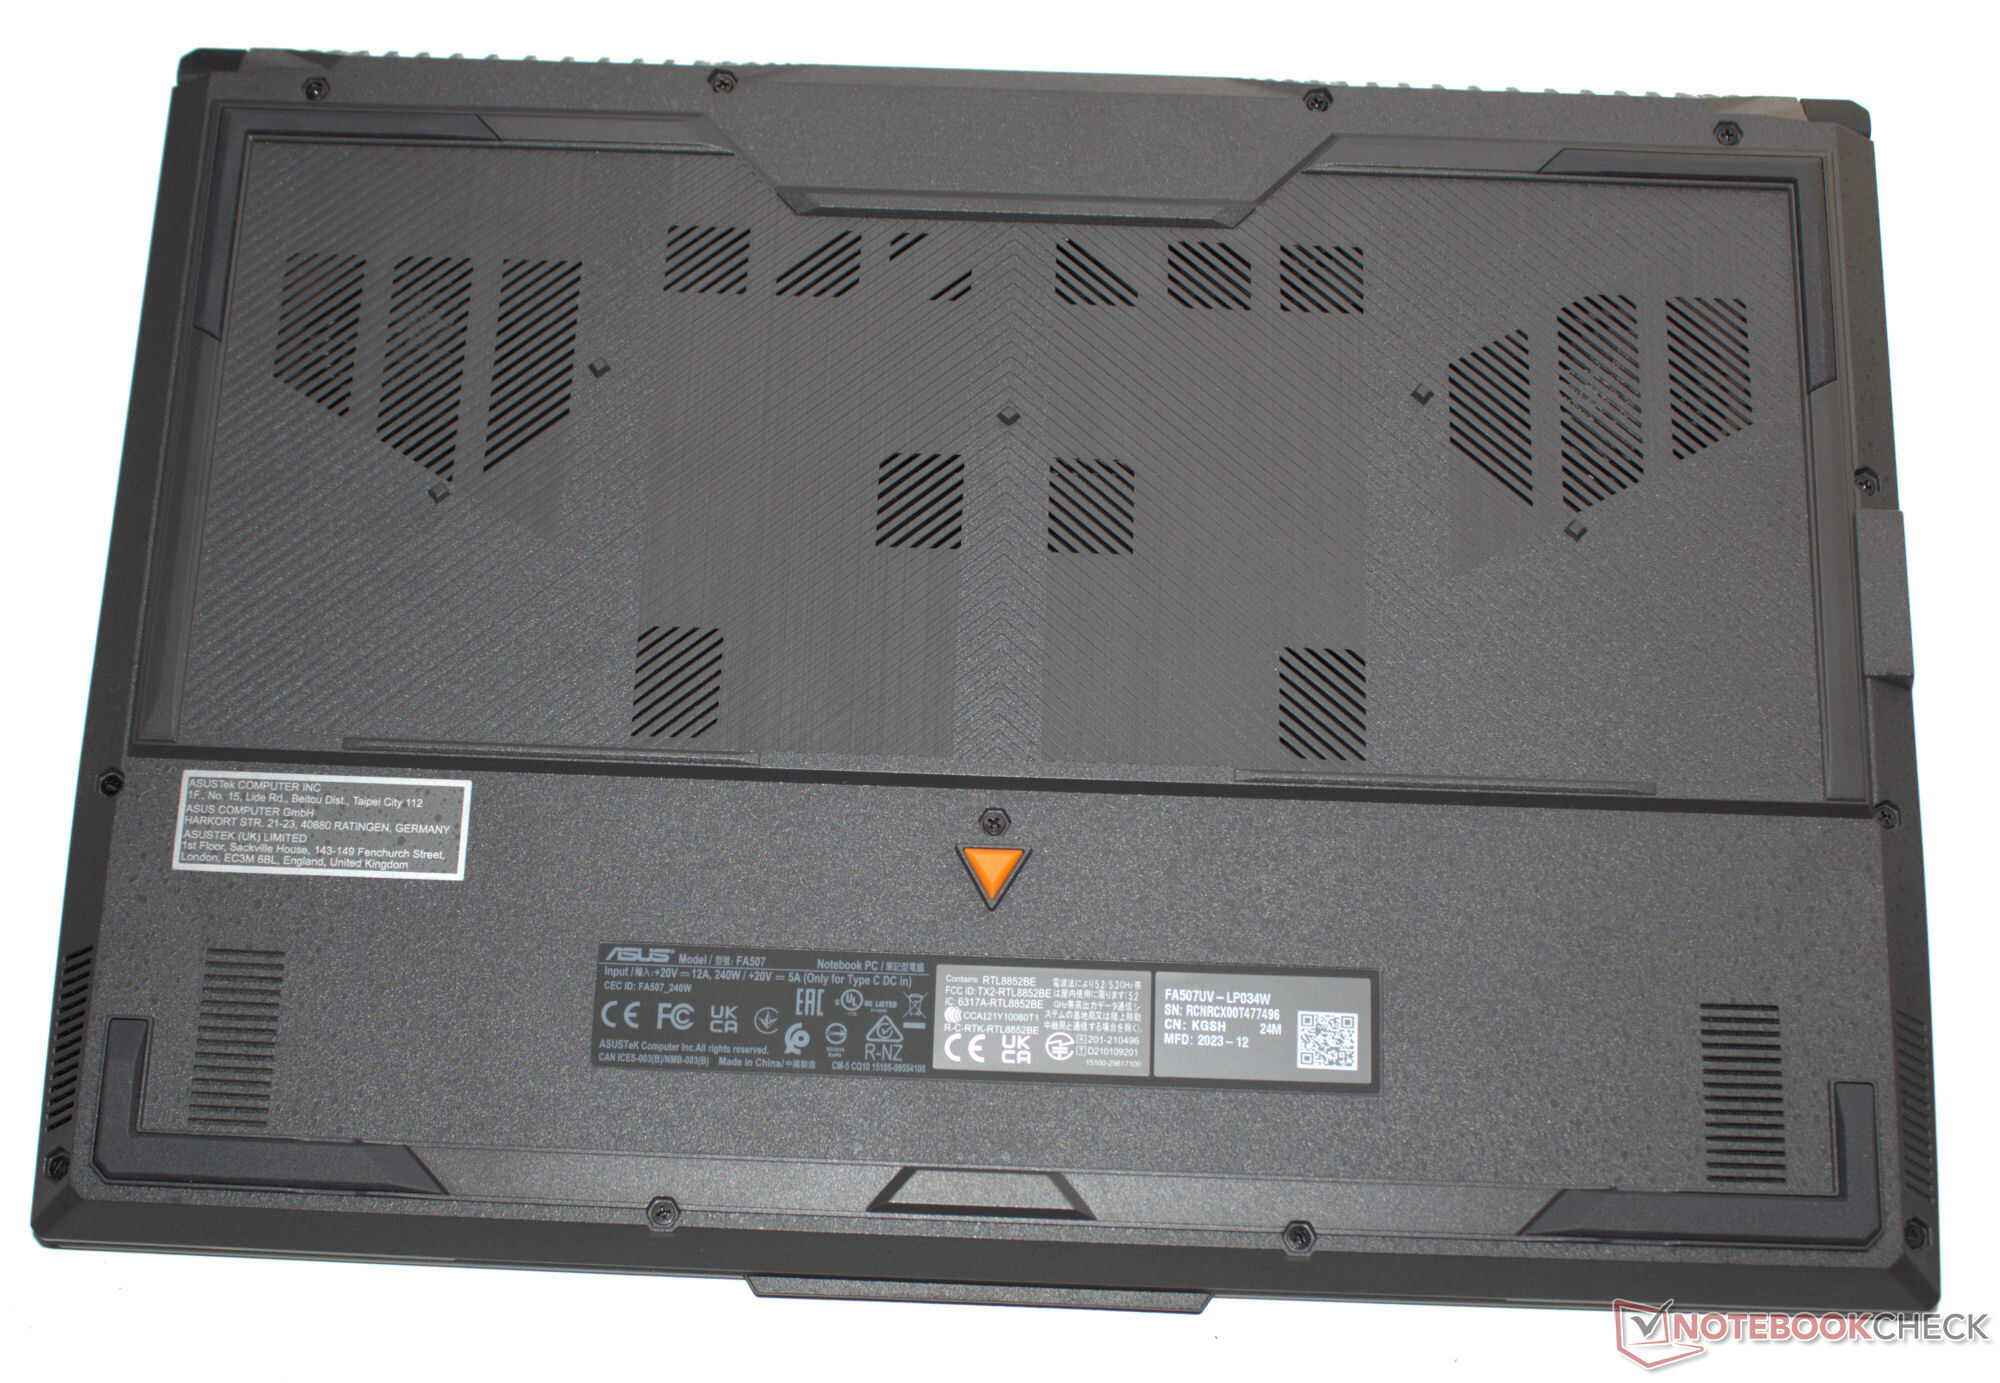
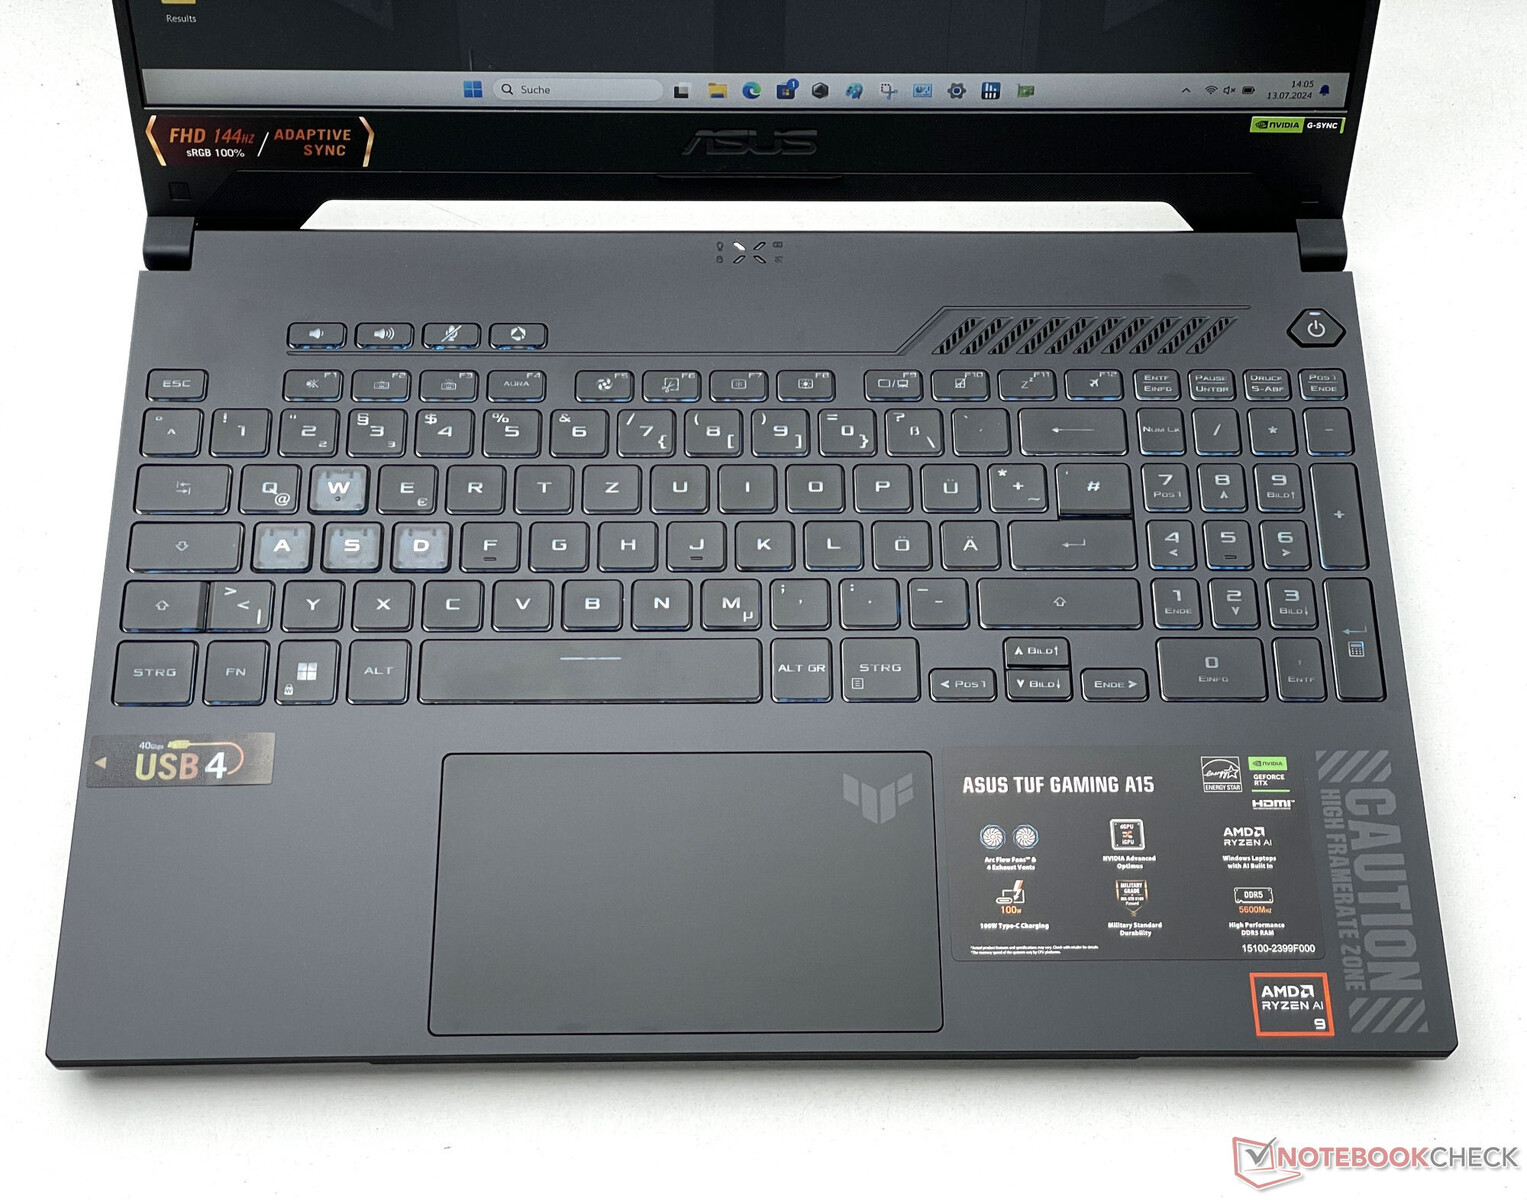
Kasa ve özellikler - Asus TUF ve USB 4
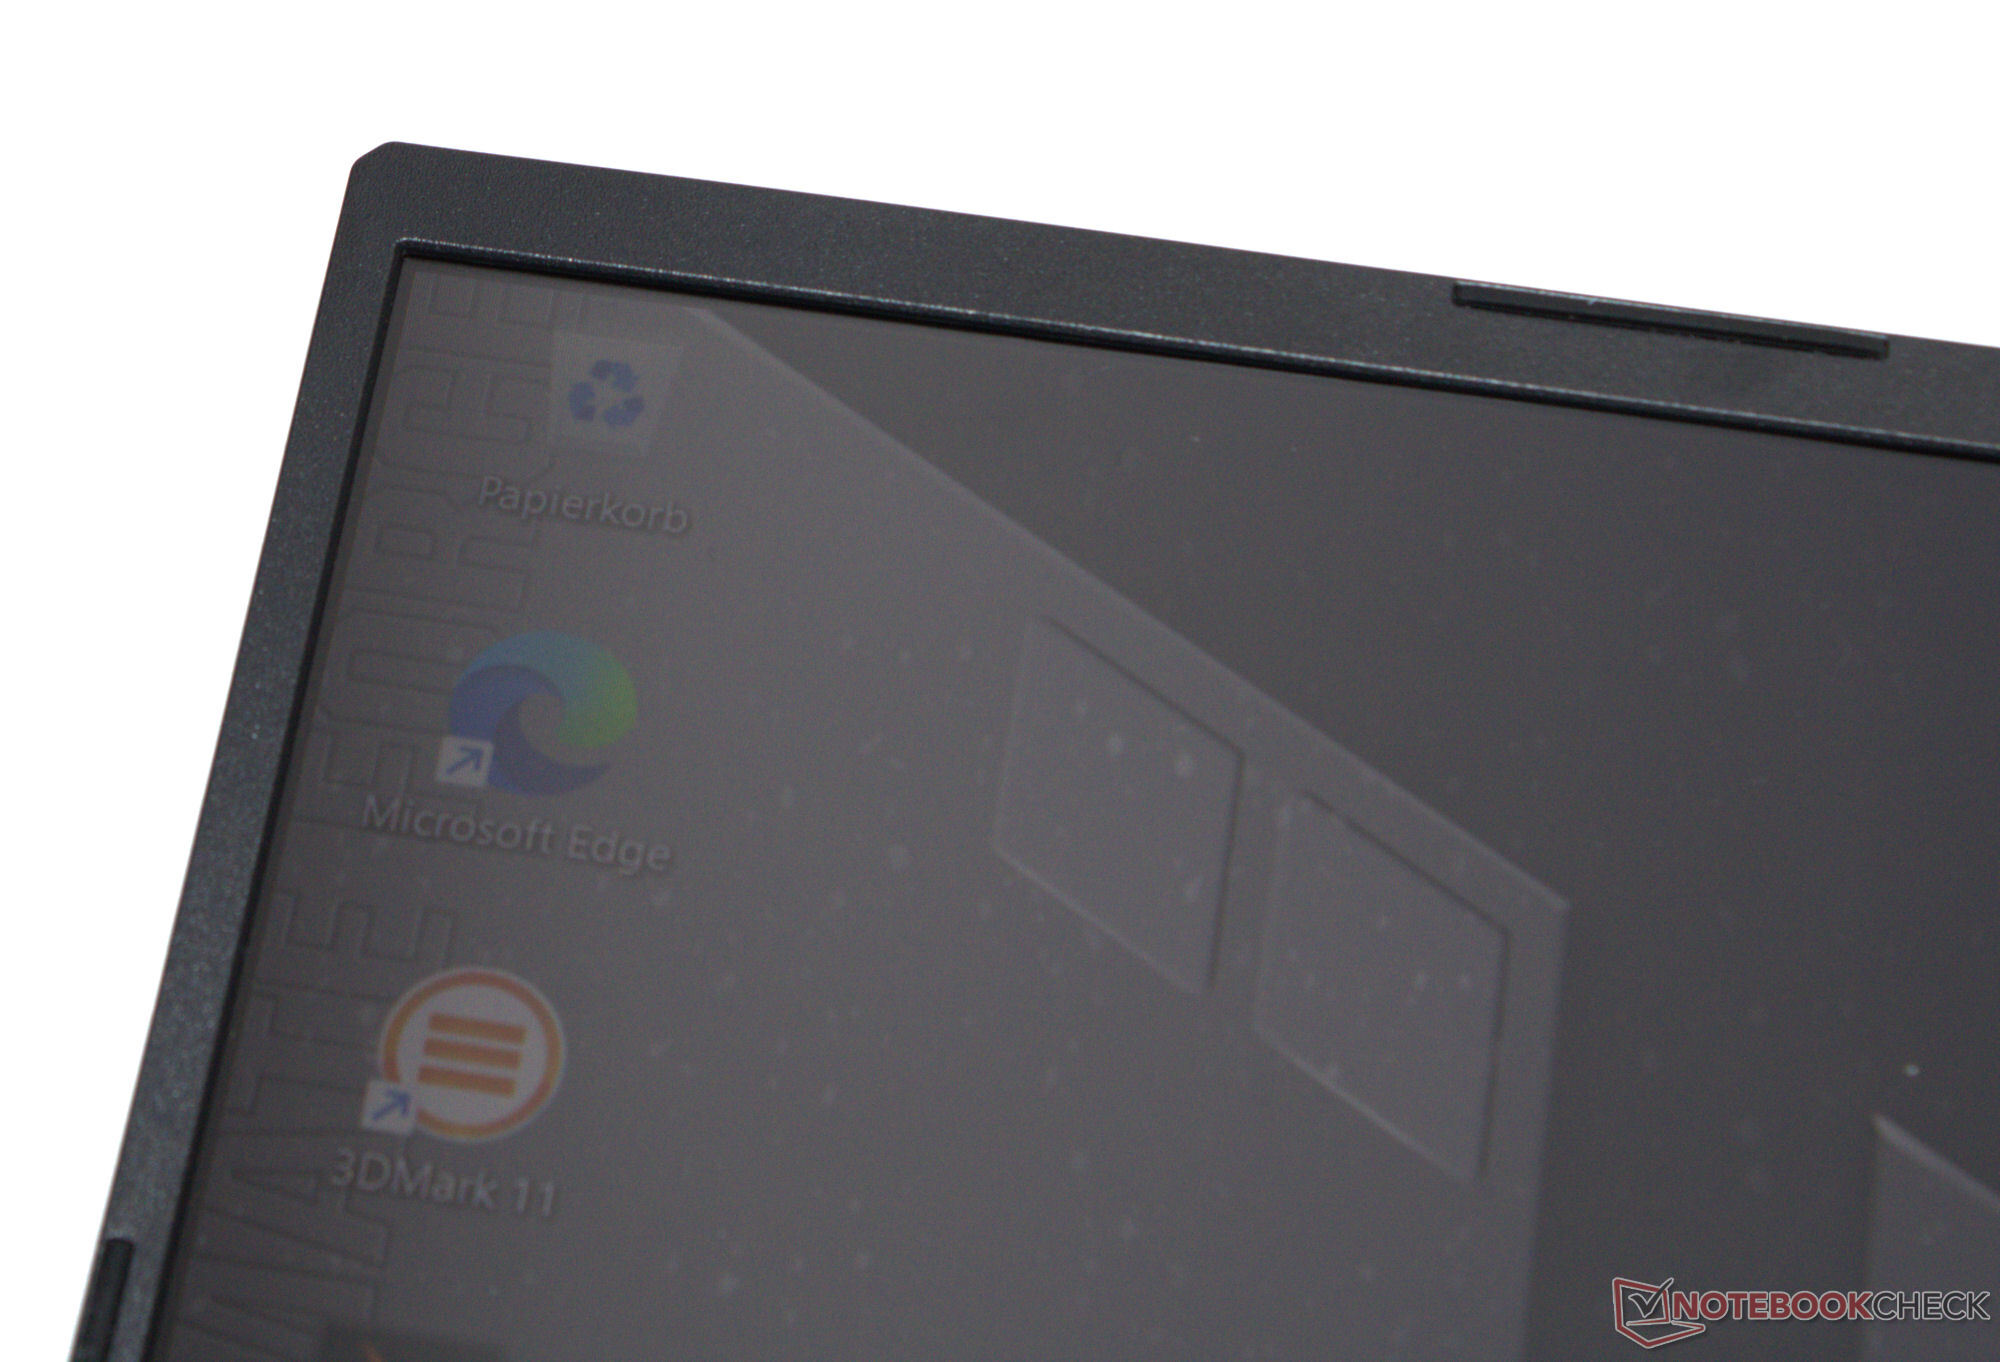
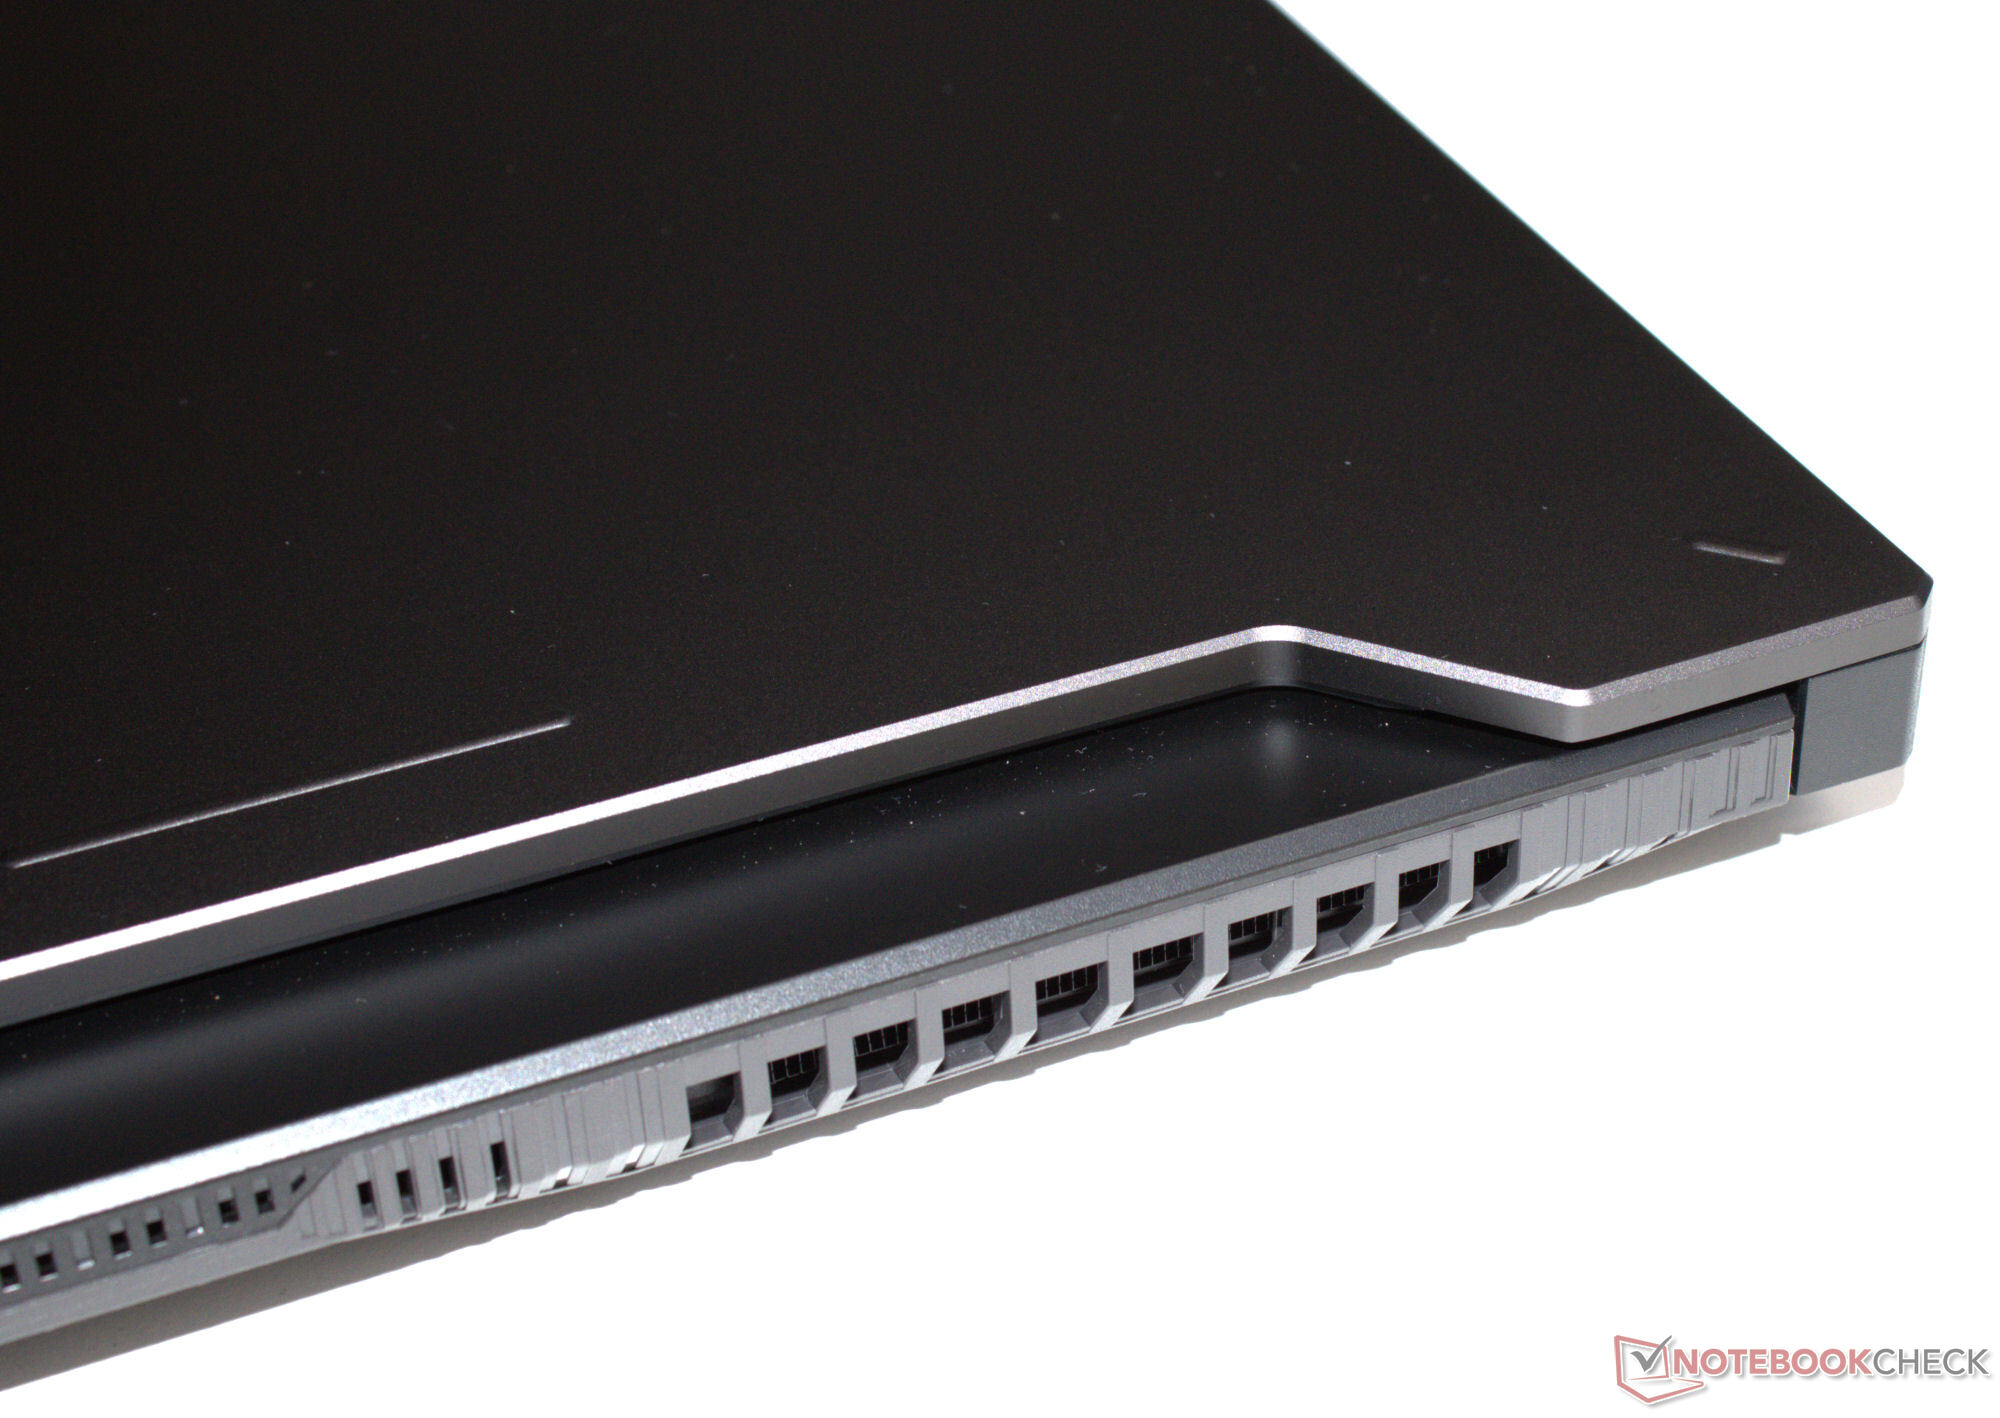
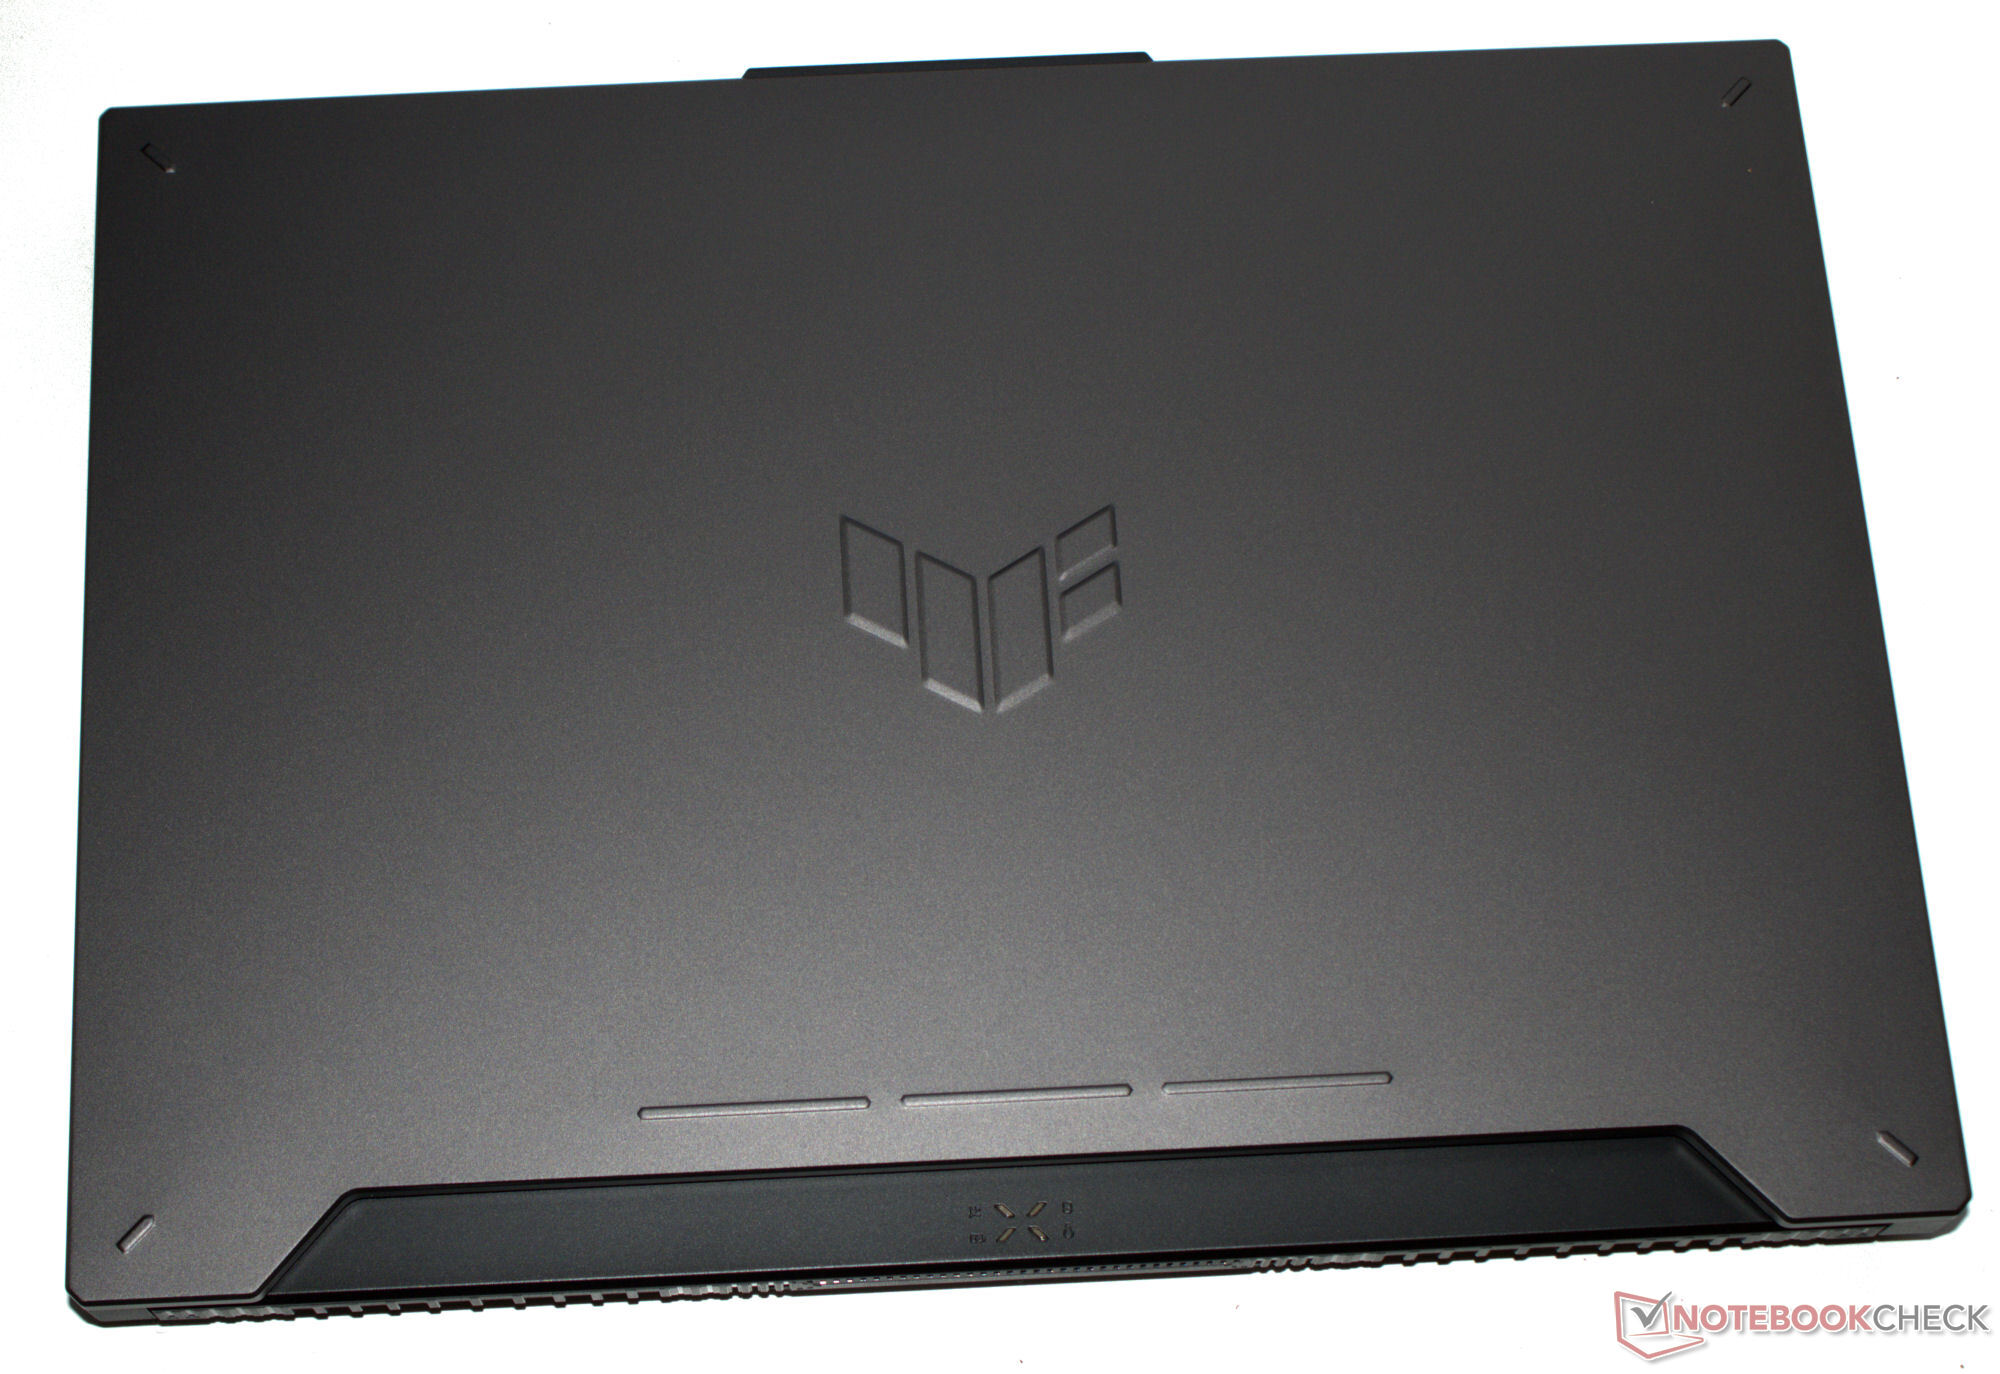
Gri (Mecha Gray), mat, pürüzsüz yüzeyli şasi zaten iyi biliniyor geçen yılın A15'i. Stabilite sorunu yoktur ve ana ünite (plastik) ve kapak (metal arka) kabul edilebilir sınırlar içinde bükülebilir. Kapağın maksimum açılma açısı yaklaşık 130 derecedir.
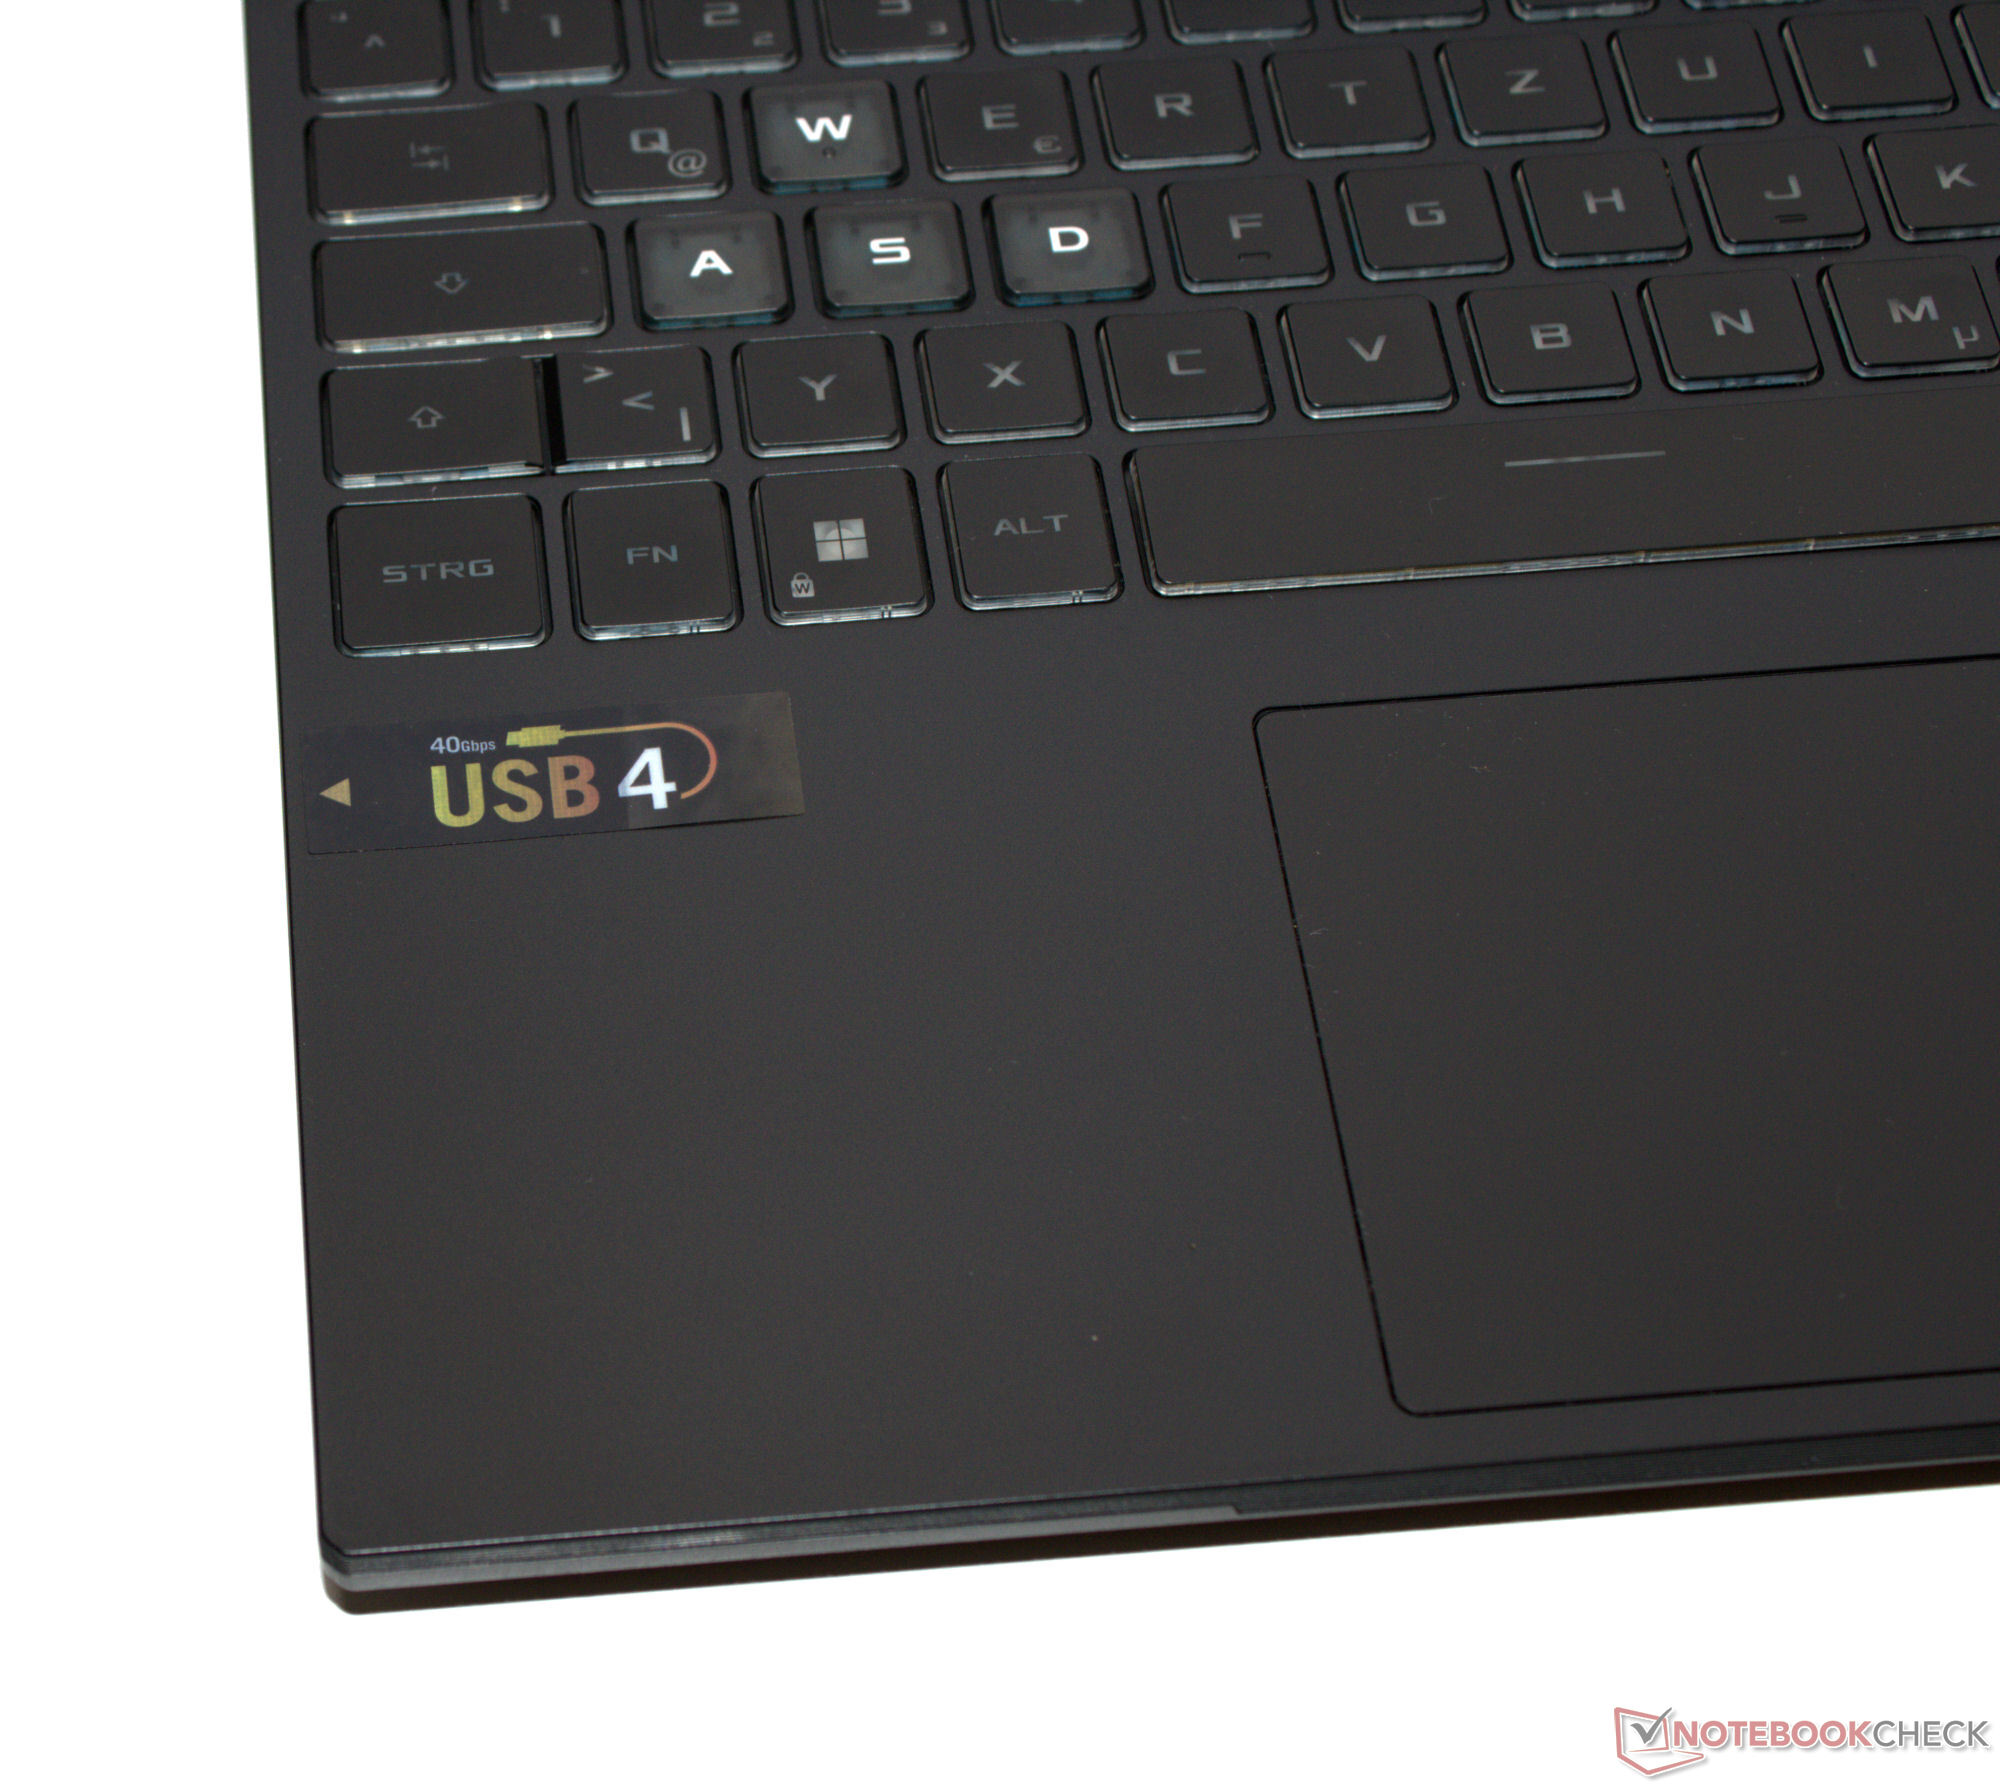
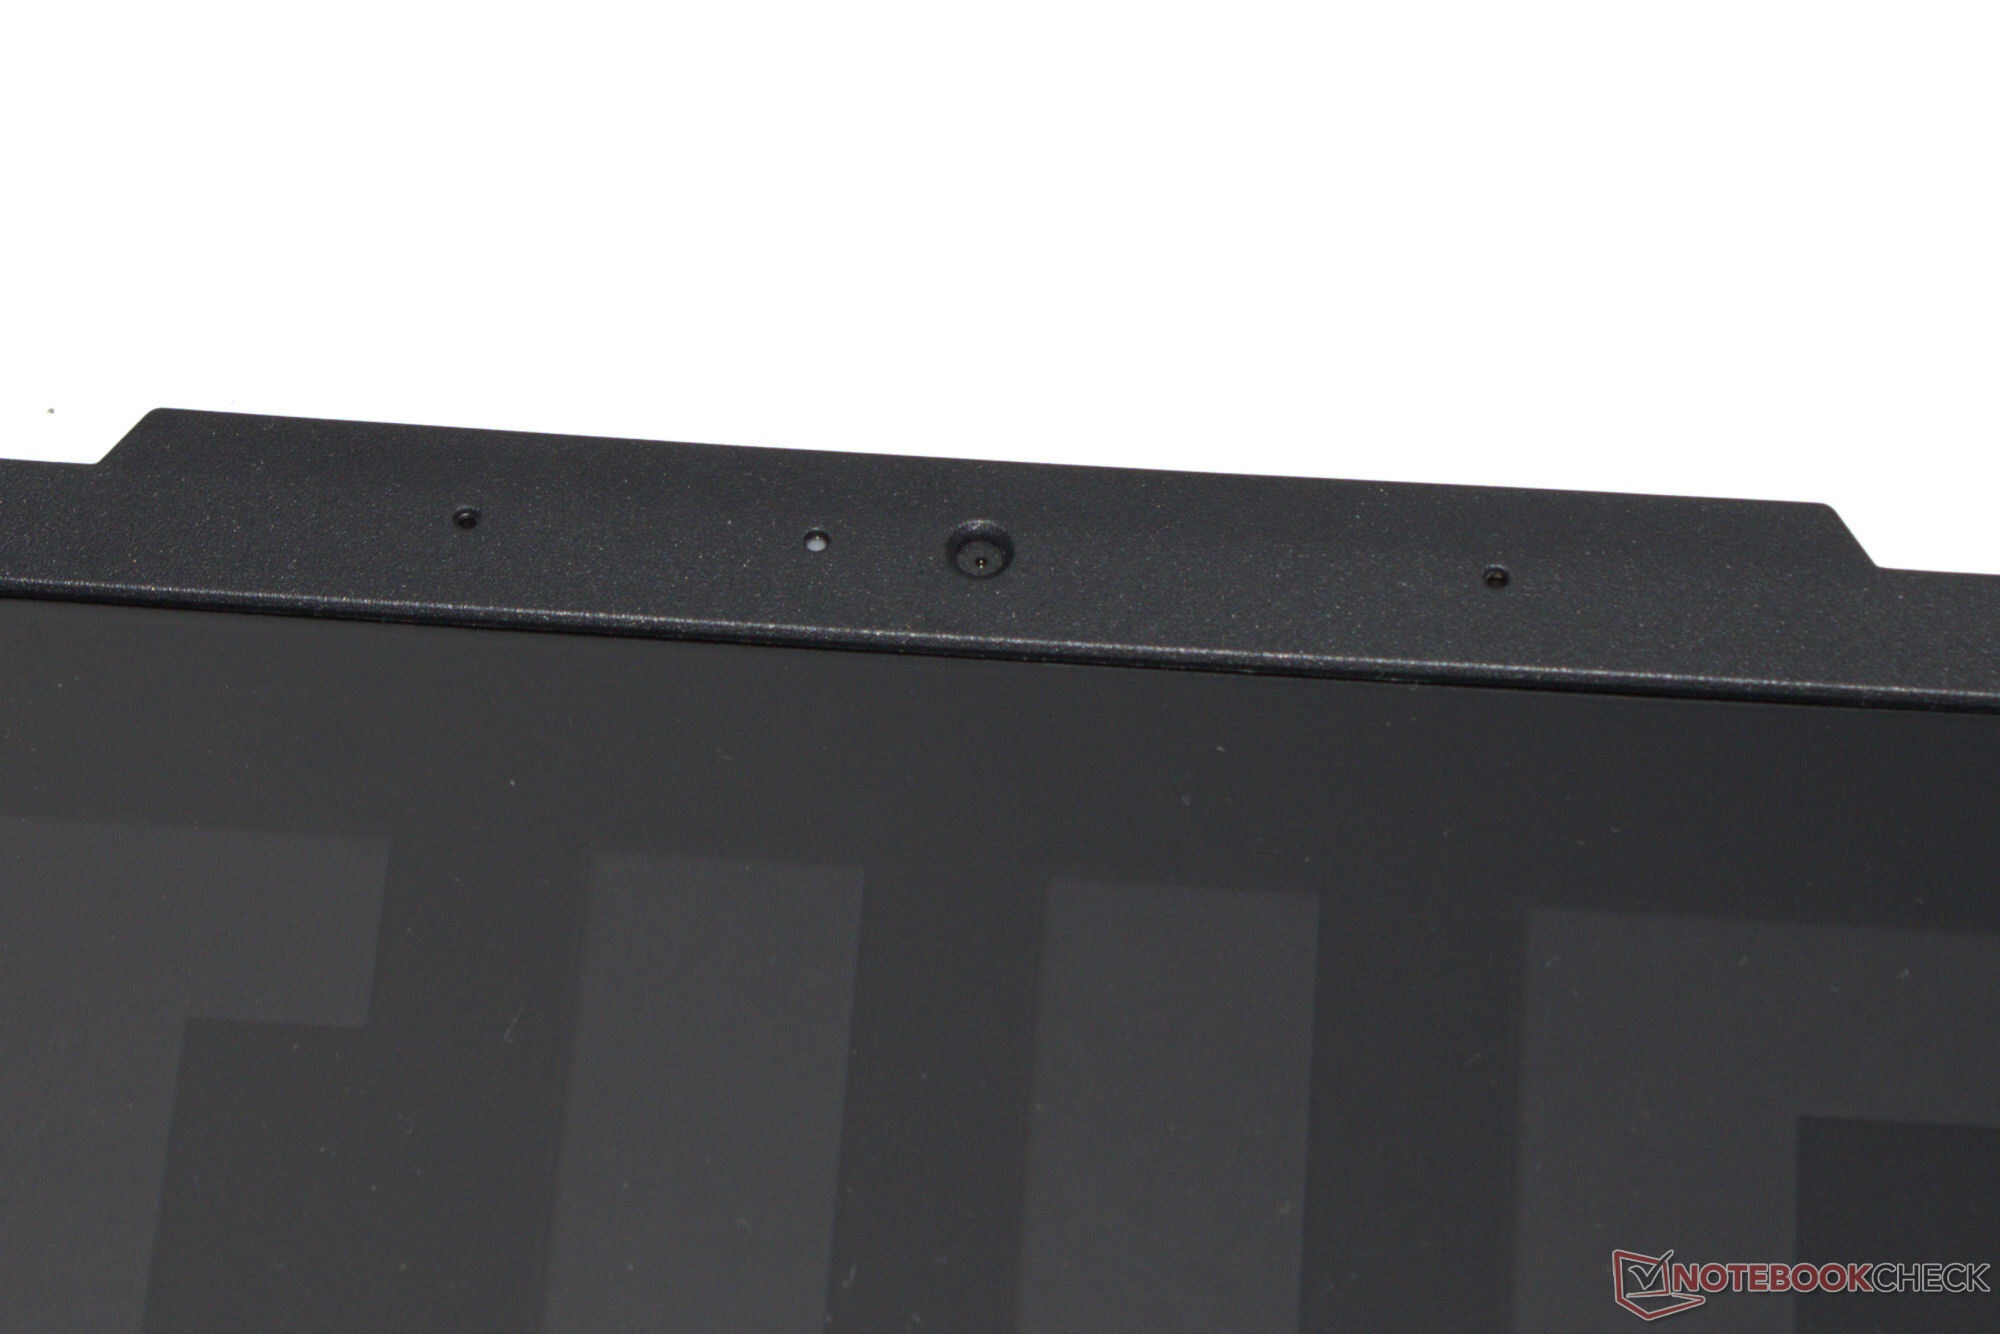
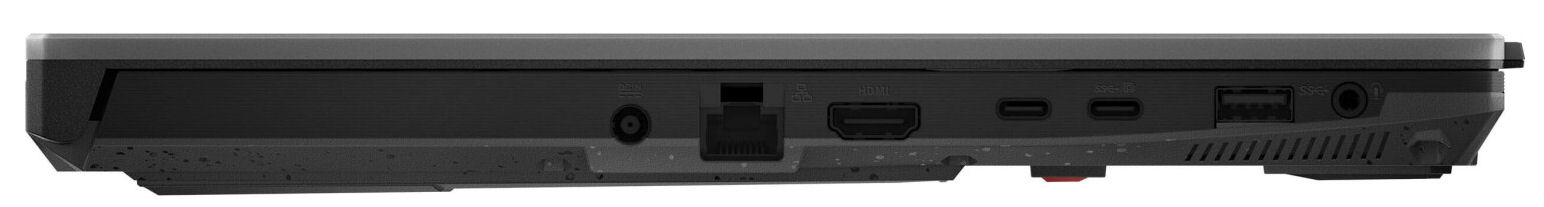
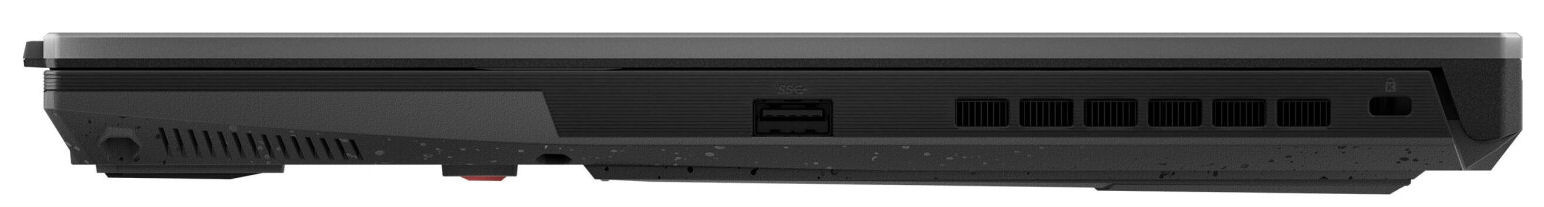
Bağlantı noktalarının çoğuna bilgisayarın sol tarafında yer ayrılmıştır. Bunlar arasında iki USB-A bağlantı noktası (USB 3.2 Gen 1) ve iki USB-C konektörü (1x USB 3.2 Gen 2, 1x USB 4) yer alıyor. İkincisi DisplayPort Alt Modunu destekliyor ve ek olarak USB 3.2 bağlantı noktası Güç Dağıtımı sunuyor. Bu, TUF'un üç video çıkışına (1x HDMI, 2x DP) sahip olduğu anlamına geliyor. Web kamerası tarafından üretilen görüntüler (0,9 MP, deklanşör yok) herhangi bir ödül kazanmayacaktır. A15 bir bellek kartı okuyucusuna ev sahipliği yapmıyor.
Asus bilgisayar, Realtek'in RTL8852BE çipini (WiFi 6) kullanan giriş seviyesi dizüstü bilgisayarlar arasına katılıyor. Kablosuz çip makul aktarım hızları sunsa da potansiyeline ulaşmakta yetersiz kalıyor ve rakip Intel modülünde görülen hızlara ulaşmayı başaramıyor. Kablolu bağlantılardan bir Gigabit Ethernet denetleyicisi (Realtek RTL8168/8111) sorumludur.


Sürdürülebilirlik
Dizüstü bilgisayar kutusunun içinde çoğunlukla karton bulacaksınız ve çok fazla plastik bulamayacaksınız. Dizüstü bilgisayar, PSU'yu çizilmelere karşı koruyan şeffaf bir kılıf ile plastik fiber bir torbaya yerleştirilmiştir. Son olarak, ekranı çizilmelere karşı koruyan bir ek parça da bulunmaktadır. Her üç durumda da uygulanan plastikler belirtilmiştir.
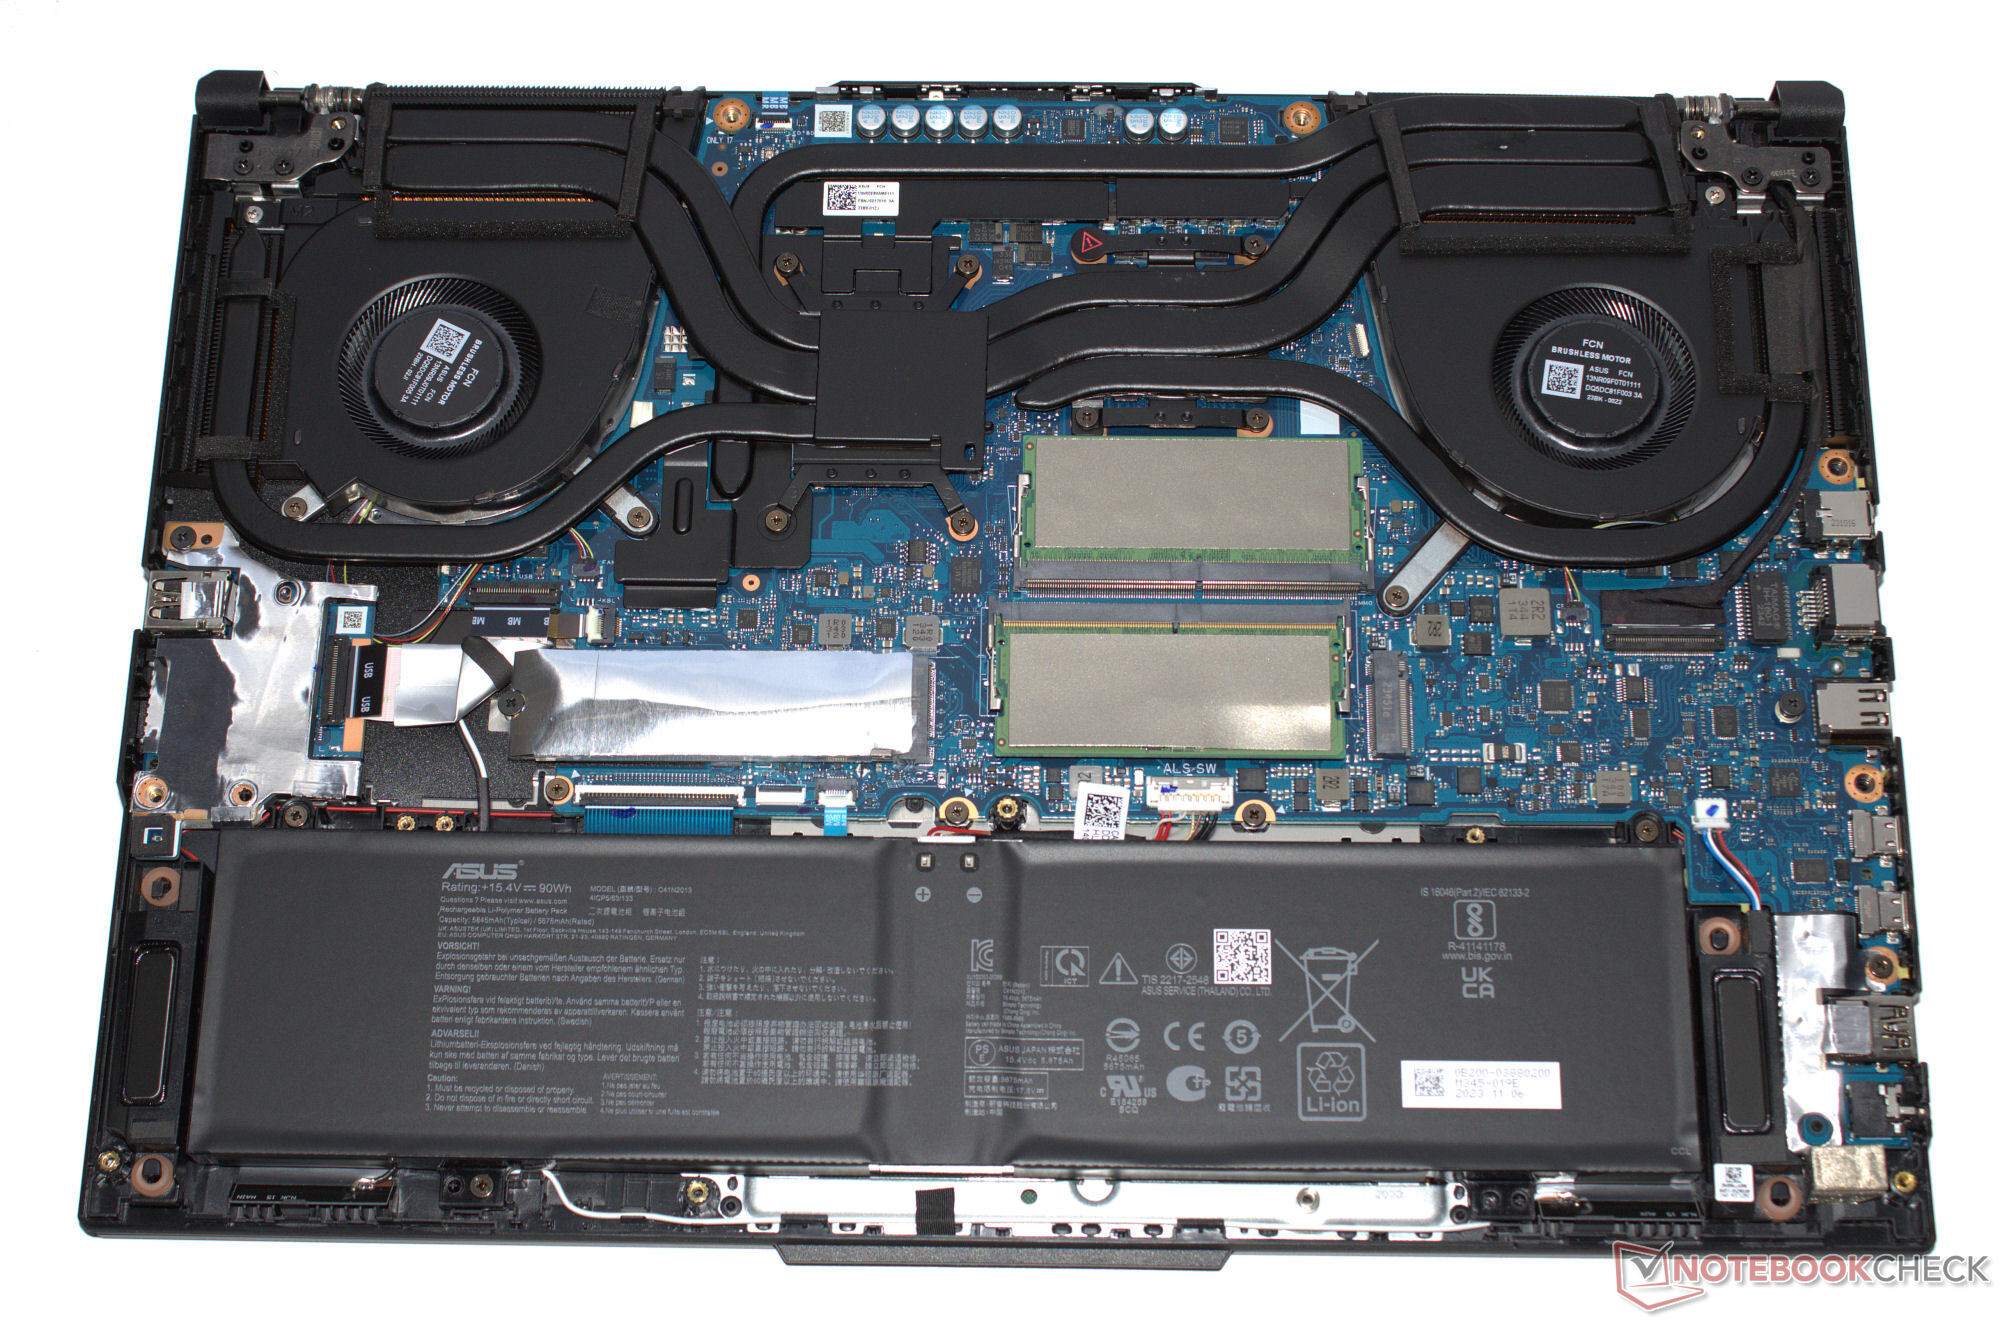
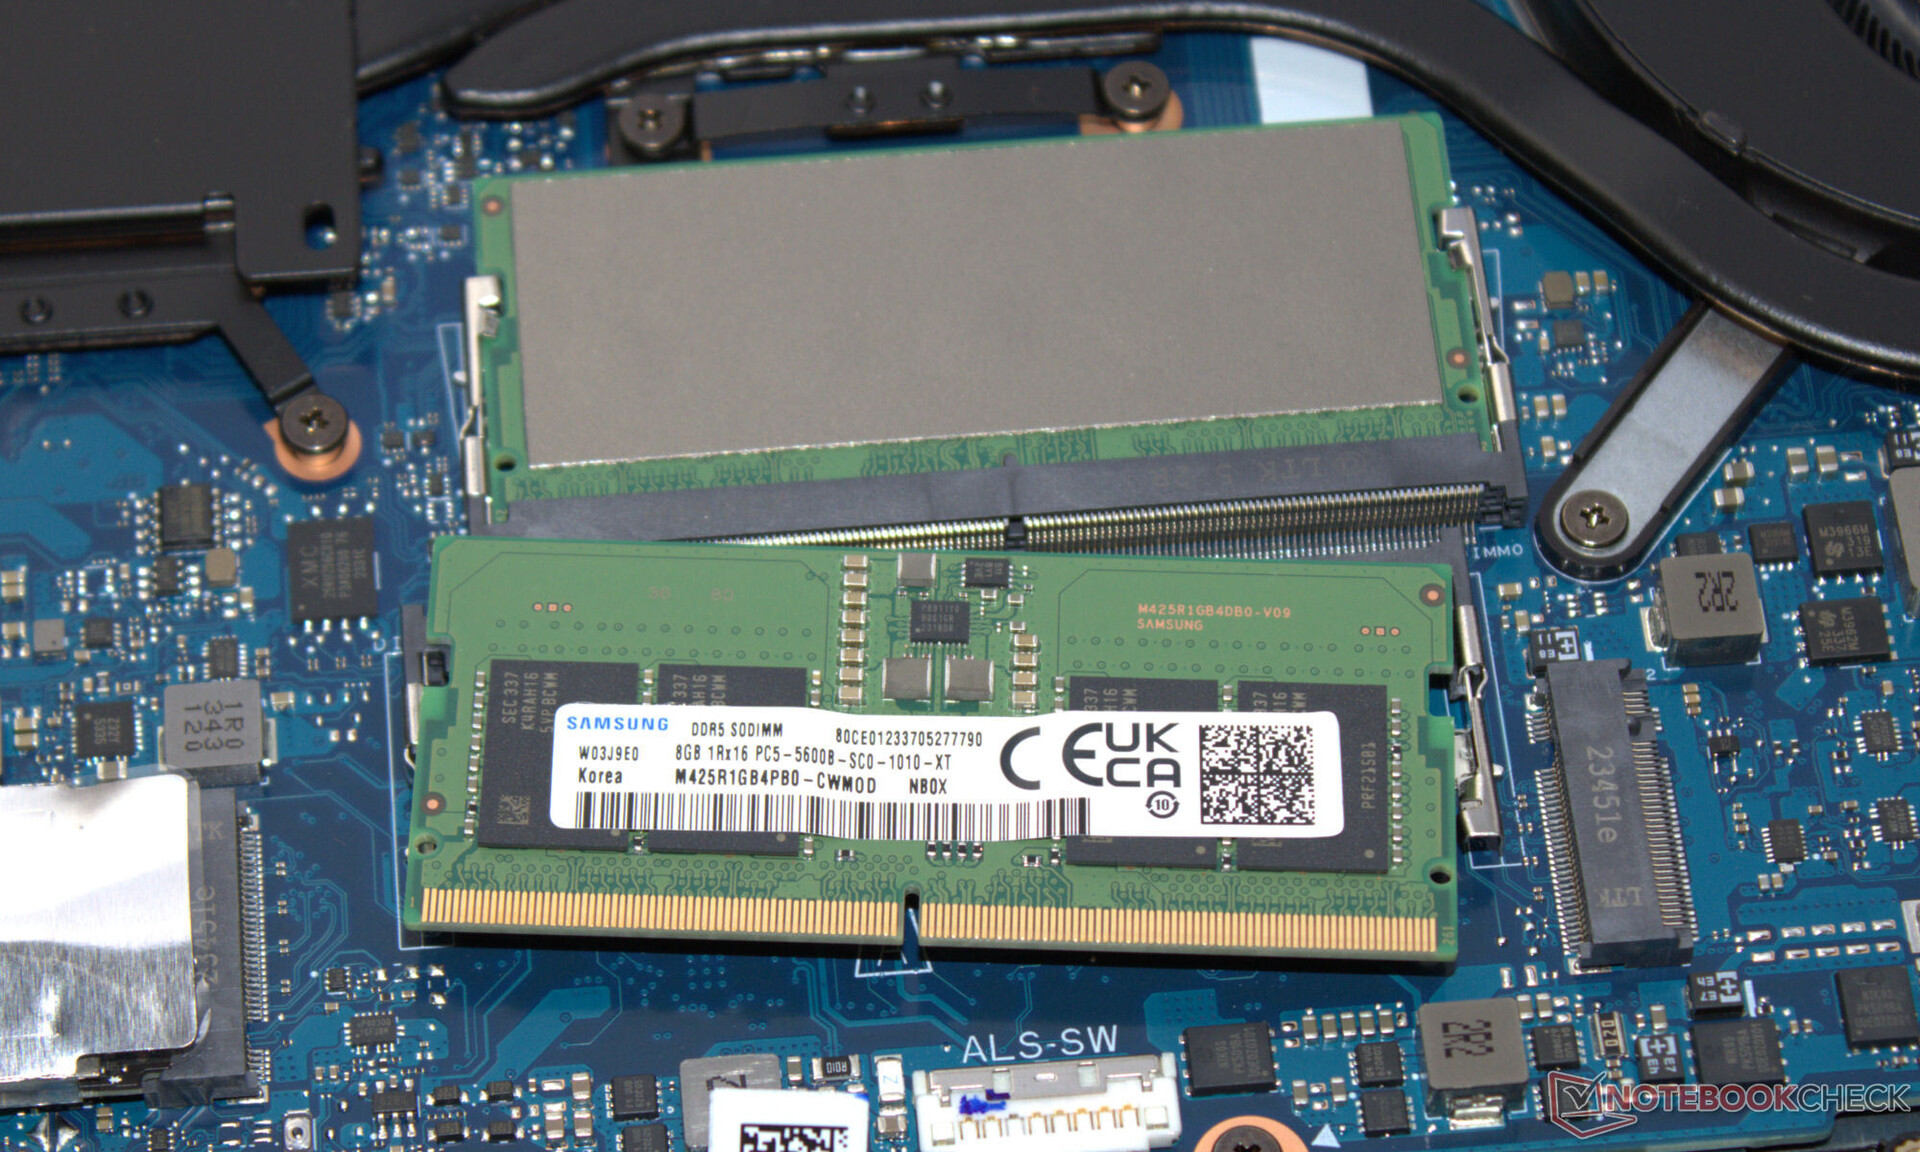
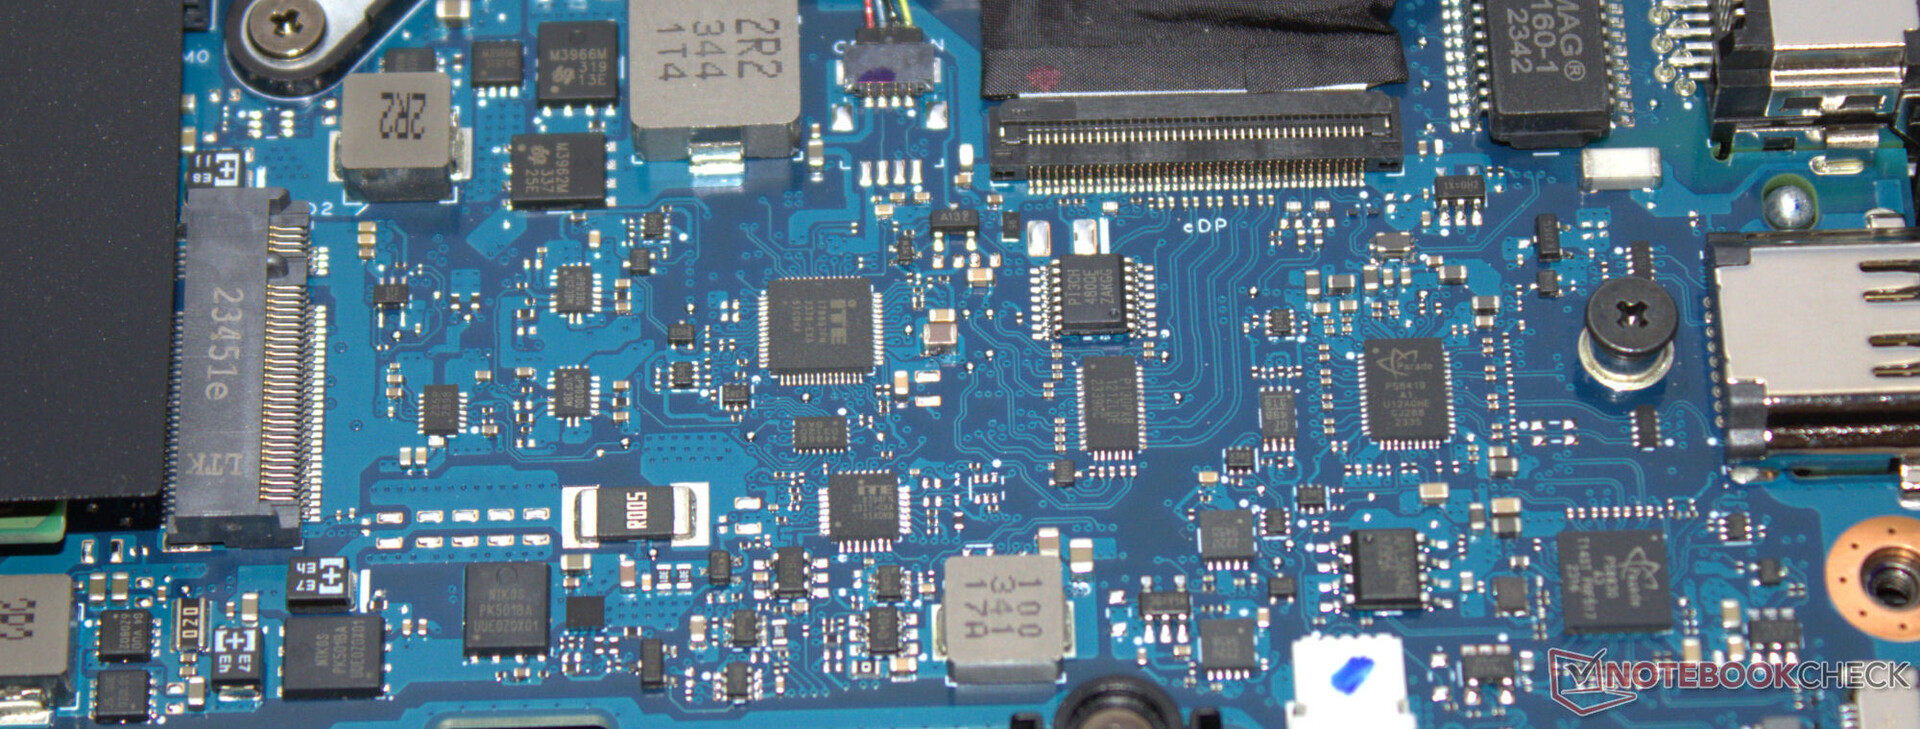
Çıkarılabilir taban plakası sayesinde onarım yapmak kolay olmalı - tüm donanıma erişilebilir. Cihazın içinde herhangi bir yapıştırılmış geçmişle karşılaşmadık. Yazılım güncellemeleri önümüzdeki yıllarda bir sorun teşkil etmeyecektir. Dizüstü bilgisayarın kendisi EPEAT bronz etiketine sahip.
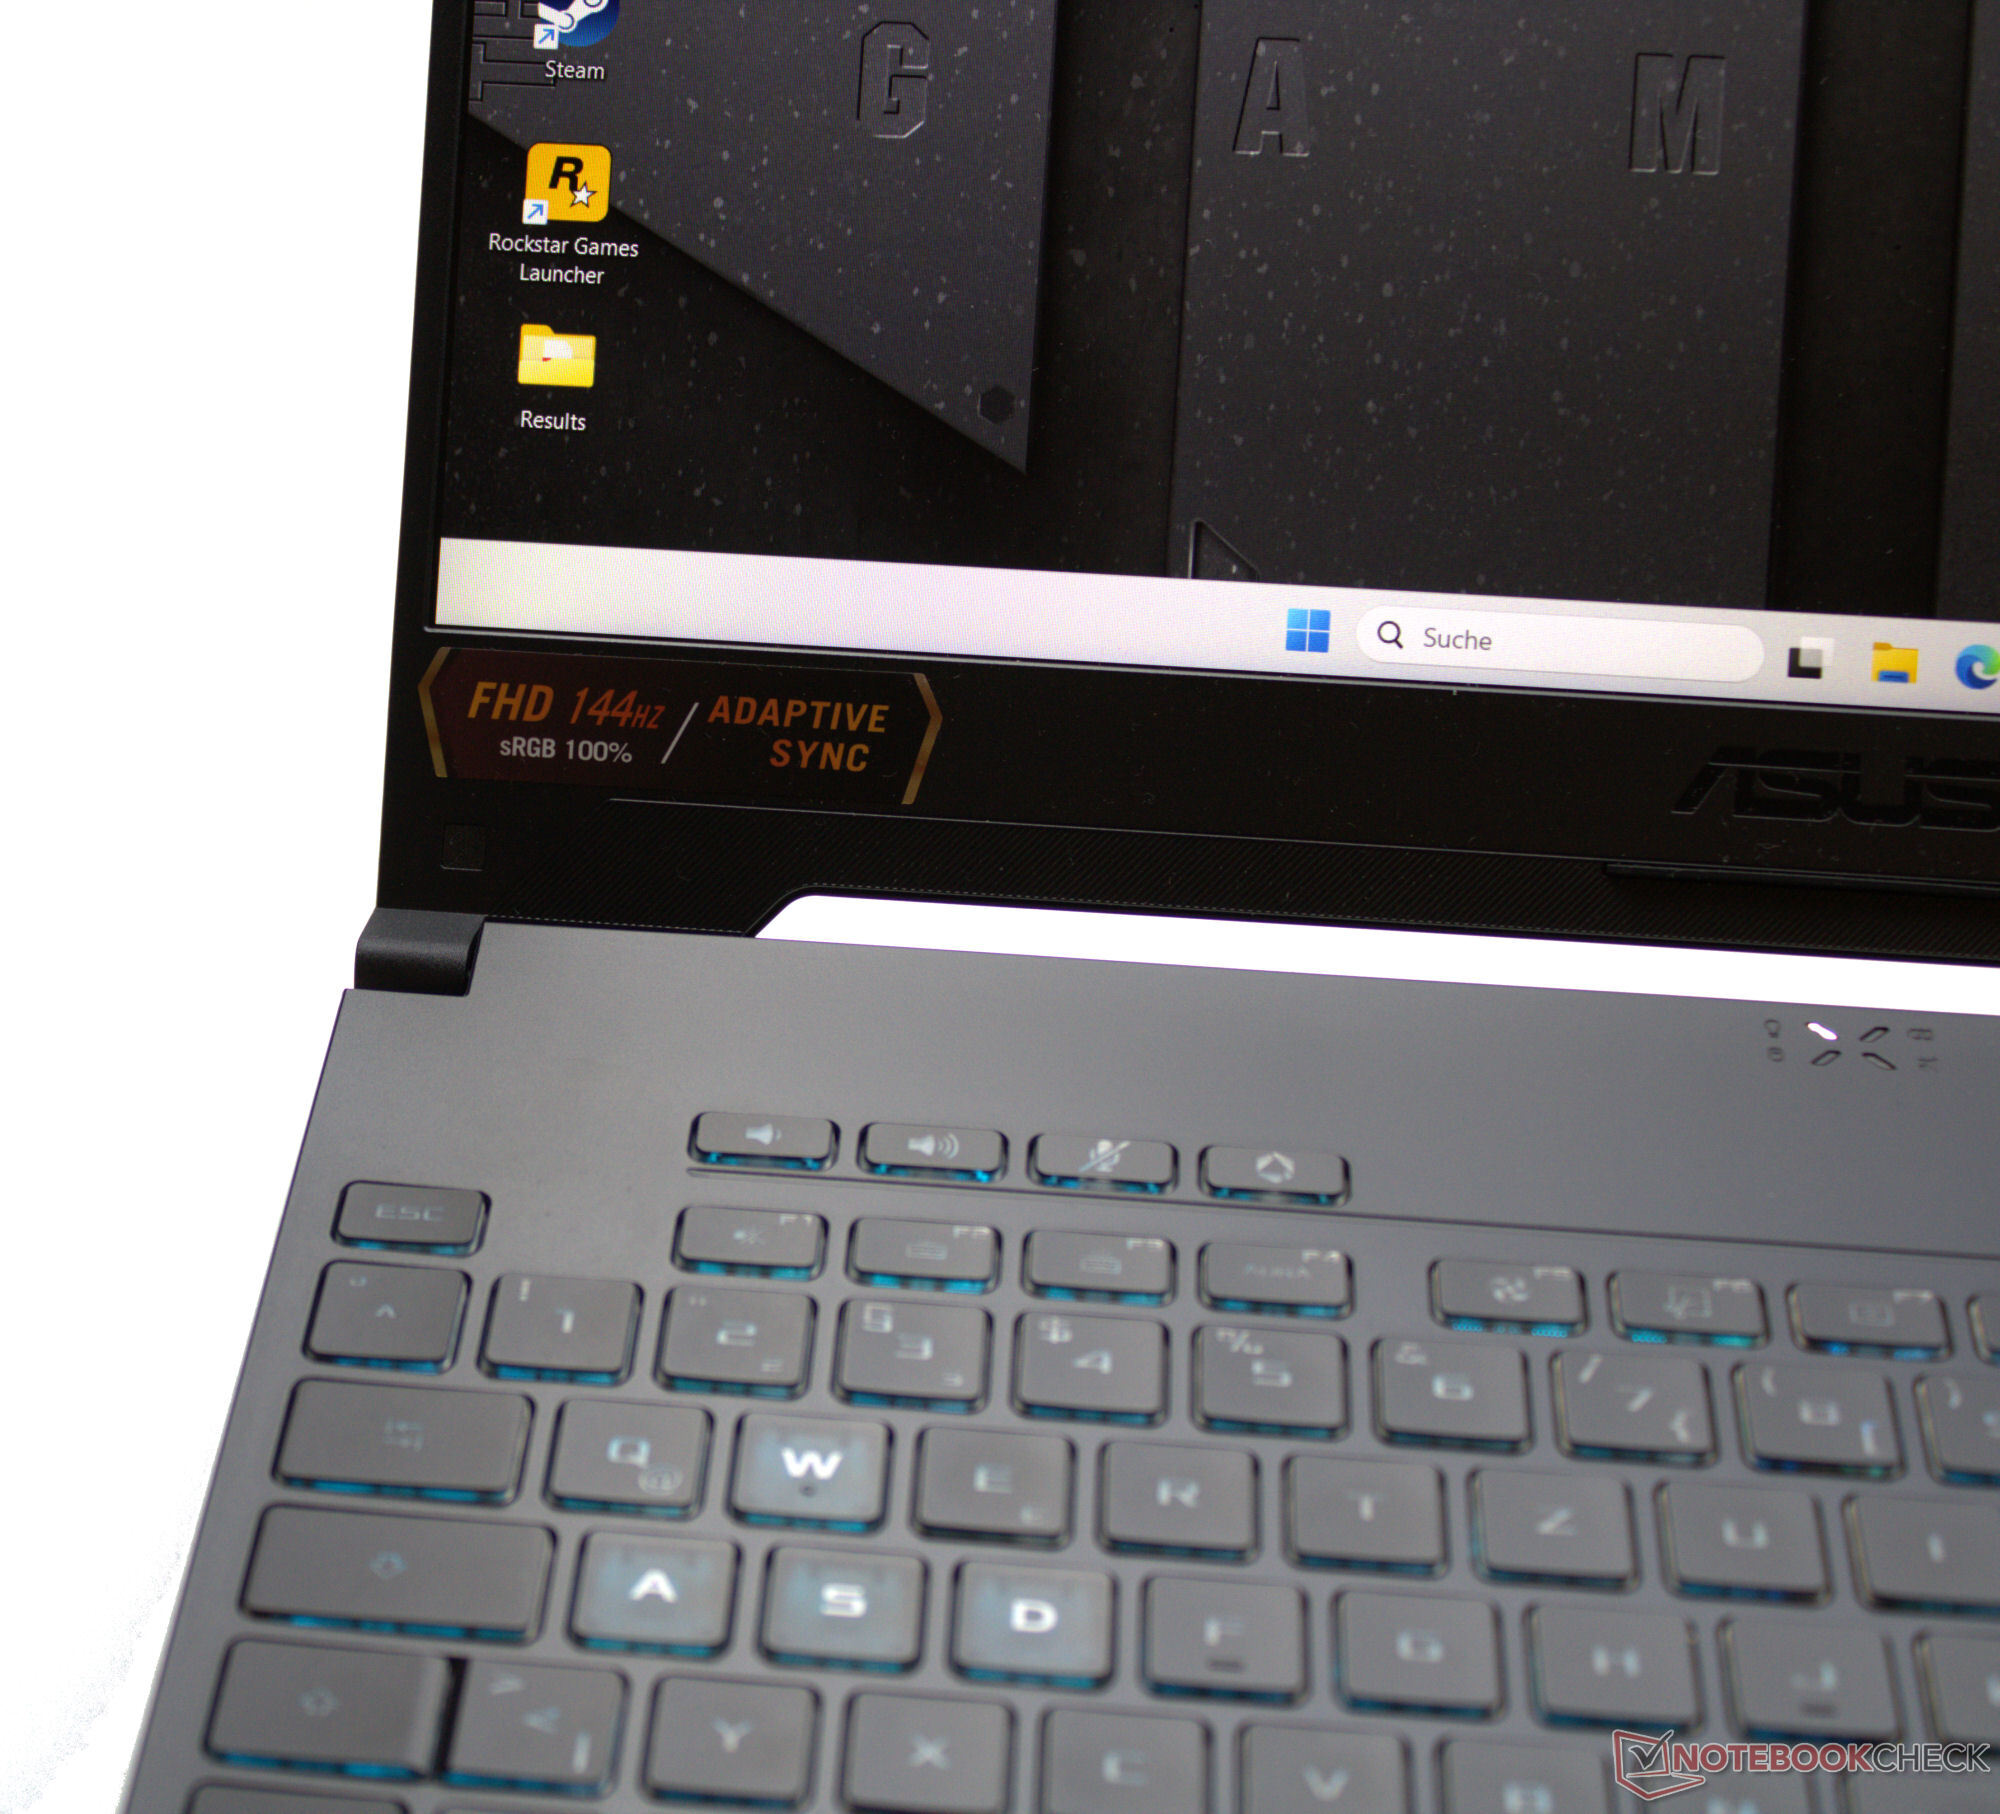
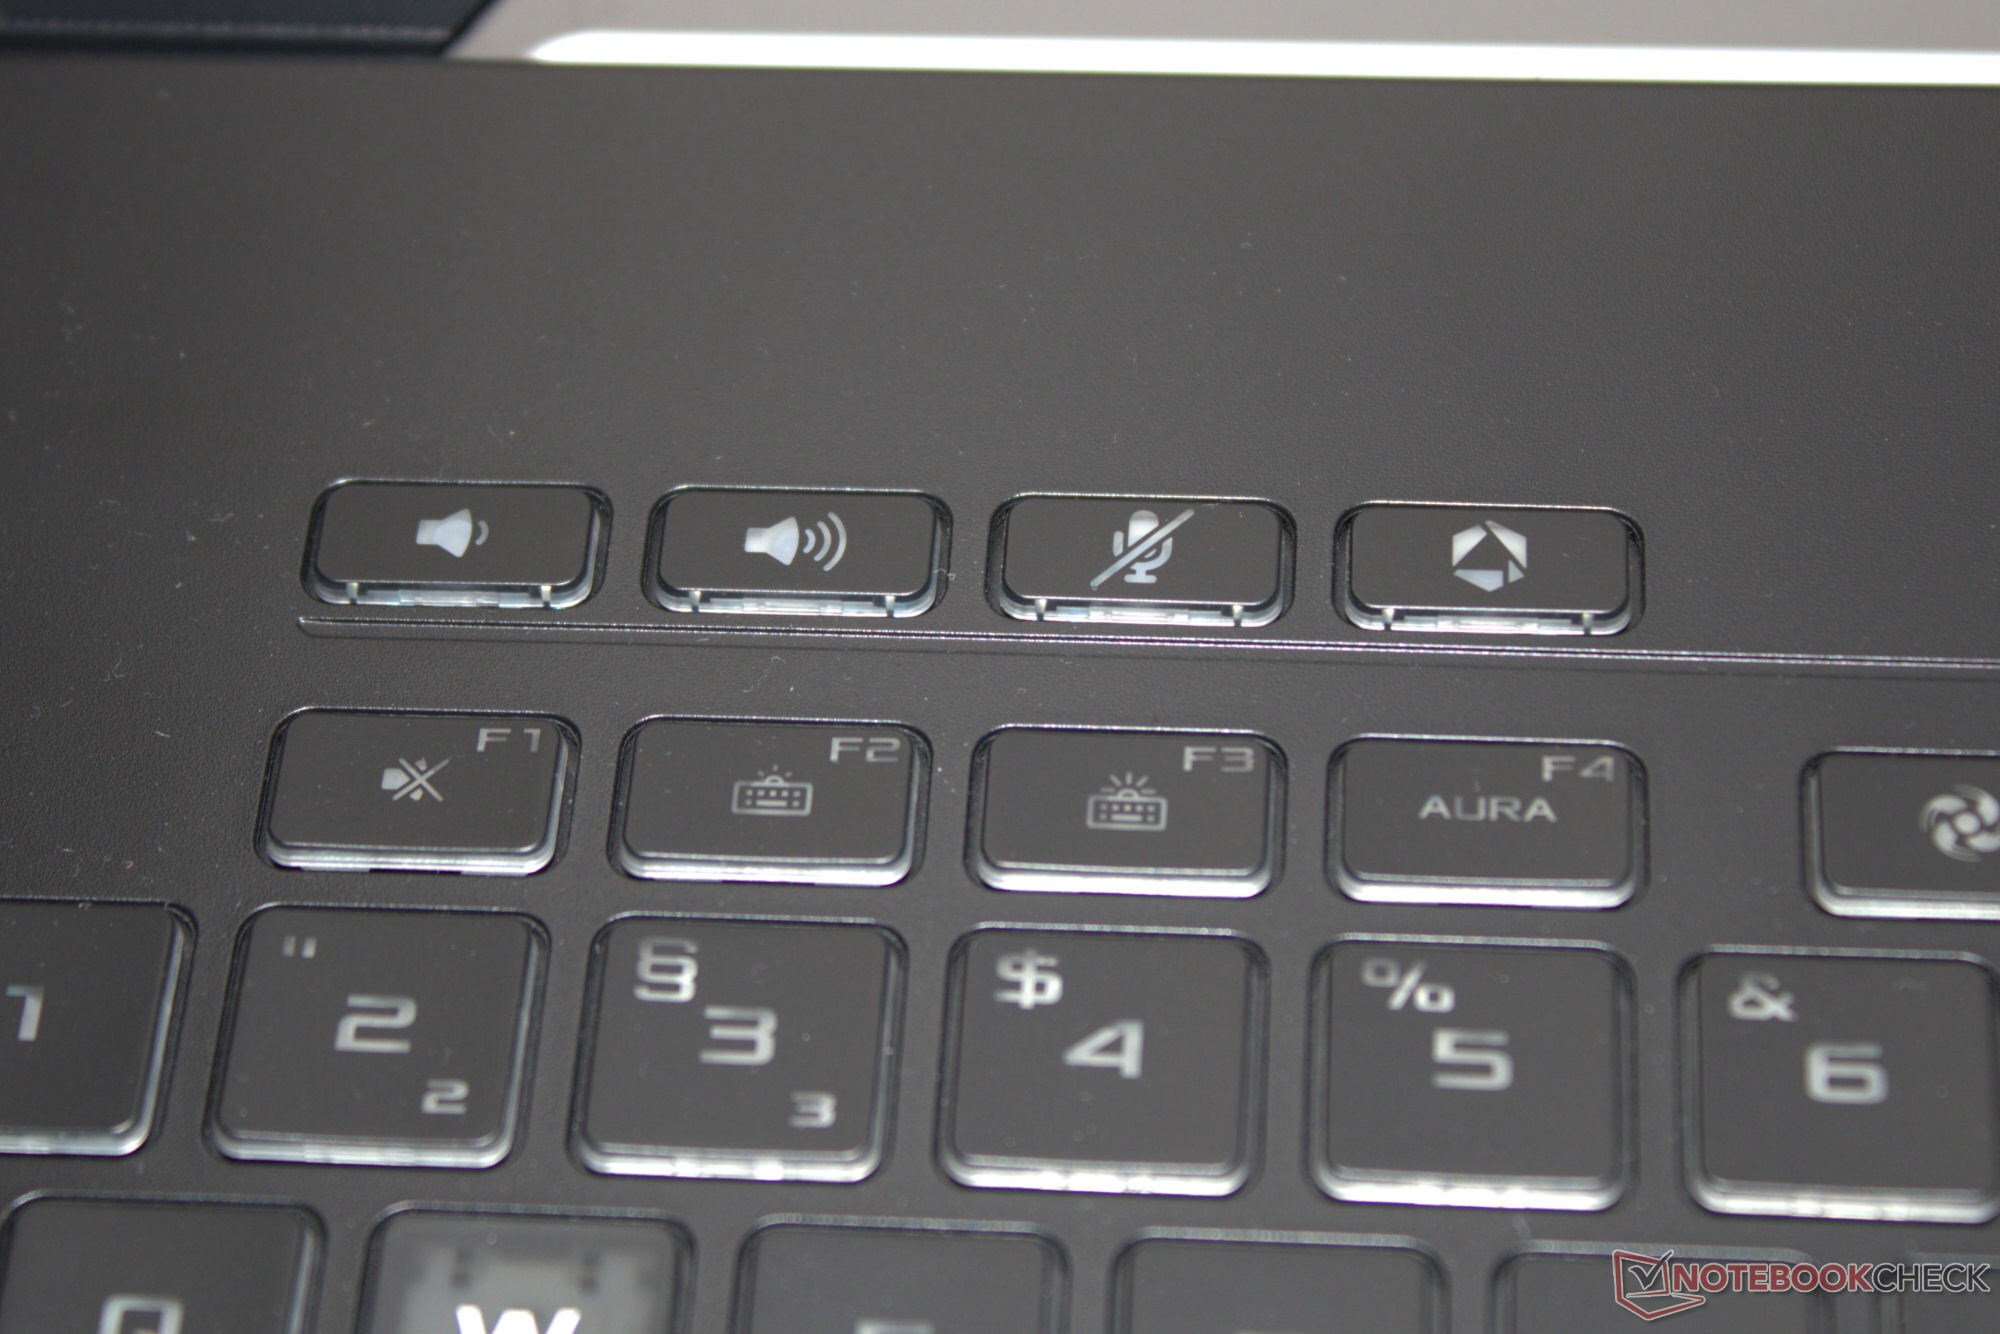
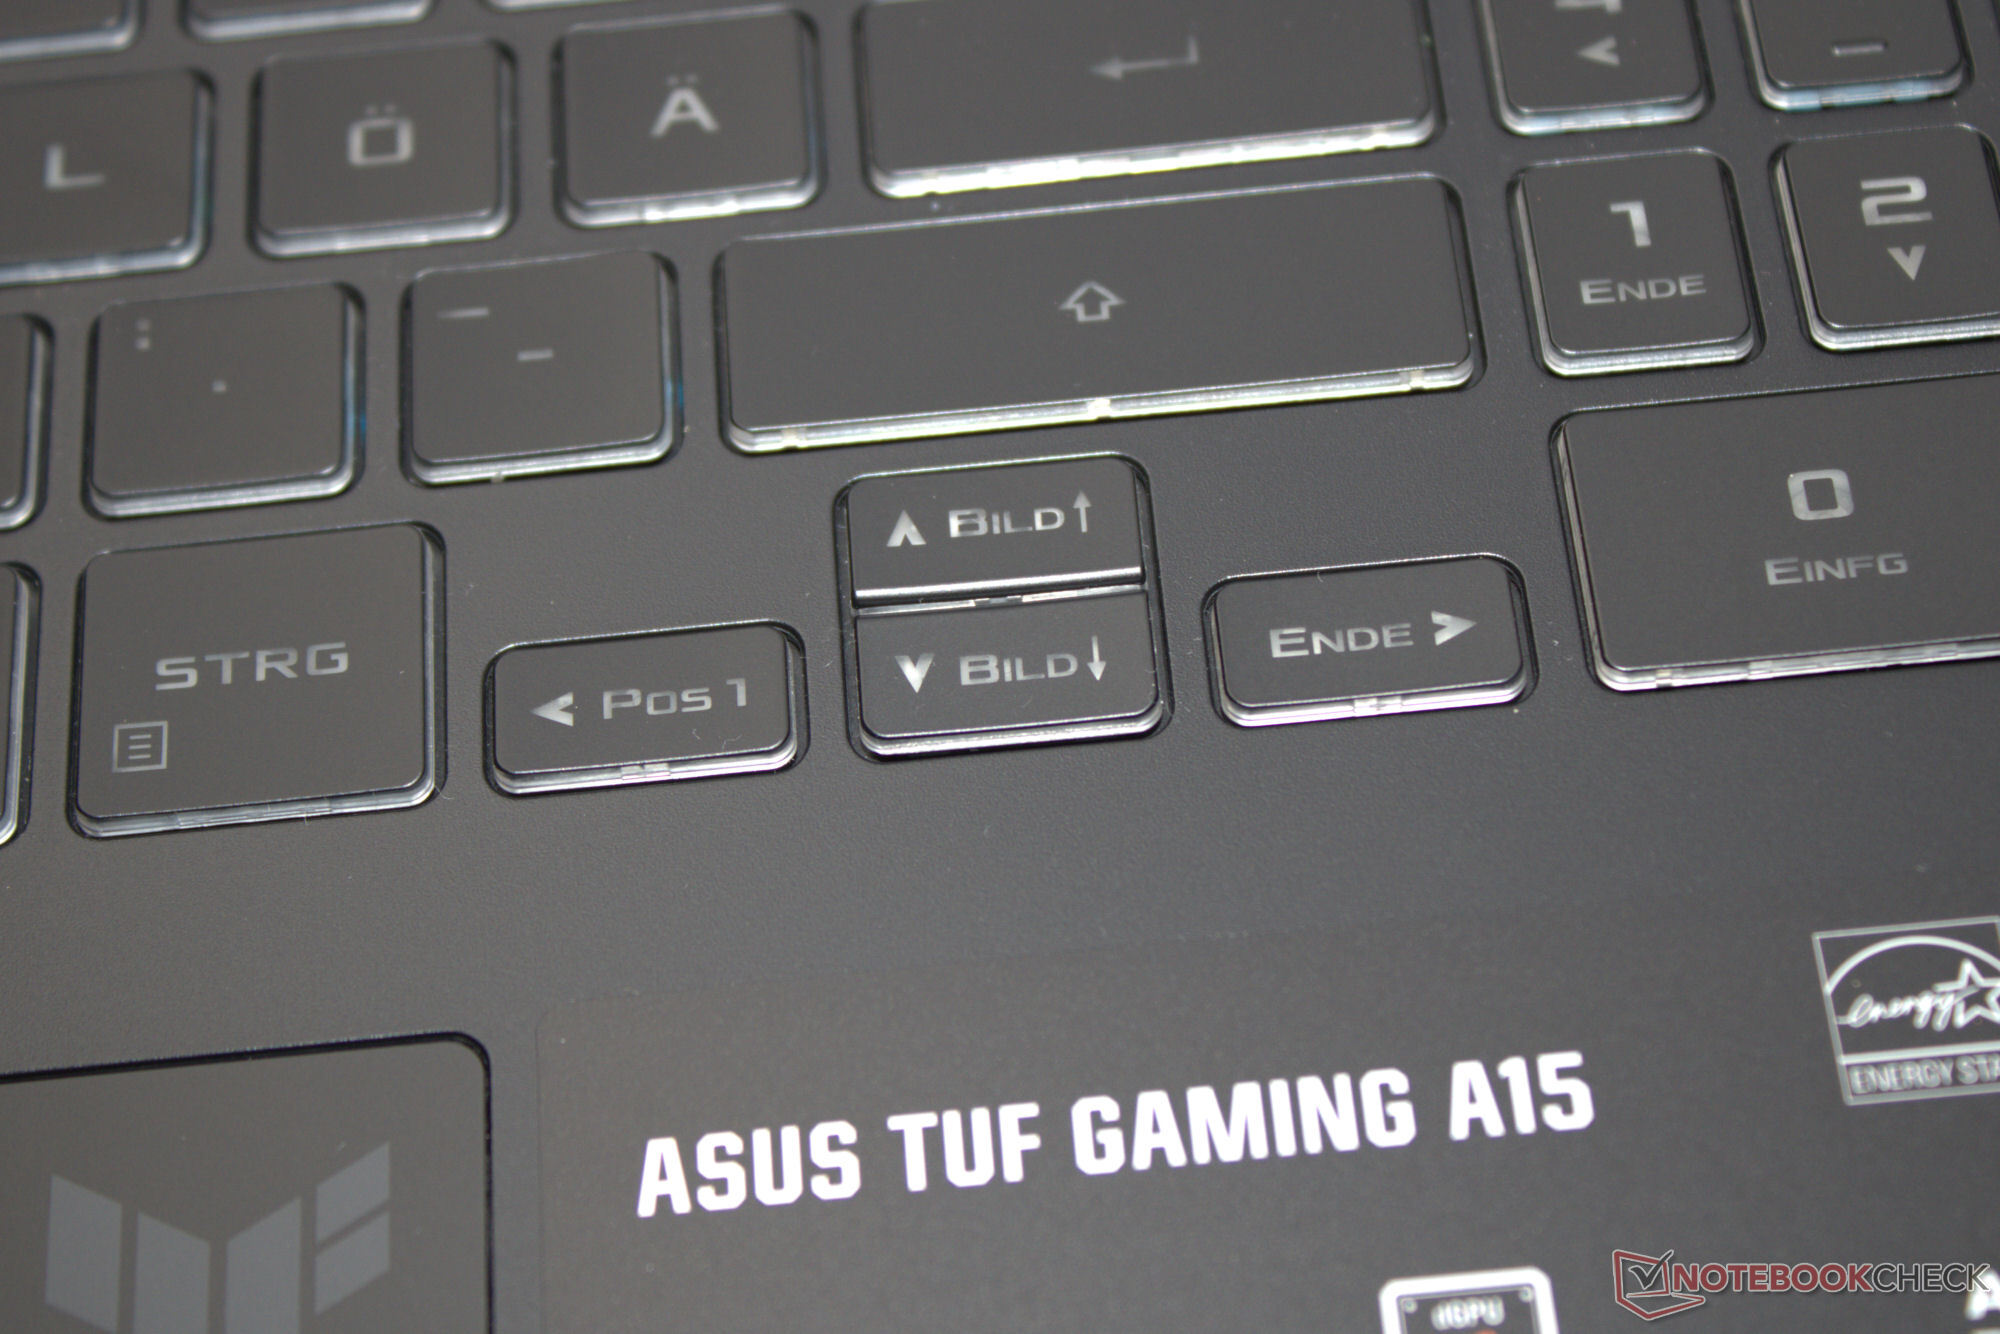
Giriş aygıtları - A15'in küçük ok tuşları vardır
Asus, arkadan aydınlatmalı chiclet klavye (RGB) için cihazın tüm genişliğini kullanıyor - bu, sayısal bir ped için yer olduğu anlamına geliyor. Pürüzsüz tuşları orta hareket mesafesine ve belirgin bir basınç noktasına sahip. Tuş direnci iyi seviyede. Yazarken klavye esnemiyor. Ok tuşu ve "Enter" tuşunun küçük olması ve kontrol tuşlarının (W, A, S, D) farklı renkte olması dikkat çekiyor. Çoklu dokunmatik clickpad (yaklaşık 13 x 7,7 cm) kısa bir hareket mesafesine ve belirgin bir basınç noktasına sahip ve yedek fare görevi görüyor.
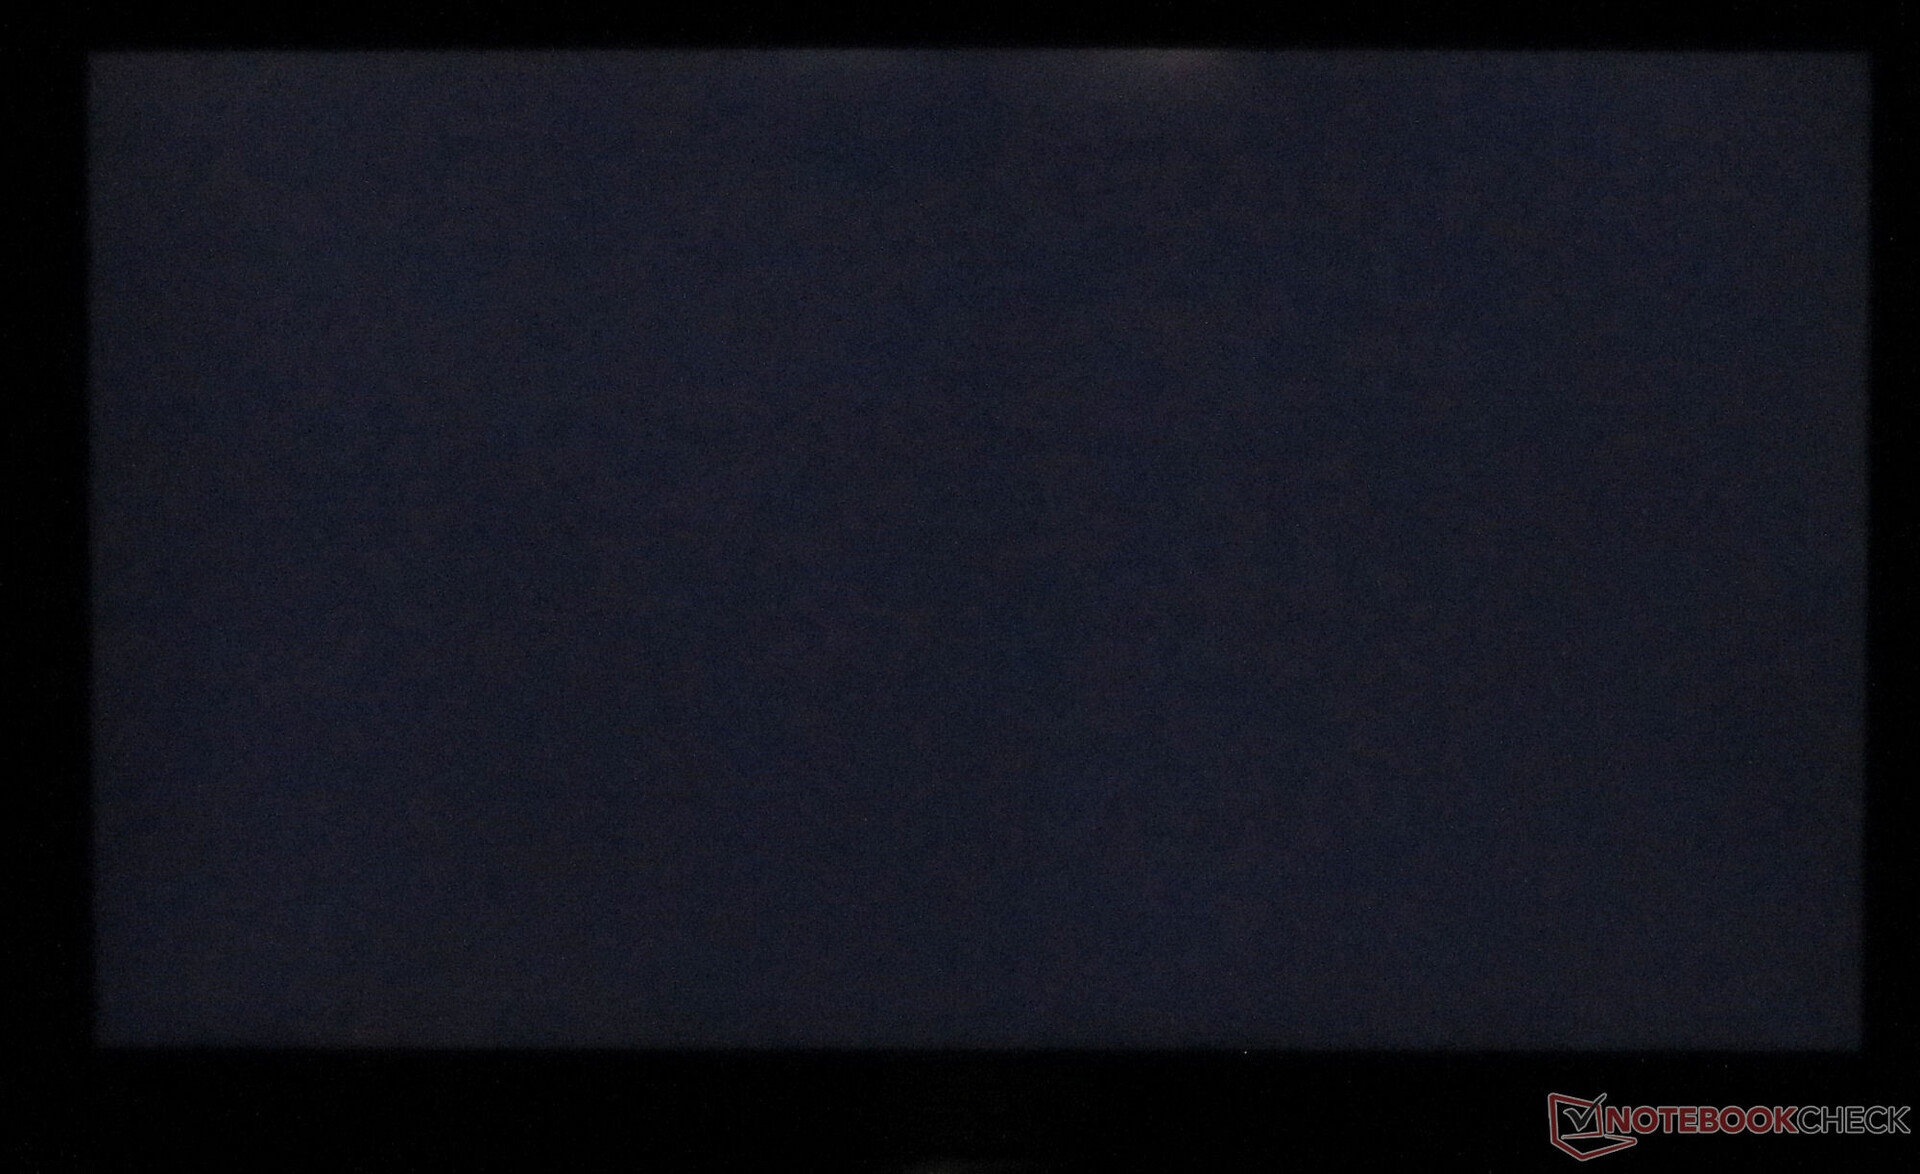
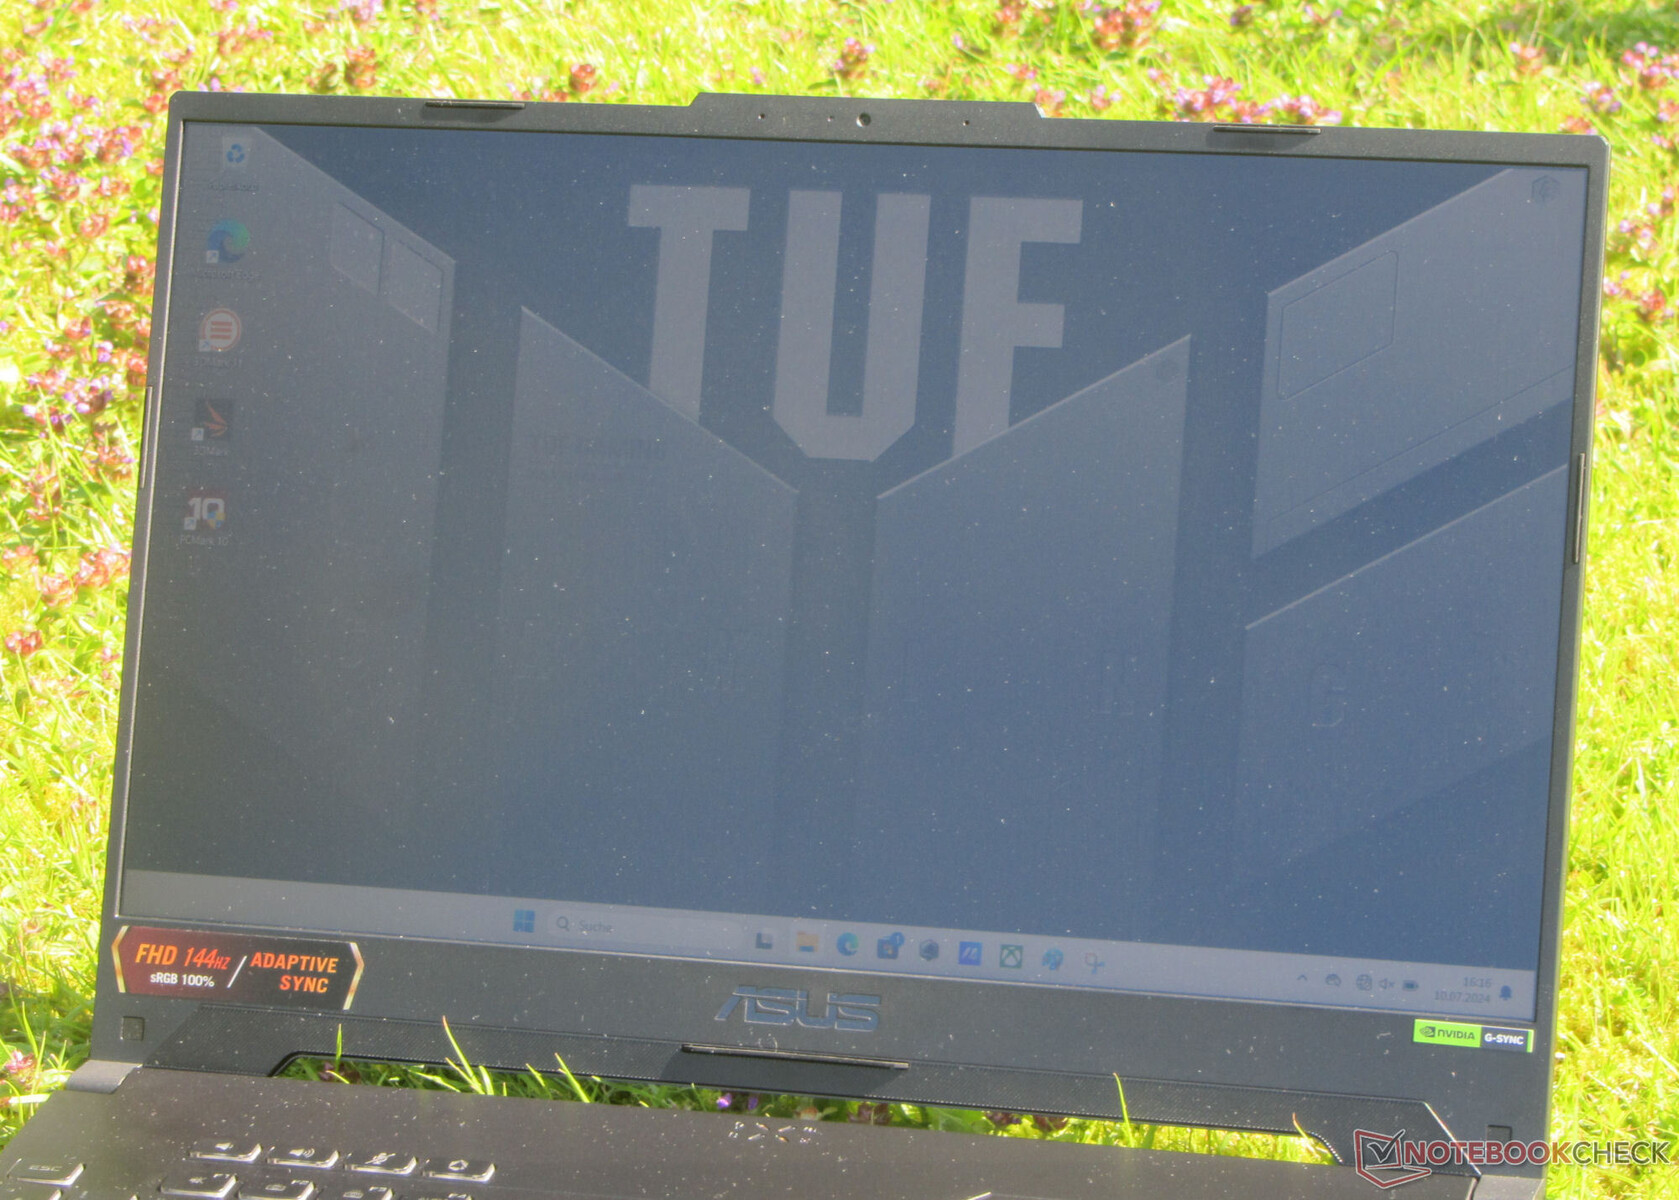
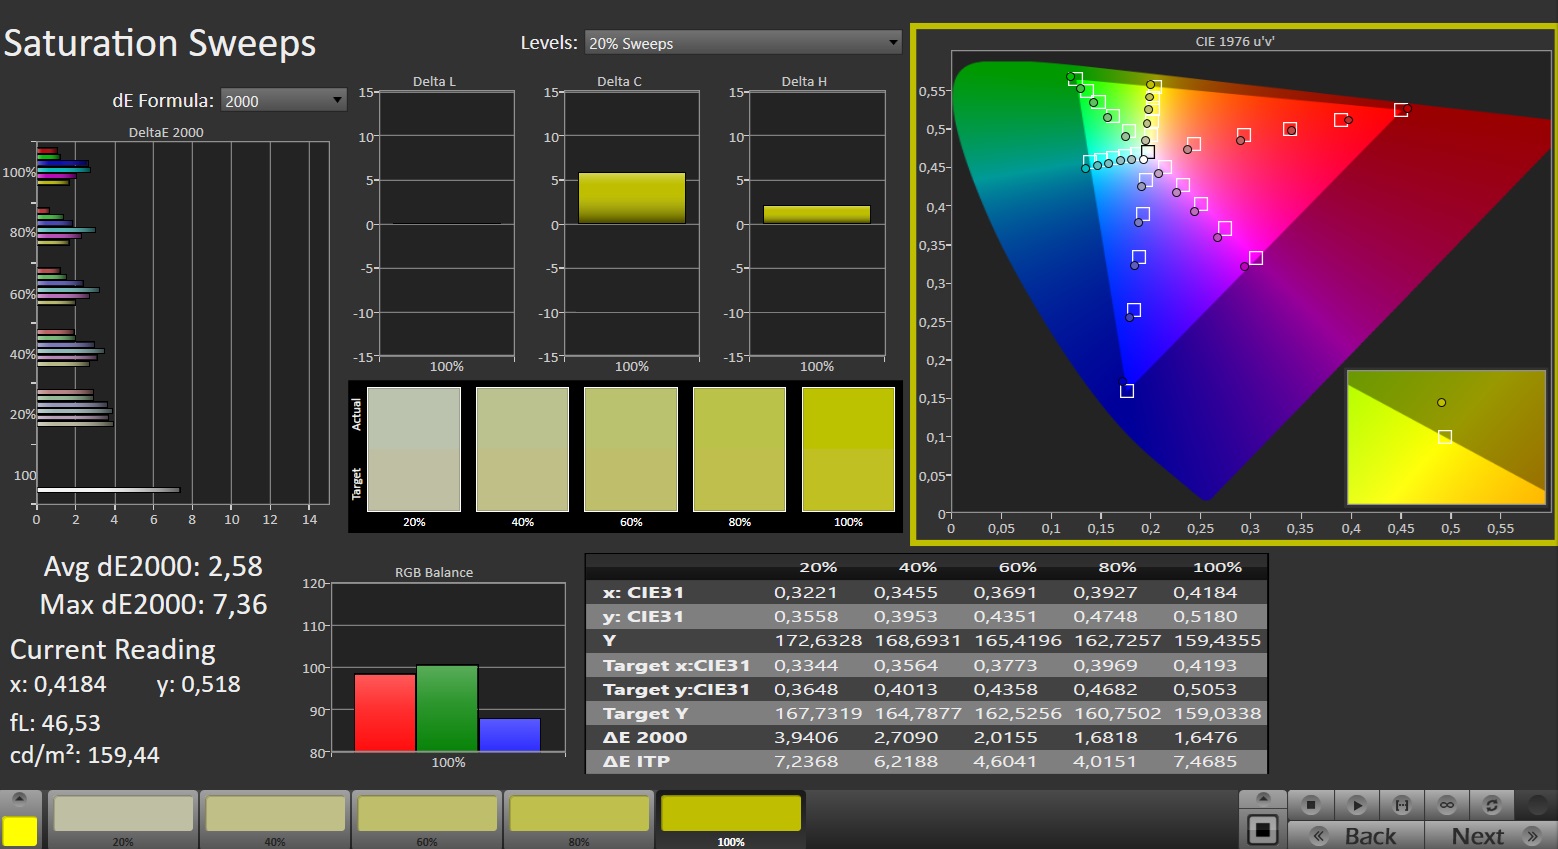
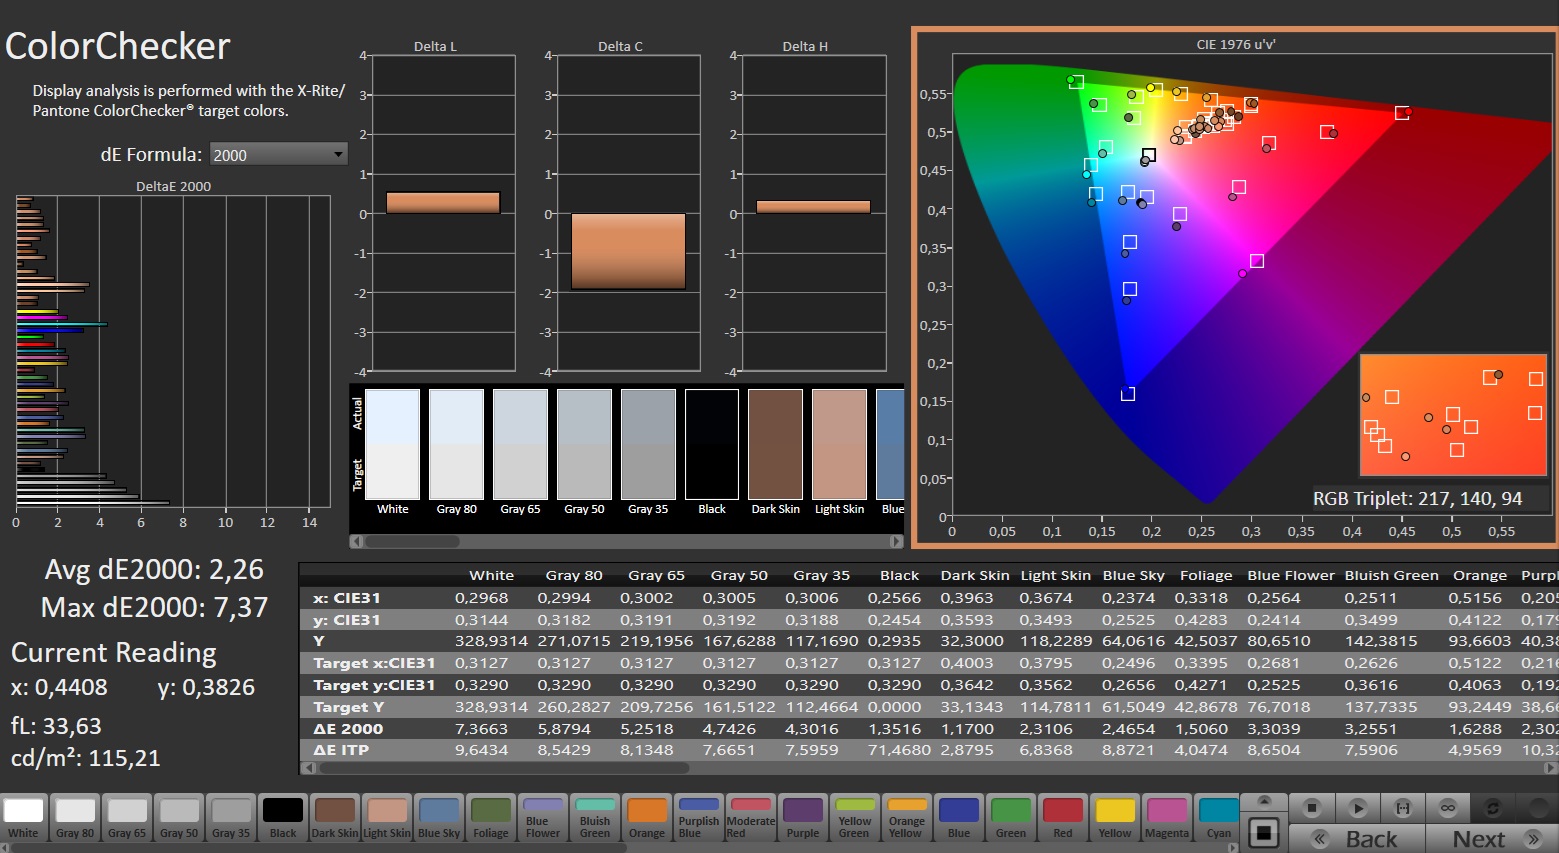
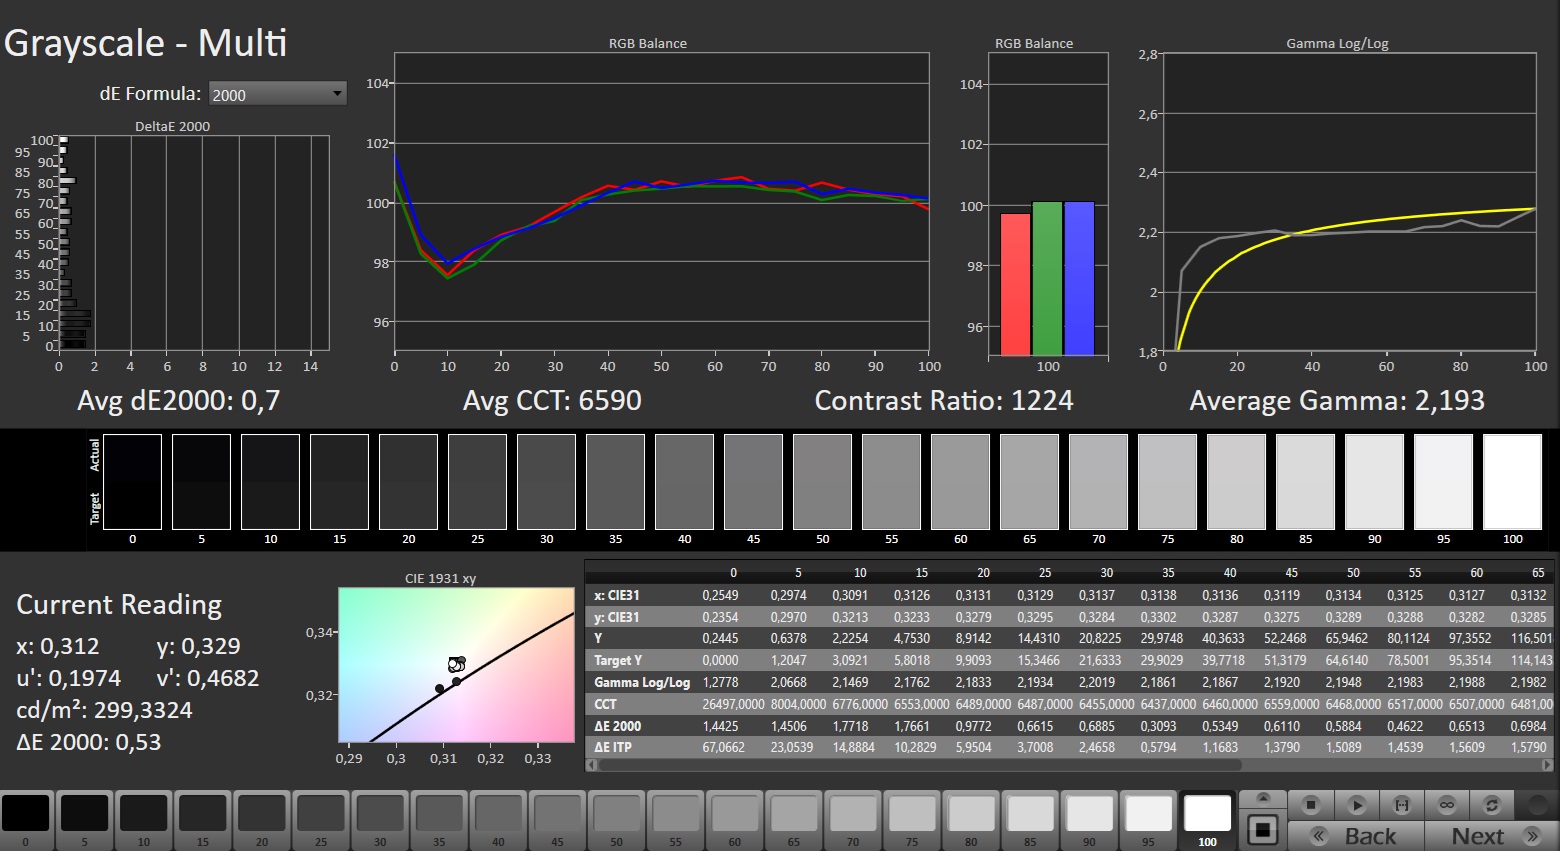
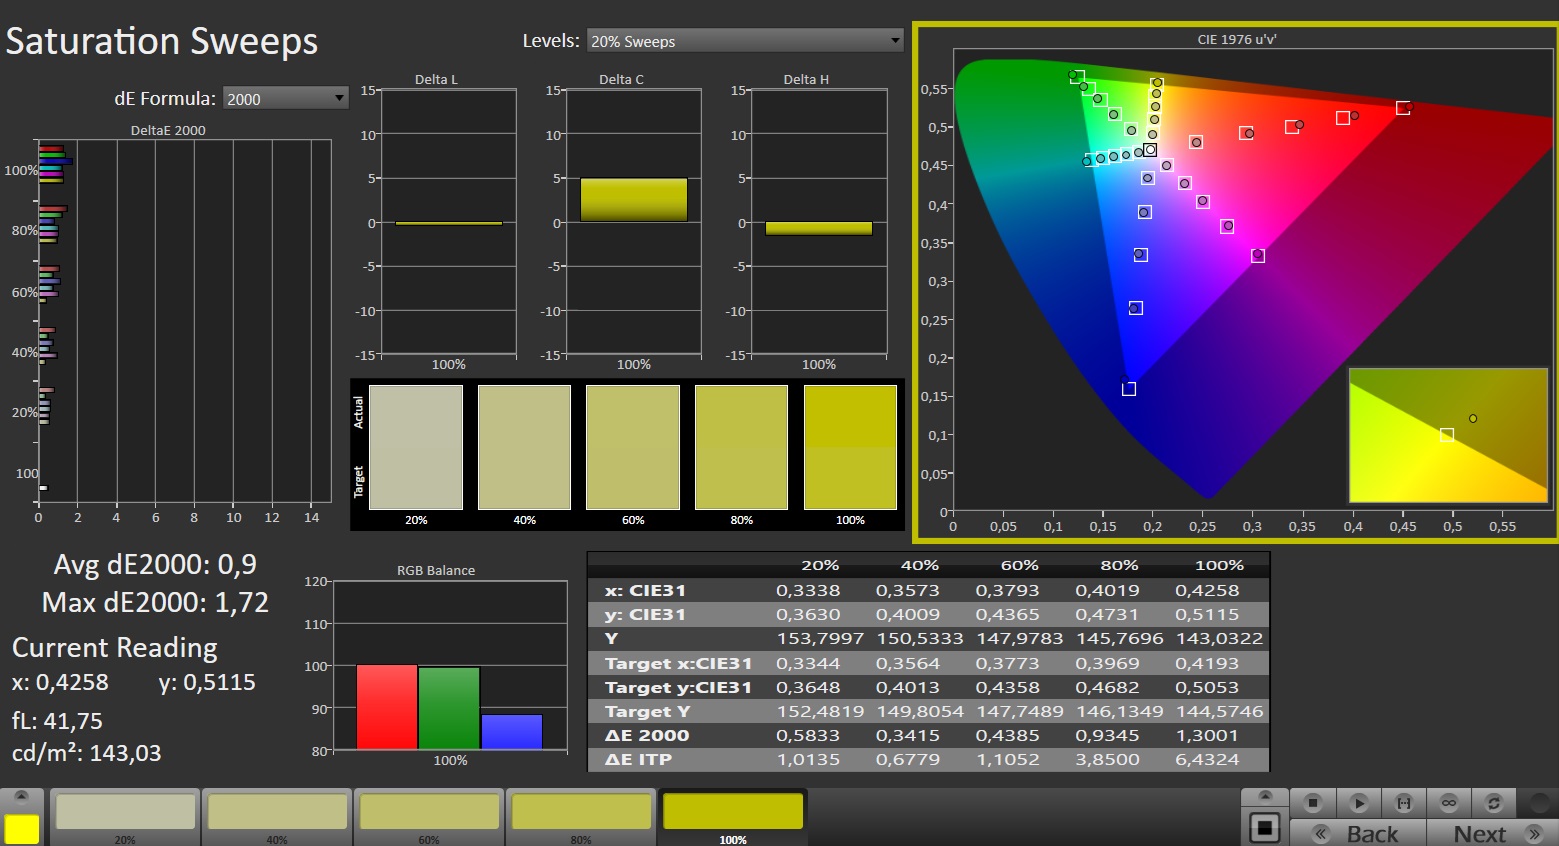
Ekran - IPS yerleşik
Asus, cihazı sabit görüş açılarına sahip 16:9, mat, 15,6 inç ekranla (FHD, IPS, 144 Hz, G-Sync) donattı. Parlaklık ve kontrast söz konusu olduğunda, panel sınıfının en iyisi rakamları sunmuyor, ancak yine de yapması gerekeni yapıyor ve bu da onu iç mekan kullanımı için önceden belirlenmiş hale getiriyor. Parlak güneş ışığı dışında her koşulda dışarıda okumak mümkün olacaktır. Herhangi bir PWM titremesi tespit edemedik.
| |||||||||||||||||||||||||
Aydınlatma: 90 %
Batarya modunda parlaklık: 315 cd/m²
Kontrast: 1260:1 (Siyah: 0.25 cd/m²)
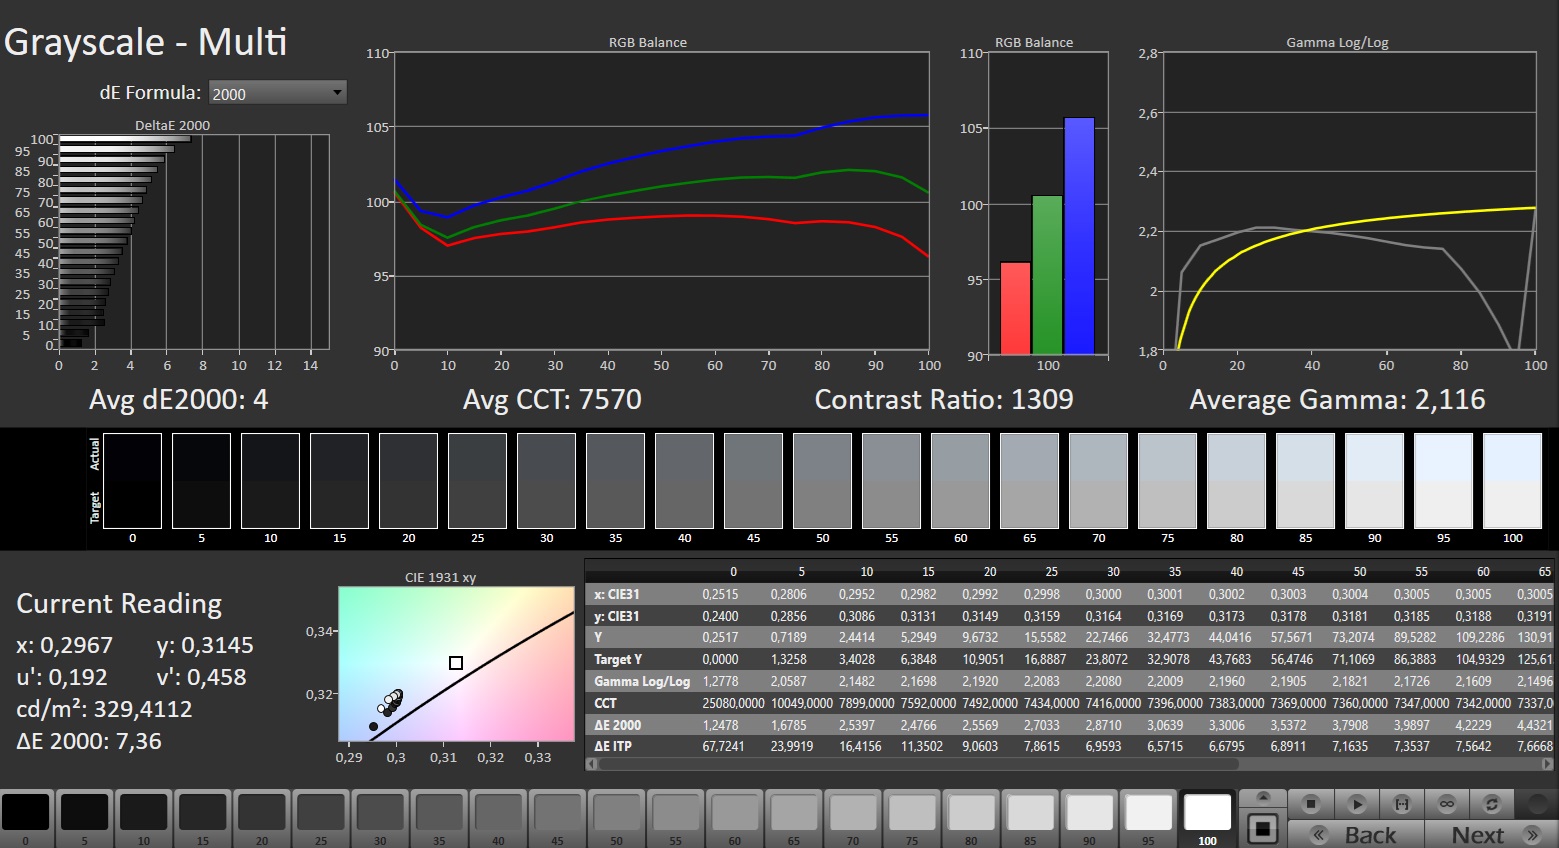
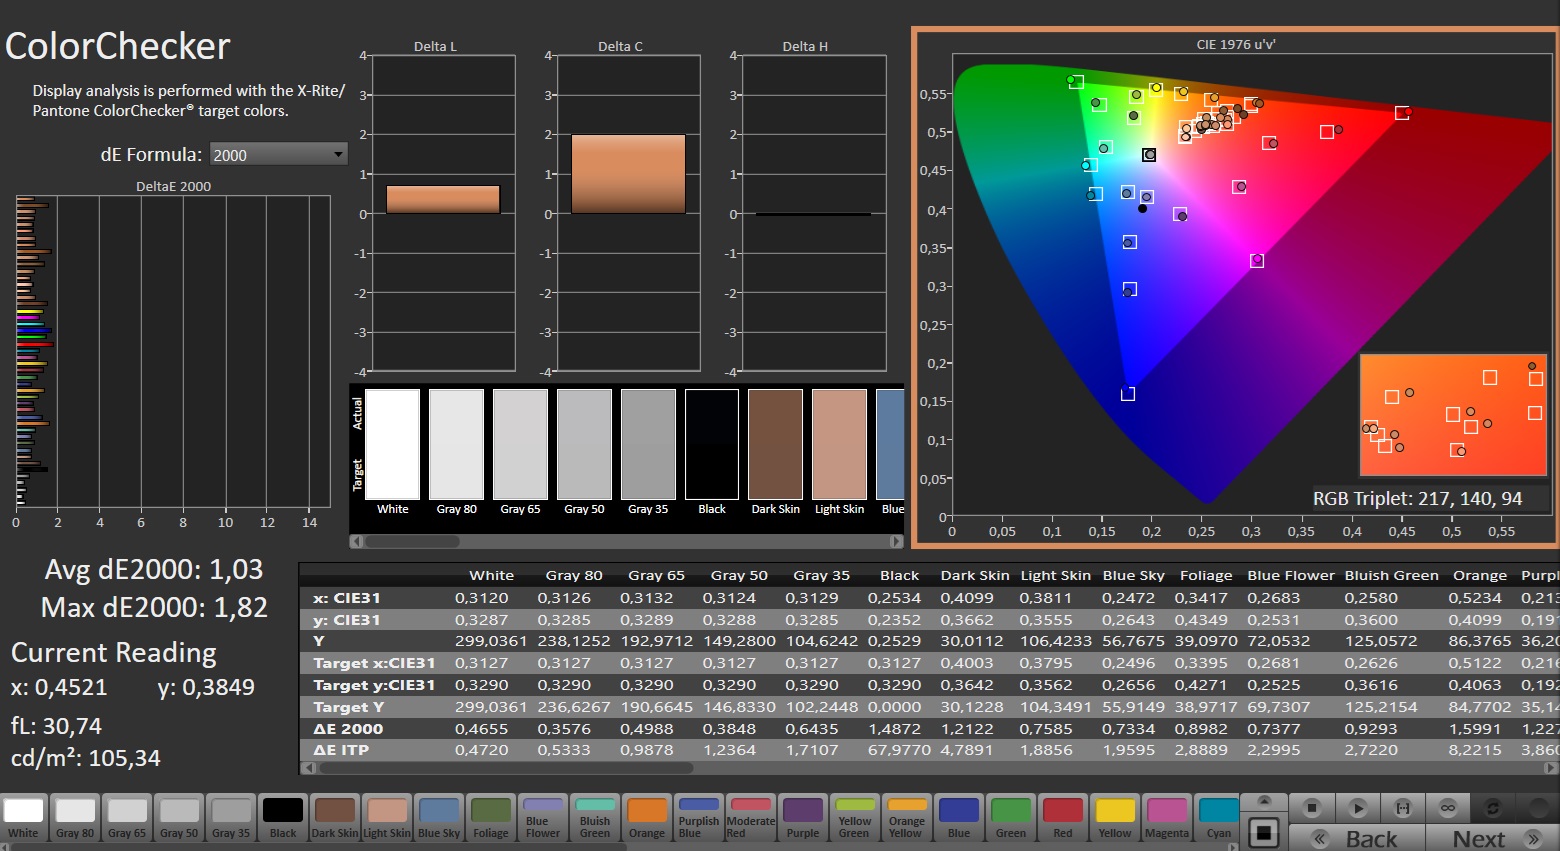
ΔE Color 2.26 | 0.5-29.43 Ø4.87, calibrated: 1.03
ΔE Greyscale 4 | 0.5-98 Ø5.1
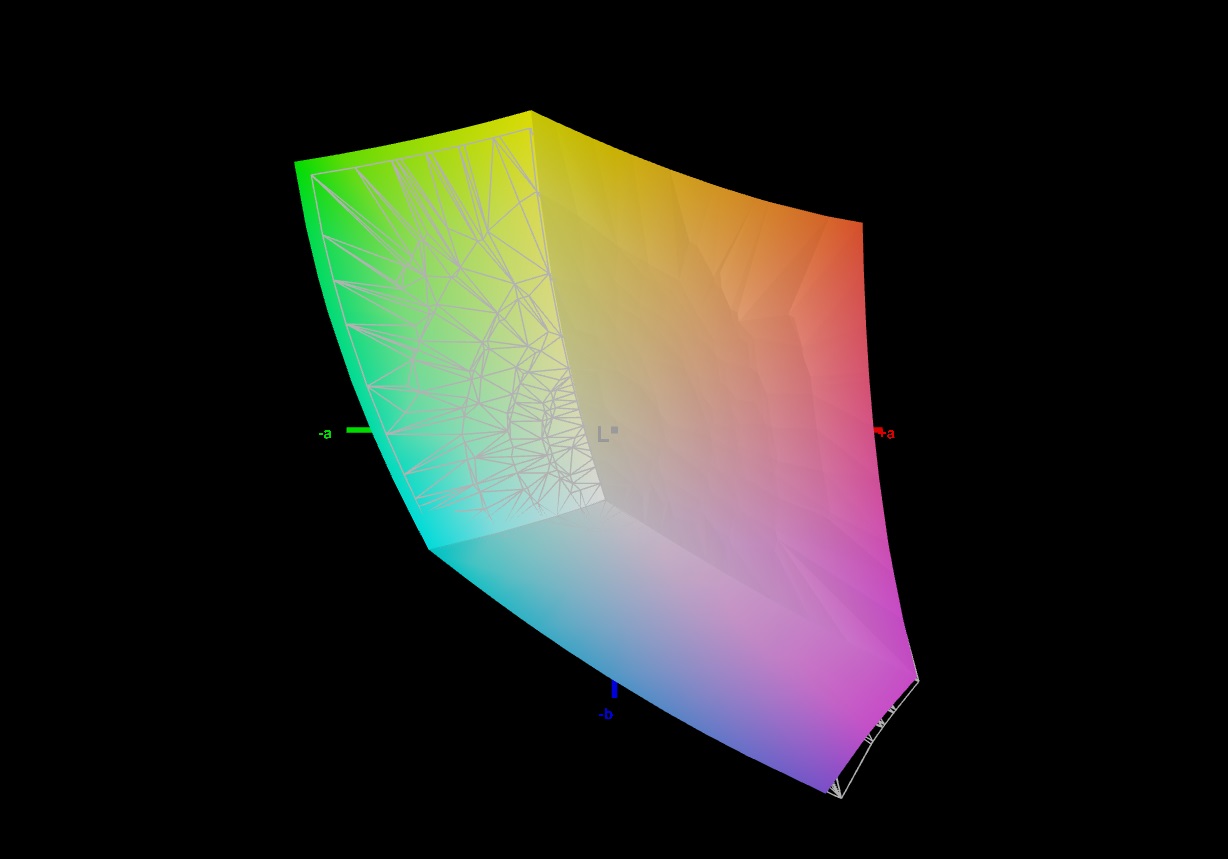
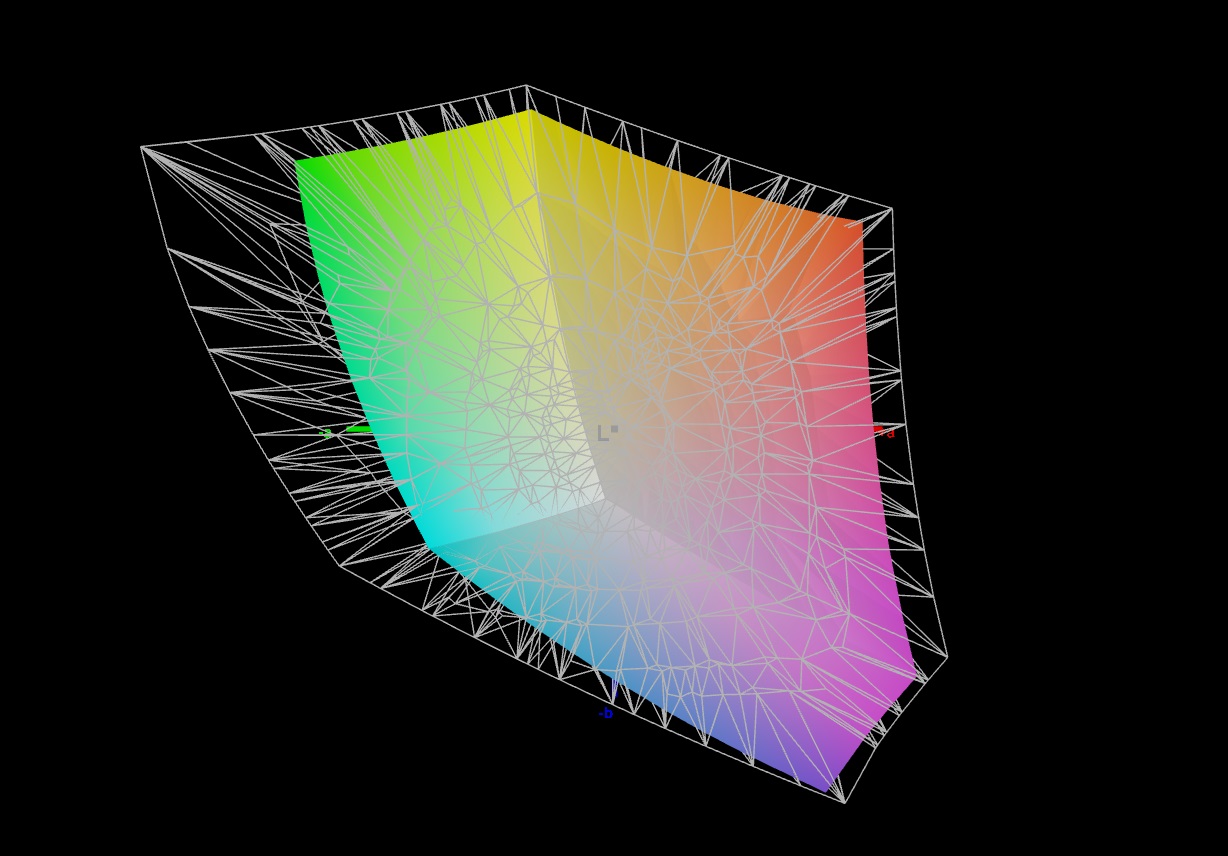
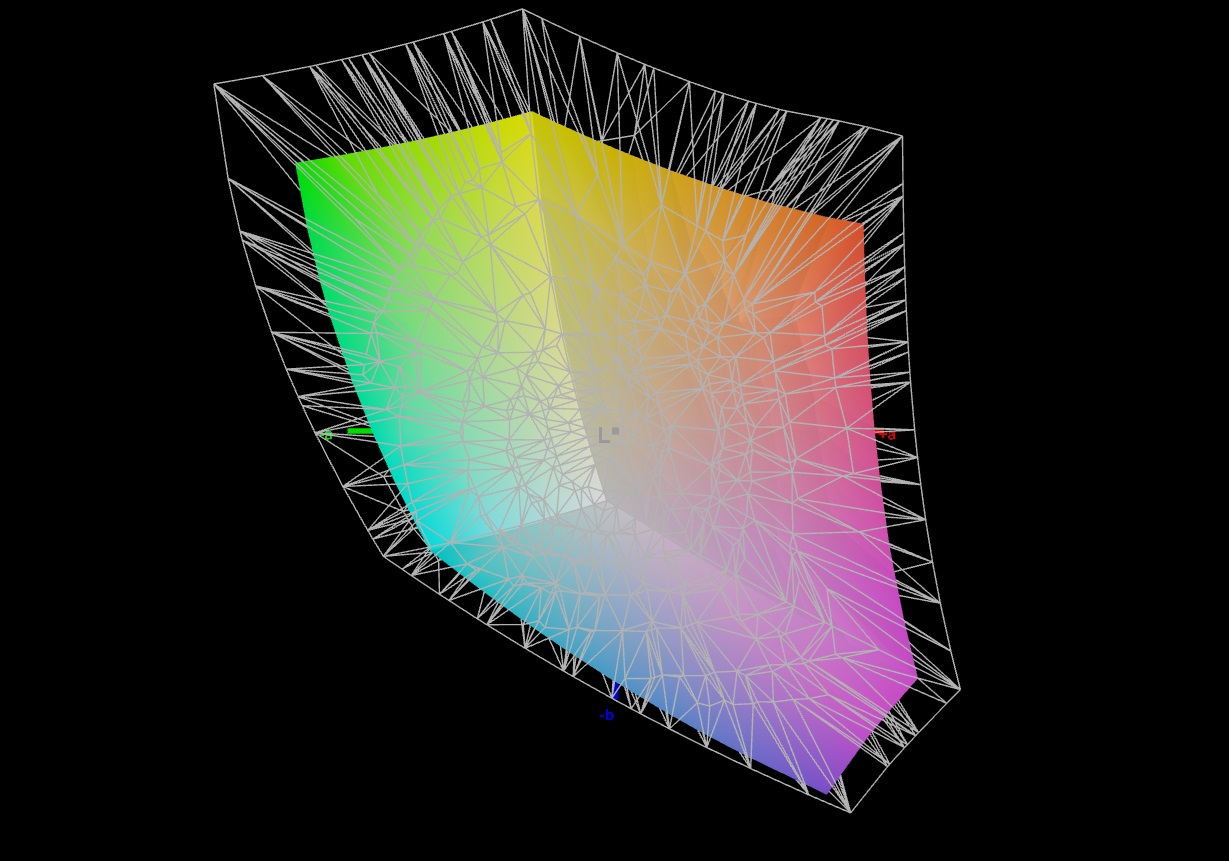
72.7% AdobeRGB 1998 (Argyll 2.2.0 3D)
98.5% sRGB (Argyll 2.2.0 3D)
70.5% Display P3 (Argyll 2.2.0 3D)
Gamma: 2.116
| Asus TUF Gaming A15 FA507UV AU Optronics B156HAN15.H, IPS, 1920x1080, 15.6" | Lenovo LOQ 15IRX9 BOE NJ NE156FHM-NX9, IPS, 1920x1080, 15.6" | HP Victus 16 (2024) Chi Mei CMN163E, IPS, 1920x1080, 16.1" | Gigabyte G6X 9KG (2024) BOE NE160WUM-NX6, IPS, 1920x1200, 16" | SCHENKER XMG Core 15 (M24) BOE NJ NE153QDM-NZ1 (BOE0C8E), IPS, 2560x1600, 15.3" | Dell G16, i7-13650HX, RTX 4060 Chi Mei CMN161D (160GME), IPS, 2560x1600, 16" | Asus TUF A15 FA507 N156HMA-GA1, IPS, 1920x1080, 15.6" | |
|---|---|---|---|---|---|---|---|
| Display | 2% | -40% | -39% | 3% | -3% | -6% | |
| Display P3 Coverage | 70.5 | 73.7 5% | 41.3 -41% | 41.8 -41% | 73.2 4% | 67.5 -4% | 64.9 -8% |
| sRGB Coverage | 98.5 | 99.1 1% | 61.7 -37% | 62.4 -37% | 100 2% | 98.5 0% | 96.5 -2% |
| AdobeRGB 1998 Coverage | 72.7 | 72.6 0% | 42.7 -41% | 43.3 -40% | 74.6 3% | 69.3 -5% | 66.6 -8% |
| Response Times | -16% | 14% | -11% | 65% | 66% | 7% | |
| Response Time Grey 50% / Grey 80% * | 31.7 ? | 42.2 ? -33% | 28.6 ? 10% | 40.5 ? -28% | 9.6 ? 70% | 7.6 ? 76% | 30.4 ? 4% |
| Response Time Black / White * | 22.9 ? | 22.6 ? 1% | 18.7 ? 18% | 21.6 ? 6% | 9.2 ? 60% | 10.4 ? 55% | 20.8 ? 9% |
| PWM Frequency | |||||||
| Screen | 6% | -62% | -54% | 14% | -9% | 18% | |
| Brightness middle | 315 | 306 -3% | 287 -9% | 353 12% | 635 102% | 369 17% | 288 -9% |
| Brightness | 303 | 287 -5% | 288 -5% | 318 5% | 604 99% | 344 14% | 271 -11% |
| Brightness Distribution | 90 | 88 -2% | 86 -4% | 81 -10% | 91 1% | 89 -1% | 91 1% |
| Black Level * | 0.25 | 0.21 16% | 0.19 24% | 0.21 16% | 0.64 -156% | 0.26 -4% | 0.17 32% |
| Contrast | 1260 | 1457 16% | 1511 20% | 1681 33% | 992 -21% | 1419 13% | 1694 34% |
| Colorchecker dE 2000 * | 2.26 | 2.25 -0% | 5.46 -142% | 5.21 -131% | 1.89 16% | 3.04 -35% | 1.9 16% |
| Colorchecker dE 2000 max. * | 7.37 | 4.84 34% | 20.36 -176% | 19.95 -171% | 3.14 57% | 5.56 25% | 3.3 55% |
| Colorchecker dE 2000 calibrated * | 1.03 | 1.45 -41% | 3.52 -242% | 3.61 -250% | 1.14 -11% | 2.35 -128% | 0.9 13% |
| Greyscale dE 2000 * | 4 | 2.4 40% | 4.8 -20% | 3.6 10% | 2.53 37% | 3.38 15% | 2.7 32% |
| Gamma | 2.116 104% | 2.259 97% | 2.108 104% | 2.367 93% | 2.36 93% | 2.47 89% | 2.32 95% |
| CCT | 7570 86% | 6790 96% | 6442 101% | 7138 91% | 6434 101% | 6040 108% | 6535 99% |
| Toplam Ortalama (Program / Ayarlar) | -3% /
2% | -29% /
-46% | -35% /
-45% | 27% /
19% | 18% /
3% | 6% /
11% |
* ... daha küçük daha iyidir
Kutudan çıktığı haliyle panel, yaklaşık 2,26 gibi çok düşük bir renk sapmasıyla geliyor (hedef: DeltaE < 3). Kalibrasyon bu rakamı 1,03'e düşürüyor. Rakiplerin çoğunda bulunan ekranlarda olduğu gibi, bu panel sRGB renk alanını (neredeyse) tamamen kapsıyor ancak AdobeRGB ve DCI P3 renk alanlarını kapsamıyor.
Yanıt Sürelerini Görüntüle
| ↔ Tepki Süresi Siyahtan Beyaza | ||
|---|---|---|
| 22.9 ms ... yükseliş ↗ ve sonbahar↘ birleşimi | ↗ 11.7 ms yükseliş | 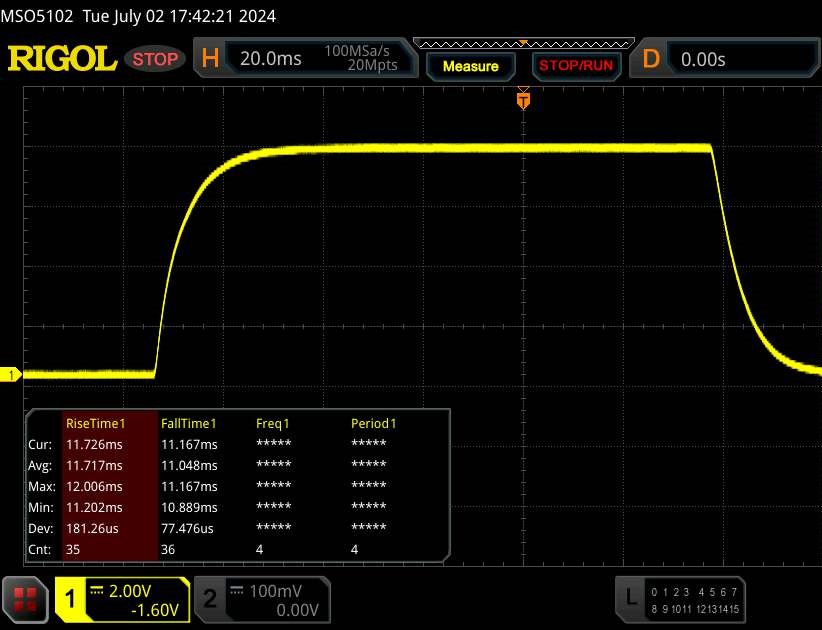 |
| ↘ 11.2 ms sonbahar | ||
| Ekran, testlerimizde iyi yanıt oranları gösteriyor ancak rekabetçi oyuncular için çok yavaş olabilir. Karşılaştırıldığında, test edilen tüm cihazlar 0.1 (minimum) ile 240 (maksimum) ms arasında değişir. » Tüm cihazların 48 %'si daha iyi. Bu, ölçülen yanıt süresinin test edilen tüm cihazların ortalamasından (20.8 ms) daha kötü olduğu anlamına gelir. | ||
| ↔ Tepki Süresi %50 Griden %80 Griye | ||
| 31.7 ms ... yükseliş ↗ ve sonbahar↘ birleşimi | ↗ 14.7 ms yükseliş | 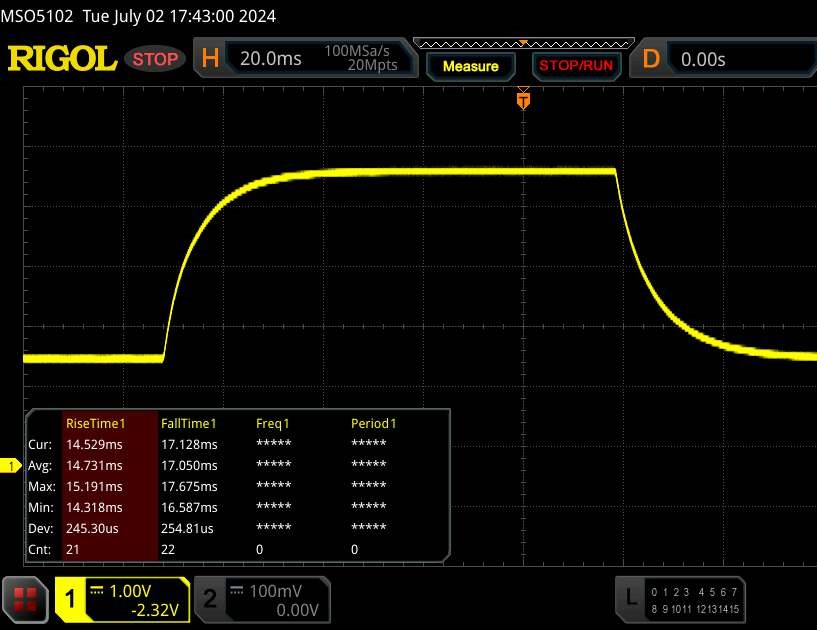 |
| ↘ 17 ms sonbahar | ||
| Ekran, testlerimizde yavaş yanıt oranları gösteriyor ve oyuncular için yetersiz olacaktır. Karşılaştırıldığında, test edilen tüm cihazlar 0.165 (minimum) ile 636 (maksimum) ms arasında değişir. » Tüm cihazların 39 %'si daha iyi. Bu, ölçülen yanıt süresinin test edilen tüm cihazların ortalamasına benzer olduğu anlamına gelir (32.5 ms). | ||
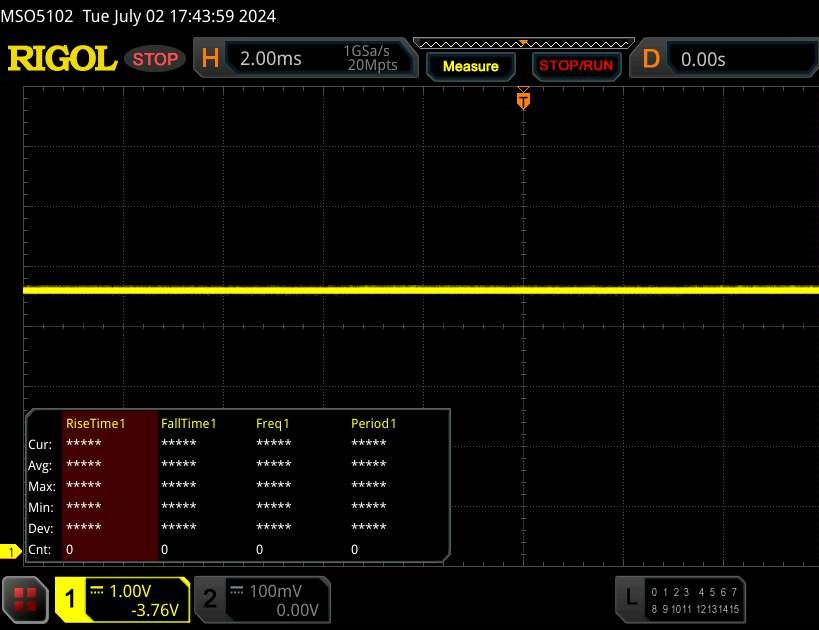
Ekran Titremesi / PWM (Darbe Genişliği Modülasyonu)
| Ekran titriyor / PWM algılanmadı | 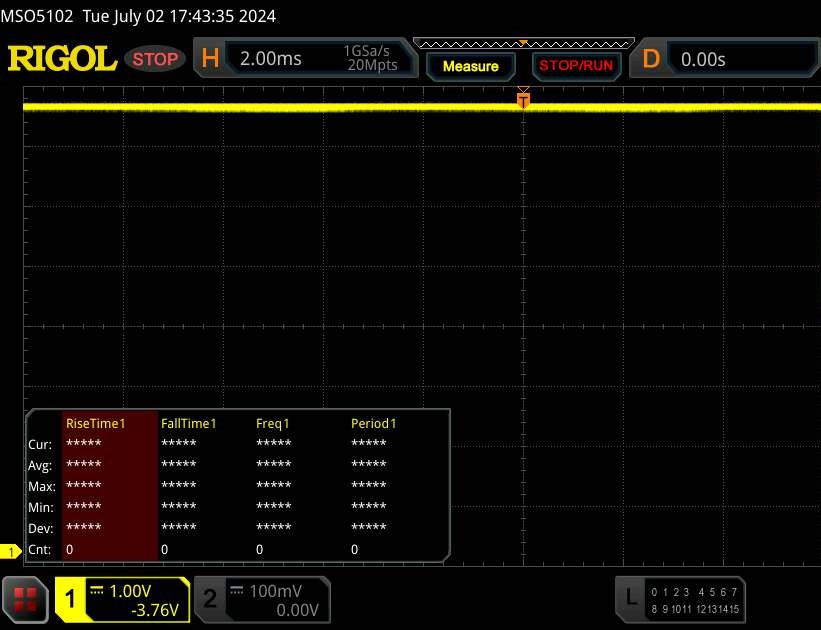 | ||
Karşılaştırıldığında: Test edilen tüm cihazların %53 %'si ekranı karartmak için PWM kullanmıyor. PWM tespit edilirse, ortalama 8516 (minimum: 5 - maksimum: 343500) Hz ölçüldü. | |||
Performans - Hawk Point ve Ada Lovelace bilgisayara güç veriyor
TUF Gaming A15 FA507UV ile Asus, düşük fiyat segmentinde orta seviye bir oyun dizüstü bilgisayarı sunuyor. Hesaplama görevleri için gerekli donanım AMD (Hawk Point, Zen 4) ve Nvidia'dan (Ada Lovelace) geliyor. İnceleme cihazı size yaklaşık 1.399 $'a mal olacak.
Test koşulları
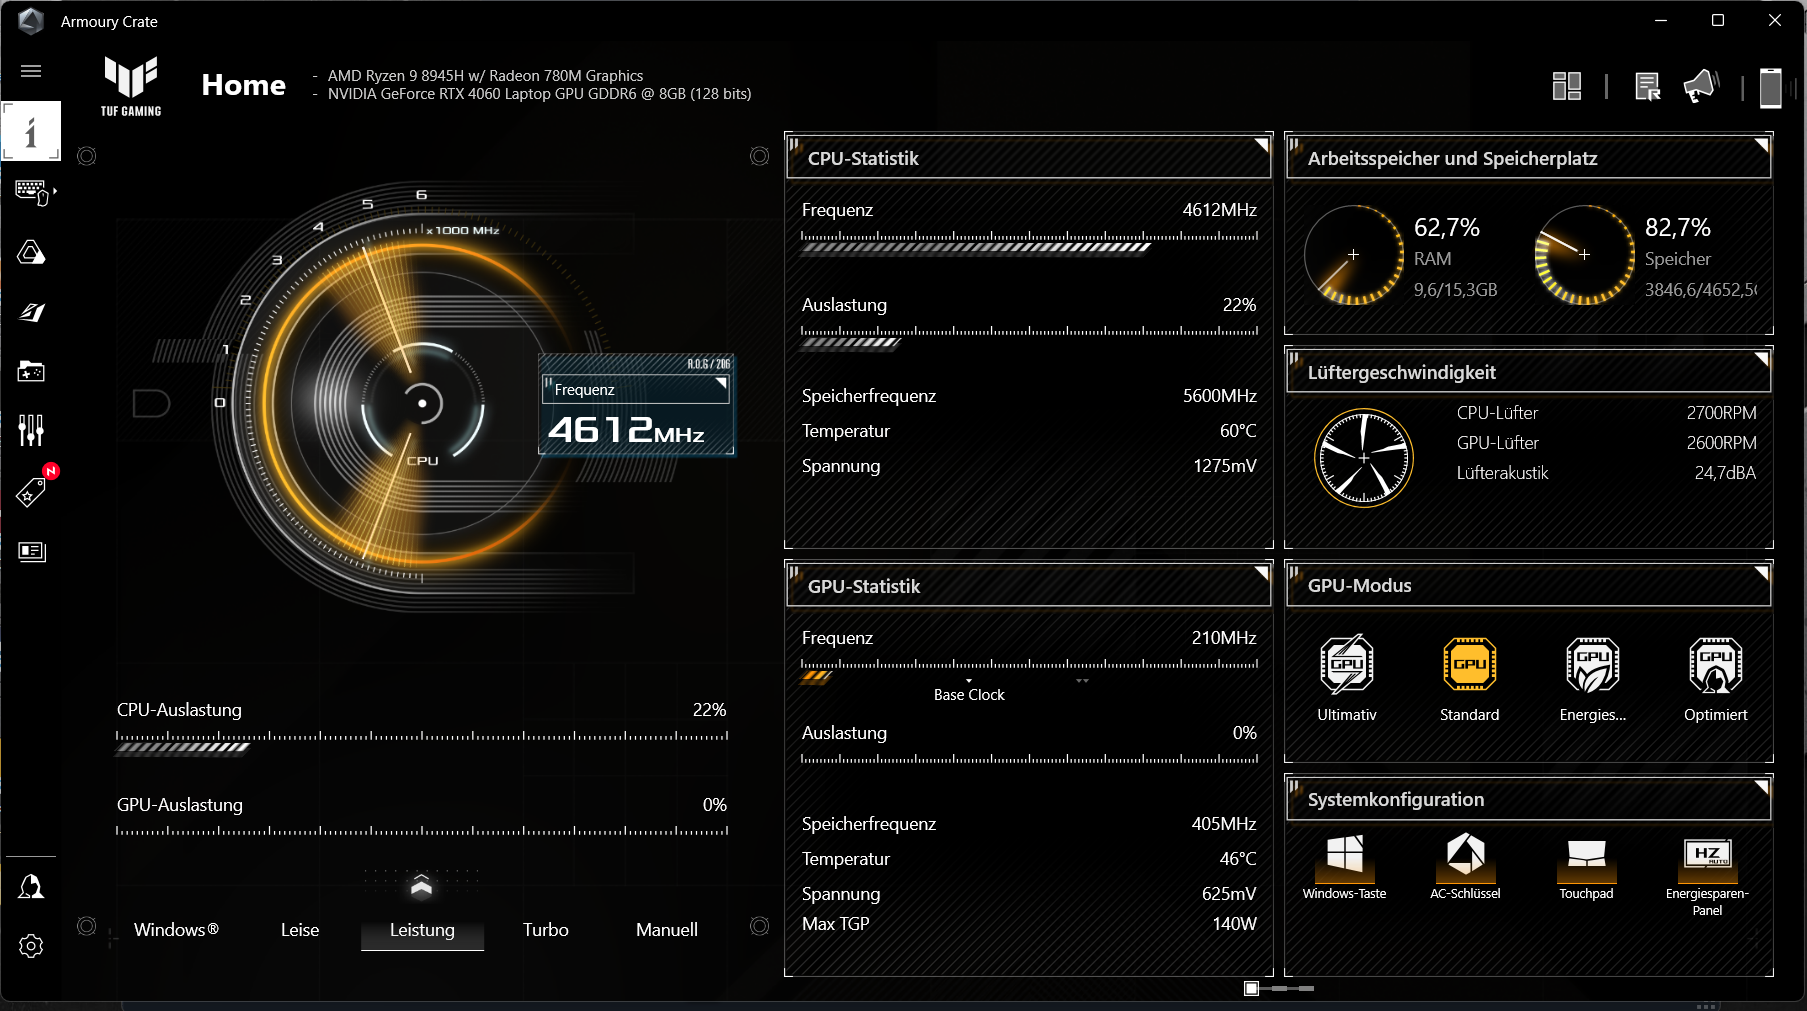
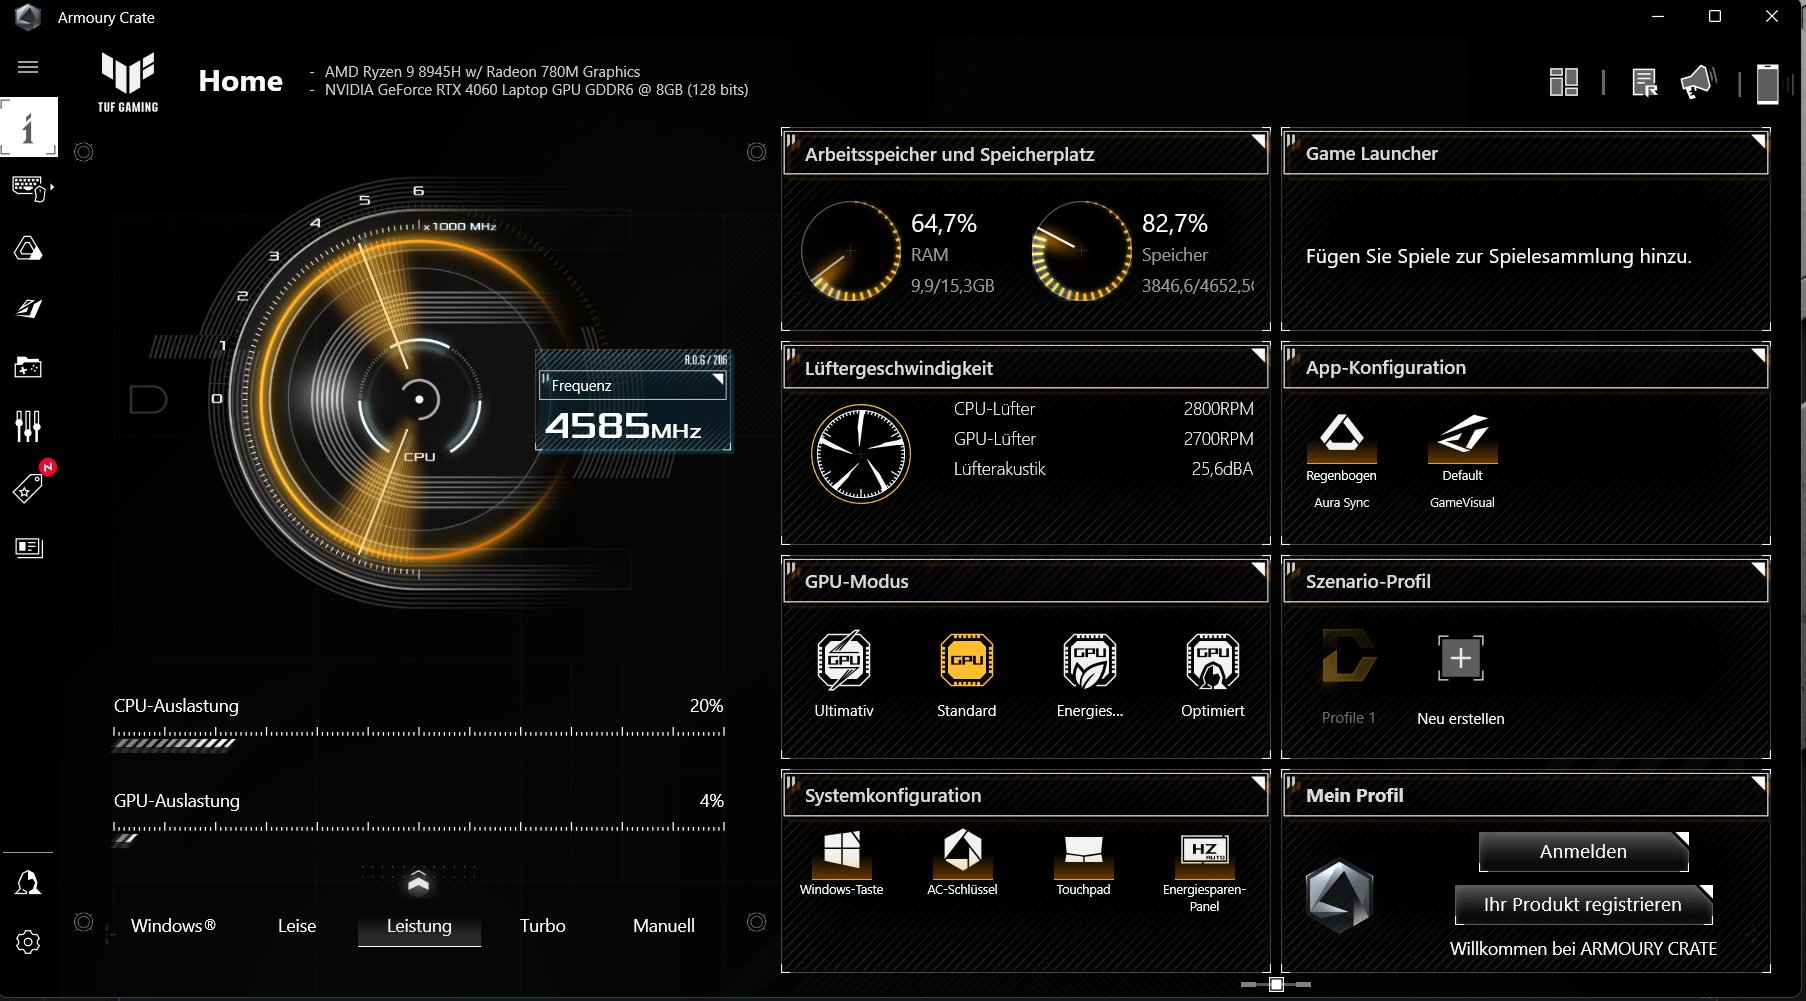
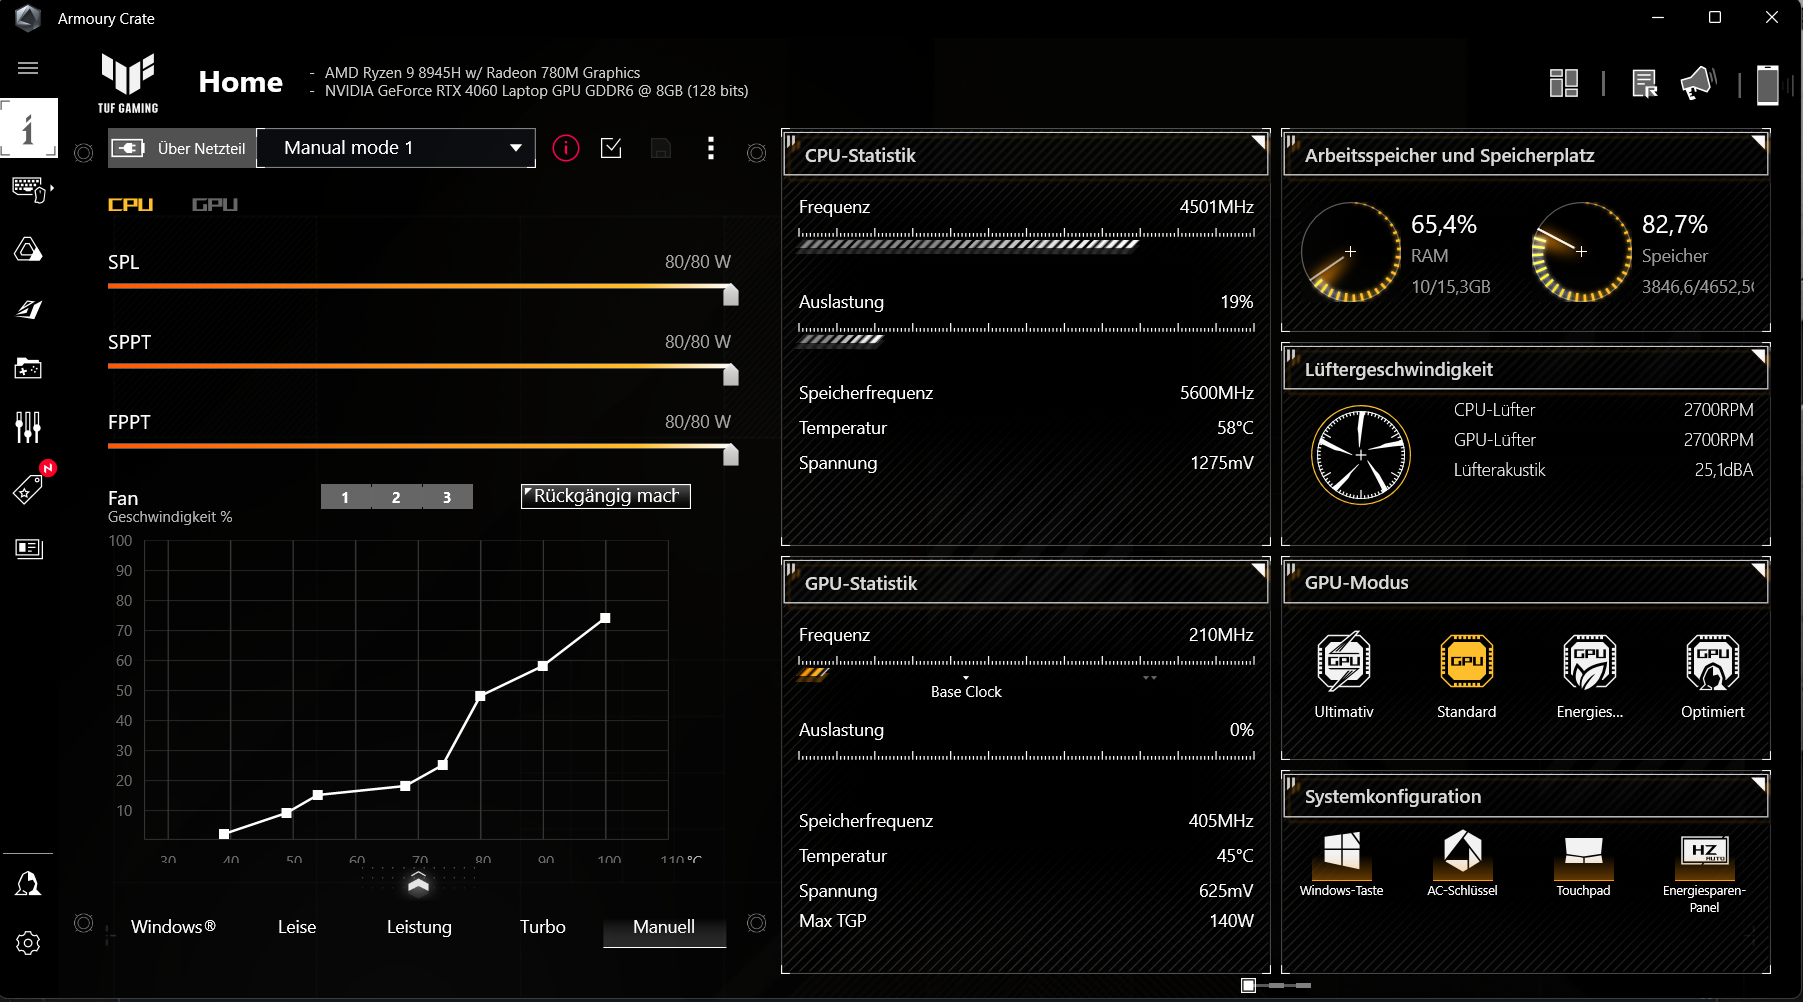
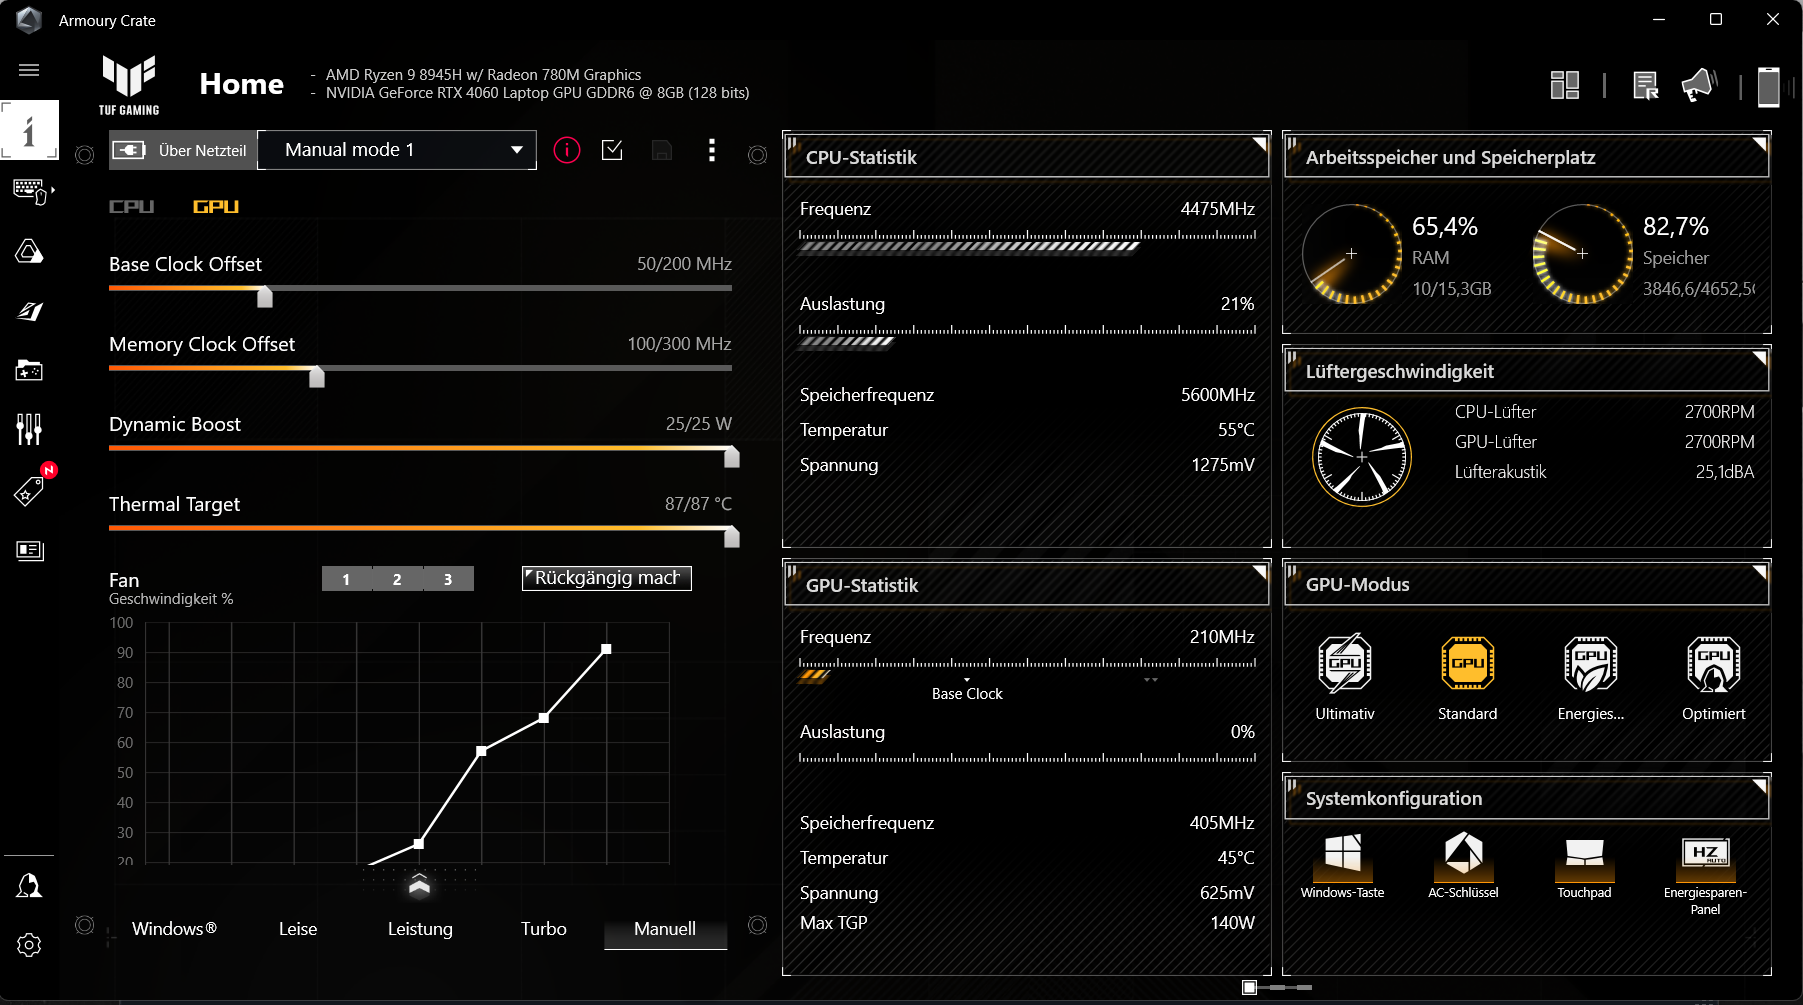
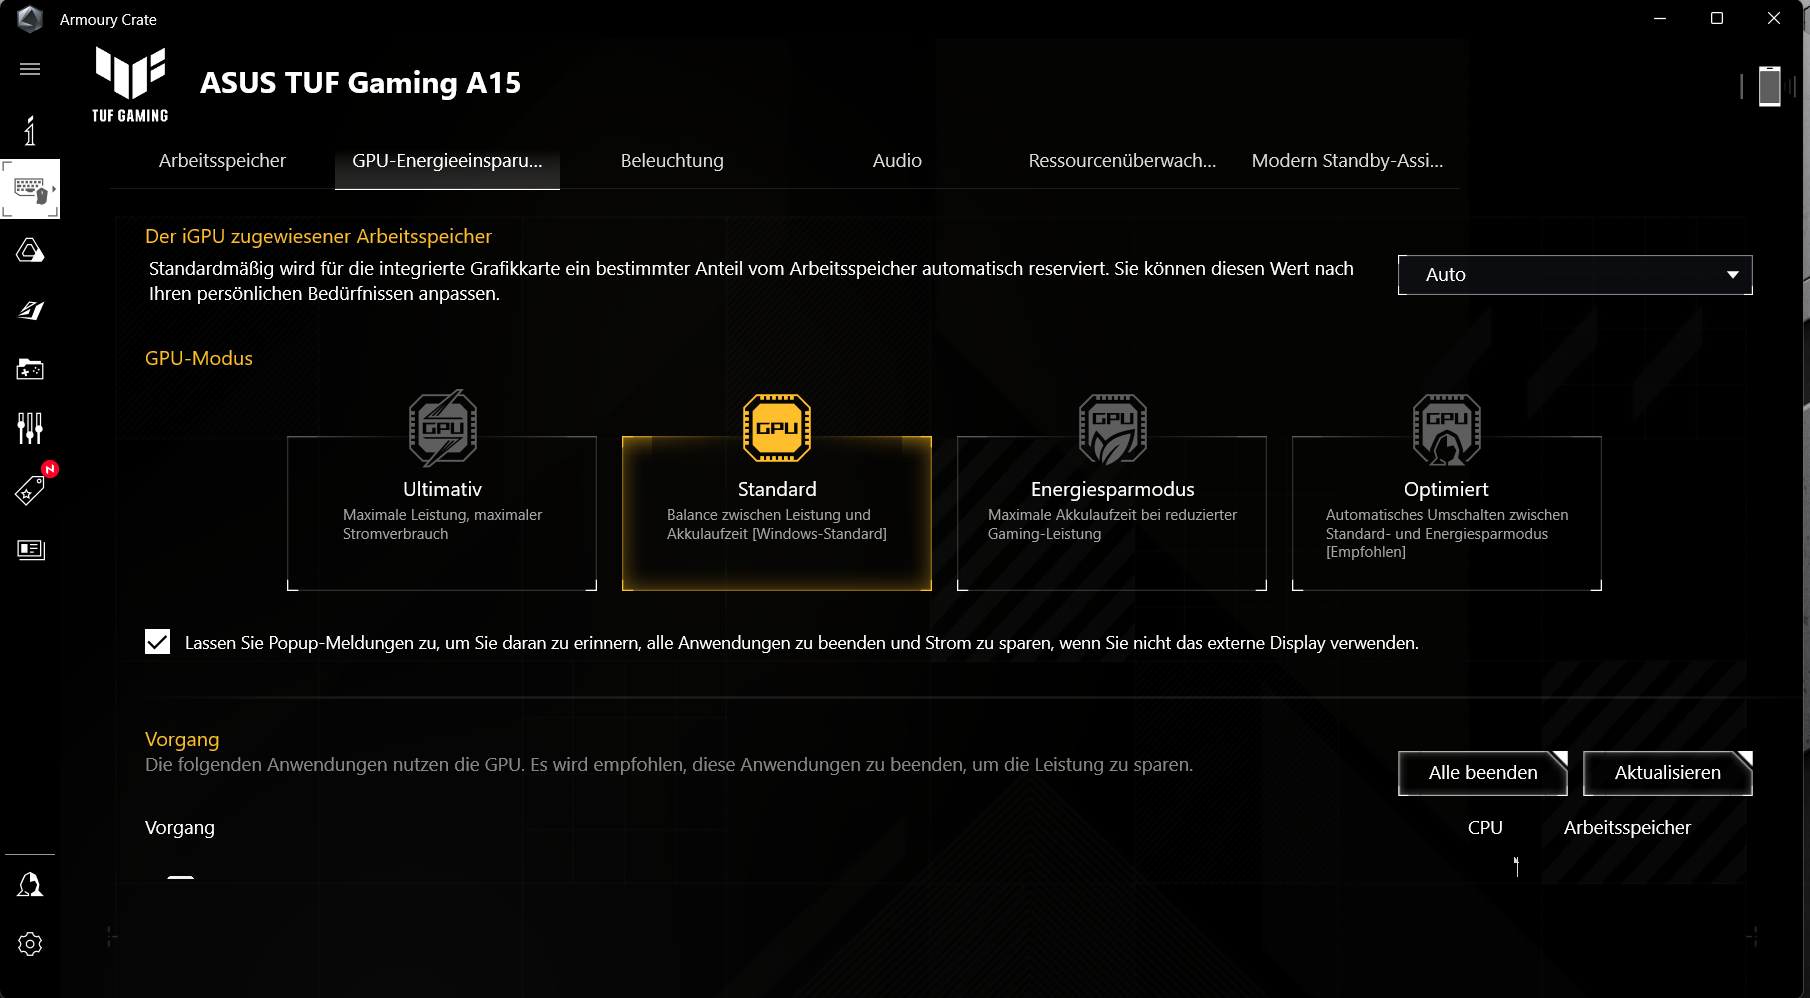
Dizüstü bilgisayarda "Fn" + "F5" tuş kombinasyonu ile değiştirilebilen üreticiye özel üç performans profili (tabloya bakın) bulunmaktadır. Biz "Performans" (kıyaslamalar) ve "Sessiz" (pil testi) profillerini kullandık. GPU modu "Standart" olarak ayarlandı. Dizüstü bilgisayarın kontrol merkezi ("Armoury Crate"), özel bir profil ("Manuel") ayarlamanıza ve güç sınırlarını, dinamik güçlendirme ve fan eğrilerini tanımlamanıza olanak tanır.
| Performans | Turbo | Sessiz | |
|---|---|---|---|
| Güç Limiti 1 (HWInfo) | 70 watt | 80 watt | 54 watt |
| Güç Limiti 2 (HWInfo) | 80 watt | 80 watt | 65 watt |
| Gürültü (CP 2077 Phantom) | 45 dB(A) | 56 dB(A) | 41 dB(A) |
| Performans (CP 2077 Phantom) | 64fps | 70fps | 56fps |
İşlemci
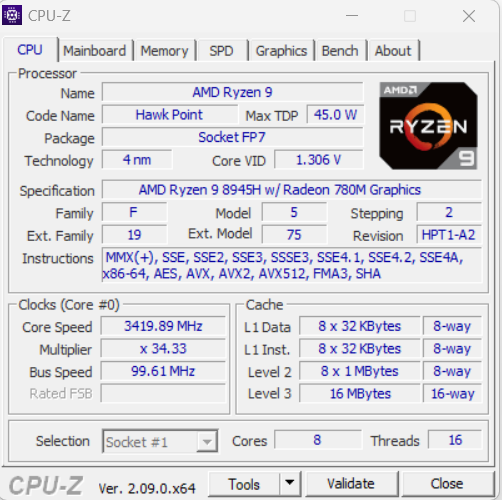
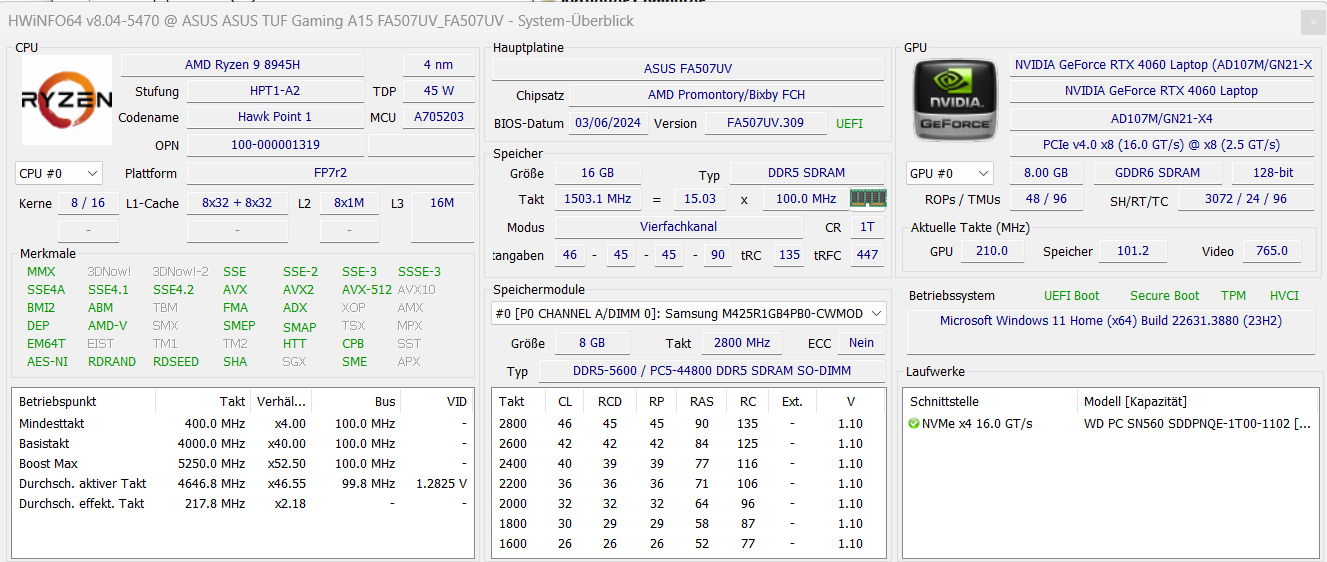
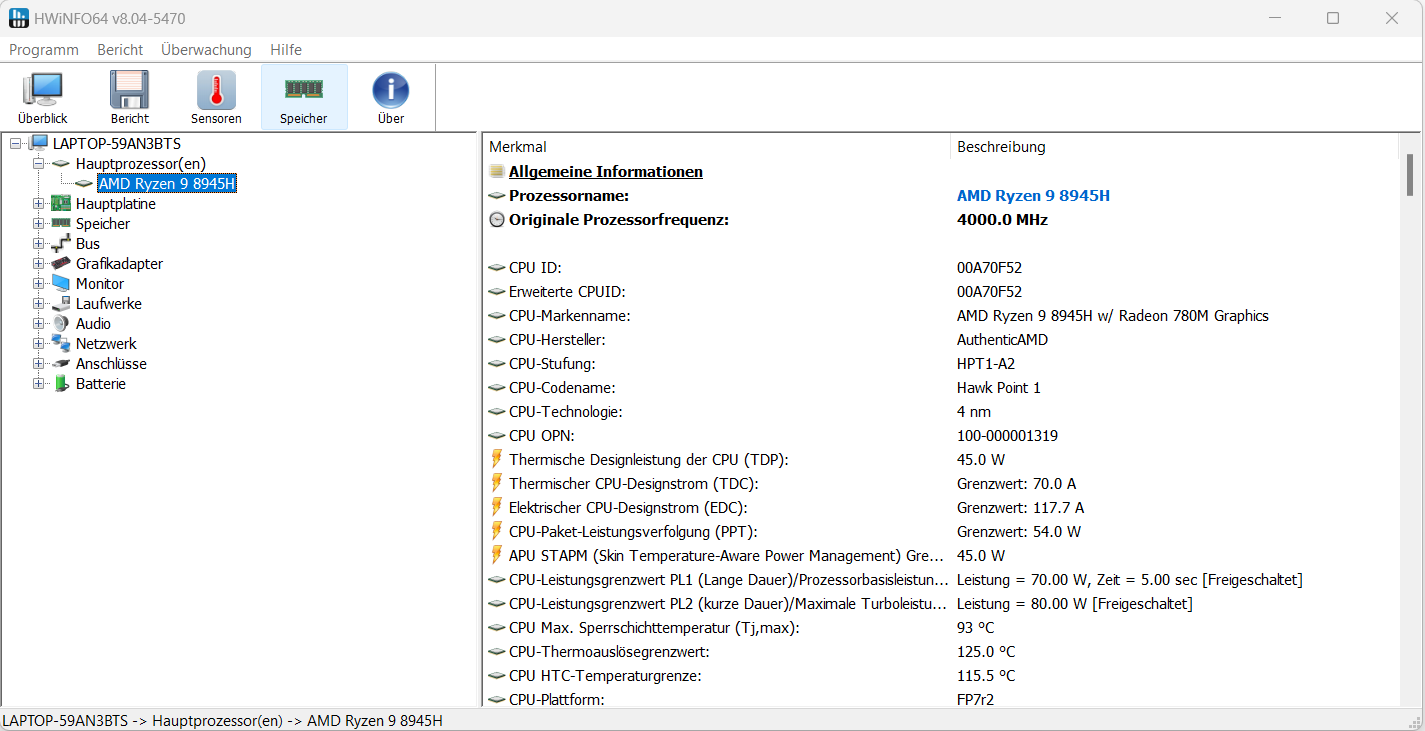
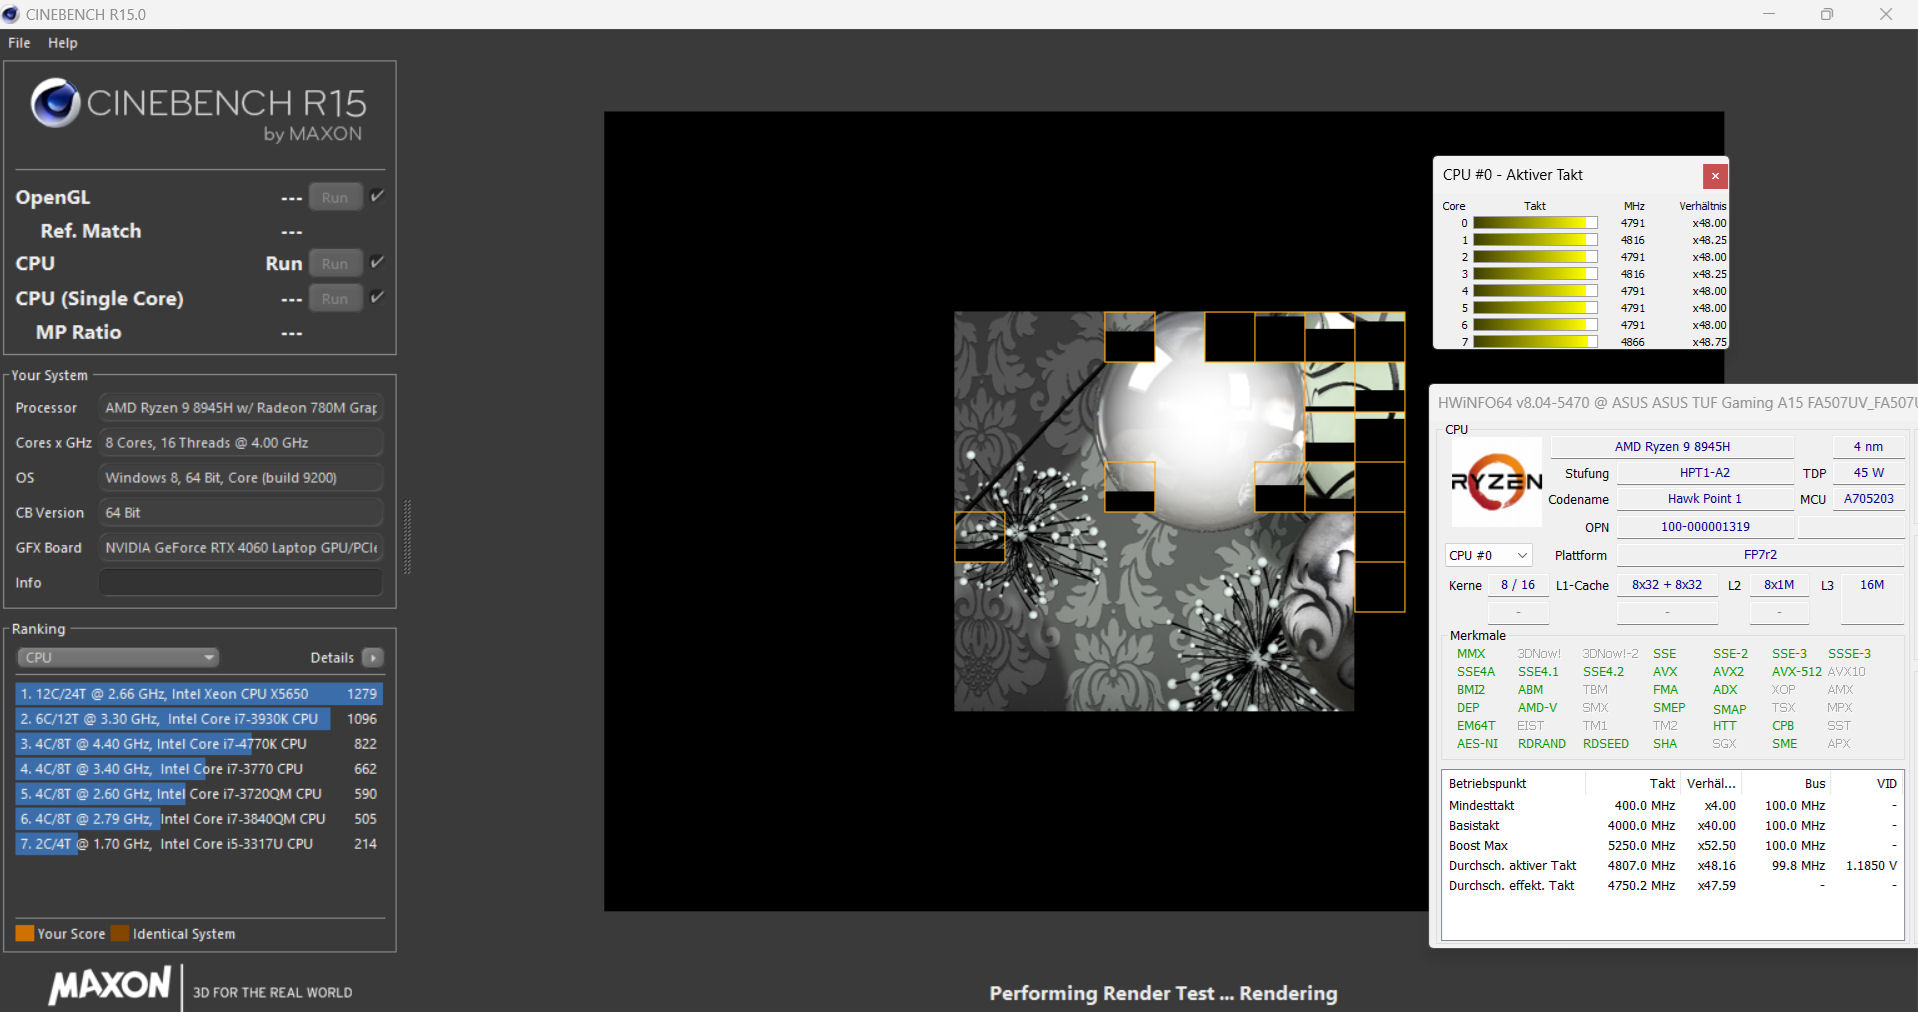
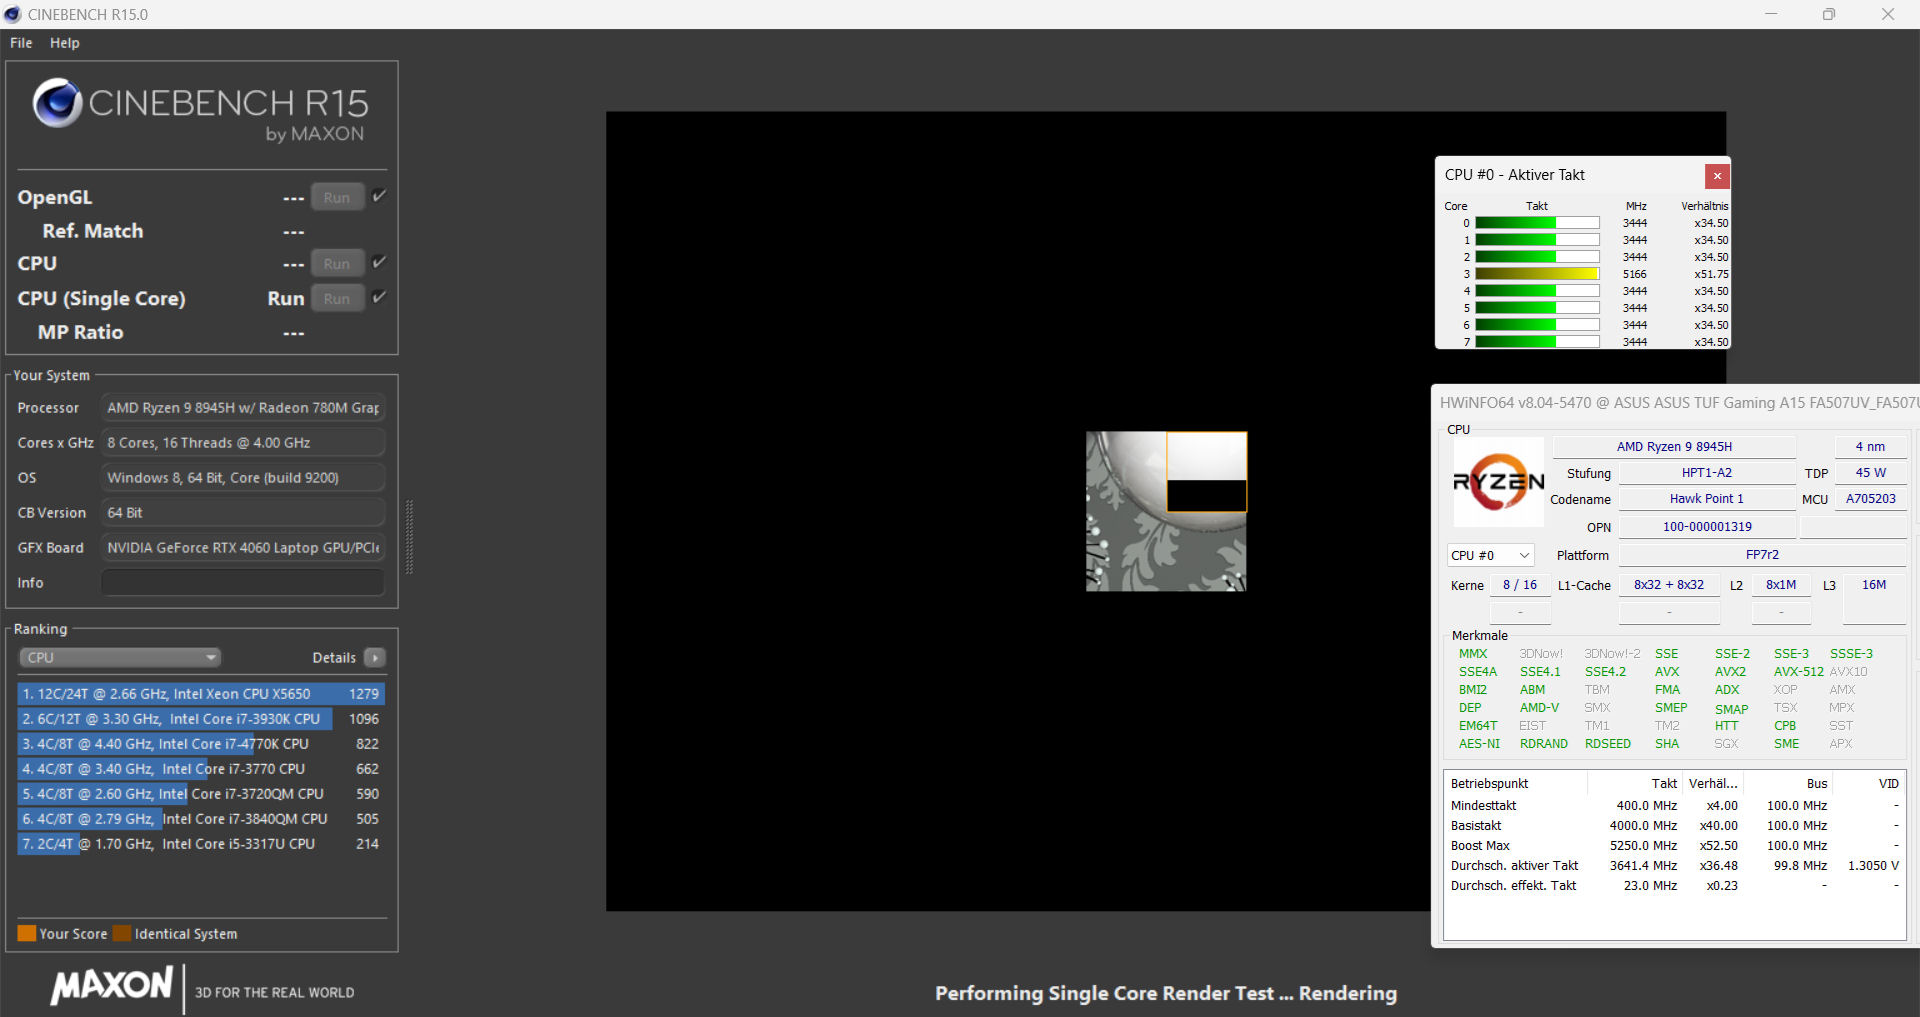
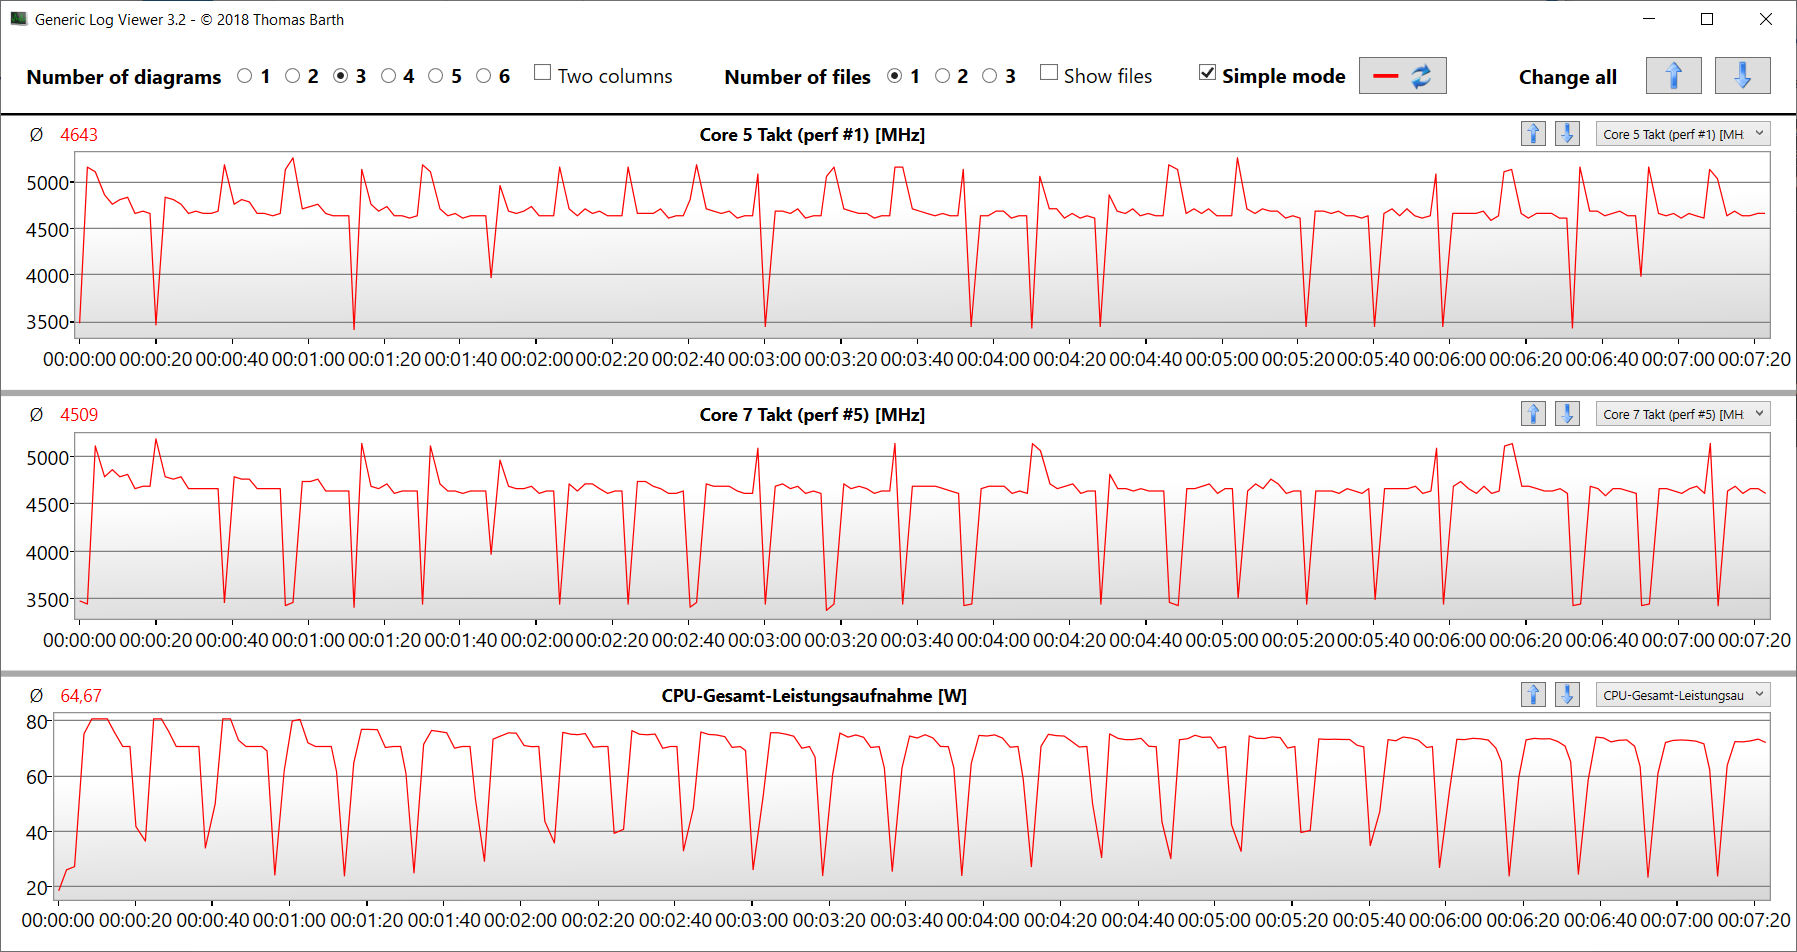
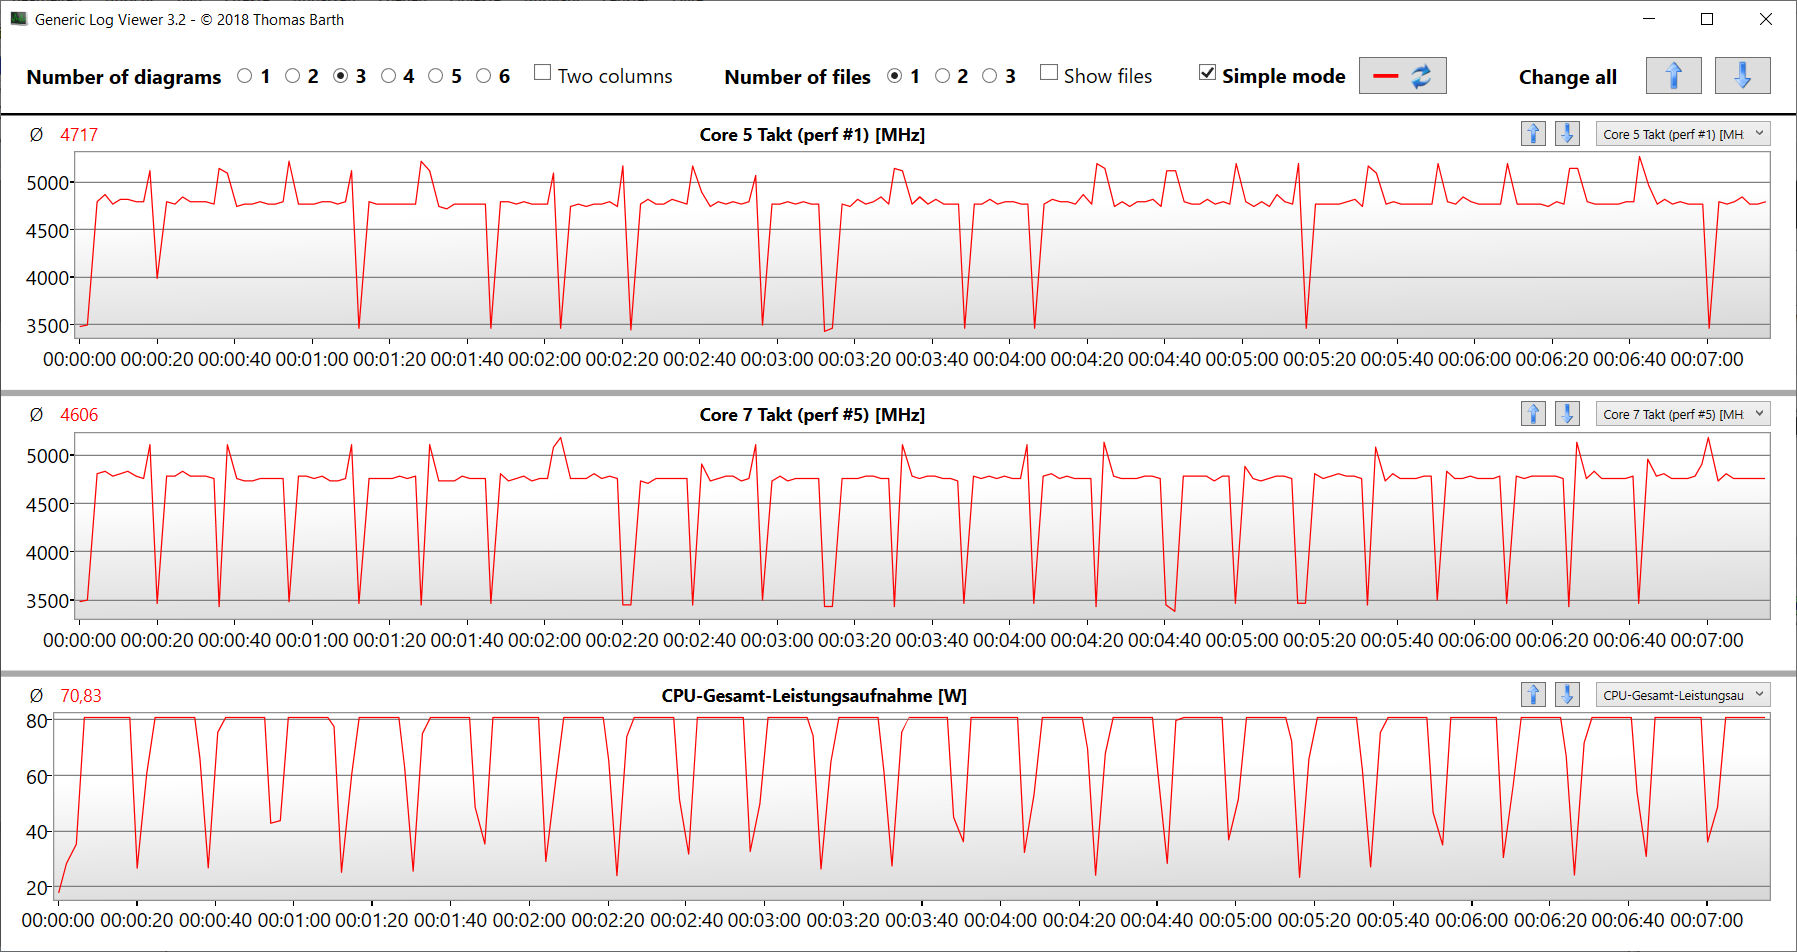
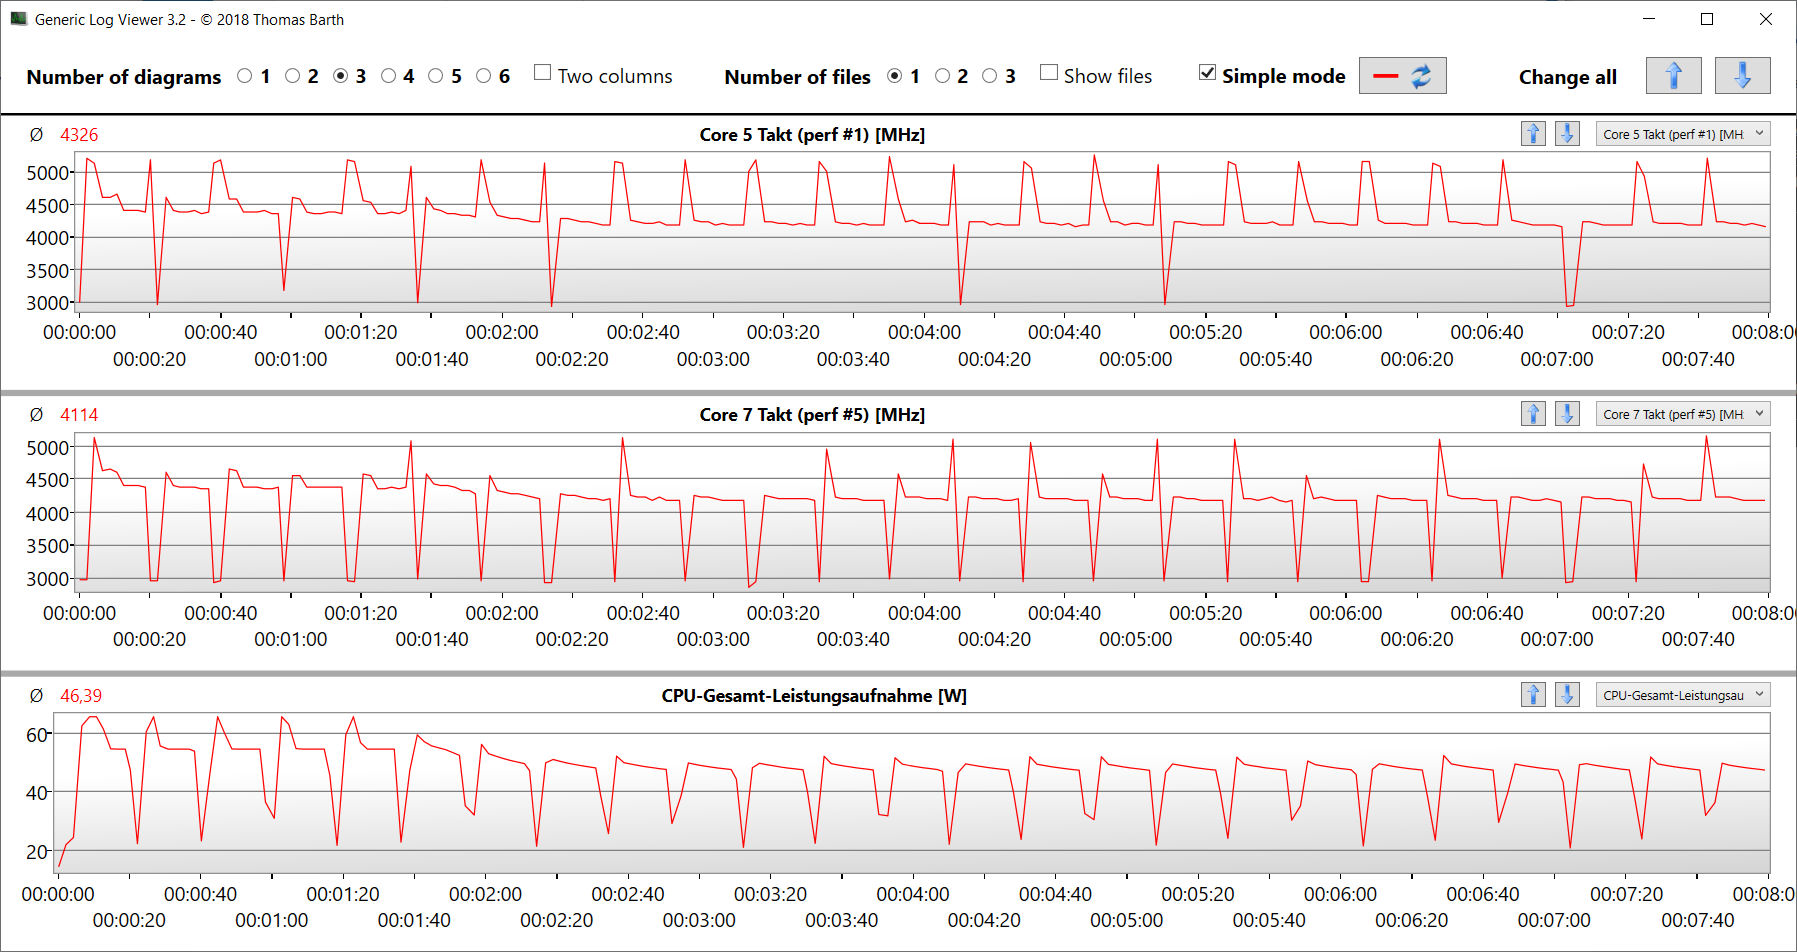
Ryzen 9 8945H (Hawk Point, Zen 4) maksimum 5,25 GHz saat hızında (bir çekirdek) toplam 16 iş parçacığına sahip sekiz CPU çekirdeği sunar. CPU, sürekli çoklu iş parçacığı yüküne (CB15 döngüsü) sürekli olarak yüksek bir turbo hızıyla yanıt verir. CPU performansı seçilen enerji profiline göre değişir ve farklar oldukça küçüktür. Kıyaslama sonuçları, benzer özelliklere sahip bir Ryzen 9 8945HS APU.
Cinebench R15 Multi Continuous Test
| CPU Performance Rating - Percent | |
| Sınıf ortalaması Gaming | |
| HP Victus 16 (2024) | |
| SCHENKER XMG Core 15 (M24) | |
| Dell G16, i7-13650HX, RTX 4060 | |
| Asus TUF Gaming A15 FA507UV | |
| Ortalama AMD Ryzen 9 8945H | |
| Asus TUF Gaming A15 FA507UV | |
| Gigabyte G6X 9KG (2024) | |
| Lenovo LOQ 15IRX9 | |
| Asus TUF A15 FA507 -2! | |
| Cinebench R23 | |
| Multi Core | |
| HP Victus 16 (2024) | |
| Sınıf ortalaması Gaming (5668 - 39652, n=151, son 2 yıl) | |
| Dell G16, i7-13650HX, RTX 4060 | |
| Gigabyte G6X 9KG (2024) | |
| SCHENKER XMG Core 15 (M24) | |
| Asus TUF Gaming A15 FA507UV (Turbo) | |
| Ortalama AMD Ryzen 9 8945H (17423 - 17785, n=2) | |
| Asus TUF Gaming A15 FA507UV | |
| Lenovo LOQ 15IRX9 | |
| Asus TUF A15 FA507 | |
| Single Core | |
| Dell G16, i7-13650HX, RTX 4060 | |
| Sınıf ortalaması Gaming (1136 - 2252, n=151, son 2 yıl) | |
| Asus TUF Gaming A15 FA507UV | |
| Gigabyte G6X 9KG (2024) | |
| Ortalama AMD Ryzen 9 8945H (1812 - 1814, n=2) | |
| Asus TUF Gaming A15 FA507UV (Turbo) | |
| SCHENKER XMG Core 15 (M24) | |
| Lenovo LOQ 15IRX9 | |
| HP Victus 16 (2024) | |
| Asus TUF A15 FA507 | |
| Cinebench R20 | |
| CPU (Multi Core) | |
| HP Victus 16 (2024) | |
| Sınıf ortalaması Gaming (2179 - 15517, n=151, son 2 yıl) | |
| Dell G16, i7-13650HX, RTX 4060 | |
| Gigabyte G6X 9KG (2024) | |
| SCHENKER XMG Core 15 (M24) | |
| Asus TUF Gaming A15 FA507UV (Turbo) | |
| Ortalama AMD Ryzen 9 8945H (6859 - 6956, n=2) | |
| Asus TUF Gaming A15 FA507UV | |
| Lenovo LOQ 15IRX9 | |
| Asus TUF A15 FA507 | |
| CPU (Single Core) | |
| Sınıf ortalaması Gaming (439 - 866, n=151, son 2 yıl) | |
| Dell G16, i7-13650HX, RTX 4060 | |
| Gigabyte G6X 9KG (2024) | |
| SCHENKER XMG Core 15 (M24) | |
| Asus TUF Gaming A15 FA507UV | |
| Ortalama AMD Ryzen 9 8945H (638 - 670, n=2) | |
| Lenovo LOQ 15IRX9 | |
| HP Victus 16 (2024) | |
| Asus TUF Gaming A15 FA507UV (Turbo) | |
| Asus TUF A15 FA507 | |
| Cinebench R15 | |
| CPU Multi 64Bit | |
| HP Victus 16 (2024) | |
| Sınıf ortalaması Gaming (905 - 6074, n=154, son 2 yıl) | |
| Dell G16, i7-13650HX, RTX 4060 | |
| SCHENKER XMG Core 15 (M24) | |
| Gigabyte G6X 9KG (2024) | |
| Asus TUF Gaming A15 FA507UV (Turbo) | |
| Asus TUF Gaming A15 FA507UV | |
| Ortalama AMD Ryzen 9 8945H (2605 - 2819, n=3) | |
| Lenovo LOQ 15IRX9 | |
| Asus TUF A15 FA507 | |
| CPU Single 64Bit | |
| Asus TUF Gaming A15 FA507UV | |
| Ortalama AMD Ryzen 9 8945H (283 - 284, n=2) | |
| Asus TUF Gaming A15 FA507UV (Turbo) | |
| SCHENKER XMG Core 15 (M24) | |
| Sınıf ortalaması Gaming (191.9 - 343, n=151, son 2 yıl) | |
| Dell G16, i7-13650HX, RTX 4060 | |
| Gigabyte G6X 9KG (2024) | |
| Asus TUF A15 FA507 | |
| Lenovo LOQ 15IRX9 | |
| HP Victus 16 (2024) | |
| Blender - v2.79 BMW27 CPU | |
| Lenovo LOQ 15IRX9 | |
| Gigabyte G6X 9KG (2024) | |
| Asus TUF A15 FA507 | |
| Asus TUF Gaming A15 FA507UV | |
| Ortalama AMD Ryzen 9 8945H (178 - 182, n=2) | |
| SCHENKER XMG Core 15 (M24) | |
| Asus TUF Gaming A15 FA507UV (Turbo) | |
| Sınıf ortalaması Gaming (81 - 555, n=144, son 2 yıl) | |
| HP Victus 16 (2024) | |
| Dell G16, i7-13650HX, RTX 4060 | |
| 7-Zip 18.03 | |
| 7z b 4 | |
| HP Victus 16 (2024) | |
| Sınıf ortalaması Gaming (23795 - 144064, n=149, son 2 yıl) | |
| Dell G16, i7-13650HX, RTX 4060 | |
| SCHENKER XMG Core 15 (M24) | |
| Gigabyte G6X 9KG (2024) | |
| Asus TUF Gaming A15 FA507UV | |
| Ortalama AMD Ryzen 9 8945H (72851 - 73222, n=2) | |
| Asus TUF Gaming A15 FA507UV (Turbo) | |
| Asus TUF A15 FA507 | |
| Lenovo LOQ 15IRX9 | |
| 7z b 4 -mmt1 | |
| Asus TUF Gaming A15 FA507UV (Turbo) | |
| Ortalama AMD Ryzen 9 8945H (6615 - 6664, n=2) | |
| Asus TUF Gaming A15 FA507UV | |
| SCHENKER XMG Core 15 (M24) | |
| Sınıf ortalaması Gaming (4199 - 7573, n=149, son 2 yıl) | |
| Dell G16, i7-13650HX, RTX 4060 | |
| Gigabyte G6X 9KG (2024) | |
| Asus TUF A15 FA507 | |
| HP Victus 16 (2024) | |
| Lenovo LOQ 15IRX9 | |
| Geekbench 6.4 | |
| Multi-Core | |
| HP Victus 16 (2024) (6.2.1) | |
| Sınıf ortalaması Gaming (5340 - 21668, n=119, son 2 yıl) | |
| SCHENKER XMG Core 15 (M24) (6.2.1) | |
| Dell G16, i7-13650HX, RTX 4060 (6.2.1) | |
| Gigabyte G6X 9KG (2024) (6.2.1) | |
| Lenovo LOQ 15IRX9 (6.2.1) | |
| Asus TUF Gaming A15 FA507UV (6.2.1) | |
| Ortalama AMD Ryzen 9 8945H (12638 - 12662, n=2) | |
| Asus TUF Gaming A15 FA507UV (6.2.1 Turbo) | |
| Single-Core | |
| Asus TUF Gaming A15 FA507UV (6.2.1) | |
| Ortalama AMD Ryzen 9 8945H (2692 - 2711, n=2) | |
| Asus TUF Gaming A15 FA507UV (6.2.1, Turbo) | |
| SCHENKER XMG Core 15 (M24) (6.2.1) | |
| Sınıf ortalaması Gaming (1490 - 3219, n=119, son 2 yıl) | |
| Dell G16, i7-13650HX, RTX 4060 (6.2.1) | |
| Gigabyte G6X 9KG (2024) (6.2.1) | |
| Lenovo LOQ 15IRX9 (6.2.1) | |
| HP Victus 16 (2024) (6.2.1) | |
| Geekbench 5.5 | |
| Multi-Core | |
| HP Victus 16 (2024) | |
| Sınıf ortalaması Gaming (4557 - 25855, n=148, son 2 yıl) | |
| Gigabyte G6X 9KG (2024) | |
| SCHENKER XMG Core 15 (M24) | |
| Dell G16, i7-13650HX, RTX 4060 | |
| Asus TUF Gaming A15 FA507UV (Turbo) | |
| Lenovo LOQ 15IRX9 | |
| Ortalama AMD Ryzen 9 8945H (11949 - 12028, n=2) | |
| Asus TUF Gaming A15 FA507UV | |
| Asus TUF A15 FA507 | |
| Single-Core | |
| Asus TUF Gaming A15 FA507UV (Turbo) | |
| Ortalama AMD Ryzen 9 8945H (1991 - 1995, n=2) | |
| Asus TUF Gaming A15 FA507UV | |
| SCHENKER XMG Core 15 (M24) | |
| Sınıf ortalaması Gaming (986 - 2423, n=148, son 2 yıl) | |
| Dell G16, i7-13650HX, RTX 4060 | |
| Gigabyte G6X 9KG (2024) | |
| HP Victus 16 (2024) | |
| Lenovo LOQ 15IRX9 | |
| Asus TUF A15 FA507 | |
| HWBOT x265 Benchmark v2.2 - 4k Preset | |
| Sınıf ortalaması Gaming (6.72 - 42.9, n=148, son 2 yıl) | |
| SCHENKER XMG Core 15 (M24) | |
| Asus TUF Gaming A15 FA507UV (Turbo) | |
| Ortalama AMD Ryzen 9 8945H (21.9 - 22.4, n=2) | |
| HP Victus 16 (2024) | |
| Asus TUF Gaming A15 FA507UV | |
| Dell G16, i7-13650HX, RTX 4060 | |
| Gigabyte G6X 9KG (2024) | |
| Lenovo LOQ 15IRX9 | |
| Asus TUF A15 FA507 | |
| LibreOffice - 20 Documents To PDF | |
| Lenovo LOQ 15IRX9 (6.3.4.2) | |
| HP Victus 16 (2024) (6.3.4.2) | |
| Dell G16, i7-13650HX, RTX 4060 (6.3.4.2) | |
| Asus TUF A15 FA507 | |
| SCHENKER XMG Core 15 (M24) (6.3.4.2) | |
| Sınıf ortalaması Gaming (19 - 96.6, n=147, son 2 yıl) | |
| Asus TUF Gaming A15 FA507UV (6.3.4.2) | |
| Ortalama AMD Ryzen 9 8945H (44.2 - 47.5, n=2) | |
| Asus TUF Gaming A15 FA507UV (6.3.4.2, Turbo) | |
| Gigabyte G6X 9KG (2024) (6.3.4.2) | |
| R Benchmark 2.5 - Overall mean | |
| Asus TUF A15 FA507 | |
| HP Victus 16 (2024) | |
| Lenovo LOQ 15IRX9 | |
| Sınıf ortalaması Gaming (0.3609 - 0.759, n=150, son 2 yıl) | |
| Gigabyte G6X 9KG (2024) | |
| SCHENKER XMG Core 15 (M24) | |
| Asus TUF Gaming A15 FA507UV (Turbo) | |
| Ortalama AMD Ryzen 9 8945H (0.4298 - 0.4346, n=2) | |
| Asus TUF Gaming A15 FA507UV | |
| Dell G16, i7-13650HX, RTX 4060 | |
| Dell G16, i7-13650HX, RTX 4060 | |
* ... daha küçük daha iyidir
AIDA64: FP32 Ray-Trace | FPU Julia | CPU SHA3 | CPU Queen | FPU SinJulia | FPU Mandel | CPU AES | CPU ZLib | FP64 Ray-Trace | CPU PhotoWorxx
| Performance Rating | |
| Asus TUF Gaming A15 FA507UV | |
| Ortalama AMD Ryzen 9 8945H | |
| SCHENKER XMG Core 15 (M24) | |
| Asus TUF Gaming A15 FA507UV | |
| Sınıf ortalaması Gaming | |
| Dell G16, i7-13650HX, RTX 4060 | |
| HP Victus 16 (2024) | |
| Asus TUF A15 FA507 | |
| Gigabyte G6X 9KG (2024) | |
| Lenovo LOQ 15IRX9 | |
| AIDA64 / FP32 Ray-Trace | |
| SCHENKER XMG Core 15 (M24) (v6.92.6600) | |
| Asus TUF Gaming A15 FA507UV (v6.92.6600, Turbo) | |
| Ortalama AMD Ryzen 9 8945H (28698 - 29423, n=2) | |
| Asus TUF Gaming A15 FA507UV (v6.92.6600) | |
| Sınıf ortalaması Gaming (4986 - 81639, n=147, son 2 yıl) | |
| Dell G16, i7-13650HX, RTX 4060 (v6.92.6600) | |
| HP Victus 16 (2024) (v6.92.6600) | |
| Asus TUF A15 FA507 (v6.85.6300) | |
| Lenovo LOQ 15IRX9 (v6.92.6600) | |
| Gigabyte G6X 9KG (2024) (v6.92.6600) | |
| AIDA64 / FPU Julia | |
| SCHENKER XMG Core 15 (M24) (v6.92.6600) | |
| Asus TUF Gaming A15 FA507UV (v6.92.6600, Turbo) | |
| Ortalama AMD Ryzen 9 8945H (122466 - 125008, n=2) | |
| Asus TUF Gaming A15 FA507UV (v6.92.6600) | |
| Sınıf ortalaması Gaming (25360 - 252486, n=147, son 2 yıl) | |
| Asus TUF A15 FA507 (v6.85.6300) | |
| Dell G16, i7-13650HX, RTX 4060 (v6.92.6600) | |
| HP Victus 16 (2024) (v6.92.6600) | |
| Lenovo LOQ 15IRX9 (v6.92.6600) | |
| Gigabyte G6X 9KG (2024) (v6.92.6600) | |
| AIDA64 / CPU SHA3 | |
| Asus TUF Gaming A15 FA507UV (v6.92.6600, Turbo) | |
| SCHENKER XMG Core 15 (M24) (v6.92.6600) | |
| Ortalama AMD Ryzen 9 8945H (5113 - 5209, n=2) | |
| Asus TUF Gaming A15 FA507UV (v6.92.6600) | |
| Sınıf ortalaması Gaming (1339 - 10389, n=147, son 2 yıl) | |
| Dell G16, i7-13650HX, RTX 4060 (v6.92.6600) | |
| HP Victus 16 (2024) (v6.92.6600) | |
| Lenovo LOQ 15IRX9 (v6.92.6600) | |
| Asus TUF A15 FA507 (v6.85.6300) | |
| Gigabyte G6X 9KG (2024) (v6.92.6600) | |
| AIDA64 / CPU Queen | |
| HP Victus 16 (2024) (v6.92.6600) | |
| Asus TUF Gaming A15 FA507UV (v6.92.6600) | |
| Ortalama AMD Ryzen 9 8945H (124401 - 125950, n=2) | |
| SCHENKER XMG Core 15 (M24) (v6.92.6600) | |
| Asus TUF Gaming A15 FA507UV (v6.92.6600, Turbo) | |
| Sınıf ortalaması Gaming (50699 - 200651, n=147, son 2 yıl) | |
| Gigabyte G6X 9KG (2024) (v6.92.6600) | |
| Dell G16, i7-13650HX, RTX 4060 (v6.92.6600) | |
| Asus TUF A15 FA507 (v6.85.6300) | |
| Lenovo LOQ 15IRX9 (v6.92.6600) | |
| AIDA64 / FPU SinJulia | |
| Asus TUF Gaming A15 FA507UV (v6.92.6600, Turbo) | |
| Ortalama AMD Ryzen 9 8945H (15856 - 15889, n=2) | |
| Asus TUF Gaming A15 FA507UV (v6.92.6600) | |
| SCHENKER XMG Core 15 (M24) (v6.92.6600) | |
| Sınıf ortalaması Gaming (4800 - 32988, n=147, son 2 yıl) | |
| Asus TUF A15 FA507 (v6.85.6300) | |
| HP Victus 16 (2024) (v6.92.6600) | |
| Dell G16, i7-13650HX, RTX 4060 (v6.92.6600) | |
| Lenovo LOQ 15IRX9 (v6.92.6600) | |
| Gigabyte G6X 9KG (2024) (v6.92.6600) | |
| AIDA64 / FPU Mandel | |
| SCHENKER XMG Core 15 (M24) (v6.92.6600) | |
| Asus TUF Gaming A15 FA507UV (v6.92.6600, Turbo) | |
| Ortalama AMD Ryzen 9 8945H (65523 - 67020, n=2) | |
| Asus TUF Gaming A15 FA507UV (v6.92.6600) | |
| Asus TUF A15 FA507 (v6.85.6300) | |
| Sınıf ortalaması Gaming (12321 - 134044, n=147, son 2 yıl) | |
| Dell G16, i7-13650HX, RTX 4060 (v6.92.6600) | |
| HP Victus 16 (2024) (v6.92.6600) | |
| Lenovo LOQ 15IRX9 (v6.92.6600) | |
| Gigabyte G6X 9KG (2024) (v6.92.6600) | |
| AIDA64 / CPU AES | |
| Sınıf ortalaması Gaming (19065 - 328679, n=147, son 2 yıl) | |
| SCHENKER XMG Core 15 (M24) (v6.92.6600) | |
| Asus TUF Gaming A15 FA507UV (v6.92.6600, Turbo) | |
| Ortalama AMD Ryzen 9 8945H (90481 - 91871, n=2) | |
| Asus TUF Gaming A15 FA507UV (v6.92.6600) | |
| Dell G16, i7-13650HX, RTX 4060 (v6.92.6600) | |
| HP Victus 16 (2024) (v6.92.6600) | |
| Lenovo LOQ 15IRX9 (v6.92.6600) | |
| Asus TUF A15 FA507 (v6.85.6300) | |
| Gigabyte G6X 9KG (2024) (v6.92.6600) | |
| AIDA64 / CPU ZLib | |
| Sınıf ortalaması Gaming (373 - 2531, n=147, son 2 yıl) | |
| Dell G16, i7-13650HX, RTX 4060 (v6.92.6600) | |
| HP Victus 16 (2024) (v6.92.6600) | |
| Asus TUF Gaming A15 FA507UV (v6.92.6600, Turbo) | |
| Ortalama AMD Ryzen 9 8945H (1150 - 1164, n=2) | |
| Asus TUF Gaming A15 FA507UV (v6.92.6600) | |
| Gigabyte G6X 9KG (2024) (v6.92.6600) | |
| Lenovo LOQ 15IRX9 (v6.92.6600) | |
| SCHENKER XMG Core 15 (M24) (v6.92.6600) | |
| Asus TUF A15 FA507 (v6.85.6300) | |
| AIDA64 / FP64 Ray-Trace | |
| SCHENKER XMG Core 15 (M24) (v6.92.6600) | |
| Asus TUF Gaming A15 FA507UV (v6.92.6600, Turbo) | |
| Ortalama AMD Ryzen 9 8945H (15513 - 15727, n=2) | |
| Asus TUF Gaming A15 FA507UV (v6.92.6600) | |
| Sınıf ortalaması Gaming (2540 - 43430, n=147, son 2 yıl) | |
| Dell G16, i7-13650HX, RTX 4060 (v6.92.6600) | |
| HP Victus 16 (2024) (v6.92.6600) | |
| Asus TUF A15 FA507 (v6.85.6300) | |
| Lenovo LOQ 15IRX9 (v6.92.6600) | |
| Gigabyte G6X 9KG (2024) (v6.92.6600) | |
| AIDA64 / CPU PhotoWorxx | |
| SCHENKER XMG Core 15 (M24) (v6.92.6600) | |
| Sınıf ortalaması Gaming (10805 - 60161, n=147, son 2 yıl) | |
| HP Victus 16 (2024) (v6.92.6600) | |
| Gigabyte G6X 9KG (2024) (v6.92.6600) | |
| Lenovo LOQ 15IRX9 (v6.92.6600) | |
| Dell G16, i7-13650HX, RTX 4060 (v6.92.6600) | |
| Asus TUF Gaming A15 FA507UV (v6.92.6600) | |
| Ortalama AMD Ryzen 9 8945H (33327 - 33410, n=2) | |
| Asus TUF Gaming A15 FA507UV (v6.92.6600, Turbo) | |
| Asus TUF A15 FA507 (v6.85.6300) | |
Sistem performansı
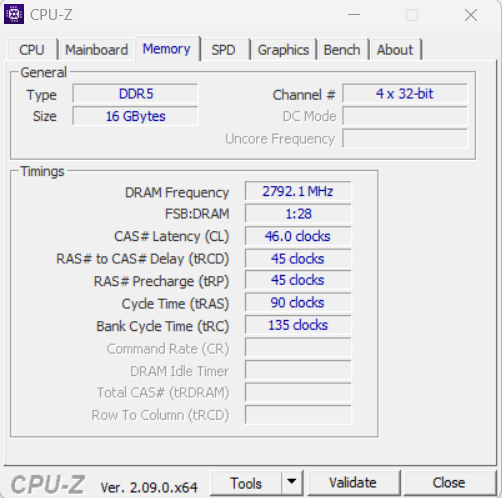
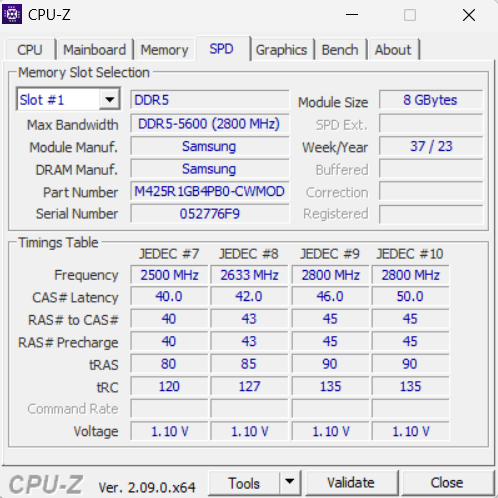
Sorunsuz çalışan sistem render, yayın ve oyun için yeterli güç sağlıyor - bu durum iyi PC Mark sonuçlarıyla da doğrulanıyor. RAM'in aktarım hızları DDR5 5600 RAM için normal seviyede.
CrossMark: Overall | Productivity | Creativity | Responsiveness
WebXPRT 3: Overall
WebXPRT 4: Overall
Mozilla Kraken 1.1: Total
| PCMark 10 / Score | |
| SCHENKER XMG Core 15 (M24) | |
| Asus TUF Gaming A15 FA507UV | |
| Ortalama AMD Ryzen 9 8945H, NVIDIA GeForce RTX 4060 Laptop GPU (n=1) | |
| Sınıf ortalaması Gaming (5776 - 9852, n=133, son 2 yıl) | |
| Gigabyte G6X 9KG (2024) | |
| HP Victus 16 (2024) | |
| Dell G16, i7-13650HX, RTX 4060 | |
| Asus TUF A15 FA507 | |
| Lenovo LOQ 15IRX9 | |
| PCMark 10 / Essentials | |
| Asus TUF Gaming A15 FA507UV | |
| Ortalama AMD Ryzen 9 8945H, NVIDIA GeForce RTX 4060 Laptop GPU (n=1) | |
| HP Victus 16 (2024) | |
| Sınıf ortalaması Gaming (9057 - 12600, n=133, son 2 yıl) | |
| Asus TUF A15 FA507 | |
| Gigabyte G6X 9KG (2024) | |
| SCHENKER XMG Core 15 (M24) | |
| Dell G16, i7-13650HX, RTX 4060 | |
| Lenovo LOQ 15IRX9 | |
| PCMark 10 / Productivity | |
| SCHENKER XMG Core 15 (M24) | |
| Asus TUF Gaming A15 FA507UV | |
| Ortalama AMD Ryzen 9 8945H, NVIDIA GeForce RTX 4060 Laptop GPU (n=1) | |
| Gigabyte G6X 9KG (2024) | |
| Dell G16, i7-13650HX, RTX 4060 | |
| HP Victus 16 (2024) | |
| Sınıf ortalaması Gaming (6662 - 14612, n=133, son 2 yıl) | |
| Asus TUF A15 FA507 | |
| Lenovo LOQ 15IRX9 | |
| PCMark 10 / Digital Content Creation | |
| SCHENKER XMG Core 15 (M24) | |
| Sınıf ortalaması Gaming (6807 - 18475, n=133, son 2 yıl) | |
| Asus TUF Gaming A15 FA507UV | |
| Ortalama AMD Ryzen 9 8945H, NVIDIA GeForce RTX 4060 Laptop GPU (n=1) | |
| Dell G16, i7-13650HX, RTX 4060 | |
| Gigabyte G6X 9KG (2024) | |
| Lenovo LOQ 15IRX9 | |
| HP Victus 16 (2024) | |
| Asus TUF A15 FA507 | |
| CrossMark / Overall | |
| Gigabyte G6X 9KG (2024) | |
| HP Victus 16 (2024) | |
| Sınıf ortalaması Gaming (1247 - 2344, n=114, son 2 yıl) | |
| SCHENKER XMG Core 15 (M24) | |
| Dell G16, i7-13650HX, RTX 4060 | |
| Lenovo LOQ 15IRX9 | |
| Asus TUF Gaming A15 FA507UV | |
| Ortalama AMD Ryzen 9 8945H, NVIDIA GeForce RTX 4060 Laptop GPU (n=1) | |
| Asus TUF A15 FA507 | |
| CrossMark / Productivity | |
| Gigabyte G6X 9KG (2024) | |
| Sınıf ortalaması Gaming (1299 - 2204, n=114, son 2 yıl) | |
| SCHENKER XMG Core 15 (M24) | |
| HP Victus 16 (2024) | |
| Asus TUF Gaming A15 FA507UV | |
| Ortalama AMD Ryzen 9 8945H, NVIDIA GeForce RTX 4060 Laptop GPU (n=1) | |
| Dell G16, i7-13650HX, RTX 4060 | |
| Lenovo LOQ 15IRX9 | |
| Asus TUF A15 FA507 | |
| CrossMark / Creativity | |
| HP Victus 16 (2024) | |
| SCHENKER XMG Core 15 (M24) | |
| Sınıf ortalaması Gaming (1275 - 2660, n=114, son 2 yıl) | |
| Gigabyte G6X 9KG (2024) | |
| Dell G16, i7-13650HX, RTX 4060 | |
| Asus TUF Gaming A15 FA507UV | |
| Ortalama AMD Ryzen 9 8945H, NVIDIA GeForce RTX 4060 Laptop GPU (n=1) | |
| Lenovo LOQ 15IRX9 | |
| Asus TUF A15 FA507 | |
| CrossMark / Responsiveness | |
| Gigabyte G6X 9KG (2024) | |
| HP Victus 16 (2024) | |
| Lenovo LOQ 15IRX9 | |
| Sınıf ortalaması Gaming (1030 - 2330, n=114, son 2 yıl) | |
| Dell G16, i7-13650HX, RTX 4060 | |
| SCHENKER XMG Core 15 (M24) | |
| Asus TUF Gaming A15 FA507UV | |
| Ortalama AMD Ryzen 9 8945H, NVIDIA GeForce RTX 4060 Laptop GPU (n=1) | |
| Asus TUF A15 FA507 | |
| WebXPRT 3 / Overall | |
| Asus TUF Gaming A15 FA507UV | |
| Ortalama AMD Ryzen 9 8945H, NVIDIA GeForce RTX 4060 Laptop GPU (n=1) | |
| SCHENKER XMG Core 15 (M24) | |
| Gigabyte G6X 9KG (2024) | |
| Sınıf ortalaması Gaming (215 - 480, n=127, son 2 yıl) | |
| Asus TUF A15 FA507 | |
| HP Victus 16 (2024) | |
| Dell G16, i7-13650HX, RTX 4060 | |
| Lenovo LOQ 15IRX9 | |
| WebXPRT 4 / Overall | |
| Sınıf ortalaması Gaming (176.4 - 335, n=115, son 2 yıl) | |
| SCHENKER XMG Core 15 (M24) | |
| Asus TUF Gaming A15 FA507UV | |
| Ortalama AMD Ryzen 9 8945H, NVIDIA GeForce RTX 4060 Laptop GPU (n=1) | |
| Gigabyte G6X 9KG (2024) | |
| HP Victus 16 (2024) | |
| Lenovo LOQ 15IRX9 | |
| Asus TUF A15 FA507 | |
| Mozilla Kraken 1.1 / Total | |
| Asus TUF A15 FA507 | |
| Lenovo LOQ 15IRX9 | |
| HP Victus 16 (2024) | |
| Gigabyte G6X 9KG (2024) | |
| Dell G16, i7-13650HX, RTX 4060 | |
| Asus TUF Gaming A15 FA507UV | |
| Ortalama AMD Ryzen 9 8945H, NVIDIA GeForce RTX 4060 Laptop GPU (n=1) | |
| Sınıf ortalaması Gaming (409 - 674, n=139, son 2 yıl) | |
| SCHENKER XMG Core 15 (M24) | |
* ... daha küçük daha iyidir
| PCMark 10 Score | 7943 puan | |
Yardım | ||
| AIDA64 / Memory Copy | |
| SCHENKER XMG Core 15 (M24) | |
| HP Victus 16 (2024) | |
| Sınıf ortalaması Gaming (21750 - 97515, n=147, son 2 yıl) | |
| Ortalama AMD Ryzen 9 8945H (61823 - 63192, n=2) | |
| Asus TUF Gaming A15 FA507UV | |
| Gigabyte G6X 9KG (2024) | |
| Dell G16, i7-13650HX, RTX 4060 | |
| Lenovo LOQ 15IRX9 | |
| Asus TUF A15 FA507 | |
| AIDA64 / Memory Read | |
| HP Victus 16 (2024) | |
| Sınıf ortalaması Gaming (22956 - 102937, n=147, son 2 yıl) | |
| Gigabyte G6X 9KG (2024) | |
| Lenovo LOQ 15IRX9 | |
| Dell G16, i7-13650HX, RTX 4060 | |
| Ortalama AMD Ryzen 9 8945H (61696 - 61810, n=2) | |
| Asus TUF Gaming A15 FA507UV | |
| SCHENKER XMG Core 15 (M24) | |
| Asus TUF A15 FA507 | |
| AIDA64 / Memory Write | |
| SCHENKER XMG Core 15 (M24) | |
| Ortalama AMD Ryzen 9 8945H (78716 - 79615, n=2) | |
| Asus TUF Gaming A15 FA507UV | |
| Sınıf ortalaması Gaming (22297 - 108954, n=147, son 2 yıl) | |
| HP Victus 16 (2024) | |
| Gigabyte G6X 9KG (2024) | |
| Lenovo LOQ 15IRX9 | |
| Dell G16, i7-13650HX, RTX 4060 | |
| Asus TUF A15 FA507 | |
| AIDA64 / Memory Latency | |
| HP Victus 16 (2024) | |
| Sınıf ortalaması Gaming (59.5 - 259, n=147, son 2 yıl) | |
| Lenovo LOQ 15IRX9 | |
| Asus TUF Gaming A15 FA507UV | |
| Ortalama AMD Ryzen 9 8945H (92 - 92.6, n=2) | |
| Dell G16, i7-13650HX, RTX 4060 | |
| Gigabyte G6X 9KG (2024) | |
| SCHENKER XMG Core 15 (M24) | |
| Asus TUF A15 FA507 | |
* ... daha küçük daha iyidir
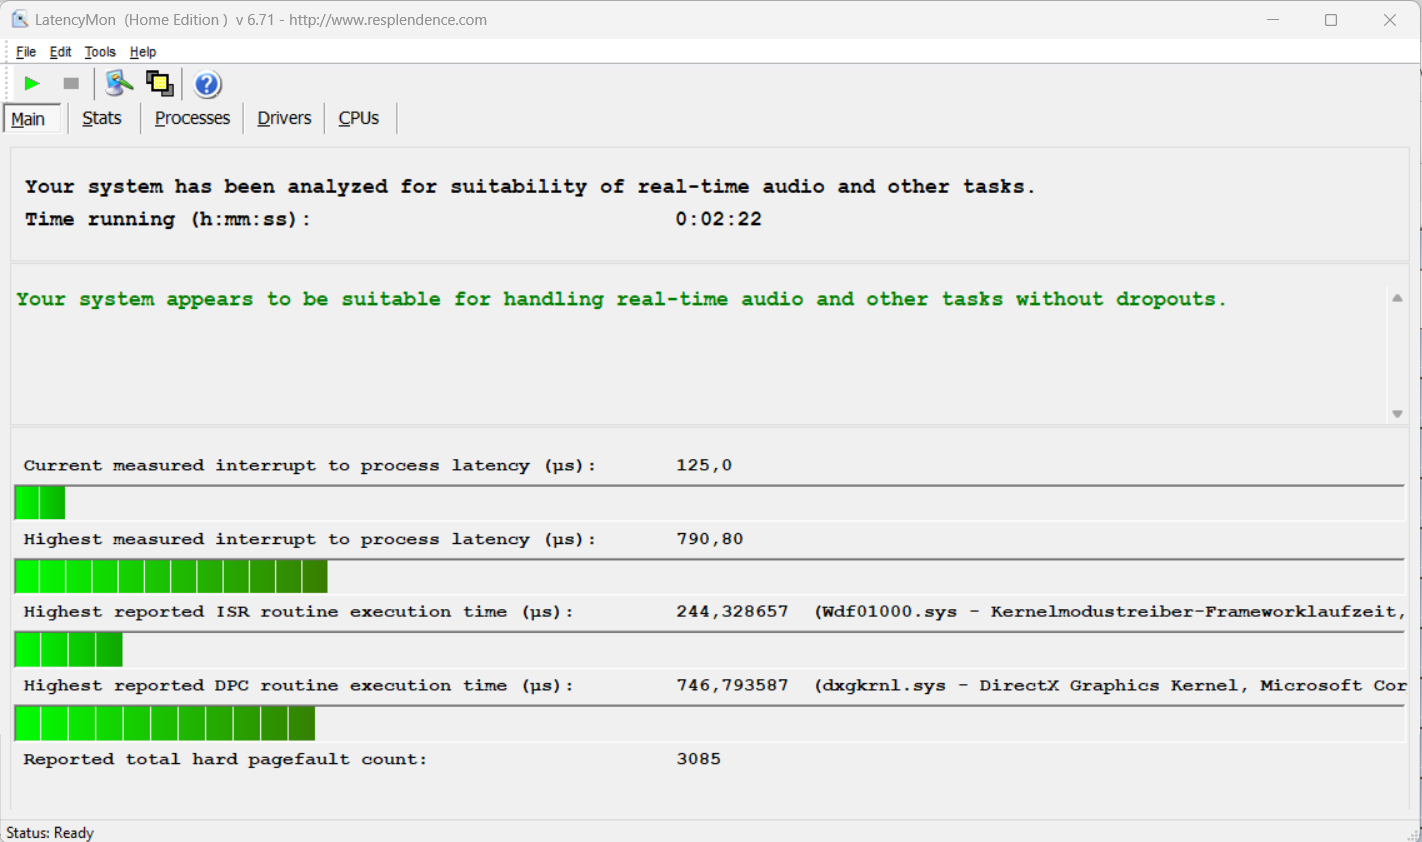
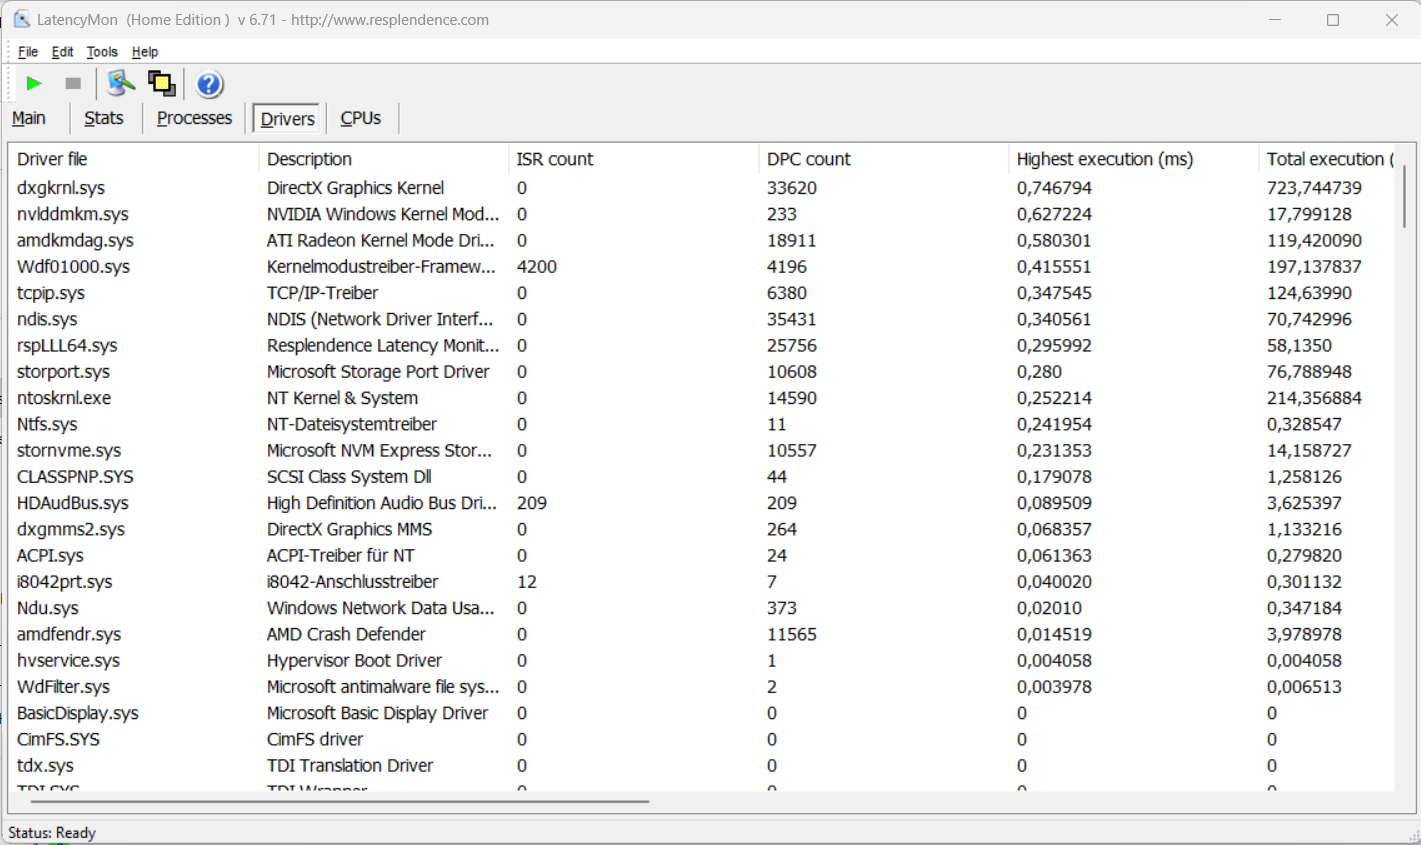
DPC gecikme süreleri
Gecikme testi (internette gezinme, 4k video oynatma, Prime95 yüksek yük) hiçbir anormallik ortaya çıkarmadı. Sistem gerçek zamanlı video ve ses düzenleme için oldukça uygun görünüyor. Gelecekteki yazılım güncellemeleri bu alanı iyileştirebilir ya da kötüleştirebilir.
| DPC Latencies / LatencyMon - interrupt to process latency (max), Web, Youtube, Prime95 | |
| Gigabyte G6X 9KG (2024) | |
| Lenovo LOQ 15IRX9 | |
| SCHENKER XMG Core 15 (M24) | |
| Dell G16, i7-13650HX, RTX 4060 | |
| HP Victus 16 (2024) | |
| Asus TUF Gaming A15 FA507UV | |
* ... daha küçük daha iyidir
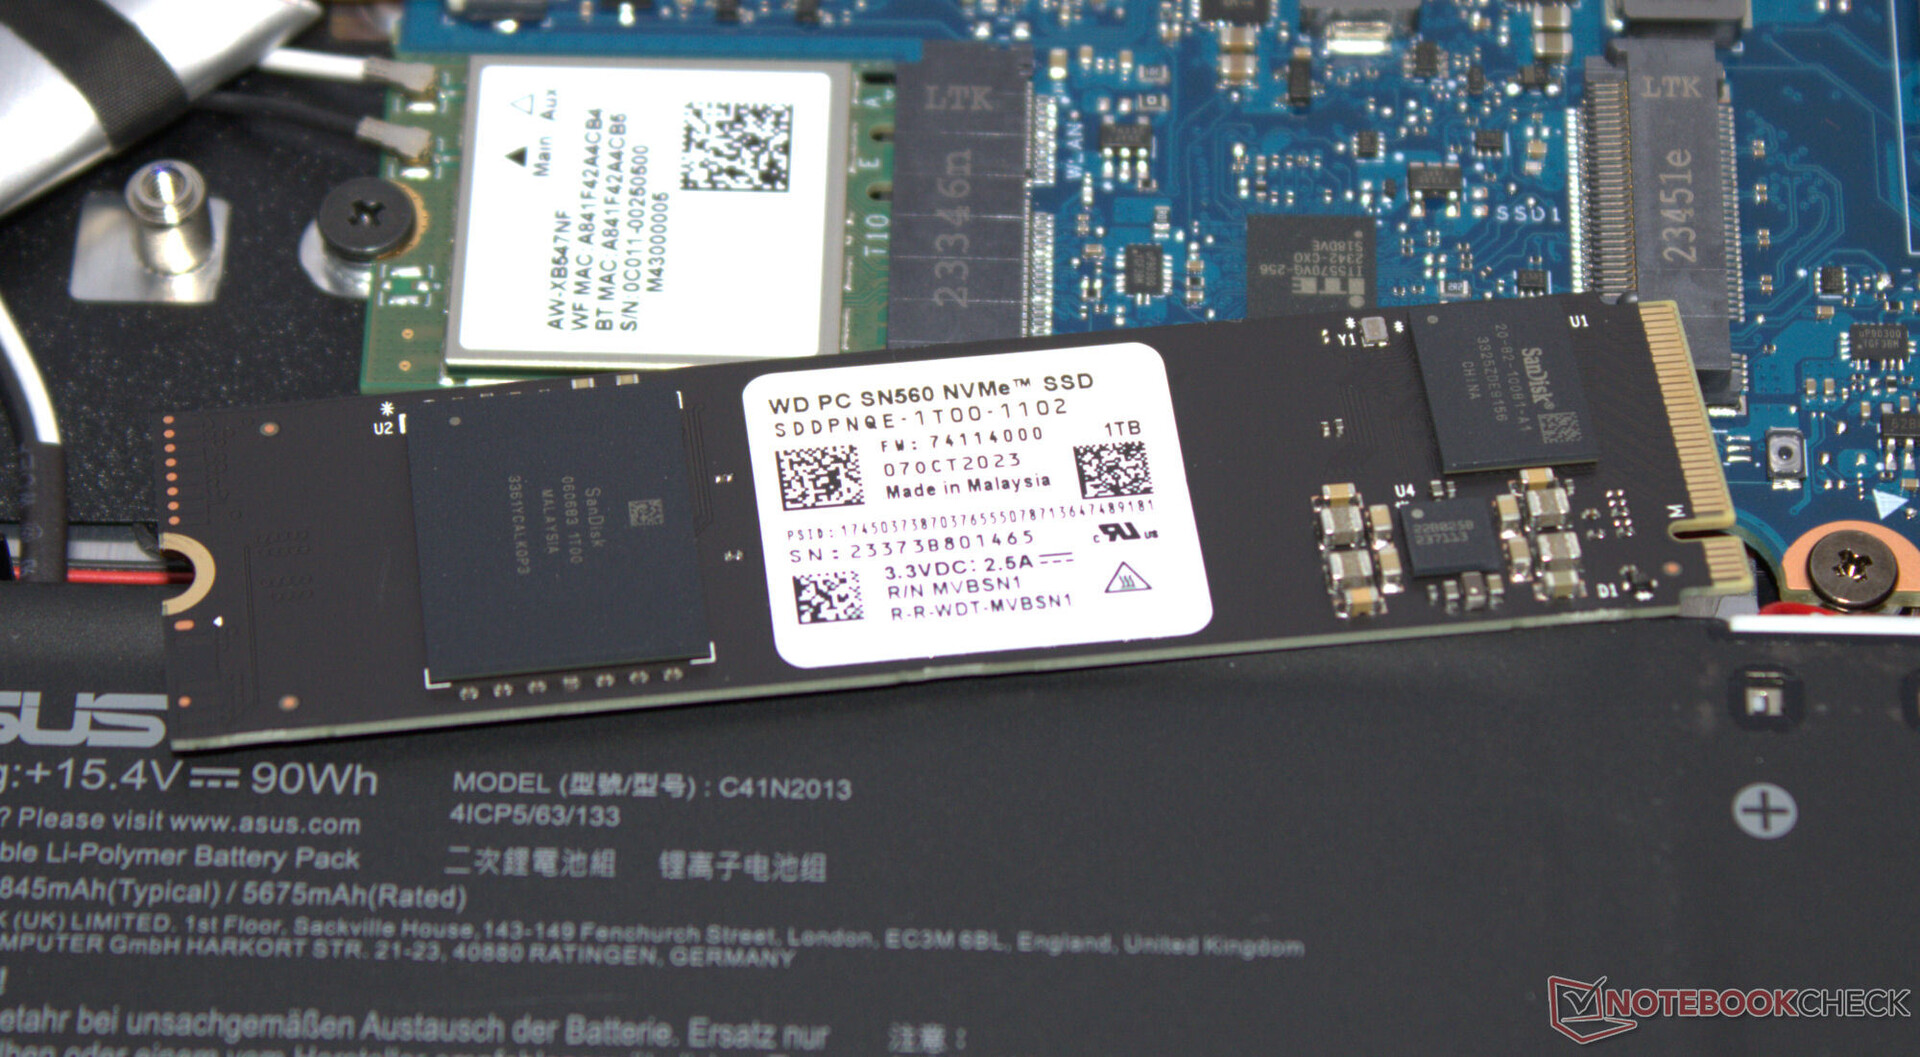
Yığın depolama
A15'in içine iki PCIe 4 SSD (M.2 2280) yerleştirilebilir, bir SSD takılıdır: Western Digital depolama cihazı (1 TB, M.2 2280) iyi veri aktarım hızları sunar ancak en iyi SSD modellerine ait değildir. DiskSpd döngüsünün son aşamalarında, termal kaynaklı kısılma gözlemledik.

| Drive Performance Rating - Percent | |
| Gigabyte G6X 9KG (2024) | |
| HP Victus 16 (2024) | |
| Sınıf ortalaması Gaming | |
| SCHENKER XMG Core 15 (M24) | |
| Dell G16, i7-13650HX, RTX 4060 | |
| Lenovo LOQ 15IRX9 | |
| Asus TUF Gaming A15 FA507UV | |
| Ortalama WD PC SN560 SDDPNQE-1T00 | |
| Asus TUF A15 FA507 | |
* ... daha küçük daha iyidir
Continuous Performance Read: DiskSpd Read Loop, Queue Depth 8
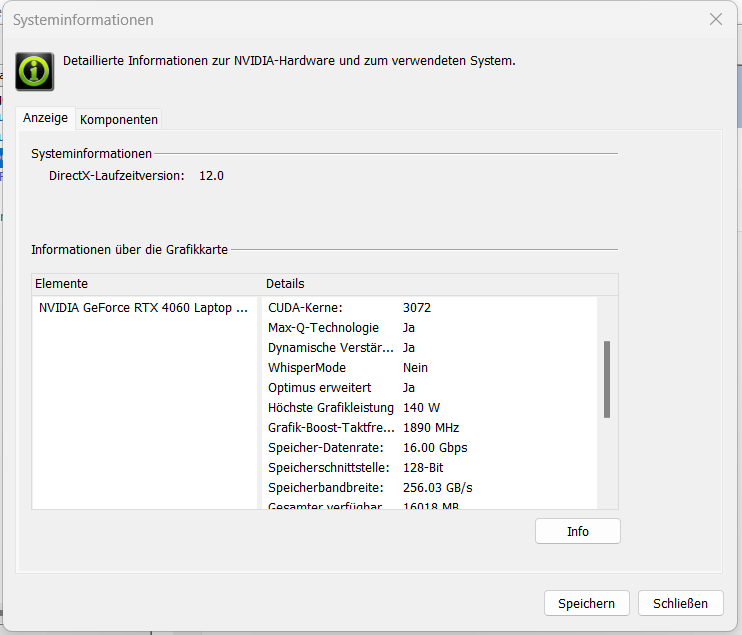
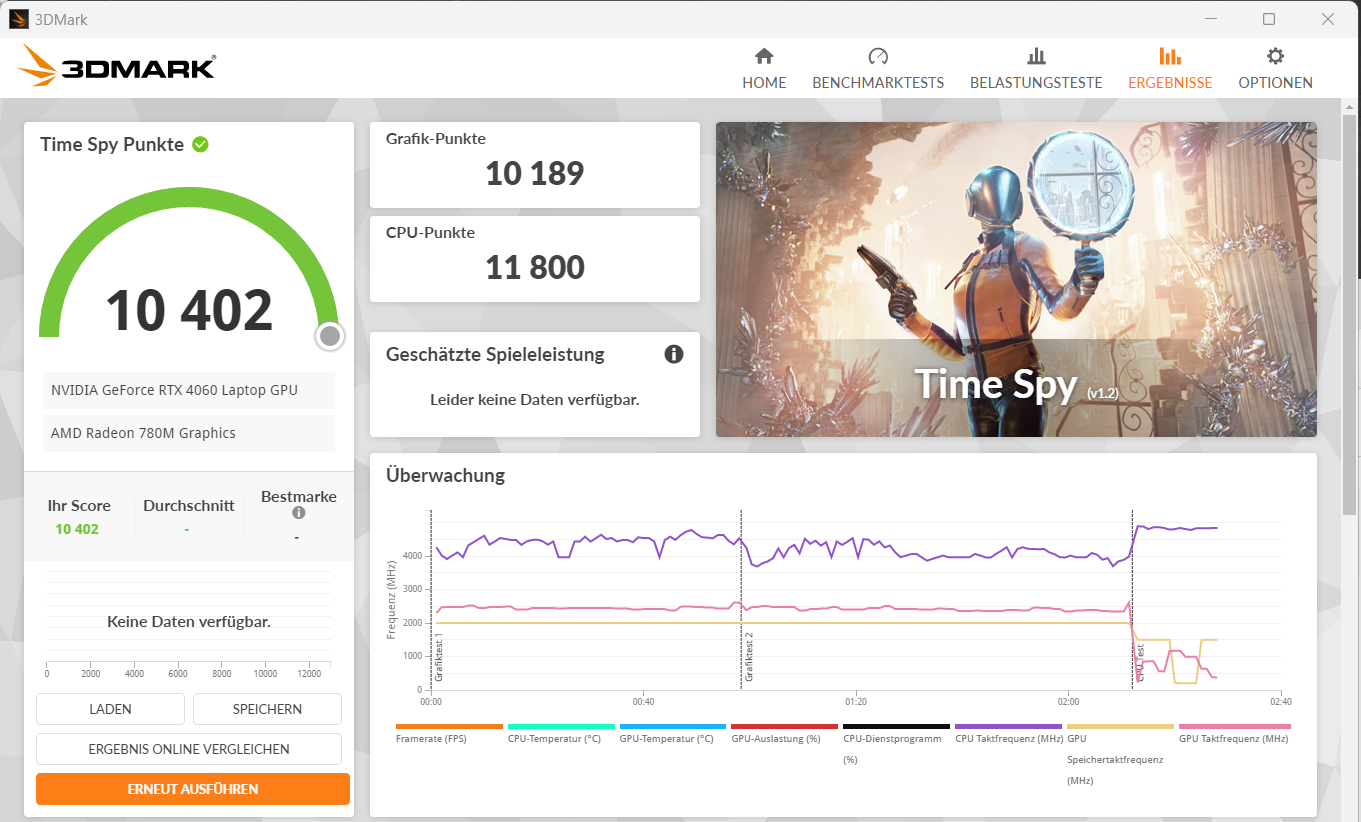
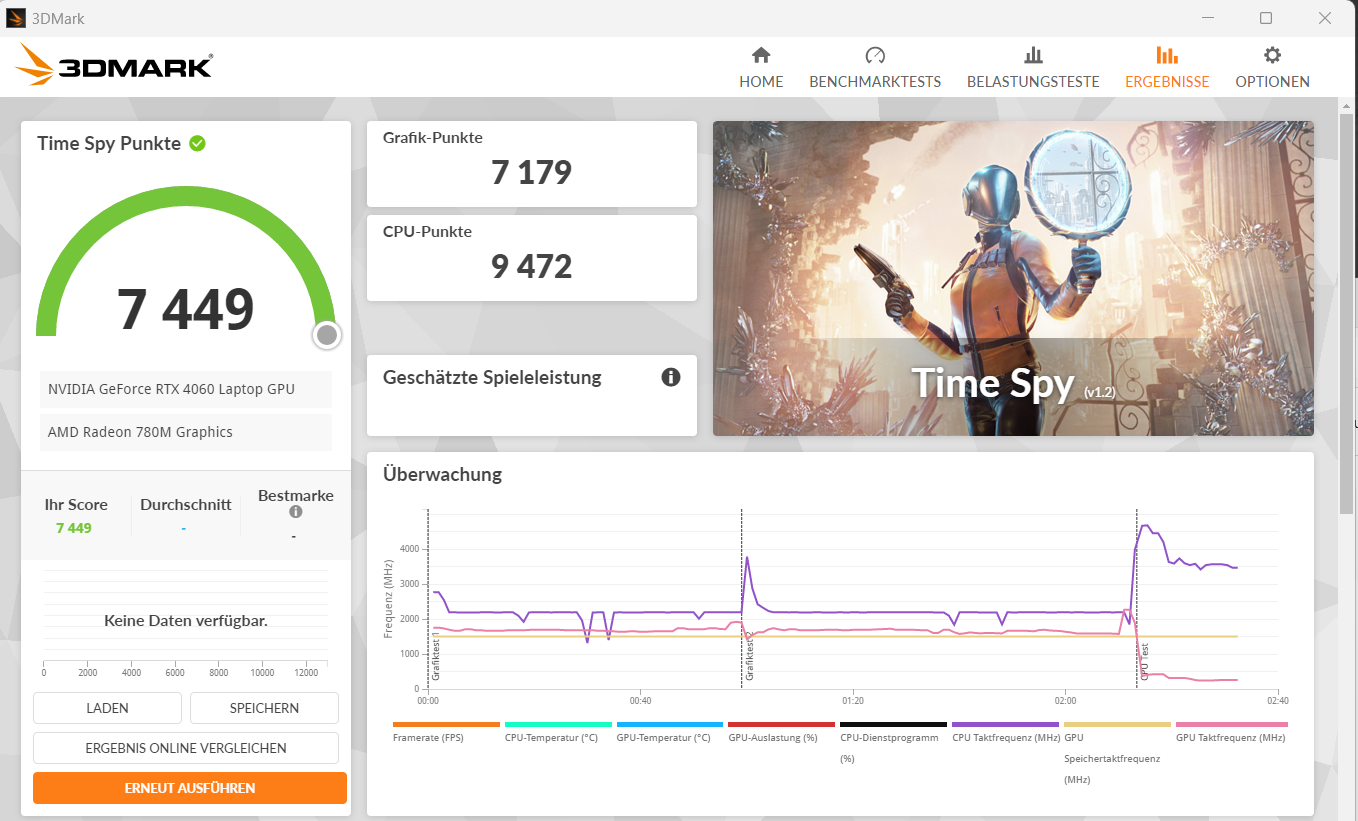
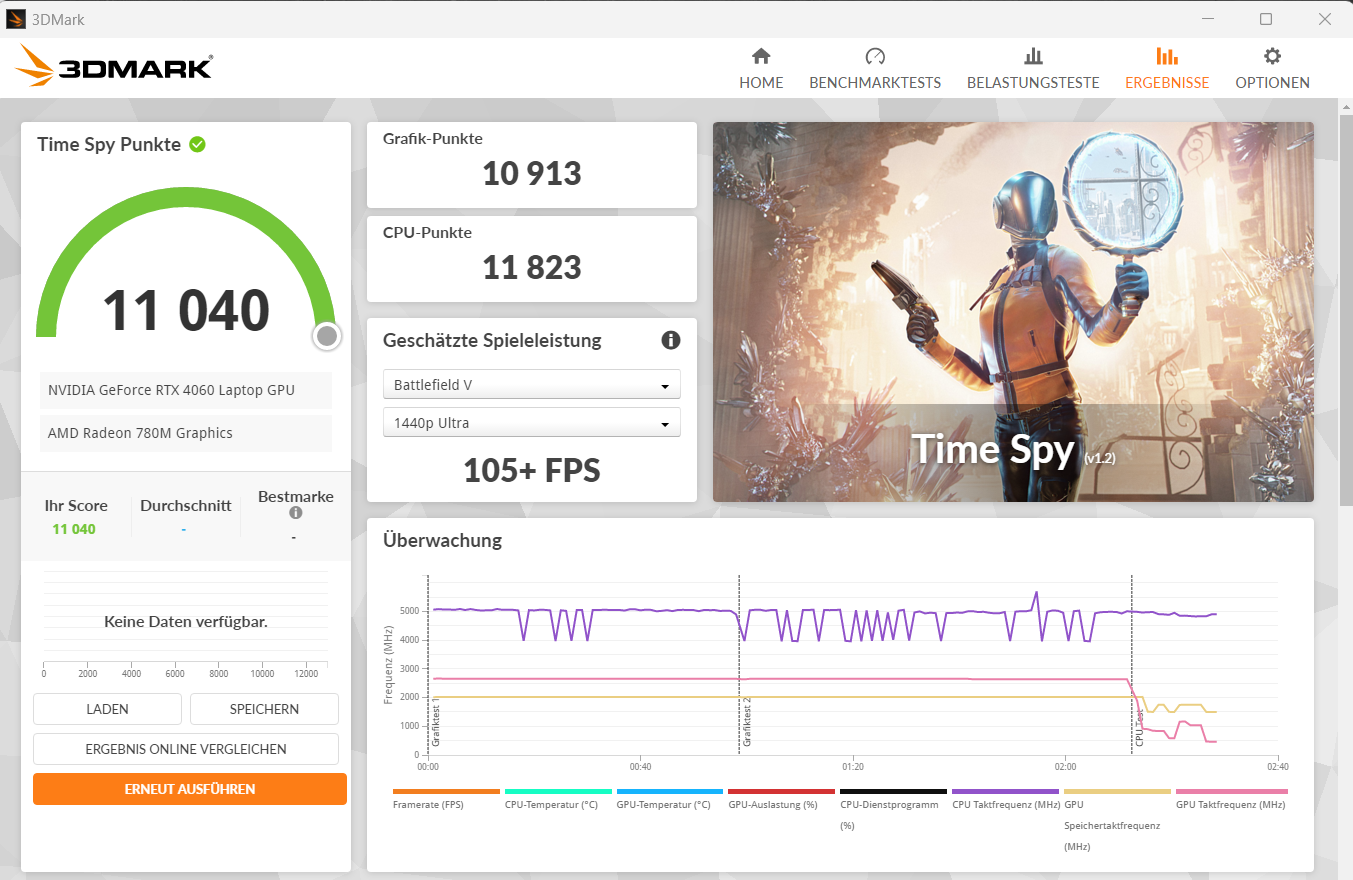
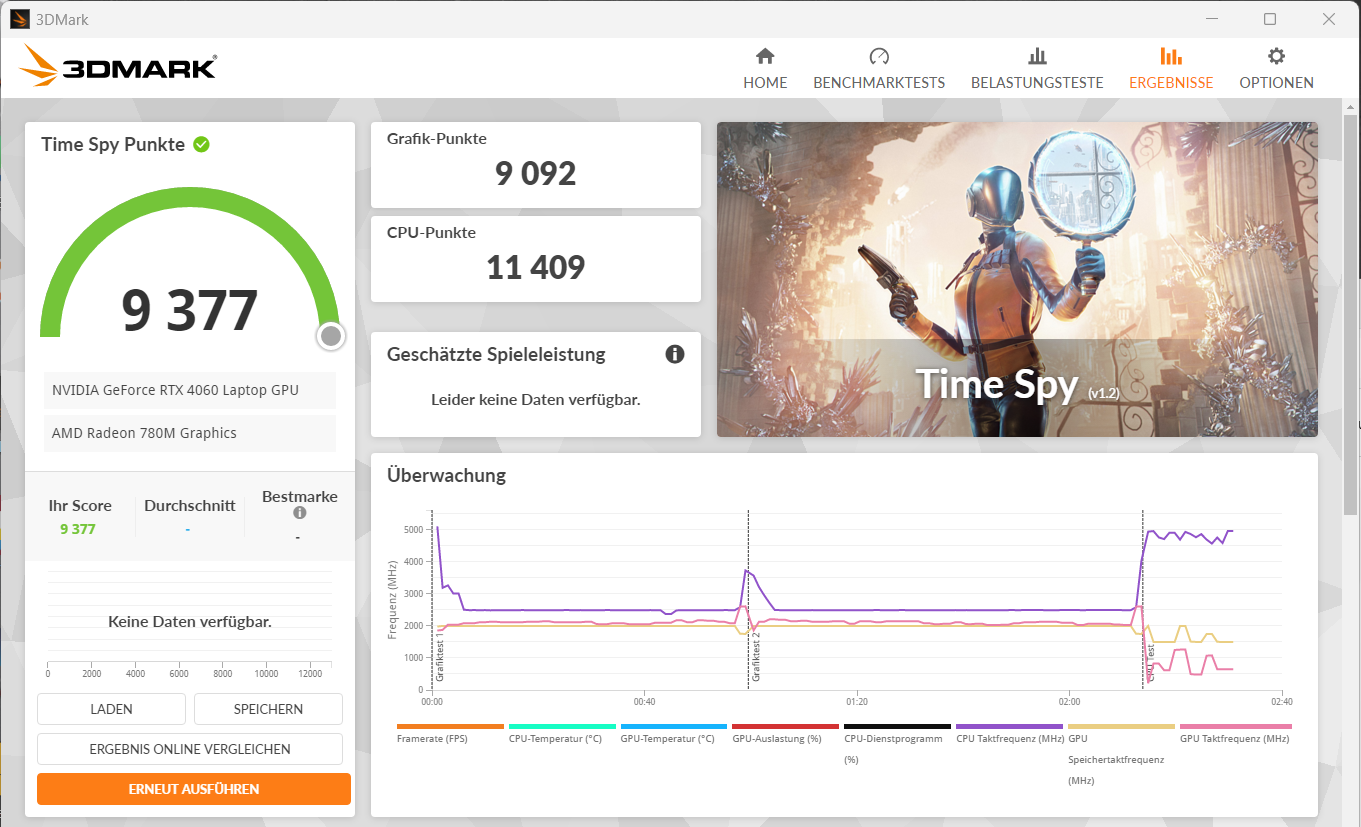
Grafik kartı
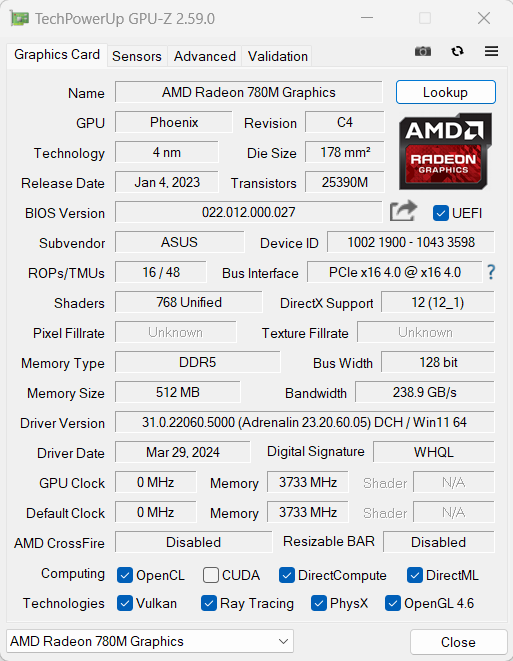
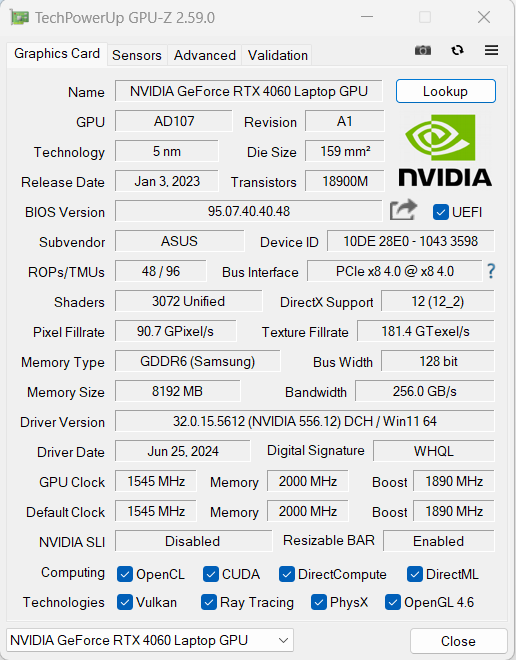
Bu GeForce RTX 4060 (3.072 gölgelendirici 128 bit veri yolu, 8 GB GDDR6, 140 watt) yüksek ila maksimum ayarlarda FHD oyun için tasarlanmıştır. Benchmark skorları ve kare hızları RTX 4060 ortalamasıyla ("Performans") aynı seviyededir. Bazı durumlarda, "Turbo" profili yalnızca minimum bir artışla sonuçlanır. DGPU ve Optimus arasında geçiş yapmak için yeniden başlatma gerekmiyor: Gelişmiş Optimus desteklenmektedir.
| 3DMark Performance Rating - Percent | |
| Sınıf ortalaması Gaming | |
| SCHENKER XMG Core 15 (M24) | |
| Asus TUF Gaming A15 FA507UV | |
| Asus TUF Gaming A15 FA507UV | |
| Dell G16, i7-13650HX, RTX 4060 | |
| Lenovo LOQ 15IRX9 | |
| Gigabyte G6X 9KG (2024) | |
| HP Victus 16 (2024) | |
| Ortalama NVIDIA GeForce RTX 4060 Laptop GPU | |
| Asus TUF A15 FA507 | |
| 3DMark 11 - 1280x720 Performance GPU | |
| Sınıf ortalaması Gaming (10741 - 72178, n=143, son 2 yıl) | |
| SCHENKER XMG Core 15 (M24) | |
| Asus TUF Gaming A15 FA507UV (Turbo) | |
| Asus TUF Gaming A15 FA507UV | |
| Dell G16, i7-13650HX, RTX 4060 | |
| Lenovo LOQ 15IRX9 | |
| Gigabyte G6X 9KG (2024) | |
| HP Victus 16 (2024) | |
| Ortalama NVIDIA GeForce RTX 4060 Laptop GPU (28136 - 38912, n=57) | |
| Asus TUF A15 FA507 | |
| 3DMark | |
| 1920x1080 Fire Strike Graphics | |
| Sınıf ortalaması Gaming (2913 - 56116, n=155, son 2 yıl) | |
| SCHENKER XMG Core 15 (M24) | |
| Asus TUF Gaming A15 FA507UV (Turbo) | |
| Asus TUF Gaming A15 FA507UV | |
| Lenovo LOQ 15IRX9 | |
| Gigabyte G6X 9KG (2024) | |
| Dell G16, i7-13650HX, RTX 4060 | |
| HP Victus 16 (2024) | |
| Ortalama NVIDIA GeForce RTX 4060 Laptop GPU (20533 - 29656, n=54) | |
| Asus TUF A15 FA507 | |
| 2560x1440 Time Spy Graphics | |
| Sınıf ortalaması Gaming (2295 - 24599, n=151, son 2 yıl) | |
| SCHENKER XMG Core 15 (M24) | |
| Asus TUF Gaming A15 FA507UV (Turbo) | |
| Dell G16, i7-13650HX, RTX 4060 | |
| Asus TUF Gaming A15 FA507UV | |
| Ortalama NVIDIA GeForce RTX 4060 Laptop GPU (7484 - 11451, n=56) | |
| HP Victus 16 (2024) | |
| Gigabyte G6X 9KG (2024) | |
| Lenovo LOQ 15IRX9 | |
| Asus TUF A15 FA507 | |
| 3DMark 06 Standard Score | 55024 puan | |
| 3DMark 11 Performance | 31639 puan | |
| 3DMark Fire Strike Score | 25032 puan | |
| 3DMark Time Spy Score | 10402 puan | |
| 3DMark Steel Nomad Score | 2200 puan | |
Yardım | ||
| Geekbench 5.5 | |
| OpenCL Score | |
| Sınıf ortalaması Gaming (5039 - 270235, n=150, son 2 yıl) | |
| SCHENKER XMG Core 15 (M24) | |
| Asus TUF Gaming A15 FA507UV | |
| Asus TUF Gaming A15 FA507UV (Turbo) | |
| Lenovo LOQ 15IRX9 | |
| Gigabyte G6X 9KG (2024) | |
| Dell G16, i7-13650HX, RTX 4060 | |
| HP Victus 16 (2024) | |
| Ortalama NVIDIA GeForce RTX 4060 Laptop GPU (5039 - 112238, n=53) | |
| Asus TUF A15 FA507 | |
| Vulkan Score 5.5 | |
| Asus TUF Gaming A15 FA507UV | |
| SCHENKER XMG Core 15 (M24) | |
| Asus TUF Gaming A15 FA507UV (Turbo) | |
| Lenovo LOQ 15IRX9 | |
| Sınıf ortalaması Gaming (9296 - 176078, n=103, son 2 yıl) | |
| Ortalama NVIDIA GeForce RTX 4060 Laptop GPU (28838 - 87612, n=31) | |
| HP Victus 16 (2024) | |
| Gigabyte G6X 9KG (2024) | |
| Geekbench 6.4 | |
| GPU OpenCL | |
| Sınıf ortalaması Gaming (4321 - 234213, n=118, son 2 yıl) | |
| Gigabyte G6X 9KG (2024) (6.2.1) | |
| SCHENKER XMG Core 15 (M24) (6.2.1) | |
| HP Victus 16 (2024) (6.2.1) | |
| Asus TUF Gaming A15 FA507UV (6.2.1 Turbo) | |
| Dell G16, i7-13650HX, RTX 4060 (6.2.1) | |
| Asus TUF Gaming A15 FA507UV (6.2.1) | |
| Lenovo LOQ 15IRX9 (6.2.1) | |
| Ortalama NVIDIA GeForce RTX 4060 Laptop GPU (4321 - 100831, n=40) | |
| GPU Vulkan | |
| SCHENKER XMG Core 15 (M24) (6.2.1) | |
| Asus TUF Gaming A15 FA507UV (6.2.1) | |
| Asus TUF Gaming A15 FA507UV (6.2.1 Turbo) | |
| Gigabyte G6X 9KG (2024) (6.2.1) | |
| Lenovo LOQ 15IRX9 (6.2.1) | |
| HP Victus 16 (2024) (6.2.1) | |
| Sınıf ortalaması Gaming (4286 - 231659, n=110, son 2 yıl) | |
| Ortalama NVIDIA GeForce RTX 4060 Laptop GPU (4286 - 101001, n=36) | |
| Dell G16, i7-13650HX, RTX 4060 (6.2.1) | |
| V-Ray Benchmark Next 4.10 | |
| GPU | |
| SCHENKER XMG Core 15 (M24) (v4.10.07 ) | |
| Sınıf ortalaması Gaming (54 - 1317, n=122, son 2 yıl) | |
| Asus TUF Gaming A15 FA507UV (v4.10.07, Turbo) | |
| Gigabyte G6X 9KG (2024) (v4.10.07 ) | |
| Asus TUF Gaming A15 FA507UV (v4.10.07 ) | |
| Ortalama NVIDIA GeForce RTX 4060 Laptop GPU (483 - 715, n=46) | |
| HP Victus 16 (2024) (v4.10.07 ) | |
| Lenovo LOQ 15IRX9 (v4.10.07 ) | |
| Asus TUF A15 FA507 (v4.10.07 ) | |
| CPU | |
| HP Victus 16 (2024) (v4.10.07 ) | |
| Sınıf ortalaması Gaming (5413 - 44129, n=122, son 2 yıl) | |
| Ortalama NVIDIA GeForce RTX 4060 Laptop GPU (12680 - 32360, n=46) | |
| SCHENKER XMG Core 15 (M24) (v4.10.07 ) | |
| Gigabyte G6X 9KG (2024) (v4.10.07 ) | |
| Asus TUF Gaming A15 FA507UV (v4.10.07, Turbo) | |
| Asus TUF Gaming A15 FA507UV (v4.10.07 ) | |
| Lenovo LOQ 15IRX9 (v4.10.07 ) | |
| Asus TUF A15 FA507 (v4.10.07 ) | |
* ... daha küçük daha iyidir
| Performance Rating - Percent | |
| Sınıf ortalaması Gaming | |
| SCHENKER XMG Core 15 (M24) | |
| Dell G16, i7-13650HX, RTX 4060 | |
| Gigabyte G6X 9KG (2024) | |
| Ortalama NVIDIA GeForce RTX 4060 Laptop GPU | |
| HP Victus 16 (2024) | |
| Asus TUF Gaming A15 FA507UV | |
| Asus TUF Gaming A15 FA507UV | |
| Lenovo LOQ 15IRX9 | |
| Asus TUF A15 FA507 -1! | |
| Cyberpunk 2077 2.2 Phantom Liberty - 1920x1080 Ultra Preset (FSR off) | |
| SCHENKER XMG Core 15 (M24) (2.12) | |
| Sınıf ortalaması Gaming (6.76 - 158, n=90, son 2 yıl) | |
| Asus TUF Gaming A15 FA507UV (2.12) | |
| Asus TUF Gaming A15 FA507UV (2.12, Turbo) | |
| Ortalama NVIDIA GeForce RTX 4060 Laptop GPU (56.4 - 93.1, n=31) | |
| Lenovo LOQ 15IRX9 (2.02) | |
| Dell G16, i7-13650HX, RTX 4060 (2.11) | |
| Gigabyte G6X 9KG (2024) (2.02) | |
| HP Victus 16 (2024) (2.02) | |
| GTA V - 1920x1080 Highest Settings possible AA:4xMSAA + FX AF:16x | |
| Dell G16, i7-13650HX, RTX 4060 | |
| SCHENKER XMG Core 15 (M24) | |
| Gigabyte G6X 9KG (2024) | |
| Lenovo LOQ 15IRX9 | |
| Sınıf ortalaması Gaming (12.1 - 168.2, n=132, son 2 yıl) | |
| HP Victus 16 (2024) | |
| Ortalama NVIDIA GeForce RTX 4060 Laptop GPU (76.9 - 126.3, n=48) | |
| Asus TUF Gaming A15 FA507UV | |
| Asus TUF Gaming A15 FA507UV (Turbo) | |
| Asus TUF A15 FA507 | |
| Final Fantasy XV Benchmark - 1920x1080 High Quality | |
| Sınıf ortalaması Gaming (19.2 - 201, n=144, son 2 yıl) | |
| SCHENKER XMG Core 15 (M24) (1.3) | |
| Asus TUF Gaming A15 FA507UV (1.3, Turbo) | |
| Dell G16, i7-13650HX, RTX 4060 (1.3) | |
| Gigabyte G6X 9KG (2024) (1.3) | |
| Asus TUF Gaming A15 FA507UV (1.3) | |
| Lenovo LOQ 15IRX9 (1.3) | |
| HP Victus 16 (2024) (1.3) | |
| Ortalama NVIDIA GeForce RTX 4060 Laptop GPU (75.1 - 109.8, n=51) | |
| Asus TUF A15 FA507 (1.3) | |
| Strange Brigade - 1920x1080 ultra AA:ultra AF:16 | |
| Sınıf ortalaması Gaming (38.9 - 420, n=140, son 2 yıl) | |
| SCHENKER XMG Core 15 (M24) (1.47.22.14 D3D12) | |
| Dell G16, i7-13650HX, RTX 4060 (1.47.22.14 D3D12) | |
| Asus TUF Gaming A15 FA507UV (1.47.22.14 D3D12, Turbo) | |
| Asus TUF Gaming A15 FA507UV (1.47.22.14 D3D12) | |
| Lenovo LOQ 15IRX9 (1.47.22.14 D3D12) | |
| Gigabyte G6X 9KG (2024) (1.47.22.14 D3D12) | |
| Ortalama NVIDIA GeForce RTX 4060 Laptop GPU (135.3 - 210, n=50) | |
| HP Victus 16 (2024) (1.47.22.14 D3D12) | |
| Asus TUF A15 FA507 | |
| Dota 2 Reborn - 1920x1080 ultra (3/3) best looking | |
| HP Victus 16 (2024) | |
| Dell G16, i7-13650HX, RTX 4060 | |
| Sınıf ortalaması Gaming (65.1 - 220, n=148, son 2 yıl) | |
| Ortalama NVIDIA GeForce RTX 4060 Laptop GPU (115 - 183.8, n=53) | |
| Gigabyte G6X 9KG (2024) | |
| Lenovo LOQ 15IRX9 | |
| Asus TUF Gaming A15 FA507UV | |
| SCHENKER XMG Core 15 (M24) | |
| Asus TUF Gaming A15 FA507UV (Turbo) | |
| Asus TUF A15 FA507 | |
| X-Plane 11.11 - 1920x1080 high (fps_test=3) | |
| Dell G16, i7-13650HX, RTX 4060 | |
| Gigabyte G6X 9KG (2024) | |
| Sınıf ortalaması Gaming (32.8 - 166.2, n=151, son 2 yıl) | |
| Ortalama NVIDIA GeForce RTX 4060 Laptop GPU (60.7 - 141.1, n=54) | |
| HP Victus 16 (2024) | |
| SCHENKER XMG Core 15 (M24) | |
| Lenovo LOQ 15IRX9 | |
| Asus TUF Gaming A15 FA507UV | |
| Asus TUF Gaming A15 FA507UV (Turbo) | |
| Asus TUF A15 FA507 | |
| Baldur's Gate 3 - 1920x1080 Ultra Preset | |
| Sınıf ortalaması Gaming (34.5 - 208, n=57, son 2 yıl) | |
| SCHENKER XMG Core 15 (M24) | |
| Asus TUF Gaming A15 FA507UV | |
| Ortalama NVIDIA GeForce RTX 4060 Laptop GPU (66.5 - 105.5, n=19) | |
| F1 24 - 1920x1080 Ultra High Preset AA:T AF:16x | |
| Sınıf ortalaması Gaming (54.1 - 148, n=19, son 2 yıl) | |
| Ortalama NVIDIA GeForce RTX 4060 Laptop GPU (47.5 - 61.6, n=10) | |
| Asus TUF Gaming A15 FA507UV (1126333) | |
| Lenovo LOQ 15IRX9 (1122588) | |
| The First Descendant - 1920x1080 Ultra Preset | |
| Ortalama NVIDIA GeForce RTX 4060 Laptop GPU (67.6 - 69.4, n=3) | |
| Asus TUF Gaming A15 FA507UV | |
| Sınıf ortalaması Gaming (15.4 - 80, n=5, son 2 yıl) | |
| Ghost of Tsushima - 1920x1080 Very High Preset AA:T | |
| Asus TUF Gaming A15 FA507UV | |
| Lenovo LOQ 15IRX9 | |
| Ortalama NVIDIA GeForce RTX 4060 Laptop GPU (55.6 - 63.4, n=5) | |
| Sınıf ortalaması Gaming (28.5 - 73.7, n=7, son 2 yıl) | |
| Senua's Saga Hellblade 2 - 1920x1080 High Preset | |
| Sınıf ortalaması Gaming (38.4 - 78.8, n=6, son 2 yıl) | |
| Asus TUF Gaming A15 FA507UV | |
| Ortalama NVIDIA GeForce RTX 4060 Laptop GPU (37.6 - 39.5, n=3) | |
| Lenovo LOQ 15IRX9 | |
| Dragon's Dogma 2 - 1920x1080 High Preset | |
| Sınıf ortalaması Gaming (49.5 - 80, n=8, son 2 yıl) | |
| HP Victus 16 (2024) | |
| Lenovo LOQ 15IRX9 | |
| Ortalama NVIDIA GeForce RTX 4060 Laptop GPU (57.2 - 67.7, n=5) | |
| Asus TUF Gaming A15 FA507UV | |
Cyberpunk 2077 ultra FPS diagram
| düşük | orta | yüksek | ultra | |
|---|---|---|---|---|
| GTA V (2015) | 182.6 | 177 | 168 | 107.2 |
| Dota 2 Reborn (2015) | 171.5 | 154.9 | 149.3 | 139.5 |
| Final Fantasy XV Benchmark (2018) | 210 | 138.8 | 100.7 | |
| X-Plane 11.11 (2018) | 135.3 | 117.5 | 91.7 | |
| Strange Brigade (2018) | 360 | 263 | 213 | 184.2 |
| Baldur's Gate 3 (2023) | 135 | 107.8 | 95.9 | 93.9 |
| Cyberpunk 2077 2.2 Phantom Liberty (2023) | 122.2 | 96.6 | 82.7 | 76.2 |
| Alone in the Dark (2024) | 159.1 | 150.1 | 143.8 | 126.9 |
| Dragon's Dogma 2 (2024) | 68.1 | 59.9 | ||
| Ghost of Tsushima (2024) | 94.1 | 83.9 | 76.9 | 62.1 |
| Senua's Saga Hellblade 2 (2024) | 66.1 | 55.1 | 39.5 | |
| F1 24 (2024) | 220 | 205 | 169.7 | 56.6 |
| The First Descendant (2024) | 155.5 | 96.8 | 79.1 | 67.6 |
Emisyonlar ve enerji - Çok iyi pil ömrüne sahip bir oyun dizüstü bilgisayarı
Gürültü emisyonları
A15'in gürültü üretimi bizi ne olumlu ne de olumsuz yönde şaşırttı. Cyberpunk 2077, gürültü seviyesinin açıkça duyulabilir 45 dB(A) ("Performans") ve çok yüksek 56 dB(A) ("Turbo") değerlerine yükselmesine neden oluyor. "Sessiz" mod, hala oynanabilir kare hızlarında ılımlı gürültü seviyelerinden sorumludur. Günlük durumlarda (ofis, internet) iki fan genellikle düşük hızda çalışır ve bazen hareketsiz kalır.
Ses yüksekliği
| Boşta |
| 25 / 27 / 33 dB |
| Çalışırken |
| 40 / 46 dB |
 | ||
30 dB sessiz 40 dB(A) duyulabilirlik 50 dB(A) gürültülü |
||
min: | ||
| Asus TUF Gaming A15 FA507UV NVIDIA GeForce RTX 4060 Laptop GPU, R9 8945H, WD PC SN560 SDDPNQE-1T00 | Lenovo LOQ 15IRX9 NVIDIA GeForce RTX 4060 Laptop GPU, i5-13450HX, Micron 2400 MTFDKCD1T0QFM | HP Victus 16 (2024) NVIDIA GeForce RTX 4060 Laptop GPU, i7-14700HX, Kioxia XG8 KXG80ZNV512G | Gigabyte G6X 9KG (2024) NVIDIA GeForce RTX 4060 Laptop GPU, i7-13650HX, Gigabyte AG450E1024-SI | SCHENKER XMG Core 15 (M24) NVIDIA GeForce RTX 4060 Laptop GPU, R7 8845HS, Samsung 990 Pro 1 TB | Dell G16, i7-13650HX, RTX 4060 NVIDIA GeForce RTX 4060 Laptop GPU, i7-13650HX, WD PC SN740 SDDPNQD-1T00 | Asus TUF A15 FA507 NVIDIA GeForce RTX 4050 Laptop GPU, R7 7735HS, Micron 2400 MTFDKBA512QFM | |
|---|---|---|---|---|---|---|---|
| Noise | -11% | -6% | -16% | 5% | 12% | 15% | |
| kapalı / ortam * | 25 | 25 -0% | 25 -0% | 26 -4% | 23 8% | 23 8% | 23.3 7% |
| Idle Minimum * | 25 | 26 -4% | 28 -12% | 30 -20% | 23 8% | 23 8% | 23.3 7% |
| Idle Average * | 27 | 34 -26% | 29 -7% | 32 -19% | 23 15% | 23 15% | 23.3 14% |
| Idle Maximum * | 33 | 36 -9% | 33 -0% | 35 -6% | 23 30% | 27.96 15% | 23.3 29% |
| Load Average * | 40 | 48 -20% | 45 -13% | 51 -28% | 38.92 3% | 27.96 30% | 29.6 26% |
| Cyberpunk 2077 ultra * | 45 | 48 -7% | 52.06 -16% | ||||
| Load Maximum * | 46 | 50 -9% | 48 -4% | 54 -17% | 52.09 -13% | 47.89 -4% | 43 7% |
| Witcher 3 ultra * | 43 | 51 | 50.96 | 47.89 | 43 |
* ... daha küçük daha iyidir
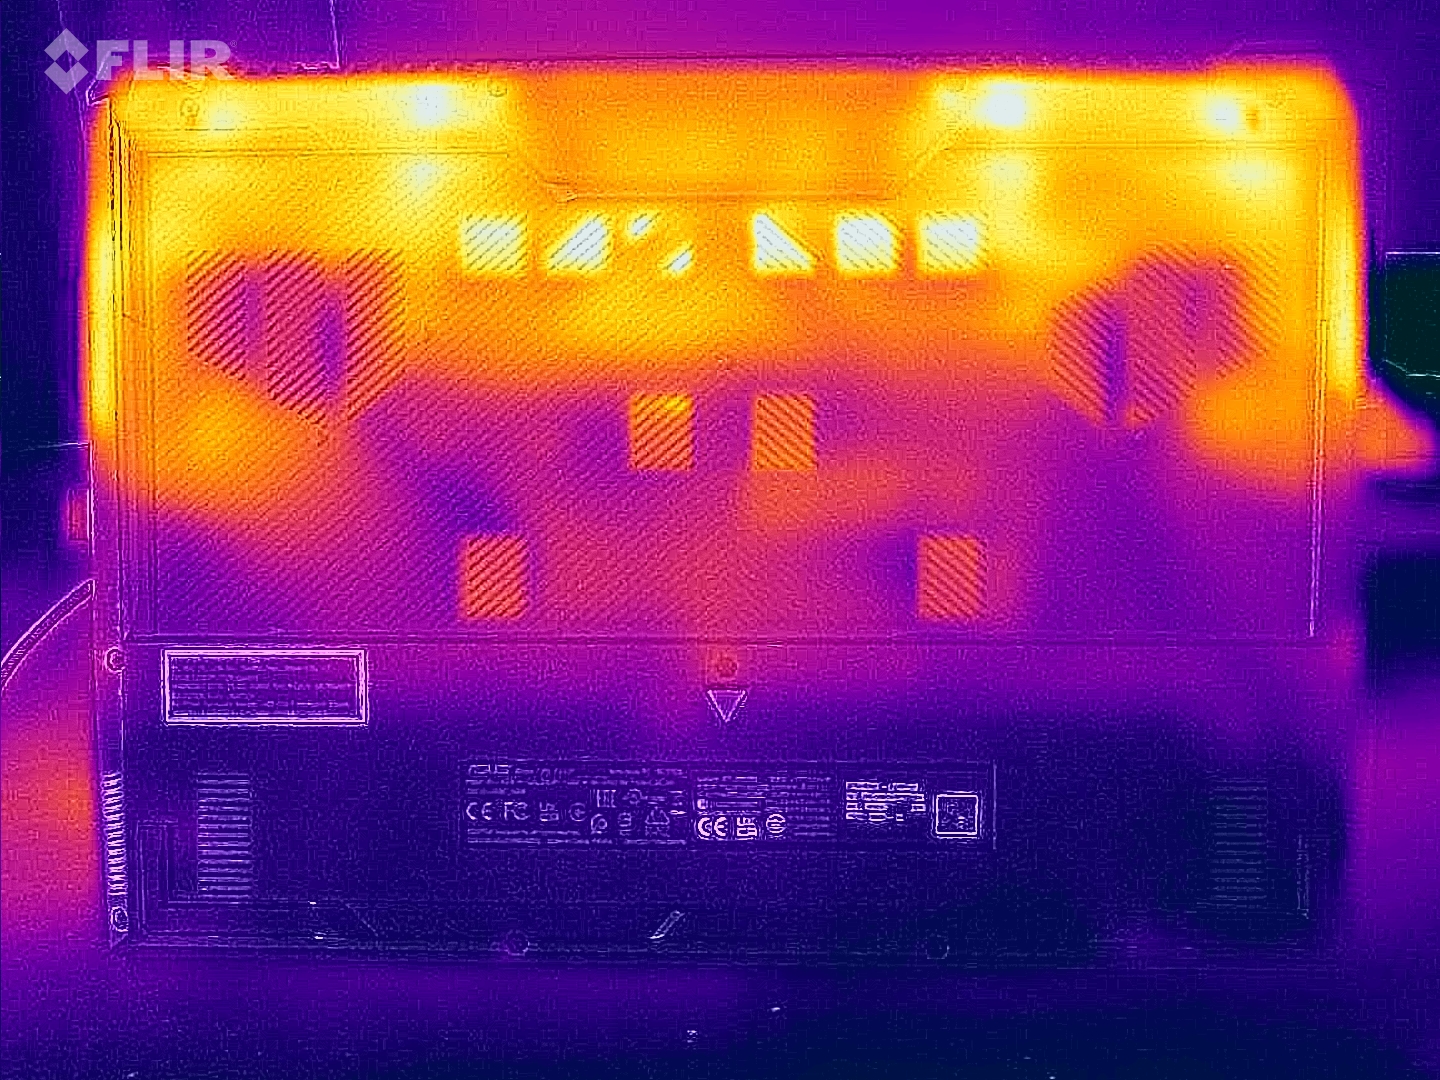
Sıcaklık
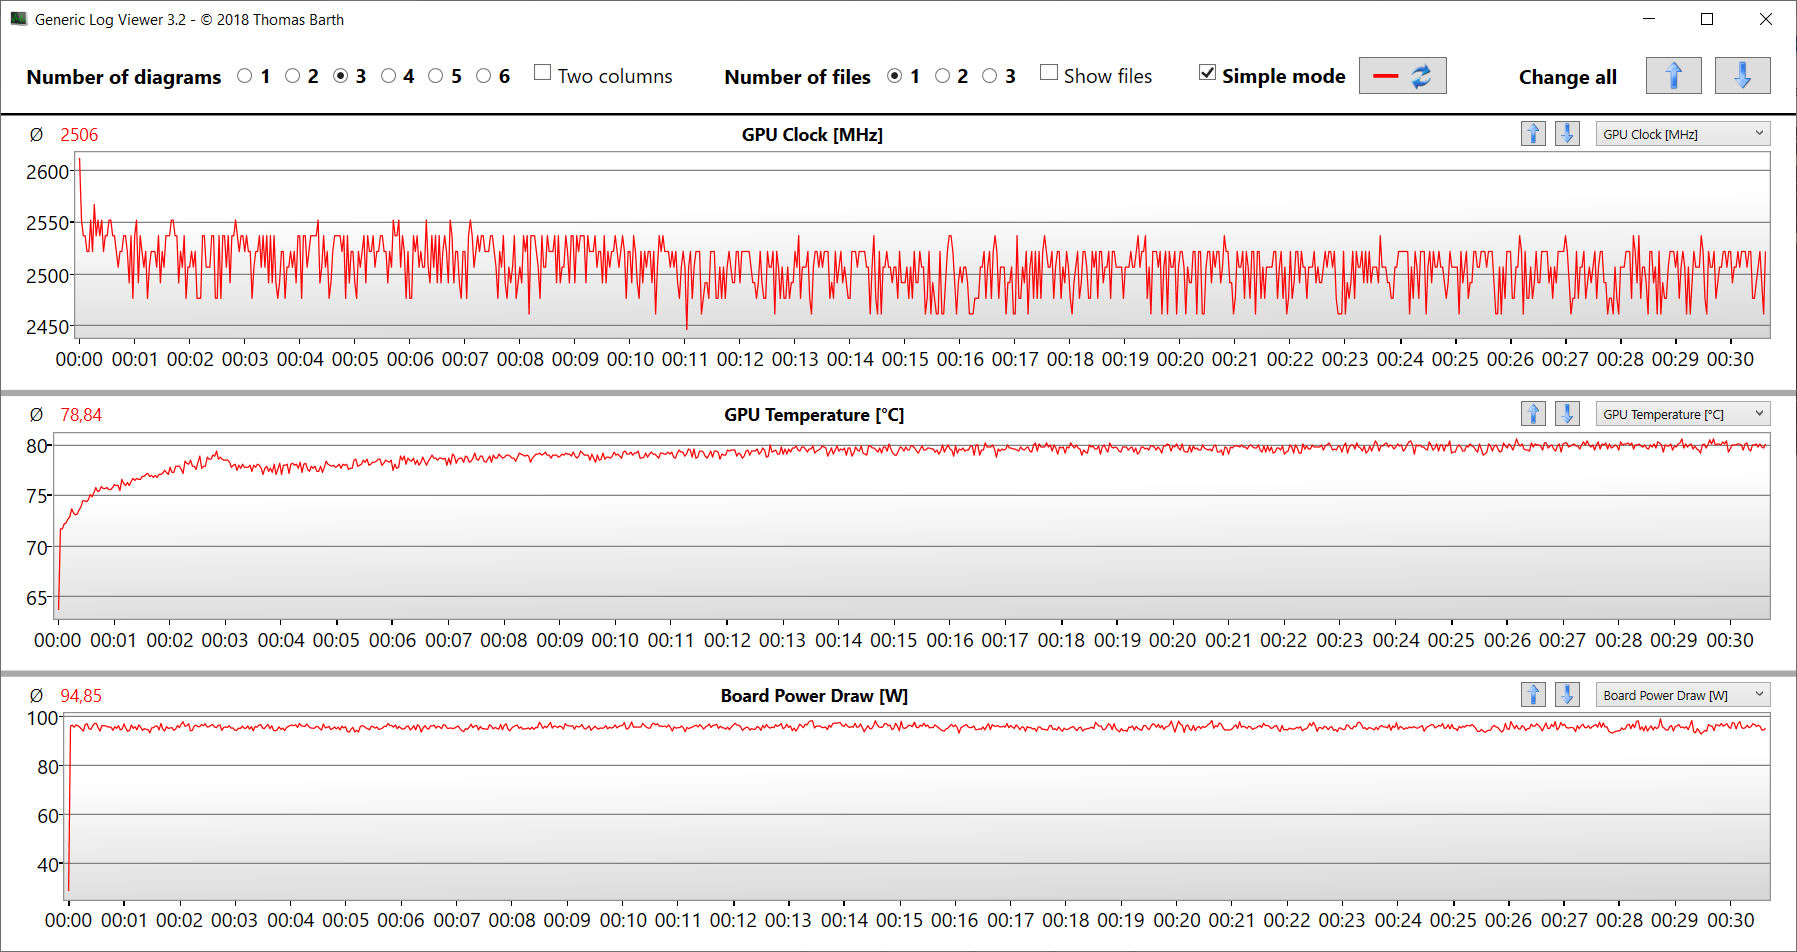
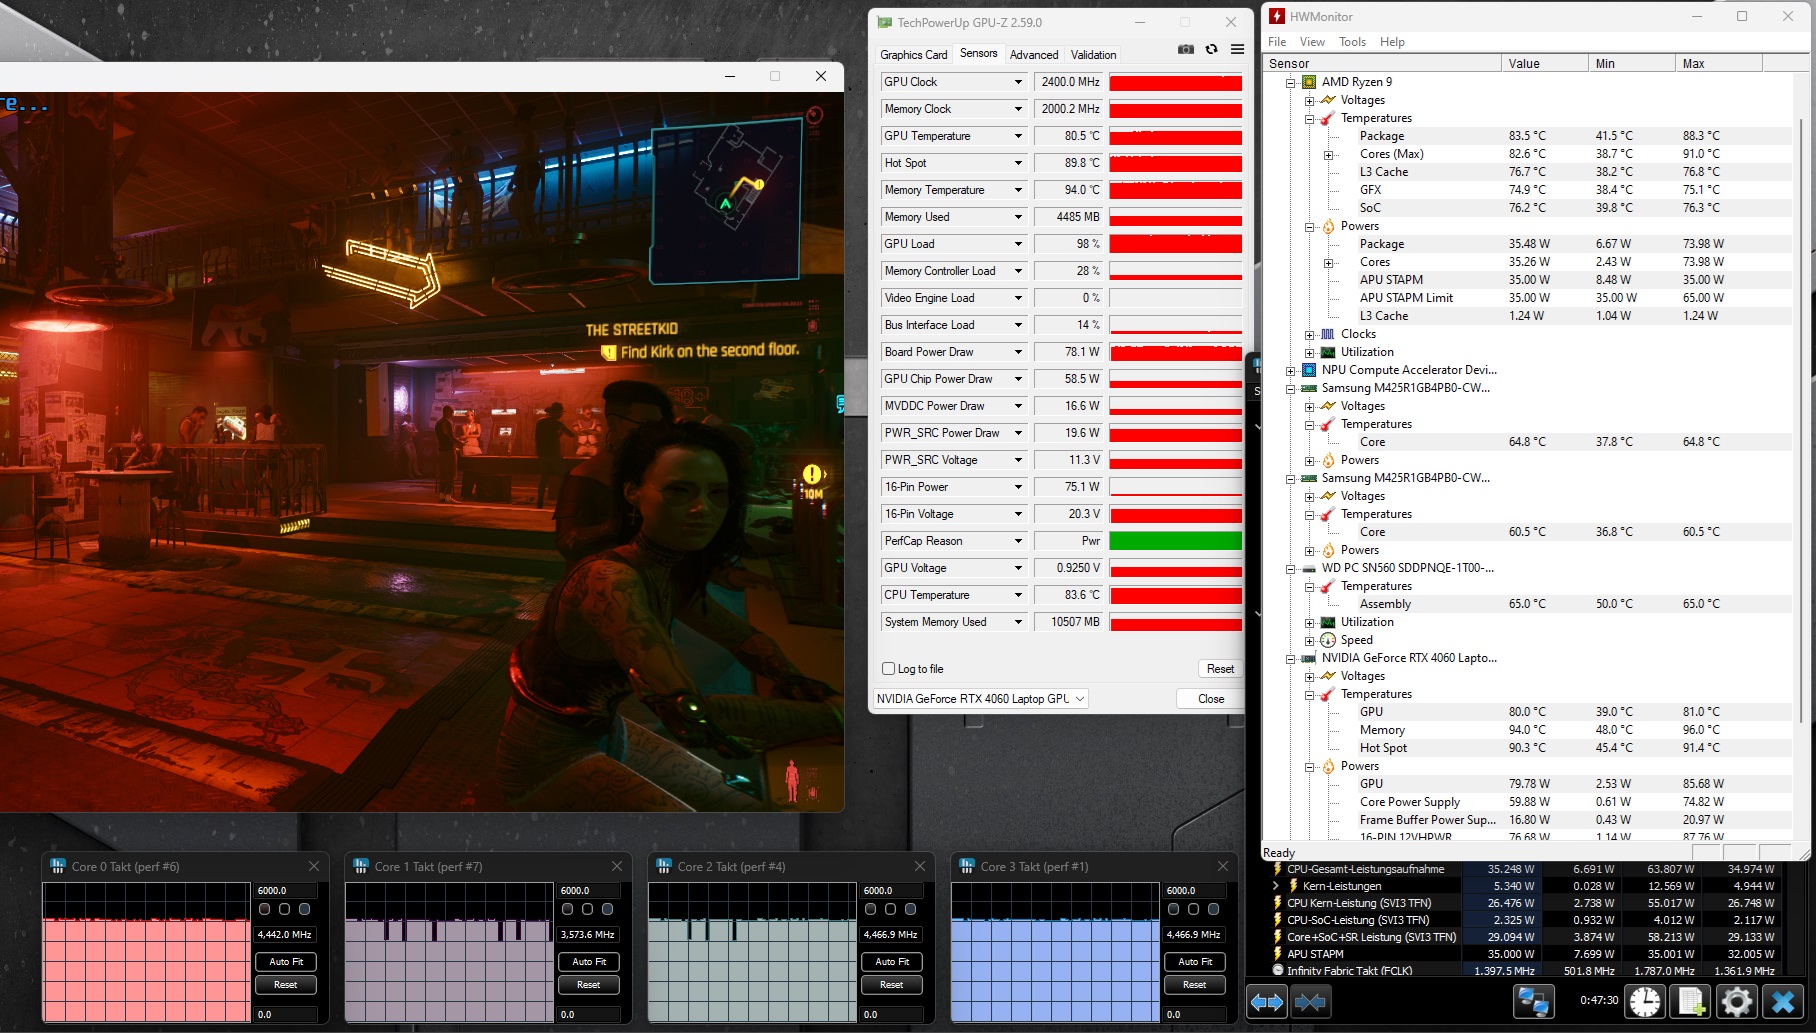
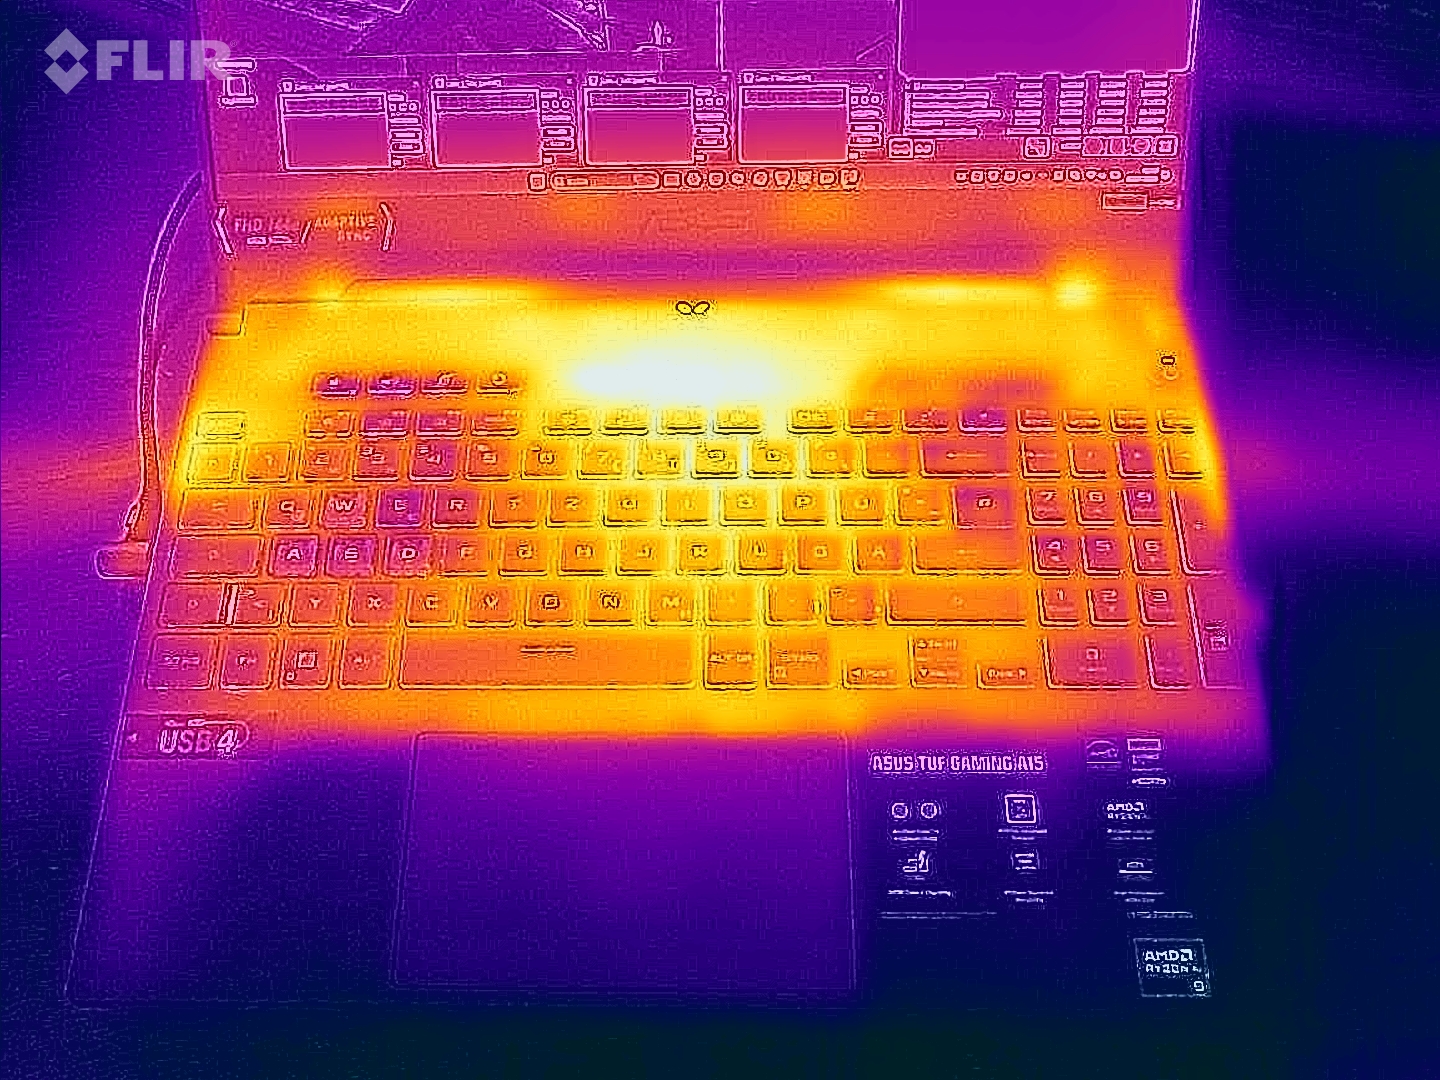
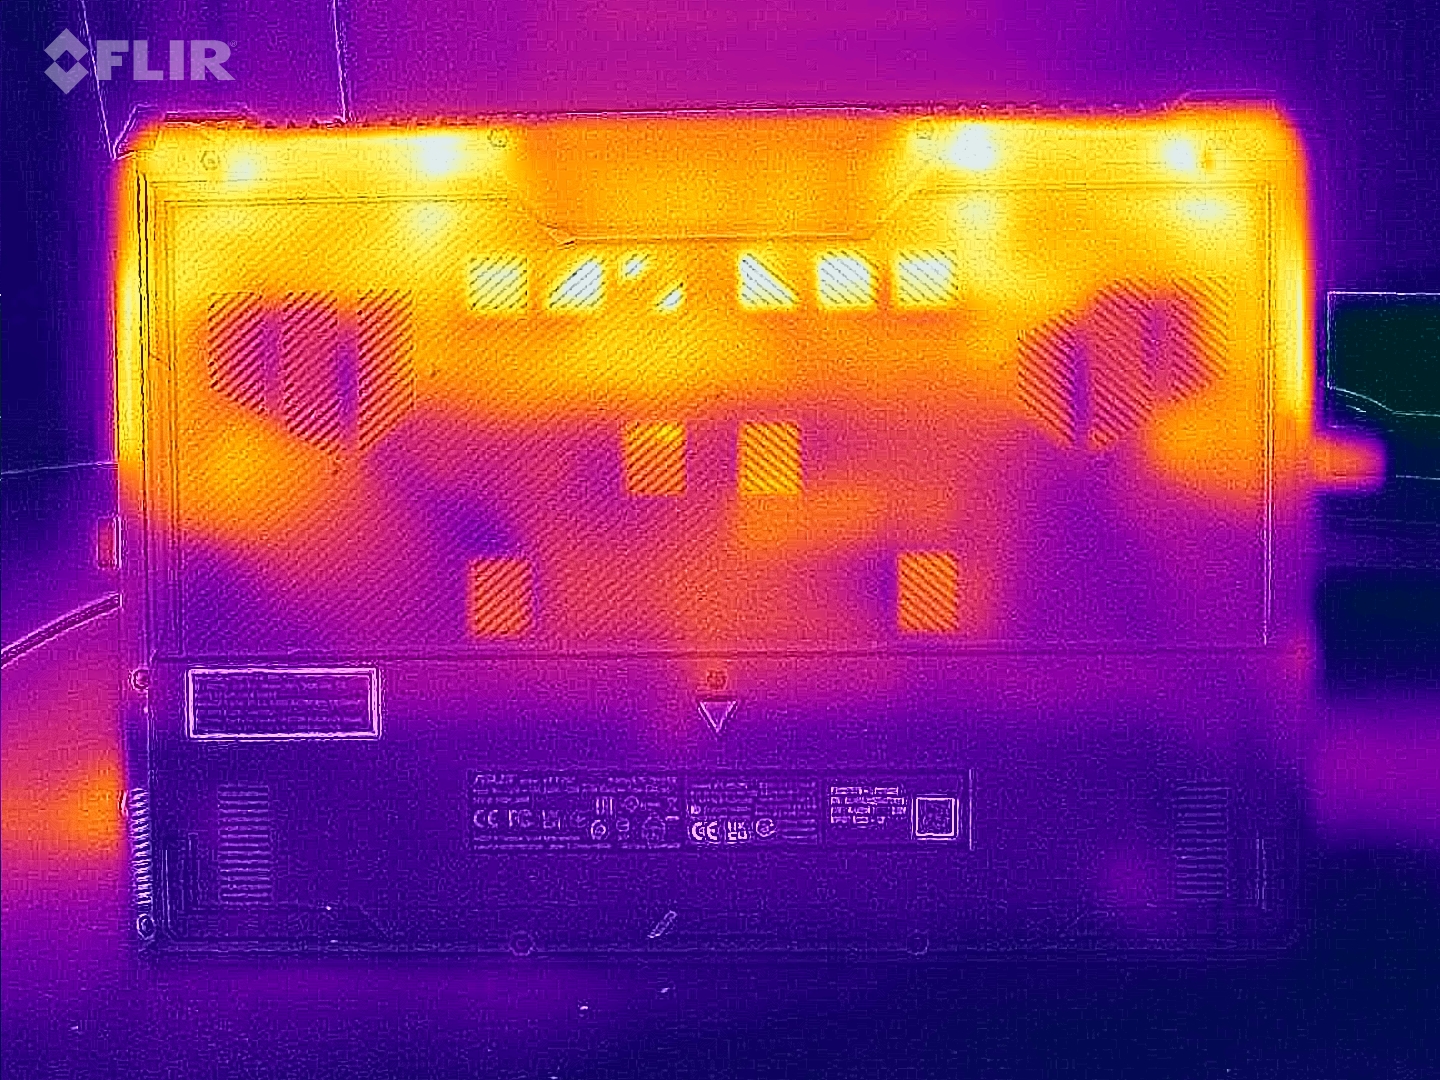
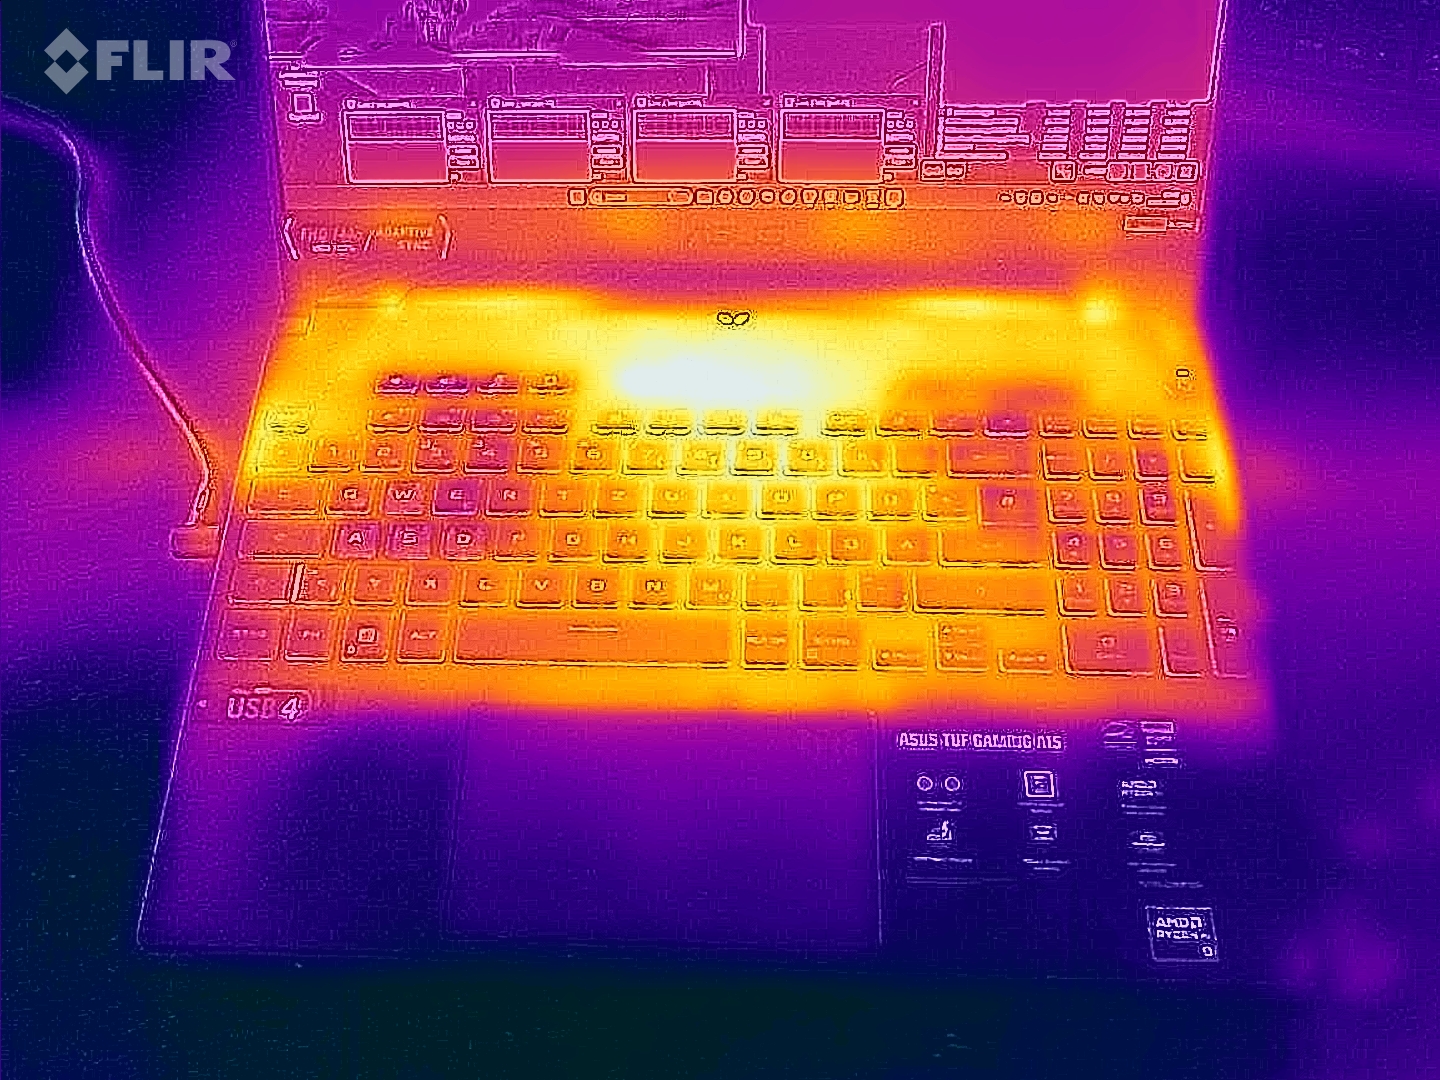
Dizüstü bilgisayar fark edilir derecede ısınıyor: Cyberpunk ve stres testi bazı bölgelerde 50 santigrat derecenin üzerinde sıcaklıklara neden oluyor. Günlük kullanım durumlarında (ofis, internet) ortalamanın üzerinde rakamlara ulaşılıyor. El dayanağı sıcaklıkları orta seviyededir.
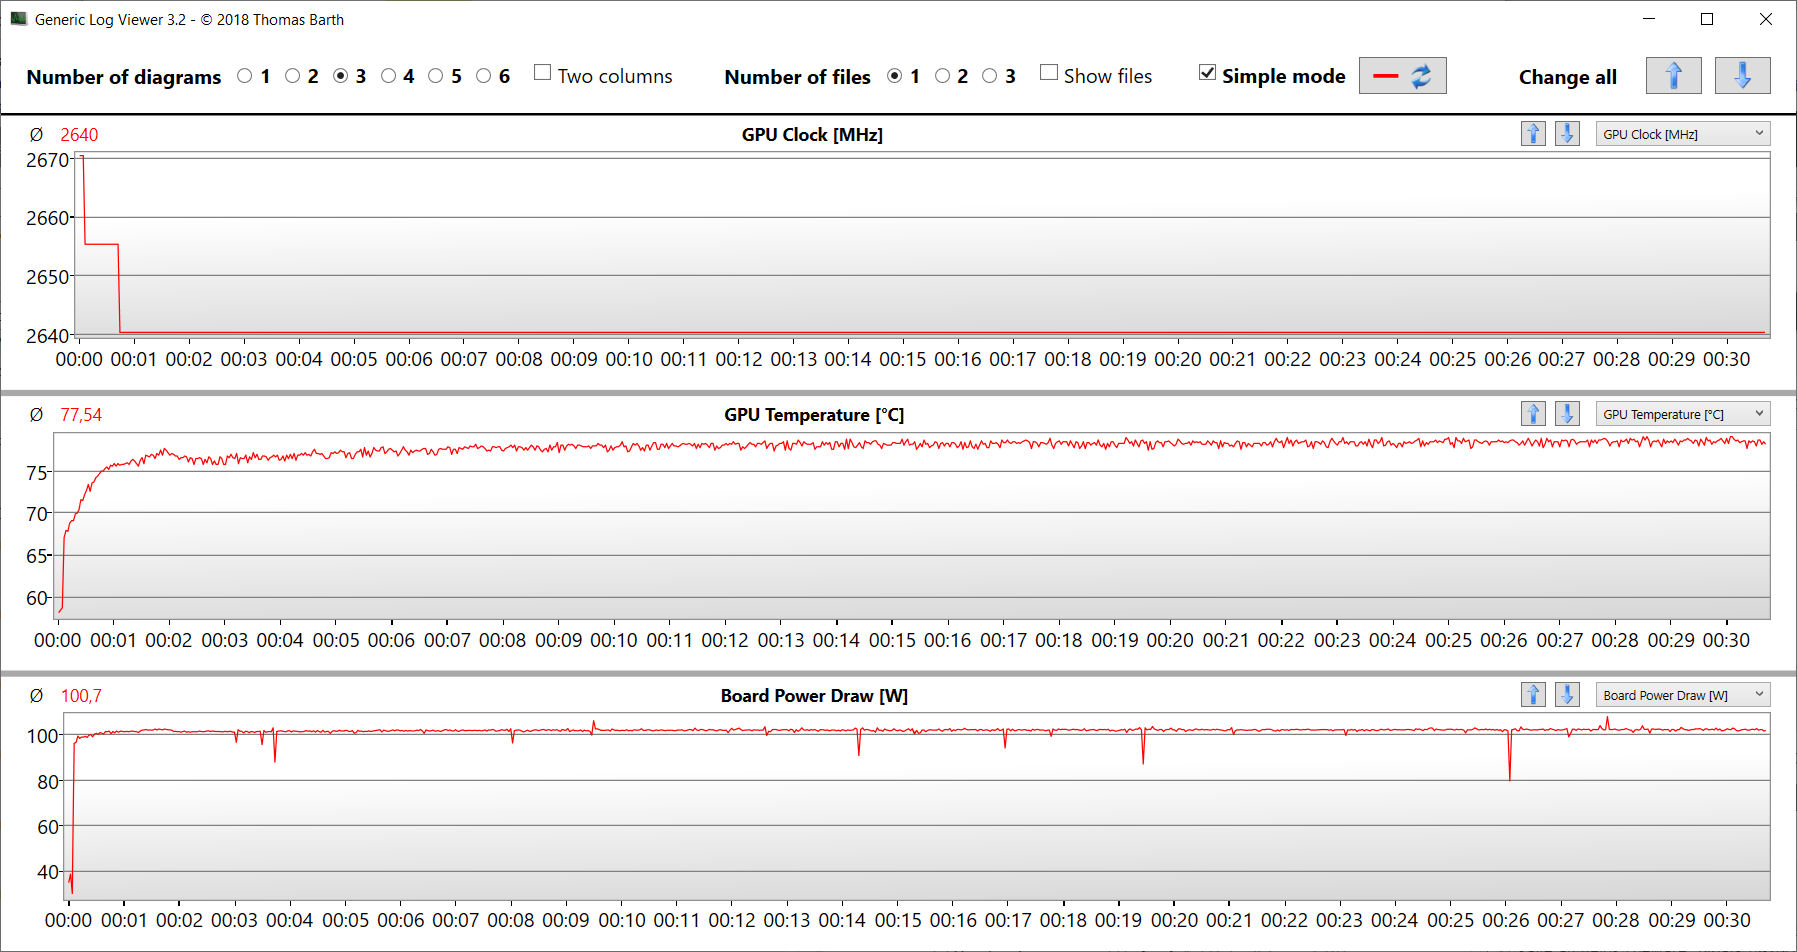
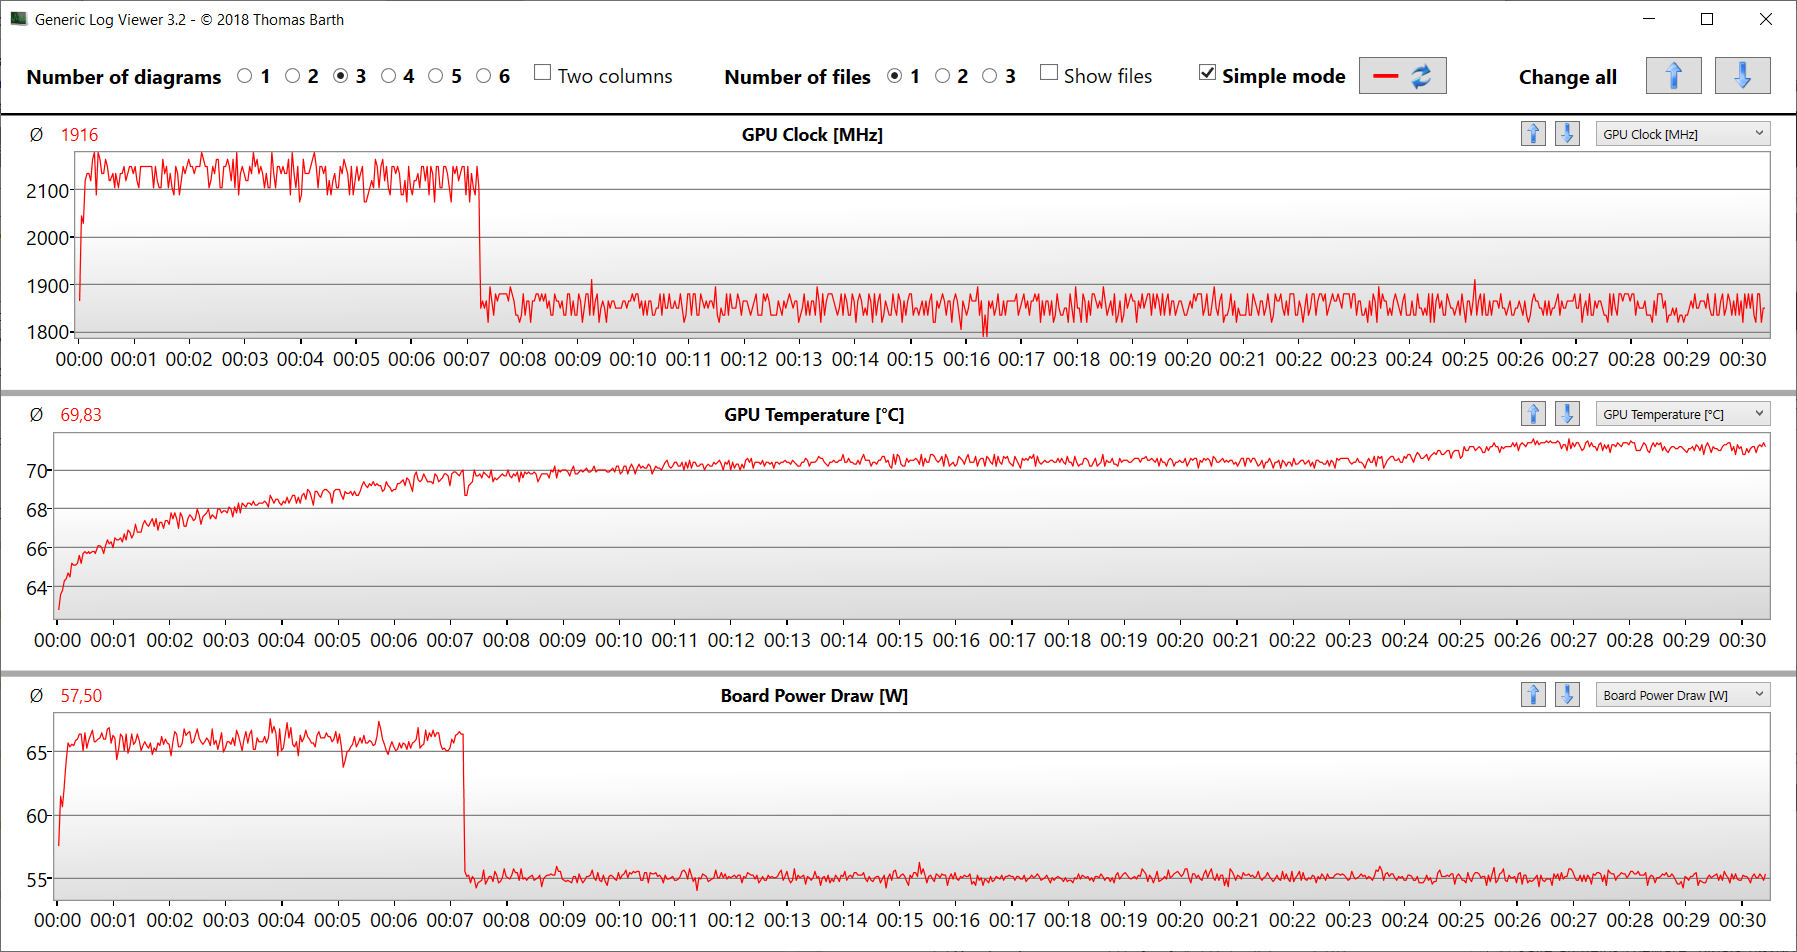
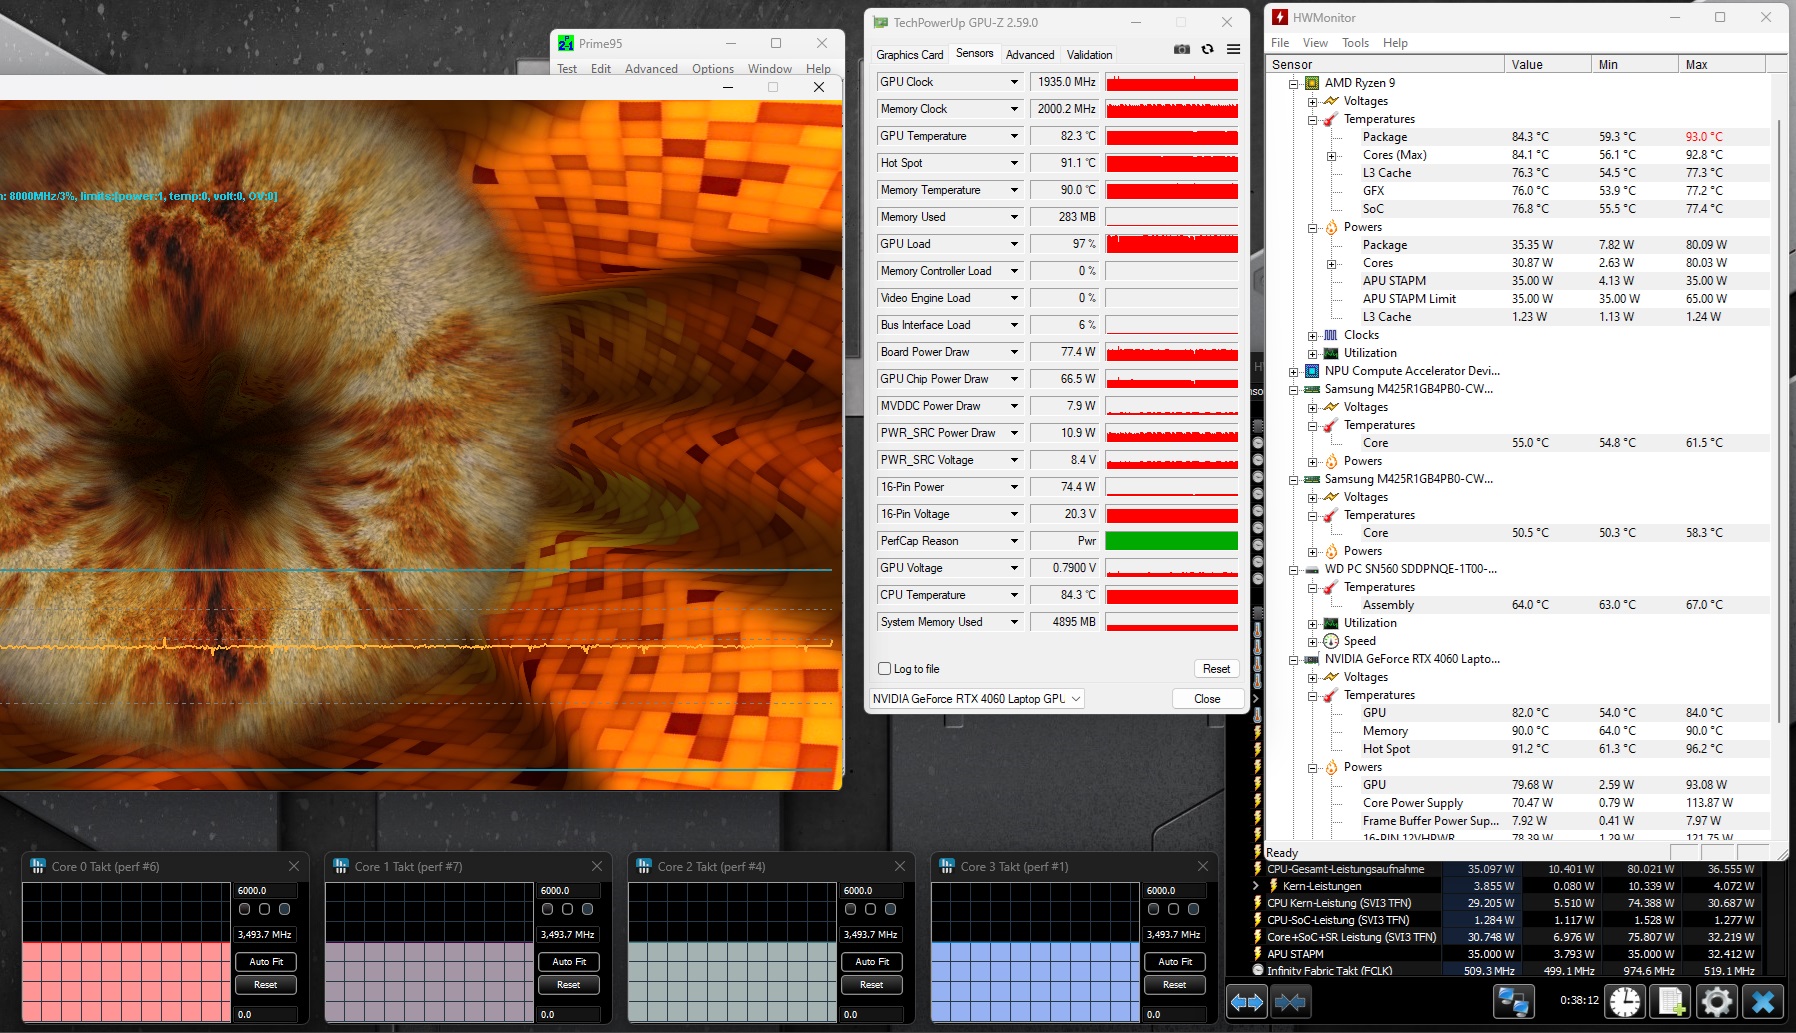
Aşırı senaryo stres testi (sürekli çalışmada Prime95 ve Furmark) tam yük altında sistem kararlılığını kontrol eder. Başlangıçtaki yüksek CPU ve GPU saat hızları testin ilk dakikasında sırasıyla 3,5 GHz (CPU) ve 1,9 GHz'e (GPU) düşer ve bu seviyede kalmaya devam eder.
(-) Üst taraftaki maksimum sıcaklık, 40.4 °C / 105 F ortalamasına kıyasla 53 °C / 127 F'dir. , Gaming sınıfı için 21.2 ile 68.8 °C arasında değişir.
(-) Alt kısım, 43.2 °C / 110 F ortalamasına kıyasla maksimum 46 °C / 115 F'ye kadar ısınır
(+) Boşta kullanımda, üst tarafın ortalama sıcaklığı 29.9 °C / 86 F olup, cihazın 33.9 °C / 93 F.
(-) 3: The average temperature for the upper side is 41.9 °C / 107 F, compared to the average of 33.9 °C / 93 F for the class Gaming.
(+) Avuç içi dayanakları ve dokunmatik yüzey maksimum (35 °C / 95 F) cilt sıcaklığına ulaşıyor ve bu nedenle sıcak değil.
(-) Benzer cihazların avuç içi dayanağı alanının ortalama sıcaklığı 28.9 °C / 84 F (-6.1 °C / -11 F) idi.
| Asus TUF Gaming A15 FA507UV AMD Ryzen 9 8945H, NVIDIA GeForce RTX 4060 Laptop GPU | Lenovo LOQ 15IRX9 Intel Core i5-13450HX, NVIDIA GeForce RTX 4060 Laptop GPU | HP Victus 16 (2024) Intel Core i7-14700HX, NVIDIA GeForce RTX 4060 Laptop GPU | Gigabyte G6X 9KG (2024) Intel Core i7-13650HX, NVIDIA GeForce RTX 4060 Laptop GPU | SCHENKER XMG Core 15 (M24) AMD Ryzen 7 8845HS, NVIDIA GeForce RTX 4060 Laptop GPU | Dell G16, i7-13650HX, RTX 4060 Intel Core i7-13650HX, NVIDIA GeForce RTX 4060 Laptop GPU | Asus TUF A15 FA507 AMD Ryzen 7 7735HS, NVIDIA GeForce RTX 4050 Laptop GPU | |
|---|---|---|---|---|---|---|---|
| Heat | -5% | 11% | 5% | -14% | -8% | 11% | |
| Maximum Upper Side * | 53 | 47 11% | 50 6% | 41 23% | 52 2% | 49 8% | 48.9 8% |
| Maximum Bottom * | 46 | 58 -26% | 50 -9% | 43 7% | 61 -33% | 58 -26% | 44.6 3% |
| Idle Upper Side * | 32 | 32 -0% | 25 22% | 32 -0% | 35 -9% | 35 -9% | 27.1 15% |
| Idle Bottom * | 34 | 36 -6% | 26 24% | 37 -9% | 39 -15% | 35 -3% | 27.5 19% |
* ... daha küçük daha iyidir
Konuşmacılar
Sonuç olarak, stereo hoparlörler iyi ses üretiyor. Bas biraz daha belirgin olabilirdi.
Asus TUF Gaming A15 FA507UV ses analizi
(+) | hoparlörler nispeten yüksek sesle çalabilir (82 dB)
Bas 100 - 315Hz
(±) | azaltılmış bas - ortalama olarak medyandan 6.8% daha düşük
(±) | Bas doğrusallığı ortalamadır (7.1% delta - önceki frekans)
Ortalar 400 - 2000 Hz
(±) | daha yüksek ortalar - ortalama olarak medyandan 7.8% daha yüksek
(±) | Ortaların doğrusallığı ortalamadır (7% delta - önceki frekans)
Yüksekler 2 - 16 kHz
(+) | dengeli yüksekler - medyandan yalnızca 2.4% uzakta
(±) | Yükseklerin doğrusallığı ortalamadır (7.6% delta - önceki frekans)
Toplam 100 - 16.000 Hz
(+) | genel ses doğrusaldır (13.1% ortancaya göre fark)
Aynı sınıfla karşılaştırıldığında
» Bu sınıftaki tüm test edilen cihazların %17%'si daha iyi, 4% benzer, 79% daha kötüydü
» En iyisinin deltası 6% idi, ortalama 18% idi, en kötüsü 132% idi
Test edilen tüm cihazlarla karşılaştırıldığında
» Test edilen tüm cihazların %11'si daha iyi, 3 benzer, % 86 daha kötüydü
» En iyisinin deltası 4% idi, ortalama 24% idi, en kötüsü 134% idi
Lenovo LOQ 15IRX9 ses analizi
(±) | hoparlör ses yüksekliği ortalama ama iyi (81 dB)
Bas 100 - 315Hz
(±) | azaltılmış bas - ortalama olarak medyandan 14.6% daha düşük
(±) | Bas doğrusallığı ortalamadır (9.6% delta - önceki frekans)
Ortalar 400 - 2000 Hz
(+) | dengeli ortalar - medyandan yalnızca 2.1% uzakta
(+) | orta frekanslar doğrusaldır (3.6% deltadan önceki frekansa)
Yüksekler 2 - 16 kHz
(±) | daha yüksek en yüksekler - ortalama olarak medyandan 5.9% daha yüksek
(±) | Yükseklerin doğrusallığı ortalamadır (8.2% delta - önceki frekans)
Toplam 100 - 16.000 Hz
(+) | genel ses doğrusaldır (14.7% ortancaya göre fark)
Aynı sınıfla karşılaştırıldığında
» Bu sınıftaki tüm test edilen cihazların %27%'si daha iyi, 7% benzer, 66% daha kötüydü
» En iyisinin deltası 6% idi, ortalama 18% idi, en kötüsü 132% idi
Test edilen tüm cihazlarla karşılaştırıldığında
» Test edilen tüm cihazların %17'si daha iyi, 4 benzer, % 79 daha kötüydü
» En iyisinin deltası 4% idi, ortalama 24% idi, en kötüsü 134% idi
Güç tüketimi
Güç tüketimine gelince, rapor edilecek garip bir şey yok. Değerler kurulu donanım için normal seviyede. Cyberpunk ve daha sonra stres testi tutarlı bir güç tüketimi ile çalıştı. PSU (240 watt) uygun boyutta.
| Kapalı / Bekleme modu | |
| Boşta | |
| Çalışırken |
|
Key:
min: | |
Power consumption Cyberpunk / stress test
Power consumption with an extrnal monitor
Pil ömrü
15,6 inçlik cihaz, gerçek dünya Wi-Fi testinde (bir komut dosyası çalıştıran web sitelerine erişirken yükün görüntüsü) 11 saat 42 dakikalık bir çalışma süresini başardı - mükemmel bir rakam. Bu, onu aşağıdakilerle aynı seviyeye getiriyor geçen yılın A15 modeli.
| Battery Runtime - WiFi Websurfing | |
| SCHENKER XMG Core 15 (M24) | |
| Asus TUF Gaming A15 FA507UV | |
| Asus TUF A15 FA507 | |
| HP Victus 16 (2024) | |
| Gigabyte G6X 9KG (2024) | |
| Sınıf ortalaması Gaming (85 - 889, n=124, son 2 yıl) | |
| Dell G16, i7-13650HX, RTX 4060 | |
| Lenovo LOQ 15IRX9 | |
Artılar
Eksiler
Karar - Çok yönlü bir oyun

Odak noktası FHD oyun oynamaktır, ancak işleme ve akış da cihazda herhangi bir sorun yaratmaz. Ryzen 9 8945H ve GeForce RTX 4060 gerekli gücü sağlar ve her iki yonga da sürekli olarak yüksek saat hızlarında çalışabilir. Takılı 15,6 inç panelin (FHD, 144 Hz, G-Sync, sRGB) ciddi bir zayıflığı yok.
TUF Gaming A15 FA507UV ile Asus, etkileyici pil ömrüne sahip çok yönlü bir FHD oyun dizüstü bilgisayarı sundu.
Bazı yerlerde bilgisayar fark edilir şekilde ısınıyor ve oldukça gürültülü oluyor. Modu seçtiğinizde performans ve gürültü arasında iyi bir uzlaşma elde edersiniz ve ortaya çıkan performans kaybı önemli değildir.
A15'in poster çocuğu muazzam pil ömrüdür: Neredeyse 12 saatlik gerçek yaşam rakamları genellikle ofis dizüstü bilgisayarları veya alt dizüstü bilgisayarlar için ayrılmıştır. Pile bir USB-C PSU aracılığıyla güç sağlamak mümkündür - iki USB-C bağlantı noktasından biri (USB 3.2 Gen 2, USB 4) Güç Dağıtımı'nı destekler, yani özel PSU'yu yanınızda taşımanız gerekmez.
Bir alternatif de şu olabilir Lenovo LOQ 15IRX9. Biraz daha az işlem gücü sunar, USB 4 yerleşik değildir ve önemli ölçüde daha kötü pil ömrü sunar. Bununla birlikte, fiyat söz konusu olduğunda burnu önde: LOQ şunları yapabilir sadece 999$'a sizin olabilir.
Fiyat ve bulunabilirlik
Asus TUF Gaming A15 FA507UV şu anda (17.07.24 itibariyle) Amazon'da yaklaşık 1.399 dolara (512 GB SSD) satılmaktadır.
Not: Derecelendirme sistemimizi yakın zamanda güncelledik ve 8. sürümün sonuçları 7. sürümün sonuçları ile karşılaştırılamaz. Daha fazla bilgi için burada.
Asus TUF Gaming A15 FA507UV
- 07/17/2024 v8
Sascha Mölck
 Total Sustainability Score:
 Şeffaflık
İncelenecek cihazların seçimi editör ekibimiz tarafından yapılır. Test örneği, bu incelemenin amacı doğrultusunda üretici veya perakendeci tarafından yazara ödünç olarak sağlanmıştır. Borç verenin bu inceleme üzerinde herhangi bir etkisi olmadığı gibi, üretici de yayınlanmadan önce bu incelemenin bir kopyasını almamıştır. Bu incelemeyi yayınlama zorunluluğu yoktu. İncelemelerimiz karşılığında asla tazminat veya ödeme kabul etmiyoruz. Bağımsız bir medya şirketi olarak Notebookcheck, üreticilerin, perakendecilerin veya yayıncıların otoritesine tabi değildir.
Notebookcheck bu şekilde test yapıyor
Notebookcheck, tüm sonuçların karşılaştırılabilir olmasını sağlamak için her yıl yüzlerce dizüstü bilgisayarı ve akıllı telefonu standart prosedürler kullanarak bağımsız olarak inceliyor. Yaklaşık 20 yıldır test yöntemlerimizi sürekli olarak geliştirdik ve bu süreçte endüstri standartlarını belirledik. Test laboratuvarlarımızda deneyimli teknisyenler ve editörler tarafından yüksek kaliteli ölçüm ekipmanları kullanılmaktadır. Bu testler çok aşamalı bir doğrulama sürecini içerir. Karmaşık derecelendirme sistemimiz, nesnelliği koruyan yüzlerce sağlam temellere dayanan ölçüm ve kıyaslamaya dayanmaktadır.Price comparison

