

Intel Core Ultra 9 285K Arrow Lake-S İncelemesi: 589 dolarlık CPU, güç verimliliğinde AMD Zen 5 Ryzen 9000 ile eşleşmek için oyun tacını feda ediyor
Güç açısından verimli ancak oyun açısından yetersiz.
Intel'in yeni Arrow Lake-S Core Ultra 9 285, hyperthreading'den ödün veren ve önemli verimlilik iyileştirmeleriyle meraklıları kazanmayı amaçlayan yeni bir işlem karosu düzeni sunuyor. Core Ultra 9 285K gerçekten de ham CPU performansı ve verimliliği sunarken, oyunlarda Intel Raptor Lake-S Refresh ve AMD Zen 5 Ryzen 9000 tekliflerine karşı kötü bir şekilde kaybediyor.Vaidyanathan Subramaniam (Çeviren DeepL / Ninh Duy) Yayınlandı 🇺🇸 🇩🇪 ...
Karar: Intel'in verimlilik oyunu bir oyun engeline takılıyor
Intel'in masaüstü yongaları tam olarak verimlilikleriyle tanınmıyor, ancak şirket bugünkü Arrow Lake-S lansmanıyla hikayeyi yeniden yazmayı umuyor.
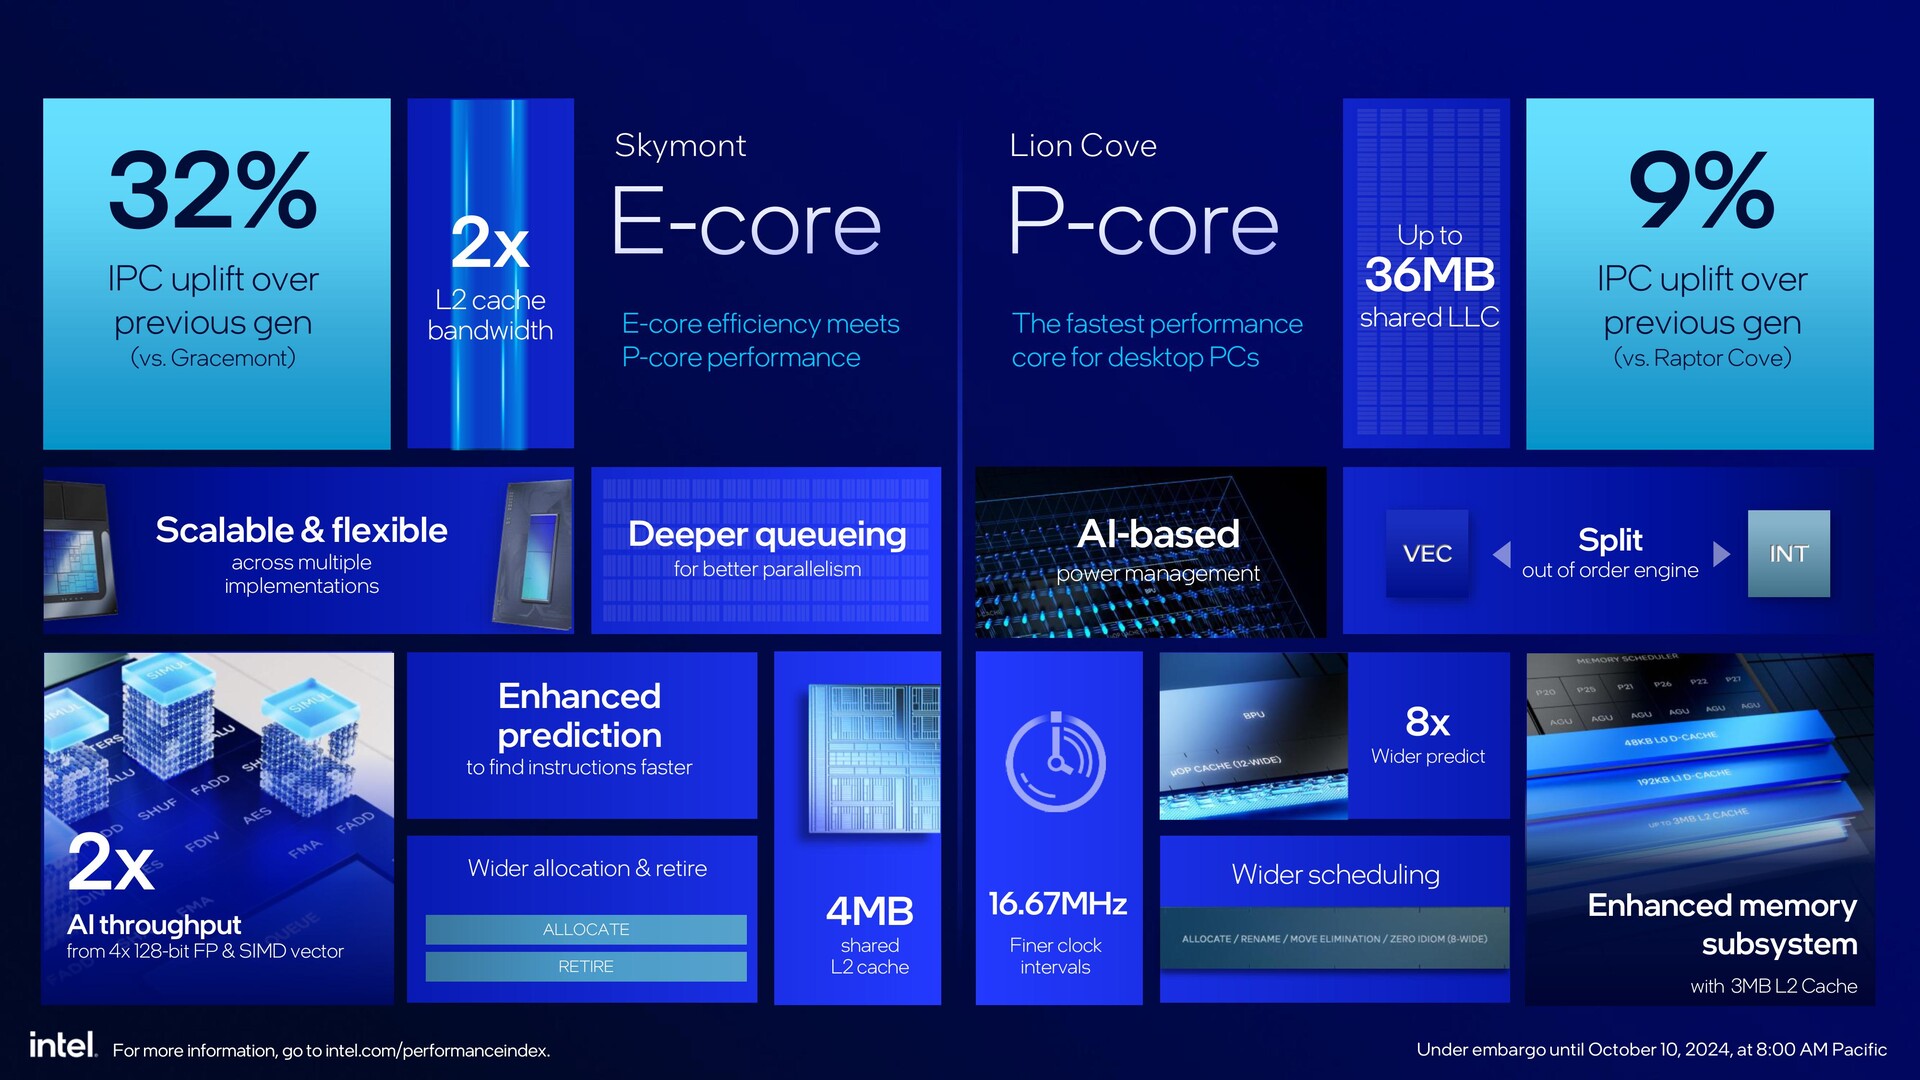
Intel'in Core Ultra 9 285K'nın başını çektiği yeni Arrow Lake-S serisi, Pentium 4 döneminden bu yana bir ilk olarak tüm modellerde hyperthreading'i kaldırarak önemli bir değişime işaret ediyor. Kümülatif CPU karşılaştırmalarında Core Ultra 9 285K, Core i9-14900K ile eşleşiyor ve neredeyse Ryzen 9 9950X performans seviyelerine ulaşıyor.
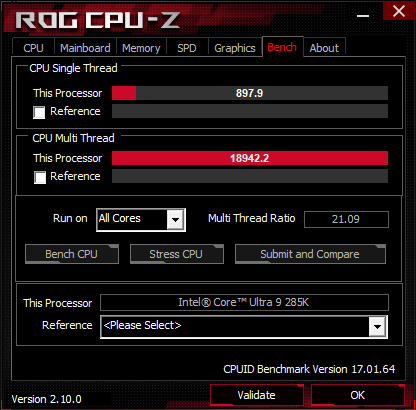
Bununla birlikte, Core Ultra 9 285K'nın bireysel tek ve çok çekirdekli kıyaslamalarda bu CPU'ların her ikisini de gölgede bıraktığını görüyoruz.
Özellikle Arrow Lake-S'nin AMD'nin Zen 5 işlemcileriyle karşılaştırılabilir bir güç verimliliği elde ederken Raptor Lake-S Refresh ile eşit veya hatta biraz daha iyi performans göstermesi hoşumuza gitti.
Ancak bu gelişmelere rağmen Core Ultra 9 285K oyun performansında zorlanıyor ve test edilen tüm çözünürlüklerde hem Core i9-14900K hem de Zen 5 CPU'ların gerisinde kalıyor.
Core Ultra 9 285K, oyunlarda yalnızca Core i7-14700K ile rekabet etmekle sınırlı kalıyor. Arrow Lake-S'nin yerleşik APO optimizasyonları ve teorik olarak CPU'nun daha iyi oyun skorları elde etmesine yardımcı olması gereken hyperthreading eksikliği göz önüne alındığında bu şaşırtıcıdır.
Yeni platform ayrıca yeni 800 Serisi anakartlar ve DDR5 bellekler için ek yatırımlar gerektiriyor ve bu da yükseltme yapmadan önce hesaba katmanız gereken bir şey.
Artılar
Eksiler
Fiyat ve bulunabilirlik
Intel Core Ultra 9 285K bugünden itibaren dünya çapındaki perakendecilerde 589 $ MSRP ile satışa sunulacak. Şimdi indirimli Core i9-14900K yeni BIOS'lardan kaynaklanan hafif performans düşüşlerine rağmen, hem bilgi işlem hem de oyun oynamaya öncelik veriyorsanız hala uygun olmaya devam ediyor.
Bu AMD Ryzen 9 9950X(şu anda Amazon'da 709 dolar) ve Ryzen 9 9900X(Amazon'da 429 dolar) Core Ultra 9 285K'nın oyun hıçkırıklarından hiçbirine sahip olmayan mükemmel alternatifler olmaya devam ediyor.
Price comparison
İçindekiler
- Karar: Intel'in verimlilik oyunu bir oyun engeline takılıyor
- Test tezgahı: GeForce RTX 4090, Core Ultra 9 285K için harika bir eşleşme
- CPU performansı: Ryzen 9 9950X'e göre küçük kazanımlarla genel olarak Core i9-14900K ile aynı seviyede
- Sistem performansı: Core i9-14900K ve AMD Zen 5 ile aynı ligde
- 3D ve oyun performansı: Arrow Lake-S büyük hayal kırıklığı yaratıyor
- Güç tüketimi: Intel nihayet güç verimliliğini doğru anlıyor
- Notebookcheck'in Core Ultra 9 285K hakkındaki genel izlenimi
Intel'in amiral gemisi 13. ve 14. nesil masaüstü işlemcileri tüm haberlere konu oldu yanlış nedenler çok uzun zaman önce değil, ama umarım bugün her şey daha iyiye doğru değişir. İyi bir başlangıç yaptıktan sonra Ay Gölü intel şimdi odağını dizüstü bilgisayarlar için Arrow Gölü-S masaüstü için.
Arrow Lake-S ya da pazarlamacıların deyimiyle Core Ultra 200S Serisi, Intel'in masaüstü işlemci stratejisinde bir paradigma değişikliğine işaret ediyor.
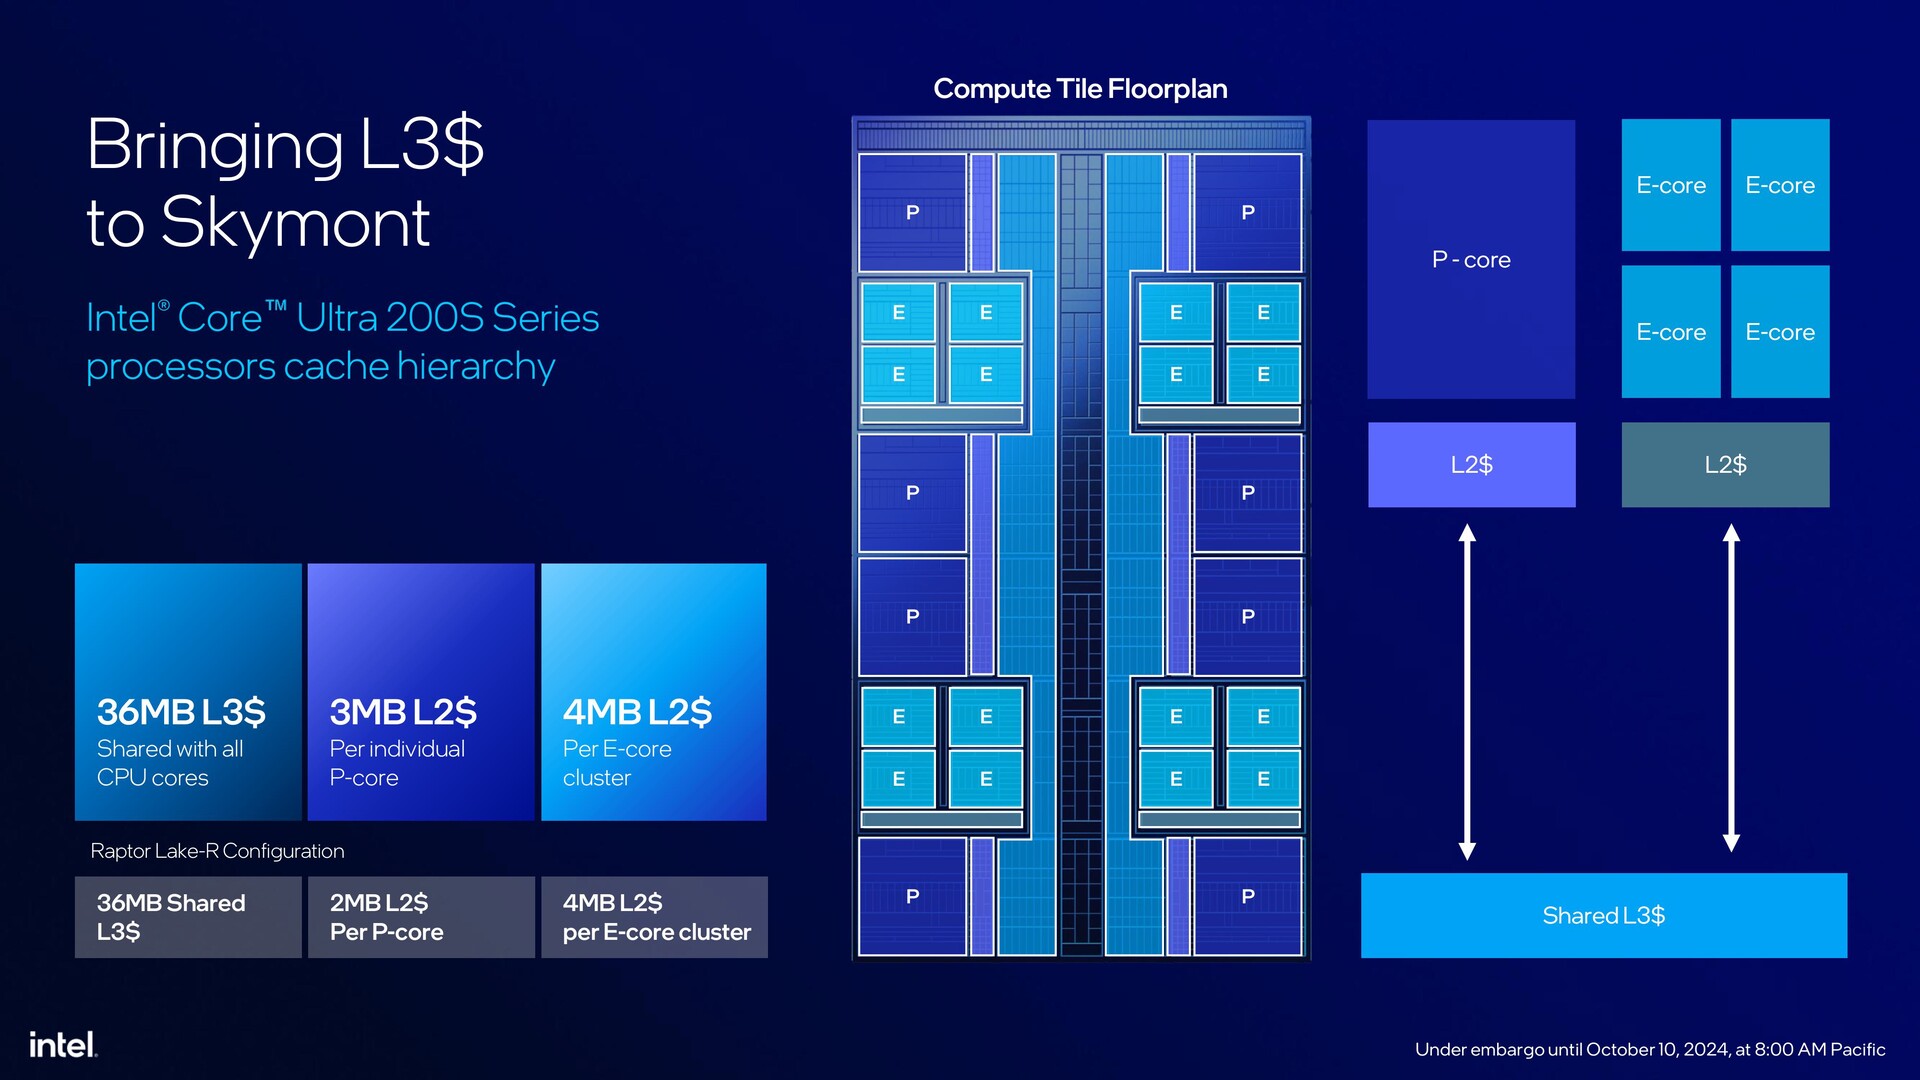
Bu nesilde Intel'in Foveros 3D paketlemesi ilk kez masaüstü bilgisayarlara geliyor, Intel'in yerine TSMC'nin 3 nm üretim hatları kullanılıyor, yeniden düzenlenmiş Lion Cove P çekirdekleri ve hyperthreading içermeyen Skymont E çekirdekleri ile yeni bir Hesaplama karosu, P çekirdeklerinde daha büyük L2 önbellek ve her ikisi de Meteor Lake'ten yeniden kullanılan Alchemist Xe iGPU ve NPU'nun gelişi görülüyor.
Arrow Lake-S'nin Foveros ambalajı, dördü TSMC düğümlerine dayanan toplam altı karo içerir. Bunlar arasında Hesaplama (N3B), Xe-LPG Alchemist iGPU (N5P), SoC (N6), I/O (N6), kararlılık için bir dolgu karosu ve Temel karo (Intel 1227.1 22 nm FinFET) bulunmaktadır.
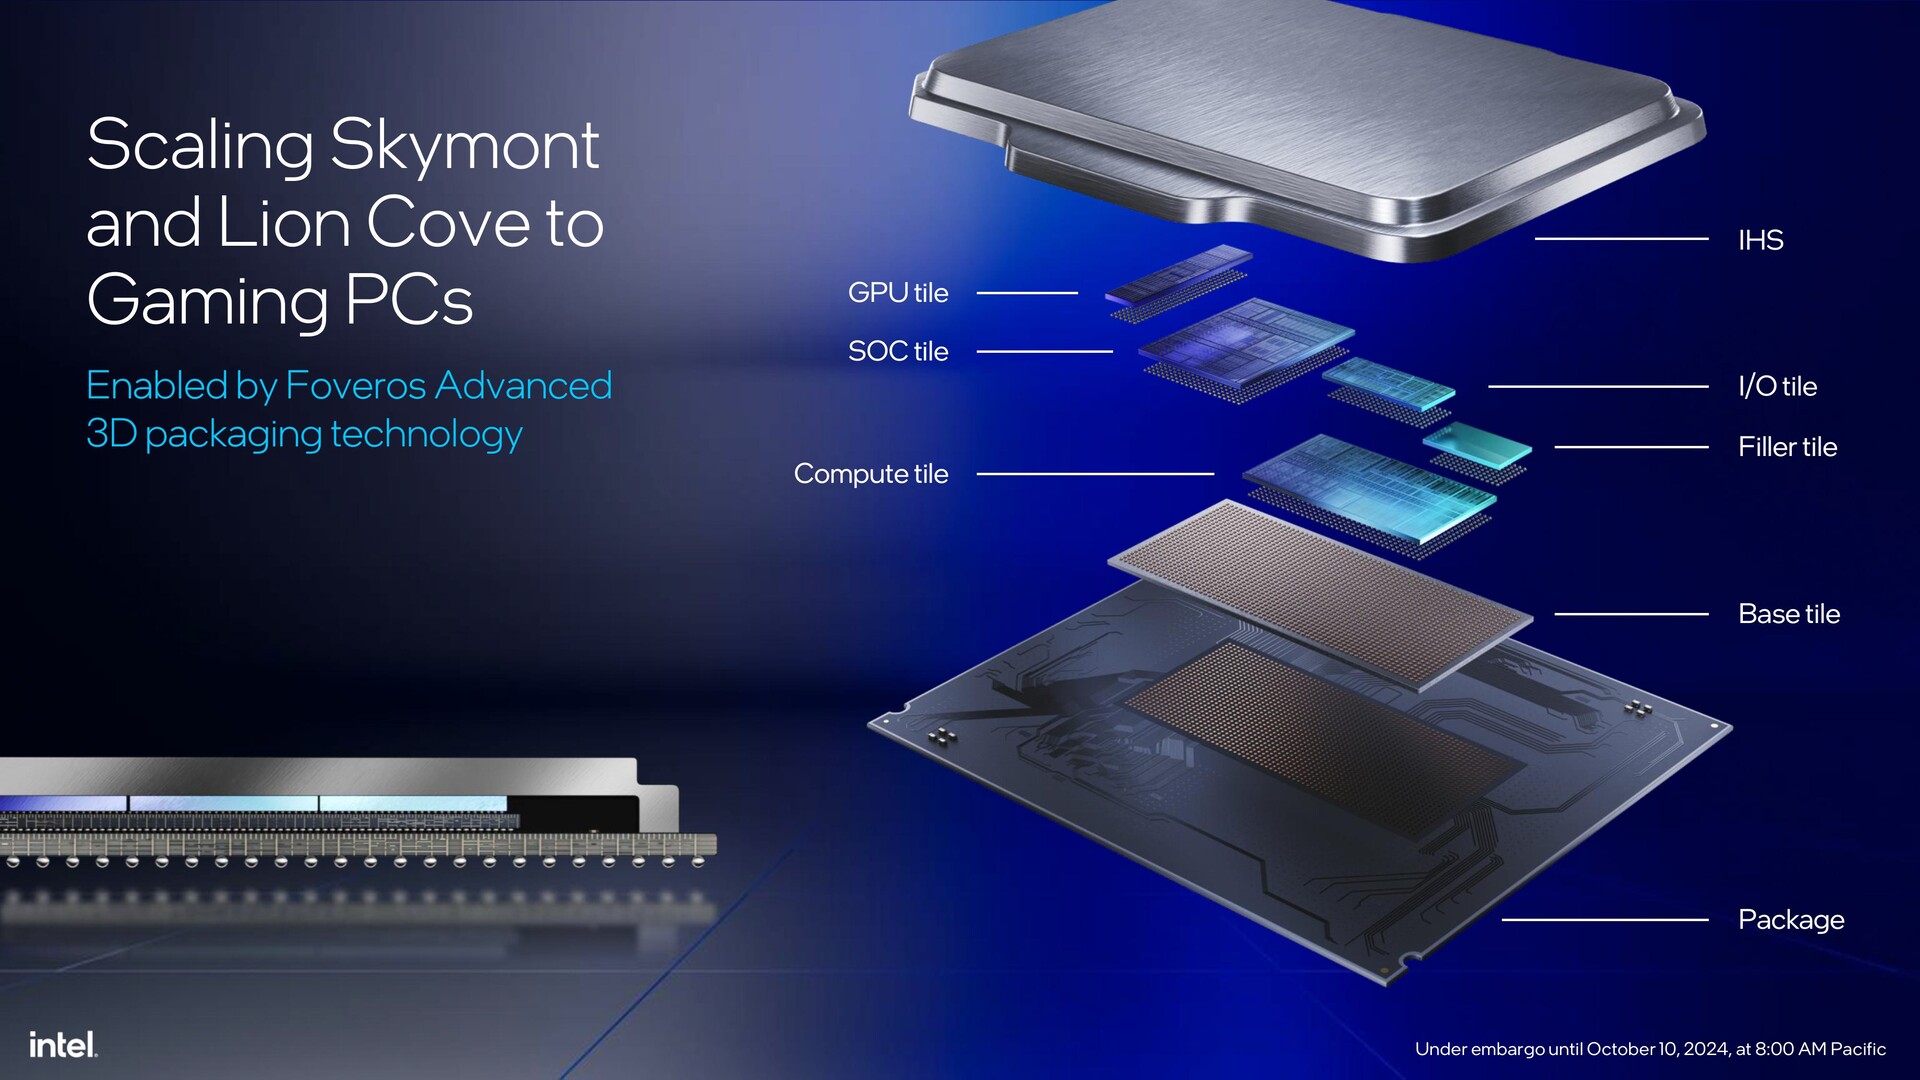
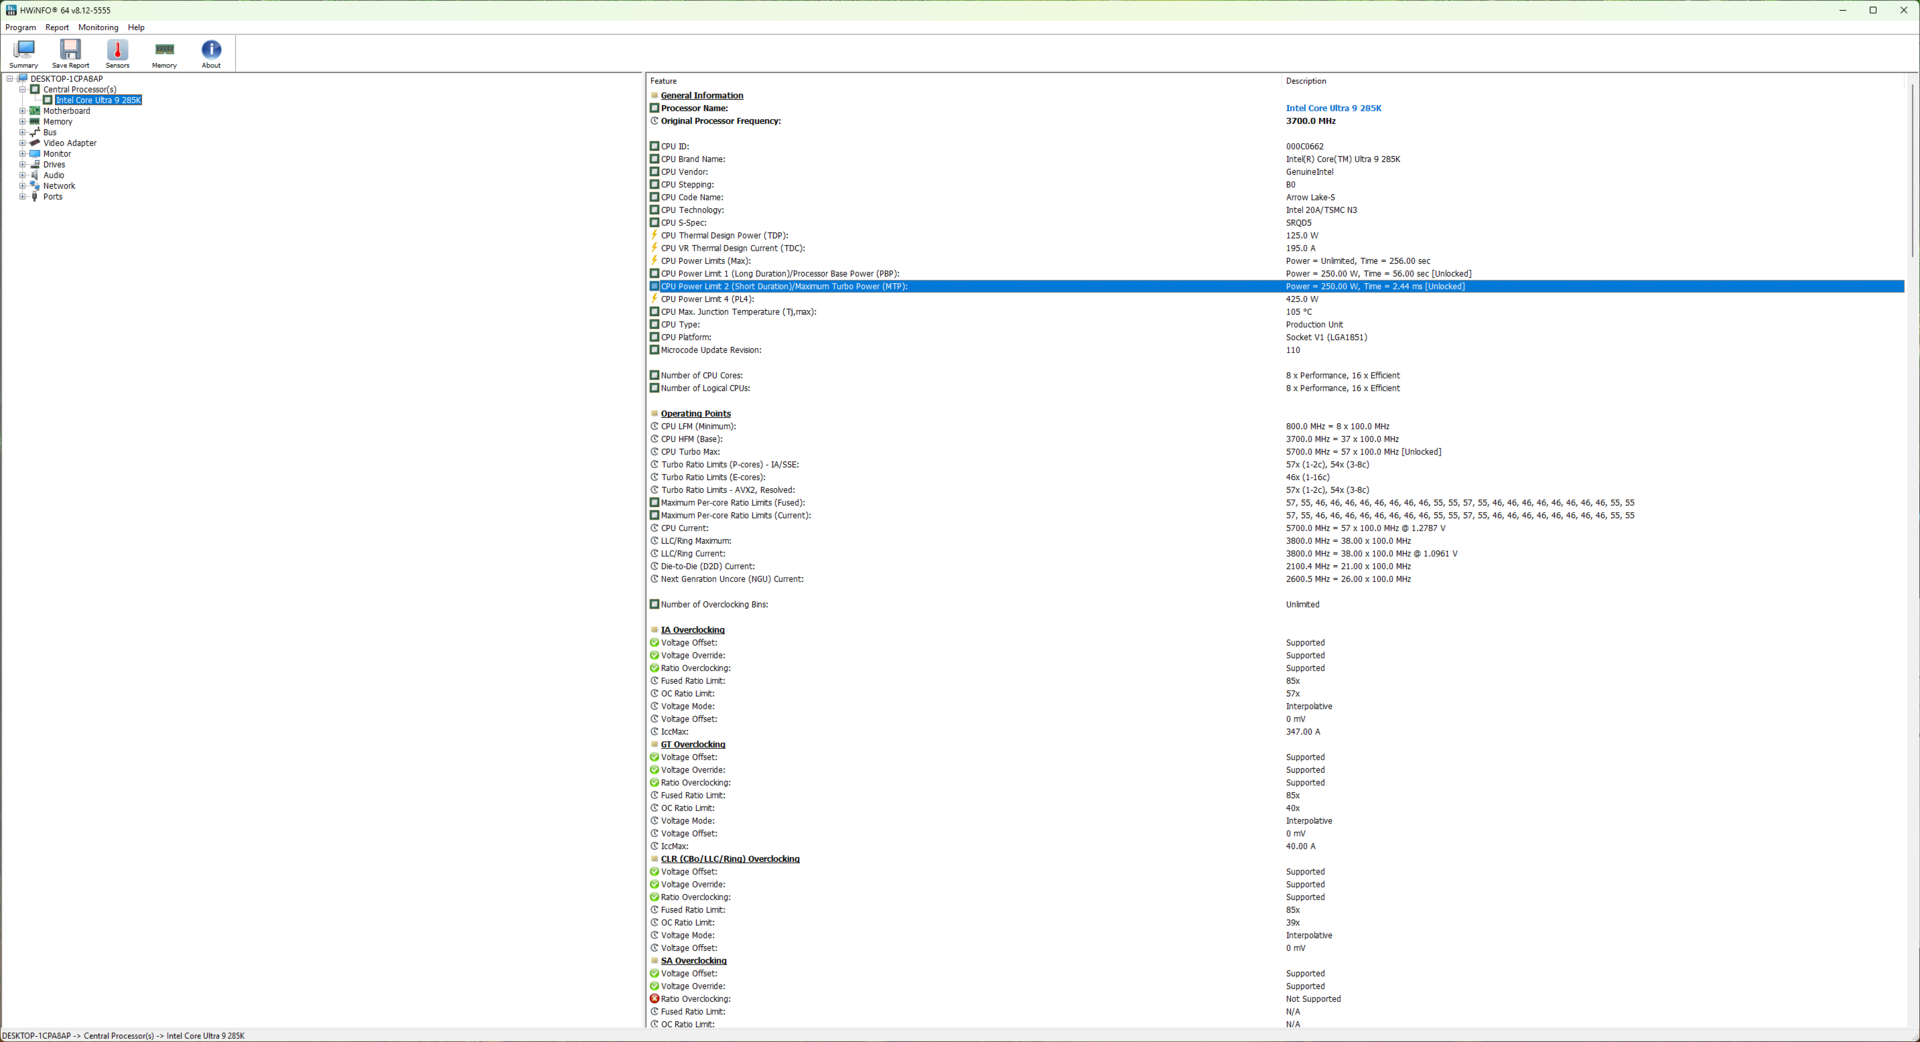
Tüm bu bileşenlerin paket üzerinde bulunması kaçınılmaz olarak yeni güç gereksinimlerini ve dolayısıyla yeni bir soketi gerekli kılıyor. Arrow Lake-S işlemciler, yeni LGA 1851 soketine sahip yeni 800 Serisi anakartlar gerektiriyor. Ne yazık ki Intel, gelecek CPU nesillerinin bu yeni pin düzenini kullanıp kullanmayacağı konusunda hala sessiz.
Bununla birlikte, bu CPU'lar Raptor Lake-S ve Alder Lake-S'de bulunan hibrit bellek denetleyicisinden yoksun olduğu için DDR5 belleğe tamamen geçiş yapma ihtiyacı da ortaya çıkıyor.
Bu incelemede, yeni Intel Core Ultra 9 285K'ya bir göz atıyor ve Intel'in masaüstünde aldığı kararların AMD'nin en son Ryzen 9000 tekliflerine ve Intel'in kendi 14. nesil yongalarına yeterince meydan okuyup okuyamayacağını görüyoruz.
Intel Core Ultra 200S Serisi Arrow Lake-S masaüstü işlemcilere genel bakış
| SKU | Çekirdek / İş Parçacığı | P-Çekirdek Saati / Turbo | E-Çekirdek Saati / Turbo | Turbo Boost Max 3.0 | Toplam L2 Önbellek | L3 Önbellek | Tümleşik Grafik | NPU Peak TOPS | PBP (PL1) | MTP (PL2) | MSRP |
|---|---|---|---|---|---|---|---|---|---|---|---|
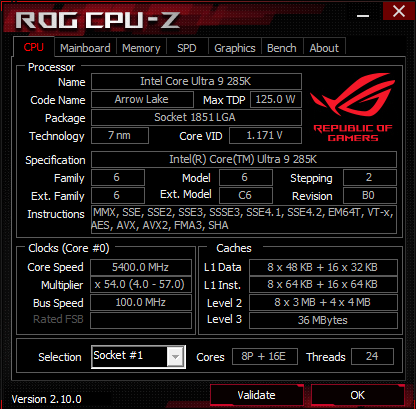
| Intel Core Ultra 9 285K | 24 (8P + 16E) /24 | 3,7 GHz / 5,5 GHz | 3,2 GHz / 4,6 GHz | 5,6 GHz | 40MB | 36 MB | 4 Xe Çekirdek, 2,0 GHz | 13 TOPS | 125 W | 250 W | 589 $ |
| Intel Core Ultra 7 265K | 20 (8P + 12E) /20 | 3.9 GHz / 5.4 GHz | 3.3 GHz / 4.6 GHz | 5.6 GHz | 36 MB | 30 MB | 4 Xe Çekirdek, 2.0 GHz | 13 TOPS | 125 W | 250 W | 394 $ |
| Intel Core Ultra 7 265KF | 20 (8P + 12E) /20 | 3.9 GHz / 5.4 GHz | 3.3 GHz / 4.6 GHz | 5.6 GHz | 36 MB | 30 MB | - | 13 TOPS | 125 W | 250 W | $379 |
| Intel Core Ultra 5 245K | 14 (6P + 8E) /14 | 3,9 GHz / 5,4 GHz | 4,2 GHz / 5,2 GHz | 5,2 GHz | 26 MB | 24 MB | 4 Xe Çekirdek, 1,9 GHz | 13 TOPS | 125 W | 159 W | $309 |
| Intel Core Ultra 5 245KF | 14 (6P + 8E) /14 | 3.9 GHz / 5.4 GHz | 4.2 GHz / 5.2 GHz | 5.2 GHz | 26 MB | 24 MB | - | 13 TOPS | 125 W | 159 W | $294 |
Test tezgahı: GeForce RTX 4090, Core Ultra 9 285K için harika bir eşleşme
Core Ultra 9 285K'yı test etmek için aşağıdaki bileşenleri kullandık:
- Cooler Master MasterFrame 700 açık test tezgahı
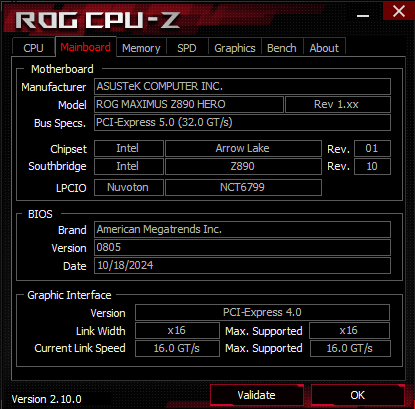
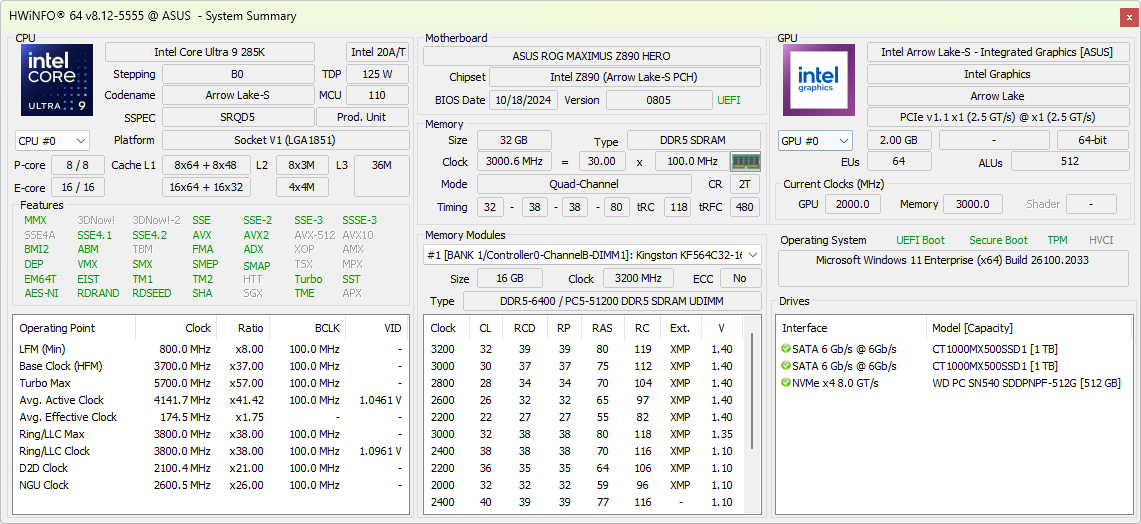
- BIOS sürümü 0805 olan Asus ROG Maximus Z890 Hero anakart
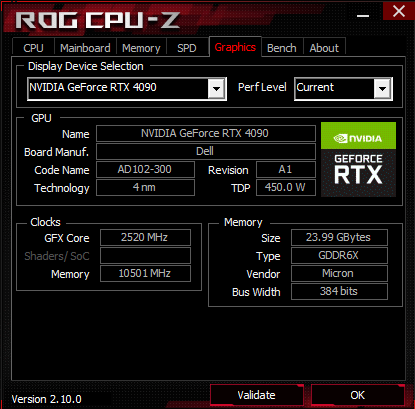
- Nvidia GeForce RTX 4090 Founders Edition GPU
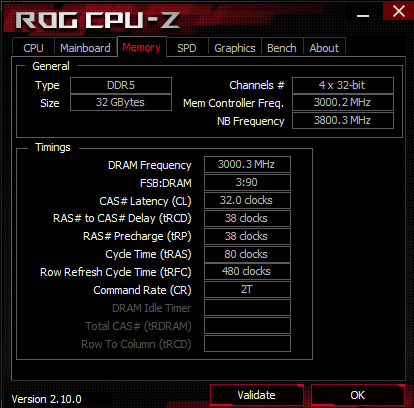
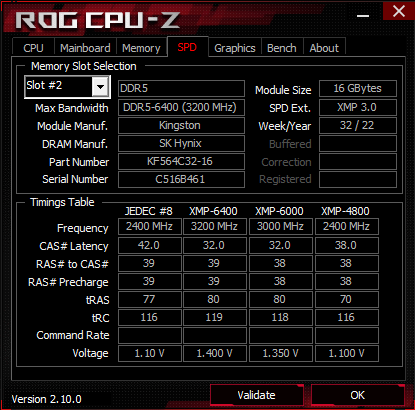
- 2x 16 GB Kingston Fury Beast DDR5-6400 RAM, 1,35 V'de 32-38-38-80 zamanlamalarla DDR5-6000'de çalışır
- İşletim sistemi, kıyaslamalar ve oyunlar için Western Digital PC SN540 512 GB NVMe SSD ve 2x Crucial MX500 1 TB SATA SSD
- Alienware AW3225QF 4K 240 Hz QD-OLED monitör
- Thermaltake TH420 V2 Ultra EX ARGB AiO soğutucu
- Cooler Master MVE Gold V2 1250 ATX 3.0 tamamen modüler PSU
Core Ultra 9 285K test örneğini sağladığı için Intel'e, RTX 4090 Founders Edition GPU için Nvidia'ya, ROG Maximus Z890 Hero anakart için Asus'a, AW3225QF monitör için Dell'e, DDR5 bellek kiti için Kingston'a, TH420 V2 Ultra EX AIO için Thermaltake'e ve son olarak test tezgahı ve güç kaynağı için Cooler Master'a teşekkür ederiz.
Tüm testler, en son platform sürücüleri ve Nvidia Game Ready Driver 566.03 ile birlikte yeni bir Windows 11 24H2 (Build 26100.2033) kurulumunda gerçekleştirildi.
BIOS'taki varsayılan Intel performans ayarlarını kullandık ve Windows güç planını PL1=PL2=250 W olarak ayarlayan Ultimate Performance olarak ayarladık.
CPU performansı: Ryzen 9 9950X'e göre küçük kazanımlarla genel olarak Core i9-14900K ile aynı seviyede
Kümülatif CPU testleri Core Ultra 9 285K'nın Core i9-14900K ile aynı seviyede olduğunu ve AMD Ryzen 9 9950X'un sadece biraz gerisinde kaldığını göstermektedir. Bu büyük ölçüde Core Ultra 9 285K'nın Blender 2.79 BMW27 CPU, V-Ray testleri, wPrime 2.1 ve R benchmark gibi belirli testlerde Ryzen 9 9950X'in gerisinde kalmasından kaynaklanıyor, ancak farklar o kadar önemli değil.
Cinebench tek çekirdek testlerinde Ultra 9 285K, Core i9-14900K'yı biraz geride bırakmayı başarıyor
Ryzen 9 9900X ve Ryzen 9 9950X'in topuklarını kemiriyor. Ancak Geekbench'te durum farklı, Zen 5 çipleri Arrow Lake-S karşısında çok küçük kazanımlar elde ediyor.Çoklu çekirdek kazanımları daha belirgin. 24C/24T Core Ultra 9 285K, hyperthreading olmamasına rağmen Cinebench çoklu çekirdek testlerinde 16C/32T Ryzen 9 9950X'e göre %4-6 kazanım gösteriyor. Core Ultra 9 285K, Core i9-14900K ve Ryzen 9 9950X, Geekbench 6.3 çoklu çekirdekte benzer performans gösteriyor.
| CPU Performance Rating - Percent | |
| AMD Ryzen 9 9950X | |
| Intel Core i9-14900K -1! | |
| Intel Core Ultra 9 285K | |
| AMD Ryzen 9 7950X -2! | |
| Intel Core i9-13900K | |
| AMD Ryzen 9 7950X3D | |
| AMD Ryzen 9 9900X -9! | |
| Intel Core i7-14700K | |
| AMD Ryzen 9 7900X -2! | |
| AMD Ryzen 7 9700X | |
| Intel Core i5-14600K | |
| Intel Core Ultra 5 245K | |
| Intel Core i9-12900K -1! | |
| Intel Core i5-13600K -2! | |
| AMD Ryzen 5 9600X -2! | |
| AMD Ryzen 7 7800X3D -3! | |
| Intel Core i5-12600K -3! | |
| Cinebench R15 | |
| CPU Single 64Bit | |
| Intel Core Ultra 9 285K | |
| AMD Ryzen 9 9900X | |
| AMD Ryzen 7 9700X | |
| AMD Ryzen 9 9950X | |
| AMD Ryzen 5 9600X | |
| Intel Core i9-14900K | |
| AMD Ryzen 9 7950X | |
| Intel Core i9-13900K | |
| AMD Ryzen 9 7950X3D | |
| AMD Ryzen 9 7900X | |
| Intel Core Ultra 5 245K | |
| Intel Core i7-14700K | |
| Intel Core i5-14600K | |
| AMD Ryzen 7 7800X3D | |
| Intel Core i5-13600K | |
| Intel Core i9-12900K | |
| Intel Core i5-12600K | |
| CPU Multi 64Bit | |
| Intel Core Ultra 9 285K | |
| AMD Ryzen 9 9950X | |
| Intel Core i9-14900K | |
| AMD Ryzen 9 7950X | |
| Intel Core i9-13900K | |
| AMD Ryzen 9 7950X3D | |
| Intel Core i7-14700K | |
| AMD Ryzen 9 9900X | |
| AMD Ryzen 9 7900X | |
| Intel Core i9-12900K | |
| Intel Core Ultra 5 245K | |
| Intel Core i5-13600K | |
| Intel Core i5-14600K | |
| AMD Ryzen 7 9700X | |
| AMD Ryzen 7 7800X3D | |
| AMD Ryzen 5 9600X | |
| Intel Core i5-12600K | |
| Cinebench R20 | |
| CPU (Single Core) | |
| Intel Core Ultra 9 285K | |
| Intel Core i9-14900K | |
| AMD Ryzen 9 9900X | |
| AMD Ryzen 9 9950X | |
| AMD Ryzen 7 9700X | |
| AMD Ryzen 5 9600X | |
| Intel Core i7-14700K | |
| Intel Core i9-13900K | |
| Intel Core Ultra 5 245K | |
| AMD Ryzen 9 7950X | |
| AMD Ryzen 9 7950X3D | |
| Intel Core i5-14600K | |
| AMD Ryzen 9 7900X | |
| Intel Core i5-13600K | |
| Intel Core i9-12900K | |
| Intel Core i5-12600K | |
| AMD Ryzen 7 7800X3D | |
| CPU (Multi Core) | |
| Intel Core Ultra 9 285K | |
| AMD Ryzen 9 9950X | |
| Intel Core i9-14900K | |
| Intel Core i9-13900K | |
| AMD Ryzen 9 7950X | |
| AMD Ryzen 9 7950X3D | |
| Intel Core i7-14700K | |
| AMD Ryzen 9 9900X | |
| AMD Ryzen 9 7900X | |
| Intel Core i9-12900K | |
| Intel Core Ultra 5 245K | |
| Intel Core i5-14600K | |
| Intel Core i5-13600K | |
| AMD Ryzen 7 9700X | |
| AMD Ryzen 7 7800X3D | |
| AMD Ryzen 5 9600X | |
| Intel Core i5-12600K | |
| Cinebench R23 | |
| Single Core | |
| Intel Core Ultra 9 285K | |
| Intel Core i9-14900K | |
| Intel Core i9-13900K | |
| AMD Ryzen 9 9900X | |
| AMD Ryzen 7 9700X | |
| AMD Ryzen 9 9950X | |
| AMD Ryzen 5 9600X | |
| Intel Core i7-14700K | |
| Intel Core Ultra 5 245K | |
| Intel Core i5-14600K | |
| AMD Ryzen 9 7950X3D | |
| AMD Ryzen 9 7950X | |
| AMD Ryzen 9 7900X | |
| Intel Core i5-13600K | |
| Intel Core i9-12900K | |
| Intel Core i5-12600K | |
| AMD Ryzen 7 7800X3D | |
| Multi Core | |
| Intel Core Ultra 9 285K | |
| Intel Core i9-14900K | |
| AMD Ryzen 9 9950X | |
| Intel Core i9-13900K | |
| AMD Ryzen 9 7950X | |
| AMD Ryzen 9 7950X3D | |
| Intel Core i7-14700K | |
| AMD Ryzen 9 9900X | |
| AMD Ryzen 9 7900X | |
| Intel Core i9-12900K | |
| Intel Core Ultra 5 245K | |
| Intel Core i5-14600K | |
| Intel Core i5-13600K | |
| AMD Ryzen 7 9700X | |
| AMD Ryzen 7 7800X3D | |
| Intel Core i5-12600K | |
| AMD Ryzen 5 9600X | |
| Blender - v2.79 BMW27 CPU | |
| Intel Core i5-12600K | |
| AMD Ryzen 5 9600X | |
| AMD Ryzen 7 7800X3D | |
| AMD Ryzen 7 9700X | |
| Intel Core Ultra 5 245K | |
| Intel Core i5-13600K | |
| Intel Core i5-14600K | |
| Intel Core i9-12900K | |
| AMD Ryzen 9 7900X | |
| AMD Ryzen 9 9900X | |
| Intel Core i7-14700K | |
| AMD Ryzen 9 7950X3D | |
| AMD Ryzen 9 7950X | |
| Intel Core i9-13900K | |
| Intel Core i9-14900K | |
| Intel Core Ultra 9 285K | |
| AMD Ryzen 9 9950X | |
| HWBOT x265 Benchmark v2.2 - 4k Preset | |
| Intel Core Ultra 9 285K | |
| AMD Ryzen 9 9950X | |
| AMD Ryzen 9 7950X | |
| Intel Core i9-14900K | |
| Intel Core i9-13900K | |
| AMD Ryzen 9 7950X3D | |
| AMD Ryzen 9 9900X | |
| Intel Core i7-14700K | |
| AMD Ryzen 9 7900X | |
| Intel Core i5-12600K | |
| Intel Core i9-12900K | |
| Intel Core Ultra 5 245K | |
| Intel Core i5-14600K | |
| Intel Core i5-13600K | |
| AMD Ryzen 7 9700X | |
| AMD Ryzen 7 7800X3D | |
| AMD Ryzen 5 9600X | |
| WinRAR - Result | |
| AMD Ryzen 9 7900X | |
| AMD Ryzen 7 7800X3D | |
| AMD Ryzen 9 7950X | |
| Intel Core i9-14900K | |
| AMD Ryzen 9 7950X3D | |
| Intel Core i9-13900K | |
| AMD Ryzen 5 9600X | |
| AMD Ryzen 9 9950X | |
| AMD Ryzen 7 9700X | |
| Intel Core Ultra 9 285K | |
| Intel Core i7-14700K | |
| Intel Core i5-14600K | |
| Intel Core i5-13600K | |
| Intel Core i9-12900K | |
| Intel Core Ultra 5 245K | |
| Intel Core i5-12600K | |
| TrueCrypt | |
| AES Mean 100MB | |
| AMD Ryzen 9 9950X | |
| AMD Ryzen 9 7950X | |
| Intel Core i9-13900K | |
| AMD Ryzen 9 7950X3D | |
| Intel Core i9-14900K | |
| Intel Core i7-14700K | |
| Intel Core i5-14600K | |
| Intel Core i5-13600K | |
| Intel Core i9-12900K | |
| Intel Core Ultra 9 285K | |
| Intel Core Ultra 5 245K | |
| AMD Ryzen 7 9700X | |
| AMD Ryzen 7 7800X3D | |
| AMD Ryzen 9 7900X | |
| AMD Ryzen 5 9600X | |
| Intel Core i5-12600K | |
| Twofish Mean 100MB | |
| Intel Core i9-14900K | |
| AMD Ryzen 9 9950X | |
| Intel Core i9-13900K | |
| Intel Core Ultra 9 285K | |
| Intel Core i7-14700K | |
| AMD Ryzen 9 7950X | |
| AMD Ryzen 9 7950X3D | |
| Intel Core i9-12900K | |
| Intel Core i5-14600K | |
| Intel Core i5-13600K | |
| Intel Core Ultra 5 245K | |
| AMD Ryzen 9 7900X | |
| AMD Ryzen 7 9700X | |
| Intel Core i5-12600K | |
| AMD Ryzen 5 9600X | |
| AMD Ryzen 7 7800X3D | |
| Serpent Mean 100MB | |
| AMD Ryzen 9 9950X | |
| Intel Core i9-13900K | |
| AMD Ryzen 9 7950X | |
| AMD Ryzen 9 7950X3D | |
| Intel Core i9-14900K | |
| Intel Core i7-14700K | |
| Intel Core Ultra 9 285K | |
| Intel Core i9-12900K | |
| Intel Core i5-14600K | |
| Intel Core i5-13600K | |
| AMD Ryzen 7 9700X | |
| AMD Ryzen 9 7900X | |
| Intel Core Ultra 5 245K | |
| AMD Ryzen 5 9600X | |
| Intel Core i5-12600K | |
| AMD Ryzen 7 7800X3D | |
| Geekbench 5.5 | |
| Single-Core | |
| AMD Ryzen 9 9950X | |
| AMD Ryzen 9 9900X | |
| AMD Ryzen 5 9600X | |
| AMD Ryzen 7 9700X | |
| Intel Core Ultra 9 285K | |
| AMD Ryzen 9 7950X | |
| AMD Ryzen 9 7950X3D | |
| Intel Core i9-13900K | |
| AMD Ryzen 9 7900X | |
| Intel Core i9-14900K | |
| Intel Core Ultra 5 245K | |
| Intel Core i7-14700K | |
| Intel Core i9-12900K | |
| AMD Ryzen 7 7800X3D | |
| Intel Core i5-14600K | |
| Intel Core i5-13600K | |
| Intel Core i5-12600K | |
| Multi-Core | |
| Intel Core Ultra 9 285K | |
| Intel Core i9-14900K | |
| AMD Ryzen 9 7950X | |
| AMD Ryzen 9 7950X3D | |
| Intel Core i9-13900K | |
| AMD Ryzen 9 9950X | |
| Intel Core i7-14700K | |
| AMD Ryzen 9 9900X | |
| AMD Ryzen 9 7900X | |
| Intel Core i9-12900K | |
| Intel Core Ultra 5 245K | |
| Intel Core i5-14600K | |
| Intel Core i5-13600K | |
| AMD Ryzen 7 9700X | |
| AMD Ryzen 7 7800X3D | |
| Intel Core i5-12600K | |
| AMD Ryzen 5 9600X | |
| Geekbench 6.4 | |
| Single-Core | |
| AMD Ryzen 9 9900X | |
| AMD Ryzen 9 9950X | |
| AMD Ryzen 7 9700X | |
| Intel Core Ultra 9 285K | |
| Intel Core i9-14900K | |
| Intel Core i9-13900K | |
| Intel Core Ultra 5 245K | |
| AMD Ryzen 9 7950X3D | |
| Intel Core i7-14700K | |
| Intel Core i5-14600K | |
| Intel Core i9-12900K | |
| Multi-Core | |
| Intel Core Ultra 9 285K | |
| Intel Core i9-14900K | |
| AMD Ryzen 9 9950X | |
| Intel Core i9-13900K | |
| AMD Ryzen 9 9900X | |
| AMD Ryzen 9 7950X3D | |
| Intel Core i7-14700K | |
| Intel Core Ultra 5 245K | |
| Intel Core i9-12900K | |
| Intel Core i5-14600K | |
| AMD Ryzen 7 9700X | |
| 7-Zip 18.03 | |
| 7z b 4 | |
| AMD Ryzen 9 7950X | |
| AMD Ryzen 9 9950X | |
| AMD Ryzen 9 7950X3D | |
| Intel Core i9-14900K | |
| Intel Core i9-13900K | |
| Intel Core i7-14700K | |
| Intel Core Ultra 9 285K | |
| AMD Ryzen 9 7900X | |
| AMD Ryzen 9 9900X | |
| Intel Core i9-12900K | |
| Intel Core i5-14600K | |
| Intel Core i5-13600K | |
| AMD Ryzen 7 7800X3D | |
| AMD Ryzen 7 9700X | |
| Intel Core Ultra 5 245K | |
| AMD Ryzen 5 9600X | |
| Intel Core i5-12600K | |
| 7z b 4 -mmt1 | |
| AMD Ryzen 9 7950X | |
| AMD Ryzen 9 7950X3D | |
| AMD Ryzen 9 7900X | |
| AMD Ryzen 7 7800X3D | |
| AMD Ryzen 9 9900X | |
| AMD Ryzen 7 9700X | |
| AMD Ryzen 9 9950X | |
| AMD Ryzen 5 9600X | |
| Intel Core i9-14900K | |
| Intel Core Ultra 9 285K | |
| Intel Core i7-14700K | |
| Intel Core i9-13900K | |
| Intel Core i5-14600K | |
| Intel Core i9-12900K | |
| Intel Core i5-13600K | |
| Intel Core Ultra 5 245K | |
| Intel Core i5-12600K | |
| R Benchmark 2.5 - Overall mean | |
| Intel Core i5-12600K | |
| Intel Core i9-12900K | |
| AMD Ryzen 7 7800X3D | |
| Intel Core Ultra 5 245K | |
| Intel Core Ultra 5 245K | |
| Intel Core i5-13600K | |
| Intel Core i5-14600K | |
| Intel Core i7-14700K | |
| Intel Core Ultra 9 285K | |
| AMD Ryzen 9 7900X | |
| AMD Ryzen 9 7950X3D | |
| AMD Ryzen 9 7950X | |
| Intel Core i9-13900K | |
| Intel Core i9-14900K | |
| AMD Ryzen 7 9700X | |
| AMD Ryzen 5 9600X | |
| AMD Ryzen 9 9900X | |
| AMD Ryzen 9 9950X | |
| LibreOffice - 20 Documents To PDF | |
| Intel Core i5-12600K | |
| AMD Ryzen 5 9600X | |
| AMD Ryzen 9 9950X | |
| AMD Ryzen 9 9900X | |
| AMD Ryzen 7 9700X | |
| Intel Core Ultra 5 245K | |
| Intel Core Ultra 5 245K | |
| AMD Ryzen 7 7800X3D | |
| Intel Core i9-12900K | |
| Intel Core i7-14700K | |
| AMD Ryzen 9 7950X3D | |
| Intel Core Ultra 9 285K | |
| Intel Core i9-13900K | |
| AMD Ryzen 9 7950X | |
| Intel Core i5-13600K | |
| AMD Ryzen 9 7900X | |
| Intel Core i9-14900K | |
| Intel Core i5-14600K | |
| WebXPRT 3 - Overall | |
| AMD Ryzen 9 9950X | |
| AMD Ryzen 7 9700X | |
| AMD Ryzen 9 9900X | |
| Intel Core Ultra 9 285K | |
| AMD Ryzen 9 7950X3D | |
| Intel Core i9-14900K | |
| AMD Ryzen 9 7900X | |
| AMD Ryzen 9 7950X | |
| AMD Ryzen 5 9600X | |
| Intel Core i9-13900K | |
| Intel Core i5-14600K | |
| AMD Ryzen 7 7800X3D | |
| Intel Core Ultra 5 245K | |
| Intel Core i7-14700K | |
| Intel Core i5-13600K | |
| Intel Core i9-12900K | |
| Intel Core i5-12600K | |
| WebXPRT 4 - Overall | |
| AMD Ryzen 9 9950X | |
| Intel Core Ultra 9 285K | |
| AMD Ryzen 9 9900X | |
| AMD Ryzen 7 9700X | |
| AMD Ryzen 5 9600X | |
| Intel Core Ultra 5 245K | |
| Intel Core i9-13900K | |
| AMD Ryzen 9 7900X | |
| Intel Core i7-14700K | |
| AMD Ryzen 9 7950X3D | |
| AMD Ryzen 9 7950X | |
| Intel Core i5-14600K | |
| Intel Core i5-13600K | |
| AMD Ryzen 7 7800X3D | |
| Mozilla Kraken 1.1 - Total | |
| Intel Core i5-12600K | |
| AMD Ryzen 7 7800X3D | |
| Intel Core i9-12900K | |
| Intel Core i5-13600K | |
| Intel Core i5-14600K | |
| Intel Core i7-14700K | |
| AMD Ryzen 9 7950X3D | |
| AMD Ryzen 9 7950X | |
| Intel Core i9-13900K | |
| AMD Ryzen 9 7900X | |
| Intel Core Ultra 5 245K | |
| Intel Core i9-14900K | |
| Intel Core Ultra 9 285K | |
| AMD Ryzen 5 9600X | |
| AMD Ryzen 7 9700X | |
| AMD Ryzen 9 9900X | |
| AMD Ryzen 9 9950X | |
| V-Ray Benchmark Next 4.10 - CPU | |
| AMD Ryzen 9 9950X | |
| Intel Core Ultra 9 285K | |
| AMD Ryzen 9 7950X | |
| AMD Ryzen 9 7950X3D | |
| Intel Core i9-14900K | |
| Intel Core i9-13900K | |
| AMD Ryzen 9 9900X | |
| Intel Core i7-14700K | |
| AMD Ryzen 9 7900X | |
| Intel Core i9-12900K | |
| Intel Core Ultra 5 245K | |
| Intel Core i5-14600K | |
| Intel Core i5-13600K | |
| AMD Ryzen 7 9700X | |
| AMD Ryzen 5 9600X | |
| Intel Core i5-12600K | |
| V-Ray 5 Benchmark - CPU | |
| AMD Ryzen 9 9950X | |
| Intel Core Ultra 9 285K | |
| AMD Ryzen 9 7950X | |
| AMD Ryzen 9 7950X3D | |
| Intel Core i9-13900K | |
| Intel Core i9-14900K | |
| Intel Core i7-14700K | |
| AMD Ryzen 9 7900X | |
| Intel Core i9-12900K | |
| Intel Core Ultra 5 245K | |
| Intel Core i5-14600K | |
| Intel Core i5-13600K | |
| AMD Ryzen 7 9700X | |
| AMD Ryzen 7 7800X3D | |
| AMD Ryzen 5 9600X | |
| Intel Core i5-12600K | |
| wPrime 2.10 | |
| 32m | |
| Intel Core i9-12900K | |
| Intel Core i5-12600K | |
| Intel Core Ultra 5 245K | |
| AMD Ryzen 5 9600X | |
| Intel Core i5-13600K | |
| AMD Ryzen 7 7800X3D | |
| Intel Core i5-14600K | |
| AMD Ryzen 7 9700X | |
| Intel Core i7-14700K | |
| Intel Core Ultra 9 285K | |
| AMD Ryzen 9 9950X | |
| Intel Core i9-14900K | |
| AMD Ryzen 9 7950X3D | |
| Intel Core i9-13900K | |
| AMD Ryzen 9 7900X | |
| AMD Ryzen 9 7950X | |
| 1024m | |
| Intel Core i5-12600K | |
| Intel Core i9-12900K | |
| Intel Core i5-13600K | |
| Intel Core i5-14600K | |
| Intel Core i7-14700K | |
| Intel Core i9-13900K | |
| Intel Core Ultra 5 245K | |
| Intel Core i9-14900K | |
| AMD Ryzen 5 9600X | |
| AMD Ryzen 7 7800X3D | |
| AMD Ryzen 7 9700X | |
| Intel Core Ultra 9 285K | |
| AMD Ryzen 9 7900X | |
| AMD Ryzen 9 7950X3D | |
| AMD Ryzen 9 7950X | |
| AMD Ryzen 9 9950X | |
| Super Pi mod 1.5 XS 1M - 1M | |
| AMD Ryzen 5 9600X | |
| AMD Ryzen 7 9700X | |
| Intel Core i5-12600K | |
| AMD Ryzen 9 9950X | |
| Intel Core Ultra 5 245K | |
| AMD Ryzen 7 7800X3D | |
| Intel Core i9-12900K | |
| Intel Core Ultra 9 285K | |
| Intel Core i5-13600K | |
| Intel Core i5-14600K | |
| AMD Ryzen 9 7900X | |
| AMD Ryzen 9 7950X3D | |
| AMD Ryzen 9 7950X | |
| Intel Core i7-14700K | |
| Intel Core i9-13900K | |
| Intel Core i9-14900K | |
| Super Pi mod 1.5 XS 2M - 2M | |
| Intel Core i5-12600K | |
| AMD Ryzen 5 9600X | |
| AMD Ryzen 7 9700X | |
| Intel Core Ultra 5 245K | |
| AMD Ryzen 9 9950X | |
| Intel Core i9-12900K | |
| AMD Ryzen 7 7800X3D | |
| Intel Core Ultra 9 285K | |
| Intel Core i5-13600K | |
| Intel Core i5-14600K | |
| AMD Ryzen 9 7950X | |
| AMD Ryzen 9 7900X | |
| Intel Core i9-13900K | |
| AMD Ryzen 9 7950X3D | |
| Intel Core i7-14700K | |
| Intel Core i9-14900K | |
* ... daha küçük daha iyidir
Cinebench R15 Çoklu Döngü
Önceki modellerde olduğu gibi Core Ultra 9 285K da kutusunda bir CPU soğutucusuyla birlikte gelmiyor. Intel, LGA 1700 için tasarlanan soğutucuların LGA 1851 ile uyumlu olması gerektiğini söylüyor. Thermaltake TH420 V2 Ultra EX ARGB hepsi bir arada soğutucumuzu LGA 1700 soketi için tasarlanan aynı montaj braketlerini kullanarak monte ederken herhangi bir sorun yaşamadık.
Bununla birlikte, paketin güneybatısındaki Compute karosunun varlığını hesaba katan LGA 1851'e özgü yeni soğutucular görmeyi bekleyin. Arrow Lake-S için tasarlanmış soğutucular biraz daha iyi soğutma performansı sunabilir, ancak mevcut LGA 1700 çözümünüz gayet iyi çalışacaktır.
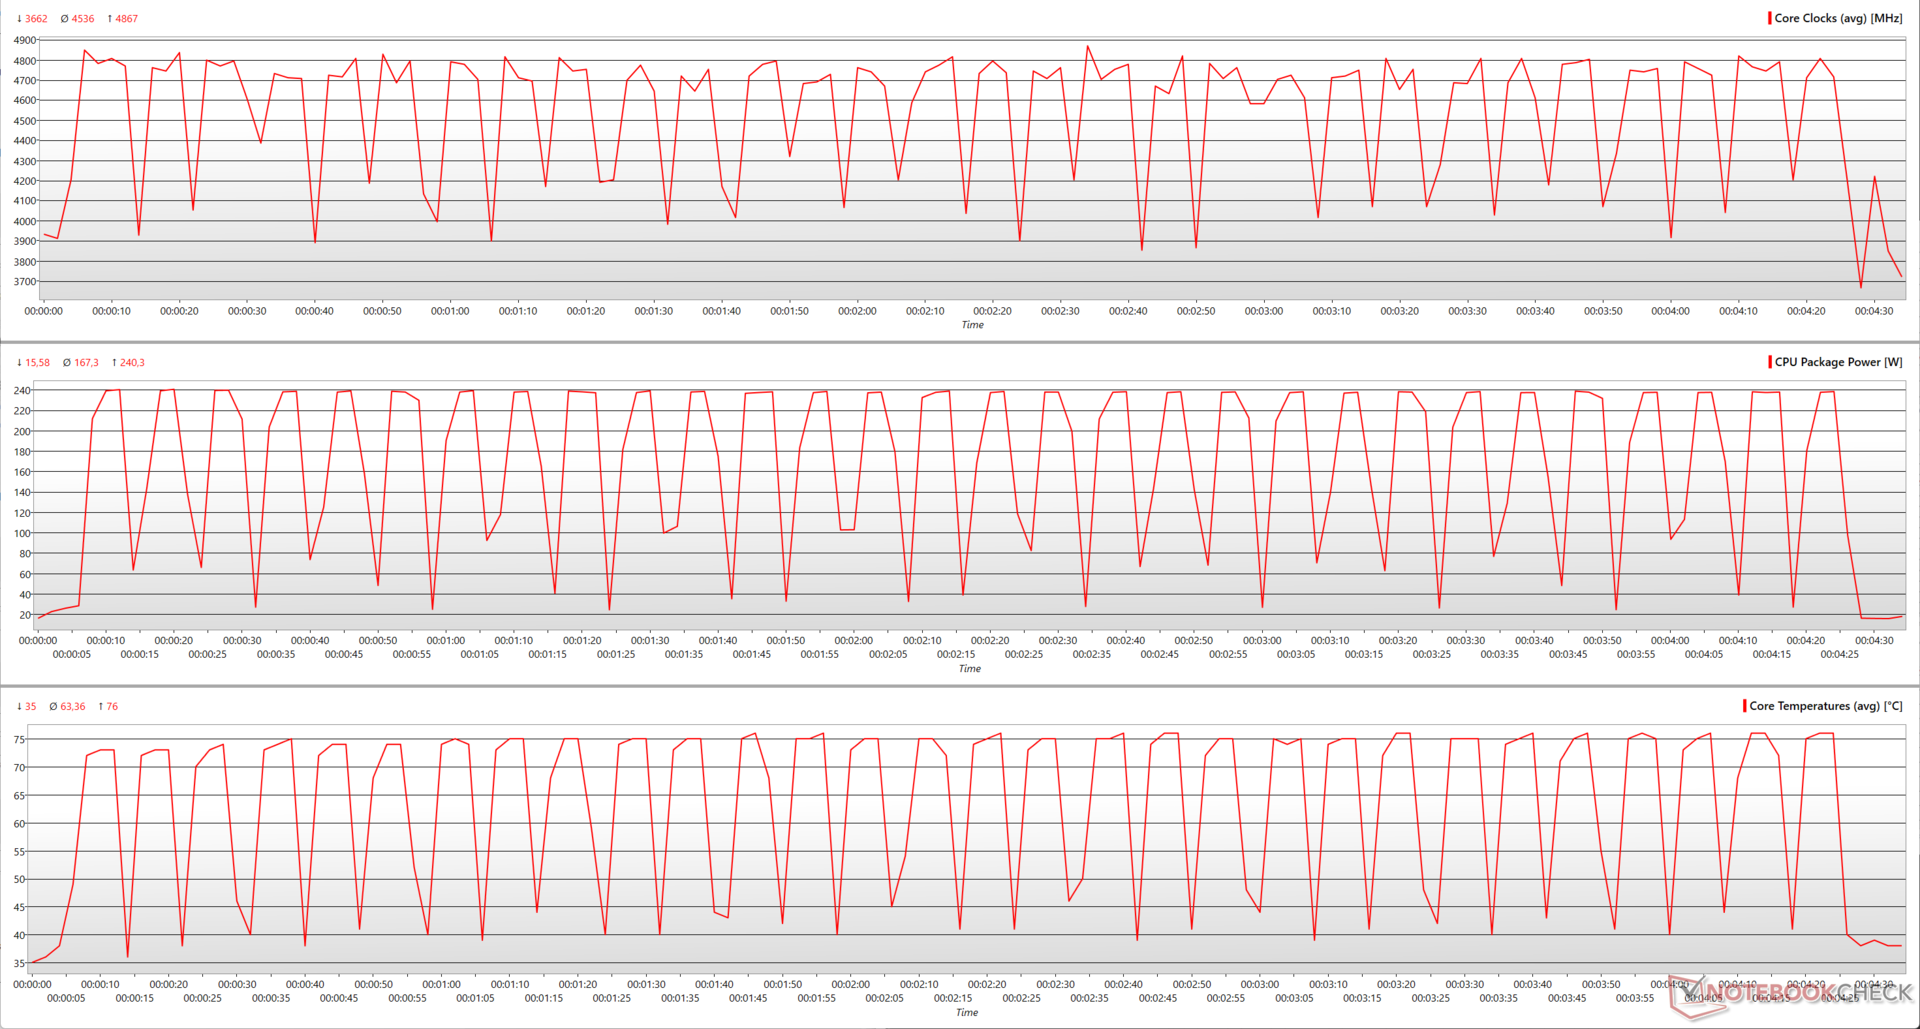
TH420 V2 Ultra EX'in Core Ultra 9 285K'yı verimli bir şekilde soğutma yeteneği, aşağıdaki Cinebench R15 çok çekirdekli döngüdeki tutarlı performanstan anlaşılmaktadır.
Core Ultra 9 285K'nın Cinebench R15 çoklu çekirdek döngüsü sırasında 4,86 GHz'e kadar yükselebildiğini ve ortalama saatlerin 4,53 GHz'de seyrettiğini görüyoruz.
Bu performans 240 W paket güç tüketimi ve 76 °C maksimum çekirdek sıcaklığı ile elde edilmektedir ki bu değerler Core i9-14900K'nin 349 W ve 87 °C değerlerinden önemli ölçüde daha düşüktür. Aslında Core i7-14700K bile 313 W paket gücü ve 92 °C çekirdek sıcaklığı ile daha yüksek rakamlar göstermektedir.
Ortalama olarak, Core Ultra 9 285K 167 W paket gücü ve 63 °C çekirdek sıcaklığını korur; bunların her ikisi de Core i7-14700K'nın 195 W ve 76 °C'lik ilgili değerlerinden daha düşüktür.
Sistem performansı: Core i9-14900K ve AMD Zen 5 ile aynı ligde
Core Ultra 9 285K'nın genel sistem performansı, Core i9-14900K ve Ryzen 9 9950X ile karşılaştırılabilir ve bu iki modelde gördüğümüzden çok farklı değil Ryzen 9 7950X, Core i9-13900Kve Ryzen 9 9900X.
Bununla birlikte, bireysel kıyaslamalar 3DMark Time Spy CPU, 3DMark 11 Performance Physics ve CrossMark'ta Core i9-14900K ile biraz daha iyi kazanımlar gösteriyor. PCMark 10 genel olarak Core Ultra 9 285K'yı Core i9-14900K'nın biraz önüne geçiriyor ama çoğunlukla AMD Zen 5 ile aynı seviyede.
AMD CPU'lar, Core Ultra 9 285K'nın algılanabilir bir liderliği yönettiği CPU PhotoWorxx dışında AIDA64 CPU testlerinde özel bir avantaja sahip.
Bununla birlikte, düzenli üretkenlik görevleri günlük kullanımda hiçbir sorunla karşılaşmaz.
3DMark 11: 1280x720 Performance Physics
3DMark: 1920x1080 Fire Strike Physics | 2560x1440 Time Spy CPU
CrossMark: Overall | Responsiveness | Creativity | Productivity
PCMark 10: Score | Essentials | Productivity | Digital Content Creation
AIDA64: FP32 Ray-Trace | FPU Julia | CPU SHA3 | CPU Queen | FPU SinJulia | FPU Mandel | CPU AES | CPU ZLib | FP64 Ray-Trace | CPU PhotoWorxx
| System Performance Rating | |
| AMD Ryzen 9 9950X | |
| Intel Core i9-14900K | |
| Intel Core Ultra 9 285K | |
| AMD Ryzen 9 7950X | |
| AMD Ryzen 9 9900X | |
| Intel Core i9-13900K | |
| AMD Ryzen 9 7950X3D -2! | |
| Intel Core i7-14700K | |
| AMD Ryzen 9 7900X | |
| AMD Ryzen 7 9700X | |
| Intel Core i5-14600K | |
| AMD Ryzen 7 7800X3D | |
| Intel Core i5-13600K | |
| AMD Ryzen 5 9600X | |
| Intel Core Ultra 5 245K | |
| Intel Core i9-12900K -4! | |
| Intel Core i5-12600K -4! | |
| 3DMark 11 / Performance Physics | |
| AMD Ryzen 9 9950X | |
| AMD Ryzen 9 7950X3D | |
| AMD Ryzen 7 7800X3D | |
| Intel Core i7-14700K | |
| Intel Core i9-13900K | |
| Intel Core i9-14900K | |
| Intel Core i5-14600K | |
| Intel Core Ultra 9 285K | |
| AMD Ryzen 7 9700X | |
| Intel Core i5-13600K | |
| AMD Ryzen 9 9900X | |
| AMD Ryzen 9 7900X | |
| AMD Ryzen 9 7950X | |
| Intel Core i9-12900K | |
| Intel Core Ultra 5 245K | |
| AMD Ryzen 5 9600X | |
| Intel Core i5-12600K | |
| 3DMark / Fire Strike Physics | |
| Intel Core i9-14900K | |
| Intel Core i9-13900K | |
| Intel Core Ultra 9 285K | |
| AMD Ryzen 9 9950X | |
| Intel Core i7-14700K | |
| AMD Ryzen 9 7950X3D | |
| AMD Ryzen 9 9900X | |
| AMD Ryzen 9 7900X | |
| AMD Ryzen 9 7950X | |
| Intel Core i5-14600K | |
| Intel Core i9-12900K | |
| Intel Core Ultra 5 245K | |
| AMD Ryzen 7 9700X | |
| Intel Core i5-13600K | |
| AMD Ryzen 5 9600X | |
| AMD Ryzen 7 7800X3D | |
| Intel Core i5-12600K | |
| 3DMark / Time Spy CPU | |
| Intel Core i9-14900K | |
| Intel Core i7-14700K | |
| Intel Core i9-13900K | |
| Intel Core i5-14600K | |
| Intel Core i9-12900K | |
| Intel Core Ultra 9 285K | |
| AMD Ryzen 9 7950X3D | |
| Intel Core i5-13600K | |
| AMD Ryzen 9 7900X | |
| AMD Ryzen 9 7950X | |
| AMD Ryzen 9 9950X | |
| AMD Ryzen 9 9900X | |
| Intel Core Ultra 5 245K | |
| AMD Ryzen 7 9700X | |
| AMD Ryzen 7 7800X3D | |
| Intel Core i5-12600K | |
| AMD Ryzen 5 9600X | |
| CrossMark / Overall | |
| Intel Core i9-14900K | |
| Intel Core i9-13900K | |
| Intel Core Ultra 9 285K | |
| AMD Ryzen 9 7950X | |
| AMD Ryzen 9 9950X | |
| AMD Ryzen 9 7900X | |
| Intel Core i5-14600K | |
| AMD Ryzen 9 9900X | |
| Intel Core i7-14700K | |
| Intel Core i5-13600K | |
| Intel Core Ultra 5 245K | |
| AMD Ryzen 7 7800X3D | |
| AMD Ryzen 9 7950X3D | |
| AMD Ryzen 7 9700X | |
| AMD Ryzen 5 9600X | |
| CrossMark / Responsiveness | |
| Intel Core i9-13900K | |
| Intel Core i9-14900K | |
| Intel Core Ultra 9 285K | |
| Intel Core i5-13600K | |
| AMD Ryzen 9 7950X | |
| AMD Ryzen 9 7900X | |
| Intel Core Ultra 5 245K | |
| Intel Core i5-14600K | |
| AMD Ryzen 7 7800X3D | |
| Intel Core i7-14700K | |
| AMD Ryzen 9 9950X | |
| AMD Ryzen 9 7950X3D | |
| AMD Ryzen 9 9900X | |
| AMD Ryzen 7 9700X | |
| AMD Ryzen 5 9600X | |
| CrossMark / Creativity | |
| AMD Ryzen 9 9950X | |
| Intel Core i9-14900K | |
| AMD Ryzen 9 7950X | |
| Intel Core i9-13900K | |
| Intel Core Ultra 9 285K | |
| AMD Ryzen 9 9900X | |
| AMD Ryzen 9 7900X | |
| Intel Core i7-14700K | |
| AMD Ryzen 7 9700X | |
| Intel Core i5-14600K | |
| AMD Ryzen 9 7950X3D | |
| AMD Ryzen 5 9600X | |
| AMD Ryzen 7 7800X3D | |
| Intel Core i5-13600K | |
| Intel Core Ultra 5 245K | |
| CrossMark / Productivity | |
| Intel Core i9-14900K | |
| Intel Core i9-13900K | |
| Intel Core Ultra 9 285K | |
| AMD Ryzen 9 7950X | |
| AMD Ryzen 9 7900X | |
| AMD Ryzen 9 9950X | |
| Intel Core Ultra 5 245K | |
| Intel Core i5-14600K | |
| Intel Core i5-13600K | |
| Intel Core i7-14700K | |
| AMD Ryzen 7 7800X3D | |
| AMD Ryzen 9 9900X | |
| AMD Ryzen 7 9700X | |
| AMD Ryzen 9 7950X3D | |
| AMD Ryzen 5 9600X | |
| PCMark 10 / Score | |
| AMD Ryzen 7 9700X | |
| AMD Ryzen 9 9950X | |
| AMD Ryzen 9 9900X | |
| Intel Core Ultra 9 285K | |
| Intel Core i9-14900K | |
| AMD Ryzen 5 9600X | |
| AMD Ryzen 9 7900X | |
| AMD Ryzen 9 7950X | |
| Intel Core i9-13900K | |
| Intel Core i7-14700K | |
| Intel Core i5-14600K | |
| AMD Ryzen 7 7800X3D | |
| Intel Core Ultra 5 245K | |
| Intel Core i5-13600K | |
| Intel Core i9-12900K | |
| Intel Core i5-12600K | |
| PCMark 10 / Essentials | |
| Intel Core i9-13900K | |
| AMD Ryzen 9 7900X | |
| AMD Ryzen 9 7950X | |
| AMD Ryzen 7 9700X | |
| Intel Core i9-14900K | |
| Intel Core i5-13600K | |
| AMD Ryzen 9 9900X | |
| AMD Ryzen 9 7950X3D | |
| AMD Ryzen 5 9600X | |
| AMD Ryzen 9 9950X | |
| Intel Core i7-14700K | |
| Intel Core Ultra 9 285K | |
| Intel Core i5-14600K | |
| AMD Ryzen 7 7800X3D | |
| Intel Core Ultra 5 245K | |
| Intel Core i9-12900K | |
| Intel Core i5-12600K | |
| PCMark 10 / Productivity | |
| AMD Ryzen 9 9900X | |
| AMD Ryzen 5 9600X | |
| AMD Ryzen 9 9950X | |
| AMD Ryzen 7 9700X | |
| AMD Ryzen 9 7950X3D | |
| Intel Core Ultra 9 285K | |
| AMD Ryzen 7 7800X3D | |
| Intel Core i5-14600K | |
| Intel Core i7-14700K | |
| AMD Ryzen 9 7900X | |
| AMD Ryzen 9 7950X | |
| Intel Core i9-14900K | |
| Intel Core i5-13600K | |
| Intel Core i9-13900K | |
| Intel Core Ultra 5 245K | |
| Intel Core i5-12600K | |
| Intel Core i9-12900K | |
| PCMark 10 / Digital Content Creation | |
| Intel Core Ultra 9 285K | |
| AMD Ryzen 9 9950X | |
| AMD Ryzen 9 9900X | |
| AMD Ryzen 7 9700X | |
| Intel Core i9-14900K | |
| Intel Core Ultra 5 245K | |
| AMD Ryzen 5 9600X | |
| Intel Core i7-14700K | |
| AMD Ryzen 9 7900X | |
| AMD Ryzen 9 7950X | |
| Intel Core i9-13900K | |
| Intel Core i5-14600K | |
| AMD Ryzen 7 7800X3D | |
| Intel Core i5-13600K | |
| Intel Core i9-12900K | |
| Intel Core i5-12600K | |
| AIDA64 / FP32 Ray-Trace | |
| AMD Ryzen 9 9950X | |
| AMD Ryzen 9 9900X | |
| AMD Ryzen 9 7950X | |
| AMD Ryzen 9 7950X3D | |
| Intel Core Ultra 9 285K | |
| AMD Ryzen 7 9700X | |
| Intel Core i9-14900K | |
| Intel Core i9-13900K | |
| AMD Ryzen 5 9600X | |
| AMD Ryzen 9 7900X | |
| Intel Core i7-14700K | |
| AMD Ryzen 7 7800X3D | |
| Intel Core i5-14600K | |
| Intel Core i5-13600K | |
| Intel Core Ultra 5 245K | |
| Intel Core i9-12900K | |
| Intel Core i5-12600K | |
| AIDA64 / FPU Julia | |
| AMD Ryzen 9 7950X3D | |
| AMD Ryzen 9 9950X | |
| AMD Ryzen 9 7950X | |
| Intel Core Ultra 9 285K | |
| AMD Ryzen 9 7900X | |
| AMD Ryzen 9 9900X | |
| Intel Core i9-14900K | |
| Intel Core i9-13900K | |
| Intel Core i7-14700K | |
| AMD Ryzen 7 7800X3D | |
| AMD Ryzen 7 9700X | |
| Intel Core i5-14600K | |
| Intel Core i5-13600K | |
| AMD Ryzen 5 9600X | |
| Intel Core Ultra 5 245K | |
| Intel Core i9-12900K | |
| Intel Core i5-12600K | |
| AIDA64 / CPU SHA3 | |
| AMD Ryzen 9 7950X3D | |
| Intel Core Ultra 9 285K | |
| AMD Ryzen 9 9950X | |
| AMD Ryzen 9 7950X | |
| Intel Core i9-13900K | |
| Intel Core i9-14900K | |
| AMD Ryzen 9 9900X | |
| Intel Core i7-14700K | |
| AMD Ryzen 9 7900X | |
| Intel Core i5-14600K | |
| AMD Ryzen 7 9700X | |
| AMD Ryzen 7 7800X3D | |
| Intel Core i5-13600K | |
| Intel Core i9-12900K | |
| Intel Core Ultra 5 245K | |
| AMD Ryzen 5 9600X | |
| Intel Core i5-12600K | |
| AIDA64 / CPU Queen | |
| AMD Ryzen 9 7950X | |
| AMD Ryzen 9 7950X3D | |
| AMD Ryzen 9 9950X | |
| AMD Ryzen 9 7900X | |
| Intel Core i7-14700K | |
| Intel Core i9-14900K | |
| Intel Core i9-13900K | |
| AMD Ryzen 9 9900X | |
| Intel Core Ultra 9 285K | |
| Intel Core i5-14600K | |
| AMD Ryzen 7 7800X3D | |
| Intel Core i5-13600K | |
| AMD Ryzen 7 9700X | |
| Intel Core i9-12900K | |
| AMD Ryzen 5 9600X | |
| Intel Core i5-12600K | |
| Intel Core Ultra 5 245K | |
| AIDA64 / FPU SinJulia | |
| AMD Ryzen 9 9950X | |
| AMD Ryzen 9 7950X | |
| AMD Ryzen 9 7950X3D | |
| AMD Ryzen 9 9900X | |
| AMD Ryzen 9 7900X | |
| Intel Core i9-14900K | |
| Intel Core i9-13900K | |
| Intel Core i7-14700K | |
| AMD Ryzen 7 9700X | |
| AMD Ryzen 7 7800X3D | |
| Intel Core Ultra 9 285K | |
| Intel Core i9-12900K | |
| AMD Ryzen 5 9600X | |
| Intel Core i5-14600K | |
| Intel Core i5-13600K | |
| Intel Core i5-12600K | |
| Intel Core Ultra 5 245K | |
| AIDA64 / FPU Mandel | |
| AMD Ryzen 9 7950X3D | |
| AMD Ryzen 9 9950X | |
| AMD Ryzen 9 7950X | |
| Intel Core Ultra 9 285K | |
| AMD Ryzen 9 7900X | |
| AMD Ryzen 9 9900X | |
| Intel Core i9-14900K | |
| Intel Core i9-13900K | |
| Intel Core i7-14700K | |
| AMD Ryzen 7 7800X3D | |
| AMD Ryzen 7 9700X | |
| Intel Core i5-14600K | |
| Intel Core i5-13600K | |
| AMD Ryzen 5 9600X | |
| Intel Core Ultra 5 245K | |
| Intel Core i9-12900K | |
| Intel Core i5-12600K | |
| AIDA64 / CPU AES | |
| AMD Ryzen 9 9900X | |
| AMD Ryzen 9 7950X | |
| AMD Ryzen 9 7950X3D | |
| AMD Ryzen 7 9700X | |
| Intel Core i9-14900K | |
| Intel Core i9-13900K | |
| AMD Ryzen 9 7900X | |
| AMD Ryzen 5 9600X | |
| Intel Core Ultra 9 285K | |
| Intel Core i5-14600K | |
| AMD Ryzen 7 7800X3D | |
| Intel Core i5-13600K | |
| AMD Ryzen 9 9950X | |
| Intel Core i7-14700K | |
| Intel Core i9-12900K | |
| Intel Core Ultra 5 245K | |
| Intel Core i5-12600K | |
| AIDA64 / CPU ZLib | |
| AMD Ryzen 9 9950X | |
| Intel Core i9-14900K | |
| Intel Core i9-13900K | |
| AMD Ryzen 9 7950X | |
| Intel Core Ultra 9 285K | |
| AMD Ryzen 9 7950X3D | |
| Intel Core i7-14700K | |
| AMD Ryzen 9 9900X | |
| AMD Ryzen 9 7900X | |
| Intel Core i9-12900K | |
| Intel Core i5-14600K | |
| Intel Core i5-13600K | |
| AMD Ryzen 7 9700X | |
| AMD Ryzen 7 7800X3D | |
| AMD Ryzen 5 9600X | |
| Intel Core i5-12600K | |
| Intel Core Ultra 5 245K | |
| AIDA64 / FP64 Ray-Trace | |
| AMD Ryzen 9 9950X | |
| AMD Ryzen 9 9900X | |
| AMD Ryzen 9 7950X | |
| AMD Ryzen 9 7950X3D | |
| Intel Core Ultra 9 285K | |
| AMD Ryzen 7 9700X | |
| Intel Core i9-14900K | |
| Intel Core i9-13900K | |
| AMD Ryzen 5 9600X | |
| AMD Ryzen 9 7900X | |
| Intel Core i7-14700K | |
| AMD Ryzen 7 7800X3D | |
| Intel Core i5-14600K | |
| Intel Core i5-13600K | |
| Intel Core Ultra 5 245K | |
| Intel Core i9-12900K | |
| Intel Core i5-12600K | |
| AIDA64 / CPU PhotoWorxx | |
| Intel Core i9-14900K | |
| Intel Core i5-14600K | |
| Intel Core Ultra 9 285K | |
| Intel Core i7-14700K | |
| AMD Ryzen 9 7950X3D | |
| Intel Core i9-13900K | |
| Intel Core i5-12600K | |
| Intel Core i5-13600K | |
| AMD Ryzen 9 9900X | |
| Intel Core i9-12900K | |
| AMD Ryzen 9 9950X | |
| AMD Ryzen 7 7800X3D | |
| AMD Ryzen 9 7950X | |
| AMD Ryzen 9 7900X | |
| AMD Ryzen 7 9700X | |
| AMD Ryzen 5 9600X | |
| Intel Core Ultra 5 245K | |
3DMark 11: 1280x720 Performance Physics
3DMark: 1920x1080 Fire Strike Physics | 2560x1440 Time Spy CPU
CrossMark: Overall | Responsiveness | Creativity | Productivity
PCMark 10: Score | Essentials | Productivity | Digital Content Creation
AIDA64: FP32 Ray-Trace | FPU Julia | CPU SHA3 | CPU Queen | FPU SinJulia | FPU Mandel | CPU AES | CPU ZLib | FP64 Ray-Trace | CPU PhotoWorxx
| PCMark 10 Score | 10514 puan | |
Yardım | ||
Intel, Arrow Lake-S ile kökten yeni bir Hesaplama karosu tasarımını tercih etti. Artık P-çekirdekleri ve E-çekirdekleri kendi önbelleklerine sahip kendi bitişik bloklarında değil. Bunun yerine E-çekirdekler, karonun köşelerindeki P-çekirdeklerin arasında dörtlü kümeler halinde dağıtılıyor.
Tüm çekirdekler artık karonun ortasından geçen birleşik bir L3 önbelleği ve birleşik bir halka veri yolunu paylaşmaktadır. Bu tasarım teorik olarak verilerin çekirdekler arasında daha hızlı taşınmasına ve ayrıca ısının bir veya bir grup çekirdek etrafında yoğunlaşmasının önlenmesine yardımcı olacaktır.
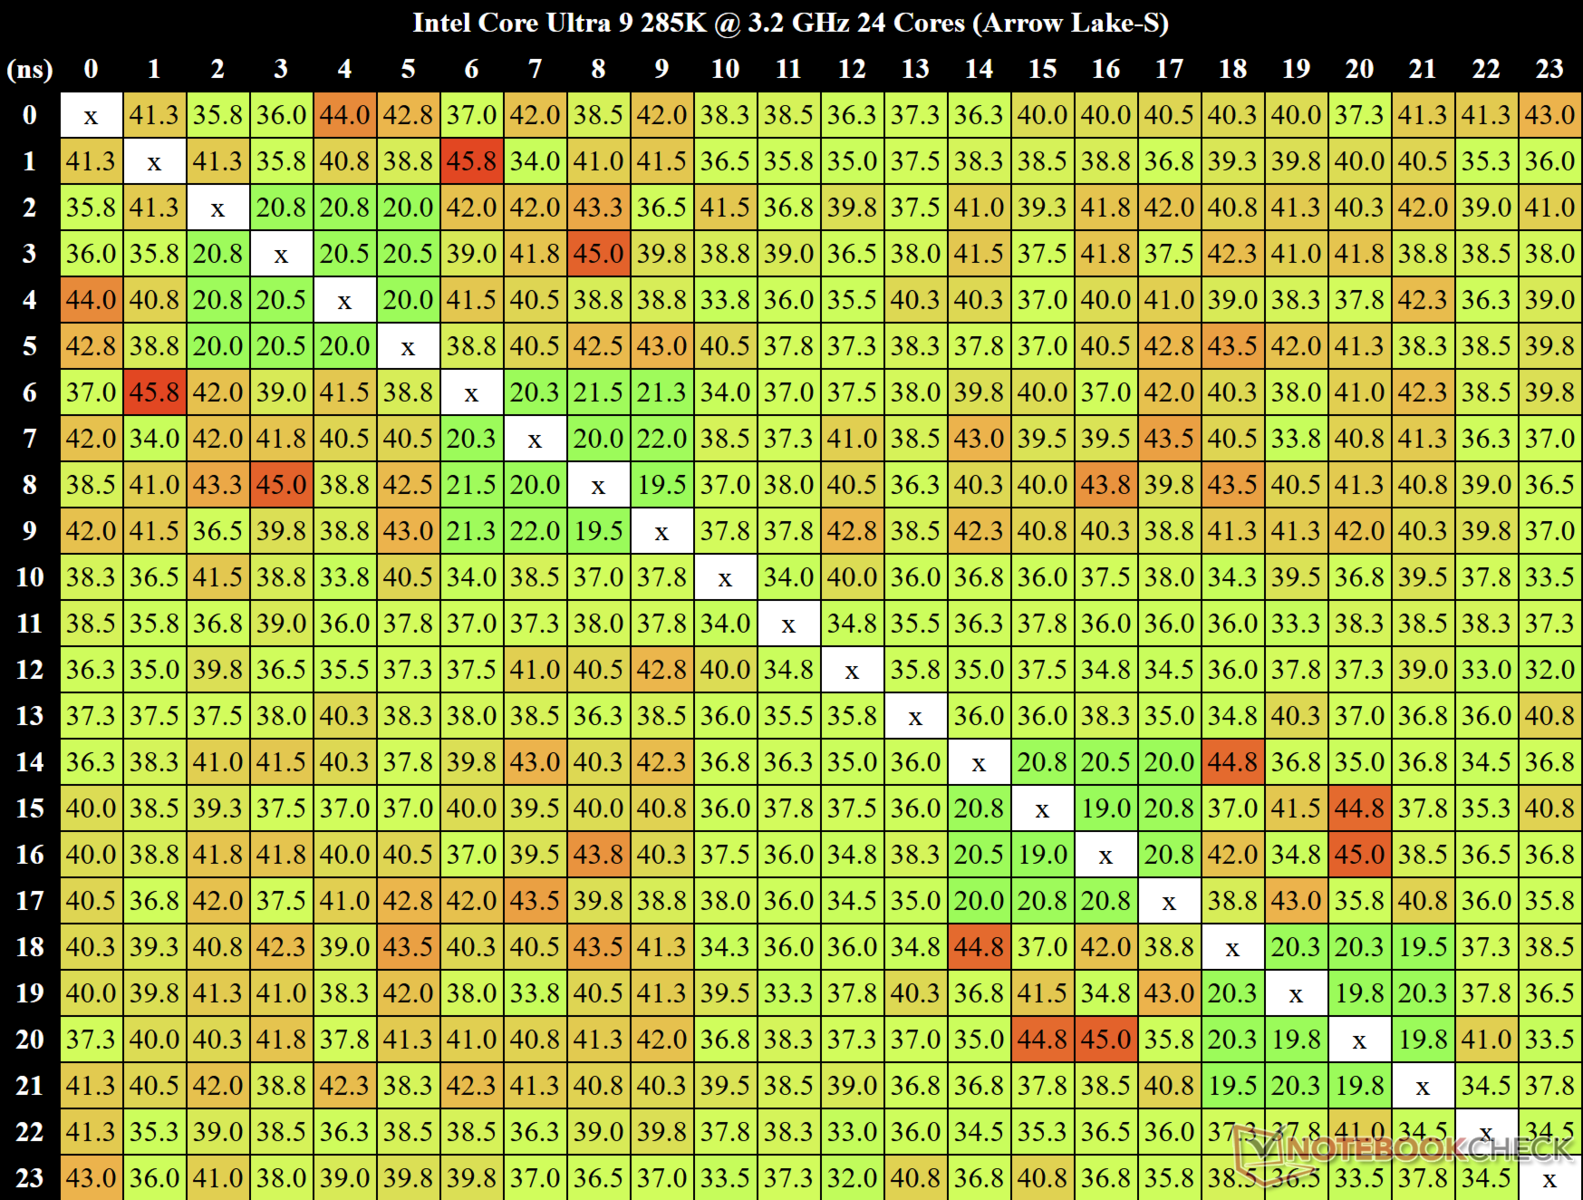
MicrobenchX kullandık çekirdekler arası gecikmeyi hesaplamak için. Çekirdekten çekirdeğe gecikme süreleri Çekirdek 2 ile Çekirdek 7 arasında 45,8 ns'ye kadar çıkmaktadır ki bu da veriler E-çekirdekten E-çekirdeğe aktarılırken olası uzun gecikme sürelerinin bir göstergesidir.
Bununla birlikte, dört E-çekirdek kümesi, bu kümeler içinde veri aktarımı için 19 ns ila 21,3 ns aralığında minimum gecikme gösteriyor gibi görünmektedir.
Genel medyan çekirdekten çekirdeğe gecikme süresi 38,25 ns olarak ölçülmüştür.
| AIDA64 Memory Performance Rating - Percent | |
| Intel Core i9-12900K -1! | |
| Intel Core i9-14900K | |
| Intel Core i7-14700K | |
| Intel Core i5-12600K -1! | |
| Intel Core i5-14600K | |
| Intel Core Ultra 9 285K | |
| AMD Ryzen 9 7950X3D | |
| AMD Ryzen 9 7950X | |
| AMD Ryzen 9 9950X | |
| Intel Core i9-13900K | |
| AMD Ryzen 9 9900X | |
| AMD Ryzen 9 7900X | |
| AMD Ryzen 7 7800X3D | |
| Intel Core i5-13600K | |
| AMD Ryzen 7 9700X | |
| AMD Ryzen 5 9600X | |
| Intel Core Ultra 5 245K | |
| AIDA64 | |
| Memory Copy | |
| Intel Core Ultra 9 285K | |
| Intel Core i9-14900K | |
| Intel Core i7-14700K | |
| Intel Core i5-14600K | |
| Intel Core i9-13900K | |
| AMD Ryzen 9 7950X3D | |
| Intel Core i9-12900K | |
| AMD Ryzen 9 7950X | |
| Intel Core i5-13600K | |
| Intel Core i5-12600K | |
| AMD Ryzen 9 9950X | |
| AMD Ryzen 9 9900X | |
| AMD Ryzen 9 7900X | |
| AMD Ryzen 7 7800X3D | |
| Intel Core Ultra 5 245K | |
| AMD Ryzen 7 9700X | |
| AMD Ryzen 5 9600X | |
| Memory Latency | |
| Intel Core Ultra 5 245K | |
| Intel Core Ultra 9 285K | |
| Intel Core i5-13600K | |
| Intel Core i9-13900K | |
| Intel Core i7-14700K | |
| Intel Core i9-14900K | |
| Intel Core i5-14600K | |
| AMD Ryzen 9 9900X | |
| AMD Ryzen 9 9950X | |
| AMD Ryzen 7 9700X | |
| AMD Ryzen 5 9600X | |
| AMD Ryzen 7 7800X3D | |
| AMD Ryzen 9 7950X3D | |
| AMD Ryzen 9 7900X | |
| AMD Ryzen 9 7950X | |
| Memory Read | |
| Intel Core i9-14900K | |
| Intel Core i7-14700K | |
| Intel Core Ultra 9 285K | |
| Intel Core i5-14600K | |
| Intel Core i9-13900K | |
| Intel Core i9-12900K | |
| AMD Ryzen 9 7950X3D | |
| AMD Ryzen 9 9900X | |
| AMD Ryzen 9 9950X | |
| AMD Ryzen 9 7950X | |
| Intel Core i5-12600K | |
| Intel Core i5-13600K | |
| AMD Ryzen 9 7900X | |
| Intel Core Ultra 5 245K | |
| AMD Ryzen 7 7800X3D | |
| AMD Ryzen 7 9700X | |
| AMD Ryzen 5 9600X | |
| Memory Write | |
| AMD Ryzen 7 7800X3D | |
| AMD Ryzen 9 7950X3D | |
| AMD Ryzen 7 9700X | |
| Intel Core Ultra 9 285K | |
| Intel Core i5-14600K | |
| Intel Core i9-14900K | |
| Intel Core i7-14700K | |
| AMD Ryzen 5 9600X | |
| AMD Ryzen 9 7950X | |
| AMD Ryzen 9 9950X | |
| AMD Ryzen 9 9900X | |
| AMD Ryzen 9 7900X | |
| Intel Core i9-13900K | |
| Intel Core i5-12600K | |
| Intel Core i9-12900K | |
| Intel Core i5-13600K | |
| Intel Core Ultra 5 245K | |
* ... daha küçük daha iyidir
3D ve oyun performansı: Arrow Lake-S büyük hayal kırıklığı yaratıyor
Hyperthreading eksikliği, Intel APO ve özellikle Skymont çekirdeklerinde artan IPC'nin avantajlarının iyi oyun kazanımlarına dönüşmesi beklenir. Hayal kırıklığına uğramaya hazır olun.
Core Ultra 9 285K nispeten daha az güç gereksinimi ile övgüye değer CPU performansı gösterirken, 3D ve oyun görevleri söz konusu olduğunda tablo tersine dönüyor.
Core Ultra 9 285K, Nvidia GeForce RTX 4090 GPU ile birlikte 3DMark 11 Performance GPU'da Ryzen 9 9900X'e göre %13, 3DMark Time Spy Graphics'te ise Ryzen 9 9950X'e göre %6'lık bir üstünlük elde etmeyi başarıyor.
Ancak sistem, 3DMark Fire Strike Graphics'te diğer Raptor Lake-S Refresh ve Zen 5 tekliflerine karşı önemli ölçüde kaybediyor ve bu da onu genel bir dezavantaja sokuyor.
| 3DMark Performance Rating - Percent | |
| Intel Core i5-14600K | |
| AMD Ryzen 7 7800X3D | |
| AMD Ryzen 5 9600X | |
| Intel Core Ultra 5 245K | |
| AMD Ryzen 7 9700X | |
| AMD Ryzen 9 7950X3D | |
| Intel Core i9-14900K | |
| Intel Core i7-14700K | |
| AMD Ryzen 9 9950X | |
| AMD Ryzen 9 9900X | |
| Intel Core Ultra 9 285K | |
| 3DMark 11 - 1280x720 Performance GPU | |
| AMD Ryzen 7 7800X3D | |
| Intel Core i5-14600K | |
| AMD Ryzen 9 7950X3D | |
| Intel Core i9-14900K | |
| Intel Core Ultra 5 245K | |
| AMD Ryzen 5 9600X | |
| Intel Core i7-14700K | |
| AMD Ryzen 9 9950X | |
| AMD Ryzen 7 9700X | |
| Intel Core Ultra 9 285K | |
| AMD Ryzen 9 9900X | |
| 3DMark | |
| 2560x1440 Time Spy Graphics | |
| Intel Core i5-14600K | |
| Intel Core i9-14900K | |
| AMD Ryzen 7 7800X3D | |
| Intel Core i7-14700K | |
| AMD Ryzen 5 9600X | |
| Intel Core Ultra 5 245K | |
| AMD Ryzen 9 7950X3D | |
| AMD Ryzen 7 9700X | |
| AMD Ryzen 9 9900X | |
| Intel Core Ultra 9 285K | |
| AMD Ryzen 9 9950X | |
| 1920x1080 Fire Strike Graphics | |
| Intel Core i5-14600K | |
| AMD Ryzen 7 9700X | |
| AMD Ryzen 5 9600X | |
| Intel Core Ultra 5 245K | |
| AMD Ryzen 9 9950X | |
| AMD Ryzen 9 9900X | |
| AMD Ryzen 7 7800X3D | |
| AMD Ryzen 9 7950X3D | |
| Intel Core i9-14900K | |
| Intel Core i7-14700K | |
| Intel Core Ultra 9 285K | |
| 3DMark 11 Performance | 62846 puan | |
| 3DMark Fire Strike Score | 44363 puan | |
| 3DMark Time Spy Score | 30904 puan | |
Yardım | ||
Benzer eğilimler oyunlarda da görülüyor. Intel'in lansmandaki iddialarının aksine, RTX 4090 ile eşleştirilmiş Core Ultra 9 285K, oyun karşılaştırma tablomuzun en altında yer alıyor, yalnızca Core i7-14700K ile eşleşiyor ve 720p Low ve 1080p Ultra'daki kümülatif oyun testlerinde Zen 5 tekliflerinin önemli ölçüde gerisinde kalıyor (%12'ye kadar).
Core Ultra 9 285K, Core i7-14700K'ya göre Far Cry 5, Dota 2 Reborn ve Metro Exodus (Enhanced Edition olmayan), ancak farklar çok küçük ve genel performans hala Core i9-14700K ve Core i9-14900K'nın oldukça gerisinde.
Hatta Core i5-14600K core Ultra 9 285K'ya kıyasla genel olarak %7'lik makul bir kazançla karşılaştırmalı olarak daha iyi bir oyun CPU'su gibi görünüyor
| Gaming Performance Rating - Percent | |
| AMD Ryzen 7 7800X3D | |
| AMD Ryzen 9 7950X3D | |
| Intel Core i9-14900K | |
| AMD Ryzen 7 9700X | |
| AMD Ryzen 9 9900X | |
| AMD Ryzen 5 9600X | |
| AMD Ryzen 9 9950X | |
| Intel Core i5-14600K | |
| Intel Core i7-14700K | |
| Intel Core Ultra 9 285K | |
| Intel Core Ultra 5 245K | |
| F1 22 | |
| 1280x720 Ultra Low Preset AA:T AF:16x | |
| AMD Ryzen 7 7800X3D | |
| Intel Core i9-14900K | |
| AMD Ryzen 9 7950X3D | |
| AMD Ryzen 9 9950X | |
| AMD Ryzen 5 9600X | |
| AMD Ryzen 7 9700X | |
| AMD Ryzen 9 9900X | |
| Intel Core i5-14600K | |
| Intel Core i7-14700K | |
| Intel Core Ultra 9 285K | |
| Intel Core Ultra 5 245K | |
| 1920x1080 Low Preset AA:T AF:16x | |
| AMD Ryzen 7 7800X3D | |
| AMD Ryzen 9 7950X3D | |
| Intel Core i9-14900K | |
| AMD Ryzen 5 9600X | |
| AMD Ryzen 9 9950X | |
| AMD Ryzen 7 9700X | |
| AMD Ryzen 9 9900X | |
| Intel Core i5-14600K | |
| Intel Core i7-14700K | |
| Intel Core Ultra 9 285K | |
| Intel Core Ultra 5 245K | |
| 1920x1080 Ultra High Preset AA:T AF:16x | |
| AMD Ryzen 7 7800X3D | |
| Intel Core i9-14900K | |
| AMD Ryzen 7 9700X | |
| Intel Core i5-14600K | |
| AMD Ryzen 9 7950X3D | |
| AMD Ryzen 5 9600X | |
| AMD Ryzen 9 9900X | |
| AMD Ryzen 9 9950X | |
| Intel Core i7-14700K | |
| Intel Core Ultra 9 285K | |
| Intel Core Ultra 5 245K | |
| Far Cry 5 | |
| 1280x720 Low Preset AA:T | |
| AMD Ryzen 7 7800X3D | |
| AMD Ryzen 9 7950X3D | |
| Intel Core i9-14900K | |
| AMD Ryzen 9 9900X | |
| AMD Ryzen 5 9600X | |
| AMD Ryzen 7 9700X | |
| Intel Core i5-14600K | |
| AMD Ryzen 9 9950X | |
| Intel Core Ultra 9 285K | |
| Intel Core Ultra 5 245K | |
| Intel Core i7-14700K | |
| 1920x1080 Ultra Preset AA:T | |
| AMD Ryzen 7 7800X3D | |
| AMD Ryzen 9 7950X3D | |
| AMD Ryzen 9 9900X | |
| Intel Core i9-14900K | |
| AMD Ryzen 5 9600X | |
| AMD Ryzen 7 9700X | |
| Intel Core i5-14600K | |
| AMD Ryzen 9 9950X | |
| Intel Core Ultra 9 285K | |
| Intel Core Ultra 5 245K | |
| Intel Core i7-14700K | |
| X-Plane 11.11 | |
| 1280x720 low (fps_test=1) | |
| AMD Ryzen 7 9700X | |
| AMD Ryzen 9 9900X | |
| AMD Ryzen 5 9600X | |
| Intel Core i9-14900K | |
| Intel Core i5-14600K | |
| Intel Core i7-14700K | |
| AMD Ryzen 9 7950X3D | |
| AMD Ryzen 7 7800X3D | |
| AMD Ryzen 9 9950X | |
| Intel Core Ultra 9 285K | |
| Intel Core Ultra 5 245K | |
| 1920x1080 high (fps_test=3) | |
| AMD Ryzen 7 7800X3D | |
| AMD Ryzen 9 7950X3D | |
| AMD Ryzen 7 9700X | |
| AMD Ryzen 9 9900X | |
| AMD Ryzen 5 9600X | |
| Intel Core i9-14900K | |
| AMD Ryzen 9 9950X | |
| Intel Core i7-14700K | |
| Intel Core i5-14600K | |
| Intel Core Ultra 9 285K | |
| Intel Core Ultra 5 245K | |
| Final Fantasy XV Benchmark | |
| 1280x720 Lite Quality | |
| AMD Ryzen 5 9600X | |
| AMD Ryzen 7 7800X3D | |
| Intel Core i5-14600K | |
| AMD Ryzen 9 9950X | |
| Intel Core i9-14900K | |
| Intel Core i7-14700K | |
| AMD Ryzen 7 9700X | |
| Intel Core Ultra 5 245K | |
| AMD Ryzen 9 9900X | |
| AMD Ryzen 9 7950X3D | |
| Intel Core Ultra 9 285K | |
| 1920x1080 High Quality | |
| Intel Core i9-14900K | |
| AMD Ryzen 7 7800X3D | |
| Intel Core i5-14600K | |
| AMD Ryzen 9 7950X3D | |
| AMD Ryzen 9 9900X | |
| AMD Ryzen 5 9600X | |
| Intel Core i7-14700K | |
| Intel Core Ultra 9 285K | |
| AMD Ryzen 7 9700X | |
| AMD Ryzen 9 9950X | |
| Intel Core Ultra 5 245K | |
| Dota 2 Reborn | |
| 1280x720 min (0/3) fastest | |
| AMD Ryzen 7 7800X3D | |
| AMD Ryzen 7 9700X | |
| AMD Ryzen 9 7950X3D | |
| AMD Ryzen 9 9900X | |
| AMD Ryzen 9 9950X | |
| Intel Core i9-14900K | |
| AMD Ryzen 5 9600X | |
| Intel Core i5-14600K | |
| Intel Core Ultra 9 285K | |
| Intel Core i7-14700K | |
| Intel Core Ultra 5 245K | |
| 1920x1080 ultra (3/3) best looking | |
| AMD Ryzen 7 7800X3D | |
| AMD Ryzen 9 7950X3D | |
| AMD Ryzen 9 9900X | |
| AMD Ryzen 9 9950X | |
| AMD Ryzen 7 9700X | |
| AMD Ryzen 5 9600X | |
| Intel Core i9-14900K | |
| Intel Core i5-14600K | |
| Intel Core Ultra 9 285K | |
| Intel Core i7-14700K | |
| Intel Core Ultra 5 245K | |
| The Witcher 3 | |
| 1024x768 Low Graphics & Postprocessing | |
| AMD Ryzen 9 7950X3D | |
| AMD Ryzen 7 7800X3D | |
| Intel Core i9-14900K | |
| AMD Ryzen 9 9950X | |
| AMD Ryzen 5 9600X | |
| AMD Ryzen 7 9700X | |
| AMD Ryzen 9 9900X | |
| Intel Core i7-14700K | |
| Intel Core i5-14600K | |
| Intel Core Ultra 9 285K | |
| Intel Core Ultra 5 245K | |
| 1920x1080 Ultra Graphics & Postprocessing (HBAO+) | |
| Intel Core i5-14600K | |
| AMD Ryzen 7 7800X3D | |
| Intel Core i9-14900K | |
| Intel Core Ultra 5 245K | |
| AMD Ryzen 9 7950X3D | |
| Intel Core Ultra 9 285K | |
| Intel Core i7-14700K | |
| AMD Ryzen 5 9600X | |
| AMD Ryzen 9 9950X | |
| AMD Ryzen 7 9700X | |
| AMD Ryzen 9 9900X | |
| GTA V | |
| 1024x768 Lowest Settings possible | |
| AMD Ryzen 7 7800X3D | |
| AMD Ryzen 5 9600X | |
| AMD Ryzen 9 7950X3D | |
| Intel Core i9-14900K | |
| AMD Ryzen 7 9700X | |
| AMD Ryzen 9 9900X | |
| Intel Core i5-14600K | |
| Intel Core Ultra 5 245K | |
| Intel Core i7-14700K | |
| AMD Ryzen 9 9950X | |
| Intel Core Ultra 9 285K | |
| 1920x1080 Highest Settings possible AA:4xMSAA + FX AF:16x | |
| AMD Ryzen 7 7800X3D | |
| Intel Core i9-14900K | |
| AMD Ryzen 9 9900X | |
| AMD Ryzen 7 9700X | |
| AMD Ryzen 5 9600X | |
| AMD Ryzen 9 9950X | |
| Intel Core i5-14600K | |
| Intel Core Ultra 9 285K | |
| AMD Ryzen 9 7950X3D | |
| Intel Core i7-14700K | |
| Intel Core Ultra 5 245K | |
| Borderlands 3 | |
| 1280x720 Very Low Overall Quality (DX11) | |
| AMD Ryzen 7 7800X3D | |
| AMD Ryzen 9 7950X3D | |
| Intel Core i9-14900K | |
| AMD Ryzen 7 9700X | |
| AMD Ryzen 9 9900X | |
| AMD Ryzen 9 9950X | |
| Intel Core i5-14600K | |
| AMD Ryzen 5 9600X | |
| Intel Core i7-14700K | |
| Intel Core Ultra 9 285K | |
| Intel Core Ultra 5 245K | |
| 1920x1080 Very Low Overall Quality (DX11) | |
| AMD Ryzen 9 7950X3D | |
| AMD Ryzen 7 7800X3D | |
| Intel Core i9-14900K | |
| AMD Ryzen 9 9900X | |
| AMD Ryzen 7 9700X | |
| AMD Ryzen 9 9950X | |
| Intel Core i5-14600K | |
| AMD Ryzen 5 9600X | |
| Intel Core i7-14700K | |
| Intel Core Ultra 9 285K | |
| Intel Core Ultra 5 245K | |
| 1920x1080 Badass Overall Quality (DX11) | |
| AMD Ryzen 9 7950X3D | |
| AMD Ryzen 7 7800X3D | |
| Intel Core i9-14900K | |
| AMD Ryzen 7 9700X | |
| AMD Ryzen 9 9900X | |
| Intel Core i5-14600K | |
| AMD Ryzen 9 9950X | |
| AMD Ryzen 5 9600X | |
| Intel Core i7-14700K | |
| Intel Core Ultra 9 285K | |
| Intel Core Ultra 5 245K | |
| Shadow of the Tomb Raider | |
| 1280x720 Lowest Preset | |
| AMD Ryzen 7 7800X3D | |
| AMD Ryzen 9 7950X3D | |
| AMD Ryzen 7 9700X | |
| AMD Ryzen 9 9950X | |
| Intel Core i9-14900K | |
| AMD Ryzen 9 9900X | |
| AMD Ryzen 5 9600X | |
| Intel Core Ultra 9 285K | |
| Intel Core i5-14600K | |
| Intel Core i7-14700K | |
| Intel Core Ultra 5 245K | |
| 1920x1080 Highest Preset AA:T | |
| AMD Ryzen 7 7800X3D | |
| AMD Ryzen 9 7950X3D | |
| Intel Core i9-14900K | |
| AMD Ryzen 9 9900X | |
| AMD Ryzen 7 9700X | |
| AMD Ryzen 9 9950X | |
| AMD Ryzen 5 9600X | |
| Intel Core i5-14600K | |
| Intel Core Ultra 9 285K | |
| Intel Core i7-14700K | |
| Intel Core Ultra 5 245K | |
| Metro Exodus | |
| 1280x720 Low Quality AF:4x | |
| AMD Ryzen 7 7800X3D | |
| AMD Ryzen 7 9700X | |
| AMD Ryzen 5 9600X | |
| AMD Ryzen 9 9950X | |
| AMD Ryzen 9 9900X | |
| Intel Core i9-14900K | |
| Intel Core Ultra 9 285K | |
| Intel Core i5-14600K | |
| AMD Ryzen 9 7950X3D | |
| Intel Core i7-14700K | |
| Intel Core Ultra 5 245K | |
| 1920x1080 Ultra Quality AF:16x | |
| AMD Ryzen 7 7800X3D | |
| AMD Ryzen 5 9600X | |
| Intel Core i9-14900K | |
| AMD Ryzen 7 9700X | |
| AMD Ryzen 9 9900X | |
| AMD Ryzen 9 9950X | |
| Intel Core i5-14600K | |
| Intel Core i7-14700K | |
| Intel Core Ultra 9 285K | |
| AMD Ryzen 9 7950X3D | |
| Intel Core Ultra 5 245K | |
| F1 2021 | |
| 1280x720 Ultra Low Preset | |
| AMD Ryzen 7 7800X3D | |
| Intel Core i9-14900K | |
| AMD Ryzen 9 7950X3D | |
| AMD Ryzen 5 9600X | |
| AMD Ryzen 9 9950X | |
| AMD Ryzen 7 9700X | |
| AMD Ryzen 9 9900X | |
| Intel Core i5-14600K | |
| Intel Core i7-14700K | |
| Intel Core Ultra 9 285K | |
| Intel Core Ultra 5 245K | |
| 1920x1080 Ultra High Preset + Raytracing AA:T AF:16x | |
| AMD Ryzen 7 7800X3D | |
| Intel Core i9-14900K | |
| AMD Ryzen 7 9700X | |
| AMD Ryzen 5 9600X | |
| Intel Core i5-14600K | |
| AMD Ryzen 9 7950X3D | |
| AMD Ryzen 9 9900X | |
| AMD Ryzen 9 9950X | |
| Intel Core i7-14700K | |
| Intel Core Ultra 9 285K | |
| Intel Core Ultra 5 245K | |
QHD Ultra ve UHD Ultra gibi GPU'ya bağlı ayarlar bile Core Ultra 9 285K'ya olan sevgisini kaybetmiş görünüyor. Bununla birlikte, Core i9-14900K'ya kıyasla kümülatif performans deltası, daha CPU'ya bağlı çözünürlüklerde %15'e kıyasla bu ayarlarda artık %10'dur.
Core Ultra 9 285K'nın RTX 4090'ı darboğaza soktuğunu söylemek biraz abartılı olsa da, birincil kullanım alanınız oyun oynamaksa daha iyi (ve daha ucuz) seçenekleriniz var.
| Gaming Performance Rating - Percent | |
| AMD Ryzen 7 7800X3D | |
| AMD Ryzen 9 7950X3D | |
| Intel Core i9-14900K | |
| AMD Ryzen 7 9700X | |
| AMD Ryzen 9 9900X | |
| Intel Core i5-14600K | |
| AMD Ryzen 5 9600X | |
| AMD Ryzen 9 9950X | |
| Intel Core i7-14700K | |
| Intel Core Ultra 9 285K | |
| Intel Core Ultra 5 245K | |
| F1 22 | |
| 2560x1440 Ultra High Preset AA:T AF:16x | |
| AMD Ryzen 7 7800X3D | |
| AMD Ryzen 5 9600X | |
| Intel Core i9-14900K | |
| AMD Ryzen 9 9900X | |
| Intel Core i5-14600K | |
| AMD Ryzen 7 9700X | |
| AMD Ryzen 9 7950X3D | |
| AMD Ryzen 9 9950X | |
| Intel Core Ultra 5 245K | |
| Intel Core i7-14700K | |
| Intel Core Ultra 9 285K | |
| 3840x2160 Ultra High Preset AA:T AF:16x | |
| AMD Ryzen 9 9900X | |
| Intel Core Ultra 5 245K | |
| AMD Ryzen 5 9600X | |
| AMD Ryzen 7 9700X | |
| AMD Ryzen 7 7800X3D | |
| AMD Ryzen 9 9950X | |
| Intel Core i5-14600K | |
| Intel Core i9-14900K | |
| Intel Core Ultra 9 285K | |
| AMD Ryzen 9 7950X3D | |
| Intel Core i7-14700K | |
| Far Cry 5 | |
| 2560x1440 Ultra Preset AA:T | |
| AMD Ryzen 7 7800X3D | |
| AMD Ryzen 9 7950X3D | |
| AMD Ryzen 9 9900X | |
| Intel Core i9-14900K | |
| AMD Ryzen 5 9600X | |
| AMD Ryzen 7 9700X | |
| Intel Core i5-14600K | |
| AMD Ryzen 9 9950X | |
| Intel Core Ultra 9 285K | |
| Intel Core i7-14700K | |
| Intel Core Ultra 5 245K | |
| 3840x2160 Ultra Preset AA:T | |
| AMD Ryzen 7 7800X3D | |
| Intel Core i9-14900K | |
| AMD Ryzen 9 7950X3D | |
| Intel Core i5-14600K | |
| AMD Ryzen 5 9600X | |
| AMD Ryzen 9 9900X | |
| AMD Ryzen 9 9950X | |
| AMD Ryzen 7 9700X | |
| Intel Core Ultra 9 285K | |
| Intel Core Ultra 5 245K | |
| Intel Core i7-14700K | |
| X-Plane 11.11 - 3840x2160 high (fps_test=3) | |
| AMD Ryzen 7 7800X3D | |
| AMD Ryzen 9 7950X3D | |
| AMD Ryzen 7 9700X | |
| AMD Ryzen 5 9600X | |
| Intel Core i9-14900K | |
| AMD Ryzen 9 9900X | |
| Intel Core i7-14700K | |
| Intel Core i5-14600K | |
| AMD Ryzen 9 9950X | |
| Intel Core Ultra 9 285K | |
| Intel Core Ultra 5 245K | |
| Final Fantasy XV Benchmark | |
| 2560x1440 High Quality | |
| AMD Ryzen 7 7800X3D | |
| Intel Core i9-14900K | |
| Intel Core i5-14600K | |
| AMD Ryzen 9 7950X3D | |
| AMD Ryzen 9 9950X | |
| Intel Core Ultra 9 285K | |
| Intel Core i7-14700K | |
| AMD Ryzen 5 9600X | |
| Intel Core Ultra 5 245K | |
| AMD Ryzen 7 9700X | |
| AMD Ryzen 9 9900X | |
| 3840x2160 High Quality | |
| Intel Core Ultra 5 245K | |
| Intel Core i9-14900K | |
| Intel Core i5-14600K | |
| Intel Core i7-14700K | |
| AMD Ryzen 7 7800X3D | |
| AMD Ryzen 9 7950X3D | |
| Intel Core Ultra 9 285K | |
| AMD Ryzen 9 9950X | |
| AMD Ryzen 9 9900X | |
| AMD Ryzen 5 9600X | |
| AMD Ryzen 7 9700X | |
| Dota 2 Reborn - 3840x2160 ultra (3/3) best looking | |
| AMD Ryzen 7 7800X3D | |
| AMD Ryzen 9 7950X3D | |
| AMD Ryzen 9 9950X | |
| AMD Ryzen 7 9700X | |
| AMD Ryzen 9 9900X | |
| Intel Core i9-14900K | |
| AMD Ryzen 5 9600X | |
| Intel Core i5-14600K | |
| Intel Core i7-14700K | |
| Intel Core Ultra 9 285K | |
| Intel Core Ultra 5 245K | |
| The Witcher 3 - 3840x2160 Ultra Graphics & Postprocessing (HBAO+) | |
| Intel Core i9-14900K | |
| Intel Core Ultra 5 245K | |
| AMD Ryzen 7 7800X3D | |
| Intel Core i5-14600K | |
| AMD Ryzen 9 7950X3D | |
| AMD Ryzen 5 9600X | |
| Intel Core i7-14700K | |
| Intel Core Ultra 9 285K | |
| AMD Ryzen 7 9700X | |
| AMD Ryzen 9 9900X | |
| AMD Ryzen 9 9950X | |
| GTA V | |
| 2560x1440 Highest Settings possible AA:4xMSAA + FX AF:16x | |
| AMD Ryzen 7 7800X3D | |
| Intel Core i9-14900K | |
| AMD Ryzen 9 9900X | |
| AMD Ryzen 7 9700X | |
| AMD Ryzen 5 9600X | |
| AMD Ryzen 9 9950X | |
| Intel Core i5-14600K | |
| AMD Ryzen 9 7950X3D | |
| Intel Core Ultra 9 285K | |
| Intel Core Ultra 5 245K | |
| Intel Core i7-14700K | |
| 3840x2160 Highest Settings possible AA:4xMSAA + FX AF:16x | |
| AMD Ryzen 7 7800X3D | |
| Intel Core i9-14900K | |
| Intel Core i5-14600K | |
| AMD Ryzen 9 9900X | |
| AMD Ryzen 5 9600X | |
| AMD Ryzen 7 9700X | |
| AMD Ryzen 9 7950X3D | |
| Intel Core Ultra 9 285K | |
| Intel Core Ultra 5 245K | |
| Intel Core i7-14700K | |
| AMD Ryzen 9 9950X | |
| Borderlands 3 | |
| 2560x1440 Badass Overall Quality (DX11) | |
| AMD Ryzen 7 7800X3D | |
| AMD Ryzen 9 7950X3D | |
| Intel Core i9-14900K | |
| AMD Ryzen 7 9700X | |
| AMD Ryzen 9 9900X | |
| Intel Core i5-14600K | |
| AMD Ryzen 9 9950X | |
| Intel Core i7-14700K | |
| AMD Ryzen 5 9600X | |
| Intel Core Ultra 9 285K | |
| Intel Core Ultra 5 245K | |
| 3840x2160 Badass Overall Quality (DX11) | |
| Intel Core i9-14900K | |
| AMD Ryzen 7 7800X3D | |
| AMD Ryzen 9 7950X3D | |
| Intel Core i5-14600K | |
| Intel Core i7-14700K | |
| AMD Ryzen 9 9900X | |
| AMD Ryzen 5 9600X | |
| AMD Ryzen 7 9700X | |
| AMD Ryzen 9 9950X | |
| Intel Core Ultra 9 285K | |
| Intel Core Ultra 5 245K | |
| Shadow of the Tomb Raider | |
| 2560x1440 Highest Preset AA:T | |
| AMD Ryzen 7 7800X3D | |
| AMD Ryzen 9 7950X3D | |
| Intel Core i9-14900K | |
| AMD Ryzen 9 9900X | |
| AMD Ryzen 9 9950X | |
| AMD Ryzen 7 9700X | |
| AMD Ryzen 5 9600X | |
| Intel Core i5-14600K | |
| Intel Core i7-14700K | |
| Intel Core Ultra 9 285K | |
| Intel Core Ultra 5 245K | |
| 3840x2160 Highest Preset AA:T | |
| Intel Core i9-14900K | |
| Intel Core i5-14600K | |
| AMD Ryzen 5 9600X | |
| AMD Ryzen 7 7800X3D | |
| AMD Ryzen 9 7950X3D | |
| Intel Core Ultra 5 245K | |
| AMD Ryzen 9 9900X | |
| AMD Ryzen 7 9700X | |
| Intel Core i7-14700K | |
| Intel Core Ultra 9 285K | |
| AMD Ryzen 9 9950X | |
| Metro Exodus | |
| 2560x1440 Ultra Quality AF:16x | |
| AMD Ryzen 7 7800X3D | |
| Intel Core i9-14900K | |
| AMD Ryzen 5 9600X | |
| AMD Ryzen 7 9700X | |
| Intel Core i5-14600K | |
| AMD Ryzen 9 9900X | |
| Intel Core i7-14700K | |
| AMD Ryzen 9 9950X | |
| AMD Ryzen 9 7950X3D | |
| Intel Core Ultra 9 285K | |
| Intel Core Ultra 5 245K | |
| 3840x2160 Ultra Quality AF:16x | |
| Intel Core i9-14900K | |
| Intel Core i5-14600K | |
| AMD Ryzen 7 7800X3D | |
| AMD Ryzen 9 7950X3D | |
| AMD Ryzen 7 9700X | |
| Intel Core i7-14700K | |
| AMD Ryzen 9 9900X | |
| AMD Ryzen 5 9600X | |
| Intel Core Ultra 5 245K | |
| Intel Core Ultra 9 285K | |
| AMD Ryzen 9 9950X | |
| F1 2021 | |
| 2560x1440 Ultra High Preset + Raytracing AA:T AF:16x | |
| AMD Ryzen 7 7800X3D | |
| AMD Ryzen 7 9700X | |
| Intel Core i9-14900K | |
| AMD Ryzen 5 9600X | |
| AMD Ryzen 9 7950X3D | |
| Intel Core i5-14600K | |
| AMD Ryzen 9 9950X | |
| Intel Core i7-14700K | |
| AMD Ryzen 9 9900X | |
| Intel Core Ultra 9 285K | |
| Intel Core Ultra 5 245K | |
| 3840x2160 Ultra High Preset + Raytracing AA:T AF:16x | |
| AMD Ryzen 7 7800X3D | |
| AMD Ryzen 9 9950X | |
| AMD Ryzen 5 9600X | |
| AMD Ryzen 9 7950X3D | |
| Intel Core i9-14900K | |
| AMD Ryzen 7 9700X | |
| AMD Ryzen 9 9900X | |
| Intel Core i5-14600K | |
| Intel Core Ultra 9 285K | |
| Intel Core Ultra 5 245K | |
| Intel Core i7-14700K | |
| düşük | orta | yüksek | ultra | QHD DLSS | QHD | 4K DLSS | 4K FSR | 4K | |
|---|---|---|---|---|---|---|---|---|---|
| GTA V (2015) | 186.9 | 185.6 | 183.2 | 161.3 | 154.2 | 182.4 | |||
| The Witcher 3 (2015) | 626 | 584 | 545 | 294 | 251 | 276 | |||
| Dota 2 Reborn (2015) | 256 | 230 | 218 | 204 | 196.3 | ||||
| Final Fantasy XV Benchmark (2018) | 234 | 237 | 228 | 221 | 154.3 | ||||
| X-Plane 11.11 (2018) | 189.1 | 172.5 | 140.5 | 117.3 | |||||
| Far Cry 5 (2018) | 225 | 194 | 186 | 171 | 172 | 162 | |||
| Strange Brigade (2018) | 705 | 557 | 552 | 547 | 501 | 276 | |||
| Shadow of the Tomb Raider (2018) | 282 | 273 | 275 | 270 | 255 | 178.4 | |||
| Metro Exodus (2019) | 299 | 271 | 230 | 193.8 | 177.7 | 131.3 | |||
| Borderlands 3 (2019) | 209 | 183 | 166.8 | 159.1 | 158.2 | 127.3 | |||
| F1 2021 (2021) | 530 | 510 | 486 | 232 | 229 | 198.2 | |||
| F1 22 (2022) | 357 | 388 | 373 | 174.6 | 149.9 | 83 | |||
| F1 23 (2023) | 376 | 394 | 393 | 182.9 | 145.7 | 127 | 78.5 | ||
| Baldur's Gate 3 (2023) | 304 | 293 | 271 | 269 | 225 | 193.2 | 131.7 | ||
| Cyberpunk 2077 2.2 Phantom Liberty (2023) | 212 | 214 | 195.1 | 180.3 | 145.2 | 73.2 | |||
| Assassin's Creed Mirage (2023) | 287 | 268 | 255 | 198 | 178 | 156 | 125 | ||
| F1 24 (2024) | 373 | 394 | 365 | 184.8 | 139.9 | 121 | 137.2 | 77 | |
| Black Myth: Wukong (2024) | 214 | 162 | 128 | 81 | 89 | 65 | 68 | 42 |
Güç tüketimi: Intel nihayet güç verimliliğini doğru anlıyor
Intel, güç verimliliğini Arrow Lake-S'nin ana USP'si olarak sunuyor ve Core Ultra 9 285K'nın bu konuda gerçekten de beklentileri karşıladığını görebiliyoruz.
Core Ultra 9 285K, Core i9-14900K ile karşılaştırıldığında Cinebench R23 çok çekirdekli çalıştırılırken duvardan %37 daha az güç tüketiyor ve Cinebench R23 tek çekirdekli güç tüketimi yaklaşık %27 daha düşük.
Prime95 yerinde büyük FFT'ler çalıştırılırken çekilen güç de Core i9-14900K ile gözlemlediğimizden %29 daha düşüktür ve Core Ultra 9 285K, Core i5-14600K seviyelerine yaklaşmaktadır.
Bu kazanımlar oyunlarda da görülüyor; Core Ultra 9 285K sistem 1080p Ultra'da The Witcher 3 oyununda Core i9-14900K'ya kıyasla %18 daha az güç çekerkenCyberpunk 2077 oyununda Ryzen 9 9950X'e kıyasla %22 daha az güç çekiyor: Phantom Liberty 1080p Ultra'da.
Power Consumption: External monitor
: Cyberpunk 2077 ultra external monitor
| Power Consumption / Cinebench R15 Multi (external Monitor) | |
| Intel Core i9-14900K, NVIDIA GeForce RTX 4090 | |
| Intel Core i9-13900K, NVIDIA GeForce RTX 3090 | |
| Intel Core i7-14700K, NVIDIA GeForce RTX 4090 | |
| Intel Core Ultra 9 285K, NVIDIA GeForce RTX 4090 (Idle: 76.2 W) | |
| Intel Core i5-14600K, NVIDIA GeForce RTX 4090 | |
| Intel Core i9-12900K, NVIDIA Titan RTX (Idle: 70.5 W) | |
| AMD Ryzen 9 7950X, NVIDIA GeForce RTX 3090 | |
| AMD Ryzen 9 7900X, NVIDIA GeForce RTX 3090 | |
| AMD Ryzen 9 9950X, NVIDIA GeForce RTX 4090 (Idle: 100 W) | |
| Intel Core i5-13600K, NVIDIA GeForce RTX 3090 | |
| AMD Ryzen 9 9900X, NVIDIA GeForce RTX 4090 (Idle: 85.1 W) | |
| AMD Ryzen 9 7950X3D, NVIDIA GeForce RTX 4090 | |
| Intel Core Ultra 5 245K, NVIDIA GeForce RTX 4090 | |
| AMD Ryzen 5 9600X, NVIDIA GeForce RTX 4090 | |
| AMD Ryzen 7 7800X3D, NVIDIA GeForce RTX 4090 | |
| Intel Core i5-12600K, NVIDIA Titan RTX (Idle: 70.45 W) | |
| AMD Ryzen 7 9700X, NVIDIA GeForce RTX 4090 (Idle: 83 W) | |
| Power Consumption / Cinebench R23 Single (external Monitor) | |
| AMD Ryzen 7 7800X3D, NVIDIA GeForce RTX 4090 | |
| Intel Core i7-14700K, NVIDIA GeForce RTX 4090 | |
| Intel Core i9-14900K, NVIDIA GeForce RTX 4090 | |
| Intel Core i5-14600K, NVIDIA GeForce RTX 4090 | |
| AMD Ryzen 5 9600X, NVIDIA GeForce RTX 4090 | |
| AMD Ryzen 9 9950X, NVIDIA GeForce RTX 4090 (100) | |
| AMD Ryzen 9 9900X, NVIDIA GeForce RTX 4090 (85.1) | |
| Intel Core Ultra 5 245K, NVIDIA GeForce RTX 4090 | |
| AMD Ryzen 7 9700X, NVIDIA GeForce RTX 4090 (83) | |
| Intel Core Ultra 9 285K, NVIDIA GeForce RTX 4090 (76.2) | |
| Power Consumption / Cinebench R23 Multi (external Monitor) | |
| Intel Core i9-14900K, NVIDIA GeForce RTX 4090 | |
| Intel Core i7-14700K, NVIDIA GeForce RTX 4090 | |
| Intel Core Ultra 9 285K, NVIDIA GeForce RTX 4090 (76.2) | |
| Intel Core i5-14600K, NVIDIA GeForce RTX 4090 | |
| AMD Ryzen 9 9950X, NVIDIA GeForce RTX 4090 (100) | |
| AMD Ryzen 9 7950X3D, NVIDIA GeForce RTX 4090 | |
| AMD Ryzen 9 9900X, NVIDIA GeForce RTX 4090 (85.1) | |
| Intel Core Ultra 5 245K, NVIDIA GeForce RTX 4090 | |
| AMD Ryzen 5 9600X, NVIDIA GeForce RTX 4090 | |
| AMD Ryzen 7 7800X3D, NVIDIA GeForce RTX 4090 | |
| AMD Ryzen 7 9700X, NVIDIA GeForce RTX 4090 (83) | |
| Power Consumption / Prime95 V2810 Stress (external Monitor) | |
| Intel Core i9-14900K, NVIDIA GeForce RTX 4090 | |
| Intel Core i9-13900K, NVIDIA GeForce RTX 3090 | |
| Intel Core i7-14700K, NVIDIA GeForce RTX 4090 | |
| Intel Core Ultra 9 285K, NVIDIA GeForce RTX 4090 (Idle: 76.2 W) | |
| Intel Core i5-14600K, NVIDIA GeForce RTX 4090 | |
| Intel Core i5-13600K, NVIDIA GeForce RTX 3090 | |
| AMD Ryzen 9 7950X, NVIDIA GeForce RTX 3090 | |
| AMD Ryzen 9 7900X, NVIDIA GeForce RTX 3090 | |
| AMD Ryzen 9 9950X, NVIDIA GeForce RTX 4090 (Idle: 100 W) | |
| Intel Core i9-12900K, NVIDIA Titan RTX (Idle: 70.5 W) | |
| AMD Ryzen 9 9900X, NVIDIA GeForce RTX 4090 (Idle: 85.1 W) | |
| AMD Ryzen 9 7950X3D, NVIDIA GeForce RTX 4090 | |
| Intel Core Ultra 5 245K, NVIDIA GeForce RTX 4090 | |
| Intel Core i5-12600K, NVIDIA Titan RTX (Idle: 70.45 W) | |
| AMD Ryzen 7 7800X3D, NVIDIA GeForce RTX 4090 | |
| AMD Ryzen 5 9600X, NVIDIA GeForce RTX 4090 | |
| AMD Ryzen 7 9700X, NVIDIA GeForce RTX 4090 (Idle: 83 W) | |
| Power Consumption / The Witcher 3 ultra (external Monitor) | |
| Intel Core i5-14600K, NVIDIA GeForce RTX 4090 | |
| Intel Core i9-14900K, NVIDIA GeForce RTX 4090 | |
| AMD Ryzen 9 7900X, NVIDIA GeForce RTX 3090 | |
| AMD Ryzen 9 7950X, NVIDIA GeForce RTX 3090 | |
| Intel Core i9-13900K, NVIDIA GeForce RTX 3090 | |
| Intel Core i7-14700K, NVIDIA GeForce RTX 4090 | |
| AMD Ryzen 9 7950X3D, NVIDIA GeForce RTX 4090 | |
| Intel Core i5-13600K, NVIDIA GeForce RTX 3090 | |
| AMD Ryzen 7 7800X3D, NVIDIA GeForce RTX 4090 | |
| Intel Core Ultra 5 245K, NVIDIA GeForce RTX 4090 | |
| AMD Ryzen 9 9950X, NVIDIA GeForce RTX 4090 (Idle: 100 W) | |
| AMD Ryzen 9 9900X, NVIDIA GeForce RTX 4090 (Idle: 85.1 W) | |
| Intel Core i9-12900K, NVIDIA Titan RTX (Idle: 70.5 W) | |
| Intel Core Ultra 9 285K, NVIDIA GeForce RTX 4090 (Idle: 76.2 W) | |
| AMD Ryzen 7 9700X, NVIDIA GeForce RTX 4090 (Idle: 83 W) | |
| Intel Core i5-12600K, NVIDIA Titan RTX (Idle: 70.45 W) | |
| Power Consumption | |
| Intel Core Ultra 9 285K, NVIDIA GeForce RTX 4090 | |
| AMD Ryzen 5 9600X, NVIDIA GeForce RTX 4090 | |
| AMD Ryzen 9 9900X, NVIDIA GeForce RTX 4090 | |
| AMD Ryzen 9 9950X, NVIDIA GeForce RTX 4090 | |
| AMD Ryzen 7 9700X, NVIDIA GeForce RTX 4090 | |
| Intel Core Ultra 5 245K, NVIDIA GeForce RTX 4090 | |
: Cyberpunk 2077 ultra external monitor
* ... daha küçük daha iyidir
Bu düşük güç çekimleri doğal olarak yüksek verimlilik kazanımlarına dönüşüyor. Cinebench R15 çoklu çekirdekte Core Ultra 9 285K, Core i9-14900K'dan %61 daha verimli olurken Cinebench R23 çoklu çekirdekte %64 daha iyi performans gösterdi.
Cinebench R23 tek çekirdekte Core Ultra 9 285K, Core i9-14900K'nın W başına 15,51 puanına kıyasla W başına 21,2 puan ile %37 daha verimli.
Ryzen 9 9950X'e karşı bile Core Ultra 9 285K, Cinebench tek çekirdekli testlerinde tek çekirdekli güç verimliliğinde %32 ila %34'lük iyi bir liderliği koruyor.
Arrow Lake-S CPU ayrıca 1080p Ultra'da The Witcher 3 oynatırken Core i9-14900K'ya karşı %14'lük iyi bir verimlilik artışı gösteriyor ve hatta marjinal olarak daha iyi Ryzen 7 7800X3D sistem.
| Power Consumption / Cinebench R15 Multi Efficiency (external Monitor) | |
| AMD Ryzen 9 7950X3D, NVIDIA GeForce RTX 4090 | |
| AMD Ryzen 9 9950X, NVIDIA GeForce RTX 4090 | |
| Intel Core Ultra 9 285K, NVIDIA GeForce RTX 4090 | |
| AMD Ryzen 9 9900X, NVIDIA GeForce RTX 4090 | |
| Intel Core Ultra 5 245K, NVIDIA GeForce RTX 4090 | |
| AMD Ryzen 7 7800X3D, NVIDIA GeForce RTX 4090 | |
| Intel Core i7-14700K, NVIDIA GeForce RTX 4090 | |
| AMD Ryzen 5 9600X, NVIDIA GeForce RTX 4090 | |
| Intel Core i9-14900K, NVIDIA GeForce RTX 4090 | |
| Intel Core i5-14600K, NVIDIA GeForce RTX 4090 | |
| Power Consumption / Cinebench R23 Single Power Efficiency - external Monitor | |
| Intel Core Ultra 9 285K, NVIDIA GeForce RTX 4090 | |
| Intel Core Ultra 5 245K, NVIDIA GeForce RTX 4090 | |
| AMD Ryzen 9 9900X, NVIDIA GeForce RTX 4090 | |
| AMD Ryzen 9 9950X, NVIDIA GeForce RTX 4090 | |
| Intel Core i9-14900K, NVIDIA GeForce RTX 4090 | |
| AMD Ryzen 5 9600X, NVIDIA GeForce RTX 4090 | |
| Intel Core i7-14700K, NVIDIA GeForce RTX 4090 | |
| Intel Core i5-14600K, NVIDIA GeForce RTX 4090 | |
| AMD Ryzen 7 7800X3D, NVIDIA GeForce RTX 4090 | |
| Power Consumption / Cinebench R23 Multi Power Efficiency - external Monitor | |
| AMD Ryzen 9 9950X, NVIDIA GeForce RTX 4090 | |
| Intel Core Ultra 9 285K, NVIDIA GeForce RTX 4090 | |
| AMD Ryzen 9 7950X3D, NVIDIA GeForce RTX 4090 | |
| AMD Ryzen 9 9900X, NVIDIA GeForce RTX 4090 | |
| Intel Core Ultra 5 245K, NVIDIA GeForce RTX 4090 | |
| AMD Ryzen 7 7800X3D, NVIDIA GeForce RTX 4090 | |
| Intel Core i7-14700K, NVIDIA GeForce RTX 4090 | |
| AMD Ryzen 5 9600X, NVIDIA GeForce RTX 4090 | |
| Intel Core i9-14900K, NVIDIA GeForce RTX 4090 | |
| Intel Core i5-14600K, NVIDIA GeForce RTX 4090 | |
| Power Consumption / Cinebench 2024 Single Power Efficiency - external Monitor | |
| Intel Core Ultra 9 285K, NVIDIA GeForce RTX 4090 | |
| AMD Ryzen 9 9900X, NVIDIA GeForce RTX 4090 | |
| AMD Ryzen 9 9950X, NVIDIA GeForce RTX 4090 | |
| Power Consumption / Cinebench 2024 Multi Power Efficiency - external Monitor | |
| Intel Core Ultra 9 285K, NVIDIA GeForce RTX 4090 | |
| AMD Ryzen 9 9950X, NVIDIA GeForce RTX 4090 | |
| AMD Ryzen 9 9900X, NVIDIA GeForce RTX 4090 | |
| Power Consumption / Witcher 3 ultra Efficiency (external Monitor) | |
| Intel Core Ultra 9 285K, NVIDIA GeForce RTX 4090 | |
| AMD Ryzen 7 7800X3D, NVIDIA GeForce RTX 4090 | |
| Intel Core i5-12400F, NVIDIA GeForce RTX 4090 | |
| Intel Core Ultra 5 245K, NVIDIA GeForce RTX 4090 | |
| AMD Ryzen 9 7950X3D, NVIDIA GeForce RTX 4090 | |
| AMD Ryzen 9 9900X, NVIDIA GeForce RTX 4090 | |
| AMD Ryzen 9 9950X, NVIDIA GeForce RTX 4090 | |
| AMD Ryzen 9 7950X, NVIDIA GeForce RTX 4090 | |
| Intel Core i9-14900K, NVIDIA GeForce RTX 4090 | |
| Intel Core i5-14600K, NVIDIA GeForce RTX 4090 | |
| Intel Core i5-13400, NVIDIA GeForce RTX 4090 | |
| Intel Core i7-14700K, NVIDIA GeForce RTX 4090 | |
| Intel Core i9-14900K, NVIDIA GeForce RTX 4090 | |
Notebookcheck'in Core Ultra 9 285K hakkındaki genel izlenimi
Intel Core Ultra 9 285K, Core i9-14900K seviyelerinde ham CPU performansını daha düşük güç seviyelerinde sunmayı başarıyor.
Ancak oyun performansı yeterli değil ve bu da 589$'lık fiyatı konusunda büyük bir soru işareti yaratıyor.
Sıkı oyuncular paralarını savurmadan önce Kasım ayı başında Ryzen 9000X3D yongalarının piyasaya çıkmasını beklemek isteyebilir.
Şeffaflık
İncelenecek cihazların seçimi editör ekibimiz tarafından yapılır. Test örneği, bu incelemenin amacı doğrultusunda üretici veya perakendeci tarafından yazara ödünç olarak sağlanmıştır. Borç verenin bu inceleme üzerinde herhangi bir etkisi olmadığı gibi, üretici de yayınlanmadan önce bu incelemenin bir kopyasını almamıştır. Bu incelemeyi yayınlama zorunluluğu yoktu. İncelemelerimiz karşılığında asla tazminat veya ödeme kabul etmiyoruz. Bağımsız bir medya şirketi olarak Notebookcheck, üreticilerin, perakendecilerin veya yayıncıların otoritesine tabi değildir.
Notebookcheck bu şekilde test yapıyor
Notebookcheck, tüm sonuçların karşılaştırılabilir olmasını sağlamak için her yıl yüzlerce dizüstü bilgisayarı ve akıllı telefonu standart prosedürler kullanarak bağımsız olarak inceliyor. Yaklaşık 20 yıldır test yöntemlerimizi sürekli olarak geliştirdik ve bu süreçte endüstri standartlarını belirledik. Test laboratuvarlarımızda deneyimli teknisyenler ve editörler tarafından yüksek kaliteli ölçüm ekipmanları kullanılmaktadır. Bu testler çok aşamalı bir doğrulama sürecini içerir. Karmaşık derecelendirme sistemimiz, nesnelliği koruyan yüzlerce sağlam temellere dayanan ölçüm ve kıyaslamaya dayanmaktadır.
