

Lenovo Legion Pro 5i dizüstü bilgisayar incelemesi: Süper güçlü i7-14700HX ve RTX 4060 performansı
Daha iyi konfigürasyonlardan birini zaten test etmiştik Core i9 14900HX CPU ve bir 140 watt GeForce RTX 4070. Bununla birlikte, birçok oyuncu muhtemelen daha uygun fiyatlı bir yapılandırmayı tercih edecektir i7 14700HX ve bir RTX 4060 bugün bu modele bir göz atıyoruz. Bu model, yüksek yüzey sıcaklıkları ve gürültülü soğutma sistemi gibi "büyük" modelin bazı zayıf noktalarını da perspektife koyabilir.
Bunun yanı sıra bÜYÜK KARDEŞ ve profesyonel olmayan Legion 5gibi diğer RTX 4060 oyuncuları ile Legion Pro 5'i karşılaştıracağız Dell G16, HP Victus 16 ve XMG Çekirdek 15.
Karşılaştırmalı olarak olası rakipler
Sürüm | Derecelendirme | Tarih | Modeli | Ağırlık | Yükseklik | Boyut | Çözünürlük | Fiyat |
|---|---|---|---|---|---|---|---|---|
| v8 | 82.3 % | 07/2024 | Lenovo Legion Pro 5 16IRX9 G9 i7-14700HX, NVIDIA GeForce RTX 4060 Laptop GPU | 2.5 kg | 26.55 mm | 16.00" | 2560x1600 | |
| v7 (old) | 84.3 % v7 (old) | 05/2024 | HP Victus 16 (2024) i7-14700HX, NVIDIA GeForce RTX 4060 Laptop GPU | 2.4 kg | 23.9 mm | 16.10" | 1920x1080 | |
| v7 (old) | 85.5 % v7 (old) | 02/2024 | Dell G16, i7-13650HX, RTX 4060 i7-13650HX, NVIDIA GeForce RTX 4060 Laptop GPU | 2.8 kg | 25.65 mm | 16.00" | 2560x1600 | |
| v8 | 83.7 % | 06/2024 | SCHENKER XMG Core 15 (M24) R7 8845HS, NVIDIA GeForce RTX 4060 Laptop GPU | 2.1 kg | 21.9 mm | 15.30" | 2560x1600 | |
| v7 (old) | 89.3 % v7 (old) | 04/2024 | Lenovo Legion Pro 5 16IRX9 i9-14900HX, NVIDIA GeForce RTX 4070 Laptop GPU | 2.5 kg | 26.95 mm | 16.00" | 2560x1600 | |
| v7 (old) | 89.1 % v7 (old) | 02/2024 | Lenovo Legion 5 16IRX G9 i7-14650HX, NVIDIA GeForce RTX 4060 Laptop GPU | 2.4 kg | 25.2 mm | 16.00" | 2560x1600 |
Lütfen dikkat: Derecelendirme sistemimizi güncelledik ve 8. sürümün sonuçları 7. sürümün sonuçları ile karşılaştırılamaz. Daha fazla bilgi için burada.
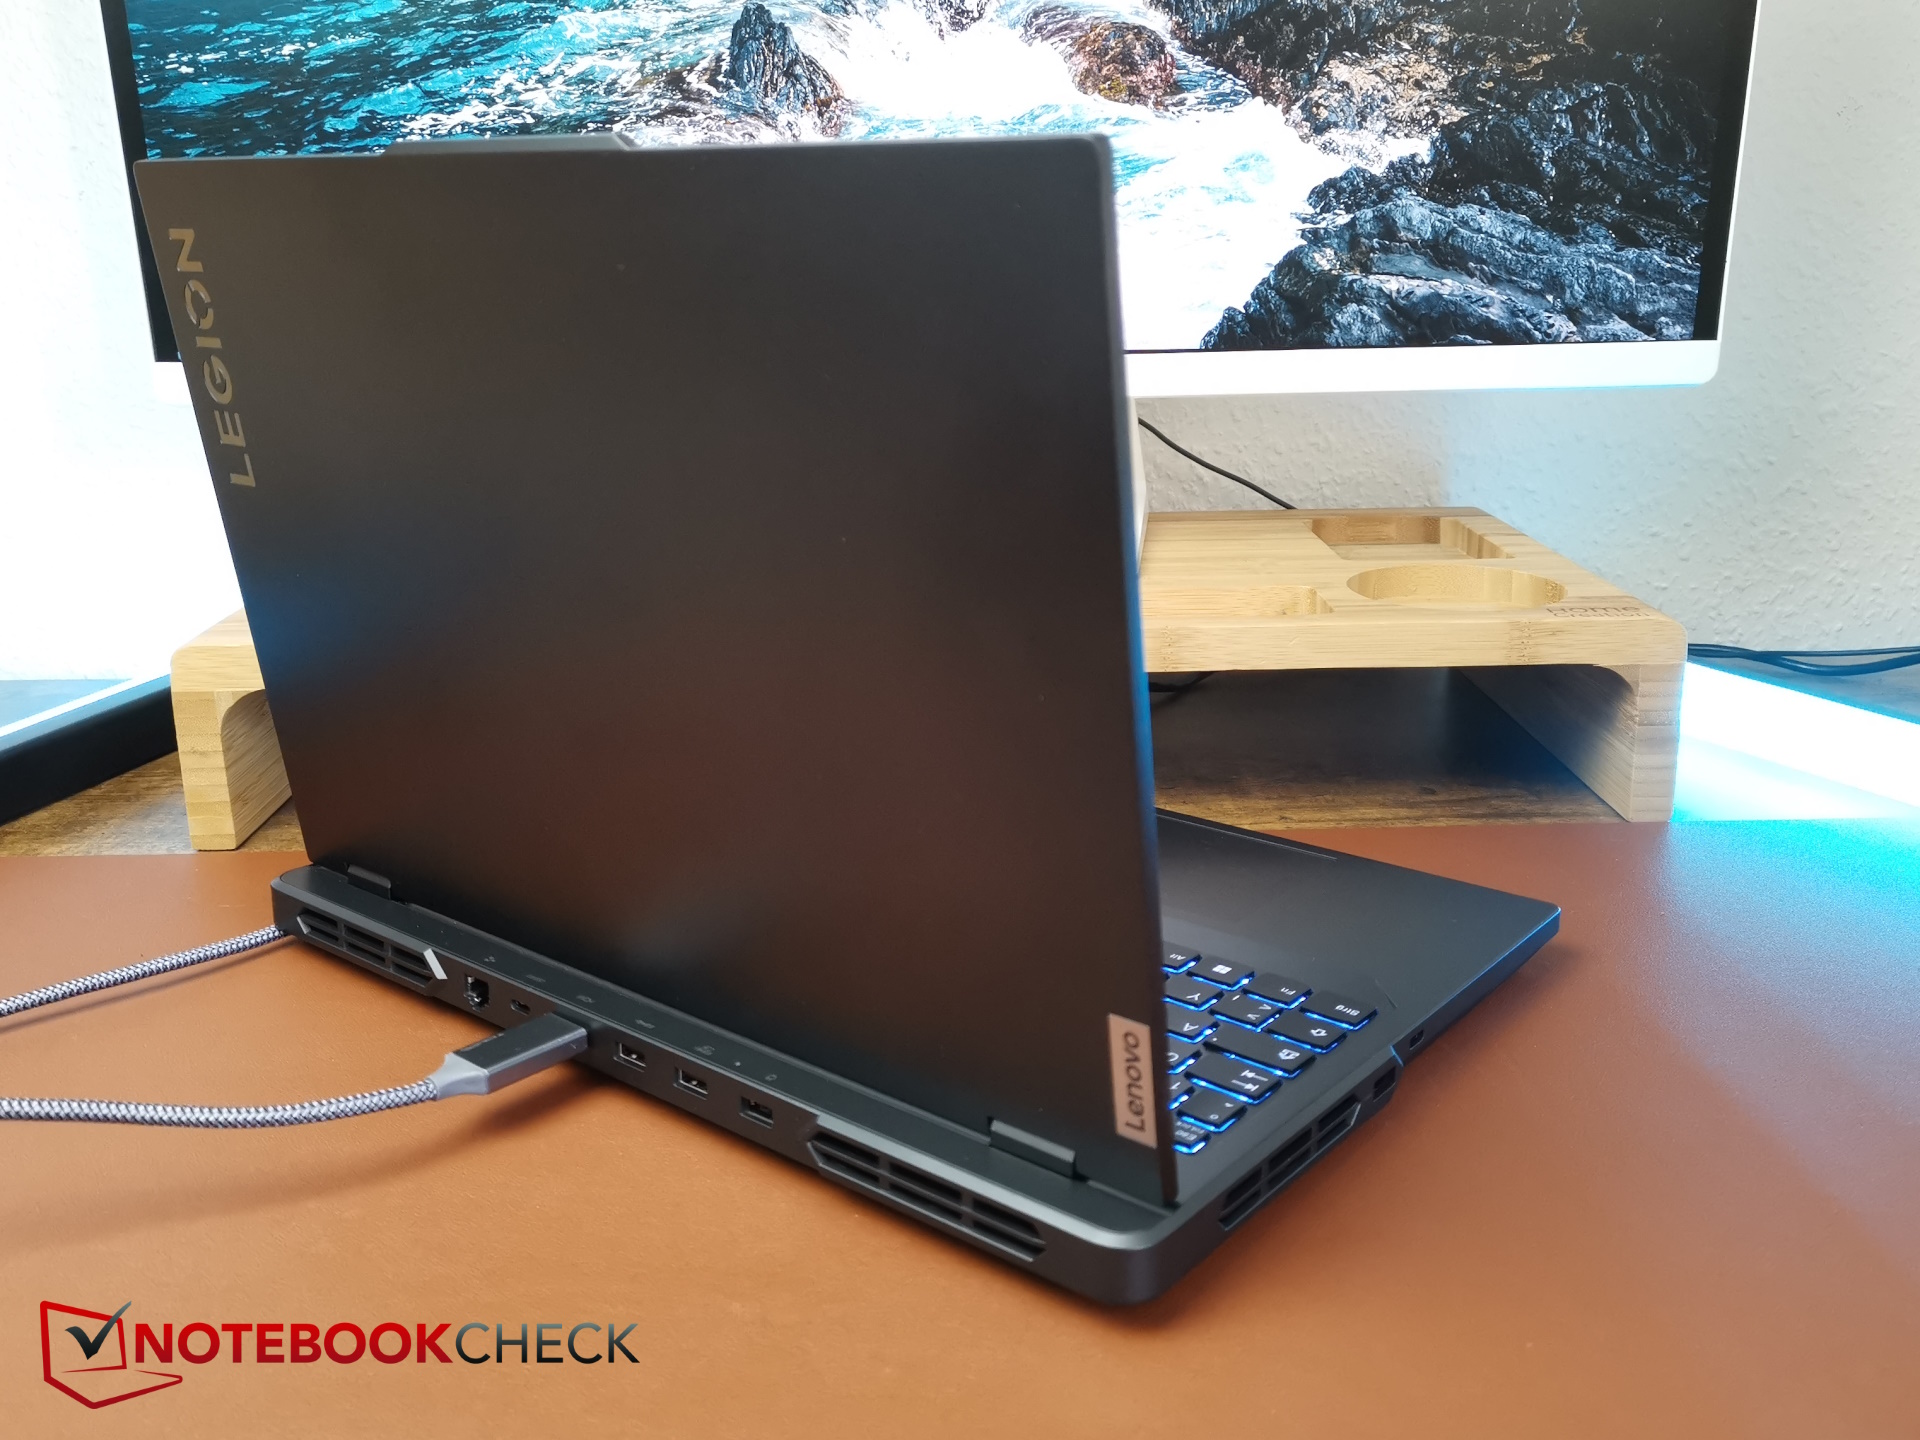
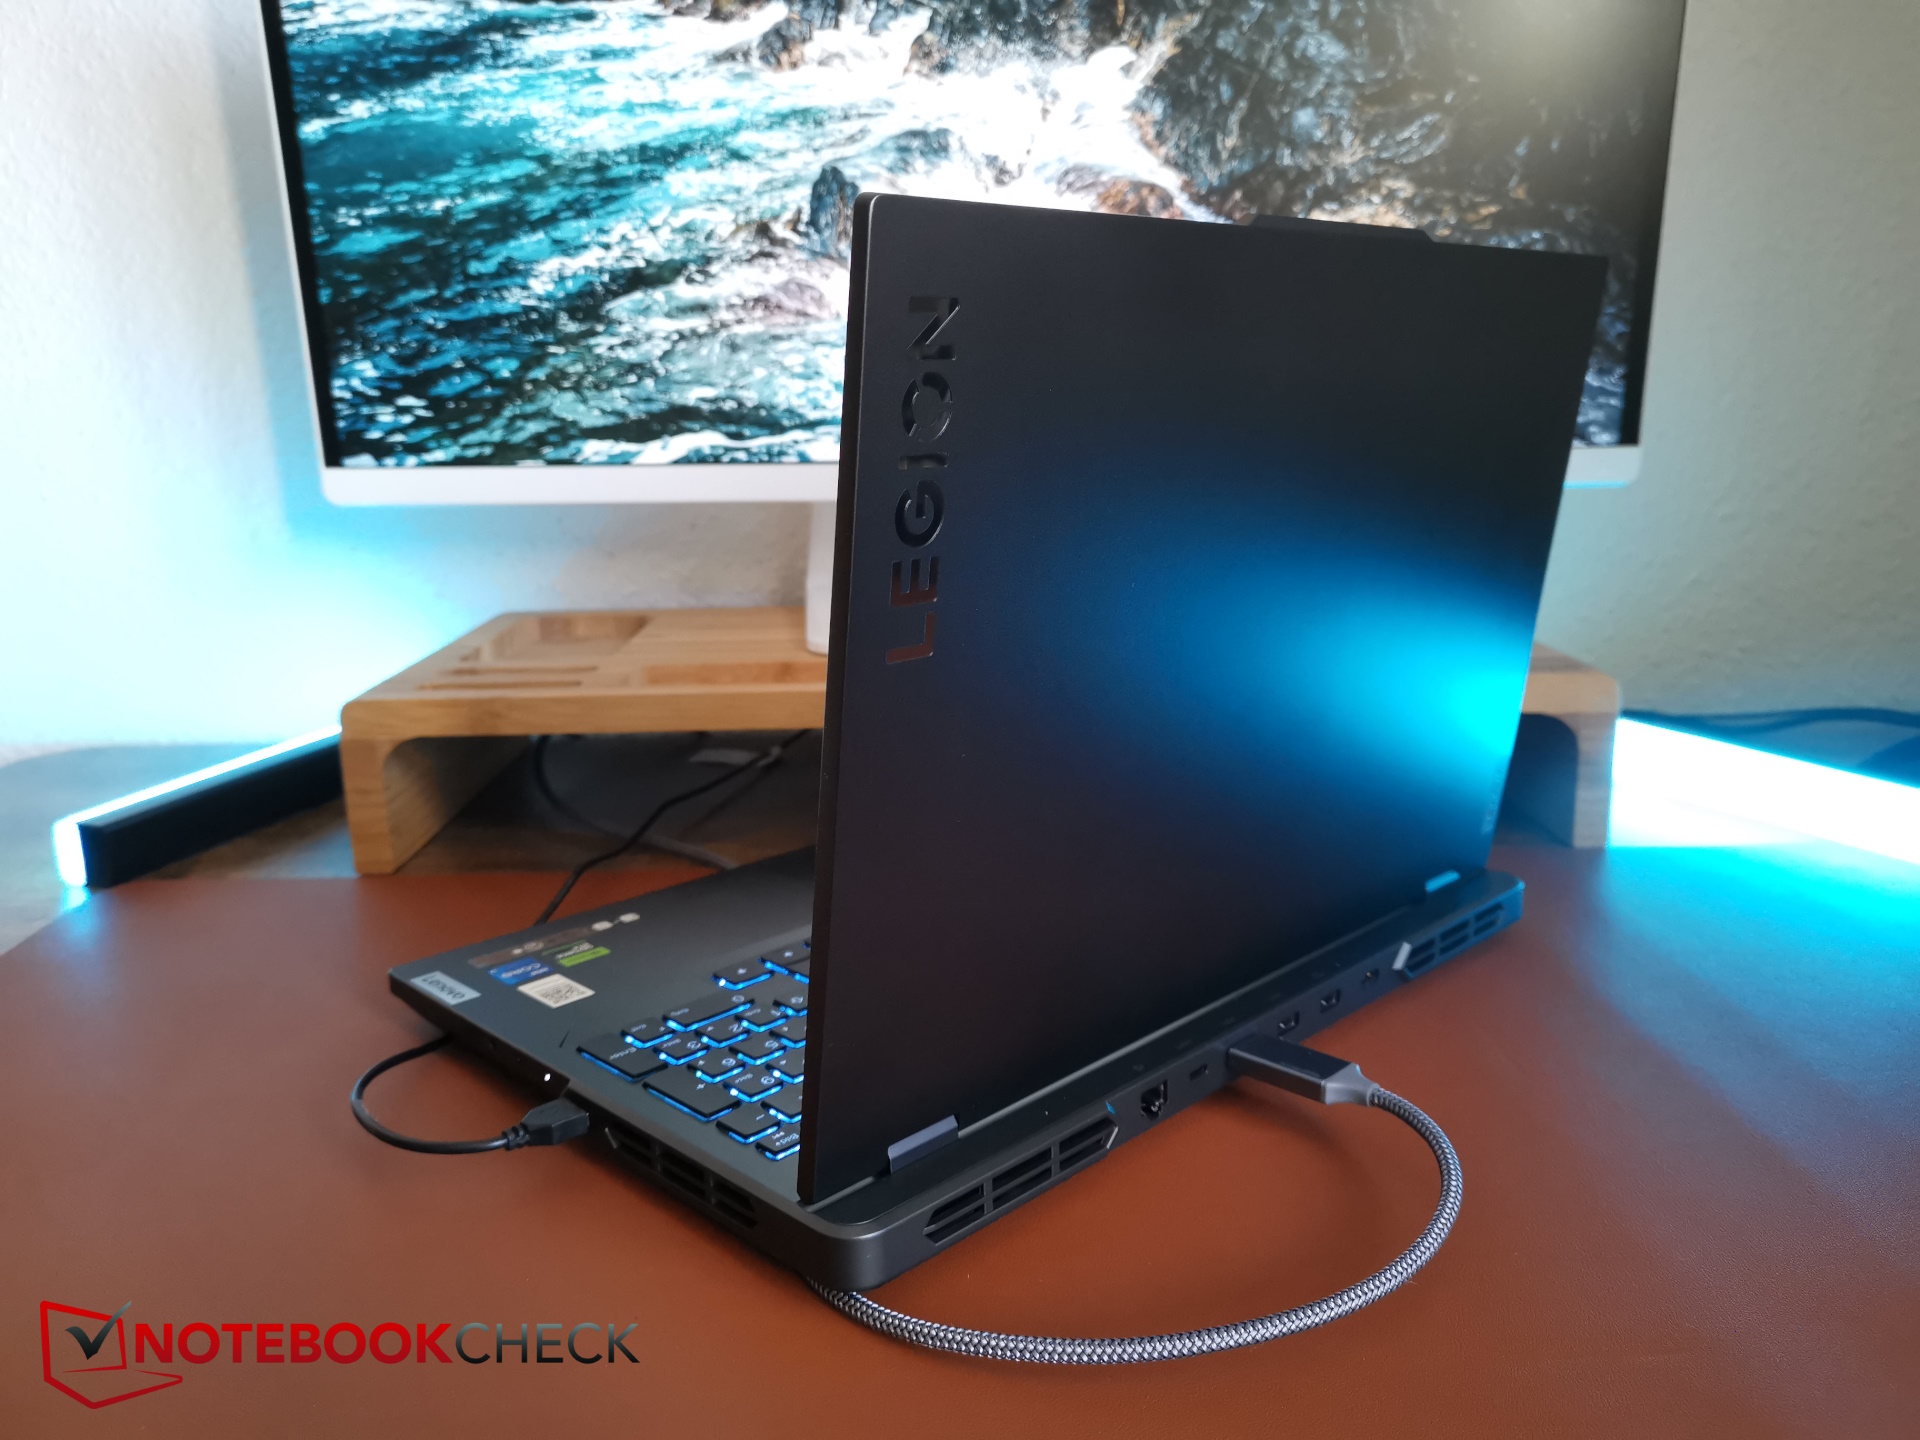
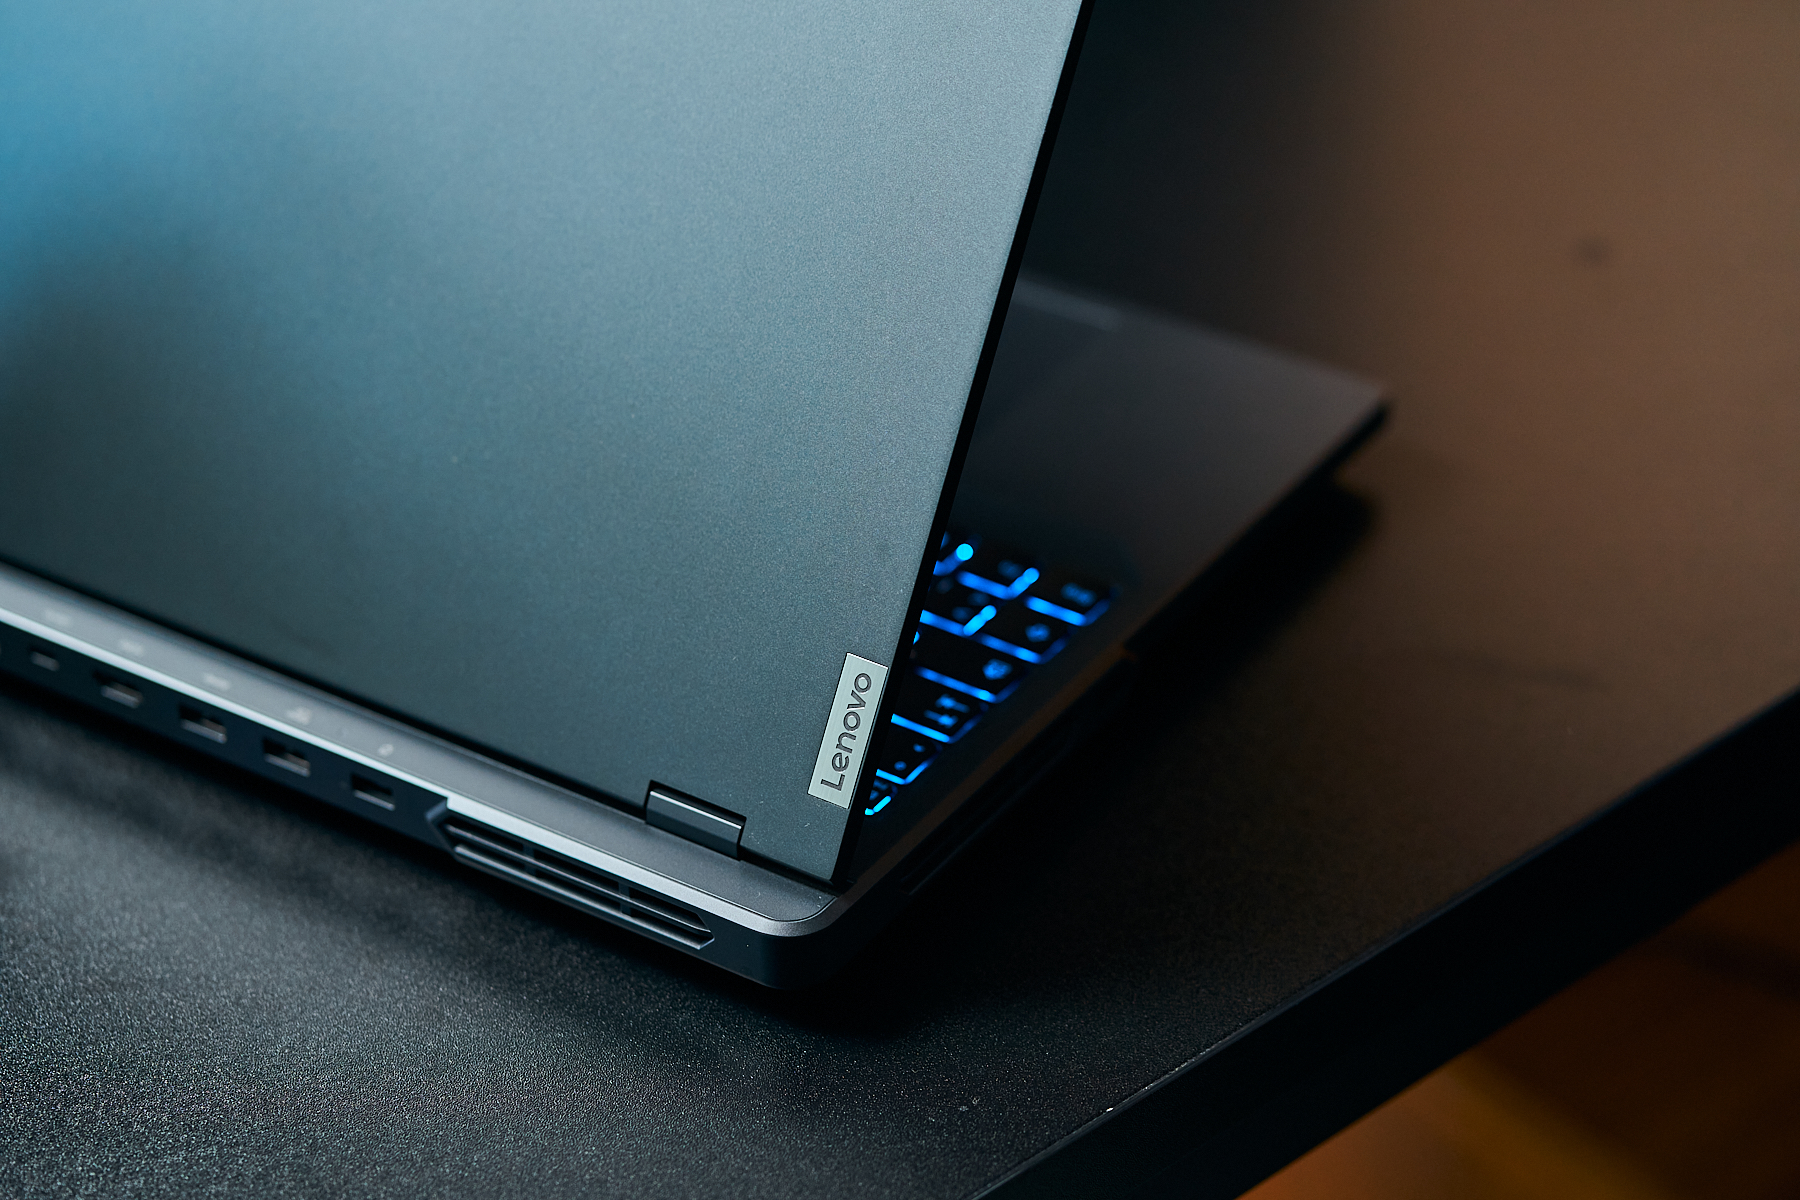
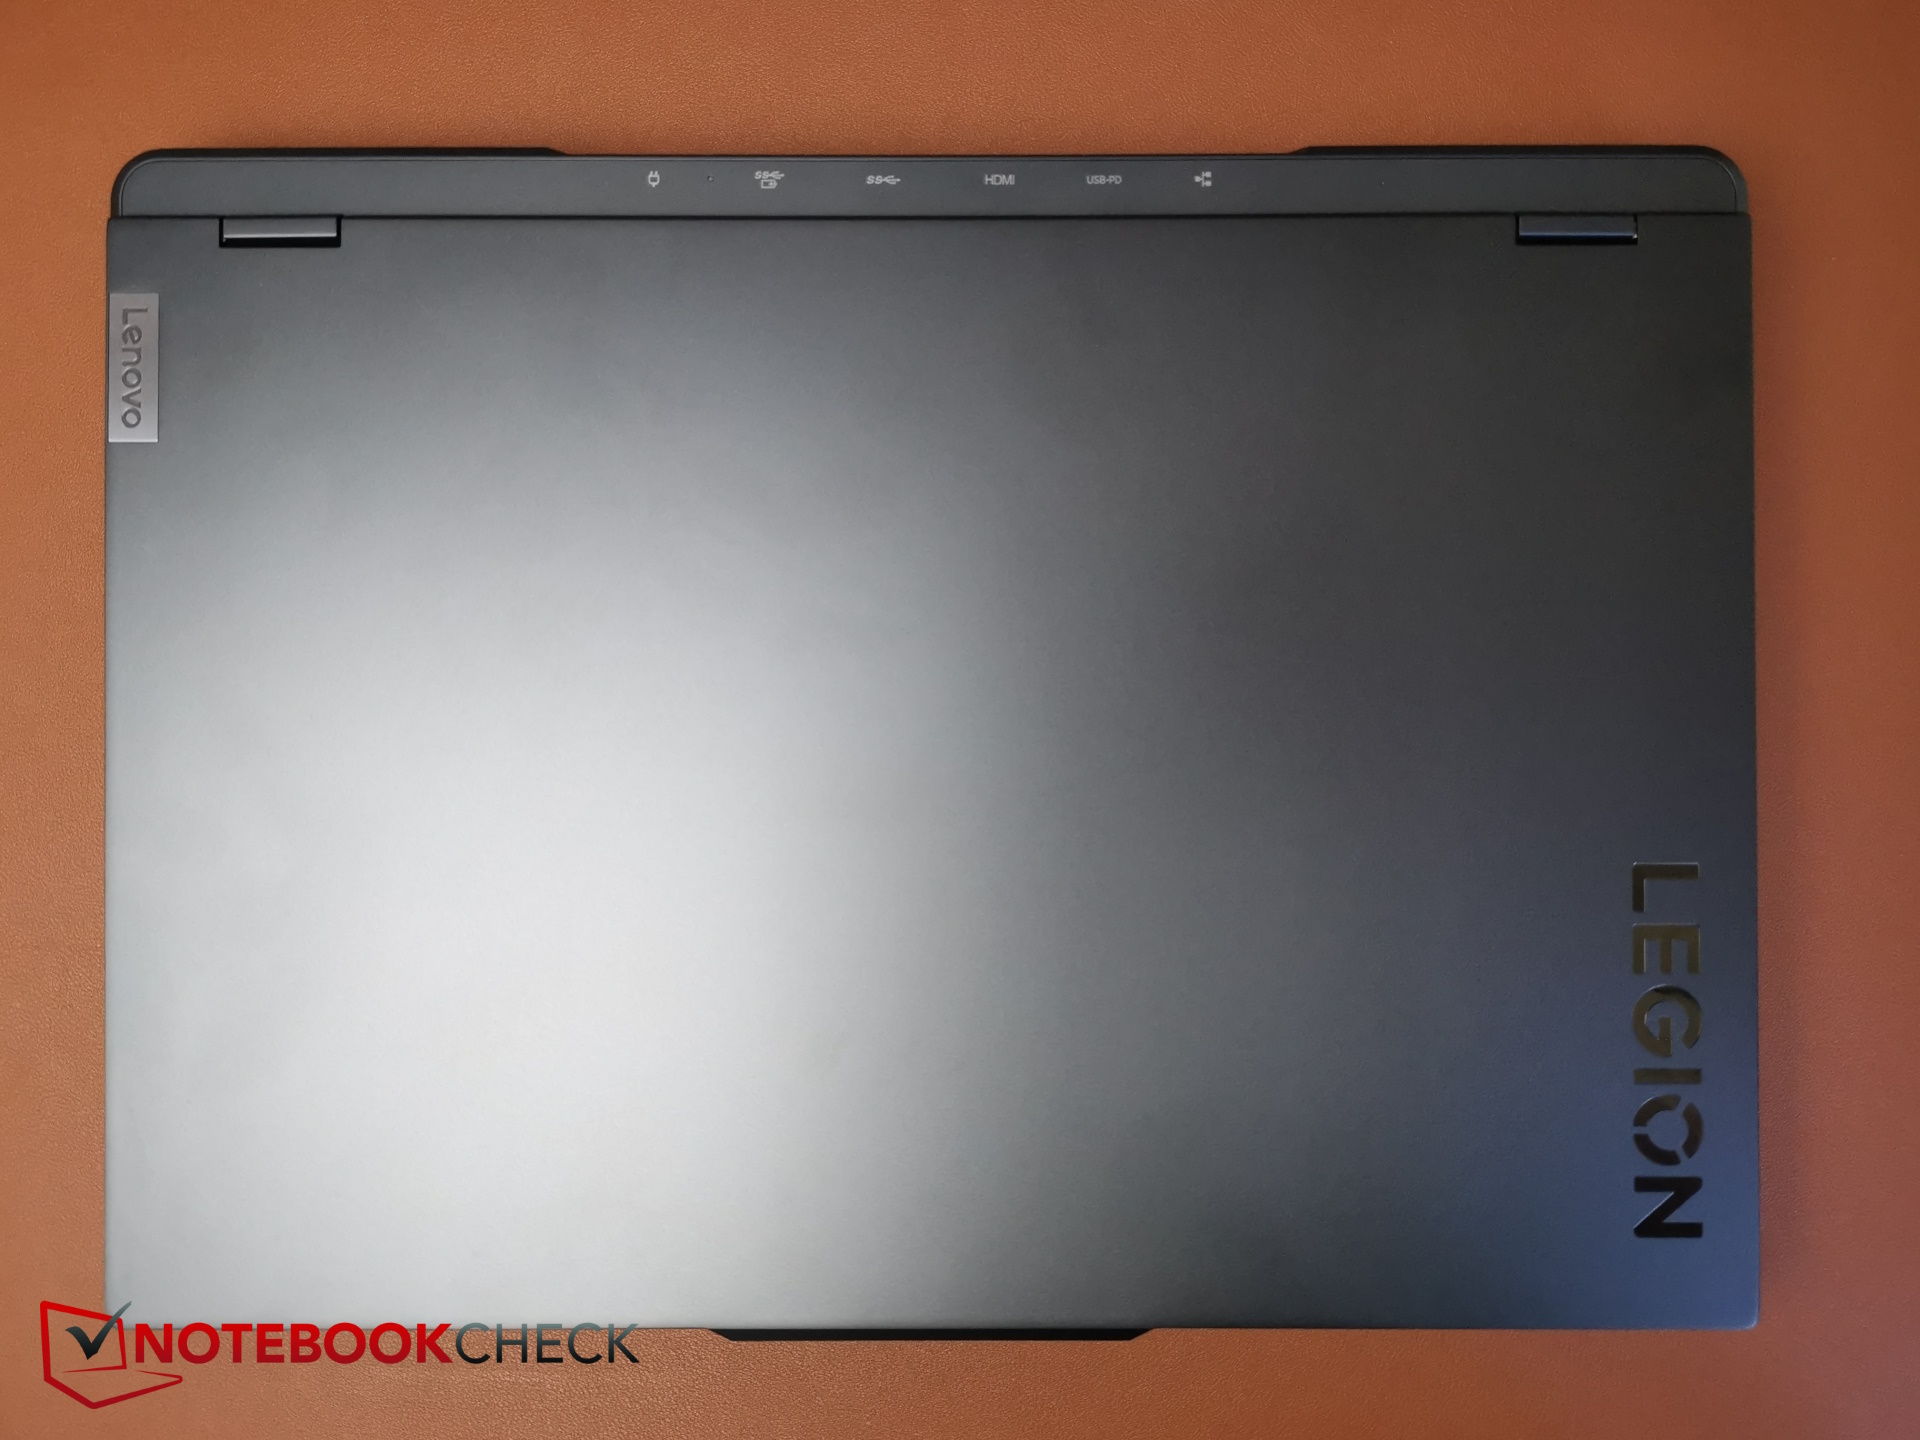
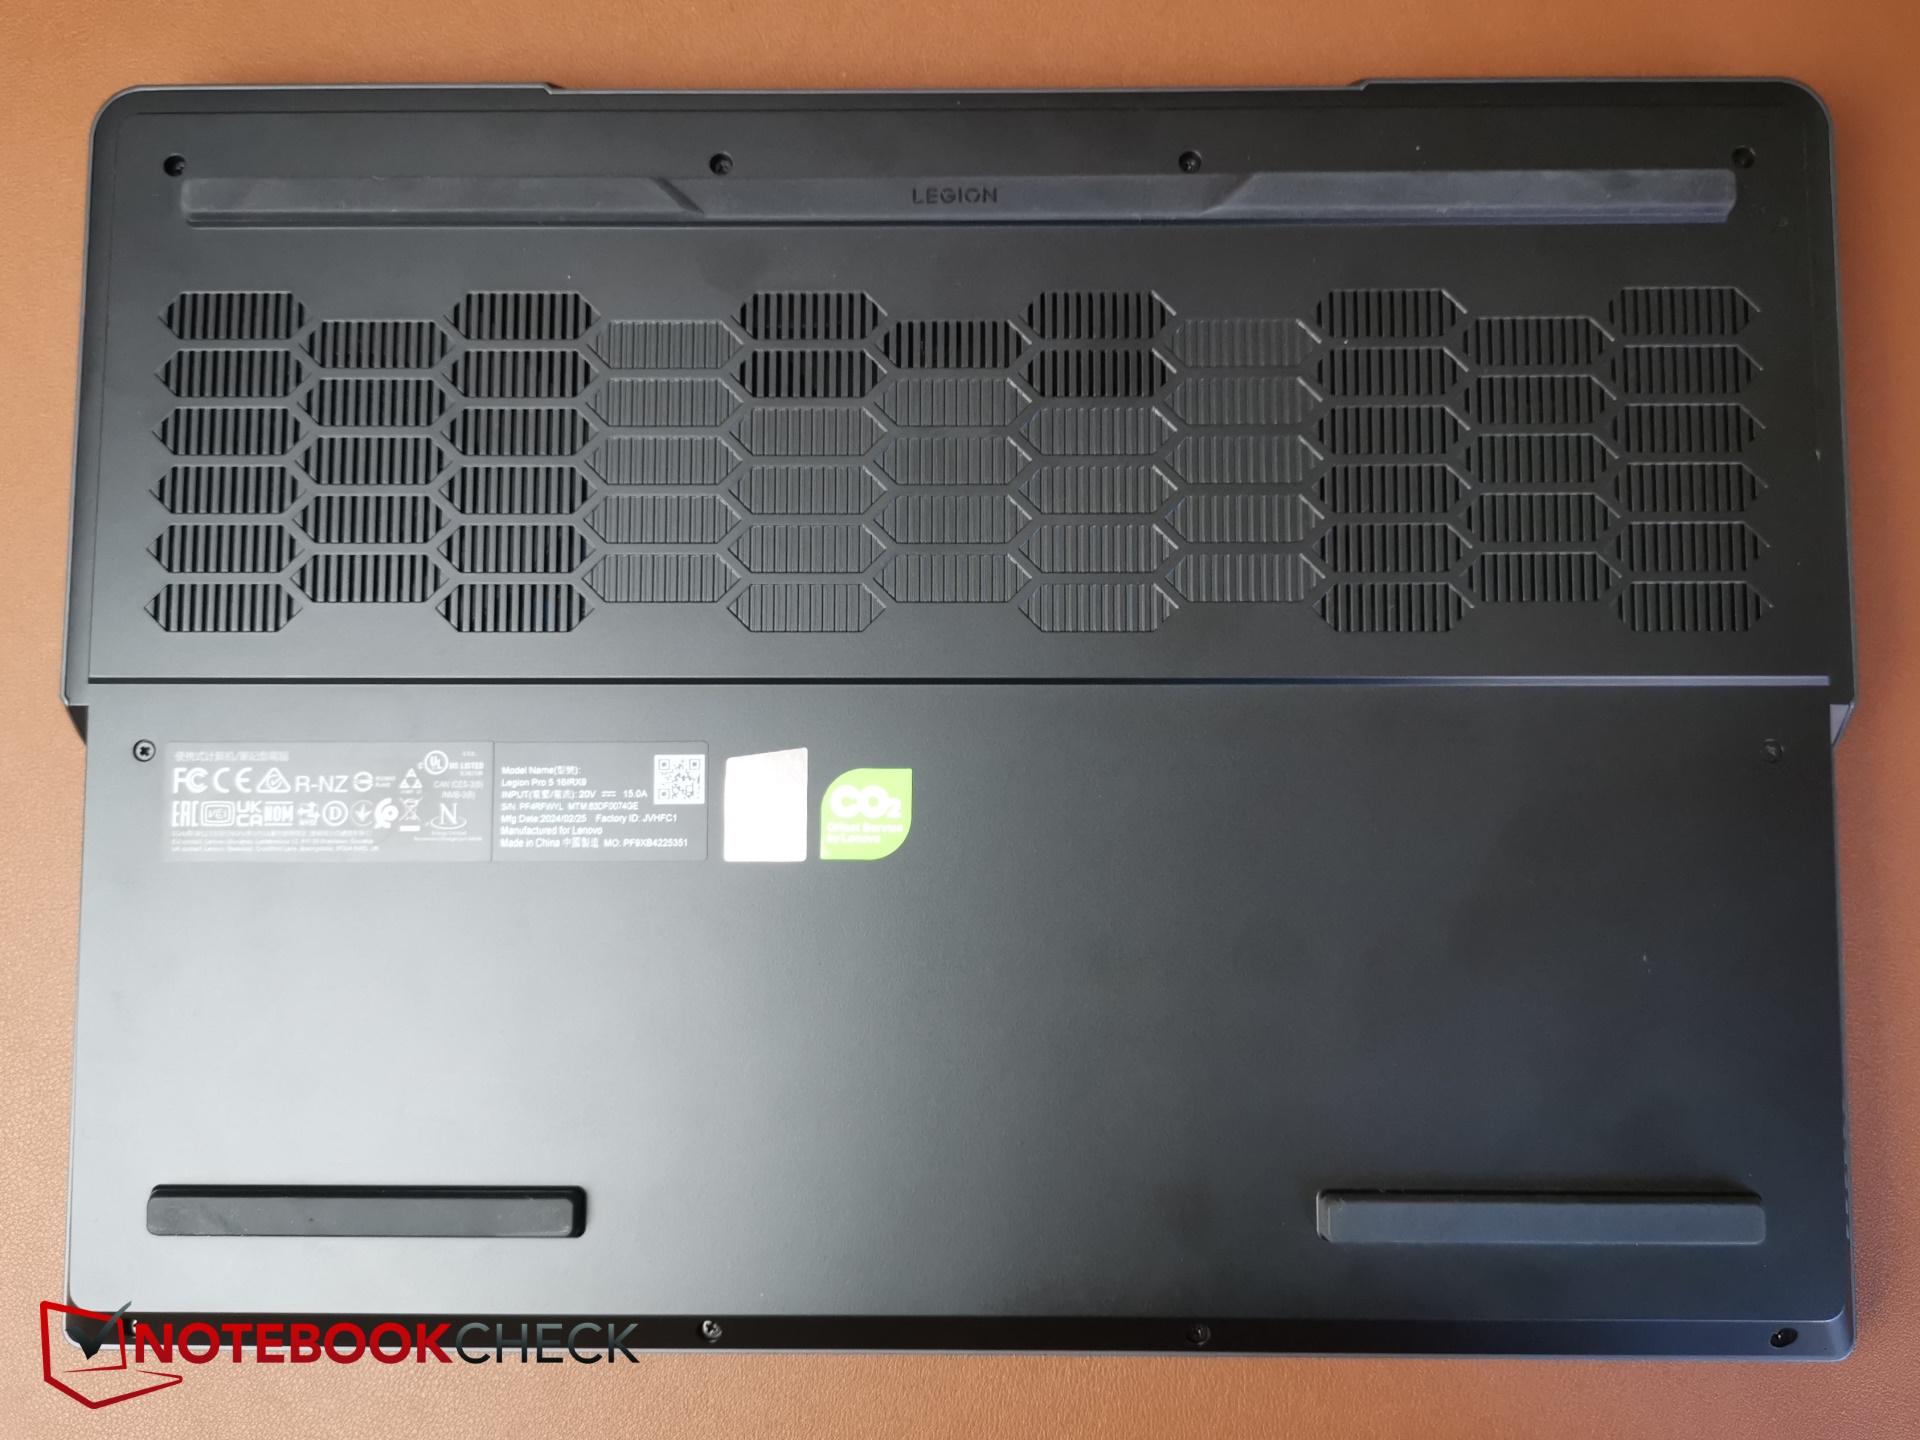
Kasa ve bağlantı: SD kart okuyucusu olmayan Legion Pro
Fiziksel özellikleri değişmediğinden, aşağıdaki yazımızı okumanızı öneririz lenovo'nun orijinal incelemesi Legion Pro 5 16IRX9 kasası, bakım seçenekleri ve giriş aygıtları hakkında bilgi için.
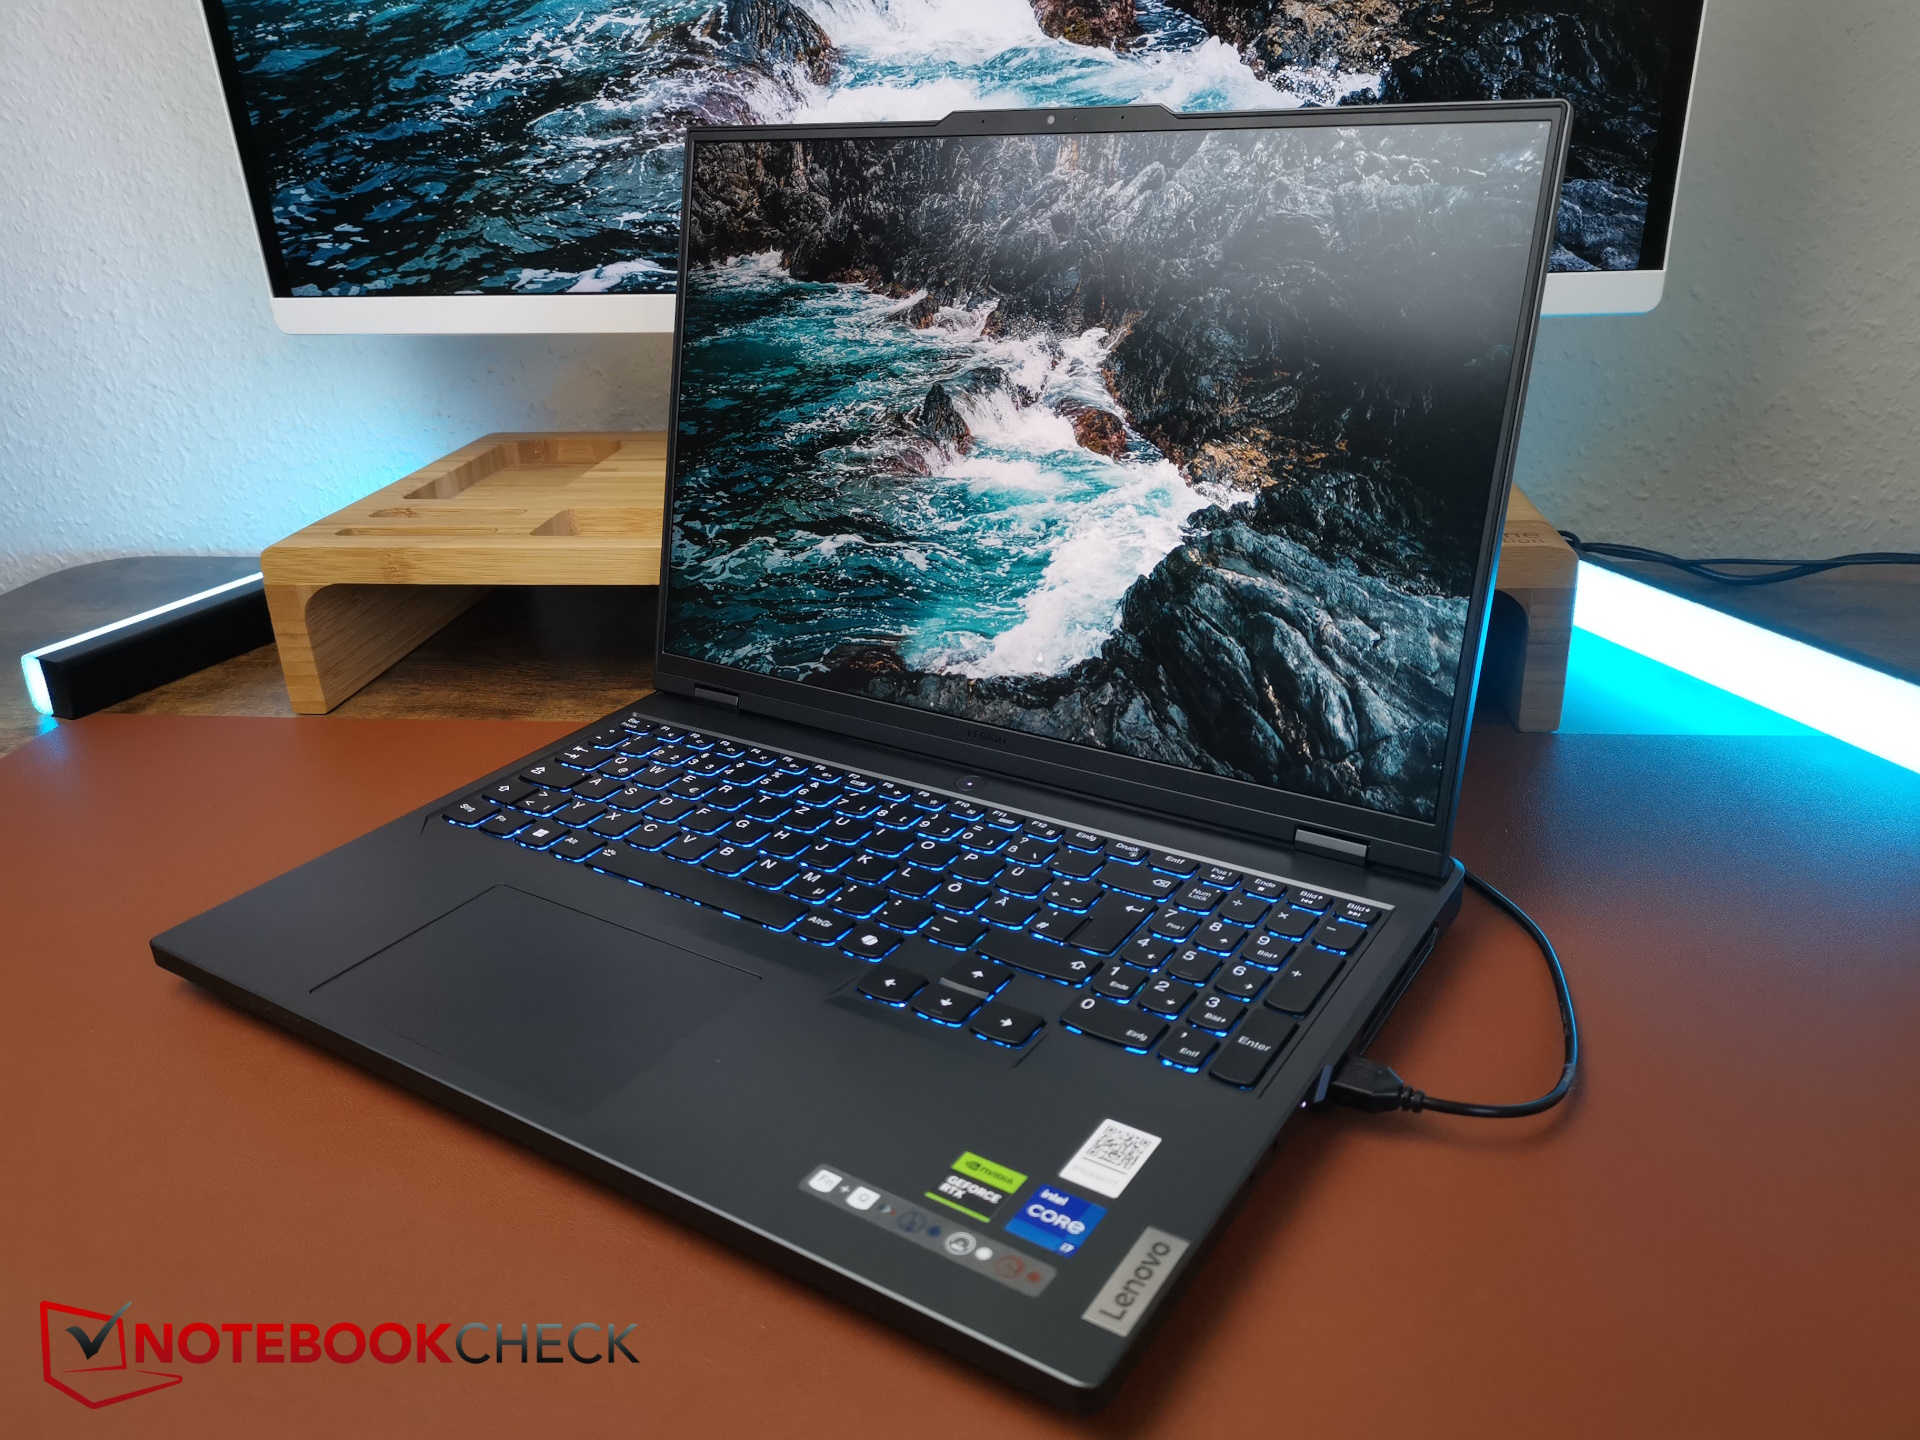
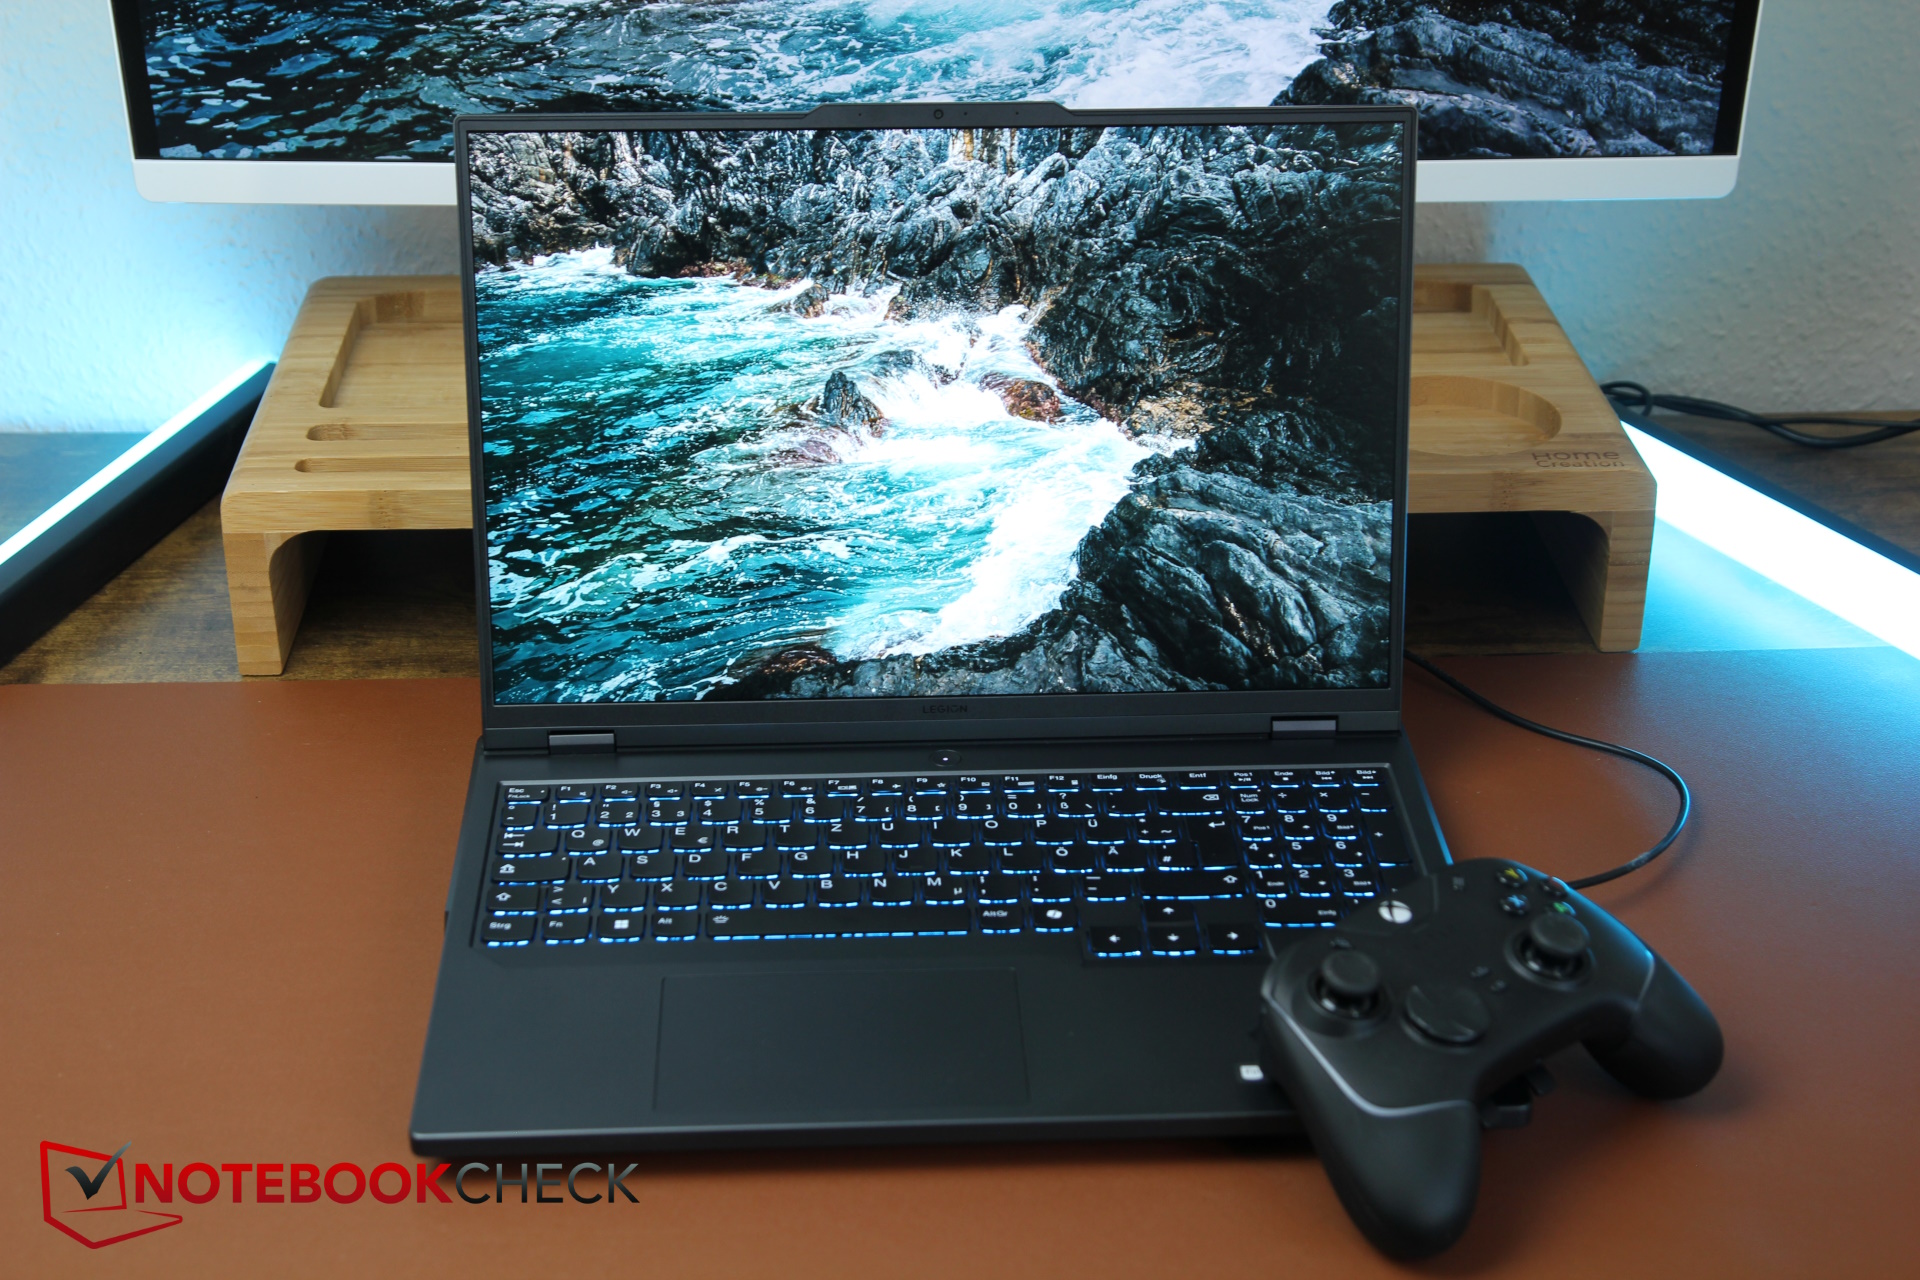


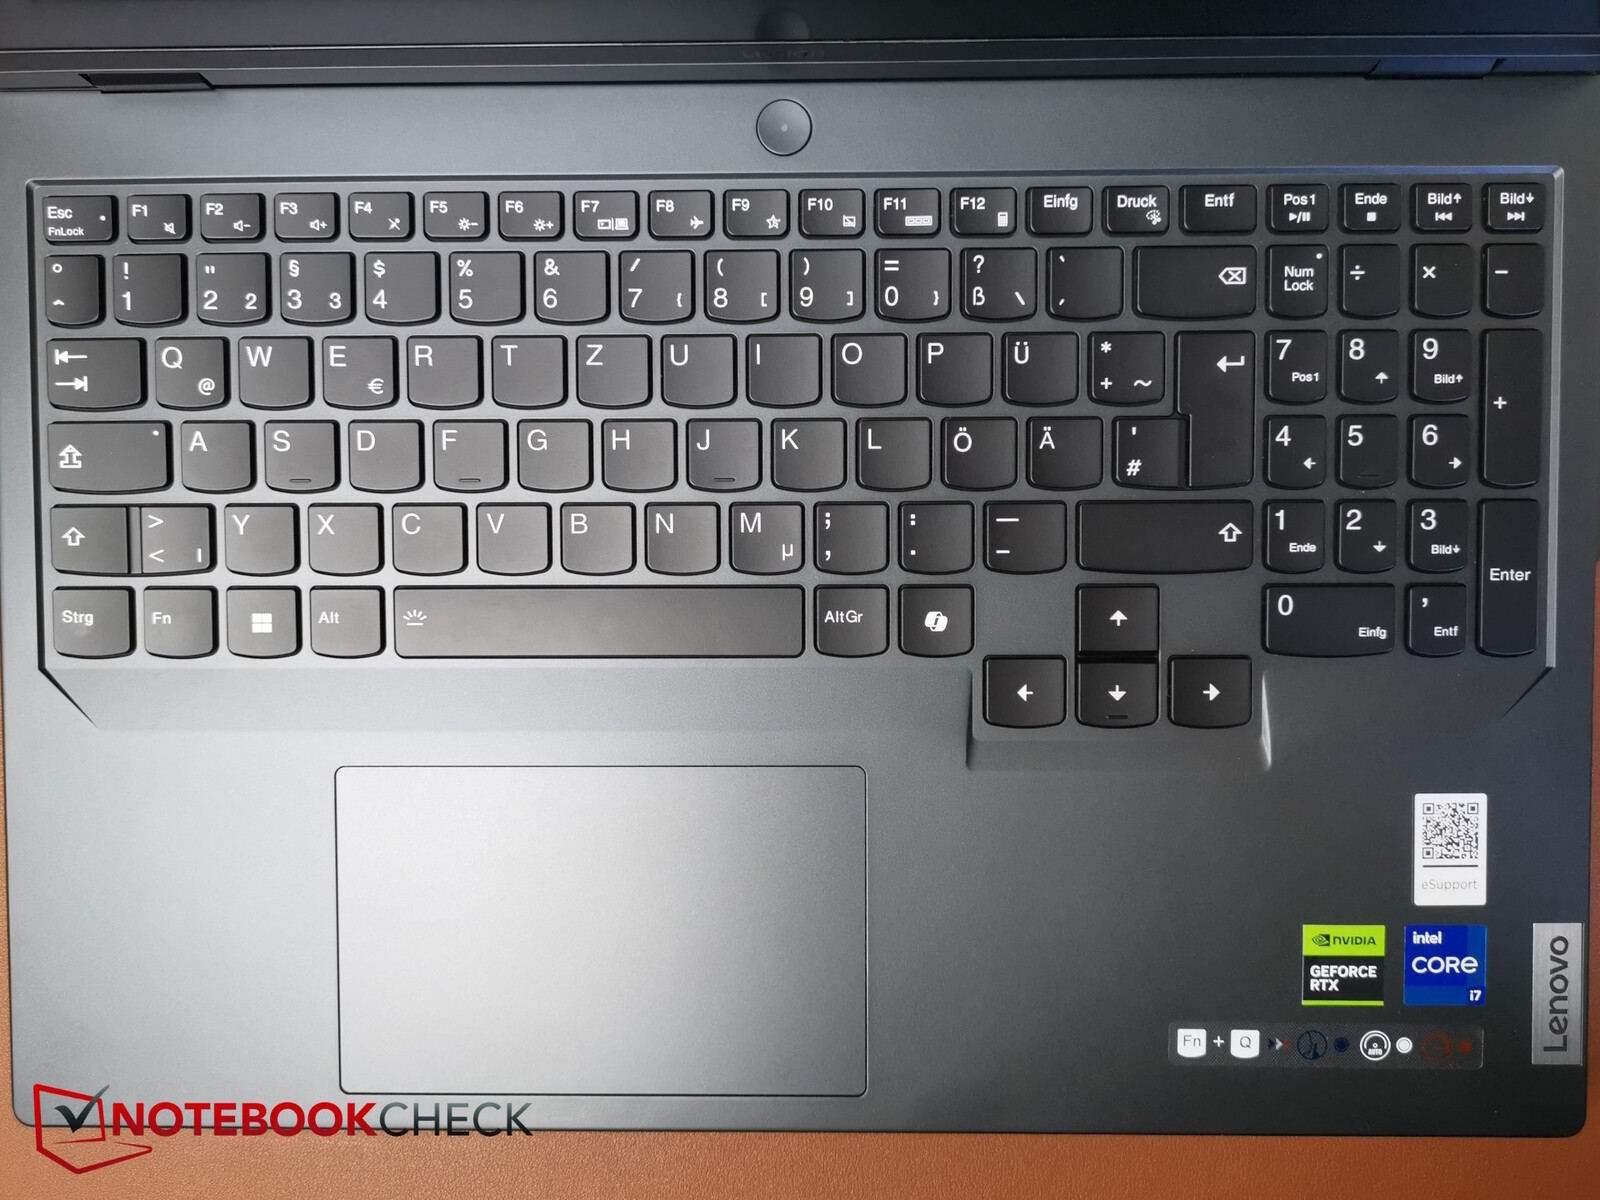
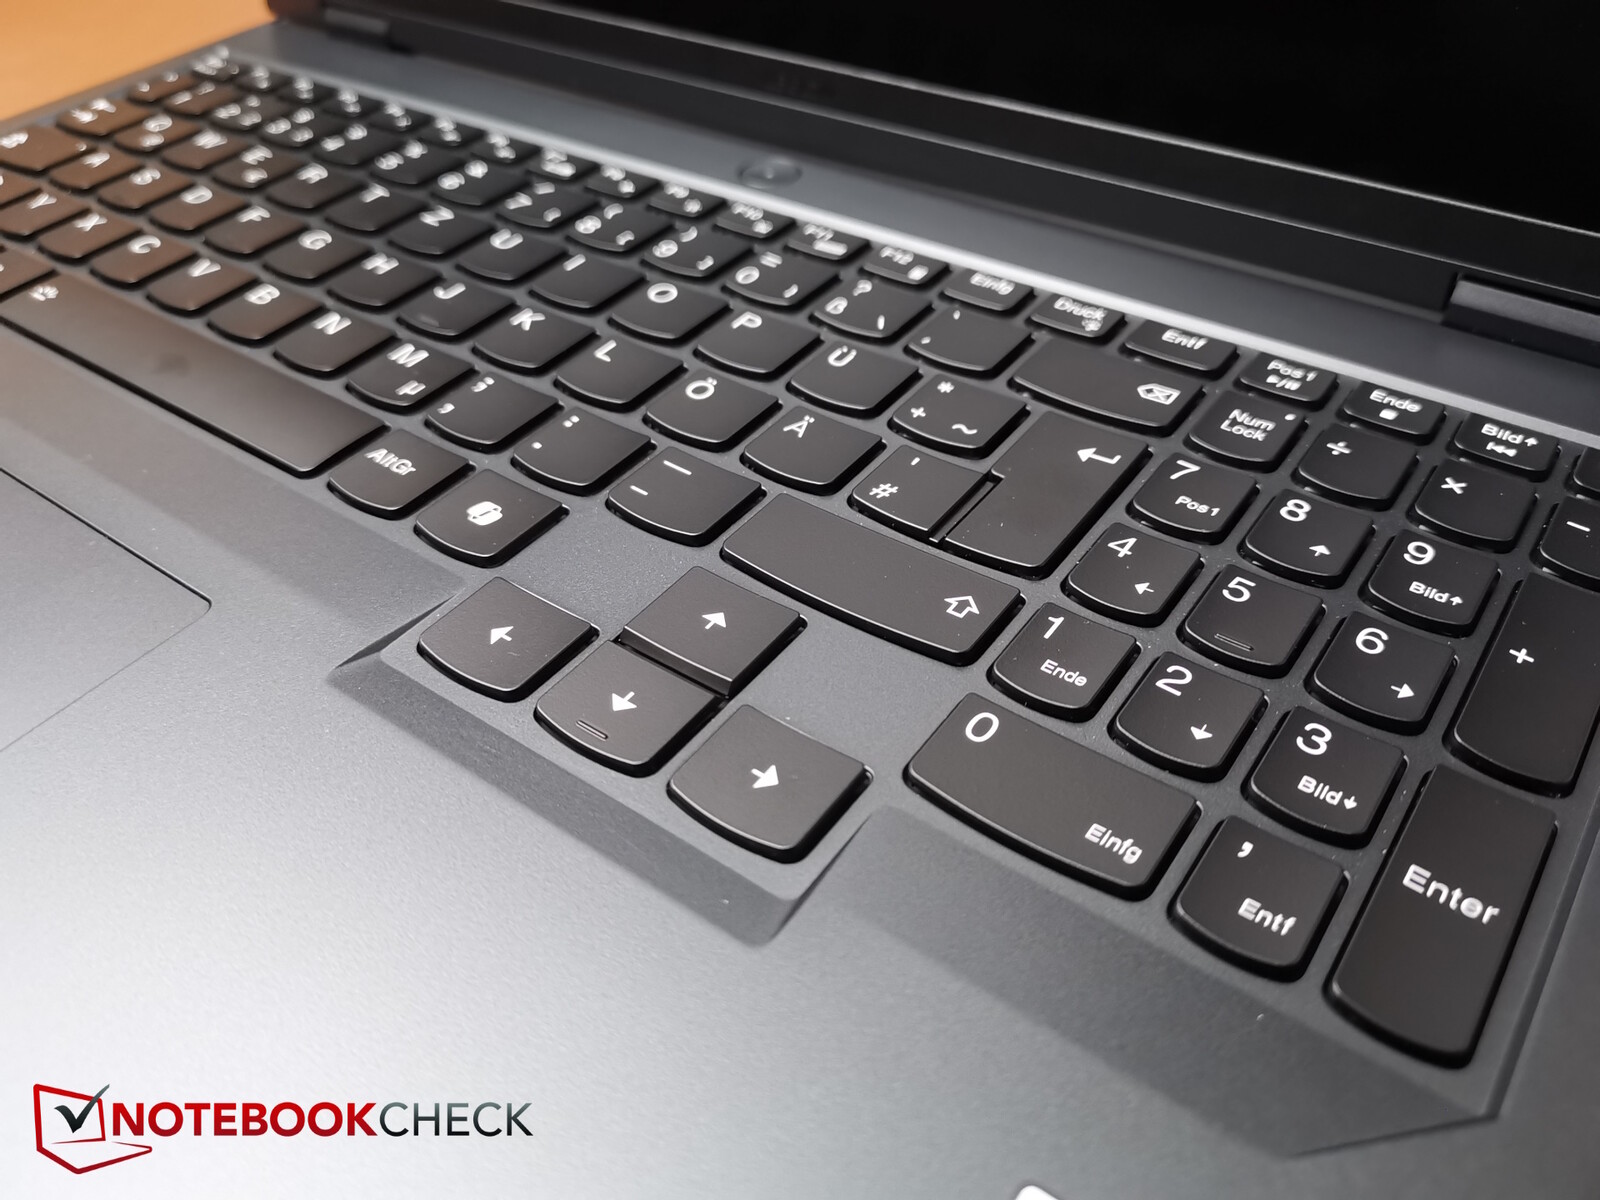
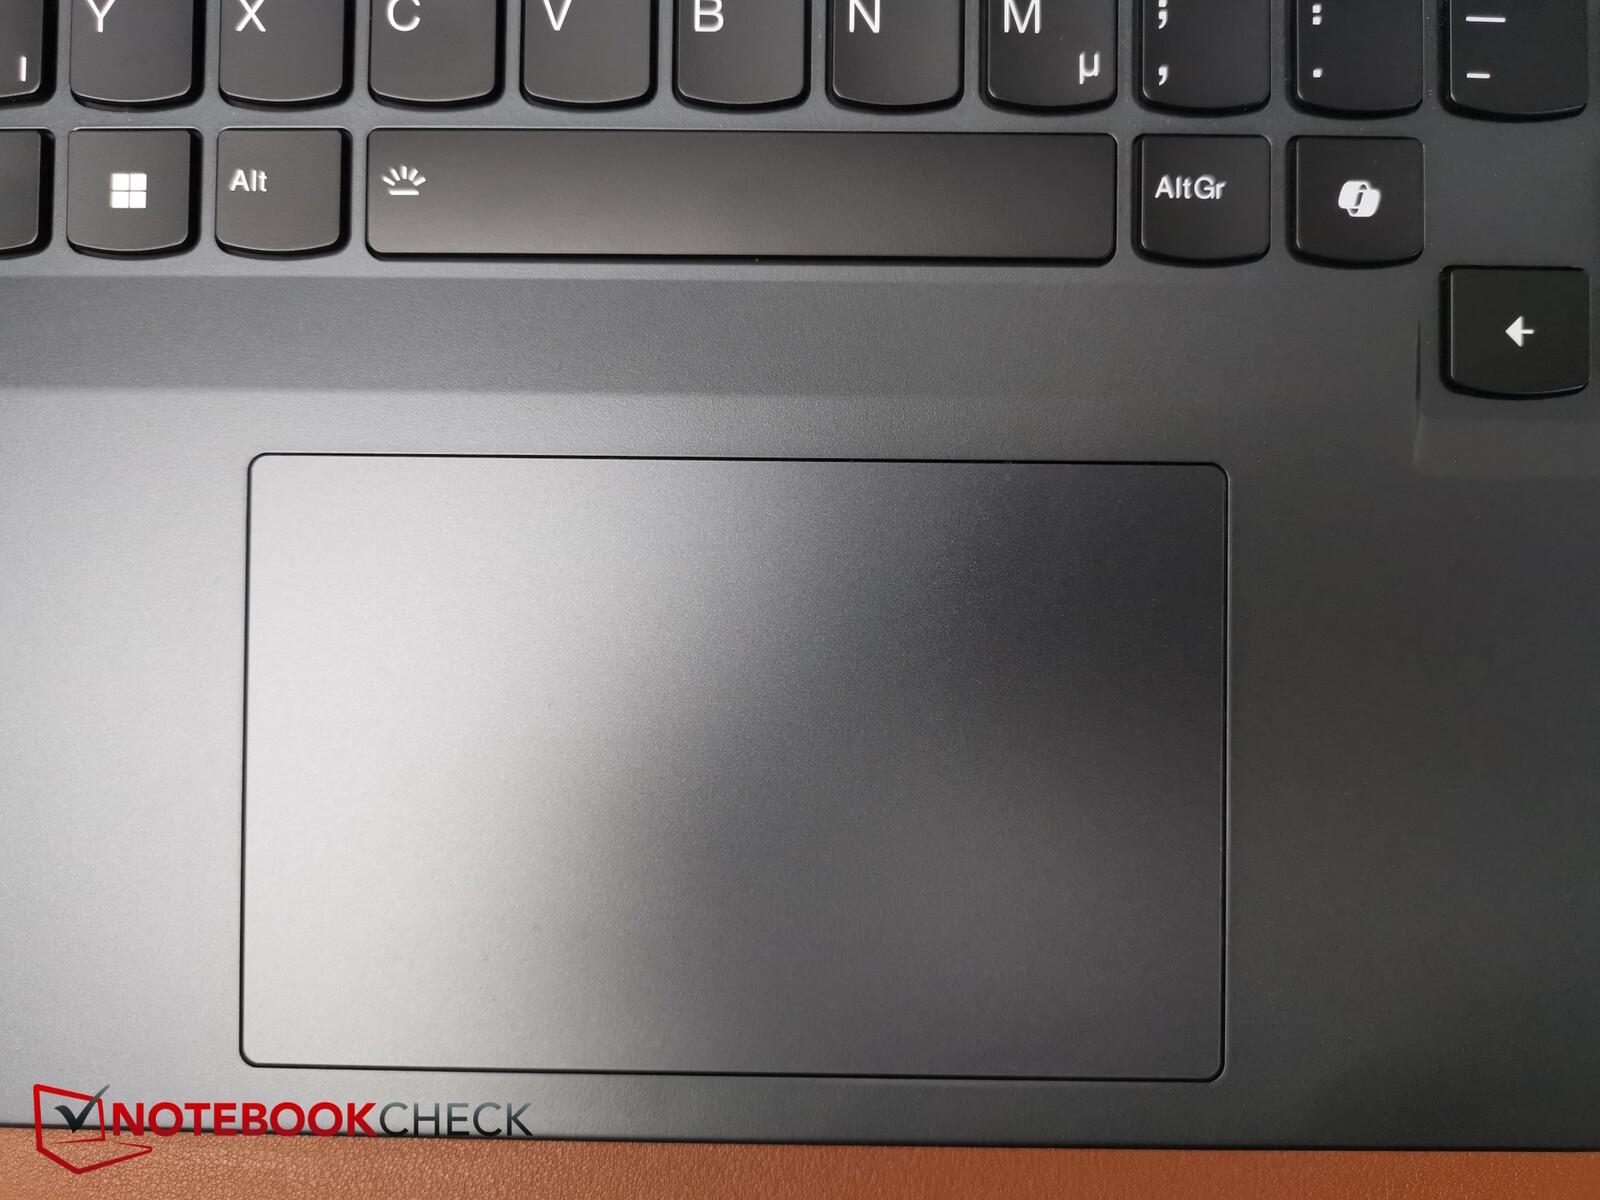
Giriş cihazları - Tanınmış Legion kalitesi
İlk yazımızda bahsedilmemişti Legion Pro 5i'nin testi: Yenileme hızı, Fn + R tuş kombinasyonu kullanılarak üç adım (240, 165 ve 60 Hz) arasında değiştirilebilir.

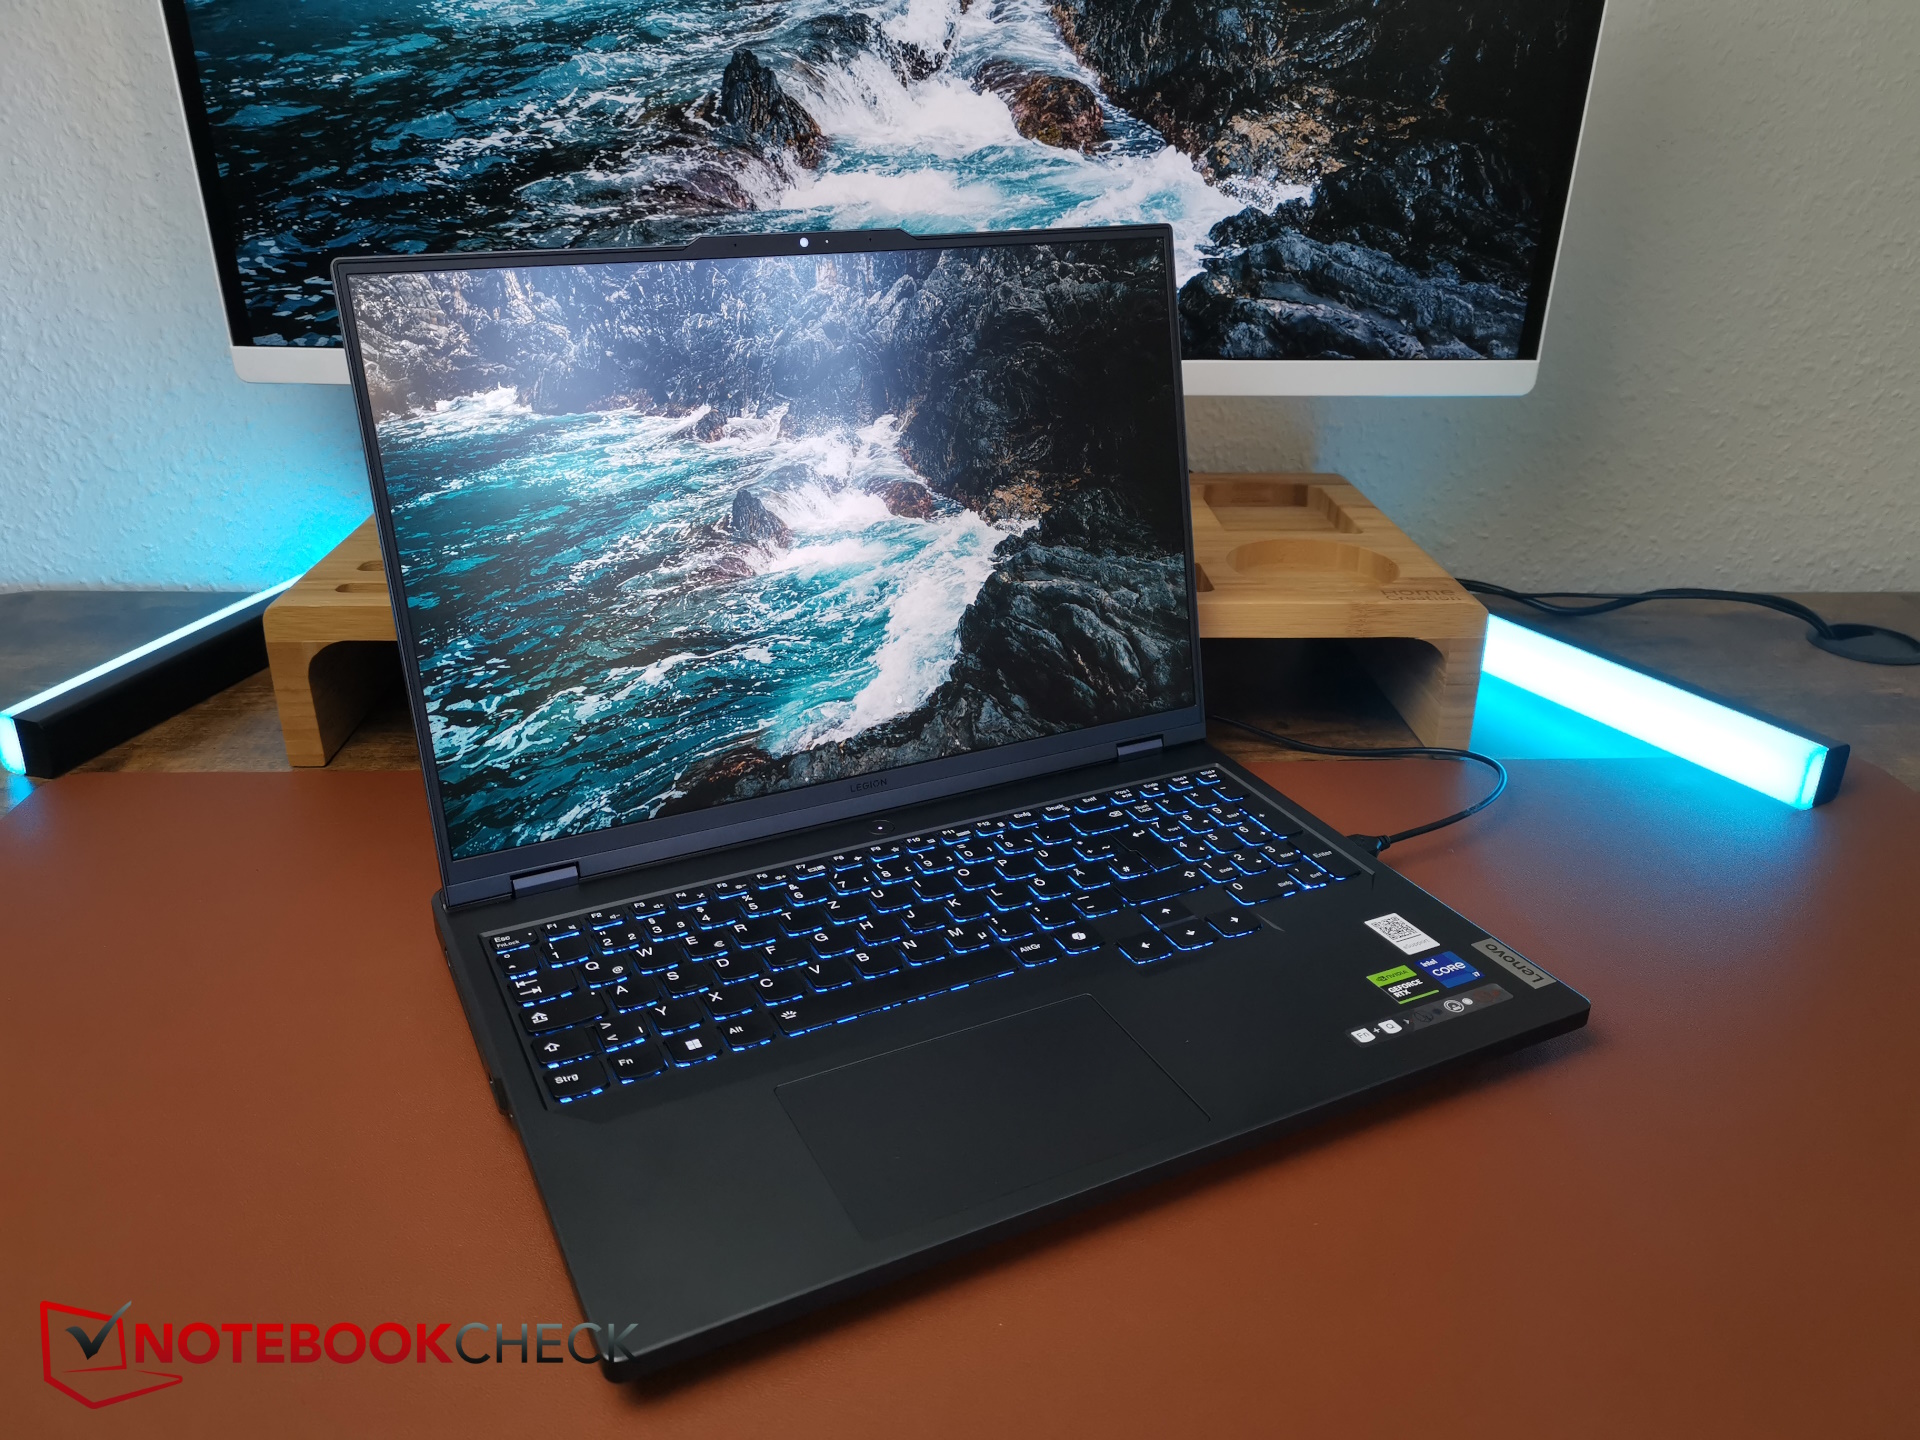
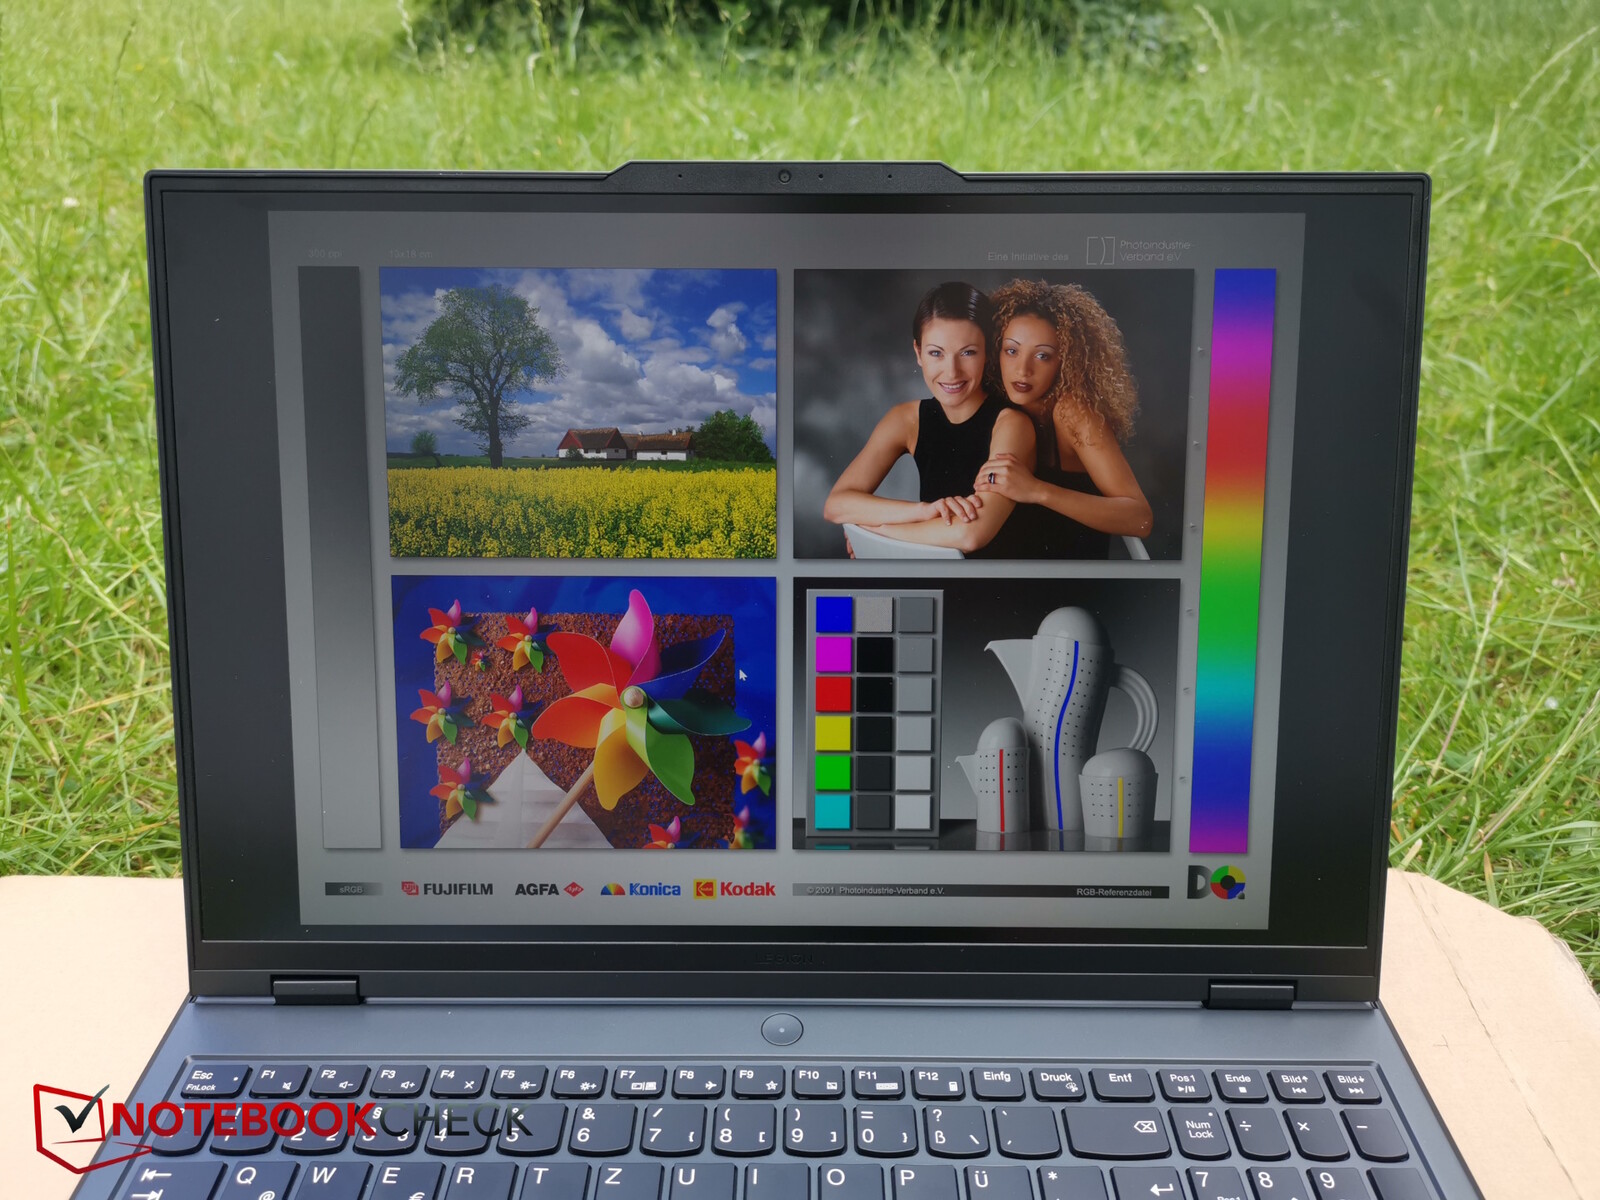
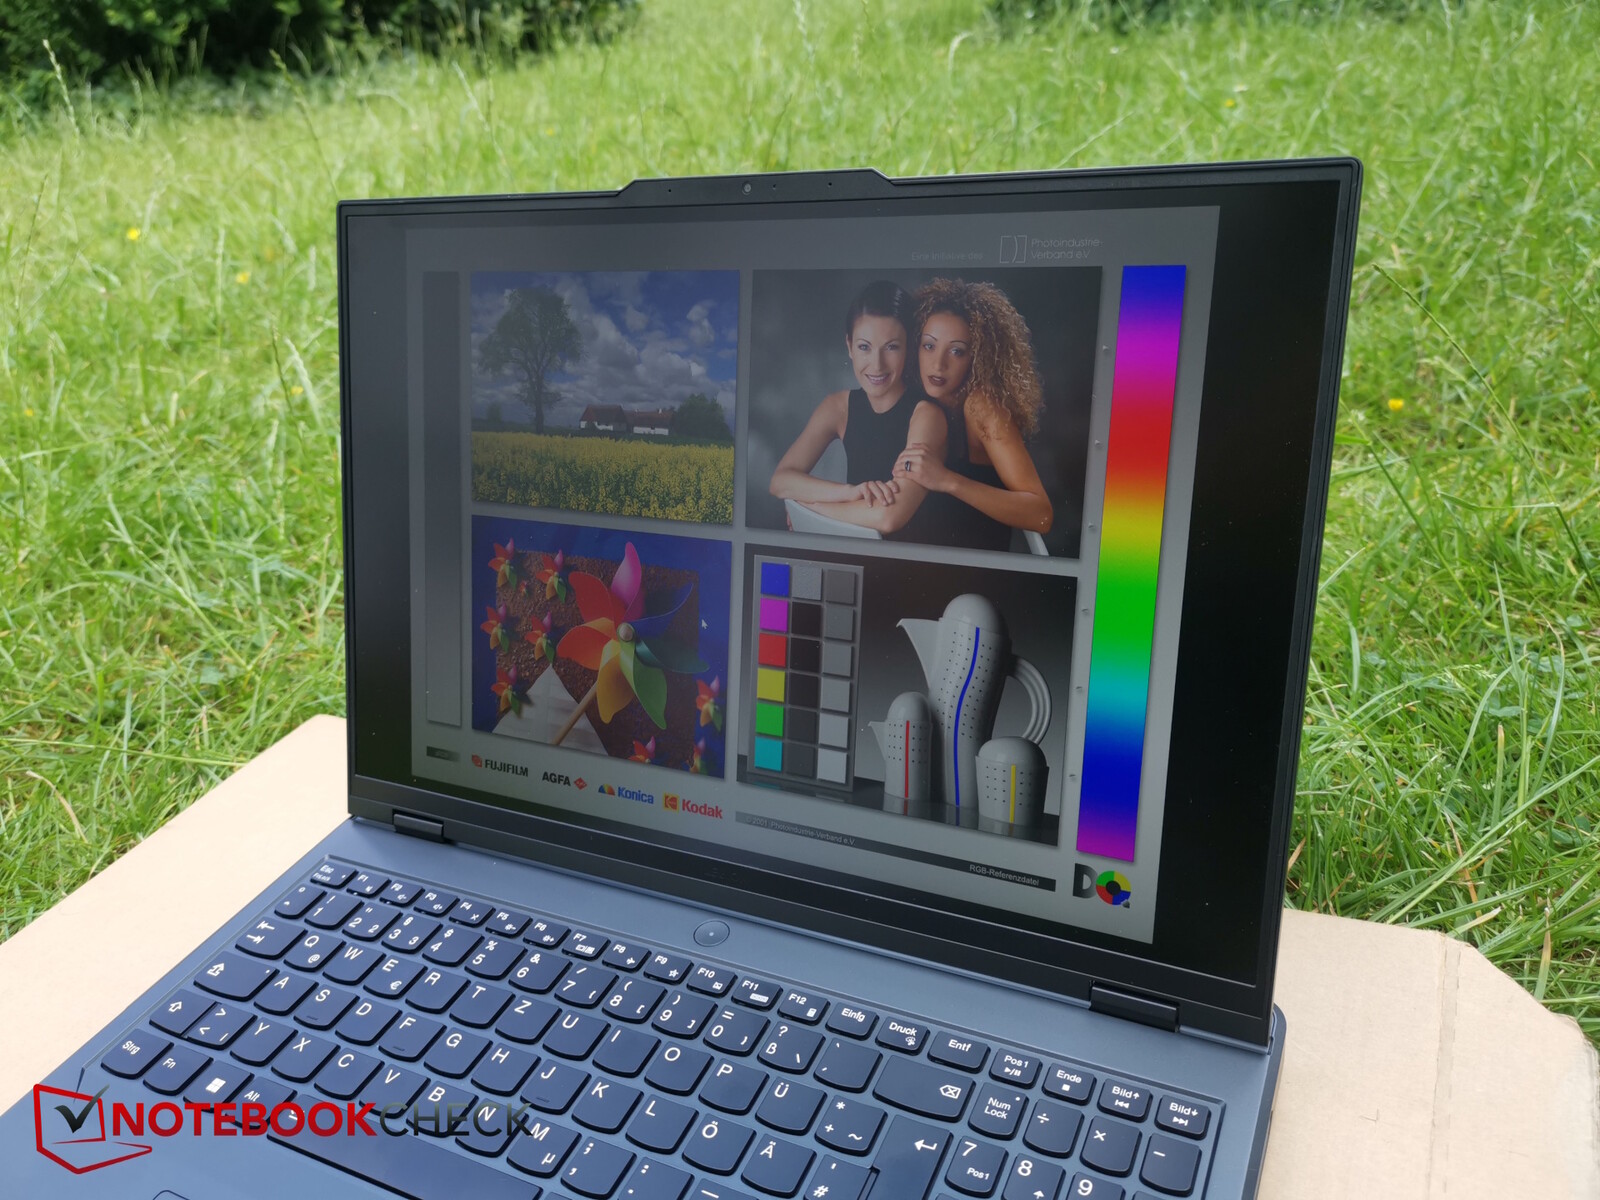
Ekran - İçerik oluşturucular için de bir Legion Pro
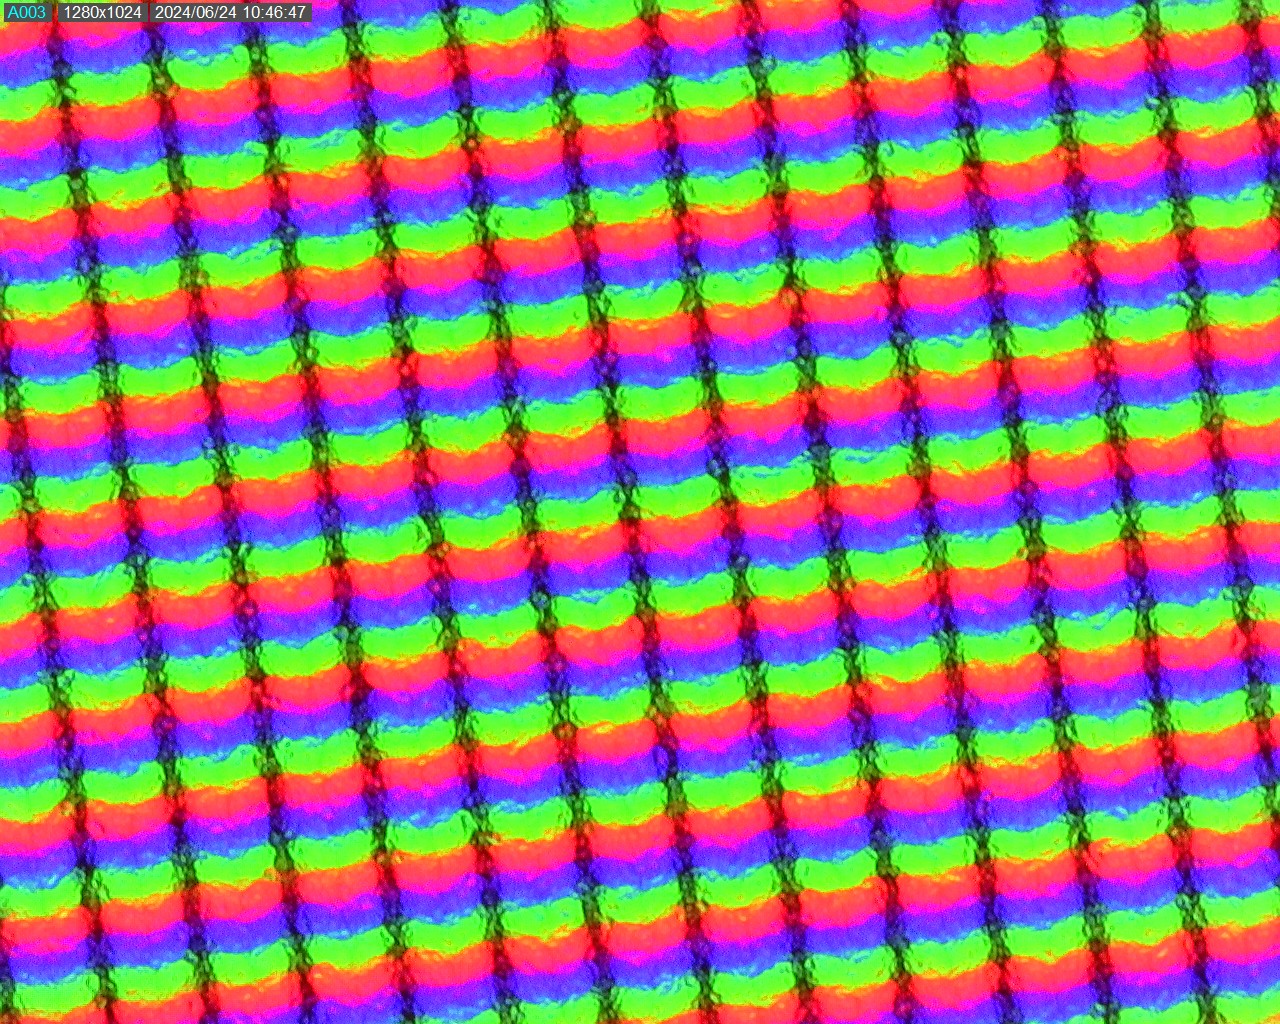

Lenovo bu dizüstü bilgisayara 2.560 x 1.600 piksel mat bir IPS ekran yerleştirmiştir. Bununla birlikte, hepsi aynı çözünürlüğe sahip üç ekran çeşidi sunuluyor. Giriş seviyesi modelin sRGB'yi kapsaması, 165 Hz yenileme hızına ve 300 nit parlaklığa sahip olması gerekiyor. Diğer iki model 500 nit parlaklığa ve 240 Hz yenileme hızına sahip ve bunlardan biri DCI-P3'ü de destekliyor. Test modelimiz 240 Hz yenileme hızına sahip 500 nit ekranlardan birine sahip.
Ortalama parlaklığı 491 nit olarak ölçtük ve yüzde 90'lık aydınlatması iyi. Bununla birlikte, siyah seviyesi biraz daha iyi olabilirdi, ancak kontrastı iyi.
Yaklaşık yüzde 58 parlaklıkta 150 nit kaydettik. PWM kullanmaz, bu nedenle ekran akması bir sorun değildir ve tepki süreleri bir IPS panel için oldukça hızlıdır.
| |||||||||||||||||||||||||
Aydınlatma: 90 %
Batarya modunda parlaklık: 518 cd/m²
Kontrast: 1439:1 (Siyah: 0.36 cd/m²)
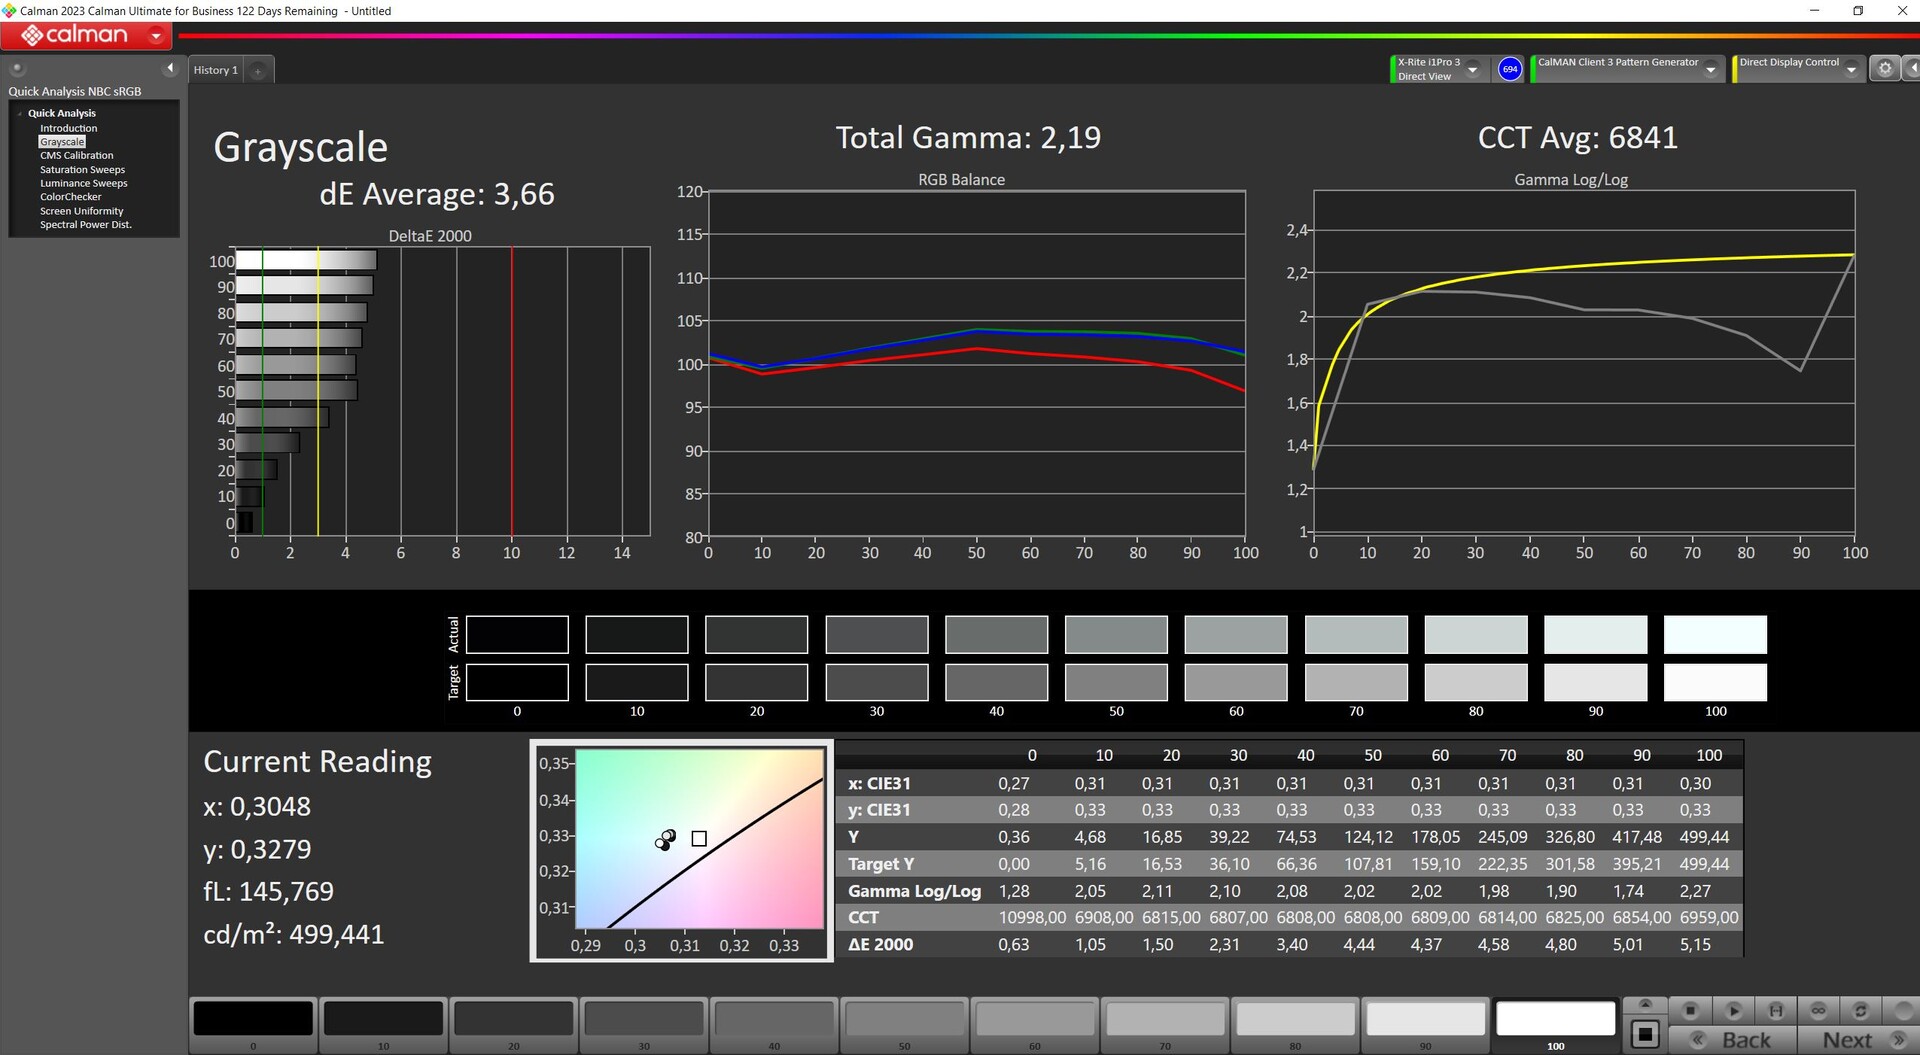
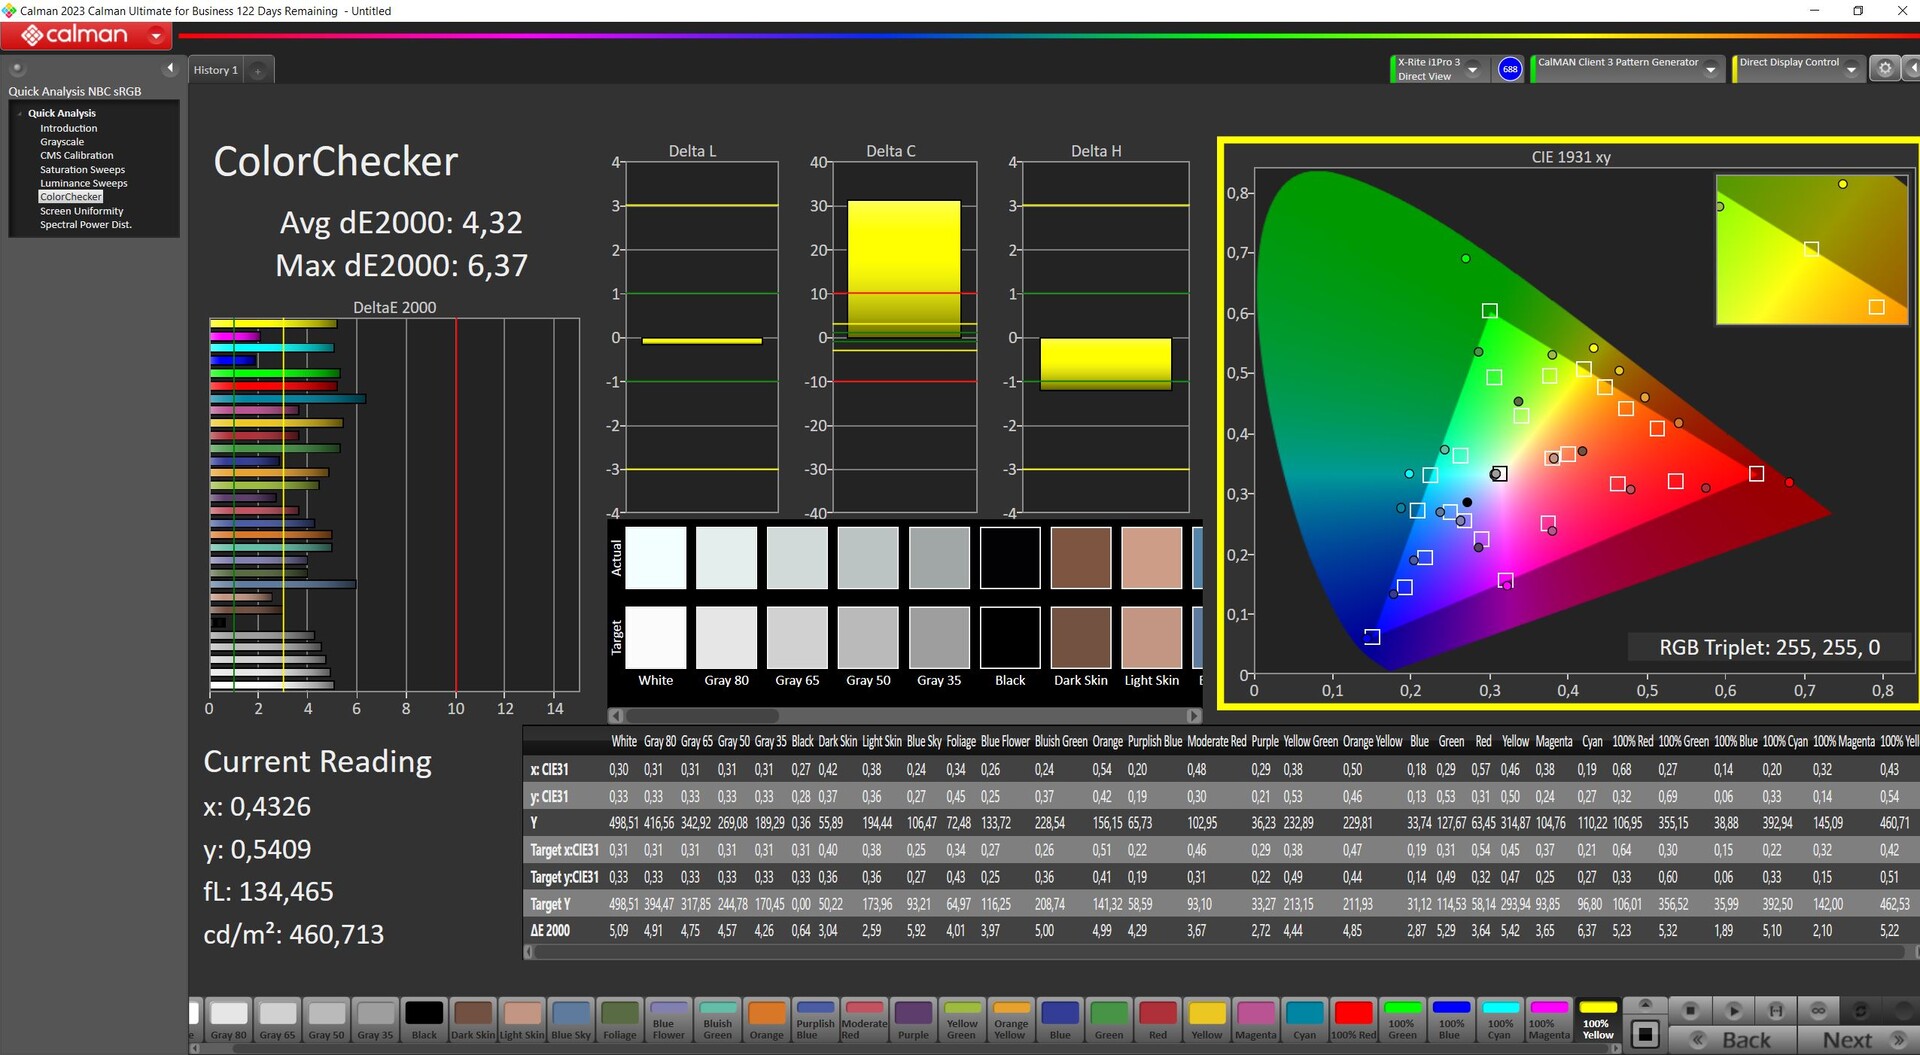
ΔE Color 4.32 | 0.5-29.43 Ø4.87, calibrated: 0.75
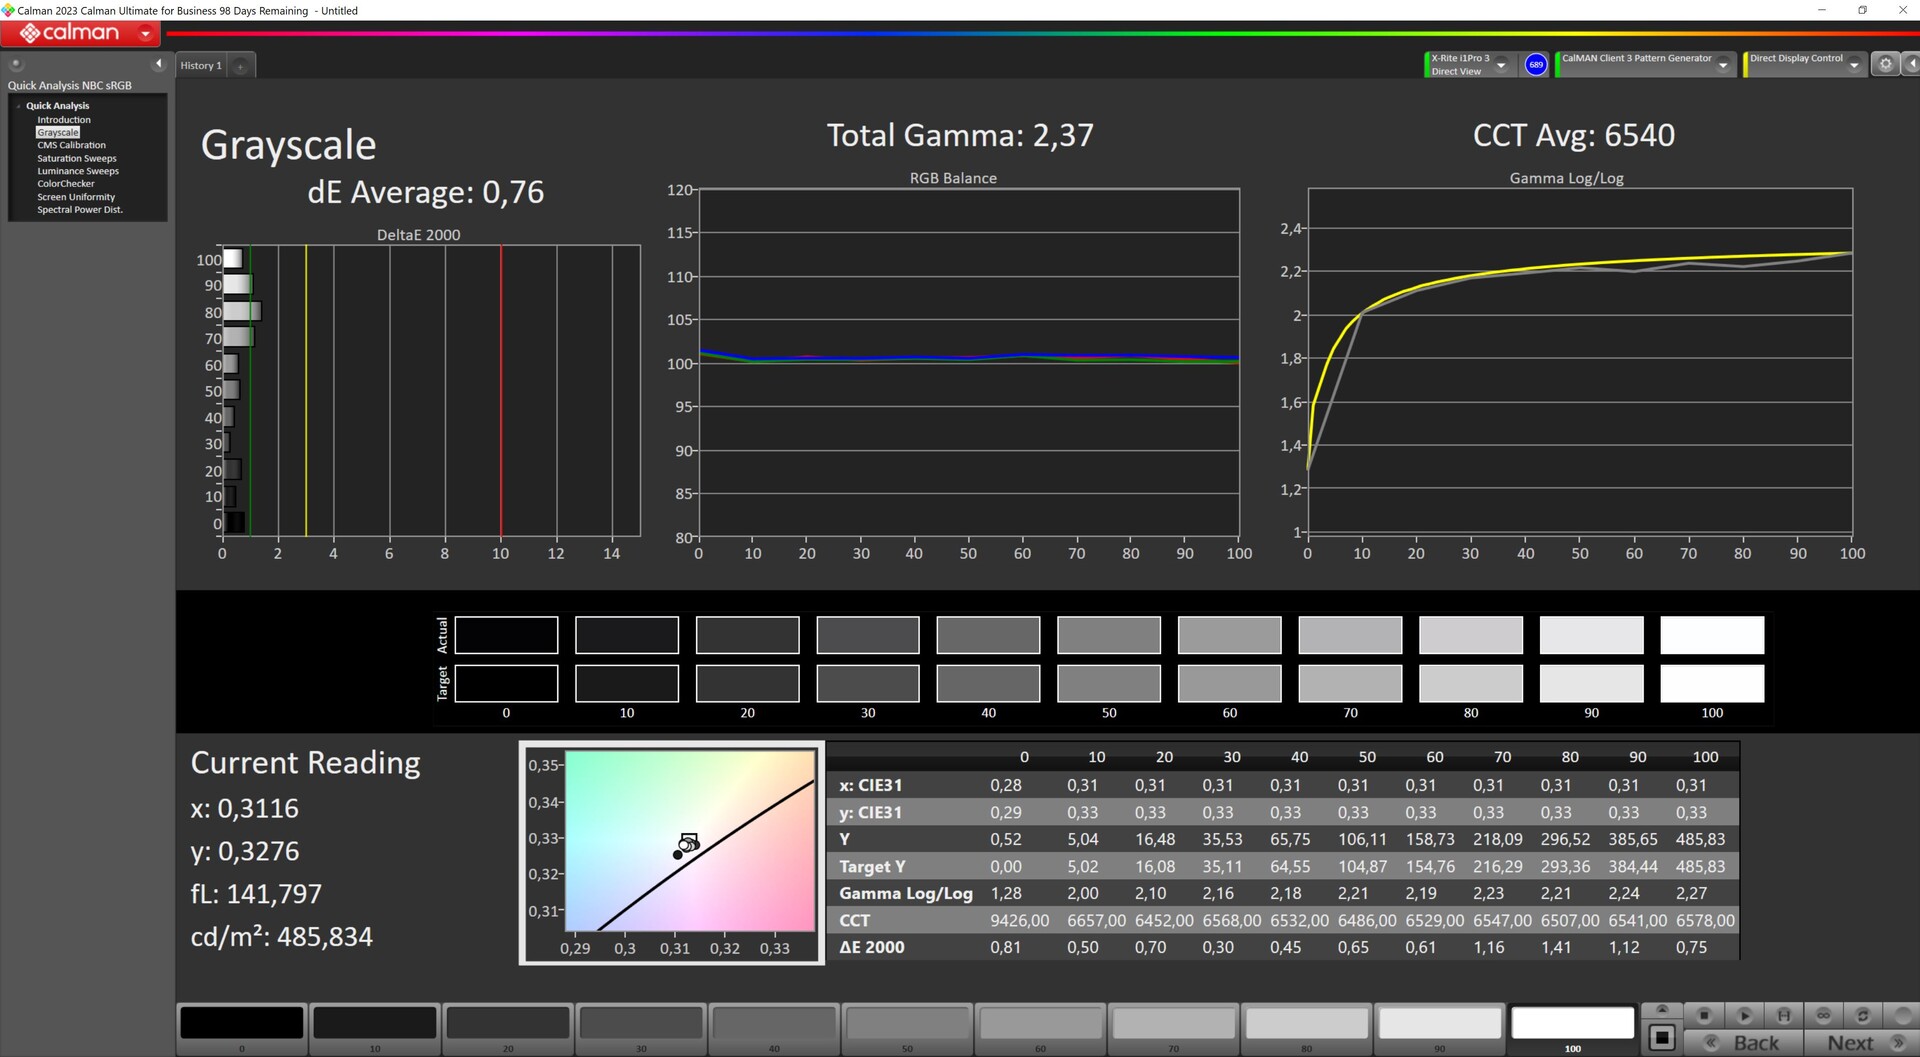
ΔE Greyscale 3.66 | 0.5-98 Ø5.1
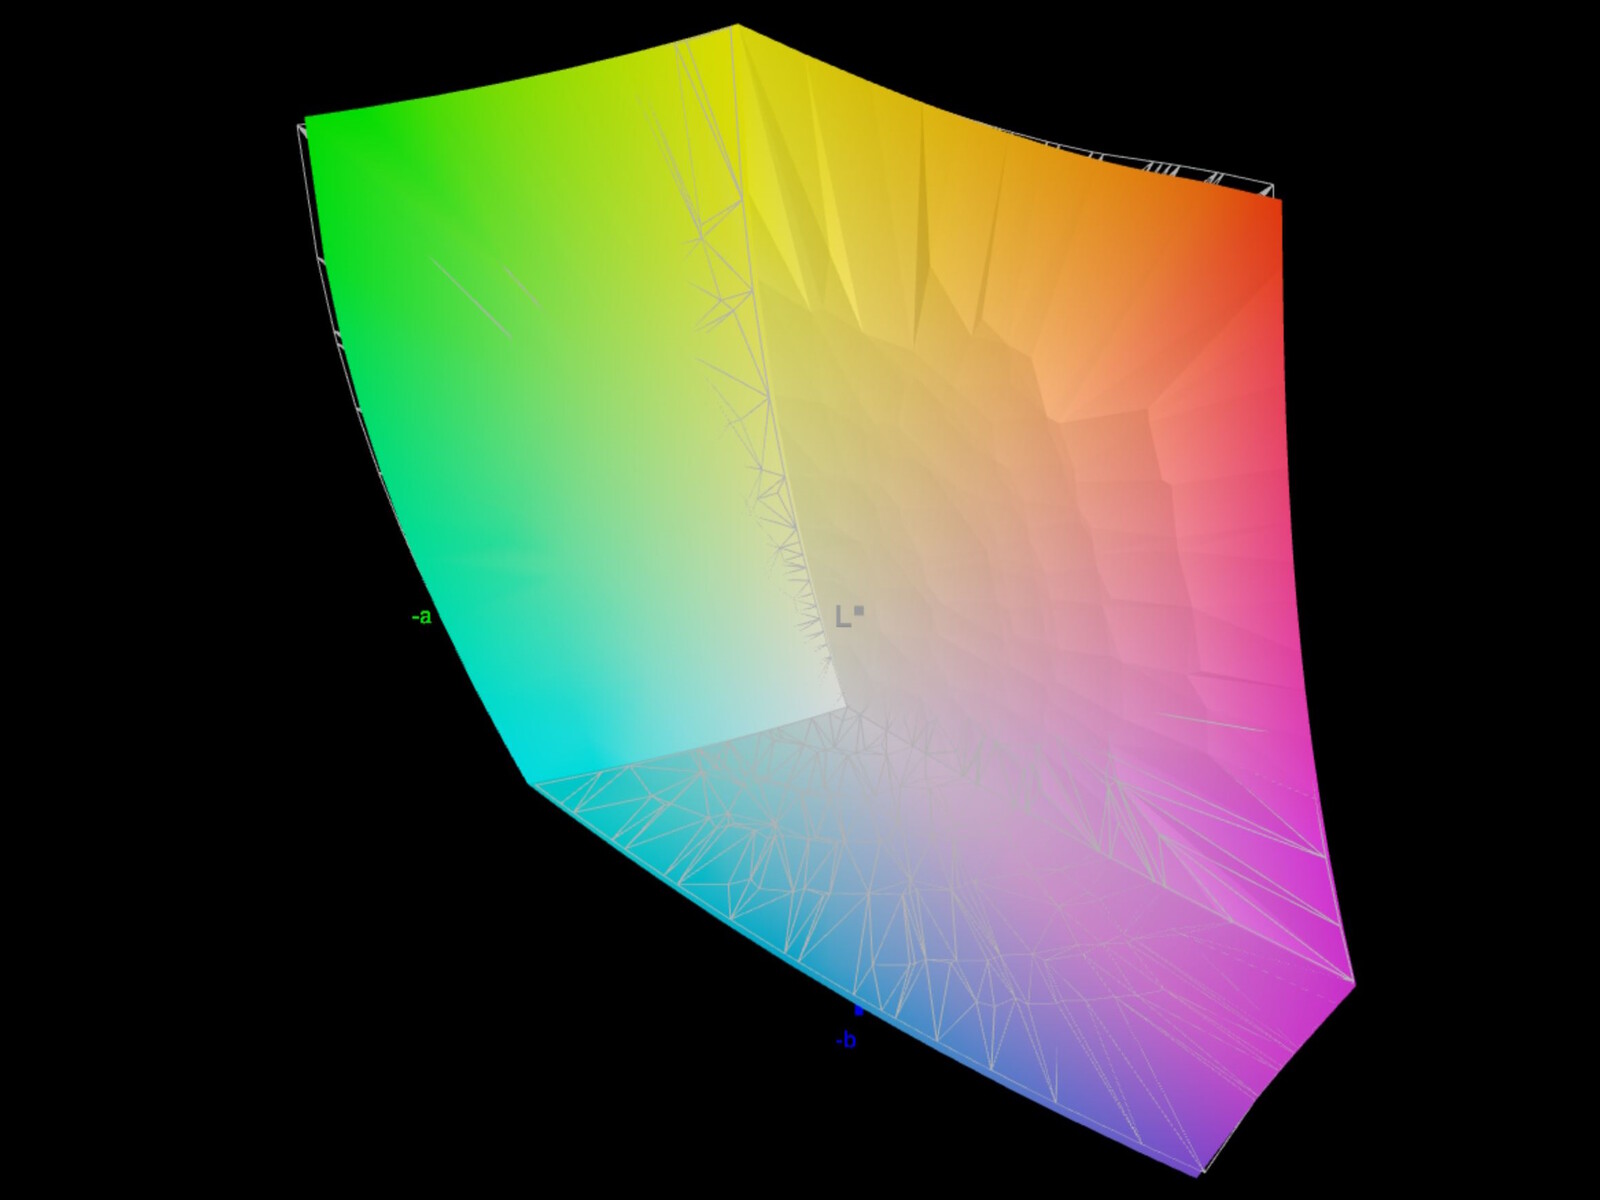
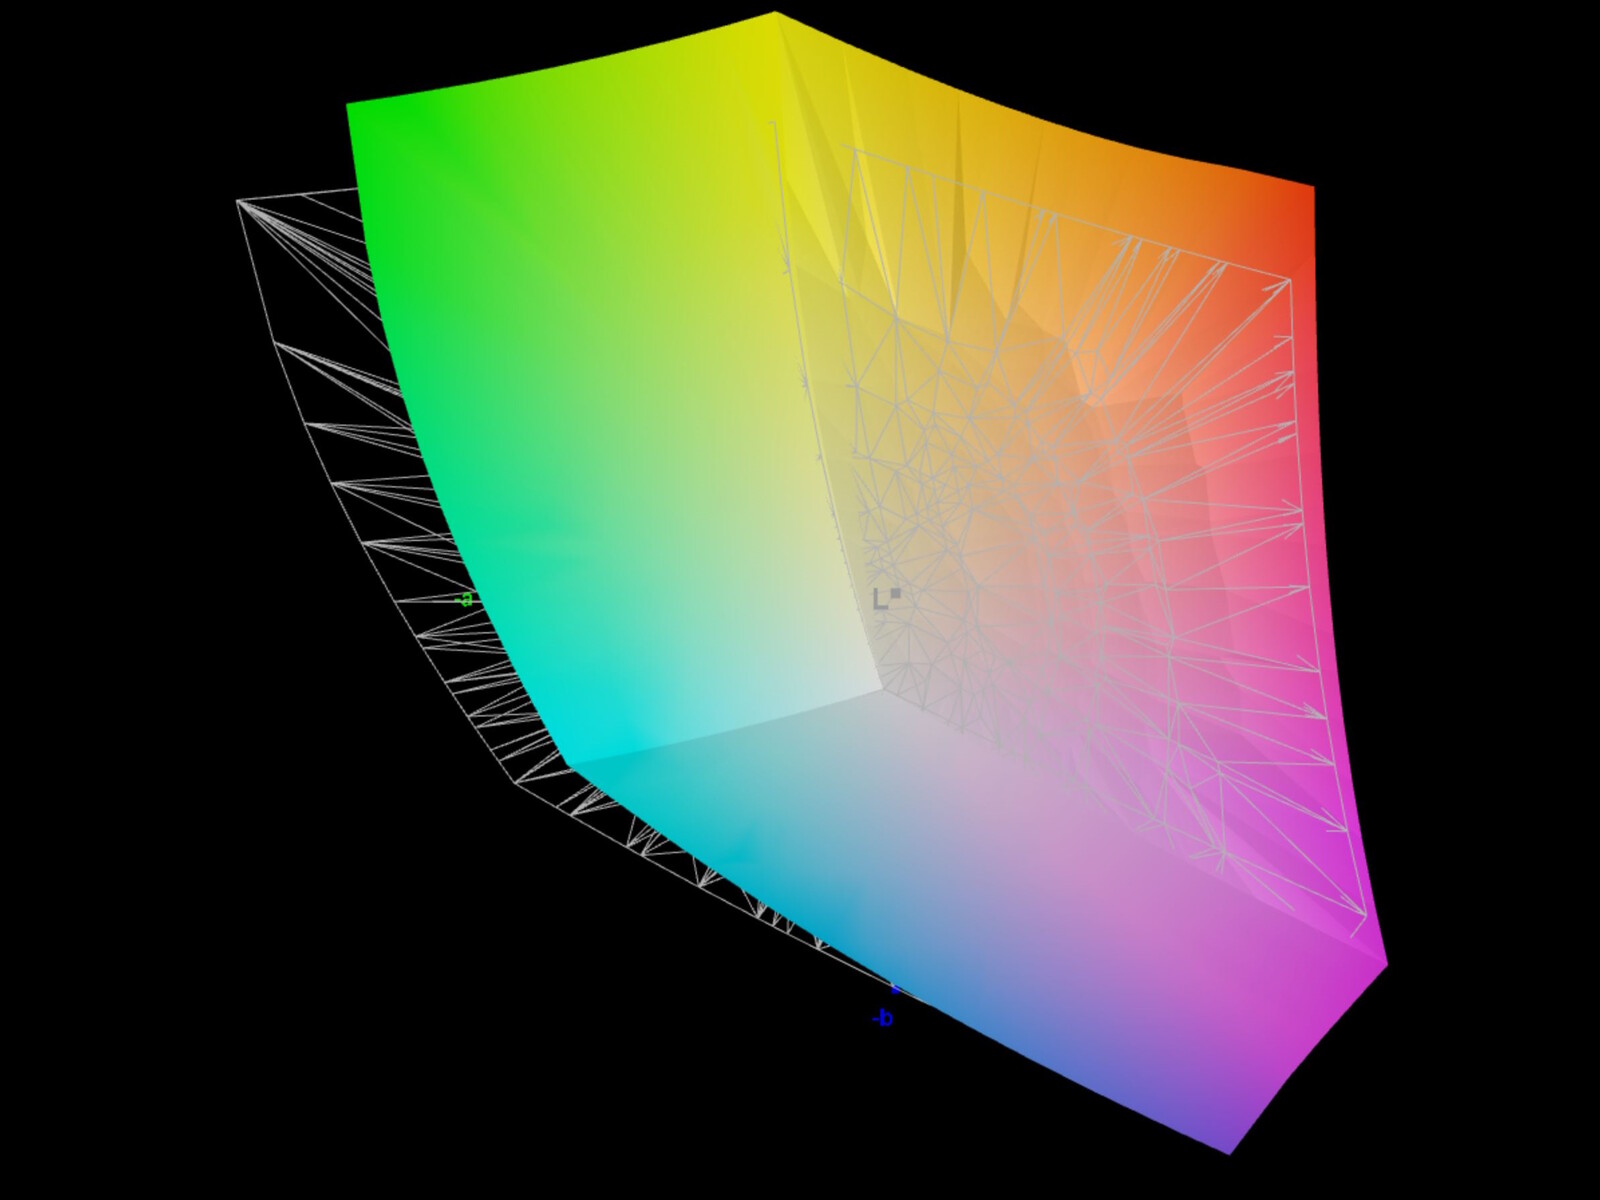
87.81% AdobeRGB 1998 (Argyll 2.2.0 3D)
99.93% sRGB (Argyll 2.2.0 3D)
99.22% Display P3 (Argyll 2.2.0 3D)
Gamma: 2.19
| Lenovo Legion Pro 5 16IRX9 G9 BOE NE160QDM-NZB, IPS, 2560x1600, 16" | HP Victus 16 (2024) Chi Mei CMN163E, IPS, 1920x1080, 16.1" | Dell G16, i7-13650HX, RTX 4060 Chi Mei CMN161D (160GME), IPS, 2560x1600, 16" | SCHENKER XMG Core 15 (M24) BOE NJ NE153QDM-NZ1 (BOE0C8E), IPS, 2560x1600, 15.3" | Lenovo Legion Pro 5 16IRX9 BOE NE160QDM-NYC, IPS, 2560x1600, 16" | Lenovo Legion 5 16IRX G9 NE160QDM-NZ3, IPS, 2560x1600, 16" | |
|---|---|---|---|---|---|---|
| Display | -49% | -18% | -14% | -17% | -14% | |
| Display P3 Coverage | 99.22 | 41.3 -58% | 67.5 -32% | 73.2 -26% | 69.3 -30% | 72.4 -27% |
| sRGB Coverage | 99.93 | 61.7 -38% | 98.5 -1% | 100 0% | 99.4 -1% | 100 0% |
| AdobeRGB 1998 Coverage | 87.81 | 42.7 -51% | 69.3 -21% | 74.6 -15% | 70.1 -20% | 74.1 -16% |
| Response Times | -300% | -36% | -50% | -73% | -78% | |
| Response Time Grey 50% / Grey 80% * | 4.8 ? | 28.6 ? -496% | 7.6 ? -58% | 9.6 ? -100% | 11.9 ? -148% | 12.5 ? -160% |
| Response Time Black / White * | 9.2 ? | 18.7 ? -103% | 10.4 ? -13% | 9.2 ? -0% | 8.9 ? 3% | 8.7 ? 5% |
| PWM Frequency | ||||||
| Screen | -76% | -22% | 3% | 12% | 21% | |
| Brightness middle | 518 | 287 -45% | 369 -29% | 635 23% | 384 -26% | 526 2% |
| Brightness | 491 | 288 -41% | 344 -30% | 604 23% | 366 -25% | 500 2% |
| Brightness Distribution | 90 | 86 -4% | 89 -1% | 91 1% | 91 1% | 87 -3% |
| Black Level * | 0.36 | 0.19 47% | 0.26 28% | 0.64 -78% | 0.35 3% | 0.33 8% |
| Contrast | 1439 | 1511 5% | 1419 -1% | 992 -31% | 1097 -24% | 1594 11% |
| Colorchecker dE 2000 * | 4.32 | 5.46 -26% | 3.04 30% | 1.89 56% | 0.97 78% | 1.2 72% |
| Colorchecker dE 2000 max. * | 6.37 | 20.36 -220% | 5.56 13% | 3.14 51% | 3.57 44% | 2.1 67% |
| Colorchecker dE 2000 calibrated * | 0.75 | 3.52 -369% | 2.35 -213% | 1.14 -52% | 0.77 -3% | 1 -33% |
| Greyscale dE 2000 * | 3.66 | 4.8 -31% | 3.38 8% | 2.53 31% | 1.5 59% | 1.3 64% |
| Gamma | 2.19 100% | 2.108 104% | 2.47 89% | 2.36 93% | 2.24 98% | 2.23 99% |
| CCT | 6841 95% | 6442 101% | 6040 108% | 6434 101% | 6709 97% | 6391 102% |
| Toplam Ortalama (Program / Ayarlar) | -142% /
-102% | -25% /
-23% | -20% /
-8% | -26% /
-6% | -24% /
-1% |
* ... daha küçük daha iyidir
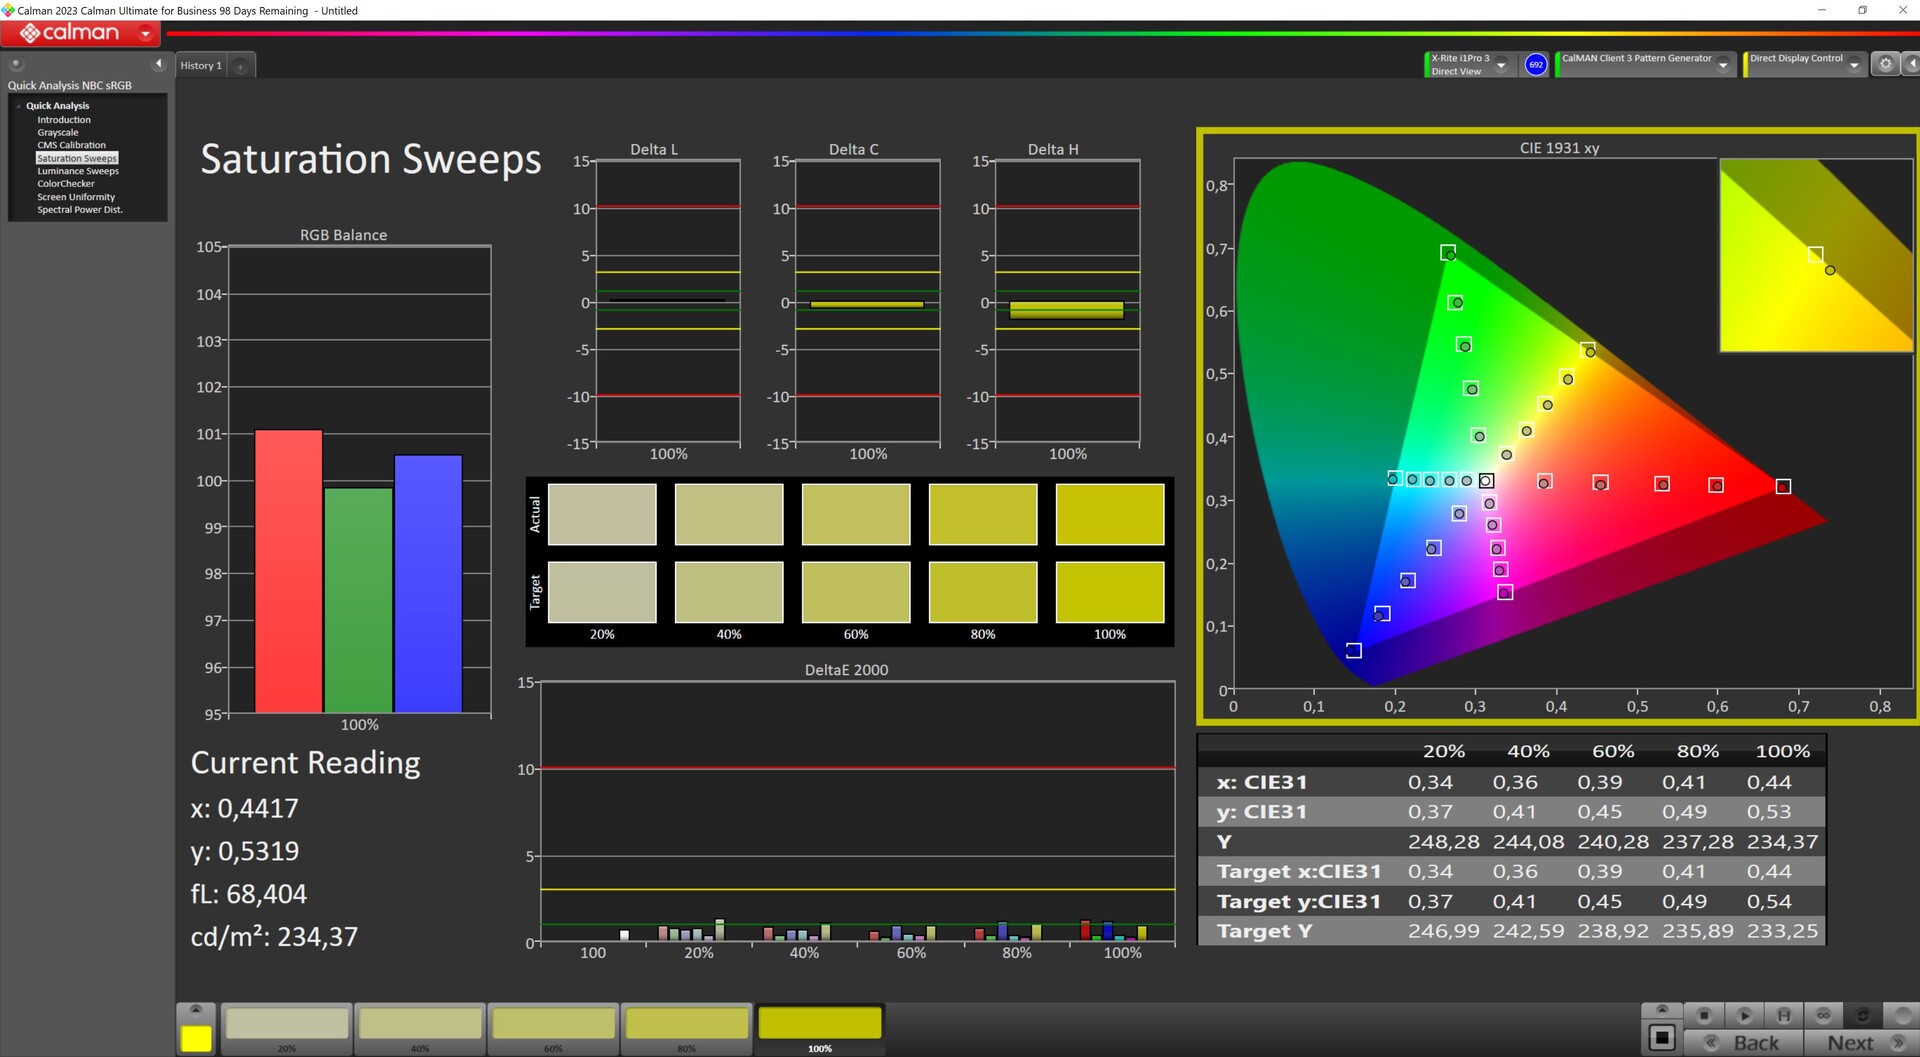
Hem sRGB hem de Display P3 neredeyse tamamen kapsanıyor ve AdobeRGB neredeyse yüzde 88 oranında kapsanıyor.

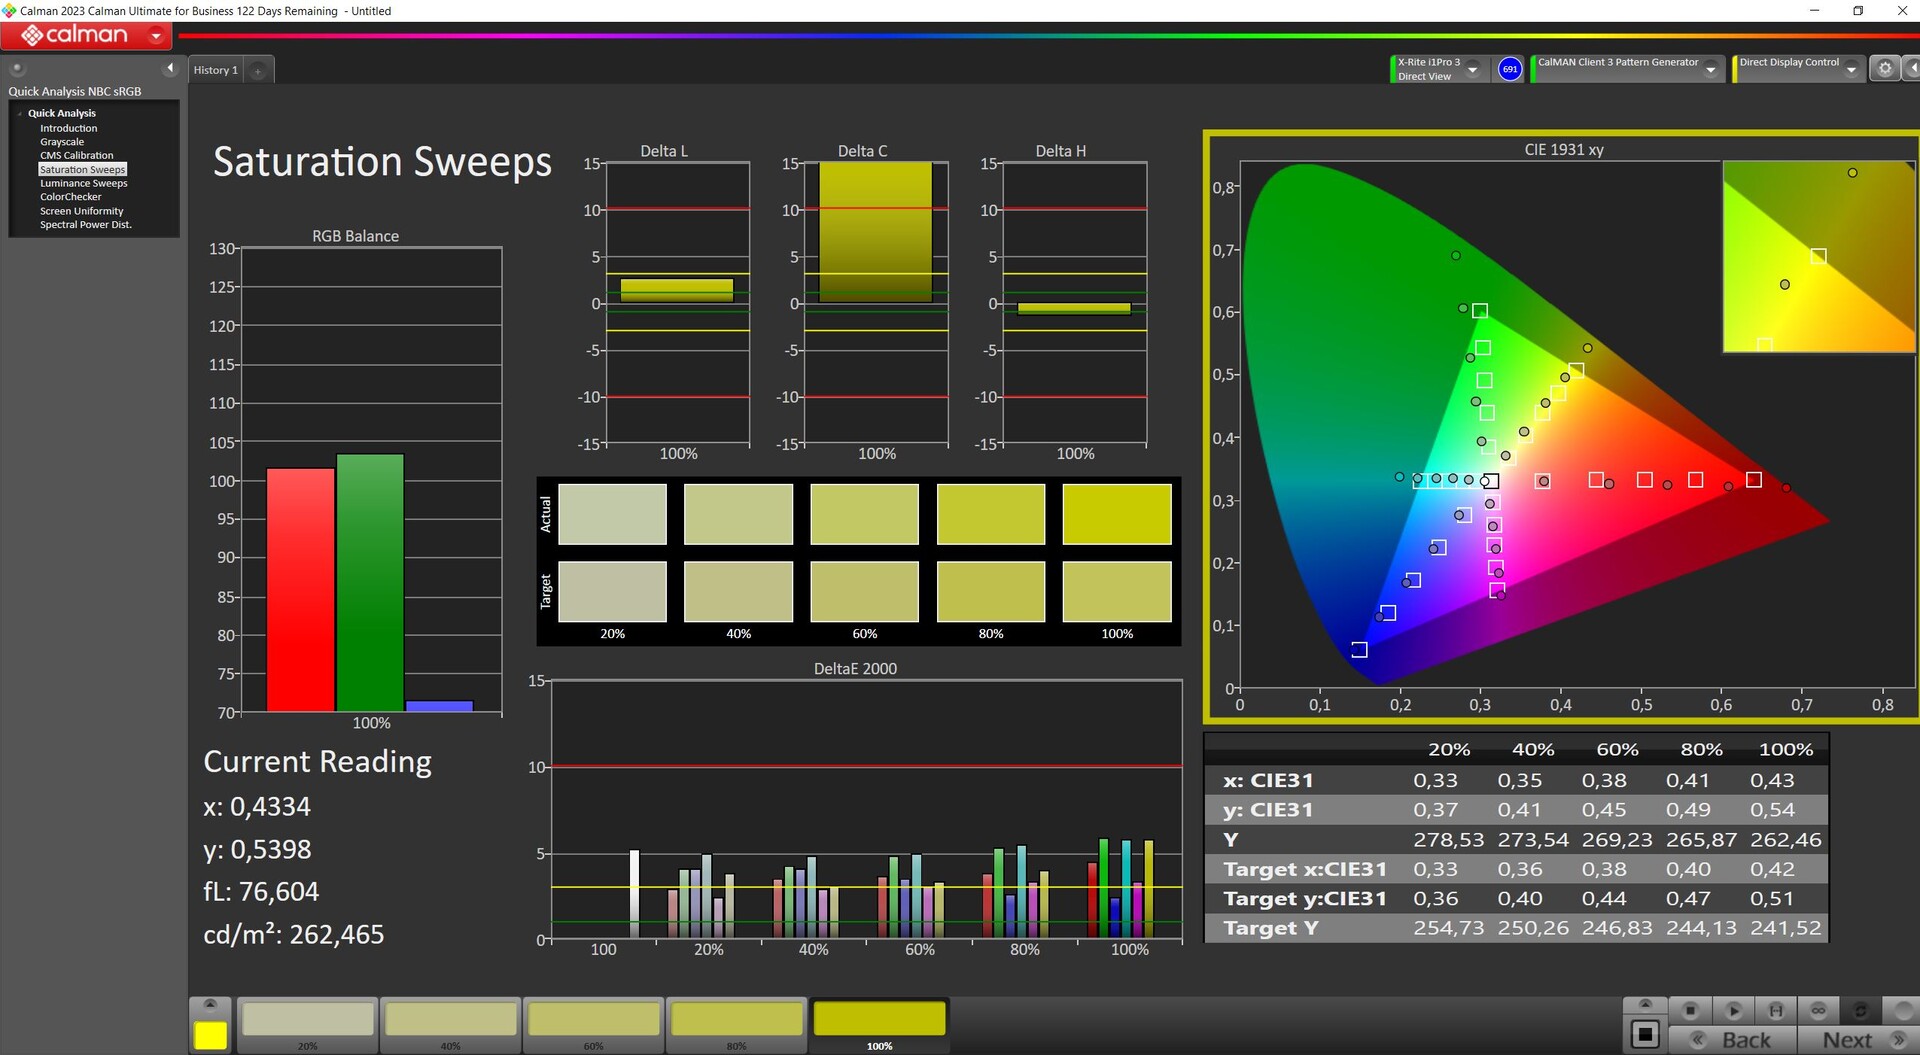
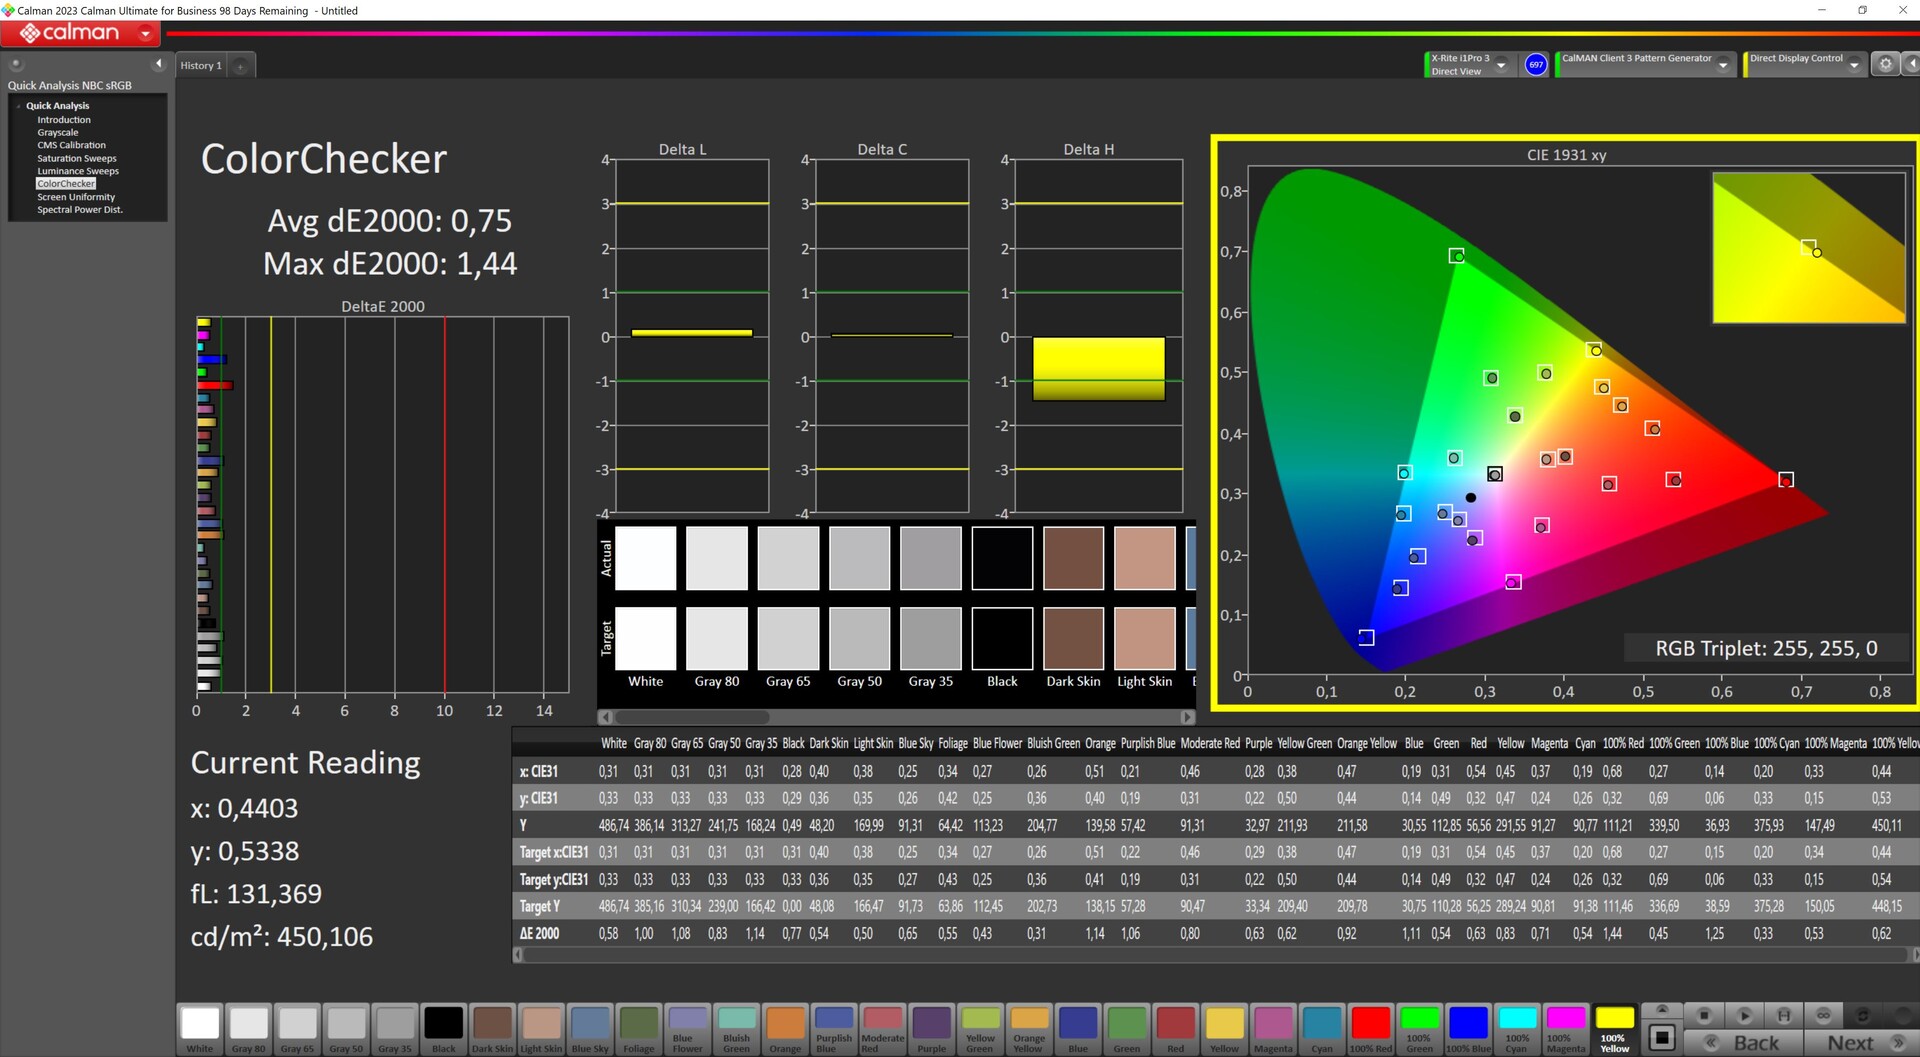
Kutudan çıkar çıkmaz, ekran tamamen optimum şekilde kalibre edilmemiştir. X-Rite i1Pro renk ölçüm cihazı ve Calman yazılımını kullanarak yaptığımız kalibrasyon, gri tonlama ve renk DeltaE değerlerini 1'in altına düşürdü.
Yanıt Sürelerini Görüntüle
| ↔ Tepki Süresi Siyahtan Beyaza | ||
|---|---|---|
| 9.2 ms ... yükseliş ↗ ve sonbahar↘ birleşimi | ↗ 4.6 ms yükseliş | 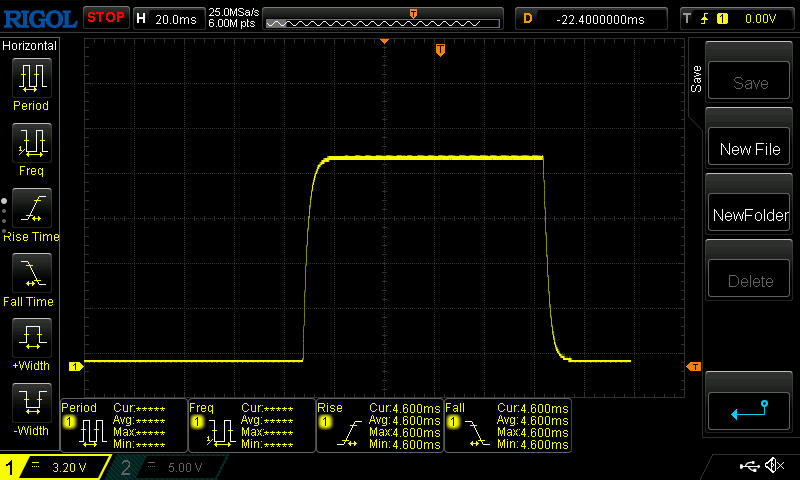 |
| ↘ 4.6 ms sonbahar | ||
| Ekran, testlerimizde hızlı yanıt oranları gösteriyor ve oyun oynamaya uygun olmalı. Karşılaştırıldığında, test edilen tüm cihazlar 0.1 (minimum) ile 240 (maksimum) ms arasında değişir. » Tüm cihazların 23 %'si daha iyi. Bu, ölçülen yanıt süresinin test edilen tüm cihazların ortalamasından (20.8 ms) daha iyi olduğu anlamına gelir. | ||
| ↔ Tepki Süresi %50 Griden %80 Griye | ||
| 4.8 ms ... yükseliş ↗ ve sonbahar↘ birleşimi | ↗ 2.2 ms yükseliş | 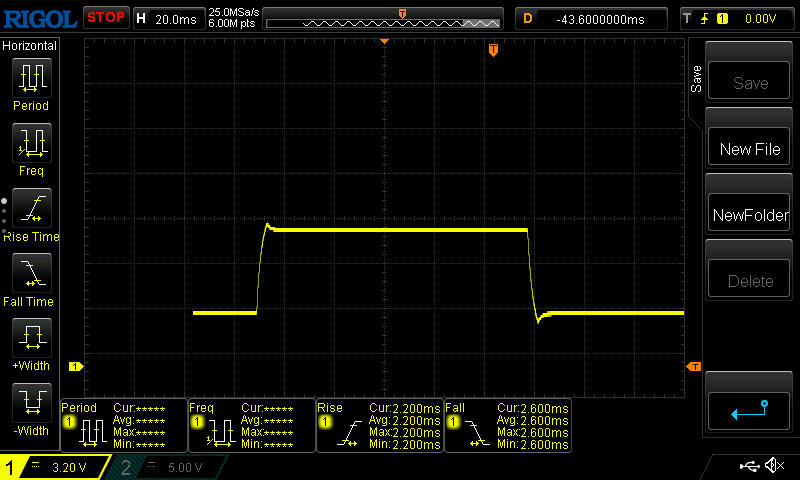 |
| ↘ 2.6 ms sonbahar | ||
| Ekran, testlerimizde çok hızlı yanıt oranları gösteriyor ve hızlı oyun oynamaya çok uygun olmalı. Karşılaştırıldığında, test edilen tüm cihazlar 0.165 (minimum) ile 636 (maksimum) ms arasında değişir. » Tüm cihazların 14 %'si daha iyi. Bu, ölçülen yanıt süresinin test edilen tüm cihazların ortalamasından (32.5 ms) daha iyi olduğu anlamına gelir. | ||
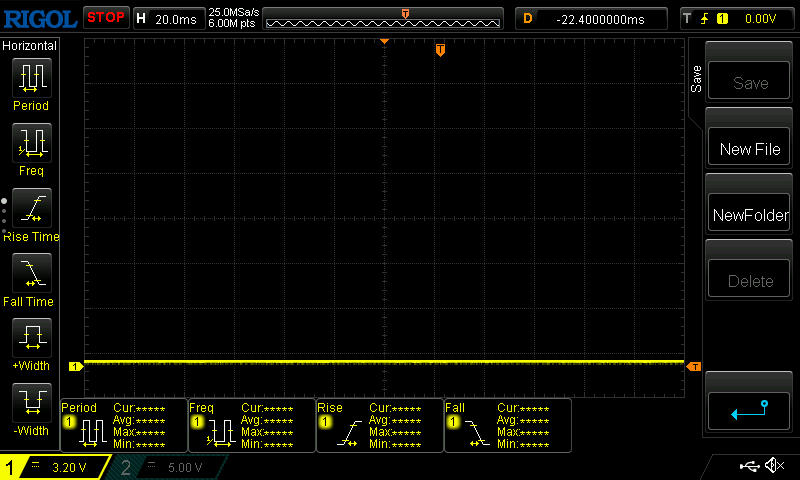
Ekran Titremesi / PWM (Darbe Genişliği Modülasyonu)
| Ekran titriyor / PWM algılanmadı | 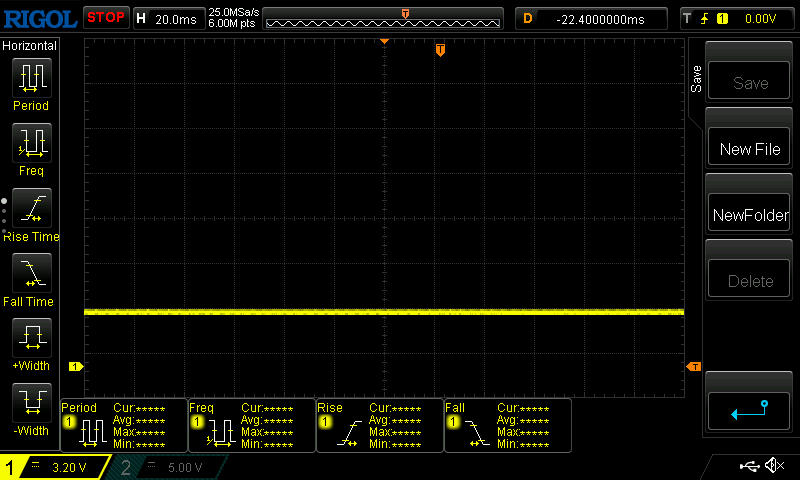 | ||
Karşılaştırıldığında: Test edilen tüm cihazların %53 %'si ekranı karartmak için PWM kullanmıyor. PWM tespit edilirse, ortalama 8516 (minimum: 5 - maksimum: 343500) Hz ölçüldü. | |||

Ekran yaklaşık 500 nit ile oldukça parlak olduğundan ve ayrıca mat bir yüzeye sahip olduğundan, çoğu yansıma azaltılır ve doğrudan baktığınız ve doğrudan güneş ışığından kaçındığınız sürece dizüstü bilgisayarı dışarıda iyi bir şekilde kullanabilirsiniz.
Performans - Pro 5i'nin mükemmel CPU ve oyun performansı
Üst düzey bileşenlere sahip Legion Pro 5i'nin aksine i9 14900HX ve RTX 4070 mevcut test cihazı, daha önce test ettiğimiz i7 14700HX ve bir RTX 4060. Bu, dizüstü bilgisayarın orta sınıf bir oyuncu olarak sınıflandırıldığı anlamına gelir.
Nispeten renk doğruluğu yüksek, parlak ekranı sayesinde Legion, tasarımı biraz daha ince olsa da muhtemelen pek çok içerik üreticisinin ilgisini çekecektir.
Test koşulları
Lenovo Vantage yazılımı, Legion Pro 5i'nin içinde bir kontrol merkezi görevi görür. Performans profillerine ek olarak, klavye aydınlatması ve güç kaynağından MUX anahtarı ve sistem güncellemelerine kadar çeşitli diğer ayarlar burada bulunabilir.
Aralarından seçim yapabileceğiniz üç önceden ayarlanmış performans profili vardır(performans, dengeli, sessiz) - dengeli modda bir AI motoru da eklenebilir ve çeşitli parametrelerin manuel olarak ayarlanabildiği başka bir özelleştirilmiş mod vardır.
Kıyaslamalarımız için GPU hız aşırtma olmadan performans modunu kullandık. Pil testlerimiz için sessiz mod kullanıldı. Zaman zaman, diğer performans modları için ölçülen değerleri de ekledik.


İşlemci
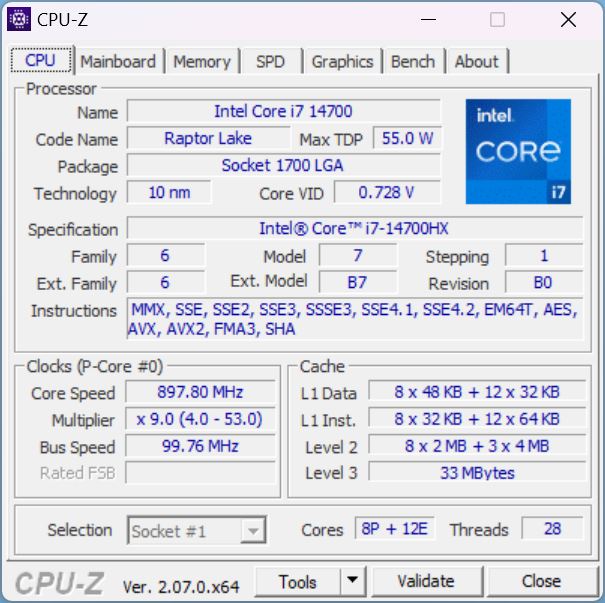
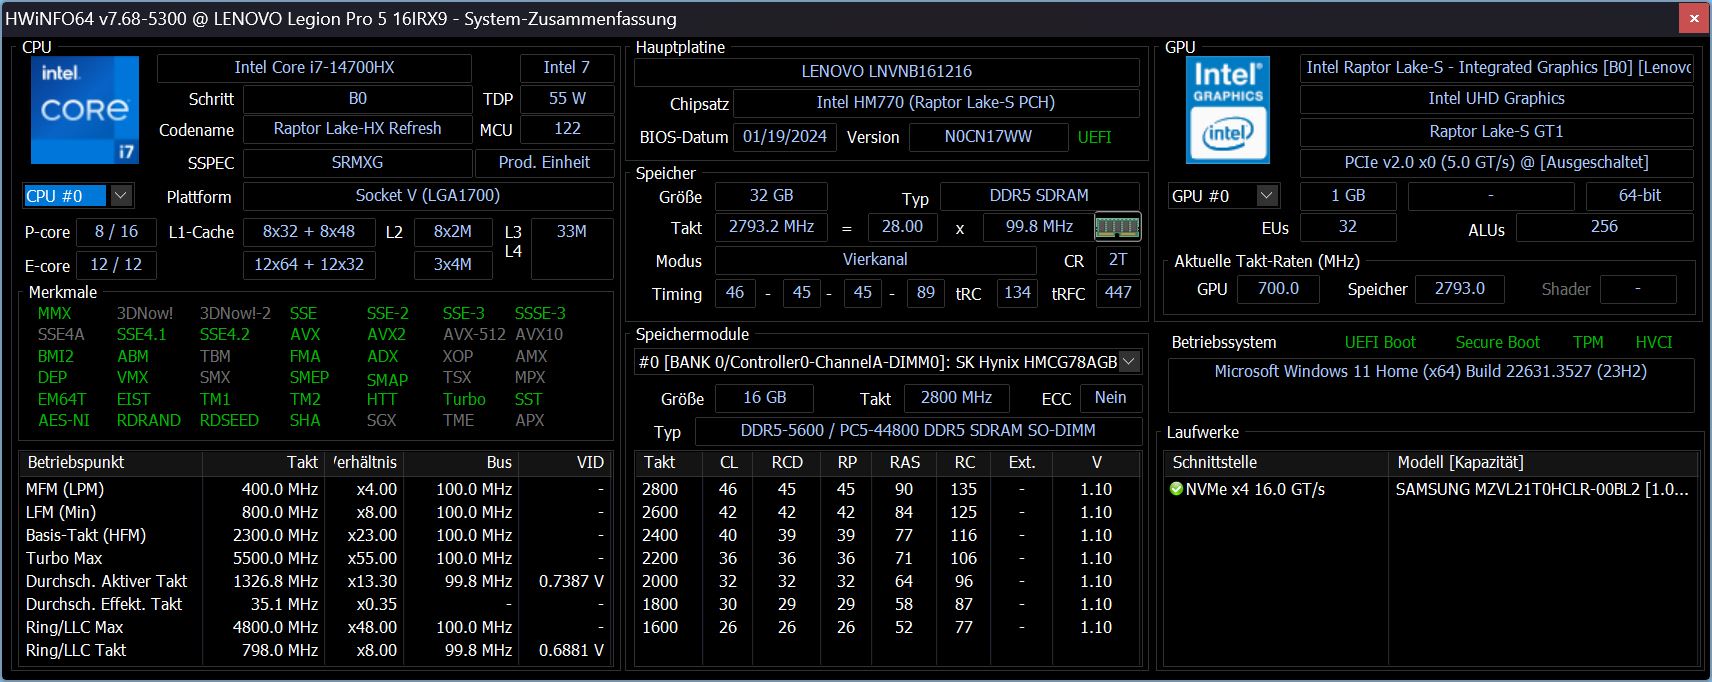
Bu Intel Core i7-14700HX yeni Raptor Lake HX Refresh serisine dayanan üst düzey bir CPU'dur. CPU 8 P ve 12 E çekirdeği içeriyor ve hyperthreading sayesinde aynı anda toplam 28 iş parçacığını işleyebiliyor.
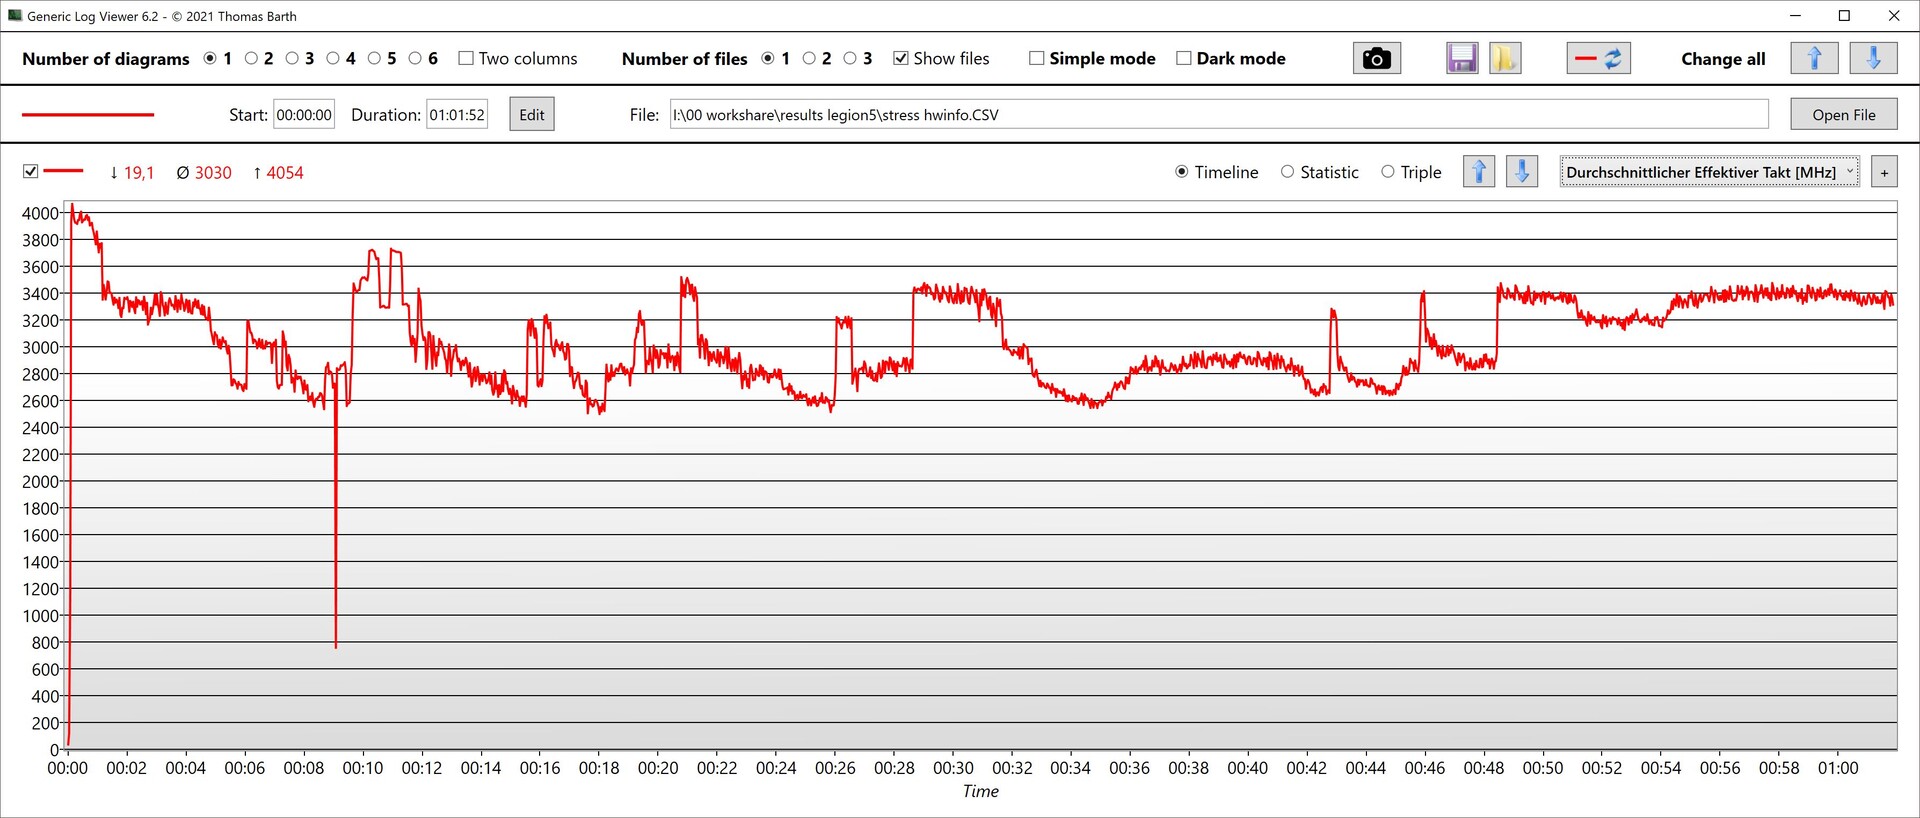
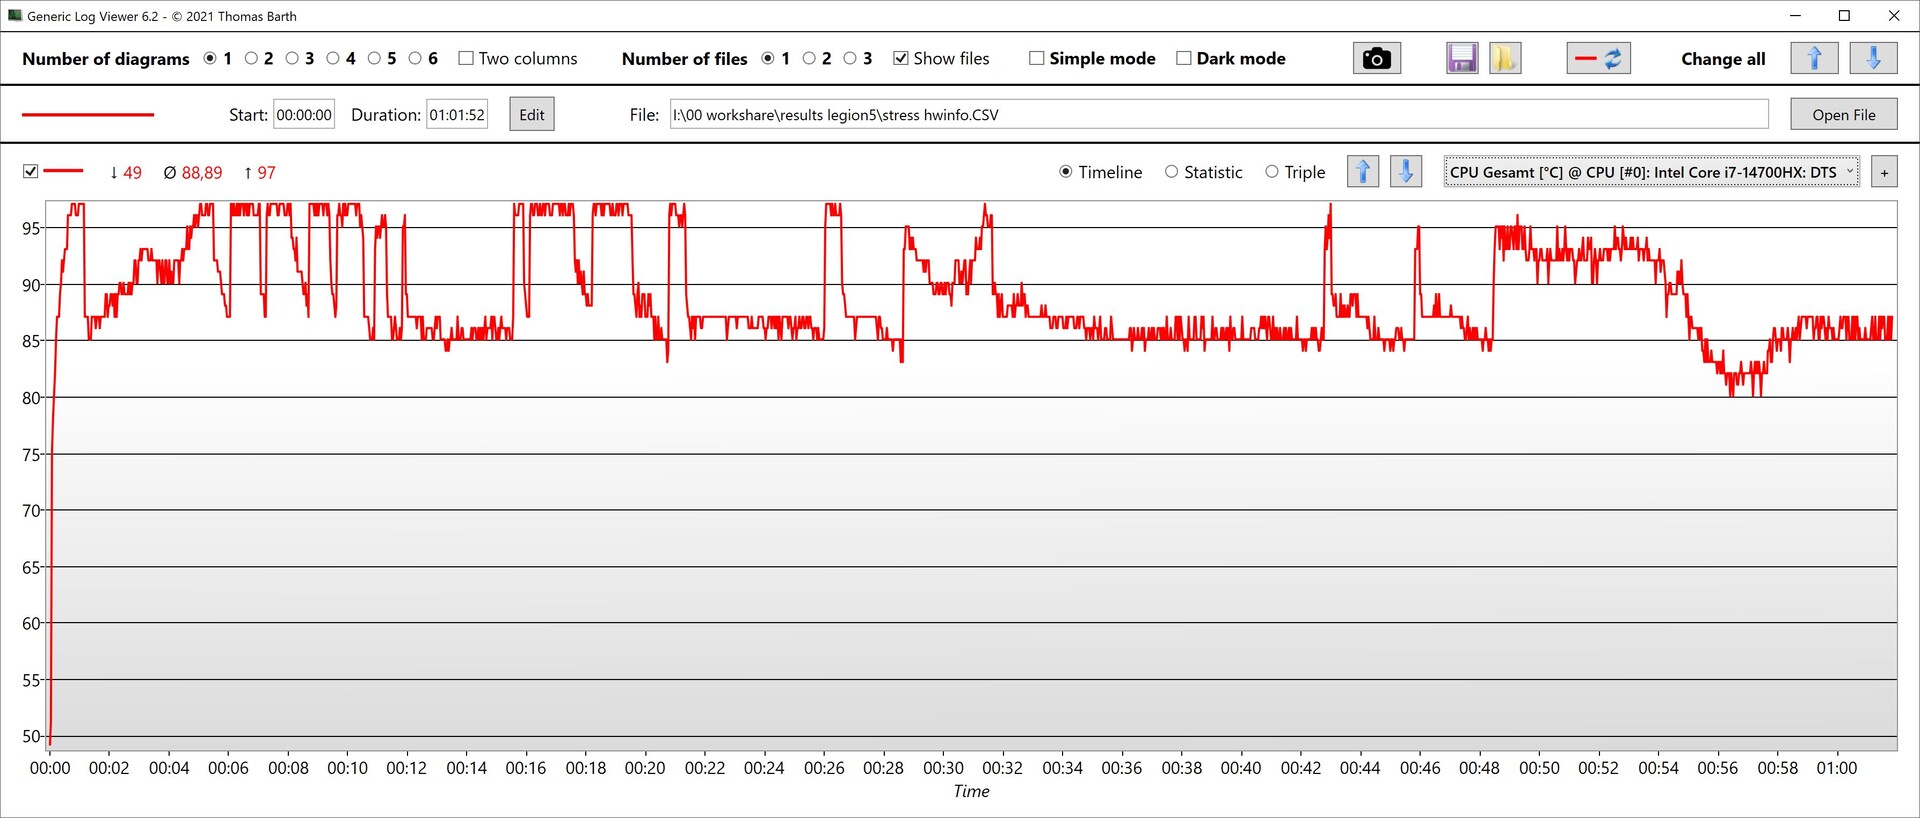
Döngü testimizde, CPU 30 dakika boyunca çok tutarlı ve yalnızca minimum performans kaybıyla performans gösterdi. Rakiplerin çoğundan daha iyi performans gösterdi - sadece Legion Pro 5i ile i9-14900HX
Ancak tüm kıyaslamalarda Legion Pro 5i'nin işlemcisinin etkileyici bir performans sergilediği ortaya çıktı. Veritabanımızdaki ortalama i7-14700HX'in yüzde 9 üzerinde ve i9-14900HX'in sadece yüzde 5 gerisinde kaldı.
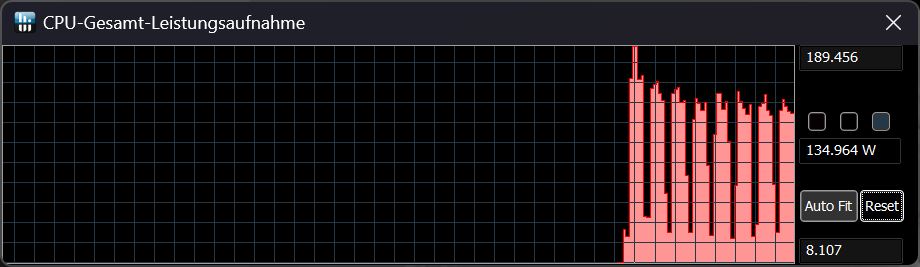
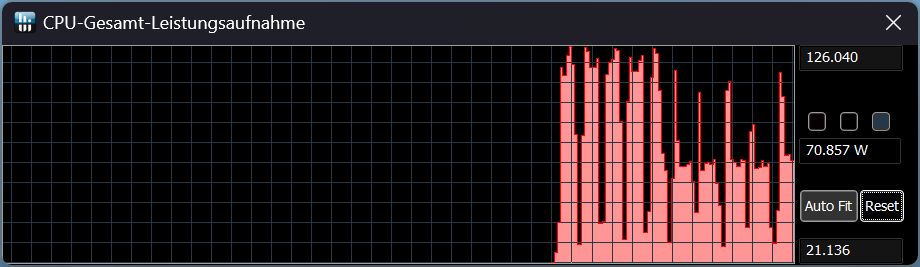
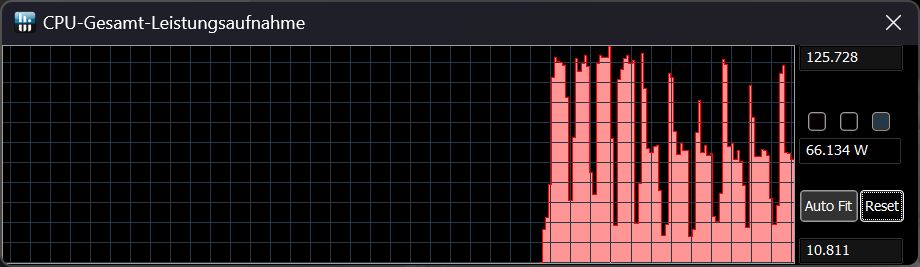
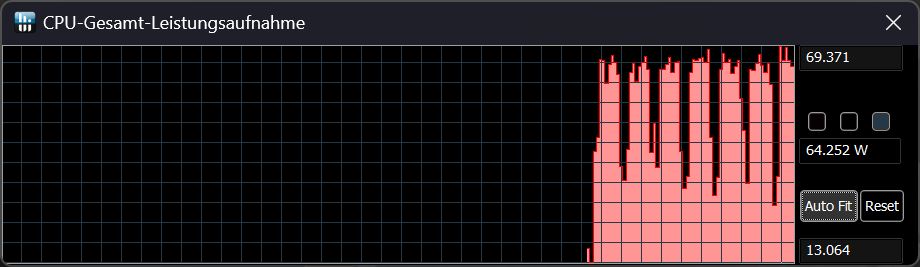
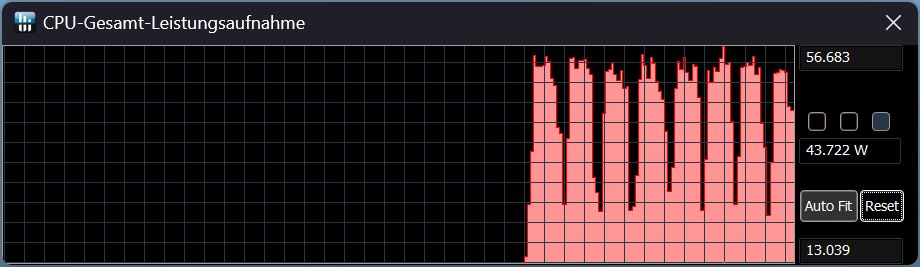
Şebeke bağlantısı kesildiğinde, Cinebench R15 Multi çalıştırıldığında CPU'nun performansının yaklaşık yüzde 44'ü kayboldu. Aşağıdaki tabloda performans profiline bağlı olarak Cinebench R15 Multi skorları ve TDP'leri, sağ tarafta ise ilgili modda karşılık gelen TDP eğrileri gösterilmektedir.
| Performans modu/ölçüm değeri | Cinebench R 15 Çoklu skor | TDP |
|---|---|---|
| Performans | 4137 | 190 - 130 |
| AI ile dengelenmiştir | 3650 | 125 - 70 |
| AI olmadan dengeli | 3367 | 125 - 65 |
| Sessiz | 2640 | 70 - 65 |
| Akü | 2302 | 56 - 45 |
Cinebench R15 Multi continuous test
Cinebench R23: Multi Core | Single Core
Cinebench R20: CPU (Multi Core) | CPU (Single Core)
Cinebench R15: CPU Multi 64Bit | CPU Single 64Bit
Blender: v2.79 BMW27 CPU
7-Zip 18.03: 7z b 4 | 7z b 4 -mmt1
Geekbench 6.4: Multi-Core | Single-Core
Geekbench 5.5: Multi-Core | Single-Core
HWBOT x265 Benchmark v2.2: 4k Preset
LibreOffice : 20 Documents To PDF
R Benchmark 2.5: Overall mean
| CPU Performance Rating | |
| Lenovo Legion Pro 5 16IRX9 | |
| Lenovo Legion Pro 5 16IRX9 G9 | |
| Lenovo Legion 5 16IRX G9 | |
| Ortalama Intel Core i7-14700HX | |
| Sınıf ortalaması Gaming | |
| HP Victus 16 (2024) | |
| SCHENKER XMG Core 15 (M24) | |
| Dell G16, i7-13650HX, RTX 4060 | |
| Cinebench R23 / Multi Core | |
| Lenovo Legion Pro 5 16IRX9 | |
| Lenovo Legion Pro 5 16IRX9 G9 | |
| Ortalama Intel Core i7-14700HX (22313 - 28122, n=7) | |
| Lenovo Legion 5 16IRX G9 | |
| HP Victus 16 (2024) | |
| Sınıf ortalaması Gaming (5668 - 39652, n=151, son 2 yıl) | |
| Dell G16, i7-13650HX, RTX 4060 | |
| SCHENKER XMG Core 15 (M24) | |
| Cinebench R23 / Single Core | |
| Lenovo Legion Pro 5 16IRX9 G9 | |
| Lenovo Legion Pro 5 16IRX9 | |
| Ortalama Intel Core i7-14700HX (1702 - 2144, n=7) | |
| Lenovo Legion 5 16IRX G9 | |
| Dell G16, i7-13650HX, RTX 4060 | |
| Sınıf ortalaması Gaming (1136 - 2252, n=151, son 2 yıl) | |
| SCHENKER XMG Core 15 (M24) | |
| HP Victus 16 (2024) | |
| Cinebench R20 / CPU (Multi Core) | |
| Lenovo Legion Pro 5 16IRX9 | |
| Lenovo Legion Pro 5 16IRX9 G9 | |
| Lenovo Legion 5 16IRX G9 | |
| HP Victus 16 (2024) | |
| Ortalama Intel Core i7-14700HX (8361 - 10498, n=7) | |
| Sınıf ortalaması Gaming (2179 - 15517, n=151, son 2 yıl) | |
| Dell G16, i7-13650HX, RTX 4060 | |
| SCHENKER XMG Core 15 (M24) | |
| Cinebench R20 / CPU (Single Core) | |
| Lenovo Legion Pro 5 16IRX9 G9 | |
| Lenovo Legion Pro 5 16IRX9 | |
| Ortalama Intel Core i7-14700HX (651 - 821, n=7) | |
| Lenovo Legion 5 16IRX G9 | |
| Sınıf ortalaması Gaming (439 - 866, n=151, son 2 yıl) | |
| Dell G16, i7-13650HX, RTX 4060 | |
| SCHENKER XMG Core 15 (M24) | |
| HP Victus 16 (2024) | |
| Cinebench R15 / CPU Multi 64Bit | |
| Lenovo Legion Pro 5 16IRX9 | |
| Lenovo Legion Pro 5 16IRX9 G9 | |
| HP Victus 16 (2024) | |
| Lenovo Legion 5 16IRX G9 | |
| Ortalama Intel Core i7-14700HX (3328 - 4137, n=7) | |
| Sınıf ortalaması Gaming (905 - 6074, n=154, son 2 yıl) | |
| Dell G16, i7-13650HX, RTX 4060 | |
| SCHENKER XMG Core 15 (M24) | |
| Cinebench R15 / CPU Single 64Bit | |
| Lenovo Legion Pro 5 16IRX9 G9 | |
| Lenovo Legion Pro 5 16IRX9 | |
| Lenovo Legion 5 16IRX G9 | |
| Ortalama Intel Core i7-14700HX (238 - 304, n=7) | |
| SCHENKER XMG Core 15 (M24) | |
| Sınıf ortalaması Gaming (191.9 - 343, n=151, son 2 yıl) | |
| Dell G16, i7-13650HX, RTX 4060 | |
| HP Victus 16 (2024) | |
| Blender / v2.79 BMW27 CPU | |
| SCHENKER XMG Core 15 (M24) | |
| Sınıf ortalaması Gaming (81 - 555, n=144, son 2 yıl) | |
| HP Victus 16 (2024) | |
| Dell G16, i7-13650HX, RTX 4060 | |
| Ortalama Intel Core i7-14700HX (126 - 184, n=7) | |
| Lenovo Legion 5 16IRX G9 | |
| Lenovo Legion Pro 5 16IRX9 G9 | |
| Lenovo Legion Pro 5 16IRX9 | |
| 7-Zip 18.03 / 7z b 4 | |
| Lenovo Legion Pro 5 16IRX9 | |
| Lenovo Legion Pro 5 16IRX9 G9 | |
| Ortalama Intel Core i7-14700HX (84799 - 104730, n=7) | |
| Lenovo Legion 5 16IRX G9 | |
| HP Victus 16 (2024) | |
| Sınıf ortalaması Gaming (23795 - 144064, n=149, son 2 yıl) | |
| Dell G16, i7-13650HX, RTX 4060 | |
| SCHENKER XMG Core 15 (M24) | |
| 7-Zip 18.03 / 7z b 4 -mmt1 | |
| Lenovo Legion Pro 5 16IRX9 G9 | |
| Lenovo Legion Pro 5 16IRX9 | |
| Lenovo Legion 5 16IRX G9 | |
| Ortalama Intel Core i7-14700HX (5641 - 7041, n=7) | |
| SCHENKER XMG Core 15 (M24) | |
| Sınıf ortalaması Gaming (4199 - 7573, n=149, son 2 yıl) | |
| Dell G16, i7-13650HX, RTX 4060 | |
| HP Victus 16 (2024) | |
| Geekbench 6.4 / Multi-Core | |
| Lenovo Legion Pro 5 16IRX9 | |
| Lenovo Legion Pro 5 16IRX9 G9 | |
| Ortalama Intel Core i7-14700HX (14807 - 17562, n=7) | |
| Lenovo Legion 5 16IRX G9 | |
| HP Victus 16 (2024) | |
| Sınıf ortalaması Gaming (5340 - 21668, n=119, son 2 yıl) | |
| SCHENKER XMG Core 15 (M24) | |
| Dell G16, i7-13650HX, RTX 4060 | |
| Geekbench 6.4 / Single-Core | |
| Lenovo Legion Pro 5 16IRX9 | |
| Lenovo Legion Pro 5 16IRX9 G9 | |
| Ortalama Intel Core i7-14700HX (2378 - 2975, n=7) | |
| Lenovo Legion 5 16IRX G9 | |
| SCHENKER XMG Core 15 (M24) | |
| Sınıf ortalaması Gaming (1490 - 3219, n=119, son 2 yıl) | |
| Dell G16, i7-13650HX, RTX 4060 | |
| HP Victus 16 (2024) | |
| Geekbench 5.5 / Multi-Core | |
| Lenovo Legion Pro 5 16IRX9 | |
| Lenovo Legion Pro 5 16IRX9 G9 | |
| Ortalama Intel Core i7-14700HX (15705 - 19597, n=7) | |
| Lenovo Legion 5 16IRX G9 | |
| HP Victus 16 (2024) | |
| Sınıf ortalaması Gaming (4557 - 25855, n=148, son 2 yıl) | |
| SCHENKER XMG Core 15 (M24) | |
| Dell G16, i7-13650HX, RTX 4060 | |
| Geekbench 5.5 / Single-Core | |
| Lenovo Legion Pro 5 16IRX9 G9 | |
| Lenovo Legion Pro 5 16IRX9 | |
| Ortalama Intel Core i7-14700HX (1700 - 2133, n=7) | |
| SCHENKER XMG Core 15 (M24) | |
| Lenovo Legion 5 16IRX G9 | |
| Sınıf ortalaması Gaming (986 - 2423, n=148, son 2 yıl) | |
| Dell G16, i7-13650HX, RTX 4060 | |
| HP Victus 16 (2024) | |
| HWBOT x265 Benchmark v2.2 / 4k Preset | |
| Lenovo Legion Pro 5 16IRX9 | |
| Lenovo Legion Pro 5 16IRX9 G9 | |
| Lenovo Legion 5 16IRX G9 | |
| Ortalama Intel Core i7-14700HX (22 - 27.4, n=7) | |
| Sınıf ortalaması Gaming (6.72 - 42.9, n=148, son 2 yıl) | |
| SCHENKER XMG Core 15 (M24) | |
| HP Victus 16 (2024) | |
| Dell G16, i7-13650HX, RTX 4060 | |
| LibreOffice / 20 Documents To PDF | |
| HP Victus 16 (2024) | |
| Dell G16, i7-13650HX, RTX 4060 | |
| Lenovo Legion Pro 5 16IRX9 G9 | |
| SCHENKER XMG Core 15 (M24) | |
| Sınıf ortalaması Gaming (19 - 96.6, n=147, son 2 yıl) | |
| Ortalama Intel Core i7-14700HX (41.9 - 55.3, n=7) | |
| Lenovo Legion 5 16IRX G9 | |
| Lenovo Legion Pro 5 16IRX9 | |
| R Benchmark 2.5 / Overall mean | |
| HP Victus 16 (2024) | |
| Sınıf ortalaması Gaming (0.3609 - 0.759, n=150, son 2 yıl) | |
| SCHENKER XMG Core 15 (M24) | |
| Dell G16, i7-13650HX, RTX 4060 | |
| Dell G16, i7-13650HX, RTX 4060 | |
| Lenovo Legion 5 16IRX G9 | |
| Ortalama Intel Core i7-14700HX (0.3821 - 0.4896, n=7) | |
| Lenovo Legion Pro 5 16IRX9 G9 | |
| Lenovo Legion Pro 5 16IRX9 | |
* ... daha küçük daha iyidir
AIDA64: FP32 Ray-Trace | FPU Julia | CPU SHA3 | CPU Queen | FPU SinJulia | FPU Mandel | CPU AES | CPU ZLib | FP64 Ray-Trace | CPU PhotoWorxx
| Performance Rating | |
| Lenovo Legion Pro 5 16IRX9 | |
| Lenovo Legion Pro 5 16IRX9 G9 | |
| SCHENKER XMG Core 15 (M24) | |
| Ortalama Intel Core i7-14700HX | |
| Sınıf ortalaması Gaming | |
| Lenovo Legion 5 16IRX G9 | |
| Dell G16, i7-13650HX, RTX 4060 | |
| HP Victus 16 (2024) | |
| AIDA64 / FP32 Ray-Trace | |
| SCHENKER XMG Core 15 (M24) | |
| Lenovo Legion Pro 5 16IRX9 | |
| Lenovo Legion Pro 5 16IRX9 G9 | |
| Sınıf ortalaması Gaming (4986 - 81639, n=147, son 2 yıl) | |
| Ortalama Intel Core i7-14700HX (16932 - 23676, n=7) | |
| Lenovo Legion 5 16IRX G9 | |
| Dell G16, i7-13650HX, RTX 4060 | |
| HP Victus 16 (2024) | |
| AIDA64 / FPU Julia | |
| Lenovo Legion Pro 5 16IRX9 | |
| SCHENKER XMG Core 15 (M24) | |
| Lenovo Legion Pro 5 16IRX9 G9 | |
| Ortalama Intel Core i7-14700HX (86338 - 116556, n=7) | |
| Sınıf ortalaması Gaming (25360 - 252486, n=147, son 2 yıl) | |
| Lenovo Legion 5 16IRX G9 | |
| Dell G16, i7-13650HX, RTX 4060 | |
| HP Victus 16 (2024) | |
| AIDA64 / CPU SHA3 | |
| Lenovo Legion Pro 5 16IRX9 | |
| Lenovo Legion Pro 5 16IRX9 G9 | |
| SCHENKER XMG Core 15 (M24) | |
| Ortalama Intel Core i7-14700HX (4008 - 5567, n=7) | |
| Sınıf ortalaması Gaming (1339 - 10389, n=147, son 2 yıl) | |
| Dell G16, i7-13650HX, RTX 4060 | |
| Lenovo Legion 5 16IRX G9 | |
| HP Victus 16 (2024) | |
| AIDA64 / CPU Queen | |
| Lenovo Legion Pro 5 16IRX9 G9 | |
| Lenovo Legion Pro 5 16IRX9 | |
| Ortalama Intel Core i7-14700HX (129836 - 152200, n=7) | |
| HP Victus 16 (2024) | |
| SCHENKER XMG Core 15 (M24) | |
| Sınıf ortalaması Gaming (50699 - 200651, n=147, son 2 yıl) | |
| Dell G16, i7-13650HX, RTX 4060 | |
| Lenovo Legion 5 16IRX G9 | |
| AIDA64 / FPU SinJulia | |
| SCHENKER XMG Core 15 (M24) | |
| Lenovo Legion Pro 5 16IRX9 | |
| Lenovo Legion Pro 5 16IRX9 G9 | |
| Ortalama Intel Core i7-14700HX (11704 - 14434, n=7) | |
| Sınıf ortalaması Gaming (4800 - 32988, n=147, son 2 yıl) | |
| Lenovo Legion 5 16IRX G9 | |
| HP Victus 16 (2024) | |
| Dell G16, i7-13650HX, RTX 4060 | |
| AIDA64 / FPU Mandel | |
| SCHENKER XMG Core 15 (M24) | |
| Lenovo Legion Pro 5 16IRX9 | |
| Lenovo Legion Pro 5 16IRX9 G9 | |
| Sınıf ortalaması Gaming (12321 - 134044, n=147, son 2 yıl) | |
| Ortalama Intel Core i7-14700HX (42125 - 58380, n=7) | |
| Lenovo Legion 5 16IRX G9 | |
| Dell G16, i7-13650HX, RTX 4060 | |
| HP Victus 16 (2024) | |
| AIDA64 / CPU AES | |
| Lenovo Legion Pro 5 16IRX9 | |
| Lenovo Legion Pro 5 16IRX9 G9 | |
| Sınıf ortalaması Gaming (19065 - 328679, n=147, son 2 yıl) | |
| Ortalama Intel Core i7-14700HX (82161 - 113157, n=7) | |
| SCHENKER XMG Core 15 (M24) | |
| Lenovo Legion 5 16IRX G9 | |
| Dell G16, i7-13650HX, RTX 4060 | |
| HP Victus 16 (2024) | |
| AIDA64 / CPU ZLib | |
| Lenovo Legion Pro 5 16IRX9 | |
| Lenovo Legion Pro 5 16IRX9 G9 | |
| Ortalama Intel Core i7-14700HX (1177 - 1682, n=7) | |
| Sınıf ortalaması Gaming (373 - 2531, n=147, son 2 yıl) | |
| Lenovo Legion 5 16IRX G9 | |
| Dell G16, i7-13650HX, RTX 4060 | |
| HP Victus 16 (2024) | |
| SCHENKER XMG Core 15 (M24) | |
| AIDA64 / FP64 Ray-Trace | |
| SCHENKER XMG Core 15 (M24) | |
| Lenovo Legion Pro 5 16IRX9 | |
| Lenovo Legion Pro 5 16IRX9 G9 | |
| Sınıf ortalaması Gaming (2540 - 43430, n=147, son 2 yıl) | |
| Ortalama Intel Core i7-14700HX (9029 - 12928, n=7) | |
| Dell G16, i7-13650HX, RTX 4060 | |
| Lenovo Legion 5 16IRX G9 | |
| HP Victus 16 (2024) | |
| AIDA64 / CPU PhotoWorxx | |
| Lenovo Legion Pro 5 16IRX9 | |
| Lenovo Legion Pro 5 16IRX9 G9 | |
| Ortalama Intel Core i7-14700HX (39151 - 49671, n=7) | |
| SCHENKER XMG Core 15 (M24) | |
| Sınıf ortalaması Gaming (10805 - 60161, n=147, son 2 yıl) | |
| HP Victus 16 (2024) | |
| Dell G16, i7-13650HX, RTX 4060 | |
| Lenovo Legion 5 16IRX G9 | |
Sistem performansı
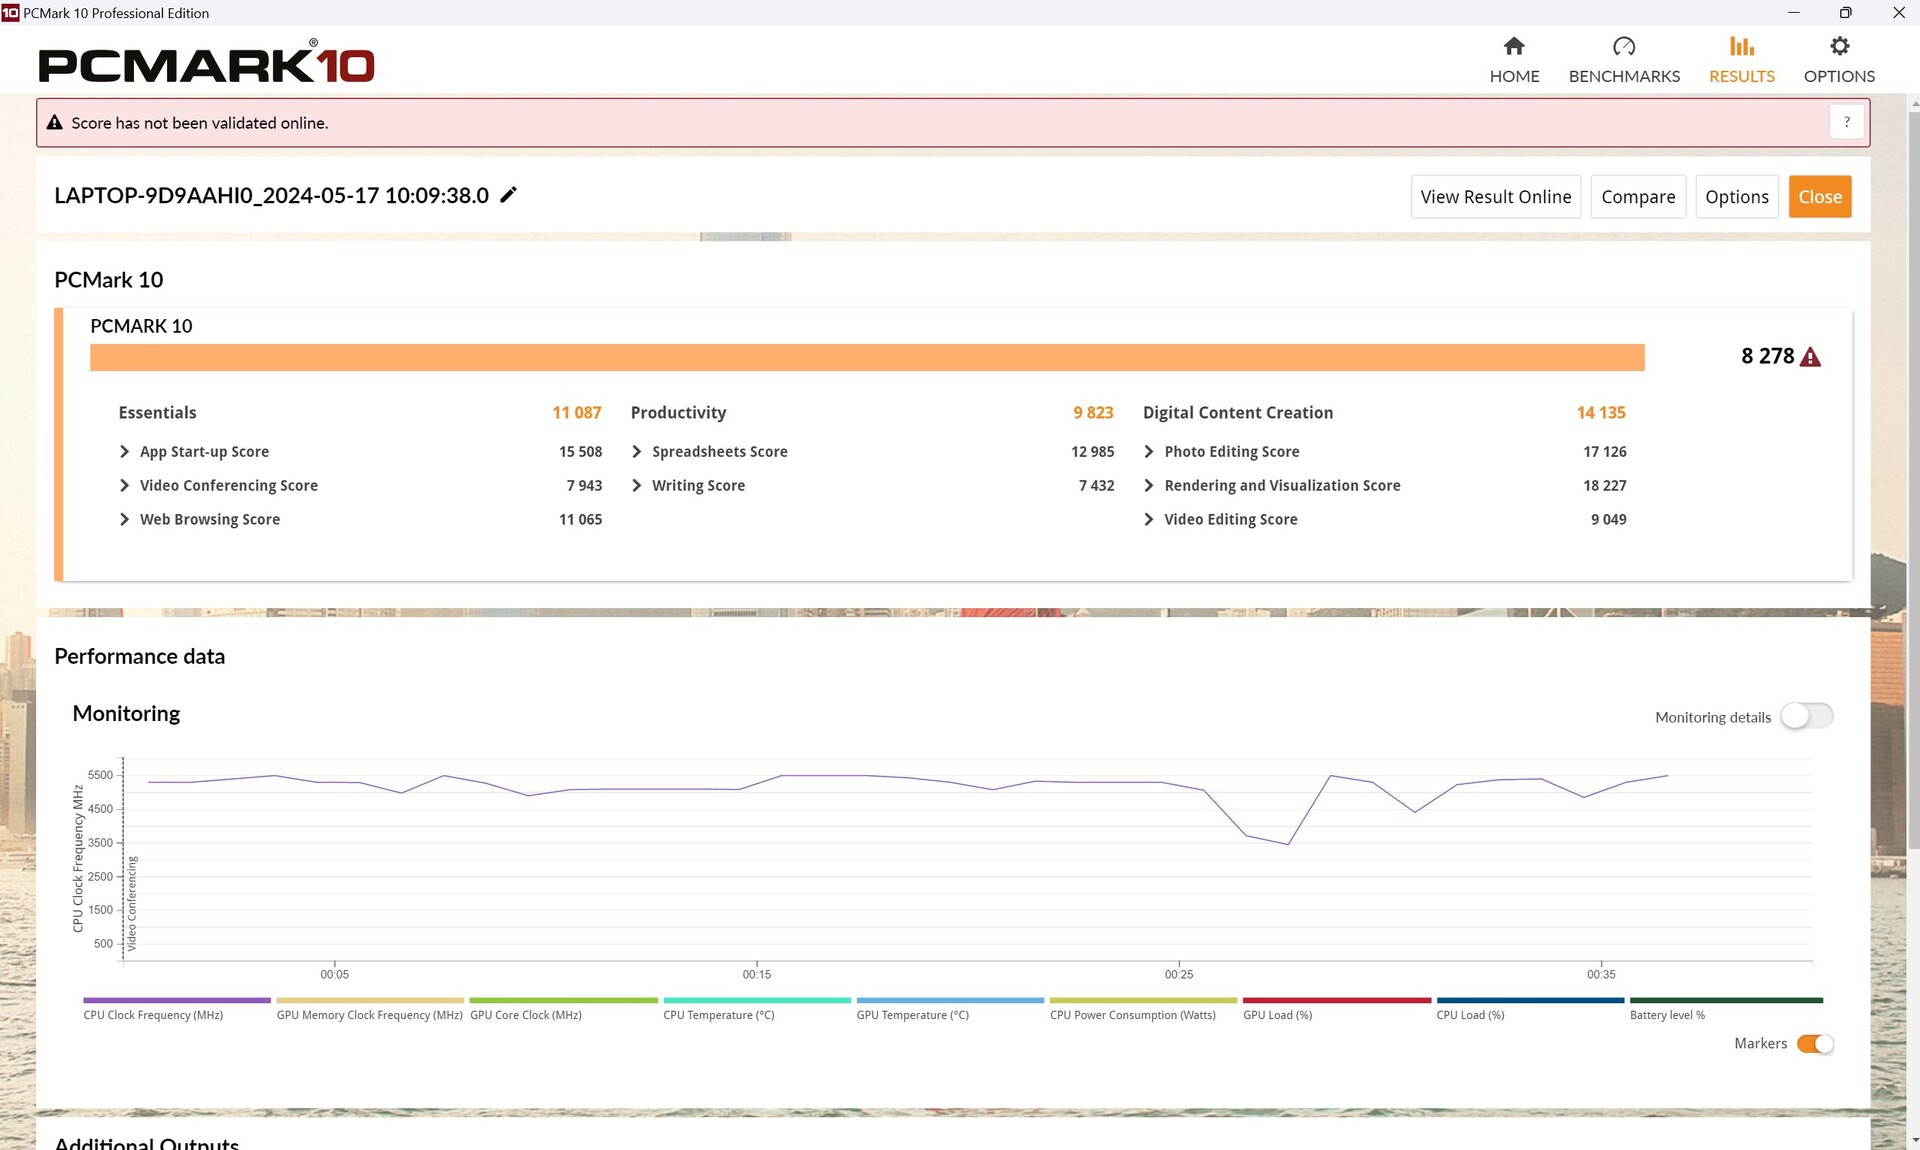
PCMark 10'da, Legion Pro'muz üretkenlik söz konusu olduğunda sadece biraz daha zayıftı, ancak bunun dışında her zaman daha iyi donanımlı Legion Pro'nun hemen arkasında ikinci sırada yer aldı.
CrossMark'ta sonuçları yine çok iyiydi ve test modelimiz kendisinin "daha iyi" versiyonunu geçmeyi bile başardı.
CrossMark: Overall | Productivity | Creativity | Responsiveness
WebXPRT 3: Overall
WebXPRT 4: Overall
Mozilla Kraken 1.1: Total
| PCMark 10 / Score | |
| SCHENKER XMG Core 15 (M24) | |
| Lenovo Legion Pro 5 16IRX9 | |
| Lenovo Legion Pro 5 16IRX9 G9 | |
| Ortalama Intel Core i7-14700HX, NVIDIA GeForce RTX 4060 Laptop GPU (7528 - 8278, n=2) | |
| Sınıf ortalaması Gaming (5776 - 9852, n=133, son 2 yıl) | |
| Lenovo Legion 5 16IRX G9 | |
| HP Victus 16 (2024) | |
| Dell G16, i7-13650HX, RTX 4060 | |
| PCMark 10 / Essentials | |
| Lenovo Legion Pro 5 16IRX9 | |
| Lenovo Legion Pro 5 16IRX9 G9 | |
| Ortalama Intel Core i7-14700HX, NVIDIA GeForce RTX 4060 Laptop GPU (10778 - 11087, n=2) | |
| Lenovo Legion 5 16IRX G9 | |
| HP Victus 16 (2024) | |
| Sınıf ortalaması Gaming (9057 - 12600, n=133, son 2 yıl) | |
| SCHENKER XMG Core 15 (M24) | |
| Dell G16, i7-13650HX, RTX 4060 | |
| PCMark 10 / Productivity | |
| SCHENKER XMG Core 15 (M24) | |
| Lenovo Legion Pro 5 16IRX9 | |
| Dell G16, i7-13650HX, RTX 4060 | |
| HP Victus 16 (2024) | |
| Sınıf ortalaması Gaming (6662 - 14612, n=133, son 2 yıl) | |
| Ortalama Intel Core i7-14700HX, NVIDIA GeForce RTX 4060 Laptop GPU (9823 - 9910, n=2) | |
| Lenovo Legion Pro 5 16IRX9 G9 | |
| Lenovo Legion 5 16IRX G9 | |
| PCMark 10 / Digital Content Creation | |
| Lenovo Legion Pro 5 16IRX9 | |
| Lenovo Legion Pro 5 16IRX9 G9 | |
| SCHENKER XMG Core 15 (M24) | |
| Ortalama Intel Core i7-14700HX, NVIDIA GeForce RTX 4060 Laptop GPU (10841 - 14135, n=2) | |
| Sınıf ortalaması Gaming (6807 - 18475, n=133, son 2 yıl) | |
| Lenovo Legion 5 16IRX G9 | |
| Dell G16, i7-13650HX, RTX 4060 | |
| HP Victus 16 (2024) | |
| CrossMark / Overall | |
| Lenovo Legion Pro 5 16IRX9 G9 | |
| Lenovo Legion 5 16IRX G9 | |
| Ortalama Intel Core i7-14700HX, NVIDIA GeForce RTX 4060 Laptop GPU (1923 - 2132, n=2) | |
| Lenovo Legion Pro 5 16IRX9 | |
| HP Victus 16 (2024) | |
| Sınıf ortalaması Gaming (1247 - 2344, n=114, son 2 yıl) | |
| SCHENKER XMG Core 15 (M24) | |
| Dell G16, i7-13650HX, RTX 4060 | |
| CrossMark / Productivity | |
| Lenovo Legion Pro 5 16IRX9 G9 | |
| Lenovo Legion 5 16IRX G9 | |
| Ortalama Intel Core i7-14700HX, NVIDIA GeForce RTX 4060 Laptop GPU (1782 - 1973, n=2) | |
| Lenovo Legion Pro 5 16IRX9 | |
| Sınıf ortalaması Gaming (1299 - 2204, n=114, son 2 yıl) | |
| SCHENKER XMG Core 15 (M24) | |
| HP Victus 16 (2024) | |
| Dell G16, i7-13650HX, RTX 4060 | |
| CrossMark / Creativity | |
| Lenovo Legion Pro 5 16IRX9 G9 | |
| Lenovo Legion 5 16IRX G9 | |
| Lenovo Legion Pro 5 16IRX9 | |
| Ortalama Intel Core i7-14700HX, NVIDIA GeForce RTX 4060 Laptop GPU (2107 - 2399, n=2) | |
| HP Victus 16 (2024) | |
| SCHENKER XMG Core 15 (M24) | |
| Sınıf ortalaması Gaming (1275 - 2660, n=114, son 2 yıl) | |
| Dell G16, i7-13650HX, RTX 4060 | |
| CrossMark / Responsiveness | |
| Lenovo Legion 5 16IRX G9 | |
| Lenovo Legion Pro 5 16IRX9 G9 | |
| Ortalama Intel Core i7-14700HX, NVIDIA GeForce RTX 4060 Laptop GPU (1835 - 1885, n=2) | |
| HP Victus 16 (2024) | |
| Lenovo Legion Pro 5 16IRX9 | |
| Sınıf ortalaması Gaming (1030 - 2330, n=114, son 2 yıl) | |
| Dell G16, i7-13650HX, RTX 4060 | |
| SCHENKER XMG Core 15 (M24) | |
| WebXPRT 3 / Overall | |
| Lenovo Legion Pro 5 16IRX9 | |
| Lenovo Legion 5 16IRX G9 | |
| SCHENKER XMG Core 15 (M24) | |
| Lenovo Legion Pro 5 16IRX9 G9 | |
| Sınıf ortalaması Gaming (215 - 480, n=127, son 2 yıl) | |
| Ortalama Intel Core i7-14700HX, NVIDIA GeForce RTX 4060 Laptop GPU (276 - 301, n=2) | |
| HP Victus 16 (2024) | |
| Dell G16, i7-13650HX, RTX 4060 | |
| WebXPRT 4 / Overall | |
| Lenovo Legion Pro 5 16IRX9 | |
| Lenovo Legion 5 16IRX G9 | |
| Lenovo Legion Pro 5 16IRX9 G9 | |
| Sınıf ortalaması Gaming (176.4 - 335, n=115, son 2 yıl) | |
| SCHENKER XMG Core 15 (M24) | |
| Ortalama Intel Core i7-14700HX, NVIDIA GeForce RTX 4060 Laptop GPU (251 - 273, n=2) | |
| HP Victus 16 (2024) | |
| Mozilla Kraken 1.1 / Total | |
| HP Victus 16 (2024) | |
| Dell G16, i7-13650HX, RTX 4060 | |
| Ortalama Intel Core i7-14700HX, NVIDIA GeForce RTX 4060 Laptop GPU (467 - 542, n=2) | |
| Sınıf ortalaması Gaming (409 - 674, n=139, son 2 yıl) | |
| SCHENKER XMG Core 15 (M24) | |
| Lenovo Legion 5 16IRX G9 | |
| Lenovo Legion Pro 5 16IRX9 G9 | |
| Lenovo Legion Pro 5 16IRX9 | |
* ... daha küçük daha iyidir
| PCMark 10 Score | 8278 puan | |
Yardım | ||
| AIDA64 / Memory Copy | |
| Lenovo Legion Pro 5 16IRX9 | |
| Lenovo Legion Pro 5 16IRX9 G9 | |
| Ortalama Intel Core i7-14700HX (63949 - 78742, n=7) | |
| SCHENKER XMG Core 15 (M24) | |
| HP Victus 16 (2024) | |
| Sınıf ortalaması Gaming (21750 - 97515, n=147, son 2 yıl) | |
| Lenovo Legion 5 16IRX G9 | |
| Dell G16, i7-13650HX, RTX 4060 | |
| AIDA64 / Memory Read | |
| Lenovo Legion Pro 5 16IRX9 | |
| Lenovo Legion Pro 5 16IRX9 G9 | |
| Ortalama Intel Core i7-14700HX (68593 - 86175, n=7) | |
| HP Victus 16 (2024) | |
| Lenovo Legion 5 16IRX G9 | |
| Sınıf ortalaması Gaming (22956 - 102937, n=147, son 2 yıl) | |
| Dell G16, i7-13650HX, RTX 4060 | |
| SCHENKER XMG Core 15 (M24) | |
| AIDA64 / Memory Write | |
| SCHENKER XMG Core 15 (M24) | |
| Lenovo Legion Pro 5 16IRX9 | |
| Lenovo Legion Pro 5 16IRX9 G9 | |
| Ortalama Intel Core i7-14700HX (64033 - 76689, n=7) | |
| Sınıf ortalaması Gaming (22297 - 108954, n=147, son 2 yıl) | |
| HP Victus 16 (2024) | |
| Dell G16, i7-13650HX, RTX 4060 | |
| Lenovo Legion 5 16IRX G9 | |
| AIDA64 / Memory Latency | |
| HP Victus 16 (2024) | |
| Sınıf ortalaması Gaming (59.5 - 259, n=147, son 2 yıl) | |
| Dell G16, i7-13650HX, RTX 4060 | |
| Lenovo Legion 5 16IRX G9 | |
| Ortalama Intel Core i7-14700HX (82.7 - 96.4, n=7) | |
| SCHENKER XMG Core 15 (M24) | |
| Lenovo Legion Pro 5 16IRX9 | |
| Lenovo Legion Pro 5 16IRX9 G9 | |
* ... daha küçük daha iyidir
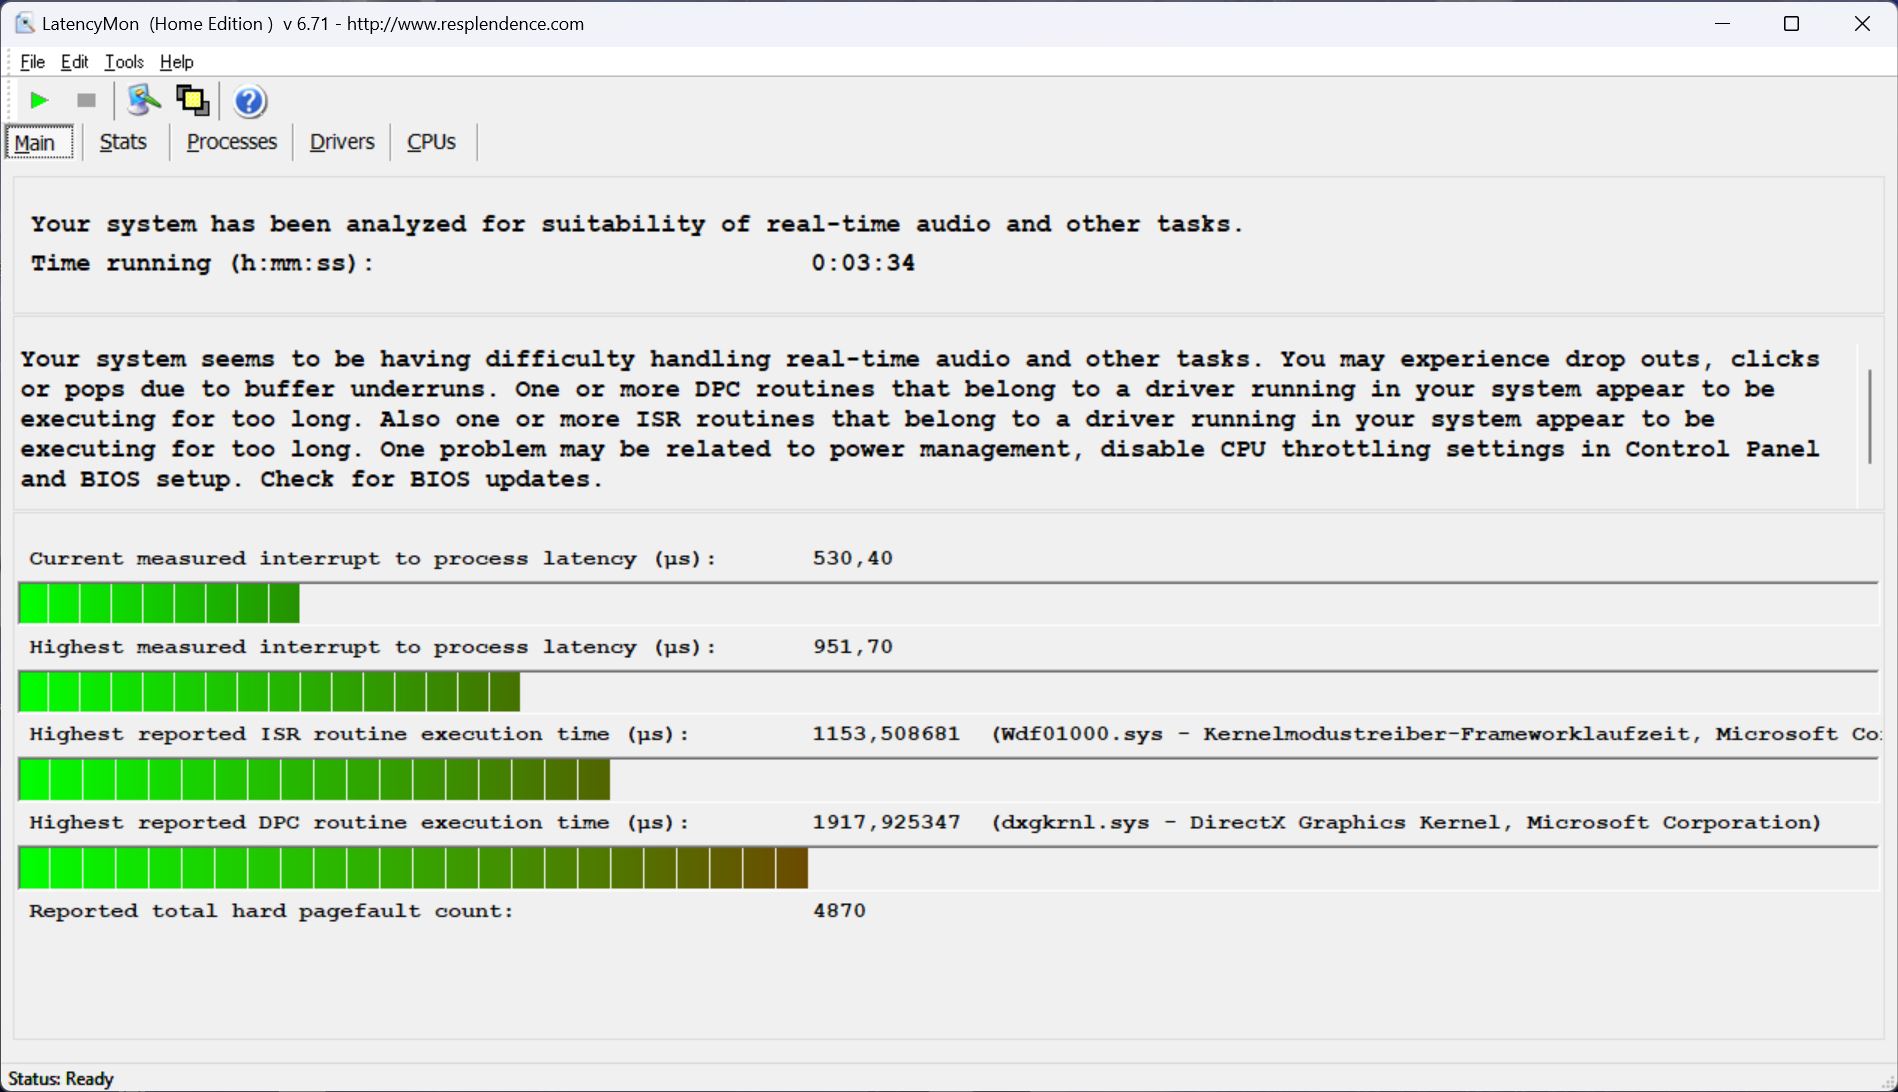
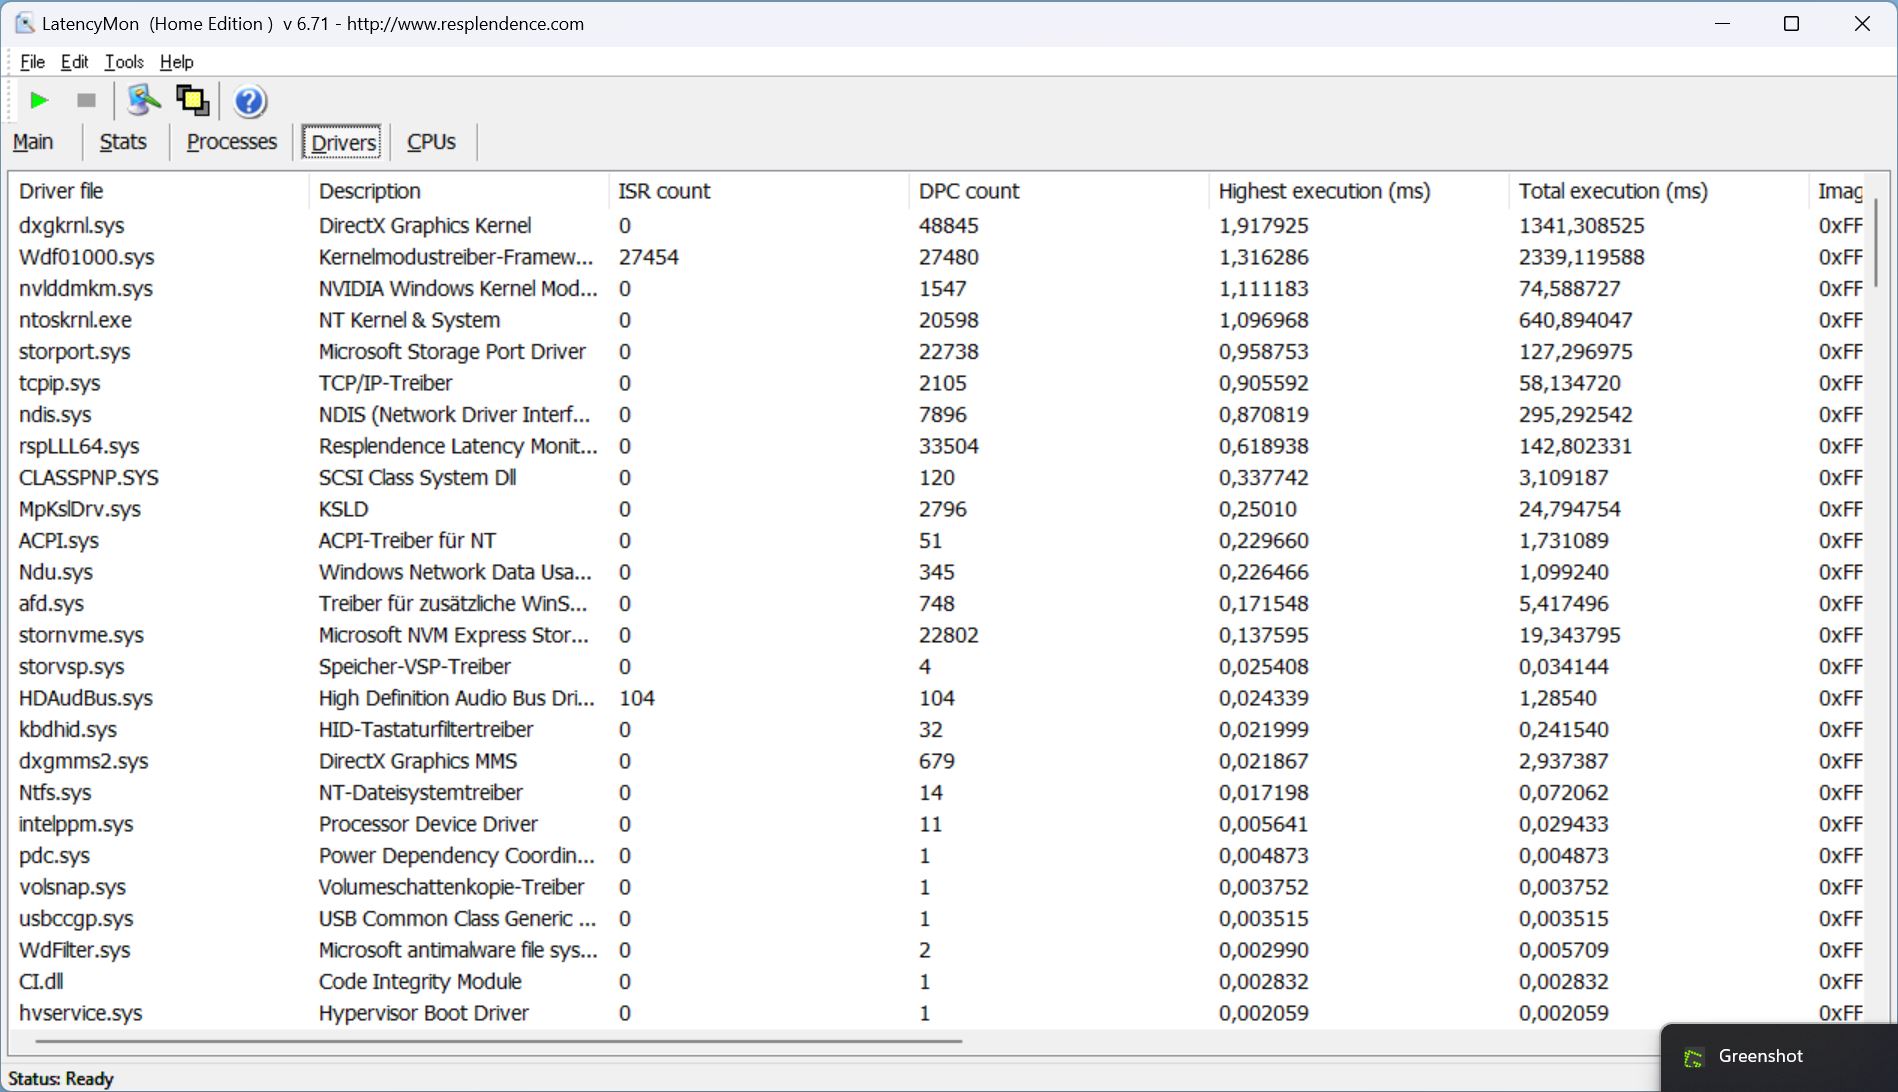
DPC gecikme süreleri
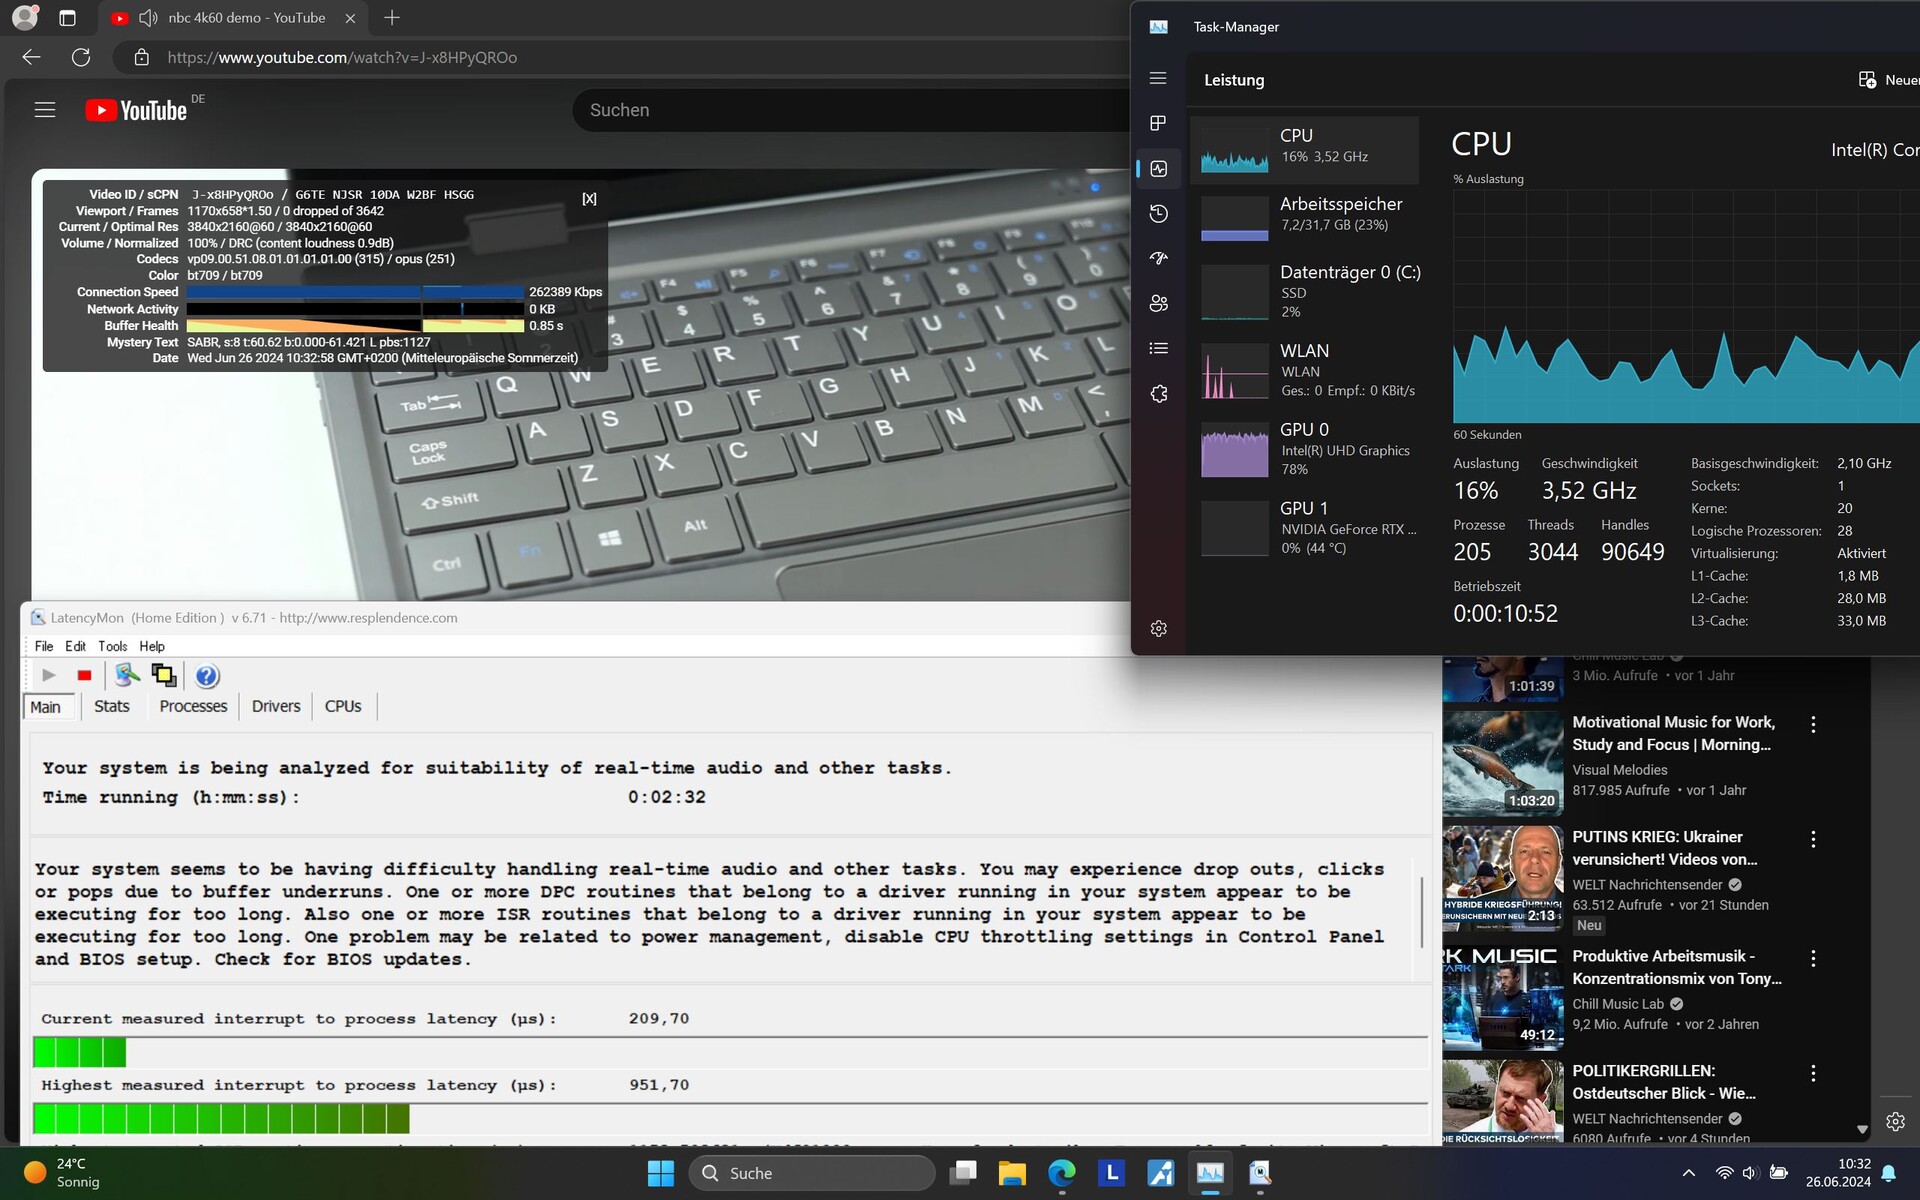
İlk olarak, tarayıcı açılırken daha küçük gecikmeler meydana geldi. Web sitemizde birkaç sekme açıldığında gecikme değeri yine çok az arttı. Bununla birlikte, 4K/60fps YouTube videomuz herhangi bir sorun veya kare düşmesi olmadan oynatıldı. Dahili GPU yükü yüzde 78 ile çok yüksekti.
| DPC Latencies / LatencyMon - interrupt to process latency (max), Web, Youtube, Prime95 | |
| Lenovo Legion 5 16IRX G9 | |
| SCHENKER XMG Core 15 (M24) | |
| Dell G16, i7-13650HX, RTX 4060 | |
| Lenovo Legion Pro 5 16IRX9 | |
| Lenovo Legion Pro 5 16IRX9 G9 | |
| HP Victus 16 (2024) | |
* ... daha küçük daha iyidir
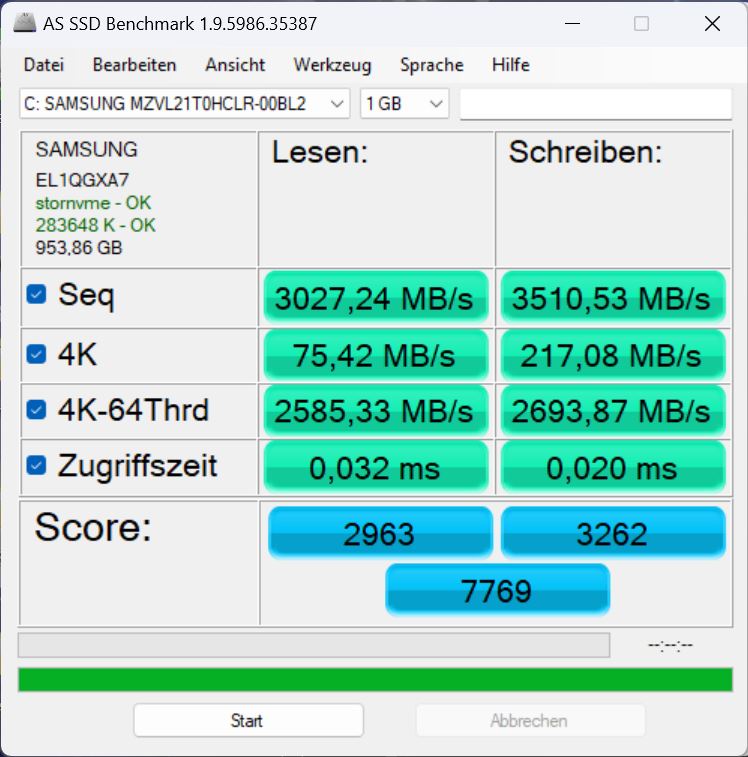
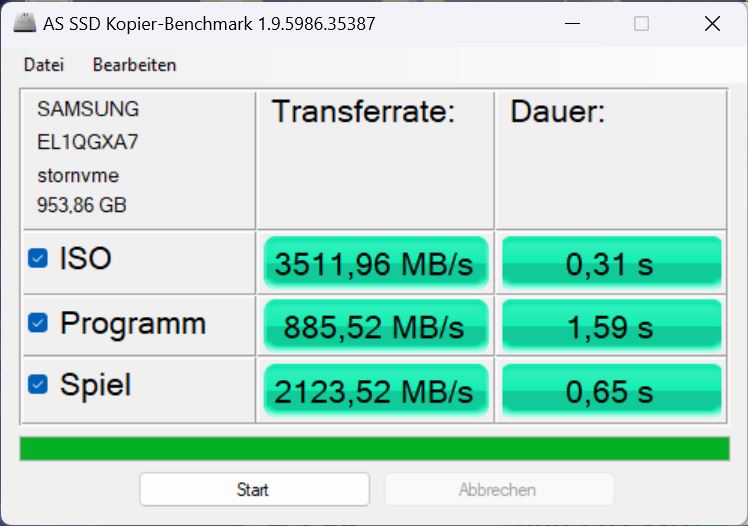
Depolama cihazı
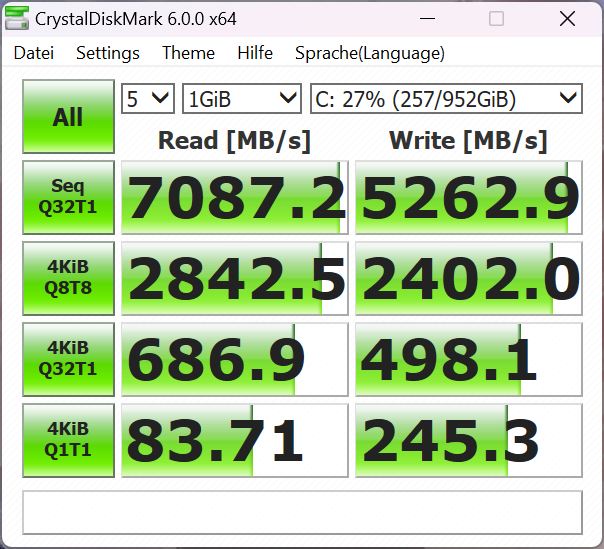
Lenovo, modelimize Samsung'un 1 TB depolama alanına sahip hızlı bir PCIe 4 NVMe SSD'sini, daha doğrusu iyi bilinen 980 Pro'nun OEM versiyonunu taktı. Model, 14. sırada yer alıyor SSD en iyi listesi bu nedenle karşılaştırma alanındaki en hızlı depolama cihazlarından biridir.
Karşılaştırmalarımız sırasında genel olarak iyi değerler elde etti, ancak diğer Legion (Pro) 5 modellerindeki SSD'ler gibi performansını uzun süre koruyamadı ve termal olarak yavaşladı. Lenovo'nun dizüstü bilgisayarı daha iyi bir soğutma sistemi ile donatmamış olması ve tüm serinin bu sorundan etkilenmiş gibi görünmesi utanç verici.

* ... daha küçük daha iyidir
Reading continuous performance: DiskSpd Read Loop, Queue Depth 8
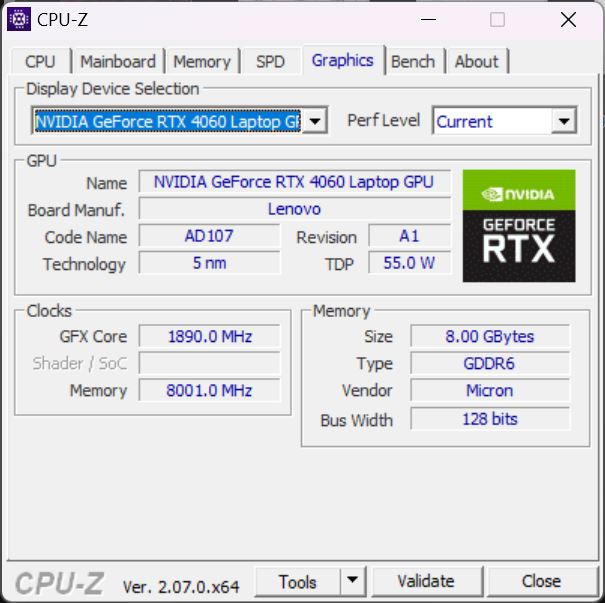
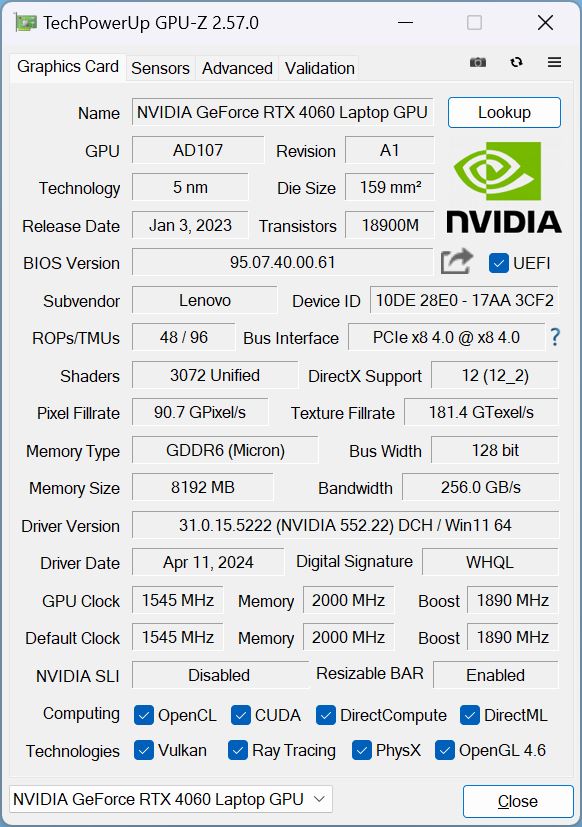
Grafik kartı
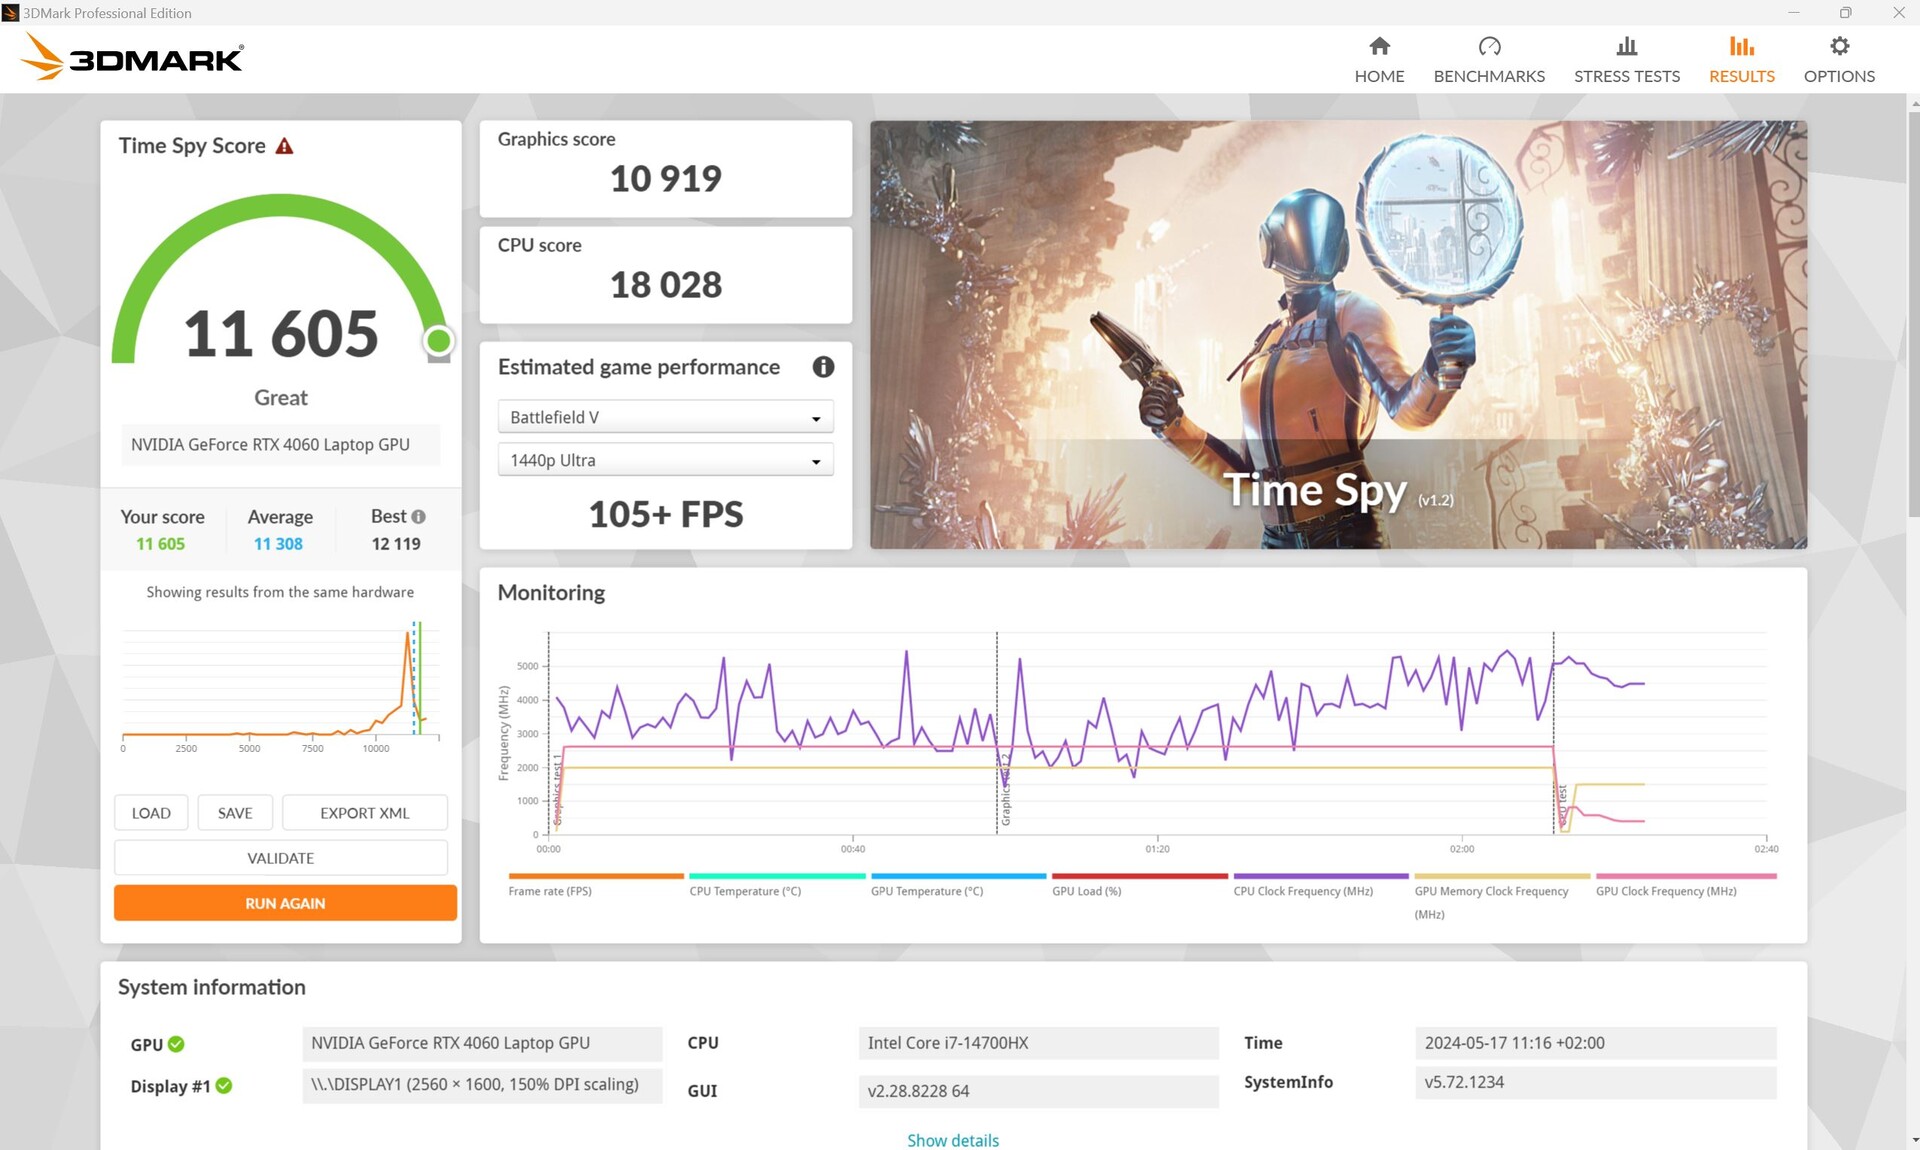
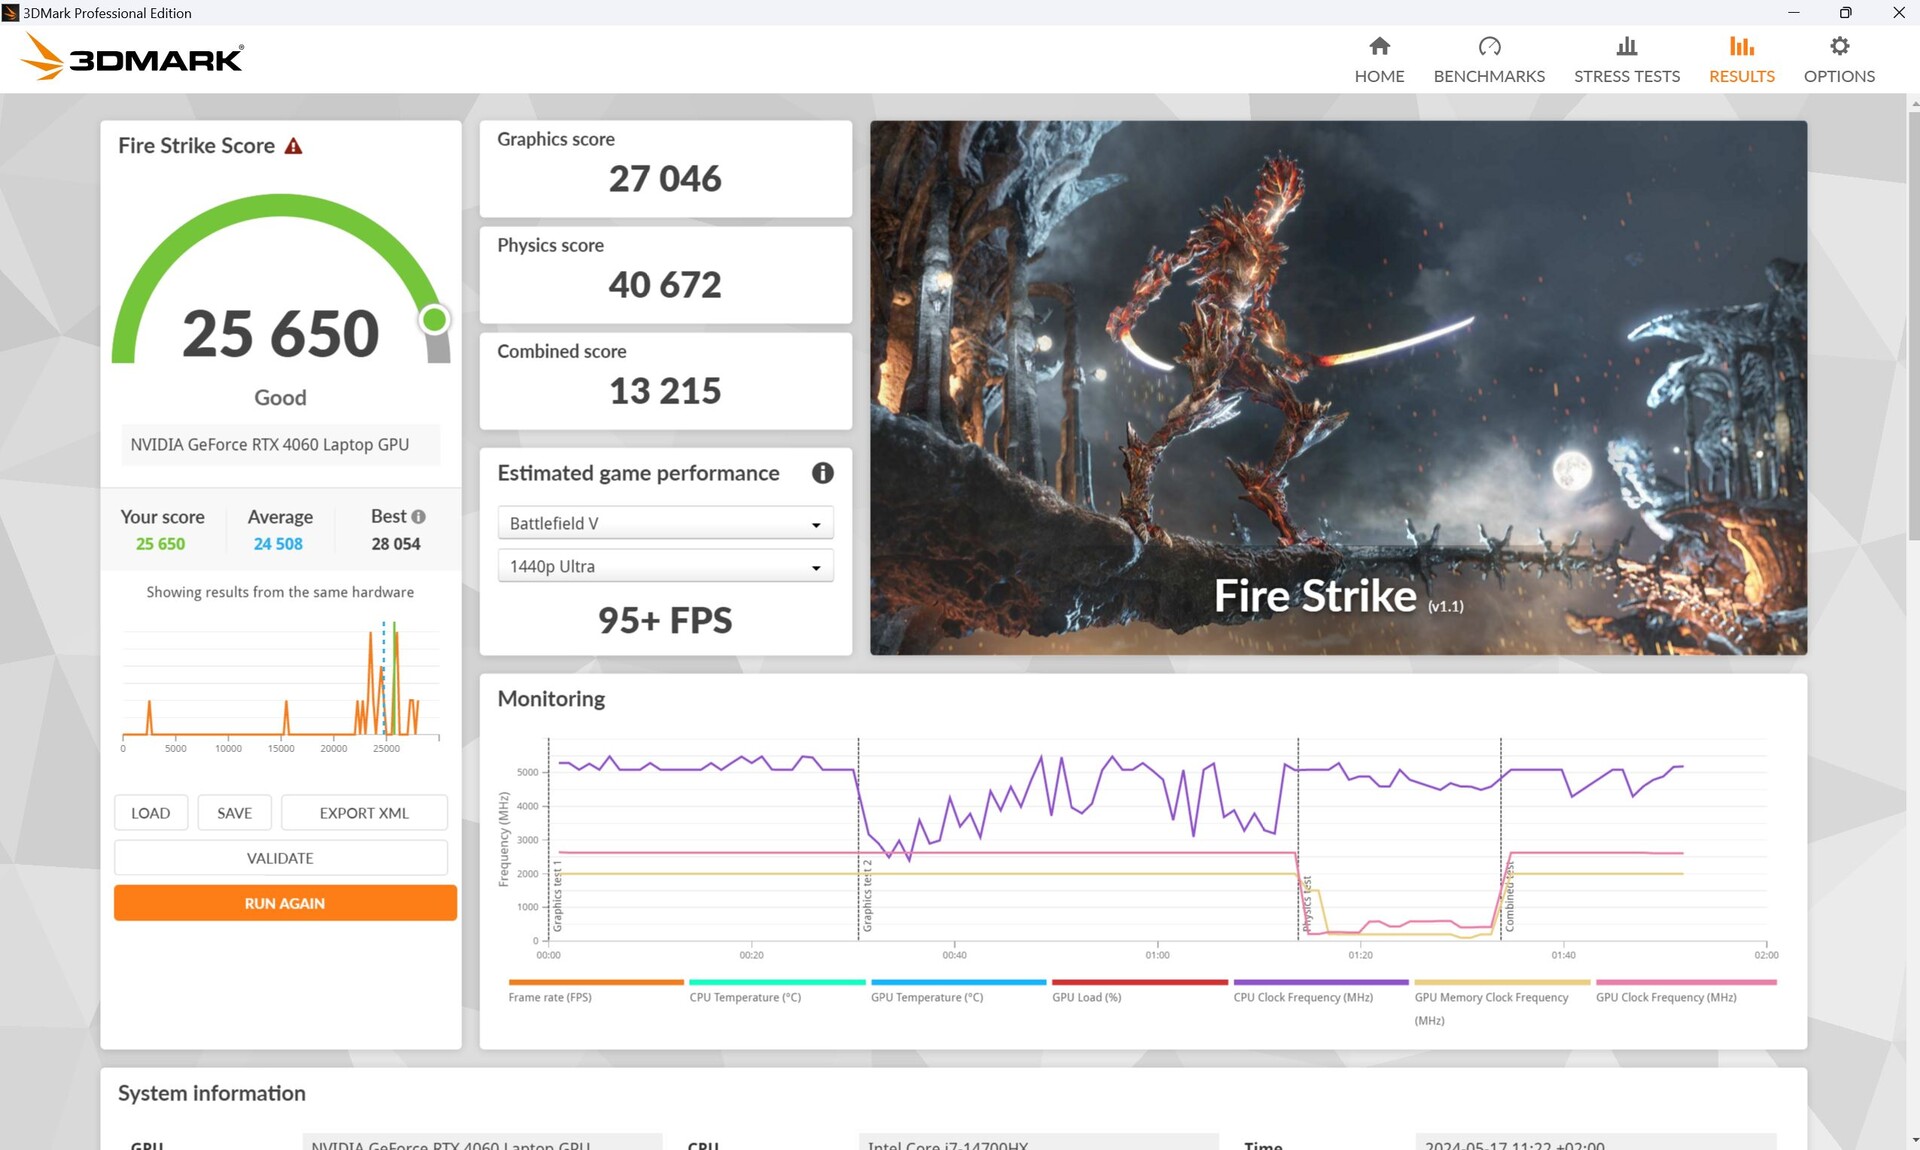
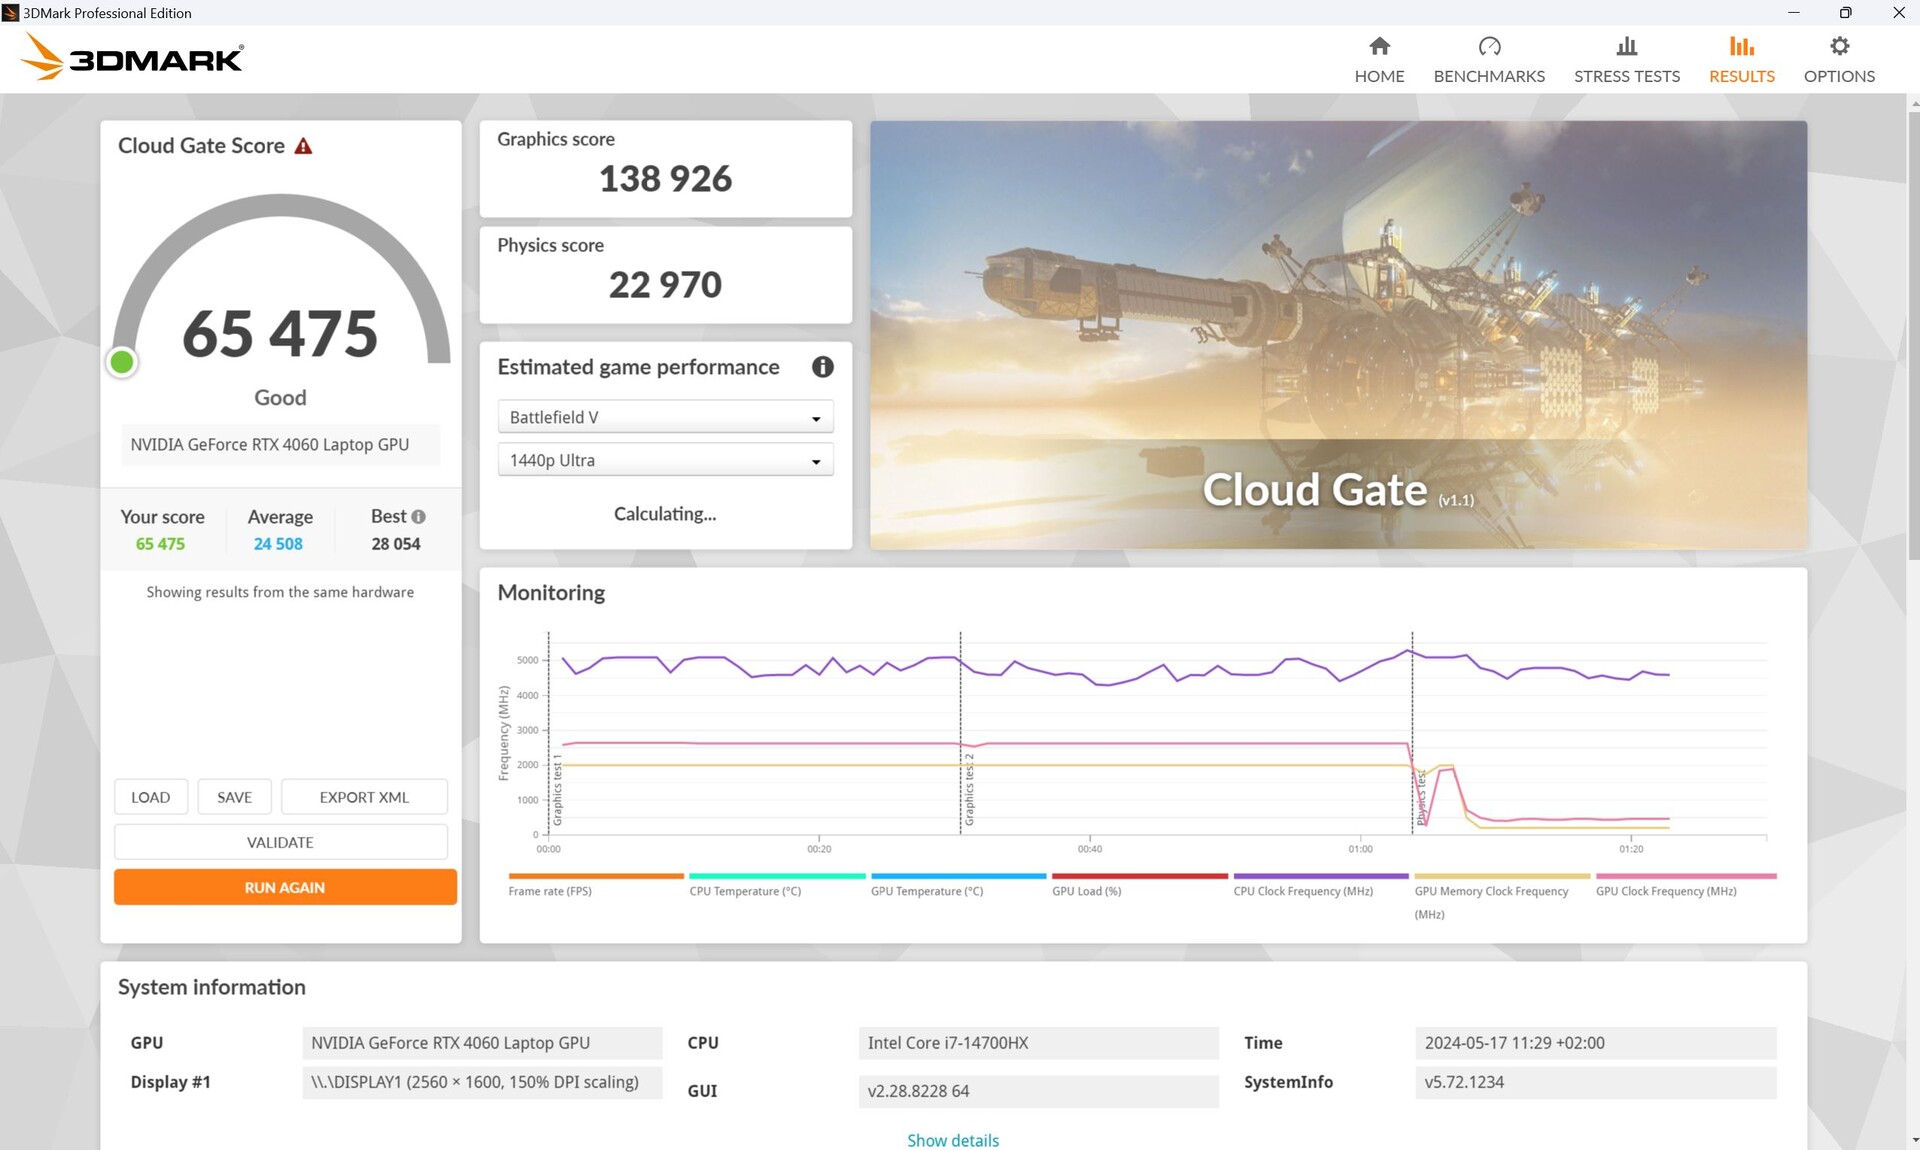
Bizim konfigürasyonumuz bir Nvidia Geforce RTX 4060 140 watt'ta.
Sentetik 3DMark testleri sırasında GPU ortalamanın biraz üzerinde performans gösterdi, ancak aynı RTX 4060 Legion 5 Pro son eki olmadan. Legion Pro 5 ile RTX 4070 ve i9-14900HX bu testlerde yaklaşık yüzde 20 daha hızlıydı.
Pil modunda, Fire Strike bir kez daha çalıştırıldığında 3D performansı yüzde 23 azaldı.

| 3DMark 11 Performance | 33600 puan | |
| 3DMark Cloud Gate Standard Score | 65475 puan | |
| 3DMark Fire Strike Score | 25650 puan | |
| 3DMark Time Spy Score | 11605 puan | |
Yardım | ||
* ... daha küçük daha iyidir
Oyun söz konusu olduğunda, Legion Pro 5, RTX 4060 içeren tüm rakiplerinden daha iyi performans gösteriyor - özellikle de 15 puan daha az puan alarak son sırada yer alan aynı CPU ve GPU'ya sahip Victus'tan. RTX-4070 Legion Pro ise sadece 10 puan önde geldi.
Sonuç olarak, test ettiğimiz tüm oyunlar Full HD'de maksimum ayrıntılarla oynanabiliyor; QHD'de, zorlu oyunları çalıştırırken kare hızı bazen 60 fps'nin altına düşebilir, ancak o zaman bile sorunsuz çalışırlar.
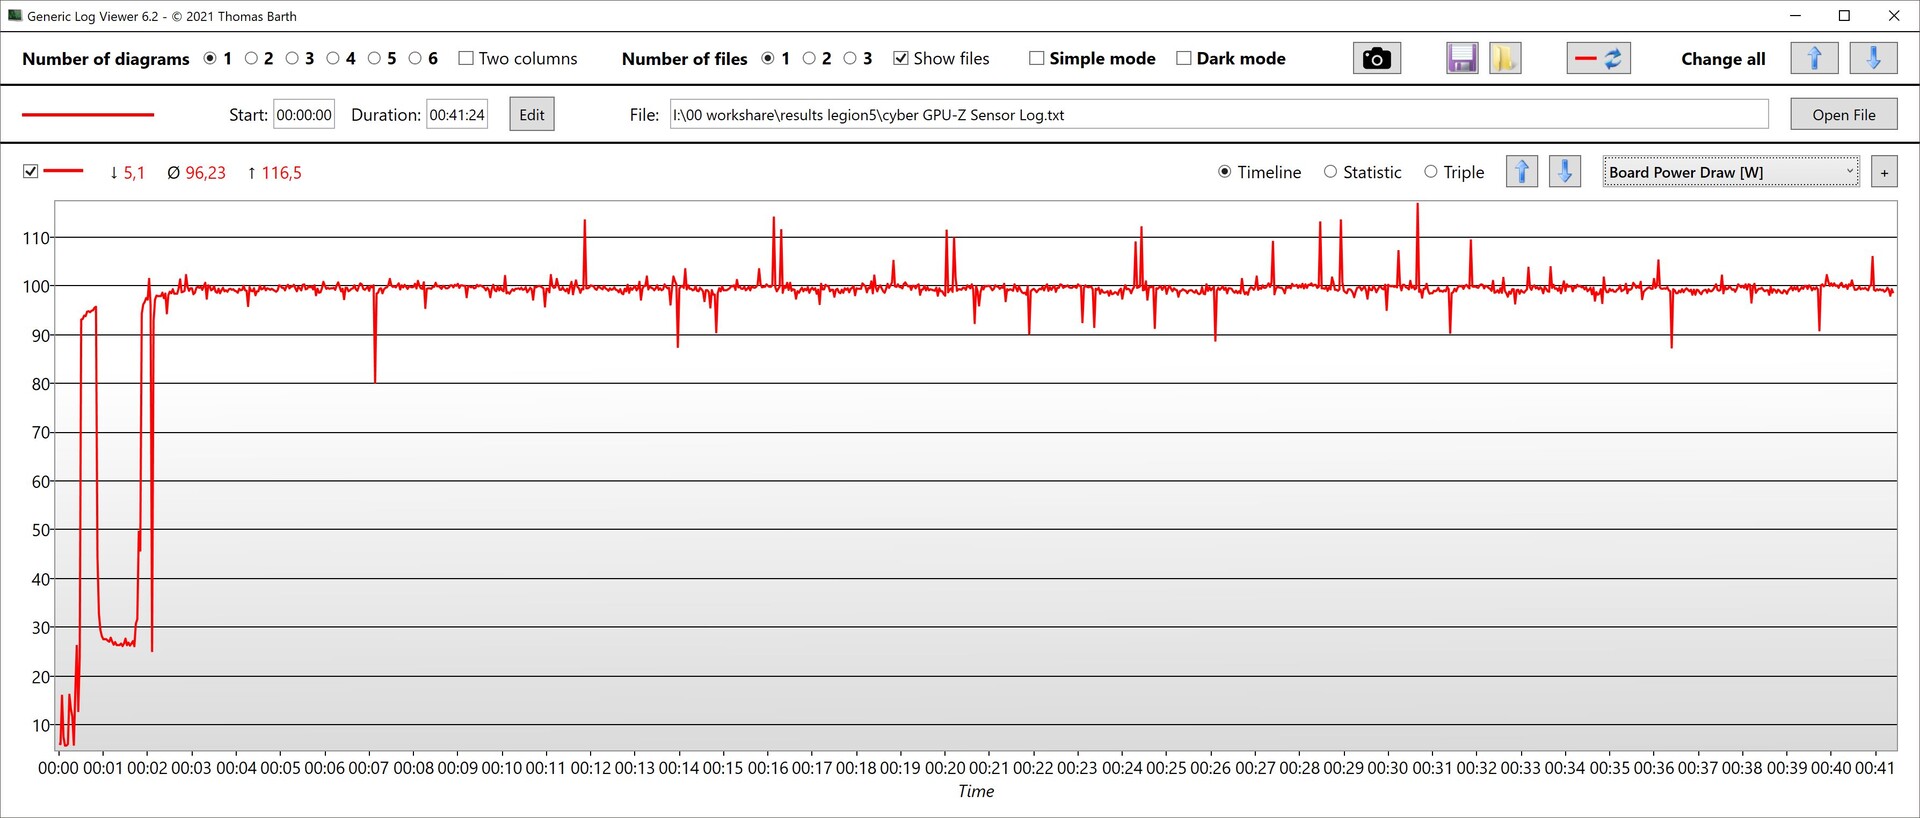
Cyberpunk 2077 'yi çalıştıran sürekli testimiz, herhangi bir büyük düşüş olmadan çok sabit bir kare hızı ortaya çıkardı. GPU sürekli olarak 2.610 MHz'de çalıştı ve 75 ila 79 °C'ye kadar ısındı. Güç tüketimi 100 watt civarındaydı.


| The Witcher 3 - 1920x1080 Ultra Graphics & Postprocessing (HBAO+) | |
| Lenovo Legion Pro 5 16IRX9 | |
| Sınıf ortalaması Gaming (18.4 - 214, n=119, son 2 yıl) | |
| Lenovo Legion Pro 5 16IRX9 G9 | |
| SCHENKER XMG Core 15 (M24) | |
| Dell G16, i7-13650HX, RTX 4060 | |
| HP Victus 16 (2024) | |
| Lenovo Legion 5 16IRX G9 | |
| GTA V - 1920x1080 Highest Settings possible AA:4xMSAA + FX AF:16x | |
| Lenovo Legion Pro 5 16IRX9 | |
| Lenovo Legion Pro 5 16IRX9 G9 | |
| Lenovo Legion 5 16IRX G9 | |
| Dell G16, i7-13650HX, RTX 4060 | |
| SCHENKER XMG Core 15 (M24) | |
| Sınıf ortalaması Gaming (12.1 - 168.2, n=132, son 2 yıl) | |
| HP Victus 16 (2024) | |
| Final Fantasy XV Benchmark - 1920x1080 High Quality | |
| Lenovo Legion Pro 5 16IRX9 | |
| Sınıf ortalaması Gaming (19.2 - 201, n=144, son 2 yıl) | |
| SCHENKER XMG Core 15 (M24) | |
| Lenovo Legion 5 16IRX G9 | |
| Lenovo Legion Pro 5 16IRX9 G9 | |
| Dell G16, i7-13650HX, RTX 4060 | |
| HP Victus 16 (2024) | |
| Strange Brigade - 1920x1080 ultra AA:ultra AF:16 | |
| Lenovo Legion Pro 5 16IRX9 | |
| Sınıf ortalaması Gaming (38.9 - 420, n=140, son 2 yıl) | |
| Lenovo Legion 5 16IRX G9 | |
| SCHENKER XMG Core 15 (M24) | |
| Lenovo Legion Pro 5 16IRX9 G9 | |
| Dell G16, i7-13650HX, RTX 4060 | |
| HP Victus 16 (2024) | |
| Dota 2 Reborn - 1920x1080 ultra (3/3) best looking | |
| Lenovo Legion Pro 5 16IRX9 | |
| Lenovo Legion Pro 5 16IRX9 G9 | |
| Lenovo Legion 5 16IRX G9 | |
| HP Victus 16 (2024) | |
| Dell G16, i7-13650HX, RTX 4060 | |
| Sınıf ortalaması Gaming (65.1 - 220, n=148, son 2 yıl) | |
| SCHENKER XMG Core 15 (M24) | |
| The Witcher 3 | |
| 1920x1080 High Graphics & Postprocessing (Nvidia HairWorks Off) | |
| Lenovo Legion Pro 5 16IRX9 | |
| Sınıf ortalaması Gaming (40.1 - 424, n=86, son 2 yıl) | |
| Lenovo Legion 5 16IRX G9 | |
| Lenovo Legion Pro 5 16IRX9 G9 | |
| SCHENKER XMG Core 15 (M24) | |
| Ortalama NVIDIA GeForce RTX 4060 Laptop GPU (110 - 229, n=36) | |
| HP Victus 16 (2024) | |
| Dell G16, i7-13650HX, RTX 4060 | |
| 1920x1080 Ultra Graphics & Postprocessing (HBAO+) | |
| Lenovo Legion Pro 5 16IRX9 | |
| Sınıf ortalaması Gaming (18.4 - 214, n=119, son 2 yıl) | |
| Lenovo Legion Pro 5 16IRX9 G9 | |
| SCHENKER XMG Core 15 (M24) | |
| Dell G16, i7-13650HX, RTX 4060 | |
| Ortalama NVIDIA GeForce RTX 4060 Laptop GPU (77 - 159.7, n=42) | |
| HP Victus 16 (2024) | |
| Lenovo Legion 5 16IRX G9 | |
| Skull & Bones | |
| 1920x1080 Ultra High Preset AA:T | |
| Sınıf ortalaması Gaming (31 - 118, n=12, son 2 yıl) | |
| SCHENKER XMG Core 15 (M24) | |
| Ortalama NVIDIA GeForce RTX 4060 Laptop GPU (65 - 73, n=5) | |
| Lenovo Legion Pro 5 16IRX9 G9 | |
| 2560x1440 Ultra High Preset AA:T | |
| Sınıf ortalaması Gaming (37 - 98, n=8, son 2 yıl) | |
| SCHENKER XMG Core 15 (M24) | |
| Ortalama NVIDIA GeForce RTX 4060 Laptop GPU (51 - 57, n=3) | |
| Lenovo Legion Pro 5 16IRX9 G9 | |
| F1 24 - 1920x1080 Ultra High Preset AA:T AF:16x | |
| Sınıf ortalaması Gaming (54.1 - 148, n=19, son 2 yıl) | |
| Lenovo Legion Pro 5 16IRX9 G9 | |
| Ortalama NVIDIA GeForce RTX 4060 Laptop GPU (47.5 - 61.6, n=10) | |
Cyberpunk 2077 FPS diagram
| düşük | orta | yüksek | ultra | QHD | 4K | |
|---|---|---|---|---|---|---|
| GTA V (2015) | 187.2 | 185.9 | 185.2 | 124.9 | 87.3 | |
| The Witcher 3 (2015) | 531 | 364 | 217 | 112 | 83 | |
| Dota 2 Reborn (2015) | 228 | 203 | 191.7 | 183.8 | 129.4 | |
| Final Fantasy XV Benchmark (2018) | 226 | 155.5 | 106.1 | 78.1 | ||
| X-Plane 11.11 (2018) | 201 | 172.9 | 135.1 | 124.7 | ||
| Far Cry 5 (2018) | 192 | 165 | 158 | 148 | 106 | |
| Strange Brigade (2018) | 526 | 295 | 231 | 199.9 | ||
| Baldur's Gate 3 (2023) | 138.6 | 85.7 | 71.1 | 66.5 | 49.1 | |
| Cyberpunk 2077 2.2 Phantom Liberty (2023) | 135.3 | 100.8 | 88.7 | 79.5 | 47.5 | |
| Skull & Bones (2024) | 137 | 124 | 98 | 69 | 53 | |
| F1 24 (2024) | 286 | 247 | 185.3 | 60.6 |
Emisyonlar ve güç: Lenovo'nun sol oyun tarafı sağdan daha fazla ısınıyor
Gürültü emisyonları
Performans modunda fanlar çoğunlukla aktiftir ve bu durum genellikle rölanti modunda da geçerlidir - daha sonra 25 ila 26 dB'lik sessiz bir hızda dönerler. 3DMark06 aracılığıyla orta yük senaryomuzda, 45 dB'ye kadar ulaştılar, ancak rakipler de benzer şekilde gürültülü.
Daha yüksek yükler altında, fanın gürültü emisyonları dalgalanıyor ve sabit kalmıyor. Tablodaki veriler maksimum değerleri göstermektedir. Örneğin, Cyberpunk oynarken emisyonları 47,5 dB ile 52,69 dB arasında dalgalandı.
Ses yüksekliği
| Boşta |
| 23 / 23 / 25 dB |
| Çalışırken |
| 45.18 / 53.13 dB |
 | ||
30 dB sessiz 40 dB(A) duyulabilirlik 50 dB(A) gürültülü |
||
min: | ||
| Lenovo Legion Pro 5 16IRX9 G9 NVIDIA GeForce RTX 4060 Laptop GPU, i7-14700HX, Samsung PM9A1 MZVL21T0HCLR | HP Victus 16 (2024) NVIDIA GeForce RTX 4060 Laptop GPU, i7-14700HX, Kioxia XG8 KXG80ZNV512G | Dell G16, i7-13650HX, RTX 4060 NVIDIA GeForce RTX 4060 Laptop GPU, i7-13650HX, WD PC SN740 SDDPNQD-1T00 | SCHENKER XMG Core 15 (M24) NVIDIA GeForce RTX 4060 Laptop GPU, R7 8845HS, Samsung 990 Pro 1 TB | Lenovo Legion Pro 5 16IRX9 NVIDIA GeForce RTX 4070 Laptop GPU, i9-14900HX, Samsung PM9A1 MZVL21T0HCLR | Lenovo Legion 5 16IRX G9 NVIDIA GeForce RTX 4060 Laptop GPU, i7-14650HX, Samsung PM9A1 MZVL21T0HCLR | |
|---|---|---|---|---|---|---|
| Noise | -13% | 6% | 4% | -7% | -11% | |
| kapalı / ortam * | 23 | 25 -9% | 23 -0% | 23 -0% | 23.9 -4% | 24 -4% |
| Idle Minimum * | 23 | 28 -22% | 23 -0% | 23 -0% | 24.3 -6% | 24 -4% |
| Idle Average * | 23 | 29 -26% | 23 -0% | 23 -0% | 24.3 -6% | 28.8 -25% |
| Idle Maximum * | 25 | 33 -32% | 27.96 -12% | 23 8% | 28.9 -16% | 32 -28% |
| Load Average * | 45.18 | 45 -0% | 27.96 38% | 38.92 14% | 45.8 -1% | 45.5 -1% |
| Cyberpunk 2077 ultra * | 52.69 | 52.06 1% | ||||
| Load Maximum * | 53.13 | 48 10% | 47.89 10% | 52.09 2% | 56.6 -7% | 55.7 -5% |
| Witcher 3 ultra * | 43 | 47.89 | 50.96 | 51 | 53.1 |
* ... daha küçük daha iyidir
Sıcaklık
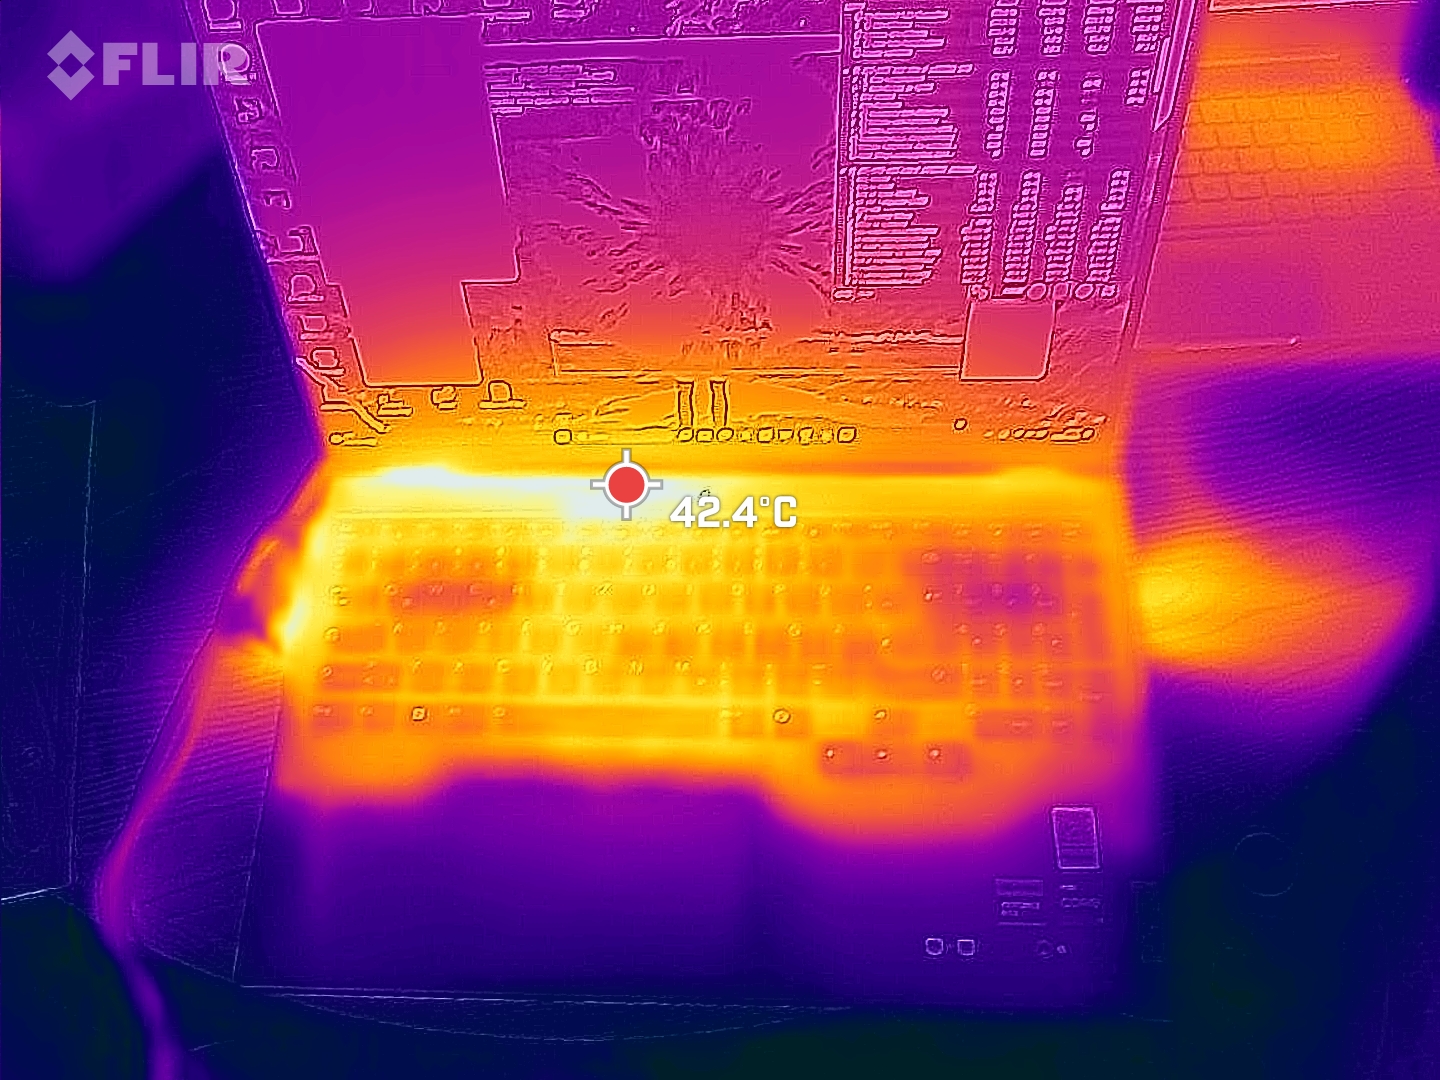
Legion rölantide çalışırken zaten oldukça ısınıyor - cihazın alt kısmında 39 °C'ye kadar ölçüm yaptık. Genel olarak, WASD tuşlarının bulunduğu sol taraf (oyuncular için önemli olan) sağ tarafa göre daha fazla ısınıyor gibi görünüyor.
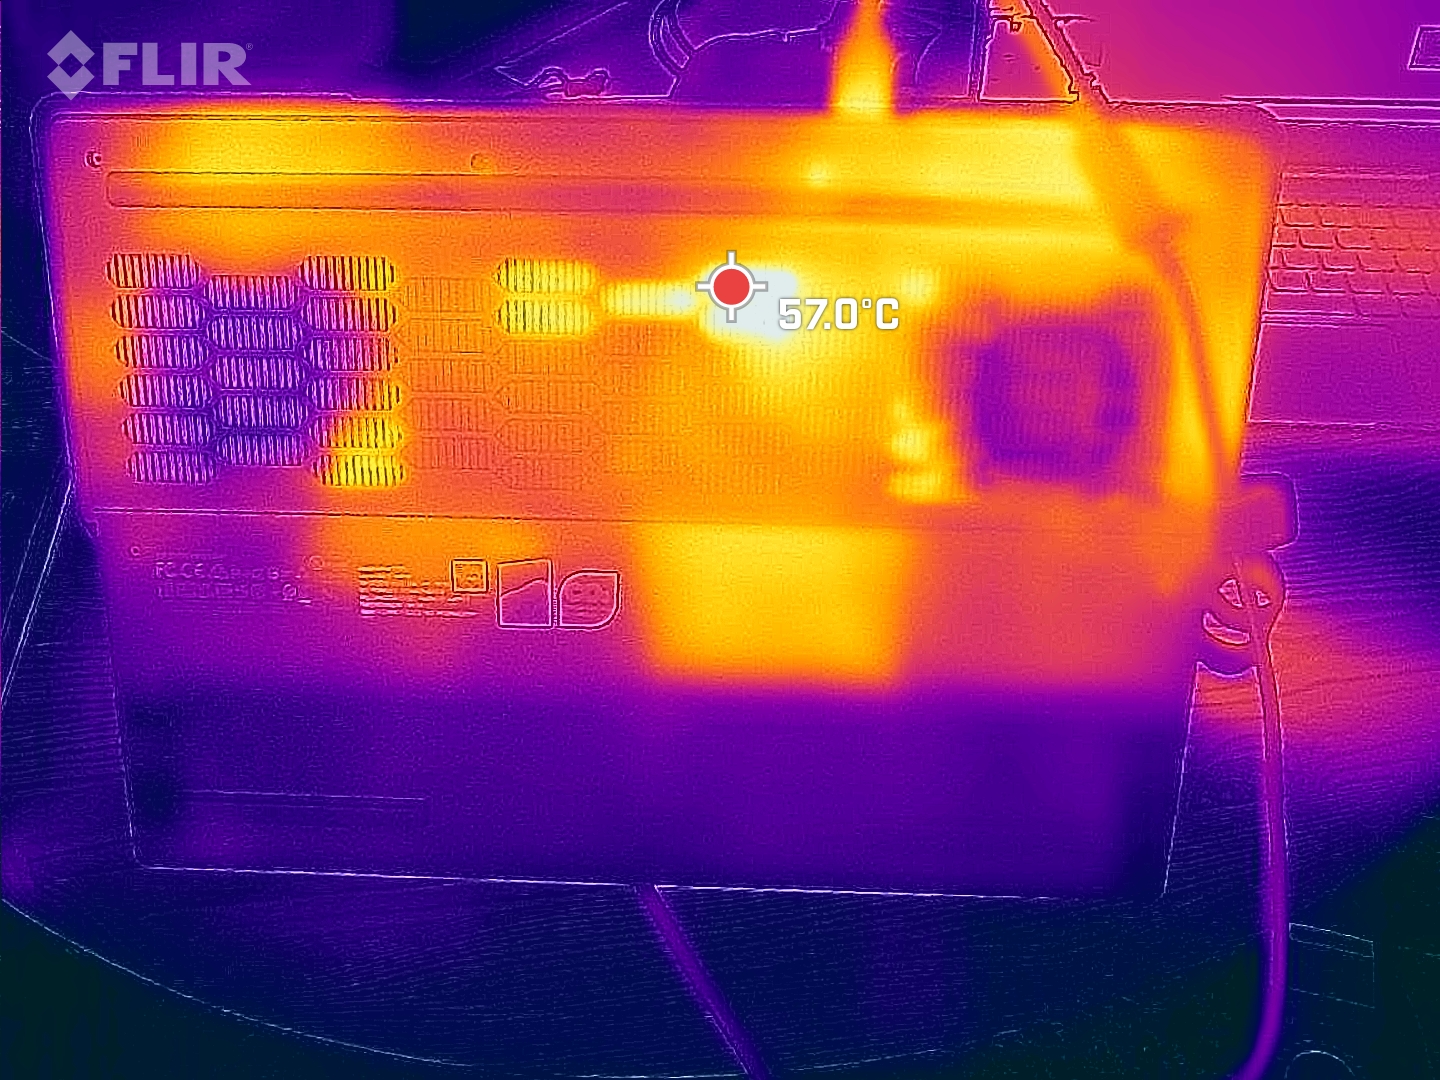
Ağır yük altında, alt kısımda 57 °C'lik bir sıcak nokta ölçtük. Dell G16 ve Core 15 benzer şekilde ısınırken, diğer rakipler daha serin kalma eğilimindeydi.
(-) Üst taraftaki maksimum sıcaklık, 40.4 °C / 105 F ortalamasına kıyasla 50 °C / 122 F'dir. , Gaming sınıfı için 21.2 ile 68.8 °C arasında değişir.
(-) Alt kısım, 43.2 °C / 110 F ortalamasına kıyasla maksimum 57 °C / 135 F'ye kadar ısınır
(±) Boşta kullanımda, üst tarafın ortalama sıcaklığı 32.9 °C / 91 F olup, cihazın 33.9 °C / 93 F.
(-) 3: The average temperature for the upper side is 38.4 °C / 101 F, compared to the average of 33.9 °C / 93 F for the class Gaming.
(±) Avuç içi dayanakları ve dokunmatik yüzey maksimum 36 °C / 96.8 F ile dokunulamayacak kadar ısınabilir.
(-) Benzer cihazların avuç içi dayanağı alanının ortalama sıcaklığı 28.9 °C / 84 F (-7.1 °C / -12.8 F) idi.
| Lenovo Legion Pro 5 16IRX9 G9 Intel Core i7-14700HX, NVIDIA GeForce RTX 4060 Laptop GPU | HP Victus 16 (2024) Intel Core i7-14700HX, NVIDIA GeForce RTX 4060 Laptop GPU | Dell G16, i7-13650HX, RTX 4060 Intel Core i7-13650HX, NVIDIA GeForce RTX 4060 Laptop GPU | SCHENKER XMG Core 15 (M24) AMD Ryzen 7 8845HS, NVIDIA GeForce RTX 4060 Laptop GPU | Lenovo Legion Pro 5 16IRX9 Intel Core i9-14900HX, NVIDIA GeForce RTX 4070 Laptop GPU | Lenovo Legion 5 16IRX G9 Intel Core i7-14650HX, NVIDIA GeForce RTX 4060 Laptop GPU | |
|---|---|---|---|---|---|---|
| Heat | 19% | 3% | -2% | 8% | 17% | |
| Maximum Upper Side * | 50 | 50 -0% | 49 2% | 52 -4% | 43.8 12% | 40.4 19% |
| Maximum Bottom * | 57 | 50 12% | 58 -2% | 61 -7% | 55.4 3% | 43.8 23% |
| Idle Upper Side * | 36 | 25 31% | 35 3% | 35 3% | 32.8 9% | 30.3 16% |
| Idle Bottom * | 39 | 26 33% | 35 10% | 39 -0% | 36 8% | 35.3 9% |
* ... daha küçük daha iyidir
Konuşmacılar
Hoparlörler rakiplerinden olumlu bir şekilde ayrılmıyor: sadece orta derecede yüksekler ve neredeyse hiç bas sesi duymadık. Analog cihazları bağlamak için standart bir kulaklık girişi mevcuttur.
Lenovo Legion Pro 5 16IRX9 G9 ses analizi
(±) | hoparlör ses yüksekliği ortalama ama iyi (77.13 dB)
Bas 100 - 315Hz
(-) | neredeyse hiç bas yok - ortalama olarak medyandan 18.3% daha düşük
(±) | Bas doğrusallığı ortalamadır (12% delta - önceki frekans)
Ortalar 400 - 2000 Hz
(±) | daha yüksek ortalar - ortalama olarak medyandan 6.9% daha yüksek
(+) | orta frekanslar doğrusaldır (4.9% deltadan önceki frekansa)
Yüksekler 2 - 16 kHz
(+) | dengeli yüksekler - medyandan yalnızca 4.5% uzakta
(±) | Yükseklerin doğrusallığı ortalamadır (9.5% delta - önceki frekans)
Toplam 100 - 16.000 Hz
(±) | Genel sesin doğrusallığı ortalamadır (21.6% ortancaya göre fark)
Aynı sınıfla karşılaştırıldığında
» Bu sınıftaki tüm test edilen cihazların %76%'si daha iyi, 5% benzer, 19% daha kötüydü
» En iyisinin deltası 6% idi, ortalama 18% idi, en kötüsü 132% idi
Test edilen tüm cihazlarla karşılaştırıldığında
» Test edilen tüm cihazların %59'si daha iyi, 7 benzer, % 34 daha kötüydü
» En iyisinin deltası 4% idi, ortalama 24% idi, en kötüsü 134% idi
Dell G16, i7-13650HX, RTX 4060 ses analizi
(±) | hoparlör ses yüksekliği ortalama ama iyi (80.55 dB)
Bas 100 - 315Hz
(-) | neredeyse hiç bas yok - ortalama olarak medyandan 25.1% daha düşük
(-) | bas doğrusal değildir (18.9% delta ile önceki frekans)
Ortalar 400 - 2000 Hz
(±) | daha yüksek ortalar - ortalama olarak medyandan 8% daha yüksek
(+) | orta frekanslar doğrusaldır (5.9% deltadan önceki frekansa)
Yüksekler 2 - 16 kHz
(+) | dengeli yüksekler - medyandan yalnızca 3.5% uzakta
(±) | Yükseklerin doğrusallığı ortalamadır (8.6% delta - önceki frekans)
Toplam 100 - 16.000 Hz
(±) | Genel sesin doğrusallığı ortalamadır (23.4% ortancaya göre fark)
Aynı sınıfla karşılaştırıldığında
» Bu sınıftaki tüm test edilen cihazların %83%'si daha iyi, 5% benzer, 12% daha kötüydü
» En iyisinin deltası 6% idi, ortalama 18% idi, en kötüsü 132% idi
Test edilen tüm cihazlarla karşılaştırıldığında
» Test edilen tüm cihazların %68'si daha iyi, 6 benzer, % 26 daha kötüydü
» En iyisinin deltası 4% idi, ortalama 24% idi, en kötüsü 134% idi
Güç tüketimi
Legion Pro 5'in gerçek rölanti tüketimini ölçmek pek kolay değil çünkü dizüstü bilgisayar boştayken bile neredeyse sürekli olarak soketten yaklaşık 50 watt çekiyor! Çok uzun bir süre beklerseniz, boşta tüketimi sonunda nispeten normal değerlere (15 ila 20 watt) düşer, ancak dizüstü bilgisayarın parlaklığını F tuşuyla değiştirir değiştirmez, tüketim 50 watt'a geri döner ve alışılmadık derecede uzun bir süre orada kalır. Bu nedenle tabloda verilen boşta çalışma değerleri oldukça iyimser bir şekilde düşüktür.
Ağır yük altında, tüketim grafiklerimizden de görebileceğiniz gibi, tüketimi ve GPU'nun performansı oldukça güçlü bir şekilde dalgalanıyor - özellikle de stres testimizde olduğu gibi CPU ve GPU eşit derecede zorlandığında.

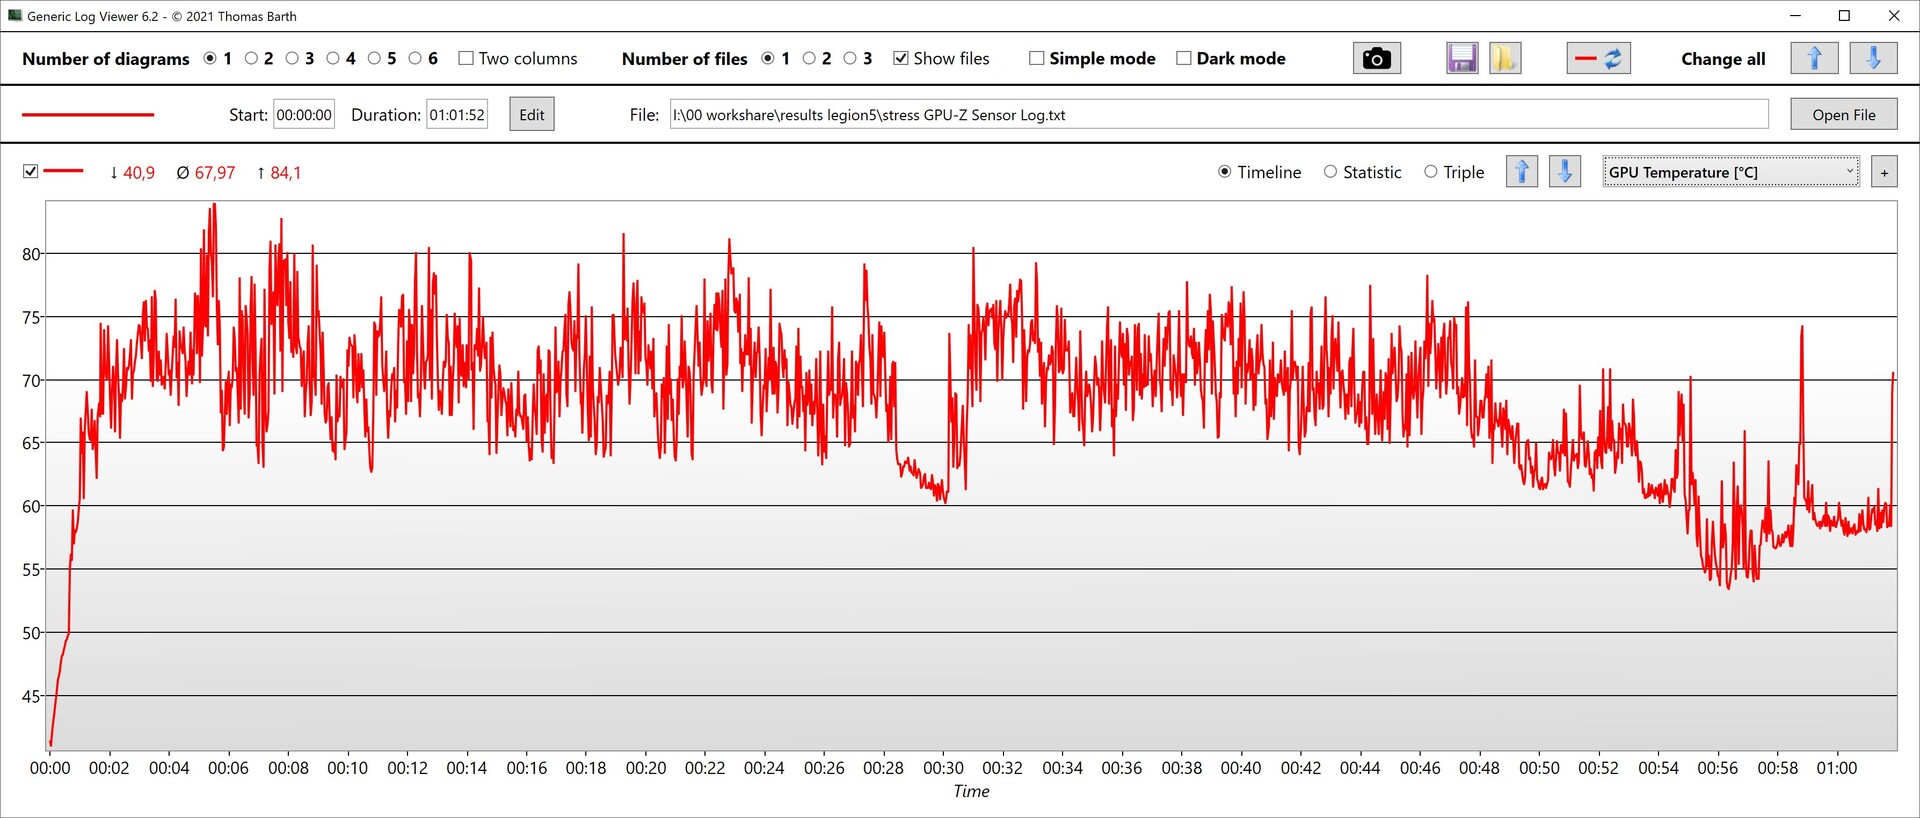
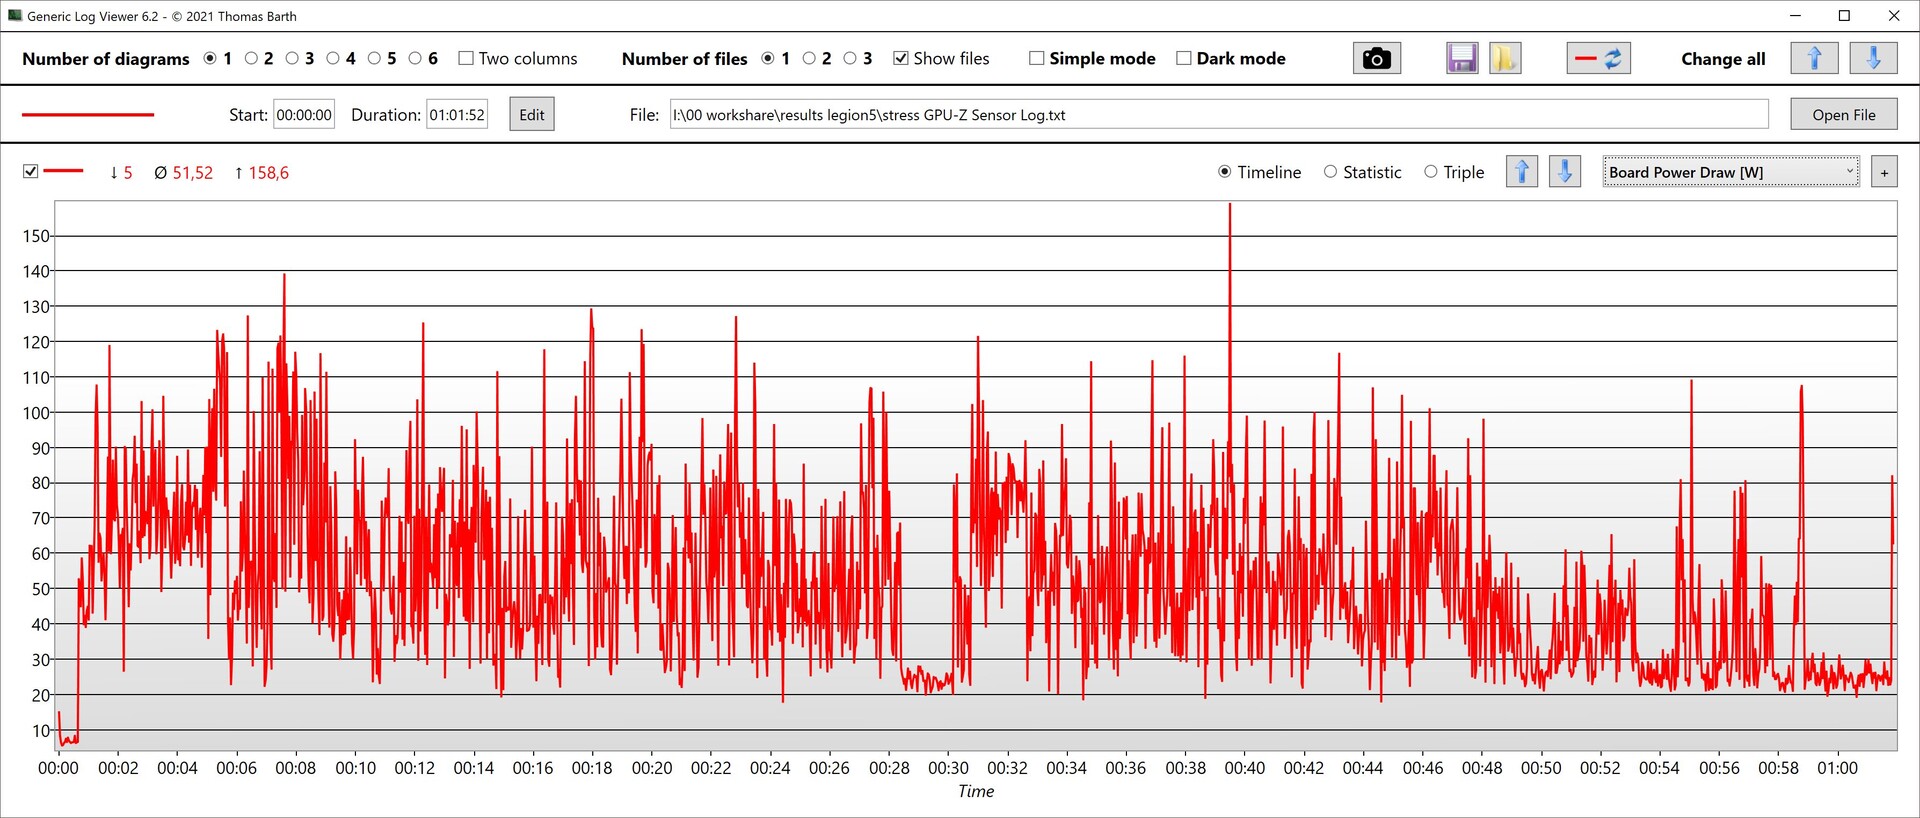
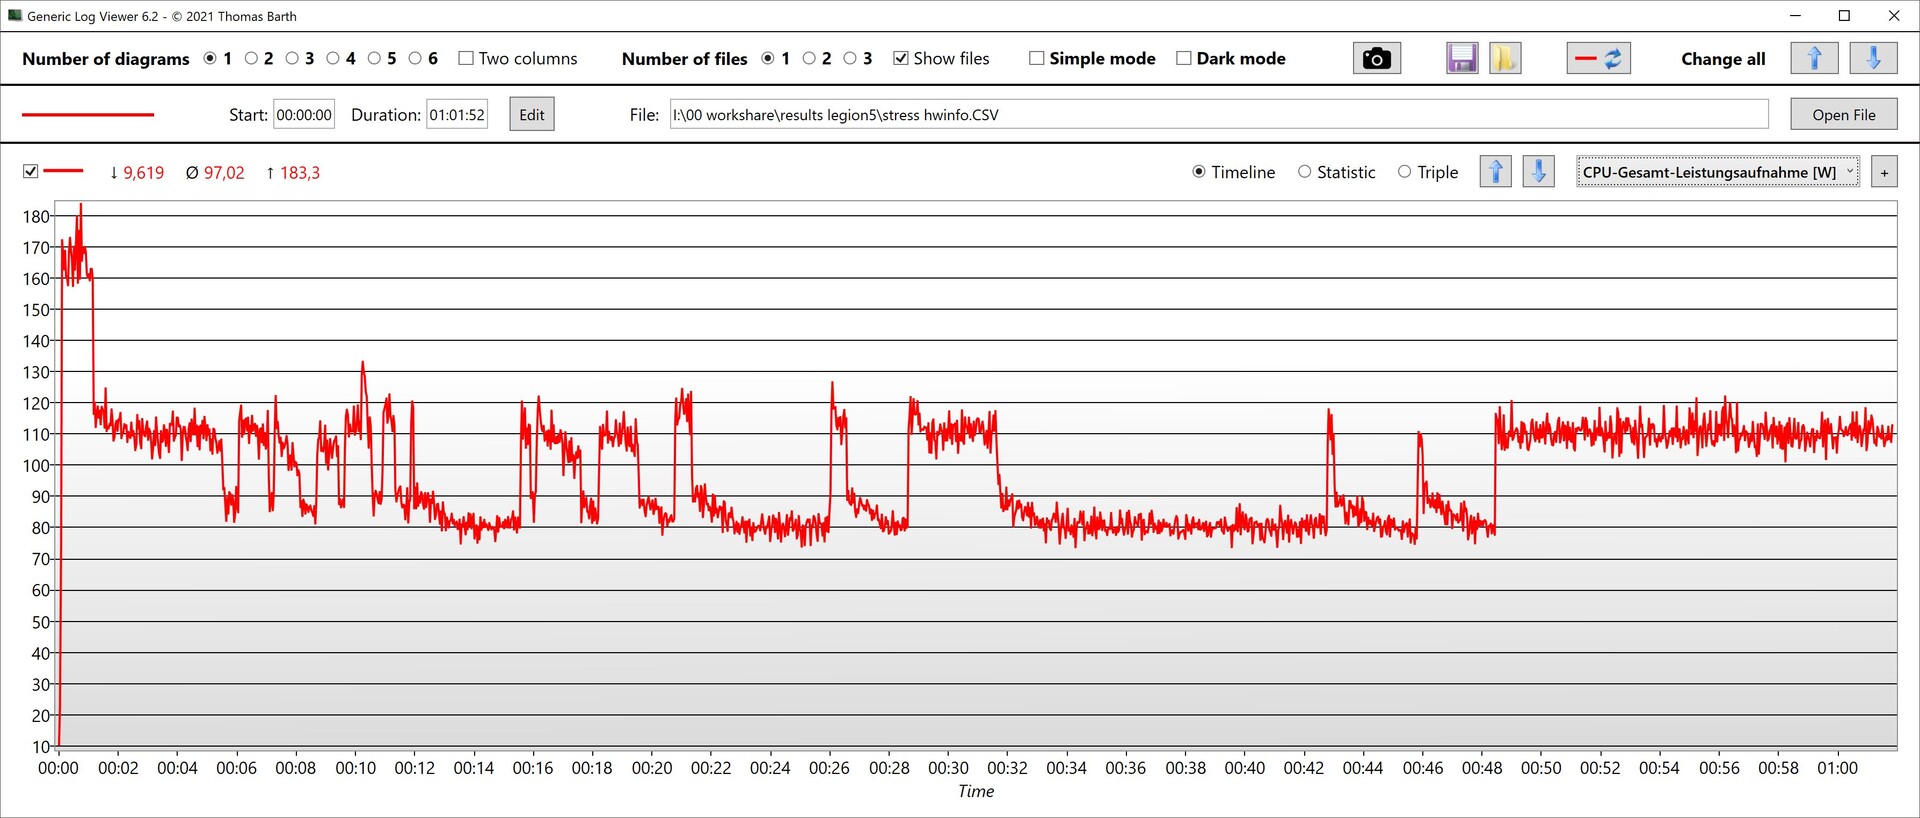
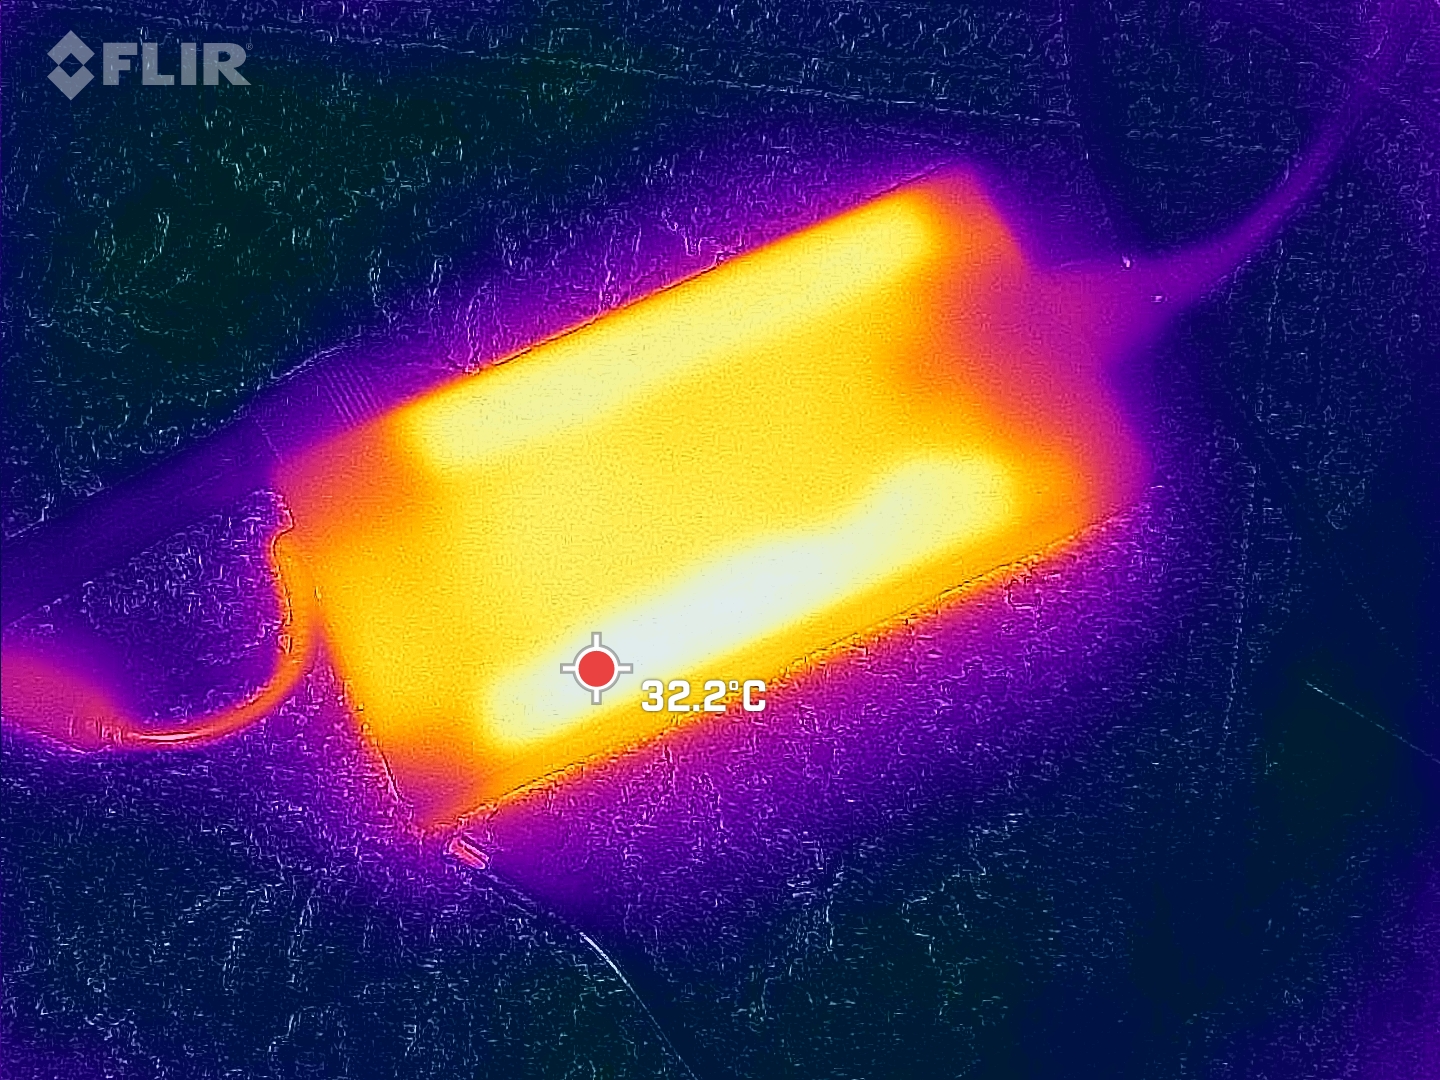
Cyberpunk 2077'yi çalıştırırken ortalama 229 watt tüketim ölçtük. Stres testinde, ölçüm cihazımız maksimum ve sadece kısa süreli 297 watt'a kadar tüketim kaydetti, bu da düz ama oldukça büyük 300 watt güç kaynağının başa çıkabileceği bir değer.
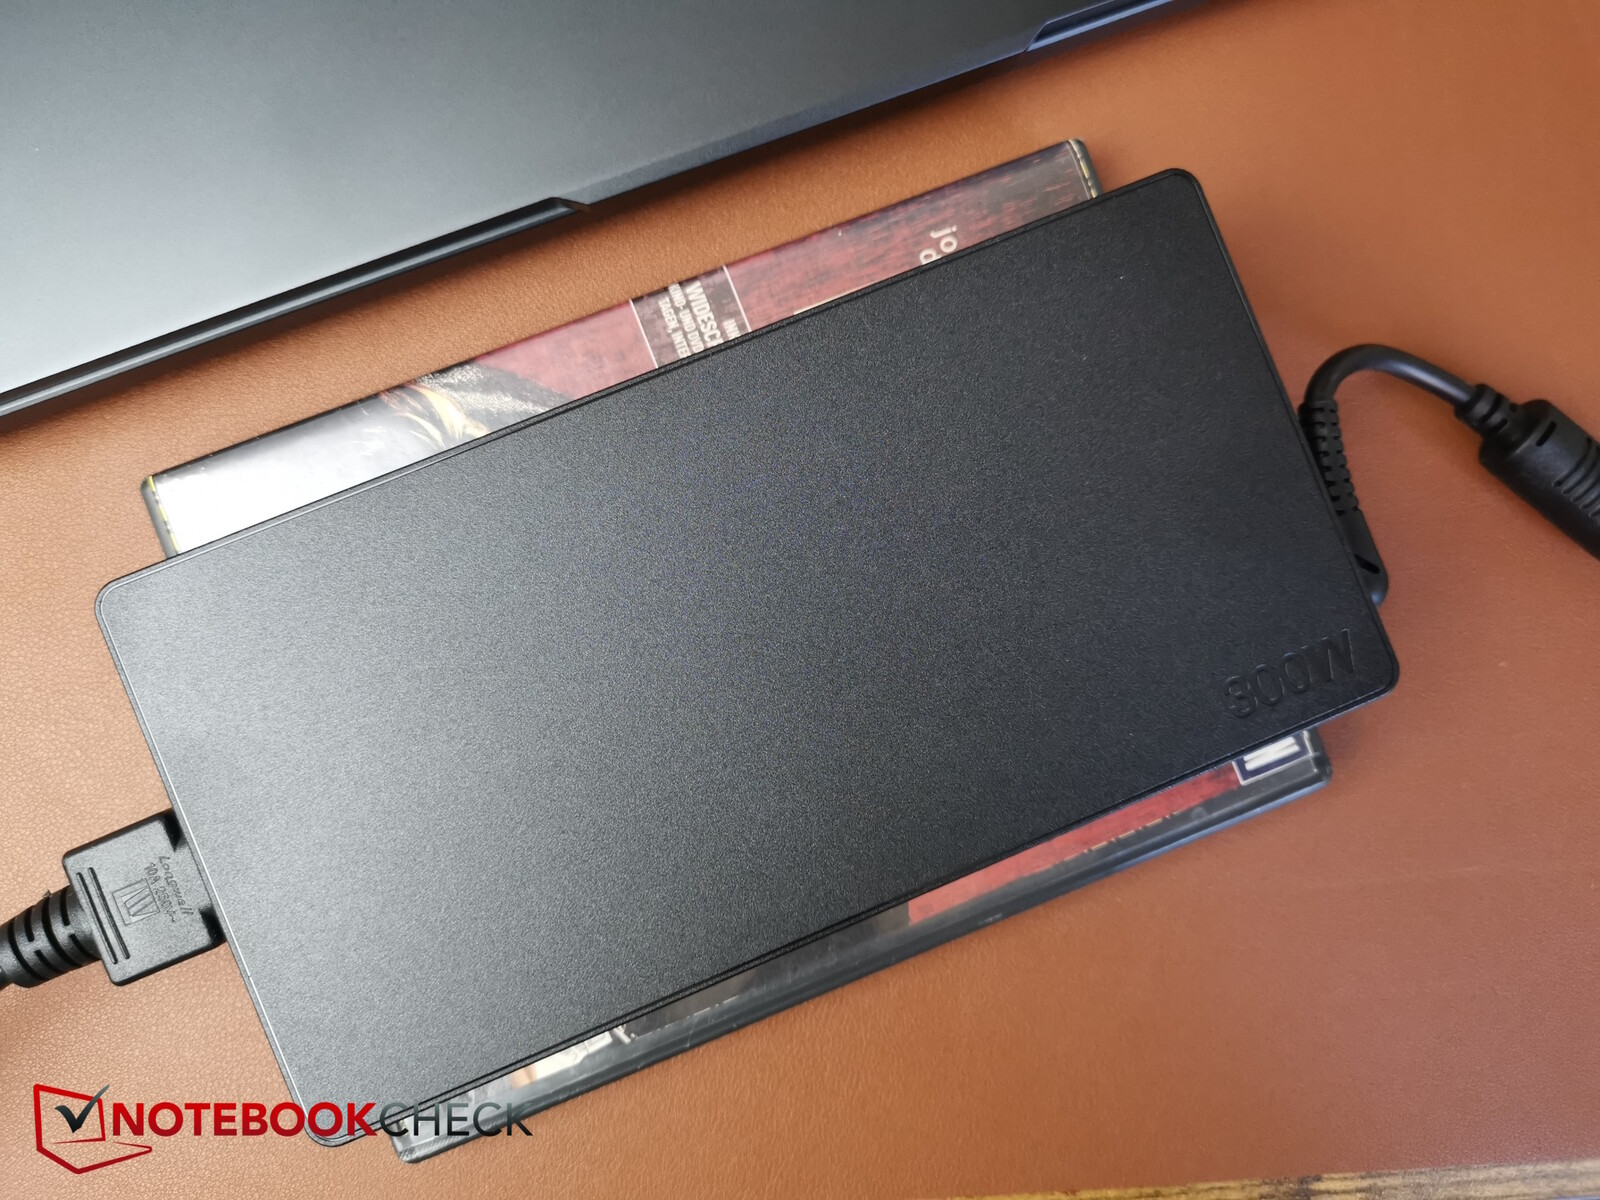
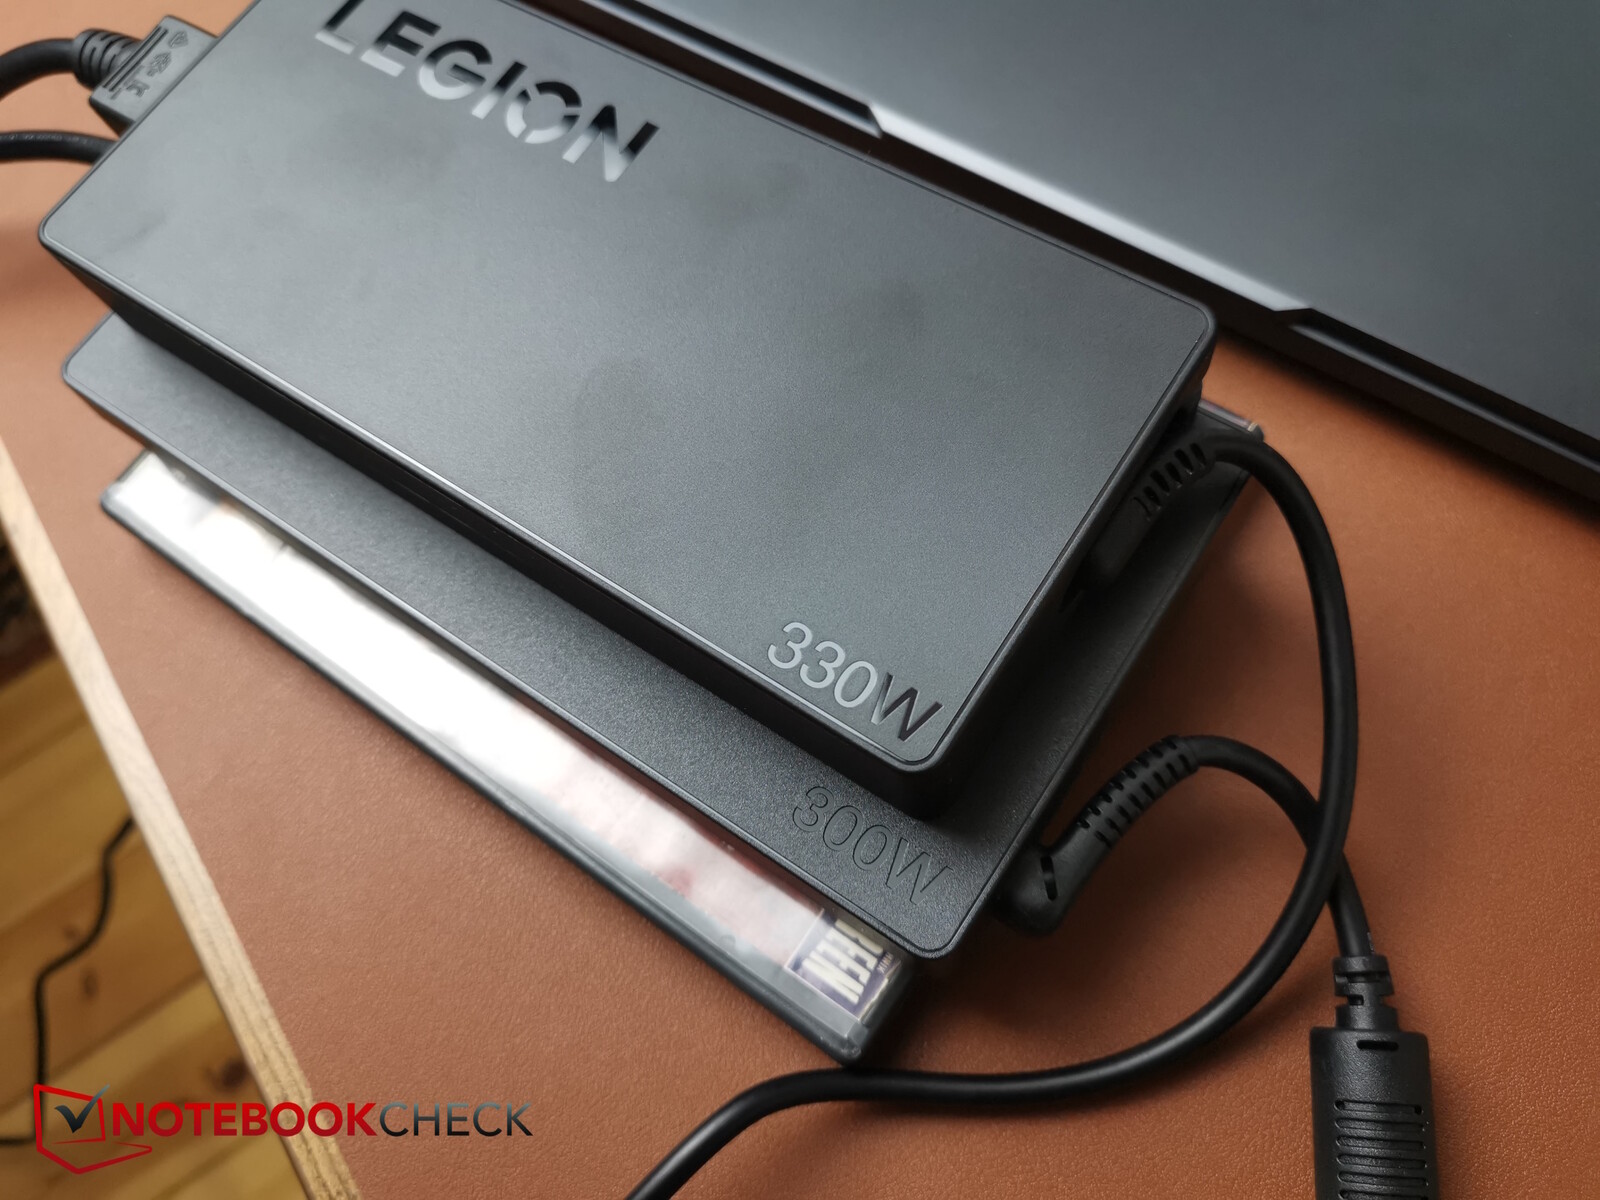
Güç kaynağı ünitelerinden bahsetmişken: Legion Pro 5i ile birlikte gelen 300 watt'lık güç kaynağı, daha pahalı olan Legion 9i'nin 330 watt'lık güç kaynağı ünitesinden oldukça büyük.
| Kapalı / Bekleme modu | |
| Boşta | |
| Çalışırken |
|
Key:
min: | |
| Lenovo Legion Pro 5 16IRX9 G9 NVIDIA GeForce RTX 4060 Laptop GPU, i7-14700HX, Samsung PM9A1 MZVL21T0HCLR | HP Victus 16 (2024) NVIDIA GeForce RTX 4060 Laptop GPU, i7-14700HX, Kioxia XG8 KXG80ZNV512G | Dell G16, i7-13650HX, RTX 4060 NVIDIA GeForce RTX 4060 Laptop GPU, i7-13650HX, WD PC SN740 SDDPNQD-1T00 | SCHENKER XMG Core 15 (M24) NVIDIA GeForce RTX 4060 Laptop GPU, R7 8845HS, Samsung 990 Pro 1 TB | Lenovo Legion Pro 5 16IRX9 NVIDIA GeForce RTX 4070 Laptop GPU, i9-14900HX, Samsung PM9A1 MZVL21T0HCLR | Lenovo Legion 5 16IRX G9 NVIDIA GeForce RTX 4060 Laptop GPU, i7-14650HX, Samsung PM9A1 MZVL21T0HCLR | |
|---|---|---|---|---|---|---|
| Power Consumption | 11% | 14% | 23% | -22% | -8% | |
| Idle 150cd/m2 * | 16.4 | 15.4 6% | 14 15% | 11.8 28% | 21 -28% | 17.6 -7% |
| 3DMark06 Return To Proxycon * | 124 | 104 16% | 77.5 37% | |||
| Cyberpunk 2077 FHD ultra no FSR 150cd * | 229 | |||||
| 1280x720 Prime95 28.10 and Furmark 1.25 * | 211 | 176.9 16% | 190 10% | 200.6 5% | 245 -16% | 227 -8% |
* ... daha küçük daha iyidir
Power consumption Witcher 3 / stress test
Power consumption with external monitor
Çalışma Zamanları
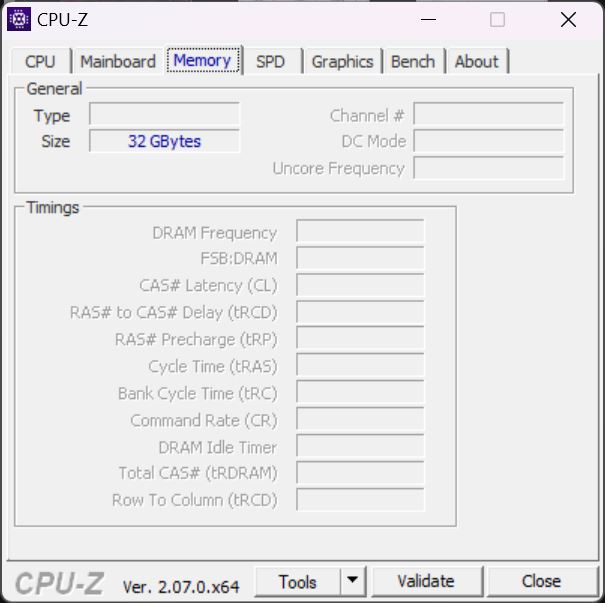
Lenovo dizüstü bilgisayara 80 Wh'lik bir batarya yerleştirmiştir; daha büyük bir bataryaya sahip Core 15 dışında, rakipler benzer kapasiteye sahip modeller kullanmaktadır.
Test cihazımız, Wi-Fi ve video testlerinde parlaklığı 150 nite düşürerek 5 saatten biraz fazla dayandı; bu, rakipler tarafından genellikle aşılan ortalama ila ortalamanın biraz altında bir değer.
| Lenovo Legion Pro 5 16IRX9 G9 i7-14700HX, NVIDIA GeForce RTX 4060 Laptop GPU, 80 Wh | HP Victus 16 (2024) i7-14700HX, NVIDIA GeForce RTX 4060 Laptop GPU, 83 Wh | Dell G16, i7-13650HX, RTX 4060 i7-13650HX, NVIDIA GeForce RTX 4060 Laptop GPU, 86 Wh | SCHENKER XMG Core 15 (M24) R7 8845HS, NVIDIA GeForce RTX 4060 Laptop GPU, 99.8 Wh | Lenovo Legion Pro 5 16IRX9 i9-14900HX, NVIDIA GeForce RTX 4070 Laptop GPU, 80 Wh | Lenovo Legion 5 16IRX G9 i7-14650HX, NVIDIA GeForce RTX 4060 Laptop GPU, 80 Wh | Sınıf ortalaması Gaming | |
|---|---|---|---|---|---|---|---|
| Pil Çalışma Süresi | 66% | 6% | 109% | -22% | 24% | 16% | |
| H.264 | 312 | 381 22% | 608 95% | 576 85% | 447 ? 43% | ||
| WiFi v1.3 | 308 | 511 66% | 378 23% | 889 189% | 290 -6% | 444 44% | 387 ? 26% |
| Load | 105 | 76 -28% | 151 44% | 65 -38% | 46 -56% | 84.5 ? -20% | |
| Reader / Idle | 403 | 585 ? |
Artılar
Eksiler
Karar - Tamamen performansa odaklanın


Legion Pro 5 yalnızca performansa odaklanıyor. Zaten güçlü olan i7-14700HX ve RTX 4060, ortalamadan daha hızlı çalışıyor ve sadece performans açısından i9-14900HX ve RTX 4070'li konfigürasyona bile yaklaşıyor. Dizüstü bilgisayarın potansiyel olarak son derece doğru renklere sahip ekranı sayesinde Legion Pro içerik oluşturucular için de ilgi çekici olabilir.
Buna karşılık, ekranın kutudan çıkar çıkmaz çok doğru bir şekilde kalibre edilmemiş olması utanç verici. Oyun performansına odaklandığı düşünüldüğünde, üreticinin soğutma sisteminin sağ tarafta WASD tarafına göre biraz daha iyi çalıştığını fark etmesi gerekirdi ki bu oyuncular için önemlidir. Diğer olumsuz noktalar arasında SSD'nin termal olarak yavaşlaması ve cihazın kısmen yüksek rölanti performansının tekrar sakinleşmesi oldukça uzun sürüyor. Yine de olumlu yanları olumsuz yanlarından daha ağır basıyor.
Süper güçlü bir oyun dizüstü bilgisayarı arayışındaysanız, Lenovo Legion Pro 5i'den başkasına bakmayın. İçerik oluşturucular da mutlu olabilir, ancak birkaç küçük ayrıntı potansiyel optimizasyon için daha fazla alan bırakıyor.
Fiyat ve bulunabilirlik
Lenovo Legion Pro 5i'yi doğrudan üreticiden sipariş edebilirsiniz. Test cihazımız için MRSP 1.395 ABD dolarıdır.
Lütfen dikkat: Derecelendirme sistemimizi güncelledik ve 8. sürümün sonuçları 7. sürümün sonuçları ile karşılaştırılamaz. Daha fazla bilgi için burada.
Lenovo Legion Pro 5 16IRX9 G9
- 07/03/2024 v8
Christian Hintze
 Total Sustainability Score:
 Şeffaflık
İncelenecek cihazların seçimi editör ekibimiz tarafından yapılır. Test örneği, bu incelemenin amacı doğrultusunda üretici veya perakendeci tarafından yazara ödünç olarak sağlanmıştır. Borç verenin bu inceleme üzerinde herhangi bir etkisi olmadığı gibi, üretici de yayınlanmadan önce bu incelemenin bir kopyasını almamıştır. Bu incelemeyi yayınlama zorunluluğu yoktu. İncelemelerimiz karşılığında asla tazminat veya ödeme kabul etmiyoruz. Bağımsız bir medya şirketi olarak Notebookcheck, üreticilerin, perakendecilerin veya yayıncıların otoritesine tabi değildir.
Notebookcheck bu şekilde test yapıyor
Notebookcheck, tüm sonuçların karşılaştırılabilir olmasını sağlamak için her yıl yüzlerce dizüstü bilgisayarı ve akıllı telefonu standart prosedürler kullanarak bağımsız olarak inceliyor. Yaklaşık 20 yıldır test yöntemlerimizi sürekli olarak geliştirdik ve bu süreçte endüstri standartlarını belirledik. Test laboratuvarlarımızda deneyimli teknisyenler ve editörler tarafından yüksek kaliteli ölçüm ekipmanları kullanılmaktadır. Bu testler çok aşamalı bir doğrulama sürecini içerir. Karmaşık derecelendirme sistemimiz, nesnelliği koruyan yüzlerce sağlam temellere dayanan ölçüm ve kıyaslamaya dayanmaktadır.Price comparison

