

Maingear ML-16 MK2 dizüstü bilgisayar incelemesi: GeForce Uygun fiyata RTX 4070 performansı

Schenker ya da Eurocom gibi Maingear da oyuncuların ve profesyonellerin ilgisini çekmek üzere tasarlanmış yüksek performanslı beyaz etiketli dizüstü bilgisayarların satıcısıdır. Bu yaklaşım, dizüstü bilgisayarlarını kendi bünyesinde tasarlayan Dell, Lenovo veya HP gibi daha tanınmış bilgisayar üreticilerinin aksine bir yaklaşımdır. Maingear'ın son modeli, en yeni Intel Meteor Lake CPU ve Nvidia GPU ile donatılmış ML-16 MK2'dir.
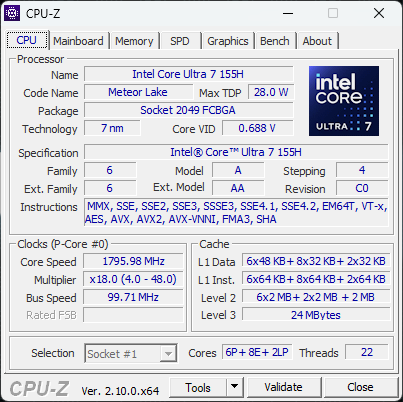
Test ünitemiz Core Ultra 7 155H, 105 W GeForce RTX 4070 ve 240 Hz 1600p IPS ekran ile yaklaşık 2000 $ karşılığında tamamen yapılandırılmıştır. Daha düşük SKU'lar bunun yerine RTX 4060 ile birlikte gelir, ancak CPU ve ekran sabit kalır.
ML-16 MK2'nin rakipleri arasında aşağıdaki gibi diğer ultra ince 16 inç oyun dizüstü bilgisayarları bulunmaktadır Razer Blade 16, Alienware x16 R2, Asus ROG Zephyrus G16veya Lenovo Legion Pro 7 16.
Daha fazla Maingear incelemesi:
Karşılaştırmalı olarak olası rakipler
Derecelendirme | Sürüm | Tarih | Modeli | Ağırlık | Yükseklik | Boyut | Çözünürlük | Fiyat |
|---|---|---|---|---|---|---|---|---|
| 80.9 % | v8 | 09/2024 | Maingear ML-16 MK2 Ultra 7 155H, NVIDIA GeForce RTX 4070 Laptop GPU | 2.1 kg | 19.9 mm | 16.00" | 2560x1600 | |
| 85.9 % | v8 | 08/2024 | Asus ROG Zephyrus G16 GA605WV Ryzen AI 9 HX 370, NVIDIA GeForce RTX 4060 Laptop GPU | 1.8 kg | 17.2 mm | 16.00" | 2560x1600 | |
| 84.3 % v7 (old) | v7 (old) | 05/2024 | HP Victus 16 (2024) i7-14700HX, NVIDIA GeForce RTX 4060 Laptop GPU | 2.4 kg | 23.9 mm | 16.10" | 1920x1080 | |
| 88.4 % v7 (old) | v7 (old) | 05/2024 | Alienware x16 R2 P120F Ultra 9 185H, NVIDIA GeForce RTX 4080 Laptop GPU | 2.7 kg | 18.57 mm | 16.00" | 2560x1600 | |
| 89.3 % v7 (old) | v7 (old) | 04/2024 | Lenovo Legion Pro 5 16IRX9 i9-14900HX, NVIDIA GeForce RTX 4070 Laptop GPU | 2.5 kg | 26.95 mm | 16.00" | 2560x1600 | |
| 91.1 % v7 (old) | v7 (old) | 02/2024 | Razer Blade 16 2024, RTX 4090 i9-14900HX, NVIDIA GeForce RTX 4090 Laptop GPU | 2.5 kg | 22 mm | 16.00" | 2560x1600 |
Not: Derecelendirme sistemimizi yakın zamanda güncelledik ve 8. sürümün sonuçları 7. sürümün sonuçları ile karşılaştırılamaz. Daha fazla bilgi için burada .
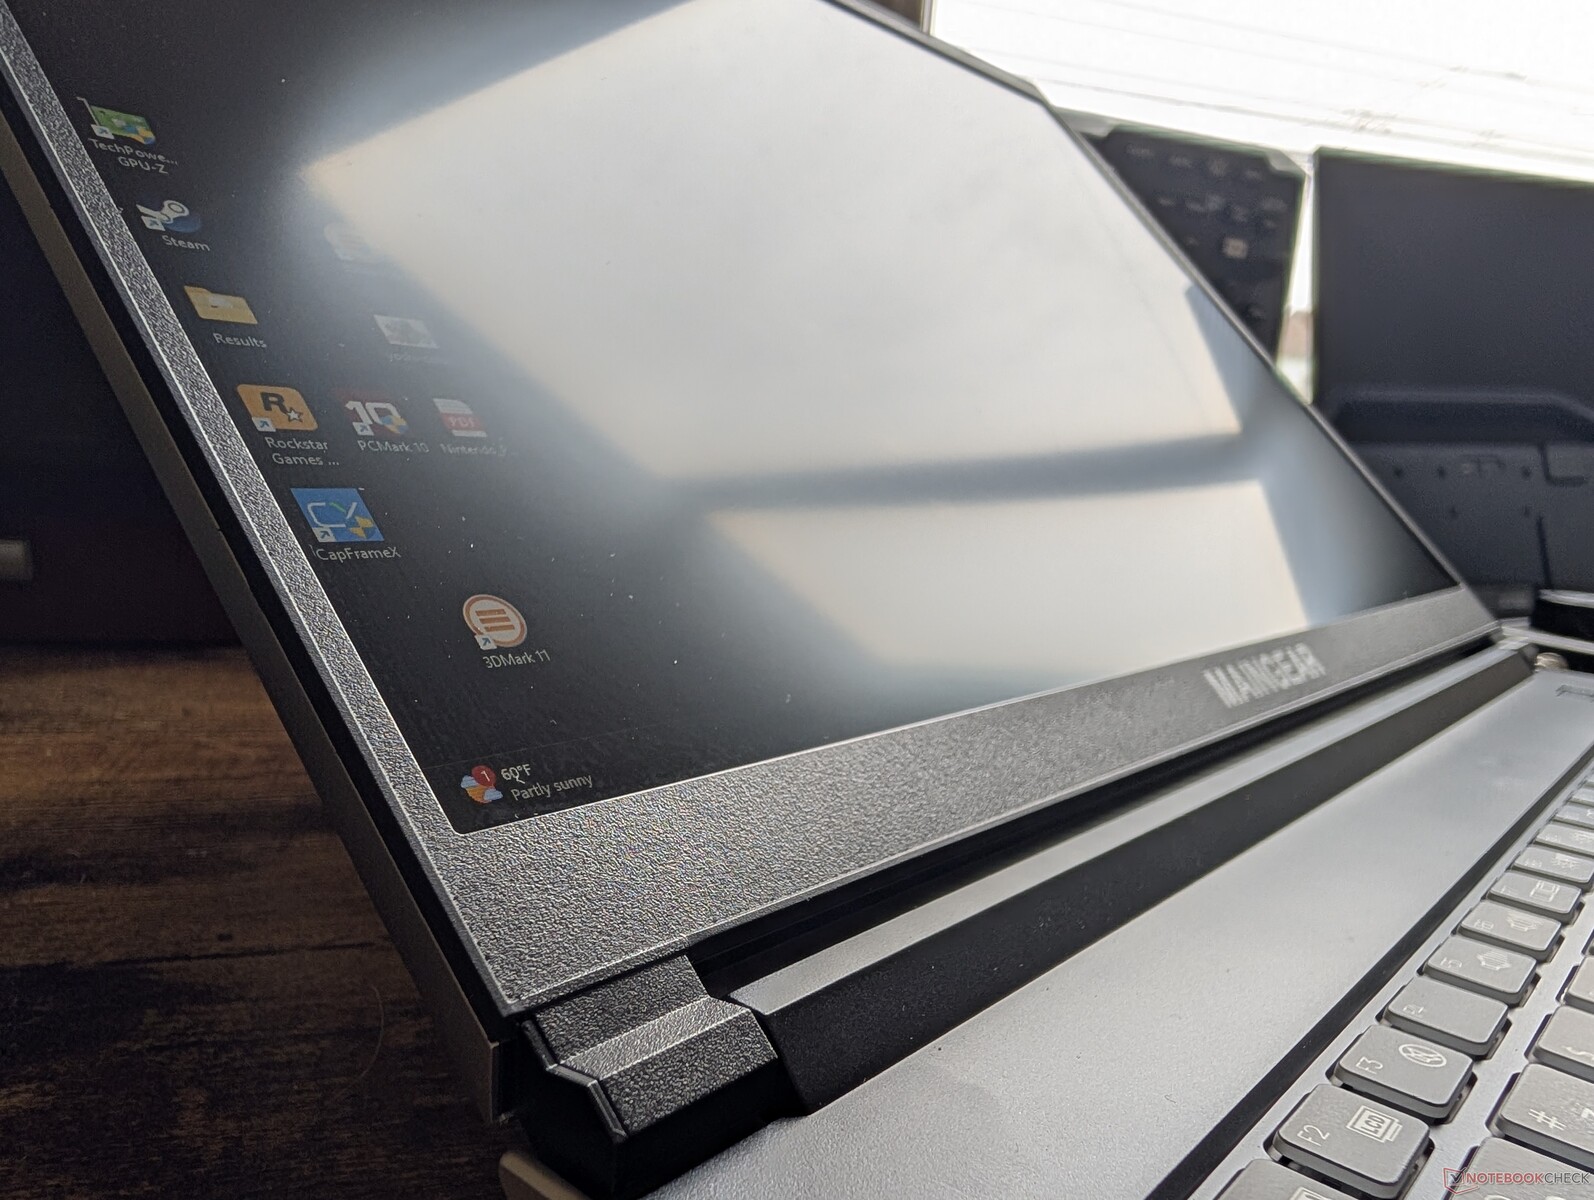
Kasa - İnce ve Keskin
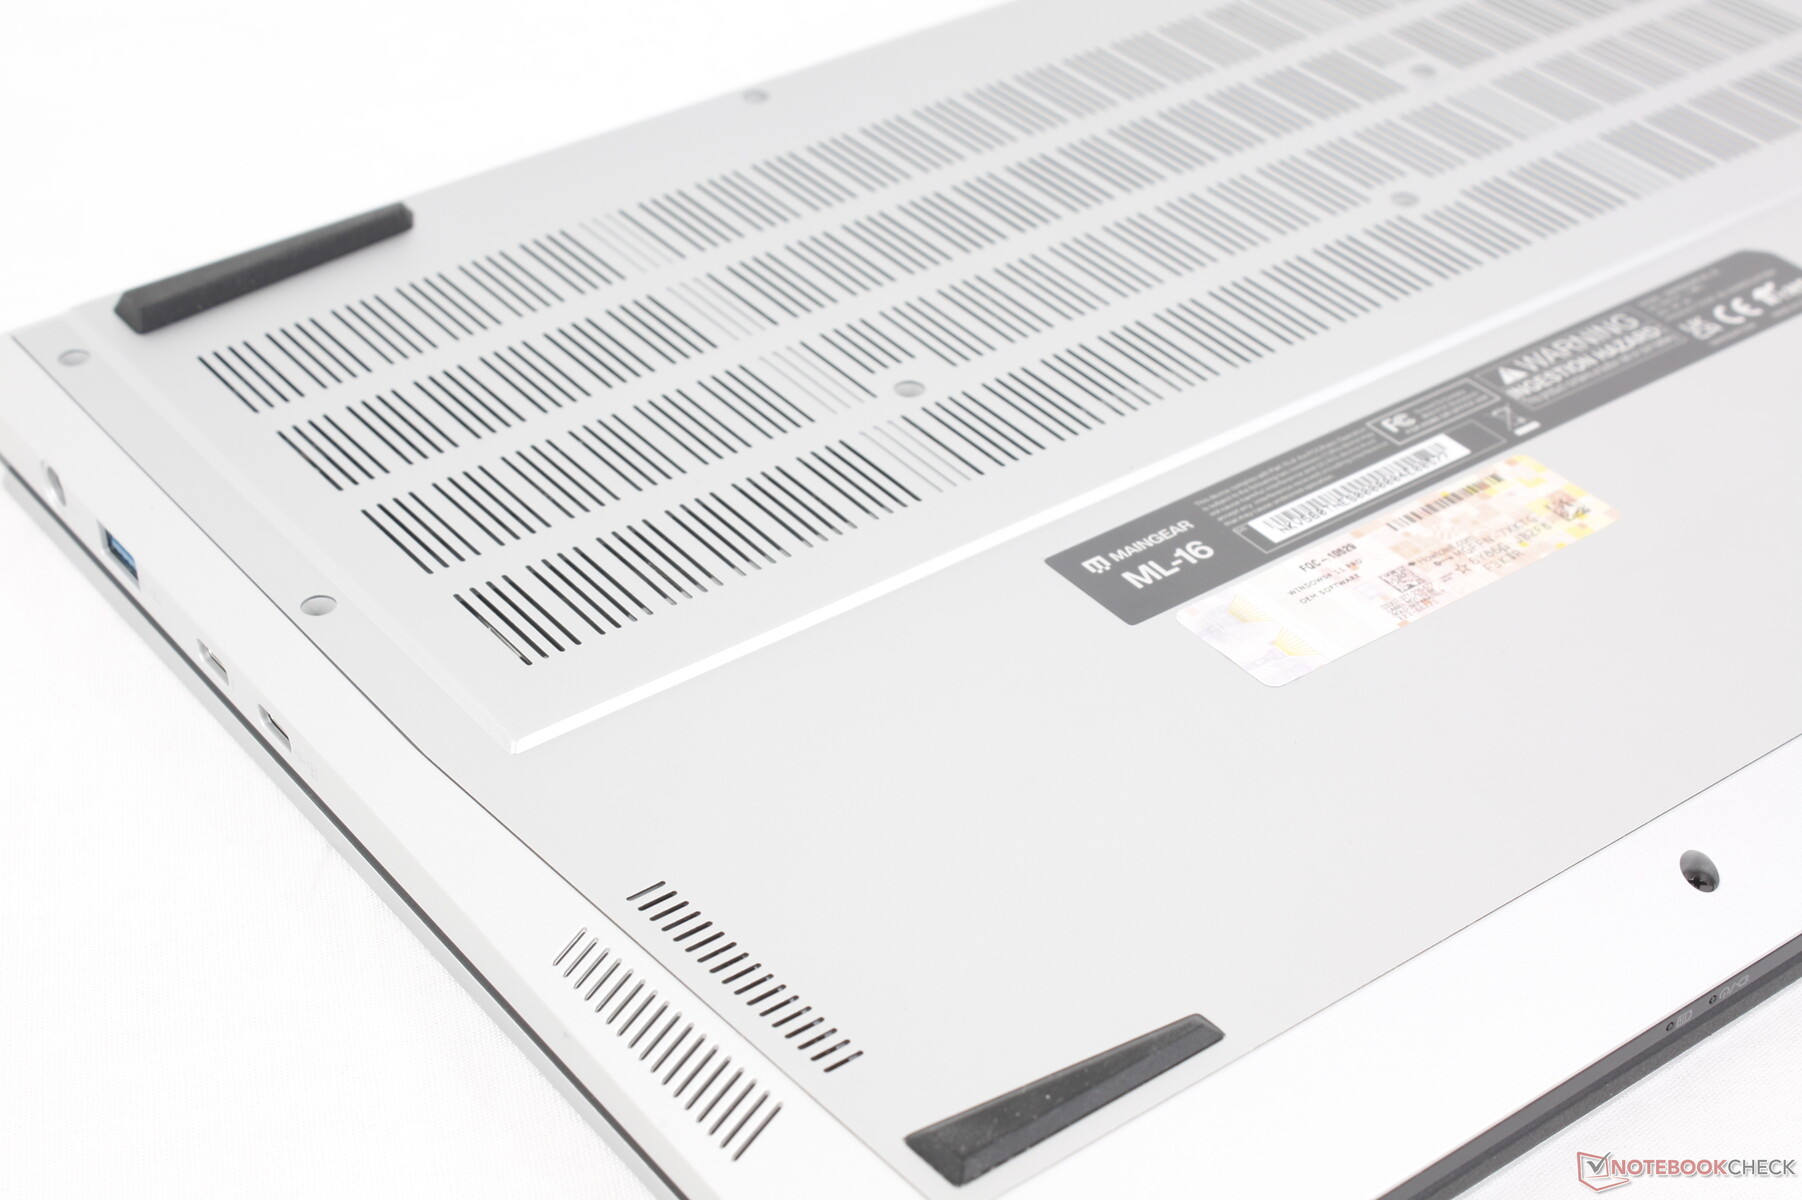
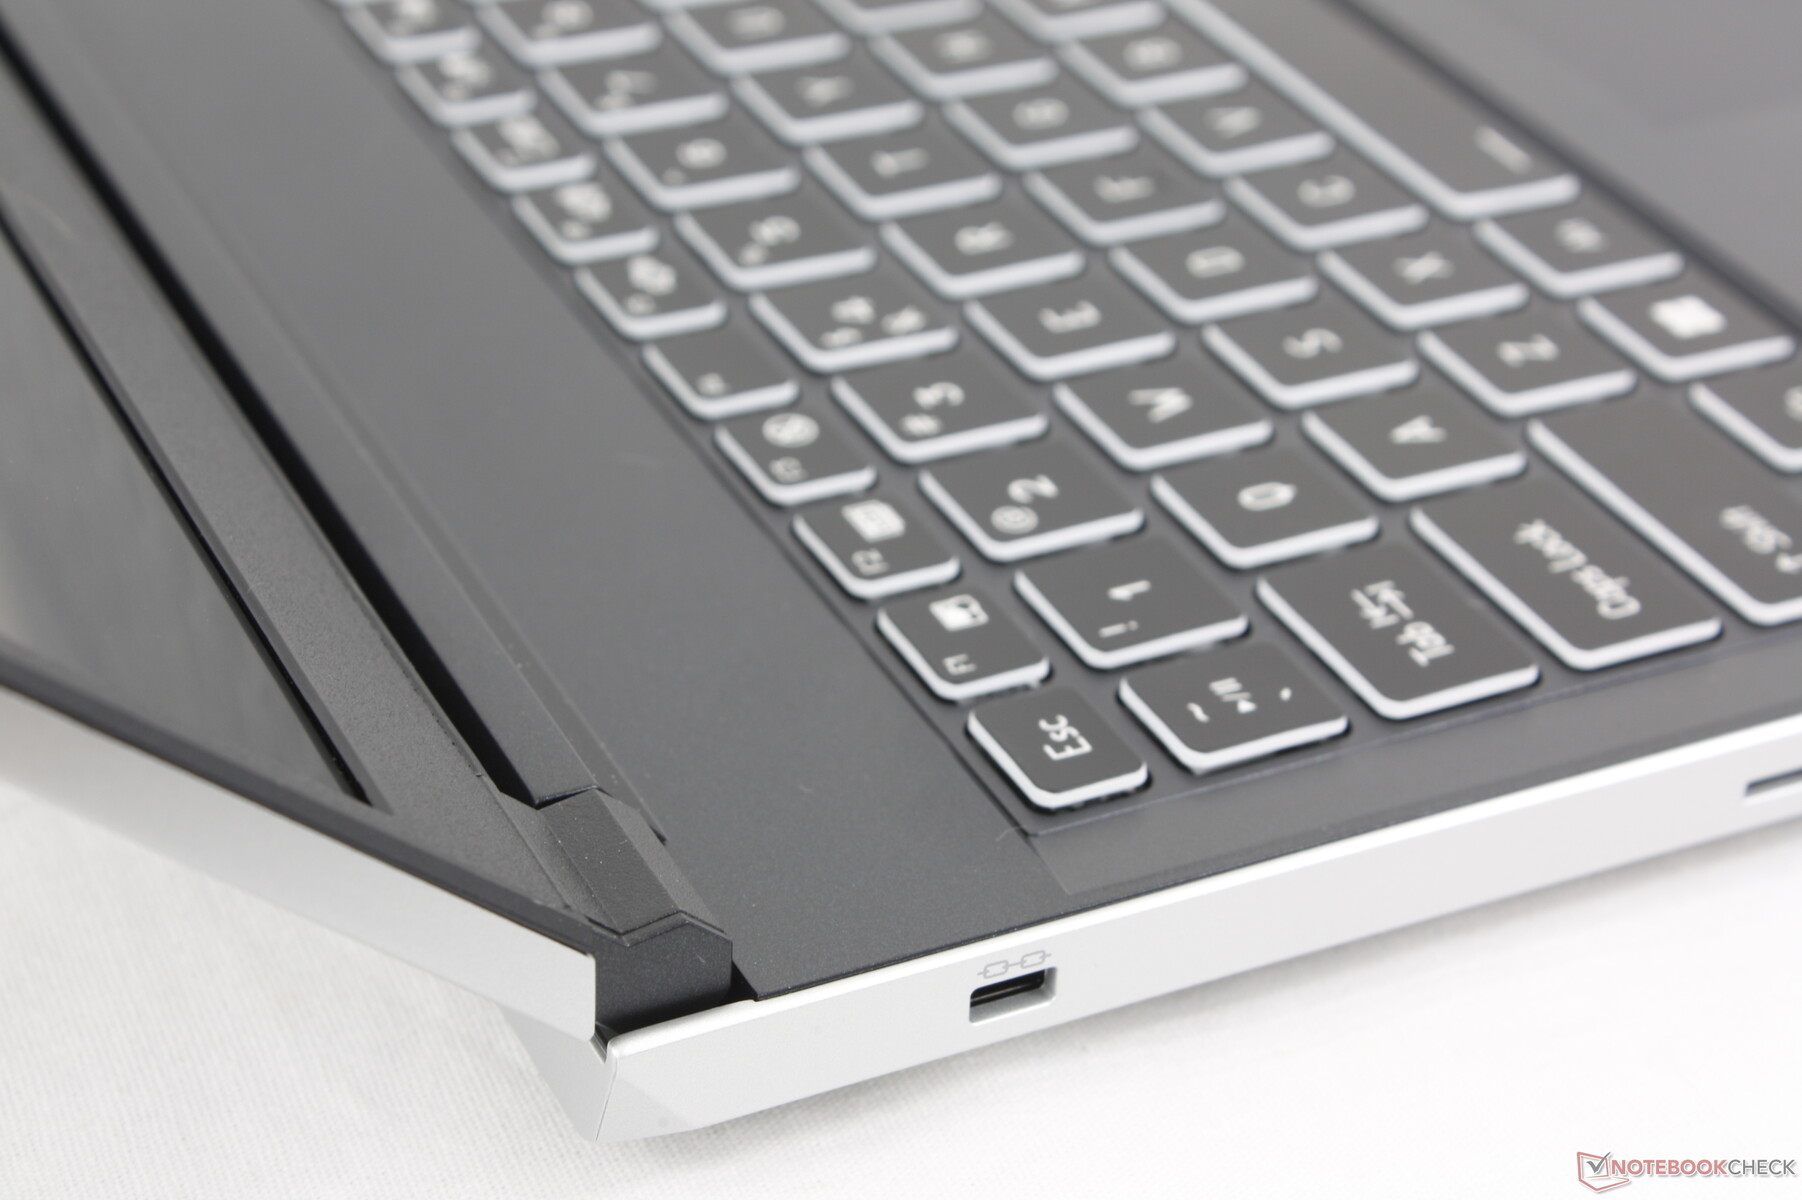
Şasi, menşe üreticisine göre Clevo'ya (V560TNE-S) kadar izlenebilir. Çoğunlukla dış kapak ve alt kısım için alüminyum metalden oluşurken, siyah klavye güvertesi plastiktir. İki zıt renk, modeli normal tamamen siyah veya mat beyaz oyun dizüstü bilgisayarından görsel olarak ayırt etmeye yardımcı olmak için birlikte iyi çalışır.
Ancak şasi kalitesi yüksek fiyatı yansıtmıyor. Yüzeyler daha kolay bükülüyor ve rakipleri kadar sert hissettirmiyor Razer Blade 16 veya Alienware x16 R2. Örneğin, klavyenin ortasına veya dış kapağına parmağınızla bastırdığınızda yüzeyler belirgin bir şekilde bastırılır. Açıları ayarlarken de kapak daha kolay sallanıyor. ML-16 MK2'yi tutarken daha dikkatli olmanız gerekecek, aksi takdirde küçük menteşelere zarar verme riskiniz olabilir.
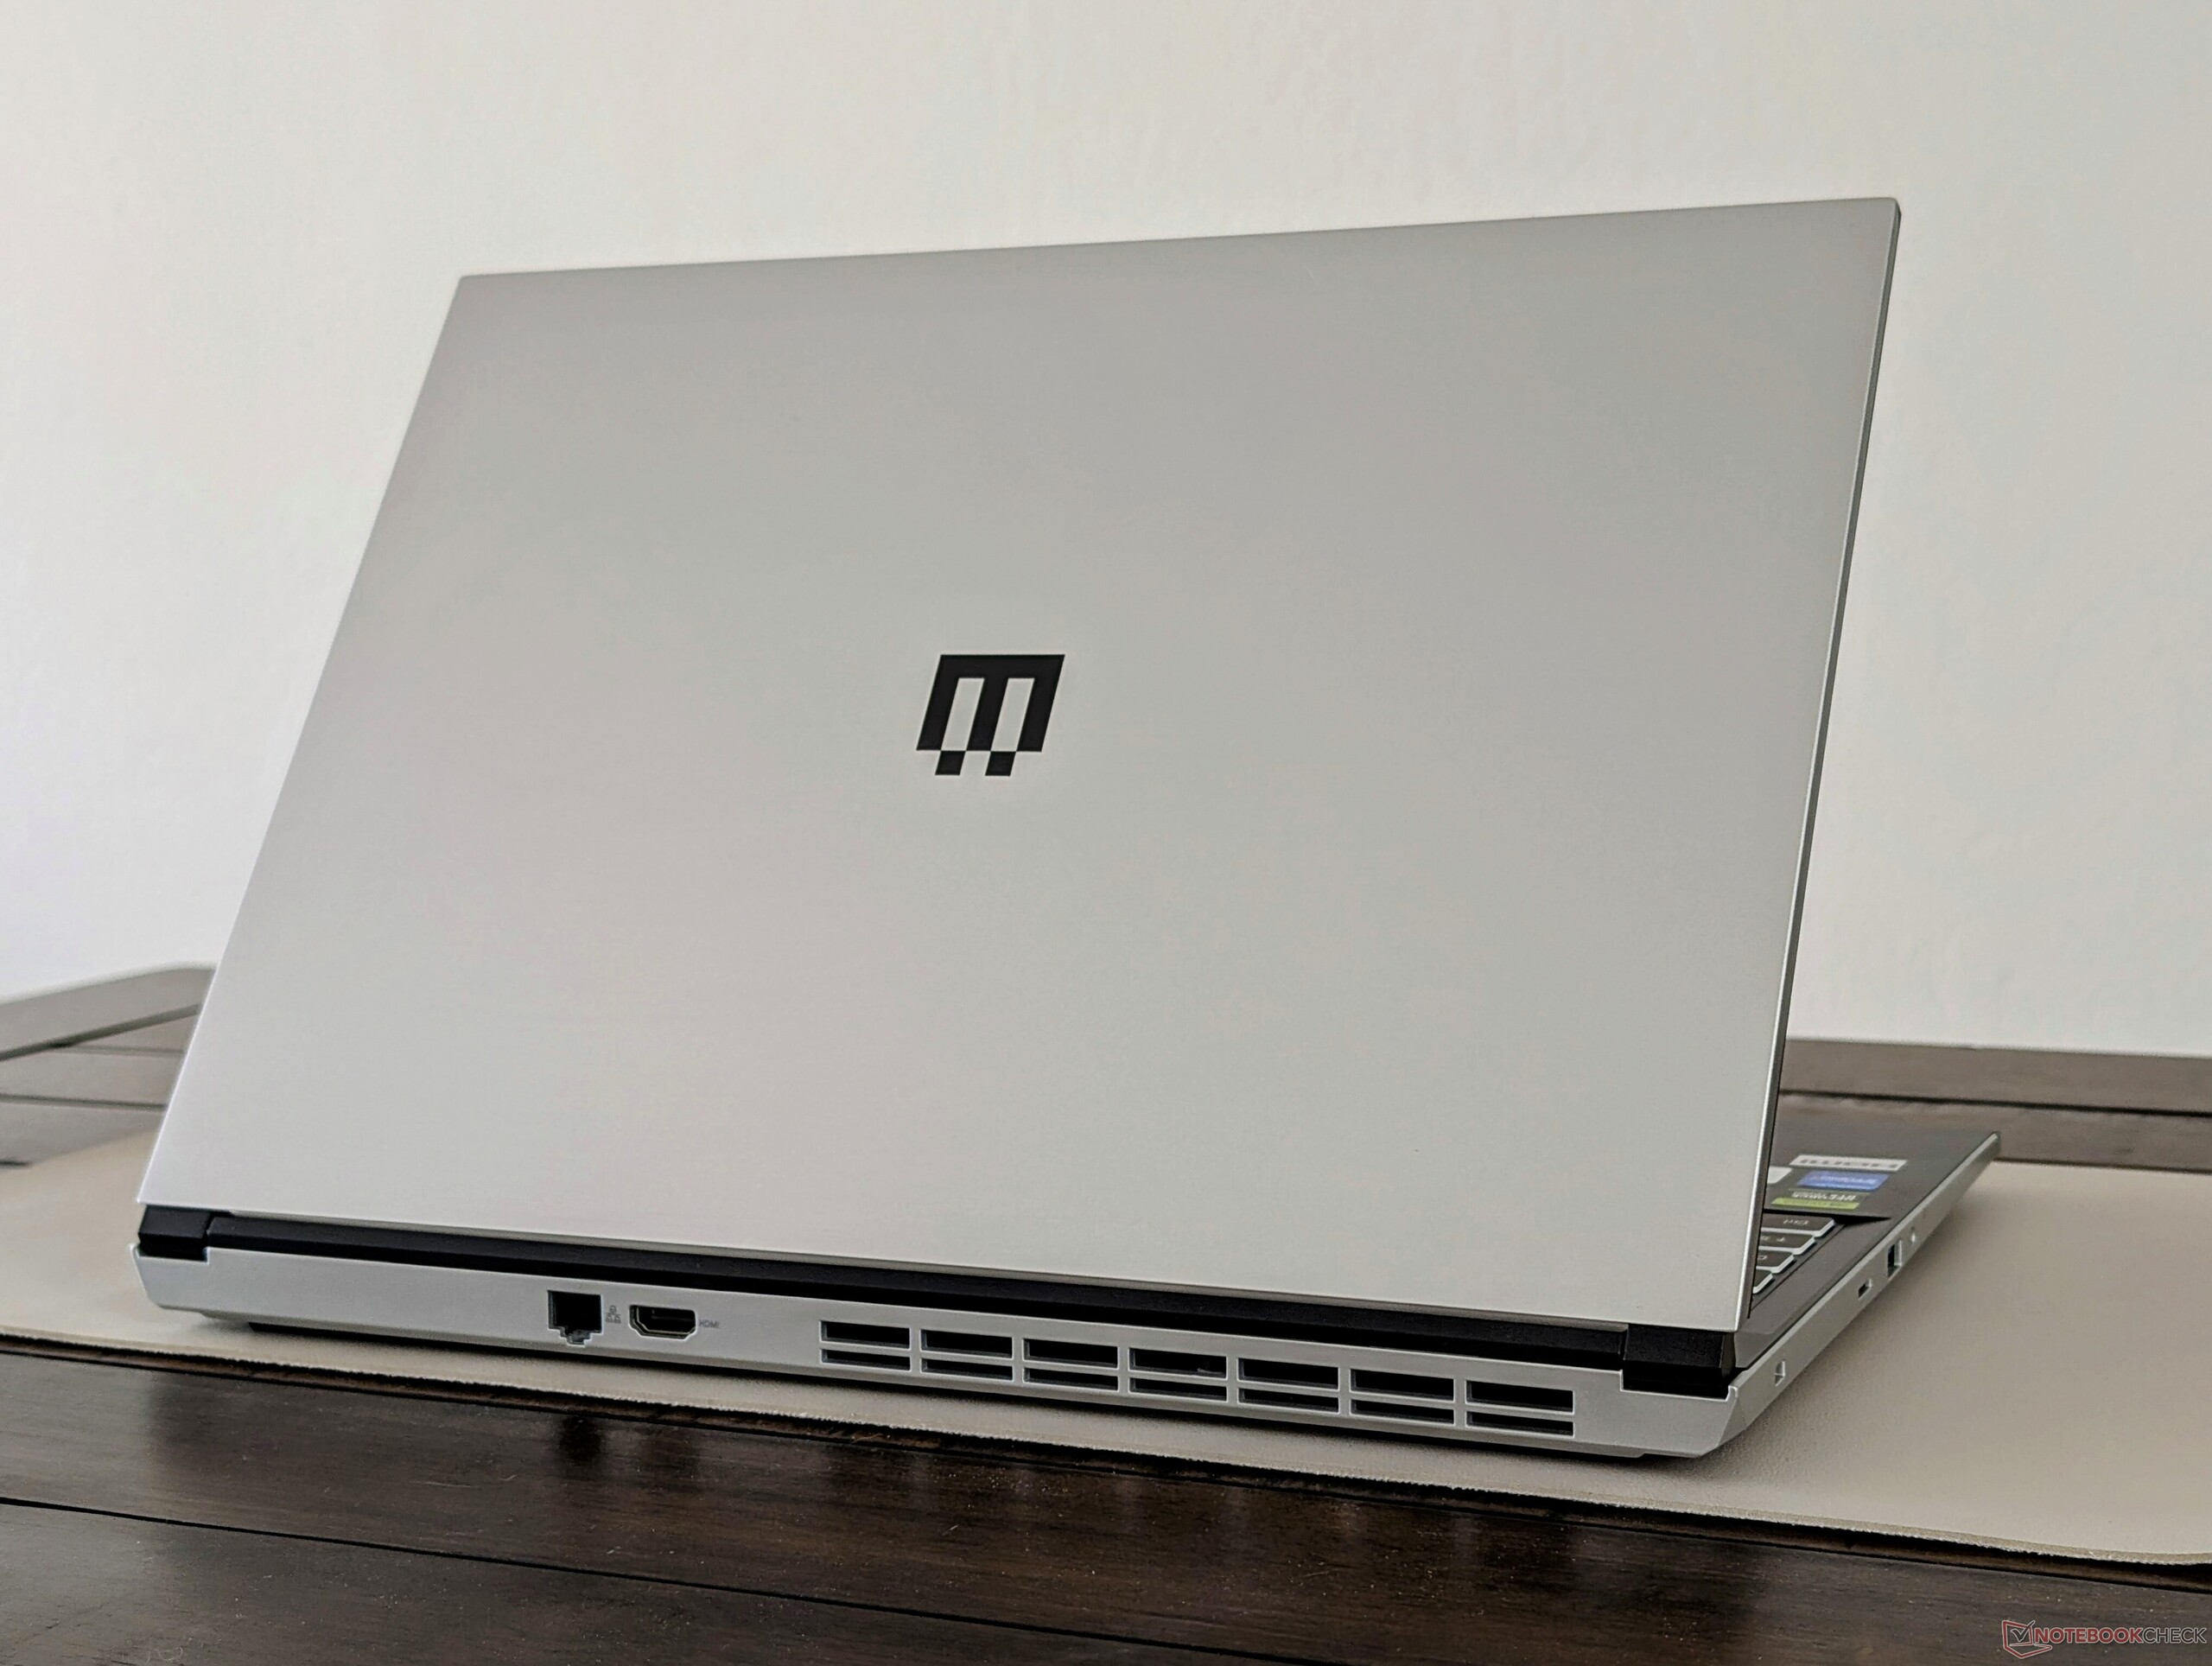
Ağırlık ve kalınlık, Blade 16 veya Blade 16 gibi büyük rakiplerden daha hafif ve daha incedir Lenovo Legion Pro 5 16IRX9. Asus ROG Zephyrus G16, Maingear'ımızdan daha ince ve daha hafiftir, ancak aynı zamanda yüzlerce dolar daha pahalıya satılmaktadır.
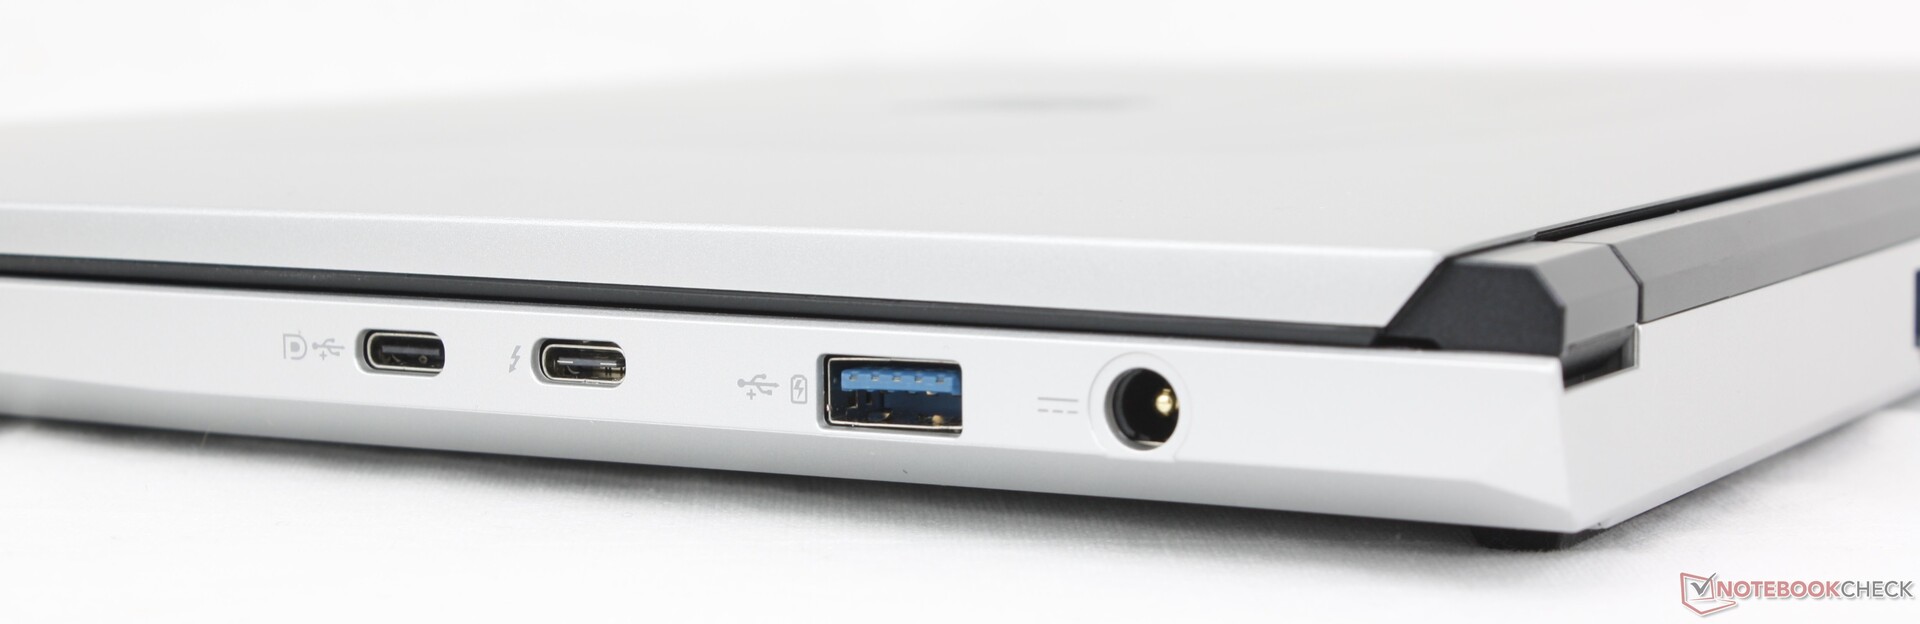
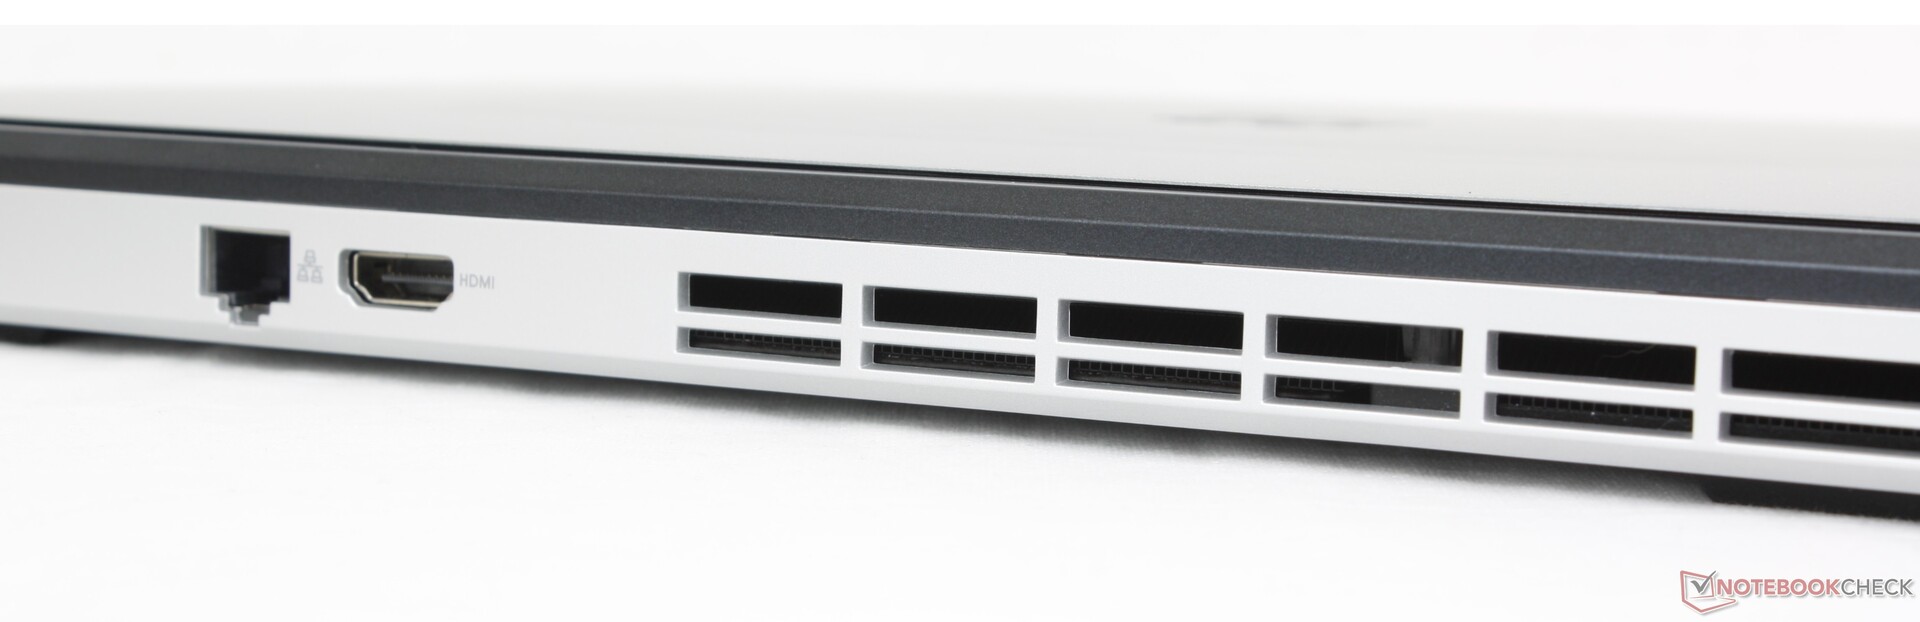
Bağlanabilirlik
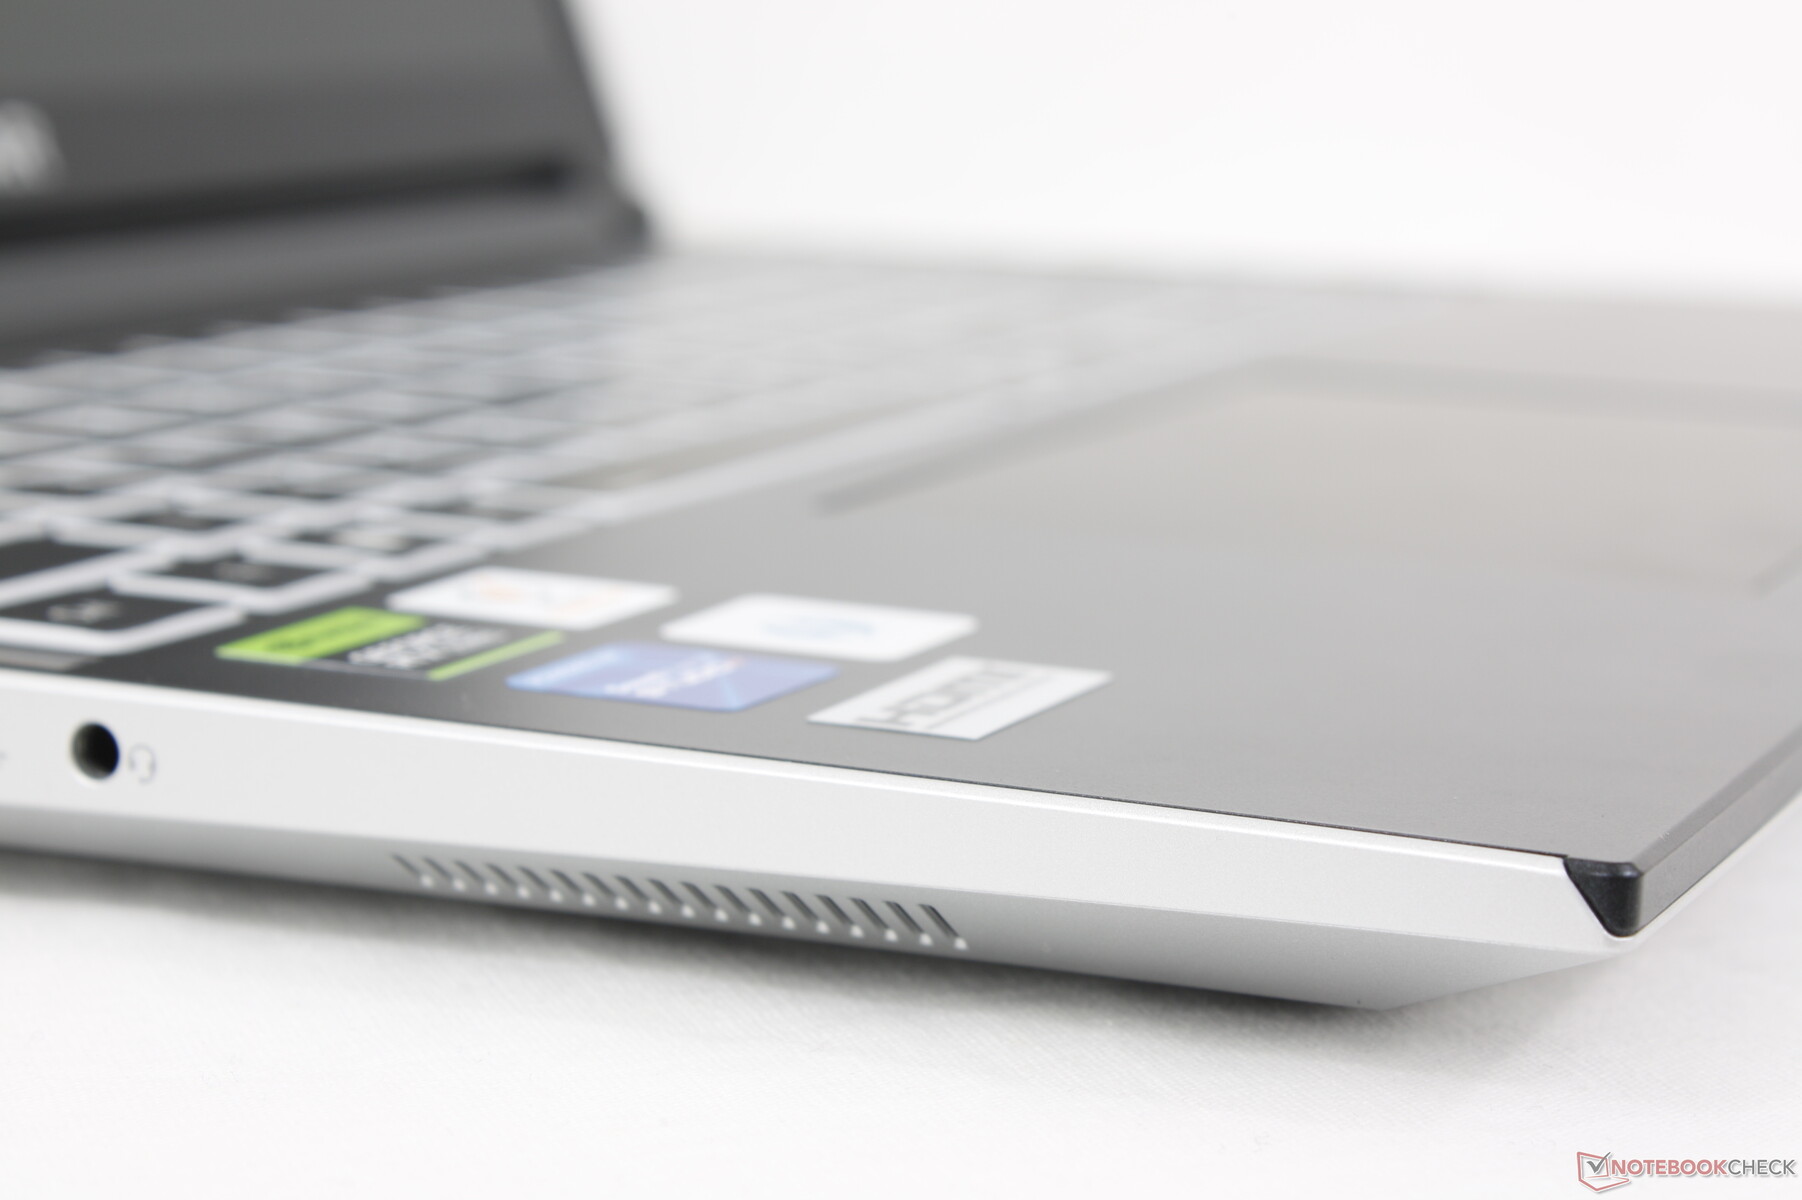
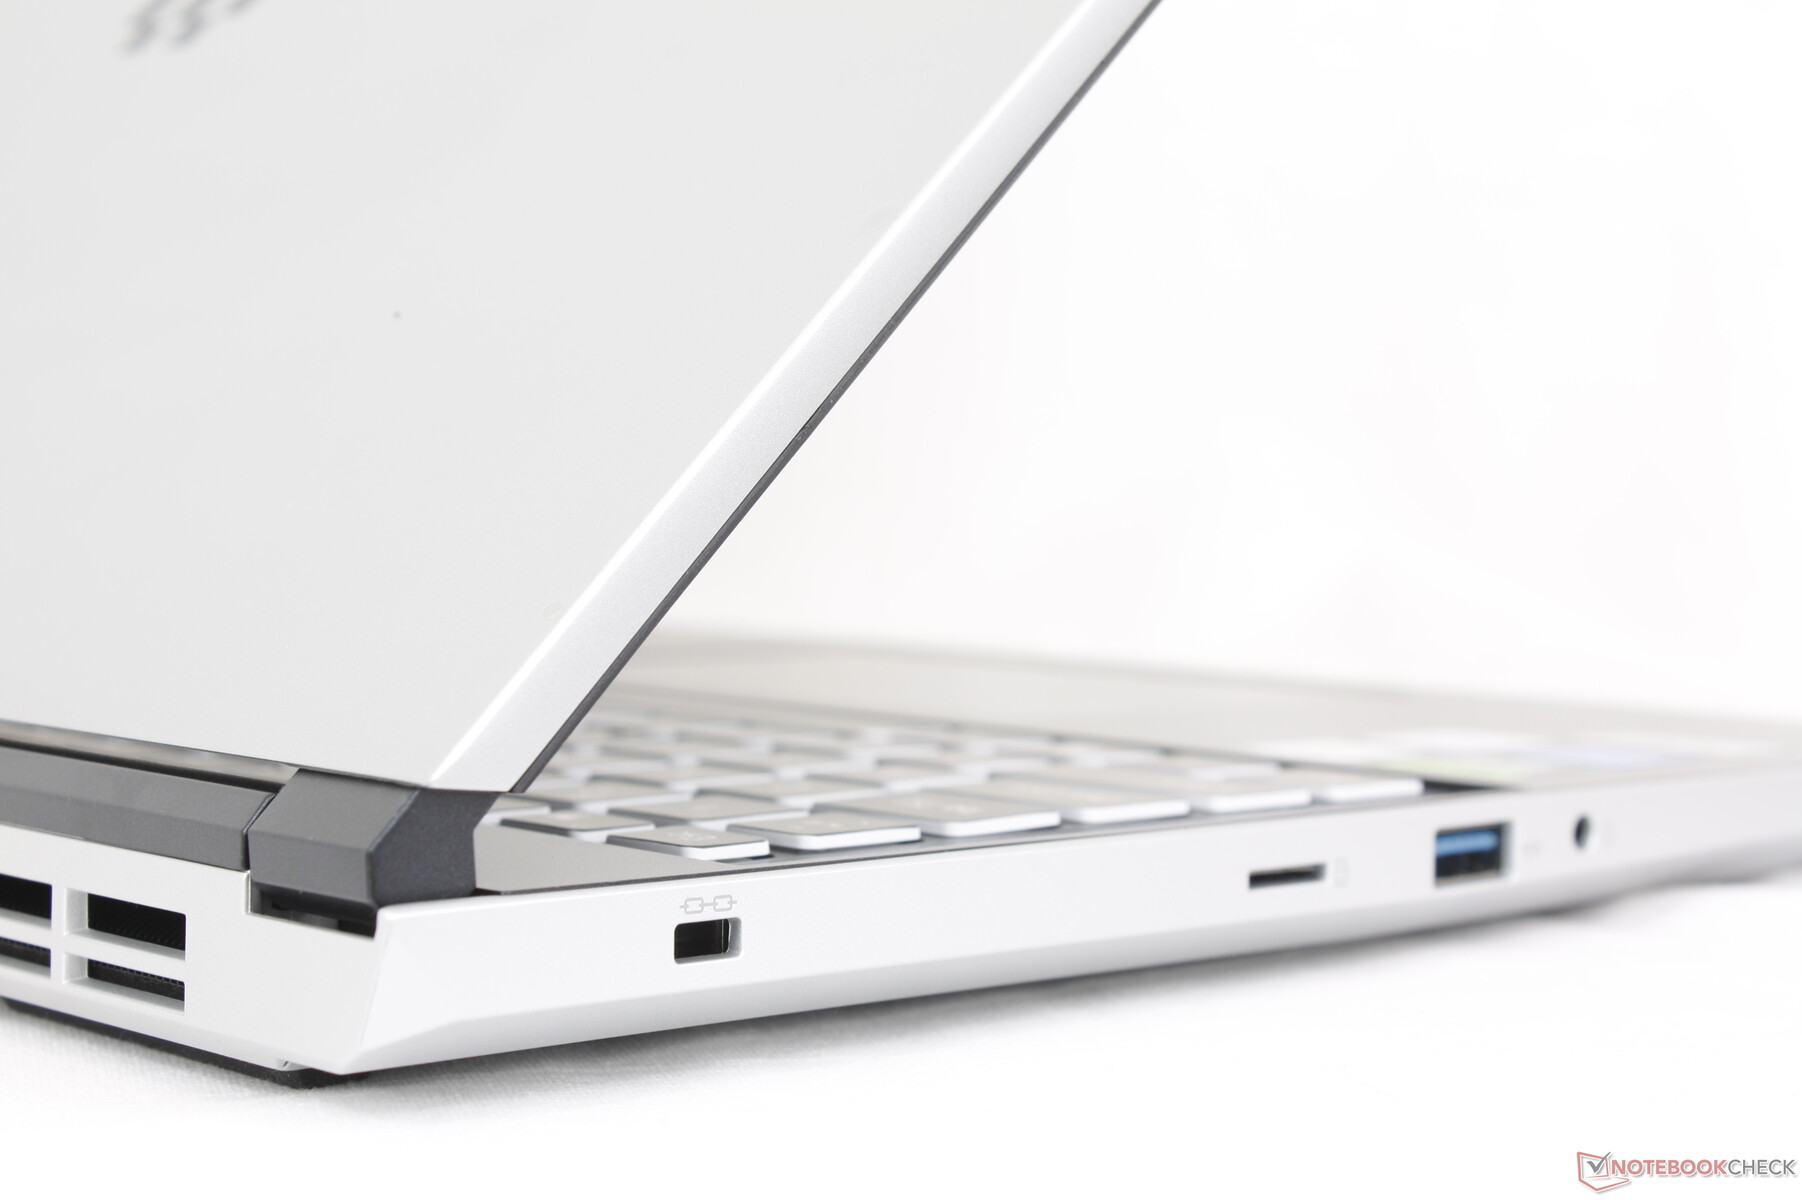
Birkaç eksik olmasına rağmen bağlantı noktaları bol miktarda bulunmaktadır. Örneğin Blade 16 daha fazla USB-A portu içerirken Alienware x16 R2 bir mini-DisplayPort içeriyor. Port konumlandırması iyi ve yukarıda bahsedilen Alienware sisteminin aksine çok kalabalık değil.
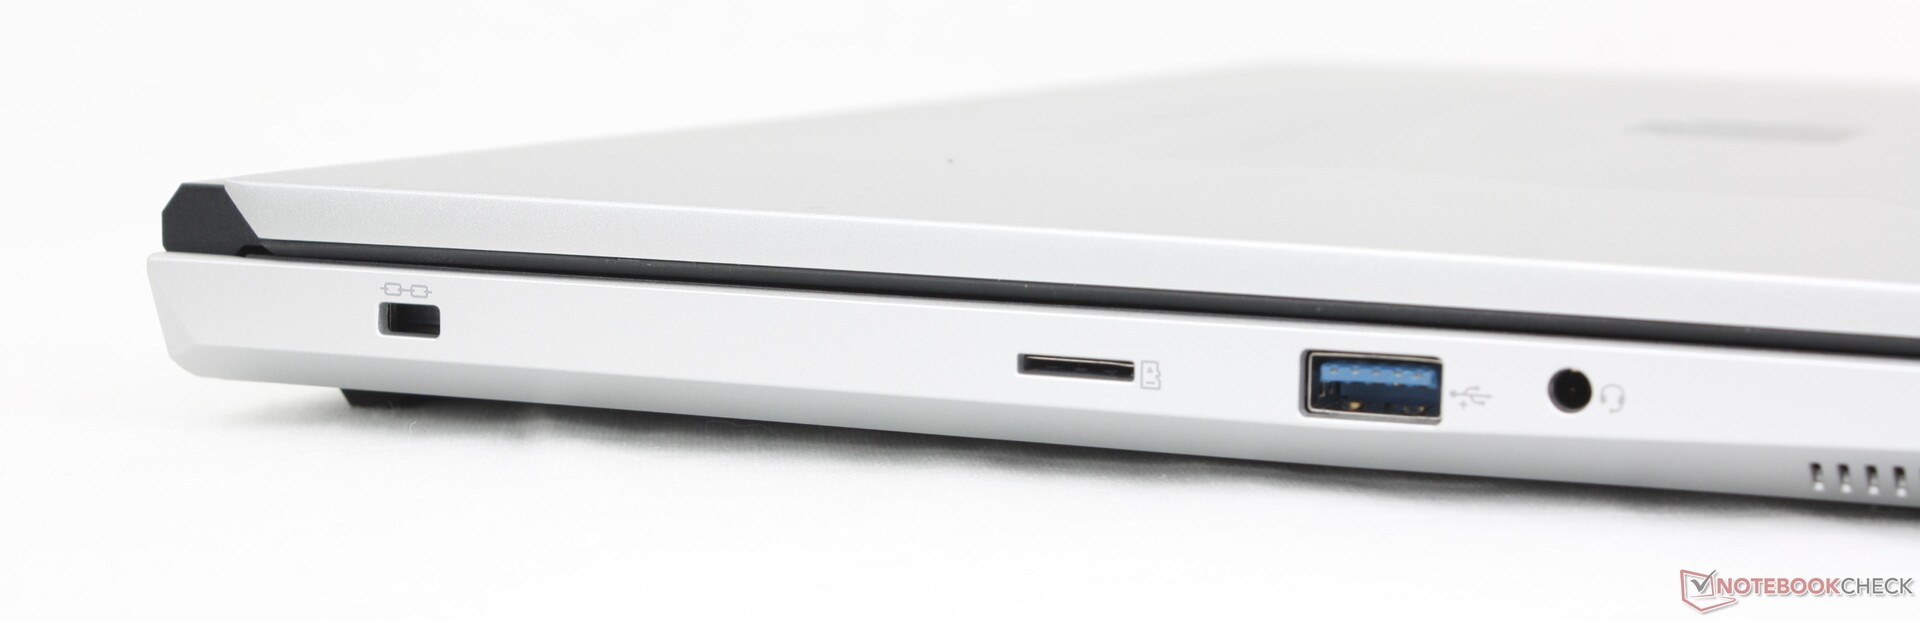
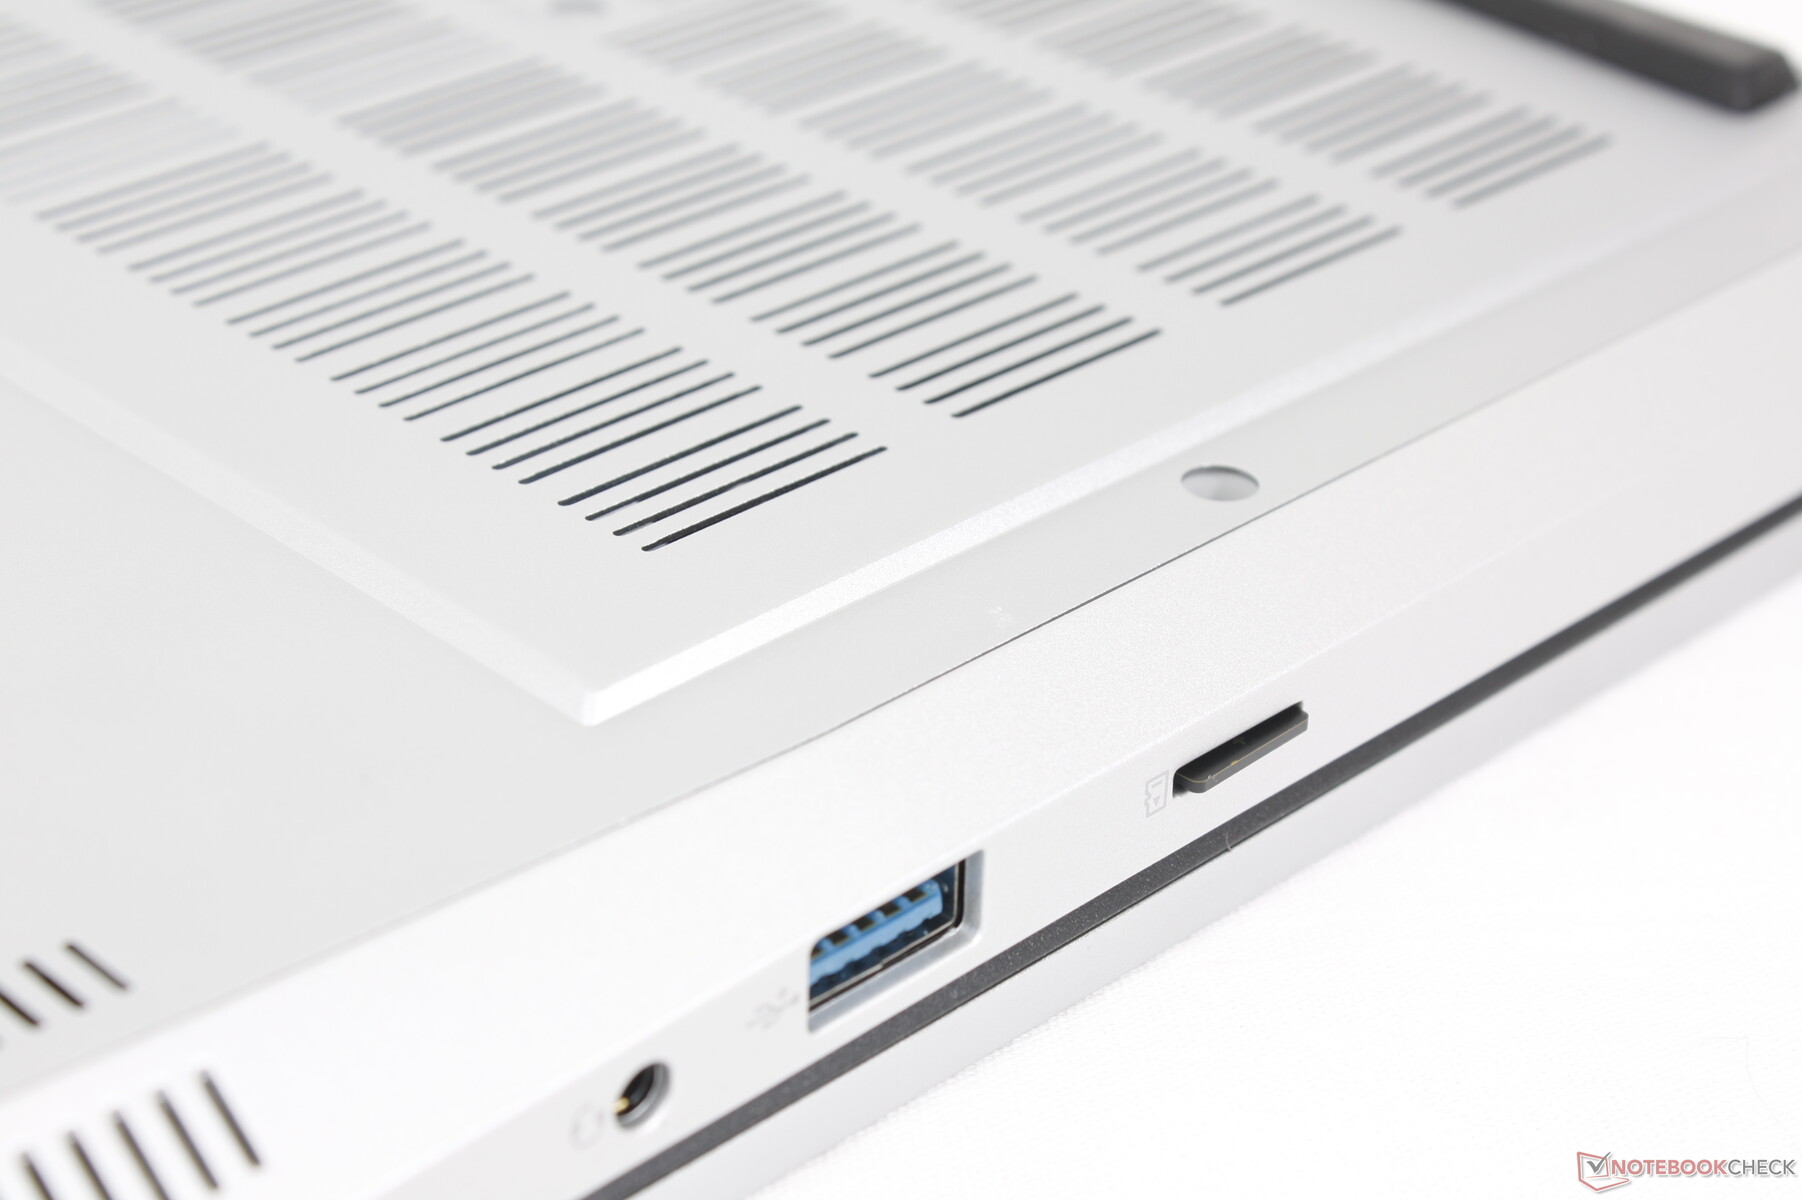
SD Kart Okuyucu
Hiç SD okuyucu olmaması yerine küçük bir MicroSD okuyucu olmasını takdir etsek de, buradaki okuyucu özellikle 16 inçlik bir oyun dizüstü bilgisayarı için yavaş. UHS-II test kartımızdan 1 GB fotoğraf aktarmak, dizüstü bilgisayardaki 6 saniyeye kıyasla yaklaşık 25 saniye sürüyor Bıçak 16.
| SD Card Reader | |
| average JPG Copy Test (av. of 3 runs) | |
| Razer Blade 16 2024, RTX 4090 | |
| Alienware x16 R2 P120F (AV PRO microSD 128 GB V60) | |
| Maingear ML-16 MK2 (AV PRO microSD 128 GB V60) | |
| maximum AS SSD Seq Read Test (1GB) | |
| Alienware x16 R2 P120F (AV PRO microSD 128 GB V60) | |
| Razer Blade 16 2024, RTX 4090 | |
| Maingear ML-16 MK2 (AV PRO microSD 128 GB V60) | |
İletişim
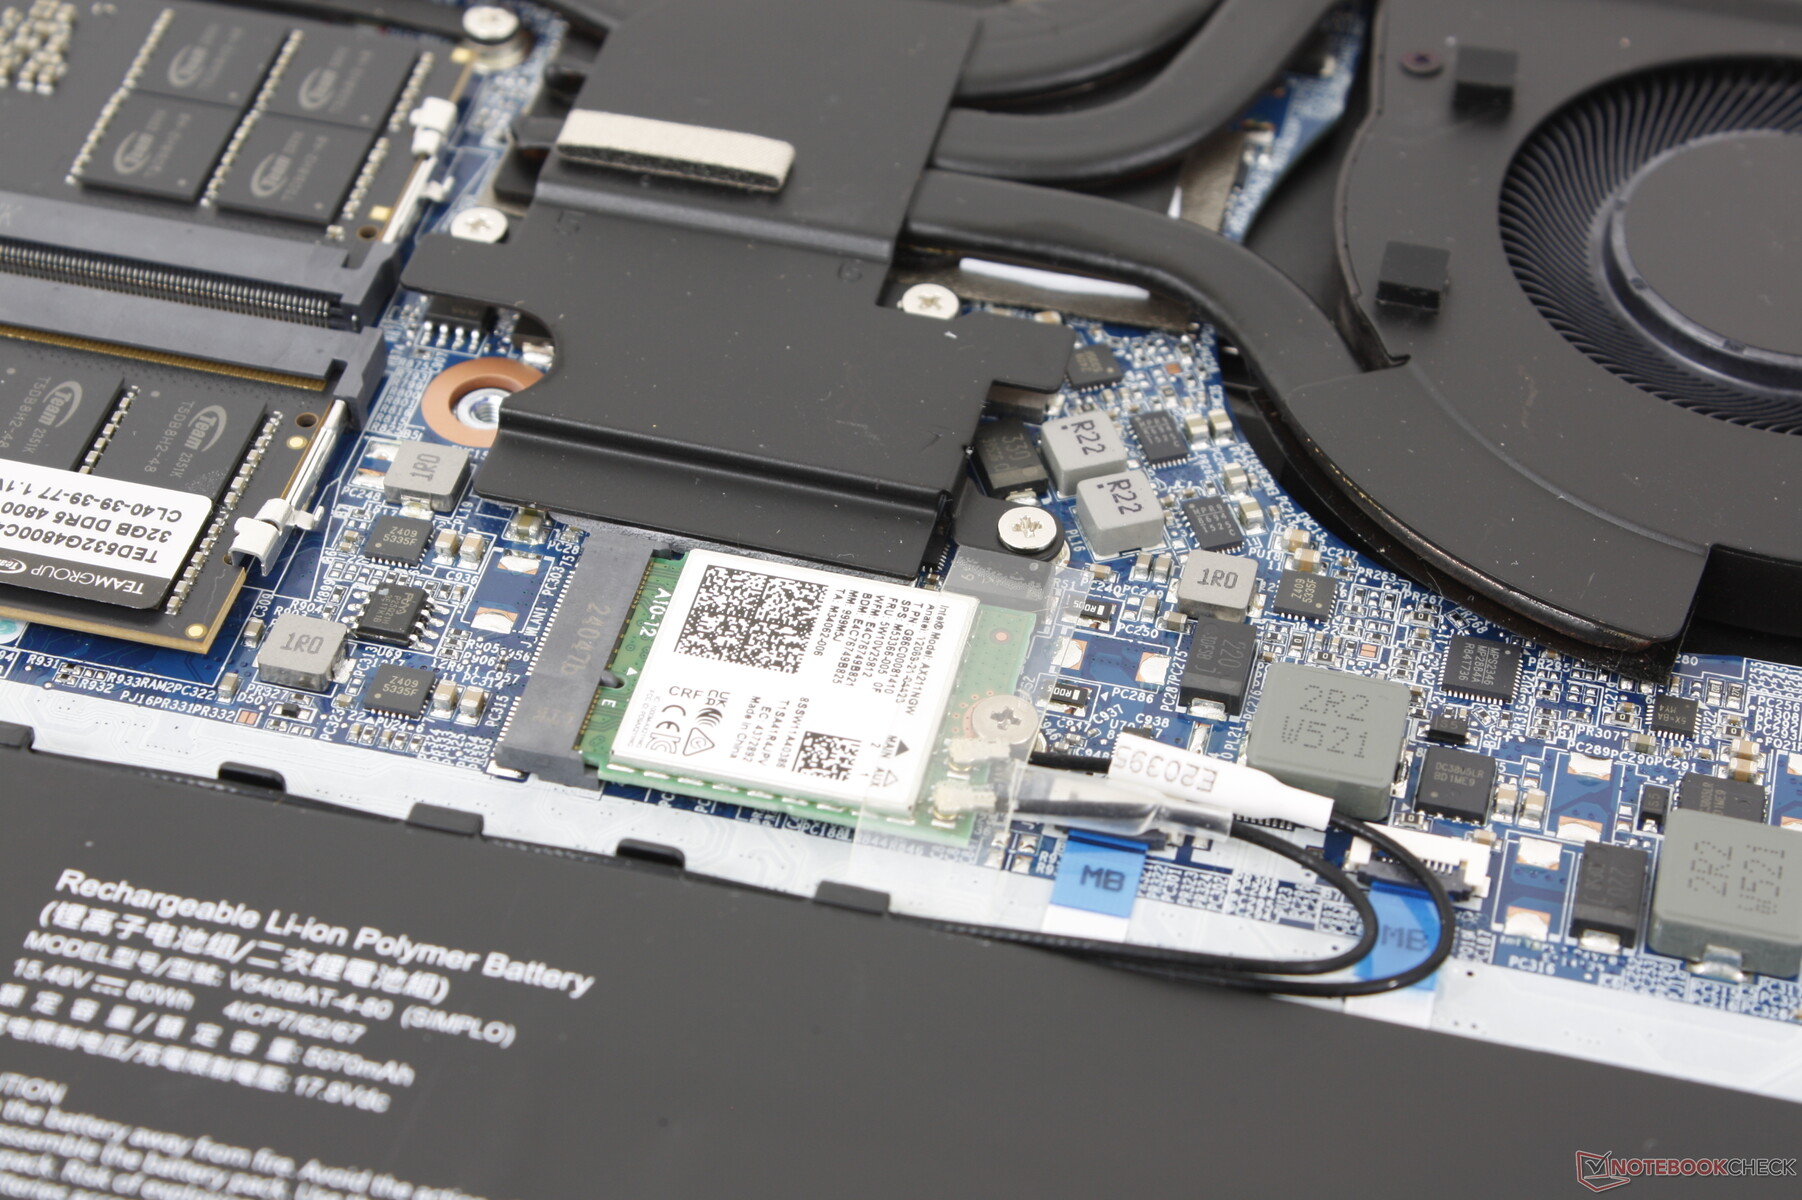
Intel AX211, Wi-Fi 6E ve Bluetooth 5.3 bağlantısı için standart olarak gelir. AXE11000 test yönlendiricimizle eşleştirdiğimizde sabit aktarım hızları elde ettik ve hiçbir sorun yaşamadık.
Web kamerası
IR ve elektronik deklanşöre sahip 2 MP web kamerası, rakipleriyle karşılaştırılabilir olmak için standart olarak gelir.


Bakım
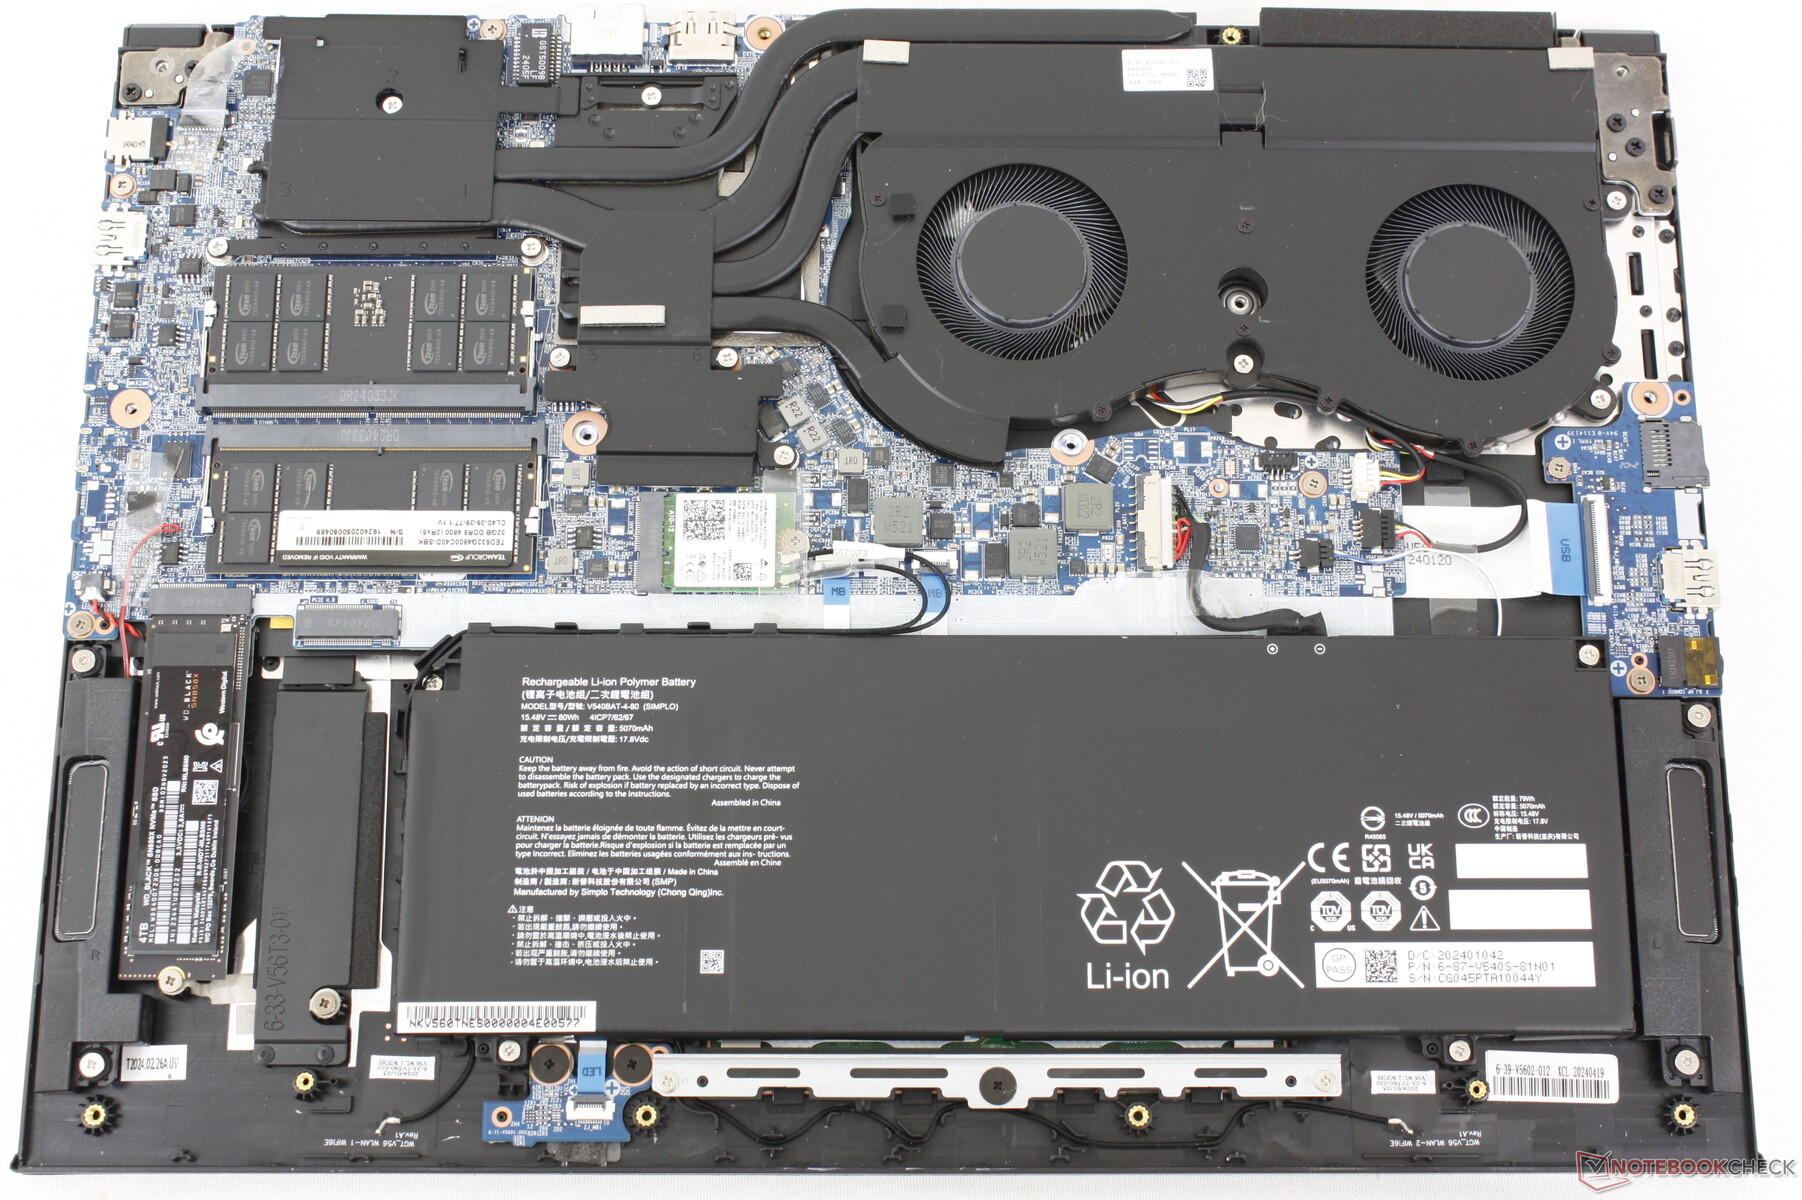
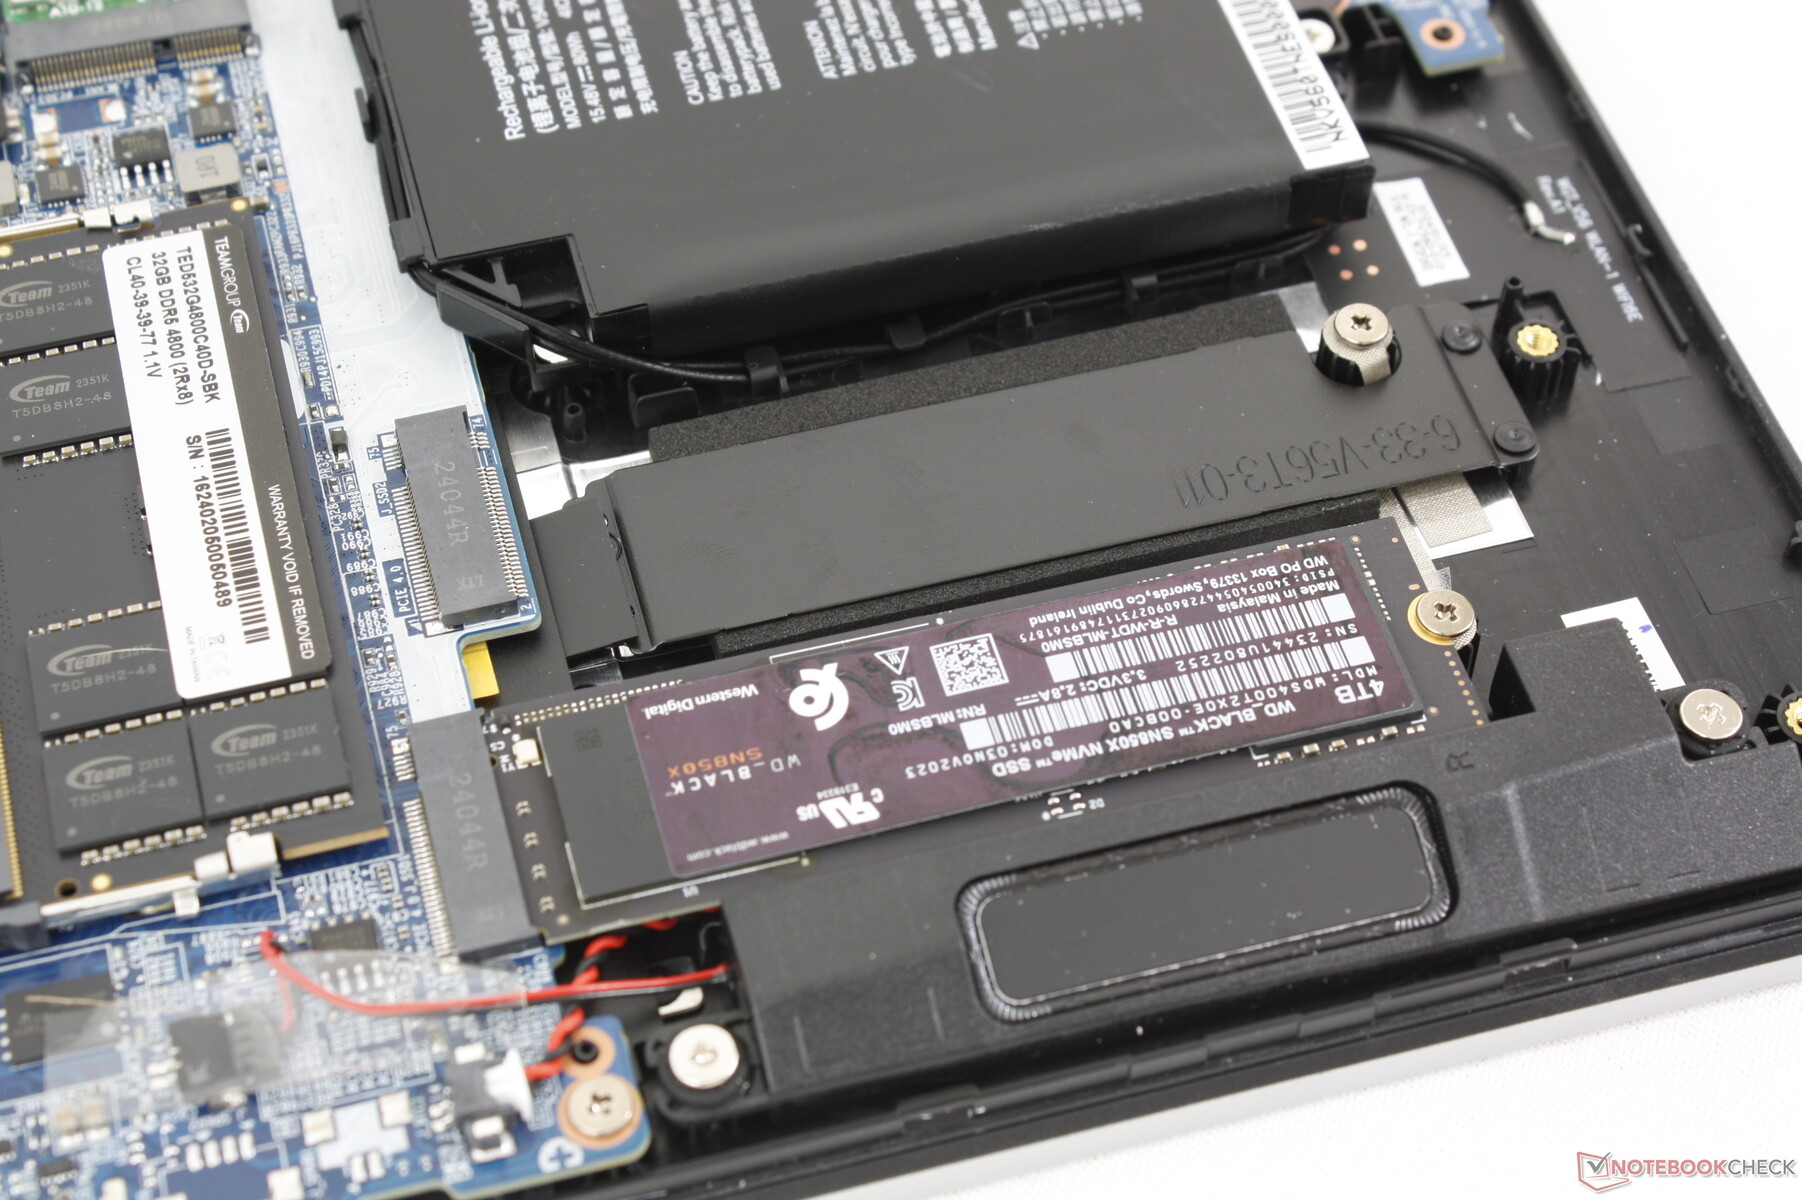
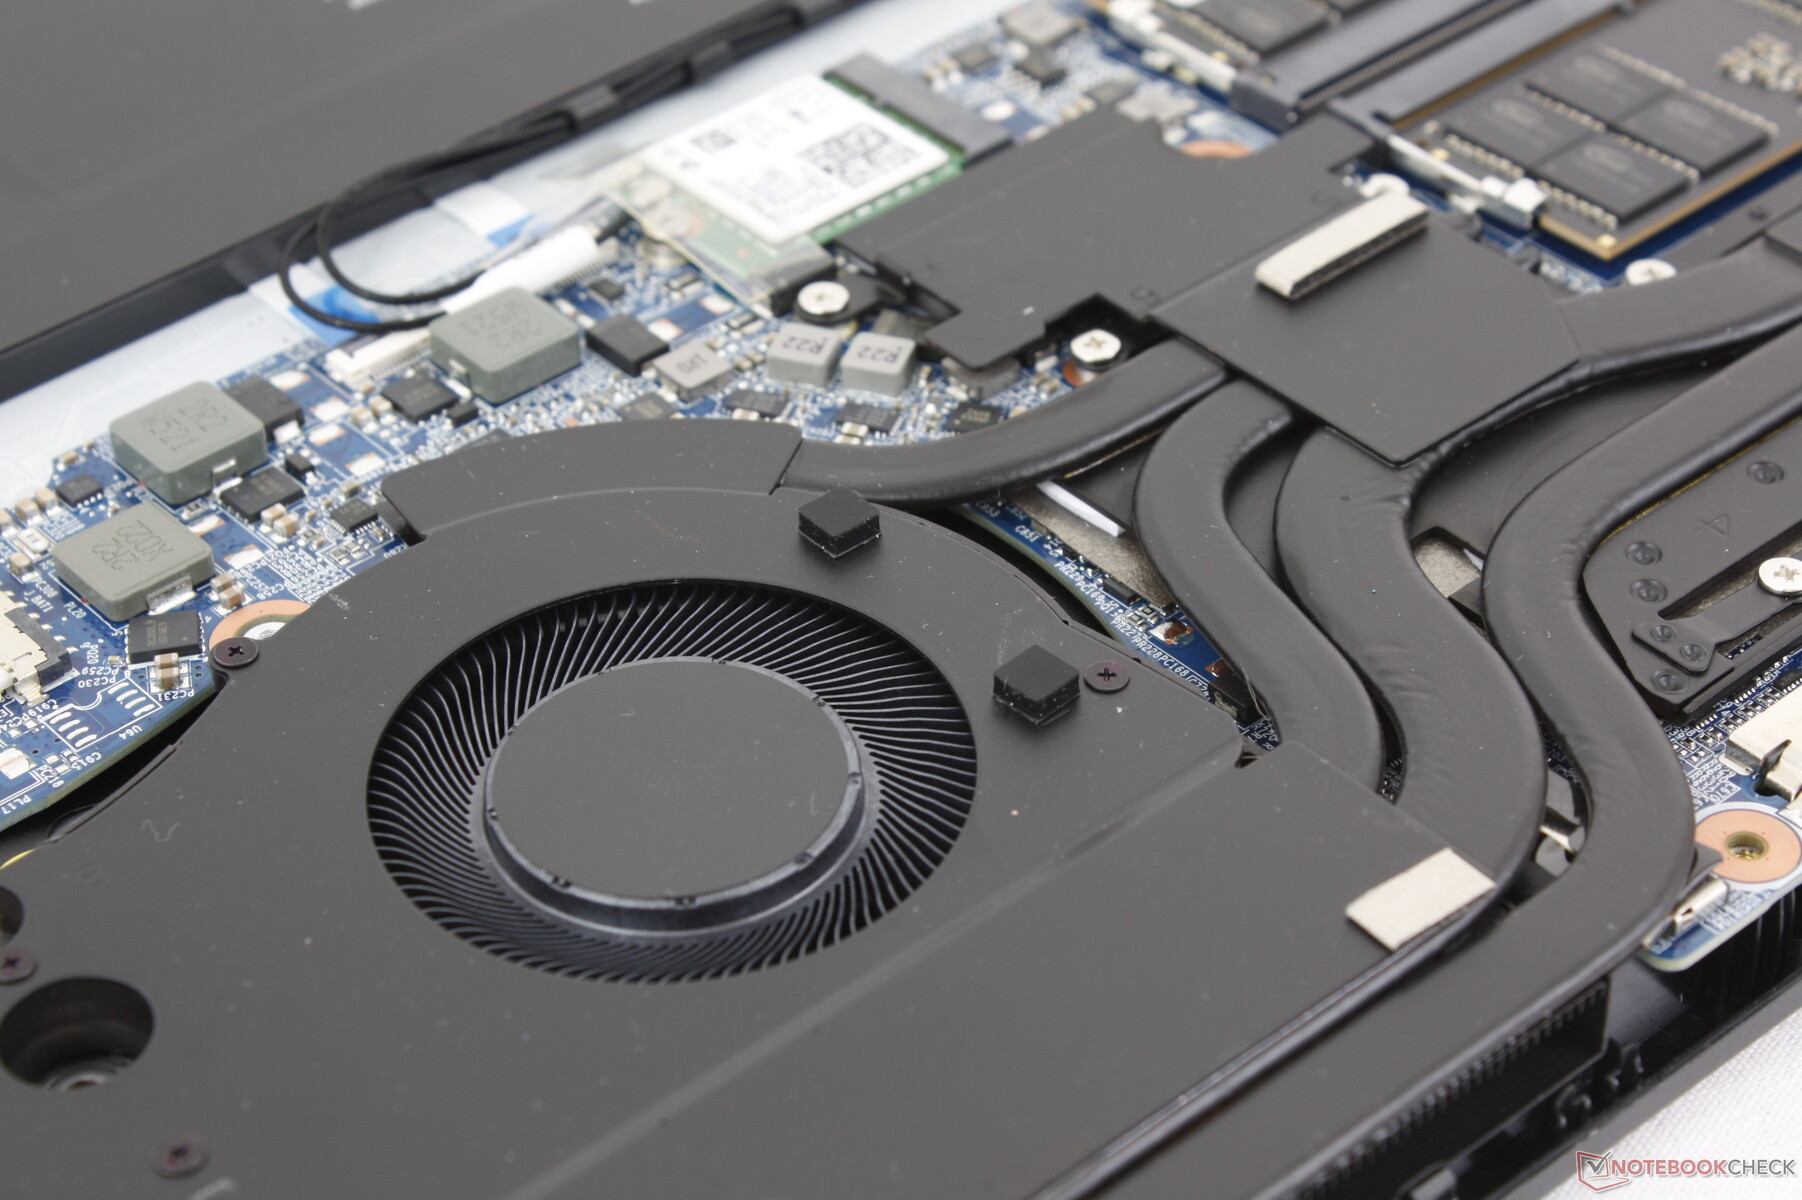
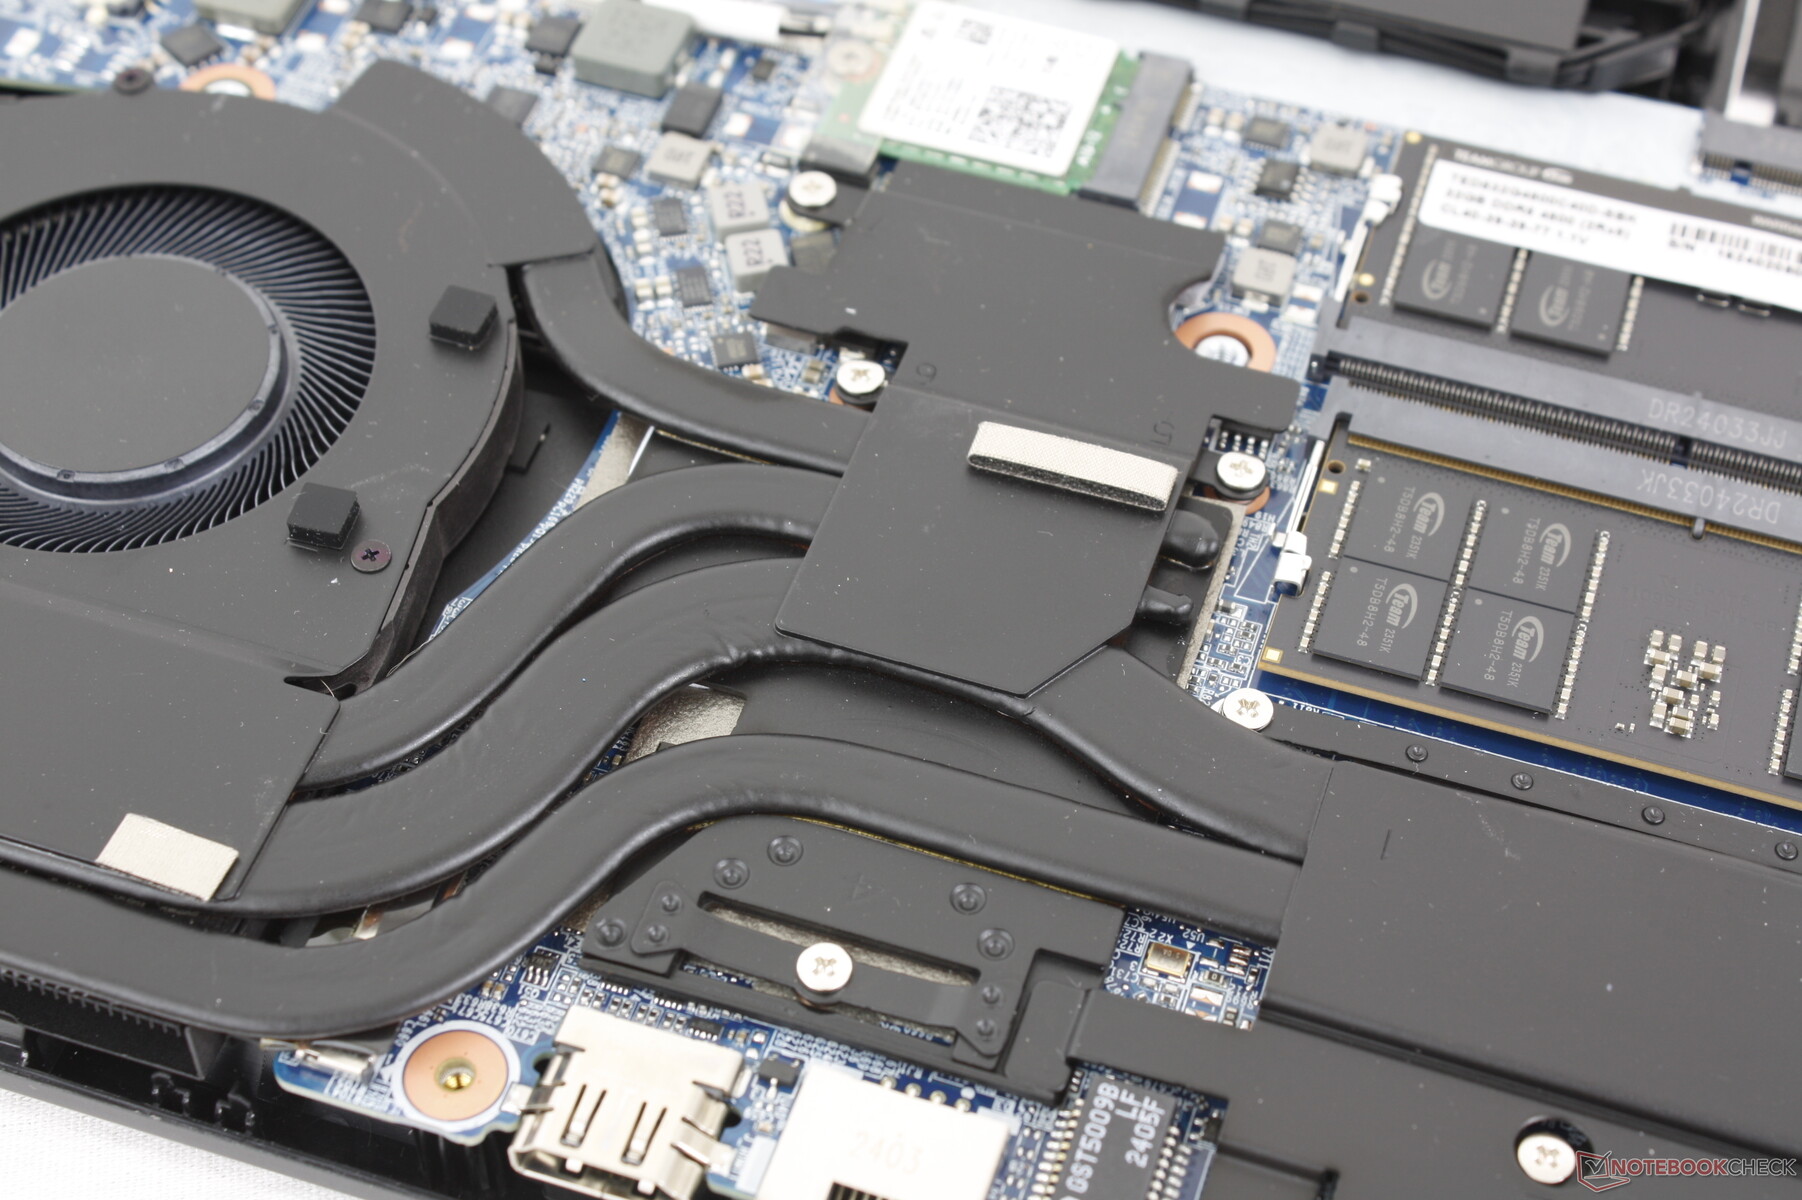
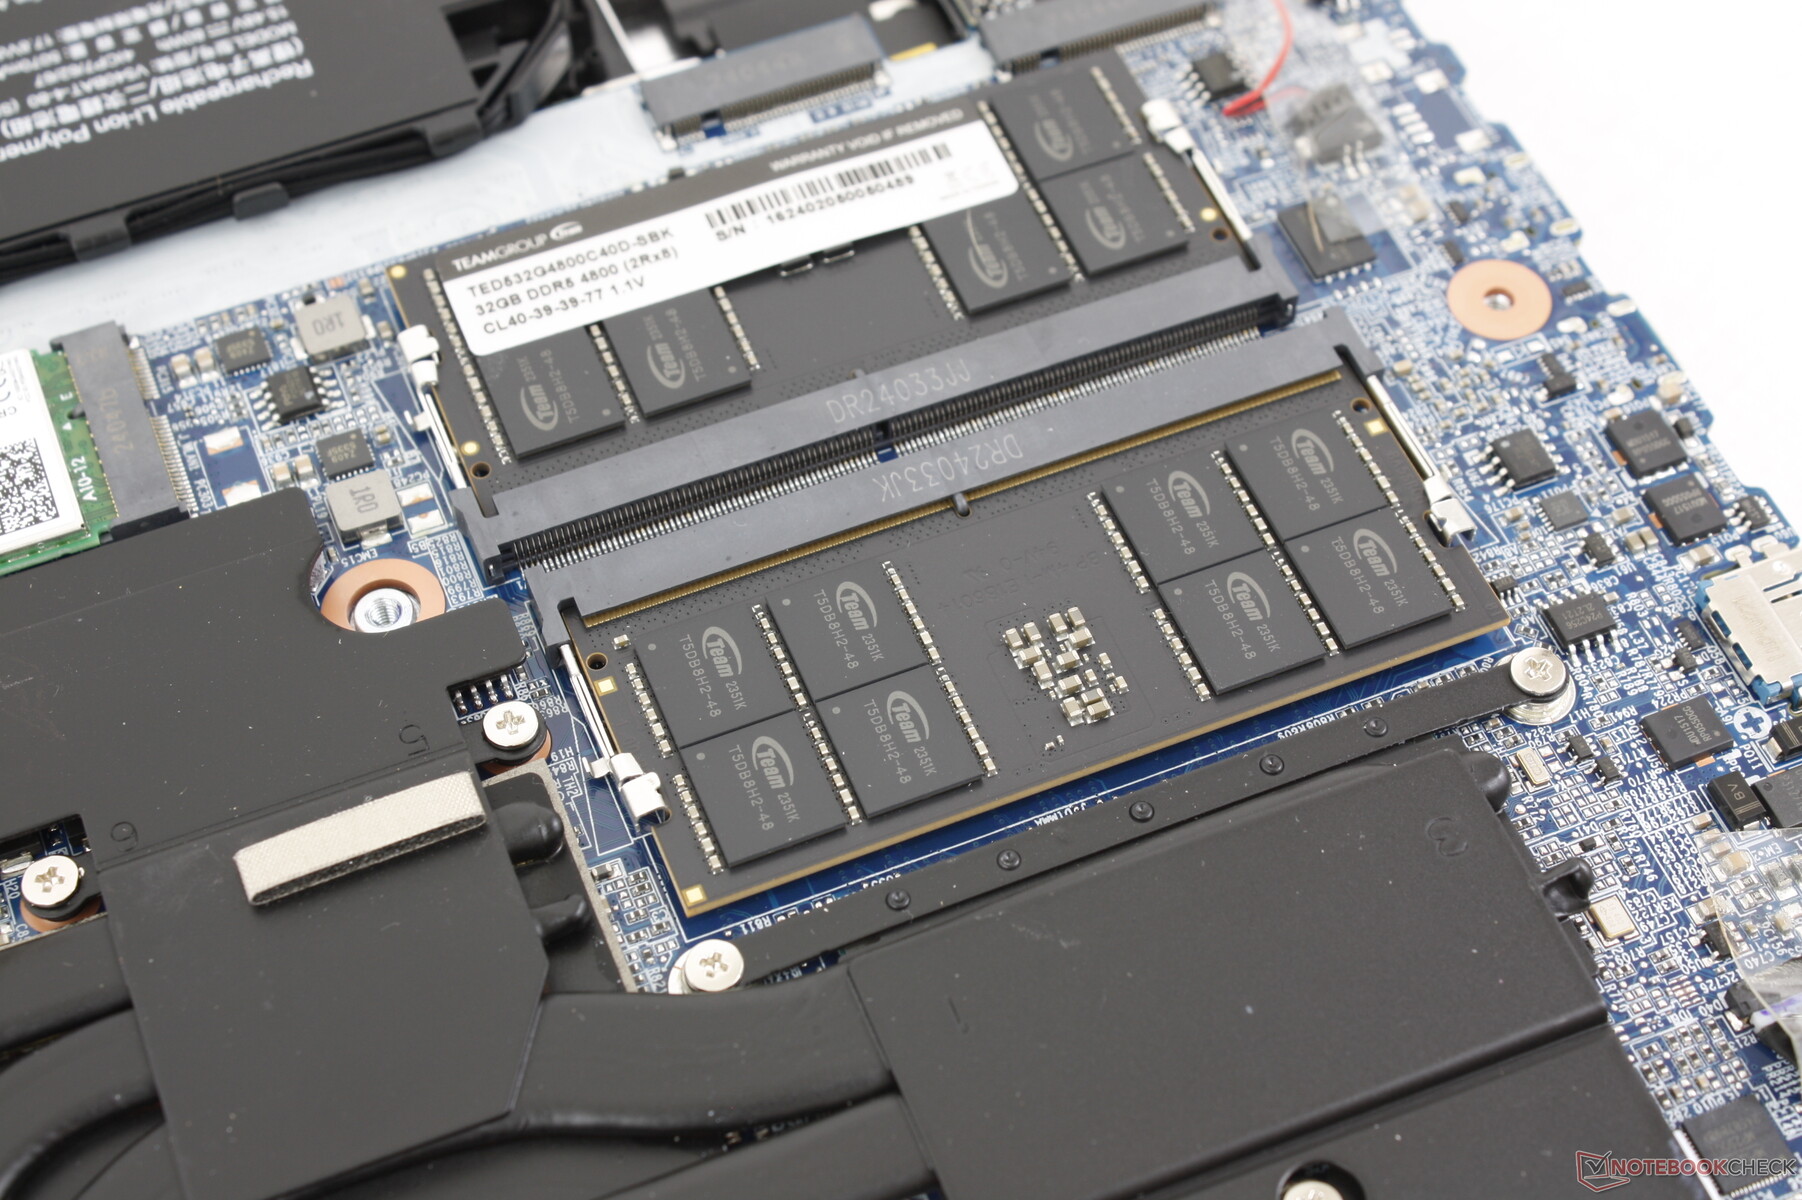
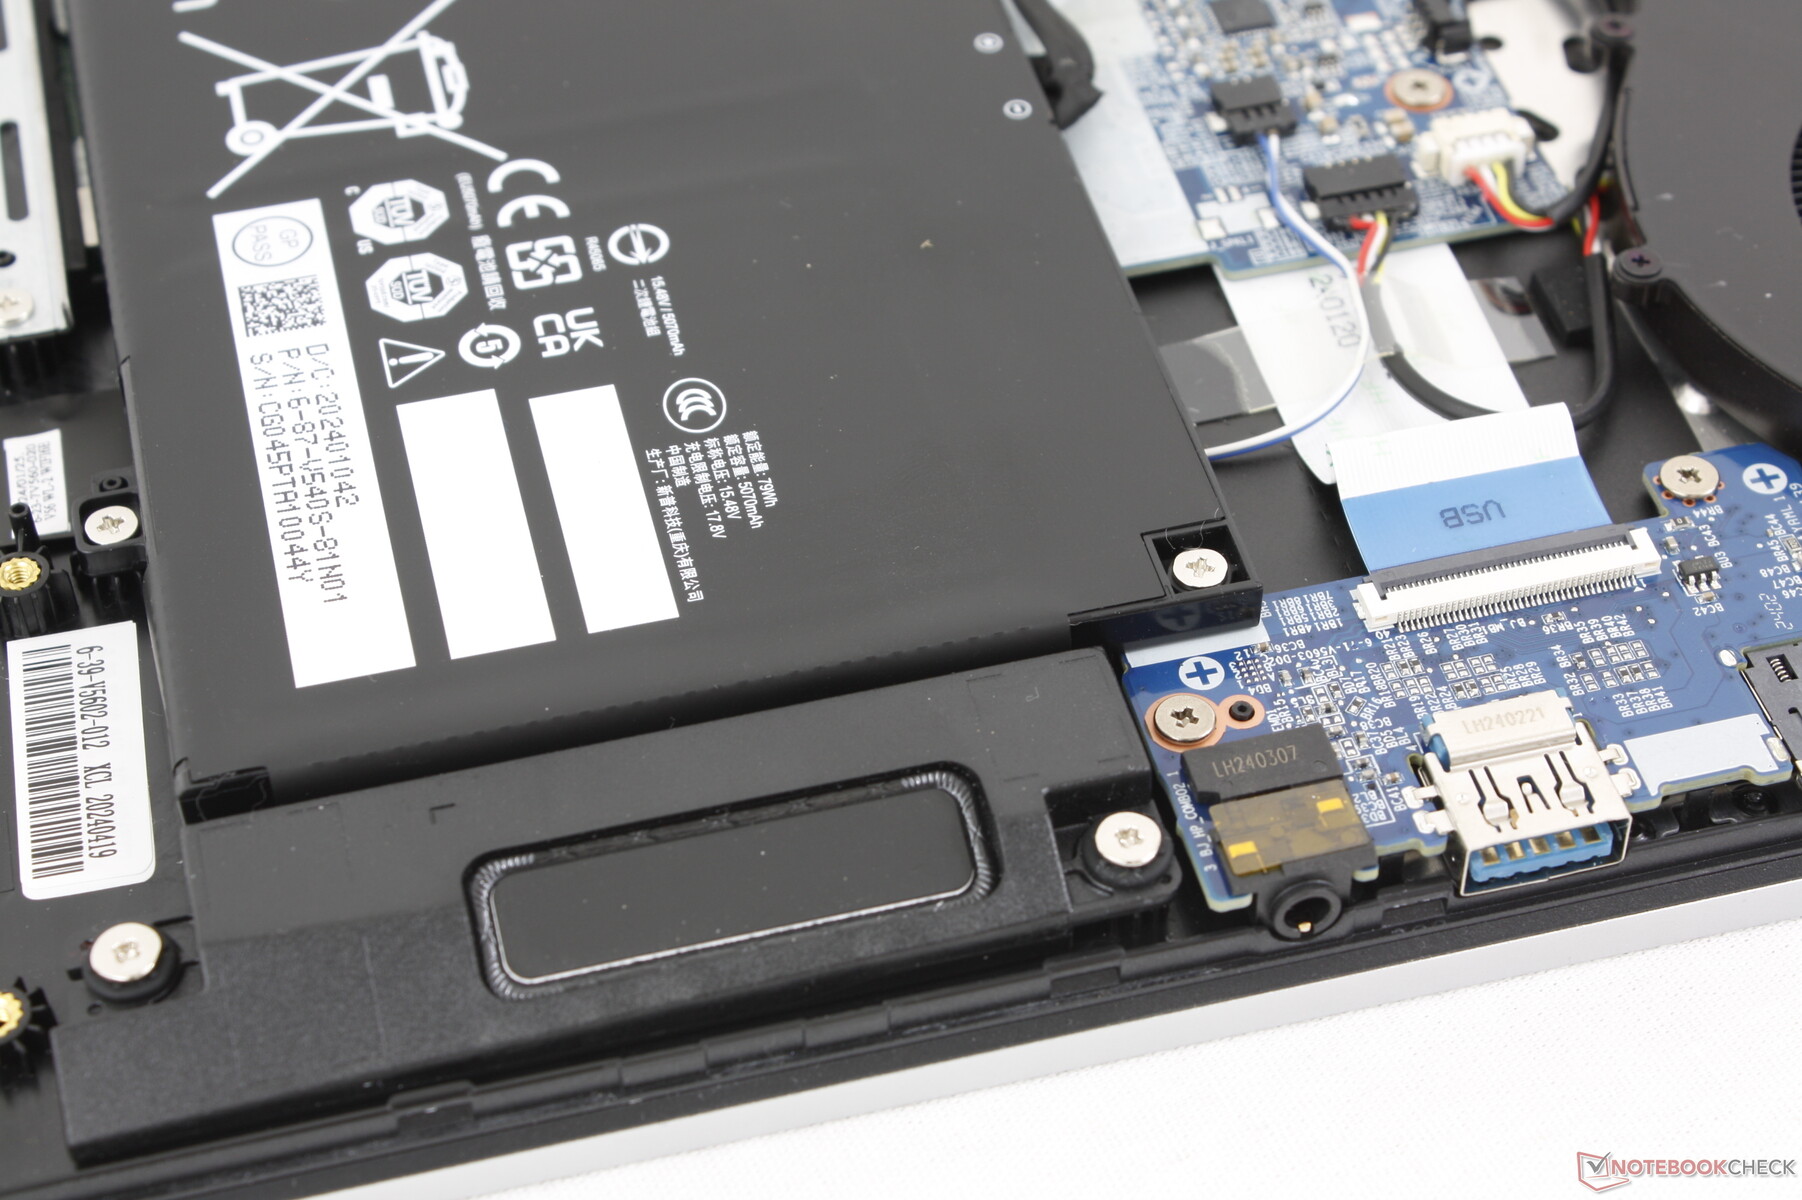
Alt panel 13 Phillips vida ile sabitlendiği için çıkarılması biraz sabır gerektiriyor. Aksi takdirde iki M.2 PCIe4 x4 2280 yuvasına, iki SODIMM yuvasına, bataryaya ve çıkarılabilir WLAN modülüne kolay erişim için fazla direnç göstermeden açılır. Bu seçenekler Razer Blade 16 ile karşılaştırılabilirken, Razer Blade 16'dan daha iyi Alienware x16 R2 kullanıcı tarafından yükseltilebilir RAM'e sahip değildir.
Sürdürülebilirlik
Maingear, dizüstü bilgisayarın üretiminde geri dönüştürülmüş malzeme kullanılmadığını belirtiyor.
Ambalaj karton, plastik ambalaj ve geri dönüştürülemeyen LDPE'den oluşmaktadır.
Aksesuarlar ve Garanti
Kutuda AC adaptörü ve evraklar dışında ekstra bir şey yoktur. ABD'de satın alındıysa normal bir yıllık sınırlı üretici garantisi geçerlidir.
Giriş Aygıtları
Klavye
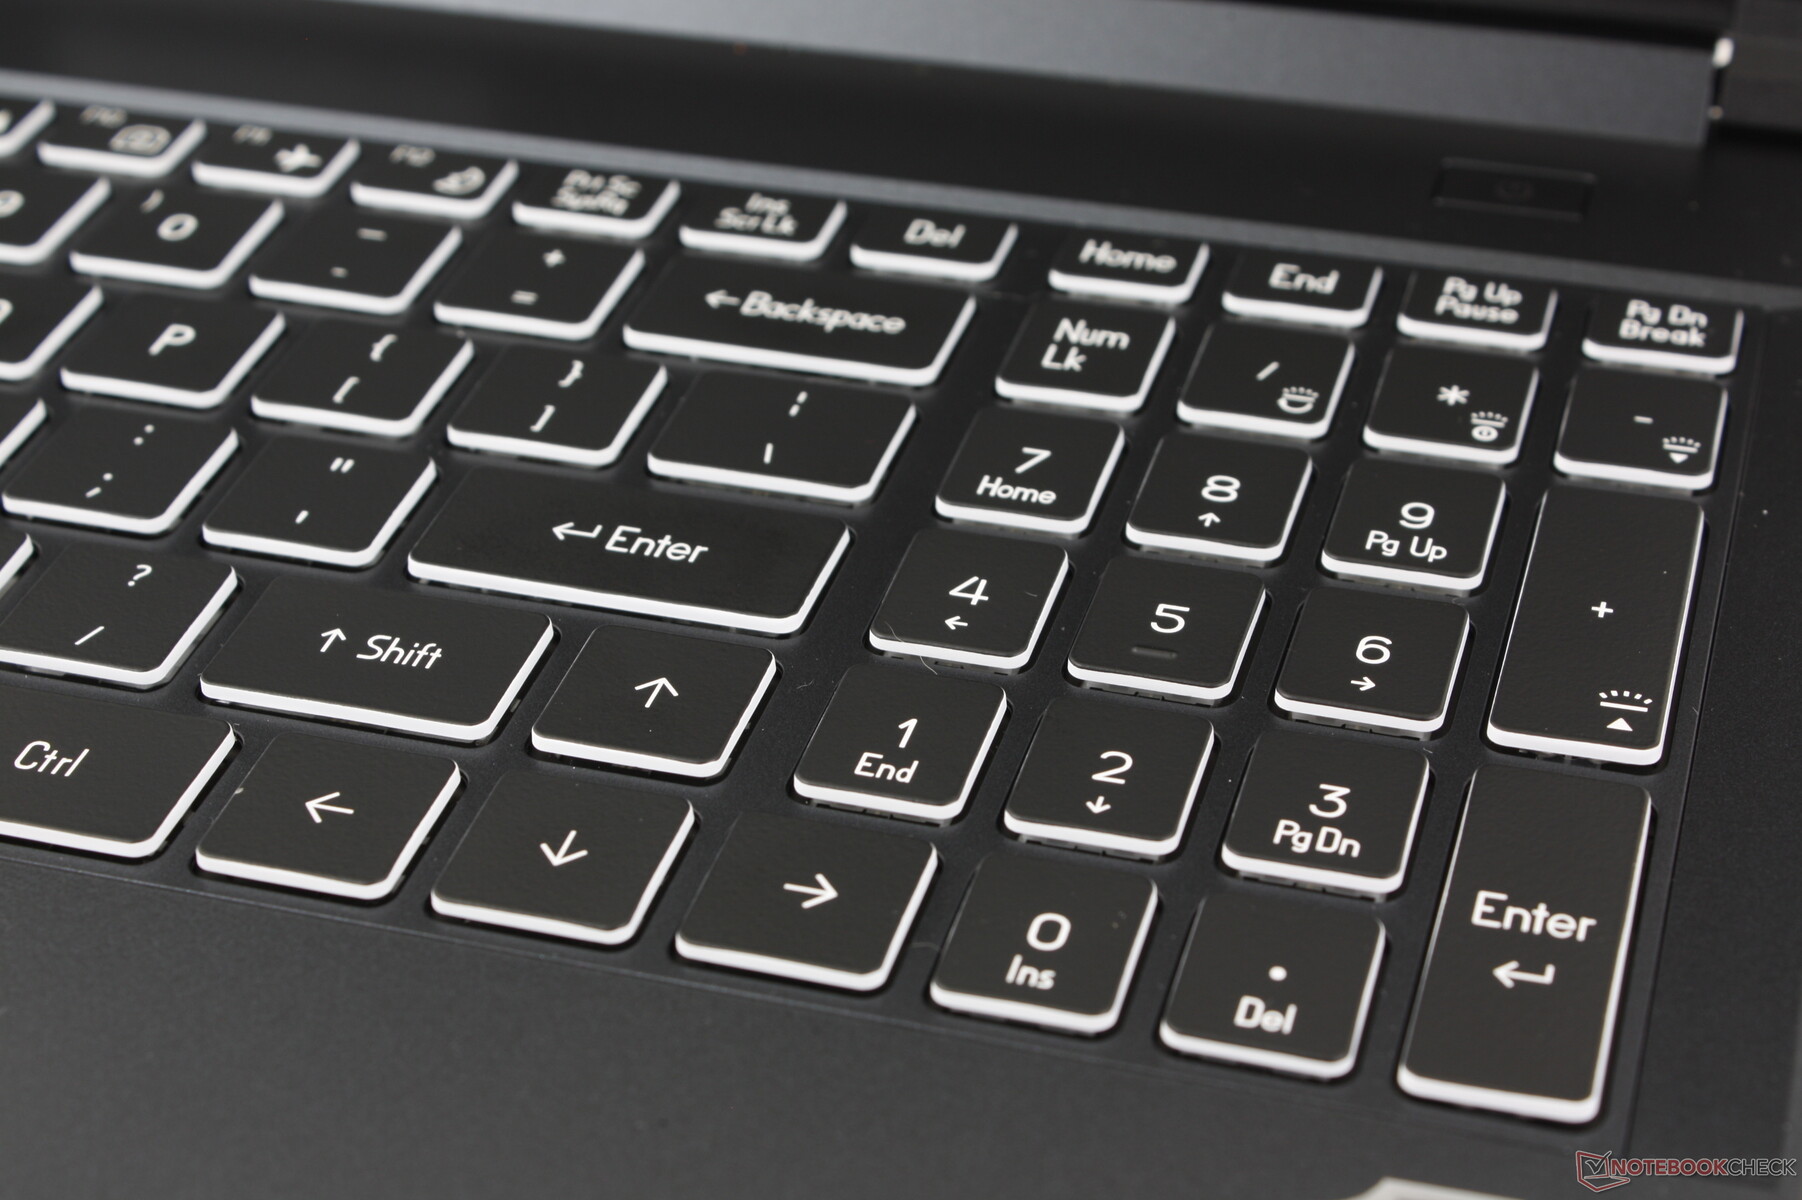
Yazma deneyimi, ana QWERTY tuşlarının tiz takırtısı nedeniyle diğer dizüstü bilgisayarların çoğundan daha yüksek. Yüksek ses genellikle daha sıkı ve daha tatmin edici geri bildirim anlamına gelir, ancak ML-16 MK2'de durum böyle değildir, çünkü yumuşak geri bildirim keskin gürültü seviyesine tam olarak uymazken hareket hala sığdır. Legion Pro 5 16'daki klavyeler veya Victus 16 karşılaştırıldığında daha tanıdık geliyor ve alışması daha kolay.
Tek bölgeli RGB arka ışık standart olarak sunuluyor ve tuş başına RGB ya da dört bölge seçeneği bulunmuyor.
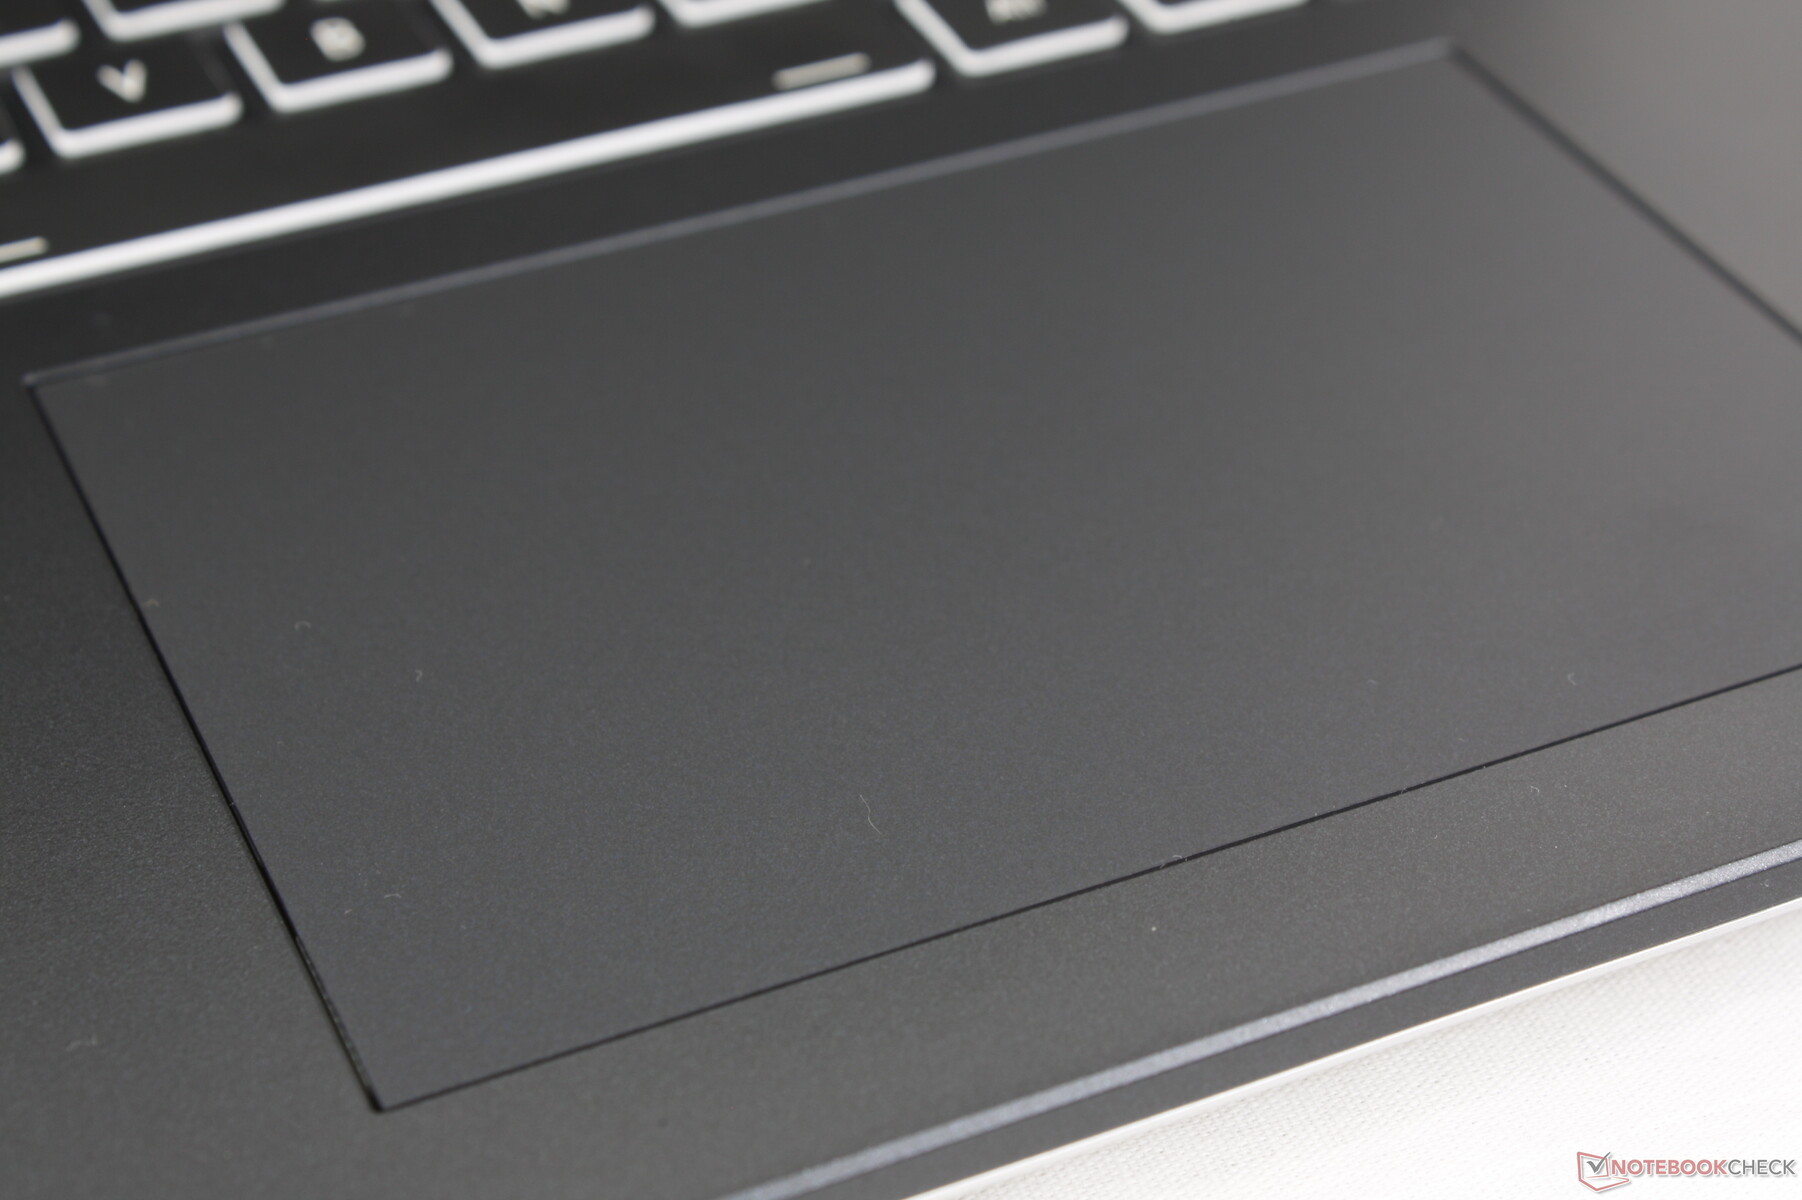
Dokunmatik yüzey
Tıklama yüzeyi (12,2 x 8,3 cm), ekran kartındakinden daha küçüktür Bıçak 16 (17 x 9,7 cm) ancak Legion Pro 5 16IRX9'dan (12 x 7,5 cm) daha büyüktür. Basıldığında sert ve tıklamalı geri bildirim ile geniş. Bununla birlikte, kayma özellikle düşük hızlarda neredeyse çok yumuşaktır, bu da hassas tıklamaları veya sürükle ve bırak eylemlerini daha zor hale getirir. Buna karşılık, diğer dizüstü bilgisayarların çoğunda daha düşük hızlarda hareket ederken parmak hassasiyeti sağlamak için yapışmaya meyillidir.


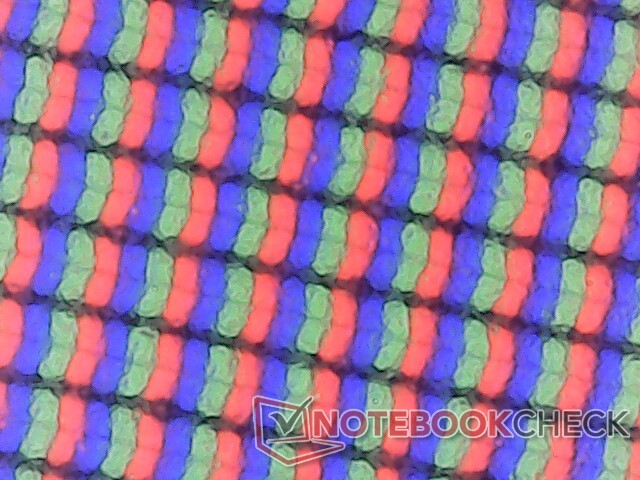
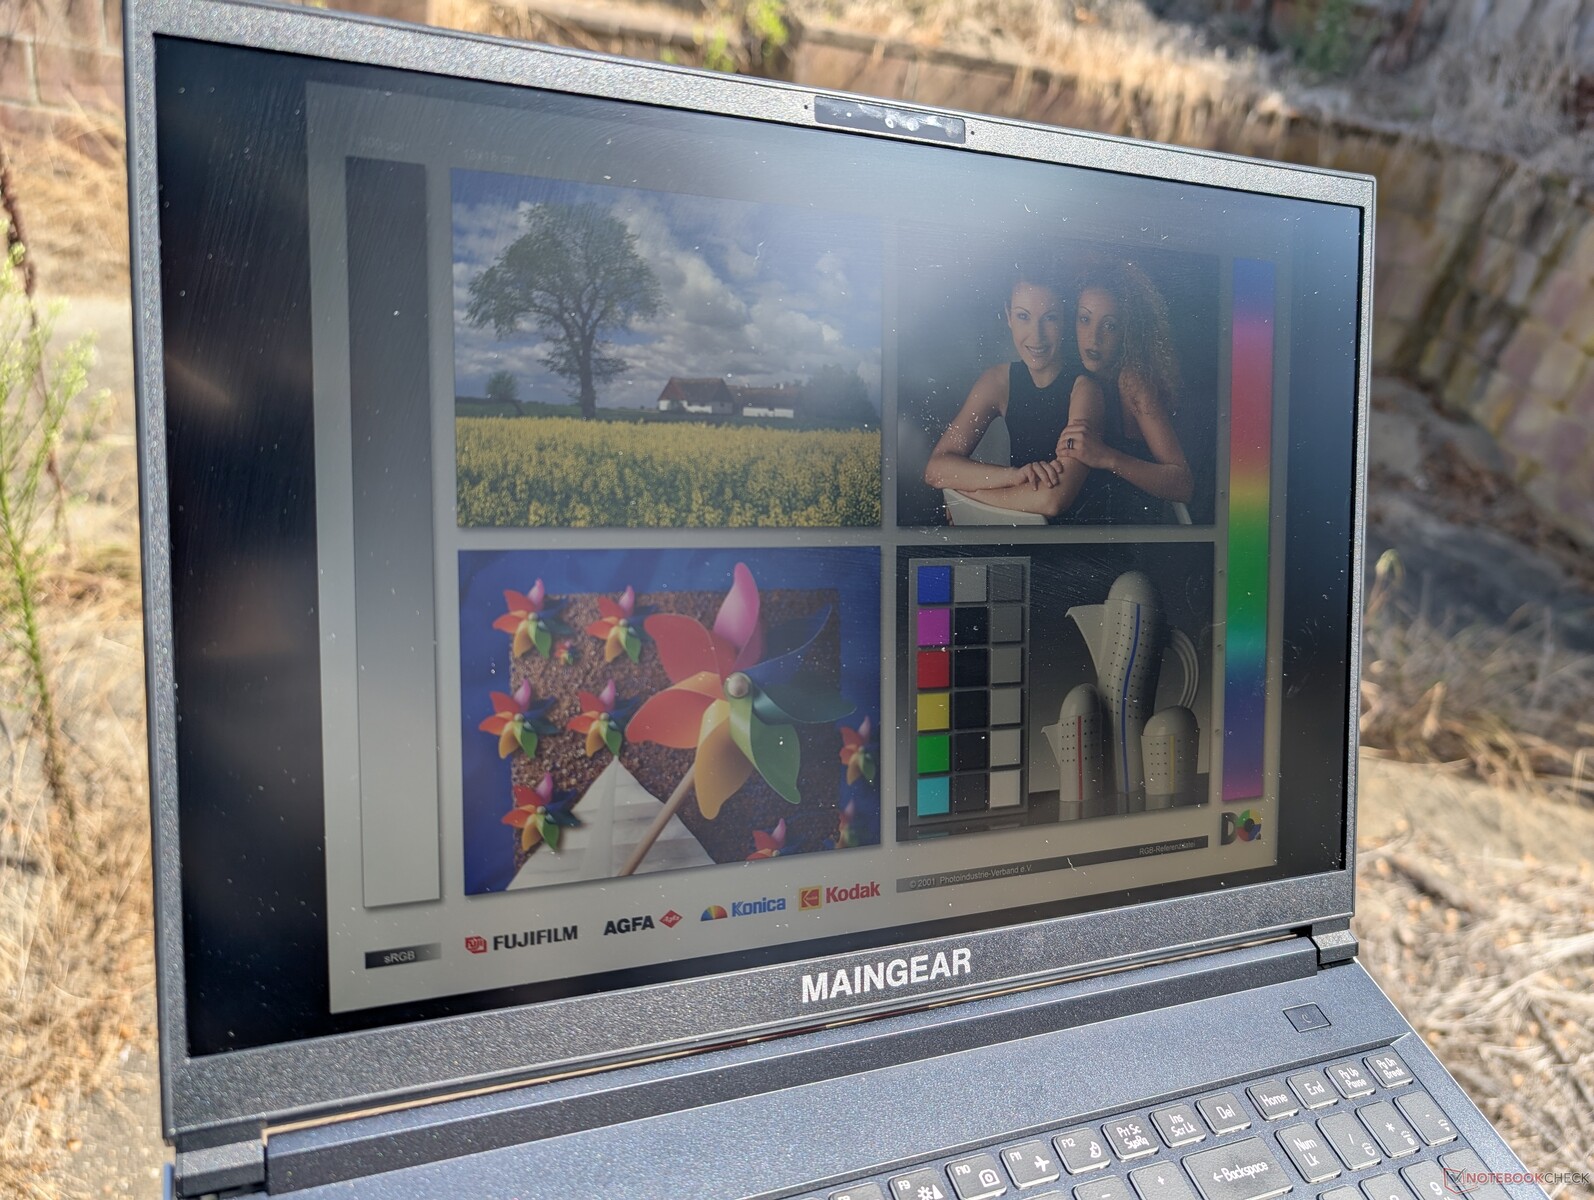
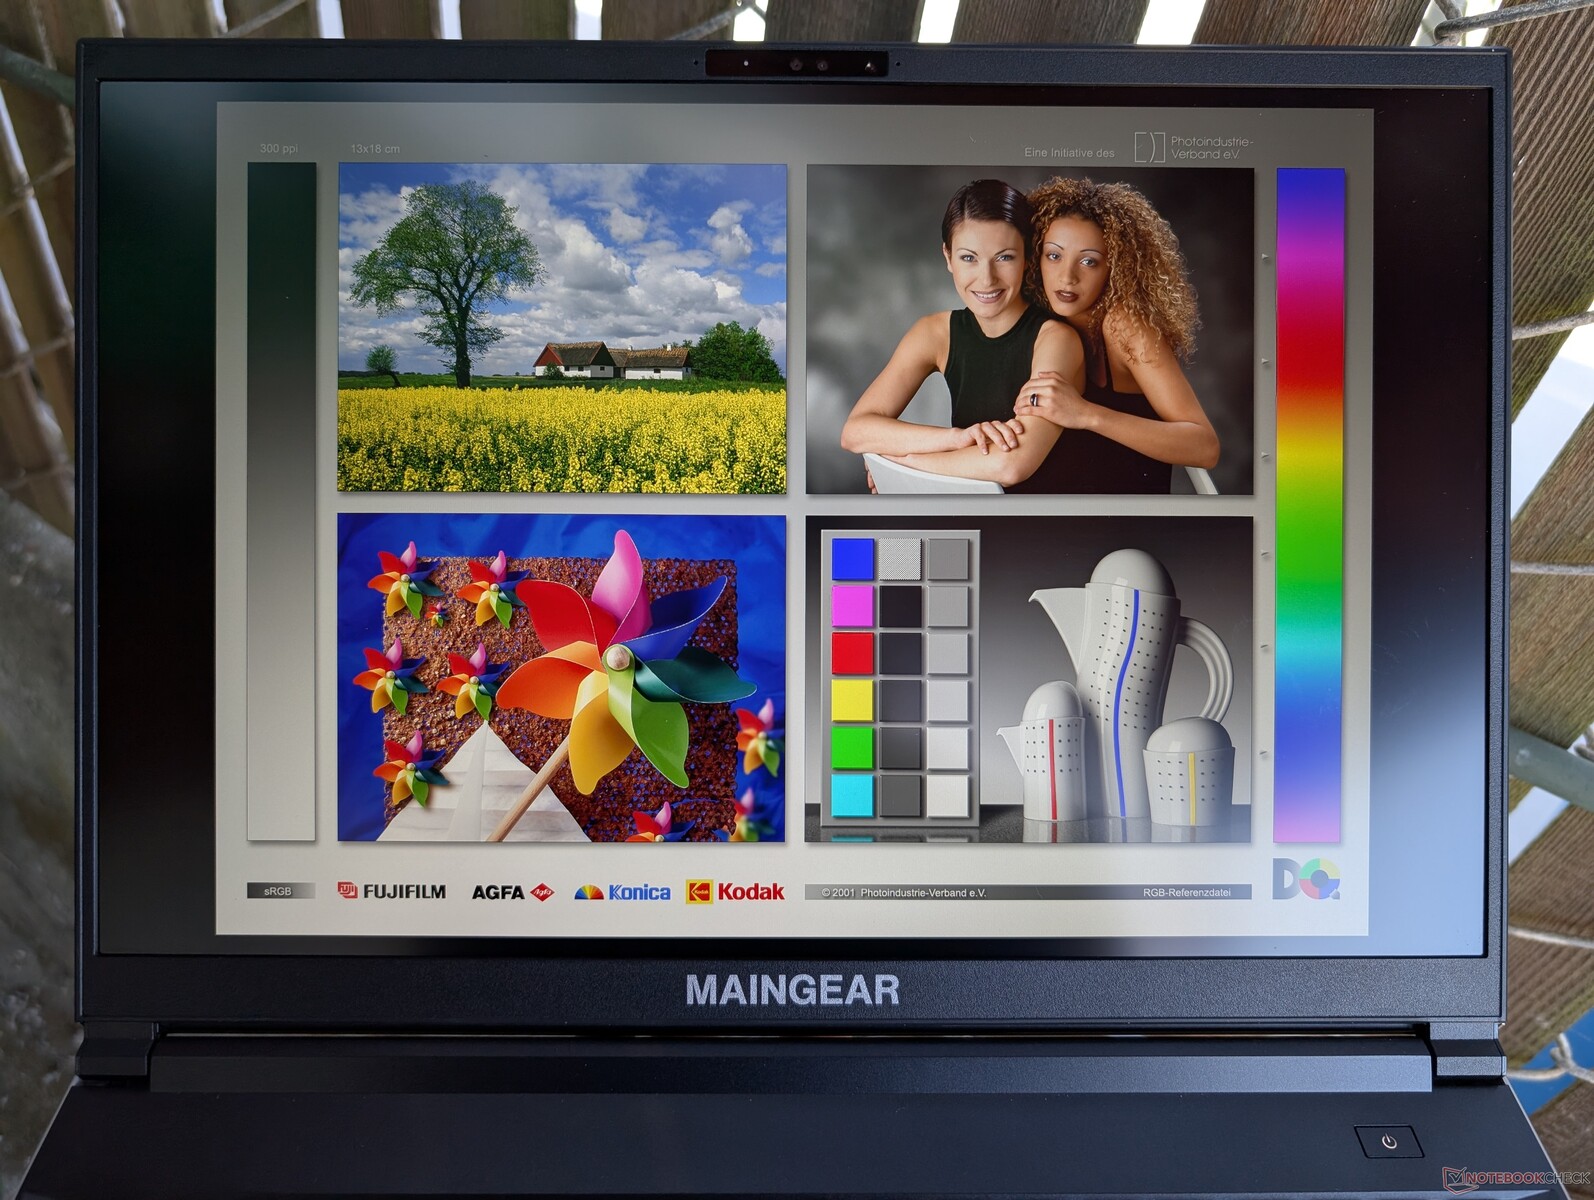
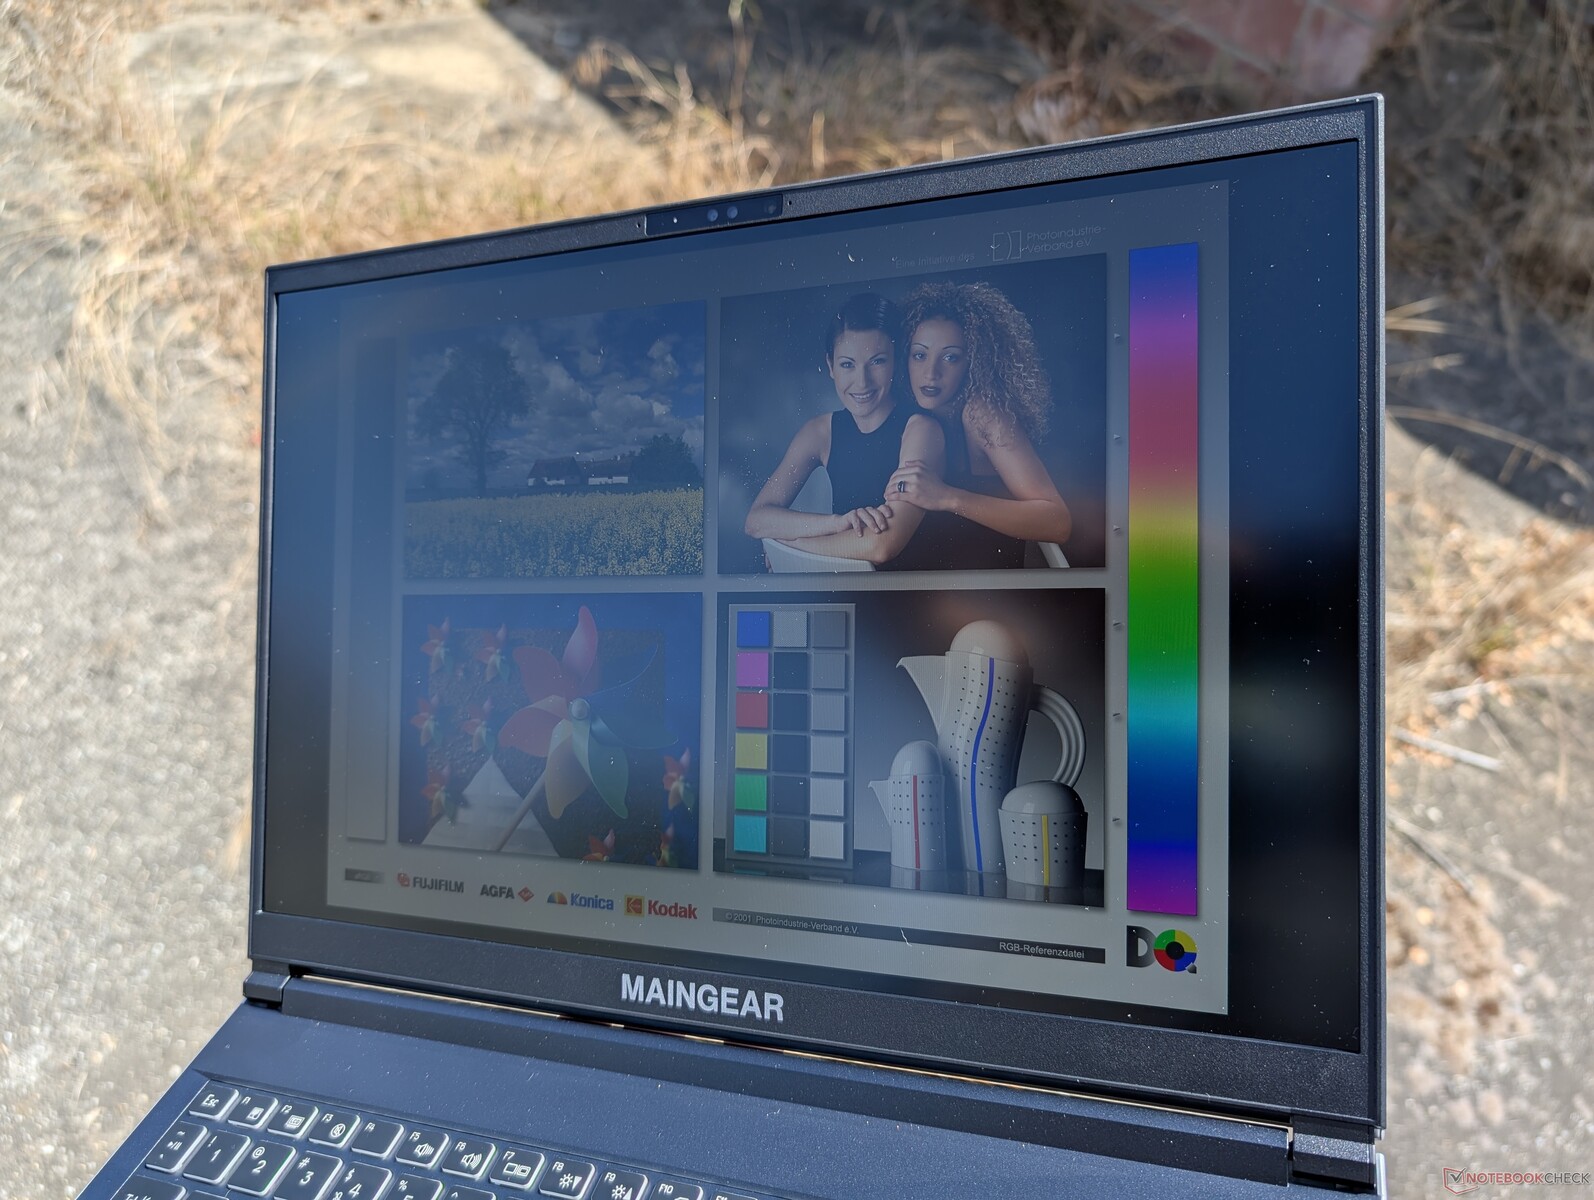
Ekran - Oyun IPS
ML-16 MK2, veritabanımızda TL160ADMP11-0 240 Hz IPS panel ile gönderilen ilk modeldir. Yenileme hızı, kontrast oranı ve çözünürlük açısından Alienware x16 R2'deki BOE B160QAN panel ile karşılaştırılabilir, ancak renk üretimi veya yanıt süreleri söz konusu olduğunda Dell ekranıyla tam olarak eşleşemez. ML-16 MK2 ekran sonuç olarak orta seviye olarak kabul edilebilir ve oyun oynamak ve çoğu amatör grafik düzenleme için hala çok uygundur.
G-Sync veya HDR gibi daha gelişmiş özellikler desteklenmiyor.

| |||||||||||||||||||||||||
Aydınlatma: 90 %
Batarya modunda parlaklık: 518.2 cd/m²
Kontrast: 1296:1 (Siyah: 0.4 cd/m²)
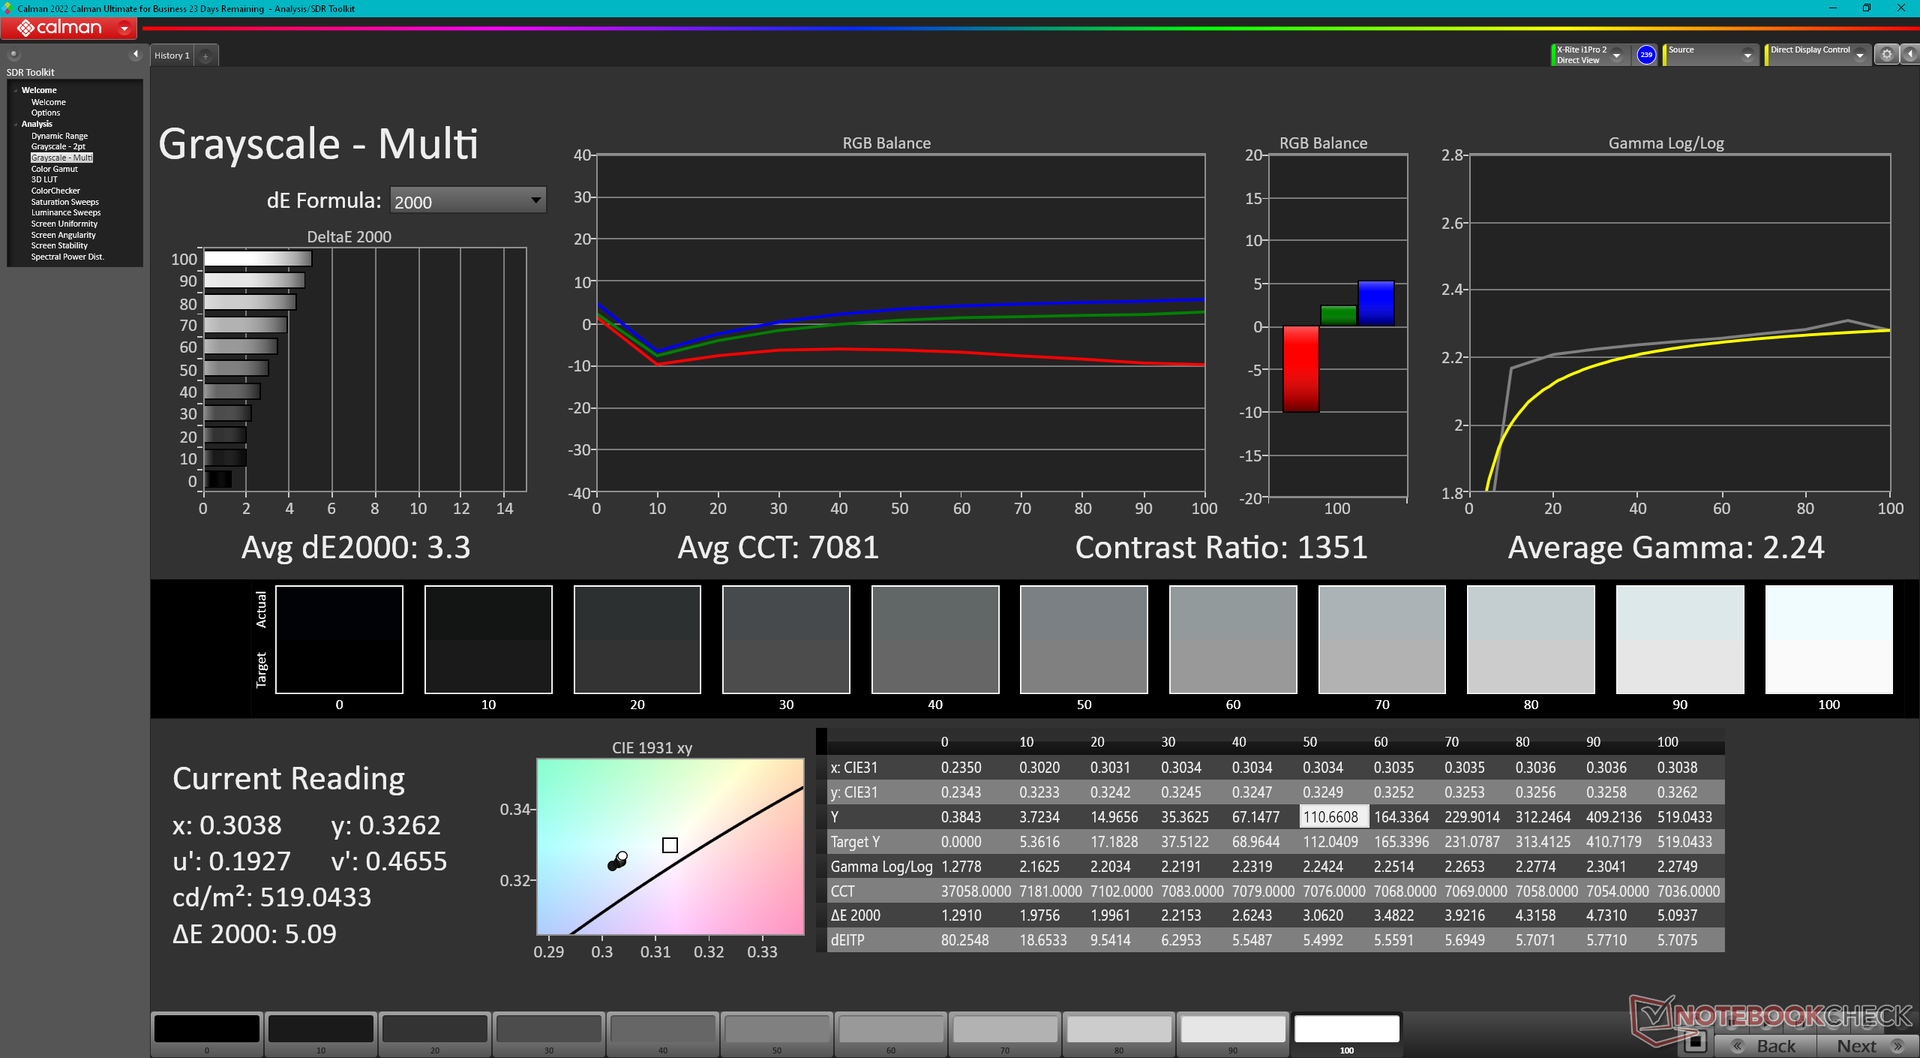
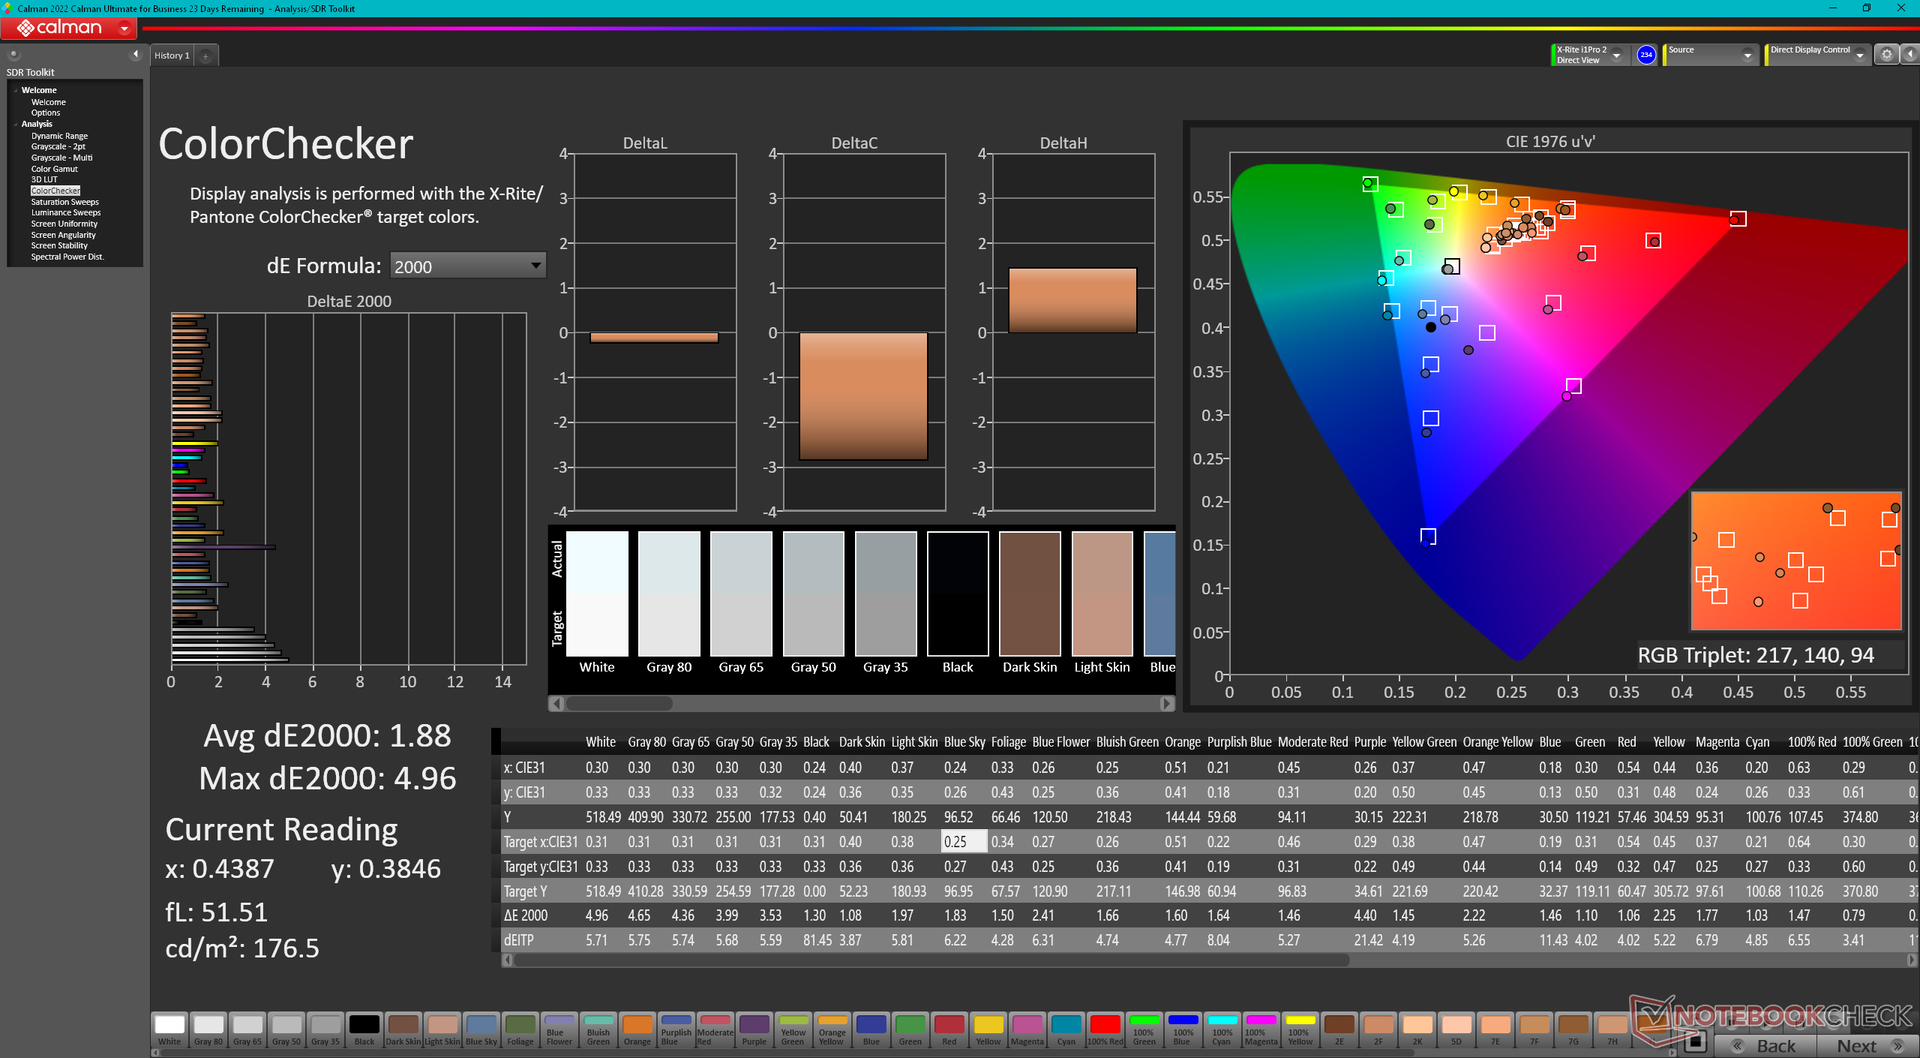
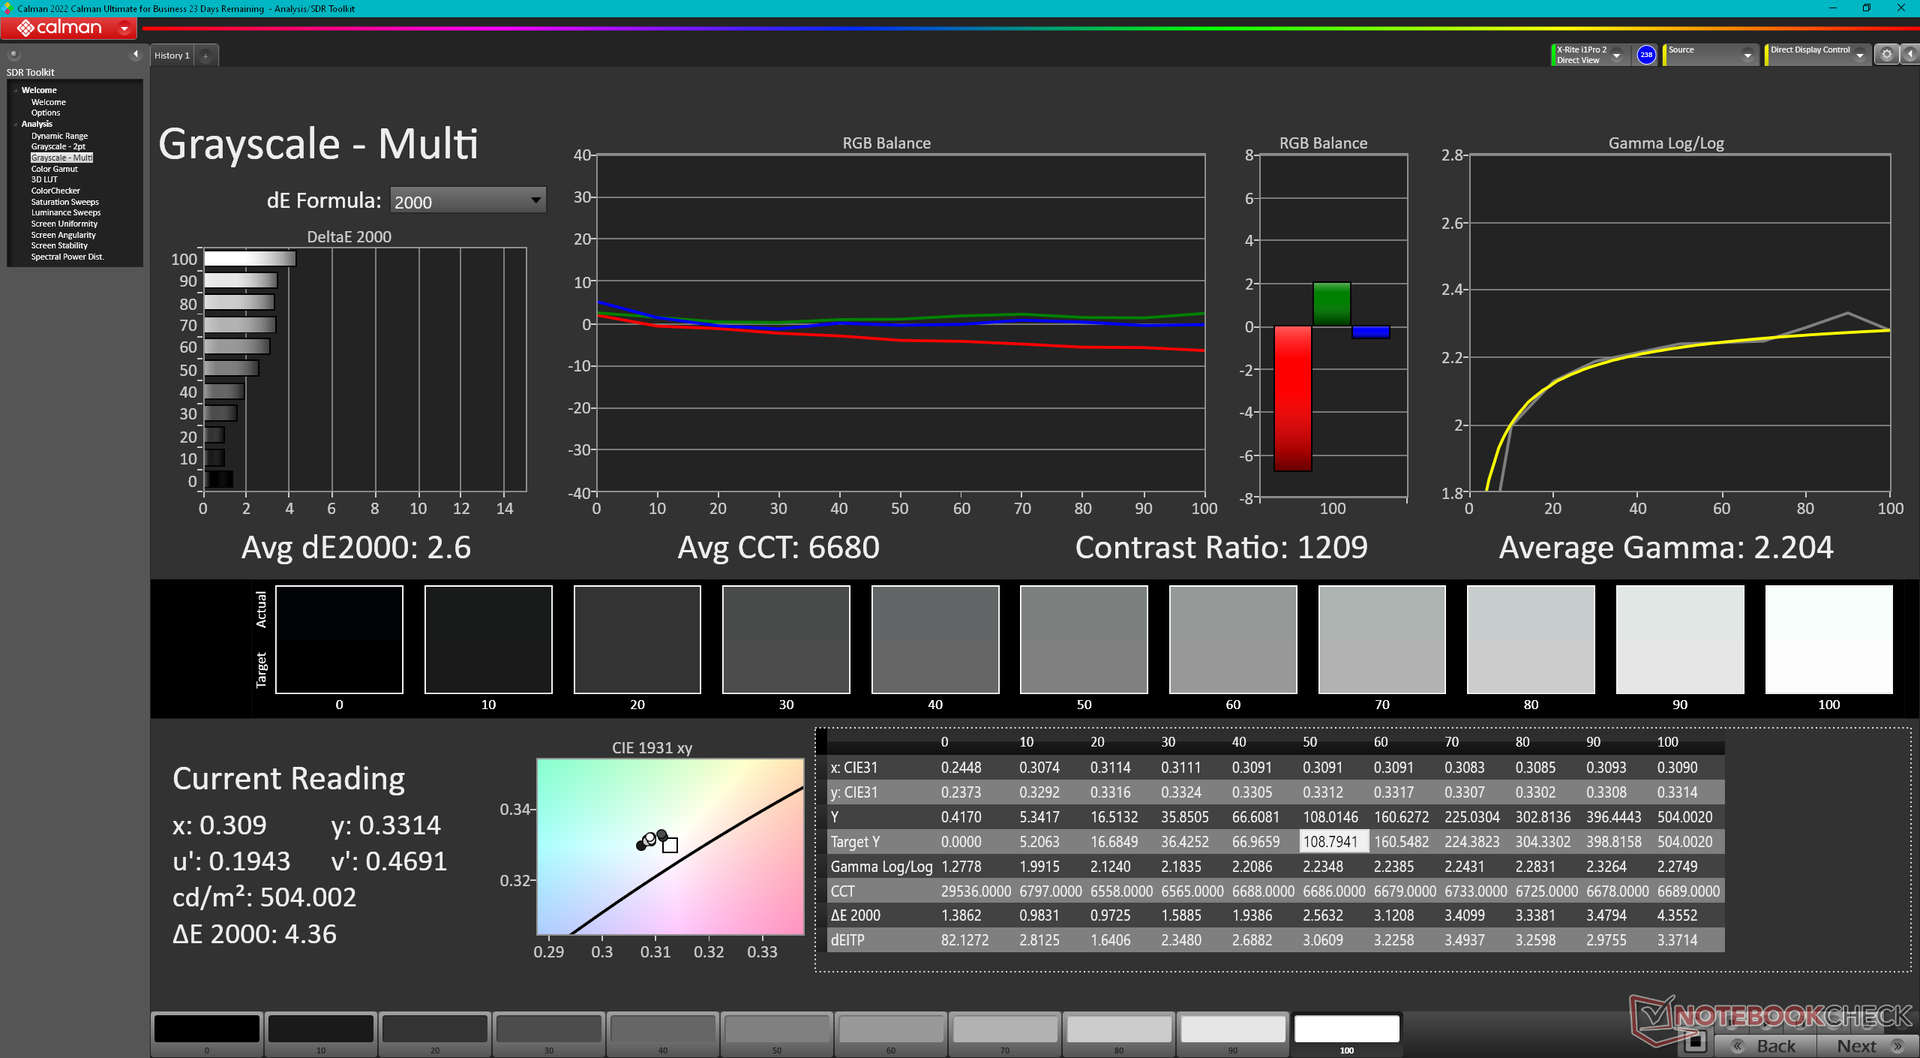
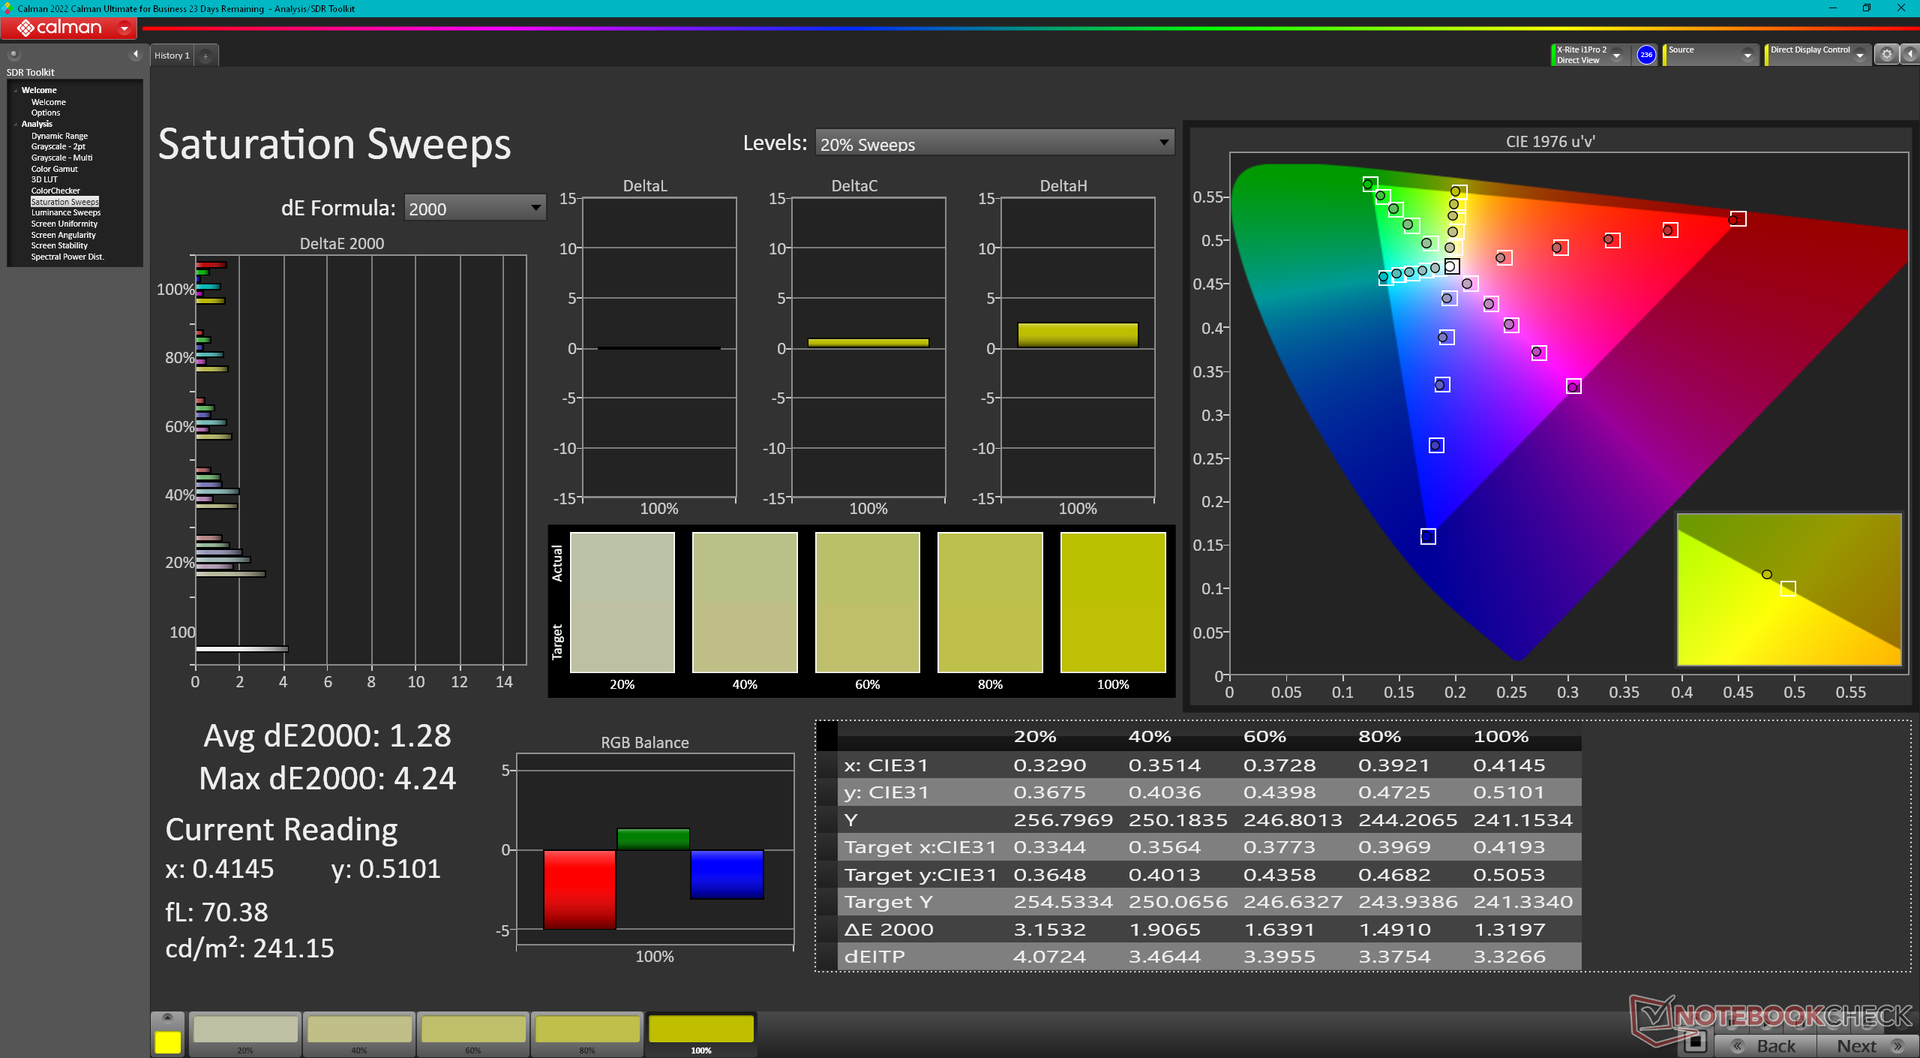
ΔE Color 1.88 | 0.5-29.43 Ø4.87, calibrated: 1.42
ΔE Greyscale 3.3 | 0.5-98 Ø5.1
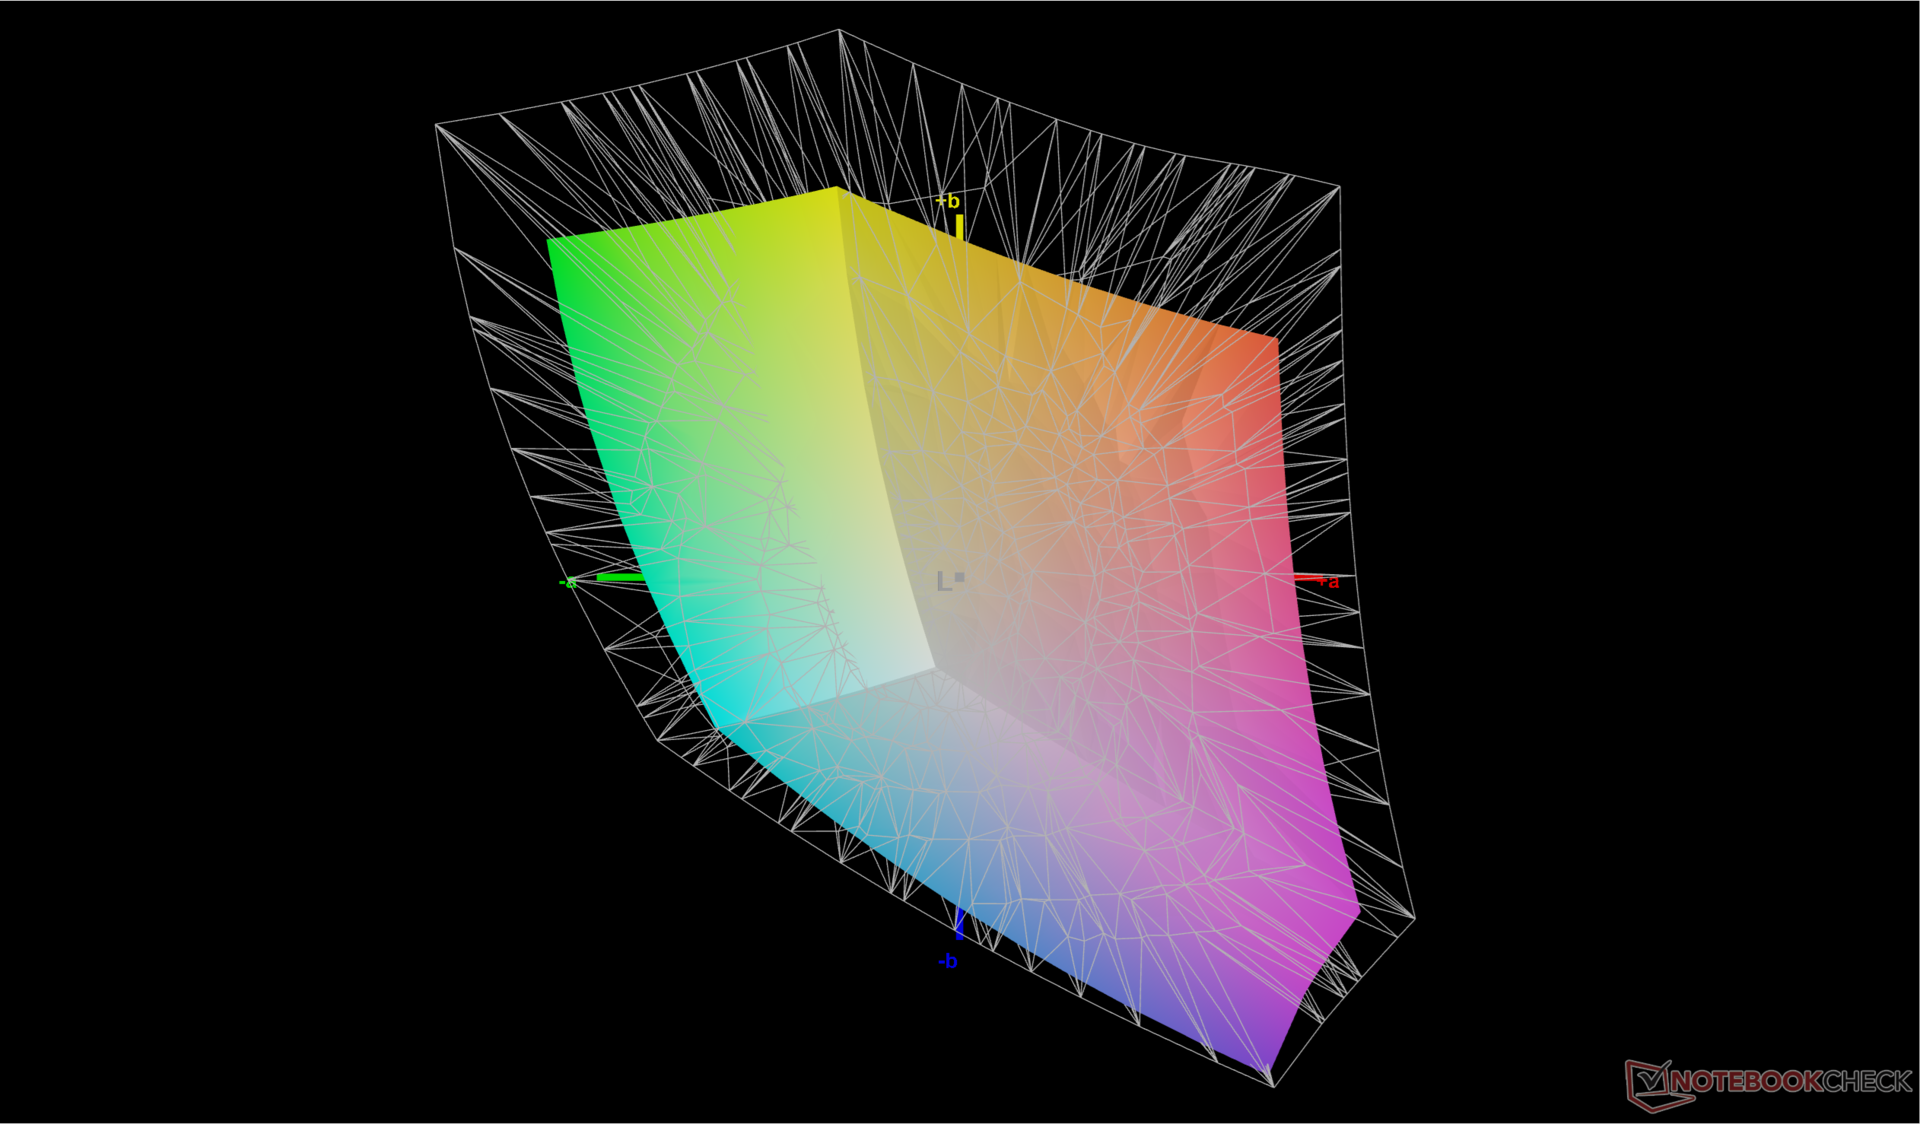
69.2% AdobeRGB 1998 (Argyll 2.2.0 3D)
98.2% sRGB (Argyll 2.2.0 3D)
67.3% Display P3 (Argyll 2.2.0 3D)
Gamma: 2.24
| Maingear ML-16 MK2 TL160ADMP11-0, IPS, 2560x1600, 16", 240 Hz | Asus ROG Zephyrus G16 GA605WV ATNA60DL04-0, OLED, 2560x1600, 16", 240 Hz | HP Victus 16 (2024) Chi Mei CMN163E, IPS, 1920x1080, 16.1", 144 Hz | Alienware x16 R2 P120F BOE B160QAN, IPS, 2560x1600, 16", 240 Hz | Lenovo Legion Pro 5 16IRX9 BOE NE160QDM-NYC, IPS, 2560x1600, 16", 165 Hz | Razer Blade 16 2024, RTX 4090 Samsung SDC41AB (ATNA60DL03-0), OLED, 2560x1600, 16", 240 Hz | |
|---|---|---|---|---|---|---|
| Display | 30% | -38% | 25% | 2% | 29% | |
| Display P3 Coverage | 67.3 | 99.9 48% | 41.3 -39% | 98.3 46% | 69.3 3% | 99.1 47% |
| sRGB Coverage | 98.2 | 100 2% | 61.7 -37% | 100 2% | 99.4 1% | 99.9 2% |
| AdobeRGB 1998 Coverage | 69.2 | 96.9 40% | 42.7 -38% | 88.8 28% | 70.1 1% | 95.6 38% |
| Response Times | 98% | -117% | 42% | 4% | 97% | |
| Response Time Grey 50% / Grey 80% * | 12.5 ? | 0.22 ? 98% | 28.6 ? -129% | 3.9 ? 69% | 11.9 ? 5% | 0.24 ? 98% |
| Response Time Black / White * | 9.1 ? | 0.25 ? 97% | 18.7 ? -105% | 7.8 ? 14% | 8.9 ? 2% | 0.4 ? 96% |
| PWM Frequency | 960 | 960 | ||||
| Screen | 11% | -79% | -3% | 14% | 193% | |
| Brightness middle | 518.2 | 416 -20% | 287 -45% | 348.4 -33% | 384 -26% | 418 -19% |
| Brightness | 487 | 418 -14% | 288 -41% | 340 -30% | 366 -25% | 420 -14% |
| Brightness Distribution | 90 | 96 7% | 86 -4% | 90 0% | 91 1% | 98 9% |
| Black Level * | 0.4 | 0.19 52% | 0.33 17% | 0.35 12% | 0.02 95% | |
| Contrast | 1296 | 1511 17% | 1056 -19% | 1097 -15% | 20900 1513% | |
| Colorchecker dE 2000 * | 1.88 | 1.6 15% | 5.46 -190% | 2.68 -43% | 0.97 48% | 1.07 43% |
| Colorchecker dE 2000 max. * | 4.96 | 2.1 58% | 20.36 -310% | 4.14 17% | 3.57 28% | 4.04 19% |
| Colorchecker dE 2000 calibrated * | 1.42 | 3.52 -148% | 0.42 70% | 0.77 46% | 1.07 25% | |
| Greyscale dE 2000 * | 3.3 | 2.7 18% | 4.8 -45% | 3.4 -3% | 1.5 55% | 1.12 66% |
| Gamma | 2.24 98% | 2.16 102% | 2.108 104% | 2.41 91% | 2.24 98% | 2.29 96% |
| CCT | 7081 92% | 6331 103% | 6442 101% | 6083 107% | 6709 97% | 6417 101% |
| Toplam Ortalama (Program / Ayarlar) | 46% /
32% | -78% /
-76% | 21% /
10% | 7% /
10% | 106% /
144% |
* ... daha küçük daha iyidir
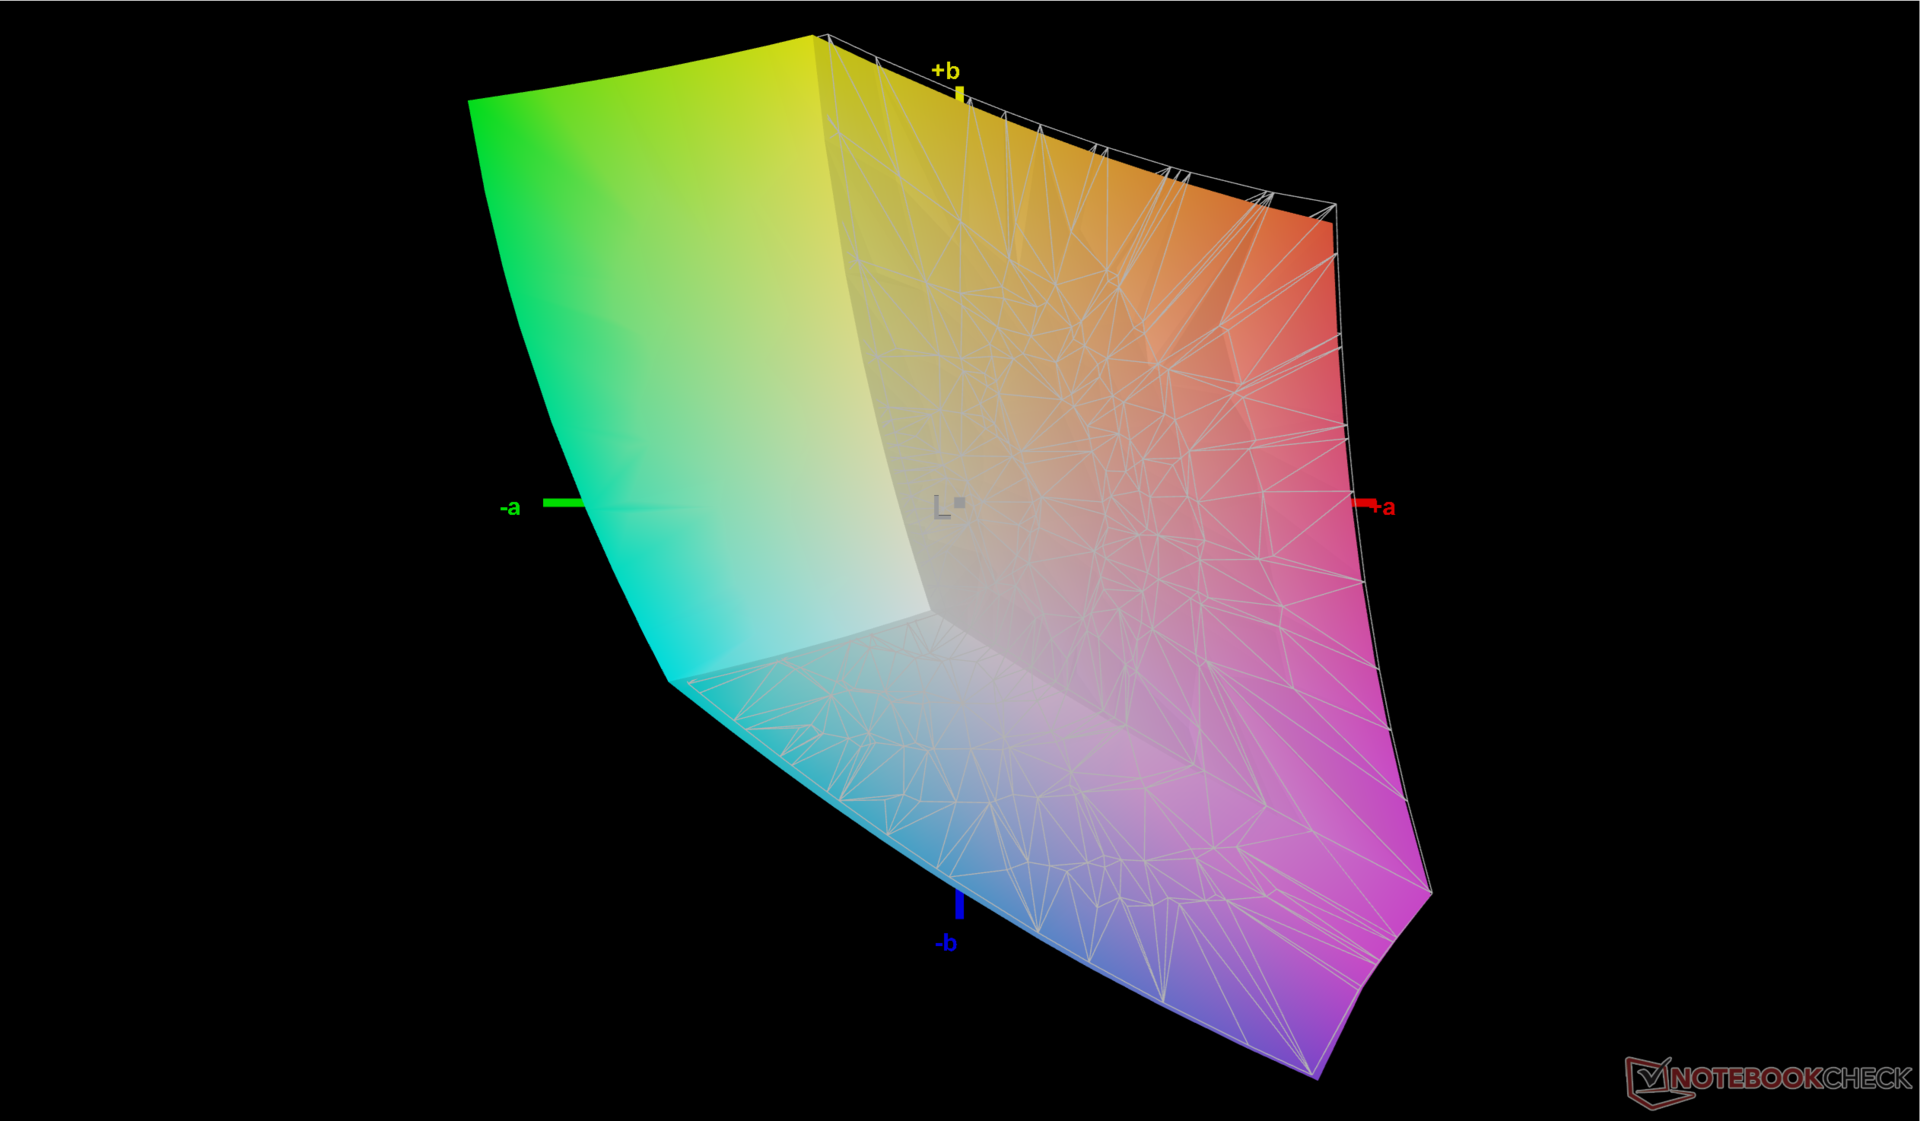
Ekran fabrikada kalibre edilmemiş olsa da, ortalama gri tonlama ve renk DeltaE değerleri sırasıyla 3,3 ve 1,8 ile kutudan çıktığı haliyle oldukça iyi. Renk sıcaklığı neredeyse 7100'de biraz fazla soğuk, ancak X-Rite renk ölçerimizle kalibre etmek ortalama deltaE değerlerini biraz iyileştirmek için bunu giderir. Kullanıcılar yukarıdaki kalibre edilmiş ICM profilimizi ücretsiz olarak uygulayabilirler.

Yanıt Sürelerini Görüntüle
| ↔ Tepki Süresi Siyahtan Beyaza | ||
|---|---|---|
| 9.1 ms ... yükseliş ↗ ve sonbahar↘ birleşimi | ↗ 5 ms yükseliş | 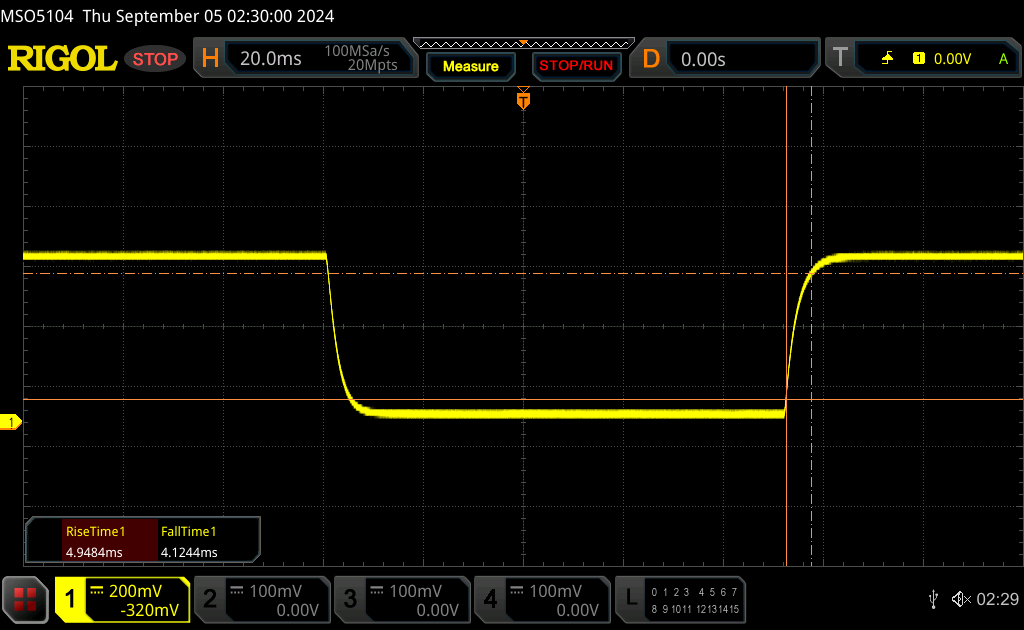 |
| ↘ 4.1 ms sonbahar | ||
| Ekran, testlerimizde hızlı yanıt oranları gösteriyor ve oyun oynamaya uygun olmalı. Karşılaştırıldığında, test edilen tüm cihazlar 0.1 (minimum) ile 240 (maksimum) ms arasında değişir. » Tüm cihazların 23 %'si daha iyi. Bu, ölçülen yanıt süresinin test edilen tüm cihazların ortalamasından (20.8 ms) daha iyi olduğu anlamına gelir. | ||
| ↔ Tepki Süresi %50 Griden %80 Griye | ||
| 12.5 ms ... yükseliş ↗ ve sonbahar↘ birleşimi | ↗ 5.6 ms yükseliş | 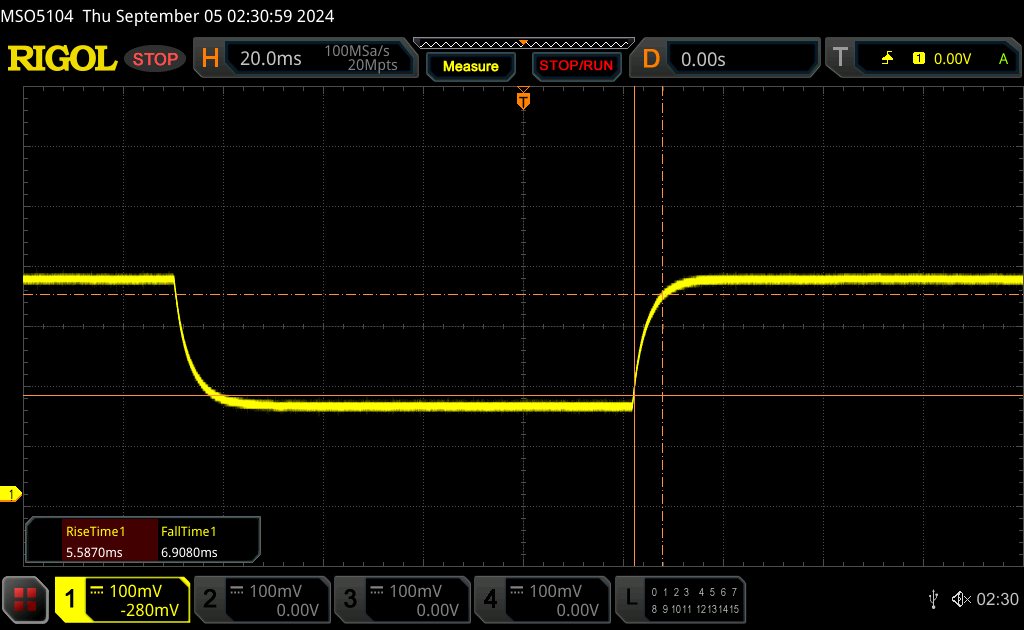 |
| ↘ 6.9 ms sonbahar | ||
| Ekran, testlerimizde iyi yanıt oranları gösteriyor ancak rekabetçi oyuncular için çok yavaş olabilir. Karşılaştırıldığında, test edilen tüm cihazlar 0.165 (minimum) ile 636 (maksimum) ms arasında değişir. » Tüm cihazların 23 %'si daha iyi. Bu, ölçülen yanıt süresinin test edilen tüm cihazların ortalamasından (32.5 ms) daha iyi olduğu anlamına gelir. | ||
Ekran Titremesi / PWM (Darbe Genişliği Modülasyonu)
| Ekran titriyor / PWM algılanmadı |  | ||
Karşılaştırıldığında: Test edilen tüm cihazların %53 %'si ekranı karartmak için PWM kullanmıyor. PWM tespit edilirse, ortalama 8516 (minimum: 5 - maksimum: 343500) Hz ölçüldü. | |||
Nispeten parlak 500 nit arka ışık sayesinde dış mekan görünürlüğü diğer 16 inç oyun dizüstü bilgisayarlarının çoğundan daha iyidir. Bu Victus 16örneğin, Alienware x16 R2 ve Blade 16, yalnızca 400 nit veya hatta fark edilir derecede daha sönük olması için yalnızca 300 nit ile en üst seviyededir. Yine de renkleri mümkün olduğunca korumak için doğrudan güneş ışığından kaçınmak isteyeceksiniz.

Performans - Raptor Gölü Yerine Meteor Gölü Yenilemesi

Test Koşulları
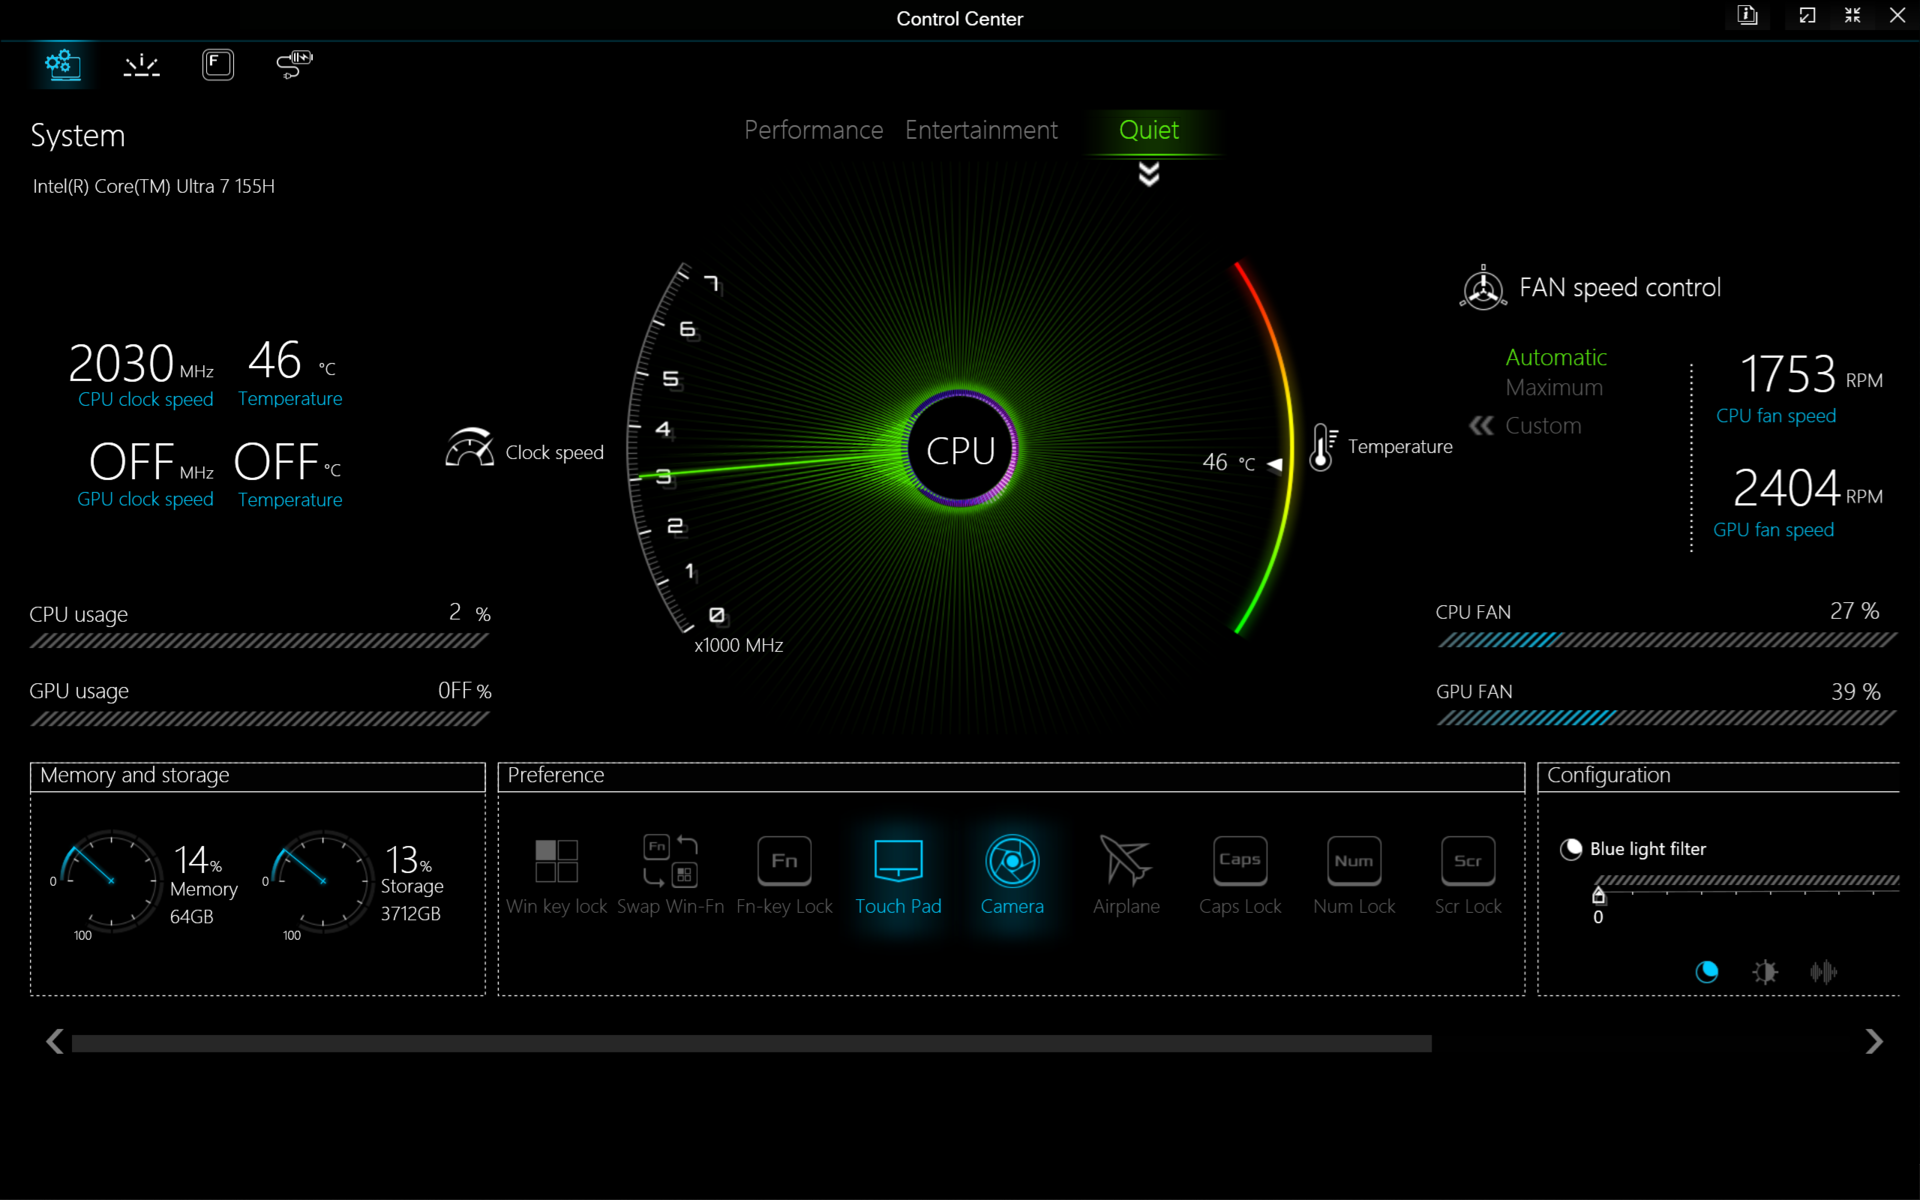
Aşağıdaki kıyaslamaları çalıştırmadan önce Windows ve Kontrol Merkezini Performans moduna ayarladık. Fan davranışı, elektronik kamera deklanşörü, RGB tuşları ve manuel GPU MUX anahtarı gibi temel özelliklerin ayarlandığı merkez olduğu için cihaz sahipleri önceden yüklenmiş Kontrol Merkezi yazılımına aşina olmalıdır. İkincisinin, erişmek için ek tıklama gerektiren bir alt menü altında can sıkıcı bir şekilde gizlendiğini unutmayın.
Gelişmiş Optimus olmadan yalnızca standart Optimus ve MUX desteklenir. Bu nedenle, dGPU ve MSHybrid modları arasında geçiş yaparken yeniden başlatma gerekir.

İşlemci
Bu Core Ultra 7 155H başarılı olur Core i7-13700Hancak performans artışı sadece yüzde 5 ila 15 arasında nispeten marjinaldir. Bunun nedeni, yeni Meteor Lake platformunun kalıp alanının çoğunu yeni entegre NPU için ayırması ve bu nedenle ham performans avantajlarının bu yıl arka planda kalmasıdır. Bu Core i7-14700HX core Ultra 7 155H'ye göre ham performansı çok daha önemli ölçüde artırabilirdi, ancak aynı zamanda daha fazla güç tüketen bir işlemcidir.
Entegre NPU, Co-Pilot+ ile uyumlu olmadığı için ne yazık ki çok sınırlı bir kullanıma sahiptir; Microsoft hizmeti en azından bir Lunar Lake işlemci veya AMD/Qualcomm eşdeğeri gerektirir. Çoğu oyun da henüz NPU'yu kullanmıyor.
Cinebench R15 Multi Loop
Cinebench R23: Multi Core | Single Core
Cinebench R20: CPU (Multi Core) | CPU (Single Core)
Cinebench R15: CPU Multi 64Bit | CPU Single 64Bit
Blender: v2.79 BMW27 CPU
7-Zip 18.03: 7z b 4 | 7z b 4 -mmt1
Geekbench 6.4: Multi-Core | Single-Core
Geekbench 5.5: Multi-Core | Single-Core
HWBOT x265 Benchmark v2.2: 4k Preset
LibreOffice : 20 Documents To PDF
R Benchmark 2.5: Overall mean
| CPU Performance Rating | |
| Razer Blade 16 2024, RTX 4090 | |
| Asus ROG Zephyrus G16 GA605WV | |
| HP Victus 16 (2024) | |
| Asus TUF Gaming A16 FA617XS -2! | |
| MSI Stealth 16 Mercedes-AMG Motorsport A13VG | |
| Lenovo Legion Slim 7 16APH8 | |
| Dell Inspiron 16 Plus 7630 | |
| HP Victus 16-r0076TX -3! | |
| Alienware x16 R2 P120F | |
| Maingear ML-16 MK2 | |
| Ortalama Intel Core Ultra 7 155H | |
| HP Victus 16-r0077ng | |
| CSL GameStar Notebook VenomGamer G16 | |
| HP Omen 16-n0033dx -2! | |
| Acer Nitro 16 AN16-41-R7YE | |
| Cinebench R23 / Multi Core | |
| Razer Blade 16 2024, RTX 4090 | |
| HP Victus 16 (2024) | |
| Asus ROG Zephyrus G16 GA605WV | |
| MSI Stealth 16 Mercedes-AMG Motorsport A13VG | |
| Alienware x16 R2 P120F | |
| HP Victus 16-r0076TX | |
| Maingear ML-16 MK2 | |
| Asus TUF Gaming A16 FA617XS | |
| Lenovo Legion Slim 7 16APH8 | |
| Dell Inspiron 16 Plus 7630 | |
| HP Victus 16-r0077ng | |
| Ortalama Intel Core Ultra 7 155H (9769 - 19007, n=52) | |
| CSL GameStar Notebook VenomGamer G16 | |
| HP Omen 16-n0033dx | |
| Acer Nitro 16 AN16-41-R7YE | |
| Cinebench R23 / Single Core | |
| Razer Blade 16 2024, RTX 4090 | |
| MSI Stealth 16 Mercedes-AMG Motorsport A13VG | |
| Asus ROG Zephyrus G16 GA605WV | |
| Dell Inspiron 16 Plus 7630 | |
| Asus TUF Gaming A16 FA617XS | |
| Lenovo Legion Slim 7 16APH8 | |
| Ortalama Intel Core Ultra 7 155H (1496 - 1815, n=52) | |
| HP Victus 16 (2024) | |
| HP Victus 16-r0076TX | |
| HP Victus 16-r0077ng | |
| Maingear ML-16 MK2 | |
| Alienware x16 R2 P120F | |
| CSL GameStar Notebook VenomGamer G16 | |
| HP Omen 16-n0033dx | |
| Acer Nitro 16 AN16-41-R7YE | |
| Cinebench R20 / CPU (Multi Core) | |
| Razer Blade 16 2024, RTX 4090 | |
| HP Victus 16 (2024) | |
| Asus ROG Zephyrus G16 GA605WV | |
| MSI Stealth 16 Mercedes-AMG Motorsport A13VG | |
| Alienware x16 R2 P120F | |
| HP Victus 16-r0076TX | |
| Maingear ML-16 MK2 | |
| Asus TUF Gaming A16 FA617XS | |
| Lenovo Legion Slim 7 16APH8 | |
| Dell Inspiron 16 Plus 7630 | |
| HP Victus 16-r0077ng | |
| Ortalama Intel Core Ultra 7 155H (3798 - 7409, n=50) | |
| CSL GameStar Notebook VenomGamer G16 | |
| HP Omen 16-n0033dx | |
| Acer Nitro 16 AN16-41-R7YE | |
| Cinebench R20 / CPU (Single Core) | |
| Razer Blade 16 2024, RTX 4090 | |
| Asus ROG Zephyrus G16 GA605WV | |
| MSI Stealth 16 Mercedes-AMG Motorsport A13VG | |
| Dell Inspiron 16 Plus 7630 | |
| Asus TUF Gaming A16 FA617XS | |
| Lenovo Legion Slim 7 16APH8 | |
| Ortalama Intel Core Ultra 7 155H (601 - 696, n=50) | |
| HP Victus 16 (2024) | |
| HP Victus 16-r0077ng | |
| HP Victus 16-r0076TX | |
| Maingear ML-16 MK2 | |
| Alienware x16 R2 P120F | |
| HP Omen 16-n0033dx | |
| CSL GameStar Notebook VenomGamer G16 | |
| Acer Nitro 16 AN16-41-R7YE | |
| Cinebench R15 / CPU Multi 64Bit | |
| Razer Blade 16 2024, RTX 4090 | |
| HP Victus 16 (2024) | |
| Asus ROG Zephyrus G16 GA605WV | |
| MSI Stealth 16 Mercedes-AMG Motorsport A13VG | |
| HP Victus 16-r0076TX | |
| Alienware x16 R2 P120F | |
| Maingear ML-16 MK2 | |
| Asus TUF Gaming A16 FA617XS | |
| Lenovo Legion Slim 7 16APH8 | |
| Ortalama Intel Core Ultra 7 155H (1932 - 2880, n=56) | |
| Dell Inspiron 16 Plus 7630 | |
| HP Victus 16-r0077ng | |
| CSL GameStar Notebook VenomGamer G16 | |
| HP Omen 16-n0033dx | |
| Acer Nitro 16 AN16-41-R7YE | |
| Cinebench R15 / CPU Single 64Bit | |
| Razer Blade 16 2024, RTX 4090 | |
| Asus ROG Zephyrus G16 GA605WV | |
| Asus TUF Gaming A16 FA617XS | |
| MSI Stealth 16 Mercedes-AMG Motorsport A13VG | |
| Lenovo Legion Slim 7 16APH8 | |
| Dell Inspiron 16 Plus 7630 | |
| CSL GameStar Notebook VenomGamer G16 | |
| Ortalama Intel Core Ultra 7 155H (99.6 - 268, n=52) | |
| HP Victus 16-r0077ng | |
| HP Omen 16-n0033dx | |
| HP Victus 16-r0076TX | |
| Maingear ML-16 MK2 | |
| Acer Nitro 16 AN16-41-R7YE | |
| HP Victus 16 (2024) | |
| Alienware x16 R2 P120F | |
| Blender / v2.79 BMW27 CPU | |
| Acer Nitro 16 AN16-41-R7YE | |
| HP Omen 16-n0033dx | |
| Ortalama Intel Core Ultra 7 155H (175 - 381, n=47) | |
| MSI Stealth 16 Mercedes-AMG Motorsport A13VG | |
| Maingear ML-16 MK2 | |
| Dell Inspiron 16 Plus 7630 | |
| HP Victus 16-r0077ng | |
| CSL GameStar Notebook VenomGamer G16 | |
| Lenovo Legion Slim 7 16APH8 | |
| HP Victus 16-r0076TX | |
| Asus TUF Gaming A16 FA617XS | |
| Alienware x16 R2 P120F | |
| HP Victus 16 (2024) | |
| Asus ROG Zephyrus G16 GA605WV | |
| Razer Blade 16 2024, RTX 4090 | |
| 7-Zip 18.03 / 7z b 4 | |
| Razer Blade 16 2024, RTX 4090 | |
| HP Victus 16 (2024) | |
| Asus ROG Zephyrus G16 GA605WV | |
| HP Victus 16-r0076TX | |
| Lenovo Legion Slim 7 16APH8 | |
| Asus TUF Gaming A16 FA617XS | |
| Alienware x16 R2 P120F | |
| HP Victus 16-r0077ng | |
| Maingear ML-16 MK2 | |
| CSL GameStar Notebook VenomGamer G16 | |
| Dell Inspiron 16 Plus 7630 | |
| Ortalama Intel Core Ultra 7 155H (41739 - 70254, n=50) | |
| HP Omen 16-n0033dx | |
| MSI Stealth 16 Mercedes-AMG Motorsport A13VG | |
| Acer Nitro 16 AN16-41-R7YE | |
| 7-Zip 18.03 / 7z b 4 -mmt1 | |
| Razer Blade 16 2024, RTX 4090 | |
| Asus TUF Gaming A16 FA617XS | |
| Lenovo Legion Slim 7 16APH8 | |
| MSI Stealth 16 Mercedes-AMG Motorsport A13VG | |
| Asus ROG Zephyrus G16 GA605WV | |
| CSL GameStar Notebook VenomGamer G16 | |
| Dell Inspiron 16 Plus 7630 | |
| Acer Nitro 16 AN16-41-R7YE | |
| HP Omen 16-n0033dx | |
| HP Victus 16 (2024) | |
| HP Victus 16-r0077ng | |
| HP Victus 16-r0076TX | |
| Ortalama Intel Core Ultra 7 155H (4594 - 5621, n=50) | |
| Maingear ML-16 MK2 | |
| Alienware x16 R2 P120F | |
| Geekbench 6.4 / Multi-Core | |
| Razer Blade 16 2024, RTX 4090 | |
| Asus ROG Zephyrus G16 GA605WV | |
| HP Victus 16 (2024) | |
| Dell Inspiron 16 Plus 7630 | |
| Lenovo Legion Slim 7 16APH8 | |
| Alienware x16 R2 P120F | |
| Ortalama Intel Core Ultra 7 155H (7732 - 13656, n=55) | |
| MSI Stealth 16 Mercedes-AMG Motorsport A13VG | |
| Maingear ML-16 MK2 | |
| HP Victus 16-r0077ng | |
| CSL GameStar Notebook VenomGamer G16 | |
| Acer Nitro 16 AN16-41-R7YE | |
| Geekbench 6.4 / Single-Core | |
| Razer Blade 16 2024, RTX 4090 | |
| Asus ROG Zephyrus G16 GA605WV | |
| MSI Stealth 16 Mercedes-AMG Motorsport A13VG | |
| Dell Inspiron 16 Plus 7630 | |
| Lenovo Legion Slim 7 16APH8 | |
| HP Victus 16-r0077ng | |
| HP Victus 16 (2024) | |
| Ortalama Intel Core Ultra 7 155H (1901 - 2473, n=52) | |
| Maingear ML-16 MK2 | |
| Alienware x16 R2 P120F | |
| CSL GameStar Notebook VenomGamer G16 | |
| Acer Nitro 16 AN16-41-R7YE | |
| Geekbench 5.5 / Multi-Core | |
| Razer Blade 16 2024, RTX 4090 | |
| HP Victus 16 (2024) | |
| Asus ROG Zephyrus G16 GA605WV | |
| Dell Inspiron 16 Plus 7630 | |
| Alienware x16 R2 P120F | |
| HP Victus 16-r0076TX | |
| Maingear ML-16 MK2 | |
| Asus TUF Gaming A16 FA617XS | |
| Ortalama Intel Core Ultra 7 155H (10017 - 13556, n=52) | |
| Lenovo Legion Slim 7 16APH8 | |
| HP Victus 16-r0077ng | |
| MSI Stealth 16 Mercedes-AMG Motorsport A13VG | |
| CSL GameStar Notebook VenomGamer G16 | |
| HP Omen 16-n0033dx | |
| Acer Nitro 16 AN16-41-R7YE | |
| Geekbench 5.5 / Single-Core | |
| Razer Blade 16 2024, RTX 4090 | |
| Asus ROG Zephyrus G16 GA605WV | |
| Asus TUF Gaming A16 FA617XS | |
| MSI Stealth 16 Mercedes-AMG Motorsport A13VG | |
| Lenovo Legion Slim 7 16APH8 | |
| Dell Inspiron 16 Plus 7630 | |
| Ortalama Intel Core Ultra 7 155H (1462 - 1824, n=52) | |
| HP Victus 16 (2024) | |
| Alienware x16 R2 P120F | |
| HP Victus 16-r0076TX | |
| HP Victus 16-r0077ng | |
| Maingear ML-16 MK2 | |
| CSL GameStar Notebook VenomGamer G16 | |
| HP Omen 16-n0033dx | |
| Acer Nitro 16 AN16-41-R7YE | |
| HWBOT x265 Benchmark v2.2 / 4k Preset | |
| Razer Blade 16 2024, RTX 4090 | |
| Asus ROG Zephyrus G16 GA605WV | |
| HP Victus 16 (2024) | |
| Asus TUF Gaming A16 FA617XS | |
| Alienware x16 R2 P120F | |
| HP Victus 16-r0076TX | |
| Lenovo Legion Slim 7 16APH8 | |
| CSL GameStar Notebook VenomGamer G16 | |
| Maingear ML-16 MK2 | |
| HP Victus 16-r0077ng | |
| Ortalama Intel Core Ultra 7 155H (9.93 - 21.2, n=50) | |
| HP Omen 16-n0033dx | |
| Dell Inspiron 16 Plus 7630 | |
| MSI Stealth 16 Mercedes-AMG Motorsport A13VG | |
| Acer Nitro 16 AN16-41-R7YE | |
| LibreOffice / 20 Documents To PDF | |
| Lenovo Legion Slim 7 16APH8 | |
| CSL GameStar Notebook VenomGamer G16 | |
| HP Victus 16-r0077ng | |
| HP Omen 16-n0033dx | |
| MSI Stealth 16 Mercedes-AMG Motorsport A13VG | |
| HP Victus 16 (2024) | |
| Asus ROG Zephyrus G16 GA605WV | |
| Ortalama Intel Core Ultra 7 155H (37.5 - 79.2, n=49) | |
| Razer Blade 16 2024, RTX 4090 | |
| Acer Nitro 16 AN16-41-R7YE | |
| Alienware x16 R2 P120F | |
| Dell Inspiron 16 Plus 7630 | |
| Maingear ML-16 MK2 | |
| Asus TUF Gaming A16 FA617XS | |
| R Benchmark 2.5 / Overall mean | |
| Maingear ML-16 MK2 | |
| HP Victus 16-r0077ng | |
| Acer Nitro 16 AN16-41-R7YE | |
| Alienware x16 R2 P120F | |
| HP Omen 16-n0033dx | |
| HP Victus 16 (2024) | |
| HP Victus 16-r0076TX | |
| CSL GameStar Notebook VenomGamer G16 | |
| Ortalama Intel Core Ultra 7 155H (0.4457 - 0.53, n=49) | |
| Lenovo Legion Slim 7 16APH8 | |
| Dell Inspiron 16 Plus 7630 | |
| MSI Stealth 16 Mercedes-AMG Motorsport A13VG | |
| Asus TUF Gaming A16 FA617XS | |
| Asus ROG Zephyrus G16 GA605WV | |
| Razer Blade 16 2024, RTX 4090 | |
Cinebench R23: Multi Core | Single Core
Cinebench R20: CPU (Multi Core) | CPU (Single Core)
Cinebench R15: CPU Multi 64Bit | CPU Single 64Bit
Blender: v2.79 BMW27 CPU
7-Zip 18.03: 7z b 4 | 7z b 4 -mmt1
Geekbench 6.4: Multi-Core | Single-Core
Geekbench 5.5: Multi-Core | Single-Core
HWBOT x265 Benchmark v2.2: 4k Preset
LibreOffice : 20 Documents To PDF
R Benchmark 2.5: Overall mean
* ... daha küçük daha iyidir
AIDA64: FP32 Ray-Trace | FPU Julia | CPU SHA3 | CPU Queen | FPU SinJulia | FPU Mandel | CPU AES | CPU ZLib | FP64 Ray-Trace | CPU PhotoWorxx
| Performance Rating | |
| Asus ROG Zephyrus G16 GA605WV | |
| Razer Blade 16 2024, RTX 4090 | |
| Lenovo Legion Pro 5 16IRX9 | |
| Alienware x16 R2 P120F | |
| HP Victus 16 (2024) | |
| Maingear ML-16 MK2 | |
| Ortalama Intel Core Ultra 7 155H | |
| AIDA64 / FP32 Ray-Trace | |
| Asus ROG Zephyrus G16 GA605WV | |
| Razer Blade 16 2024, RTX 4090 | |
| Lenovo Legion Pro 5 16IRX9 | |
| Alienware x16 R2 P120F | |
| HP Victus 16 (2024) | |
| Maingear ML-16 MK2 | |
| Ortalama Intel Core Ultra 7 155H (6670 - 18470, n=50) | |
| AIDA64 / FPU Julia | |
| Asus ROG Zephyrus G16 GA605WV | |
| Lenovo Legion Pro 5 16IRX9 | |
| Razer Blade 16 2024, RTX 4090 | |
| Alienware x16 R2 P120F | |
| HP Victus 16 (2024) | |
| Maingear ML-16 MK2 | |
| Ortalama Intel Core Ultra 7 155H (40905 - 93181, n=50) | |
| AIDA64 / CPU SHA3 | |
| Lenovo Legion Pro 5 16IRX9 | |
| Razer Blade 16 2024, RTX 4090 | |
| Asus ROG Zephyrus G16 GA605WV | |
| Alienware x16 R2 P120F | |
| HP Victus 16 (2024) | |
| Maingear ML-16 MK2 | |
| Ortalama Intel Core Ultra 7 155H (1940 - 4436, n=50) | |
| AIDA64 / CPU Queen | |
| Lenovo Legion Pro 5 16IRX9 | |
| Razer Blade 16 2024, RTX 4090 | |
| HP Victus 16 (2024) | |
| Alienware x16 R2 P120F | |
| Asus ROG Zephyrus G16 GA605WV | |
| Maingear ML-16 MK2 | |
| Ortalama Intel Core Ultra 7 155H (64698 - 94181, n=50) | |
| AIDA64 / FPU SinJulia | |
| Asus ROG Zephyrus G16 GA605WV | |
| Razer Blade 16 2024, RTX 4090 | |
| Lenovo Legion Pro 5 16IRX9 | |
| HP Victus 16 (2024) | |
| Alienware x16 R2 P120F | |
| Maingear ML-16 MK2 | |
| Ortalama Intel Core Ultra 7 155H (5639 - 10647, n=50) | |
| AIDA64 / FPU Mandel | |
| Asus ROG Zephyrus G16 GA605WV | |
| Razer Blade 16 2024, RTX 4090 | |
| Lenovo Legion Pro 5 16IRX9 | |
| Alienware x16 R2 P120F | |
| HP Victus 16 (2024) | |
| Maingear ML-16 MK2 | |
| Ortalama Intel Core Ultra 7 155H (18236 - 47685, n=50) | |
| AIDA64 / CPU AES | |
| Maingear ML-16 MK2 | |
| Razer Blade 16 2024, RTX 4090 | |
| Lenovo Legion Pro 5 16IRX9 | |
| Alienware x16 R2 P120F | |
| HP Victus 16 (2024) | |
| Asus ROG Zephyrus G16 GA605WV | |
| Ortalama Intel Core Ultra 7 155H (45713 - 152179, n=50) | |
| AIDA64 / CPU ZLib | |
| Lenovo Legion Pro 5 16IRX9 | |
| Razer Blade 16 2024, RTX 4090 | |
| Asus ROG Zephyrus G16 GA605WV | |
| Alienware x16 R2 P120F | |
| Maingear ML-16 MK2 | |
| HP Victus 16 (2024) | |
| Ortalama Intel Core Ultra 7 155H (557 - 1250, n=50) | |
| AIDA64 / FP64 Ray-Trace | |
| Asus ROG Zephyrus G16 GA605WV | |
| Razer Blade 16 2024, RTX 4090 | |
| Lenovo Legion Pro 5 16IRX9 | |
| Alienware x16 R2 P120F | |
| HP Victus 16 (2024) | |
| Maingear ML-16 MK2 | |
| Ortalama Intel Core Ultra 7 155H (3569 - 9802, n=50) | |
| AIDA64 / CPU PhotoWorxx | |
| Alienware x16 R2 P120F | |
| Lenovo Legion Pro 5 16IRX9 | |
| Razer Blade 16 2024, RTX 4090 | |
| Asus ROG Zephyrus G16 GA605WV | |
| Ortalama Intel Core Ultra 7 155H (32719 - 54223, n=50) | |
| HP Victus 16 (2024) | |
| Maingear ML-16 MK2 | |
Stres Testi
Prime95 stresini başlatırken CPU 3,2 GHz, 100 C ve 85 W'a yükselir. Ancak birkaç saniye sonra CPU 2,6 GHz ve 69 W'a düşüyor ve sonunda 2,1 GHz ve 57 W'ta sabitleniyordu. Çekirdek sıcaklığı, HWiNFO'ya göre tespit edilen termal kısma ile 73 C ile 100 C arasında değişiyordu. Bu yüksek çekirdek sıcaklıkları Razer Blade 16 benzer koşullar altında ve çok sıcak yüzey sıcaklıklarından da sorumludurlar.
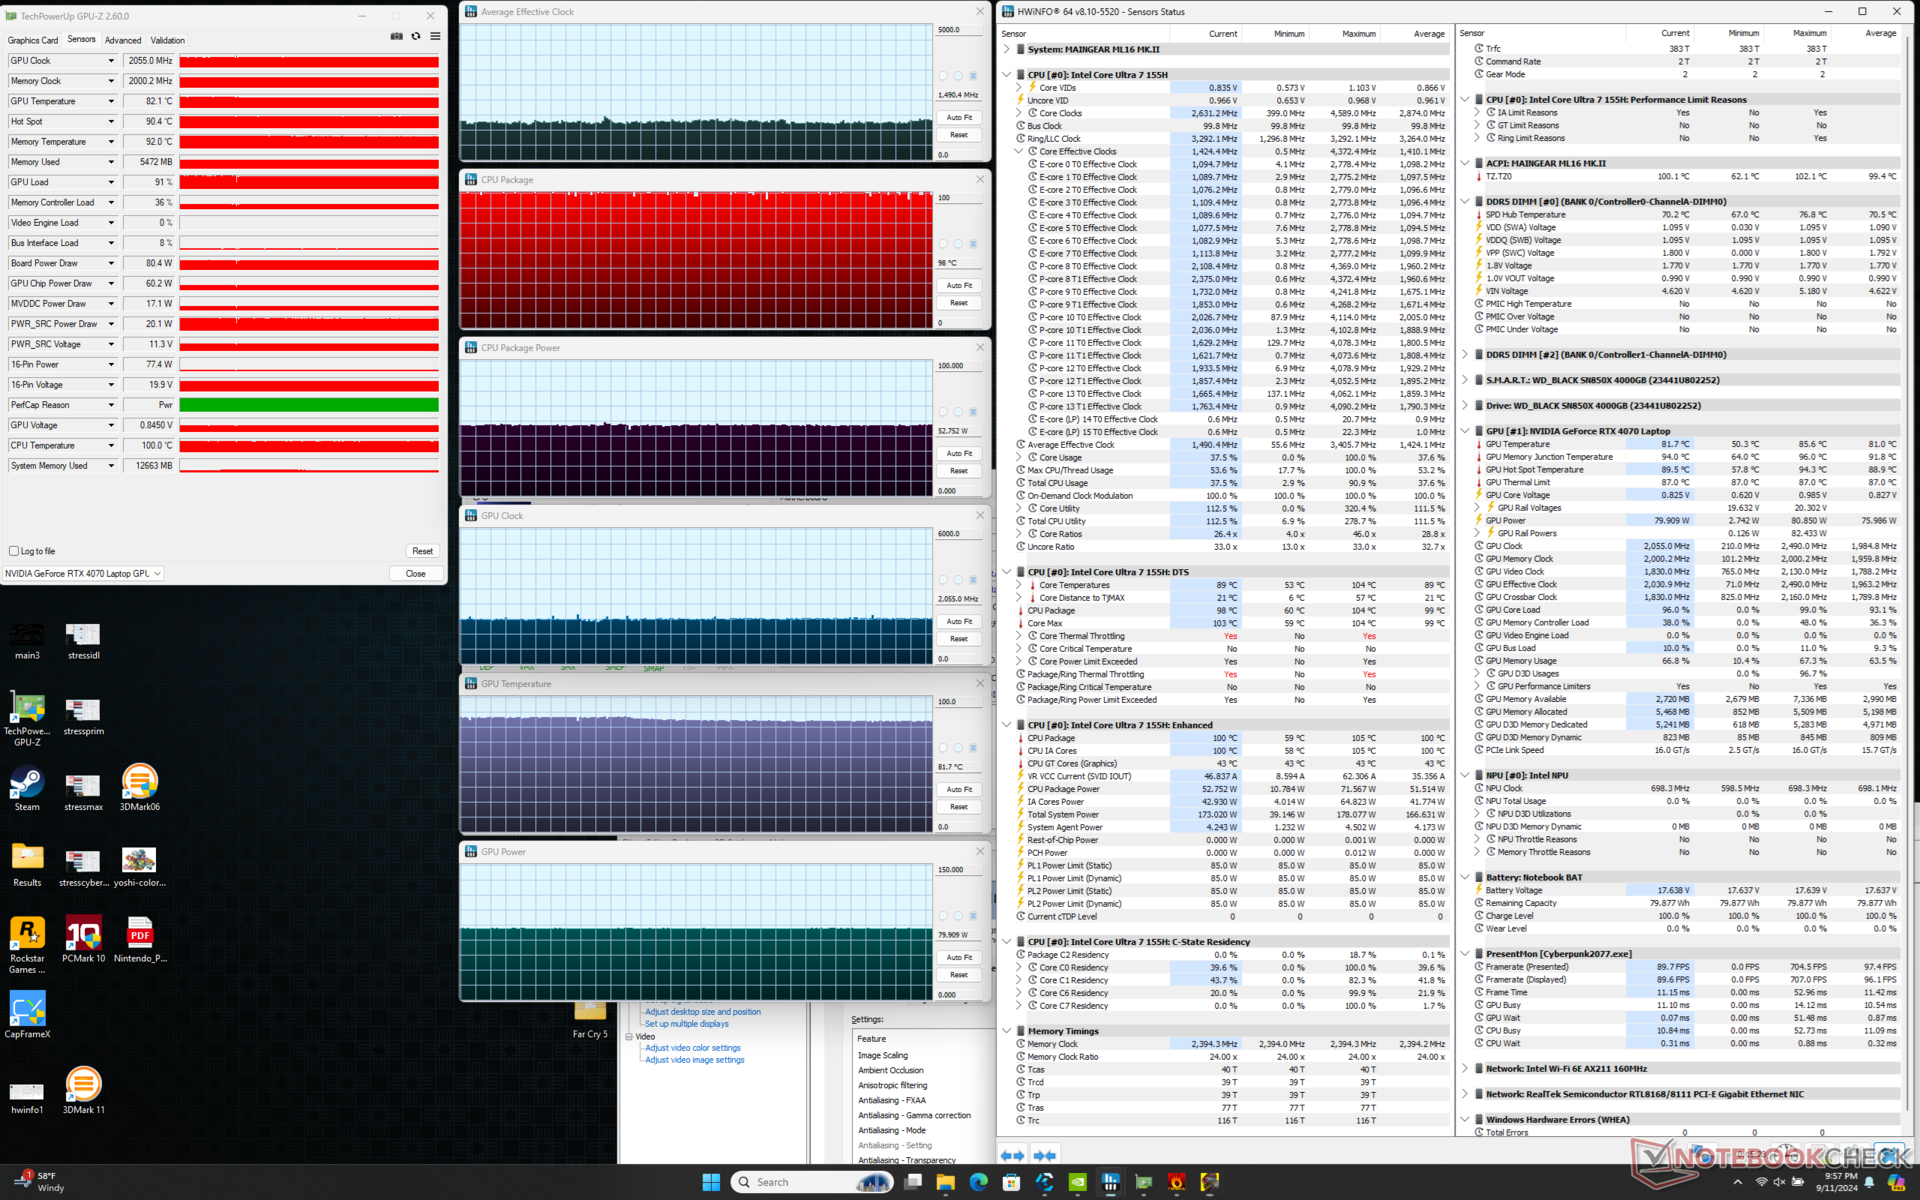
Cyberpunk 2077 'yi Performans modunda çalıştırırken GPU, daha sessiz Dengeli modda 2010 MHz, 80 C ve 74 W değerlerine kıyasla 2160 MHz, 85 C ve 80 W değerlerinde stabilize olur. Eğer oyununuz CPU ağırlıklı değilse, GPU çok fazla etkilenmediği için Dengeli modda çalıştırmak tercih edilebilir. Nvidia Kontrol Paneli'nin 105 W'lık bir TGP listelediğini, ancak GPU-Z'ye göre oyun oynarken yalnızca maksimum 80 W'a ulaşabildiğimizi unutmayın.
Oyun oynarken genel çekirdek sıcaklıkları Blade 16 gibi alternatiflerden çok daha yüksek. CPU ve GPU'muz, Razer'daki 78 C ve 75 C'ye kıyasla sırasıyla 101 C ve 85 C'de stabilize olur. Maksimum fan modunu etkinleştirmek, performansı artırmadan çekirdek sıcaklıklarını yalnızca birkaç C derece azaltacaktır.
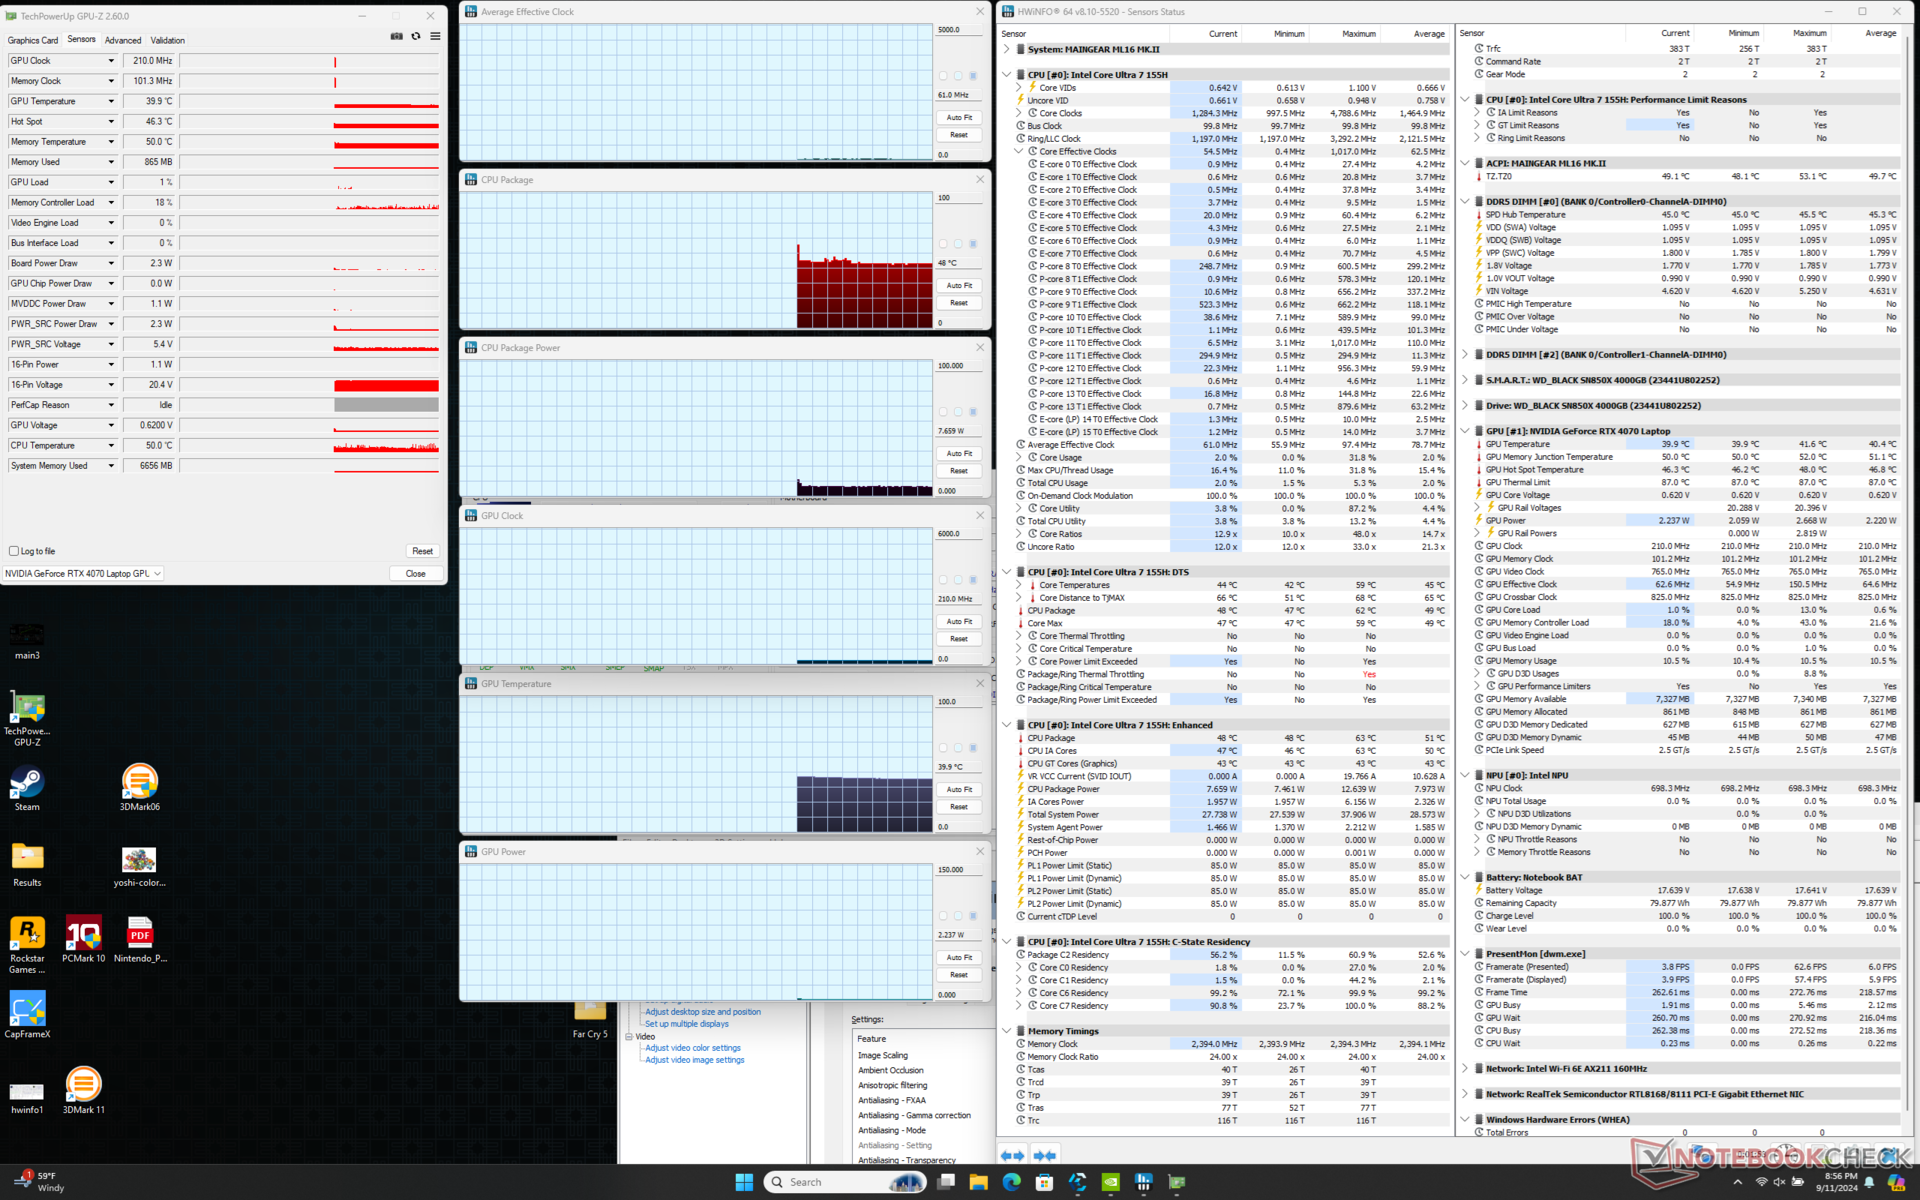
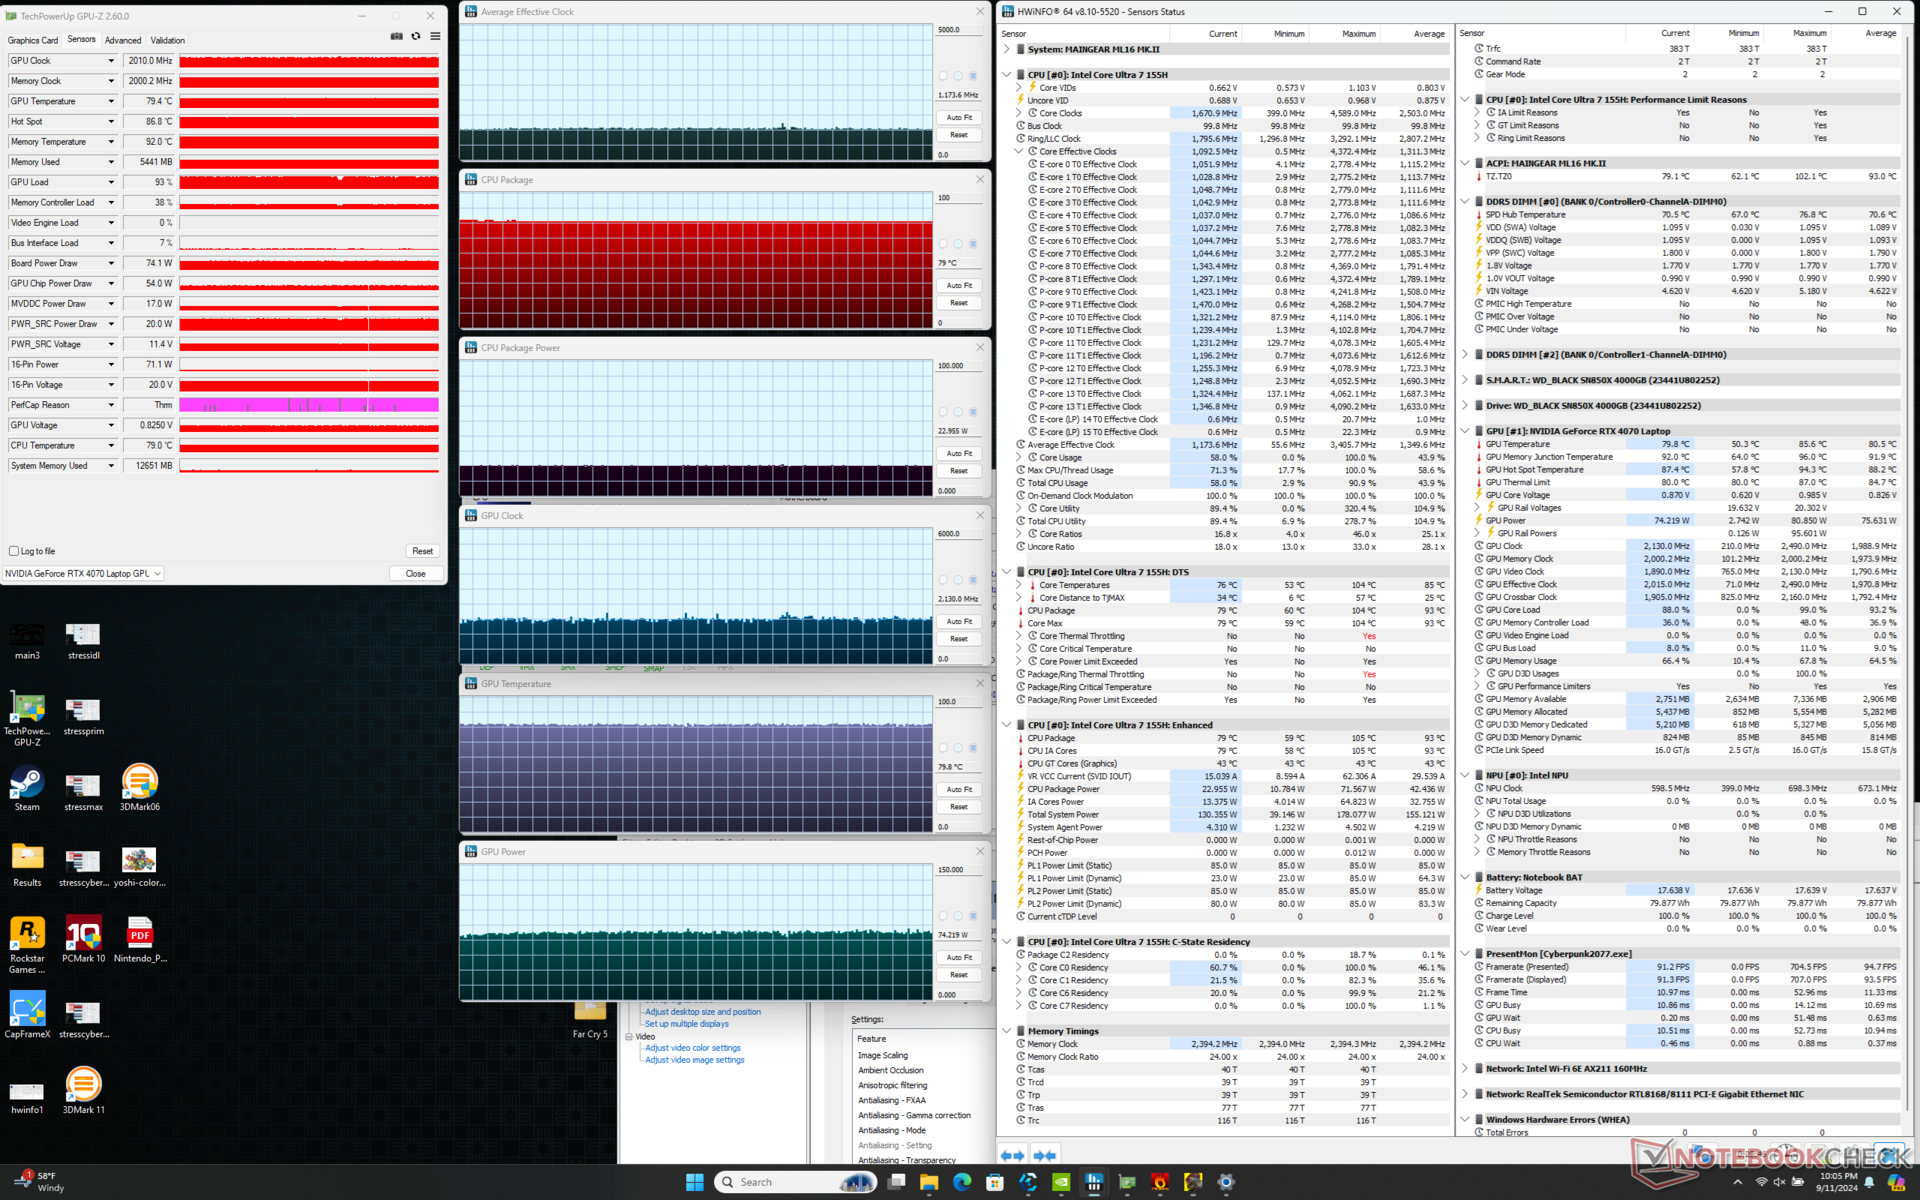
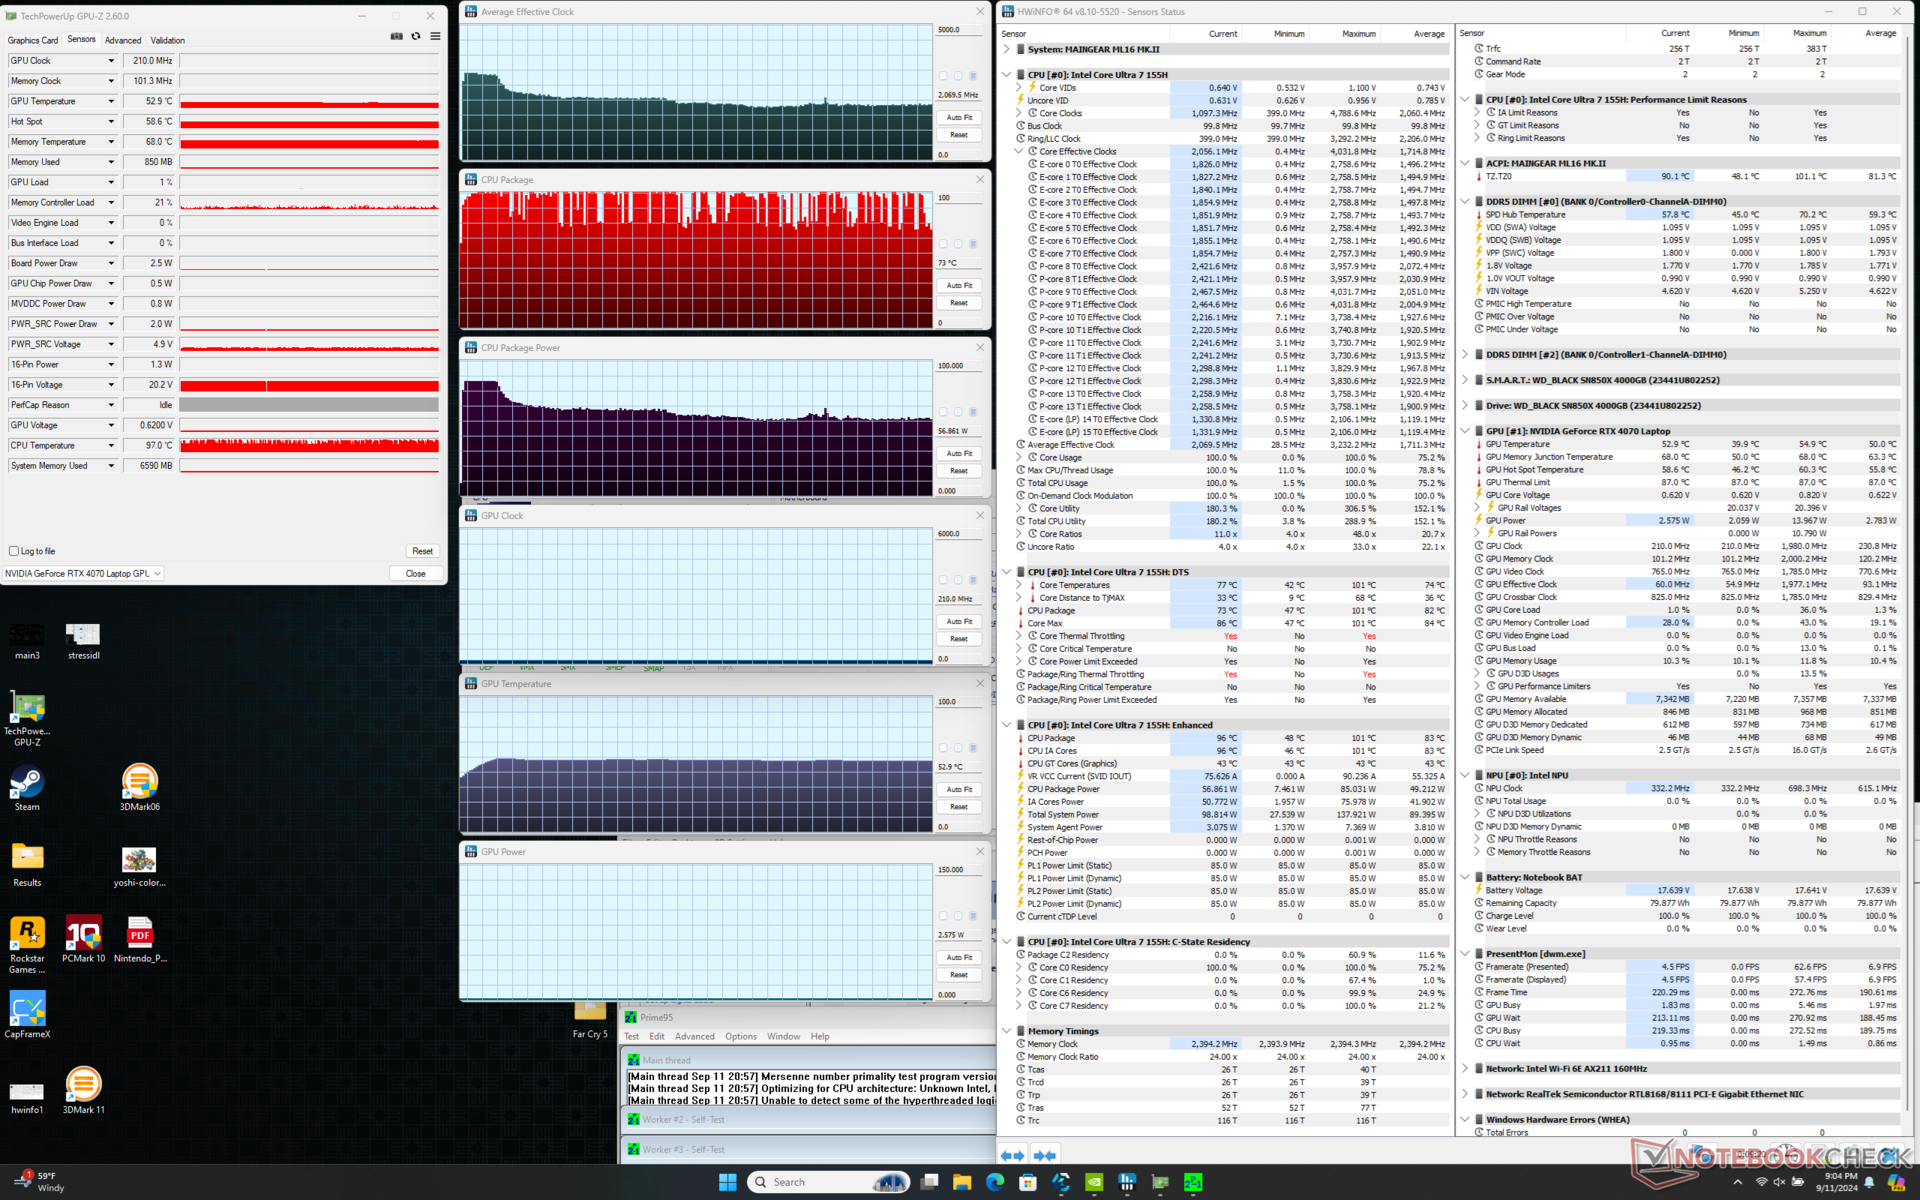

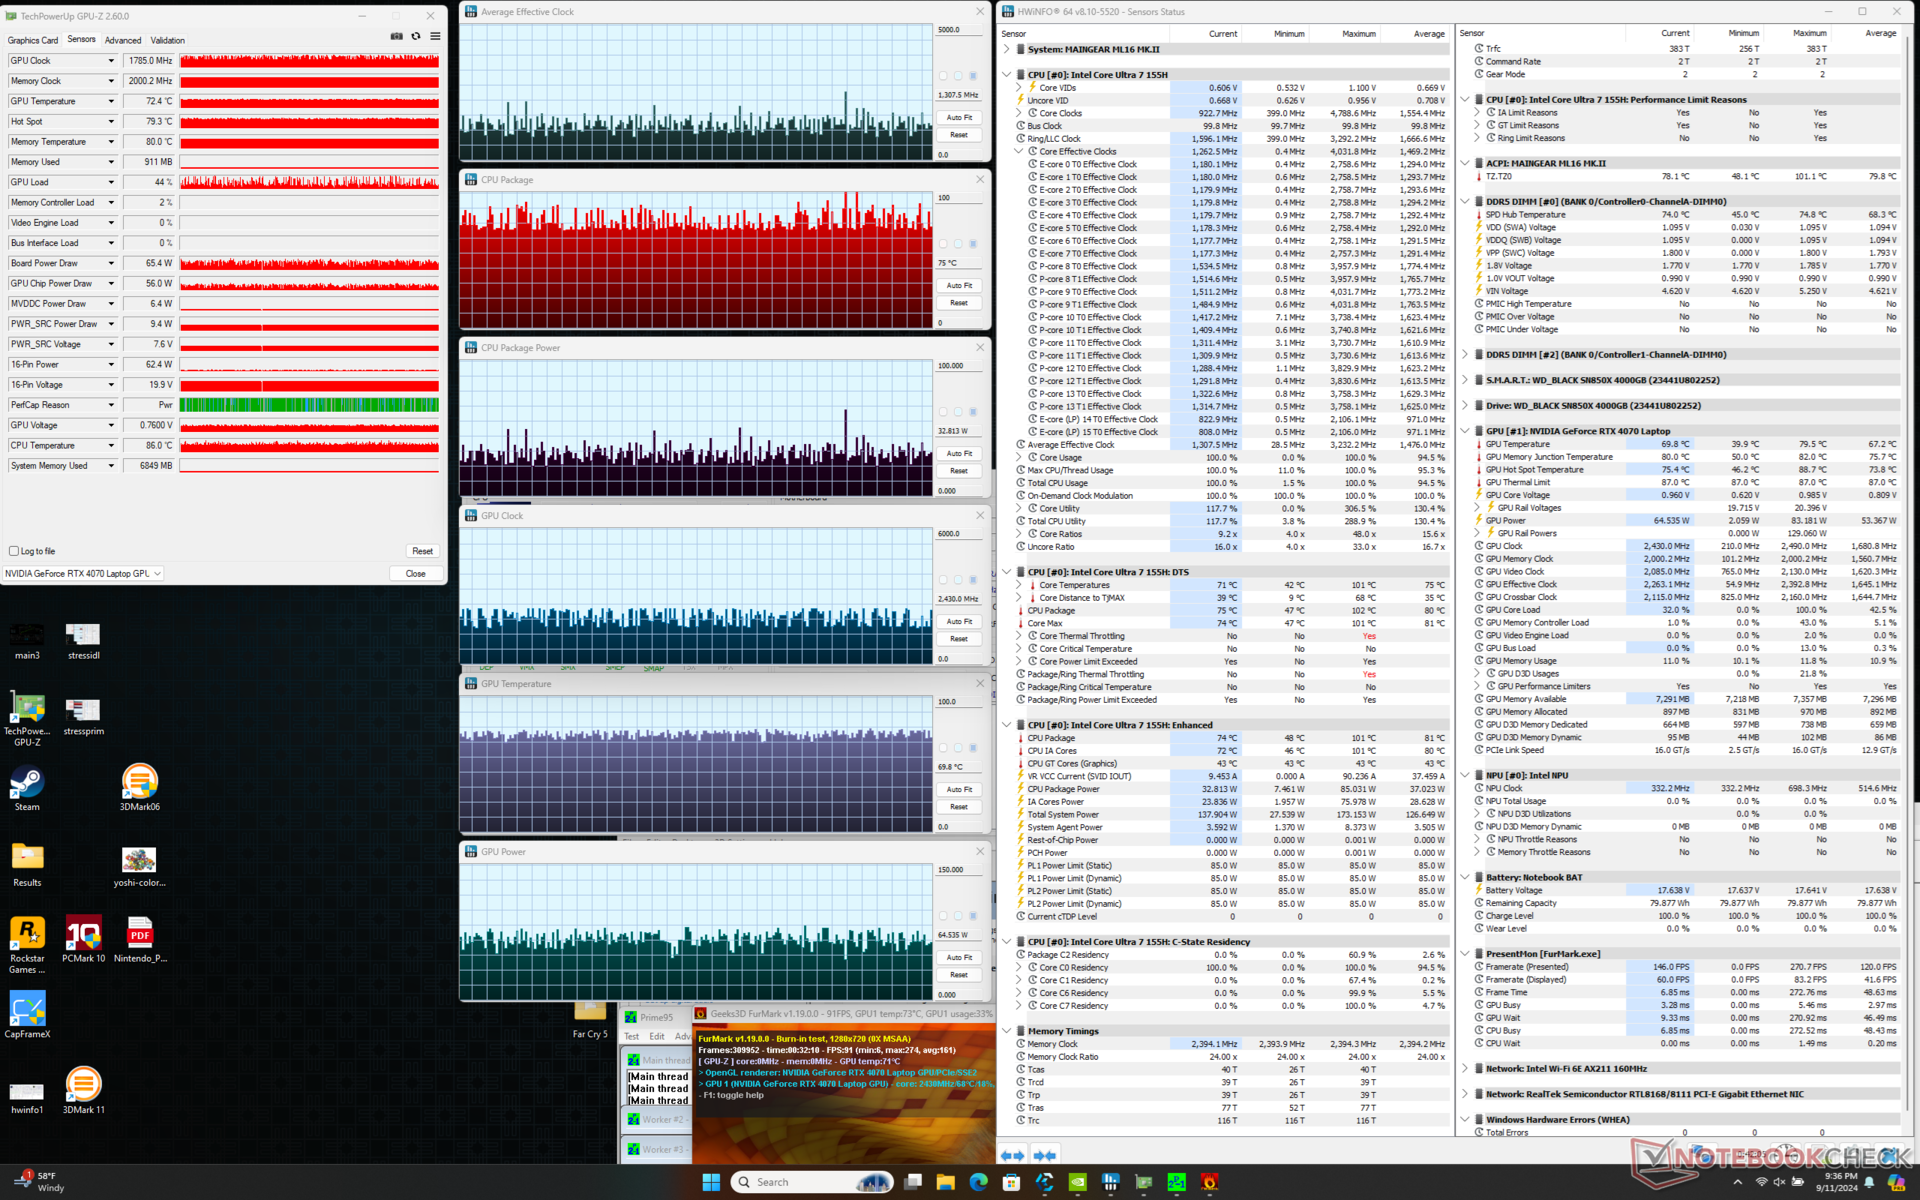
| Ortalama CPU Saati (GHz) | GPU Saati (MHz) | Ortalama CPU Sıcaklığı (°C) | Ortalama GPU Sıcaklığı (°C) | |
| Sistem Boşta | -- | -- | 48 | 40 |
| Prime95 Stres | 2.1 | -- | 73 - 101 | 53 |
| Prime95 + FurMark Stres | 1.1 - 1.4 | ~1785 | 75 - 95 | ~70 |
| Cyberpunk 2077 Stres (Dengeli mod) | 1.2 | 2010 | 79 | 80 |
| Cyberpunk 2077 Stres (Maksimum fan kapalıyken performans modu) | 1.4 | 2160 | 101 | 85 |
| Cyberpunk 2077 Stres (Maksimum fan açıkken performans modu) | 1.5 | 2055 | 98 | 82 |
Sistem Performansı
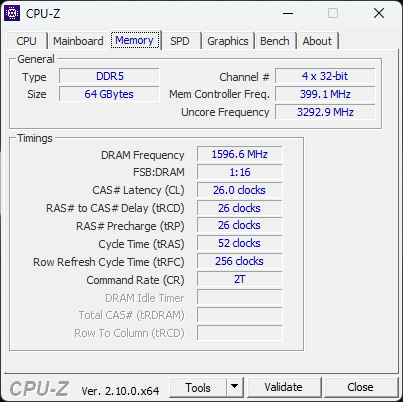
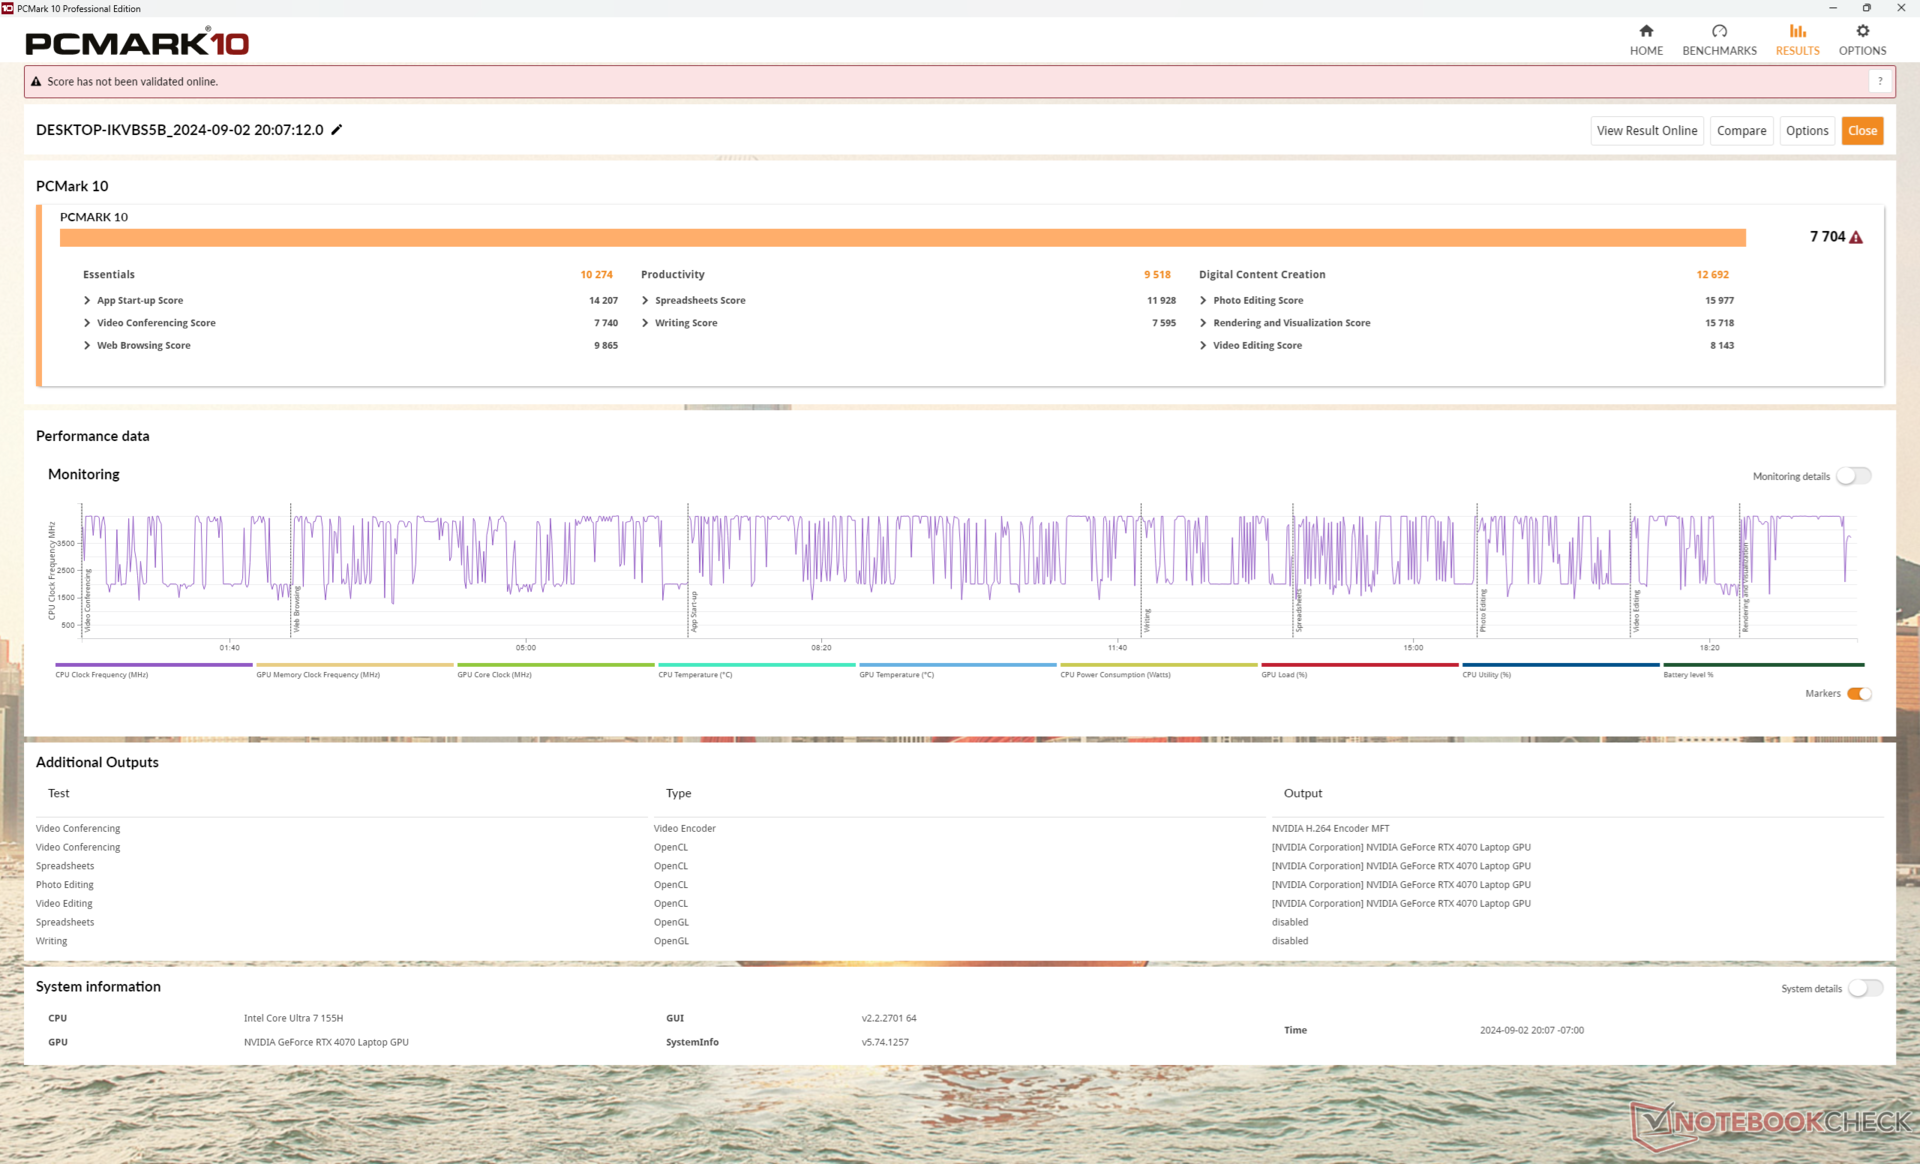
PCMark skorları HP Victus 16 veya Asus ROG Zephyrus G16 teknik özellik farklılıklarına rağmen çoğu günlük görevin Maingear'da önemli ölçüde daha hızlı veya daha yavaş çalışmadığını göstermek için. Ancak, CrossMark ve AIDA64 bellek sonuçları, nispeten daha yavaş ham CPU performansımız ve DDR5-4800 RAM'imiz nedeniyle beklenenden daha düşük. Blade 16 veya Alienware m16 R2 gibi rakipler sırasıyla daha hızlı DDR5-5600 veya LPDDR5-7467 ile geliyor.
CrossMark: Overall | Productivity | Creativity | Responsiveness
WebXPRT 3: Overall
WebXPRT 4: Overall
Mozilla Kraken 1.1: Total
| PCMark 10 / Score | |
| Lenovo Legion Pro 5 16IRX9 | |
| Razer Blade 16 2024, RTX 4090 | |
| Asus ROG Zephyrus G16 GA605WV | |
| Maingear ML-16 MK2 | |
| HP Victus 16 (2024) | |
| Ortalama Intel Core Ultra 7 155H, NVIDIA GeForce RTX 4070 Laptop GPU (7084 - 7761, n=4) | |
| Alienware x16 R2 P120F | |
| PCMark 10 / Essentials | |
| Lenovo Legion Pro 5 16IRX9 | |
| Razer Blade 16 2024, RTX 4090 | |
| HP Victus 16 (2024) | |
| Maingear ML-16 MK2 | |
| Ortalama Intel Core Ultra 7 155H, NVIDIA GeForce RTX 4070 Laptop GPU (10038 - 10393, n=4) | |
| Asus ROG Zephyrus G16 GA605WV | |
| Alienware x16 R2 P120F | |
| PCMark 10 / Productivity | |
| Razer Blade 16 2024, RTX 4090 | |
| Lenovo Legion Pro 5 16IRX9 | |
| Asus ROG Zephyrus G16 GA605WV | |
| HP Victus 16 (2024) | |
| Maingear ML-16 MK2 | |
| Ortalama Intel Core Ultra 7 155H, NVIDIA GeForce RTX 4070 Laptop GPU (9192 - 9518, n=4) | |
| Alienware x16 R2 P120F | |
| PCMark 10 / Digital Content Creation | |
| Lenovo Legion Pro 5 16IRX9 | |
| Asus ROG Zephyrus G16 GA605WV | |
| Razer Blade 16 2024, RTX 4090 | |
| Alienware x16 R2 P120F | |
| Maingear ML-16 MK2 | |
| Ortalama Intel Core Ultra 7 155H, NVIDIA GeForce RTX 4070 Laptop GPU (10100 - 13035, n=4) | |
| HP Victus 16 (2024) | |
| CrossMark / Overall | |
| Razer Blade 16 2024, RTX 4090 | |
| Lenovo Legion Pro 5 16IRX9 | |
| HP Victus 16 (2024) | |
| Asus ROG Zephyrus G16 GA605WV | |
| Ortalama Intel Core Ultra 7 155H, NVIDIA GeForce RTX 4070 Laptop GPU (1687 - 1848, n=4) | |
| Maingear ML-16 MK2 | |
| Alienware x16 R2 P120F | |
| CrossMark / Productivity | |
| Razer Blade 16 2024, RTX 4090 | |
| Lenovo Legion Pro 5 16IRX9 | |
| HP Victus 16 (2024) | |
| Ortalama Intel Core Ultra 7 155H, NVIDIA GeForce RTX 4070 Laptop GPU (1589 - 1750, n=4) | |
| Asus ROG Zephyrus G16 GA605WV | |
| Maingear ML-16 MK2 | |
| Alienware x16 R2 P120F | |
| CrossMark / Creativity | |
| Razer Blade 16 2024, RTX 4090 | |
| Lenovo Legion Pro 5 16IRX9 | |
| Asus ROG Zephyrus G16 GA605WV | |
| HP Victus 16 (2024) | |
| Ortalama Intel Core Ultra 7 155H, NVIDIA GeForce RTX 4070 Laptop GPU (1860 - 2014, n=4) | |
| Maingear ML-16 MK2 | |
| Alienware x16 R2 P120F | |
| CrossMark / Responsiveness | |
| Razer Blade 16 2024, RTX 4090 | |
| HP Victus 16 (2024) | |
| Lenovo Legion Pro 5 16IRX9 | |
| Alienware x16 R2 P120F | |
| Ortalama Intel Core Ultra 7 155H, NVIDIA GeForce RTX 4070 Laptop GPU (1424 - 1683, n=4) | |
| Maingear ML-16 MK2 | |
| Asus ROG Zephyrus G16 GA605WV | |
| WebXPRT 3 / Overall | |
| Razer Blade 16 2024, RTX 4090 | |
| Lenovo Legion Pro 5 16IRX9 | |
| Ortalama Intel Core Ultra 7 155H, NVIDIA GeForce RTX 4070 Laptop GPU (264 - 294, n=4) | |
| HP Victus 16 (2024) | |
| Maingear ML-16 MK2 | |
| Alienware x16 R2 P120F | |
| WebXPRT 4 / Overall | |
| Lenovo Legion Pro 5 16IRX9 | |
| Asus ROG Zephyrus G16 GA605WV | |
| Ortalama Intel Core Ultra 7 155H, NVIDIA GeForce RTX 4070 Laptop GPU (247 - 257, n=4) | |
| HP Victus 16 (2024) | |
| Maingear ML-16 MK2 | |
| Alienware x16 R2 P120F | |
| Mozilla Kraken 1.1 / Total | |
| Alienware x16 R2 P120F | |
| Maingear ML-16 MK2 | |
| Ortalama Intel Core Ultra 7 155H, NVIDIA GeForce RTX 4070 Laptop GPU (546 - 568, n=3) | |
| HP Victus 16 (2024) | |
| Razer Blade 16 2024, RTX 4090 | |
| Lenovo Legion Pro 5 16IRX9 | |
| Asus ROG Zephyrus G16 GA605WV | |
* ... daha küçük daha iyidir
| PCMark 10 Score | 7704 puan | |
Yardım | ||
| AIDA64 / Memory Copy | |
| Alienware x16 R2 P120F | |
| Asus ROG Zephyrus G16 GA605WV | |
| Ortalama Intel Core Ultra 7 155H (62397 - 96791, n=50) | |
| Lenovo Legion Pro 5 16IRX9 | |
| Razer Blade 16 2024, RTX 4090 | |
| HP Victus 16 (2024) | |
| Maingear ML-16 MK2 | |
| AIDA64 / Memory Read | |
| Asus ROG Zephyrus G16 GA605WV | |
| Razer Blade 16 2024, RTX 4090 | |
| Lenovo Legion Pro 5 16IRX9 | |
| Alienware x16 R2 P120F | |
| HP Victus 16 (2024) | |
| Ortalama Intel Core Ultra 7 155H (60544 - 90647, n=50) | |
| Maingear ML-16 MK2 | |
| AIDA64 / Memory Write | |
| Asus ROG Zephyrus G16 GA605WV | |
| Lenovo Legion Pro 5 16IRX9 | |
| Razer Blade 16 2024, RTX 4090 | |
| Alienware x16 R2 P120F | |
| Ortalama Intel Core Ultra 7 155H (58692 - 93451, n=50) | |
| HP Victus 16 (2024) | |
| Maingear ML-16 MK2 | |
| AIDA64 / Memory Latency | |
| Maingear ML-16 MK2 | |
| Ortalama Intel Core Ultra 7 155H (116.2 - 233, n=50) | |
| Alienware x16 R2 P120F | |
| Asus ROG Zephyrus G16 GA605WV | |
| HP Victus 16 (2024) | |
| Razer Blade 16 2024, RTX 4090 | |
| Lenovo Legion Pro 5 16IRX9 | |
* ... daha küçük daha iyidir
DPC Gecikme Süresi
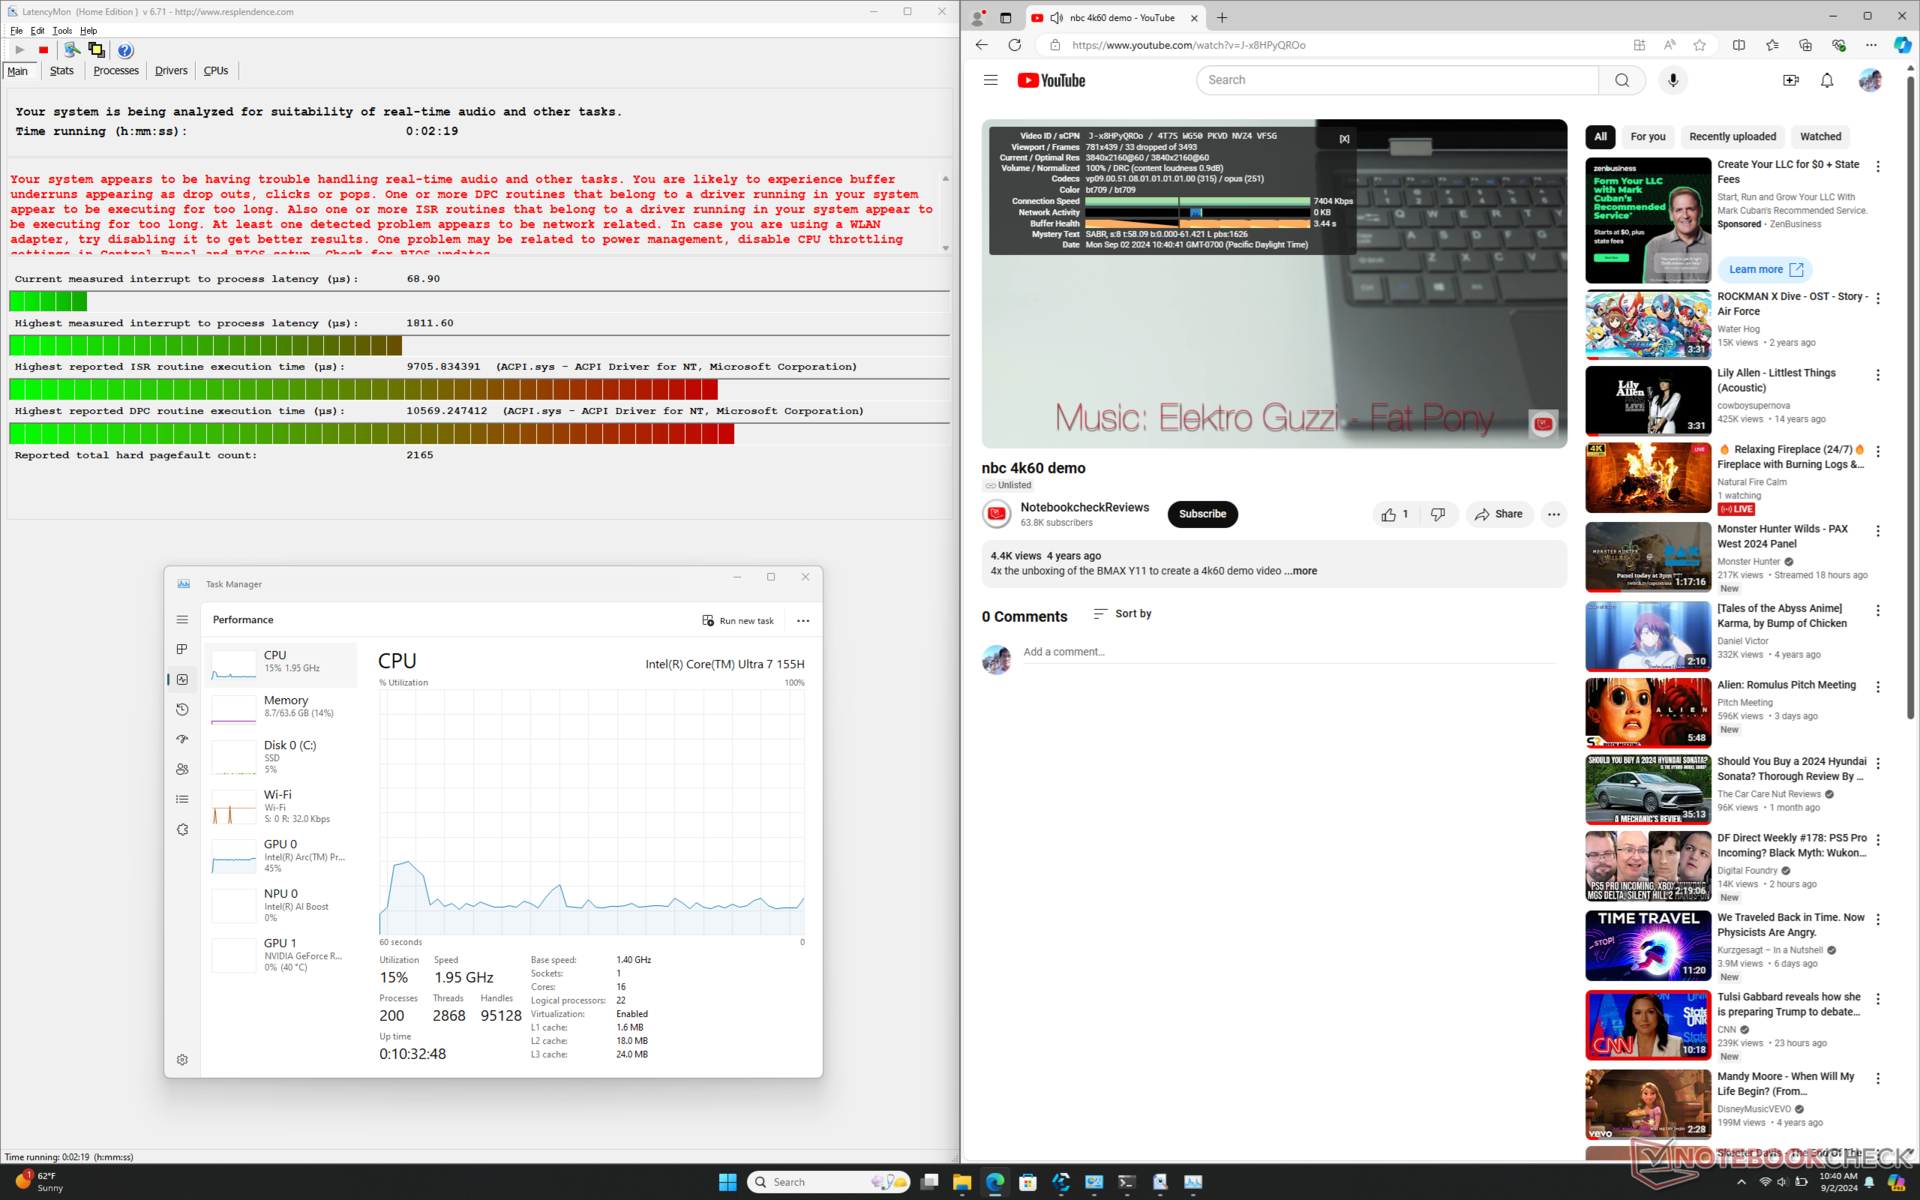
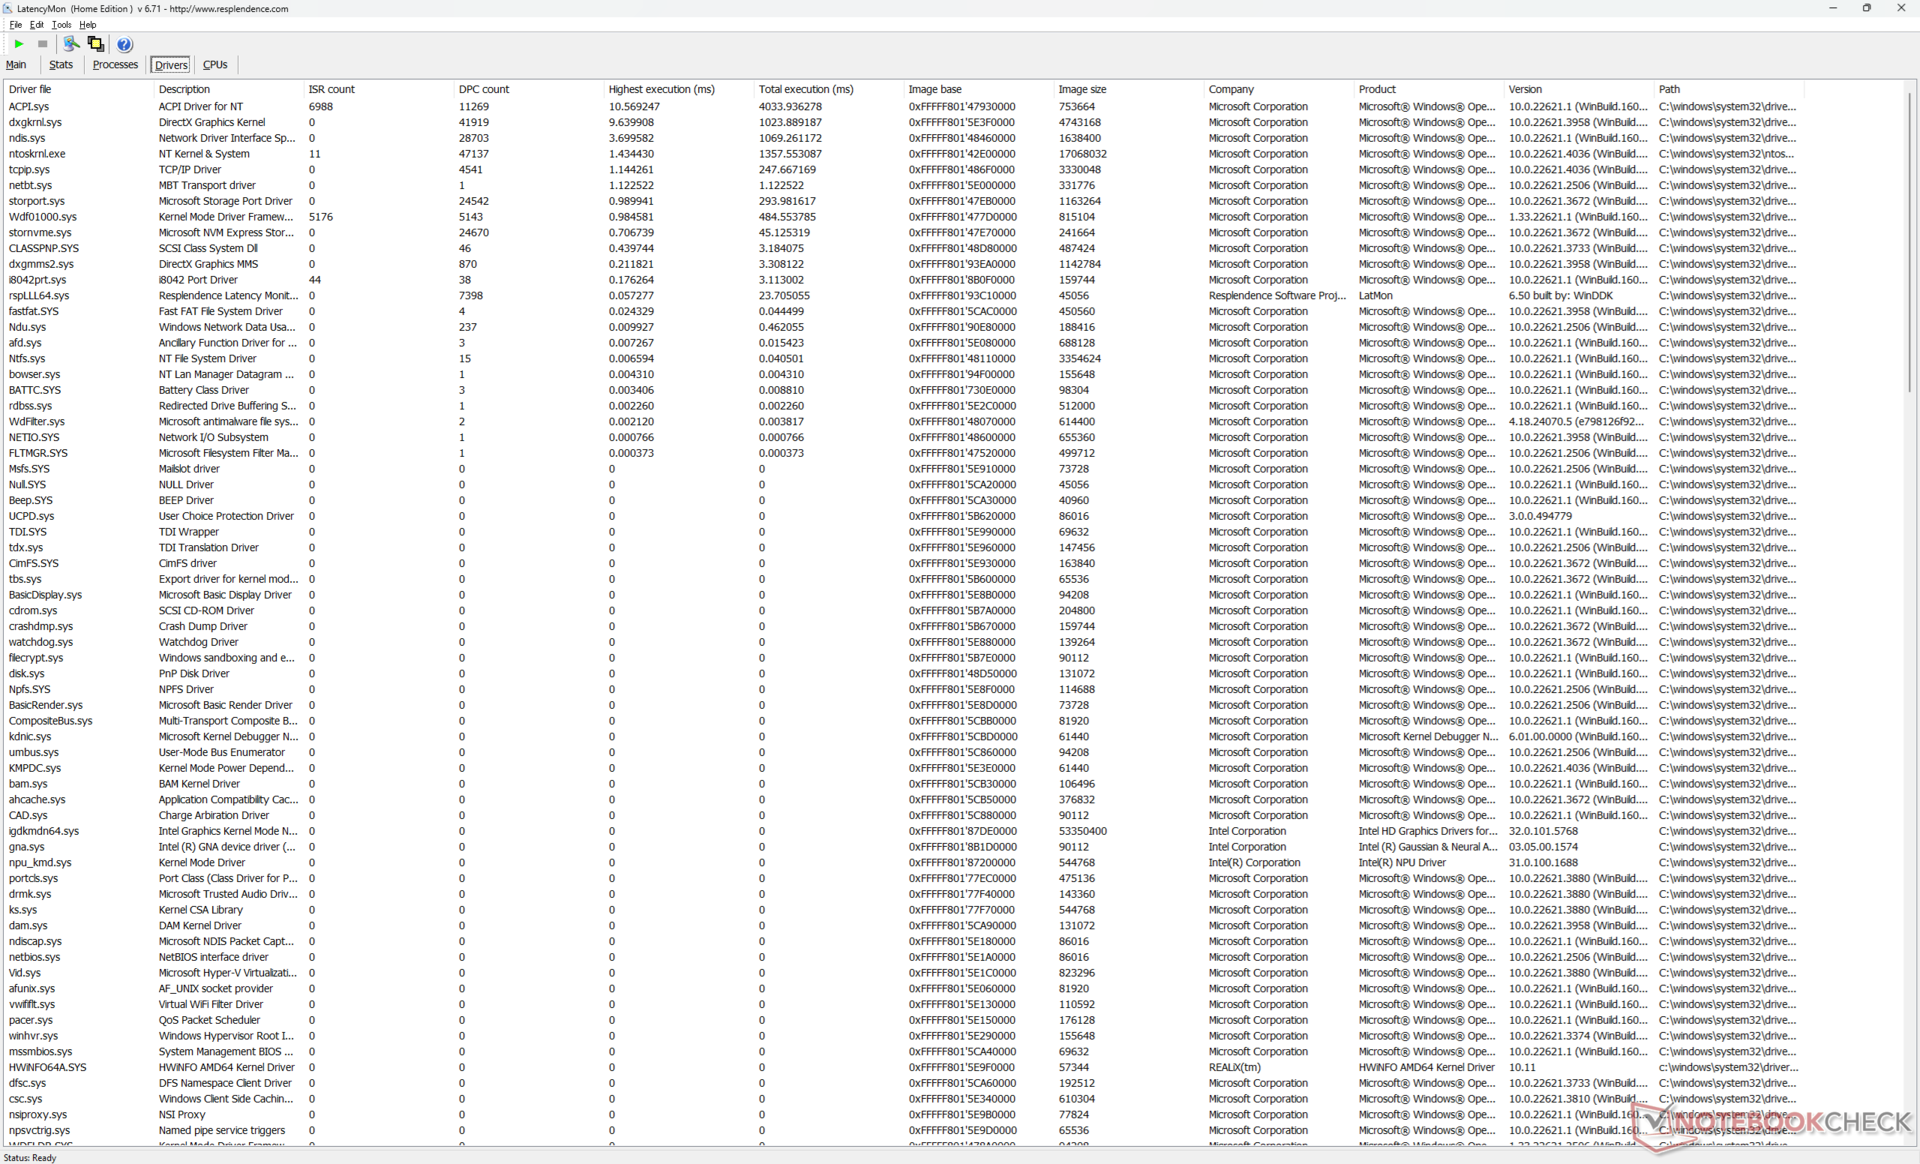
LatencyMon, MSHybrid modundayken bile ACPI sürücüleriyle ilgili beklenenden daha büyük DPC sorunları olduğunu ortaya koyuyor. Ayrıca, 60 saniyelik bir 4K60 test videosunda, özellikle de içindeki Meteor Lake-H CPU göz önüne alındığında sıfır olması gerekirken 33 kare düşmesi kaydedebildik. Bu düşen kareler, 4K video akışı sırasında takılma olarak ortaya çıkıyor ve altta yatan bir sürücü sorununa veya ana pencereyi kesintiye uğratabilecek arka plan etkinliklerinin kötü yönetimine işaret ediyor.
| DPC Latencies / LatencyMon - interrupt to process latency (max), Web, Youtube, Prime95 | |
| Alienware x16 R2 P120F | |
| Maingear ML-16 MK2 | |
| Razer Blade 16 2024, RTX 4090 | |
| Lenovo Legion Pro 5 16IRX9 | |
| HP Victus 16 (2024) | |
| Asus ROG Zephyrus G16 GA605WV | |
* ... daha küçük daha iyidir
Depolama Cihazları
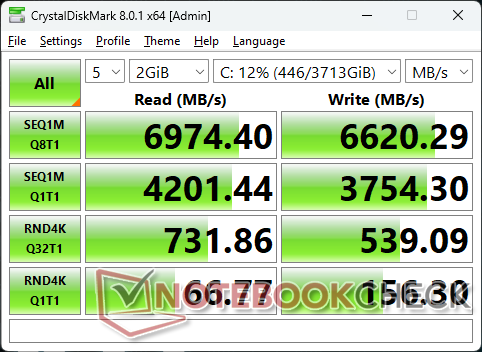
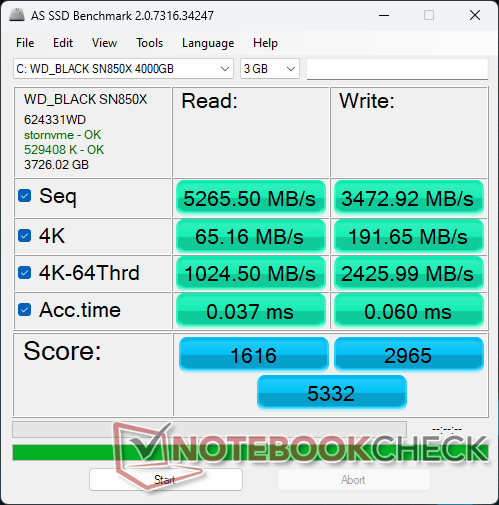
Maingear, aşağıdakilerle birlikte gönderilen birkaç sistemden biridir 4 TB WD Black SN850X PCIe4 x4 NVMe seçenekleri. Aktarım hızları yaklaşık 7000 MB/sn ile mükemmeldir ve stres altındayken herhangi bir yavaşlama tespit edilmemiştir. Isıyı dağıtmaya yardımcı olmak için ısı emici ve termal pedlerin standart olarak gelmesini takdir ediyoruz.

| Drive Performance Rating - Percent | |
| Lenovo Legion Pro 5 16IRX9 | |
| Alienware x16 R2 P120F | |
| Razer Blade 16 2024, RTX 4090 | |
| HP Victus 16 (2024) | |
| Maingear ML-16 MK2 | |
| Asus ROG Zephyrus G16 GA605WV | |
* ... daha küçük daha iyidir
Disk Throttling: DiskSpd Read Loop, Queue Depth 8
GPU Performansı
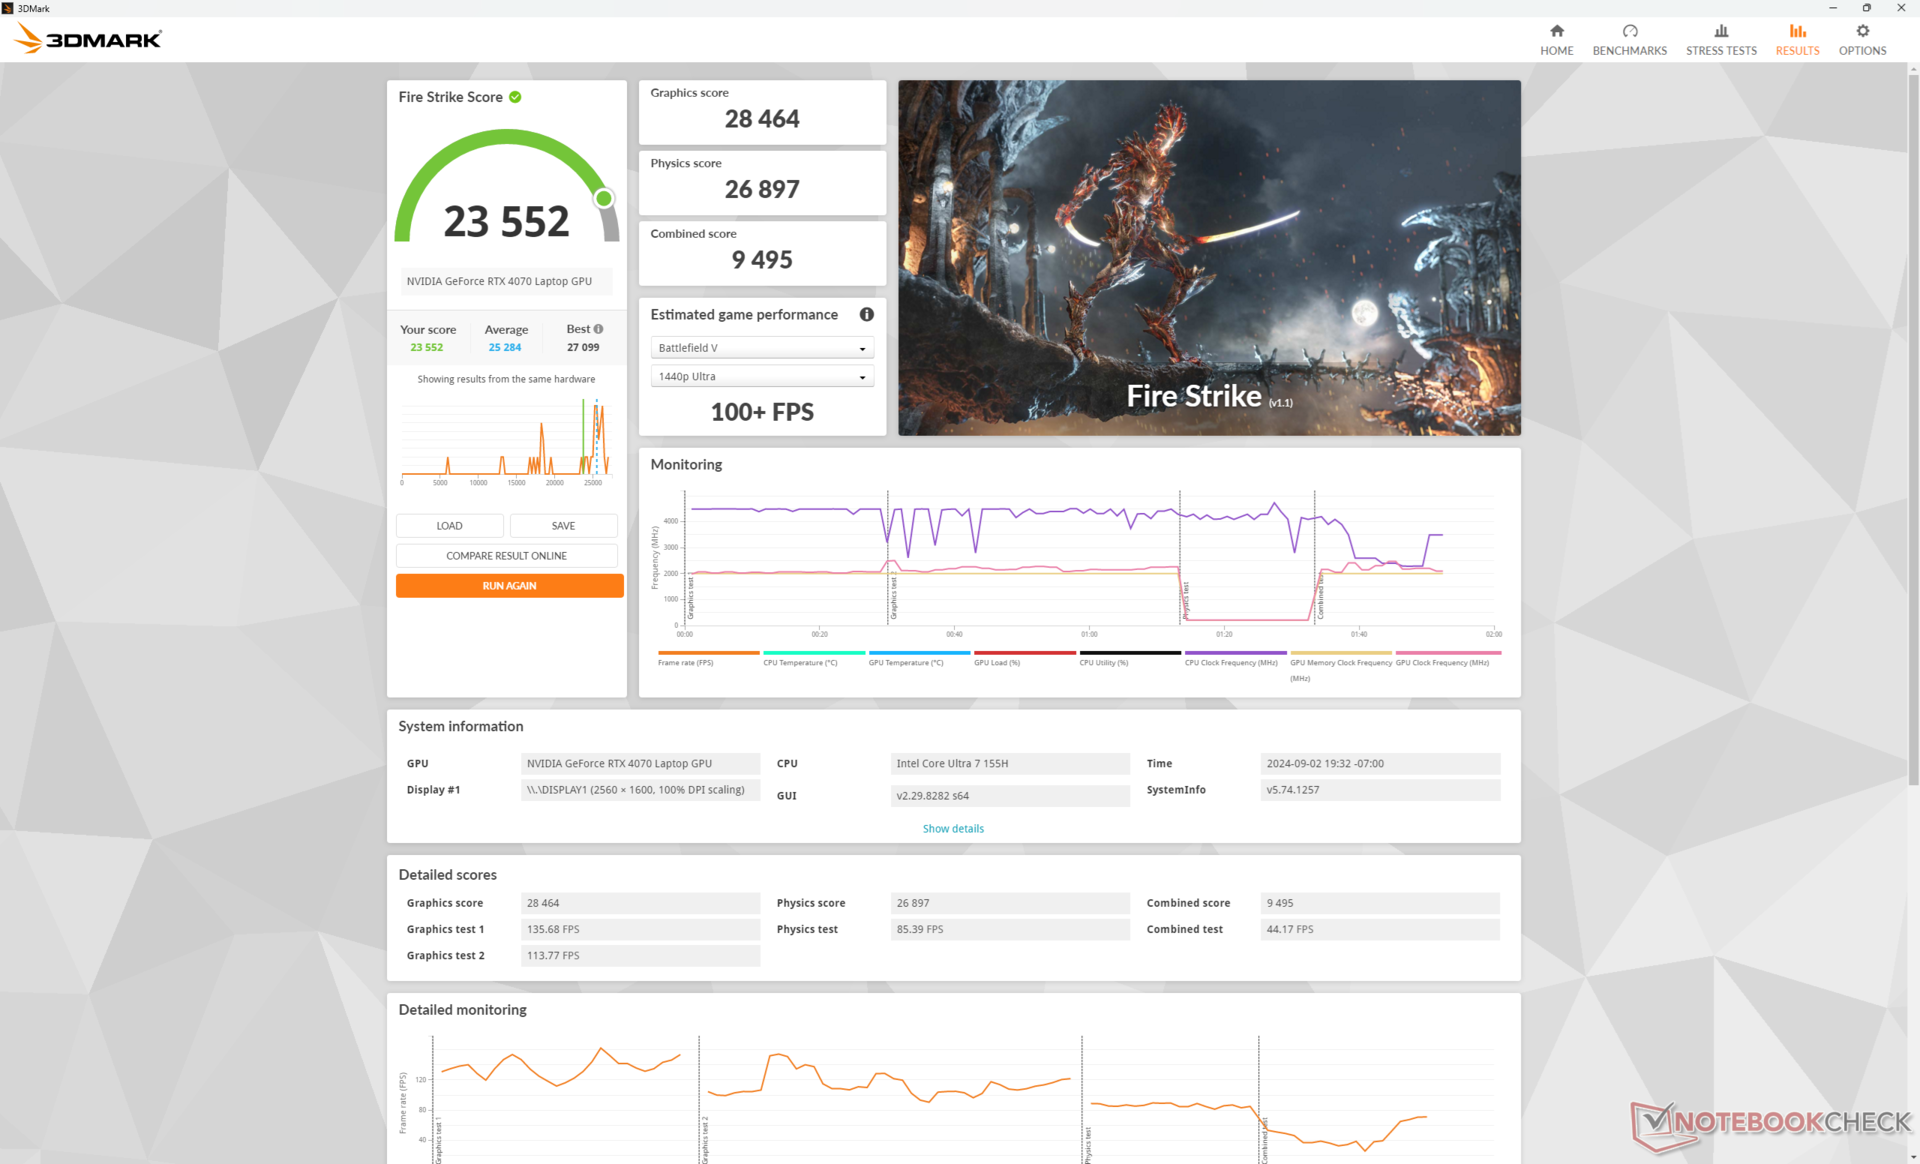
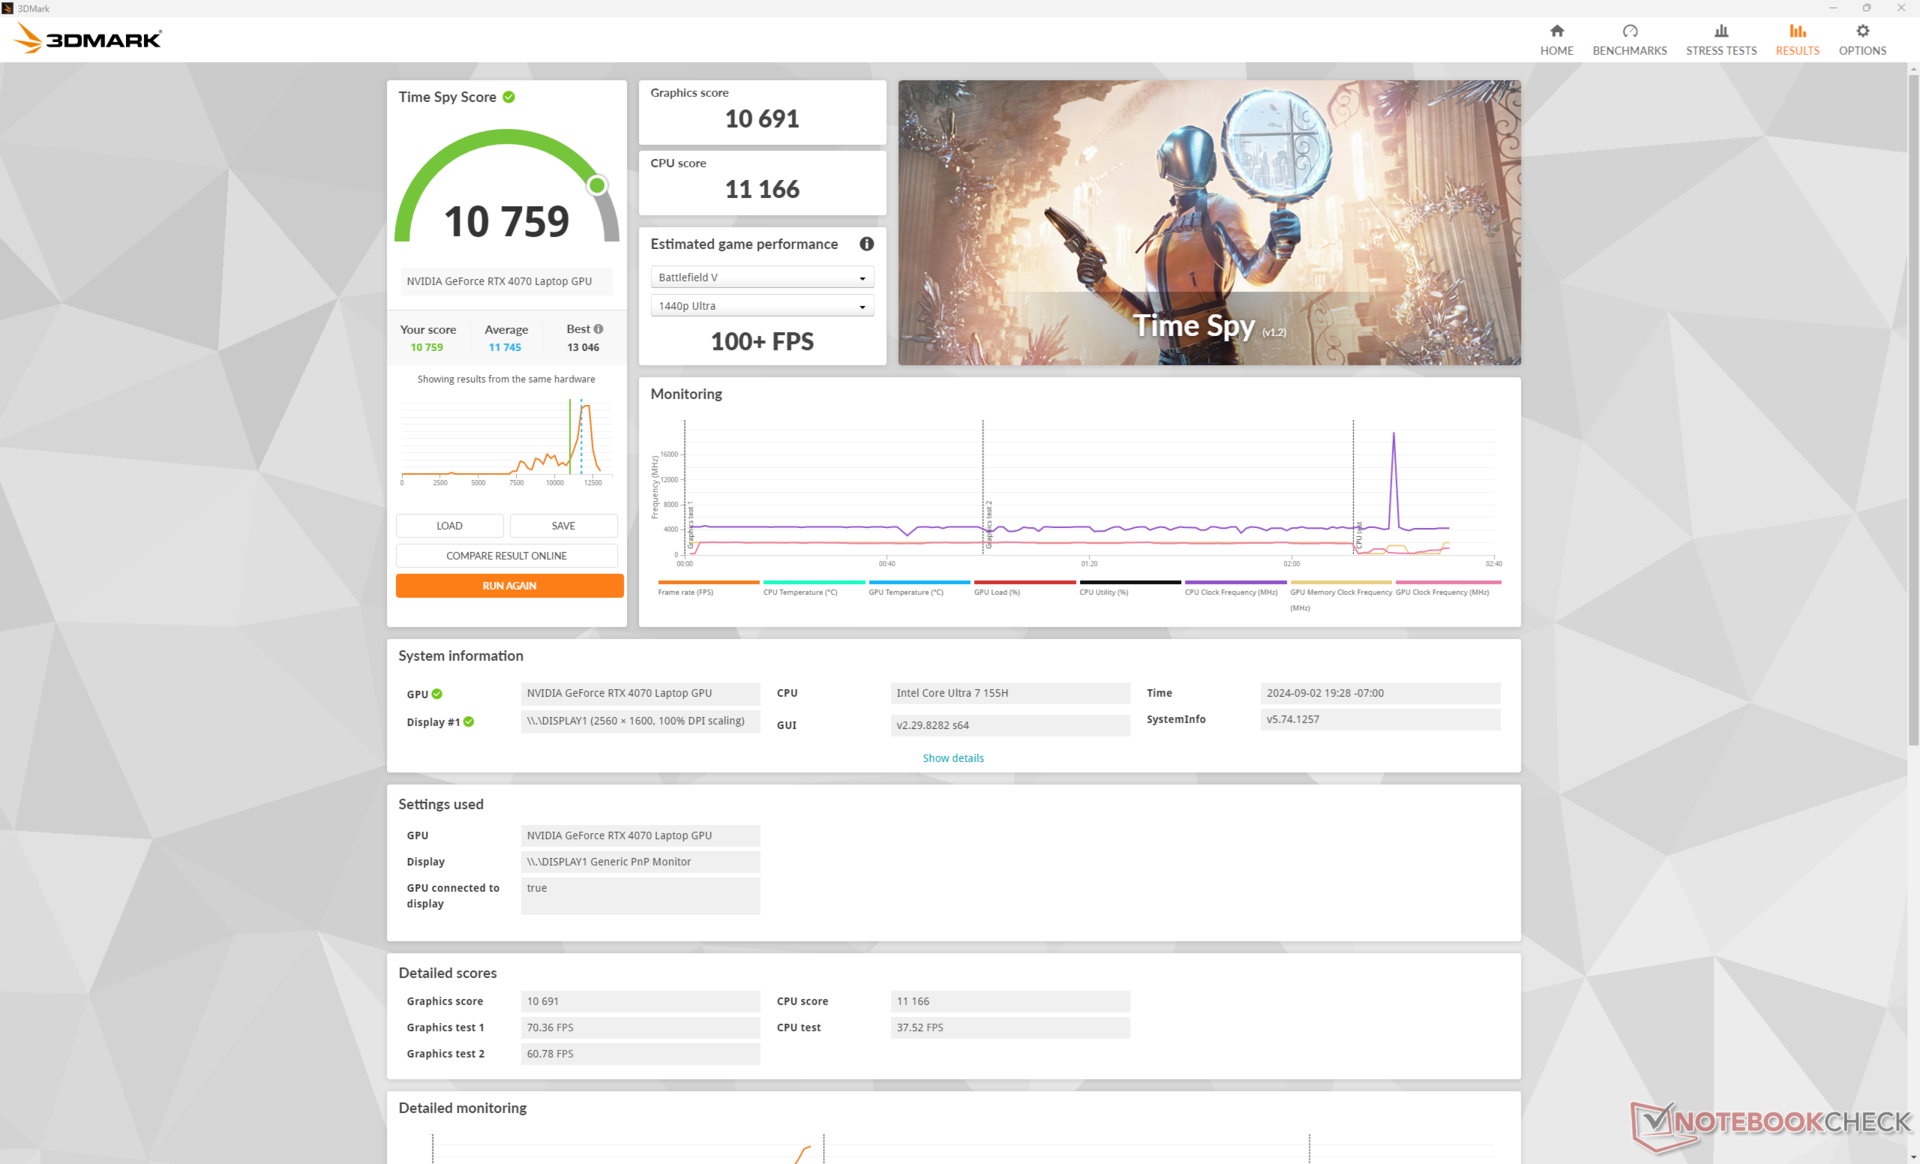
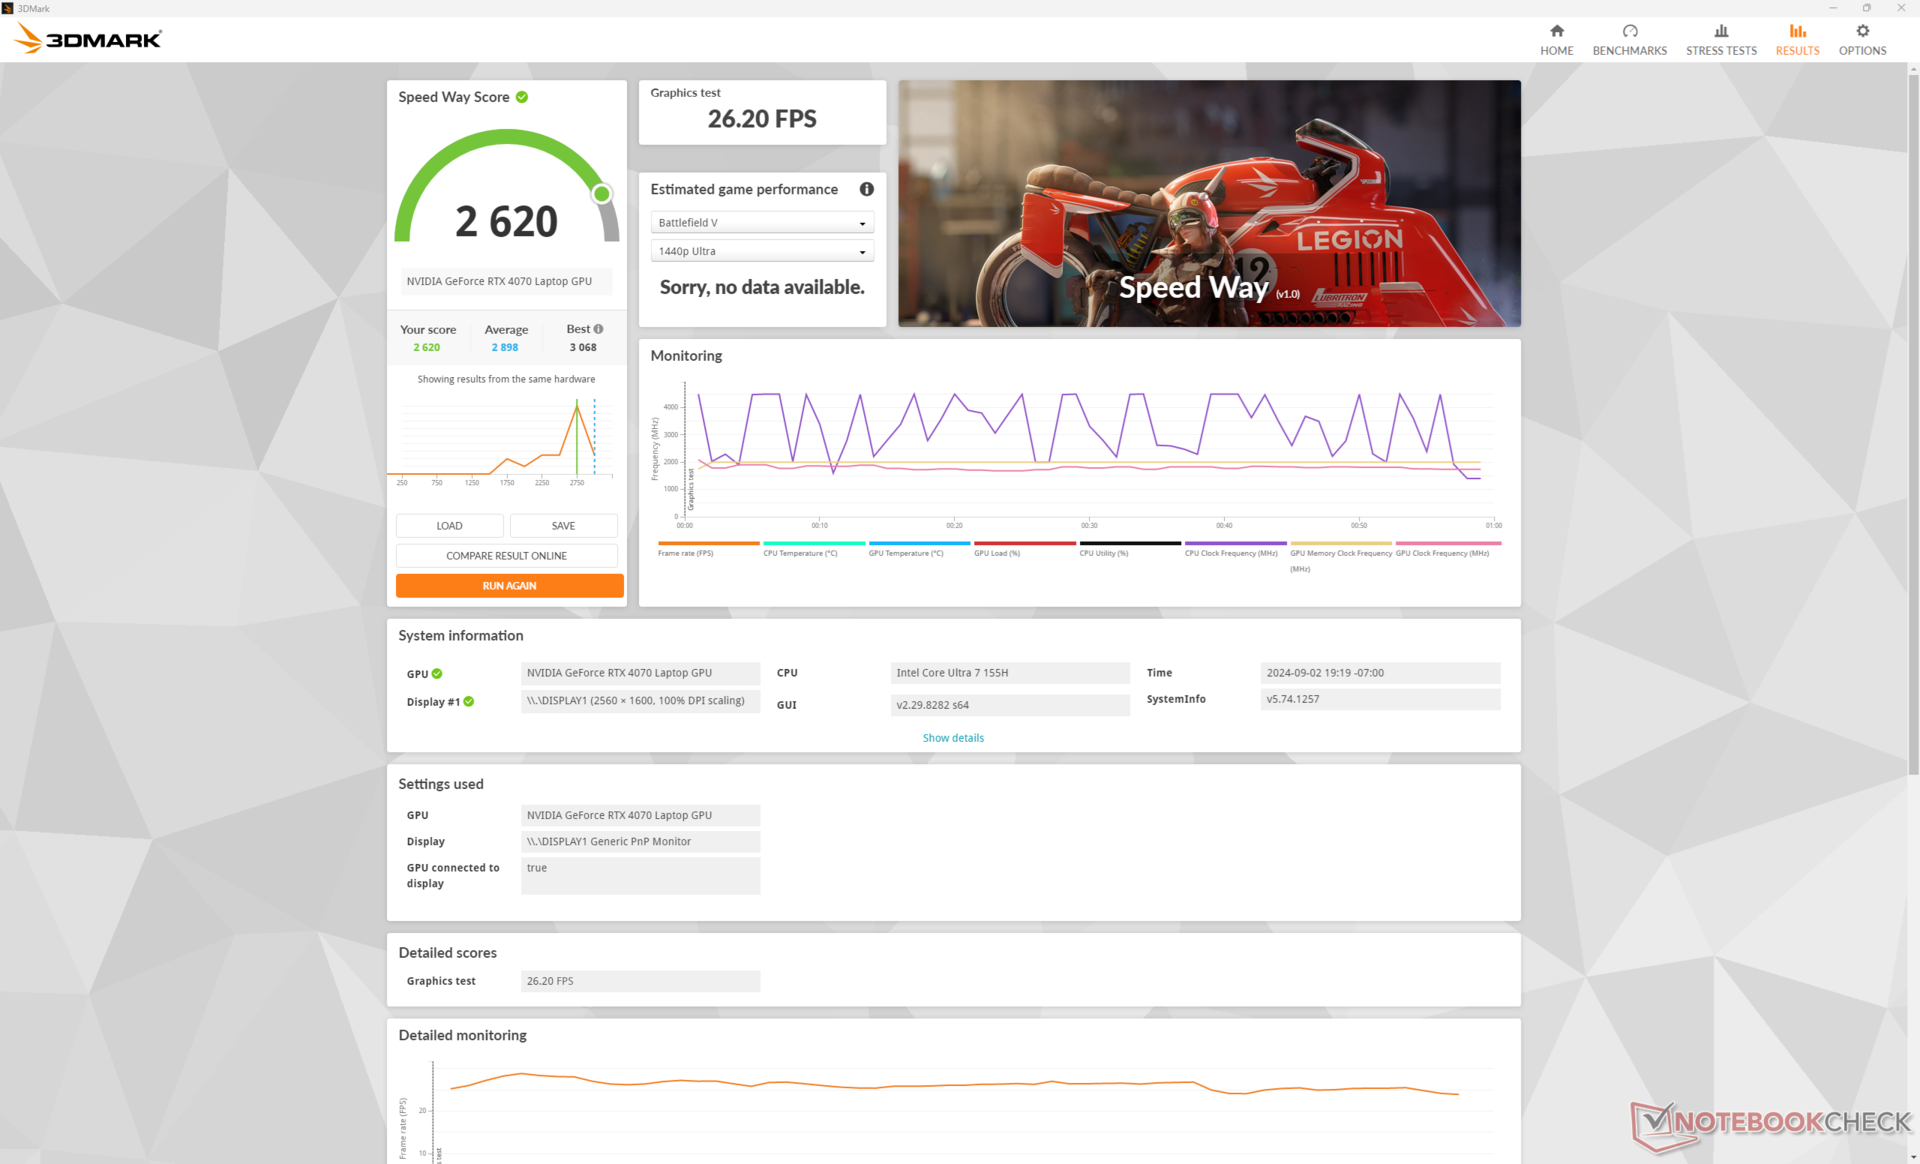
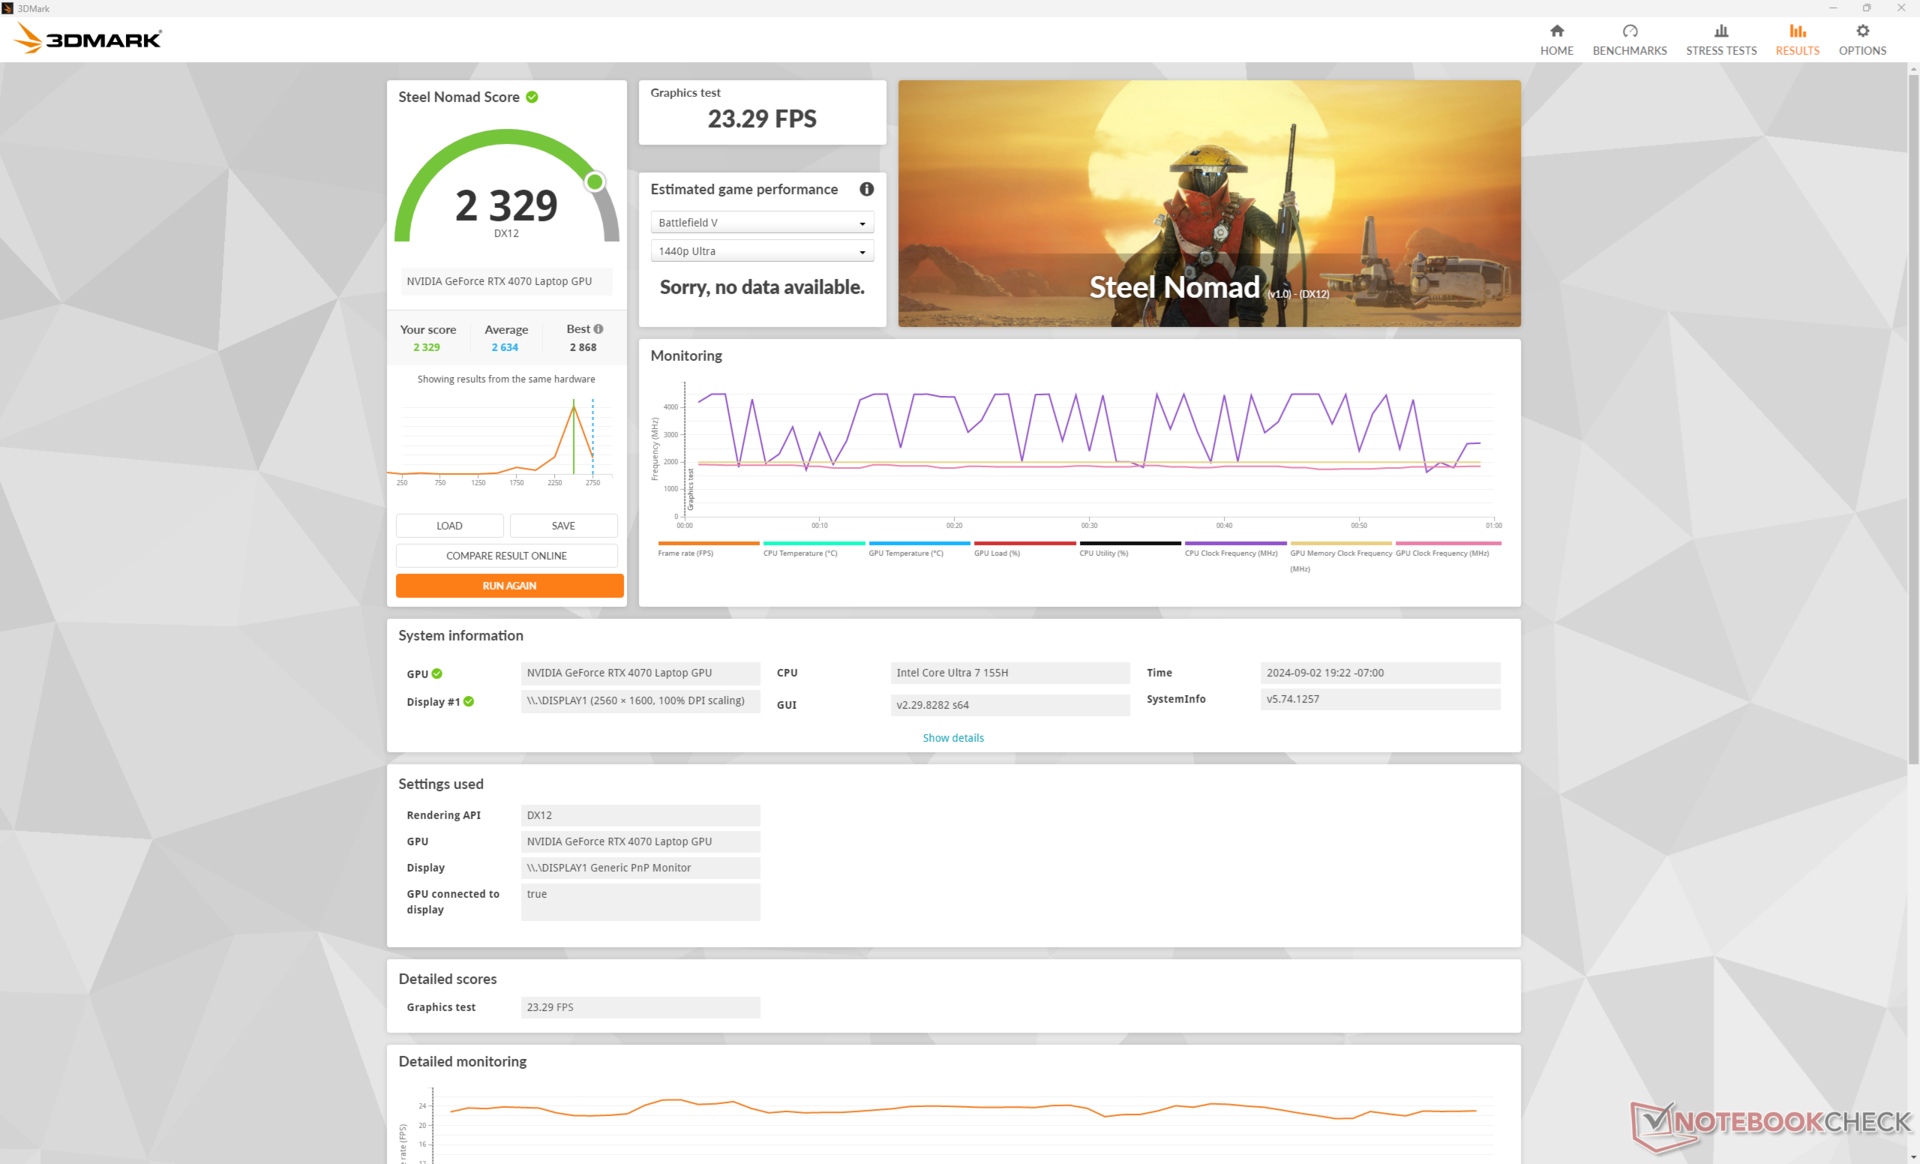
Mobil GeForce RTX 4070, aşağıdakilerden birkaç yüzde puan daha yavaş performans gösterir veritabanımızdaki ortalama dizüstü bilgisayar aynı GPU seçeneği ile. Genel performans, temel GPU'ya göre yalnızca yüzde 5 ila 15 daha iyi RTX 4060 seçeneğinden veya daha eski olanlardan yaklaşık yüzde 15 daha iyi RTX 3070 Ti. Mobil RTX 4070 ile karşılaştırıldığında aradaki fark çok daha açılıyor mobil RTX 4080ancak ikincisi bu modelde yapılandırılamaz.
Mobil RTX 4070'in diğer modellere göre çok daha yavaş olduğunu unutmayın masaüstü muadili yaklaşık yüzde 35 ila 40 oranında azalmıştır.
| Güç Profili | Grafik Puanı | Fizik Puanı | Birleşik Puan |
| Performans modu | 28464 | 26897 | 9495 |
| Dengeli mod | 28238 (-0%) | 16060 (-40%) | 8049 (-15%) |
| Pil gücü | 5539 (-81%) | 12186 (-55%) | 1715 (-82%) |
Performans modu yerine Dengeli modda çalıştırmak CPU performansını önemli ölçüde etkilerken, yukarıdaki Fire Strike sonuç tablomuza göre grafik performansı etkilenmiyor. Bu, yukarıdaki Stres Testi bölümündeki gözlemlerimizle uyumludur. Pil gücüyle çalıştırmak, Performans moduna ayarlandığında bile genel performansı daha da etkiler.
| 3DMark Performance Rating - Percent | |
| Razer Blade 16 2024, RTX 4090 -1! | |
| KFA2 GeForce RTX 4070 EX Gamer | |
| Alienware x16 R2 P120F | |
| Lenovo Yoga Pro 9 16IMH9 -1! | |
| Ortalama NVIDIA GeForce RTX 4070 Laptop GPU | |
| Maingear ML-16 MK2 | |
| HP Victus 16 (2024) -1! | |
| HP Omen 16-b0085ng -1! | |
| CSL GameStar Notebook VenomGamer G16 -1! | |
| Asus ROG Zephyrus M16 GU603Z -1! | |
| Asus TUF Gaming A16 FA617XS | |
| HP Victus 16-r0076TX | |
| HP Omen 16-n0033dx | |
| Acer Nitro 16 AN16-41-R7YE | |
| Lenovo Legion C7 15IMH05 82EH0030GE -1! | |
| 3DMark 11 - 1280x720 Performance GPU | |
| Razer Blade 16 2024, RTX 4090 | |
| KFA2 GeForce RTX 4070 EX Gamer | |
| Alienware x16 R2 P120F | |
| Lenovo Yoga Pro 9 16IMH9 | |
| Ortalama NVIDIA GeForce RTX 4070 Laptop GPU (24229 - 46434, n=66) | |
| Maingear ML-16 MK2 | |
| CSL GameStar Notebook VenomGamer G16 | |
| HP Victus 16 (2024) | |
| HP Omen 16-b0085ng | |
| Asus TUF Gaming A16 FA617XS | |
| HP Omen 16-n0033dx | |
| Asus ROG Zephyrus M16 GU603Z | |
| HP Victus 16-r0076TX | |
| Acer Nitro 16 AN16-41-R7YE | |
| Lenovo Legion C7 15IMH05 82EH0030GE | |
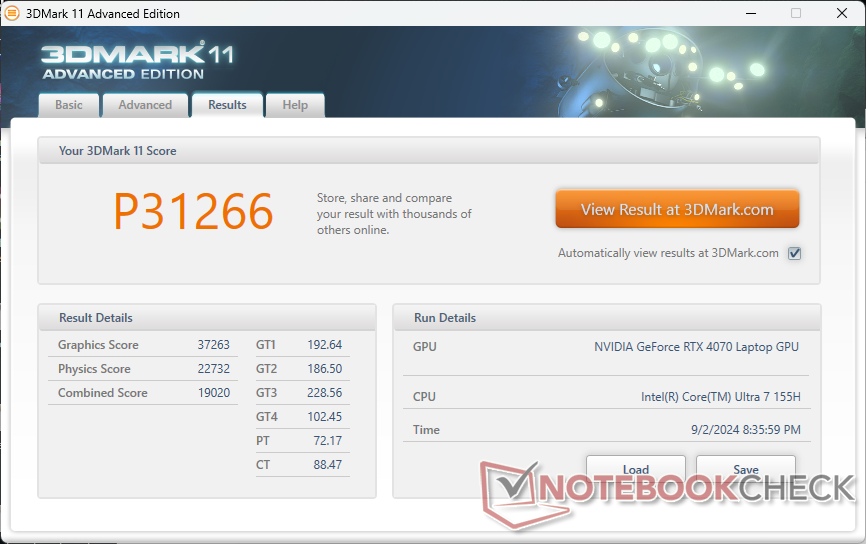
| 3DMark 11 Performance | 31266 puan | |
| 3DMark Cloud Gate Standard Score | 57717 puan | |
| 3DMark Fire Strike Score | 23552 puan | |
| 3DMark Time Spy Score | 10759 puan | |
| 3DMark Steel Nomad Score | 2329 puan | |
Yardım | ||
* ... daha küçük daha iyidir
Oyun Performansı
Mobil RTX 4070, modern oyunları yerel QHD+ çözünürlükte maksimum ayarlarda çalıştıracak kadar güçlüdür. Cyberpunk 2077 gibi daha zorlu oyunlarda da 60 FPS veya üzerine ulaşmak için DLSS gerekecek olsa da bu mümkün. Örneğin, oyun içi kıyaslamayı Ultra RT ayarları ve doğal 1600p ile çalıştırmak, DLSS 3 Balanced etkinken 63,1'e karşılık yalnızca 20,2'lik bir ortalama kare hızı sağlayacaktır.
| Performance Rating - Percent | |
| Razer Blade 16 2024, RTX 4090 | |
| Lenovo Legion Pro 5 16IRX9 | |
| Alienware x16 R2 P120F -1! | |
| Maingear ML-16 MK2 | |
| HP Victus 16 (2024) -1! | |
| Asus ROG Zephyrus G16 GA605WV | |
| GTA V - 1920x1080 Highest Settings possible AA:4xMSAA + FX AF:16x | |
| Razer Blade 16 2024, RTX 4090 | |
| Lenovo Legion Pro 5 16IRX9 | |
| Maingear ML-16 MK2 | |
| HP Victus 16 (2024) | |
| Asus ROG Zephyrus G16 GA605WV | |
| Final Fantasy XV Benchmark - 1920x1080 High Quality | |
| Alienware x16 R2 P120F | |
| Razer Blade 16 2024, RTX 4090 | |
| Lenovo Legion Pro 5 16IRX9 | |
| Maingear ML-16 MK2 | |
| HP Victus 16 (2024) | |
| Asus ROG Zephyrus G16 GA605WV | |
| Strange Brigade - 1920x1080 ultra AA:ultra AF:16 | |
| Razer Blade 16 2024, RTX 4090 | |
| Alienware x16 R2 P120F | |
| Lenovo Legion Pro 5 16IRX9 | |
| Maingear ML-16 MK2 | |
| HP Victus 16 (2024) | |
| Asus ROG Zephyrus G16 GA605WV | |
| Dota 2 Reborn - 1920x1080 ultra (3/3) best looking | |
| Razer Blade 16 2024, RTX 4090 | |
| Lenovo Legion Pro 5 16IRX9 | |
| HP Victus 16 (2024) | |
| Asus ROG Zephyrus G16 GA605WV | |
| Maingear ML-16 MK2 | |
| Alienware x16 R2 P120F | |
| X-Plane 11.11 - 1920x1080 high (fps_test=3) | |
| Razer Blade 16 2024, RTX 4090 | |
| Lenovo Legion Pro 5 16IRX9 | |
| HP Victus 16 (2024) | |
| Maingear ML-16 MK2 | |
| Alienware x16 R2 P120F | |
| Asus ROG Zephyrus G16 GA605WV | |
| Far Cry 5 - 1920x1080 Ultra Preset AA:T | |
| Lenovo Legion Pro 5 16IRX9 | |
| Razer Blade 16 2024, RTX 4090 | |
| Alienware x16 R2 P120F | |
| Maingear ML-16 MK2 | |
| Asus ROG Zephyrus G16 GA605WV | |
| Baldur's Gate 3 | |
| 1920x1080 High Preset | |
| Alienware x16 R2 P120F | |
| Lenovo Yoga Pro 9 16IMH9 | |
| Maingear ML-16 MK2 | |
| Ortalama NVIDIA GeForce RTX 4070 Laptop GPU (72.7 - 129.3, n=26) | |
| CSL GameStar Notebook VenomGamer G16 | |
| 1920x1080 Ultra Preset | |
| Razer Blade 16 2024, RTX 4090 | |
| Alienware x16 R2 P120F | |
| Lenovo Yoga Pro 9 16IMH9 | |
| Maingear ML-16 MK2 | |
| Ortalama NVIDIA GeForce RTX 4070 Laptop GPU (66.7 - 128.5, n=28) | |
| CSL GameStar Notebook VenomGamer G16 | |
| 2560x1440 Ultra Preset | |
| Razer Blade 16 2024, RTX 4090 | |
| Alienware x16 R2 P120F | |
| Lenovo Yoga Pro 9 16IMH9 | |
| Ortalama NVIDIA GeForce RTX 4070 Laptop GPU (54.4 - 89.6, n=23) | |
| Maingear ML-16 MK2 | |
| CSL GameStar Notebook VenomGamer G16 | |
| Dota 2 Reborn | |
| 1920x1080 high (2/3) | |
| KFA2 GeForce RTX 4070 EX Gamer | |
| Razer Blade 16 2024, RTX 4090 | |
| Asus ROG Zephyrus M16 GU603Z | |
| HP Victus 16 (2024) | |
| HP Victus 16-r0076TX | |
| Ortalama NVIDIA GeForce RTX 4070 Laptop GPU (88.2 - 210, n=66) | |
| Lenovo Yoga Pro 9 16IMH9 | |
| Maingear ML-16 MK2 | |
| HP Omen 16-b0085ng | |
| Alienware x16 R2 P120F | |
| Asus TUF Gaming A16 FA617XS | |
| Acer Nitro 16 AN16-41-R7YE | |
| Lenovo Legion C7 15IMH05 82EH0030GE | |
| CSL GameStar Notebook VenomGamer G16 | |
| HP Omen 16-n0033dx | |
| 1920x1080 ultra (3/3) best looking | |
| KFA2 GeForce RTX 4070 EX Gamer | |
| Razer Blade 16 2024, RTX 4090 | |
| Asus ROG Zephyrus M16 GU603Z | |
| HP Victus 16 (2024) | |
| Ortalama NVIDIA GeForce RTX 4070 Laptop GPU (89.7 - 191.2, n=66) | |
| HP Victus 16-r0076TX | |
| Maingear ML-16 MK2 | |
| Lenovo Yoga Pro 9 16IMH9 | |
| HP Omen 16-b0085ng | |
| Alienware x16 R2 P120F | |
| Acer Nitro 16 AN16-41-R7YE | |
| Lenovo Legion C7 15IMH05 82EH0030GE | |
| Asus TUF Gaming A16 FA617XS | |
| CSL GameStar Notebook VenomGamer G16 | |
| HP Omen 16-n0033dx | |
| X-Plane 11.11 | |
| 1920x1080 med (fps_test=2) | |
| KFA2 GeForce RTX 4070 EX Gamer | |
| Razer Blade 16 2024, RTX 4090 | |
| Asus ROG Zephyrus M16 GU603Z | |
| HP Victus 16-r0076TX | |
| Ortalama NVIDIA GeForce RTX 4070 Laptop GPU (74.7 - 191.1, n=66) | |
| HP Victus 16 (2024) | |
| Maingear ML-16 MK2 | |
| HP Omen 16-b0085ng | |
| Lenovo Yoga Pro 9 16IMH9 | |
| Alienware x16 R2 P120F | |
| Acer Nitro 16 AN16-41-R7YE | |
| Lenovo Legion C7 15IMH05 82EH0030GE | |
| CSL GameStar Notebook VenomGamer G16 | |
| Asus TUF Gaming A16 FA617XS | |
| HP Omen 16-n0033dx | |
| 1920x1080 high (fps_test=3) | |
| KFA2 GeForce RTX 4070 EX Gamer | |
| Razer Blade 16 2024, RTX 4090 | |
| Asus ROG Zephyrus M16 GU603Z | |
| HP Victus 16-r0076TX | |
| Ortalama NVIDIA GeForce RTX 4070 Laptop GPU (52.1 - 147.9, n=68) | |
| HP Victus 16 (2024) | |
| HP Omen 16-b0085ng | |
| Lenovo Yoga Pro 9 16IMH9 | |
| Maingear ML-16 MK2 | |
| Alienware x16 R2 P120F | |
| Lenovo Legion C7 15IMH05 82EH0030GE | |
| Acer Nitro 16 AN16-41-R7YE | |
| CSL GameStar Notebook VenomGamer G16 | |
| Asus TUF Gaming A16 FA617XS | |
| HP Omen 16-n0033dx | |
| Tiny Tina's Wonderlands | |
| 1920x1080 High Preset (DX12) | |
| KFA2 GeForce RTX 4070 EX Gamer | |
| Alienware x16 R2 P120F | |
| Ortalama NVIDIA GeForce RTX 4070 Laptop GPU (74.3 - 151.4, n=14) | |
| Maingear ML-16 MK2 | |
| Asus TUF Gaming A16 FA617XS | |
| 1920x1080 Badass Preset (DX12) | |
| KFA2 GeForce RTX 4070 EX Gamer | |
| Alienware x16 R2 P120F | |
| Ortalama NVIDIA GeForce RTX 4070 Laptop GPU (58.6 - 115.9, n=17) | |
| Maingear ML-16 MK2 | |
| Asus TUF Gaming A16 FA617XS | |
| 2560x1440 Badass Preset (DX12) | |
| KFA2 GeForce RTX 4070 EX Gamer | |
| Alienware x16 R2 P120F | |
| Ortalama NVIDIA GeForce RTX 4070 Laptop GPU (49.8 - 79.5, n=16) | |
| Maingear ML-16 MK2 | |
| F1 22 | |
| 1920x1080 High Preset AA:T AF:16x | |
| KFA2 GeForce RTX 4070 EX Gamer | |
| Maingear ML-16 MK2 | |
| Ortalama NVIDIA GeForce RTX 4070 Laptop GPU (109 - 245, n=32) | |
| Asus TUF Gaming A16 FA617XS | |
| Alienware x16 R2 P120F | |
| HP Omen 16-n0033dx | |
| Acer Nitro 16 AN16-41-R7YE | |
| HP Victus 16-r0076TX | |
| 1920x1080 Ultra High Preset AA:T AF:16x | |
| KFA2 GeForce RTX 4070 EX Gamer | |
| Alienware x16 R2 P120F | |
| Ortalama NVIDIA GeForce RTX 4070 Laptop GPU (39.2 - 88.7, n=32) | |
| Maingear ML-16 MK2 | |
| HP Victus 16-r0076TX | |
| Acer Nitro 16 AN16-41-R7YE | |
| Asus TUF Gaming A16 FA617XS | |
| HP Omen 16-n0033dx | |
| 2560x1440 Ultra High Preset AA:T AF:16x | |
| KFA2 GeForce RTX 4070 EX Gamer | |
| Alienware x16 R2 P120F | |
| Ortalama NVIDIA GeForce RTX 4070 Laptop GPU (10.6 - 58.8, n=30) | |
| Maingear ML-16 MK2 | |
| Cyberpunk 2077 2.2 Phantom Liberty | |
| 1920x1080 Medium Preset (FSR off) | |
| Alienware x16 R2 P120F | |
| Ortalama NVIDIA GeForce RTX 4070 Laptop GPU (81.6 - 124.5, n=29) | |
| Lenovo Yoga Pro 9 16IMH9 | |
| Maingear ML-16 MK2 | |
| HP Victus 16 (2024) | |
| CSL GameStar Notebook VenomGamer G16 | |
| 1920x1080 High Preset (FSR off) | |
| Alienware x16 R2 P120F | |
| Ortalama NVIDIA GeForce RTX 4070 Laptop GPU (74.7 - 103.6, n=30) | |
| Lenovo Yoga Pro 9 16IMH9 | |
| Maingear ML-16 MK2 | |
| HP Victus 16 (2024) | |
| CSL GameStar Notebook VenomGamer G16 | |
| 1920x1080 Ultra Preset (FSR off) | |
| Alienware x16 R2 P120F | |
| Razer Blade 16 2024, RTX 4090 | |
| Ortalama NVIDIA GeForce RTX 4070 Laptop GPU (30.7 - 90.7, n=38) | |
| Lenovo Yoga Pro 9 16IMH9 | |
| Maingear ML-16 MK2 | |
| HP Victus 16 (2024) | |
| CSL GameStar Notebook VenomGamer G16 | |
| 2560x1440 Ultra Preset (FSR off) | |
| Razer Blade 16 2024, RTX 4090 | |
| Alienware x16 R2 P120F | |
| Ortalama NVIDIA GeForce RTX 4070 Laptop GPU (24.8 - 57.1, n=35) | |
| Lenovo Yoga Pro 9 16IMH9 | |
| Maingear ML-16 MK2 | |
| CSL GameStar Notebook VenomGamer G16 | |
Cyberpunk 2077 ultra FPS Chart
| düşük | orta | yüksek | ultra | QHD | |
|---|---|---|---|---|---|
| GTA V (2015) | 183.3 | 180.4 | 175 | 115.1 | 90.6 |
| Dota 2 Reborn (2015) | 173.4 | 152.8 | 145.3 | 139.2 | |
| Final Fantasy XV Benchmark (2018) | 187.6 | 146.3 | 110.6 | 80 | |
| X-Plane 11.11 (2018) | 139.9 | 124.4 | 89.8 | ||
| Far Cry 5 (2018) | 125 | 125 | 114 | 101 | |
| Strange Brigade (2018) | 477 | 284 | 224 | 192.8 | 127.9 |
| Tiny Tina's Wonderlands (2022) | 218.7 | 180.9 | 119.4 | 92.9 | 62.7 |
| F1 22 (2022) | 252 | 250 | 206 | 69.2 | 42.9 |
| Baldur's Gate 3 (2023) | 152 | 125.9 | 108.2 | 106.8 | 70.6 |
| Cyberpunk 2077 2.2 Phantom Liberty (2023) | 130 | 106.1 | 88.1 | 76.4 | 44.3 |
Emisyonlar - Sıcak ve Gürültülü
Sistem Gürültüsü
Tarama veya video akışı sırasında fan gürültüsü, Sessiz moda ayarlandığında fark edilebilir ancak tolere edilebilir olması için 23 dB(A)'lık sessiz bir arka plana karşı 27 dB(A)'da zirveye ulaşma eğilimindedir. Performans modunda oyun oynarken, fan gürültüsü 55 dB(A)'nın biraz üzerinde çok yüksek olur ve Victus 16 gibi rakiplerden daha yüksektir, Alienware x16 R2veya Legion Pro 5 16. Maksimum fan gürültüsünün etkinleştirilmesi fan gürültüsünü daha da artırarak neredeyse 58 dB(A)'ya çıkaracaktır.

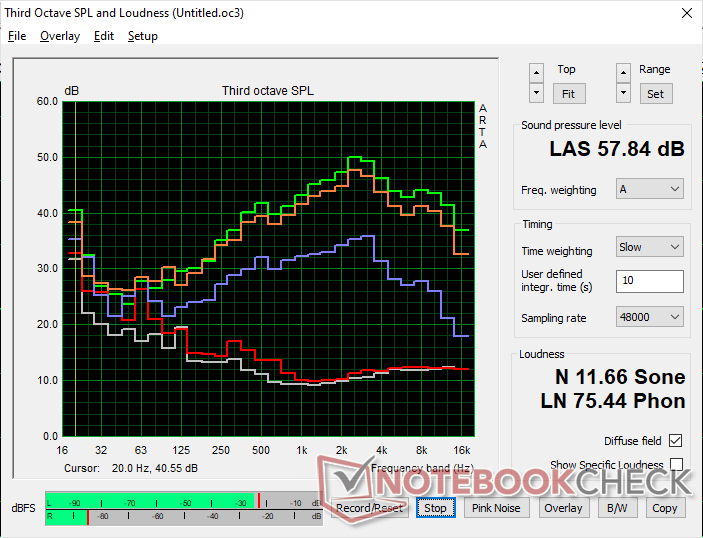
Ses yüksekliği
| Boşta |
| 24.1 / 24.1 / 25.6 dB |
| Çalışırken |
| 44.3 / 57.8 dB |
 | ||
30 dB sessiz 40 dB(A) duyulabilirlik 50 dB(A) gürültülü |
||
min: | ||
| Maingear ML-16 MK2 NVIDIA GeForce RTX 4070 Laptop GPU, Ultra 7 155H | Asus ROG Zephyrus G16 GA605WV NVIDIA GeForce RTX 4060 Laptop GPU, Ryzen AI 9 HX 370, Micron 2400 MTFDKBA1T0QFM | HP Victus 16 (2024) NVIDIA GeForce RTX 4060 Laptop GPU, i7-14700HX, Kioxia XG8 KXG80ZNV512G | Alienware x16 R2 P120F NVIDIA GeForce RTX 4080 Laptop GPU, Ultra 9 185H, WDC PC SN810 1TB | Lenovo Legion Pro 5 16IRX9 NVIDIA GeForce RTX 4070 Laptop GPU, i9-14900HX, Samsung PM9A1 MZVL21T0HCLR | Razer Blade 16 2024, RTX 4090 NVIDIA GeForce RTX 4090 Laptop GPU, i9-14900HX, Samsung PM9A1 MZVL22T0HBLB | |
|---|---|---|---|---|---|---|
| Noise | -4% | -10% | 2% | -3% | 3% | |
| kapalı / ortam * | 23 | 24.6 -7% | 25 -9% | 23.4 -2% | 23.9 -4% | 23 -0% |
| Idle Minimum * | 24.1 | 28.6 -19% | 28 -16% | 23.8 1% | 24.3 -1% | 23 5% |
| Idle Average * | 24.1 | 28.6 -19% | 29 -20% | 28.5 -18% | 24.3 -1% | 23 5% |
| Idle Maximum * | 25.6 | 28.6 -12% | 33 -29% | 28.5 -11% | 28.9 -13% | 27.66 -8% |
| Load Average * | 44.3 | 42.8 3% | 45 -2% | 28.8 35% | 45.8 -3% | 43.76 1% |
| Cyberpunk 2077 ultra * | 55.4 | 48.3 13% | ||||
| Load Maximum * | 57.8 | 48.3 16% | 48 17% | 54.2 6% | 56.6 2% | 50.37 13% |
| Witcher 3 ultra * | 43 | 49.5 | 51 | 46.81 |
* ... daha küçük daha iyidir
Sıcaklık
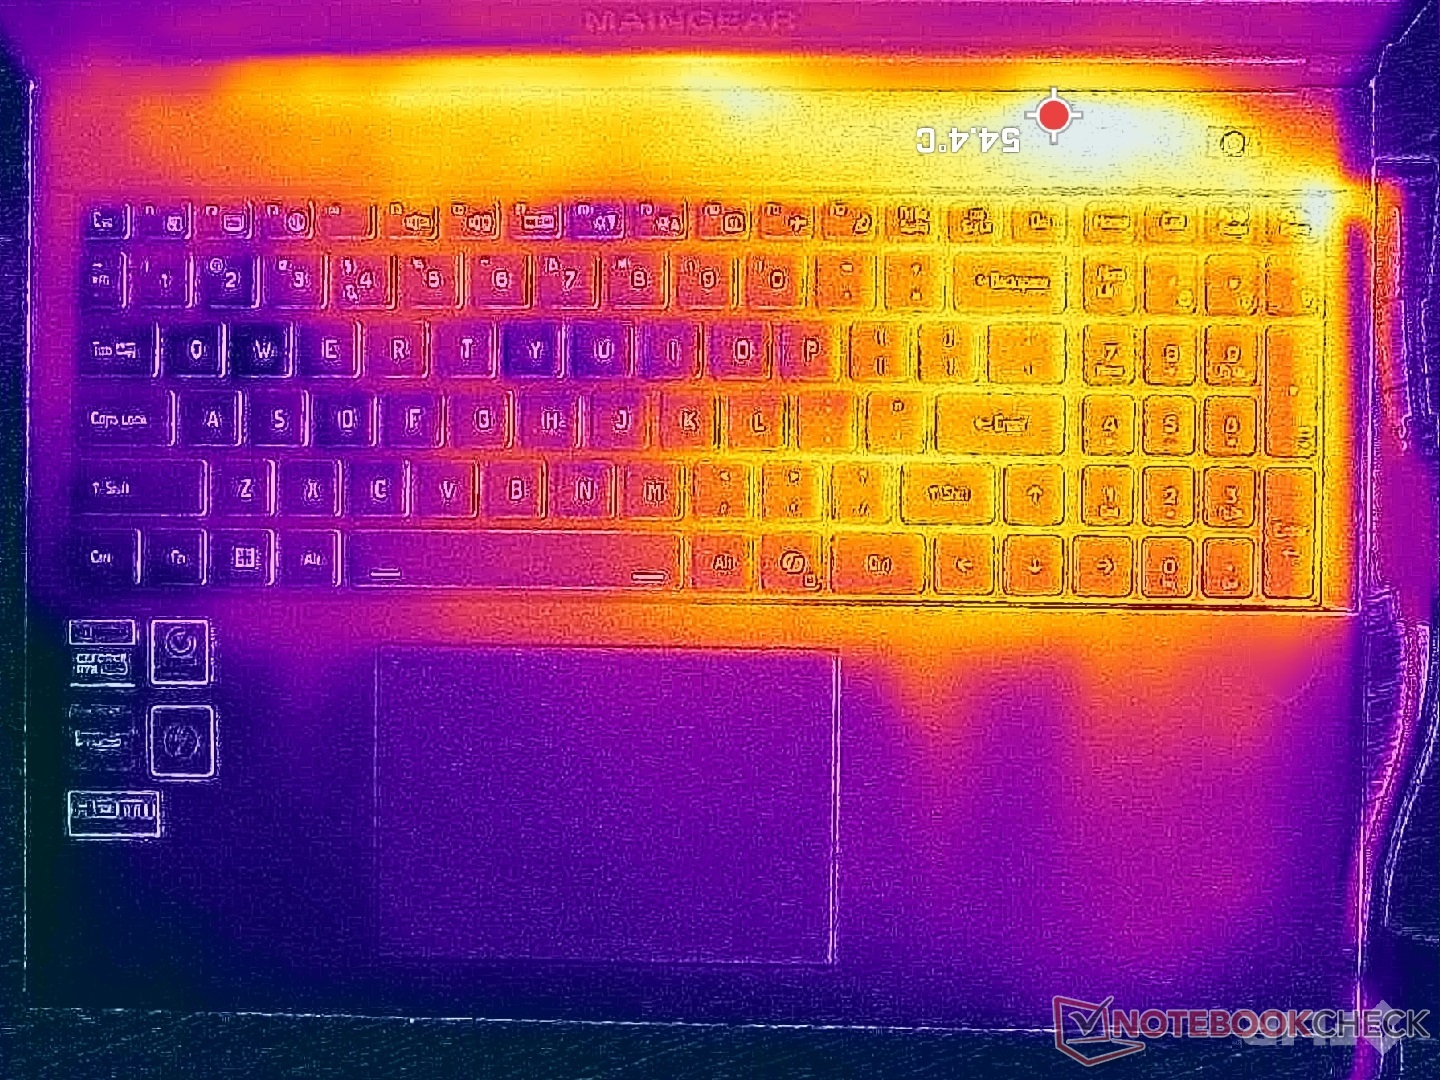
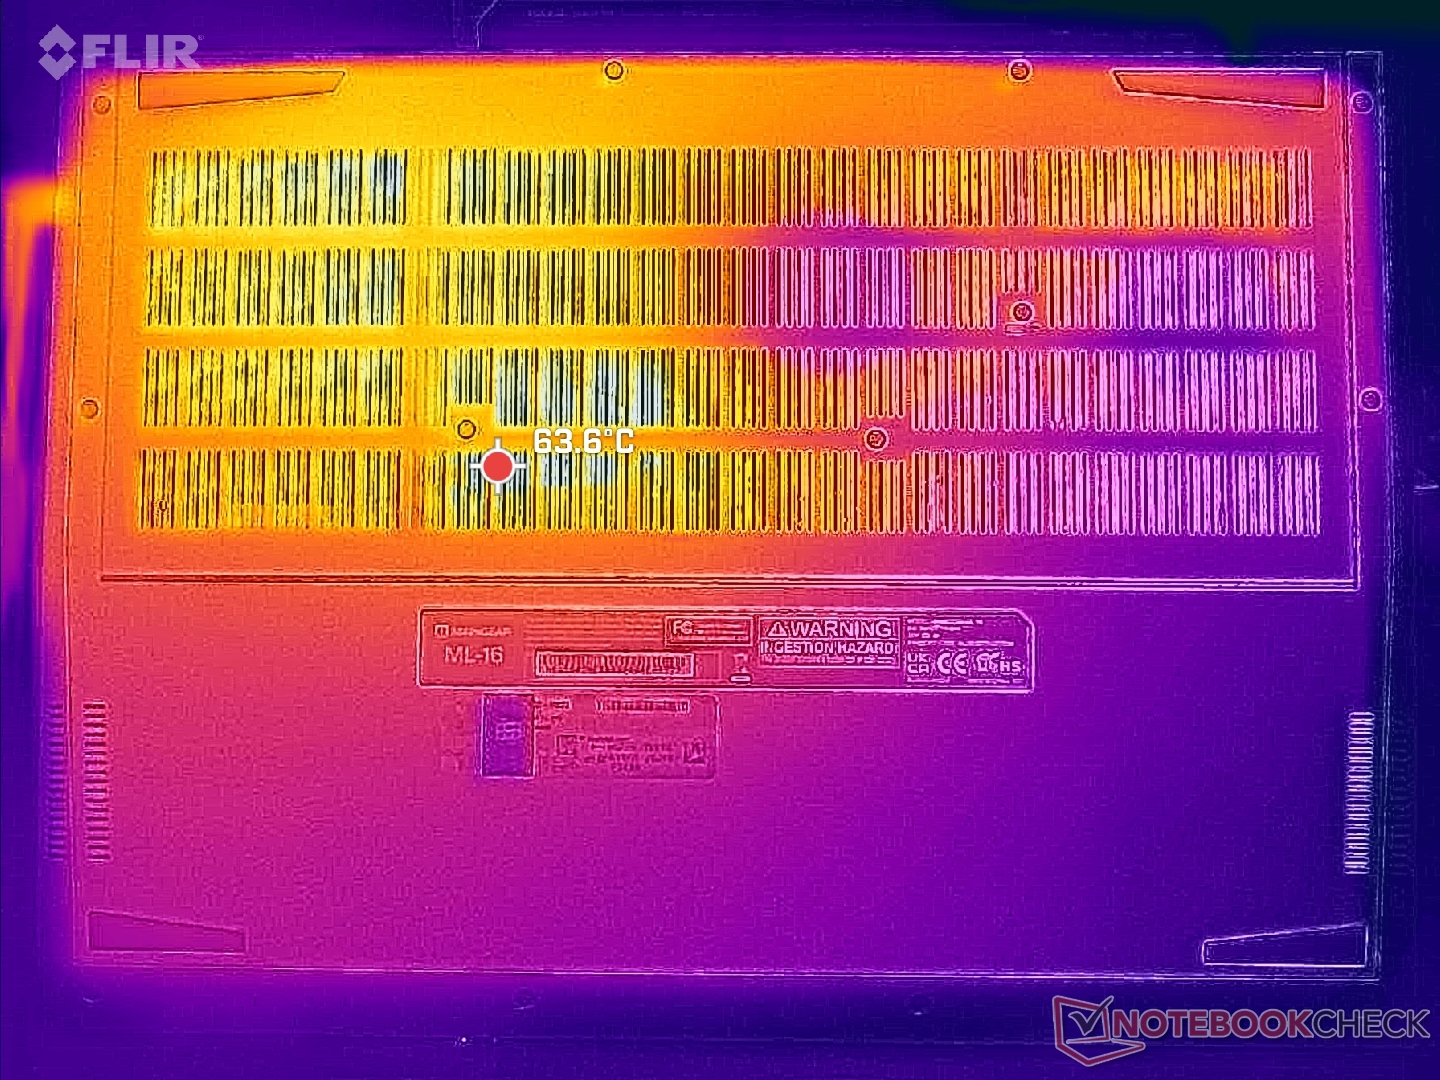
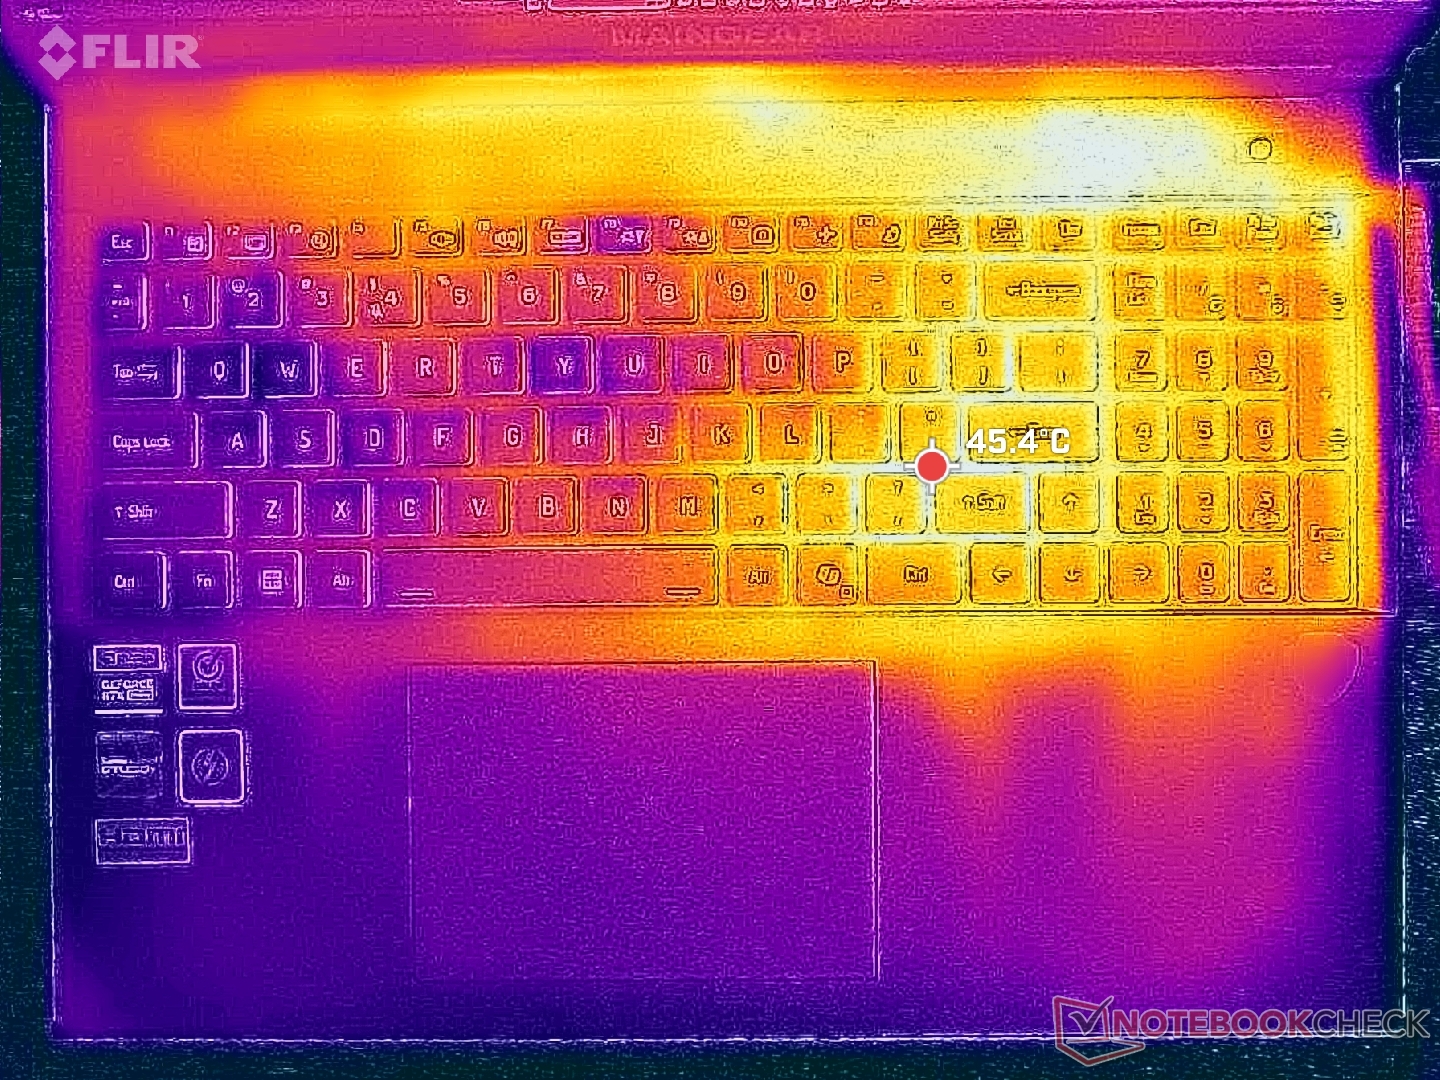
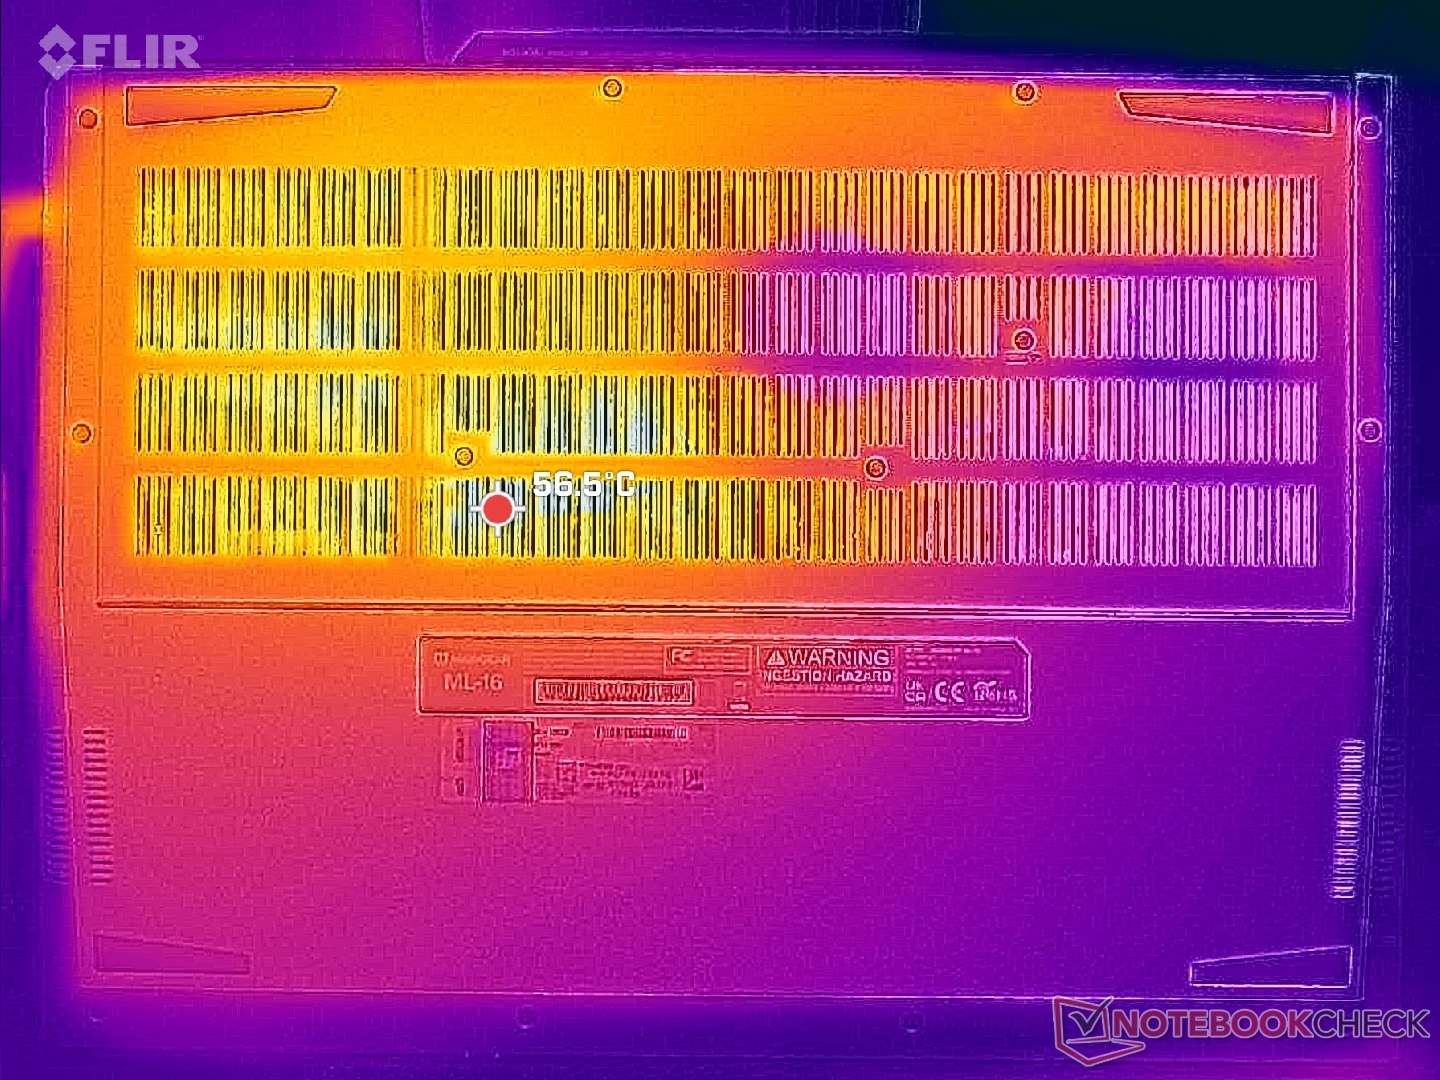
Yukarıda bahsedildiği gibi çok sıcak çalışma sıcaklıkları, ortalamanın üzerinde yüzey sıcaklıklarına yol açmaktadır. Oyun oynarken sıcak noktalar üstte ve altta sırasıyla 54 C ve 56 C'nin üzerine çıkabilirken Bıçak 16 veya Legion Pro 5 16IRX9 üzerinde 47 C'dir.
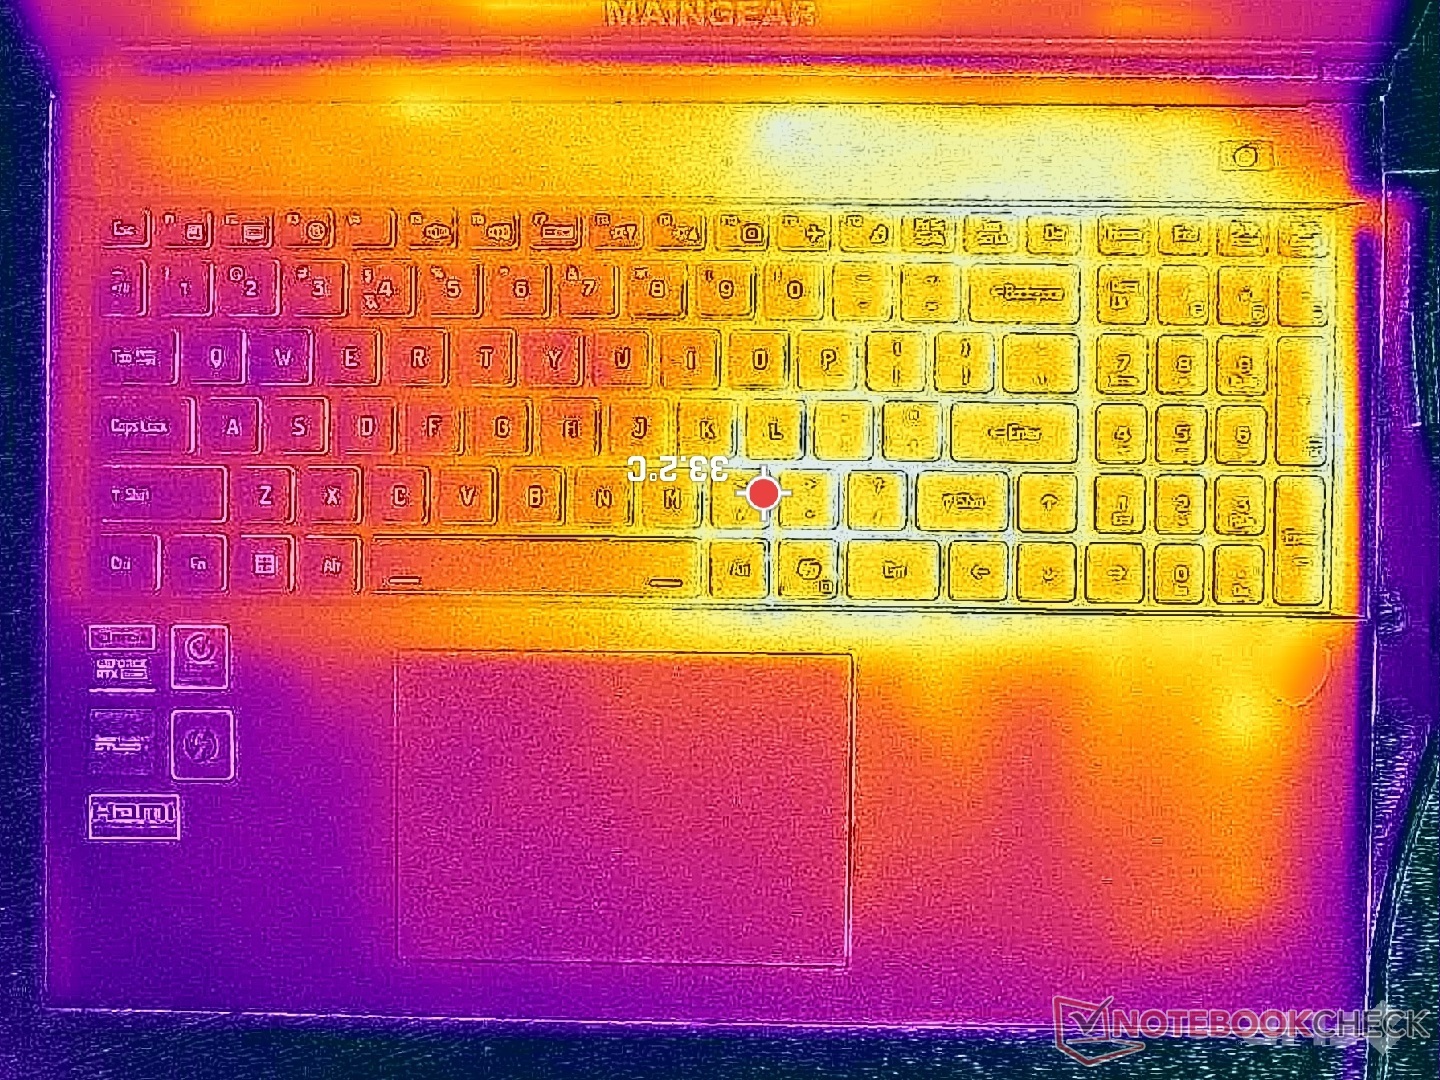
Ayrıca, asimetrik soğutma çözümü, kasanın veya klavyenin sağ yarısının soldan çok daha sıcak olacağı anlamına gelir. Bu, simetrik soğutma çözümlerinin yaygın olduğu diğer oyun dizüstü bilgisayarlarının çoğunun aksine. Çoğu oyunda klavyenin sol yarısında yalnızca WASD tuşları kullanıldığından bu büyük bir sorun değildir, ancak oyun numpad'den girişler gerektiriyorsa terli bir avuç bekleyebilirsiniz.
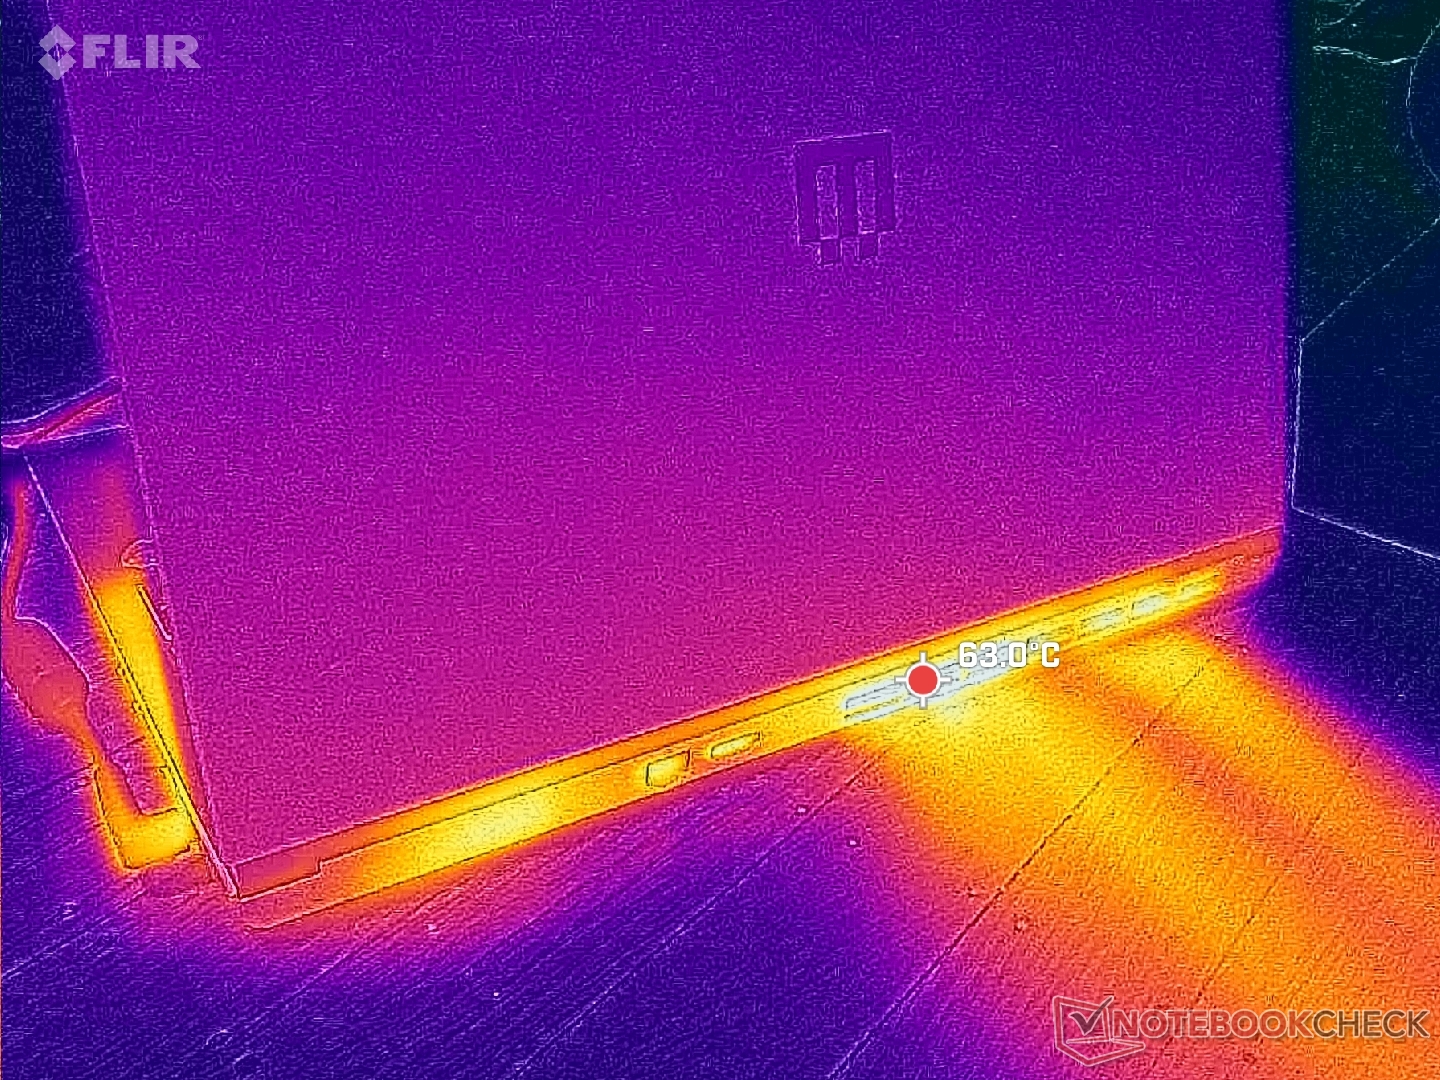
(-) Üst taraftaki maksimum sıcaklık, 40.4 °C / 105 F ortalamasına kıyasla 45.2 °C / 113 F'dir. , Gaming sınıfı için 21.2 ile 68.8 °C arasında değişir.
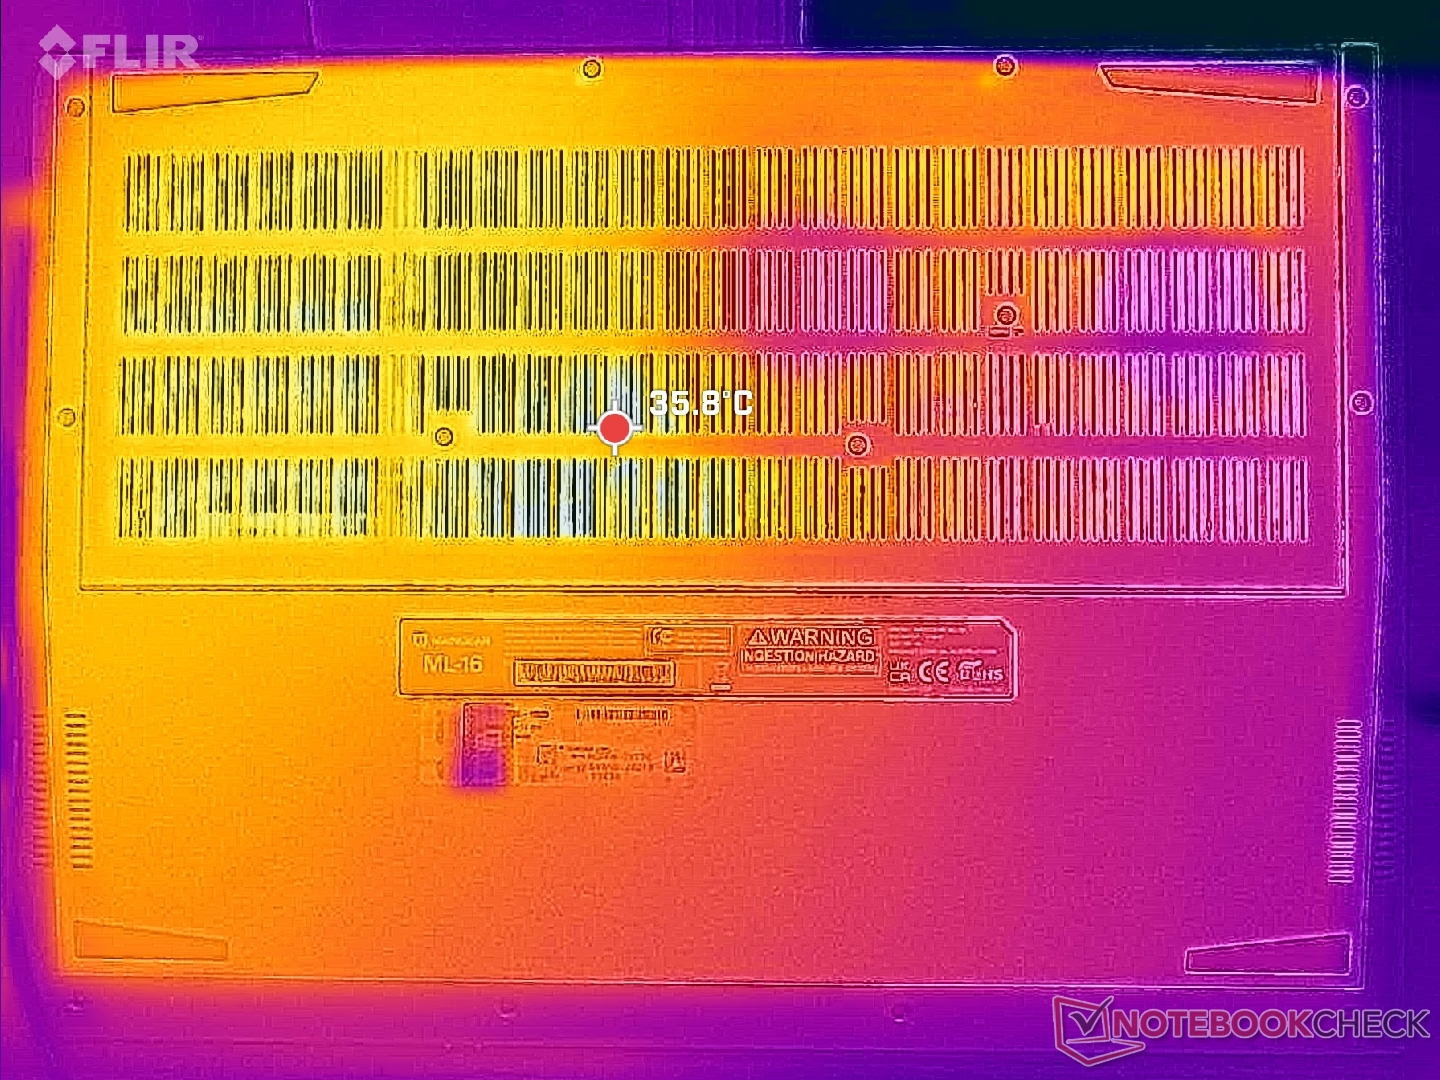
(-) Alt kısım, 43.2 °C / 110 F ortalamasına kıyasla maksimum 48.8 °C / 120 F'ye kadar ısınır
(+) Boşta kullanımda, üst tarafın ortalama sıcaklığı 31.9 °C / 89 F olup, cihazın 33.9 °C / 93 F.
(-) 3: The average temperature for the upper side is 40 °C / 104 F, compared to the average of 33.9 °C / 93 F for the class Gaming.
(+) Avuç içi dayanakları ve dokunmatik yüzey maksimum (34.6 °C / 94.3 F) cilt sıcaklığına ulaşıyor ve bu nedenle sıcak değil.
(-) Benzer cihazların avuç içi dayanağı alanının ortalama sıcaklığı 28.9 °C / 84 F (-5.7 °C / -10.3 F) idi.
| Maingear ML-16 MK2 Intel Core Ultra 7 155H, NVIDIA GeForce RTX 4070 Laptop GPU | Asus ROG Zephyrus G16 GA605WV AMD Ryzen AI 9 HX 370, NVIDIA GeForce RTX 4060 Laptop GPU | HP Victus 16 (2024) Intel Core i7-14700HX, NVIDIA GeForce RTX 4060 Laptop GPU | Alienware x16 R2 P120F Intel Core Ultra 9 185H, NVIDIA GeForce RTX 4080 Laptop GPU | Lenovo Legion Pro 5 16IRX9 Intel Core i9-14900HX, NVIDIA GeForce RTX 4070 Laptop GPU | Razer Blade 16 2024, RTX 4090 Intel Core i9-14900HX, NVIDIA GeForce RTX 4090 Laptop GPU | |
|---|---|---|---|---|---|---|
| Heat | 8% | 12% | -4% | 0% | 12% | |
| Maximum Upper Side * | 45.2 | 48.2 -7% | 50 -11% | 51 -13% | 43.8 3% | 45 -0% |
| Maximum Bottom * | 48.8 | 51.3 -5% | 50 -2% | 50.8 -4% | 55.4 -14% | 45 8% |
| Idle Upper Side * | 34.8 | 28 20% | 25 28% | 36.6 -5% | 32.8 6% | 29 17% |
| Idle Bottom * | 38.2 | 28.8 25% | 26 32% | 35.2 8% | 36 6% | 30 21% |
* ... daha küçük daha iyidir
Konuşmacılar
Maingear ML-16 MK2 ses analizi
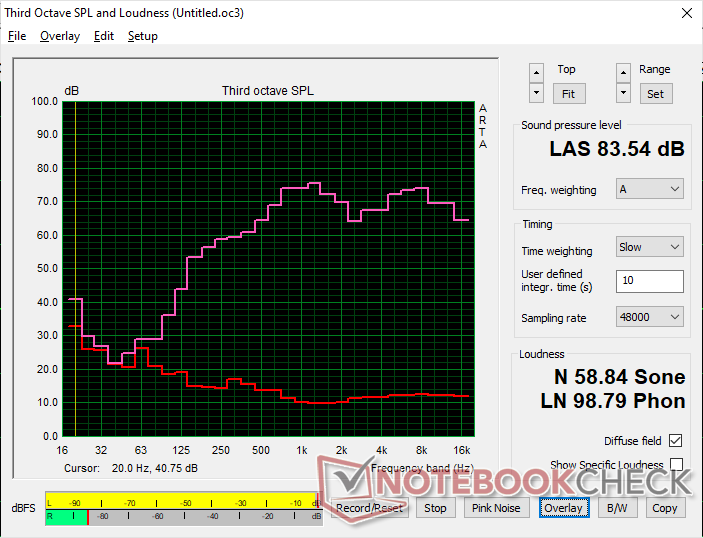
(+) | hoparlörler nispeten yüksek sesle çalabilir (83.5 dB)
Bas 100 - 315Hz
(-) | neredeyse hiç bas yok - ortalama olarak medyandan 16.1% daha düşük
(±) | Bas doğrusallığı ortalamadır (9.2% delta - önceki frekans)
Ortalar 400 - 2000 Hz
(+) | dengeli ortalar - medyandan yalnızca 4.9% uzakta
(+) | orta frekanslar doğrusaldır (4.9% deltadan önceki frekansa)
Yüksekler 2 - 16 kHz
(+) | dengeli yüksekler - medyandan yalnızca 3.3% uzakta
(+) | yüksekler doğrusaldır (5.1% deltadan önceki frekansa)
Toplam 100 - 16.000 Hz
(+) | genel ses doğrusaldır (13.7% ortancaya göre fark)
Aynı sınıfla karşılaştırıldığında
» Bu sınıftaki tüm test edilen cihazların %20%'si daha iyi, 6% benzer, 74% daha kötüydü
» En iyisinin deltası 6% idi, ortalama 18% idi, en kötüsü 132% idi
Test edilen tüm cihazlarla karşılaştırıldığında
» Test edilen tüm cihazların %13'si daha iyi, 4 benzer, % 83 daha kötüydü
» En iyisinin deltası 4% idi, ortalama 24% idi, en kötüsü 134% idi
Apple MacBook Pro 16 2021 M1 Pro ses analizi
(+) | hoparlörler nispeten yüksek sesle çalabilir (84.7 dB)
Bas 100 - 315Hz
(+) | iyi bas - medyandan yalnızca 3.8% uzakta
(+) | bas doğrusaldır (5.2% delta ile önceki frekans)
Ortalar 400 - 2000 Hz
(+) | dengeli ortalar - medyandan yalnızca 1.3% uzakta
(+) | orta frekanslar doğrusaldır (2.1% deltadan önceki frekansa)
Yüksekler 2 - 16 kHz
(+) | dengeli yüksekler - medyandan yalnızca 1.9% uzakta
(+) | yüksekler doğrusaldır (2.7% deltadan önceki frekansa)
Toplam 100 - 16.000 Hz
(+) | genel ses doğrusaldır (4.6% ortancaya göre fark)
Aynı sınıfla karşılaştırıldığında
» Bu sınıftaki tüm test edilen cihazların %0%'si daha iyi, 0% benzer, 100% daha kötüydü
» En iyisinin deltası 5% idi, ortalama 18% idi, en kötüsü 45% idi
Test edilen tüm cihazlarla karşılaştırıldığında
» Test edilen tüm cihazların %0'si daha iyi, 0 benzer, % 100 daha kötüydü
» En iyisinin deltası 4% idi, ortalama 24% idi, en kötüsü 134% idi
Enerji Yönetimi
Güç Tüketimi
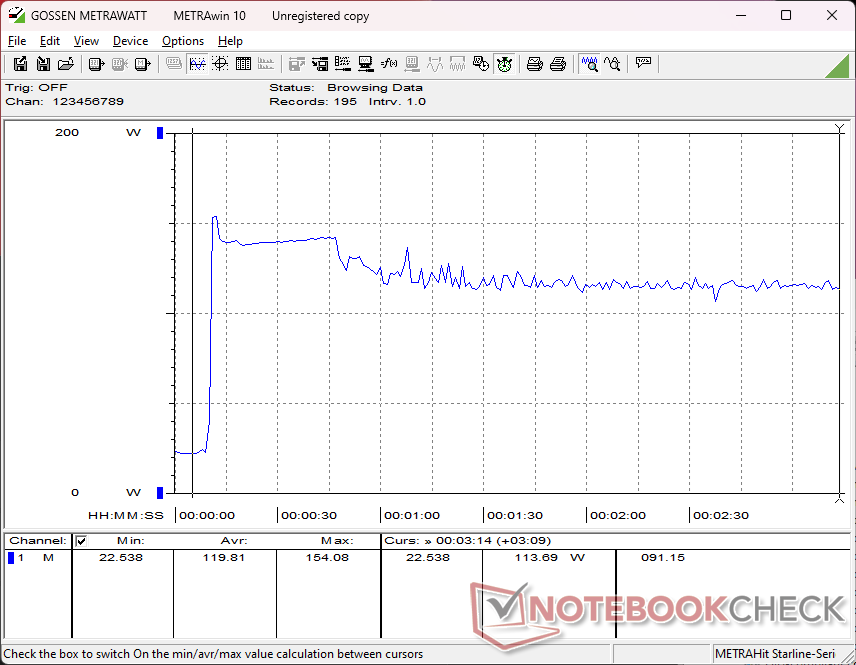
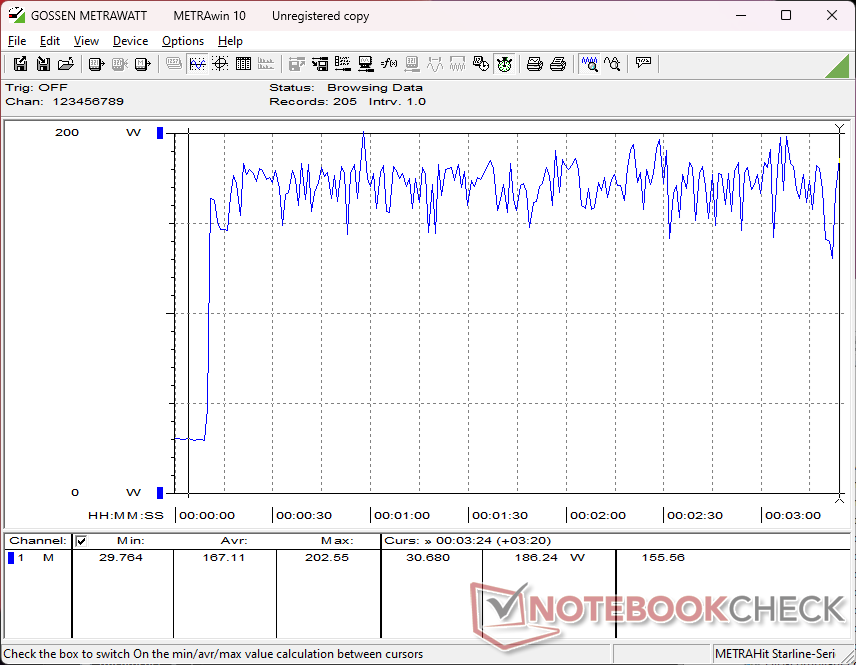
Rölantide çalışırken güç tüketimi, GPU ayarına ve parlaklık seviyesine bağlı olarak 7 W ila 27 W arasında değişmektedir ki bu rakiplerle karşılaştırıldığında daha geniş bir aralıktır. Bu aynı zamanda aşağıdaki bir sonraki bölümde yer alan nispeten kısa pil ömrünü de açıklamaktadır. Sadece dGPU modunu ve maksimum ekran parlaklığını etkinleştirmek, tüketimin 7 W'tan 23 W'a sıçramasına neden olur ve bu nedenle pil ömrü önemliyse MSHybrid modunda çalıştırılması önerilir.
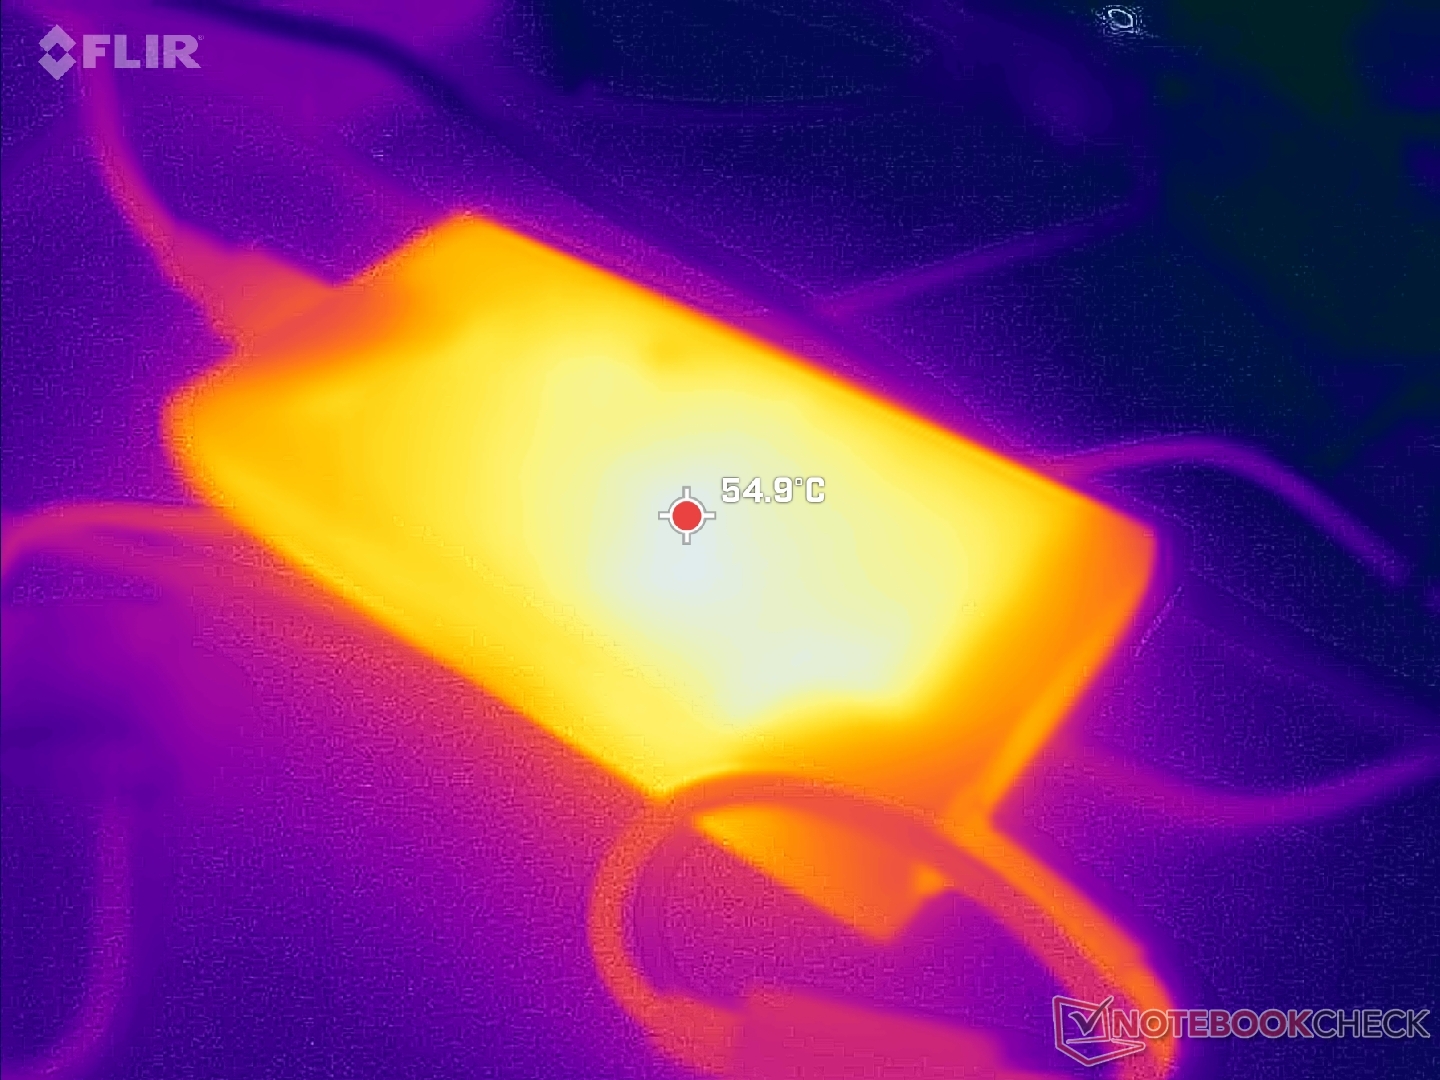
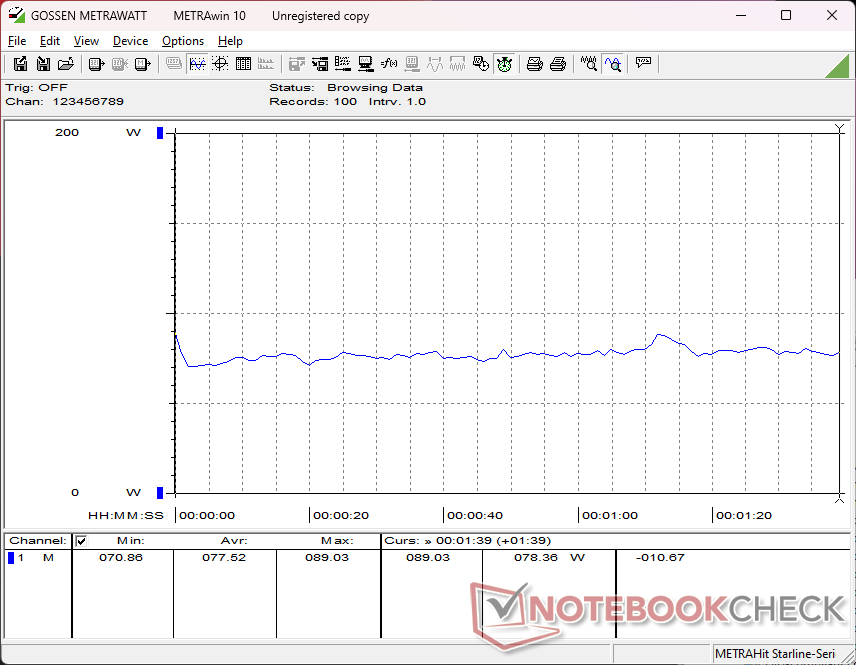
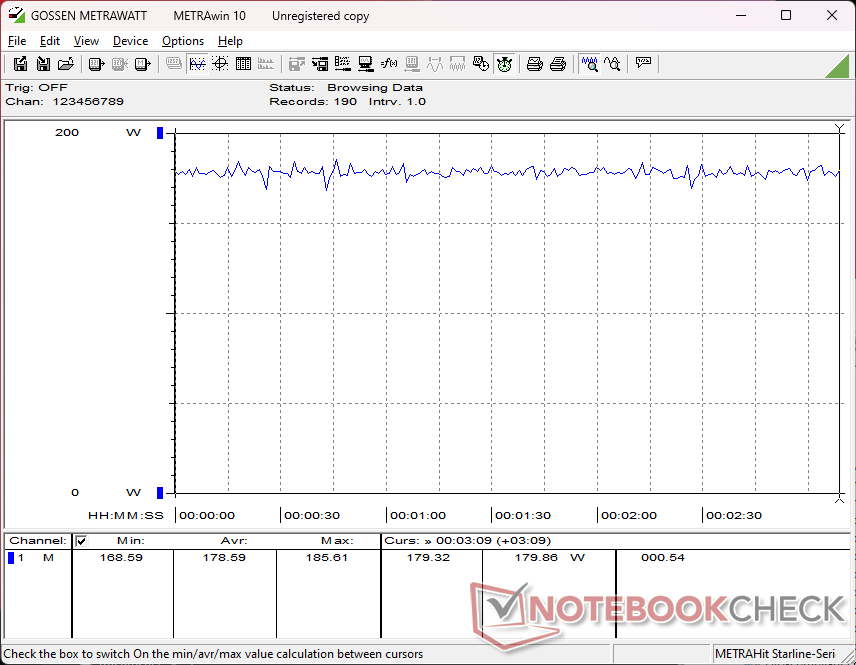
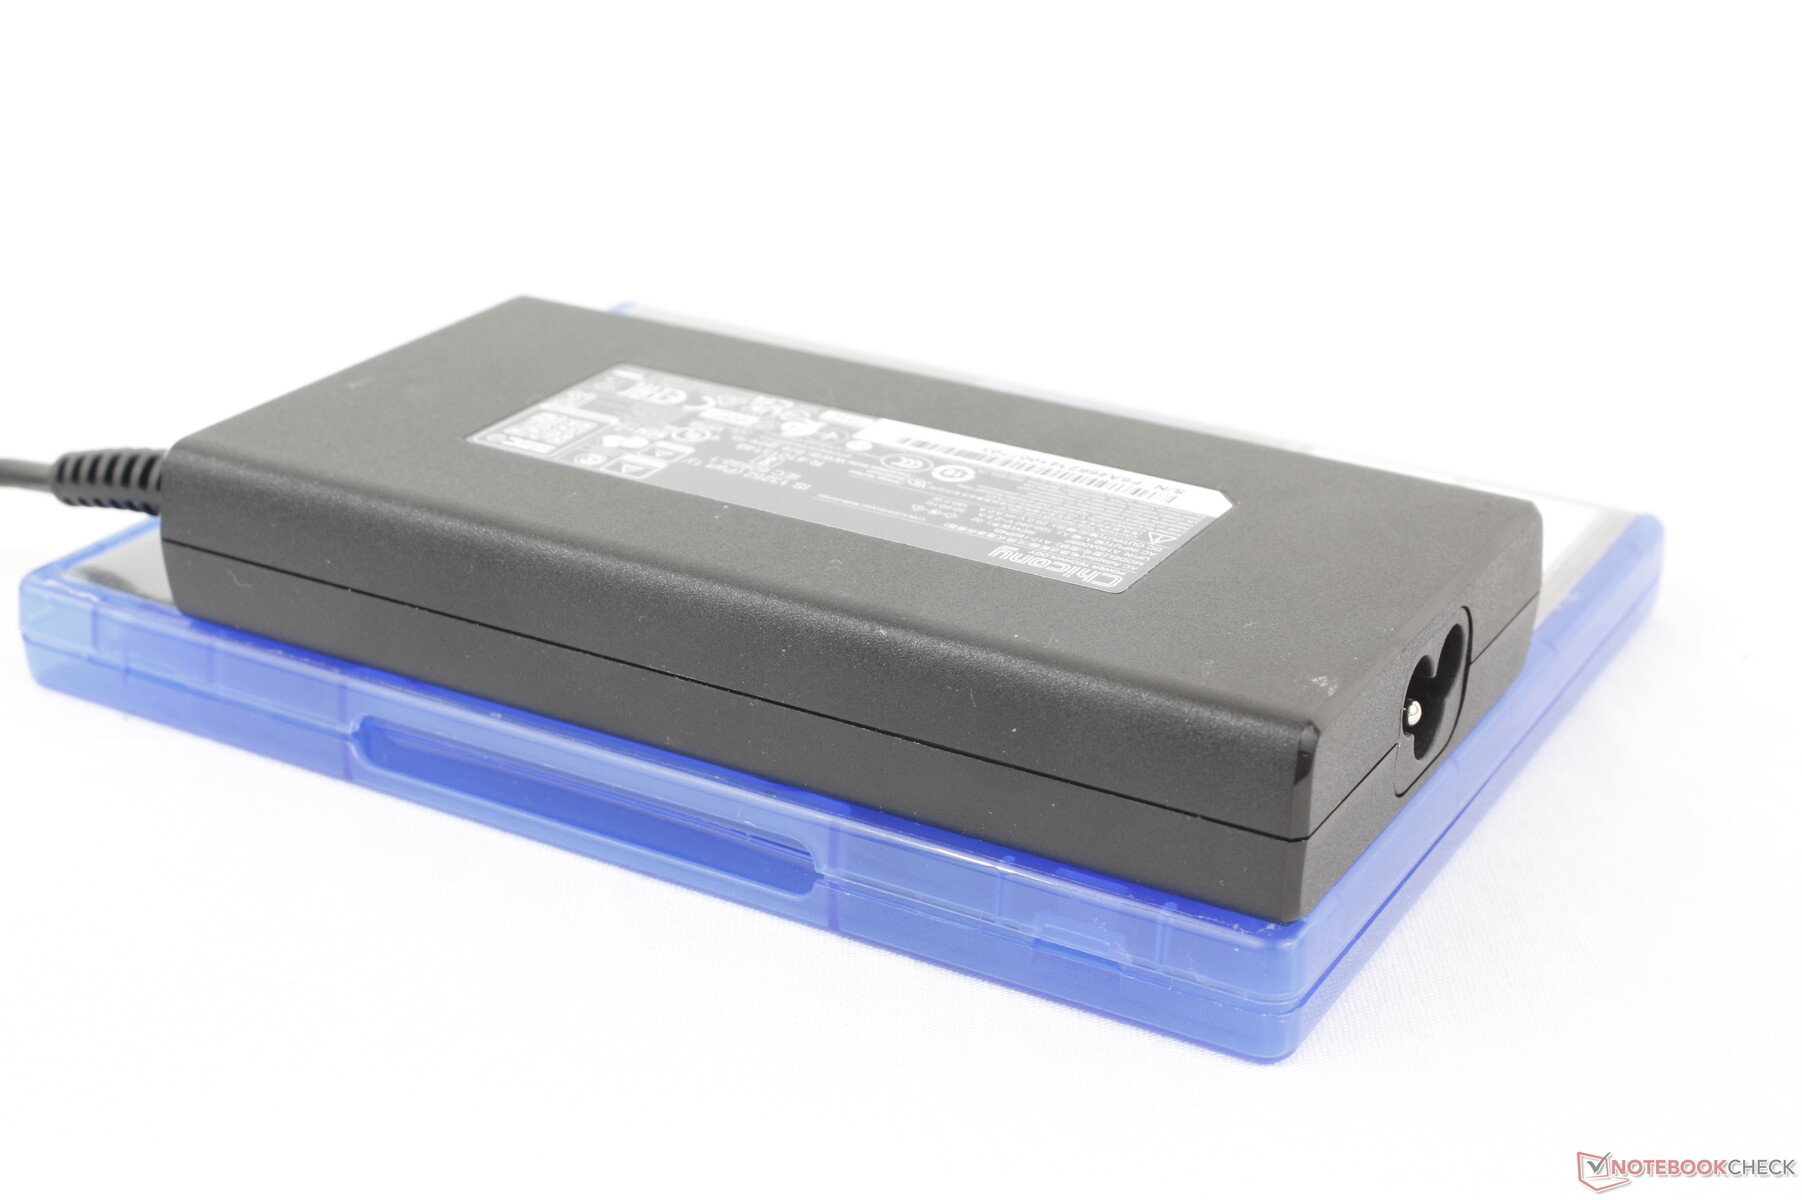
Oyun oynamak, orta büyüklükteki (~14,4 x 7,5 x 2,3 cm) 180 W AC adaptörden ortalama 179 W talep eder. Bu, aynı anda oyun çalıştırıldığında şarj hızının yavaşlayacağı anlamına gelir ve ayrıca modelin daha büyük 230 W AC adaptörle birlikte gönderilmesi durumunda performansın daha hızlı olabileceğini gösterir. Aslında, sistemin AC adaptörünün güvenli bir şekilde sağlayabileceğinden daha fazlasını talep edebileceğini kanıtlamak için CPU ve GPU tam kullanımdayken maksimum 203 W'lık bir çekim kaydedebiliyoruz. Bu, AC adaptörde gözlemlediğimizle benzerdir Lenovo Yoga Pro 9i 16 G9 burada 170 W AC adaptörünün Core Ultra H CPU ve RTX 4070 GPU için çok küçük olduğunu gördük.
| Kapalı / Bekleme modu | |
| Boşta | |
| Çalışırken |
|
Key:
min: | |
| Maingear ML-16 MK2 Ultra 7 155H, NVIDIA GeForce RTX 4070 Laptop GPU, , IPS, 2560x1600, 16" | Asus ROG Zephyrus G16 GA605WV Ryzen AI 9 HX 370, NVIDIA GeForce RTX 4060 Laptop GPU, Micron 2400 MTFDKBA1T0QFM, OLED, 2560x1600, 16" | HP Victus 16 (2024) i7-14700HX, NVIDIA GeForce RTX 4060 Laptop GPU, Kioxia XG8 KXG80ZNV512G, IPS, 1920x1080, 16.1" | Alienware x16 R2 P120F Ultra 9 185H, NVIDIA GeForce RTX 4080 Laptop GPU, WDC PC SN810 1TB, IPS, 2560x1600, 16" | Lenovo Legion Pro 5 16IRX9 i9-14900HX, NVIDIA GeForce RTX 4070 Laptop GPU, Samsung PM9A1 MZVL21T0HCLR, IPS, 2560x1600, 16" | Razer Blade 16 2024, RTX 4090 i9-14900HX, NVIDIA GeForce RTX 4090 Laptop GPU, Samsung PM9A1 MZVL22T0HBLB, OLED, 2560x1600, 16" | |
|---|---|---|---|---|---|---|
| Power Consumption | 24% | -9% | -20% | -29% | -39% | |
| Idle Minimum * | 7.7 | 6.9 10% | 9 -17% | 9.9 -29% | 12.5 -62% | 16.9 -119% |
| Idle Average * | 22.9 | 12.6 45% | 15 34% | 14.5 37% | 24.6 -7% | 17.8 22% |
| Idle Maximum * | 26.7 | 13 51% | 23 14% | 33.5 -25% | 24.8 7% | 19.6 27% |
| Load Average * | 77.5 | 84.1 -9% | 123 -59% | 97.5 -26% | 109.6 -41% | 128 -65% |
| Cyberpunk 2077 ultra external monitor * | 178.9 | 124.5 30% | ||||
| Cyberpunk 2077 ultra * | 178.6 | 127.2 29% | ||||
| Load Maximum * | 202.6 | 177.6 12% | 241 -19% | 315.2 -56% | 284.9 -41% | 328 -62% |
| Witcher 3 ultra * | 143.7 | 230 | 218 | 243 |
* ... daha küçük daha iyidir
Power Consumption Cyberpunk / Stress Test
Power Consumption external Monitor
Pil Ömrü
80 Wh pil kapasitesi, 16 inç ekran boyutu için ortalama bir değerdir. Ancak çalışma süreleri bir oyun dizüstü bilgisayarı için ortalamanın altında. MSHybrid aktifken Dengeli güç profiline ayarlandığında bile 3,5 saatin biraz üzerinde gerçek dünya WLAN taraması kaydedebildik Asus ROG Zephyrus G16 veya HP Victus 16.
Boş kapasiteden tam kapasiteye şarj etme 1 ila 1,5 saat arasında nispeten hızlıdır. Sistem, daha yavaş bir hızda olsa da üçüncü taraf USB-C AC adaptörleri ile de şarj edilebilir. İki USB-C bağlantı noktasından yalnızca birinin şarjı desteklediğini unutmayın.
| Maingear ML-16 MK2 Ultra 7 155H, NVIDIA GeForce RTX 4070 Laptop GPU, 80 Wh | Asus ROG Zephyrus G16 GA605WV Ryzen AI 9 HX 370, NVIDIA GeForce RTX 4060 Laptop GPU, 90 Wh | HP Victus 16 (2024) i7-14700HX, NVIDIA GeForce RTX 4060 Laptop GPU, 83 Wh | Alienware x16 R2 P120F Ultra 9 185H, NVIDIA GeForce RTX 4080 Laptop GPU, 90 Wh | Lenovo Legion Pro 5 16IRX9 i9-14900HX, NVIDIA GeForce RTX 4070 Laptop GPU, 80 Wh | Razer Blade 16 2024, RTX 4090 i9-14900HX, NVIDIA GeForce RTX 4090 Laptop GPU, 95.2 Wh | |
|---|---|---|---|---|---|---|
| Pil Çalışma Süresi | 62% | 134% | -11% | -13% | 16% | |
| Reader / Idle | 651 | 403 -38% | ||||
| WiFi v1.3 | 218 | 478 119% | 511 134% | 193 -11% | 290 33% | 329 51% |
| Load | 98 | 103 5% | 65 -34% | 79 -19% | ||
| H.264 | 824 | 456 |
Artılar
Eksiler
Karar - Şaşırtıcı Derecede Hafif, Ancak Biraz Fazla Sıcak
Maingear ML-16 MK2, büyük rakipleriyle kıyaslandığında birkaç özelliğe sahiptir. En önemlileri, her zaman evde oyun oynamayan kullanıcılara yardımcı olmak için hafifliği ve nispeten parlak ekranıdır. Bu arada, entegre numpad belirli oyun türleri ve elektronik tablo çalışmaları için yararlı olabilirken, kolay servis edilebilirlik meraklılar arasında her zaman takdir edilmektedir.
Ne yazık ki, model uzun bir dezavantajlar listesinden muzdarip. Birincisi, soğutma çözümü nispeten küçük ve rakip 16 inç oyun dizüstü bilgisayarları kadar yetkin değil. Bu nedenle çekirdek sıcaklıkları, yüzey sıcaklıkları ve fan gürültüsü, daha ağır dizüstü bilgisayarlar gibi alternatiflerden daha sıcak ve daha gürültülüdür Razer Blade 16 veya Lenovo Legion Pro. Şasi sertliği de daha zayıf ilk izlenimler için söz konusu rakiplerden daha zayıftır. Bu aksaklıklar kısmen daha hafif ağırlığa bağlanabilir, çünkü sonuç olarak şasi ve soğutma çözümünde köşeler kesilmiştir. Başka bir deyişle, daha hafif ve daha taşınabilir ağırlık için bazı önemli fedakarlıklar yapacaksınız.
Maingear ML-16 MK2 beklediğimizden daha hafif ve daha parlak. Bununla birlikte, sıcaklık ve fan gürültüsü daha iyi olabilirken, birkaç gelişmiş özellikten yoksundur.
Optimus 2.0, HDR, OLED, tuş başına RGB aydınlatma, buhar odası soğutması ve sıvı metal arayüz gibi diğer gelişmiş özelliklerin tümü ML-16 MK2'de mevcut değil. Bu tür eksiklikler 1500 dolar aralığında kabul edilebilir olabilir, ancak RTX 4070 yapılandırmamız için istenen 2000 dolarlık fiyatı göz önünde bulundurarak biraz daha fazlasını bekliyorduk.
Fiyat ve Bulunabilirlik
Maingear şimdi gönderiliyor mL-16 Mark 2'yi GeForce RTX 4060 ile 1800 dolara veya incelendiği gibi RTX 4070 ile 2000 dolara satın alabilirsiniz.
Not: Derecelendirme sistemimizi yakın zamanda güncelledik ve 8. sürümün sonuçları 7. sürümün sonuçları ile karşılaştırılamaz. Daha fazla bilgi için burada .
Maingear ML-16 MK2
- 09/17/2024 v8
Allen Ngo
 Total Sustainability Score:
 Şeffaflık
İncelenecek cihazların seçimi editör ekibimiz tarafından yapılır. Test örneği, bu incelemenin amacı doğrultusunda üretici veya perakendeci tarafından yazara ödünç olarak sağlanmıştır. Borç verenin bu inceleme üzerinde herhangi bir etkisi olmadığı gibi, üretici de yayınlanmadan önce bu incelemenin bir kopyasını almamıştır. Bu incelemeyi yayınlama zorunluluğu yoktu. İncelemelerimiz karşılığında asla tazminat veya ödeme kabul etmiyoruz. Bağımsız bir medya şirketi olarak Notebookcheck, üreticilerin, perakendecilerin veya yayıncıların otoritesine tabi değildir.
Notebookcheck bu şekilde test yapıyor
Notebookcheck, tüm sonuçların karşılaştırılabilir olmasını sağlamak için her yıl yüzlerce dizüstü bilgisayarı ve akıllı telefonu standart prosedürler kullanarak bağımsız olarak inceliyor. Yaklaşık 20 yıldır test yöntemlerimizi sürekli olarak geliştirdik ve bu süreçte endüstri standartlarını belirledik. Test laboratuvarlarımızda deneyimli teknisyenler ve editörler tarafından yüksek kaliteli ölçüm ekipmanları kullanılmaktadır. Bu testler çok aşamalı bir doğrulama sürecini içerir. Karmaşık derecelendirme sistemimiz, nesnelliği koruyan yüzlerce sağlam temellere dayanan ölçüm ve kıyaslamaya dayanmaktadır.Price comparison

