

Nvidia RTX 3500 Ada performansı ilk kez görücüye çıktı: HP ZBook Fury 16 G11 iş istasyonu incelemesi
2024 ZBook Fury 16 G11'in yerini 2023 Fury 16 G10 raptor Lake-HX CPU'ları daha yeni Raptor Lake-HX Refresh seçenekleriyle değiştirerek. Aksi takdirde kasa, yapılandırılabilir seçeneklerin çoğu gibi Fury 16 G10 veya Fury 16 G9 ile aynı kalır. İncelememize göz atmanızı öneririz Fury 16 G9 modelin fiziksel özellikleri hakkında daha fazla bilgi edinmek için.
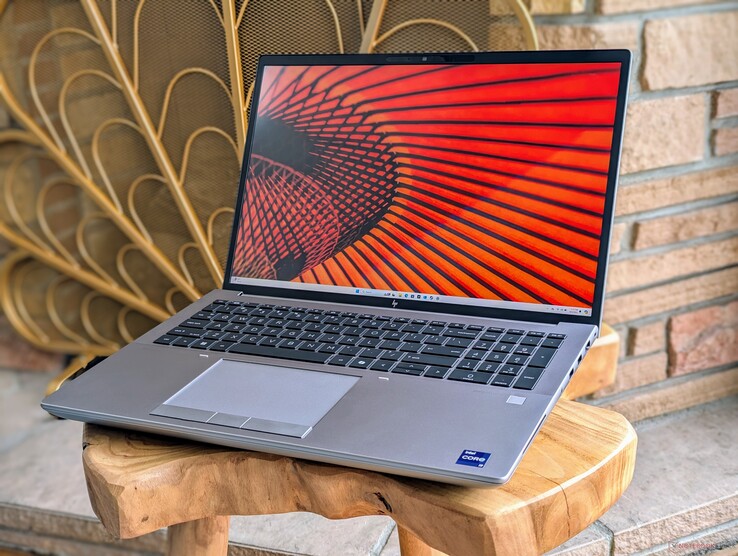
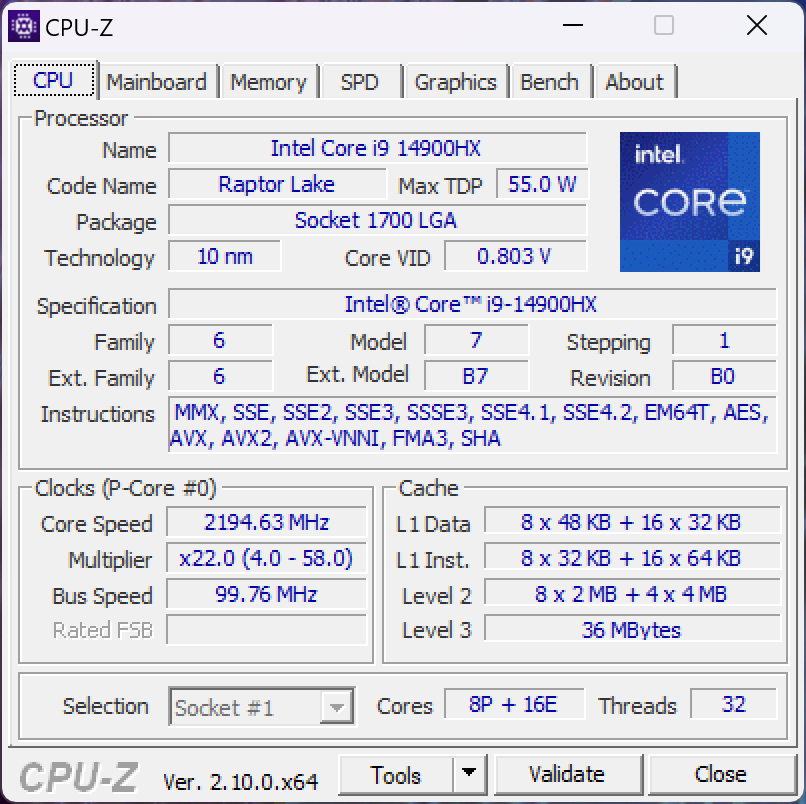
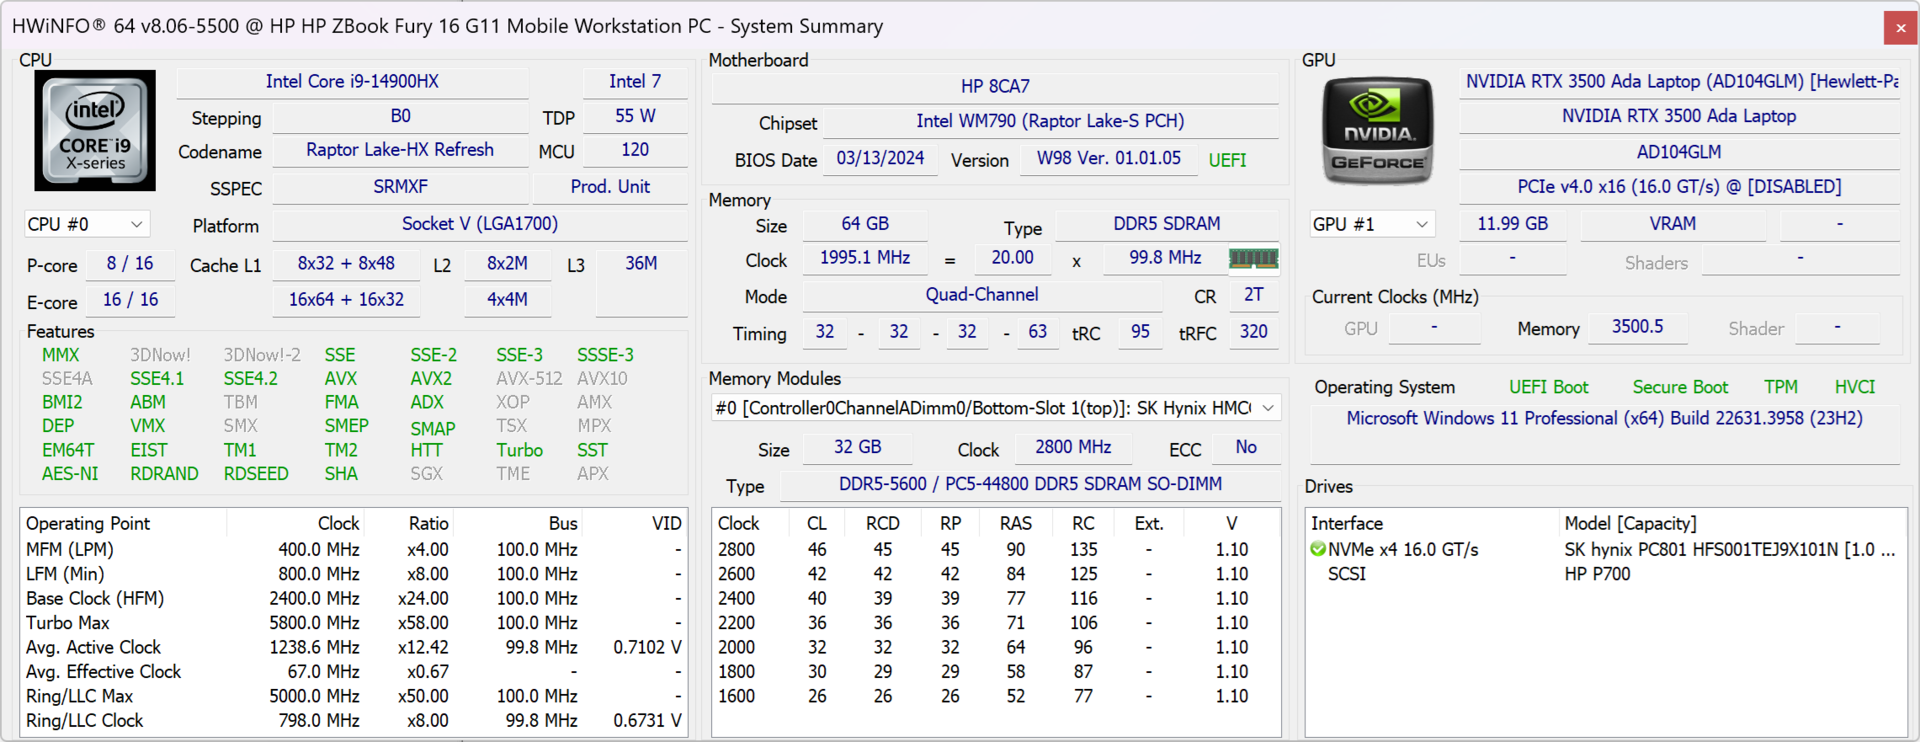
Test ünitemiz Core i9-14900HX CPU, RTX 3500 Ada GPU ve 120 Hz 3840 x 2400 IPS ekran ile yaklaşık 3300 $'a üst-orta seviye bir konfigürasyondur. Diğer SKU'lar Core i5-13600HX ile başlayıp RTX 5000 Ada ve 2400p OLED dokunmatik ekrana kadar uzanıyor. Meteor Lake CPU seçeneği yoktur.
ZBook Fury 16 G11'in rakipleri arasında aşağıdaki gibi diğer 16 inç iş istasyonları yer alıyor Dell Precision 5690, Lenovo ThinkPad P16 G2veya Asus ProArt Studiobook 16.
Daha fazla HP incelemesi:
Karşılaştırmalı olarak olası rakipler
Derecelendirme | Sürüm | Tarih | Modeli | Ağırlık | Yükseklik | Boyut | Çözünürlük | Fiyat |
|---|---|---|---|---|---|---|---|---|
| 85.9 % | v8 | 08/2024 | HP ZBook Fury 16 G11 i9-14900HX, NVIDIA RTX 3500 Ada Generation Laptop GPU | 2.6 kg | 28.5 mm | 16.00" | 3840x2400 | |
| 92.3 % v7 (old) | v7 (old) | 09/2023 | HP ZBook Fury 16 G10 i9-13950HX, NVIDIA RTX 5000 Ada Generation Laptop GPU | 2.6 kg | 28.5 mm | 16.00" | 3840x2400 | |
| 91 % v7 (old) | v7 (old) | HP ZBook Fury 16 G9 i9-12950HX, RTX A5500 Laptop GPU | 2.6 kg | 28.5 mm | 16.00" | 3840x2400 | ||
| 88.3 % v7 (old) | v7 (old) | 05/2024 | Dell Precision 5690 Ultra 9 185H, NVIDIA RTX 5000 Ada Generation Laptop GPU | 2.3 kg | 22.17 mm | 16.00" | 3840x2400 | |
| 90.2 % v7 (old) | v7 (old) | 03/2024 | Lenovo ThinkPad P16 G2 21FA000FGE i7-13700HX, NVIDIA RTX 2000 Ada Generation Laptop GPU | 3 kg | 30.23 mm | 16.00" | 2560x1600 | |
| 90.1 % v7 (old) | v7 (old) | 12/2023 | Lenovo ThinkPad P1 G6 21FV001KUS i7-13800H, NVIDIA GeForce RTX 4080 Laptop GPU | 1.9 kg | 17.5 mm | 16.00" | 3480x2400 | |
| 86.1 % v7 (old) | v7 (old) | 07/2023 | Asus ProArt Studiobook 16 OLED H7604 i9-13980HX, NVIDIA GeForce RTX 4070 Laptop GPU | 2.4 kg | 23.9 mm | 16.00" | 3200x2000 |
İpucu: Derecelendirme Sistemimizi kısa bir süre önce güncelledik ve Sürüm 8'in sonuçları Sürüm 7'nin sonuçlarıyla karşılaştırılamaz. Daha fazla bilgi için hier verfügbar.
Not: Derecelendirme sistemimizi yakın zamanda güncelledik ve 8. sürümün sonuçları 7. sürümün sonuçları ile karşılaştırılamaz. Daha fazla bilgi için burada .
Dava
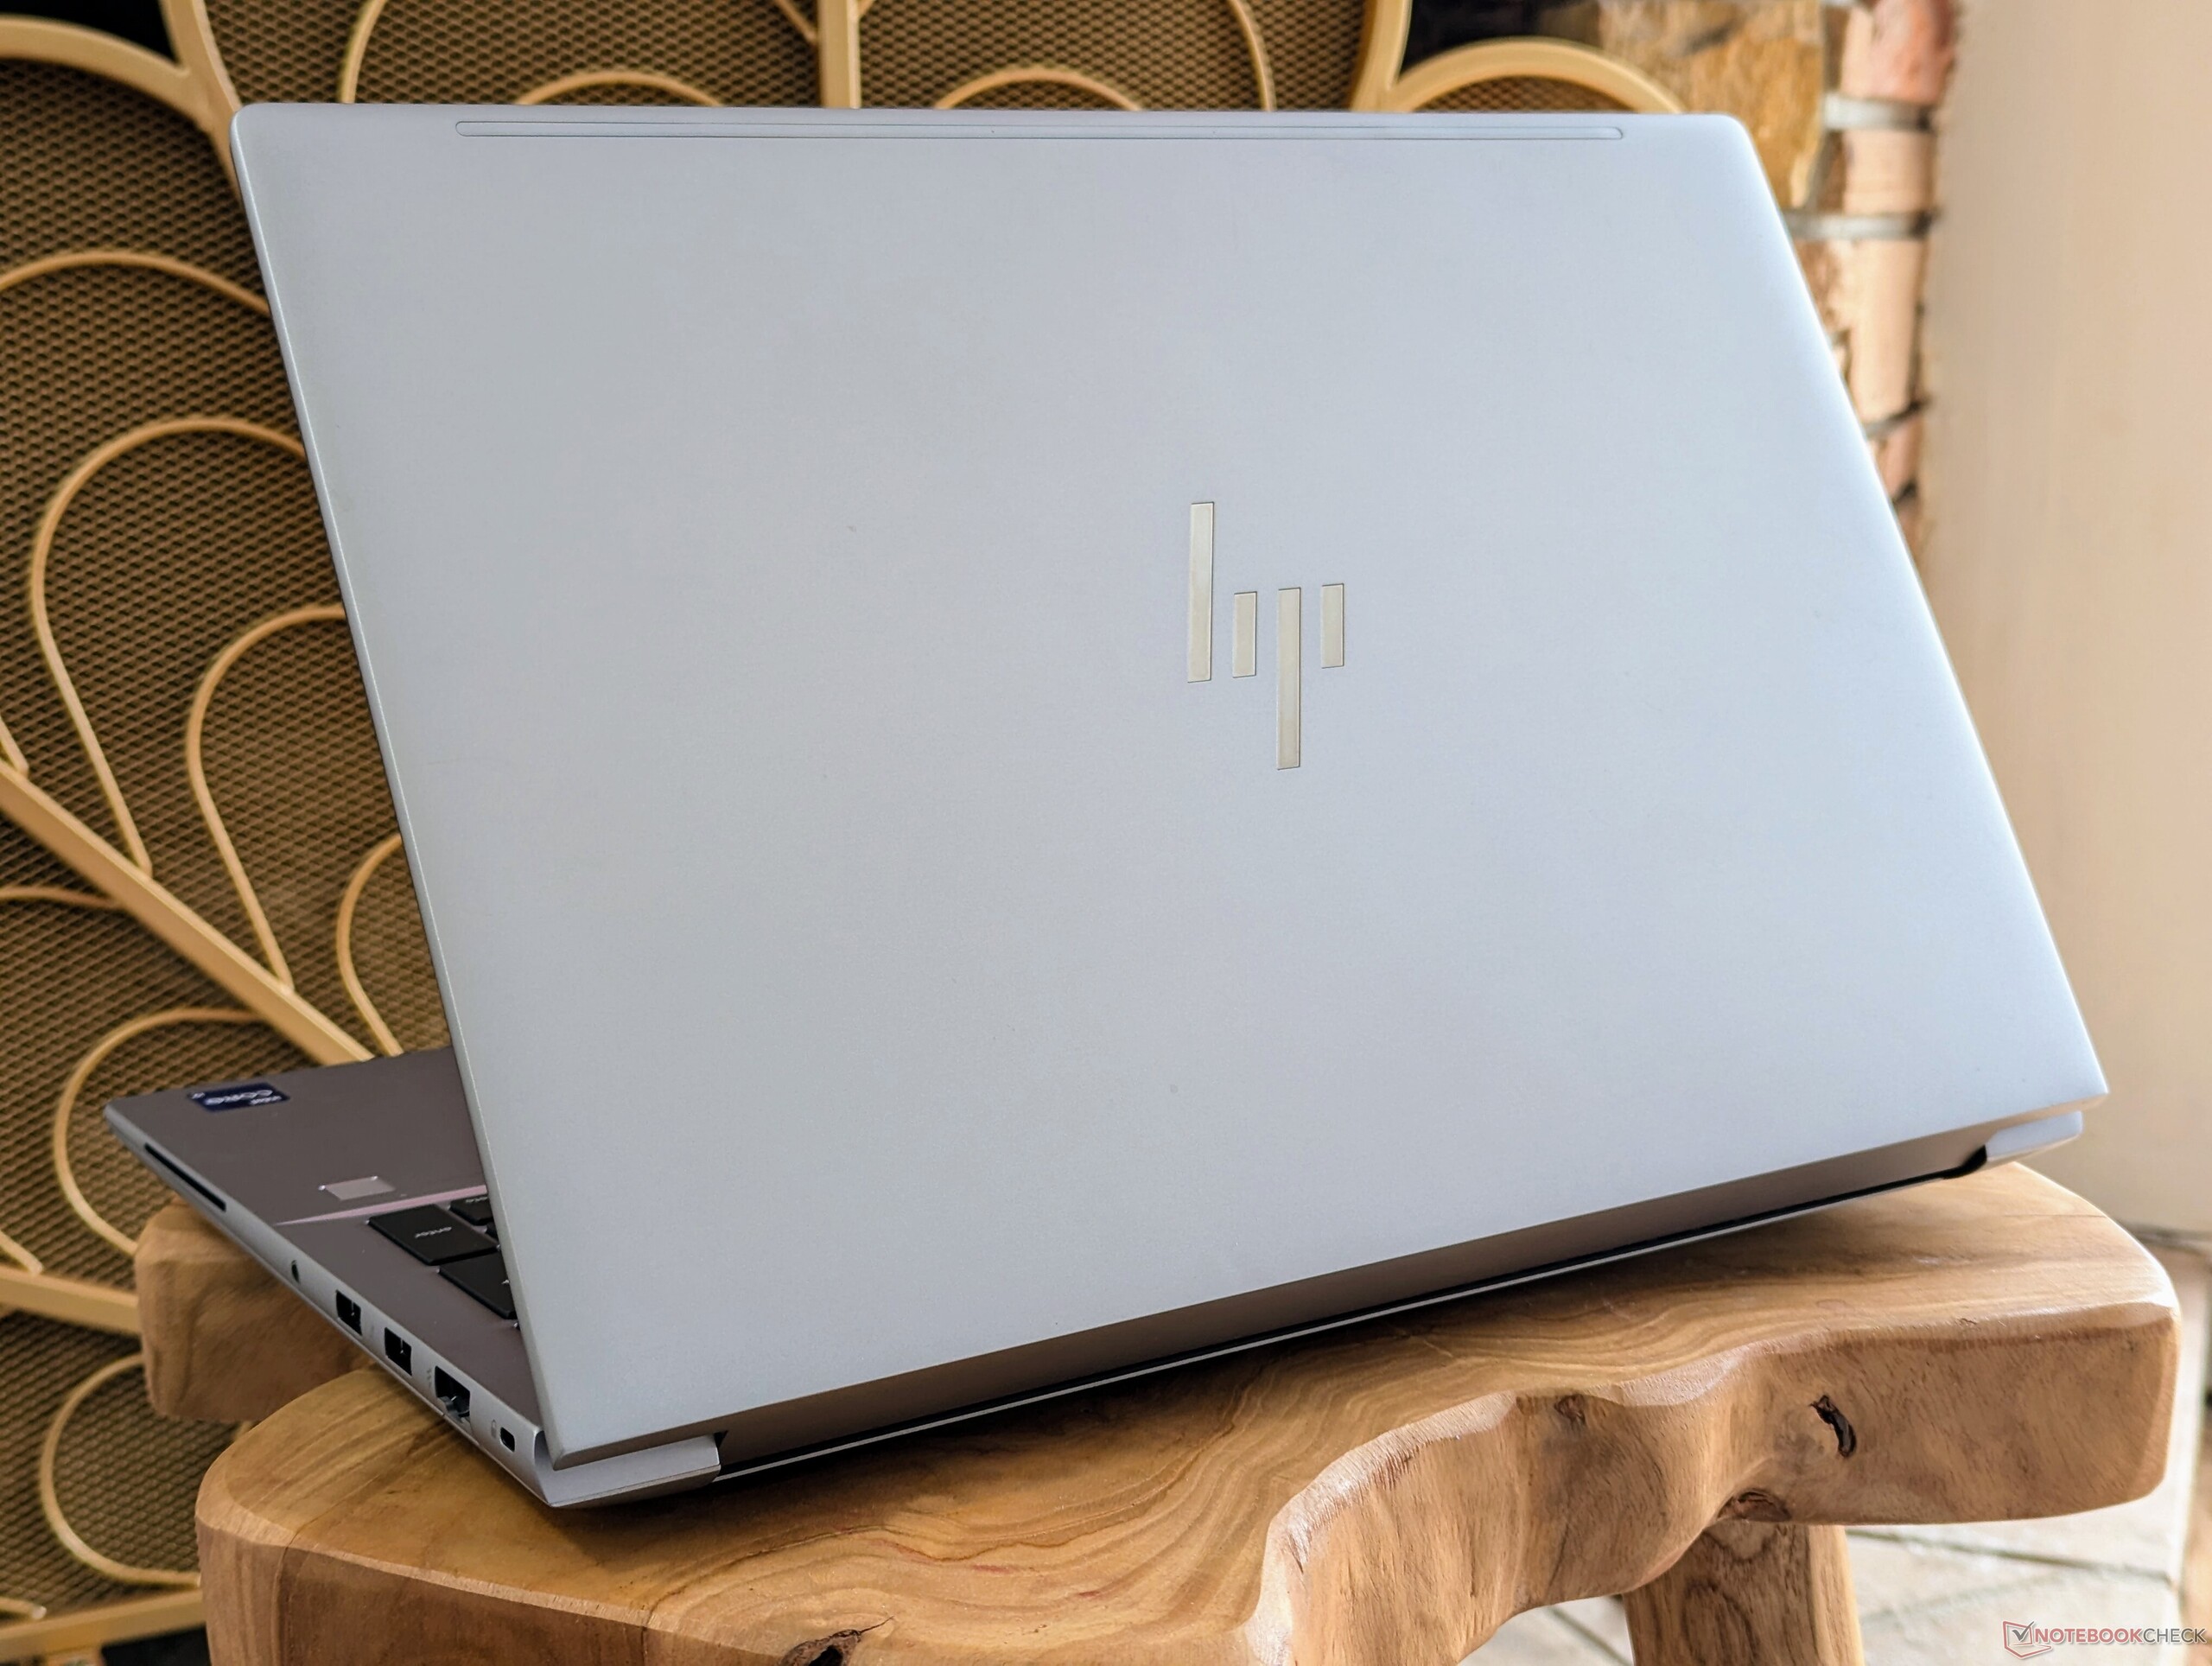
ZBook Fury 16 G11'i önceki modellerden ayırt etmenin kolay bir yolu klavyedeki Co-Pilot tuşunu aramaktır. Aksi takdirde, kasa tasarımı öncekiyle aynı kalır.
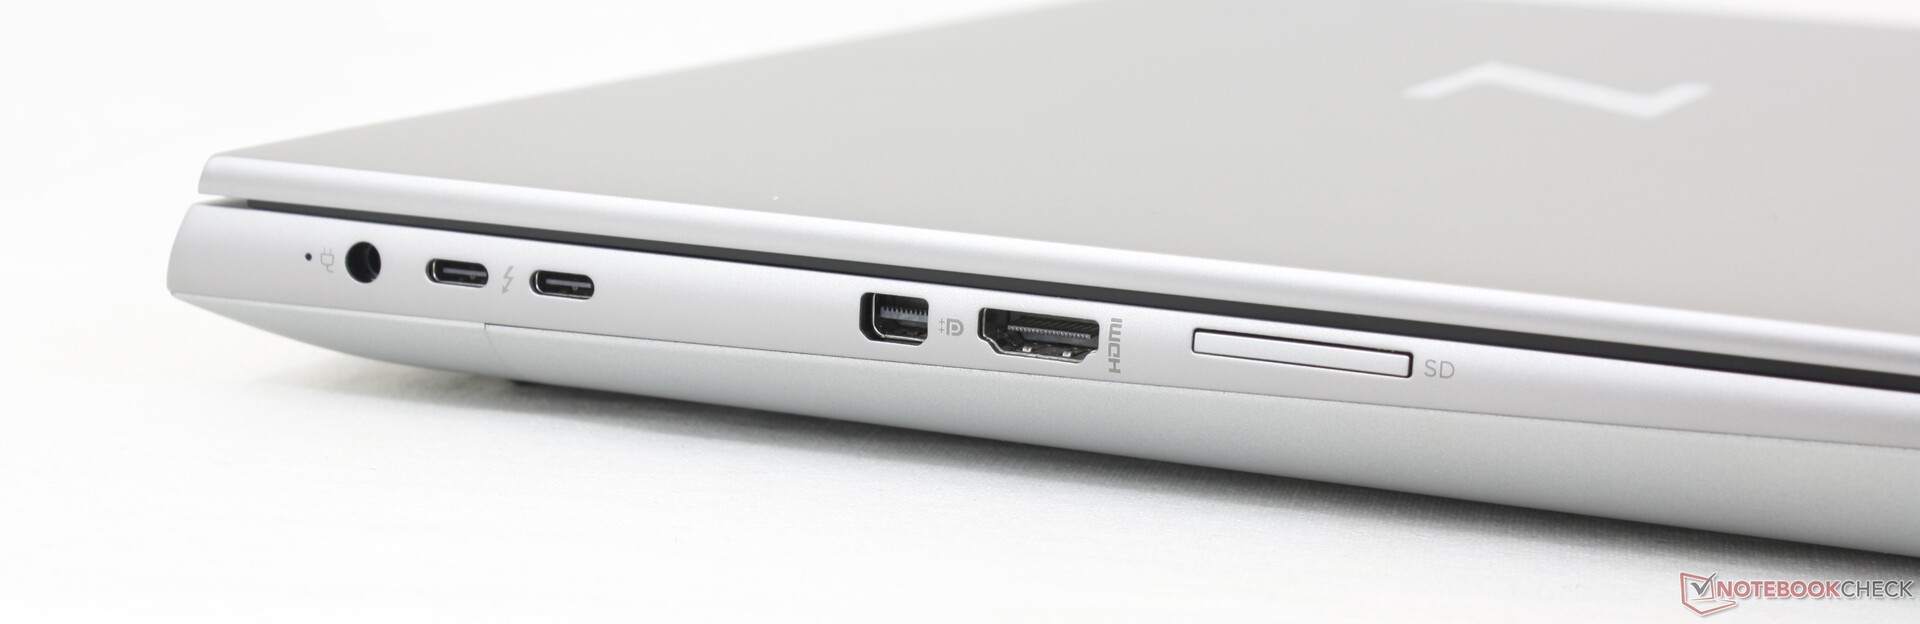
Bağlanabilirlik
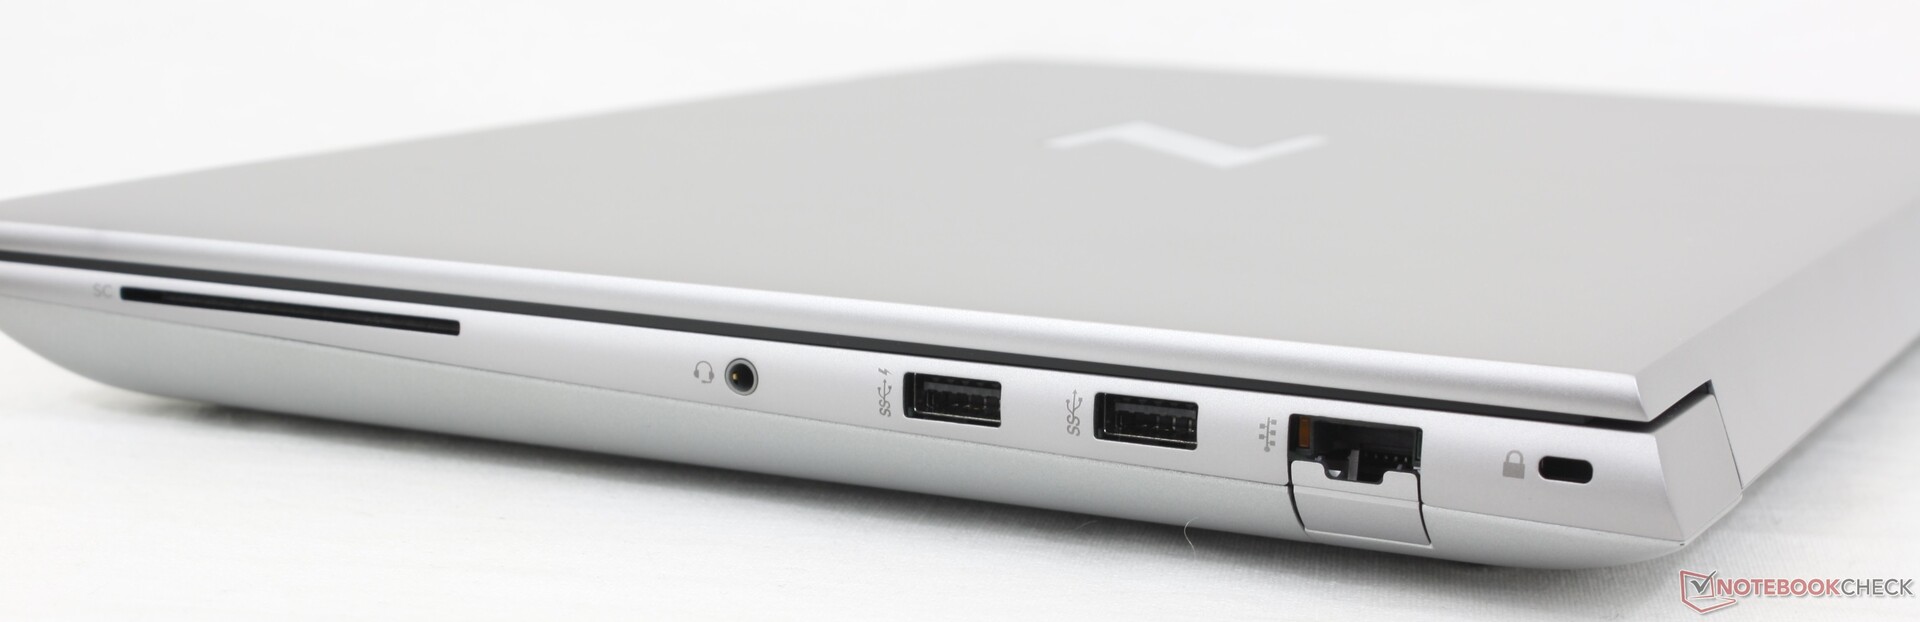
SD Kart Okuyucu
| SD Card Reader | |
| average JPG Copy Test (av. of 3 runs) | |
| Lenovo ThinkPad P1 G6 21FV001KUS (Toshiba Exceria Pro SDXC 64 GB UHS-II) | |
| HP ZBook Fury 16 G11 (Toshiba Exceria Pro SDXC 64 GB UHS-II) | |
| HP ZBook Fury 16 G10 (Toshiba Exceria Pro SDXC 64 GB UHS-II) | |
| HP ZBook Fury 16 G9 (PNY EliteX-PRO60) | |
| Asus ProArt Studiobook 16 OLED H7604 (Angelibird AV Pro V60) | |
| Lenovo ThinkPad P16 G2 21FA000FGE | |
| maximum AS SSD Seq Read Test (1GB) | |
| HP ZBook Fury 16 G11 (Toshiba Exceria Pro SDXC 64 GB UHS-II) | |
| Lenovo ThinkPad P1 G6 21FV001KUS (Toshiba Exceria Pro SDXC 64 GB UHS-II) | |
| HP ZBook Fury 16 G10 (Toshiba Exceria Pro SDXC 64 GB UHS-II) | |
| HP ZBook Fury 16 G9 (PNY EliteX-PRO60) | |
| Lenovo ThinkPad P16 G2 21FA000FGE | |
| Asus ProArt Studiobook 16 OLED H7604 (Angelibird AV Pro V60) | |
İletişim
WLAN, uygun Wi-Fi 7 desteği için Intel AX211'den BE200'e yükseltilmiştir. Ancak pratikte çoğu kullanıcı Wi-Fi 6 veya 6E erişim noktalarına bağlanmaya devam edecektir.
| Networking | |
| iperf3 transmit AXE11000 | |
| Asus ProArt Studiobook 16 OLED H7604 | |
| HP ZBook Fury 16 G10 | |
| Dell Precision 5690 | |
| Lenovo ThinkPad P1 G6 21FV001KUS | |
| HP ZBook Fury 16 G11 | |
| HP ZBook Fury 16 G9 | |
| Lenovo ThinkPad P16 G2 21FA000FGE | |
| iperf3 receive AXE11000 | |
| Asus ProArt Studiobook 16 OLED H7604 | |
| Lenovo ThinkPad P16 G2 21FA000FGE | |
| Dell Precision 5690 | |
| HP ZBook Fury 16 G9 | |
| HP ZBook Fury 16 G10 | |
| Lenovo ThinkPad P1 G6 21FV001KUS | |
| HP ZBook Fury 16 G11 | |
| iperf3 transmit AXE11000 6GHz | |
| HP ZBook Fury 16 G11 | |
| HP ZBook Fury 16 G10 | |
| Dell Precision 5690 | |
| Lenovo ThinkPad P1 G6 21FV001KUS | |
| Lenovo ThinkPad P16 G2 21FA000FGE | |
| iperf3 receive AXE11000 6GHz | |
| Lenovo ThinkPad P16 G2 21FA000FGE | |
| HP ZBook Fury 16 G11 | |
| Dell Precision 5690 | |
| HP ZBook Fury 16 G10 | |
| Lenovo ThinkPad P1 G6 21FV001KUS | |
Web kamerası


Bakım
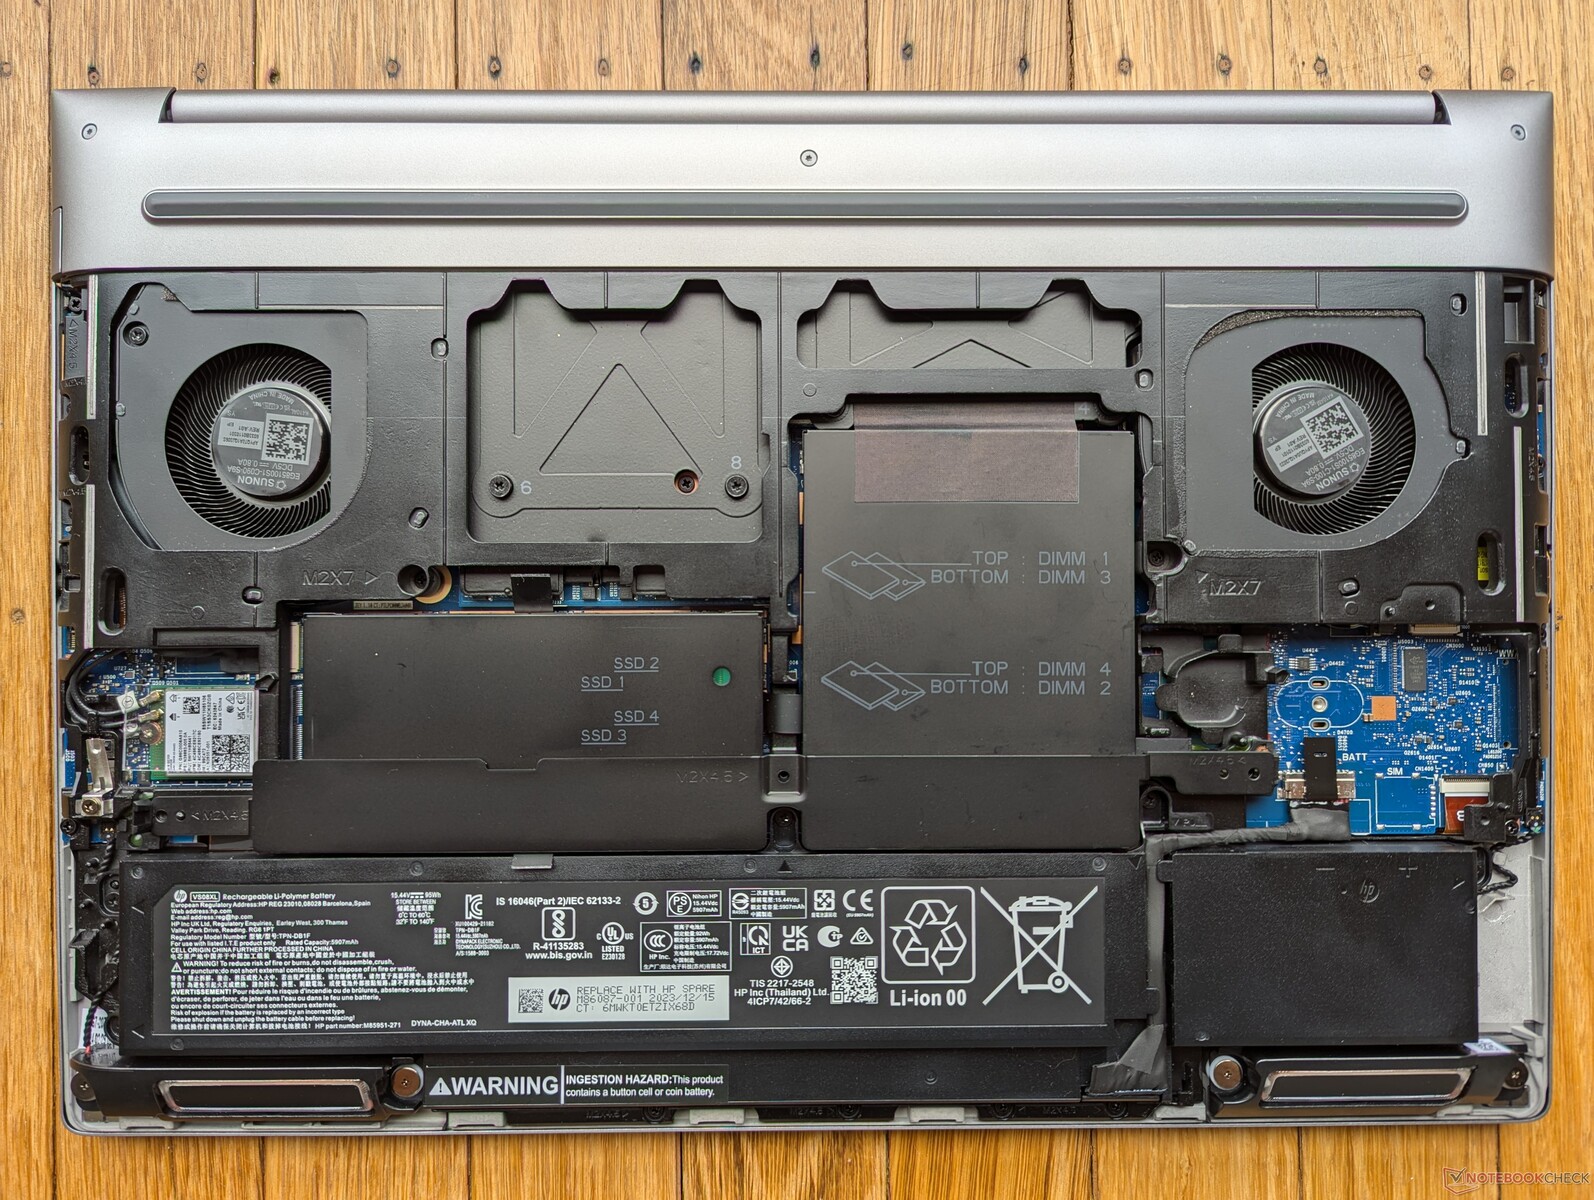
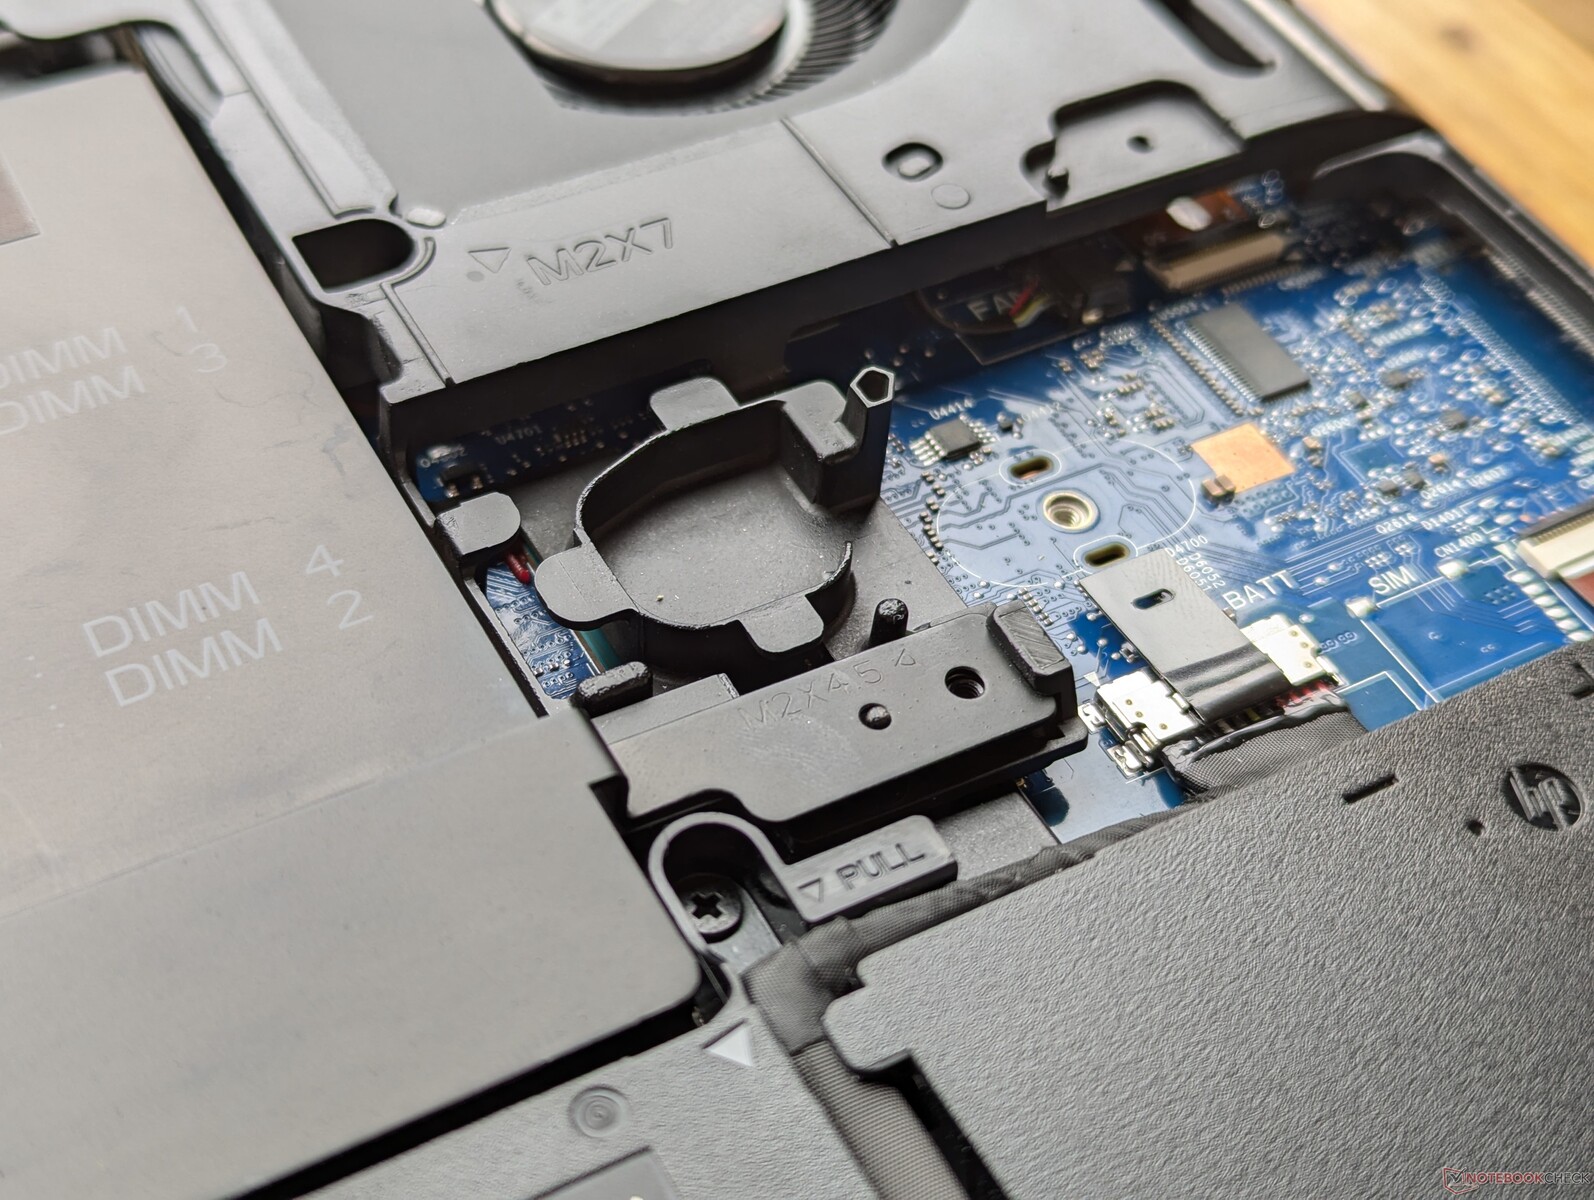
HP, geçen yılın başlarındaki G9 modelinden bu yana Fury 16 serisi için aletsiz servis hizmetiyle övünüyor. Alt panel herhangi bir alet kullanmadan kolayca kayarak çıkarken, RAM ve SODIMM modülleri hala çıkarılması için tornavida gerektiren alüminyum bir kapakla korunuyordu. Bu alüminyum kapak, G11 modelinde vidalar yerine mandallarla yeniden tasarlandı, yani kullanıcılar artık RAM modüllerini herhangi bir alet kullanmadan takabiliyor.
Ancak SSD'ler hala anakarta vidalarla sabitlenmiştir ve bu nedenle sürücüleri değiştirirken hala bir tornavidaya ihtiyaç vardır. Sistem dört adede kadar SSD ve dört RAM modülünü destekleyebiliyor.


Sürdürülebilirlik
Ambalaj tamamen geri dönüştürülebilir ve çoğunlukla kağıttan oluşuyor. AC adaptörü, plastikle sarılmış olarak gelen tek öğedir.
Aksesuarlar ve Garanti
Perakende kutusunda AC adaptörü ve evraklar dışında ekstra bir şey bulunmuyor. ABD'de satın alındığında üç yıllık üretici garantisi standarttır.
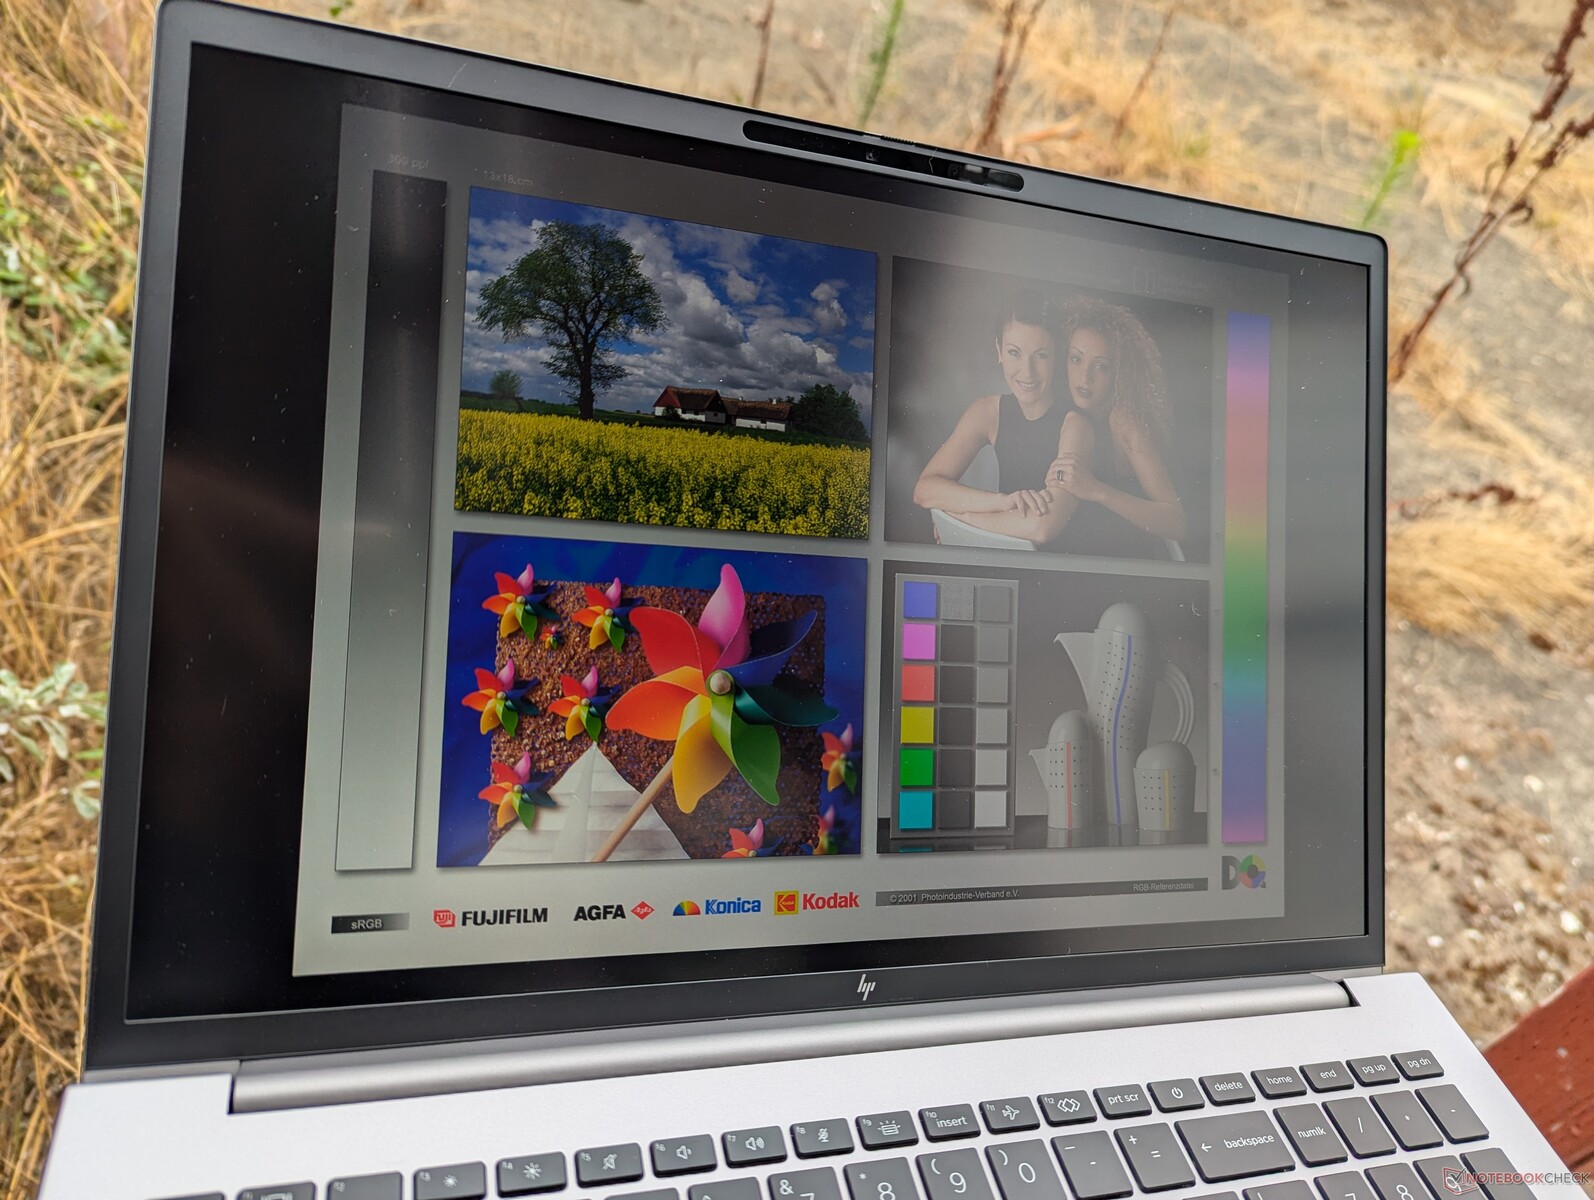
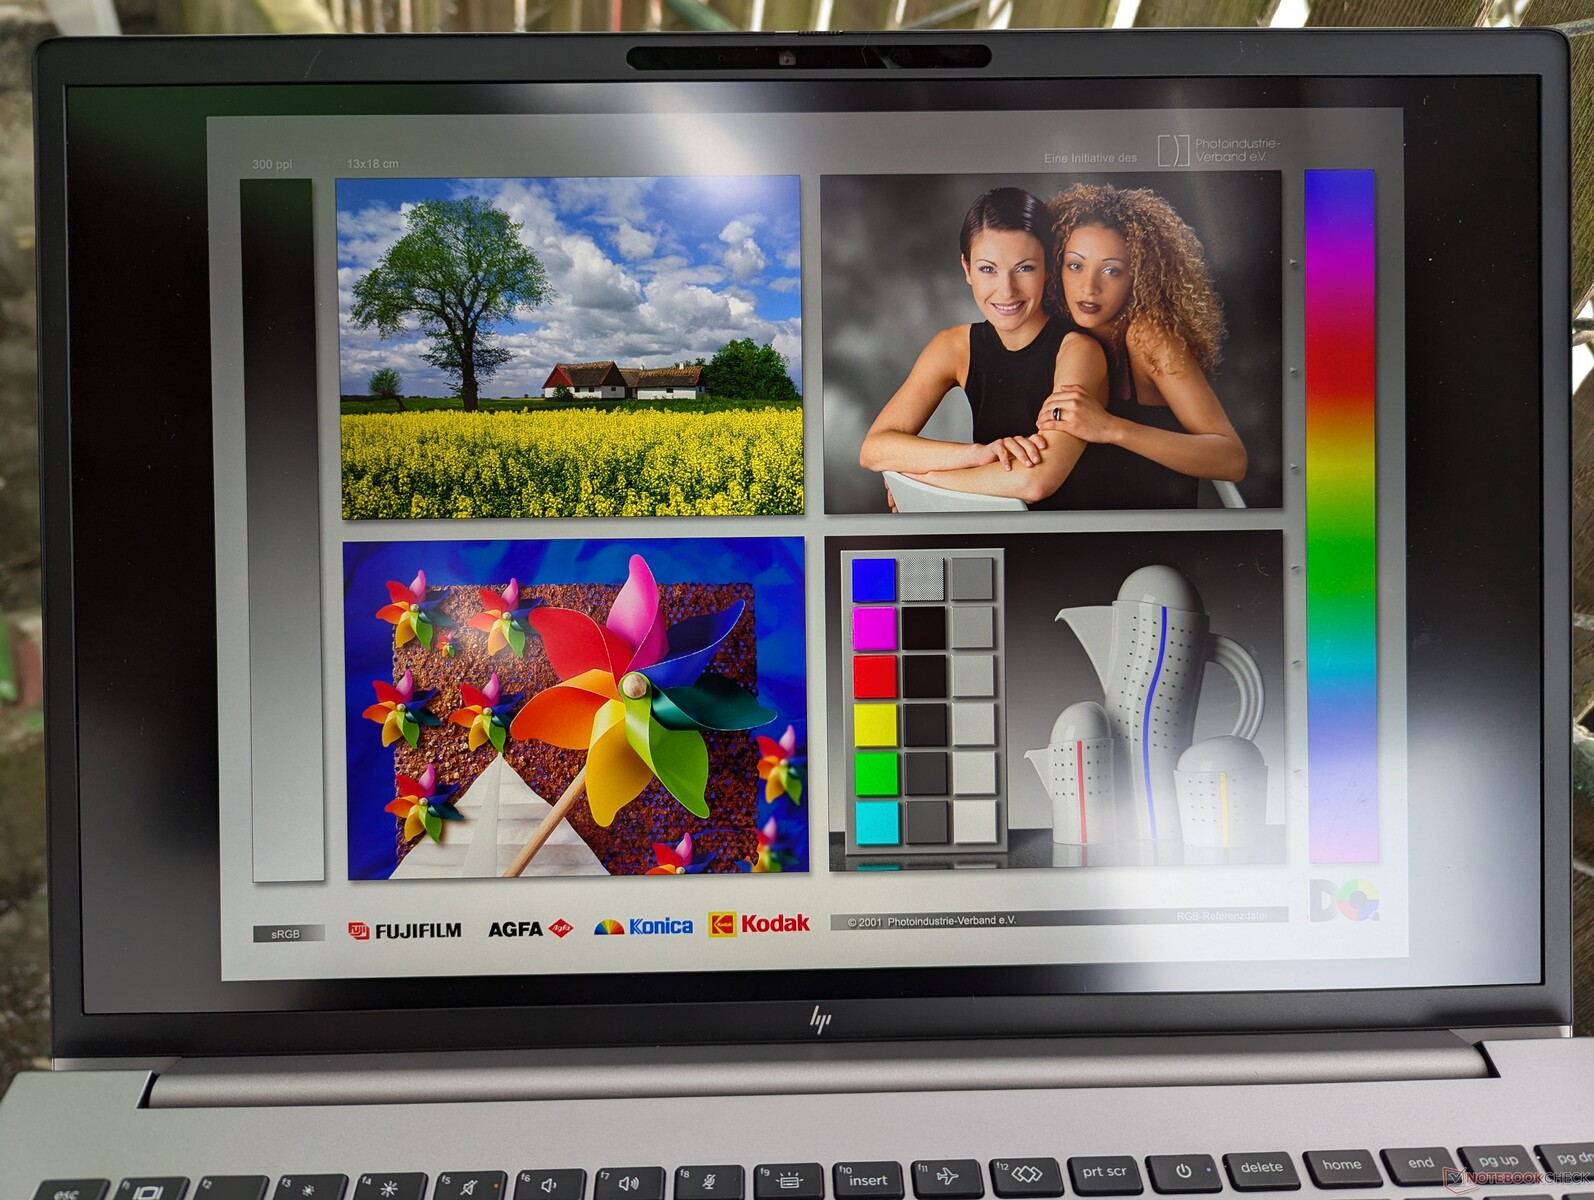
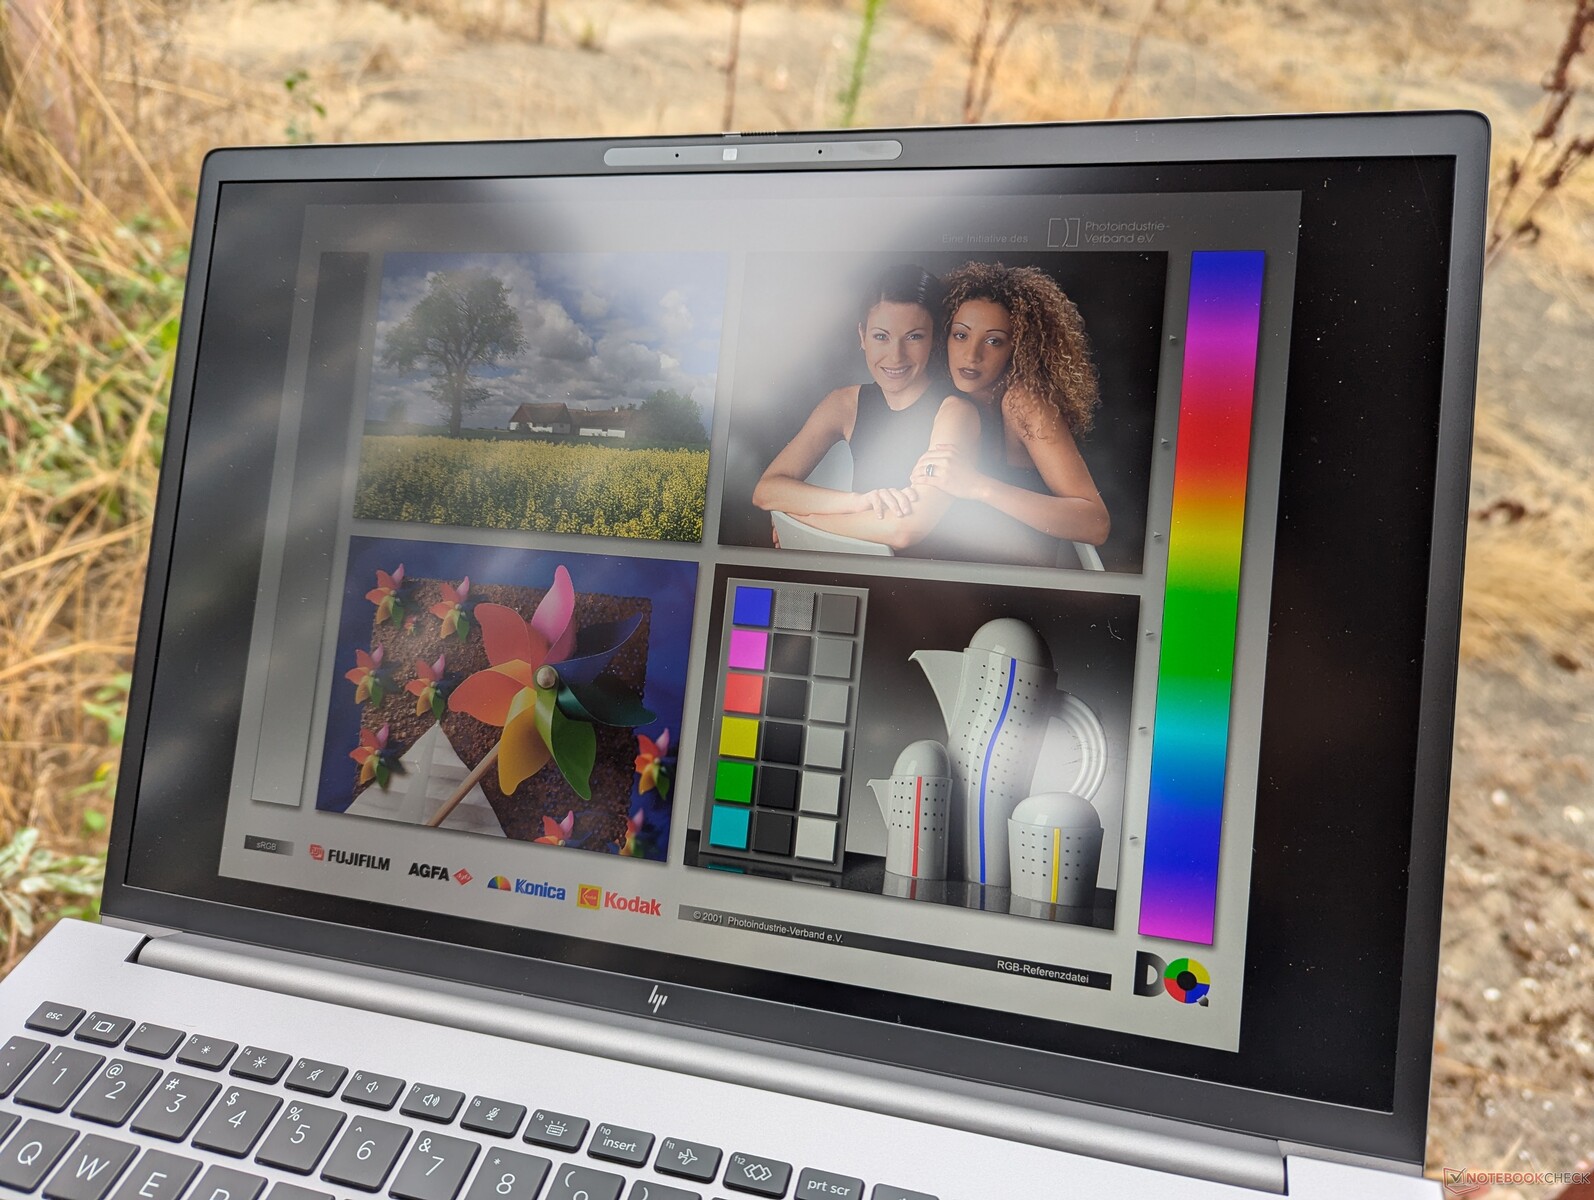
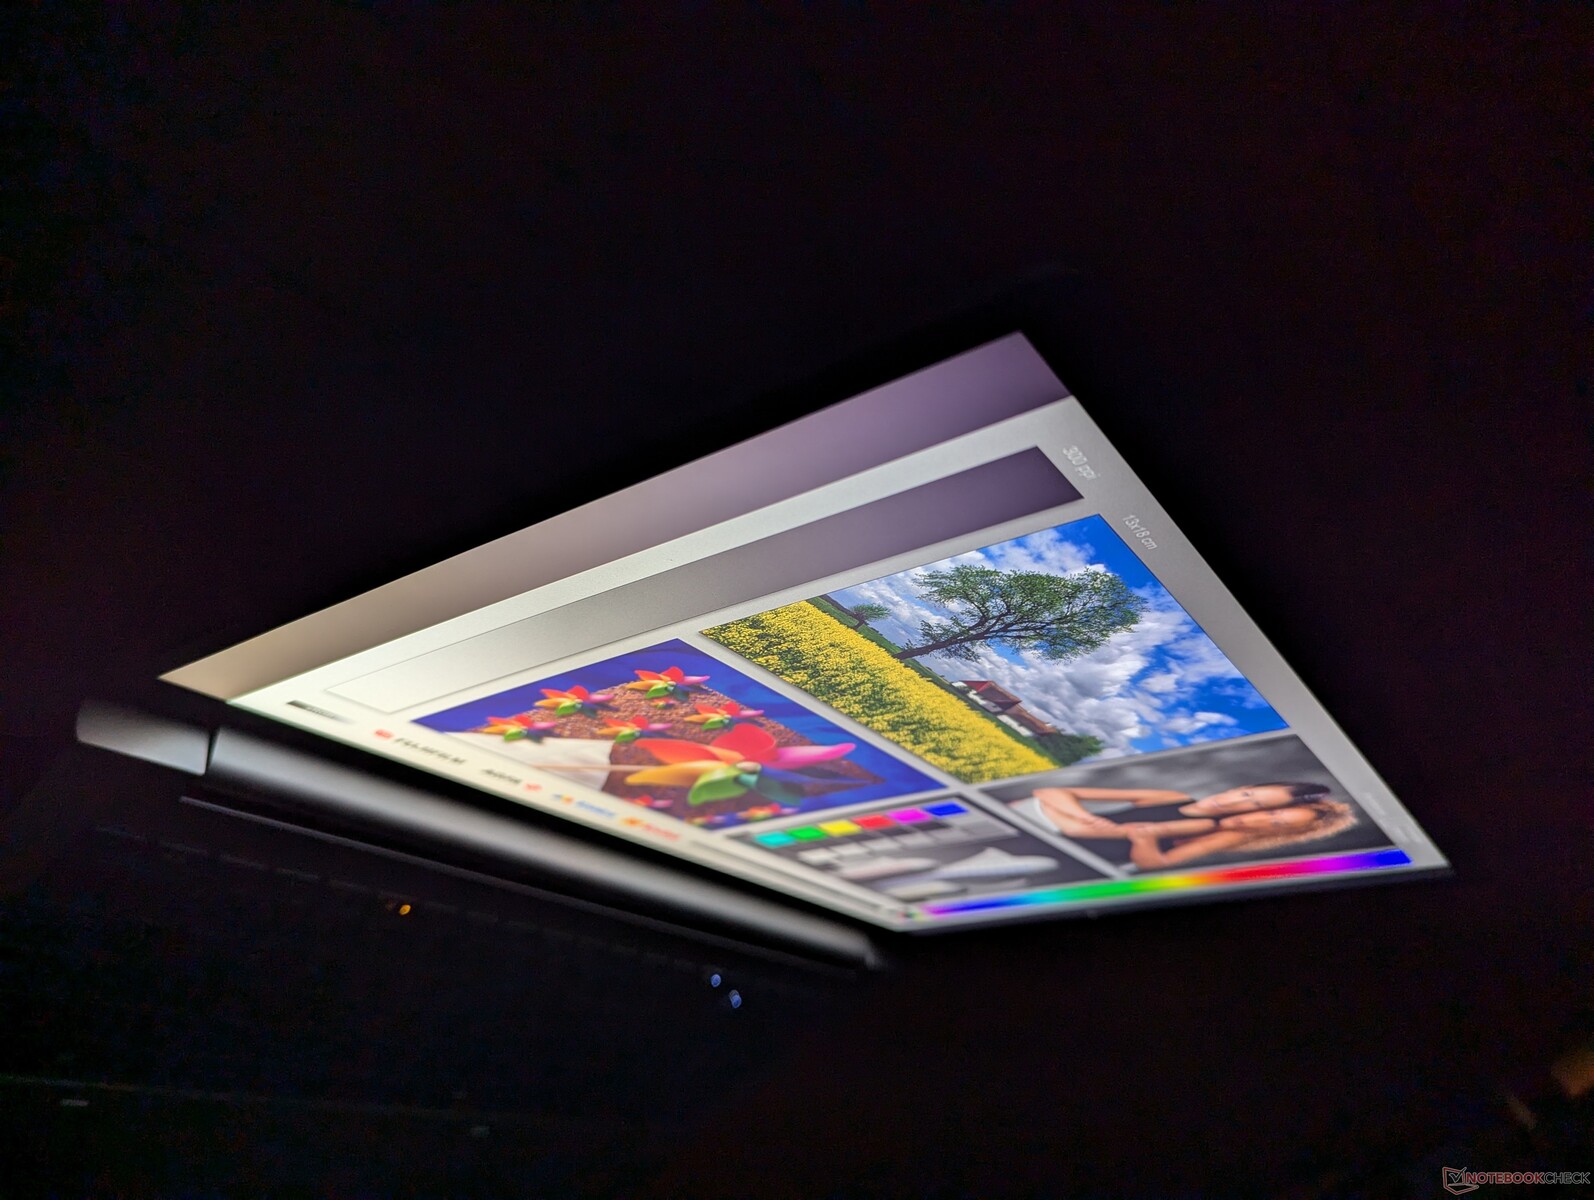
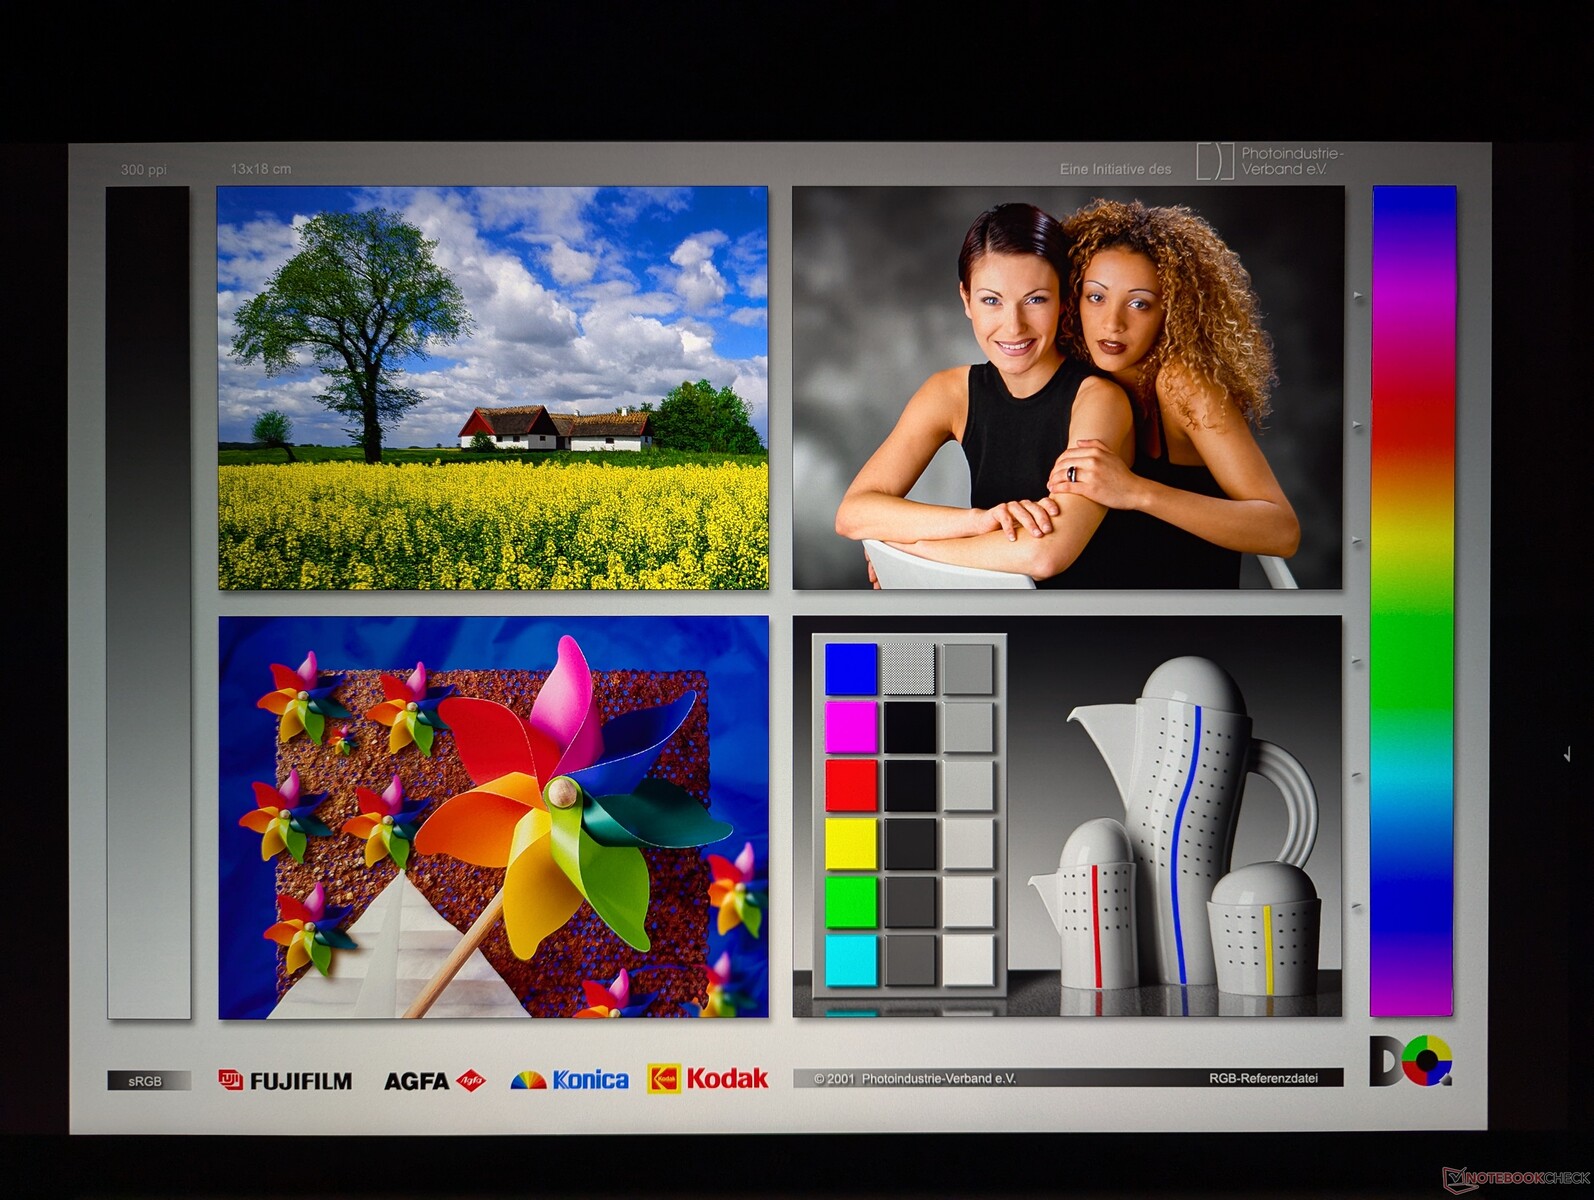
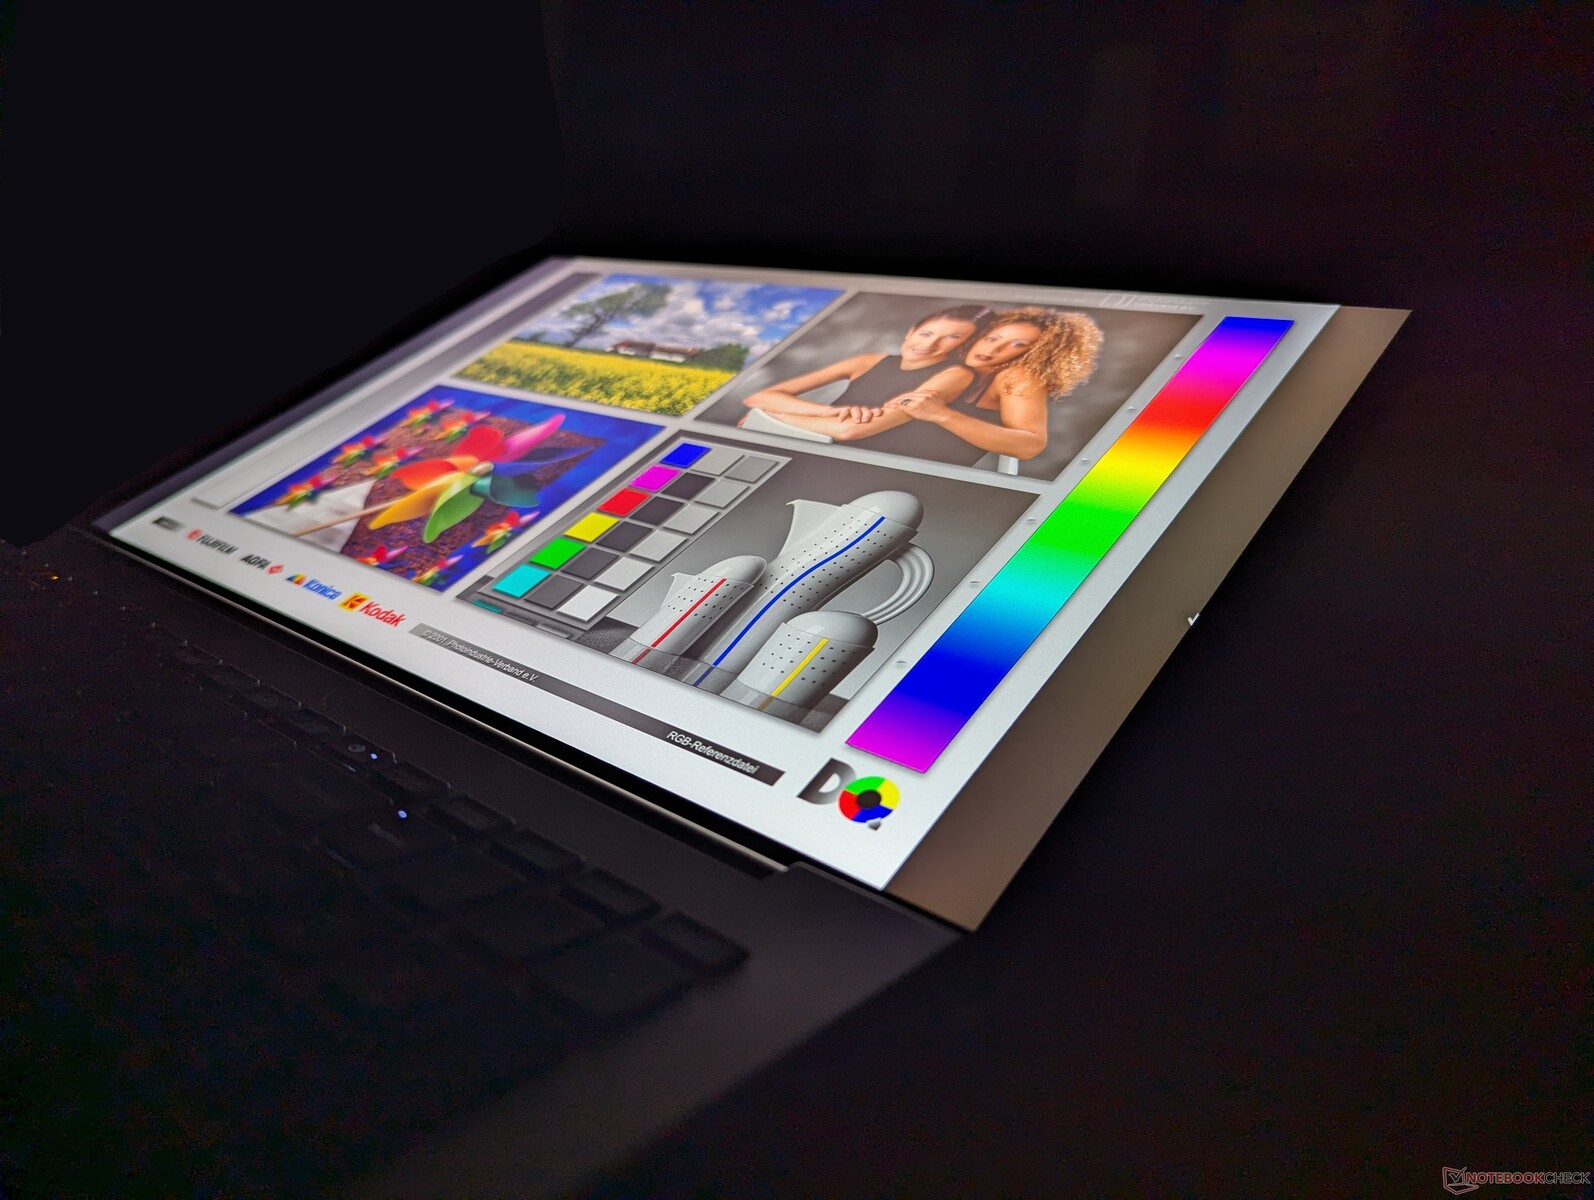
Ekran
Aşağıdaki gibi beş ekran seçeneği mevcuttur. Özel test ünitemiz kalın harflerle yazılmış panelle birlikte gelmektedir.
- 3840 x 2400, OLED, dokunmatik ekran, parlak, 400 nit, %100 DCI-P3, 60 Hz
- 3840 x 2400, IPS, dokunmatik olmayan, mat, 500 nit, %100 DCI-P3, 120 Hz
- 1920 x 1200, IPS, dokunmatik olmayan, mat, 400 nit, %100 sRGB, 60 Hz
- 1920 x 1200, IPS, dokunmatik olmayan, mat, 1000 nit, %100 sRGB, 60 Hz, Sure View Integrated
- 1920 x 1200, IPS, dokunmatik ekran, parlak, 400 nit, %100 sRGB, 60 Hz
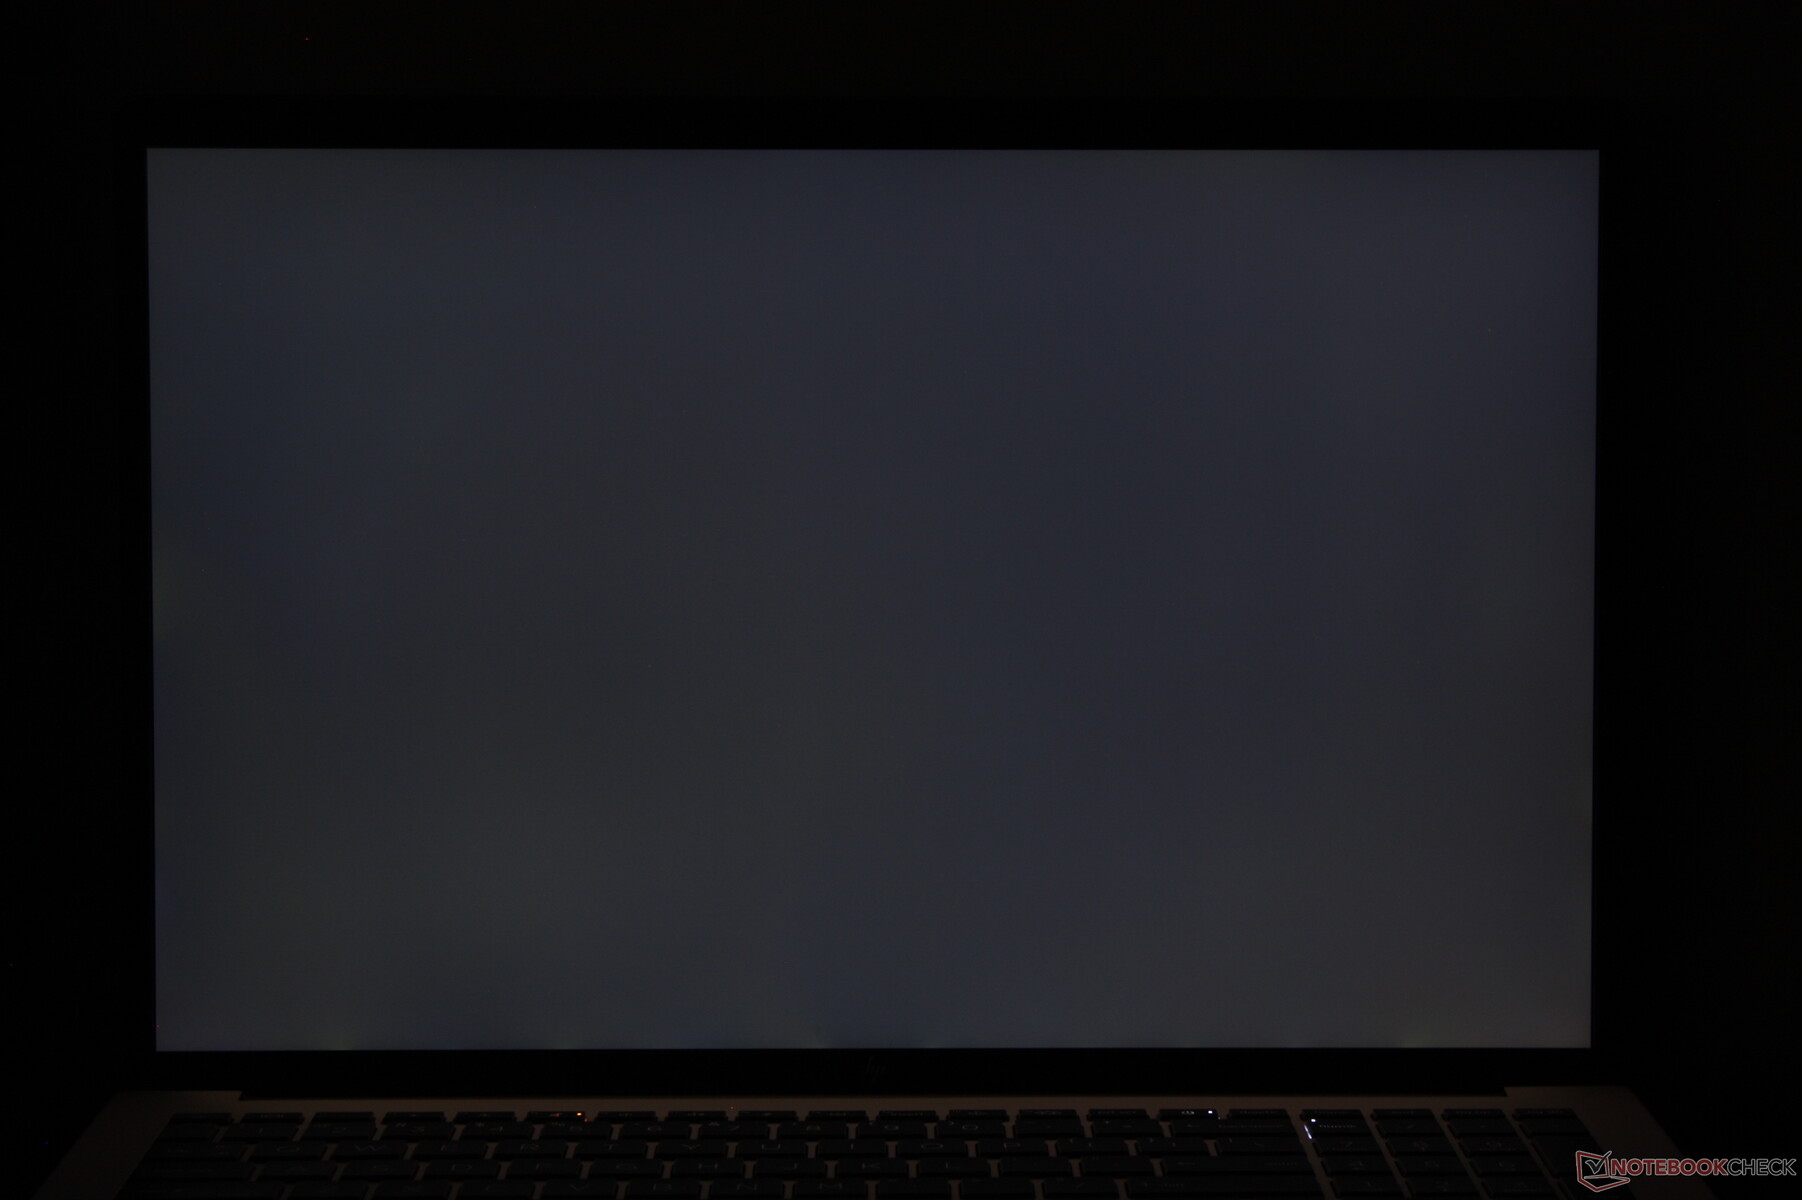
Bu özel panel, ZBook Fury 16 G10'umuzla birlikte gönderilenle aynıdır ve bu nedenle görsel deneyim aynı kalır. Dizüstü bilgisayarı dışarıda kullanmayı düşünen alıcılar 1000 nit seçeneğini değerlendirmek isteyebilir, ancak bu panel ne yazık ki ekranı başkalarıyla paylaşmayı zorlaştırmak için görüntüleme açılarını önemli ölçüde sınırlayan Sure View'a bağlı. Bu arada OLED seçeneği, dijital sanatçılara ve multimedya düzenleme uygulamalarına hitap etmek için çok daha üstün siyah seviyeleri sunacak, ancak parlak kaplaması ve yetersiz 60 Hz yenileme hızı bir dezavantaj olabilir.
Windows dinamik yenileme hızı, yapılandırılmış panelimizde yalnızca 60 Hz'e kadar desteklenmektedir.
| |||||||||||||||||||||||||
Aydınlatma: 83 %
Batarya modunda parlaklık: 457.6 cd/m²
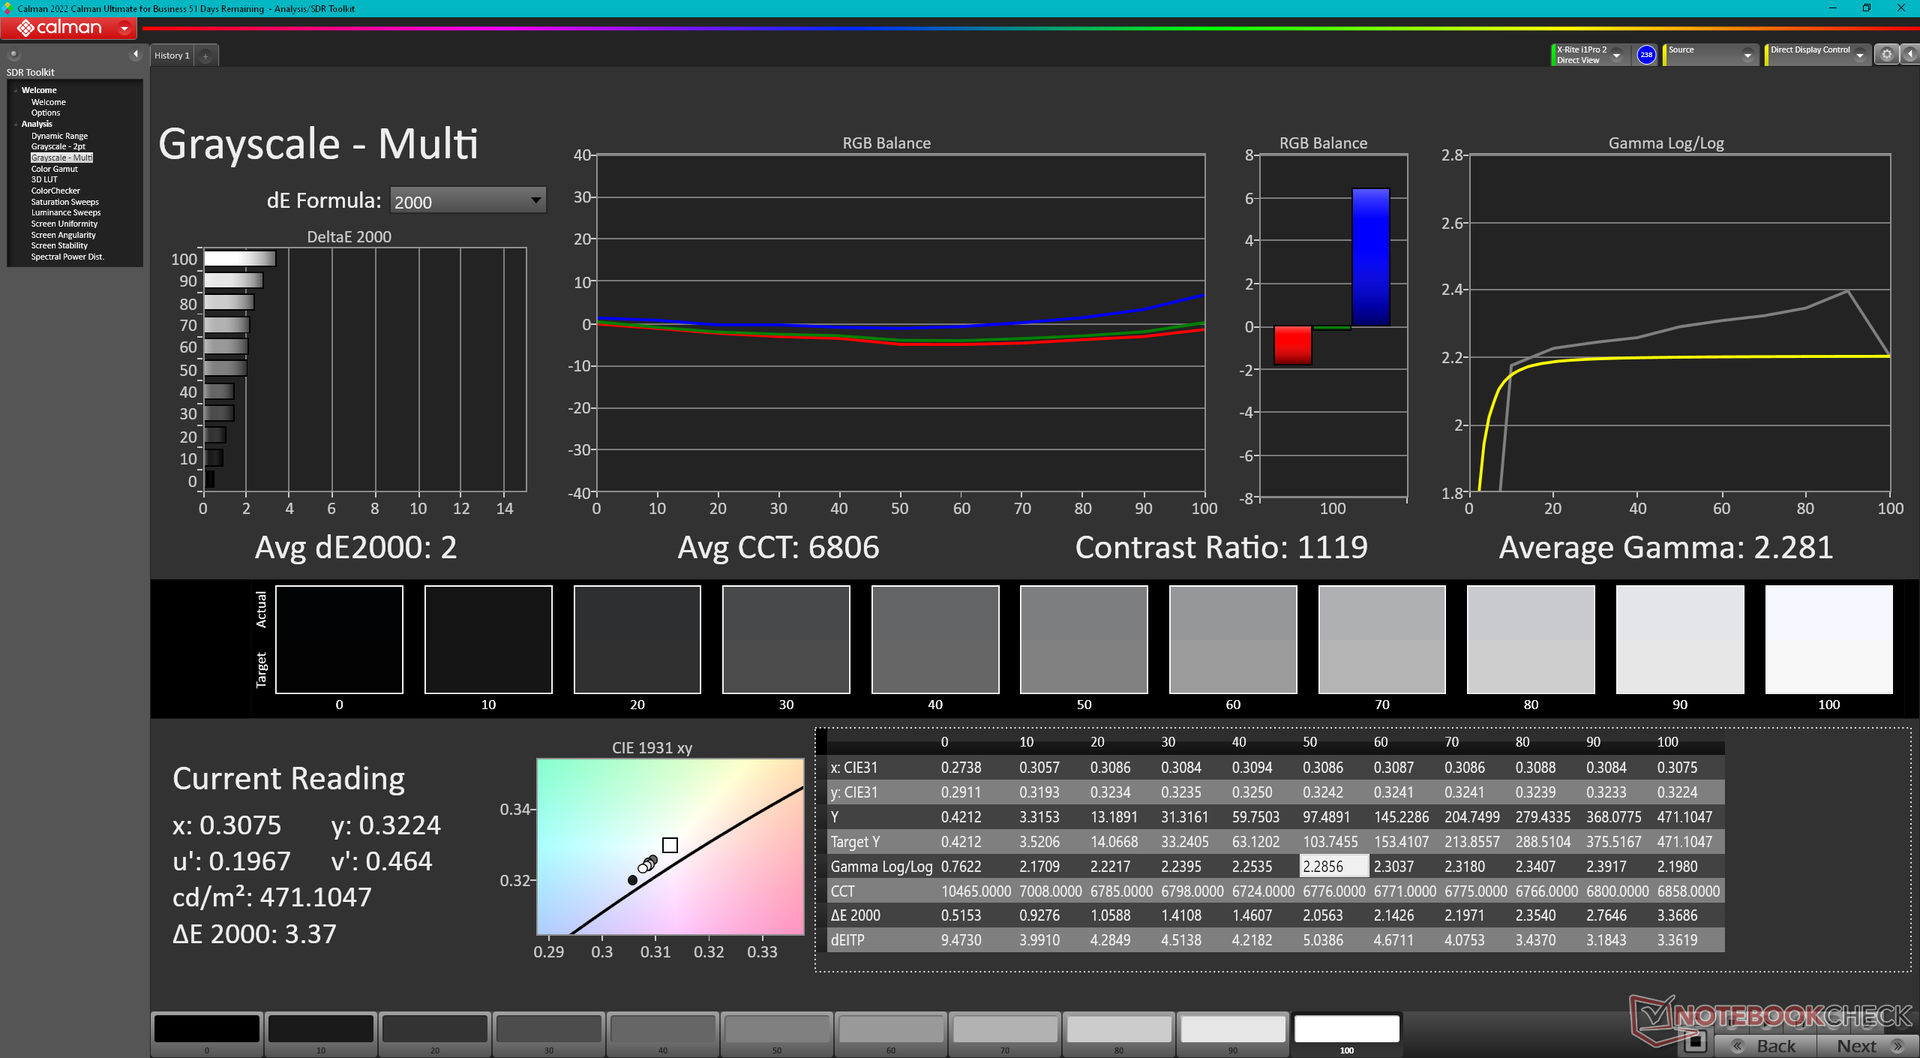
Kontrast: 1064:1 (Siyah: 0.43 cd/m²)
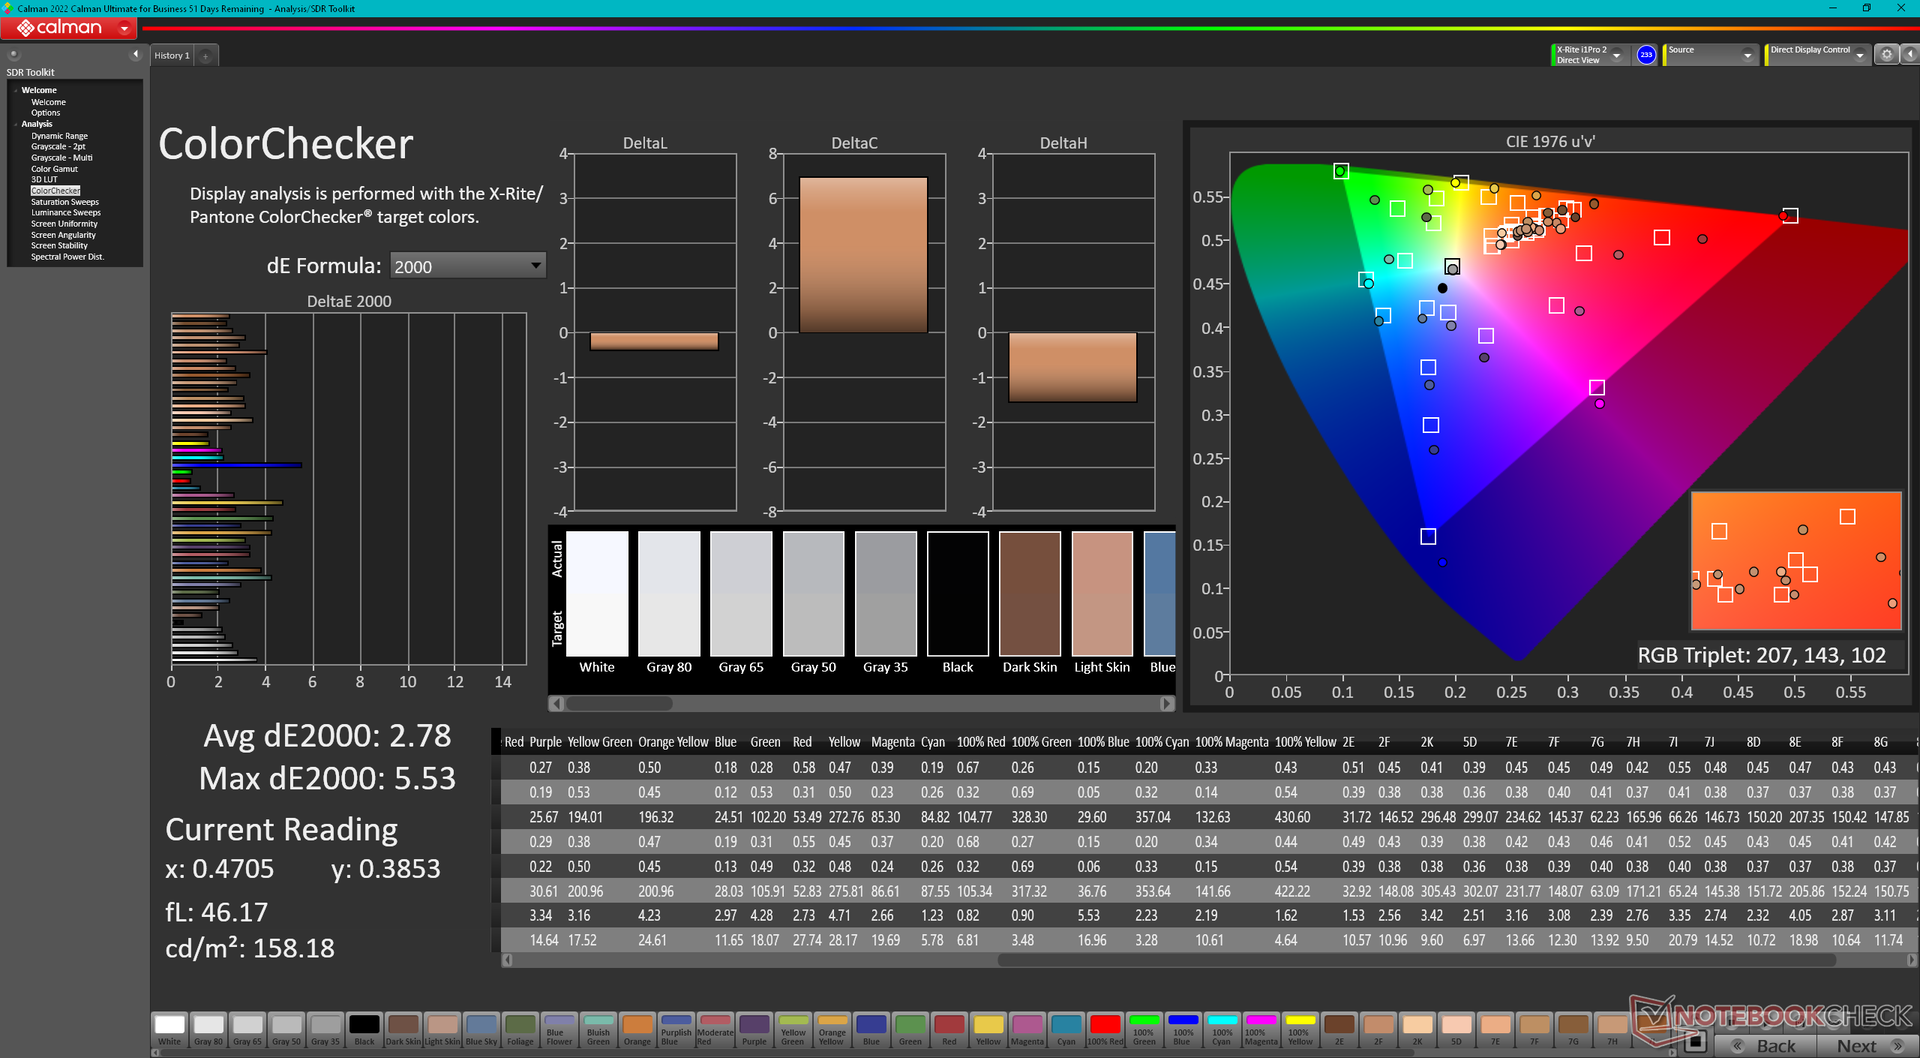
ΔE Color 2.78 | 0.5-29.43 Ø4.87, calibrated: 1.37
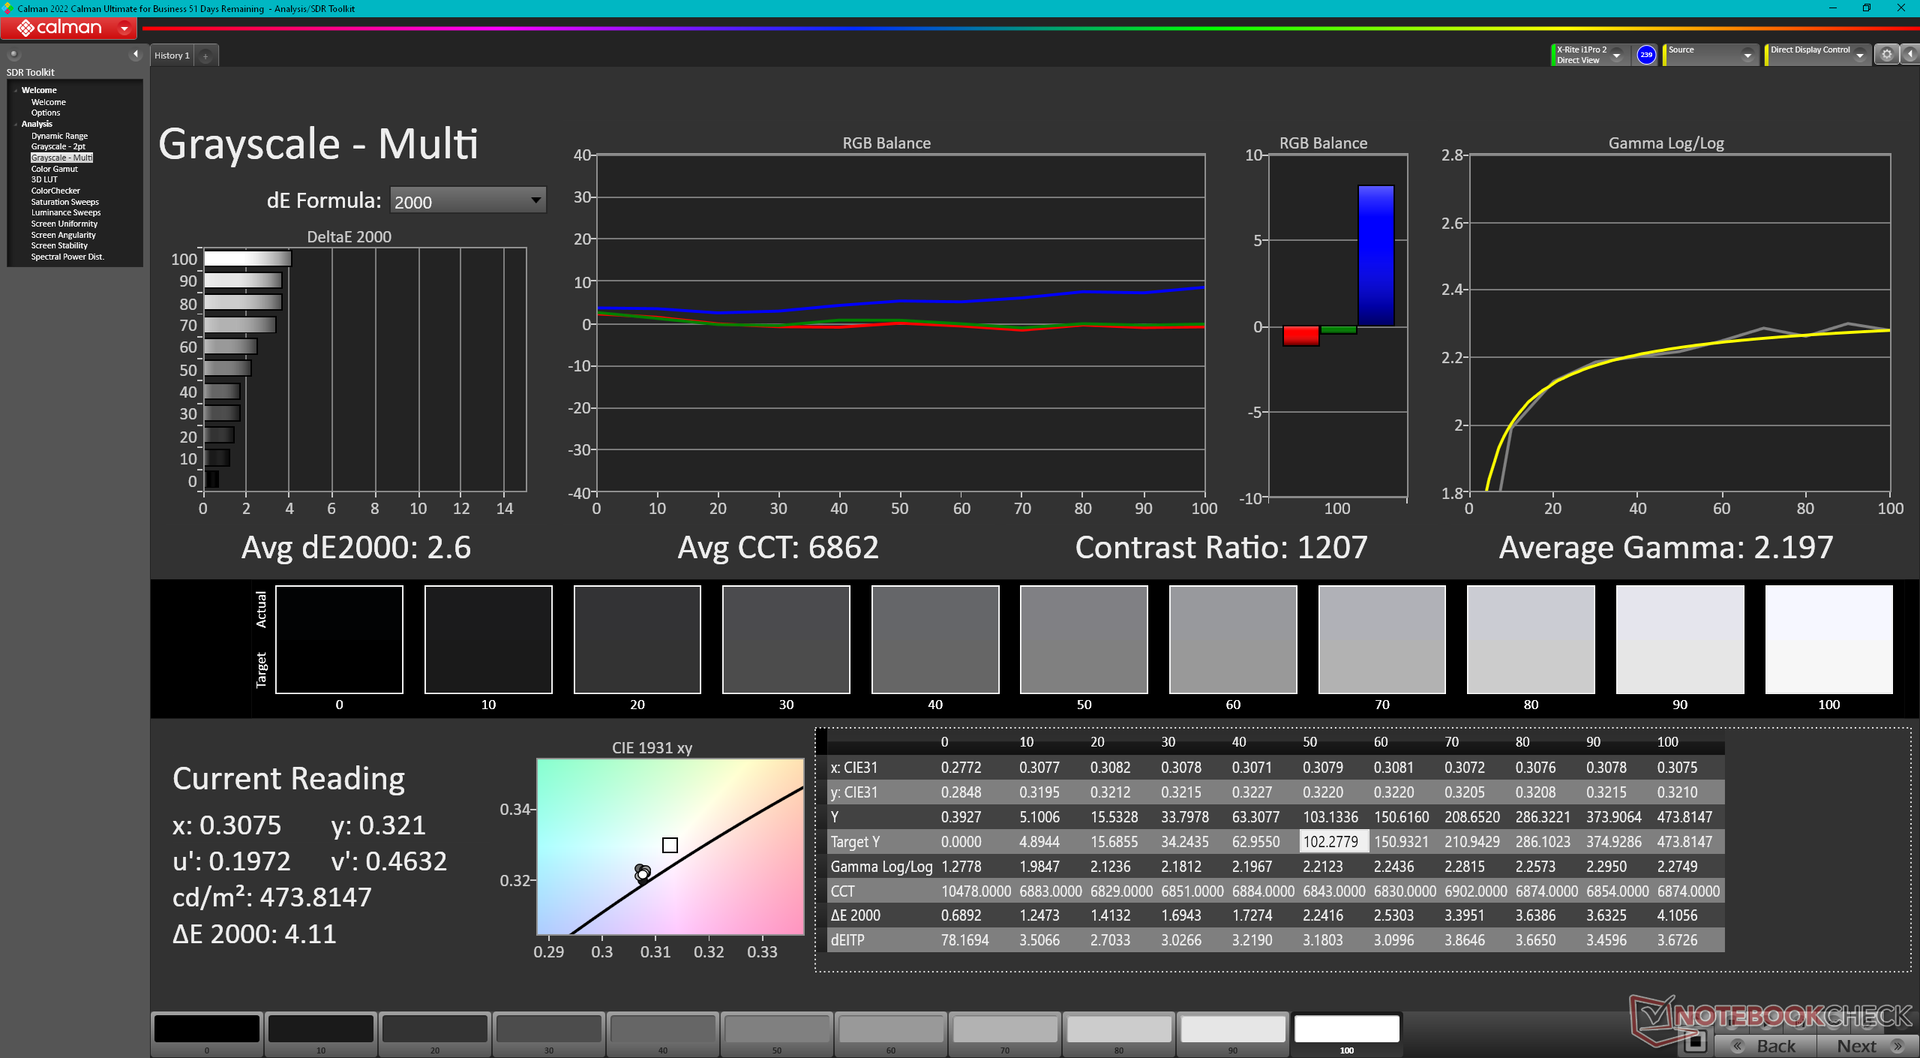
ΔE Greyscale 2 | 0.5-98 Ø5.1
86% AdobeRGB 1998 (Argyll 2.2.0 3D)
99.9% sRGB (Argyll 2.2.0 3D)
98.4% Display P3 (Argyll 2.2.0 3D)
Gamma: 2.28
| HP ZBook Fury 16 G11 AUO87A8, IPS, 3840x2400, 16", 120 Hz | HP ZBook Fury 16 G10 AUO87A8, IPS, 3840x2400, 16", 120 Hz | HP ZBook Fury 16 G9 BOE0A52, IPS, 3840x2400, 16", 60 Hz | Dell Precision 5690 Samsung 160YV03, OLED, 3840x2400, 16", 60 Hz | Lenovo ThinkPad P16 G2 21FA000FGE MNG007DA1-9, IPS LED, 2560x1600, 16", 165 Hz | Lenovo ThinkPad P1 G6 21FV001KUS Samsung ATNA60YV04-0, OLED, 3480x2400, 16", 60 Hz | Asus ProArt Studiobook 16 OLED H7604 ATNA60BX01-1, OLED, 3200x2000, 16", 120 Hz | |
|---|---|---|---|---|---|---|---|
| Display | 0% | -0% | 4% | -15% | 5% | 2% | |
| Display P3 Coverage | 98.4 | 98 0% | 97.4 -1% | 99.8 1% | 71 -28% | 99.8 1% | 99.6 1% |
| sRGB Coverage | 99.9 | 99.9 0% | 99.9 0% | 100 0% | 99.2 -1% | 100 0% | 100 0% |
| AdobeRGB 1998 Coverage | 86 | 86.2 0% | 86.3 0% | 96.6 12% | 73.2 -15% | 97.9 14% | 89.4 4% |
| Response Times | -9% | -11% | 83% | -16% | 82% | 93% | |
| Response Time Grey 50% / Grey 80% * | 11.4 ? | 11.9 ? -4% | 13.7 ? -20% | 1.7 ? 85% | 12.8 ? -12% | 1.69 ? 85% | 0.59 ? 95% |
| Response Time Black / White * | 8.4 ? | 9.6 ? -14% | 8.6 ? -2% | 1.7 ? 80% | 10.1 ? -20% | 1.73 ? 79% | 0.79 ? 91% |
| PWM Frequency | 60 ? | 60 ? | 240 ? | ||||
| Screen | 19% | -25% | -8% | -7% | 19% | 179% | |
| Brightness middle | 457.6 | 514.6 12% | 530.5 16% | 348.1 -24% | 510 11% | 375.1 -18% | 349 -24% |
| Brightness | 466 | 495 6% | 476 2% | 351 -25% | 517 11% | 379 -19% | 350 -25% |
| Brightness Distribution | 83 | 90 8% | 83 0% | 97 17% | 89 7% | 98 18% | 95 14% |
| Black Level * | 0.43 | 0.46 -7% | 0.57 -33% | 0.37 14% | 0.02 95% | ||
| Contrast | 1064 | 1119 5% | 931 -12% | 1378 30% | 17450 1540% | ||
| Colorchecker dE 2000 * | 2.78 | 2.4 14% | 2.26 19% | 4.18 -50% | 2.6 6% | 1.16 58% | 2.1 24% |
| Colorchecker dE 2000 max. * | 5.53 | 4.86 12% | 6.68 -21% | 5.2 6% | 2.94 47% | 5.5 1% | |
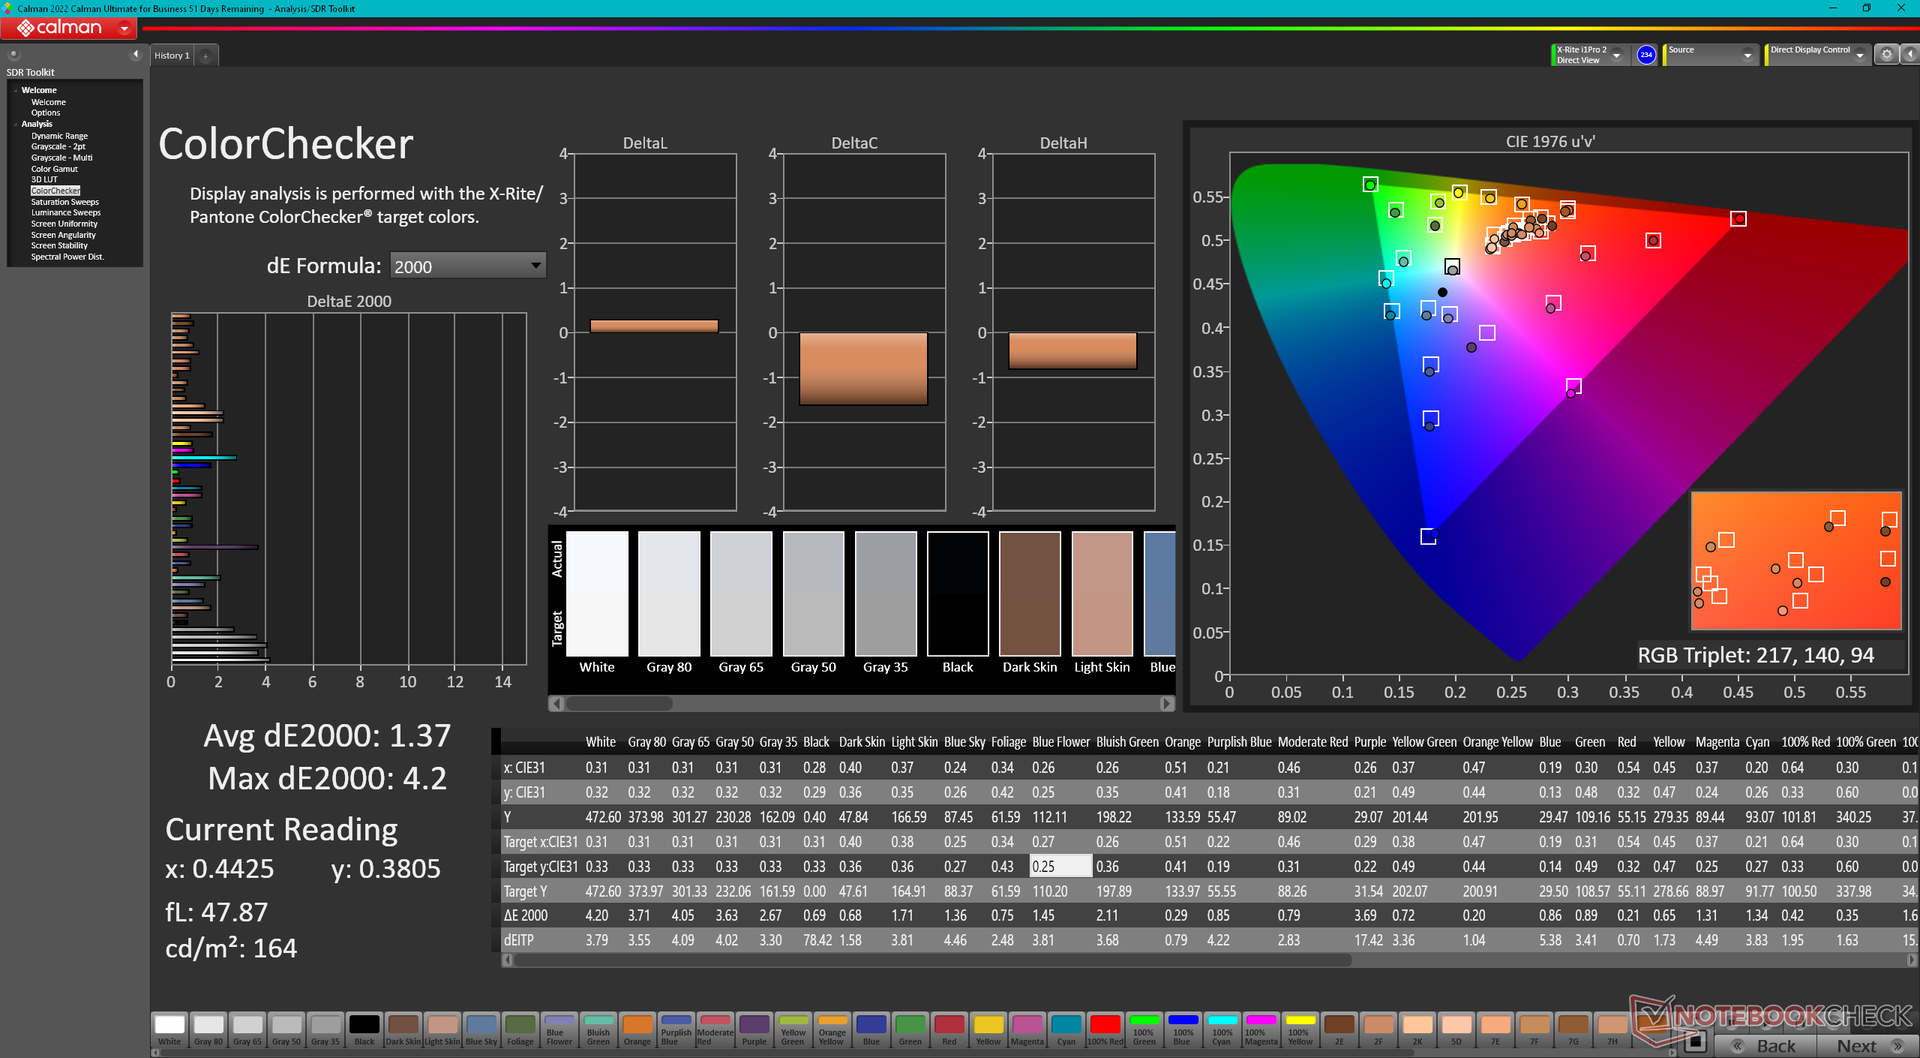
| Colorchecker dE 2000 calibrated * | 1.37 | 0.4 71% | 4.73 -245% | 0.97 29% | 2.3 -68% | 2.1 -53% | |
| Greyscale dE 2000 * | 2 | 1 50% | 1 50% | 1.7 15% | 3.6 -80% | 1.4 30% | 1.2 40% |
| Gamma | 2.28 96% | 2.3 96% | 2.28 96% | 2.2 100% | 2.26 97% | 2.2 100% | 2.19 100% |
| CCT | 6806 96% | 6553 99% | 6543 99% | 6198 105% | 5969 109% | 6325 103% | 6545 99% |
| Toplam Ortalama (Program / Ayarlar) | 3% /
11% | -12% /
-17% | 26% /
10% | -13% /
-10% | 35% /
27% | 91% /
129% |
* ... daha küçük daha iyidir
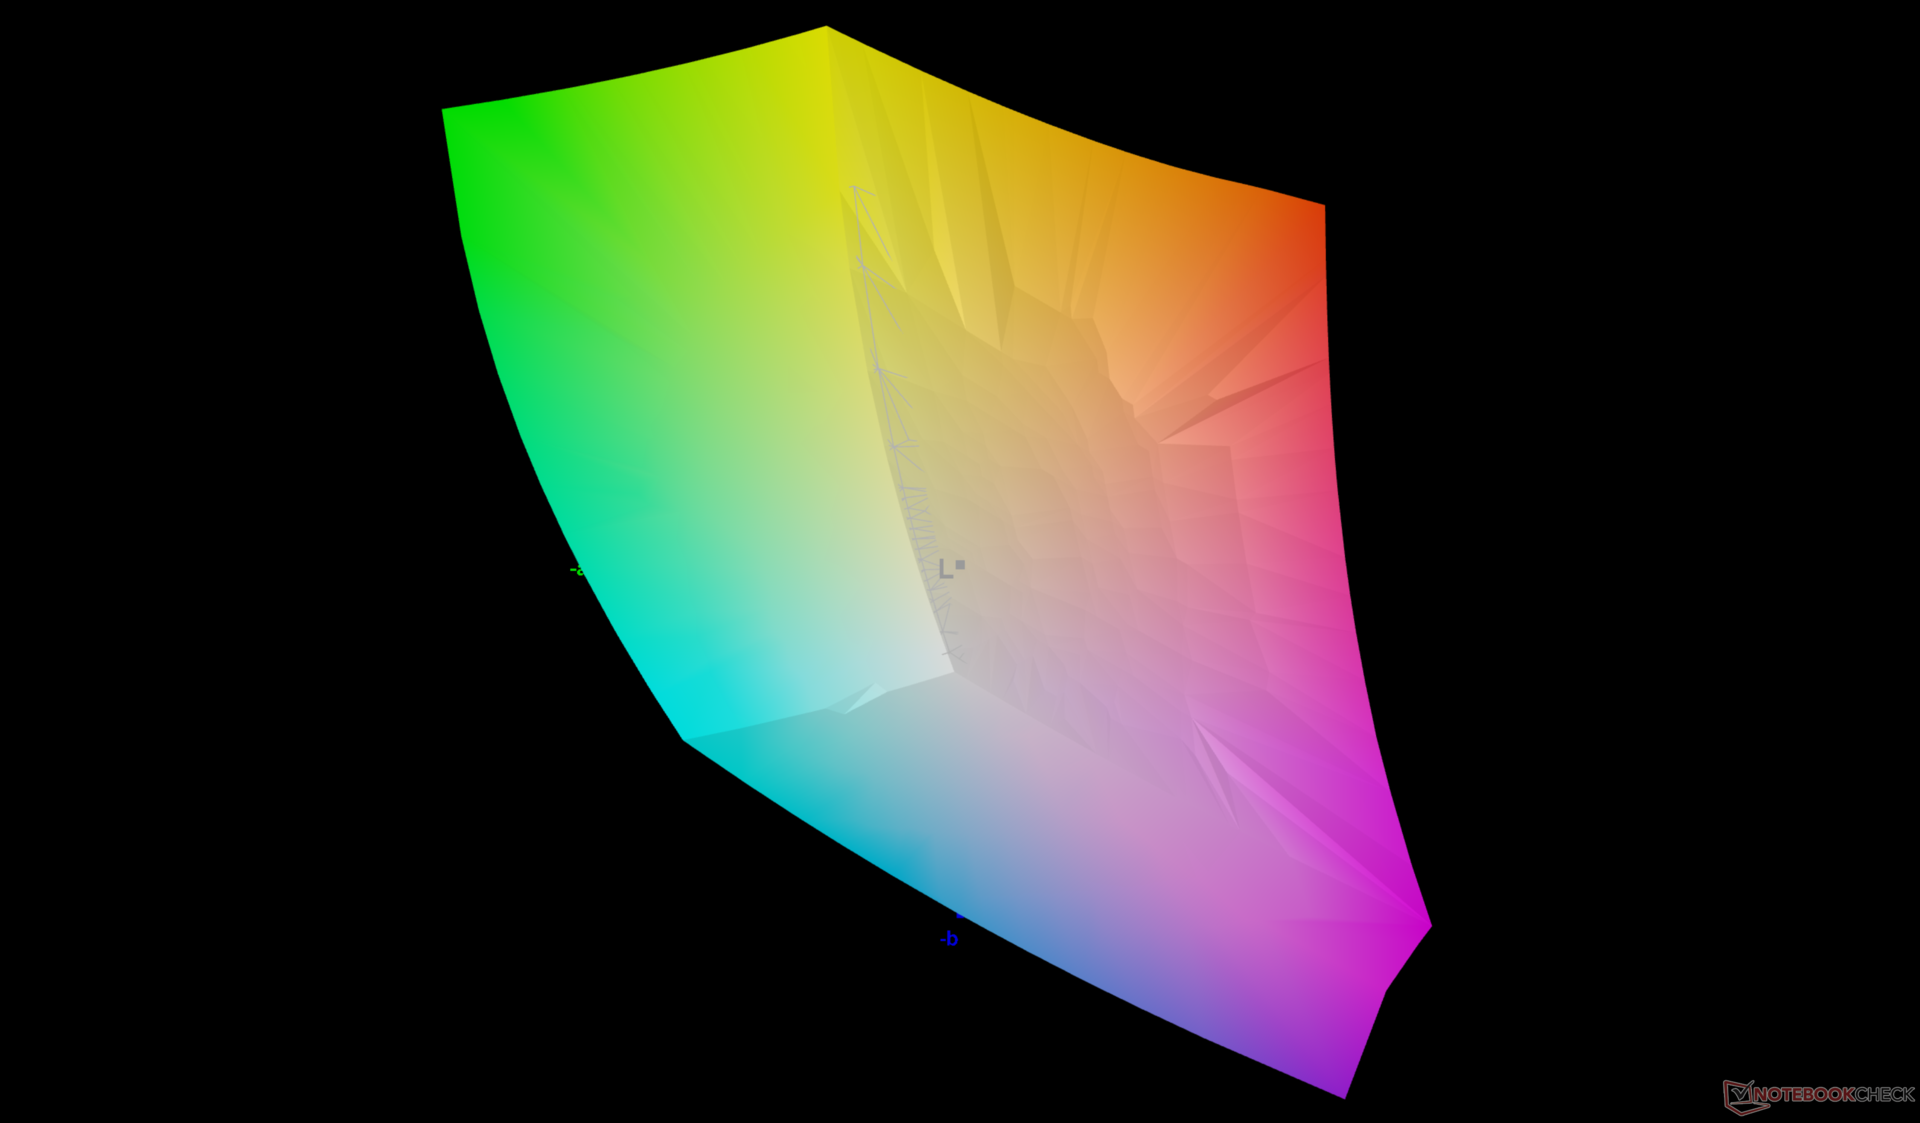
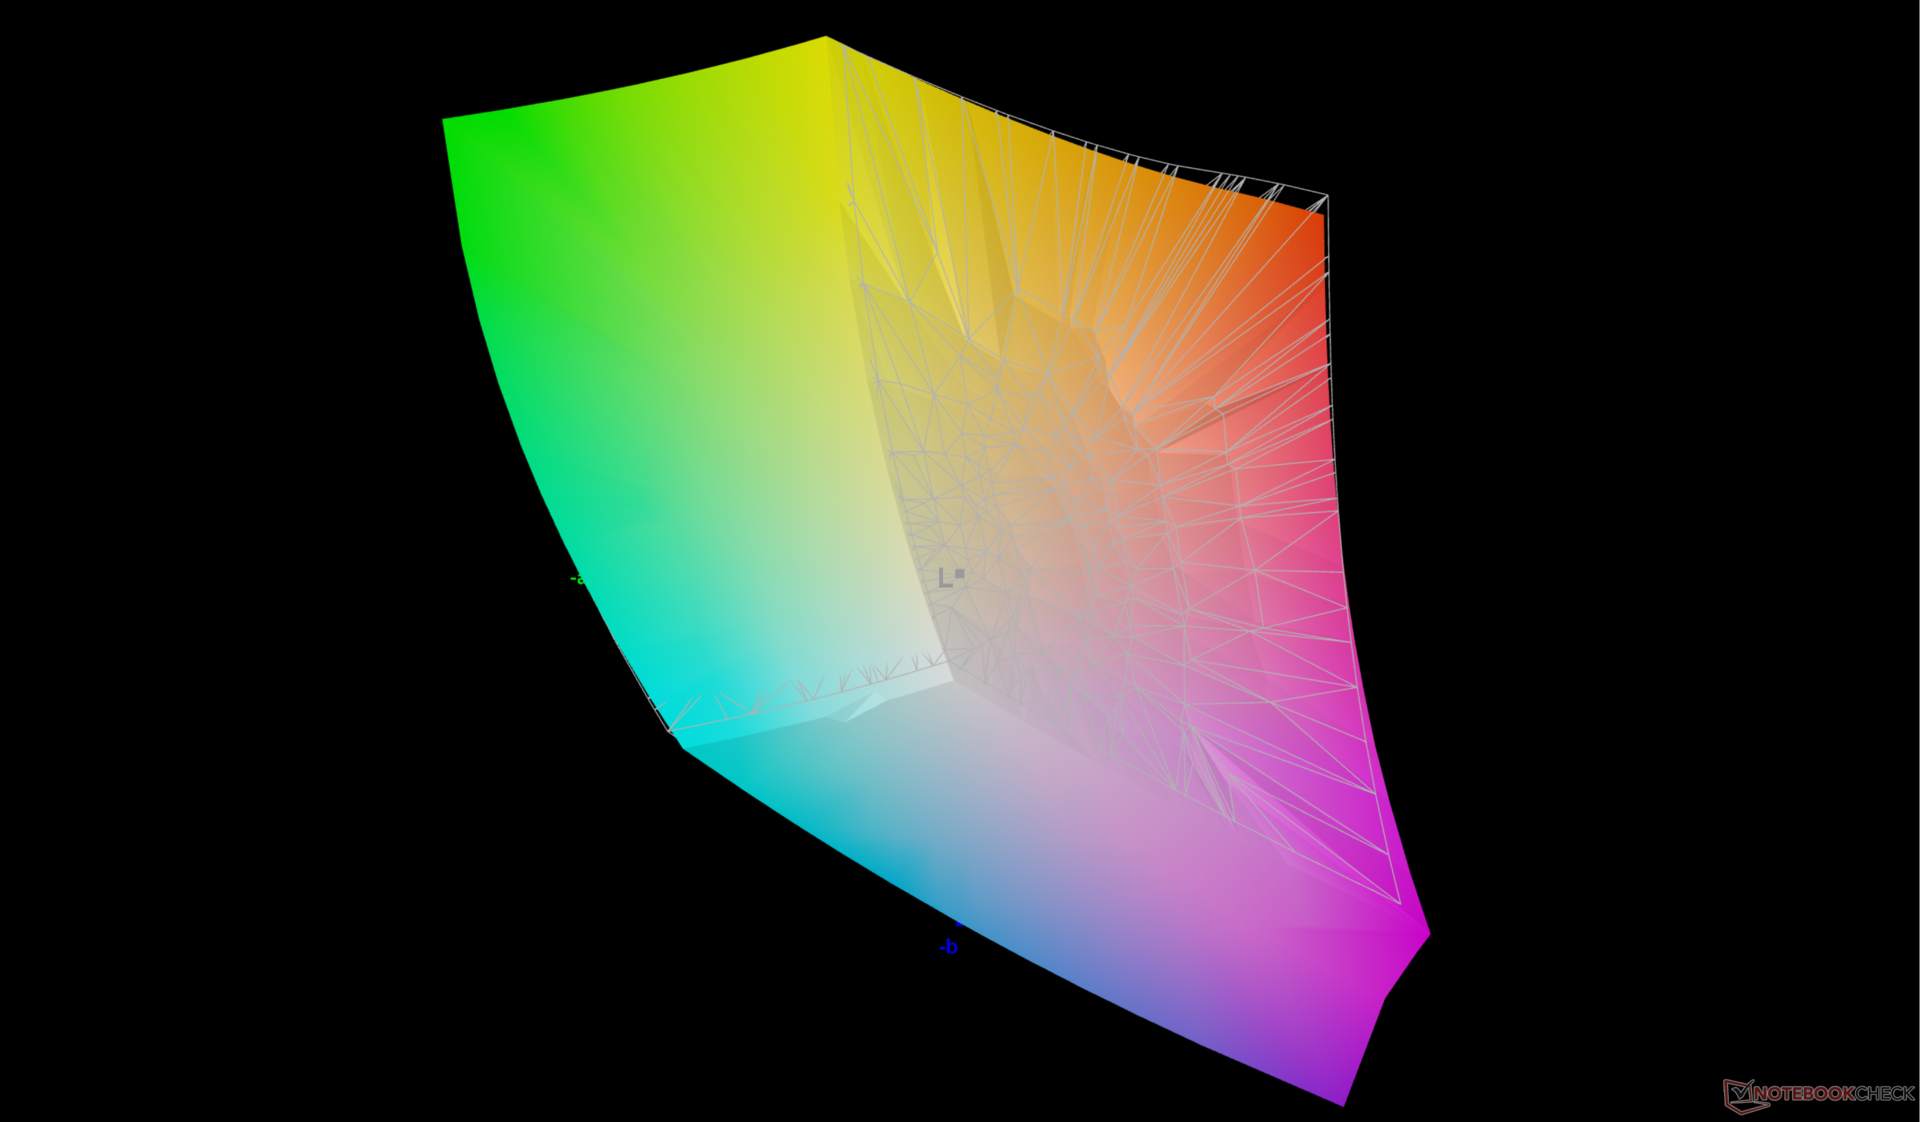
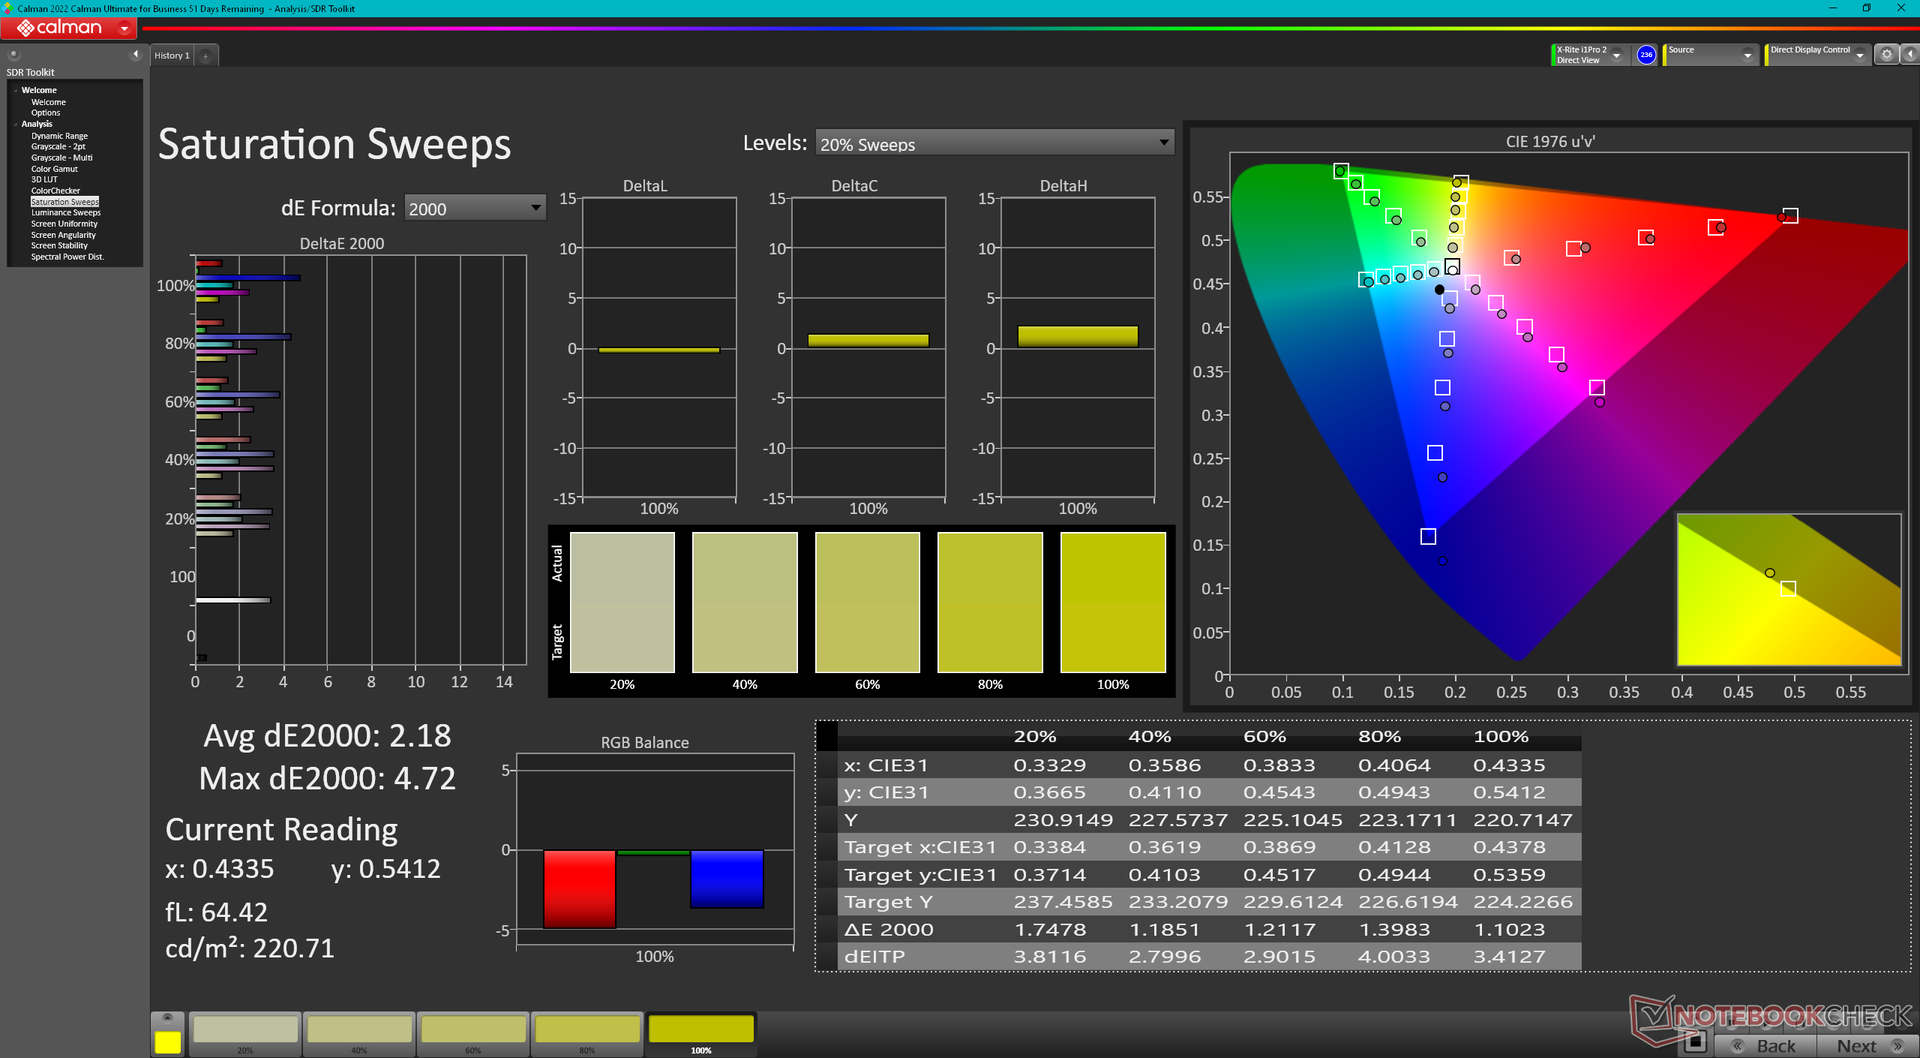
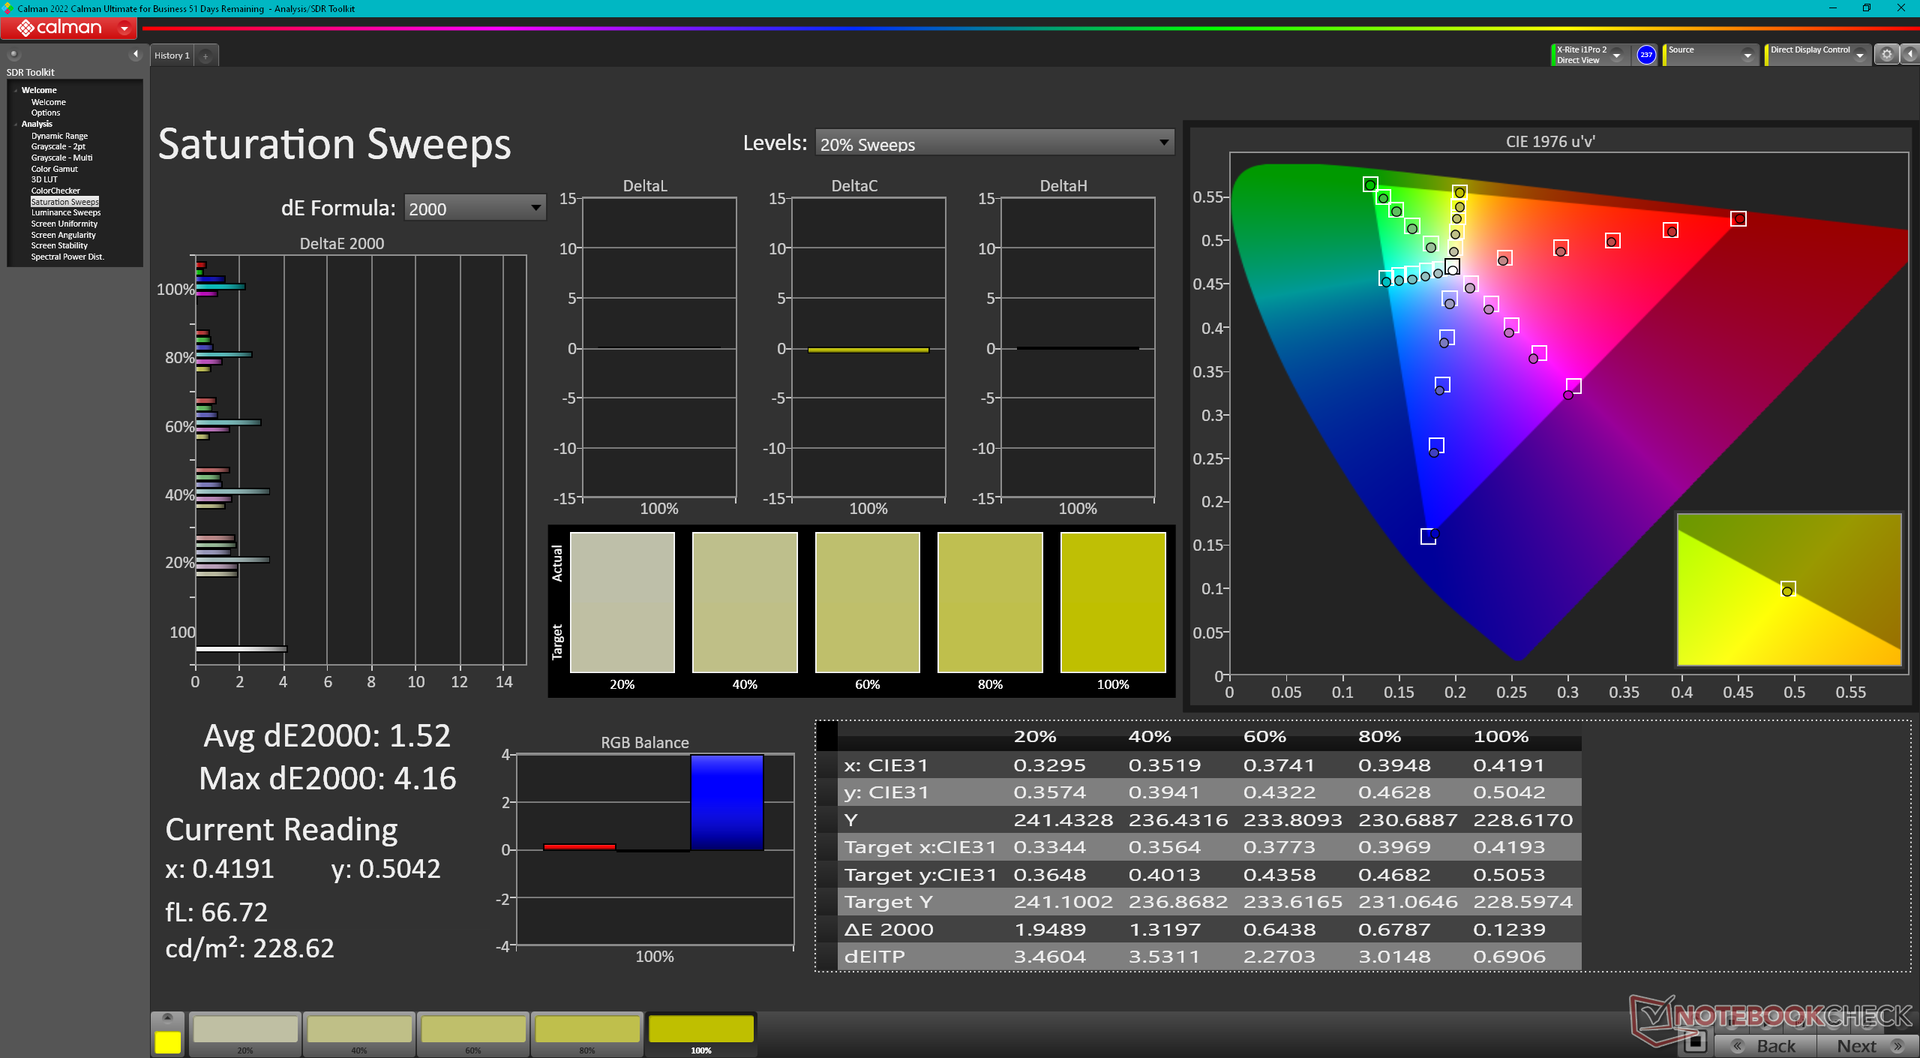
Ekran, sırasıyla sadece 2 ve 2,18 ortalama deltaE gri tonlama ve renk değerleriyle P3 standardına göre iyi kalibre edilmiştir. Paneli X-Rite renk ölçerimizle daha da kalibre etmek doğruluğu çok az artıracak ve çoğu kullanıcı için çoğunlukla gereksiz olacaktır.
Yanıt Sürelerini Görüntüle
| ↔ Tepki Süresi Siyahtan Beyaza | ||
|---|---|---|
| 8.4 ms ... yükseliş ↗ ve sonbahar↘ birleşimi | ↗ 4.7 ms yükseliş | 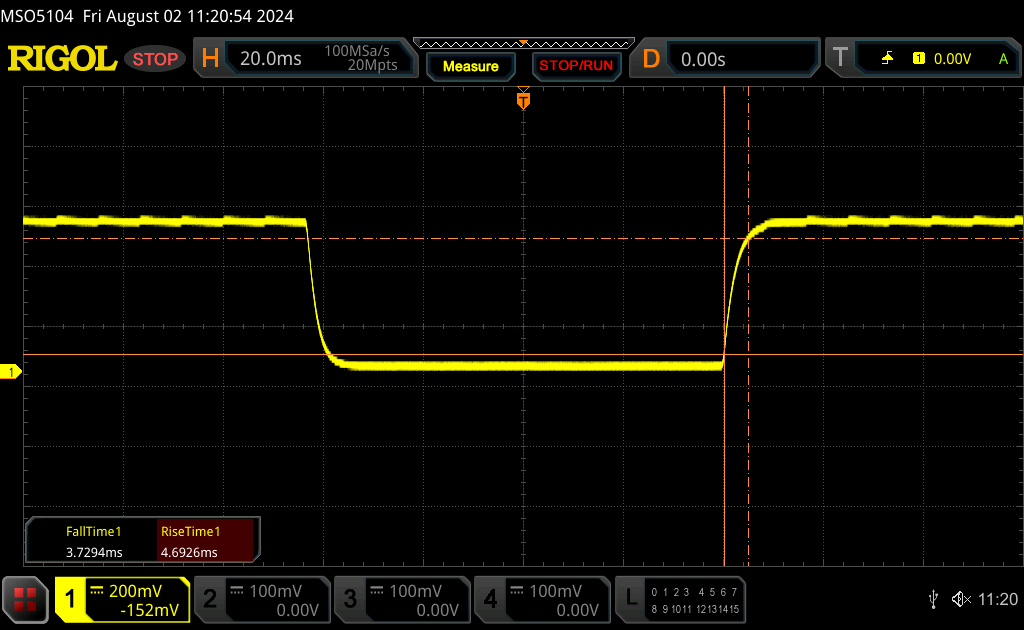 |
| ↘ 3.7 ms sonbahar | ||
| Ekran, testlerimizde hızlı yanıt oranları gösteriyor ve oyun oynamaya uygun olmalı. Karşılaştırıldığında, test edilen tüm cihazlar 0.1 (minimum) ile 240 (maksimum) ms arasında değişir. » Tüm cihazların 21 %'si daha iyi. Bu, ölçülen yanıt süresinin test edilen tüm cihazların ortalamasından (20.7 ms) daha iyi olduğu anlamına gelir. | ||
| ↔ Tepki Süresi %50 Griden %80 Griye | ||
| 11.4 ms ... yükseliş ↗ ve sonbahar↘ birleşimi | ↗ 5.3 ms yükseliş | 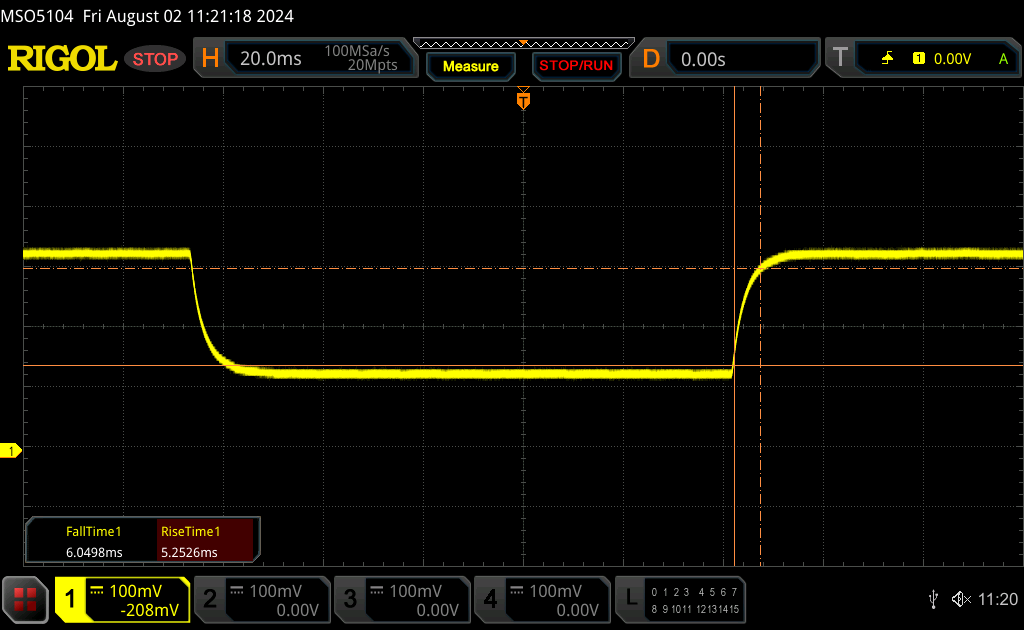 |
| ↘ 6.1 ms sonbahar | ||
| Ekran, testlerimizde iyi yanıt oranları gösteriyor ancak rekabetçi oyuncular için çok yavaş olabilir. Karşılaştırıldığında, test edilen tüm cihazlar 0.165 (minimum) ile 636 (maksimum) ms arasında değişir. » Tüm cihazların 22 %'si daha iyi. Bu, ölçülen yanıt süresinin test edilen tüm cihazların ortalamasından (32.5 ms) daha iyi olduğu anlamına gelir. | ||
Ekran Titremesi / PWM (Darbe Genişliği Modülasyonu)
| Ekran titriyor / PWM algılanmadı | 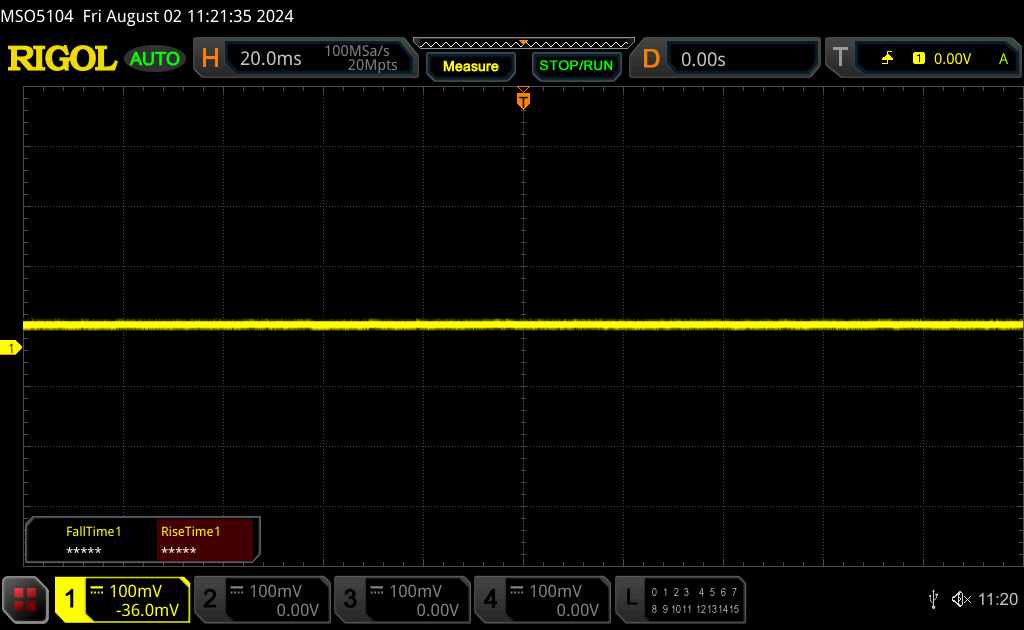 | ||
Karşılaştırıldığında: Test edilen tüm cihazların %53 %'si ekranı karartmak için PWM kullanmıyor. PWM tespit edilirse, ortalama 8508 (minimum: 5 - maksimum: 343500) Hz ölçüldü. | |||
Performans - Daha Yüksek Turbo Güçlendirme Potansiyeli
Test Koşulları
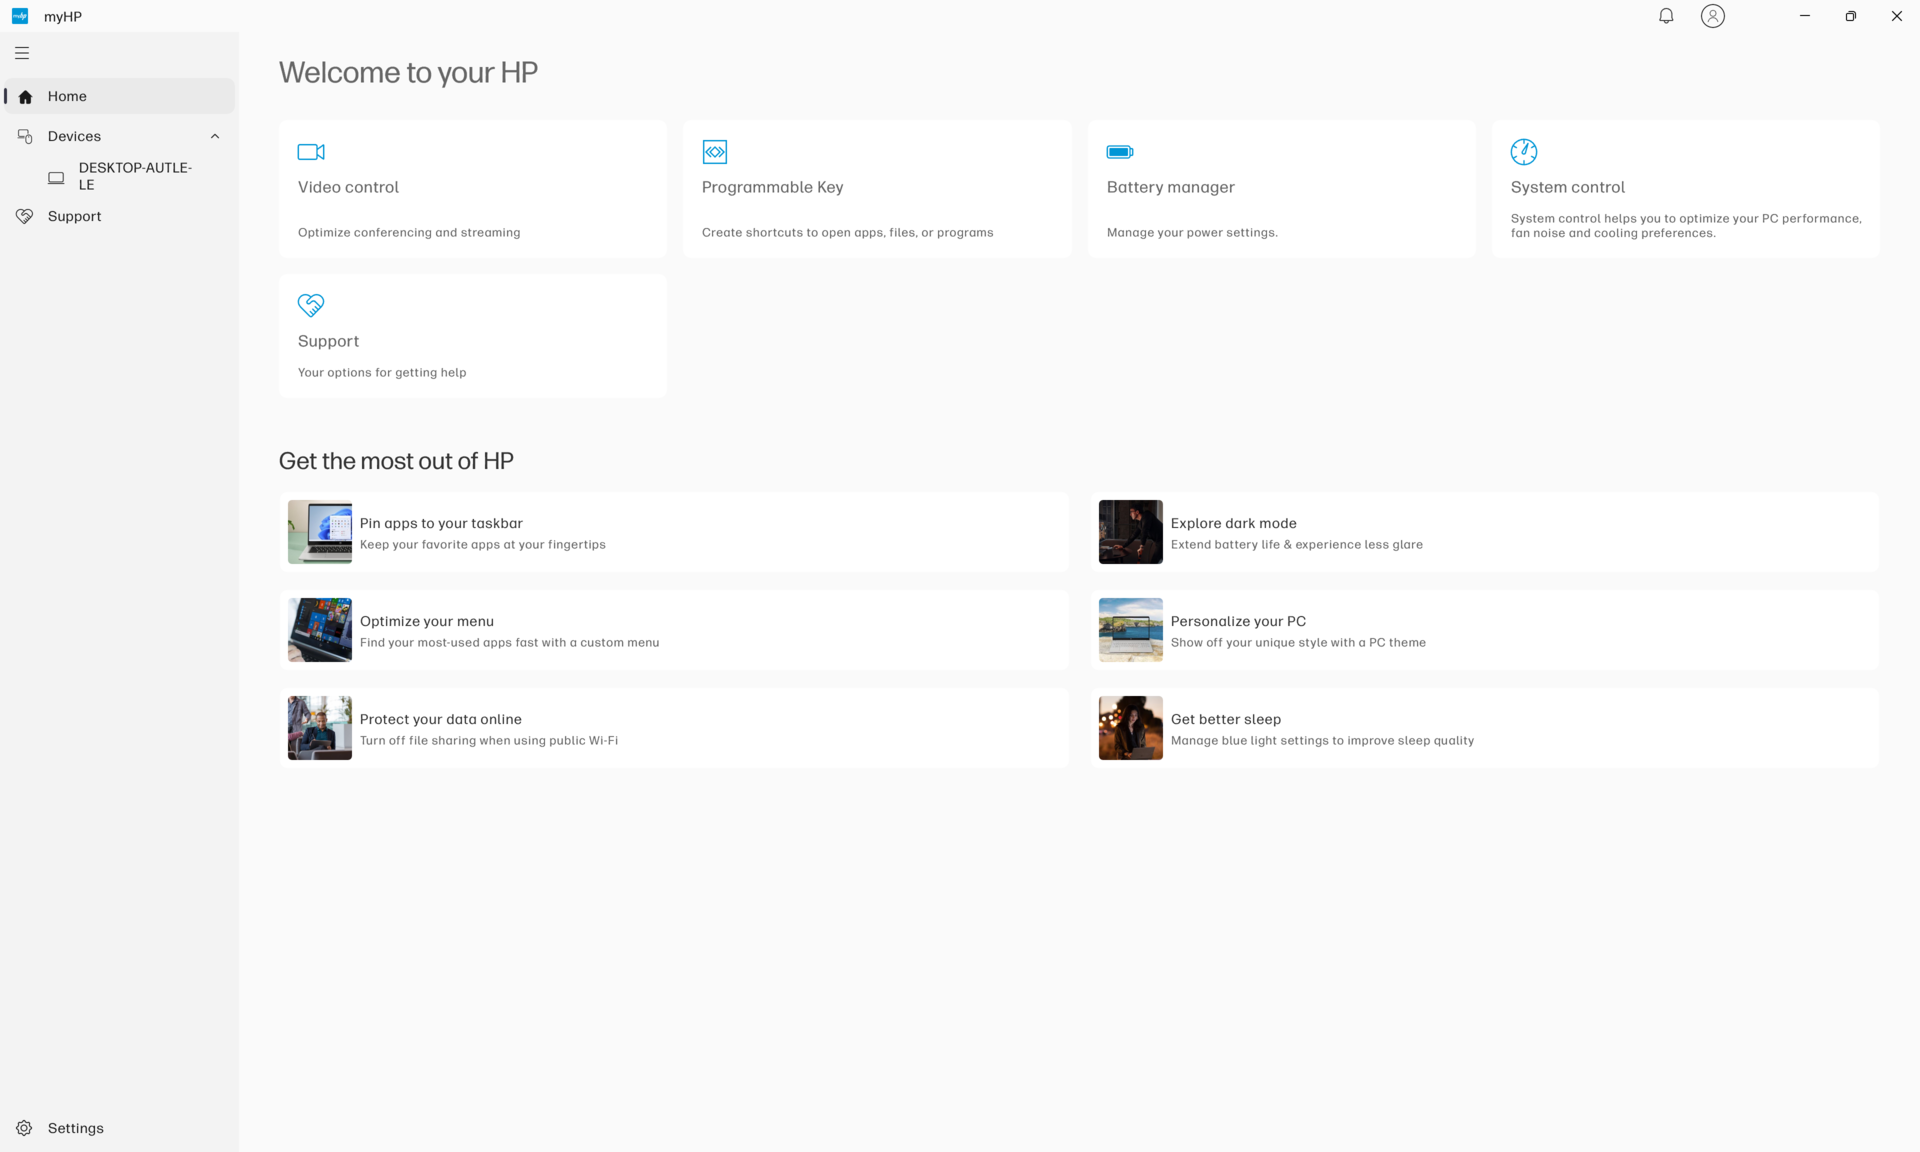
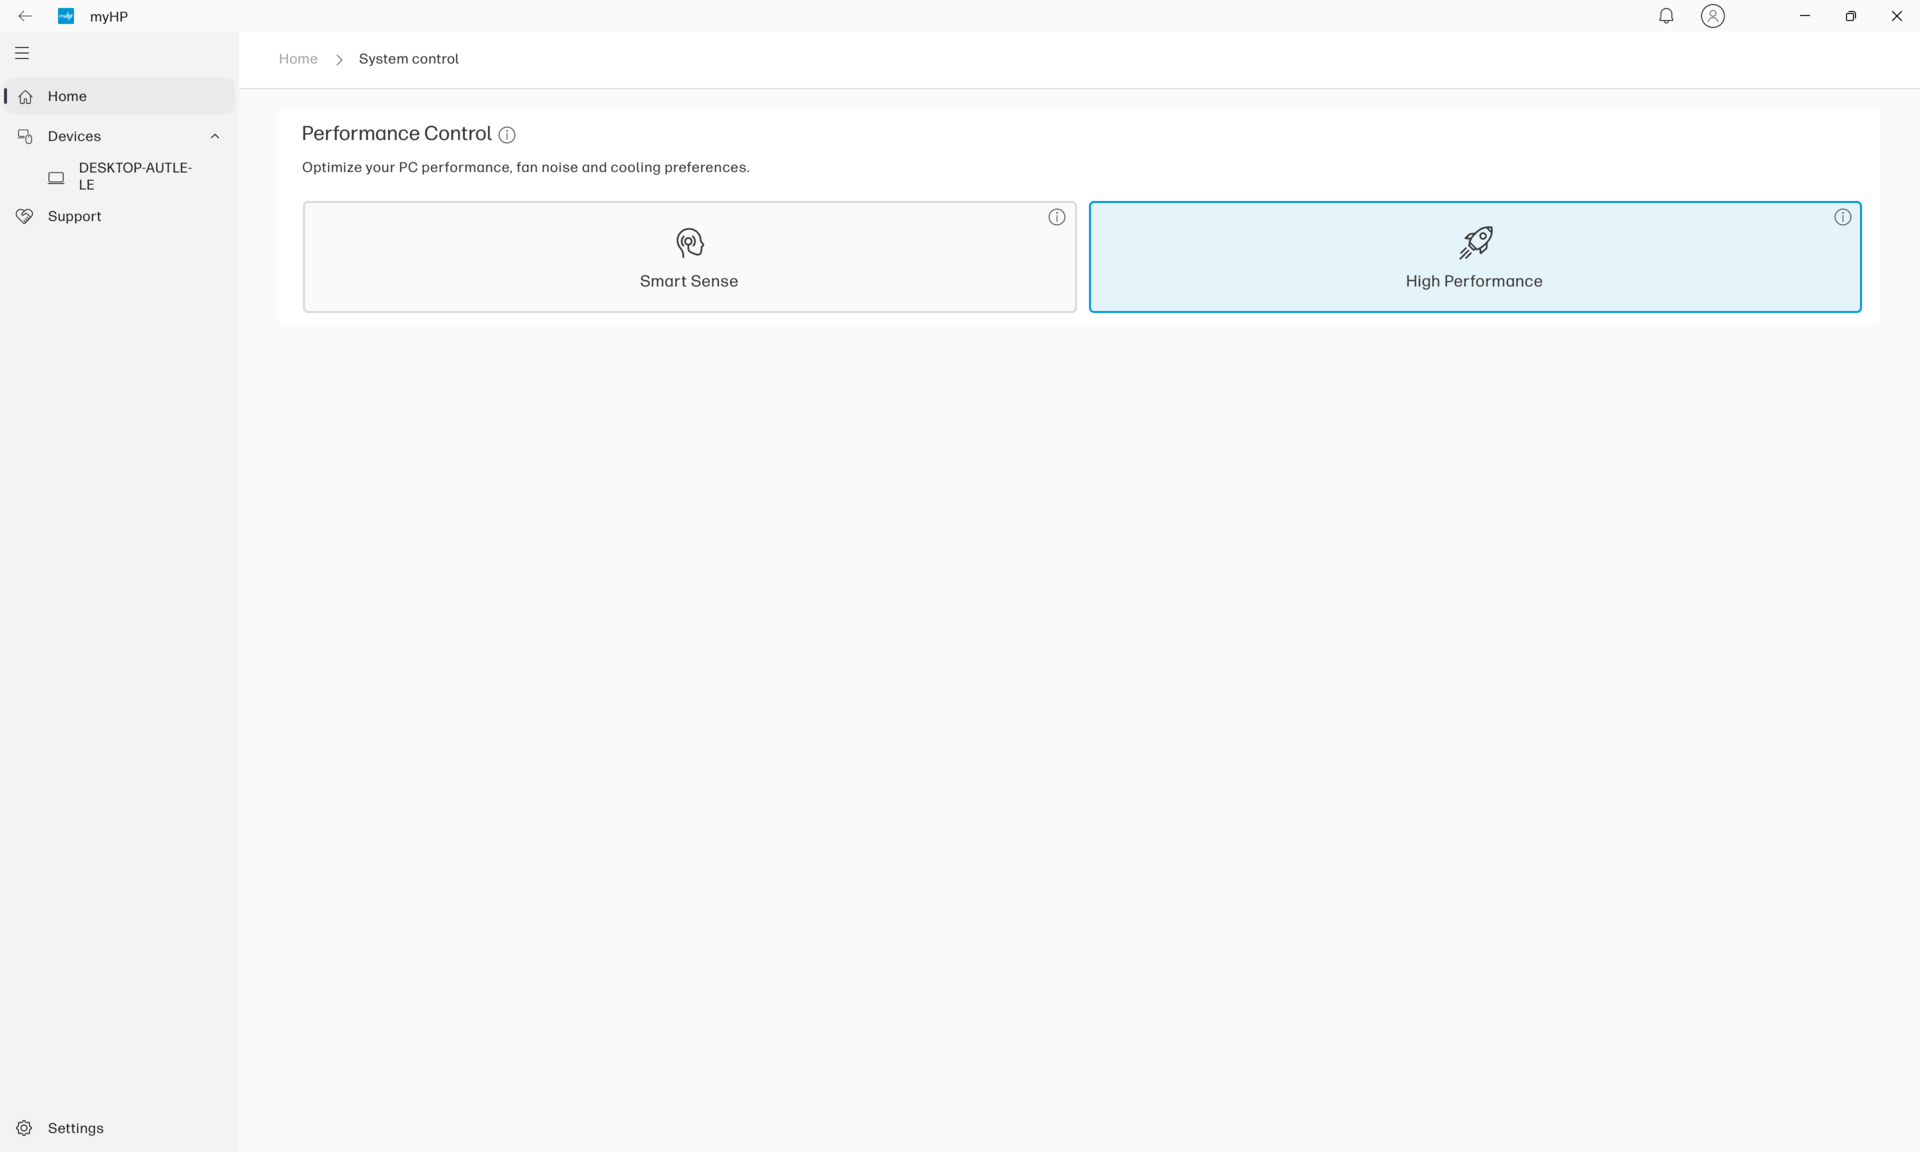
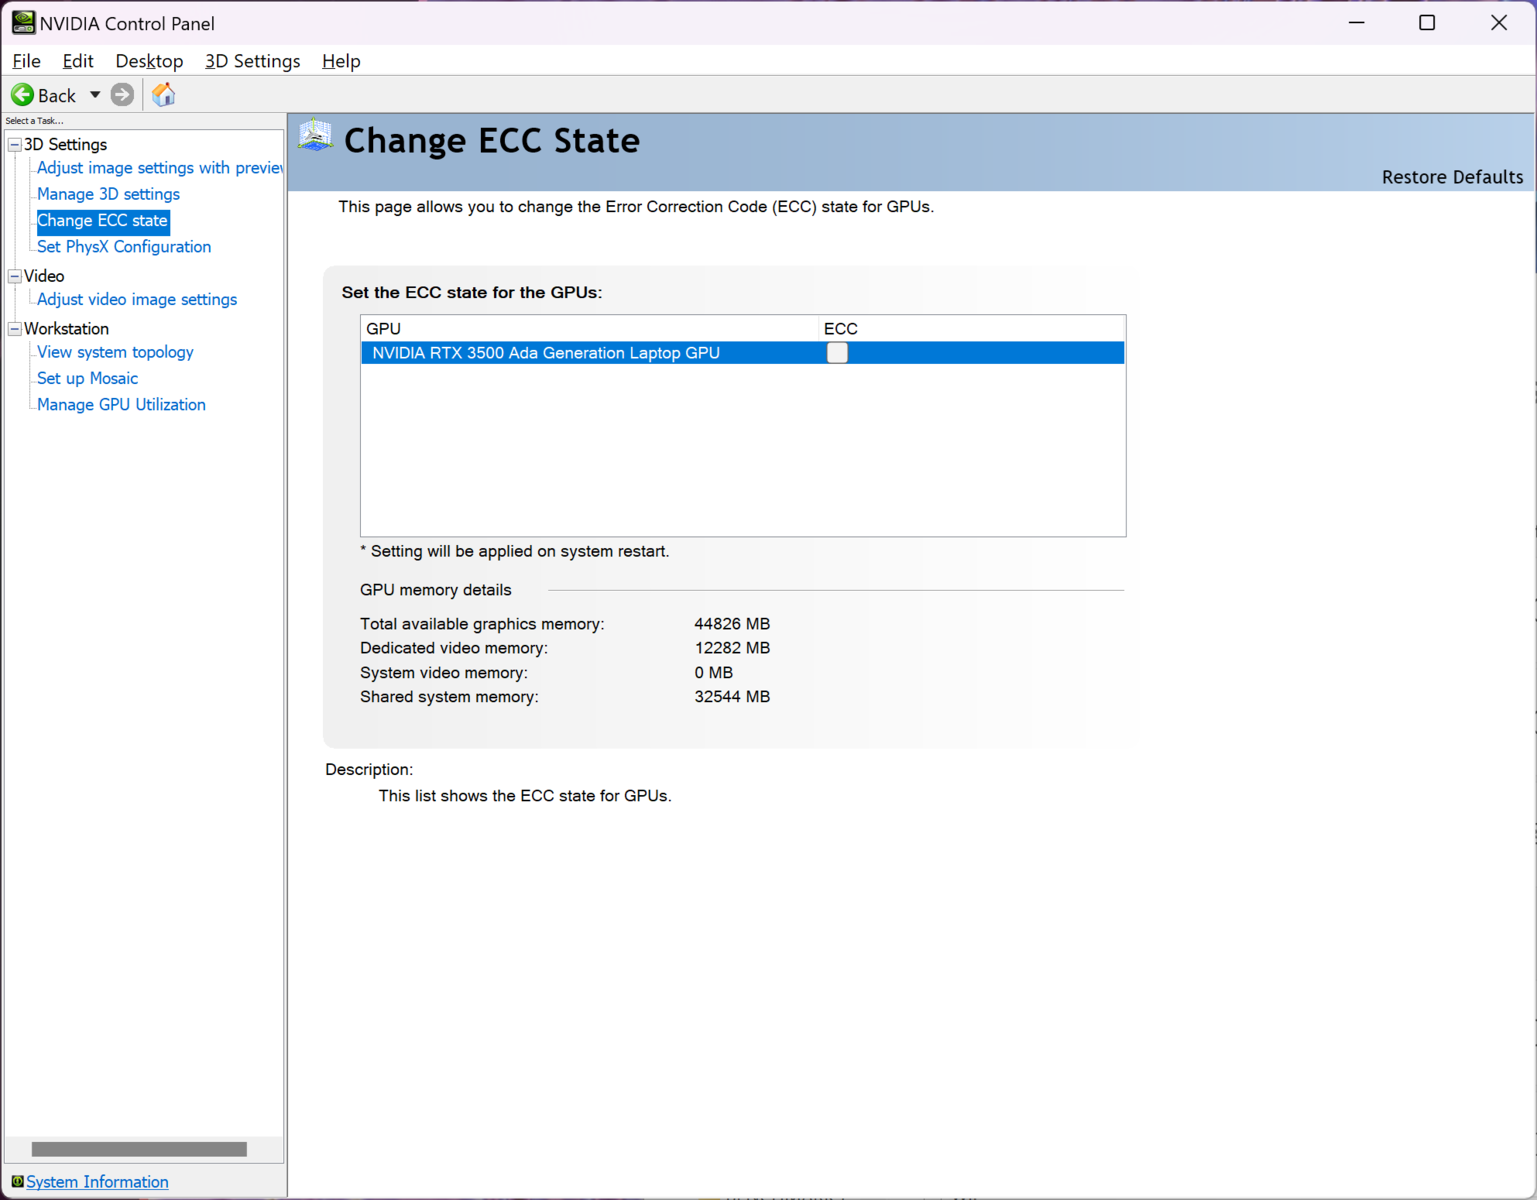
Aşağıdaki kıyaslamaları çalıştırmadan önce hem Windows'u hem de MyHP'yi Performans moduna ayarladık. Ayrıca Nvidia Denetim Masası üzerinden GPU ECC modunu devre dışı bıraktık.
İşlemci
Atlama Core i9-12950HX zBook Fury 16 G9'da Core i9-13950HX zBook Fury 16 G10'da önemli performans artışları sağladı. Ne yazık ki, Fury 16 G10'daki Core i9-13950HX'ten ZBook Fury 16 G10'a geçerken aynı şey söylenemez Core i9-14900HX fury 16 G11 konfigürasyonumuzda. Herhangi bir azaltma hesaba katılmadan önce kazançlar yaklaşık yüzde 10 ila 15 oranında çok daha küçüktür. Kısma hesaba katıldığında, genel işlemci performansı aşağıdaki CineBench R15 xT döngü testi sonuçlarımızda gösterildiği gibi Core i9-13950HX ile esasen aynı olacaktır. Core i9-14900HX, Core i9-13950HX ile aynı temel mimariyi kullanmaktadır ve bu nedenle geçen yılki seçeneklerin yeniden markalanması olarak düşünülebilir. Bu nedenle, daha yüksek Turbo Boost tavanı, daha yüksek Turbo Boost hızları kısa ömürlü olsa bile, giden işlemciye göre ana avantajıdır.
İşlemci Lenovo Legion 9 16IRX9hP ile aynı Core i9-14900HX'e sahip olan bu ürün, daha yüksek Turbo Boost saat hızlarını sürdürebilmek için daha yetenekli soğutma çözümü sayesinde muhtemelen yüzde 20'ye kadar daha hızlı çalışacaktır.
Cinebench R15 Multi Loop
Cinebench R23: Multi Core | Single Core
Cinebench R20: CPU (Multi Core) | CPU (Single Core)
Cinebench R15: CPU Multi 64Bit | CPU Single 64Bit
Blender: v2.79 BMW27 CPU
7-Zip 18.03: 7z b 4 | 7z b 4 -mmt1
Geekbench 6.4: Multi-Core | Single-Core
Geekbench 5.5: Multi-Core | Single-Core
HWBOT x265 Benchmark v2.2: 4k Preset
LibreOffice : 20 Documents To PDF
R Benchmark 2.5: Overall mean
| CPU Performance Rating | |
| Asus ProArt Studiobook 16 OLED H7604 -2! | |
| Ortalama Intel Core i9-14900HX | |
| HP ZBook Fury 16 G11 | |
| HP ZBook Fury 16 G10 | |
| Dell Precision 5000 5680 | |
| Lenovo ThinkPad P1 G6 21FV001KUS | |
| Asus ExpertBook B6 Flip B6602FC2 -2! | |
| Lenovo ThinkPad P16 G2 21FA000FGE -2! | |
| Lenovo ThinkPad P1 G6-21FV000DGE | |
| Dell Precision 5690 | |
| HP ZBook Fury 16 G9 -2! | |
| MSI CreatorPro Z16P B12UKST -2! | |
| Lenovo ThinkPad P16v G1 AMD | |
| Lenovo ThinkPad P1 G4-20Y4S0KS00 -2! | |
| Cinebench R23 / Multi Core | |
| Asus ProArt Studiobook 16 OLED H7604 | |
| Ortalama Intel Core i9-14900HX (17078 - 36249, n=37) | |
| HP ZBook Fury 16 G11 | |
| HP ZBook Fury 16 G10 | |
| Lenovo ThinkPad P16 G2 21FA000FGE | |
| Asus ExpertBook B6 Flip B6602FC2 | |
| Dell Precision 5690 | |
| HP ZBook Fury 16 G9 | |
| Dell Precision 5000 5680 | |
| Lenovo ThinkPad P1 G6-21FV000DGE | |
| Lenovo ThinkPad P1 G6 21FV001KUS | |
| MSI CreatorPro Z16P B12UKST | |
| Lenovo ThinkPad P16v G1 AMD | |
| Lenovo ThinkPad P1 G4-20Y4S0KS00 | |
| Cinebench R23 / Single Core | |
| HP ZBook Fury 16 G11 | |
| Ortalama Intel Core i9-14900HX (1720 - 2245, n=37) | |
| Asus ProArt Studiobook 16 OLED H7604 | |
| HP ZBook Fury 16 G10 | |
| Lenovo ThinkPad P1 G6-21FV000DGE | |
| Dell Precision 5000 5680 | |
| Lenovo ThinkPad P1 G6 21FV001KUS | |
| HP ZBook Fury 16 G9 | |
| Lenovo ThinkPad P16 G2 21FA000FGE | |
| Asus ExpertBook B6 Flip B6602FC2 | |
| Dell Precision 5690 | |
| MSI CreatorPro Z16P B12UKST | |
| Lenovo ThinkPad P16v G1 AMD | |
| Lenovo ThinkPad P1 G4-20Y4S0KS00 | |
| Cinebench R20 / CPU (Multi Core) | |
| Asus ProArt Studiobook 16 OLED H7604 | |
| Ortalama Intel Core i9-14900HX (6579 - 13832, n=37) | |
| HP ZBook Fury 16 G11 | |
| HP ZBook Fury 16 G10 | |
| Asus ExpertBook B6 Flip B6602FC2 | |
| Lenovo ThinkPad P16 G2 21FA000FGE | |
| Dell Precision 5690 | |
| HP ZBook Fury 16 G9 | |
| Dell Precision 5000 5680 | |
| Lenovo ThinkPad P1 G6-21FV000DGE | |
| MSI CreatorPro Z16P B12UKST | |
| Lenovo ThinkPad P1 G6 21FV001KUS | |
| Lenovo ThinkPad P16v G1 AMD | |
| Lenovo ThinkPad P1 G4-20Y4S0KS00 | |
| Cinebench R20 / CPU (Single Core) | |
| HP ZBook Fury 16 G11 | |
| Ortalama Intel Core i9-14900HX (657 - 859, n=37) | |
| HP ZBook Fury 16 G10 | |
| Asus ProArt Studiobook 16 OLED H7604 | |
| Lenovo ThinkPad P1 G6-21FV000DGE | |
| Dell Precision 5000 5680 | |
| Lenovo ThinkPad P1 G6 21FV001KUS | |
| HP ZBook Fury 16 G9 | |
| Asus ExpertBook B6 Flip B6602FC2 | |
| Lenovo ThinkPad P16 G2 21FA000FGE | |
| Dell Precision 5690 | |
| MSI CreatorPro Z16P B12UKST | |
| Lenovo ThinkPad P16v G1 AMD | |
| Lenovo ThinkPad P1 G4-20Y4S0KS00 | |
| Cinebench R15 / CPU Multi 64Bit | |
| Asus ProArt Studiobook 16 OLED H7604 | |
| Ortalama Intel Core i9-14900HX (3263 - 5589, n=38) | |
| HP ZBook Fury 16 G11 | |
| HP ZBook Fury 16 G10 | |
| Asus ExpertBook B6 Flip B6602FC2 | |
| Dell Precision 5690 | |
| Lenovo ThinkPad P16 G2 21FA000FGE | |
| Lenovo ThinkPad P1 G6 21FV001KUS | |
| Lenovo ThinkPad P1 G6-21FV000DGE | |
| HP ZBook Fury 16 G9 | |
| Lenovo ThinkPad P16v G1 AMD | |
| Dell Precision 5000 5680 | |
| MSI CreatorPro Z16P B12UKST | |
| Lenovo ThinkPad P1 G4-20Y4S0KS00 | |
| Cinebench R15 / CPU Single 64Bit | |
| Asus ProArt Studiobook 16 OLED H7604 | |
| Ortalama Intel Core i9-14900HX (247 - 323, n=37) | |
| HP ZBook Fury 16 G10 | |
| HP ZBook Fury 16 G11 | |
| Dell Precision 5000 5680 | |
| Lenovo ThinkPad P1 G6-21FV000DGE | |
| Lenovo ThinkPad P1 G6 21FV001KUS | |
| Lenovo ThinkPad P16 G2 21FA000FGE | |
| Asus ExpertBook B6 Flip B6602FC2 | |
| Dell Precision 5690 | |
| Lenovo ThinkPad P16v G1 AMD | |
| MSI CreatorPro Z16P B12UKST | |
| Lenovo ThinkPad P1 G4-20Y4S0KS00 | |
| HP ZBook Fury 16 G9 | |
| Blender / v2.79 BMW27 CPU | |
| Lenovo ThinkPad P1 G4-20Y4S0KS00 | |
| Dell Precision 5690 | |
| Lenovo ThinkPad P16v G1 AMD | |
| MSI CreatorPro Z16P B12UKST | |
| Dell Precision 5000 5680 | |
| Lenovo ThinkPad P1 G6-21FV000DGE | |
| Lenovo ThinkPad P1 G6 21FV001KUS | |
| Asus ExpertBook B6 Flip B6602FC2 | |
| HP ZBook Fury 16 G9 | |
| Lenovo ThinkPad P16 G2 21FA000FGE | |
| HP ZBook Fury 16 G10 | |
| HP ZBook Fury 16 G11 | |
| Ortalama Intel Core i9-14900HX (91 - 206, n=37) | |
| Asus ProArt Studiobook 16 OLED H7604 | |
| 7-Zip 18.03 / 7z b 4 | |
| Asus ProArt Studiobook 16 OLED H7604 | |
| Ortalama Intel Core i9-14900HX (66769 - 136645, n=37) | |
| HP ZBook Fury 16 G11 | |
| HP ZBook Fury 16 G10 | |
| Lenovo ThinkPad P16 G2 21FA000FGE | |
| HP ZBook Fury 16 G9 | |
| Dell Precision 5690 | |
| Asus ExpertBook B6 Flip B6602FC2 | |
| Lenovo ThinkPad P1 G6-21FV000DGE | |
| Lenovo ThinkPad P1 G6 21FV001KUS | |
| Dell Precision 5000 5680 | |
| MSI CreatorPro Z16P B12UKST | |
| Lenovo ThinkPad P16v G1 AMD | |
| Lenovo ThinkPad P1 G4-20Y4S0KS00 | |
| 7-Zip 18.03 / 7z b 4 -mmt1 | |
| Asus ProArt Studiobook 16 OLED H7604 | |
| Ortalama Intel Core i9-14900HX (5452 - 7545, n=37) | |
| HP ZBook Fury 16 G11 | |
| HP ZBook Fury 16 G10 | |
| Lenovo ThinkPad P1 G6-21FV000DGE | |
| Lenovo ThinkPad P16v G1 AMD | |
| Lenovo ThinkPad P16 G2 21FA000FGE | |
| Lenovo ThinkPad P1 G6 21FV001KUS | |
| Asus ExpertBook B6 Flip B6602FC2 | |
| Dell Precision 5000 5680 | |
| HP ZBook Fury 16 G9 | |
| MSI CreatorPro Z16P B12UKST | |
| Lenovo ThinkPad P1 G4-20Y4S0KS00 | |
| Dell Precision 5690 | |
| Geekbench 6.4 / Multi-Core | |
| Ortalama Intel Core i9-14900HX (13158 - 19665, n=37) | |
| HP ZBook Fury 16 G10 | |
| HP ZBook Fury 16 G11 | |
| Dell Precision 5000 5680 | |
| Dell Precision 5690 | |
| Lenovo ThinkPad P1 G6 21FV001KUS | |
| Lenovo ThinkPad P1 G6-21FV000DGE | |
| Lenovo ThinkPad P16v G1 AMD | |
| Geekbench 6.4 / Single-Core | |
| Ortalama Intel Core i9-14900HX (2419 - 3129, n=37) | |
| HP ZBook Fury 16 G10 | |
| HP ZBook Fury 16 G11 | |
| Lenovo ThinkPad P1 G6 21FV001KUS | |
| Lenovo ThinkPad P1 G6-21FV000DGE | |
| Dell Precision 5000 5680 | |
| Lenovo ThinkPad P16v G1 AMD | |
| Dell Precision 5690 | |
| Geekbench 5.5 / Multi-Core | |
| Asus ProArt Studiobook 16 OLED H7604 | |
| Ortalama Intel Core i9-14900HX (8618 - 23194, n=37) | |
| HP ZBook Fury 16 G11 | |
| HP ZBook Fury 16 G10 | |
| Asus ExpertBook B6 Flip B6602FC2 | |
| Dell Precision 5000 5680 | |
| Lenovo ThinkPad P16 G2 21FA000FGE | |
| Dell Precision 5690 | |
| HP ZBook Fury 16 G9 | |
| Lenovo ThinkPad P1 G6 21FV001KUS | |
| MSI CreatorPro Z16P B12UKST | |
| Lenovo ThinkPad P1 G6-21FV000DGE | |
| Lenovo ThinkPad P16v G1 AMD | |
| Lenovo ThinkPad P1 G4-20Y4S0KS00 | |
| Geekbench 5.5 / Single-Core | |
| Asus ProArt Studiobook 16 OLED H7604 | |
| HP ZBook Fury 16 G10 | |
| Ortalama Intel Core i9-14900HX (1669 - 2210, n=37) | |
| Dell Precision 5000 5680 | |
| HP ZBook Fury 16 G11 | |
| Lenovo ThinkPad P1 G6 21FV001KUS | |
| Lenovo ThinkPad P1 G6-21FV000DGE | |
| HP ZBook Fury 16 G9 | |
| Asus ExpertBook B6 Flip B6602FC2 | |
| Lenovo ThinkPad P16 G2 21FA000FGE | |
| Dell Precision 5690 | |
| Lenovo ThinkPad P16v G1 AMD | |
| MSI CreatorPro Z16P B12UKST | |
| Lenovo ThinkPad P1 G4-20Y4S0KS00 | |
| HWBOT x265 Benchmark v2.2 / 4k Preset | |
| Asus ProArt Studiobook 16 OLED H7604 | |
| Ortalama Intel Core i9-14900HX (16.8 - 38.9, n=37) | |
| HP ZBook Fury 16 G11 | |
| HP ZBook Fury 16 G10 | |
| Lenovo ThinkPad P16 G2 21FA000FGE | |
| Dell Precision 5690 | |
| Asus ExpertBook B6 Flip B6602FC2 | |
| Dell Precision 5000 5680 | |
| Lenovo ThinkPad P1 G6 21FV001KUS | |
| HP ZBook Fury 16 G9 | |
| MSI CreatorPro Z16P B12UKST | |
| Lenovo ThinkPad P1 G6-21FV000DGE | |
| Lenovo ThinkPad P16v G1 AMD | |
| Lenovo ThinkPad P1 G4-20Y4S0KS00 | |
| LibreOffice / 20 Documents To PDF | |
| Lenovo ThinkPad P16 G2 21FA000FGE | |
| HP ZBook Fury 16 G11 | |
| Lenovo ThinkPad P1 G6-21FV000DGE | |
| Lenovo ThinkPad P16v G1 AMD | |
| Lenovo ThinkPad P1 G4-20Y4S0KS00 | |
| Lenovo ThinkPad P1 G6 21FV001KUS | |
| Asus ProArt Studiobook 16 OLED H7604 | |
| HP ZBook Fury 16 G10 | |
| Ortalama Intel Core i9-14900HX (19 - 85.1, n=37) | |
| Asus ExpertBook B6 Flip B6602FC2 | |
| Dell Precision 5690 | |
| Dell Precision 5000 5680 | |
| MSI CreatorPro Z16P B12UKST | |
| HP ZBook Fury 16 G9 | |
| R Benchmark 2.5 / Overall mean | |
| Lenovo ThinkPad P1 G4-20Y4S0KS00 | |
| Dell Precision 5690 | |
| MSI CreatorPro Z16P B12UKST | |
| Asus ExpertBook B6 Flip B6602FC2 | |
| Lenovo ThinkPad P16 G2 21FA000FGE | |
| Lenovo ThinkPad P16v G1 AMD | |
| HP ZBook Fury 16 G9 | |
| Lenovo ThinkPad P1 G6-21FV000DGE | |
| Dell Precision 5000 5680 | |
| Lenovo ThinkPad P1 G6 21FV001KUS | |
| HP ZBook Fury 16 G10 | |
| Ortalama Intel Core i9-14900HX (0.3604 - 0.4859, n=37) | |
| Asus ProArt Studiobook 16 OLED H7604 | |
| HP ZBook Fury 16 G11 | |
Cinebench R23: Multi Core | Single Core
Cinebench R20: CPU (Multi Core) | CPU (Single Core)
Cinebench R15: CPU Multi 64Bit | CPU Single 64Bit
Blender: v2.79 BMW27 CPU
7-Zip 18.03: 7z b 4 | 7z b 4 -mmt1
Geekbench 6.4: Multi-Core | Single-Core
Geekbench 5.5: Multi-Core | Single-Core
HWBOT x265 Benchmark v2.2: 4k Preset
LibreOffice : 20 Documents To PDF
R Benchmark 2.5: Overall mean
* ... daha küçük daha iyidir
AIDA64: FP32 Ray-Trace | FPU Julia | CPU SHA3 | CPU Queen | FPU SinJulia | FPU Mandel | CPU AES | CPU ZLib | FP64 Ray-Trace | CPU PhotoWorxx
| Performance Rating | |
| Asus ProArt Studiobook 16 OLED H7604 | |
| Ortalama Intel Core i9-14900HX | |
| HP ZBook Fury 16 G10 | |
| HP ZBook Fury 16 G11 | |
| Dell Precision 5690 | |
| Lenovo ThinkPad P16 G2 21FA000FGE | |
| HP ZBook Fury 16 G9 | |
| Lenovo ThinkPad P1 G6 21FV001KUS | |
| AIDA64 / FP32 Ray-Trace | |
| Asus ProArt Studiobook 16 OLED H7604 | |
| Ortalama Intel Core i9-14900HX (13098 - 33474, n=36) | |
| HP ZBook Fury 16 G10 | |
| HP ZBook Fury 16 G11 | |
| Dell Precision 5690 | |
| Lenovo ThinkPad P16 G2 21FA000FGE | |
| HP ZBook Fury 16 G9 | |
| Lenovo ThinkPad P1 G6 21FV001KUS | |
| AIDA64 / FPU Julia | |
| Asus ProArt Studiobook 16 OLED H7604 | |
| Ortalama Intel Core i9-14900HX (67573 - 166040, n=36) | |
| HP ZBook Fury 16 G10 | |
| HP ZBook Fury 16 G11 | |
| HP ZBook Fury 16 G9 | |
| Dell Precision 5690 | |
| Lenovo ThinkPad P16 G2 21FA000FGE | |
| Lenovo ThinkPad P1 G6 21FV001KUS | |
| AIDA64 / CPU SHA3 | |
| Asus ProArt Studiobook 16 OLED H7604 | |
| Ortalama Intel Core i9-14900HX (3589 - 7979, n=36) | |
| HP ZBook Fury 16 G10 | |
| HP ZBook Fury 16 G11 | |
| Dell Precision 5690 | |
| Lenovo ThinkPad P16 G2 21FA000FGE | |
| HP ZBook Fury 16 G9 | |
| Lenovo ThinkPad P1 G6 21FV001KUS | |
| AIDA64 / CPU Queen | |
| Ortalama Intel Core i9-14900HX (118405 - 148966, n=36) | |
| HP ZBook Fury 16 G11 | |
| Asus ProArt Studiobook 16 OLED H7604 | |
| HP ZBook Fury 16 G10 | |
| Lenovo ThinkPad P1 G6 21FV001KUS | |
| Lenovo ThinkPad P16 G2 21FA000FGE | |
| HP ZBook Fury 16 G9 | |
| Dell Precision 5690 | |
| AIDA64 / FPU SinJulia | |
| Asus ProArt Studiobook 16 OLED H7604 | |
| Ortalama Intel Core i9-14900HX (10475 - 18517, n=36) | |
| HP ZBook Fury 16 G11 | |
| HP ZBook Fury 16 G10 | |
| Lenovo ThinkPad P16 G2 21FA000FGE | |
| HP ZBook Fury 16 G9 | |
| Dell Precision 5690 | |
| Lenovo ThinkPad P1 G6 21FV001KUS | |
| AIDA64 / FPU Mandel | |
| Asus ProArt Studiobook 16 OLED H7604 | |
| Ortalama Intel Core i9-14900HX (32543 - 83662, n=36) | |
| HP ZBook Fury 16 G10 | |
| HP ZBook Fury 16 G11 | |
| Dell Precision 5690 | |
| HP ZBook Fury 16 G9 | |
| Lenovo ThinkPad P16 G2 21FA000FGE | |
| Lenovo ThinkPad P1 G6 21FV001KUS | |
| AIDA64 / CPU AES | |
| Ortalama Intel Core i9-14900HX (86964 - 241777, n=36) | |
| Asus ProArt Studiobook 16 OLED H7604 | |
| HP ZBook Fury 16 G10 | |
| HP ZBook Fury 16 G11 | |
| HP ZBook Fury 16 G9 | |
| Dell Precision 5690 | |
| Lenovo ThinkPad P16 G2 21FA000FGE | |
| Lenovo ThinkPad P1 G6 21FV001KUS | |
| AIDA64 / CPU ZLib | |
| Asus ProArt Studiobook 16 OLED H7604 | |
| Ortalama Intel Core i9-14900HX (1054 - 2292, n=36) | |
| HP ZBook Fury 16 G11 | |
| HP ZBook Fury 16 G10 | |
| Dell Precision 5690 | |
| HP ZBook Fury 16 G9 | |
| Lenovo ThinkPad P1 G6 21FV001KUS | |
| Lenovo ThinkPad P16 G2 21FA000FGE | |
| AIDA64 / FP64 Ray-Trace | |
| Asus ProArt Studiobook 16 OLED H7604 | |
| Ortalama Intel Core i9-14900HX (6809 - 18349, n=36) | |
| HP ZBook Fury 16 G10 | |
| HP ZBook Fury 16 G11 | |
| Lenovo ThinkPad P16 G2 21FA000FGE | |
| Dell Precision 5690 | |
| Lenovo ThinkPad P1 G6 21FV001KUS | |
| HP ZBook Fury 16 G9 | |
| AIDA64 / CPU PhotoWorxx | |
| Dell Precision 5690 | |
| Asus ProArt Studiobook 16 OLED H7604 | |
| Ortalama Intel Core i9-14900HX (23903 - 54702, n=36) | |
| HP ZBook Fury 16 G10 | |
| HP ZBook Fury 16 G9 | |
| HP ZBook Fury 16 G11 | |
| Lenovo ThinkPad P16 G2 21FA000FGE | |
| Lenovo ThinkPad P1 G6 21FV001KUS | |
Stres Testi
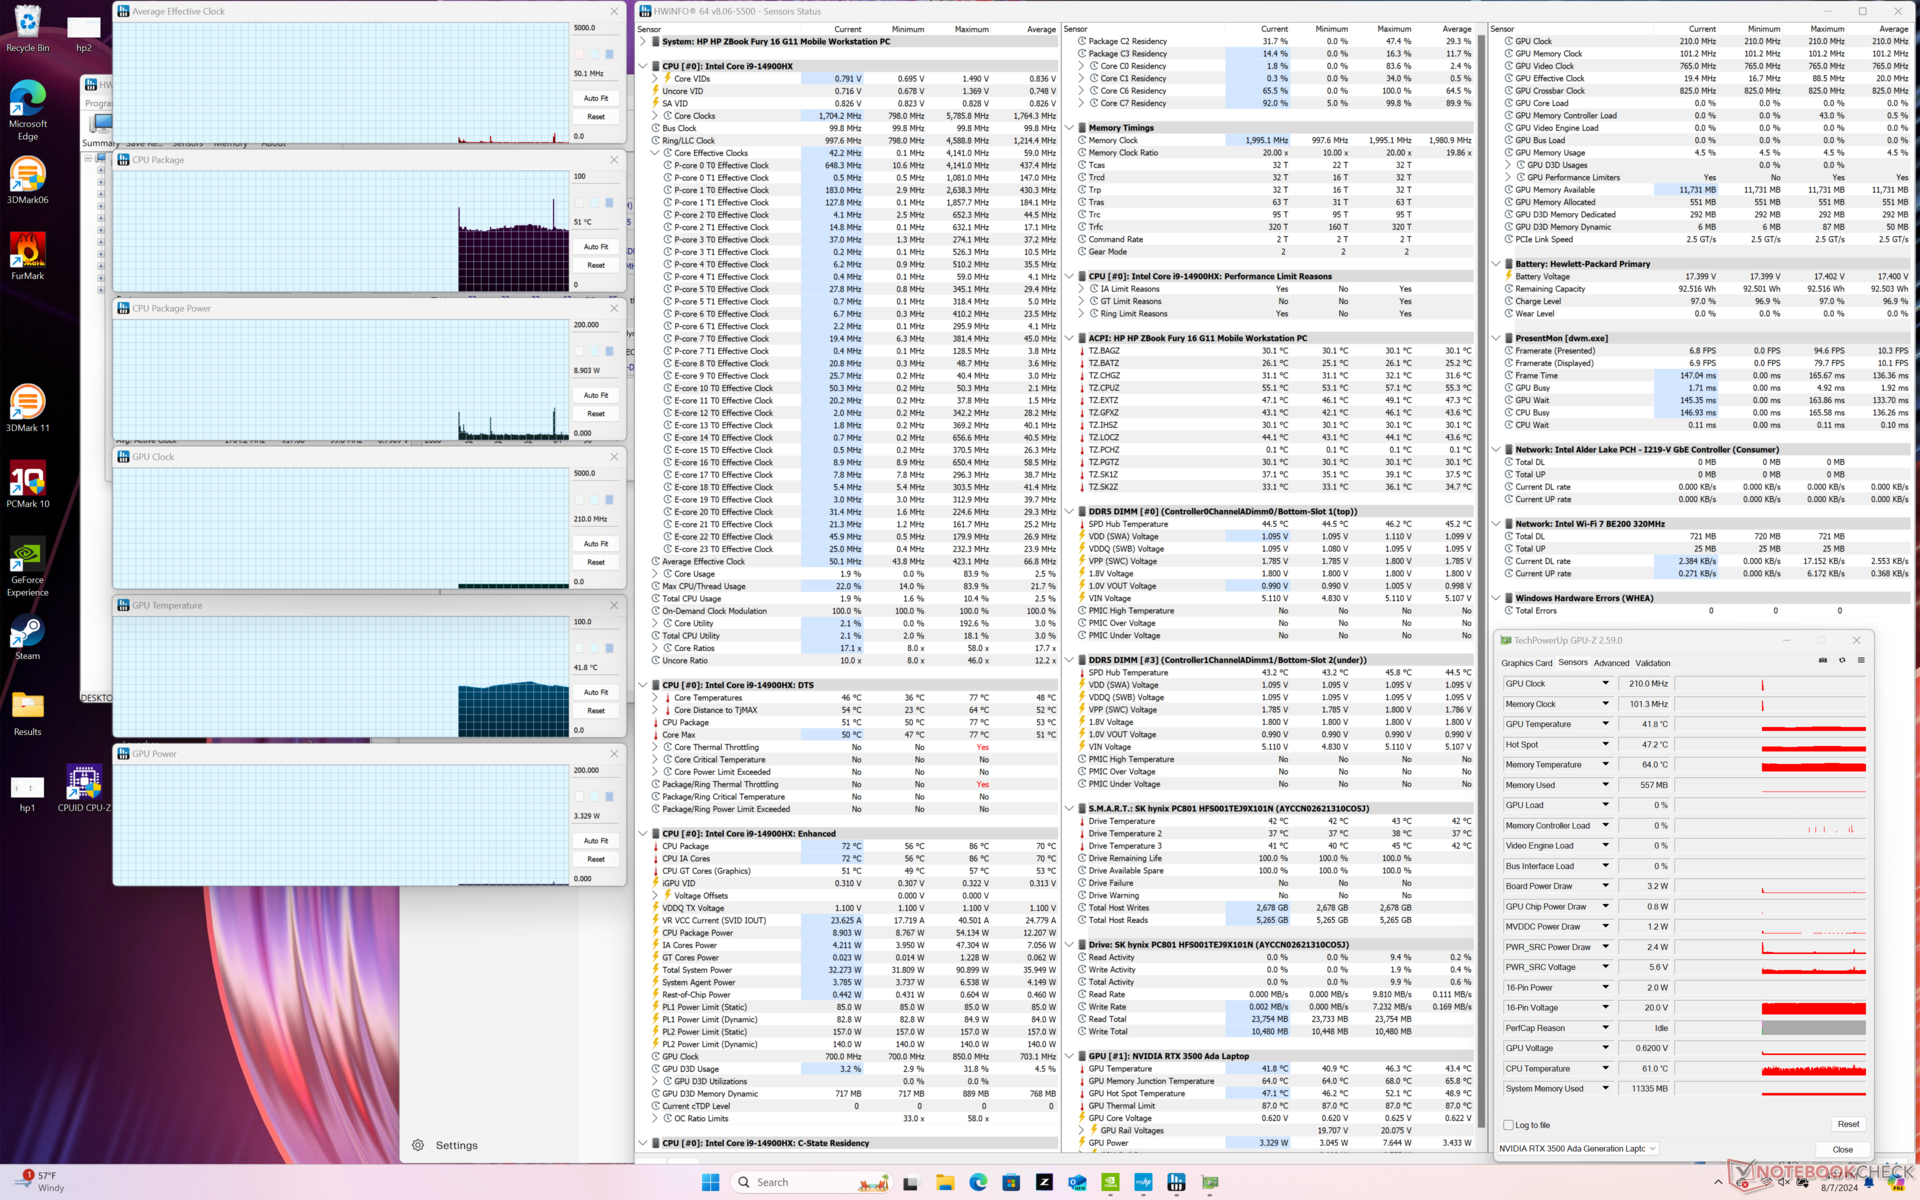
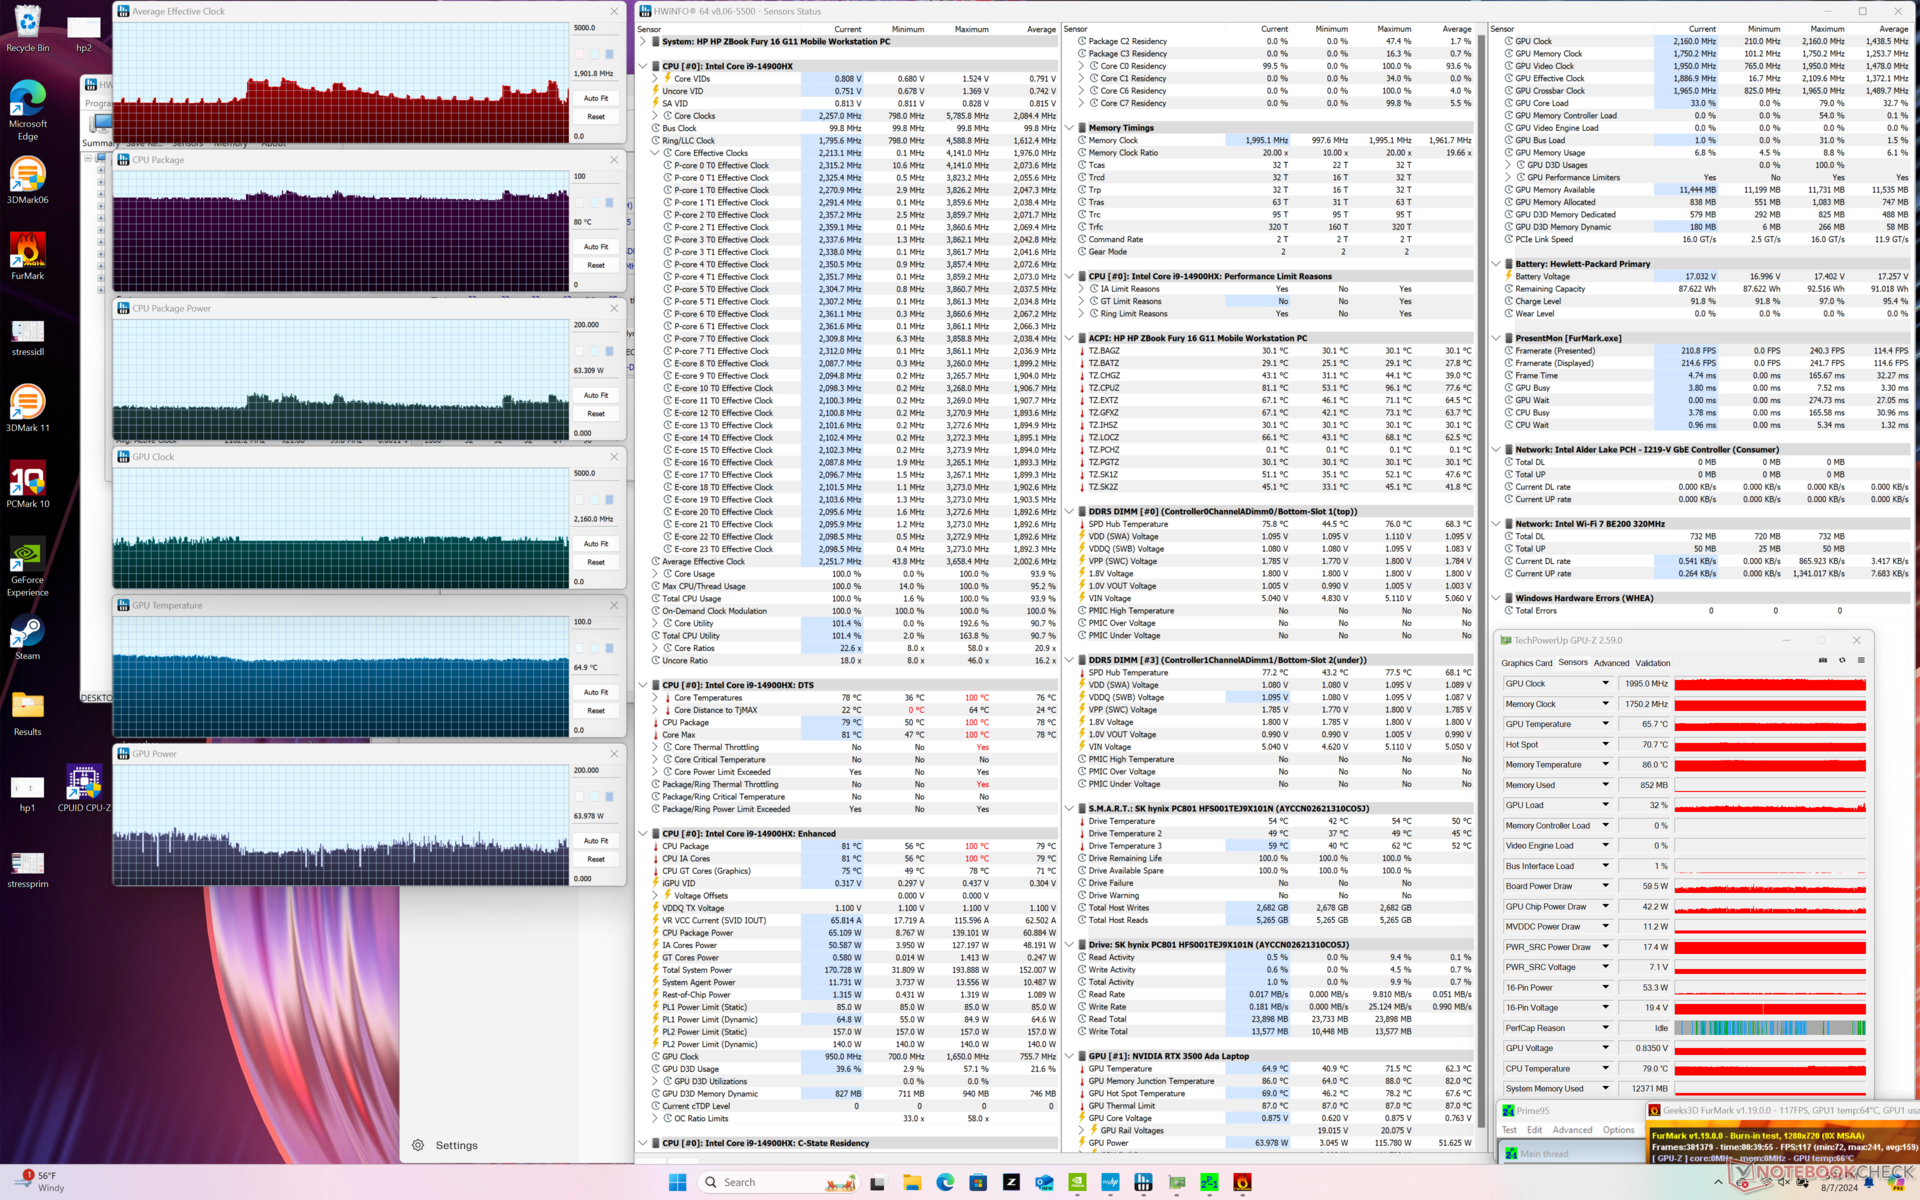
CPU'yu strese sokmak için Prime95 çalıştırıldığında, çekirdek saat hızları ve paket güç çekimi sırasıyla 3,7 GHz ve 139 W'a yükselir, çekirdek sıcaklığı da 99 C'ye yükselir ve en fazla bir dakika sürer. 82 C'lik daha yönetilebilir bir çekirdek sıcaklığını korumak için CPU sonunda 2,3 GHz ve 69 W'a yerleşir. Zaman içinde performanstaki nispeten dik düşüş, yukarıda belirtilen CineBench R15 xT döngü puanlarının giderek düşmesine neden olur.
Oyunlar gibi daha yüksek yükleri çalıştırırken CPU ve GPU sıcaklıkları, performans farklılıklarına rağmen geçen yılki ZBook Fury 16 G10'da kaydettiklerimizle neredeyse aynı değerlerde stabilize olur.
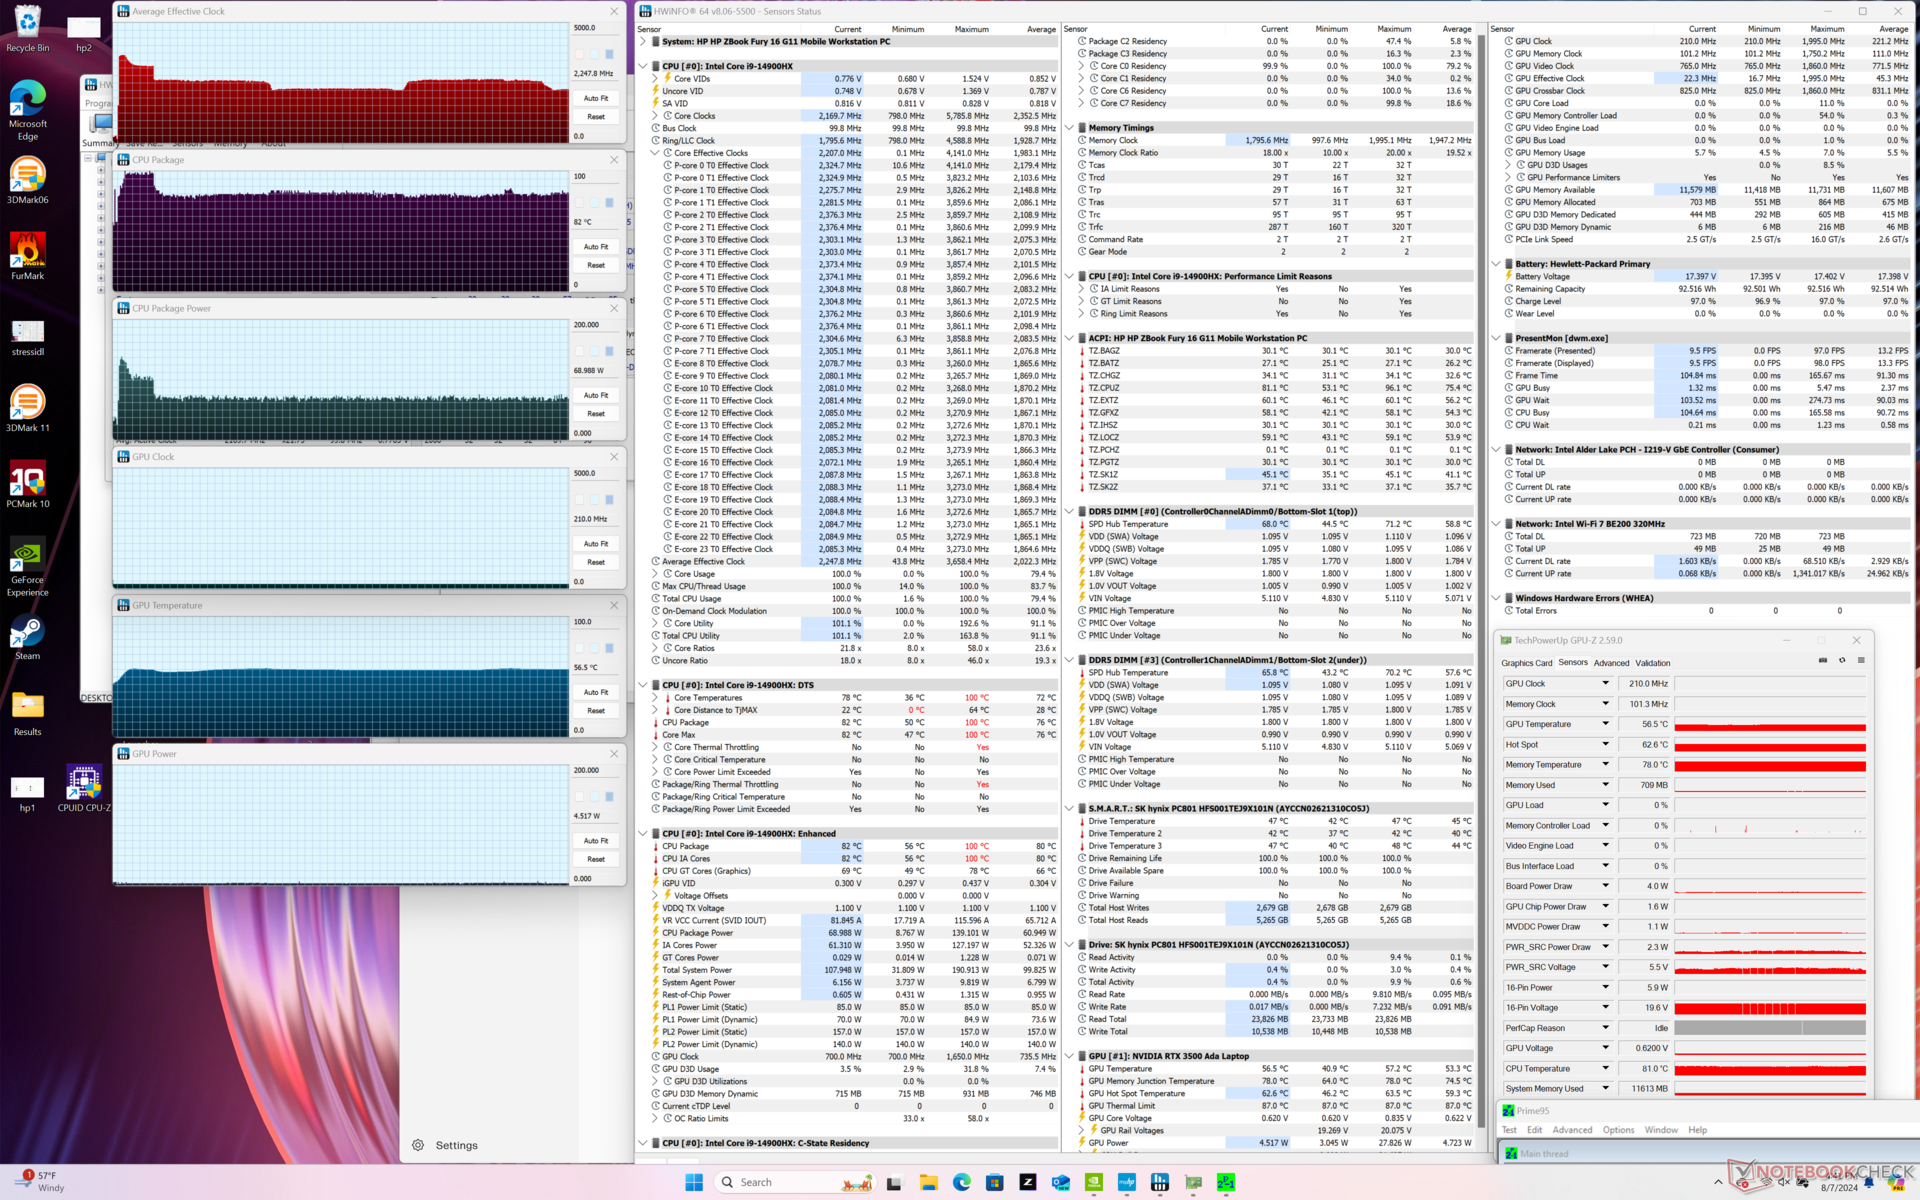
| Ortalama CPU Saati (GHz) | GPU Saati (MHz) | Ortalama CPU Sıcaklığı (°C) | Ortalama GPU Sıcaklığı (°C) | |
| Sistem Boşta | -- | -- | 51 | 42 |
| Prime95 Stres | 2,2 - 2,6 | -- | 82 | 57 |
| Prime95 + FurMark Stres | 1.8 | 1995 | 81 | 65 |
| Cyberpunk 2077 Stres | 1.1 | 1845 | 81 | 69 |
Sistem Performansı
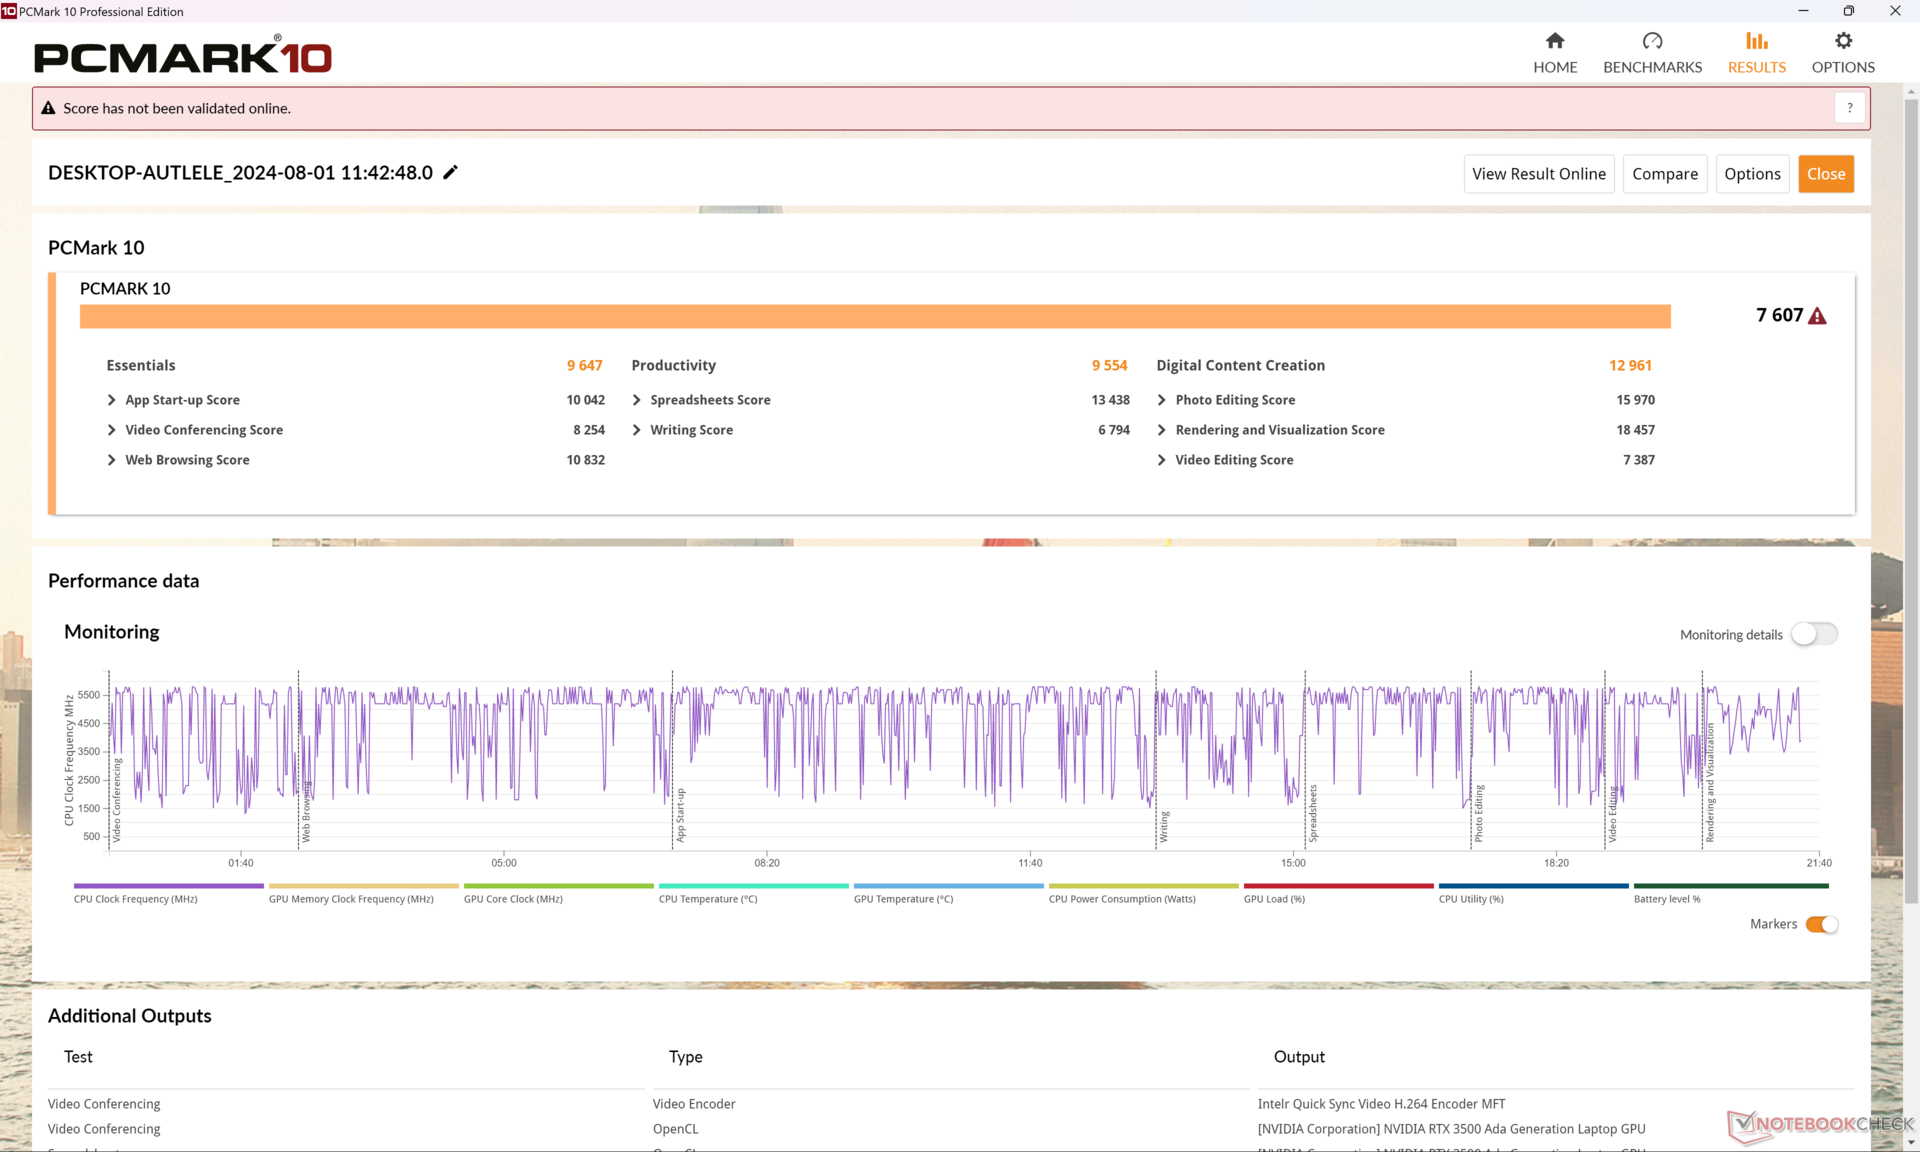
PCMark sonuçları, geçen yılki ZBook Fury 16 G10'da kaydettiklerimize benzer olup, ZBook Fury 16 G11'in çoğu günlük görevi selefinden daha hızlı çalıştırmayacağını göstermektedir.
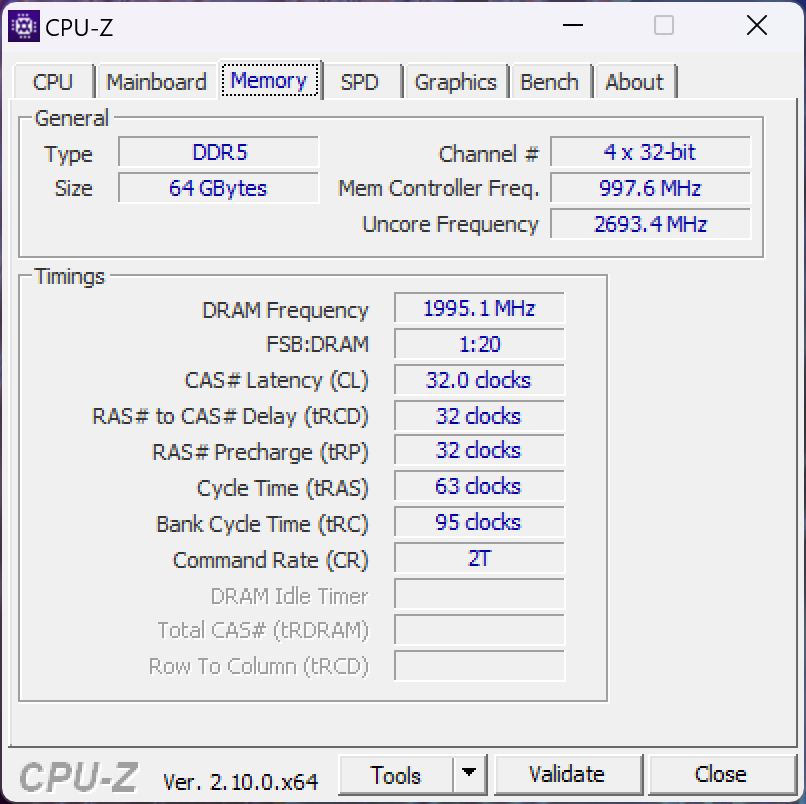
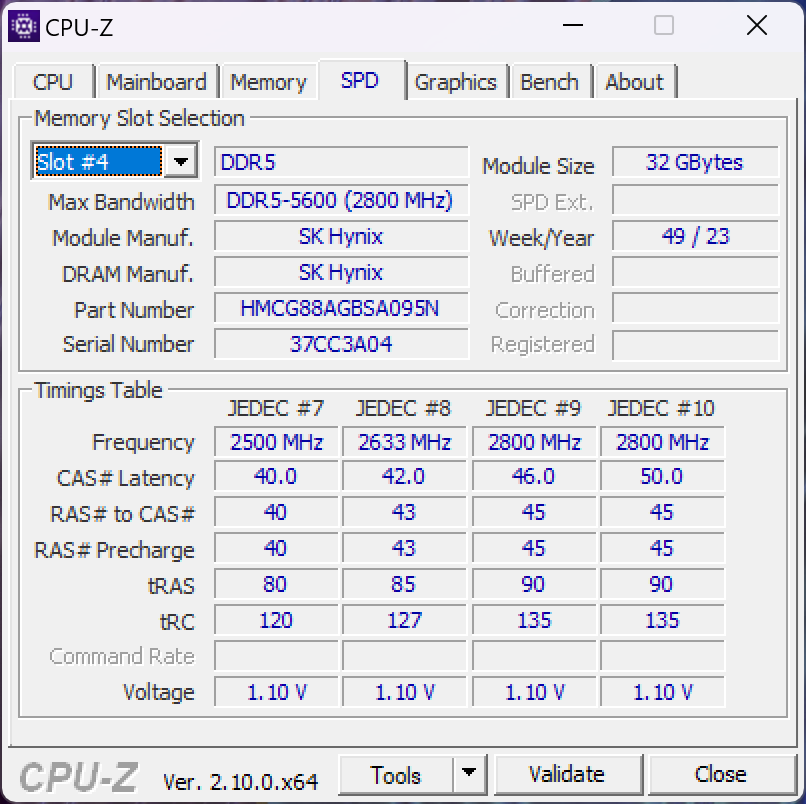
SODIMM standardının sınırlamaları nedeniyle 128 GB bellekle yapılandırıldığında maksimum RAM hızının yalnızca 4000 MT/s ile sınırlı olduğunu unutmayın. Model hem ECC RAM'i hem de ECC olmayan RAM'i desteklemektedir.
CrossMark: Overall | Productivity | Creativity | Responsiveness
WebXPRT 3: Overall
WebXPRT 4: Overall
Mozilla Kraken 1.1: Total
| PCMark 10 / Score | |
| HP ZBook Fury 16 G10 | |
| Dell Precision 5690 | |
| Lenovo ThinkPad P1 G6 21FV001KUS | |
| HP ZBook Fury 16 G11 | |
| Ortalama Intel Core i9-14900HX, NVIDIA RTX 3500 Ada Generation Laptop GPU (n=1) | |
| Asus ProArt Studiobook 16 OLED H7604 | |
| Lenovo ThinkPad P16 G2 21FA000FGE | |
| HP ZBook Fury 16 G9 | |
| PCMark 10 / Essentials | |
| Lenovo ThinkPad P1 G6 21FV001KUS | |
| HP ZBook Fury 16 G10 | |
| Dell Precision 5690 | |
| Lenovo ThinkPad P16 G2 21FA000FGE | |
| HP ZBook Fury 16 G9 | |
| Asus ProArt Studiobook 16 OLED H7604 | |
| HP ZBook Fury 16 G11 | |
| Ortalama Intel Core i9-14900HX, NVIDIA RTX 3500 Ada Generation Laptop GPU (n=1) | |
| PCMark 10 / Productivity | |
| Dell Precision 5690 | |
| Lenovo ThinkPad P1 G6 21FV001KUS | |
| Asus ProArt Studiobook 16 OLED H7604 | |
| HP ZBook Fury 16 G11 | |
| Ortalama Intel Core i9-14900HX, NVIDIA RTX 3500 Ada Generation Laptop GPU (n=1) | |
| Lenovo ThinkPad P16 G2 21FA000FGE | |
| HP ZBook Fury 16 G10 | |
| HP ZBook Fury 16 G9 | |
| PCMark 10 / Digital Content Creation | |
| HP ZBook Fury 16 G10 | |
| HP ZBook Fury 16 G11 | |
| Ortalama Intel Core i9-14900HX, NVIDIA RTX 3500 Ada Generation Laptop GPU (n=1) | |
| Lenovo ThinkPad P1 G6 21FV001KUS | |
| Dell Precision 5690 | |
| Asus ProArt Studiobook 16 OLED H7604 | |
| Lenovo ThinkPad P16 G2 21FA000FGE | |
| HP ZBook Fury 16 G9 | |
| CrossMark / Overall | |
| Asus ProArt Studiobook 16 OLED H7604 | |
| HP ZBook Fury 16 G11 | |
| Ortalama Intel Core i9-14900HX, NVIDIA RTX 3500 Ada Generation Laptop GPU (n=1) | |
| HP ZBook Fury 16 G10 | |
| HP ZBook Fury 16 G9 | |
| Lenovo ThinkPad P16 G2 21FA000FGE | |
| Lenovo ThinkPad P1 G6 21FV001KUS | |
| Dell Precision 5690 | |
| CrossMark / Productivity | |
| Asus ProArt Studiobook 16 OLED H7604 | |
| HP ZBook Fury 16 G11 | |
| Ortalama Intel Core i9-14900HX, NVIDIA RTX 3500 Ada Generation Laptop GPU (n=1) | |
| HP ZBook Fury 16 G10 | |
| HP ZBook Fury 16 G9 | |
| Dell Precision 5690 | |
| Lenovo ThinkPad P1 G6 21FV001KUS | |
| Lenovo ThinkPad P16 G2 21FA000FGE | |
| CrossMark / Creativity | |
| Asus ProArt Studiobook 16 OLED H7604 | |
| HP ZBook Fury 16 G11 | |
| Ortalama Intel Core i9-14900HX, NVIDIA RTX 3500 Ada Generation Laptop GPU (n=1) | |
| Lenovo ThinkPad P16 G2 21FA000FGE | |
| HP ZBook Fury 16 G9 | |
| HP ZBook Fury 16 G10 | |
| Lenovo ThinkPad P1 G6 21FV001KUS | |
| Dell Precision 5690 | |
| CrossMark / Responsiveness | |
| Asus ProArt Studiobook 16 OLED H7604 | |
| HP ZBook Fury 16 G11 | |
| Ortalama Intel Core i9-14900HX, NVIDIA RTX 3500 Ada Generation Laptop GPU (n=1) | |
| HP ZBook Fury 16 G10 | |
| HP ZBook Fury 16 G9 | |
| Dell Precision 5690 | |
| Lenovo ThinkPad P1 G6 21FV001KUS | |
| Lenovo ThinkPad P16 G2 21FA000FGE | |
| WebXPRT 3 / Overall | |
| HP ZBook Fury 16 G10 | |
| Asus ProArt Studiobook 16 OLED H7604 | |
| Lenovo ThinkPad P16 G2 21FA000FGE | |
| HP ZBook Fury 16 G11 | |
| Ortalama Intel Core i9-14900HX, NVIDIA RTX 3500 Ada Generation Laptop GPU (n=1) | |
| Lenovo ThinkPad P1 G6 21FV001KUS | |
| HP ZBook Fury 16 G9 | |
| Dell Precision 5690 | |
| WebXPRT 4 / Overall | |
| HP ZBook Fury 16 G11 | |
| Ortalama Intel Core i9-14900HX, NVIDIA RTX 3500 Ada Generation Laptop GPU (n=1) | |
| HP ZBook Fury 16 G10 | |
| Asus ProArt Studiobook 16 OLED H7604 | |
| Lenovo ThinkPad P1 G6 21FV001KUS | |
| HP ZBook Fury 16 G9 | |
| Dell Precision 5690 | |
| Mozilla Kraken 1.1 / Total | |
| Dell Precision 5690 | |
| HP ZBook Fury 16 G9 | |
| Lenovo ThinkPad P16 G2 21FA000FGE | |
| Lenovo ThinkPad P1 G6 21FV001KUS | |
| HP ZBook Fury 16 G10 | |
| HP ZBook Fury 16 G11 | |
| Ortalama Intel Core i9-14900HX, NVIDIA RTX 3500 Ada Generation Laptop GPU (n=1) | |
| Asus ProArt Studiobook 16 OLED H7604 | |
* ... daha küçük daha iyidir
| PCMark 10 Score | 7607 puan | |
Yardım | ||
| AIDA64 / Memory Copy | |
| Dell Precision 5690 | |
| Ortalama Intel Core i9-14900HX (38028 - 83392, n=36) | |
| Asus ProArt Studiobook 16 OLED H7604 | |
| HP ZBook Fury 16 G10 | |
| HP ZBook Fury 16 G9 | |
| HP ZBook Fury 16 G11 | |
| Lenovo ThinkPad P16 G2 21FA000FGE | |
| Lenovo ThinkPad P1 G6 21FV001KUS | |
| AIDA64 / Memory Read | |
| Dell Precision 5690 | |
| Ortalama Intel Core i9-14900HX (43306 - 87568, n=36) | |
| Asus ProArt Studiobook 16 OLED H7604 | |
| HP ZBook Fury 16 G10 | |
| HP ZBook Fury 16 G11 | |
| HP ZBook Fury 16 G9 | |
| Lenovo ThinkPad P16 G2 21FA000FGE | |
| Lenovo ThinkPad P1 G6 21FV001KUS | |
| AIDA64 / Memory Write | |
| Dell Precision 5690 | |
| Ortalama Intel Core i9-14900HX (37146 - 80589, n=36) | |
| Asus ProArt Studiobook 16 OLED H7604 | |
| HP ZBook Fury 16 G10 | |
| HP ZBook Fury 16 G9 | |
| Lenovo ThinkPad P16 G2 21FA000FGE | |
| HP ZBook Fury 16 G11 | |
| Lenovo ThinkPad P1 G6 21FV001KUS | |
| AIDA64 / Memory Latency | |
| Dell Precision 5690 | |
| HP ZBook Fury 16 G10 | |
| Lenovo ThinkPad P16 G2 21FA000FGE | |
| HP ZBook Fury 16 G11 | |
| HP ZBook Fury 16 G9 | |
| Asus ProArt Studiobook 16 OLED H7604 | |
| Lenovo ThinkPad P1 G6 21FV001KUS | |
| Ortalama Intel Core i9-14900HX (76.1 - 105, n=36) | |
* ... daha küçük daha iyidir
DPC Gecikme Süresi
LatencyMon, ana sayfamızın birden fazla tarayıcı sekmesini açarken DPC sorunlarını ortaya çıkarıyor. 60 FPS'de 4K video oynatma, kaydedilen hiçbir kare düşmesi olmadan mükemmeldir.
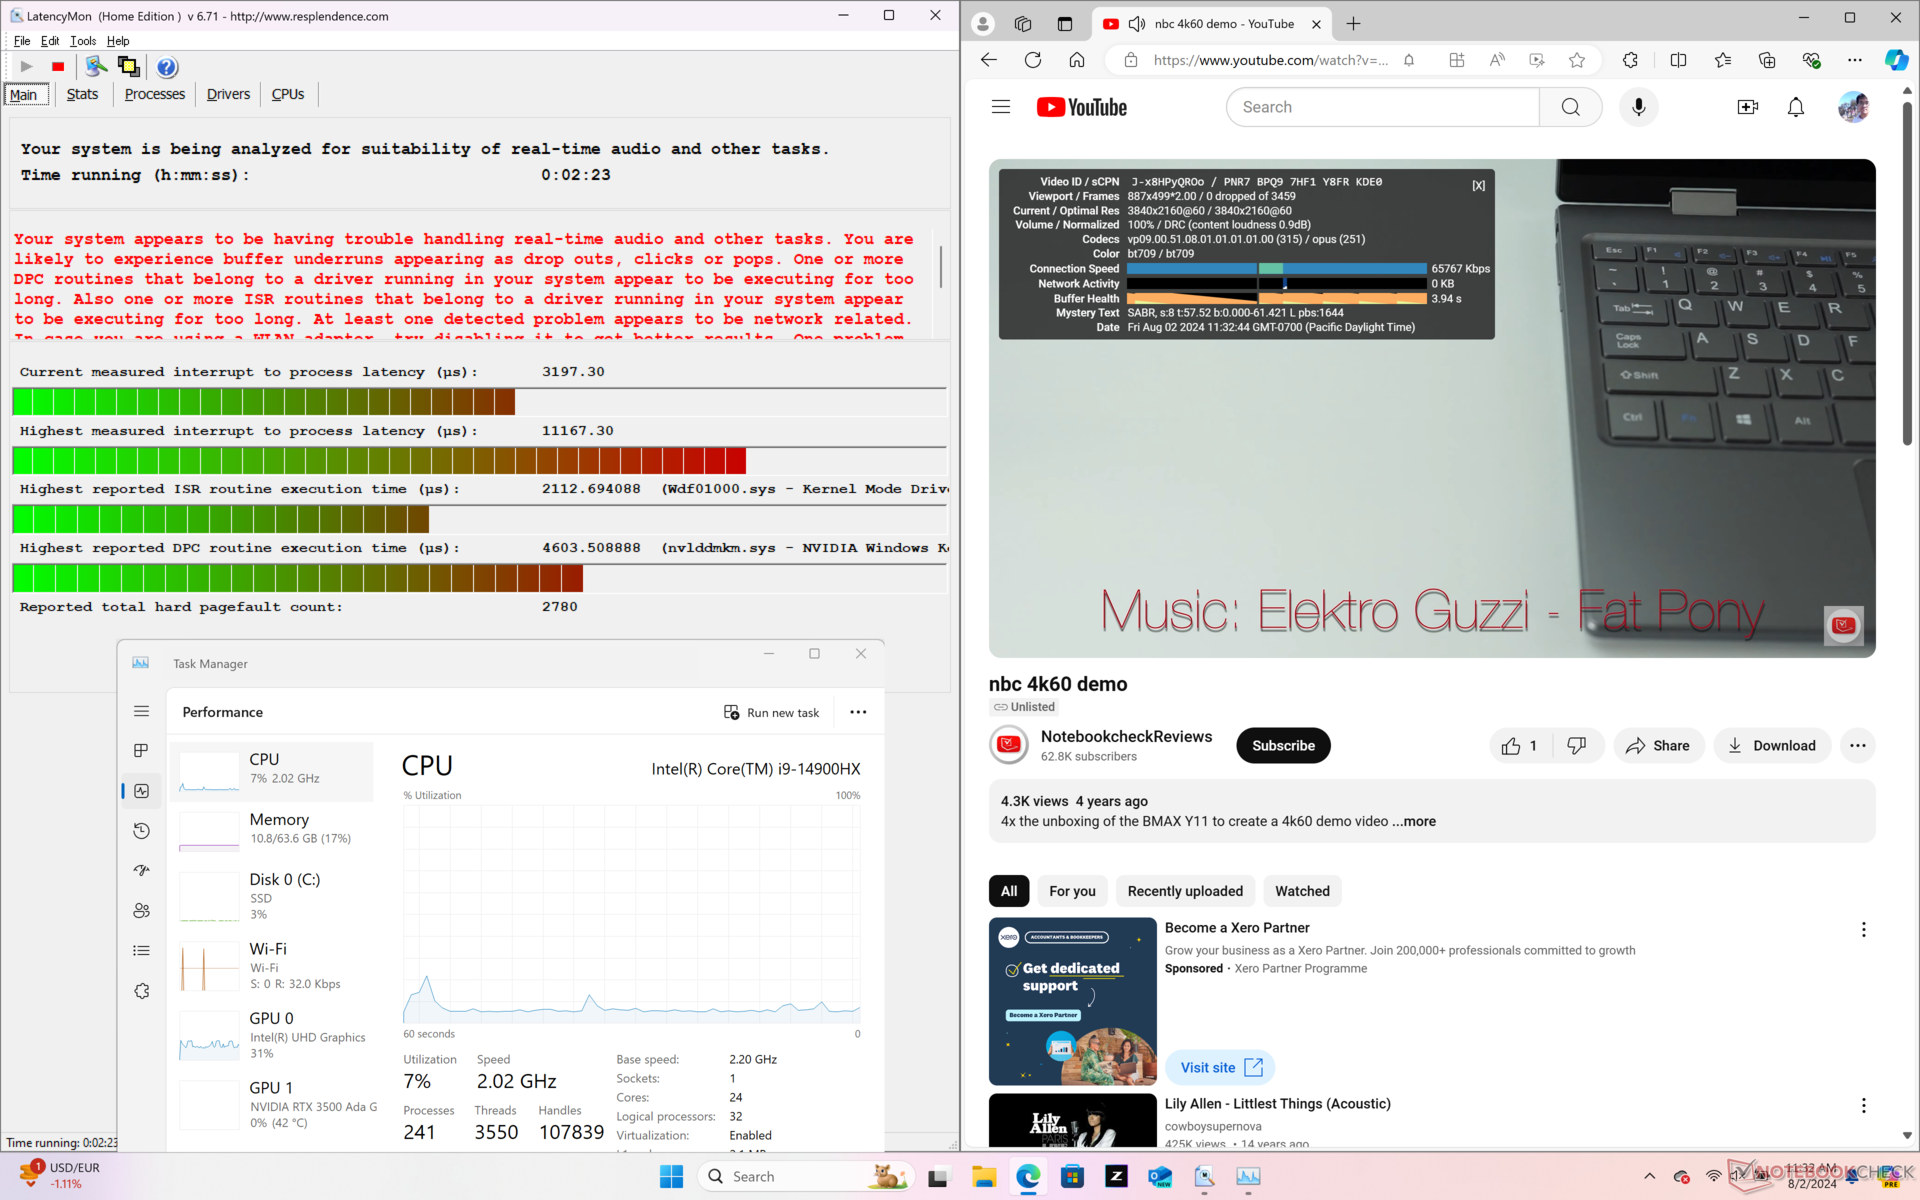

| DPC Latencies / LatencyMon - interrupt to process latency (max), Web, Youtube, Prime95 | |
| HP ZBook Fury 16 G11 | |
| HP ZBook Fury 16 G10 | |
| HP ZBook Fury 16 G9 | |
| Asus ProArt Studiobook 16 OLED H7604 | |
| Lenovo ThinkPad P1 G6 21FV001KUS | |
| Lenovo ThinkPad P16 G2 21FA000FGE | |
| Dell Precision 5690 | |
* ... daha küçük daha iyidir
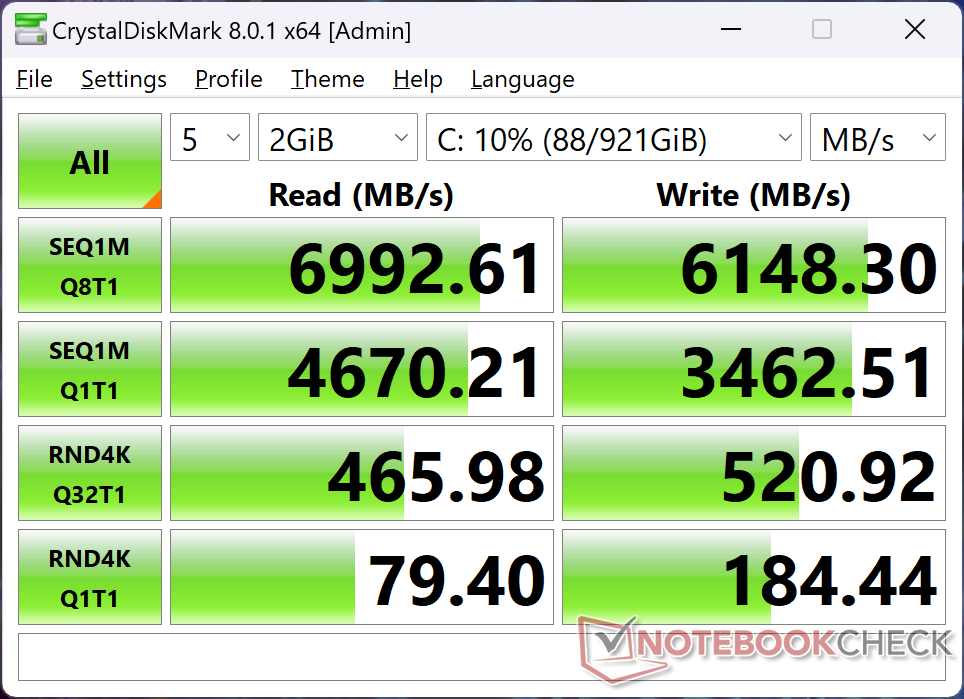
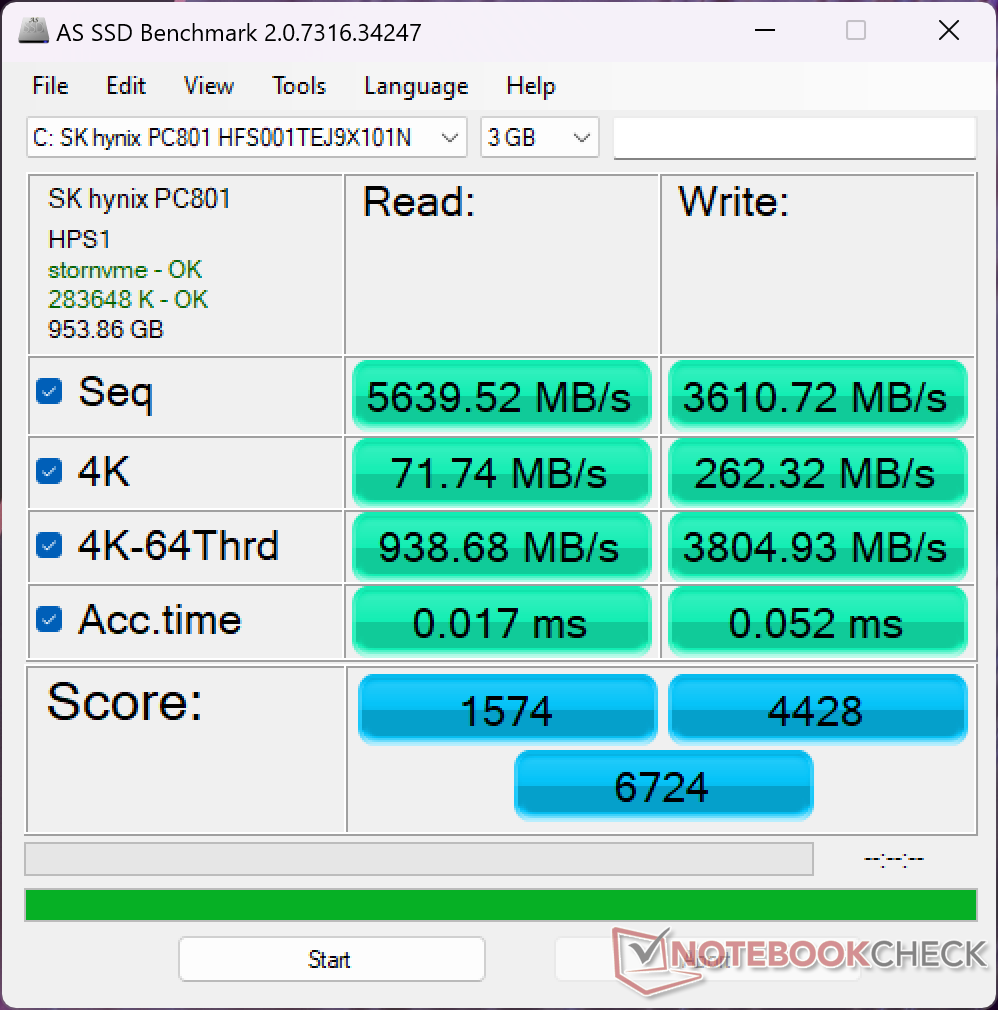
Depolama Cihazları
Test ünitemiz aynı 1 TB ile birlikte gönderilir SK Hynix PC801 HFS001TEJ9X101N Geçen yılki ZBook Fury 16 G10'da bulunan PCIe4 M.2 SSD. Ne yazık ki sürücü de aynı performans düşüklüğü sorunlarından muzdariptir. DiskSpd'yi bir döngü içinde çalıştırırken, transfer hızları neredeyse 7000 MB/sn gibi çok yüksek bir değerden başlayıp, aşağıdaki grafikte gösterildiği gibi sadece birkaç dakika sonra 3400 MB/sn'ye kadar düşmektedir. Bu, sürücüler için yetersiz soğutmaya bağlanabilir, ancak bu belki de diğer dizüstü bilgisayarlardan daha fazla bireysel sürücüyü desteklemek için ödenmesi gereken bedeldir.

| Drive Performance Rating - Percent | |
| HP ZBook Fury 16 G9 | |
| Asus ProArt Studiobook 16 OLED H7604 | |
| HP ZBook Fury 16 G11 | |
| Dell Precision 5690 | |
| HP ZBook Fury 16 G10 | |
| Lenovo ThinkPad P16 G2 21FA000FGE | |
| Lenovo ThinkPad P1 G6 21FV001KUS | |
* ... daha küçük daha iyidir
Disk Throttling: DiskSpd Read Loop, Queue Depth 8
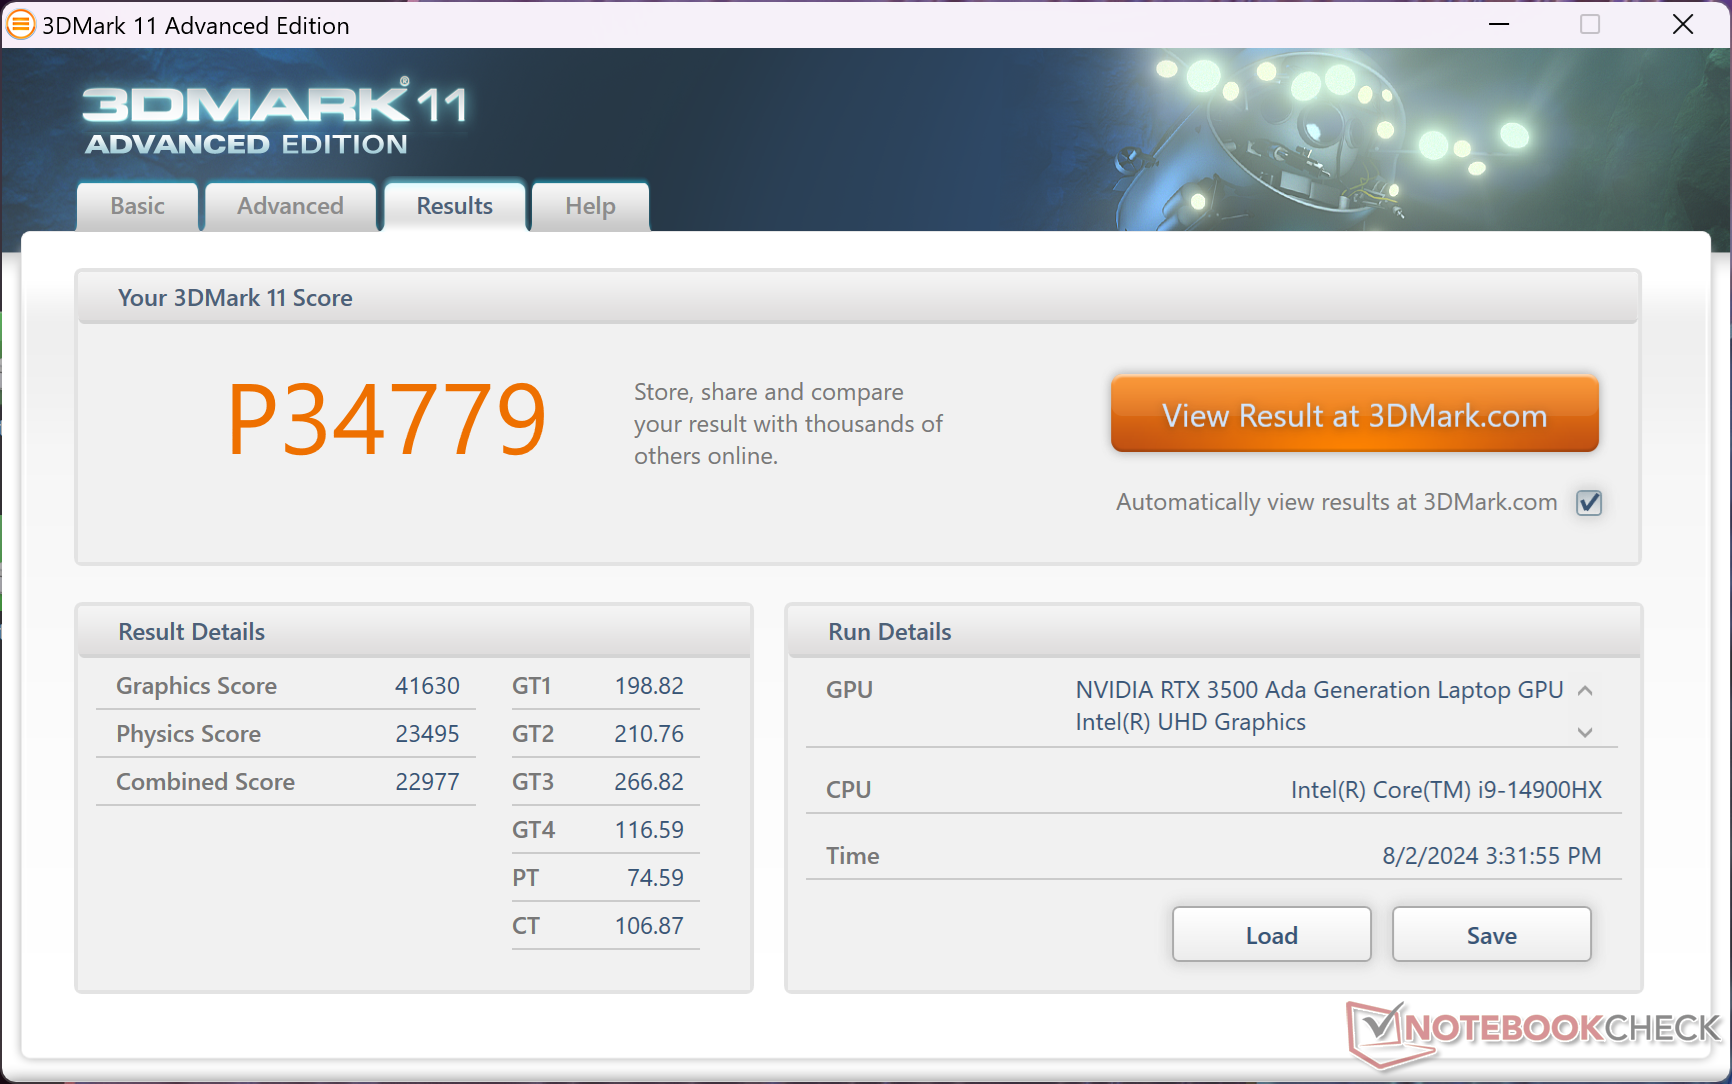
GPU Performansı
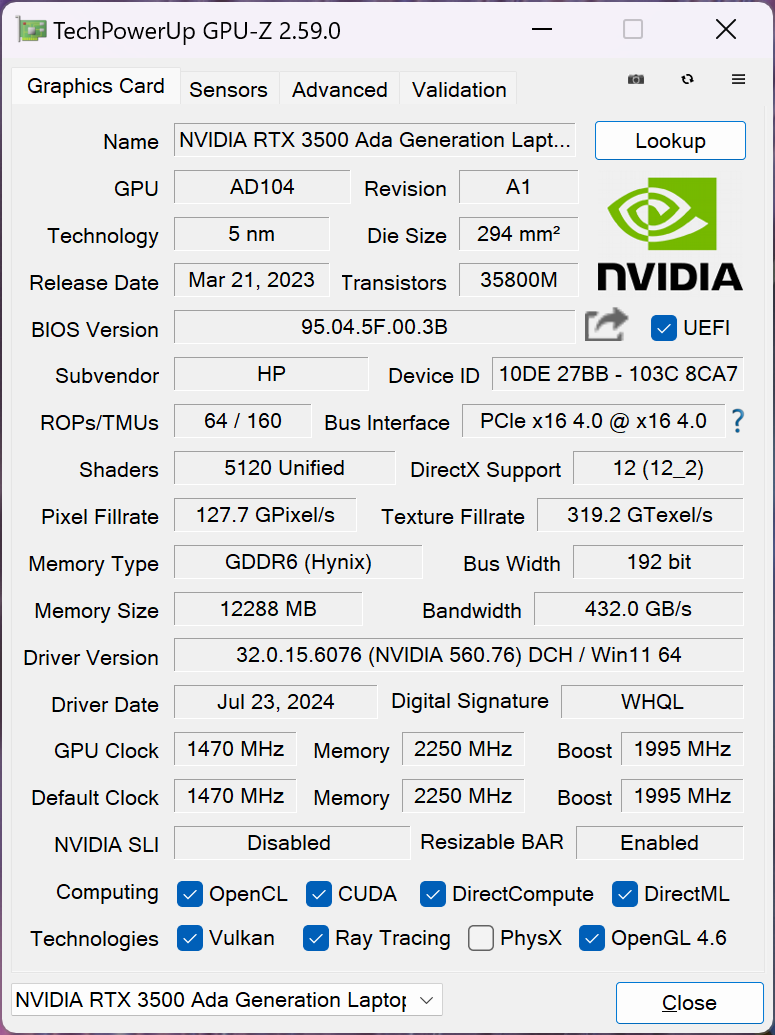
Kullanıcılar şunları bekleyebilir RTX 3500 Ada yaklaşık yüzde 20 ila 30 daha yavaş performans göstermesi RTX 5000 Ada. Nvidia henüz yeni nesil mobil GPU'ları tanıtmadığından, ZBook Fury 16 G11, kayda değer bir performans artışı olmadan geçen yılki modelle aynı GPU seçenekleriyle birlikte geliyor. RTA 5000 Ada, mevcut en hızlı mobil iş istasyonu GPU'su olmaya devam ediyor.
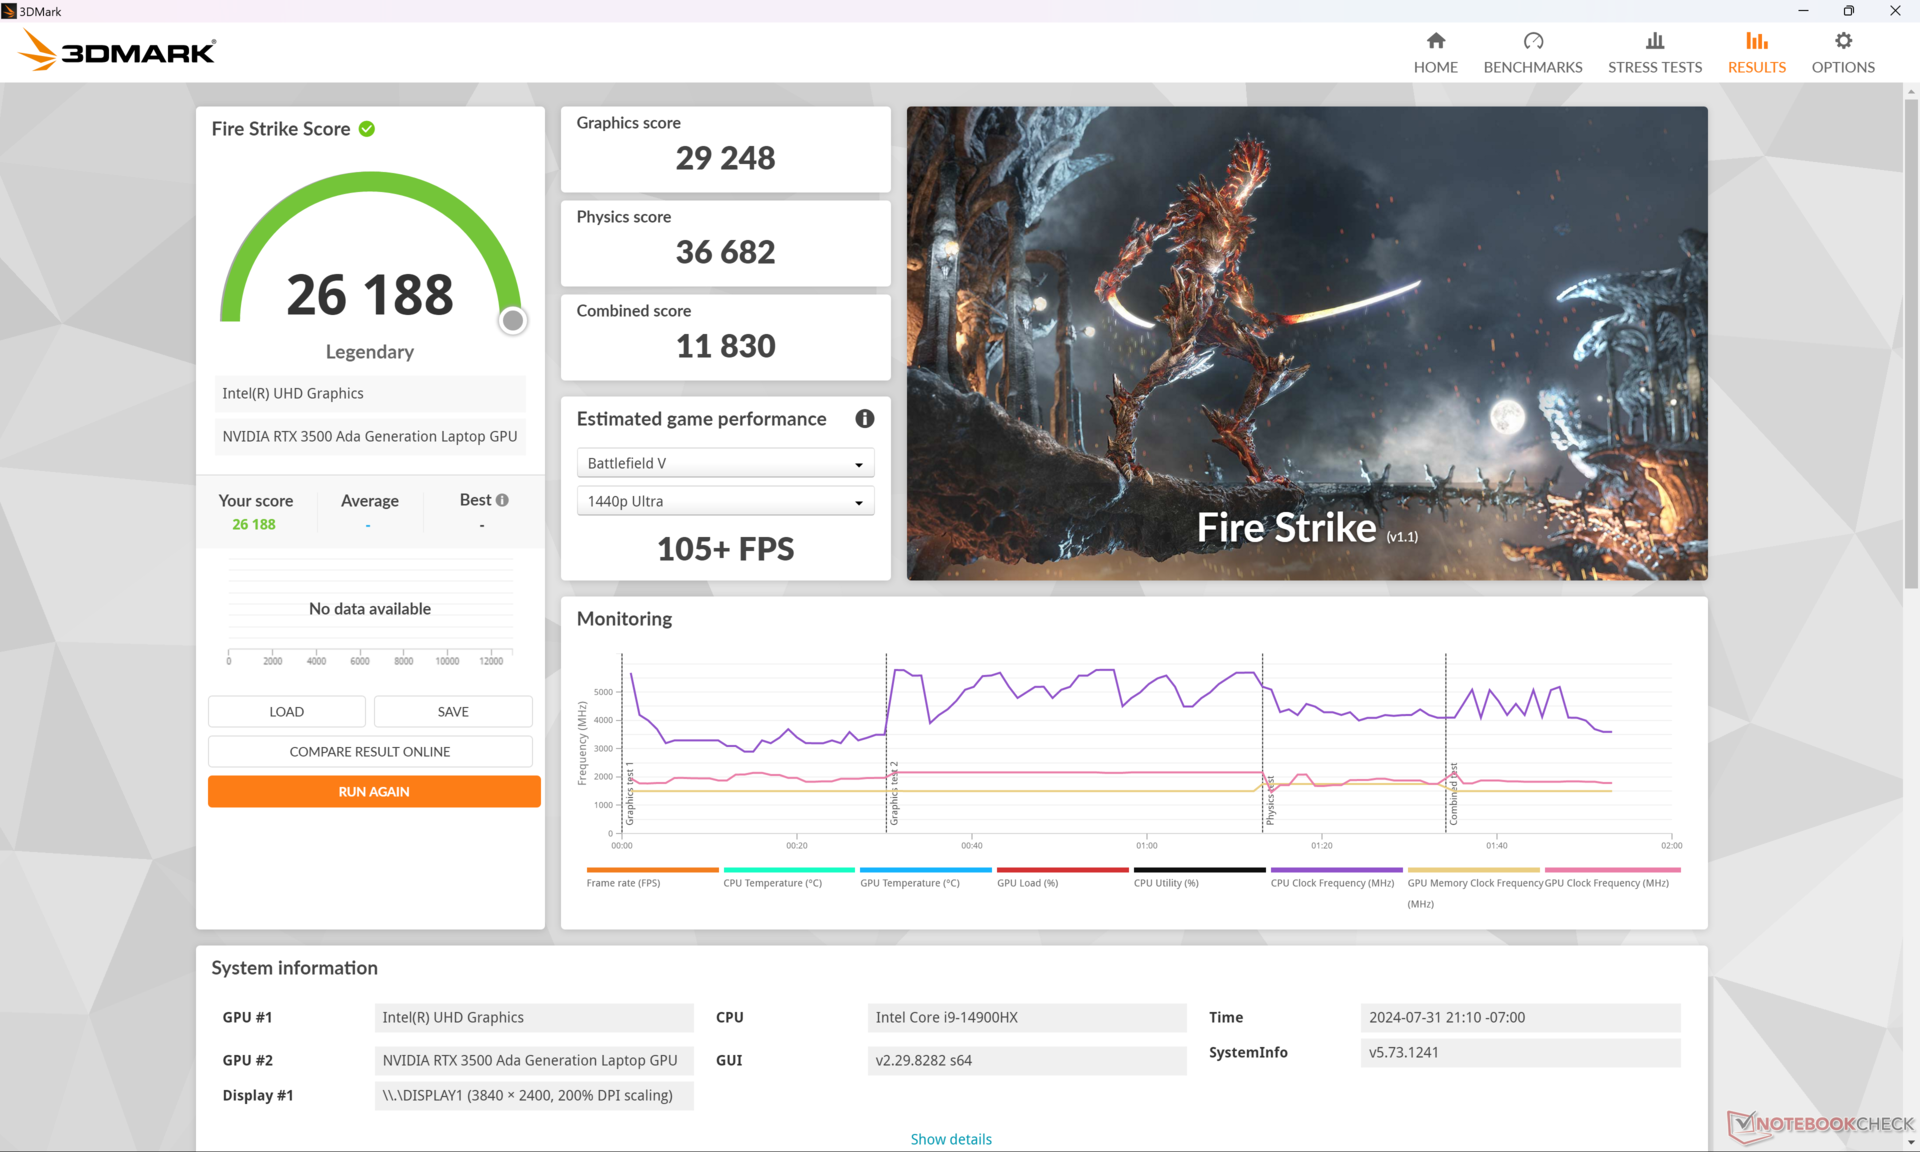
| Güç Profili | Grafik Puanı | Fizik Puanı | Birleşik Puan |
| Performans Modu | 29248 | 36682 | 11830 |
| Dengeli Mod | 28214 (-4%) | 33094 (-10%) | 10246 (-13%) |
| Akü Gücü | 16618 (-43%) | 25118 (-32%) | 4101 (-65%) |
Performans modu yerine Dengeli modda çalıştırmak, yukarıdaki Fire Strike tablomuzda gösterildiği gibi performansı yüzde 10 ila 15 oranında etkileyecektir. Performans açığı, çoğu yüksek performanslı dizüstü bilgisayardan bekleneceği üzere pil gücüyle çalıştığında daha da büyür.
| 3DMark Performance Rating - Percent | |
| HP ZBook Fury 16 G10 -2! | |
| Dell Precision 5690 -2! | |
| Dell Precision 5000 5680 -2! | |
| HP ZBook Fury 16 G11 | |
| Ortalama NVIDIA RTX 3500 Ada Generation Laptop GPU | |
| Lenovo ThinkPad P1 G6 21FV001KUS -2! | |
| Lenovo ThinkPad P1 G6-21FV000DGE -17! | |
| HP ZBook Fury 16 G9 -2! | |
| Lenovo ThinkPad P16 G2 21FA000FGE -17! | |
| MSI CreatorPro Z16P B12UKST -17! | |
| Asus ProArt Studiobook 16 OLED H7604 -17! | |
| Asus ExpertBook B6 Flip B6602FC2 -17! | |
| Lenovo ThinkPad P1 G4-20Y4S0KS00 -10! | |
| Lenovo ThinkPad P16v G1 AMD -17! | |
| 3DMark 11 Performance | 34779 puan | |
| 3DMark Fire Strike Score | 26188 puan | |
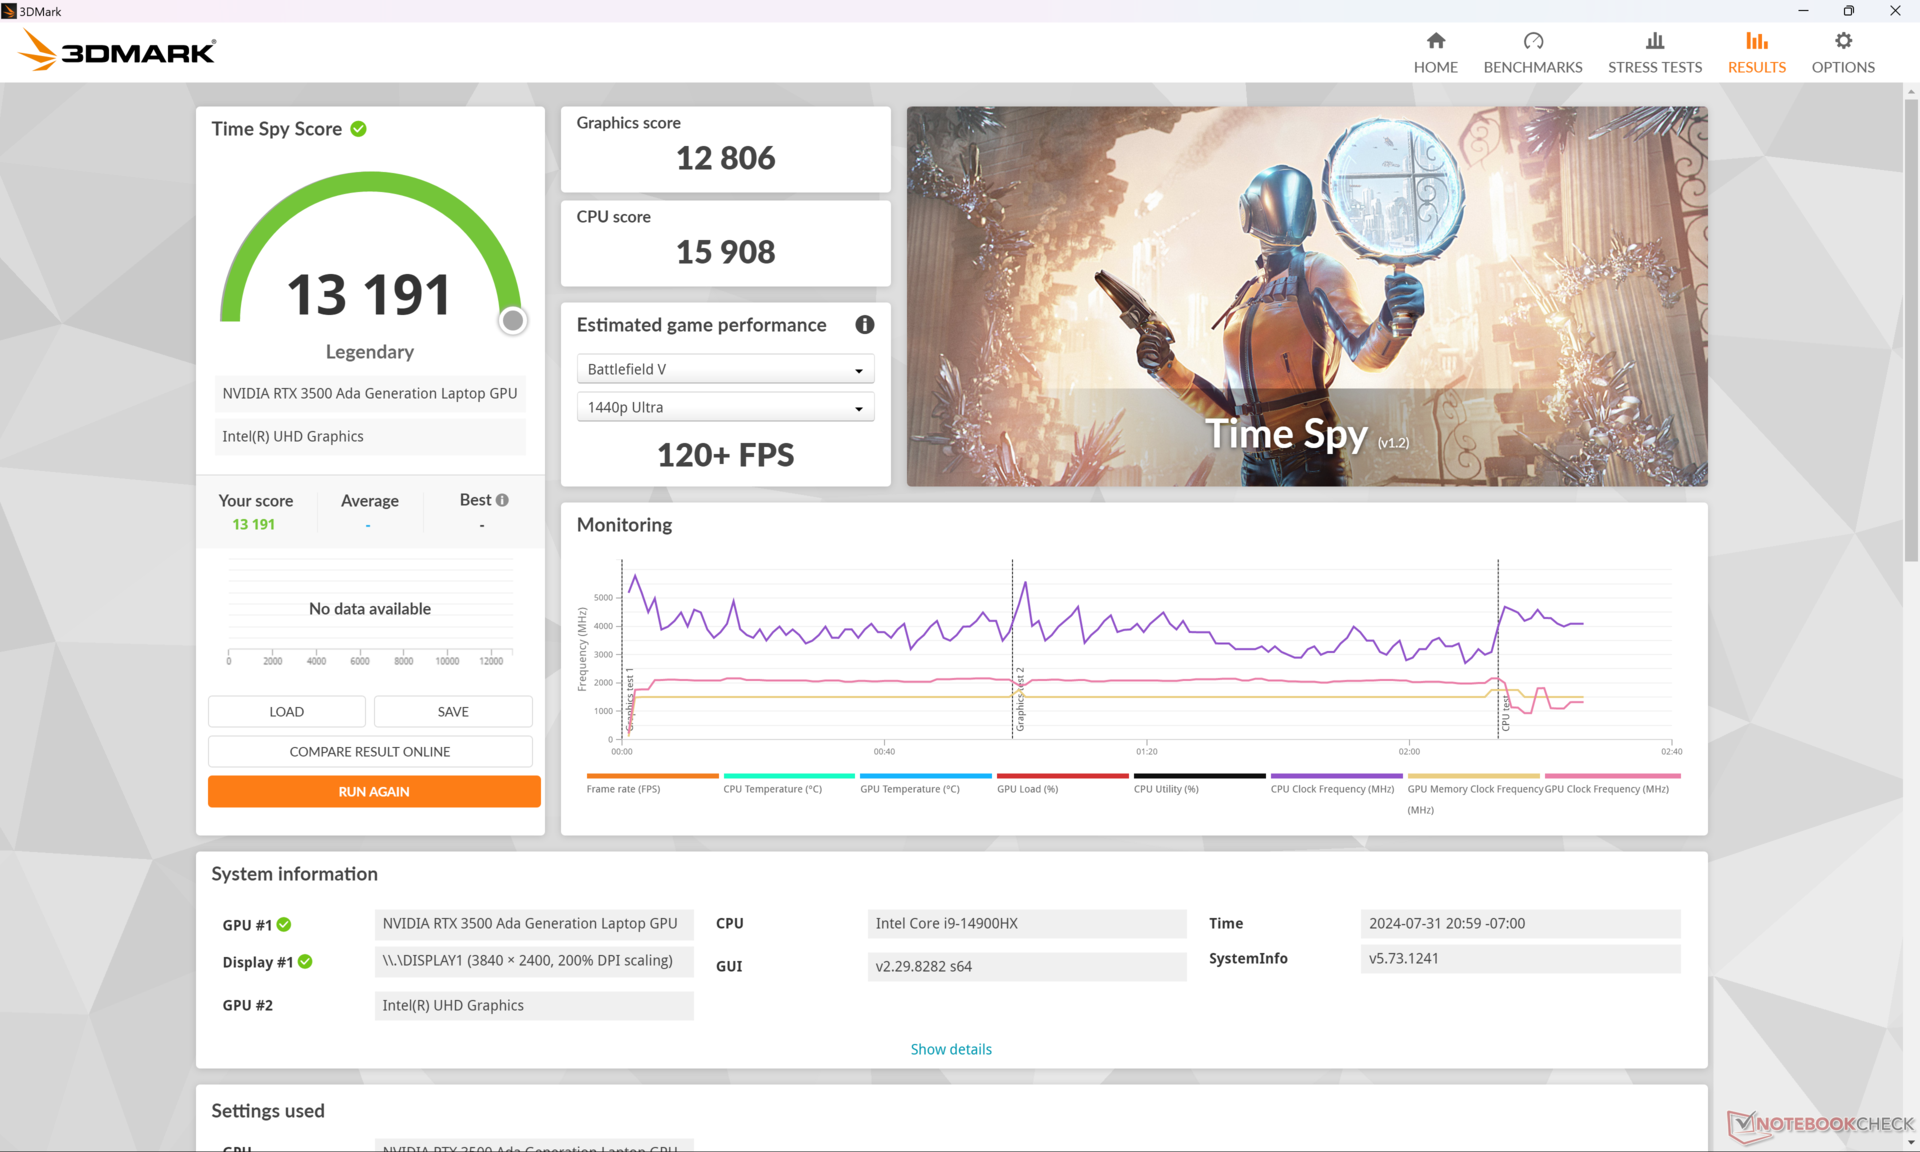
| 3DMark Time Spy Score | 13191 puan | |
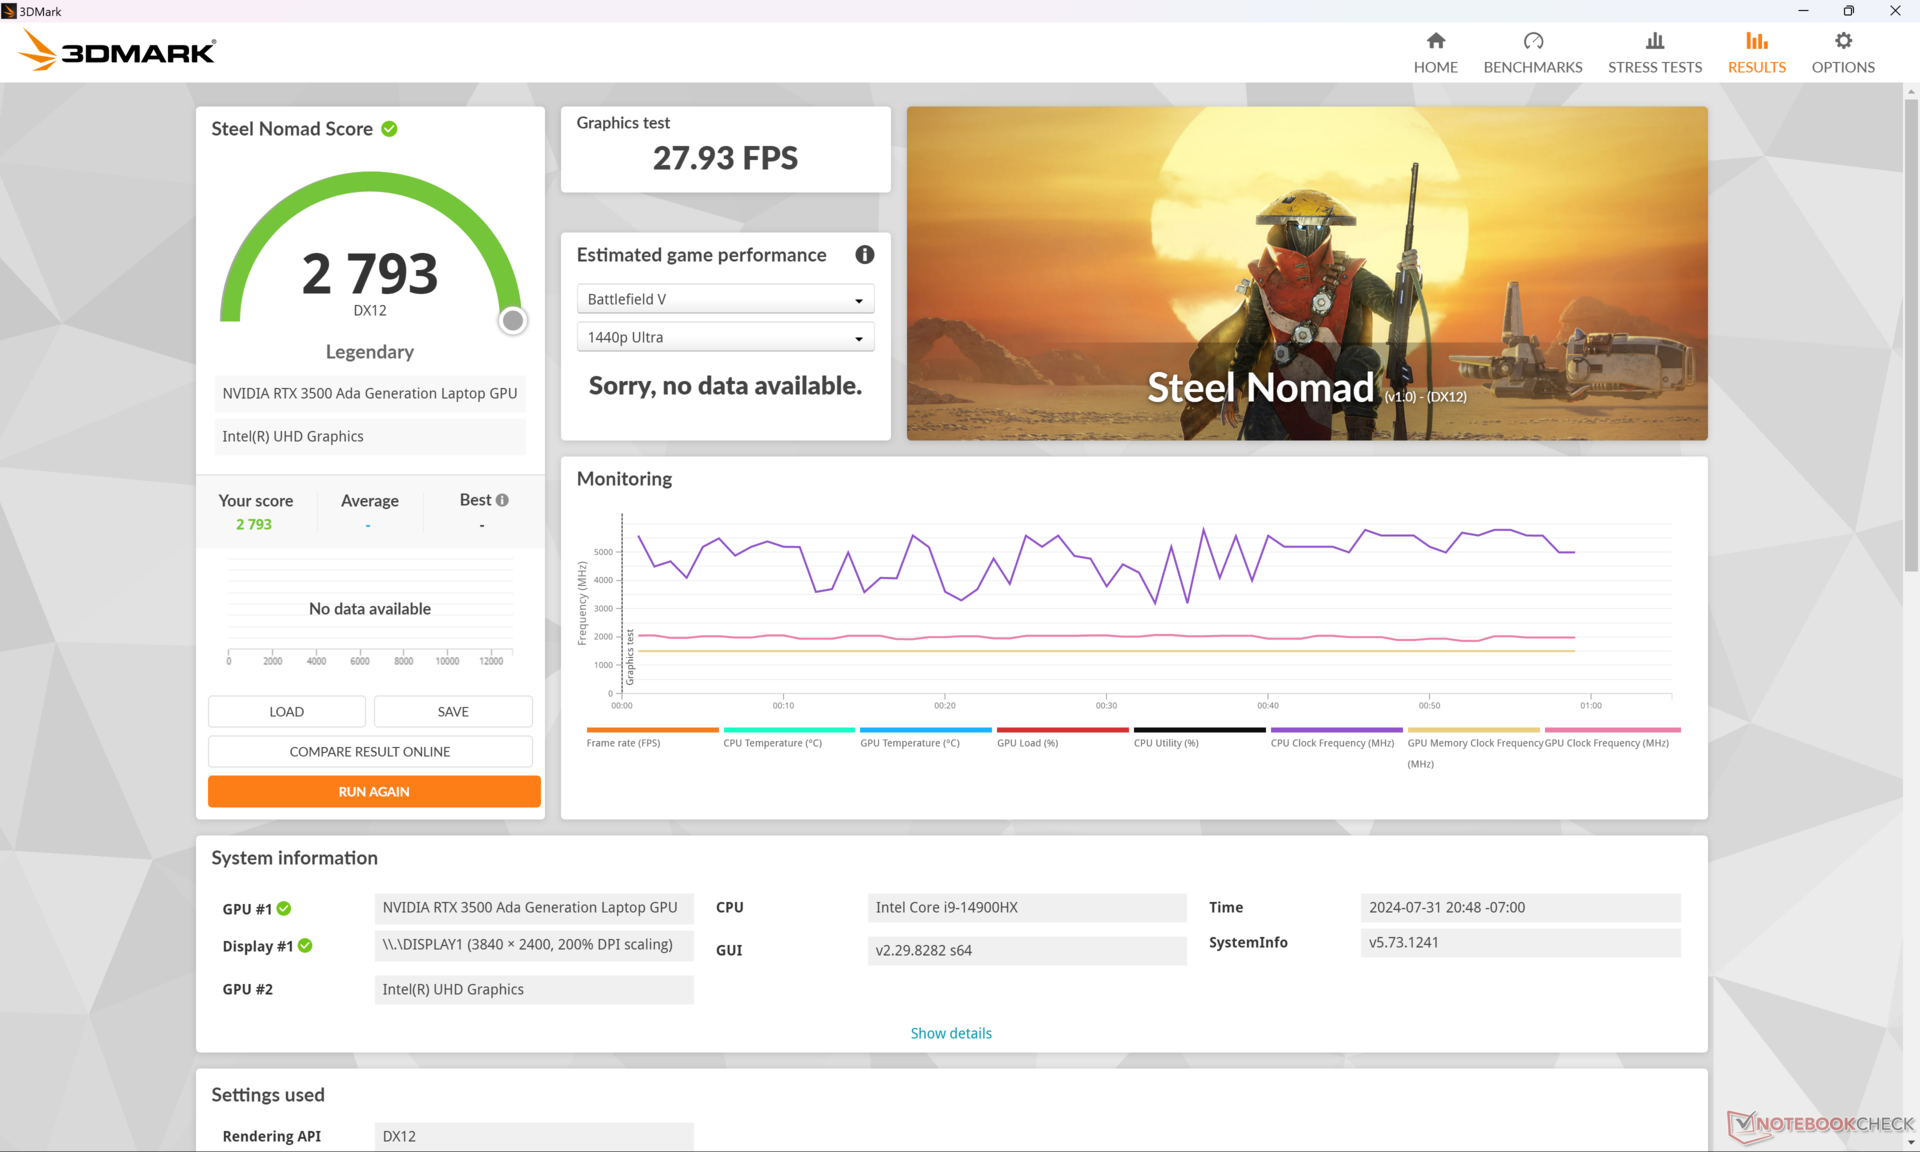
| 3DMark Steel Nomad Score | 2793 puan | |
Yardım | ||
* ... daha küçük daha iyidir
Oyun Performansı
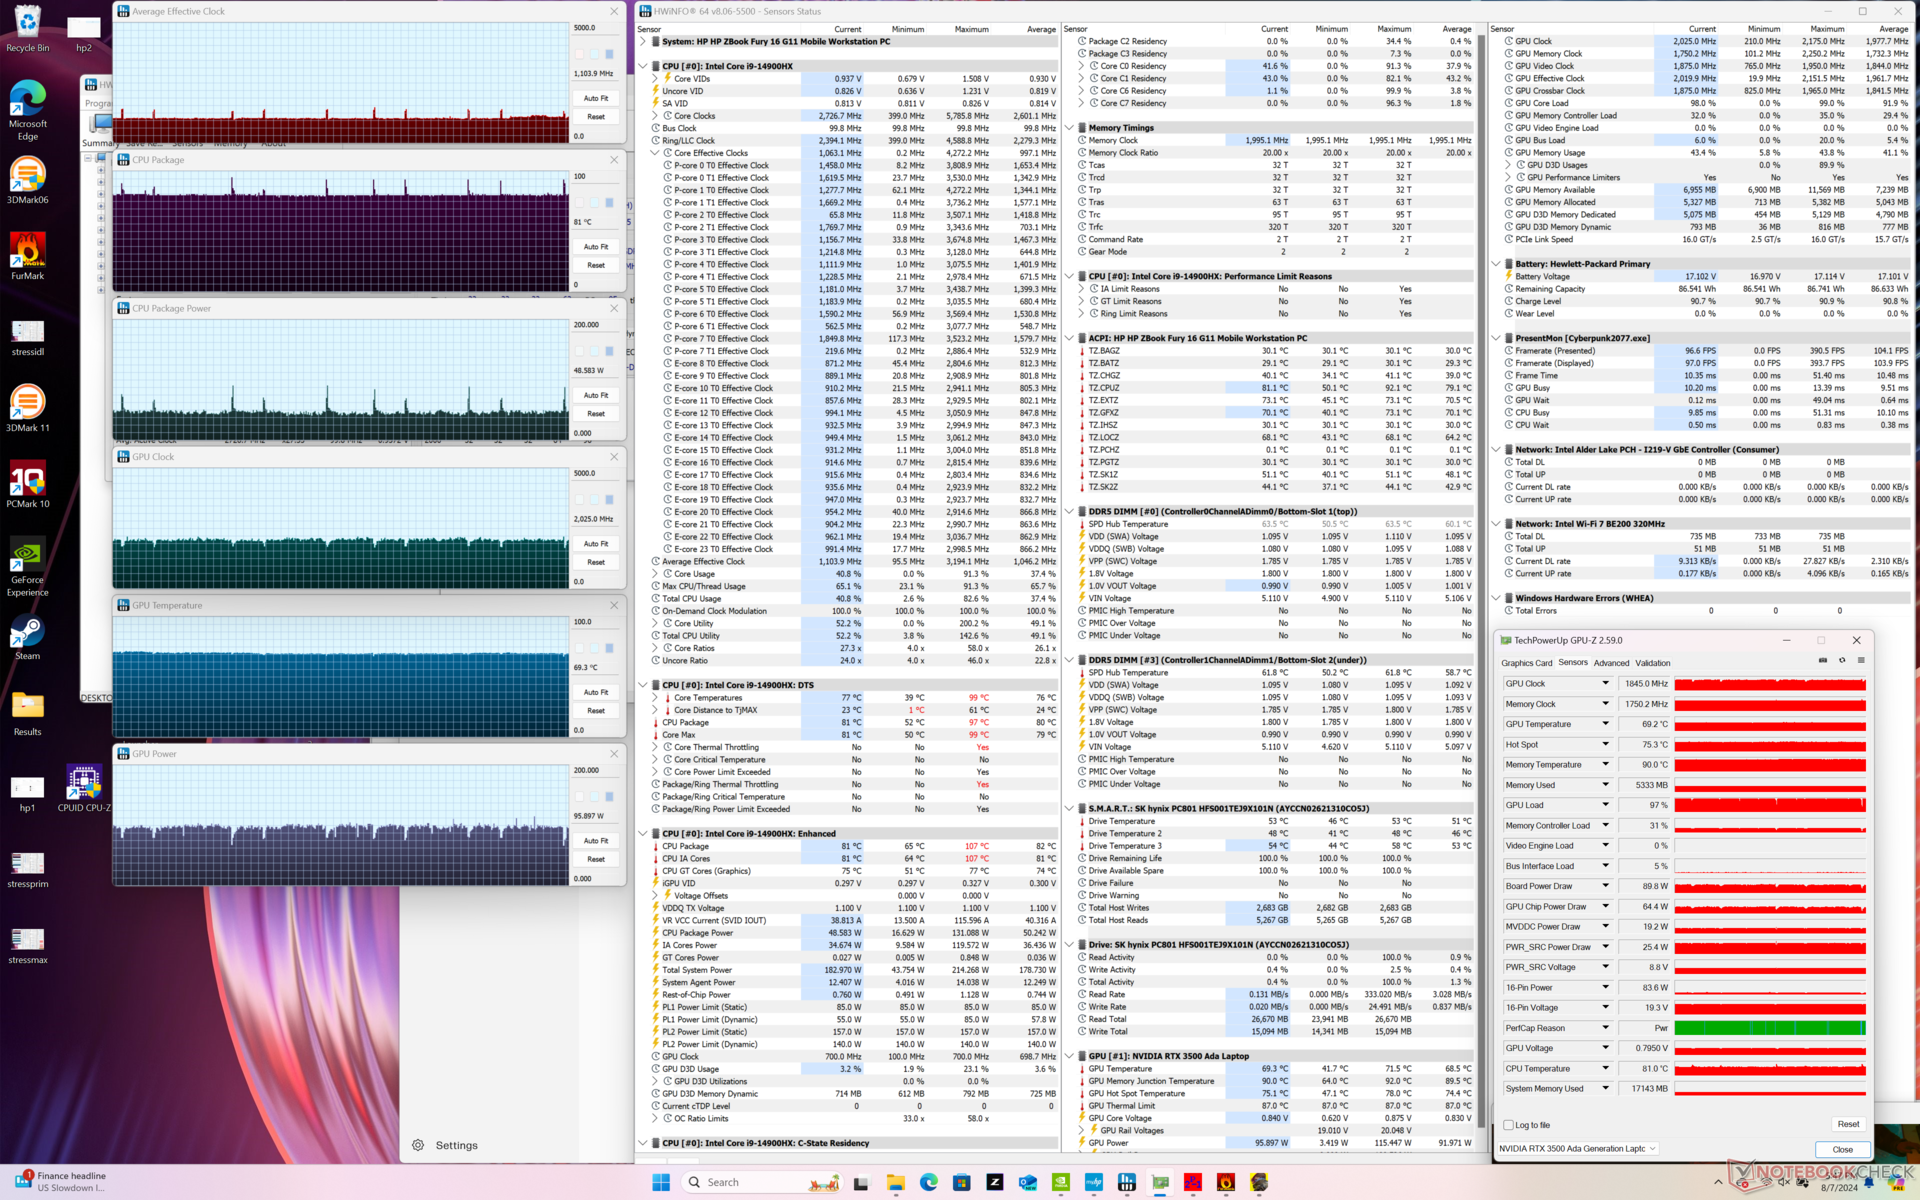
Oyun oynamak için tasarlanmamış olsa da, RTX 3500 Ada biraz daha yüksek performans gösterir mobil GeForce RTX 4070 ancak özellikle birleşik işlem hattı sayısı, tensör çekirdekleri ve bellek bant genişliği göz önüne alındığında mobil RTX 4080'in altında kalıyor. Bununla birlikte, GPU artırma hızları belirsiz olmadığından, stres altında performans zaman içinde kademeli olarak yavaşlayabilir. Örneğin Cyberpunk 2077 'de 1080p Ultra ayarlarda rölantide çalışırken, performans 70 FPS'nin biraz üzerinde başlar ve aşağıdaki grafikte gösterildiği gibi yalnızca 30 dakika sonra kademeli olarak düşük 60 FPS aralığına düşer.
| Performance Rating - Percent | |
| HP ZBook Fury 16 G10 -2! | |
| Lenovo ThinkPad P1 G6 21FV001KUS -1! | |
| HP ZBook Fury 16 G11 | |
| Asus ProArt Studiobook 16 OLED H7604 -1! | |
| Dell Precision 5690 -1! | |
| HP ZBook Fury 16 G9 -1! | |
| Lenovo ThinkPad P16 G2 21FA000FGE -1! | |
| GTA V - 1920x1080 Highest Settings possible AA:4xMSAA + FX AF:16x | |
| Asus ProArt Studiobook 16 OLED H7604 | |
| Lenovo ThinkPad P1 G6 21FV001KUS | |
| HP ZBook Fury 16 G9 | |
| HP ZBook Fury 16 G11 | |
| Lenovo ThinkPad P16 G2 21FA000FGE | |
| Final Fantasy XV Benchmark - 1920x1080 High Quality | |
| HP ZBook Fury 16 G10 | |
| Lenovo ThinkPad P1 G6 21FV001KUS | |
| Dell Precision 5690 | |
| HP ZBook Fury 16 G11 | |
| Asus ProArt Studiobook 16 OLED H7604 | |
| HP ZBook Fury 16 G9 | |
| Lenovo ThinkPad P16 G2 21FA000FGE | |
| Strange Brigade - 1920x1080 ultra AA:ultra AF:16 | |
| HP ZBook Fury 16 G10 | |
| Dell Precision 5690 | |
| HP ZBook Fury 16 G11 | |
| HP ZBook Fury 16 G9 | |
| Lenovo ThinkPad P16 G2 21FA000FGE | |
| Asus ProArt Studiobook 16 OLED H7604 | |
| Dota 2 Reborn - 1920x1080 ultra (3/3) best looking | |
| Asus ProArt Studiobook 16 OLED H7604 | |
| HP ZBook Fury 16 G10 | |
| HP ZBook Fury 16 G11 | |
| HP ZBook Fury 16 G9 | |
| Lenovo ThinkPad P16 G2 21FA000FGE | |
| Lenovo ThinkPad P1 G6 21FV001KUS | |
| Dell Precision 5690 | |
| X-Plane 11.11 - 1920x1080 high (fps_test=3) | |
| Asus ProArt Studiobook 16 OLED H7604 | |
| HP ZBook Fury 16 G10 | |
| Lenovo ThinkPad P1 G6 21FV001KUS | |
| HP ZBook Fury 16 G11 | |
| HP ZBook Fury 16 G9 | |
| Lenovo ThinkPad P16 G2 21FA000FGE | |
| Dell Precision 5690 | |
| Cyberpunk 2077 2.2 Phantom Liberty - 1920x1080 Ultra Preset (FSR off) | |
| Dell Precision 5690 | |
| Lenovo ThinkPad P1 G6 21FV001KUS | |
| HP ZBook Fury 16 G11 | |
| Strange Brigade | |
| 1920x1080 ultra AA:ultra AF:16 | |
| HP ZBook Fury 16 G10 | |
| Dell Precision 5690 | |
| HP ZBook Fury 16 G11 | |
| Ortalama NVIDIA RTX 3500 Ada Generation Laptop GPU (n=1) | |
| HP ZBook Fury 16 G9 | |
| Lenovo ThinkPad P16 G2 21FA000FGE | |
| Lenovo ThinkPad P1 G6-21FV000DGE | |
| Lenovo ThinkPad P1 G4-20Y4S0KS00 | |
| Asus ProArt Studiobook 16 OLED H7604 | |
| Asus ExpertBook B6 Flip B6602FC2 | |
| MSI CreatorPro Z16P B12UKST | |
| Lenovo ThinkPad P16v G1 AMD | |
| 2560x1440 ultra AA:ultra AF:16 | |
| HP ZBook Fury 16 G10 | |
| Dell Precision 5690 | |
| HP ZBook Fury 16 G11 | |
| Ortalama NVIDIA RTX 3500 Ada Generation Laptop GPU (n=1) | |
| HP ZBook Fury 16 G9 | |
| Lenovo ThinkPad P1 G4-20Y4S0KS00 | |
| Lenovo ThinkPad P1 G6-21FV000DGE | |
| Lenovo ThinkPad P16 G2 21FA000FGE | |
| Asus ProArt Studiobook 16 OLED H7604 | |
| MSI CreatorPro Z16P B12UKST | |
| 3840x2160 ultra AA:ultra AF:16 | |
| Dell Precision 5690 | |
| HP ZBook Fury 16 G10 | |
| HP ZBook Fury 16 G11 | |
| Ortalama NVIDIA RTX 3500 Ada Generation Laptop GPU (n=1) | |
| HP ZBook Fury 16 G9 | |
| Lenovo ThinkPad P1 G4-20Y4S0KS00 | |
| Tiny Tina's Wonderlands | |
| 1920x1080 High Preset (DX12) | |
| HP ZBook Fury 16 G10 | |
| Dell Precision 5000 5680 | |
| Dell Precision 5690 | |
| HP ZBook Fury 16 G11 | |
| Ortalama NVIDIA RTX 3500 Ada Generation Laptop GPU (n=1) | |
| HP ZBook Fury 16 G9 | |
| Asus ExpertBook B6 Flip B6602FC2 | |
| 1920x1080 Badass Preset (DX12) | |
| HP ZBook Fury 16 G10 | |
| Dell Precision 5000 5680 | |
| Dell Precision 5690 | |
| Lenovo ThinkPad P1 G6 21FV001KUS | |
| HP ZBook Fury 16 G11 | |
| Ortalama NVIDIA RTX 3500 Ada Generation Laptop GPU (n=1) | |
| HP ZBook Fury 16 G9 | |
| Asus ExpertBook B6 Flip B6602FC2 | |
| 2560x1440 Badass Preset (DX12) | |
| HP ZBook Fury 16 G10 | |
| Dell Precision 5000 5680 | |
| Dell Precision 5690 | |
| Lenovo ThinkPad P1 G6 21FV001KUS | |
| HP ZBook Fury 16 G11 | |
| Ortalama NVIDIA RTX 3500 Ada Generation Laptop GPU (n=1) | |
| HP ZBook Fury 16 G9 | |
| Asus ExpertBook B6 Flip B6602FC2 | |
| 3840x2160 Badass Preset (DX12) | |
| HP ZBook Fury 16 G10 | |
| Dell Precision 5000 5680 | |
| Dell Precision 5690 | |
| Lenovo ThinkPad P1 G6 21FV001KUS | |
| HP ZBook Fury 16 G11 | |
| Ortalama NVIDIA RTX 3500 Ada Generation Laptop GPU (n=1) | |
| HP ZBook Fury 16 G9 | |
Cyberpunk 2077 ultra FPS Chart
| düşük | orta | yüksek | ultra | QHD | 4K | |
|---|---|---|---|---|---|---|
| GTA V (2015) | 184.3 | 181 | 170.1 | 115.5 | 97.5 | 59.6 |
| Dota 2 Reborn (2015) | 201 | 177.7 | 162.1 | 153.9 | 134.4 | |
| Final Fantasy XV Benchmark (2018) | 200 | 167.6 | 128.9 | 97.5 | 54.2 | |
| X-Plane 11.11 (2018) | 144.6 | 137.8 | 110.9 | 92.7 | ||
| Far Cry 5 (2018) | 133 | 135 | 127 | 109 | 62 | |
| Strange Brigade (2018) | 411 | 296 | 235 | 223 | 159.2 | 78.6 |
| Tiny Tina's Wonderlands (2022) | 232.5 | 195.4 | 137.9 | 109.3 | 74.4 | 41.6 |
| F1 22 (2022) | 228 | 223 | 182.8 | 72.9 | 48.3 | 24 |
| Baldur's Gate 3 (2023) | 164.8 | 136.2 | 118.6 | 117.3 | 80.2 | 41.2 |
| Cyberpunk 2077 2.2 Phantom Liberty (2023) | 121.2 | 113.1 | 101.8 | 90.3 | 60.2 | 21.3 |
Emisyonlar
Sistem Gürültüsü
Fan gürültüsü ve davranışı, daha yüksek yüklerde çalışırken biraz daha yüksek olmasa da geçen yılki modelde kaydettiklerimizle hemen hemen aynı. Masaüstünde rölantide çalışırken de, hiçbir uygulama çalıştırılmadan Dengeli moda ayarlandığında bile fanlar ara sıra titreşiyordu. Daha da kötüsü, bizim ünitemizde tüm test süresi boyunca devam eden belirgin bir bobin sızıntısı vardı.
Ses yüksekliği
| Boşta |
| 23.2 / 23.2 / 29.5 dB |
| Çalışırken |
| 43 / 48.2 dB |
 | ||
30 dB sessiz 40 dB(A) duyulabilirlik 50 dB(A) gürültülü |
||
min: | ||
| HP ZBook Fury 16 G11 NVIDIA RTX 3500 Ada Generation Laptop GPU, i9-14900HX, SK hynix PC801 HFS001TEJ9X101N | HP ZBook Fury 16 G10 NVIDIA RTX 5000 Ada Generation Laptop GPU, i9-13950HX, SK hynix PC801 HFS001TEJ9X101N | HP ZBook Fury 16 G9 RTX A5500 Laptop GPU, i9-12950HX, Micron 3400 1TB MTFDKBA1T0TFH | Dell Precision 5690 NVIDIA RTX 5000 Ada Generation Laptop GPU, Ultra 9 185H, 2x Samsung PM9A1 1TB (RAID 0) | Lenovo ThinkPad P16 G2 21FA000FGE NVIDIA RTX 2000 Ada Generation Laptop GPU, i7-13700HX, SK hynix PC801 HFS001TEJ9X162N | Lenovo ThinkPad P1 G6 21FV001KUS NVIDIA GeForce RTX 4080 Laptop GPU, i7-13800H, Kioxia XG8 KXG8AZNV1T02 | Asus ProArt Studiobook 16 OLED H7604 NVIDIA GeForce RTX 4070 Laptop GPU, i9-13980HX, Phison EM2804TBMTCB47 | |
|---|---|---|---|---|---|---|---|
| Noise | 3% | 4% | -3% | -4% | 9% | -5% | |
| kapalı / ortam * | 23.2 | 22.9 1% | 22.6 3% | 23.4 -1% | 23.5 -1% | 22.5 3% | 24.5 -6% |
| Idle Minimum * | 23.2 | 22.9 1% | 22.7 2% | 23.6 -2% | 23.5 -1% | 22.5 3% | 24.5 -6% |
| Idle Average * | 23.2 | 22.9 1% | 22.7 2% | 24.9 -7% | 29.2 -26% | 22.5 3% | 24.5 -6% |
| Idle Maximum * | 29.5 | 28.5 3% | 28.8 2% | 30.9 -5% | 29.5 -0% | 22.5 24% | 24.5 17% |
| Load Average * | 43 | 40.6 6% | 36.2 16% | 40.4 6% | 32.7 24% | 28.7 33% | 47.6 -11% |
| Cyberpunk 2077 ultra * | 48.2 | ||||||
| Load Maximum * | 48.2 | 45.8 5% | 49.3 -2% | 51.9 -8% | 56.6 -17% | 54.4 -13% | 56.7 -18% |
| Witcher 3 ultra * | 44.1 | 49.5 | 48.3 | 50.6 | 47.5 | 55.9 |
* ... daha küçük daha iyidir
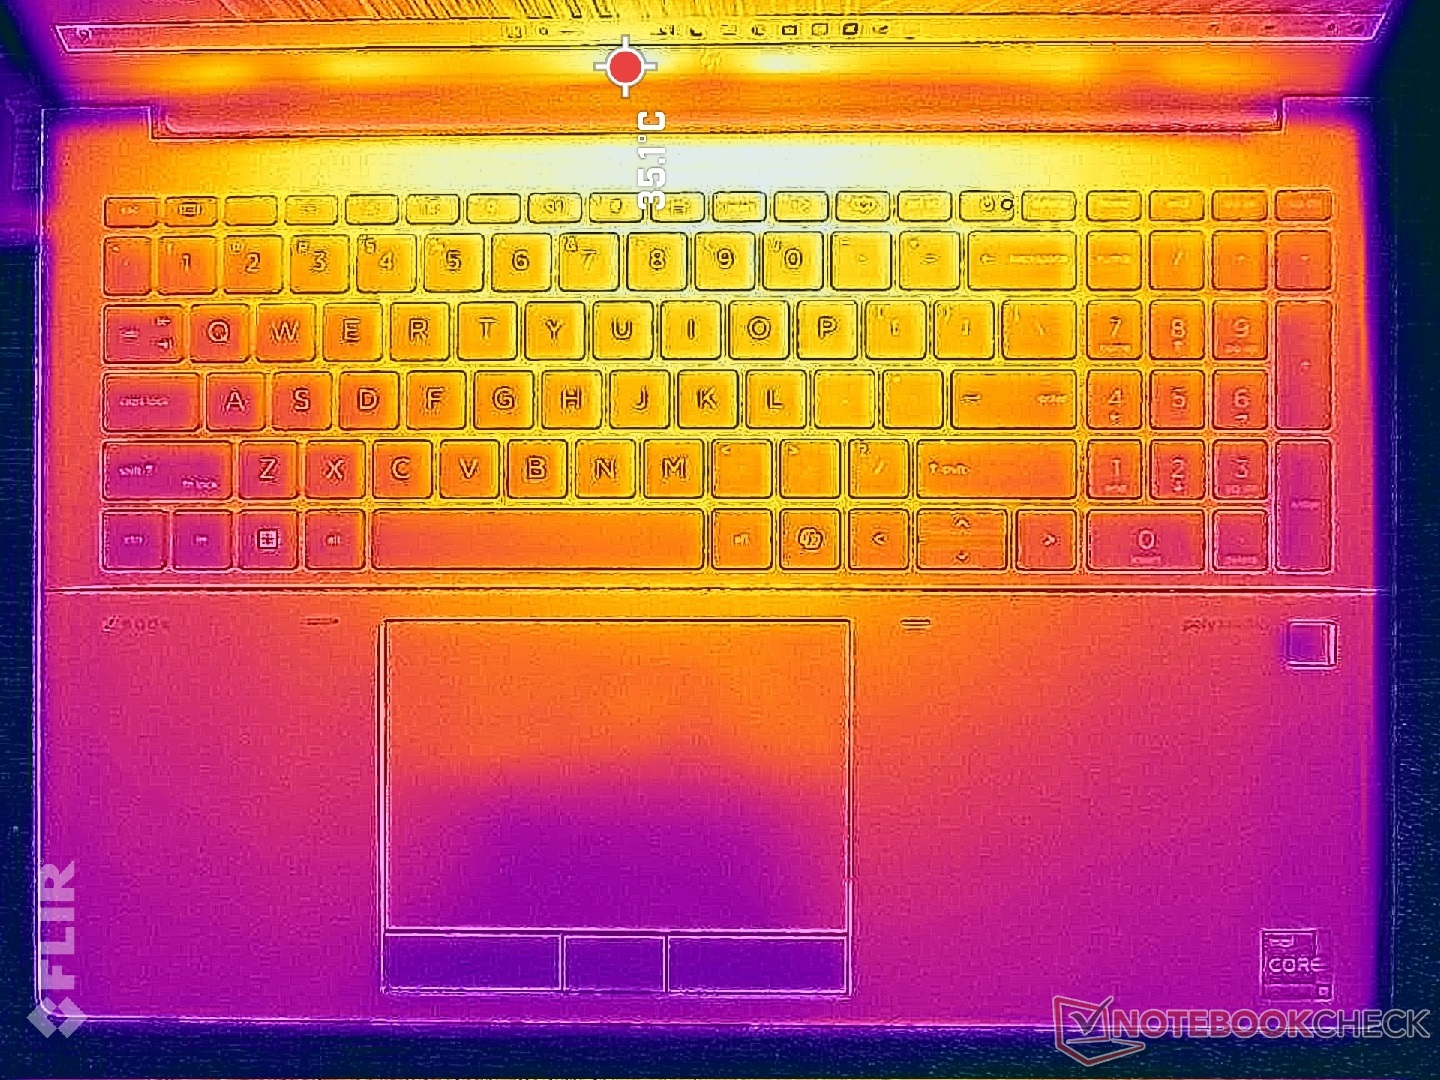
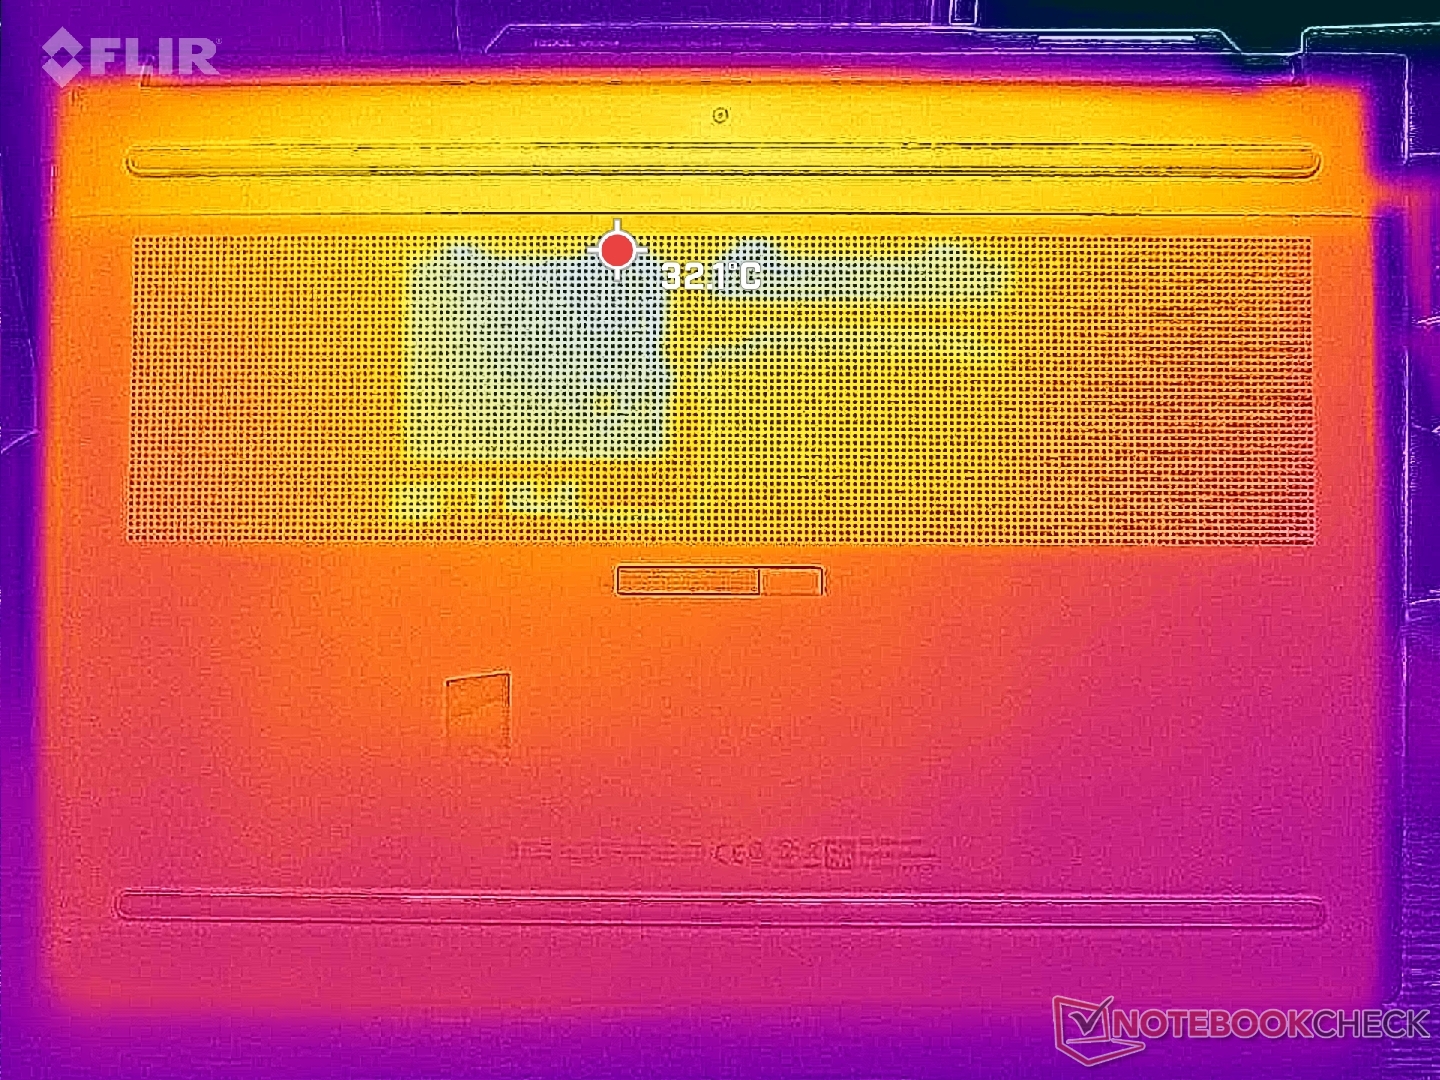
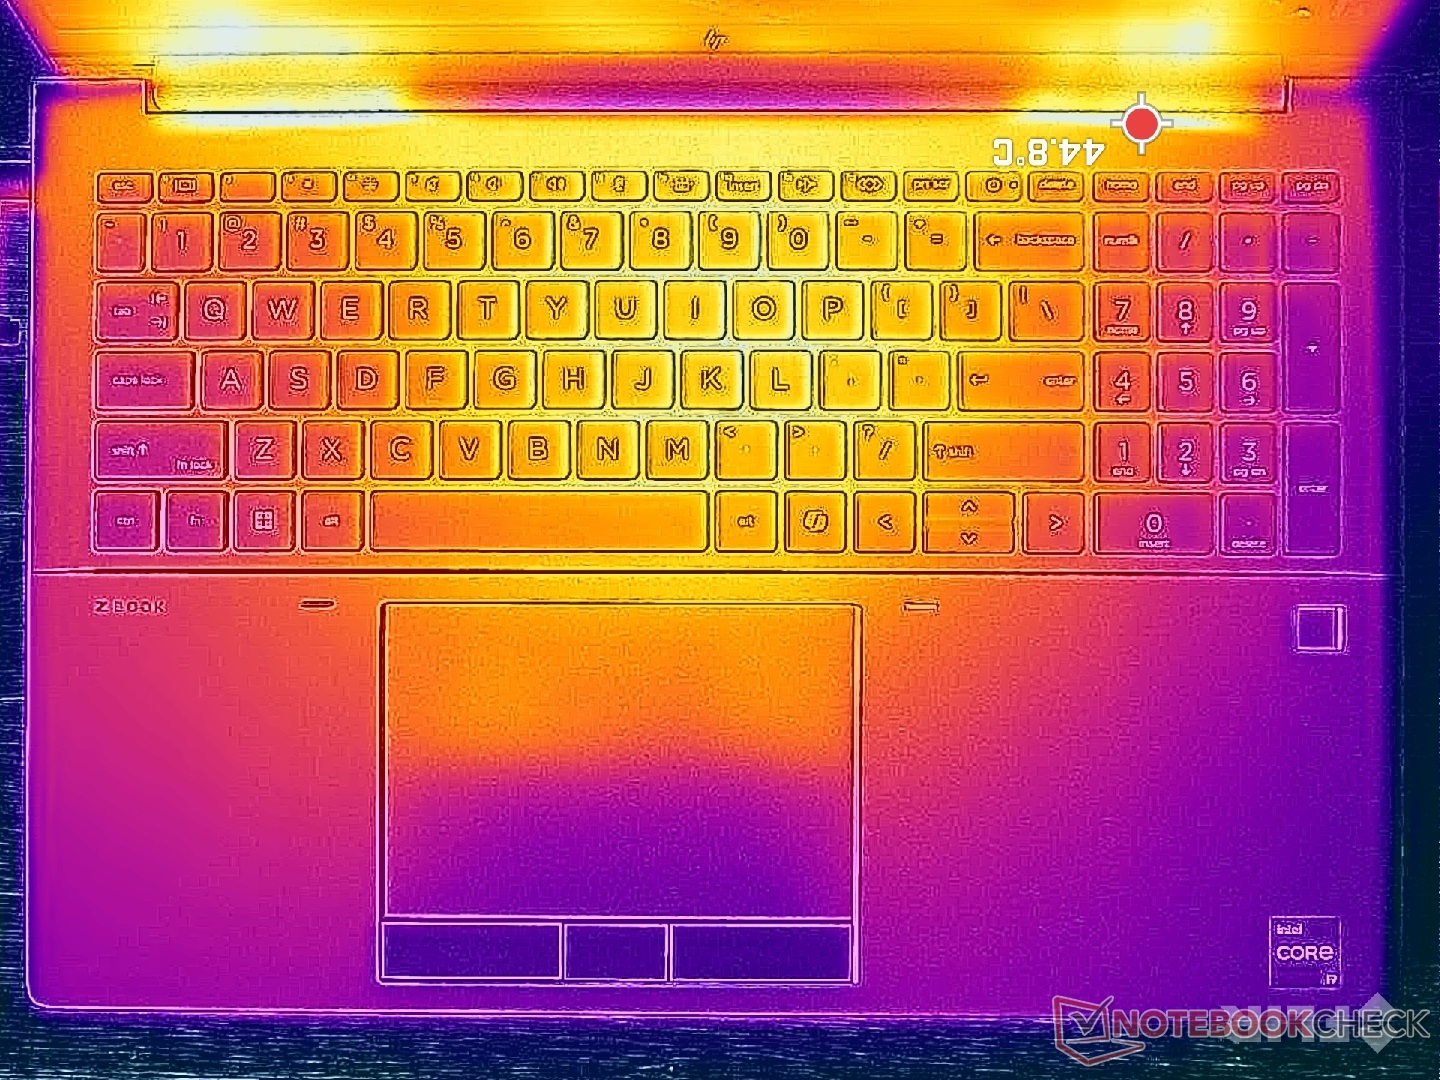
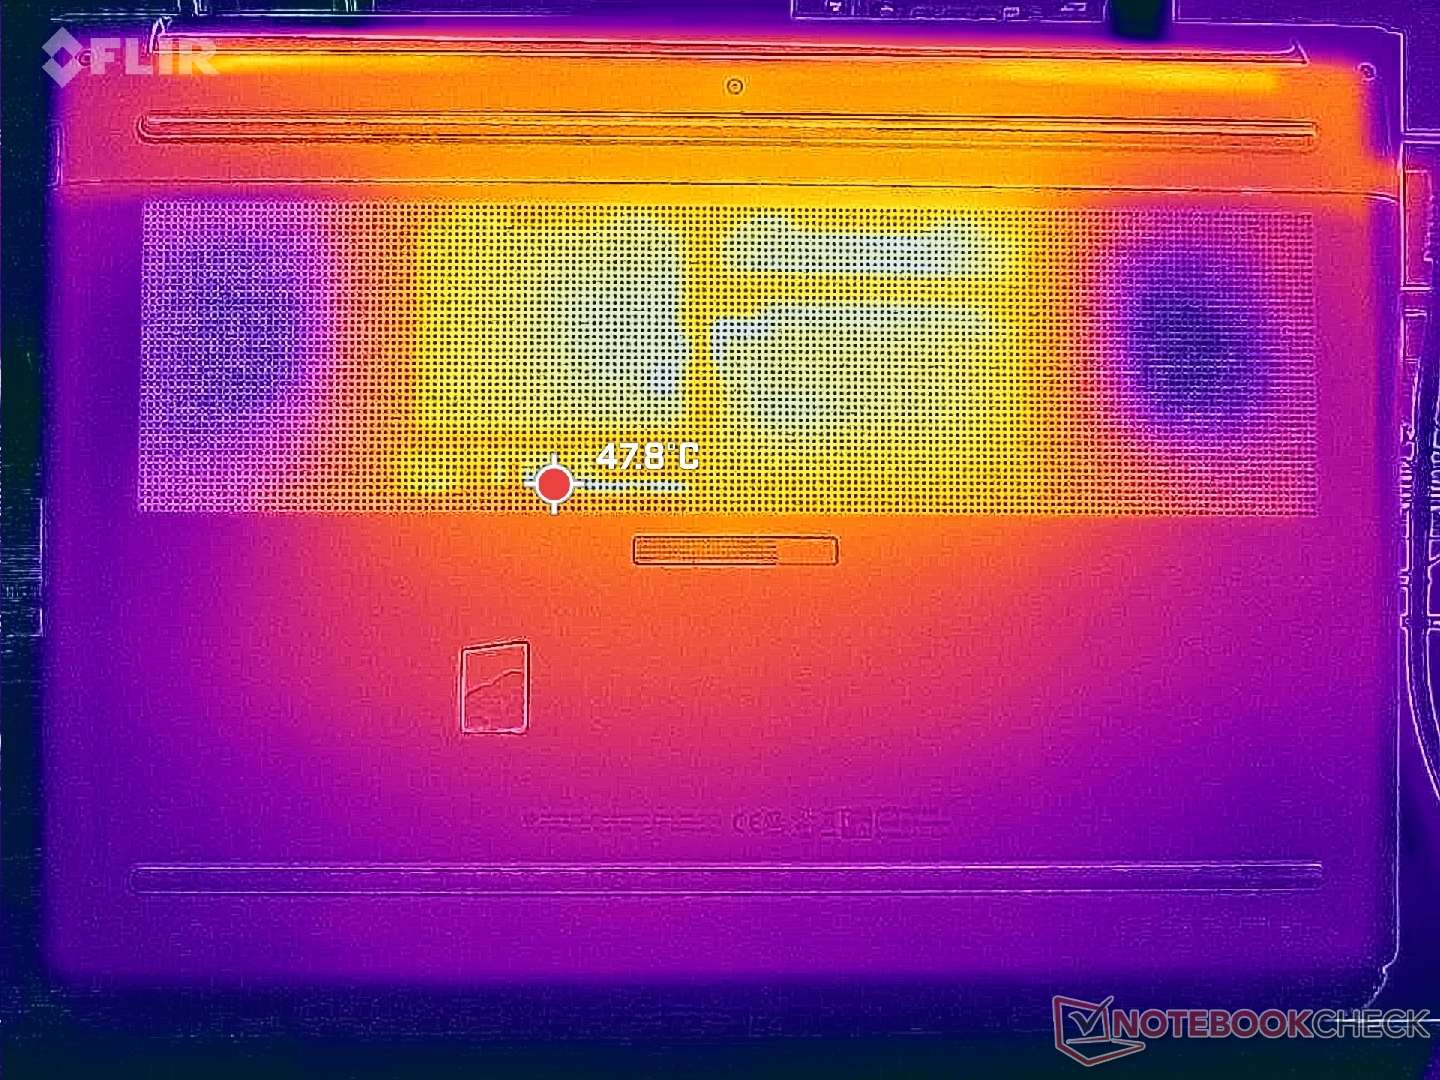
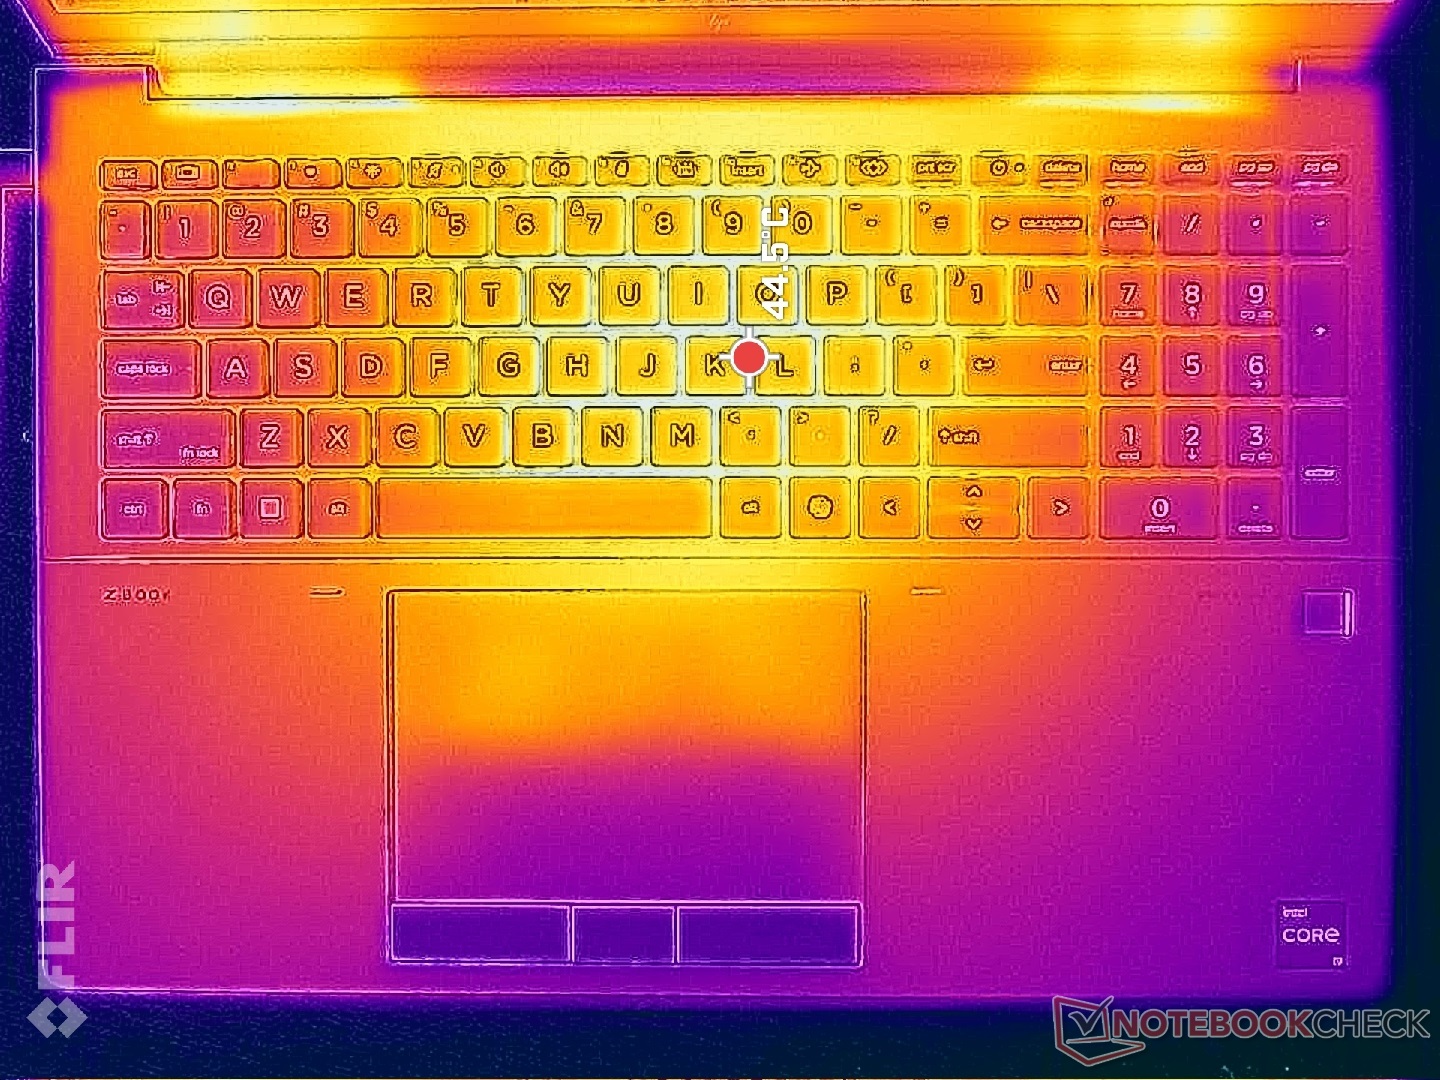
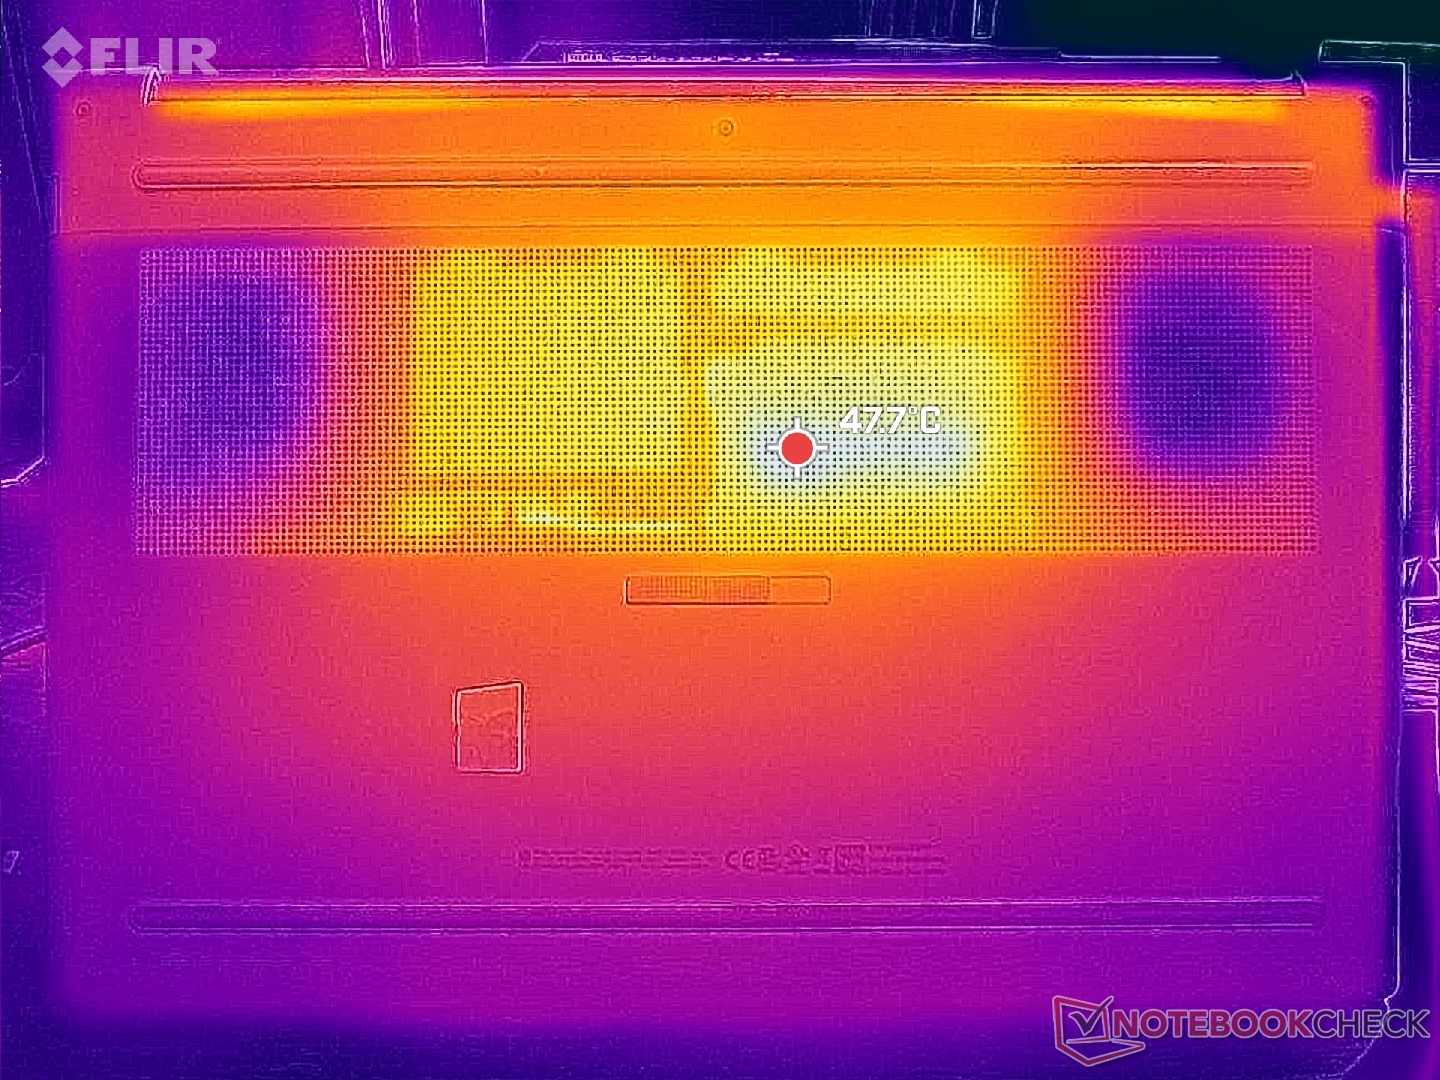
Sıcaklık
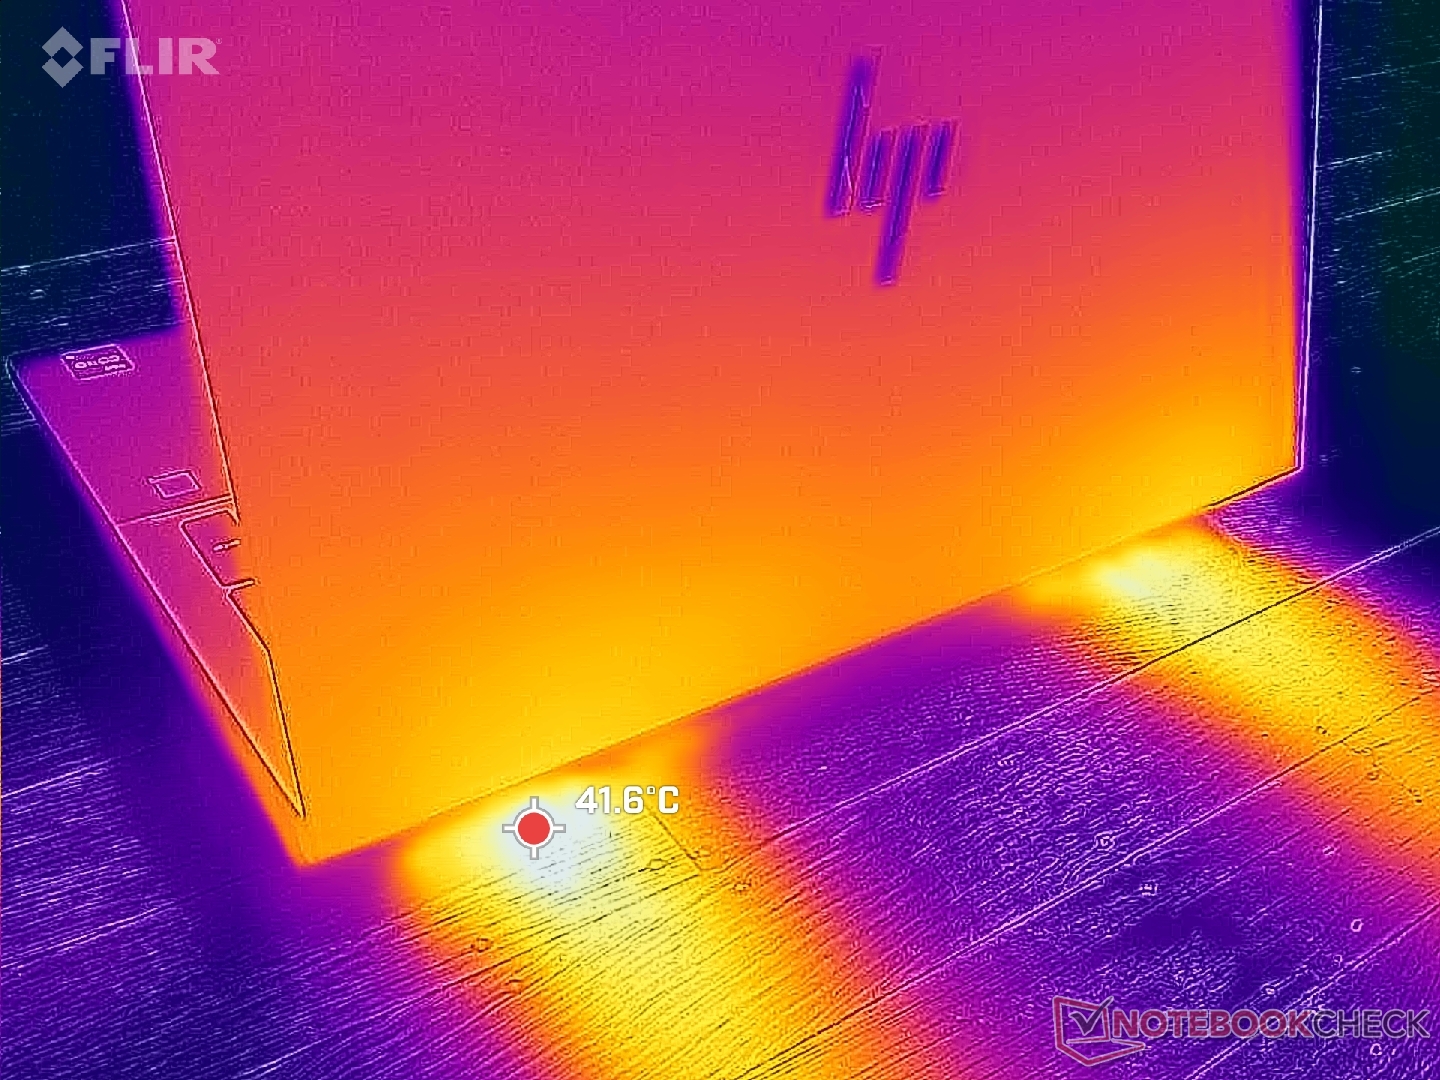
(±) Üst taraftaki maksimum sıcaklık, 38.2 °C / 101 F ortalamasına kıyasla 42.2 °C / 108 F'dir. , Workstation sınıfı için 22.2 ile 69.8 °C arasında değişir.
(-) Alt kısım, 41.2 °C / 106 F ortalamasına kıyasla maksimum 48 °C / 118 F'ye kadar ısınır
(±) Boşta kullanımda, üst tarafın ortalama sıcaklığı 33.8 °C / 93 F olup, cihazın 32 °C / 90 F.
(-) 3: The average temperature for the upper side is 38.5 °C / 101 F, compared to the average of 32 °C / 90 F for the class Workstation.
(±) Avuç içi dayanakları ve dokunmatik yüzey maksimum 37.6 °C / 99.7 F ile dokunulamayacak kadar ısınabilir.
(-) Benzer cihazların avuç içi dayanağı alanının ortalama sıcaklığı 27.8 °C / 82 F (-9.8 °C / -17.7 F) idi.
| HP ZBook Fury 16 G11 Intel Core i9-14900HX, NVIDIA RTX 3500 Ada Generation Laptop GPU | HP ZBook Fury 16 G10 Intel Core i9-13950HX, Nvidia RTX 5000 Ada Generation Laptop GPU | HP ZBook Fury 16 G9 Intel Core i9-12950HX, NVIDIA RTX A5500 Laptop GPU | Dell Precision 5690 Intel Core Ultra 9 185H, Nvidia RTX 5000 Ada Generation Laptop GPU | Lenovo ThinkPad P16 G2 21FA000FGE Intel Core i7-13700HX, NVIDIA RTX 2000 Ada Generation Laptop GPU | Lenovo ThinkPad P1 G6 21FV001KUS Intel Core i7-13800H, NVIDIA GeForce RTX 4080 Laptop GPU | Asus ProArt Studiobook 16 OLED H7604 Intel Core i9-13980HX, NVIDIA GeForce RTX 4070 Laptop GPU | |
|---|---|---|---|---|---|---|---|
| Heat | 3% | 10% | 13% | 15% | 4% | 3% | |
| Maximum Upper Side * | 42.2 | 44.8 -6% | 43.2 -2% | 46.6 -10% | 47.2 -12% | 42 -0% | 44.1 -5% |
| Maximum Bottom * | 48 | 50 -4% | 50.4 -5% | 33 31% | 39.5 18% | 45.2 6% | 48 -0% |
| Idle Upper Side * | 37 | 34.4 7% | 28.6 23% | 32.4 12% | 28.1 24% | 33 11% | 32.7 12% |
| Idle Bottom * | 36.8 | 31.8 14% | 28.2 23% | 29.4 20% | 25.3 31% | 37 -1% | 34.9 5% |
* ... daha küçük daha iyidir
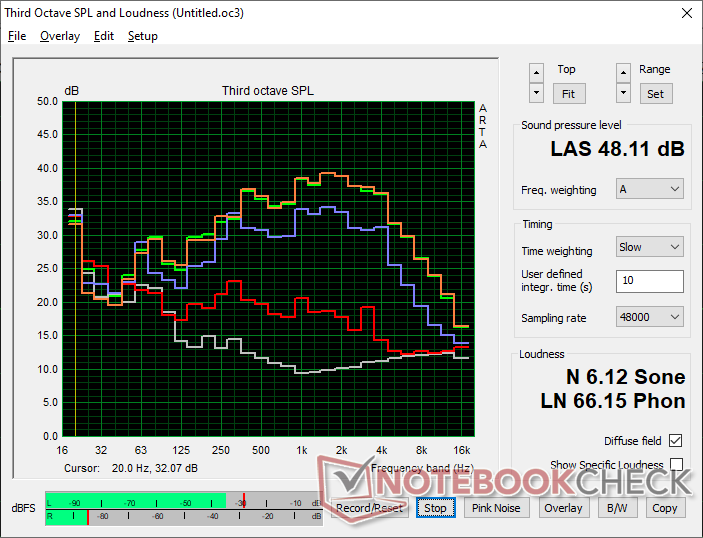
Konuşmacılar
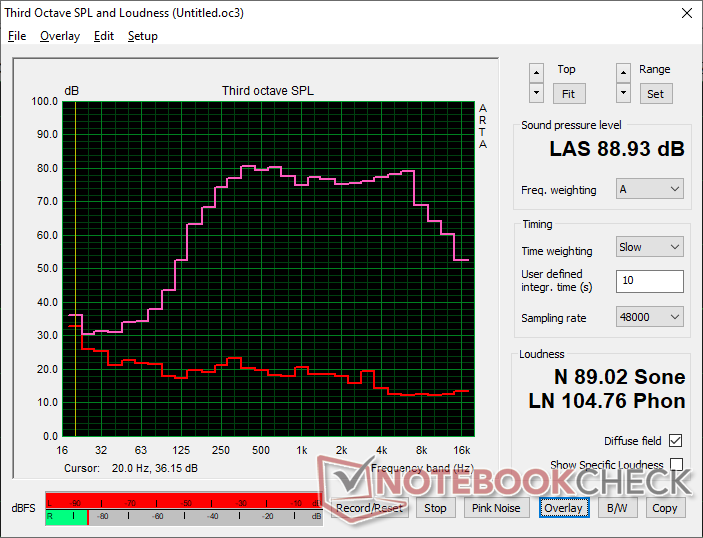
HP ZBook Fury 16 G11 ses analizi
(+) | hoparlörler nispeten yüksek sesle çalabilir (88.9 dB)
Bas 100 - 315Hz
(±) | azaltılmış bas - ortalama olarak medyandan 13.3% daha düşük
(±) | Bas doğrusallığı ortalamadır (11.2% delta - önceki frekans)
Ortalar 400 - 2000 Hz
(+) | dengeli ortalar - medyandan yalnızca 2.2% uzakta
(+) | orta frekanslar doğrusaldır (3.2% deltadan önceki frekansa)
Yüksekler 2 - 16 kHz
(+) | dengeli yüksekler - medyandan yalnızca 3.7% uzakta
(+) | yüksekler doğrusaldır (4.6% deltadan önceki frekansa)
Toplam 100 - 16.000 Hz
(+) | genel ses doğrusaldır (12.9% ortancaya göre fark)
Aynı sınıfla karşılaştırıldığında
» Bu sınıftaki tüm test edilen cihazların %17%'si daha iyi, 6% benzer, 76% daha kötüydü
» En iyisinin deltası 7% idi, ortalama 18% idi, en kötüsü 35% idi
Test edilen tüm cihazlarla karşılaştırıldığında
» Test edilen tüm cihazların %11'si daha iyi, 3 benzer, % 87 daha kötüydü
» En iyisinin deltası 4% idi, ortalama 24% idi, en kötüsü 134% idi
Apple MacBook Pro 16 2021 M1 Pro ses analizi
(+) | hoparlörler nispeten yüksek sesle çalabilir (84.7 dB)
Bas 100 - 315Hz
(+) | iyi bas - medyandan yalnızca 3.8% uzakta
(+) | bas doğrusaldır (5.2% delta ile önceki frekans)
Ortalar 400 - 2000 Hz
(+) | dengeli ortalar - medyandan yalnızca 1.3% uzakta
(+) | orta frekanslar doğrusaldır (2.1% deltadan önceki frekansa)
Yüksekler 2 - 16 kHz
(+) | dengeli yüksekler - medyandan yalnızca 1.9% uzakta
(+) | yüksekler doğrusaldır (2.7% deltadan önceki frekansa)
Toplam 100 - 16.000 Hz
(+) | genel ses doğrusaldır (4.6% ortancaya göre fark)
Aynı sınıfla karşılaştırıldığında
» Bu sınıftaki tüm test edilen cihazların %0%'si daha iyi, 0% benzer, 100% daha kötüydü
» En iyisinin deltası 5% idi, ortalama 18% idi, en kötüsü 45% idi
Test edilen tüm cihazlarla karşılaştırıldığında
» Test edilen tüm cihazların %0'si daha iyi, 0 benzer, % 100 daha kötüydü
» En iyisinin deltası 4% idi, ortalama 24% idi, en kötüsü 134% idi
Enerji Yönetimi
Güç Tüketimi
Sistem, masaüstünde rölantide çalışırken bizim sistemimize kıyasla daha verimlidir ZBook Fury 16 G10 yapılandırma. Aksi takdirde, yapılandırılan GPU'lar iki örneğimiz arasında farklı olsa da oyunlar gibi daha zorlu yükleri çalıştırırken tüketim neredeyse aynı hale gelir. Dolayısıyla, orta seviye RTX 3500 Ada'ya kıyasla üst seviye GPU yapılandırmaları seçildiğinde watt başına performans artıyor.
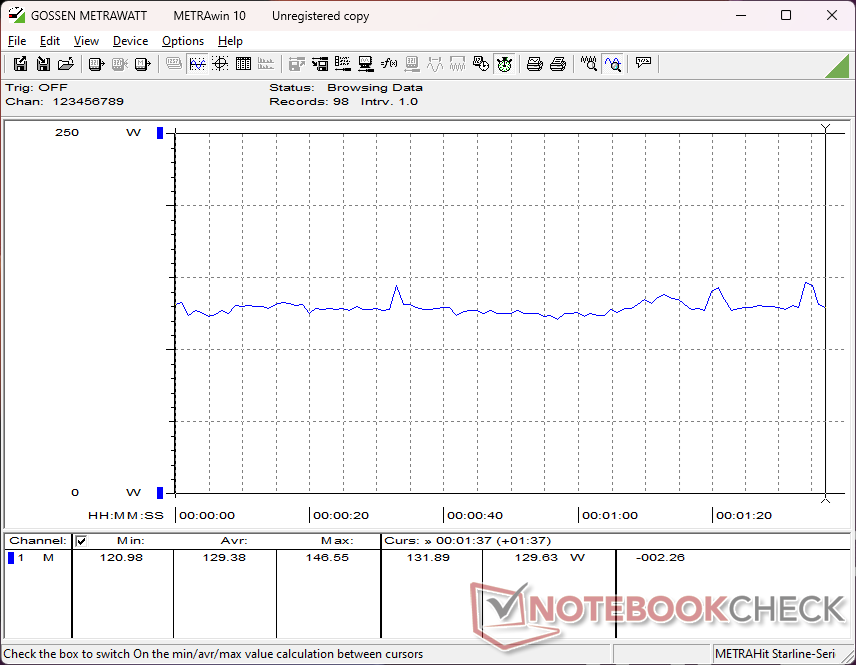
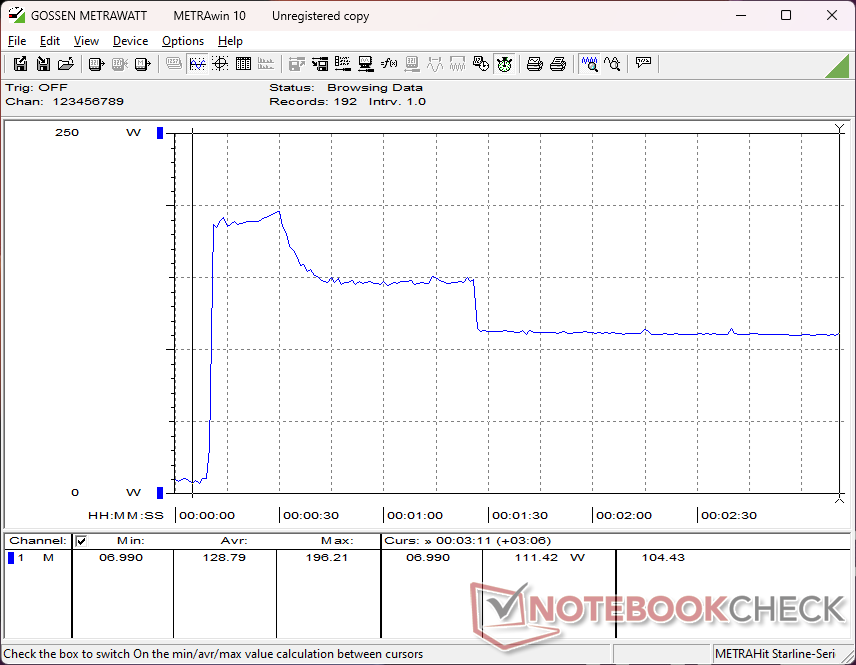
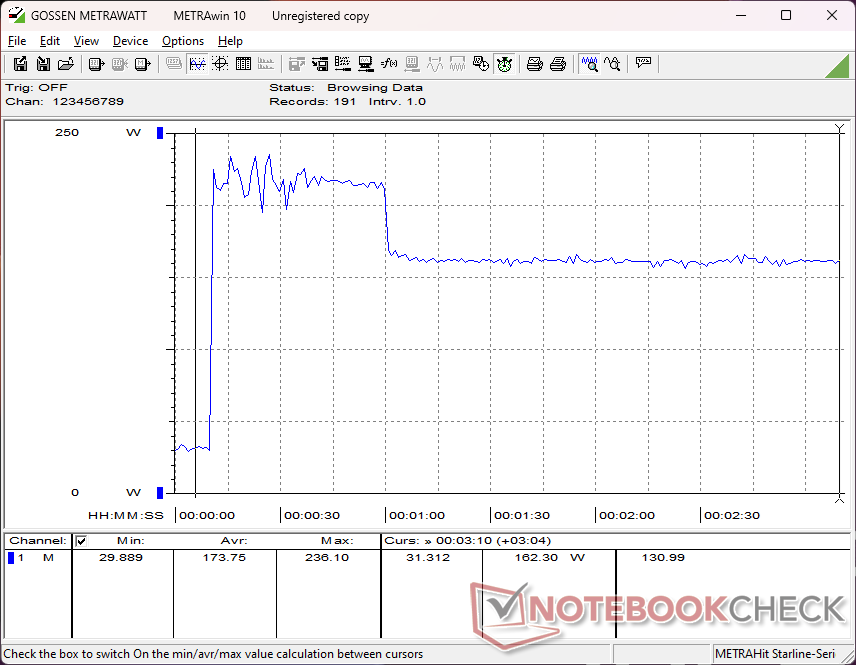
Prime95 veya CineBench R15 xT çalıştırılırken tüketim, Core i9-14900HX işlemcimizin daha yüksek Turbo Boost potansiyeli nedeniyle geçen yılki modelle karşılaştırıldığında ünitemizde belirgin şekilde daha yüksek olacaktır. Ancak bir dakika kadar sonra tüketim, yukarıdaki CineBench R15 xT döngü gözlemlerimizle uyumlu olan aşağıdaki karşılaştırma grafiğinde gösterildiği gibi geçen yılki modelde ölçtüğümüzle neredeyse aynı seviyeye düşüyordu. Bu nedenle, daha yüksek başlangıç Turbo Boost potansiyelimiz, yeni modellerle aramızdaki en önemli avantajdır Core i9-14900HX ve daha eski Core i9-13950HX.
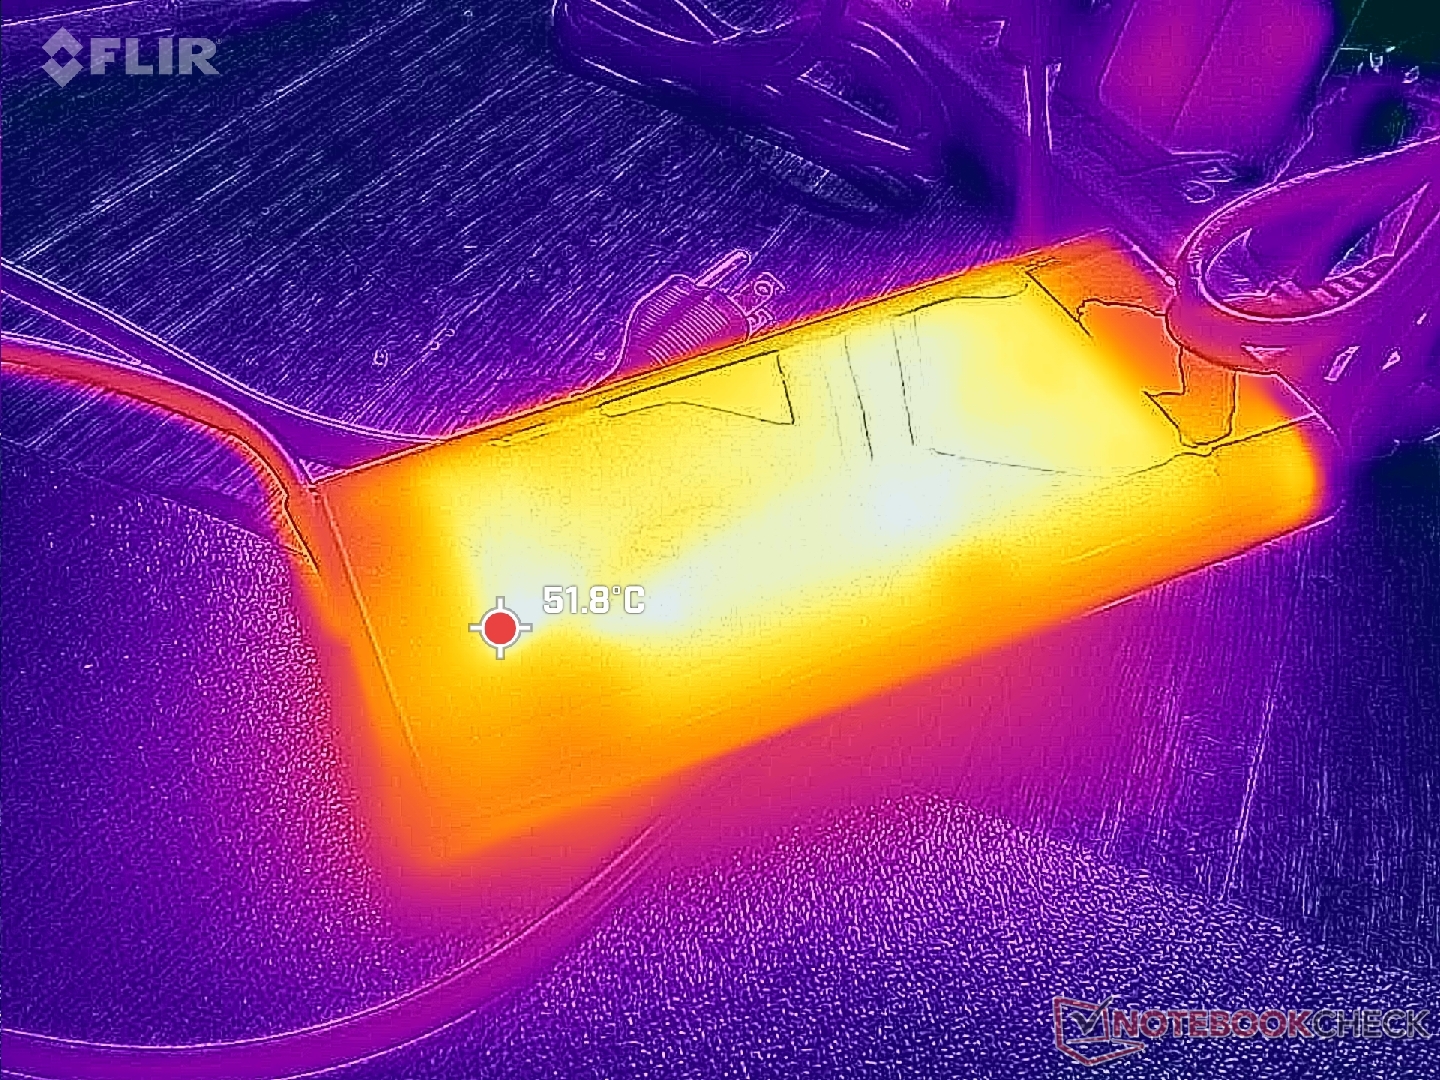
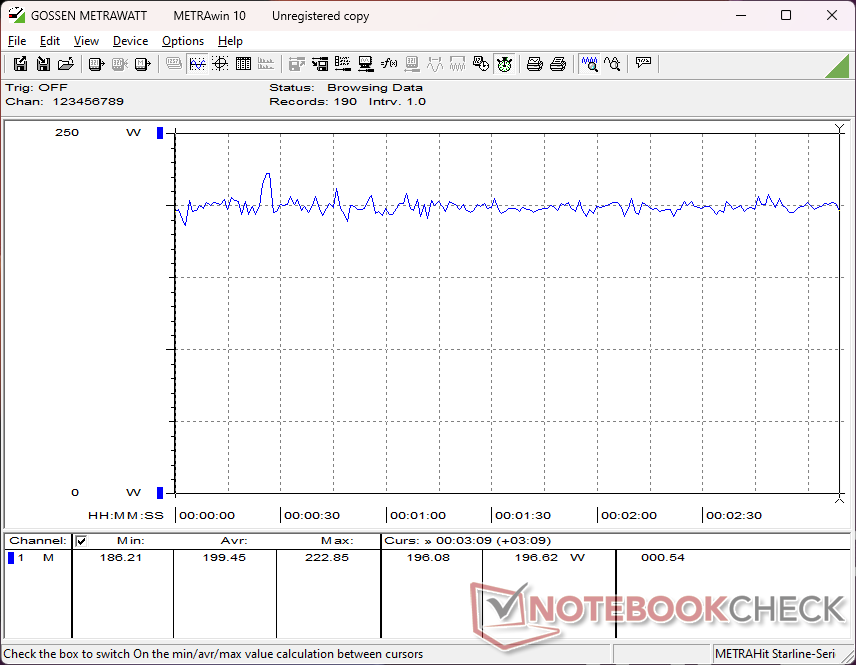
CPU ve GPU'nun her biri yüzde 100 kullanımdayken büyük (~18 x 8,8 x 2,5 cm) 230 W AC adaptörden maksimum 236 W tüketim kaydedebiliyoruz.
| Kapalı / Bekleme modu | |
| Boşta | |
| Çalışırken |
|
Key:
min: | |
| HP ZBook Fury 16 G11 i9-14900HX, NVIDIA RTX 3500 Ada Generation Laptop GPU, SK hynix PC801 HFS001TEJ9X101N, IPS, 3840x2400, 16" | HP ZBook Fury 16 G10 i9-13950HX, NVIDIA RTX 5000 Ada Generation Laptop GPU, SK hynix PC801 HFS001TEJ9X101N, IPS, 3840x2400, 16" | HP ZBook Fury 16 G9 i9-12950HX, RTX A5500 Laptop GPU, Micron 3400 1TB MTFDKBA1T0TFH, IPS, 3840x2400, 16" | Dell Precision 5690 Ultra 9 185H, NVIDIA RTX 5000 Ada Generation Laptop GPU, 2x Samsung PM9A1 1TB (RAID 0), OLED, 3840x2400, 16" | Lenovo ThinkPad P16 G2 21FA000FGE i7-13700HX, NVIDIA RTX 2000 Ada Generation Laptop GPU, SK hynix PC801 HFS001TEJ9X162N, IPS LED, 2560x1600, 16" | Lenovo ThinkPad P1 G6 21FV001KUS i7-13800H, NVIDIA GeForce RTX 4080 Laptop GPU, Kioxia XG8 KXG8AZNV1T02, OLED, 3480x2400, 16" | Asus ProArt Studiobook 16 OLED H7604 i9-13980HX, NVIDIA GeForce RTX 4070 Laptop GPU, Phison EM2804TBMTCB47, OLED, 3200x2000, 16" | |
|---|---|---|---|---|---|---|---|
| Power Consumption | -34% | -77% | -1% | 4% | 7% | -24% | |
| Idle Minimum * | 8.6 | 15.3 -78% | 19.5 -127% | 7.9 8% | 9.3 -8% | 8 7% | 12.8 -49% |
| Idle Average * | 14.8 | 18.2 -23% | 29 -96% | 12 19% | 14.1 5% | 9.5 36% | 19.9 -34% |
| Idle Maximum * | 15.7 | 28 -78% | 40.7 -159% | 28.6 -82% | 15.5 1% | 23.7 -51% | 20.3 -29% |
| Load Average * | 129.4 | 137.9 -7% | 142.1 -10% | 98.8 24% | 133.6 -3% | 97.2 25% | 131.4 -2% |
| Cyberpunk 2077 ultra external monitor * | 192.6 | ||||||
| Cyberpunk 2077 ultra * | 199.4 | ||||||
| Load Maximum * | 236.1 | 202 14% | 224.4 5% | 174.8 26% | 179.6 24% | 197.2 16% | 246.8 -5% |
| Witcher 3 ultra * | 189.4 | 188.6 | 144.5 | 144.9 | 144 | 196.5 |
* ... daha küçük daha iyidir
Power Consumption Cyberpunk / Stress Test
Power Consumption external Monitor
Pil Ömrü
Çalışma süreleri, Raptor Lake-HX Refresh CPU için daha yüksek Turbo Boost tavanı nedeniyle muhtemelen biraz daha kısa olmasa da geçen yılki ZBook Fury 16 G11'e çok benziyor. Precision 5690 veya ThinkPad P16 G2 gibi rakip modellerin her biri karşılaştırıldığında en az bir saat kadar daha uzun süre dayanabilir.
Ürünle birlikte verilen fıçı AC adaptörü ile boş kapasiteden tam kapasiteye şarj etmek 60 dakikanın biraz üzerinde nispeten hızlıdır.
| HP ZBook Fury 16 G11 i9-14900HX, NVIDIA RTX 3500 Ada Generation Laptop GPU, 95 Wh | HP ZBook Fury 16 G10 i9-13950HX, NVIDIA RTX 5000 Ada Generation Laptop GPU, 95 Wh | HP ZBook Fury 16 G9 i9-12950HX, RTX A5500 Laptop GPU, 95 Wh | Dell Precision 5690 Ultra 9 185H, NVIDIA RTX 5000 Ada Generation Laptop GPU, 98 Wh | Lenovo ThinkPad P16 G2 21FA000FGE i7-13700HX, NVIDIA RTX 2000 Ada Generation Laptop GPU, 94 Wh | Lenovo ThinkPad P1 G6 21FV001KUS i7-13800H, NVIDIA GeForce RTX 4080 Laptop GPU, 90 Wh | Asus ProArt Studiobook 16 OLED H7604 i9-13980HX, NVIDIA GeForce RTX 4070 Laptop GPU, 90 Wh | |
|---|---|---|---|---|---|---|---|
| Pil Çalışma Süresi | 8% | -10% | 37% | 28% | -37% | -17% | |
| WiFi v1.3 | 402 | 435 8% | 360 -10% | 549 37% | 515 28% | 252 -37% | 334 -17% |
| Reader / Idle | 319 | ||||||
| Load | 71 | 65 | |||||
| H.264 | 358 |
Artılar
Eksiler
Karar - Güçlü Tasarım Sınırlı Turbo Takviyesiyle Geriledi
ZBook Fury 16 G11'in tasarımını seviyoruz. Fury 16 G9 ile aynı kalsa da, servis kolaylığı, geniş yapılandırılabilir seçenekler, ECC RAM desteği ve rahat klavye ve dokunmatik yüzey, iş istasyonu kullanıcıları için tüm doğru kutuları işaretler.
Bunun yerine, ZBook Fury 16 G11 ile ilgili temel sorunlar performansında yatmaktadır. Başka bir dizüstü bilgisayar gibi Lenovo Legion 9 16IRX9 aynı Core i9-14900HX CPU'yu ZBook'umuzdan yüzde 20'ye kadar daha hızlı çalıştırabiliyorsa, HP'deki soğutma çözümü daha yüksek Turbo Boost hızlarını daha uzun süre desteklemek için kesinlikle bir yükseltme kullanabilir. Benzer şekilde, M.2 SSD'ler de aynı nedenden dolayı ısı dağıtıcılardan faydalanabilir, çünkü gerildiklerinde kısılabilirler. Bu sınırlamalar, Core i9 CPU ve PCIe4 SSD'nin avantajlarını gölgelemektedir, çünkü Dell veya Lenovo'nun rakip makinelerinde potansiyel olarak daha hızlı performans gösterebilirler.
ZBook Fury 16 G11, geçen yılki ZBook Fury G10'a göre sadece küçük bir güncellemedir. Hala harika görünmesine ve hissettirmesine rağmen, daha ağır kullanım senaryolarında performans düşme eğilimindedir.
Son olarak, modelin yerel yapay zeka hızlandırması için Meteor Lake seçeneği sunmaması biraz talihsiz bir durum. Kabul etmek gerekir ki, böyle bir özellik muhtemelen yalnızca küçük bir iş istasyonu kullanıcısı alt kümesine hitap ediyor, ancak Fury 16 G11'i Fury 16 G10'dan daha da ayırmaya yardımcı olabilirdi. Neredeyse bir yıllık olan Fury 16 G11 ile aynı performansı ve özellikleri elde edebilirsiniz Fury 16 G10 en son Fury 16 G11'de yapabildiğiniz gibi.
Fiyat ve Bulunabilirlik
ZBook Fury 16 G11 şu anda Core i9-14900HX ve RTX 3500 Ada ile yapılandırılmış olarak yaklaşık 3400 $ ' a, RTX 5000 Ada ile tam olarak yapılandırılmışsa 5500 $'ın üzerine gönderiliyor.
İpucu: Derecelendirme Sistemimizi kısa bir süre önce güncelledik ve Sürüm 8'in sonuçları Sürüm 7'nin sonuçlarıyla karşılaştırılamaz. Daha fazla bilgi için hier verfügbar.
Not: Derecelendirme sistemimizi yakın zamanda güncelledik ve 8. sürümün sonuçları 7. sürümün sonuçları ile karşılaştırılamaz. Daha fazla bilgi için burada .
HP ZBook Fury 16 G11
- 08/12/2024 v8
Allen Ngo
 Total Sustainability Score:
 Şeffaflık
İncelenecek cihazların seçimi editör ekibimiz tarafından yapılır. Test örneği, bu incelemenin amacı doğrultusunda üretici veya perakendeci tarafından yazara ödünç olarak sağlanmıştır. Borç verenin bu inceleme üzerinde herhangi bir etkisi olmadığı gibi, üretici de yayınlanmadan önce bu incelemenin bir kopyasını almamıştır. Bu incelemeyi yayınlama zorunluluğu yoktu. İncelemelerimiz karşılığında asla tazminat veya ödeme kabul etmiyoruz. Bağımsız bir medya şirketi olarak Notebookcheck, üreticilerin, perakendecilerin veya yayıncıların otoritesine tabi değildir.
Notebookcheck bu şekilde test yapıyor
Notebookcheck, tüm sonuçların karşılaştırılabilir olmasını sağlamak için her yıl yüzlerce dizüstü bilgisayarı ve akıllı telefonu standart prosedürler kullanarak bağımsız olarak inceliyor. Yaklaşık 20 yıldır test yöntemlerimizi sürekli olarak geliştirdik ve bu süreçte endüstri standartlarını belirledik. Test laboratuvarlarımızda deneyimli teknisyenler ve editörler tarafından yüksek kaliteli ölçüm ekipmanları kullanılmaktadır. Bu testler çok aşamalı bir doğrulama sürecini içerir. Karmaşık derecelendirme sistemimiz, nesnelliği koruyan yüzlerce sağlam temellere dayanan ölçüm ve kıyaslamaya dayanmaktadır.Price comparison

