Notebookcheck Logo
Teaser

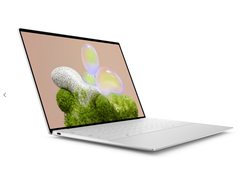
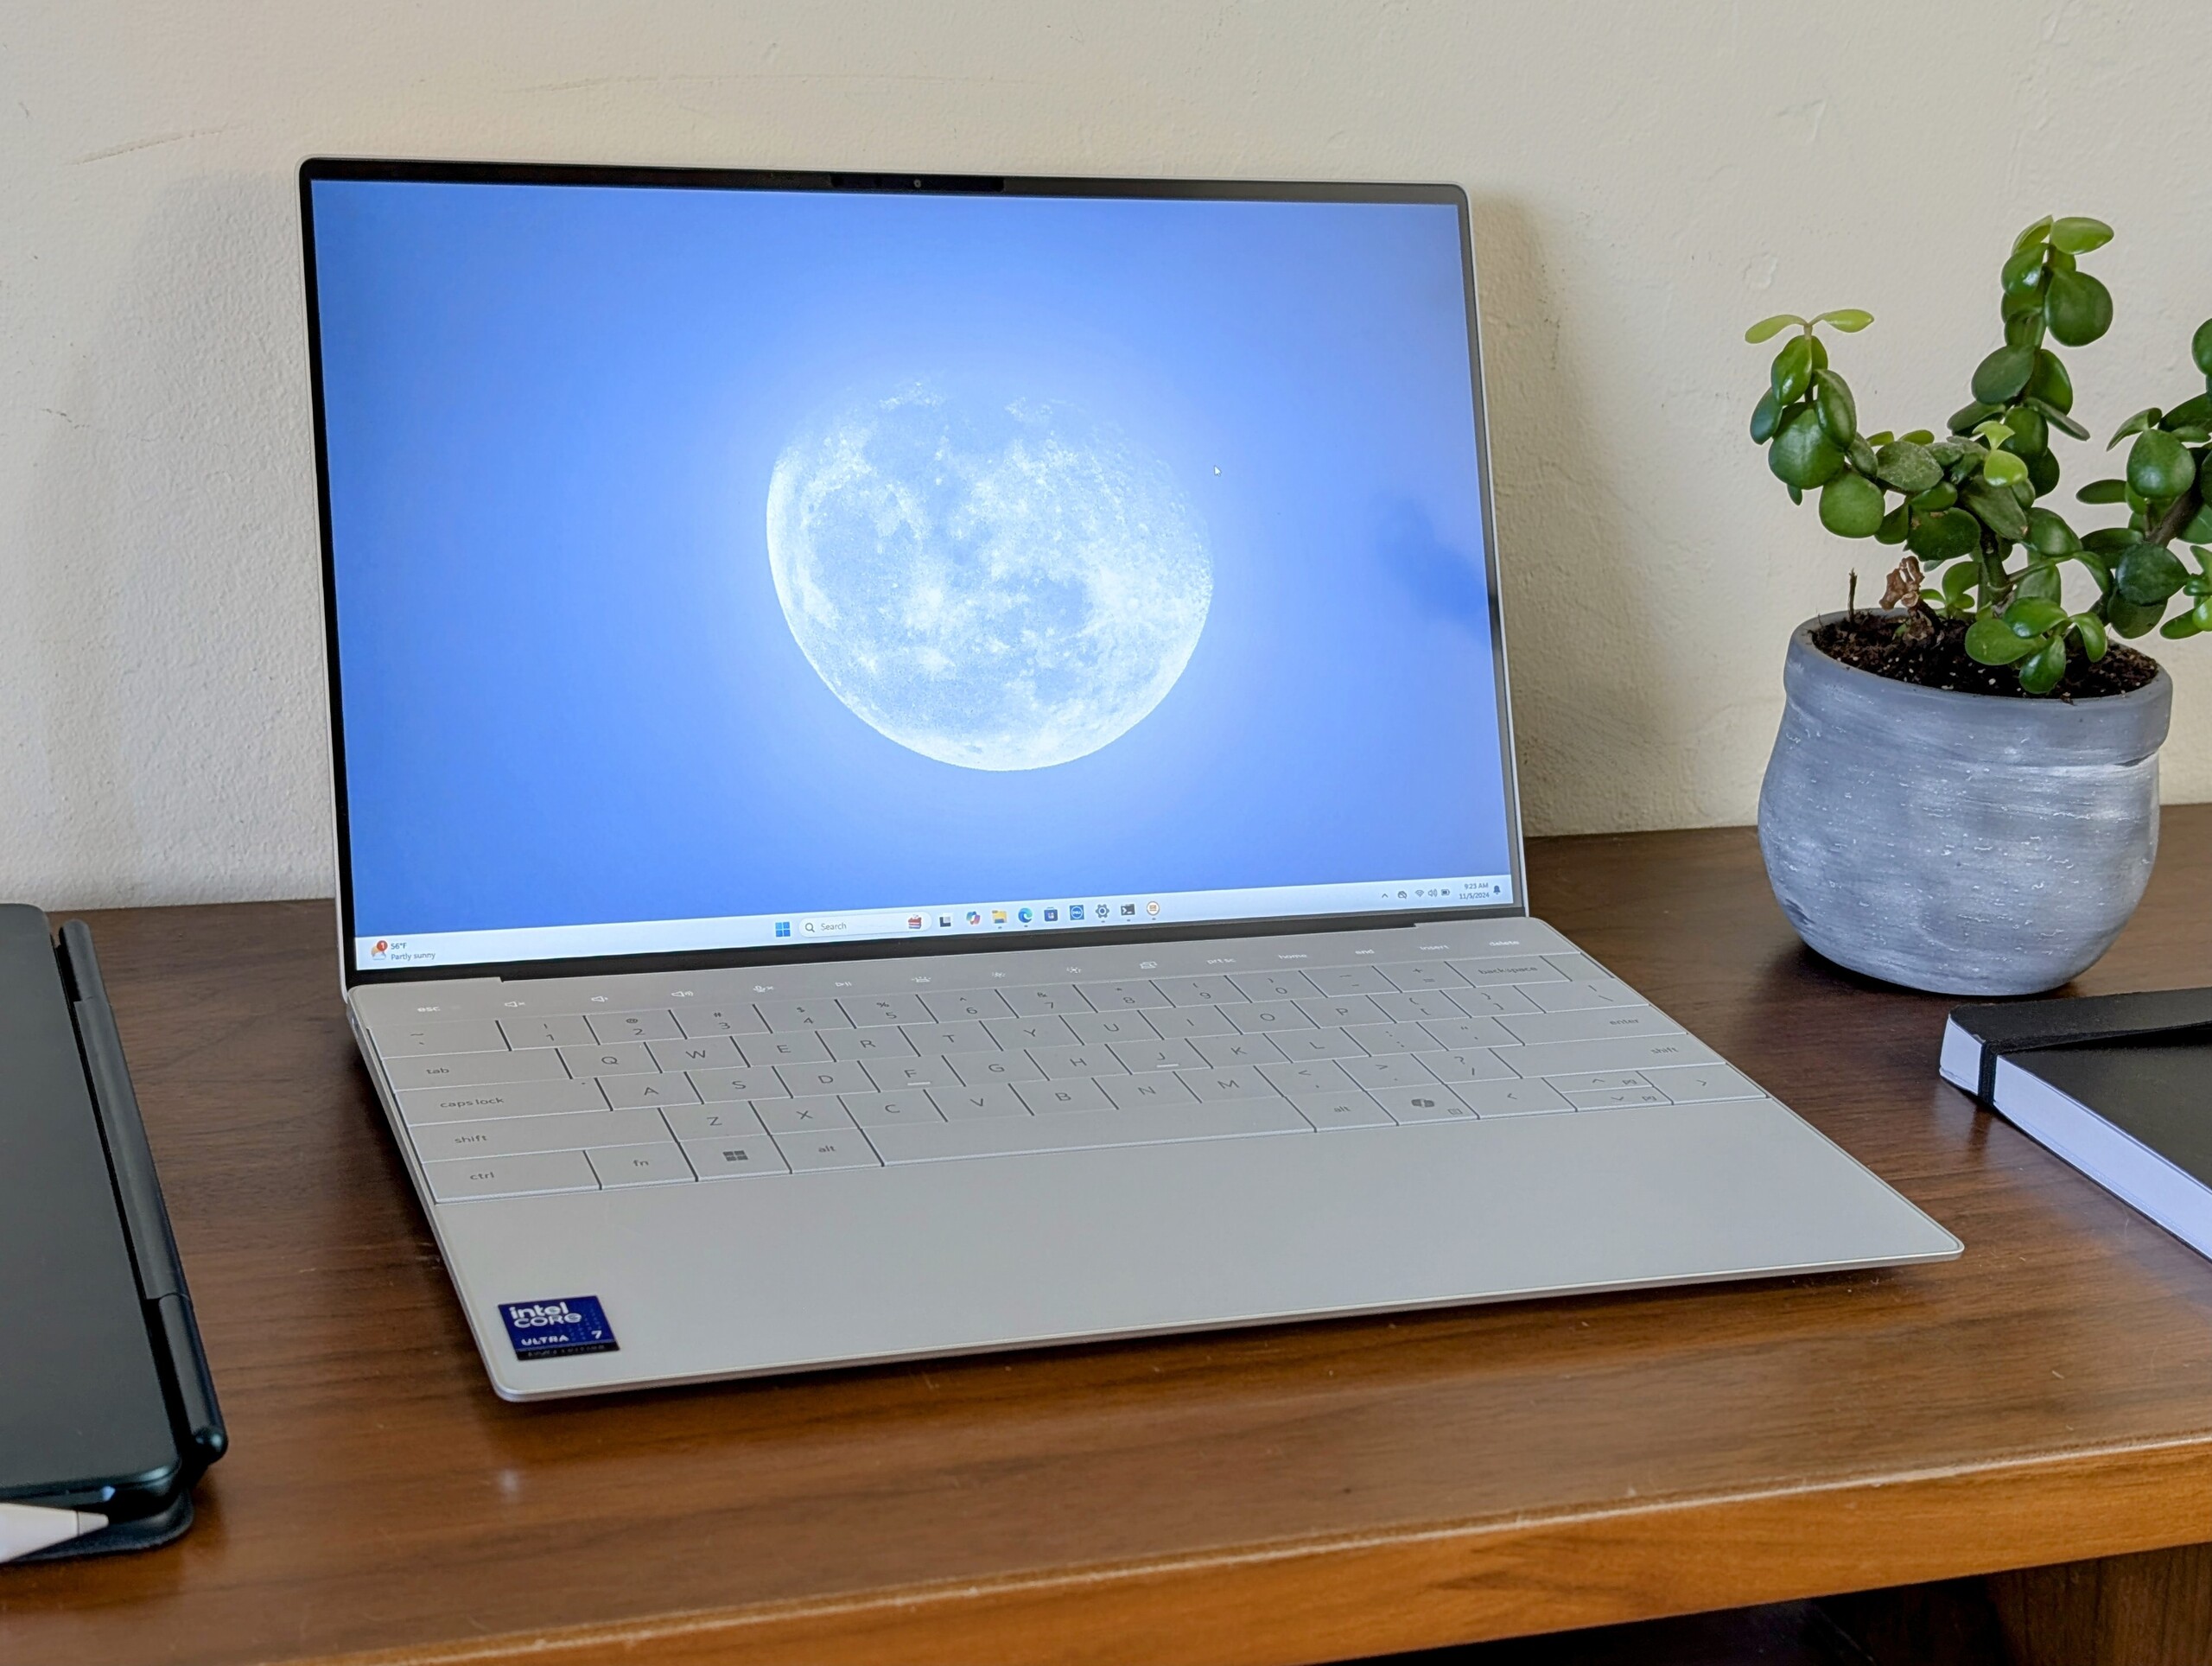
Dell XPS 13 9350 dizüstü bilgisayar incelemesi: Intel Lunar Lake mükemmel uyum sağlıyor

Şimdiye kadarki en dengeli XPS 13 seçeneği.

Yeni Intel CPU, XPS 13 9340'a göre daha tutarlı bir işlemci performansı sağlarken hem pil ömrünü hem de grafikleri önemli ölçüde artırıyor. Değişiklikler, XPS 13'ü MacBook Air 13 serisine karşı daha da iyi bir rakip haline getirmeye yardımcı oluyor.
Allen Ngo, 👁 Allen Ngo (Çeviren DeepL / Ninh Duy) Published 🇺🇸 🇷🇺 ...
Lunar Lake Laptop / Notebook XPS Intel Evo

Karar

İncelemede: Dell XPS 13 9350

XPS 13'ün kasa tasarımı hakkında ne derseniz deyin, yeni Lunar Lake CPU kesinlikle sistemi daha tutarlı performansa ve çok daha uzun pil ömrüne sahip bir şeye dönüştürdü. XPS 13 9340'daki Core H-serisi işlemci ince kasanın kaldıramayacağı kadar büyüktü ve daha verimli Core Ultra 7 256V bu sorunu doğrudan çözerken aynı zamanda grafik performansını da geliştiriyor. Bu değişiklikler, daha uzun çalışma sürelerinden ve daha hızlı GPU'dan yararlanabilecek gezginlere ve editörlere doğrudan fayda sağlayacaktır MacBook Air 13.

Turbo Boost performansı XPS 13 9340 ile kıyaslandığında biraz düşüş gösteriyor. Bununla birlikte, yeni Lunar Lake platformuna geçmenin grafik performansı ve pil ömründeki kazanımları, çoklu iş parçacığı performansındaki dezavantajdan daha ağır basıyor.

Artılar

+ tam sRGB renklere sahip yüksek kaliteli 120 Hz IPS ekran
+ bir XPS 13 için iyi grafik performansı
+ daha istikrarlı işlemci performansı
+ çok uzun pil ömrü
+ çok dar çerçeveler

Eksiler

- xPS 13 9340'a göre daha zayıf Turbo Boost performansı
- 2 MP web kamerası yaşını göstermeye başlıyor
- değişken yenileme hızı desteği yok
- ya sev ya nefret et şasi tasarımı
- başka görüntüleme seçeneği yok

Fiyat ve Bulunabilirlik

Dell, incelediğimiz XPS 13 9350'yi 1400 USD fiyatla satışa sunuyor.

Karşılaştırılan olası alternatifler

Image
Model / Review
Price
Weight
Height
Display
1.
85.3%
Dell XPS 13 9350
Dell XPS 13 9350
Intel Core Ultra 7 256V ⎘
Intel Arc Graphics 140V ⎘
16 GB Bellek, 512 GB SSD
1.2 kg15.3 mm13.40"
1920x1200
169 PPI
IPS
2.
87.3% v7 (old)
Dell XPS 13 Plus 9320 i7-1280P OLED
Intel Core i7-1280P ⎘
Intel Iris Xe Graphics G7 96EUs ⎘
16 GB Bellek, 512 GB SSD
1.3 kg15.28 mm13.40"
3456x2160
304 PPI
OLED
3.
90.1% v7 (old)
Lenovo ThinkBook 13x G4 21KR0008GE
Intel Core Ultra 5 125H ⎘
Intel Arc 7-Core iGPU ⎘
16 GB Bellek, 512 GB SSD
1.2 kg12.9 mm13.50"
2880x1920
256 PPI
IPS
4.
91.9% v7 (old)
HP Dragonfly G4
HP Dragonfly G4
Intel Core i7-1365U ⎘
Intel Iris Xe Graphics G7 96EUs ⎘
16 GB Bellek, 512 GB SSD
1.1 kg16.3 mm13.50"
1920x1280
171 PPI
IPS
5.
85.4% v7 (old)
Asus ZenBook S13 OLED UX5304
Intel Core i7-1355U ⎘
Intel Iris Xe Graphics G7 96EUs ⎘
16 GB Bellek, 1024 GB SSD
1 kg11.8 mm13.30"
2880x1800
255 PPI
OLED
6.
86.6% v7 (old)
MSI Prestige 13 AI Evo
Intel Core Ultra 7 155H ⎘
Intel Arc 8-Core iGPU ⎘
32 GB Bellek, 1024 GB SSD
967 g16.9 mm13.30"
2880x1800
OLED

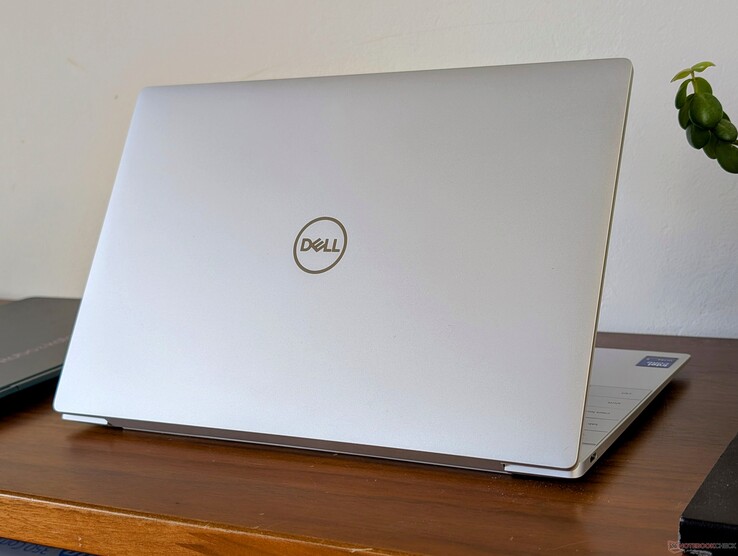
Dell bu sezon XPS 13 serisini Intel Lunar Lake işlemci serisi ile yeniledi. XPS 13 9350 olarak adlandırılan bu sistem, XPS 13 9340 ve Meteor Lake-H seçeneklerinin yerini alıyor. Sistemin fiziksel özellikleri 9340 ile aynıdır ve bu nedenle XPS 13 9340 ile ilgili incelemelerimize göz atmanızı öneririz 9320 modelin kasası ve dış tasarımı hakkında daha fazla bilgi edinmek için.

Test ünitemiz Core Ultra 7 256V CPU, 16 GB hızlı LPDDR5x-8533 RAM, 512 GB NVMe SSD ve 1200p IPS ekran ile yaklaşık 1400 $ karşılığında geliyor. Bu yazının yazıldığı sırada başka bir konfigürasyon mevcut değil, ancak 1800p dokunmatik ekranlı SKU'lar planlanıyor.

XPS 13'ün alternatifleri arasında aşağıdaki gibi diğer üst düzey alt dizüstü bilgisayarlar bulunmaktadır MSI Prestige 13 AI Evo, Asus ZenBook S13 OLED, HP Dragonfly G4veya Apple MacBook Air 13 serisi.

Daha fazla Dell incelemesi:

Teknik Özellikler

Dell XPS 13 9350 (XPS 13 Seri)
İşlemci
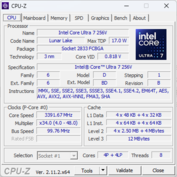
Intel Core Ultra 7 256V 8 x 2.2 - 4.8 GHz, 39 W PL2 / Short Burst, 32 W PL1 / Sustained, Lunar Lake
Grafik kartı
Intel Arc Graphics 140V, Çekirdek: 1850 MHz, LPDDR5x, 32.0.101.5730
Bellek
16 GB 
, Dual-Channel, LPDDR5x, 8533 MT/s, Soldered
Görüntü
13.40 inç 16:10, 1920 x 1200 pixel 169 PPI, LG Philips 134WU2, IPS, ID: LGD078B, Dell P/N: PF71N, parlak: hayır, 120 Hz
Harddisk
Micron 2550 512GB, 512 GB 
Ses kartı
Intel Lunar Lake SOC - cAVS (Audio, Voice, Speech)
Bağlantılar
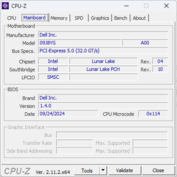
2 USB 4.0 40 Gbps, 2 Thunderbolt, USB-C Power Delivery (PD), 2 DisplayPort, 1 Parmak izi okuyucu, Brightness Sensor
Network
Intel BE201 320MHz (a/b/g/h/n = Wi-Fi 4/ac = Wi-Fi 5/ax = Wi-Fi 6/ Wi-Fi 6E 6 GHz be = Wi-Fi 7), Bluetooth 5.4
Boyut
yükseklik x genişlik x derinlik (mm): 15.3 x 295.3 x 199.1
Batarya
55 Wh Lithium-Polymer
İşletim sistemi
Microsoft Windows 11 Home
Camera
Webcam: 1080p + IR
Primary Camera: 2 MPix
Ek özellikler
Hoparlörler: quad speakers, Klavye ışığı: evet, MyDell, 12 Ay Garanti
Ağırlık
1.21 kg, Güç kaynağı: 291 g
Fiyat
1400 USD
Note: The manufacturer may use components from different suppliers including display panels, drives or memory sticks with similar specifications.


Vaka - Çekici Bir Karma Çanta

Şasi, orijinal lansmanından bu yana değişmeden kalmıştır XPS 13 9320 2022'de geri döndü. Tasarım, görünüşte işlevden çok biçime öncelik verdiği için başından beri tartışmalı olmuştur; dokunmatik çubuk ve kenarsız clickpad gibi özellikler pürüzsüz ve şık görünebilir, ancak diğer dizüstü bilgisayarların çoğunun sunduğu dokunsal geri bildirimden yoksundur.

Tasarım, boyut ve görünüm açısından yeni rakiplere karşı hala iyi durumda. Dragonfly G4 ve ThinkBook 13x G4örneğin, benzer 13 inç ekran boyutlarına rağmen daha büyük ve daha kalın çerçevelere sahipler.

thunderbolt 4 ile 2x USB-C

Boyut ve ağırlık karşılaştırması

299 mm 210 mm 16.9 mm 967 g297 mm 220 mm 16.3 mm 1.1 kg295.3 mm 199.1 mm 15.3 mm 1.2 kg295.3 mm 199.04 mm 15.28 mm 1.3 kg296.2 mm 216.3 mm 11.8 mm 1 kg292.9 mm 205 mm 12.9 mm 1.2 kg297 mm 210 mm 1 mm 5.7 g

İletişim

Intel BE201, Wi-Fi 7 ve Bluetooth 5.4 desteği için standart olarak gelmektedir. Bununla birlikte, Wi-Fi 7 çoğu evde nispeten yaygın olmadığı için çoğu kullanıcı bunun yerine Wi-Fi 6 veya 6E üzerinden internete bağlanmaya devam edecektir.

Networking
iperf3 transmit AXE11000
Lenovo ThinkBook 13x G4 21KR0008GE
Intel Wi-Fi 6E AX211
1666 (1537min, 1551.79P1 - 1751max) MBit/s +90%
MSI Prestige 13 AI Evo
Intel Killer Wi-Fi 7 BE1750W 320 MHz (BE200NGW)
1609 (1535min, 1544.86P1 - 1649max) MBit/s +84%
Asus ZenBook S13 OLED UX5304
Intel Wi-Fi 6E AX211
1555 (1319min - 1613max) MBit/s +78%
HP Dragonfly G4
Intel Wi-Fi 6E AX211
973 (879min - 1016max) MBit/s +11%
Dell XPS 13 9350
Intel BE201 320MHz
875 (599min - 1034max) MBit/s
iperf3 receive AXE11000
Lenovo ThinkBook 13x G4 21KR0008GE
Intel Wi-Fi 6E AX211
1709 (1689min, 1690.74P1 - 1723max) MBit/s +106%
MSI Prestige 13 AI Evo
Intel Killer Wi-Fi 7 BE1750W 320 MHz (BE200NGW)
1644 (1579min, 1581.03P1 - 1671max) MBit/s +99%
Asus ZenBook S13 OLED UX5304
Intel Wi-Fi 6E AX211
1439 (1353min - 1469max) MBit/s +74%
HP Dragonfly G4
Intel Wi-Fi 6E AX211
1200 (1059min - 1247max) MBit/s +45%
Dell XPS 13 9350
Intel BE201 320MHz
828 (763min - 865max) MBit/s
iperf3 transmit AXE11000 6GHz
HP Dragonfly G4
Intel Wi-Fi 6E AX211
1243 (776min - 1326max) MBit/s +10%
Dell XPS 13 9350
Intel BE201 320MHz
1127 (1037min - 1292max) MBit/s
iperf3 receive AXE11000 6GHz
Dell XPS 13 9350
Intel BE201 320MHz
1620 (1578min - 1652max) MBit/s
HP Dragonfly G4
Intel Wi-Fi 6E AX211
1234 (1042min - 1336max) MBit/s -24%
05010015020025030035040045050055060065070075080085090095010001050110011501200125013001350140014501500155016001650Tooltip
Dell XPS 13 9350; iperf3 transmit AXE11000 6GHz; iperf 3.1.3: Ø1127 (1037-1292)
Dell XPS 13 9350; iperf3 receive AXE11000 6GHz; iperf 3.1.3: Ø1620 (1578-1652)

Web kamerası

1080p web kamerası, birçok Lenovo ve HP modelindeki 5 MP veya daha yüksek tekliflerle karşılaştırıldığında çözünürlük spektrumunun alt ucunda yer alıyor. Belki de daha can sıkıcı olanı, sistemde fiyat noktası ne olursa olsun diğer dizüstü bilgisayarların çoğunda ortak bir özellik haline gelen gizlilik deklanşörü bulunmamaya devam ediyor.
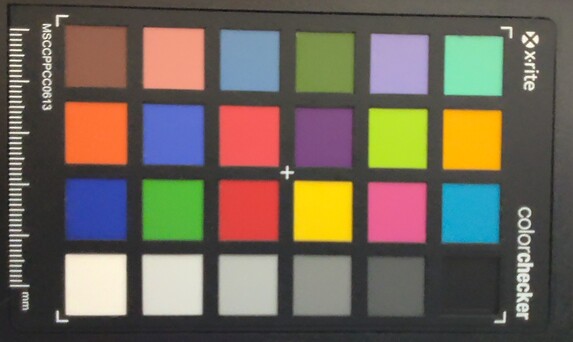
ColorChecker
9.6 ∆E
9.7 ∆E
11.7 ∆E
16.6 ∆E
12.4 ∆E
12.1 ∆E
11.4 ∆E
8.4 ∆E
11.9 ∆E
8.9 ∆E
10.4 ∆E
7.1 ∆E
4.3 ∆E
12.5 ∆E
13 ∆E
5 ∆E
12.7 ∆E
11.3 ∆E
9.5 ∆E
8.4 ∆E
11.4 ∆E
10.3 ∆E
8 ∆E
0.7 ∆E
ColorChecker Dell XPS 13 9350: 9.89 ∆E min: 0.7 - max: 16.58 ∆E

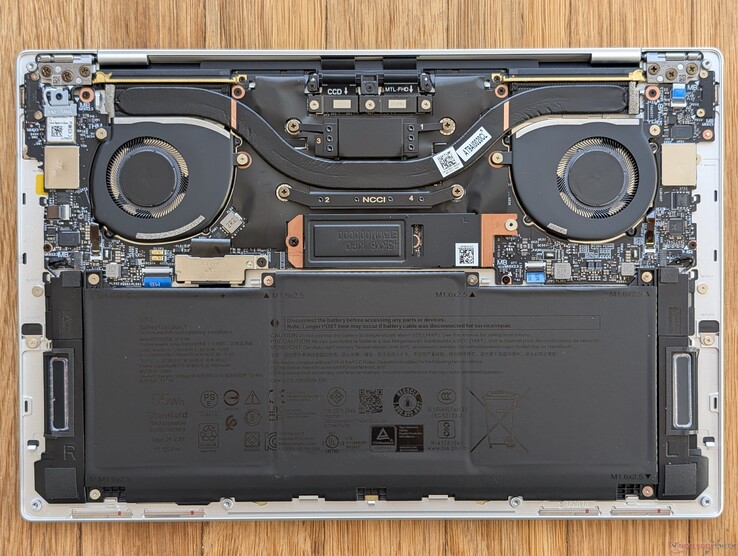
Bakım

Önceki nesil XPS 13 9340 ve hatta Snapdragon destekli XPS 13 9340 ile karşılaştırıldığında önemli bir dahili değişiklik yok XPS 13 9345. WLAN ve RAM lehimli olarak kalır ve bu nedenle yalnızca tek M.2 2280 SSD yükseltilebilir.

Dell XPS 13 9350 dahili özellikleri

Sürdürülebilirlik

Model, karbon ayak izini azaltmak için hidro-güç yenilenebilir enerji kaynakları kullanılarak üretilmiştir. Dell ayrıca sistemin yüzde 100 geri dönüştürülebilir olduğunu iddia ediyor.

Ambalaj, yüzde 100 geri dönüştürülmüş kağıt ve kartondan oluşuyor ve hiçbir yerinde plastik bulunmuyor.

Aksesuarlar ve Garanti

Perakende ambalajında yalnızca evraklar ve AC adaptörü bulunurken USB-C - 3,5 mm ses jakı adaptörü bulunmuyor. Eski XPS modelleri adaptörü içeriyordu, ancak Dell bunu tamamen kaldırıyor olabilir.

ABD'de satın alındığında standart bir yıllık sınırlı garanti geçerlidir.

Ekran - Bir IPS için Sağlam

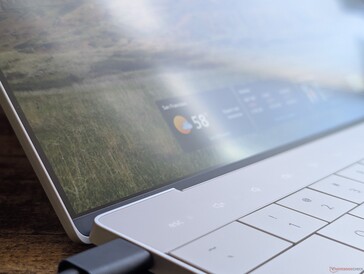
Bu yazının yazıldığı sırada mevcut olan tek ekran seçeneği 120 Hz 1200p konfigürasyonumuzdur. Bu önceki modellerde de mevcut olsa da Dell bu kez panel sağlayıcılarını Sharp'tan LG Philips'e değiştirdi. Kontrast oranı artık renklerin öne çıkmasına yardımcı olmak için daha yüksek, ancak tam sRGB kapsamı, yenileme hızı ve ortalama siyah-beyaz tepki süreleri dahil olmak üzere diğer her şey neredeyse eskisi gibi kalıyor.

Gelecek modellerde görmek istediğimiz bir şey de Windows değişken yenileme hızı veya VRR desteğidir. Şu anda kullanıcılar yalnızca sabit 60 Hz veya 120 Hz yenileme hızı arasında seçim yapabilirken, bazı ekranlarda Framework Dizüstü Bilgisayar 16 dinamik olarak <60 Hz olarak değişebilir. Bunu XPS 13'e uygulamak, pil modunda daha da fazla güç tasarrufu yapmasına yardımcı olacaktır.

Dokunmatik ekran desteği olmayan mat panel
Herhangi bir subnotebook'un en dar çerçevelerinden bazıları
Ekran mat bir panel için çok keskin; piksel ızgarası grenliliği azaltmak için ekran yüzeyine yakın
Üst köşeler boyunca küçük düzensiz arka ışık kanaması
428
cd/m²
440.5
cd/m²
446.5
cd/m²
422.9
cd/m²
462.8
cd/m²
458.4
cd/m²
402.5
cd/m²
418
cd/m²
436.3
cd/m²
Parlaklığın yayılımı
LG Philips 134WU2 tested with X-Rite i1Pro 2
Maksimum: 462.8 cd/m² (Nits) Ortalama: 435.1 cd/m² Minimum: 22.3 cd/m²
Aydınlatma: 87 %
Batarya modunda parlaklık: 462.8 cd/m²
Kontrast: 2436:1 (Siyah: 0.19 cd/m²)
ΔE Color 1.92 | 0.5-29.43 Ø4.91, calibrated: 0.48
ΔE Greyscale 0.6 | 0.5-98 Ø5.2
68.6% AdobeRGB 1998 (Argyll 2.2.0 3D)
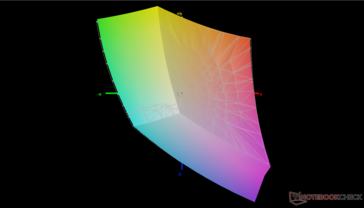
99% sRGB (Argyll 2.2.0 3D)
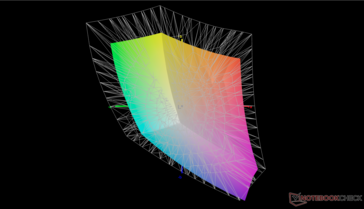
67.3% Display P3 (Argyll 2.2.0 3D)
Gamma: 2.19
Dell XPS 13 9350
LG Philips 134WU2, IPS, 1920x1200, 13.4", 120 Hz
Dell XPS 13 Plus 9320 i7-1280P OLED
Samsung 134XK04, OLED, 3456x2160, 13.4", 60 Hz
Lenovo ThinkBook 13x G4 21KR0008GE
LEN135WQ+, IPS, 2880x1920, 13.5", 120 Hz
HP Dragonfly G4
Chi Mei CMN13C0, IPS, 1920x1280, 13.5", 60 Hz
Asus ZenBook S13 OLED UX5304
SDC417B, OLED, 2880x1800, 13.3", 60 Hz
MSI Prestige 13 AI Evo
ATNA33AA07-0, OLED, 2880x1800, 13.3", 60 Hz
Display
31%
-2%
1%
30%
31%
Display P3 Coverage
67.3
99.5
48%
65.5
-3%
68.4
2%
99.7
48%
99.9
48%
sRGB Coverage
99
100
1%
97.3
-2%
98.3
-1%
100
1%
100
1%
AdobeRGB 1998 Coverage
68.6
98.4
43%
67.7
-1%
70.4
3%
96.9
41%
97.8
43%
Response Times
93%
39%
-26%
95%
95%
Response Time Grey 50% / Grey 80% *
37.3 ?(17, 20.3)
2.6 ?(1.3, 1.3)
93%
27.3 ?(12.8, 14.5)
27%
48.8 ?(22.9, 25.9)
-31%
2 ?(1.1, 0.9)
95%
1.54 ?(0.79, 0.75)
96%
Response Time Black / White *
25.9 ?(12.5, 13.4)
2.1 ?(0.8, 1.3)
92%
12.8 ?(4.4, 8.4)
51%
31.3 ?(16.3, 15)
-21%
1.6 ?(0.8, 0.8)
94%
1.44 ?(0.73, 0.71)
94%
PWM Frequency
59.5
240 ?(57, 88)
240 ?(42)
Screen
-59%
-44%
-51%
-7%
-23%
Brightness middle
462.8
371.8
-20%
539
16%
408.8
-12%
361
-22%
404
-13%
Brightness
435
374
-14%
513
18%
399
-8%
365
-16%
407
-6%
Brightness Distribution
87
98
13%
89
2%
90
3%
98
13%
98
13%
Black Level *
0.19
0.38
-100%
0.32
-68%
Contrast
2436
1418
-42%
1278
-48%
Colorchecker dE 2000 *
1.92
2.37
-23%
1.4
27%
2.02
-5%
1.2
37%
2.1
-9%
Colorchecker dE 2000 max. *
3.45
6.1
-77%
3.5
-1%
3.84
-11%
1.9
45%
4.3
-25%
Colorchecker dE 2000 calibrated *
0.48
0.7
-46%
0.61
-27%
Greyscale dE 2000 *
0.6
2
-233%
2.2
-267%
2.3
-283%
1.2
-100%
1.2
-100%
Gamma
2.19 100%
2.29 96%
2.19 100%
2.2 100%
2.27 97%
2.16 102%
CCT
6539 99%
6261 104%
6710 97%
6203 105%
6486 100%
6465 101%
Total Average (Program / Settings)
22% / -7%
-2% / -23%
-25% / -36%
39% / 21%
34% / 13%

* ... smaller is better

vs. sRGB
vs. sRGB
vs. P3
vs. P3

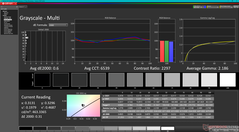
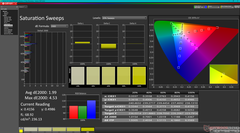
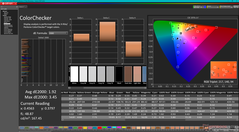
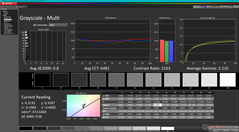
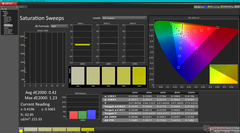
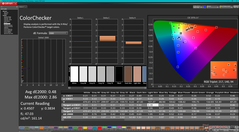
Ekran kutudan çıktığında ortalama gri tonlama ve renk deltaE değerleri sırasıyla sadece 0,6 ve 1,92 olacak şekilde önceden kalibre edilmiş olarak geliyor. Seçici olmak gerekirse, aşağıdaki ekran görüntülerimizde gösterildiği gibi, bazı renkler için DeltaE'nin 3 veya 4'e ulaşabildiği daha yüksek doygunluk seviyelerinde renkler daha doğru olabilirdi. Paneli bir X-Rite renk ölçer ile kendimiz kalibre etmek bu küçük eksikliği giderecektir, ancak bu durumda kullanıcıların çoğu için bir son kullanıcı kalibrasyonu gerekli olmamalıdır.
Kalibrasyon öncesi gri tonlama
Kalibrasyondan önce Doygunluk Taramaları
Kalibrasyondan önce ColorChecker
Kalibrasyondan sonra gri tonlama
Kalibrasyondan sonra Doygunluk Taramaları
Kalibrasyondan sonra ColorChecker

Display Response Times

Display response times show how fast the screen is able to change from one color to the next. Slow response times can lead to afterimages and can cause moving objects to appear blurry (ghosting). Gamers of fast-paced 3D titles should pay special attention to fast response times.
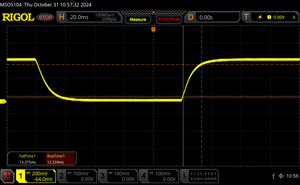
       Response Time Black to White
25.9 ms ... rise ↗ and fall ↘ combined↗ 12.5 ms rise
↘ 13.4 ms fall
The screen shows relatively slow response rates in our tests and may be too slow for gamers.
In comparison, all tested devices range from 0.1 (minimum) to 240 (maximum) ms. » 59 % of all devices are better.
This means that the measured response time is worse than the average of all tested devices (20.9 ms).
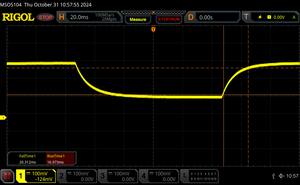
       Response Time 50% Grey to 80% Grey
37.3 ms ... rise ↗ and fall ↘ combined↗ 17 ms rise
↘ 20.3 ms fall
The screen shows slow response rates in our tests and will be unsatisfactory for gamers.
In comparison, all tested devices range from 0.165 (minimum) to 636 (maximum) ms. » 51 % of all devices are better.
This means that the measured response time is worse than the average of all tested devices (32.8 ms).

Screen Flickering / PWM (Pulse-Width Modulation)

To dim the screen, some notebooks will simply cycle the backlight on and off in rapid succession - a method called Pulse Width Modulation (PWM) . This cycling frequency should ideally be undetectable to the human eye. If said frequency is too low, users with sensitive eyes may experience strain or headaches or even notice the flickering altogether.
Screen flickering / PWM not detected

In comparison: 53 % of all tested devices do not use PWM to dim the display. If PWM was detected, an average of 8702 (minimum: 5 - maximum: 343500) Hz was measured.

Dış mekan görünürlüğü fena değil ancak yine de MacBook Air 13 dell'deki ~435 nit ile karşılaştırıldığında 500 nitin biraz üzerine çıkabilir. Mat panelimizdeki parlama OLED konfigürasyonuna göre çok daha az dikkat dağıtıcıdır, ancak parlak koşullar altında çalışırken renkler yine de soluk görünecektir.

Açık havada güneş ışığı altında
Gölge altında açık havada
Açık havada güneş ışığı altında
Geniş IPS görüntüleme açıları

Performans - Daha İstikrarlı ve Daha Güvenilir


Test Koşulları

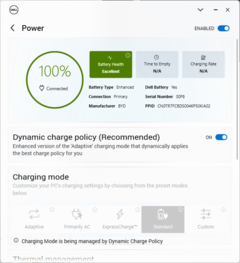
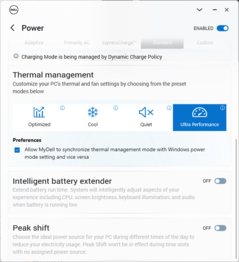
Aşağıdaki kıyaslamaları çalıştırmadan önce MyDell'i Ultra Performans moduna ayarladık. MyDell güç ayarları, diğer çoğu dizüstü bilgisayarın aksine Windows güç ayarlarıyla rahatça senkronize edilebilir. Bu, üreticinin güç ayarı Performans'a ayarlıyken Windows'un Güç Tasarrufu'na ayarlanabildiği garip senaryoları önler

MyDell ana ekranı
MyDell ana ekranı
Şarj davranışını gösteren güç ayarları menüsü
Dell güç profili ayarları

İşlemci

İşlemci performansı özellikle XPS 13 9340 ile karşılaştırıldığında ilginçtir ve Core Ultra 7 155H. Bizim Core Ultra 7 256V turbo Boost potansiyeli ve çekirdek sayısı Core Ultra 7 155H'den daha düşük olduğu için çoğu çoklu iş parçacıklı kıyaslamaya göre beklendiği gibi yüzde 20 ila 30'a kadar daha yavaş performans gösterir. Bununla birlikte, Core Ultra 7 256V'miz de XPS 9340'taki Core Ultra 7 155H'den önemli ölçüde daha az yavaşlayacaktır. Kısma hesaba katıldığında, XPS 13 9340 ve 9350 arasındaki çoklu iş parçacığı performansı, aşağıdaki CineBench R15 xT döngü testi sonuçlarımızda örneklendiği gibi neredeyse aynı hale gelir.
Core Ultra 7 155H'nin Core Ultra 7 256V'ye benzer bir performans göstermesi için en az bir düzine CineBench R15 xT çalıştırması gerektiğini belirtmek gerekir. Bu nedenle Meteor Lake-H'nin performans avantajı kısa ve orta vadede hala önemli.
Cinebench R15 Multi Loop

011523034546057569080592010351150126513801495161017251840195520702185Tooltip
Dell XPS 13 9350 Intel Core Ultra 7 256V: Ø1415 (1369.16-1569.86)
Dell XPS 13 Plus 9320 i7-1280P OLED Intel Core i7-1280P: Ø1467 (1369.16-1905.49)
Lenovo ThinkBook 13x G4 21KR0008GE Intel Core Ultra 5 125H: Ø1373 (1247-1702.49)
HP Dragonfly G4 Intel Core i7-1365U: Ø1060 (1014.74-1347.89)
Asus ZenBook S13 OLED UX5304 Intel Core i7-1355U: Ø1024 (989.63-1358.19)
MSI Prestige 13 AI Evo Intel Core Ultra 7 155H: Ø1302 (1245.56-2032.83)
Dell XPS 13 9340 Core Ultra 7 Intel Core Ultra 7 155H: Ø1635 (1358.56-2230.28)
CPU Performance Rating: Percent
Cinebench R23: Multi Core | Single Core
Cinebench R20: CPU (Multi Core) | CPU (Single Core)
Cinebench R15: CPU Multi 64Bit | CPU Single 64Bit
Blender: v2.79 BMW27 CPU
7-Zip 18.03: 7z b 4 | 7z b 4 -mmt1
Geekbench 6.3: Multi-Core | Single-Core
Geekbench 5.5: Multi-Core | Single-Core
HWBOT x265 Benchmark v2.2: 4k Preset
LibreOffice : 20 Documents To PDF
R Benchmark 2.5: Overall mean
CPU Performance Rating
Framework Laptop 13.5 Ryzen 7 7840U
AMD Ryzen 7 7840U
82.1 pt
HP EliteBook x360 1040 G11
Intel Core Ultra 7 165H
81.3 pt
Dell XPS 13 9340 Core Ultra 7
Intel Core Ultra 7 155H
79 pt
Dell XPS 13 Plus 9320 Core i7-1360P -2!
Intel Core i7-1360P
73.4 pt
Dell XPS 13 9350
Intel Core Ultra 7 256V
72.3 pt
Average Intel Core Ultra 7 256V
 
72.3 pt
Dell XPS 13 Plus 9320 i7-1280P OLED -2!
Intel Core i7-1280P
70.6 pt
MSI Prestige 13 AI Evo
Intel Core Ultra 7 155H
69.6 pt
Asus Zenbook S 14 UX5406
Intel Core Ultra 7 258V
66.3 pt
Dell XPS 13 Plus 9320 4K -2!
Intel Core i7-1260P
66.3 pt
Lenovo ThinkBook 13x G4 21KR0008GE -1!
Intel Core Ultra 5 125H
66.1 pt
Asus Zenbook S 13 OLED -2!
AMD Ryzen 7 6800U
62.9 pt
HP Dragonfly G4 -2!
Intel Core i7-1365U
61.8 pt
Asus ZenBook S13 OLED UX5304 -2!
Intel Core i7-1355U
58.1 pt
Dell XPS 13 Plus 9320 i5-1240p -2!
Intel Core i5-1240P
56.6 pt
Lenovo ThinkBook 13s G3 20YA0005GE -2!
AMD Ryzen 7 5800U
56.2 pt
Lenovo Yoga 6 13 83B2001SGE -2!
AMD Ryzen 7 7730U
55.2 pt
Dell XPS 13 9315 2-in-1 Core i5-1230U -2!
Intel Core i5-1230U
51.8 pt
Dell XPS 13 9315, i5-1230U -6!
Intel Core i5-1230U
51 pt
Cinebench R23 / Multi Core
HP EliteBook x360 1040 G11
Intel Core Ultra 7 165H
14551 (13047.9min - 14551max) Points +40%
Framework Laptop 13.5 Ryzen 7 7840U
AMD Ryzen 7 7840U
13981 (12822.5min - 13981.2max) Points +35%
Dell XPS 13 9340 Core Ultra 7
Intel Core Ultra 7 155H
13511 Points +30%
Dell XPS 13 Plus 9320 i7-1280P OLED
Intel Core i7-1280P
11852 (9209.64min - 11852max) Points +14%
Dell XPS 13 Plus 9320 Core i7-1360P
Intel Core i7-1360P
11503 (9427.43min - 11502.9max) Points +11%
Average Intel Core Ultra 7 256V
  (10391 - 10768, n=2)
10580 Points +2%
Asus Zenbook S 13 OLED
AMD Ryzen 7 6800U
10468 Points +1%
Dell XPS 13 9350
Intel Core Ultra 7 256V
10391 (9371.44min - 10390.8max) Points
MSI Prestige 13 AI Evo
Intel Core Ultra 7 155H
9769 Points -6%
Dell XPS 13 Plus 9320 4K
Intel Core i7-1260P
9743 Points -6%
Dell XPS 13 Plus 9320 i5-1240p
Intel Core i5-1240P
9392 Points -10%
Lenovo ThinkBook 13x G4 21KR0008GE
Intel Core Ultra 5 125H
9194 Points -12%
Asus Zenbook S 14 UX5406
Intel Core Ultra 7 258V
9114 Points -12%
Lenovo ThinkBook 13s G3 20YA0005GE
AMD Ryzen 7 5800U
8068 Points -22%
HP Dragonfly G4
Intel Core i7-1365U
7532 (5307.67min - 7531.78max) Points -28%
Lenovo Yoga 6 13 83B2001SGE
AMD Ryzen 7 7730U
7286 Points -30%
Dell XPS 13 9315 2-in-1 Core i5-1230U
Intel Core i5-1230U
7264 (4444.94min - 7264.12max) Points -30%
Asus ZenBook S13 OLED UX5304
Intel Core i7-1355U
7015 Points -32%
Dell XPS 13 9315, i5-1230U
Intel Core i5-1230U
4402 Points -58%
Cinebench R23 / Single Core
HP Dragonfly G4
Intel Core i7-1365U
1891 Points +1%
Average Intel Core Ultra 7 256V
  (1875 - 1902, n=2)
1889 Points +1%
Dell XPS 13 9350
Intel Core Ultra 7 256V
1875 Points
Asus Zenbook S 14 UX5406
Intel Core Ultra 7 258V
1865 Points -1%
Dell XPS 13 Plus 9320 Core i7-1360P
Intel Core i7-1360P
1848 Points -1%
HP EliteBook x360 1040 G11
Intel Core Ultra 7 165H
1759 Points -6%
Asus ZenBook S13 OLED UX5304
Intel Core i7-1355U
1730 Points -8%
Dell XPS 13 9340 Core Ultra 7
Intel Core Ultra 7 155H
1685 Points -10%
Dell XPS 13 Plus 9320 4K
Intel Core i7-1260P
1678 Points -11%
MSI Prestige 13 AI Evo
Intel Core Ultra 7 155H
1671 Points -11%
Framework Laptop 13.5 Ryzen 7 7840U
AMD Ryzen 7 7840U
1647 Points -12%
Dell XPS 13 Plus 9320 i5-1240p
Intel Core i5-1240P
1621 Points -14%
Dell XPS 13 Plus 9320 i7-1280P OLED
Intel Core i7-1280P
1615 Points -14%
Lenovo ThinkBook 13x G4 21KR0008GE
Intel Core Ultra 5 125H
1549 Points -17%
Dell XPS 13 9315 2-in-1 Core i5-1230U
Intel Core i5-1230U
1512 Points -19%
Asus Zenbook S 13 OLED
AMD Ryzen 7 6800U
1488 Points -21%
Lenovo ThinkBook 13s G3 20YA0005GE
AMD Ryzen 7 5800U
1430 Points -24%
Lenovo Yoga 6 13 83B2001SGE
AMD Ryzen 7 7730U
1335 Points -29%
Dell XPS 13 9315, i5-1230U
Intel Core i5-1230U
1310 Points -30%
Cinebench R20 / CPU (Multi Core)
HP EliteBook x360 1040 G11
Intel Core Ultra 7 165H
5545 Points +37%
Framework Laptop 13.5 Ryzen 7 7840U
AMD Ryzen 7 7840U
5425 Points +34%
Dell XPS 13 9340 Core Ultra 7
Intel Core Ultra 7 155H
5181 Points +28%
Dell XPS 13 Plus 9320 i7-1280P OLED
Intel Core i7-1280P
4571 Points +13%
Dell XPS 13 Plus 9320 Core i7-1360P
Intel Core i7-1360P
4424 Points +10%
Average Intel Core Ultra 7 256V
  (4038 - 4162, n=2)
4100 Points +2%
Asus Zenbook S 13 OLED
AMD Ryzen 7 6800U
4060 Points +1%
Dell XPS 13 9350
Intel Core Ultra 7 256V
4038 Points
Dell XPS 13 Plus 9320 4K
Intel Core i7-1260P
3909 Points -3%
MSI Prestige 13 AI Evo
Intel Core Ultra 7 155H
3798 Points -6%
Lenovo ThinkBook 13x G4 21KR0008GE
Intel Core Ultra 5 125H
3673 Points -9%
Asus Zenbook S 14 UX5406
Intel Core Ultra 7 258V
3530 Points -13%
Dell XPS 13 Plus 9320 i5-1240p
Intel Core i5-1240P
3424 Points -15%
Lenovo ThinkBook 13s G3 20YA0005GE
AMD Ryzen 7 5800U
2995 Points -26%
HP Dragonfly G4
Intel Core i7-1365U
2902 Points -28%
Lenovo Yoga 6 13 83B2001SGE
AMD Ryzen 7 7730U
2849 Points -29%
Asus ZenBook S13 OLED UX5304
Intel Core i7-1355U
2849 Points -29%
Dell XPS 13 9315 2-in-1 Core i5-1230U
Intel Core i5-1230U
2802 Points -31%
Dell XPS 13 9315, i5-1230U
Intel Core i5-1230U
1653 Points -59%
Cinebench R20 / CPU (Single Core)
Average Intel Core Ultra 7 256V
  (720 - 727, n=2)
724 Points +1%
Dell XPS 13 9350
Intel Core Ultra 7 256V
720 Points
Dell XPS 13 Plus 9320 Core i7-1360P
Intel Core i7-1360P
707 Points -2%
HP Dragonfly G4
Intel Core i7-1365U
703 Points -2%
HP EliteBook x360 1040 G11
Intel Core Ultra 7 165H
683 Points -5%
Asus ZenBook S13 OLED UX5304
Intel Core i7-1355U
679 Points -6%
Dell XPS 13 9340 Core Ultra 7
Intel Core Ultra 7 155H
656 Points -9%
Lenovo ThinkBook 13x G4 21KR0008GE
Intel Core Ultra 5 125H
655 Points -9%
Framework Laptop 13.5 Ryzen 7 7840U
AMD Ryzen 7 7840U
651 Points -10%
Dell XPS 13 Plus 9320 4K
Intel Core i7-1260P
648 Points -10%
Asus Zenbook S 14 UX5406
Intel Core Ultra 7 258V
643 Points -11%
MSI Prestige 13 AI Evo
Intel Core Ultra 7 155H
632 Points -12%
Dell XPS 13 Plus 9320 i7-1280P OLED
Intel Core i7-1280P
622 Points -14%
Dell XPS 13 Plus 9320 i5-1240p
Intel Core i5-1240P
616 Points -14%
Dell XPS 13 9315 2-in-1 Core i5-1230U
Intel Core i5-1230U
580 Points -19%
Asus Zenbook S 13 OLED
AMD Ryzen 7 6800U
564 Points -22%
Lenovo ThinkBook 13s G3 20YA0005GE
AMD Ryzen 7 5800U
560 Points -22%
Lenovo Yoga 6 13 83B2001SGE
AMD Ryzen 7 7730U
533 Points -26%
Dell XPS 13 9315, i5-1230U
Intel Core i5-1230U
469 Points -35%
Cinebench R15 / CPU Multi 64Bit
HP EliteBook x360 1040 G11
Intel Core Ultra 7 165H
2467 (1713.06min - 2466.7max) Points +57%
Dell XPS 13 9340 Core Ultra 7
Intel Core Ultra 7 155H
2230 (1358.56min - 2230.28max) Points +42%
Framework Laptop 13.5 Ryzen 7 7840U
AMD Ryzen 7 7840U
2205 (2124.16min - 2204.83max) Points +40%
MSI Prestige 13 AI Evo
Intel Core Ultra 7 155H
2033 (1245.56min - 2032.83max) Points +29%
Dell XPS 13 Plus 9320 Core i7-1360P
Intel Core i7-1360P
1951 (1397.72min - 1950.55max) Points +24%
Lenovo ThinkBook 13s G3 20YA0005GE
AMD Ryzen 7 5800U
1925 Points +23%
Lenovo ThinkBook 13s G3 20YA0005GE
AMD Ryzen 7 5800U
1691 Points +8%
Dell XPS 13 Plus 9320 i7-1280P OLED
Intel Core i7-1280P
1905 (1369.16min - 1905.49max) Points +21%
Asus Zenbook S 13 OLED
AMD Ryzen 7 6800U
1742 Points +11%
Lenovo ThinkBook 13x G4 21KR0008GE
Intel Core Ultra 5 125H
1702 (1247min - 1702.49max) Points +8%
Dell XPS 13 Plus 9320 4K
Intel Core i7-1260P
1677 (1481.98min - 1677.36max) Points +7%
Dell XPS 13 Plus 9320 4K
Intel Core i7-1260P
1626 (983.94min - 1625.95max) Points +4%
Dell XPS 13 Plus 9320 i5-1240p
Intel Core i5-1240P
1592 Points +1%
Lenovo Yoga 6 13 83B2001SGE
AMD Ryzen 7 7730U
1588 (1265.06min - 1588.12max) Points +1%
Dell XPS 13 9350
Intel Core Ultra 7 256V
1570 (1369.16min - 1569.86max) Points
Average Intel Core Ultra 7 256V
  ()
1570 Points 0%
Asus Zenbook S 14 UX5406
Intel Core Ultra 7 258V
1550 (1108.49min - 1550.27max) Points -1%
Asus ZenBook S13 OLED UX5304
Intel Core i7-1355U
1358 (989.63min - 1358.19max) Points -14%
HP Dragonfly G4
Intel Core i7-1365U
1348 (1014.74min - 1347.89max) Points -14%
Dell XPS 13 9315 2-in-1 Core i5-1230U
Intel Core i5-1230U
1254 (632min - 1254.35max) Points -20%
Dell XPS 13 9315, i5-1230U
Intel Core i5-1230U
514 (482min - 513.59max) Points -67%
Cinebench R15 / CPU Single 64Bit
Dell XPS 13 9350
Intel Core Ultra 7 256V
285 Points
Average Intel Core Ultra 7 256V
  ()
285 Points 0%
Dell XPS 13 Plus 9320 Core i7-1360P
Intel Core i7-1360P
263 Points -8%
HP Dragonfly G4
Intel Core i7-1365U
261 Points -8%
Asus Zenbook S 14 UX5406
Intel Core Ultra 7 258V
258 Points -9%
HP EliteBook x360 1040 G11
Intel Core Ultra 7 165H
257 Points -10%
Dell XPS 13 9340 Core Ultra 7
Intel Core Ultra 7 155H
253 Points -11%
Framework Laptop 13.5 Ryzen 7 7840U
AMD Ryzen 7 7840U
249 Points -13%
Lenovo ThinkBook 13x G4 21KR0008GE
Intel Core Ultra 5 125H
247 Points -13%
Asus ZenBook S13 OLED UX5304
Intel Core i7-1355U
245 Points -14%
MSI Prestige 13 AI Evo
Intel Core Ultra 7 155H
242 Points -15%
Dell XPS 13 Plus 9320 4K
Intel Core i7-1260P
240 Points -16%
Asus Zenbook S 13 OLED
AMD Ryzen 7 6800U
237 Points -17%
Lenovo ThinkBook 13s G3 20YA0005GE
AMD Ryzen 7 5800U
229 Points -20%
Dell XPS 13 Plus 9320 i7-1280P OLED
Intel Core i7-1280P
229 Points -20%
Dell XPS 13 Plus 9320 i5-1240p
Intel Core i5-1240P
226 Points -21%
Dell XPS 13 9315 2-in-1 Core i5-1230U
Intel Core i5-1230U
221 Points -22%
Lenovo Yoga 6 13 83B2001SGE
AMD Ryzen 7 7730U
221 Points -22%
Dell XPS 13 9315, i5-1230U
Intel Core i5-1230U
186.8 Points -34%
Blender / v2.79 BMW27 CPU
Dell XPS 13 9315 2-in-1 Core i5-1230U
Intel Core i5-1230U
503 Seconds * -48%
Asus ZenBook S13 OLED UX5304
Intel Core i7-1355U
450 Seconds * -33%
Asus ZenBook S13 OLED UX5304
Intel Core i7-1355U
448 Seconds * -32%
HP Dragonfly G4
Intel Core i7-1365U
430 Seconds * -27%
Asus Zenbook S 14 UX5406
Intel Core Ultra 7 258V
414 Seconds * -22%
Lenovo ThinkBook 13s G3 20YA0005GE
AMD Ryzen 7 5800U
391 Seconds * -15%
Lenovo Yoga 6 13 83B2001SGE
AMD Ryzen 7 7730U
374 Seconds * -10%
Dell XPS 13 Plus 9320 i5-1240p
Intel Core i5-1240P
369 Seconds * -9%
Lenovo ThinkBook 13x G4 21KR0008GE
Intel Core Ultra 5 125H
357 Seconds * -5%
MSI Prestige 13 AI Evo
Intel Core Ultra 7 155H
349 Seconds * -3%
Dell XPS 13 9350
Intel Core Ultra 7 256V
339 Seconds *
Average Intel Core Ultra 7 256V
  (324 - 339, n=2)
332 Seconds * +2%
Dell XPS 13 Plus 9320 4K
Intel Core i7-1260P
319 Seconds * +6%
Asus Zenbook S 13 OLED
AMD Ryzen 7 6800U
310 Seconds * +9%
Dell XPS 13 Plus 9320 Core i7-1360P
Intel Core i7-1360P
279 Seconds * +18%
Dell XPS 13 Plus 9320 i7-1280P OLED
Intel Core i7-1280P
268 Seconds * +21%
Dell XPS 13 9340 Core Ultra 7
Intel Core Ultra 7 155H
243 Seconds * +28%
HP EliteBook x360 1040 G11
Intel Core Ultra 7 165H
231 Seconds * +32%
Framework Laptop 13.5 Ryzen 7 7840U
AMD Ryzen 7 7840U
230 Seconds * +32%
7-Zip 18.03 / 7z b 4
Framework Laptop 13.5 Ryzen 7 7840U
AMD Ryzen 7 7840U
61902 MIPS +72%
Dell XPS 13 9340 Core Ultra 7
Intel Core Ultra 7 155H
58233 MIPS +62%
HP EliteBook x360 1040 G11
Intel Core Ultra 7 165H
56997 MIPS +59%
Dell XPS 13 Plus 9320 i7-1280P OLED
Intel Core i7-1280P
49572 MIPS +38%
Dell XPS 13 Plus 9320 Core i7-1360P
Intel Core i7-1360P
47737 MIPS +33%
Asus Zenbook S 13 OLED
AMD Ryzen 7 6800U
47500 MIPS +32%
Dell XPS 13 Plus 9320 4K
Intel Core i7-1260P
43056 MIPS +20%
MSI Prestige 13 AI Evo
Intel Core Ultra 7 155H
42601 MIPS +19%
Dell XPS 13 Plus 9320 i5-1240p
Intel Core i5-1240P
40777 MIPS +13%
Lenovo Yoga 6 13 83B2001SGE
AMD Ryzen 7 7730U
40263 MIPS +12%
Lenovo ThinkBook 13s G3 20YA0005GE
AMD Ryzen 7 5800U
39618 MIPS +10%
Average Intel Core Ultra 7 256V
  (35950 - 35978, n=2)
35964 MIPS 0%
Dell XPS 13 9350
Intel Core Ultra 7 256V
35950 MIPS
Dell XPS 13 9315 2-in-1 Core i5-1230U
Intel Core i5-1230U
34505 MIPS -4%
HP Dragonfly G4
Intel Core i7-1365U
33476 MIPS -7%
Asus Zenbook S 14 UX5406
Intel Core Ultra 7 258V
32198 MIPS -10%
Asus ZenBook S13 OLED UX5304
Intel Core i7-1355U
31233 MIPS -13%
Dell XPS 13 9315, i5-1230U
Intel Core i5-1230U
20092 MIPS -44%
7-Zip 18.03 / 7z b 4 -mmt1
Framework Laptop 13.5 Ryzen 7 7840U
AMD Ryzen 7 7840U
6408 MIPS +12%
HP Dragonfly G4
Intel Core i7-1365U
5835 MIPS +2%
Dell XPS 13 9350
Intel Core Ultra 7 256V
5727 MIPS
Asus ZenBook S13 OLED UX5304
Intel Core i7-1355U
5689 MIPS -1%
Average Intel Core Ultra 7 256V
  (5616 - 5727, n=2)
5672 MIPS -1%
Asus Zenbook S 14 UX5406
Intel Core Ultra 7 258V
5551 MIPS -3%
Dell XPS 13 Plus 9320 Core i7-1360P
Intel Core i7-1360P
5526 MIPS -4%
MSI Prestige 13 AI Evo
Intel Core Ultra 7 155H
5458 MIPS -5%
Asus Zenbook S 13 OLED
AMD Ryzen 7 6800U
5431 MIPS -5%
Dell XPS 13 9340 Core Ultra 7
Intel Core Ultra 7 155H
5410 MIPS -6%
Dell XPS 13 Plus 9320 4K
Intel Core i7-1260P
5325 MIPS -7%
Lenovo ThinkBook 13s G3 20YA0005GE
AMD Ryzen 7 5800U
5285 MIPS -8%
HP EliteBook x360 1040 G11
Intel Core Ultra 7 165H
5273 MIPS -8%
Lenovo Yoga 6 13 83B2001SGE
AMD Ryzen 7 7730U
5222 MIPS -9%
Lenovo ThinkBook 13x G4 21KR0008GE
Intel Core Ultra 5 125H
5082 MIPS -11%
Dell XPS 13 Plus 9320 i7-1280P OLED
Intel Core i7-1280P
4995 MIPS -13%
Dell XPS 13 9315 2-in-1 Core i5-1230U
Intel Core i5-1230U
4870 MIPS -15%
Dell XPS 13 Plus 9320 i5-1240p
Intel Core i5-1240P
4791 MIPS -16%
Dell XPS 13 9315, i5-1230U
Intel Core i5-1230U
3873 MIPS -32%
Geekbench 6.3 / Multi-Core
HP EliteBook x360 1040 G11
Intel Core Ultra 7 165H
12265 Points +12%
Dell XPS 13 9340 Core Ultra 7
Intel Core Ultra 7 155H
11982 Points +9%
Framework Laptop 13.5 Ryzen 7 7840U
AMD Ryzen 7 7840U
11489 Points +5%
Lenovo ThinkBook 13x G4 21KR0008GE
Intel Core Ultra 5 125H
11192 Points +2%
Dell XPS 13 9350
Intel Core Ultra 7 256V
10972 Points
Asus Zenbook S 14 UX5406
Intel Core Ultra 7 258V
10730 Points -2%
MSI Prestige 13 AI Evo
Intel Core Ultra 7 155H
10696 Points -3%
Average Intel Core Ultra 7 256V
  (9852 - 10972, n=3)
10592 Points -3%
Geekbench 6.3 / Single-Core
Dell XPS 13 9350
Intel Core Ultra 7 256V
2778 Points
Average Intel Core Ultra 7 256V
  (2680 - 2784, n=3)
2747 Points -1%
Asus Zenbook S 14 UX5406
Intel Core Ultra 7 258V
2679 Points -4%
Framework Laptop 13.5 Ryzen 7 7840U
AMD Ryzen 7 7840U
2553 Points -8%
MSI Prestige 13 AI Evo
Intel Core Ultra 7 155H
2441 Points -12%
HP EliteBook x360 1040 G11
Intel Core Ultra 7 165H
2437 Points -12%
Dell XPS 13 9340 Core Ultra 7
Intel Core Ultra 7 155H
2408 Points -13%
Lenovo ThinkBook 13x G4 21KR0008GE
Intel Core Ultra 5 125H
2279 Points -18%
Geekbench 5.5 / Multi-Core
HP EliteBook x360 1040 G11
Intel Core Ultra 7 165H
12204 Points +31%
Dell XPS 13 Plus 9320 i7-1280P OLED
Intel Core i7-1280P
11434 Points +23%
Dell XPS 13 9340 Core Ultra 7
Intel Core Ultra 7 155H
11279 Points +21%
Dell XPS 13 Plus 9320 Core i7-1360P
Intel Core i7-1360P
10817 Points +16%
Framework Laptop 13.5 Ryzen 7 7840U
AMD Ryzen 7 7840U
10558 Points +14%
Lenovo ThinkBook 13x G4 21KR0008GE
Intel Core Ultra 5 125H
10309 Points +11%
MSI Prestige 13 AI Evo
Intel Core Ultra 7 155H
10017 Points +8%
Dell XPS 13 Plus 9320 4K
Intel Core i7-1260P
9817 Points +6%
Average Intel Core Ultra 7 256V
  (9302 - 9618, n=2)
9460 Points +2%
Asus Zenbook S 14 UX5406
Intel Core Ultra 7 258V
9330 Points 0%
Dell XPS 13 9350
Intel Core Ultra 7 256V
9302 Points
HP Dragonfly G4
Intel Core i7-1365U
8778 Points -6%
Asus ZenBook S13 OLED UX5304
Intel Core i7-1355U
8117 Points -13%
Asus Zenbook S 13 OLED
AMD Ryzen 7 6800U
7613 Points -18%
Lenovo Yoga 6 13 83B2001SGE
AMD Ryzen 7 7730U
7423 Points -20%
Dell XPS 13 9315 2-in-1 Core i5-1230U
Intel Core i5-1230U
7309 Points -21%
Lenovo ThinkBook 13s G3 20YA0005GE
AMD Ryzen 7 5800U
6995 Points -25%
Dell XPS 13 9315, i5-1230U
Intel Core i5-1230U
6755 Points -27%
Dell XPS 13 Plus 9320 i5-1240p
Intel Core i5-1240P
4286 Points -54%
Geekbench 5.5 / Single-Core
Dell XPS 13 9350
Intel Core Ultra 7 256V
2010 Points
Average Intel Core Ultra 7 256V
  (1972 - 2010, n=2)
1991 Points -1%
Asus Zenbook S 14 UX5406
Intel Core Ultra 7 258V
1956 Points -3%
Framework Laptop 13.5 Ryzen 7 7840U
AMD Ryzen 7 7840U
1912 Points -5%
HP Dragonfly G4
Intel Core i7-1365U
1902 Points -5%
Dell XPS 13 Plus 9320 Core i7-1360P
Intel Core i7-1360P
1825 Points -9%
HP EliteBook x360 1040 G11
Intel Core Ultra 7 165H
1806 Points -10%
Dell XPS 13 Plus 9320 i7-1280P OLED
Intel Core i7-1280P
1802 Points -10%
Asus ZenBook S13 OLED UX5304
Intel Core i7-1355U
1775 Points -12%
Dell XPS 13 9340 Core Ultra 7
Intel Core Ultra 7 155H
1775 Points -12%
MSI Prestige 13 AI Evo
Intel Core Ultra 7 155H
1771 Points -12%
Dell XPS 13 Plus 9320 4K
Intel Core i7-1260P
1723 Points -14%
Lenovo ThinkBook 13x G4 21KR0008GE
Intel Core Ultra 5 125H
1684 Points -16%
Dell XPS 13 9315, i5-1230U
Intel Core i5-1230U
1640 Points -18%
Dell XPS 13 Plus 9320 i5-1240p
Intel Core i5-1240P
1588 Points -21%
Dell XPS 13 9315 2-in-1 Core i5-1230U
Intel Core i5-1230U
1529 Points -24%
Asus Zenbook S 13 OLED
AMD Ryzen 7 6800U
1514 Points -25%
Lenovo Yoga 6 13 83B2001SGE
AMD Ryzen 7 7730U
1471 Points -27%
Lenovo ThinkBook 13s G3 20YA0005GE
AMD Ryzen 7 5800U
1436 Points -29%
HWBOT x265 Benchmark v2.2 / 4k Preset
Framework Laptop 13.5 Ryzen 7 7840U
AMD Ryzen 7 7840U
17.4 fps +33%
HP EliteBook x360 1040 G11
Intel Core Ultra 7 165H
16 fps +22%
Dell XPS 13 9340 Core Ultra 7
Intel Core Ultra 7 155H
15.5 fps +18%
Dell XPS 13 Plus 9320 i7-1280P OLED
Intel Core i7-1280P
13.8 fps +5%
Average Intel Core Ultra 7 256V
  (13.1 - 13.5, n=2)
13.3 fps +2%
Dell XPS 13 Plus 9320 Core i7-1360P
Intel Core i7-1360P
13.2 fps +1%
Dell XPS 13 9350
Intel Core Ultra 7 256V
13.1 fps
Asus Zenbook S 13 OLED
AMD Ryzen 7 6800U
12.6 fps -4%
Dell XPS 13 Plus 9320 4K
Intel Core i7-1260P
11.8 fps -10%
Dell XPS 13 Plus 9320 i5-1240p
Intel Core i5-1240P
11.5 fps -12%
Asus Zenbook S 14 UX5406
Intel Core Ultra 7 258V
10.5 fps -20%
MSI Prestige 13 AI Evo
Intel Core Ultra 7 155H
10.4 fps -21%
Lenovo Yoga 6 13 83B2001SGE
AMD Ryzen 7 7730U
9.91 fps -24%
Lenovo ThinkBook 13x G4 21KR0008GE
Intel Core Ultra 5 125H
9.7 fps -26%
Lenovo ThinkBook 13s G3 20YA0005GE
AMD Ryzen 7 5800U
9.68 fps -26%
HP Dragonfly G4
Intel Core i7-1365U
8.61 fps -34%
Dell XPS 13 9315 2-in-1 Core i5-1230U
Intel Core i5-1230U
8.33 fps -36%
Asus ZenBook S13 OLED UX5304
Intel Core i7-1355U
7.83 fps -40%
LibreOffice / 20 Documents To PDF
Dell XPS 13 Plus 9320 i5-1240p
Intel Core i5-1240P
61.8 s * -16%
Asus Zenbook S 14 UX5406
Intel Core Ultra 7 258V
59.3 s * -11%
HP EliteBook x360 1040 G11
Intel Core Ultra 7 165H
54.8 s * -3%
Average Intel Core Ultra 7 256V
  (53.2 - 55.6, n=2)
54.4 s * -2%
Asus Zenbook S 13 OLED
AMD Ryzen 7 6800U
54.1 s * -2%
Dell XPS 13 9350
Intel Core Ultra 7 256V
53.2 s *
Dell XPS 13 9315 2-in-1 Core i5-1230U
Intel Core i5-1230U
51.2 s * +4%
Lenovo ThinkBook 13s G3 20YA0005GE
AMD Ryzen 7 5800U
50.9 s * +4%
Dell XPS 13 Plus 9320 i7-1280P OLED
Intel Core i7-1280P
49.2 s * +8%
Lenovo ThinkBook 13x G4 21KR0008GE
Intel Core Ultra 5 125H
49.2 s * +8%
Lenovo Yoga 6 13 83B2001SGE
AMD Ryzen 7 7730U
48.4 s * +9%
Dell XPS 13 9340 Core Ultra 7
Intel Core Ultra 7 155H
47.8 s * +10%
Asus ZenBook S13 OLED UX5304
Intel Core i7-1355U
47.5 s * +11%
Dell XPS 13 Plus 9320 Core i7-1360P
Intel Core i7-1360P
46.5 s * +13%
HP Dragonfly G4
Intel Core i7-1365U
45.3 s * +15%
Dell XPS 13 Plus 9320 4K
Intel Core i7-1260P
44.6 s * +16%
Framework Laptop 13.5 Ryzen 7 7840U
AMD Ryzen 7 7840U
44.1 s * +17%
MSI Prestige 13 AI Evo
Intel Core Ultra 7 155H
43.5 s * +18%
R Benchmark 2.5 / Overall mean
Lenovo ThinkBook 13s G3 20YA0005GE
AMD Ryzen 7 5800U
0.546 sec * -19%
Lenovo Yoga 6 13 83B2001SGE
AMD Ryzen 7 7730U
0.543 sec * -19%
Asus Zenbook S 13 OLED
AMD Ryzen 7 6800U
0.529 sec * -16%
Dell XPS 13 9315 2-in-1 Core i5-1230U
Intel Core i5-1230U
0.527 sec * -15%
Dell XPS 13 Plus 9320 i5-1240p
Intel Core i5-1240P
0.524 sec * -14%
Lenovo ThinkBook 13x G4 21KR0008GE
Intel Core Ultra 5 125H
0.503 sec * -10%
Dell XPS 13 Plus 9320 i7-1280P OLED
Intel Core i7-1280P
0.4998 sec * -9%
Dell XPS 13 Plus 9320 4K
Intel Core i7-1260P
0.4928 sec * -8%
Dell XPS 13 9340 Core Ultra 7
Intel Core Ultra 7 155H
0.4829 sec * -5%
Asus ZenBook S13 OLED UX5304
Intel Core i7-1355U
0.469 sec * -2%
HP EliteBook x360 1040 G11
Intel Core Ultra 7 165H
0.4686 sec * -2%
Dell XPS 13 Plus 9320 Core i7-1360P
Intel Core i7-1360P
0.4675 sec * -2%
MSI Prestige 13 AI Evo
Intel Core Ultra 7 155H
0.4629 sec * -1%
Average Intel Core Ultra 7 256V
  (0.4578 - 0.4645, n=2)
0.4612 sec * -1%
Asus Zenbook S 14 UX5406
Intel Core Ultra 7 258V
0.4593 sec * -0%
HP Dragonfly G4
Intel Core i7-1365U
0.4586 sec * -0%
Dell XPS 13 9350
Intel Core Ultra 7 256V
0.4578 sec *
Framework Laptop 13.5 Ryzen 7 7840U
AMD Ryzen 7 7840U
0.456 sec * -0%
CPU Performance Rating: Percent
Cinebench R23: Multi Core | Single Core
Cinebench R20: CPU (Multi Core) | CPU (Single Core)
Cinebench R15: CPU Multi 64Bit | CPU Single 64Bit
Blender: v2.79 BMW27 CPU
7-Zip 18.03: 7z b 4 | 7z b 4 -mmt1
Geekbench 6.3: Multi-Core | Single-Core
Geekbench 5.5: Multi-Core | Single-Core
HWBOT x265 Benchmark v2.2: 4k Preset
LibreOffice : 20 Documents To PDF
R Benchmark 2.5: Overall mean

* ... smaller is better

Cinebench R15 CPU Multi 64Bit
1570 Points
Cinebench R15 OpenGL 64Bit
170.5 fps
Cinebench R15 Ref. Match 64Bit
97.8 %
Cinebench R15 CPU Single 64Bit
285 Points
Cinebench R20 CPU (Multi Core)
4038 Points
Cinebench R20 CPU (Single Core)
720 Points
Cinebench R23 Single Core
1875 Points
Cinebench R23 Multi Core
10391 Points
Cinebench 2024 CPU Multi Core
582 Points
Cinebench 2024 CPU Single Core
117.4 Points
Yardım
Performance Rating
Dell XPS 13 Plus 9320 i7-1280P OLED
Intel Core i7-1280P, Iris Xe G7 96EUs
93.9 pt
Average Intel Core Ultra 7 256V
 
86.6 pt
Dell XPS 13 9350
Intel Core Ultra 7 256V, Arc 140V
85.4 pt
Lenovo ThinkBook 13x G4 21KR0008GE
Intel Core Ultra 5 125H, Arc 7-Core
78.3 pt
MSI Prestige 13 AI Evo
Intel Core Ultra 7 155H, Arc 8-Core
71.2 pt
HP Dragonfly G4
Intel Core i7-1365U, Iris Xe G7 96EUs
62.1 pt
Asus ZenBook S13 OLED UX5304
Intel Core i7-1355U, Iris Xe G7 96EUs
58 pt
AIDA64 / FP32 Ray-Trace
Average Intel Core Ultra 7 256V
  (12287 - 12812, n=2)
12550 KRay/s +2%
Dell XPS 13 9350
Intel Core Ultra 7 256V, Arc 140V
12287 KRay/s
Dell XPS 13 Plus 9320 i7-1280P OLED
Intel Core i7-1280P, Iris Xe G7 96EUs
10787 KRay/s -12%
Lenovo ThinkBook 13x G4 21KR0008GE
Intel Core Ultra 5 125H, Arc 7-Core
8430 KRay/s -31%
HP Dragonfly G4
Intel Core i7-1365U, Iris Xe G7 96EUs
6720 KRay/s -45%
MSI Prestige 13 AI Evo
Intel Core Ultra 7 155H, Arc 8-Core
6670 KRay/s -46%
Asus ZenBook S13 OLED UX5304
Intel Core i7-1355U, Iris Xe G7 96EUs
5981 KRay/s -51%
AIDA64 / FPU Julia
Dell XPS 13 9350
Intel Core Ultra 7 256V, Arc 140V
61131 Points
Average Intel Core Ultra 7 256V
  (60345 - 61131, n=2)
60738 Points -1%
Dell XPS 13 Plus 9320 i7-1280P OLED
Intel Core i7-1280P, Iris Xe G7 96EUs
56649 Points -7%
MSI Prestige 13 AI Evo
Intel Core Ultra 7 155H, Arc 8-Core
45123 Points -26%
Lenovo ThinkBook 13x G4 21KR0008GE
Intel Core Ultra 5 125H, Arc 7-Core
44947 Points -26%
HP Dragonfly G4
Intel Core i7-1365U, Iris Xe G7 96EUs
33777 Points -45%
Asus ZenBook S13 OLED UX5304
Intel Core i7-1355U, Iris Xe G7 96EUs
31092 Points -49%
AIDA64 / CPU SHA3
Average Intel Core Ultra 7 256V
  (2713 - 2814, n=2)
2764 MB/s +2%
Dell XPS 13 9350
Intel Core Ultra 7 256V, Arc 140V
2713 MB/s
Dell XPS 13 Plus 9320 i7-1280P OLED
Intel Core i7-1280P, Iris Xe G7 96EUs
2683 MB/s -1%
Lenovo ThinkBook 13x G4 21KR0008GE
Intel Core Ultra 5 125H, Arc 7-Core
2047 MB/s -25%
MSI Prestige 13 AI Evo
Intel Core Ultra 7 155H, Arc 8-Core
2039 MB/s -25%
HP Dragonfly G4
Intel Core i7-1365U, Iris Xe G7 96EUs
1754 MB/s -35%
Asus ZenBook S13 OLED UX5304
Intel Core i7-1355U, Iris Xe G7 96EUs
1632 MB/s -40%
AIDA64 / CPU Queen
Dell XPS 13 Plus 9320 i7-1280P OLED
Intel Core i7-1280P, Iris Xe G7 96EUs
94234 Points +90%
Lenovo ThinkBook 13x G4 21KR0008GE
Intel Core Ultra 5 125H, Arc 7-Core
79986 Points +61%
HP Dragonfly G4
Intel Core i7-1365U, Iris Xe G7 96EUs
69991 Points +41%
Asus ZenBook S13 OLED UX5304
Intel Core i7-1355U, Iris Xe G7 96EUs
66531 Points +34%
MSI Prestige 13 AI Evo
Intel Core Ultra 7 155H, Arc 8-Core
64698 Points +30%
Average Intel Core Ultra 7 256V
  (49622 - 49794, n=2)
49708 Points 0%
Dell XPS 13 9350
Intel Core Ultra 7 256V, Arc 140V
49622 Points
AIDA64 / FPU SinJulia
Dell XPS 13 Plus 9320 i7-1280P OLED
Intel Core i7-1280P, Iris Xe G7 96EUs
7547 Points +70%
Lenovo ThinkBook 13x G4 21KR0008GE
Intel Core Ultra 5 125H, Arc 7-Core
6588 Points +49%
MSI Prestige 13 AI Evo
Intel Core Ultra 7 155H, Arc 8-Core
5639 Points +27%
HP Dragonfly G4
Intel Core i7-1365U, Iris Xe G7 96EUs
4589 Points +4%
Dell XPS 13 9350
Intel Core Ultra 7 256V, Arc 140V
4428 Points
Average Intel Core Ultra 7 256V
  (4425 - 4428, n=2)
4427 Points 0%
Asus ZenBook S13 OLED UX5304
Intel Core i7-1355U, Iris Xe G7 96EUs
4216 Points -5%
AIDA64 / FPU Mandel
Dell XPS 13 9350
Intel Core Ultra 7 256V, Arc 140V
32410 Points
Average Intel Core Ultra 7 256V
  (32020 - 32410, n=2)
32215 Points -1%
Dell XPS 13 Plus 9320 i7-1280P OLED
Intel Core i7-1280P, Iris Xe G7 96EUs
26694 Points -18%
MSI Prestige 13 AI Evo
Intel Core Ultra 7 155H, Arc 8-Core
21671 Points -33%
Lenovo ThinkBook 13x G4 21KR0008GE
Intel Core Ultra 5 125H, Arc 7-Core
21210 Points -35%
HP Dragonfly G4
Intel Core i7-1365U, Iris Xe G7 96EUs
16808 Points -48%
Asus ZenBook S13 OLED UX5304
Intel Core i7-1355U, Iris Xe G7 96EUs
15222 Points -53%
AIDA64 / CPU AES
Dell XPS 13 Plus 9320 i7-1280P OLED
Intel Core i7-1280P, Iris Xe G7 96EUs
54261 MB/s +33%
Lenovo ThinkBook 13x G4 21KR0008GE
Intel Core Ultra 5 125H, Arc 7-Core
48373 MB/s +18%
MSI Prestige 13 AI Evo
Intel Core Ultra 7 155H, Arc 8-Core
46211 MB/s +13%
Dell XPS 13 9350
Intel Core Ultra 7 256V, Arc 140V
40828 MB/s
Average Intel Core Ultra 7 256V
  (40415 - 40828, n=2)
40622 MB/s -1%
HP Dragonfly G4
Intel Core i7-1365U, Iris Xe G7 96EUs
34968 MB/s -14%
Asus ZenBook S13 OLED UX5304
Intel Core i7-1355U, Iris Xe G7 96EUs
32647 MB/s -20%
AIDA64 / CPU ZLib
Dell XPS 13 Plus 9320 i7-1280P OLED
Intel Core i7-1280P, Iris Xe G7 96EUs
725 MB/s +35%
Lenovo ThinkBook 13x G4 21KR0008GE
Intel Core Ultra 5 125H, Arc 7-Core
612 MB/s +14%
Average Intel Core Ultra 7 256V
  (536 - 632, n=2)
584 MB/s +9%
MSI Prestige 13 AI Evo
Intel Core Ultra 7 155H, Arc 8-Core
582 MB/s +9%
Dell XPS 13 9350
Intel Core Ultra 7 256V, Arc 140V
536 MB/s
HP Dragonfly G4
Intel Core i7-1365U, Iris Xe G7 96EUs
519 MB/s -3%
Asus ZenBook S13 OLED UX5304
Intel Core i7-1355U, Iris Xe G7 96EUs
488 MB/s -9%
AIDA64 / FP64 Ray-Trace
Average Intel Core Ultra 7 256V
  (6506 - 6832, n=2)
6669 KRay/s +3%
Dell XPS 13 9350
Intel Core Ultra 7 256V, Arc 140V
6506 KRay/s
Dell XPS 13 Plus 9320 i7-1280P OLED
Intel Core i7-1280P, Iris Xe G7 96EUs
5993 KRay/s -8%
Lenovo ThinkBook 13x G4 21KR0008GE
Intel Core Ultra 5 125H, Arc 7-Core
4421 KRay/s -32%
MSI Prestige 13 AI Evo
Intel Core Ultra 7 155H, Arc 8-Core
3569 KRay/s -45%
HP Dragonfly G4
Intel Core i7-1365U, Iris Xe G7 96EUs
3513 KRay/s -46%
Asus ZenBook S13 OLED UX5304
Intel Core i7-1355U, Iris Xe G7 96EUs
3134 KRay/s -52%
AIDA64 / CPU PhotoWorxx
Average Intel Core Ultra 7 256V
  (51767 - 52282, n=2)
52025 MPixel/s 0%
Dell XPS 13 9350
Intel Core Ultra 7 256V, Arc 140V
51767 MPixel/s
Dell XPS 13 Plus 9320 i7-1280P OLED
Intel Core i7-1280P, Iris Xe G7 96EUs
47506 MPixel/s -8%
Lenovo ThinkBook 13x G4 21KR0008GE
Intel Core Ultra 5 125H, Arc 7-Core
47353 MPixel/s -9%
MSI Prestige 13 AI Evo
Intel Core Ultra 7 155H, Arc 8-Core
42674 MPixel/s -18%
Asus ZenBook S13 OLED UX5304
Intel Core i7-1355U, Iris Xe G7 96EUs
38665 MPixel/s -25%
HP Dragonfly G4
Intel Core i7-1365U, Iris Xe G7 96EUs
37846 MPixel/s -27%

Stres Testi

Sistem boşta
Sistem boşta

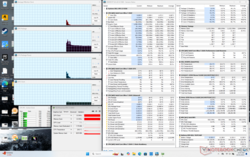
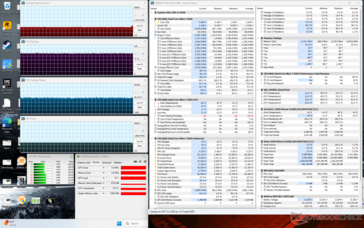
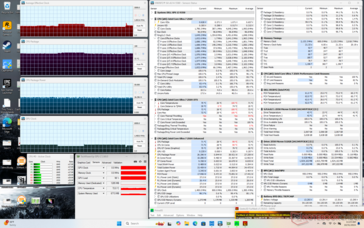
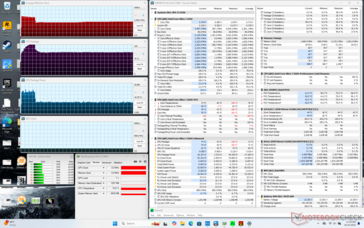
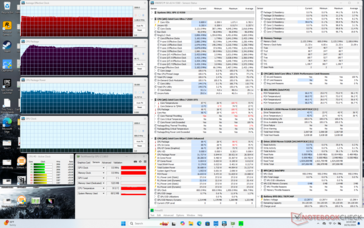
Prime95 stresini başlatırken, CPU 100 C çekirdek sıcaklığına ulaşana kadar yaklaşık bir dakika boyunca 3,4 GHz ve 38 W'a yükselir. Daha sonra 90 C'lik biraz daha soğuk bir çekirdek sıcaklığını korumak için 3,2 GHz ve 32 W'da stabilize olur. Bunun yerine Dengeli modda ise CPU, aşağıdaki GPU Performansı bölümümüzde belirtildiği gibi daha yavaş işlemci performansımızla ilişkili olarak 2,5 GHz, 76 C ve 18 W gibi çok daha düşük değerlerde stabilize olur.

Prime95'i Performans modunda çalıştırırken çekirdek sıcaklığı, eski modelde kaydettiğimizden daha yüksek XPS 13 9320 aynı stres testini çalıştırırken. Öte yandan, oyun çalıştırırken çekirdek sıcaklığı yeni XPS 13 9350'de neredeyse 10 C daha soğuk görünüyor.

Cyberpunk 2077 stresi
Prime95+FurMark stresi
Prime95 stres (Dengeli mod)
Prime95 stres (Performans modu)
Ortalama CPU Saati (GHz) GPU Saati (MHz) Ortalama CPU Sıcaklığı (°C)
Sistem Boşta -- -- 29
Prime95 Stres (Performans modu) 3.2 -- 90
Prime95 Stres (Dengeli mod) 2.5 -- 76
Prime95 + FurMark Stres ~1.8 ~1400 72
Cyberpunk 2077 Stres 1.7 1850 71

Sistem Performansı

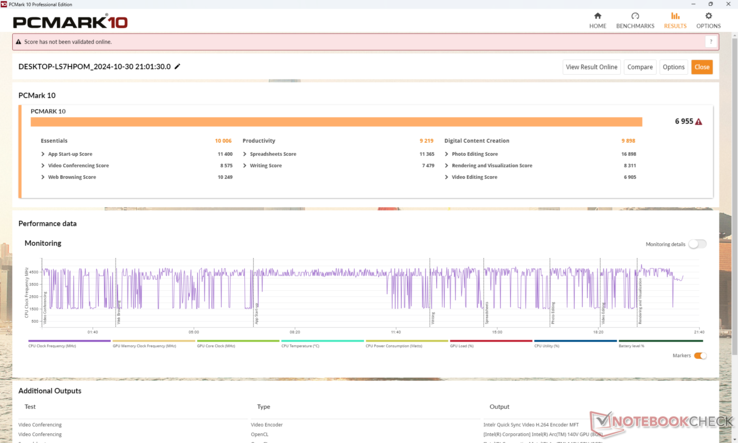
Ortalama PCMark sonuçları, yukarıda belirtildiği gibi Core Ultra 7 155H ile karşılaştırıldığında daha yavaş CPU kıyaslama sonuçlarına rağmen önceki XPS 13 yapılandırmalarından rahatça daha yüksektir. Bu, işlemci açığını dengelemek için hem daha hızlı RAM hem de entegre GPU'ya bağlanabilir. Örneğin AIDA64 bellek sonuçları, Lunar Lake'in geliştirilmesi sırasında RAM performansı ve verimliliği öncelikli olduğundan diğer alt dizüstü bilgisayarların çoğundan önemli ölçüde daha hızlıdır.

PCMark 10 Standart
PCMark 10 Standart
PCMark 10 / Score
Dell XPS 13 9350
Arc 140V, Core Ultra 7 256V, Micron 2550 512GB
6955 Points
Average Intel Core Ultra 7 256V, Intel Arc Graphics 140V
  (6771 - 6955, n=2)
6863 Points -1%
Dell XPS 13 9340 Core Ultra 7
Arc 8-Core, Ultra 7 155H, Micron 2550 512GB
6555 Points -6%
Lenovo ThinkBook 13x G4 21KR0008GE
Arc 7-Core, Ultra 5 125H, Samsung PM9C1a MZAL8512HDLU
6293 Points -10%
MSI Prestige 13 AI Evo
Arc 8-Core, Ultra 7 155H, Samsung PM9A1 MZVL21T0HCLR
5952 Points -14%
HP Dragonfly G4
Iris Xe G7 96EUs, i7-1365U, Micron 3400 MTFDKBA512TFH 512GB
5690 Points -18%
Dell XPS 13 Plus 9320 i7-1280P OLED
Iris Xe G7 96EUs, i7-1280P, WDC PC SN810 512GB
5644 Points -19%
Asus ZenBook S13 OLED UX5304
Iris Xe G7 96EUs, i7-1355U, Samsung PM9A1 MZVL21T0HCLR
5576 Points -20%
PCMark 10 / Essentials
HP Dragonfly G4
Iris Xe G7 96EUs, i7-1365U, Micron 3400 MTFDKBA512TFH 512GB
10853 Points +8%
Dell XPS 13 9340 Core Ultra 7
Arc 8-Core, Ultra 7 155H, Micron 2550 512GB
10752 Points +7%
Asus ZenBook S13 OLED UX5304
Iris Xe G7 96EUs, i7-1355U, Samsung PM9A1 MZVL21T0HCLR
10605 Points +6%
Dell XPS 13 Plus 9320 i7-1280P OLED
Iris Xe G7 96EUs, i7-1280P, WDC PC SN810 512GB
10435 Points +4%
Lenovo ThinkBook 13x G4 21KR0008GE
Arc 7-Core, Ultra 5 125H, Samsung PM9C1a MZAL8512HDLU
10159 Points +2%
Dell XPS 13 9350
Arc 140V, Core Ultra 7 256V, Micron 2550 512GB
10006 Points
MSI Prestige 13 AI Evo
Arc 8-Core, Ultra 7 155H, Samsung PM9A1 MZVL21T0HCLR
9833 Points -2%
Average Intel Core Ultra 7 256V, Intel Arc Graphics 140V
  (9627 - 10006, n=2)
9817 Points -2%
PCMark 10 / Productivity
Dell XPS 13 9350
Arc 140V, Core Ultra 7 256V, Micron 2550 512GB
9219 Points
Average Intel Core Ultra 7 256V, Intel Arc Graphics 140V
  (8997 - 9219, n=2)
9108 Points -1%
MSI Prestige 13 AI Evo
Arc 8-Core, Ultra 7 155H, Samsung PM9A1 MZVL21T0HCLR
8643 Points -6%
Dell XPS 13 9340 Core Ultra 7
Arc 8-Core, Ultra 7 155H, Micron 2550 512GB
8440 Points -8%
Lenovo ThinkBook 13x G4 21KR0008GE
Arc 7-Core, Ultra 5 125H, Samsung PM9C1a MZAL8512HDLU
8000 Points -13%
HP Dragonfly G4
Iris Xe G7 96EUs, i7-1365U, Micron 3400 MTFDKBA512TFH 512GB
7206 Points -22%
Asus ZenBook S13 OLED UX5304
Iris Xe G7 96EUs, i7-1355U, Samsung PM9A1 MZVL21T0HCLR
7182 Points -22%
Dell XPS 13 Plus 9320 i7-1280P OLED
Iris Xe G7 96EUs, i7-1280P, WDC PC SN810 512GB
6698 Points -27%
PCMark 10 / Digital Content Creation
Dell XPS 13 9350
Arc 140V, Core Ultra 7 256V, Micron 2550 512GB
9898 Points
Average Intel Core Ultra 7 256V, Intel Arc Graphics 140V
  (9727 - 9898, n=2)
9813 Points -1%
Dell XPS 13 9340 Core Ultra 7
Arc 8-Core, Ultra 7 155H, Micron 2550 512GB
8423 Points -15%
Lenovo ThinkBook 13x G4 21KR0008GE
Arc 7-Core, Ultra 5 125H, Samsung PM9C1a MZAL8512HDLU
8321 Points -16%
Dell XPS 13 Plus 9320 i7-1280P OLED
Iris Xe G7 96EUs, i7-1280P, WDC PC SN810 512GB
6983 Points -29%
MSI Prestige 13 AI Evo
Arc 8-Core, Ultra 7 155H, Samsung PM9A1 MZVL21T0HCLR
6735 Points -32%
HP Dragonfly G4
Iris Xe G7 96EUs, i7-1365U, Micron 3400 MTFDKBA512TFH 512GB
6392 Points -35%
Asus ZenBook S13 OLED UX5304
Iris Xe G7 96EUs, i7-1355U, Samsung PM9A1 MZVL21T0HCLR
6177 Points -38%
CrossMark / Overall
Dell XPS 13 Plus 9320 i7-1280P OLED
Iris Xe G7 96EUs, i7-1280P, WDC PC SN810 512GB
1747 Points +1%
Dell XPS 13 9350
Arc 140V, Core Ultra 7 256V, Micron 2550 512GB
1736 Points
Average Intel Core Ultra 7 256V, Intel Arc Graphics 140V
  (1663 - 1736, n=2)
1700 Points -2%
Dell XPS 13 9340 Core Ultra 7
Arc 8-Core, Ultra 7 155H, Micron 2550 512GB
1680 Points -3%
HP Dragonfly G4
Iris Xe G7 96EUs, i7-1365U, Micron 3400 MTFDKBA512TFH 512GB
1628 Points -6%
Asus ZenBook S13 OLED UX5304
Iris Xe G7 96EUs, i7-1355U, Samsung PM9A1 MZVL21T0HCLR
1592 Points -8%
Lenovo ThinkBook 13x G4 21KR0008GE
Arc 7-Core, Ultra 5 125H, Samsung PM9C1a MZAL8512HDLU
1548 Points -11%
MSI Prestige 13 AI Evo
Arc 8-Core, Ultra 7 155H, Samsung PM9A1 MZVL21T0HCLR
1455 Points -16%
CrossMark / Productivity
Dell XPS 13 9350
Arc 140V, Core Ultra 7 256V, Micron 2550 512GB
1682 Points
Dell XPS 13 Plus 9320 i7-1280P OLED
Iris Xe G7 96EUs, i7-1280P, WDC PC SN810 512GB
1658 Points -1%
Average Intel Core Ultra 7 256V, Intel Arc Graphics 140V
  (1612 - 1682, n=2)
1647 Points -2%
HP Dragonfly G4
Iris Xe G7 96EUs, i7-1365U, Micron 3400 MTFDKBA512TFH 512GB
1620 Points -4%
Dell XPS 13 9340 Core Ultra 7
Arc 8-Core, Ultra 7 155H, Micron 2550 512GB
1618 Points -4%
Asus ZenBook S13 OLED UX5304
Iris Xe G7 96EUs, i7-1355U, Samsung PM9A1 MZVL21T0HCLR
1566 Points -7%
Lenovo ThinkBook 13x G4 21KR0008GE
Arc 7-Core, Ultra 5 125H, Samsung PM9C1a MZAL8512HDLU
1483 Points -12%
MSI Prestige 13 AI Evo
Arc 8-Core, Ultra 7 155H, Samsung PM9A1 MZVL21T0HCLR
1454 Points -14%
CrossMark / Creativity
Dell XPS 13 9350
Arc 140V, Core Ultra 7 256V, Micron 2550 512GB
1953 Points
Dell XPS 13 Plus 9320 i7-1280P OLED
Iris Xe G7 96EUs, i7-1280P, WDC PC SN810 512GB
1928 Points -1%
Average Intel Core Ultra 7 256V, Intel Arc Graphics 140V
  (1862 - 1953, n=2)
1908 Points -2%
Dell XPS 13 9340 Core Ultra 7
Arc 8-Core, Ultra 7 155H, Micron 2550 512GB
1854 Points -5%
HP Dragonfly G4
Iris Xe G7 96EUs, i7-1365U, Micron 3400 MTFDKBA512TFH 512GB
1731 Points -11%
Lenovo ThinkBook 13x G4 21KR0008GE
Arc 7-Core, Ultra 5 125H, Samsung PM9C1a MZAL8512HDLU
1727 Points -12%
Asus ZenBook S13 OLED UX5304
Iris Xe G7 96EUs, i7-1355U, Samsung PM9A1 MZVL21T0HCLR
1696 Points -13%
MSI Prestige 13 AI Evo
Arc 8-Core, Ultra 7 155H, Samsung PM9A1 MZVL21T0HCLR
1519 Points -22%
CrossMark / Responsiveness
Dell XPS 13 Plus 9320 i7-1280P OLED
Iris Xe G7 96EUs, i7-1280P, WDC PC SN810 512GB
1520 Points +13%
Dell XPS 13 9340 Core Ultra 7
Arc 8-Core, Ultra 7 155H, Micron 2550 512GB
1397 Points +4%
Asus ZenBook S13 OLED UX5304
Iris Xe G7 96EUs, i7-1355U, Samsung PM9A1 MZVL21T0HCLR
1386 Points +3%
HP Dragonfly G4
Iris Xe G7 96EUs, i7-1365U, Micron 3400 MTFDKBA512TFH 512GB
1373 Points +2%
Dell XPS 13 9350
Arc 140V, Core Ultra 7 256V, Micron 2550 512GB
1343 Points
Average Intel Core Ultra 7 256V, Intel Arc Graphics 140V
  (1301 - 1343, n=2)
1322 Points -2%
MSI Prestige 13 AI Evo
Arc 8-Core, Ultra 7 155H, Samsung PM9A1 MZVL21T0HCLR
1283 Points -4%
Lenovo ThinkBook 13x G4 21KR0008GE
Arc 7-Core, Ultra 5 125H, Samsung PM9C1a MZAL8512HDLU
1270 Points -5%
WebXPRT 3 / Overall
Dell XPS 13 9350
Arc 140V, Core Ultra 7 256V, Micron 2550 512GB
310 Points
Average Intel Core Ultra 7 256V, Intel Arc Graphics 140V
  (306 - 310, n=2)
308 Points -1%
HP Dragonfly G4
Iris Xe G7 96EUs, i7-1365U, Micron 3400 MTFDKBA512TFH 512GB
305 Points -2%
Asus ZenBook S13 OLED UX5304
Iris Xe G7 96EUs, i7-1355U, Samsung PM9A1 MZVL21T0HCLR
291 Points -6%
Dell XPS 13 Plus 9320 i7-1280P OLED
Iris Xe G7 96EUs, i7-1280P, WDC PC SN810 512GB
288 Points -7%
Dell XPS 13 9340 Core Ultra 7
Arc 8-Core, Ultra 7 155H, Micron 2550 512GB
272 Points -12%
MSI Prestige 13 AI Evo
Arc 8-Core, Ultra 7 155H, Samsung PM9A1 MZVL21T0HCLR
261 Points -16%
Lenovo ThinkBook 13x G4 21KR0008GE
Arc 7-Core, Ultra 5 125H, Samsung PM9C1a MZAL8512HDLU
250 Points -19%
WebXPRT 4 / Overall
Dell XPS 13 9350
Arc 140V, Core Ultra 7 256V, Micron 2550 512GB
286 Points
Average Intel Core Ultra 7 256V, Intel Arc Graphics 140V
  (284 - 286, n=2)
285 Points 0%
HP Dragonfly G4
Iris Xe G7 96EUs, i7-1365U, Micron 3400 MTFDKBA512TFH 512GB
266 Points -7%
Dell XPS 13 9340 Core Ultra 7
Arc 8-Core, Ultra 7 155H, Micron 2550 512GB
257 Points -10%
Asus ZenBook S13 OLED UX5304
Iris Xe G7 96EUs, i7-1355U, Samsung PM9A1 MZVL21T0HCLR
252 Points -12%
Dell XPS 13 Plus 9320 i7-1280P OLED
Iris Xe G7 96EUs, i7-1280P, WDC PC SN810 512GB
251 Points -12%
MSI Prestige 13 AI Evo
Arc 8-Core, Ultra 7 155H, Samsung PM9A1 MZVL21T0HCLR
241 Points -16%
Lenovo ThinkBook 13x G4 21KR0008GE
Arc 7-Core, Ultra 5 125H, Samsung PM9C1a MZAL8512HDLU
240 Points -16%
Mozilla Kraken 1.1 / Total
Lenovo ThinkBook 13x G4 21KR0008GE
Arc 7-Core, Ultra 5 125H, Samsung PM9C1a MZAL8512HDLU
560 ms * -19%
MSI Prestige 13 AI Evo
Arc 8-Core, Ultra 7 155H, Samsung PM9A1 MZVL21T0HCLR
542 ms * -15%
Dell XPS 13 Plus 9320 i7-1280P OLED
Iris Xe G7 96EUs, i7-1280P, WDC PC SN810 512GB
538 ms * -14%
Dell XPS 13 9340 Core Ultra 7
Arc 8-Core, Ultra 7 155H, Micron 2550 512GB
528 ms * -12%
Asus ZenBook S13 OLED UX5304
Iris Xe G7 96EUs, i7-1355U, Samsung PM9A1 MZVL21T0HCLR
515 ms * -9%
HP Dragonfly G4
Iris Xe G7 96EUs, i7-1365U, Micron 3400 MTFDKBA512TFH 512GB
494 ms * -5%
Average Intel Core Ultra 7 256V, Intel Arc Graphics 140V
  (472 - 474, n=2)
473 ms * -0%
Dell XPS 13 9350
Arc 140V, Core Ultra 7 256V, Micron 2550 512GB
472 ms *

* ... smaller is better

PCMark 10 Score
6955 puan
Yardım
AIDA64 / Memory Copy
Average Intel Core Ultra 7 256V
  (101642 - 104459, n=2)
103051 MB/s +1%
Dell XPS 13 9350
Intel Core Ultra 7 256V, Arc 140V
101642 MB/s
Lenovo ThinkBook 13x G4 21KR0008GE
Intel Core Ultra 5 125H, Arc 7-Core
87473 MB/s -14%
MSI Prestige 13 AI Evo
Intel Core Ultra 7 155H, Arc 8-Core
81600 MB/s -20%
Dell XPS 13 Plus 9320 i7-1280P OLED
Intel Core i7-1280P, Iris Xe G7 96EUs
72478 MB/s -29%
Asus ZenBook S13 OLED UX5304
Intel Core i7-1355U, Iris Xe G7 96EUs
59942 MB/s -41%
HP Dragonfly G4
Intel Core i7-1365U, Iris Xe G7 96EUs
58331 MB/s -43%
AIDA64 / Memory Read
Average Intel Core Ultra 7 256V
  (88013 - 89144, n=2)
88579 MB/s +1%
Dell XPS 13 9350
Intel Core Ultra 7 256V, Arc 140V
88013 MB/s
Lenovo ThinkBook 13x G4 21KR0008GE
Intel Core Ultra 5 125H, Arc 7-Core
76803 MB/s -13%
MSI Prestige 13 AI Evo
Intel Core Ultra 7 155H, Arc 8-Core
74299 MB/s -16%
Dell XPS 13 Plus 9320 i7-1280P OLED
Intel Core i7-1280P, Iris Xe G7 96EUs
73719 MB/s -16%
Asus ZenBook S13 OLED UX5304
Intel Core i7-1355U, Iris Xe G7 96EUs
49758 MB/s -43%
HP Dragonfly G4
Intel Core i7-1365U, Iris Xe G7 96EUs
49203 MB/s -44%
AIDA64 / Memory Write
Average Intel Core Ultra 7 256V
  (112340 - 117933, n=2)
115137 MB/s +2%
Dell XPS 13 9350
Intel Core Ultra 7 256V, Arc 140V
112340 MB/s
MSI Prestige 13 AI Evo
Intel Core Ultra 7 155H, Arc 8-Core
75825 MB/s -33%
Asus ZenBook S13 OLED UX5304
Intel Core i7-1355U, Iris Xe G7 96EUs
72418 MB/s -36%
HP Dragonfly G4
Intel Core i7-1365U, Iris Xe G7 96EUs
70434 MB/s -37%
Lenovo ThinkBook 13x G4 21KR0008GE
Intel Core Ultra 5 125H, Arc 7-Core
69575 MB/s -38%
Dell XPS 13 Plus 9320 i7-1280P OLED
Intel Core i7-1280P, Iris Xe G7 96EUs
63969 MB/s -43%
AIDA64 / Memory Latency
MSI Prestige 13 AI Evo
Intel Core Ultra 7 155H, Arc 8-Core
146.1 ns * -47%
Lenovo ThinkBook 13x G4 21KR0008GE
Intel Core Ultra 5 125H, Arc 7-Core
133.4 ns * -34%
Dell XPS 13 Plus 9320 i7-1280P OLED
Intel Core i7-1280P, Iris Xe G7 96EUs
103 ns * -3%
Dell XPS 13 9350
Intel Core Ultra 7 256V, Arc 140V
99.6 ns *
Average Intel Core Ultra 7 256V
  (99.6 - 99.6, n=2)
99.6 ns * -0%
HP Dragonfly G4
Intel Core i7-1365U, Iris Xe G7 96EUs
90.2 ns * +9%
Asus ZenBook S13 OLED UX5304
Intel Core i7-1355U, Iris Xe G7 96EUs
90.1 ns * +10%

* ... smaller is better

DPC Gecikme Süresi

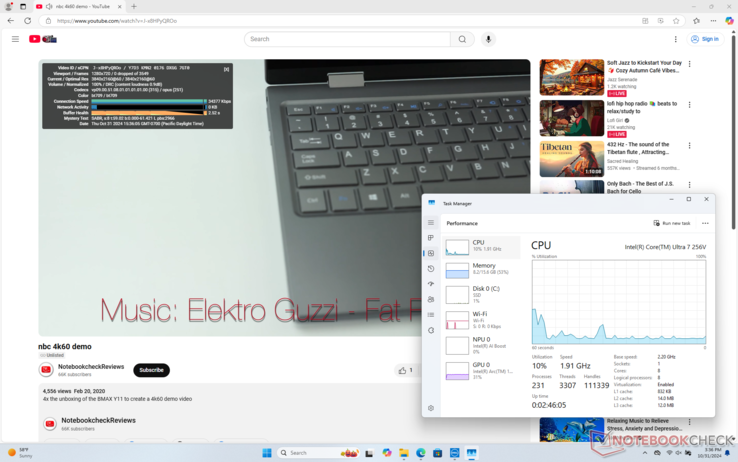
LatencyMon, model ve yeni Lunar Lake CPU ile uyumsuzdur. 60 FPS'de 4K video oynatma, kaydedilen hiçbir kare düşmesi olmadan mükemmeldir.

4K60 oynatma testi
4K60 oynatma testi

Depolama Cihazları

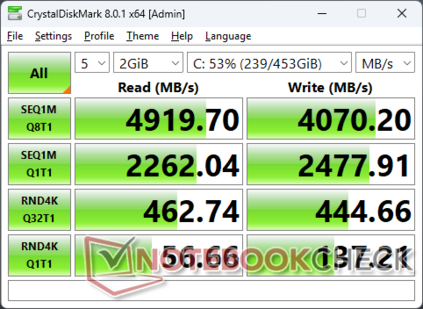
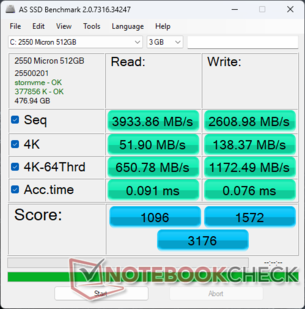
Sistem aynı ürünle birlikte gönderilir Micron 2550 PCIe4 NVMe SSD xPS 13 9340 ve 9345 serilerinde olduğu gibi. Aktarım hızları ~5000 MB/s'ye ulaşıyor ve zorlandığında herhangi bir yavaşlama belirtisi göstermiyor. Bununla birlikte, biraz daha büyük dizüstü bilgisayarlar Lenovo ThinkPad T14s 7000 MB/s'nin üzerinde hızlara ulaşabilen Samsung PM9A1a ile birlikte gönderilme eğilimindedir.

CDM 8
CDM 8
AS SSD
AS SSD
Micron 2550 512GB
CDM 5/6 Read Seq Q32T1: 5036 MB/s
CDM 5/6 Write Seq Q32T1: 4060 MB/s
CDM 5/6 Read 4K Q32T1: 467.7 MB/s
CDM 5/6 Write 4K Q32T1: 452.4 MB/s
CDM 5 Read Seq: 2284 MB/s
CDM 5 Write Seq: 2548 MB/s
CDM 5/6 Read 4K: 55.42 MB/s
CDM 5/6 Write 4K: 133 MB/s
Drive Performance Rating - Percent
MSI Prestige 13 AI Evo
Samsung PM9A1 MZVL21T0HCLR
95.1 pt
Dell XPS 13 Plus 9320 i7-1280P OLED
WDC PC SN810 512GB
72.6 pt
Asus ZenBook S13 OLED UX5304
Samsung PM9A1 MZVL21T0HCLR
71.8 pt
Lenovo ThinkBook 13x G4 21KR0008GE
Samsung PM9C1a MZAL8512HDLU
66.2 pt
HP Dragonfly G4
Micron 3400 MTFDKBA512TFH 512GB
63.6 pt
Dell XPS 13 9350
Micron 2550 512GB
50.4 pt
DiskSpd
seq read
MSI Prestige 13 AI Evo
Samsung PM9A1 MZVL21T0HCLR
4501 (4492.31min - 4501.34max) MB/s +86%
Asus ZenBook S13 OLED UX5304
Samsung PM9A1 MZVL21T0HCLR
4001 (3943.69min - 4000.53max) MB/s +66%
Dell XPS 13 Plus 9320 i7-1280P OLED
WDC PC SN810 512GB
3747 (3711.67min - 3747.4max) MB/s +55%
HP Dragonfly G4
Micron 3400 MTFDKBA512TFH 512GB
3312 (3304.27min - 3312.03max) MB/s +37%
Lenovo ThinkBook 13x G4 21KR0008GE
Samsung PM9C1a MZAL8512HDLU
2565 (1389.73min - 2564.61max) MB/s +6%
Dell XPS 13 9350
Micron 2550 512GB
2416 (2299.74min - 2415.91max) MB/s
seq write
MSI Prestige 13 AI Evo
Samsung PM9A1 MZVL21T0HCLR
4460 (4450.9min - 4460.43max) MB/s +80%
Dell XPS 13 Plus 9320 i7-1280P OLED
WDC PC SN810 512GB
3470 (3416.05min - 3470.37max) MB/s +40%
HP Dragonfly G4
Micron 3400 MTFDKBA512TFH 512GB
3342 (3270.72min - 3341.6max) MB/s +35%
Asus ZenBook S13 OLED UX5304
Samsung PM9A1 MZVL21T0HCLR
3321 (3143.21min - 3321.26max) MB/s +34%
Lenovo ThinkBook 13x G4 21KR0008GE
Samsung PM9C1a MZAL8512HDLU
2983 (2793.48min - 2982.57max) MB/s +20%
Dell XPS 13 9350
Micron 2550 512GB
2477 (2281.75min - 2476.53max) MB/s
seq q8 t1 read
MSI Prestige 13 AI Evo
Samsung PM9A1 MZVL21T0HCLR
7100 (6554.33min - 7100.12max) MB/s +40%
Asus ZenBook S13 OLED UX5304
Samsung PM9A1 MZVL21T0HCLR
7036 (6223.64min - 7035.55max) MB/s +39%
Dell XPS 13 Plus 9320 i7-1280P OLED
WDC PC SN810 512GB
6656 (5809.03min - 6655.73max) MB/s +32%
HP Dragonfly G4
Micron 3400 MTFDKBA512TFH 512GB
6628 (6115.78min - 6627.63max) MB/s +31%
Lenovo ThinkBook 13x G4 21KR0008GE
Samsung PM9C1a MZAL8512HDLU
6068 (5239.11min - 6068.32max) MB/s +20%
Dell XPS 13 9350
Micron 2550 512GB
5057 (4337.25min - 5057.07max) MB/s
seq q8 t1 write
MSI Prestige 13 AI Evo
Samsung PM9A1 MZVL21T0HCLR
5281 (5261.13min - 5280.63max) MB/s +30%
Asus ZenBook S13 OLED UX5304
Samsung PM9A1 MZVL21T0HCLR
5179 (4831.64min - 5178.79max) MB/s +27%
Lenovo ThinkBook 13x G4 21KR0008GE
Samsung PM9C1a MZAL8512HDLU
4715 (4689.23min - 4715.24max) MB/s +16%
Dell XPS 13 Plus 9320 i7-1280P OLED
WDC PC SN810 512GB
4468 (4431.23min - 4467.85max) MB/s +10%
Dell XPS 13 9350
Micron 2550 512GB
4062 (3975.8min - 4061.61max) MB/s
HP Dragonfly G4
Micron 3400 MTFDKBA512TFH 512GB
3965 (3820.5min - 3965.05max) MB/s -2%
4k q1 t1 read
MSI Prestige 13 AI Evo
Samsung PM9A1 MZVL21T0HCLR
85.9 (85.31min - 85.9max) MB/s +61%
Asus ZenBook S13 OLED UX5304
Samsung PM9A1 MZVL21T0HCLR
83.3 (77.84min - 83.26max) MB/s +57%
Dell XPS 13 Plus 9320 i7-1280P OLED
WDC PC SN810 512GB
67.5 (65.71min - 67.48max) MB/s +27%
HP Dragonfly G4
Micron 3400 MTFDKBA512TFH 512GB
67.2 (66.32min - 67.16max) MB/s +26%
Lenovo ThinkBook 13x G4 21KR0008GE
Samsung PM9C1a MZAL8512HDLU
63 (61.94min - 62.98max) MB/s +18%
Dell XPS 13 9350
Micron 2550 512GB
53.2 (50.58min - 53.24max) MB/s
4k q1 t1 write
MSI Prestige 13 AI Evo
Samsung PM9A1 MZVL21T0HCLR
204 (200.8min - 203.91max) MB/s +47%
Dell XPS 13 Plus 9320 i7-1280P OLED
WDC PC SN810 512GB
170.9 (165.47min - 170.92max) MB/s +23%
Asus ZenBook S13 OLED UX5304
Samsung PM9A1 MZVL21T0HCLR
140.8 (131.23min - 140.77max) MB/s +1%
Dell XPS 13 9350
Micron 2550 512GB
139.2 (136.33min - 139.15max) MB/s
HP Dragonfly G4
Micron 3400 MTFDKBA512TFH 512GB
138.9 (137.35min - 138.92max) MB/s 0%
Lenovo ThinkBook 13x G4 21KR0008GE
Samsung PM9C1a MZAL8512HDLU
119.2 (114.62min - 119.17max) MB/s -14%
4k q32 t16 read
MSI Prestige 13 AI Evo
Samsung PM9A1 MZVL21T0HCLR
3215 (2358.16min - 3214.63max) MB/s +402%
Lenovo ThinkBook 13x G4 21KR0008GE
Samsung PM9C1a MZAL8512HDLU
703 (627.88min - 703.14max) MB/s +10%
HP Dragonfly G4
Micron 3400 MTFDKBA512TFH 512GB
690 (550.07min - 689.62max) MB/s +8%
Dell XPS 13 9350
Micron 2550 512GB
640 (630.5min - 640.27max) MB/s
Dell XPS 13 Plus 9320 i7-1280P OLED
WDC PC SN810 512GB
540 (532.43min - 540.23max) MB/s -16%
Asus ZenBook S13 OLED UX5304
Samsung PM9A1 MZVL21T0HCLR
494 (392.19min - 494.04max) MB/s -23%
4k q32 t16 write
MSI Prestige 13 AI Evo
Samsung PM9A1 MZVL21T0HCLR
2288 (1575.7min - 2287.8max) MB/s +512%
Dell XPS 13 Plus 9320 i7-1280P OLED
WDC PC SN810 512GB
416 (398.57min - 416.29max) MB/s +11%
Lenovo ThinkBook 13x G4 21KR0008GE
Samsung PM9C1a MZAL8512HDLU
397 (338.3min - 396.83max) MB/s +6%
HP Dragonfly G4
Micron 3400 MTFDKBA512TFH 512GB
389 (345.44min - 388.55max) MB/s +4%
Dell XPS 13 9350
Micron 2550 512GB
374 (359.04min - 373.65max) MB/s
Asus ZenBook S13 OLED UX5304
Samsung PM9A1 MZVL21T0HCLR
372 (323.75min - 372.35max) MB/s -1%
AS SSD
Score Total
MSI Prestige 13 AI Evo
Samsung PM9A1 MZVL21T0HCLR
5770 Points +82%
Dell XPS 13 Plus 9320 i7-1280P OLED
WDC PC SN810 512GB
5114 Points +61%
Lenovo ThinkBook 13x G4 21KR0008GE
Samsung PM9C1a MZAL8512HDLU
4180 Points +32%
HP Dragonfly G4
Micron 3400 MTFDKBA512TFH 512GB
4171 Points +31%
Asus ZenBook S13 OLED UX5304
Samsung PM9A1 MZVL21T0HCLR
4048 Points +27%
Dell XPS 13 9350
Micron 2550 512GB
3176 Points
Score Read
MSI Prestige 13 AI Evo
Samsung PM9A1 MZVL21T0HCLR
1756 Points +60%
Dell XPS 13 Plus 9320 i7-1280P OLED
WDC PC SN810 512GB
1451 Points +32%
Lenovo ThinkBook 13x G4 21KR0008GE
Samsung PM9C1a MZAL8512HDLU
1211 Points +10%
HP Dragonfly G4
Micron 3400 MTFDKBA512TFH 512GB
1169 Points +7%
Dell XPS 13 9350
Micron 2550 512GB
1096 Points
Asus ZenBook S13 OLED UX5304
Samsung PM9A1 MZVL21T0HCLR
1040 Points -5%
Score Write
MSI Prestige 13 AI Evo
Samsung PM9A1 MZVL21T0HCLR
3156 Points +101%
Dell XPS 13 Plus 9320 i7-1280P OLED
WDC PC SN810 512GB
3046 Points +94%
Asus ZenBook S13 OLED UX5304
Samsung PM9A1 MZVL21T0HCLR
2568 Points +63%
HP Dragonfly G4
Micron 3400 MTFDKBA512TFH 512GB
2506 Points +59%
Lenovo ThinkBook 13x G4 21KR0008GE
Samsung PM9C1a MZAL8512HDLU
2426 Points +54%
Dell XPS 13 9350
Micron 2550 512GB
1572 Points
Seq Read
MSI Prestige 13 AI Evo
Samsung PM9A1 MZVL21T0HCLR
5470 MB/s +39%
Dell XPS 13 Plus 9320 i7-1280P OLED
WDC PC SN810 512GB
5411.56 MB/s +38%
Asus ZenBook S13 OLED UX5304
Samsung PM9A1 MZVL21T0HCLR
5107 MB/s +30%
HP Dragonfly G4
Micron 3400 MTFDKBA512TFH 512GB
4510.61 MB/s +15%
Lenovo ThinkBook 13x G4 21KR0008GE
Samsung PM9C1a MZAL8512HDLU
4488 MB/s +14%
Dell XPS 13 9350
Micron 2550 512GB
3933.86 MB/s
Seq Write
MSI Prestige 13 AI Evo
Samsung PM9A1 MZVL21T0HCLR
4344 MB/s +67%
Asus ZenBook S13 OLED UX5304
Samsung PM9A1 MZVL21T0HCLR
2849 MB/s +9%
Dell XPS 13 9350
Micron 2550 512GB
2608.98 MB/s
Lenovo ThinkBook 13x G4 21KR0008GE
Samsung PM9C1a MZAL8512HDLU
2595 MB/s -1%
Dell XPS 13 Plus 9320 i7-1280P OLED
WDC PC SN810 512GB
2530.01 MB/s -3%
HP Dragonfly G4
Micron 3400 MTFDKBA512TFH 512GB
2127.08 MB/s -18%
4K Read
MSI Prestige 13 AI Evo
Samsung PM9A1 MZVL21T0HCLR
72 MB/s +39%
Dell XPS 13 Plus 9320 i7-1280P OLED
WDC PC SN810 512GB
70.31 MB/s +35%
Lenovo ThinkBook 13x G4 21KR0008GE
Samsung PM9C1a MZAL8512HDLU
65.3 MB/s +26%
Asus ZenBook S13 OLED UX5304
Samsung PM9A1 MZVL21T0HCLR
64.1 MB/s +24%
HP Dragonfly G4
Micron 3400 MTFDKBA512TFH 512GB
61.53 MB/s +19%
Dell XPS 13 9350
Micron 2550 512GB
51.9 MB/s
4K Write
Dell XPS 13 Plus 9320 i7-1280P OLED
WDC PC SN810 512GB
232.86 MB/s +68%
Asus ZenBook S13 OLED UX5304
Samsung PM9A1 MZVL21T0HCLR
198.7 MB/s +44%
HP Dragonfly G4
Micron 3400 MTFDKBA512TFH 512GB
185.58 MB/s +34%
MSI Prestige 13 AI Evo
Samsung PM9A1 MZVL21T0HCLR
179.9 MB/s +30%
Lenovo ThinkBook 13x G4 21KR0008GE
Samsung PM9C1a MZAL8512HDLU
156.9 MB/s +13%
Dell XPS 13 9350
Micron 2550 512GB
138.37 MB/s
4K-64 Read
MSI Prestige 13 AI Evo
Samsung PM9A1 MZVL21T0HCLR
1137 MB/s +75%
Dell XPS 13 Plus 9320 i7-1280P OLED
WDC PC SN810 512GB
839.87 MB/s +29%
Lenovo ThinkBook 13x G4 21KR0008GE
Samsung PM9C1a MZAL8512HDLU
697 MB/s +7%
HP Dragonfly G4
Micron 3400 MTFDKBA512TFH 512GB
656.17 MB/s +1%
Dell XPS 13 9350
Micron 2550 512GB
650.78 MB/s
Asus ZenBook S13 OLED UX5304
Samsung PM9A1 MZVL21T0HCLR
466 MB/s -28%
4K-64 Write
Dell XPS 13 Plus 9320 i7-1280P OLED
WDC PC SN810 512GB
2560.31 MB/s +118%
MSI Prestige 13 AI Evo
Samsung PM9A1 MZVL21T0HCLR
2542 MB/s +117%
HP Dragonfly G4
Micron 3400 MTFDKBA512TFH 512GB
2107.89 MB/s +80%
Asus ZenBook S13 OLED UX5304
Samsung PM9A1 MZVL21T0HCLR
2084 MB/s +78%
Lenovo ThinkBook 13x G4 21KR0008GE
Samsung PM9C1a MZAL8512HDLU
2010 MB/s +71%
Dell XPS 13 9350
Micron 2550 512GB
1172.49 MB/s
Access Time Read
Dell XPS 13 9350
Micron 2550 512GB
0.091 ms *
Dell XPS 13 Plus 9320 i7-1280P OLED
WDC PC SN810 512GB
0.082 ms * +10%
HP Dragonfly G4
Micron 3400 MTFDKBA512TFH 512GB
0.055 ms * +40%
Lenovo ThinkBook 13x G4 21KR0008GE
Samsung PM9C1a MZAL8512HDLU
0.036 ms * +60%
MSI Prestige 13 AI Evo
Samsung PM9A1 MZVL21T0HCLR
0.033 ms * +64%
Asus ZenBook S13 OLED UX5304
Samsung PM9A1 MZVL21T0HCLR
0.025 ms * +73%
Access Time Write
Dell XPS 13 9350
Micron 2550 512GB
0.076 ms *
HP Dragonfly G4
Micron 3400 MTFDKBA512TFH 512GB
0.067 ms * +12%
Dell XPS 13 Plus 9320 i7-1280P OLED
WDC PC SN810 512GB
0.049 ms * +36%
Asus ZenBook S13 OLED UX5304
Samsung PM9A1 MZVL21T0HCLR
0.025 ms * +67%
MSI Prestige 13 AI Evo
Samsung PM9A1 MZVL21T0HCLR
0.025 ms * +67%
Lenovo ThinkBook 13x G4 21KR0008GE
Samsung PM9C1a MZAL8512HDLU
0.023 ms * +70%

* ... smaller is better

Disk Throttling: DiskSpd Read Loop, Queue Depth 8

02605207801040130015601820208023402600286031203380364039004160442046804940Tooltip
Dell XPS 13 9350 Micron 2550 512GB; diskspd 2.0.17 f: Ø5043 (4553.97-5060.22)
Dell XPS 13 9345  ; diskspd 2.0.17 f: Ø5089 (4590.46-5102.16)

GPU Performansı

3DMark sonuçlarımızdan Ark Grafikleri 140V özellikle bir subnotebook için oldukça yüksektir. Ünitemiz şu anda piyasada bulunan ve entegre grafiklerle çalışan diğer tüm U serisi alt dizüstü bilgisayarlardan daha iyi performans gösteriyor Radeon 780M GPU. En dikkat çekici nokta, puanların Türkiye'den yüzde 20 ila 40 daha yüksek olmasıdır Ark 8 henüz 6 aylık XPS 13 9340'ta. XPS 13 serisinin grafik performansı söz konusu olduğunda tarihsel olarak oldukça zayıf olduğu düşünüldüğünde sonuçlar gerçekten şaşırtıcı.

Güç ProfiliGrafik PuanıFizik PuanıBirleşik Puan
Performans Modu9492222573474
Dengeli Mod9555 (-0%)19598 (-12%)2932 (-16%)
Akü Gücü9200 (-3%)17818 (-20%)2754 (-21%)

Performans modundan Dengeli moda veya pil gücüne düşmek, yukarıdaki Fire Strike sonuç tablomuzda gösterildiği gibi CPU performansını grafik performansından daha fazla etkiler. Bu nedenle, sistemden en iyi şekilde yararlanmak için zorlu uygulamaları çalıştırırken Performans modunda olmak isteyeceksiniz.

3DMark 11
3DMark 11
Fire Strike
Fire Strike
Çelik Göçebe
Çelik Göçebe
Time Spy
Time Spy
3DMark Performance Rating - Percent
Dell XPS 13 9350
Intel Arc Graphics 140V, Intel Core Ultra 7 256V
96.4 pt
Average Intel Arc Graphics 140V
 
93.2 pt
HP EliteBook x360 1040 G11
Intel Arc 8-Core iGPU, Intel Core Ultra 7 165H
91.5 pt
Asus Zenbook S 14 UX5406
Intel Arc Graphics 140V, Intel Core Ultra 7 258V
90.7 pt
Lenovo ThinkBook 13x G4 21KR0008GE
Intel Arc 7-Core iGPU, Intel Core Ultra 5 125H
85.2 pt
Dell XPS 13 9340 Core Ultra 7
Intel Arc 8-Core iGPU, Intel Core Ultra 7 155H
77.8 pt
Framework Laptop 13.5 Ryzen 7 7840U
AMD Radeon 780M, AMD Ryzen 7 7840U
75.3 pt
Asus Zenbook S 13 OLED
AMD Radeon 680M, AMD Ryzen 7 6800U
64.4 pt
MSI Prestige 13 AI Evo
Intel Arc 8-Core iGPU, Intel Core Ultra 7 155H
55.6 pt
Dell XPS 13 Plus 9320 Core i7-1360P
Intel Iris Xe Graphics G7 96EUs, Intel Core i7-1360P
51.9 pt
Dell XPS 13 Plus 9320 i7-1280P OLED
Intel Iris Xe Graphics G7 96EUs, Intel Core i7-1280P
50.4 pt
Dell XPS 13 Plus 9320 4K
Intel Iris Xe Graphics G7 96EUs, Intel Core i7-1260P
50.3 pt
HP Dragonfly G4
Intel Iris Xe Graphics G7 96EUs, Intel Core i7-1365U
46.3 pt
Asus ZenBook S13 OLED UX5304
Intel Iris Xe Graphics G7 96EUs, Intel Core i7-1355U
45 pt
Lenovo Yoga 6 13 83B2001SGE
AMD Radeon RX Vega 8 (Ryzen 4000/5000), AMD Ryzen 7 7730U
38.4 pt
Dell XPS 13 Plus 9320 i5-1240p
Intel Iris Xe Graphics G7 80EUs, Intel Core i5-1240P
35.3 pt
Lenovo ThinkBook 13s G3 20YA0005GE
AMD Radeon RX Vega 8 (Ryzen 4000/5000), AMD Ryzen 7 5800U
34.6 pt
Dell XPS 13 9315, i5-1230U
Intel Iris Xe Graphics G7 80EUs, Intel Core i5-1230U
28.1 pt
Dell XPS 13 9315 2-in-1 Core i5-1230U
Intel Iris Xe Graphics G7 80EUs, Intel Core i5-1230U
28 pt
3DMark 11 - 1280x720 Performance GPU
HP EliteBook x360 1040 G11
Intel Arc 8-Core iGPU, Intel Core Ultra 7 165H
12457 Points +17%
Framework Laptop 13.5 Ryzen 7 7840U
AMD Radeon 780M, AMD Ryzen 7 7840U
11695 Points +10%
Lenovo ThinkBook 13x G4 21KR0008GE
Intel Arc 7-Core iGPU, Intel Core Ultra 5 125H
11467 Points +8%
Average Intel Arc Graphics 140V
  (10499 - 11335, n=8)
10810 Points +1%
Asus Zenbook S 14 UX5406
Intel Arc Graphics 140V, Intel Core Ultra 7 258V
10722 Points +1%
Dell XPS 13 9350
Intel Arc Graphics 140V, Intel Core Ultra 7 256V
10651 Points
Dell XPS 13 9340 Core Ultra 7
Intel Arc 8-Core iGPU, Intel Core Ultra 7 155H
10624 Points 0%
Asus Zenbook S 13 OLED
AMD Radeon 680M, AMD Ryzen 7 6800U
9095 Points -15%
MSI Prestige 13 AI Evo
Intel Arc 8-Core iGPU, Intel Core Ultra 7 155H
8064 Points -24%
Dell XPS 13 Plus 9320 i7-1280P OLED
Intel Iris Xe Graphics G7 96EUs, Intel Core i7-1280P
7016 Points -34%
Dell XPS 13 Plus 9320 4K
Intel Iris Xe Graphics G7 96EUs, Intel Core i7-1260P
6956 Points -35%
Dell XPS 13 Plus 9320 Core i7-1360P
Intel Iris Xe Graphics G7 96EUs, Intel Core i7-1360P
6815 Points -36%
HP Dragonfly G4
Intel Iris Xe Graphics G7 96EUs, Intel Core i7-1365U
6440 Points -40%
Asus ZenBook S13 OLED UX5304
Intel Iris Xe Graphics G7 96EUs, Intel Core i7-1355U
6334 Points -41%
Lenovo ThinkBook 13s G3 20YA0005GE
AMD Radeon RX Vega 8 (Ryzen 4000/5000), AMD Ryzen 7 5800U
6174 Points -42%
Lenovo Yoga 6 13 83B2001SGE
AMD Radeon RX Vega 8 (Ryzen 4000/5000), AMD Ryzen 7 7730U
5656 Points -47%
Dell XPS 13 Plus 9320 i5-1240p
Intel Iris Xe Graphics G7 80EUs, Intel Core i5-1240P
5104 Points -52%
Dell XPS 13 9315, i5-1230U
Intel Iris Xe Graphics G7 80EUs, Intel Core i5-1230U
3847 Points -64%
Dell XPS 13 9315 2-in-1 Core i5-1230U
Intel Iris Xe Graphics G7 80EUs, Intel Core i5-1230U
3844 Points -64%
3DMark
1920x1080 Fire Strike Graphics
Dell XPS 13 9350
Intel Arc Graphics 140V, Intel Core Ultra 7 256V
9492 Points
Asus Zenbook S 14 UX5406
Intel Arc Graphics 140V, Intel Core Ultra 7 258V
9414 Points -1%
Average Intel Arc Graphics 140V
  (6790 - 9930, n=9)
9167 Points -3%
HP EliteBook x360 1040 G11
Intel Arc 8-Core iGPU, Intel Core Ultra 7 165H
8961 Points -6%
Lenovo ThinkBook 13x G4 21KR0008GE
Intel Arc 7-Core iGPU, Intel Core Ultra 5 125H
8503 Points -10%
Dell XPS 13 9340 Core Ultra 7
Intel Arc 8-Core iGPU, Intel Core Ultra 7 155H
7946 Points -16%
Framework Laptop 13.5 Ryzen 7 7840U
AMD Radeon 780M, AMD Ryzen 7 7840U
7455 Points -21%
Asus Zenbook S 13 OLED
AMD Radeon 680M, AMD Ryzen 7 6800U
6683 Points -30%
Dell XPS 13 Plus 9320 Core i7-1360P
Intel Iris Xe Graphics G7 96EUs, Intel Core i7-1360P
5981 Points -37%
MSI Prestige 13 AI Evo
Intel Arc 8-Core iGPU, Intel Core Ultra 7 155H
5568 Points -41%
Dell XPS 13 Plus 9320 4K
Intel Iris Xe Graphics G7 96EUs, Intel Core i7-1260P
5421 Points -43%
Dell XPS 13 Plus 9320 i7-1280P OLED
Intel Iris Xe Graphics G7 96EUs, Intel Core i7-1280P
5393 Points -43%
HP Dragonfly G4
Intel Iris Xe Graphics G7 96EUs, Intel Core i7-1365U
5175 Points -45%
Asus ZenBook S13 OLED UX5304
Intel Iris Xe Graphics G7 96EUs, Intel Core i7-1355U
5101 Points -46%
Lenovo Yoga 6 13 83B2001SGE
AMD Radeon RX Vega 8 (Ryzen 4000/5000), AMD Ryzen 7 7730U
4147 Points -56%
Dell XPS 13 Plus 9320 i5-1240p
Intel Iris Xe Graphics G7 80EUs, Intel Core i5-1240P
4086 Points -57%
Lenovo ThinkBook 13s G3 20YA0005GE
AMD Radeon RX Vega 8 (Ryzen 4000/5000), AMD Ryzen 7 5800U
3335 Points -65%
Dell XPS 13 9315, i5-1230U
Intel Iris Xe Graphics G7 80EUs, Intel Core i5-1230U
3247 Points -66%
Dell XPS 13 9315 2-in-1 Core i5-1230U
Intel Iris Xe Graphics G7 80EUs, Intel Core i5-1230U
3227 Points -66%
2560x1440 Time Spy Graphics
Dell XPS 13 9350
Intel Arc Graphics 140V, Intel Core Ultra 7 256V
4115 Points
Average Intel Arc Graphics 140V
  (2955 - 4227, n=12)
3867 Points -6%
Asus Zenbook S 14 UX5406
Intel Arc Graphics 140V, Intel Core Ultra 7 258V
3669 Points -11%
HP EliteBook x360 1040 G11
Intel Arc 8-Core iGPU, Intel Core Ultra 7 165H
3458 Points -16%
Lenovo ThinkBook 13x G4 21KR0008GE
Intel Arc 7-Core iGPU, Intel Core Ultra 5 125H
3248 Points -21%
Dell XPS 13 9340 Core Ultra 7
Intel Arc 8-Core iGPU, Intel Core Ultra 7 155H
2911 Points -29%
Framework Laptop 13.5 Ryzen 7 7840U
AMD Radeon 780M, AMD Ryzen 7 7840U
2575 Points -37%
Asus Zenbook S 13 OLED
AMD Radeon 680M, AMD Ryzen 7 6800U
2287 Points -44%
MSI Prestige 13 AI Evo
Intel Arc 8-Core iGPU, Intel Core Ultra 7 155H
2018 Points -51%
Dell XPS 13 Plus 9320 Core i7-1360P
Intel Iris Xe Graphics G7 96EUs, Intel Core i7-1360P
1791 Points -56%
Dell XPS 13 Plus 9320 i7-1280P OLED
Intel Iris Xe Graphics G7 96EUs, Intel Core i7-1280P
1760 Points -57%
Dell XPS 13 Plus 9320 4K
Intel Iris Xe Graphics G7 96EUs, Intel Core i7-1260P
1758 Points -57%
HP Dragonfly G4
Intel Iris Xe Graphics G7 96EUs, Intel Core i7-1365U
1579 Points -62%
Asus ZenBook S13 OLED UX5304
Intel Iris Xe Graphics G7 96EUs, Intel Core i7-1355U
1505 Points -63%
Lenovo Yoga 6 13 83B2001SGE
AMD Radeon RX Vega 8 (Ryzen 4000/5000), AMD Ryzen 7 7730U
1283 Points -69%
Dell XPS 13 Plus 9320 i5-1240p
Intel Iris Xe Graphics G7 80EUs, Intel Core i5-1240P
1134 Points -72%
Lenovo ThinkBook 13s G3 20YA0005GE
AMD Radeon RX Vega 8 (Ryzen 4000/5000), AMD Ryzen 7 5800U
1066 Points -74%
Dell XPS 13 9315, i5-1230U
Intel Iris Xe Graphics G7 80EUs, Intel Core i5-1230U
945 Points -77%
Dell XPS 13 9315 2-in-1 Core i5-1230U
Intel Iris Xe Graphics G7 80EUs, Intel Core i5-1230U
936 Points -77%
2560x1440 Time Spy Score
Dell XPS 13 9350
Intel Arc Graphics 140V, Intel Core Ultra 7 256V
4354 Points
Average Intel Arc Graphics 140V
  (3336 - 4502, n=9)
4158 Points -5%
Asus Zenbook S 14 UX5406
Intel Arc Graphics 140V, Intel Core Ultra 7 258V
3857 Points -11%
HP EliteBook x360 1040 G11
Intel Arc 8-Core iGPU, Intel Core Ultra 7 165H
3807 Points -13%
Lenovo ThinkBook 13x G4 21KR0008GE
Intel Arc 7-Core iGPU, Intel Core Ultra 5 125H
3498 Points -20%
Dell XPS 13 9340 Core Ultra 7
Intel Arc 8-Core iGPU, Intel Core Ultra 7 155H
3106 Points -29%
Framework Laptop 13.5 Ryzen 7 7840U
AMD Radeon 780M, AMD Ryzen 7 7840U
2891 Points -34%
Asus Zenbook S 13 OLED
AMD Radeon 680M, AMD Ryzen 7 6800U
2548 Points -41%
MSI Prestige 13 AI Evo
Intel Arc 8-Core iGPU, Intel Core Ultra 7 155H
2178 Points -50%
Dell XPS 13 Plus 9320 Core i7-1360P
Intel Iris Xe Graphics G7 96EUs, Intel Core i7-1360P
2021 Points -54%
Dell XPS 13 Plus 9320 i7-1280P OLED
Intel Iris Xe Graphics G7 96EUs, Intel Core i7-1280P
1986 Points -54%
Dell XPS 13 Plus 9320 4K
Intel Iris Xe Graphics G7 96EUs, Intel Core i7-1260P
1974 Points -55%
HP Dragonfly G4
Intel Iris Xe Graphics G7 96EUs, Intel Core i7-1365U
1768 Points -59%
Asus ZenBook S13 OLED UX5304
Intel Iris Xe Graphics G7 96EUs, Intel Core i7-1355U
1683 Points -61%
Lenovo Yoga 6 13 83B2001SGE
AMD Radeon RX Vega 8 (Ryzen 4000/5000), AMD Ryzen 7 7730U
1456 Points -67%
Dell XPS 13 Plus 9320 i5-1240p
Intel Iris Xe Graphics G7 80EUs, Intel Core i5-1240P
1290 Points -70%
Lenovo ThinkBook 13s G3 20YA0005GE
AMD Radeon RX Vega 8 (Ryzen 4000/5000), AMD Ryzen 7 5800U
1212 Points -72%
Dell XPS 13 9315 2-in-1 Core i5-1230U
Intel Iris Xe Graphics G7 80EUs, Intel Core i5-1230U
1055 Points -76%
Dell XPS 13 9315, i5-1230U
Intel Iris Xe Graphics G7 80EUs, Intel Core i5-1230U
1053 Points -76%
3DMark 11 Performance
11161 puan
3DMark Cloud Gate Standard Score
33853 puan
3DMark Fire Strike Score
8730 puan
3DMark Time Spy Score
4354 puan
3DMark Steel Nomad Score
580 puan
Yardım
Blender
v3.3 Classroom HIP/AMD
Lenovo Yoga 6 13 83B2001SGE
AMD Radeon RX Vega 8 (Ryzen 4000/5000), AMD Ryzen 7 7730U
634 Seconds *
v3.3 Classroom CPU
Dell XPS 13 9315 2-in-1 Core i5-1230U
Intel Iris Xe Graphics G7 80EUs, Intel Core i5-1230U
1023 Seconds * -76%
Asus ZenBook S13 OLED UX5304
Intel Iris Xe Graphics G7 96EUs, Intel Core i7-1355U
839 Seconds * -45%
HP Dragonfly G4
Intel Iris Xe Graphics G7 96EUs, Intel Core i7-1365U
796 Seconds * -37%
Asus Zenbook S 14 UX5406
Intel Arc Graphics 140V, Intel Core Ultra 7 258V
700 Seconds * -21%
Lenovo ThinkBook 13x G4 21KR0008GE
Intel Arc 7-Core iGPU, Intel Core Ultra 5 125H
667 Seconds * -15%
Lenovo Yoga 6 13 83B2001SGE
AMD Radeon RX Vega 8 (Ryzen 4000/5000), AMD Ryzen 7 7730U
648 Seconds * -12%
MSI Prestige 13 AI Evo
Intel Arc 8-Core iGPU, Intel Core Ultra 7 155H
637 Seconds * -10%
Dell XPS 13 Plus 9320 4K
Intel Iris Xe Graphics G7 96EUs, Intel Core i7-1260P
598 Seconds * -3%
Average Intel Arc Graphics 140V
  (532 - 700, n=7)
583 Seconds * -1%
Dell XPS 13 9350
Intel Arc Graphics 140V, Intel Core Ultra 7 256V
580 Seconds *
Dell XPS 13 Plus 9320 i7-1280P OLED
Intel Iris Xe Graphics G7 96EUs, Intel Core i7-1280P
537 Seconds * +7%
Dell XPS 13 Plus 9320 Core i7-1360P
Intel Iris Xe Graphics G7 96EUs, Intel Core i7-1360P
531 Seconds * +8%
Dell XPS 13 9340 Core Ultra 7
Intel Arc 8-Core iGPU, Intel Core Ultra 7 155H
481 Seconds * +17%
HP EliteBook x360 1040 G11
Intel Arc 8-Core iGPU, Intel Core Ultra 7 165H
406 Seconds * +30%
Framework Laptop 13.5 Ryzen 7 7840U
AMD Radeon 780M, AMD Ryzen 7 7840U
371 Seconds * +36%
v3.3 Classroom oneAPI/Intel
HP EliteBook x360 1040 G11
Intel Arc 8-Core iGPU, Intel Core Ultra 7 165H
213 Seconds * -1%
Average Intel Arc Graphics 140V
  (210 - 217, n=5)
212 Seconds * -0%
Dell XPS 13 9350
Intel Arc Graphics 140V, Intel Core Ultra 7 256V
211 Seconds *

* ... smaller is better

Oyun Performansı

Oyunlardaki performans, XPS 13 9340'a ve Arc 8 grafikli Core Ultra H serisi CPU'suna göre beklenenden daha fazla gelişti. Bu durumda, Arc 140V'miz neredeyse tutarlı bir şekilde XPS 13 9340'tan oyun ve ayarlara bağlı olarak yüzde 10 kadar az veya yüzde 85 kadar yüksek bir oranda daha iyi performans gösterdi. GTA V veya F1 22 gibi oyunları daha yüksek ayarlarda çalıştırırken daha yüksek deltalar gözlemlenebilirken, DOTA 2 Reborn veya Baldur's Gate 3'ü çalıştırırken daha küçük deltalar gözlemlenebilir. Ortalama sonuçlar rakiplerle karşılaştırılabilir Radeon 780M eski bir Iris Xe 96 EUs dizüstü bilgisayardan yükseltme yapan herkes için büyük bir sıçrama olacaktır.

Ancak tüm oyunlar mükemmel çalışmıyor. Tiny Tina's Wonderlands veya F1 22 'yi belirli grafik ayarları etkinken çalıştırırken sistemimiz her zaman çöküyordu.

Performance Rating - Percent
Dell XPS 13 9350
Intel Core Ultra 7 256V, Intel Arc Graphics 140V
96.7 pt
Lenovo ThinkBook 13x G4 21KR0008GE -1!
Intel Core Ultra 5 125H, Intel Arc 7-Core iGPU
77.1 pt
Dell XPS 13 Plus 9320 i7-1280P OLED -1!
Intel Core i7-1280P, Intel Iris Xe Graphics G7 96EUs
64.9 pt
MSI Prestige 13 AI Evo -1!
Intel Core Ultra 7 155H, Intel Arc 8-Core iGPU
59.9 pt
HP Dragonfly G4 -1!
Intel Core i7-1365U, Intel Iris Xe Graphics G7 96EUs
55.5 pt
Asus ZenBook S13 OLED UX5304 -1!
Intel Core i7-1355U, Intel Iris Xe Graphics G7 96EUs
52.1 pt
Baldur's Gate 3 - 1920x1080 Ultra Preset
Dell XPS 13 9350
Intel Core Ultra 7 256V, Intel Arc Graphics 140V
25.7 fps
GTA V - 1920x1080 Highest Settings possible AA:4xMSAA + FX AF:16x
Dell XPS 13 9350
Intel Core Ultra 7 256V, Intel Arc Graphics 140V
25.6 (2.46min, 19.6P1) fps
Lenovo ThinkBook 13x G4 21KR0008GE
Intel Core Ultra 5 125H, Intel Arc 7-Core iGPU
14.8 (1.279min, 5.78P1) fps -42%
Dell XPS 13 Plus 9320 i7-1280P OLED
Intel Core i7-1280P, Intel Iris Xe Graphics G7 96EUs
11.5 (4.27min, 7.69P1) fps -55%
HP Dragonfly G4
Intel Core i7-1365U, Intel Iris Xe Graphics G7 96EUs
10.1 (4.85min, 6.29P1) fps -61%
MSI Prestige 13 AI Evo
Intel Core Ultra 7 155H, Intel Arc 8-Core iGPU
9.97 (1.989min, 4.98P1) fps -61%
Asus ZenBook S13 OLED UX5304
Intel Core i7-1355U, Intel Iris Xe Graphics G7 96EUs
9.42 (3.26min, 5.92P1) fps -63%
Final Fantasy XV Benchmark - 1920x1080 High Quality
Dell XPS 13 9350
Intel Core Ultra 7 256V, Intel Arc Graphics 140V
31.5 fps
Lenovo ThinkBook 13x G4 21KR0008GE
Intel Core Ultra 5 125H, Intel Arc 7-Core iGPU
25.3 fps -20%
Dell XPS 13 Plus 9320 i7-1280P OLED
Intel Core i7-1280P, Intel Iris Xe Graphics G7 96EUs
17.6 fps -44%
MSI Prestige 13 AI Evo
Intel Core Ultra 7 155H, Intel Arc 8-Core iGPU
17 fps -46%
HP Dragonfly G4
Intel Core i7-1365U, Intel Iris Xe Graphics G7 96EUs
16.4 fps -48%
Asus ZenBook S13 OLED UX5304
Intel Core i7-1355U, Intel Iris Xe Graphics G7 96EUs
14.9 fps -53%
Strange Brigade - 1920x1080 ultra AA:ultra AF:16
Dell XPS 13 9350
Intel Core Ultra 7 256V, Intel Arc Graphics 140V
58 (24.7min, 30.7P1) fps
Lenovo ThinkBook 13x G4 21KR0008GE
Intel Core Ultra 5 125H, Intel Arc 7-Core iGPU
44 fps -24%
MSI Prestige 13 AI Evo
Intel Core Ultra 7 155H, Intel Arc 8-Core iGPU
32 fps -45%
Dell XPS 13 Plus 9320 i7-1280P OLED
Intel Core i7-1280P, Intel Iris Xe Graphics G7 96EUs
29.6 (9min, 10.7P1) fps -49%
HP Dragonfly G4
Intel Core i7-1365U, Intel Iris Xe Graphics G7 96EUs
24.7 (5.3min, 6.86P1) fps -57%
Asus ZenBook S13 OLED UX5304
Intel Core i7-1355U, Intel Iris Xe Graphics G7 96EUs
23.6 (5min, 6.37P1) fps -59%
Dota 2 Reborn - 1920x1080 ultra (3/3) best looking
Dell XPS 13 9350
Intel Core Ultra 7 256V, Intel Arc Graphics 140V
80.7 (52.1min) fps
Lenovo ThinkBook 13x G4 21KR0008GE
Intel Core Ultra 5 125H, Intel Arc 7-Core iGPU
64.9 (45.5min) fps -20%
Dell XPS 13 Plus 9320 i7-1280P OLED
Intel Core i7-1280P, Intel Iris Xe Graphics G7 96EUs
58.7 (50.7min) fps -27%
HP Dragonfly G4
Intel Core i7-1365U, Intel Iris Xe Graphics G7 96EUs
53.3 (44.9min) fps -34%
MSI Prestige 13 AI Evo
Intel Core Ultra 7 155H, Intel Arc 8-Core iGPU
53.3 (34.3min) fps -34%
Asus ZenBook S13 OLED UX5304
Intel Core i7-1355U, Intel Iris Xe Graphics G7 96EUs
51.1 (42.7min) fps -37%
X-Plane 11.11 - 1920x1080 high (fps_test=3)
Dell XPS 13 Plus 9320 i7-1280P OLED
Intel Core i7-1280P, Intel Iris Xe Graphics G7 96EUs
37.6 fps +25%
Lenovo ThinkBook 13x G4 21KR0008GE
Intel Core Ultra 5 125H, Intel Arc 7-Core iGPU
34.2 fps +14%
MSI Prestige 13 AI Evo
Intel Core Ultra 7 155H, Intel Arc 8-Core iGPU
32.1 fps +7%
Dell XPS 13 9350
Intel Core Ultra 7 256V, Intel Arc Graphics 140V
30.1 fps
HP Dragonfly G4
Intel Core i7-1365U, Intel Iris Xe Graphics G7 96EUs
29.1 fps -3%
Asus ZenBook S13 OLED UX5304
Intel Core i7-1355U, Intel Iris Xe Graphics G7 96EUs
27.3 fps -9%
Baldur's Gate 3
1280x720 Low Preset
Average Intel Arc Graphics 140V
  (49.3 - 66.4, n=5)
56.9 fps +10%
Dell XPS 13 9350
Intel Core Ultra 7 256V, Intel Arc Graphics 140V
51.7 fps
HP EliteBook x360 1040 G11
Intel Core Ultra 7 165H, Intel Arc 8-Core iGPU
42.2 fps -18%
1920x1080 Low Preset
Average Intel Arc Graphics 140V
  (23.7 - 43, n=12)
36.9 fps +1%
Dell XPS 13 9350
Intel Core Ultra 7 256V, Intel Arc Graphics 140V
36.6 fps
Asus Zenbook S 14 UX5406
Intel Core Ultra 7 258V, Intel Arc Graphics 140V
34.2 fps -7%
HP EliteBook x360 1040 G11
Intel Core Ultra 7 165H, Intel Arc 8-Core iGPU
29.3 fps -20%
1920x1080 Medium Preset
Dell XPS 13 9350
Intel Core Ultra 7 256V, Intel Arc Graphics 140V
30.5 fps
Average Intel Arc Graphics 140V
  (19.6 - 33.7, n=12)
29.9 fps -2%
Asus Zenbook S 14 UX5406
Intel Core Ultra 7 258V, Intel Arc Graphics 140V
26.3 fps -14%
HP EliteBook x360 1040 G11
Intel Core Ultra 7 165H, Intel Arc 8-Core iGPU
24.2 fps -21%
1920x1080 High Preset
Average Intel Arc Graphics 140V
  (17 - 30, n=12)
26.7 fps +3%
Dell XPS 13 9350
Intel Core Ultra 7 256V, Intel Arc Graphics 140V
25.8 fps
Asus Zenbook S 14 UX5406
Intel Core Ultra 7 258V, Intel Arc Graphics 140V
23.6 fps -9%
HP EliteBook x360 1040 G11
Intel Core Ultra 7 165H, Intel Arc 8-Core iGPU
21.4 fps -17%
1920x1080 Ultra Preset
Average Intel Arc Graphics 140V
  (16.6 - 29.5, n=12)
25.9 fps +1%
Dell XPS 13 9350
Intel Core Ultra 7 256V, Intel Arc Graphics 140V
25.7 fps
Asus Zenbook S 14 UX5406
Intel Core Ultra 7 258V, Intel Arc Graphics 140V
23 fps -11%
HP EliteBook x360 1040 G11
Intel Core Ultra 7 165H, Intel Arc 8-Core iGPU
20.4 fps -21%
GTA V
1024x768 Lowest Settings possible
HP EliteBook x360 1040 G11
Intel Core Ultra 7 165H, Intel Arc 8-Core iGPU
162.9 (4.68min, 83.3P1) fps +5%
Dell XPS 13 9340 Core Ultra 7
Intel Core Ultra 7 155H, Intel Arc 8-Core iGPU
157.8 (4.43min, 83.3P1) fps +2%
Dell XPS 13 9350
Intel Core Ultra 7 256V, Intel Arc Graphics 140V
154.9 (4.26min, 83.3P1) fps
Average Intel Arc Graphics 140V
  (110.5 - 161.6, n=13)
145.2 fps -6%
Asus Zenbook S 13 OLED
AMD Ryzen 7 6800U, AMD Radeon 680M
136.1 (7.35min, 90.9P1) fps -12%
Dell XPS 13 Plus 9320 Core i7-1360P
Intel Core i7-1360P, Intel Iris Xe Graphics G7 96EUs
130.6 (21.7min, 71.4P1) fps -16%
Dell XPS 13 Plus 9320 i7-1280P OLED
Intel Core i7-1280P, Intel Iris Xe Graphics G7 96EUs
123.7 (11.7min, 76.9P1) fps -20%
Lenovo ThinkBook 13x G4 21KR0008GE
Intel Core Ultra 5 125H, Intel Arc 7-Core iGPU
116.9 (6min, 62.5P1) fps -25%
Dell XPS 13 Plus 9320 4K
Intel Core i7-1260P, Intel Iris Xe Graphics G7 96EUs
115.1 (17.6min, 76.9P1) fps -26%
Asus Zenbook S 14 UX5406
Intel Core Ultra 7 258V, Intel Arc Graphics 140V
114.4 (22.8min, 83.3P1) fps -26%
Lenovo Yoga 6 13 83B2001SGE
AMD Ryzen 7 7730U, AMD Radeon RX Vega 8 (Ryzen 4000/5000)
100.2 (6.7min, 66.7P1) fps -35%
HP Dragonfly G4
Intel Core i7-1365U, Intel Iris Xe Graphics G7 96EUs
99.8 (27min, 62.5P1) fps -36%
MSI Prestige 13 AI Evo
Intel Core Ultra 7 155H, Intel Arc 8-Core iGPU
99.1 (6.8min, 27.8P1) fps -36%
Asus ZenBook S13 OLED UX5304
Intel Core i7-1355U, Intel Iris Xe Graphics G7 96EUs
94.8 (19.3min, 55.6P1) fps -39%
Dell XPS 13 9315 2-in-1 Core i5-1230U
Intel Core i5-1230U, Intel Iris Xe Graphics G7 80EUs
60.9 (8.61min, 28.6P1) fps -61%
1920x1080 Lowest Settings possible
Dell XPS 13 9350
Intel Core Ultra 7 256V, Intel Arc Graphics 140V
146.7 (4.88min, 90.9P1) fps
Average Intel Arc Graphics 140V
  (135.2 - 158.4, n=6)
143.7 fps -2%
HP EliteBook x360 1040 G11
Intel Core Ultra 7 165H, Intel Arc 8-Core iGPU
142.8 (5.23min, 76.9P1) fps -3%
Dell XPS 13 Plus 9320 i7-1280P OLED
Intel Core i7-1280P, Intel Iris Xe Graphics G7 96EUs
101.7 (13.1min, 66.7P1) fps -31%
Dell XPS 13 Plus 9320 Core i7-1360P
Intel Core i7-1360P, Intel Iris Xe Graphics G7 96EUs
95.6 (11.2min, 52.6P1) fps -35%
HP Dragonfly G4
Intel Core i7-1365U, Intel Iris Xe Graphics G7 96EUs
78.8 (12.6min, 52.6P1) fps -46%
Lenovo Yoga 6 13 83B2001SGE
AMD Ryzen 7 7730U, AMD Radeon RX Vega 8 (Ryzen 4000/5000)
55.7 (11.4min, 40P1) fps -62%
Dell XPS 13 9315 2-in-1 Core i5-1230U
Intel Core i5-1230U, Intel Iris Xe Graphics G7 80EUs
36.2 (8.37min, 16.9P1) fps -75%
1366x768 Normal/Off AF:4x
HP EliteBook x360 1040 G11
Intel Core Ultra 7 165H, Intel Arc 8-Core iGPU
151.9 (4.24min, 71.4P1) fps +2%
Dell XPS 13 9350
Intel Core Ultra 7 256V, Intel Arc Graphics 140V
149.4 (4.38min, 90.9P1) fps
Average Intel Arc Graphics 140V
  (91.1 - 155.6, n=12)
133.6 fps -11%
Dell XPS 13 9340 Core Ultra 7
Intel Core Ultra 7 155H, Intel Arc 8-Core iGPU
129.8 (4.39min, 58.8P1) fps -13%
Asus Zenbook S 13 OLED
AMD Ryzen 7 6800U, AMD Radeon 680M
120.4 (8.21min, 76.9P1) fps -19%
Dell XPS 13 Plus 9320 i7-1280P OLED
Intel Core i7-1280P, Intel Iris Xe Graphics G7 96EUs
108.7 (12.4min, 62.5P1) fps -27%
Lenovo ThinkBook 13x G4 21KR0008GE
Intel Core Ultra 5 125H, Intel Arc 7-Core iGPU
106.4 (7.63min, 50P1) fps -29%
Dell XPS 13 Plus 9320 Core i7-1360P
Intel Core i7-1360P, Intel Iris Xe Graphics G7 96EUs
105.3 (6.65min, 55.6P1) fps -30%
Dell XPS 13 Plus 9320 4K
Intel Core i7-1260P, Intel Iris Xe Graphics G7 96EUs
102.1 (18.6min, 66.7P1) fps -32%
MSI Prestige 13 AI Evo
Intel Core Ultra 7 155H, Intel Arc 8-Core iGPU
93.8 (12.8min, 41.7P1) fps -37%
Asus Zenbook S 14 UX5406
Intel Core Ultra 7 258V, Intel Arc Graphics 140V
91.1 (10.1min, 66.7P1) fps -39%
Dell XPS 13 Plus 9320 i5-1240p
Intel Core i5-1240P, Intel Iris Xe Graphics G7 80EUs
91 fps -39%
Lenovo Yoga 6 13 83B2001SGE
AMD Ryzen 7 7730U, AMD Radeon RX Vega 8 (Ryzen 4000/5000)
86.3 (23.7min, 55.6P1) fps -42%
HP Dragonfly G4
Intel Core i7-1365U, Intel Iris Xe Graphics G7 96EUs
84.1 (9min, 47.6P1) fps -44%
Asus ZenBook S13 OLED UX5304
Intel Core i7-1355U, Intel Iris Xe Graphics G7 96EUs
81 (16.8min, 45.5P1) fps -46%
Dell XPS 13 9315 2-in-1 Core i5-1230U
Intel Core i5-1230U, Intel Iris Xe Graphics G7 80EUs
38.4 (8.67min, 21.3P1) fps -74%
Dell XPS 13 9315, i5-1230U
Intel Core i5-1230U, Intel Iris Xe Graphics G7 80EUs
31 fps -79%
1920x1080 Normal/Off AF:4x
Average Intel Arc Graphics 140V
  (120.6 - 152, n=6)
134.7 fps 0%
Dell XPS 13 9350
Intel Core Ultra 7 256V, Intel Arc Graphics 140V
134.2 (5.63min, 83.3P1) fps
HP EliteBook x360 1040 G11
Intel Core Ultra 7 165H, Intel Arc 8-Core iGPU
124.3 (10.4min, 58.8P1) fps -7%
Dell XPS 13 Plus 9320 i7-1280P OLED
Intel Core i7-1280P, Intel Iris Xe Graphics G7 96EUs
90.7 (13min, 55.6P1) fps -32%
Dell XPS 13 Plus 9320 Core i7-1360P
Intel Core i7-1360P, Intel Iris Xe Graphics G7 96EUs
90.3 (13.3min, 52.6P1) fps -33%
HP Dragonfly G4
Intel Core i7-1365U, Intel Iris Xe Graphics G7 96EUs
70.6 (16.1min, 43.5P1) fps -47%
Lenovo Yoga 6 13 83B2001SGE
AMD Ryzen 7 7730U, AMD Radeon RX Vega 8 (Ryzen 4000/5000)
55.2 (15.5min, 38.5P1) fps -59%
Dell XPS 13 9315 2-in-1 Core i5-1230U
Intel Core i5-1230U, Intel Iris Xe Graphics G7 80EUs
30 (8.55min, 15.4P1) fps -78%
1920x1080 High/On (Advanced Graphics Off) AA:2xMSAA + FX AF:8x
Dell XPS 13 9350
Intel Core Ultra 7 256V, Intel Arc Graphics 140V
60.8 (2.26min, 43.5P1) fps
Average Intel Arc Graphics 140V
  (32 - 67.4, n=12)
58.8 fps -3%
Asus Zenbook S 14 UX5406
Intel Core Ultra 7 258V, Intel Arc Graphics 140V
47.1 (3.06min, 25.6P1) fps -23%
Asus Zenbook S 13 OLED
AMD Ryzen 7 6800U, AMD Radeon 680M
47 (6.64min, 31.3P1) fps -23%
HP EliteBook x360 1040 G11
Intel Core Ultra 7 165H, Intel Arc 8-Core iGPU
43.2 (2.29min, 25.6P1) fps -29%
Dell XPS 13 9340 Core Ultra 7
Intel Core Ultra 7 155H, Intel Arc 8-Core iGPU
32.8 (2.29min, 20.8P1) fps -46%
Lenovo ThinkBook 13x G4 21KR0008GE
Intel Core Ultra 5 125H, Intel Arc 7-Core iGPU
32.4 (1.526min, 12P1) fps -47%
Dell XPS 13 Plus 9320 i5-1240p
Intel Core i5-1240P, Intel Iris Xe Graphics G7 80EUs
32 fps -47%
Dell XPS 13 Plus 9320 i7-1280P OLED
Intel Core i7-1280P, Intel Iris Xe Graphics G7 96EUs
27.6 (7.19min, 18.5P1) fps -55%
Lenovo Yoga 6 13 83B2001SGE
AMD Ryzen 7 7730U, AMD Radeon RX Vega 8 (Ryzen 4000/5000)
26.9 (9.64min, 19.2P1) fps -56%
Dell XPS 13 Plus 9320 Core i7-1360P
Intel Core i7-1360P, Intel Iris Xe Graphics G7 96EUs
26.6 (7.8min, 18.5P1) fps -56%
Dell XPS 13 Plus 9320 4K
Intel Core i7-1260P, Intel Iris Xe Graphics G7 96EUs
26.2 (8.16min, 20P1) fps -57%
MSI Prestige 13 AI Evo
Intel Core Ultra 7 155H, Intel Arc 8-Core iGPU
26.2 (5.31min, 15.6P1) fps -57%
HP Dragonfly G4
Intel Core i7-1365U, Intel Iris Xe Graphics G7 96EUs
23.4 (10.4min, 16.1P1) fps -62%
Asus ZenBook S13 OLED UX5304
Intel Core i7-1355U, Intel Iris Xe Graphics G7 96EUs
22.5 (6.83min, 13.9P1) fps -63%
Dell XPS 13 9315 2-in-1 Core i5-1230U
Intel Core i5-1230U, Intel Iris Xe Graphics G7 80EUs
11.7 (3.09min, 5.59P1) fps -81%
Dell XPS 13 9315, i5-1230U
Intel Core i5-1230U, Intel Iris Xe Graphics G7 80EUs
10 fps -84%
1920x1080 Highest Settings possible AA:4xMSAA + FX AF:16x
Dell XPS 13 9350
Intel Core Ultra 7 256V, Intel Arc Graphics 140V
25.6 (2.46min, 19.6P1) fps
Average Intel Arc Graphics 140V
  (15.4 - 28.4, n=12)
25 fps -2%
Asus Zenbook S 14 UX5406
Intel Core Ultra 7 258V, Intel Arc Graphics 140V
23.4 (2.44min, 13.3P1) fps -9%
Asus Zenbook S 13 OLED
AMD Ryzen 7 6800U, AMD Radeon 680M
21.3 (3.35min, 14.5P1) fps -17%
HP EliteBook x360 1040 G11
Intel Core Ultra 7 165H, Intel Arc 8-Core iGPU
17.1 (1.72min, 12.3P1) fps -33%
Lenovo ThinkBook 13x G4 21KR0008GE
Intel Core Ultra 5 125H, Intel Arc 7-Core iGPU
14.8 (1.279min, 5.78P1) fps -42%
Dell XPS 13 9340 Core Ultra 7
Intel Core Ultra 7 155H, Intel Arc 8-Core iGPU
14.7 (2.21min, 10.8P1) fps -43%
Lenovo Yoga 6 13 83B2001SGE
AMD Ryzen 7 7730U, AMD Radeon RX Vega 8 (Ryzen 4000/5000)
12.3 (1.009min, 8.2P1) fps -52%
Dell XPS 13 Plus 9320 Core i7-1360P
Intel Core i7-1360P, Intel Iris Xe Graphics G7 96EUs
11.6 (4.4min, 6.99P1) fps -55%
Dell XPS 13 Plus 9320 i7-1280P OLED
Intel Core i7-1280P, Intel Iris Xe Graphics G7 96EUs
11.5 (4.27min, 7.69P1) fps -55%
Dell XPS 13 Plus 9320 4K
Intel Core i7-1260P, Intel Iris Xe Graphics G7 96EUs
11 (4.3min, 8.62P1) fps -57%
HP Dragonfly G4
Intel Core i7-1365U, Intel Iris Xe Graphics G7 96EUs
10.1 (4.85min, 6.29P1) fps -61%
MSI Prestige 13 AI Evo
Intel Core Ultra 7 155H, Intel Arc 8-Core iGPU
9.97 (1.989min, 4.98P1) fps -61%
Asus ZenBook S13 OLED UX5304
Intel Core i7-1355U, Intel Iris Xe Graphics G7 96EUs
9.42 (3.26min, 5.92P1) fps -63%
Dell XPS 13 9315 2-in-1 Core i5-1230U
Intel Core i5-1230U, Intel Iris Xe Graphics G7 80EUs
6.06 (1.275min, 2.14P1) fps -76%
Dota 2 Reborn
1280x720 min (0/3) fastest
Framework Laptop 13.5 Ryzen 7 7840U
AMD Ryzen 7 7840U, AMD Radeon 780M
154.1 (129.7min) fps +61%
Dell XPS 13 Plus 9320 i5-1240p
Intel Core i5-1240P, Intel Iris Xe Graphics G7 80EUs
134.4 (81.4min) fps +40%
Dell XPS 13 Plus 9320 Core i7-1360P
Intel Core i7-1360P, Intel Iris Xe Graphics G7 96EUs
125.6 (99.1min) fps +31%
Lenovo ThinkBook 13s G3 20YA0005GE
AMD Ryzen 7 5800U, AMD Radeon RX Vega 8 (Ryzen 4000/5000)
113 (99.1min) fps +18%
Asus Zenbook S 13 OLED
AMD Ryzen 7 6800U, AMD Radeon 680M
111.2 (95.4min) fps +16%
Dell XPS 13 Plus 9320 i7-1280P OLED
Intel Core i7-1280P, Intel Iris Xe Graphics G7 96EUs
110.3 (87.2min) fps +15%
Dell XPS 13 Plus 9320 4K
Intel Core i7-1260P, Intel Iris Xe Graphics G7 96EUs
109.9 (88.7min) fps +15%
Dell XPS 13 9340 Core Ultra 7
Intel Core Ultra 7 155H, Intel Arc 8-Core iGPU
106.2 (58min) fps +11%
Lenovo Yoga 6 13 83B2001SGE
AMD Ryzen 7 7730U, AMD Radeon RX Vega 8 (Ryzen 4000/5000)
103.2 (89.7min) fps +8%
HP Dragonfly G4
Intel Core i7-1365U, Intel Iris Xe Graphics G7 96EUs
101.4 (80.9min) fps +6%
Dell XPS 13 9315 2-in-1 Core i5-1230U
Intel Core i5-1230U, Intel Iris Xe Graphics G7 80EUs
101.2 (80.9min) fps +6%
HP EliteBook x360 1040 G11
Intel Core Ultra 7 165H, Intel Arc 8-Core iGPU
100.3 (58.7min) fps +5%
Average Intel Arc Graphics 140V
  (89.8 - 116.9, n=12)
100.1 fps +4%
Dell XPS 13 9350
Intel Core Ultra 7 256V, Intel Arc Graphics 140V
95.8 (61.3min) fps
Lenovo ThinkBook 13x G4 21KR0008GE
Intel Core Ultra 5 125H, Intel Arc 7-Core iGPU
93.8 (59.9min) fps -2%
Asus Zenbook S 14 UX5406
Intel Core Ultra 7 258V, Intel Arc Graphics 140V
93.1 (52.1min) fps -3%
MSI Prestige 13 AI Evo
Intel Core Ultra 7 155H, Intel Arc 8-Core iGPU
89.9 (53min) fps -6%
Asus ZenBook S13 OLED UX5304
Intel Core i7-1355U, Intel Iris Xe Graphics G7 96EUs
84.8 (65.2min) fps -11%
1366x768 med (1/3)
Dell XPS 13 Plus 9320 i5-1240p
Intel Core i5-1240P, Intel Iris Xe Graphics G7 80EUs
119.5 (103.4min) fps +37%
Framework Laptop 13.5 Ryzen 7 7840U
AMD Ryzen 7 7840U, AMD Radeon 780M
119.3 (97.9min) fps +37%
Dell XPS 13 Plus 9320 Core i7-1360P
Intel Core i7-1360P, Intel Iris Xe Graphics G7 96EUs
97.7 (75.8min) fps +12%
Asus Zenbook S 13 OLED
AMD Ryzen 7 6800U, AMD Radeon 680M
96.9 (79.9min) fps +11%
HP EliteBook x360 1040 G11
Intel Core Ultra 7 165H, Intel Arc 8-Core iGPU
94 (34.1min) fps +8%
Dell XPS 13 9340 Core Ultra 7
Intel Core Ultra 7 155H, Intel Arc 8-Core iGPU
89.8 (52.9min) fps +3%
Lenovo ThinkBook 13s G3 20YA0005GE
AMD Ryzen 7 5800U, AMD Radeon RX Vega 8 (Ryzen 4000/5000)
88.4 (72.2min) fps +2%
Dell XPS 13 9350
Intel Core Ultra 7 256V, Intel Arc Graphics 140V
87 (55.1min) fps
Dell XPS 13 Plus 9320 i7-1280P OLED
Intel Core i7-1280P, Intel Iris Xe Graphics G7 96EUs
86.8 (68min) fps 0%
Lenovo Yoga 6 13 83B2001SGE
AMD Ryzen 7 7730U, AMD Radeon RX Vega 8 (Ryzen 4000/5000)
86.3 (76.6min) fps -1%
Dell XPS 13 Plus 9320 4K
Intel Core i7-1260P, Intel Iris Xe Graphics G7 96EUs
85.2 (68min) fps -2%
Average Intel Arc Graphics 140V
  (58 - 99.9, n=12)
84.3 fps -3%
Lenovo ThinkBook 13x G4 21KR0008GE
Intel Core Ultra 5 125H, Intel Arc 7-Core iGPU
83 (55.2min) fps -5%
HP Dragonfly G4
Intel Core i7-1365U, Intel Iris Xe Graphics G7 96EUs
76.3 (60.7min) fps -12%
MSI Prestige 13 AI Evo
Intel Core Ultra 7 155H, Intel Arc 8-Core iGPU
75.9 (14.5min) fps -13%
Dell XPS 13 9315 2-in-1 Core i5-1230U
Intel Core i5-1230U, Intel Iris Xe Graphics G7 80EUs
75.8 (62.3min) fps -13%
Asus ZenBook S13 OLED UX5304
Intel Core i7-1355U, Intel Iris Xe Graphics G7 96EUs
66.7 (50.3min) fps -23%
Asus Zenbook S 14 UX5406
Intel Core Ultra 7 258V, Intel Arc Graphics 140V
59.7 (31.7min) fps -31%
1920x1080 high (2/3)
Dell XPS 13 9350
Intel Core Ultra 7 256V, Intel Arc Graphics 140V
83 (35.8min) fps
HP EliteBook x360 1040 G11
Intel Core Ultra 7 165H, Intel Arc 8-Core iGPU
77.9 (45min) fps -6%
Average Intel Arc Graphics 140V
  (48.4 - 88.2, n=12)
77.4 fps -7%
Framework Laptop 13.5 Ryzen 7 7840U
AMD Ryzen 7 7840U, AMD Radeon 780M
76.2 (63.3min) fps -8%
Asus Zenbook S 13 OLED
AMD Ryzen 7 6800U, AMD Radeon 680M
72.3 (62.7min) fps -13%
Dell XPS 13 9340 Core Ultra 7
Intel Core Ultra 7 155H, Intel Arc 8-Core iGPU
72 (49.5min) fps -13%
Dell XPS 13 Plus 9320 i5-1240p
Intel Core i5-1240P, Intel Iris Xe Graphics G7 80EUs
70.9 (59.6min) fps -15%
Dell XPS 13 Plus 9320 Core i7-1360P
Intel Core i7-1360P, Intel Iris Xe Graphics G7 96EUs
68.7 (58.6min) fps -17%
Lenovo ThinkBook 13x G4 21KR0008GE
Intel Core Ultra 5 125H, Intel Arc 7-Core iGPU
68.4 (46.3min) fps -18%
Dell XPS 13 Plus 9320 4K
Intel Core i7-1260P, Intel Iris Xe Graphics G7 96EUs
68.2 (59.4min) fps -18%
Dell XPS 13 Plus 9320 i7-1280P OLED
Intel Core i7-1280P, Intel Iris Xe Graphics G7 96EUs
68.1 (57.9min) fps -18%
Asus Zenbook S 14 UX5406
Intel Core Ultra 7 258V, Intel Arc Graphics 140V
67.2 (29.2min) fps -19%
HP Dragonfly G4
Intel Core i7-1365U, Intel Iris Xe Graphics G7 96EUs
60.2 (49.5min) fps -27%
MSI Prestige 13 AI Evo
Intel Core Ultra 7 155H, Intel Arc 8-Core iGPU
57.7 (35.7min) fps -30%
Lenovo Yoga 6 13 83B2001SGE
AMD Ryzen 7 7730U, AMD Radeon RX Vega 8 (Ryzen 4000/5000)
56.4 (47.8min) fps -32%
Asus ZenBook S13 OLED UX5304
Intel Core i7-1355U, Intel Iris Xe Graphics G7 96EUs
54.9 (44.7min) fps -34%
Lenovo ThinkBook 13s G3 20YA0005GE
AMD Ryzen 7 5800U, AMD Radeon RX Vega 8 (Ryzen 4000/5000)
51.1 (46.2min) fps -38%
Dell XPS 13 9315 2-in-1 Core i5-1230U
Intel Core i5-1230U, Intel Iris Xe Graphics G7 80EUs
37.6 (35min) fps -55%
1920x1080 ultra (3/3) best looking
Dell XPS 13 9350
Intel Core Ultra 7 256V, Intel Arc Graphics 140V
80.7 (52.1min) fps
Average Intel Arc Graphics 140V
  (54.8 - 83, n=12)
75.4 fps -7%
HP EliteBook x360 1040 G11
Intel Core Ultra 7 165H, Intel Arc 8-Core iGPU
74.4 (47.1min) fps -8%
Framework Laptop 13.5 Ryzen 7 7840U
AMD Ryzen 7 7840U, AMD Radeon 780M
71.2 (59.4min) fps -12%
Dell XPS 13 Plus 9320 i5-1240p
Intel Core i5-1240P, Intel Iris Xe Graphics G7 80EUs
66.1 (49.7min) fps -18%
Dell XPS 13 9340 Core Ultra 7
Intel Core Ultra 7 155H, Intel Arc 8-Core iGPU
65.2 (48.8min) fps -19%
Lenovo ThinkBook 13x G4 21KR0008GE
Intel Core Ultra 5 125H, Intel Arc 7-Core iGPU
64.9 (45.5min) fps -20%
Asus Zenbook S 14 UX5406
Intel Core Ultra 7 258V, Intel Arc Graphics 140V
62.9 fps -22%
Asus Zenbook S 13 OLED
AMD Ryzen 7 6800U, AMD Radeon 680M
62.7 (53.2min) fps -22%
Dell XPS 13 Plus 9320 Core i7-1360P
Intel Core i7-1360P, Intel Iris Xe Graphics G7 96EUs
61.6 (52.9min) fps -24%
Dell XPS 13 Plus 9320 4K
Intel Core i7-1260P, Intel Iris Xe Graphics G7 96EUs
60.6 (52.5min) fps -25%
Dell XPS 13 Plus 9320 i7-1280P OLED
Intel Core i7-1280P, Intel Iris Xe Graphics G7 96EUs
58.7 (50.7min) fps -27%
HP Dragonfly G4
Intel Core i7-1365U, Intel Iris Xe Graphics G7 96EUs
53.3 (44.9min) fps -34%
MSI Prestige 13 AI Evo
Intel Core Ultra 7 155H, Intel Arc 8-Core iGPU
53.3 (34.3min) fps -34%
Asus ZenBook S13 OLED UX5304
Intel Core i7-1355U, Intel Iris Xe Graphics G7 96EUs
51.1 (42.7min) fps -37%
Lenovo Yoga 6 13 83B2001SGE
AMD Ryzen 7 7730U, AMD Radeon RX Vega 8 (Ryzen 4000/5000)
50.4 (44.6min) fps -38%
Lenovo ThinkBook 13s G3 20YA0005GE
AMD Ryzen 7 5800U, AMD Radeon RX Vega 8 (Ryzen 4000/5000)
47.5 (42.7min) fps -41%
Dell XPS 13 9315 2-in-1 Core i5-1230U
Intel Core i5-1230U, Intel Iris Xe Graphics G7 80EUs
34.2 (31.2min) fps -58%
Final Fantasy XV Benchmark
1280x720 Lite Quality
Average Intel Arc Graphics 140V
  (54.1 - 91, n=12)
80.1 fps +1%
Dell XPS 13 9350
Intel Core Ultra 7 256V, Intel Arc Graphics 140V
79.4 fps
Asus Zenbook S 14 UX5406
Intel Core Ultra 7 258V, Intel Arc Graphics 140V
75.6 fps -5%
HP EliteBook x360 1040 G11
Intel Core Ultra 7 165H, Intel Arc 8-Core iGPU
73.6 fps -7%
Framework Laptop 13.5 Ryzen 7 7840U
AMD Ryzen 7 7840U, AMD Radeon 780M
66.6 fps -16%
Dell XPS 13 9340 Core Ultra 7
Intel Core Ultra 7 155H, Intel Arc 8-Core iGPU
61.3 fps -23%
Asus Zenbook S 13 OLED
AMD Ryzen 7 6800U, AMD Radeon 680M
59.8 fps -25%
Lenovo ThinkBook 13x G4 21KR0008GE
Intel Core Ultra 5 125H, Intel Arc 7-Core iGPU
59.8 fps -25%
Dell XPS 13 Plus 9320 i7-1280P OLED
Intel Core i7-1280P, Intel Iris Xe Graphics G7 96EUs
46.1 fps -42%
Dell XPS 13 Plus 9320 4K
Intel Core i7-1260P, Intel Iris Xe Graphics G7 96EUs
44.7 fps -44%
Dell XPS 13 Plus 9320 Core i7-1360P
Intel Core i7-1360P, Intel Iris Xe Graphics G7 96EUs
44.5 fps -44%
MSI Prestige 13 AI Evo
Intel Core Ultra 7 155H, Intel Arc 8-Core iGPU
43.8 fps -45%
HP Dragonfly G4
Intel Core i7-1365U, Intel Iris Xe Graphics G7 96EUs
40.9 fps -48%
Lenovo ThinkBook 13s G3 20YA0005GE
AMD Ryzen 7 5800U, AMD Radeon RX Vega 8 (Ryzen 4000/5000)
39.1 fps -51%
Lenovo Yoga 6 13 83B2001SGE
AMD Ryzen 7 7730U, AMD Radeon RX Vega 8 (Ryzen 4000/5000)
38.7 fps -51%
Asus ZenBook S13 OLED UX5304
Intel Core i7-1355U, Intel Iris Xe Graphics G7 96EUs
37.4 fps -53%
Dell XPS 13 Plus 9320 i5-1240p
Intel Core i5-1240P, Intel Iris Xe Graphics G7 80EUs
36.3 fps -54%
Dell XPS 13 9315 2-in-1 Core i5-1230U
Intel Core i5-1230U, Intel Iris Xe Graphics G7 80EUs
27 fps -66%
Dell XPS 13 9315, i5-1230U
Intel Core i5-1230U, Intel Iris Xe Graphics G7 80EUs
18.9 fps -76%
1920x1080 Standard Quality
Dell XPS 13 9350
Intel Core Ultra 7 256V, Intel Arc Graphics 140V
46.1 fps
Average Intel Arc Graphics 140V
  (31.6 - 49.3, n=13)
44.3 fps -4%
Asus Zenbook S 14 UX5406
Intel Core Ultra 7 258V, Intel Arc Graphics 140V
40.9 fps -11%
HP EliteBook x360 1040 G11
Intel Core Ultra 7 165H, Intel Arc 8-Core iGPU
40.3 fps -13%
Dell XPS 13 9340 Core Ultra 7
Intel Core Ultra 7 155H, Intel Arc 8-Core iGPU
36.2 fps -21%
Framework Laptop 13.5 Ryzen 7 7840U
AMD Ryzen 7 7840U, AMD Radeon 780M
34.4 fps -25%
Lenovo ThinkBook 13x G4 21KR0008GE
Intel Core Ultra 5 125H, Intel Arc 7-Core iGPU
33.4 fps -28%
Asus Zenbook S 13 OLED
AMD Ryzen 7 6800U, AMD Radeon 680M
31.6 fps -31%
MSI Prestige 13 AI Evo
Intel Core Ultra 7 155H, Intel Arc 8-Core iGPU
28 fps -39%
Dell XPS 13 Plus 9320 4K
Intel Core i7-1260P, Intel Iris Xe Graphics G7 96EUs
25.3 fps -45%
Dell XPS 13 Plus 9320 i7-1280P OLED
Intel Core i7-1280P, Intel Iris Xe Graphics G7 96EUs
25.3 fps -45%
Dell XPS 13 Plus 9320 Core i7-1360P
Intel Core i7-1360P, Intel Iris Xe Graphics G7 96EUs
25.2 fps -45%
HP Dragonfly G4
Intel Core i7-1365U, Intel Iris Xe Graphics G7 96EUs
23.2 fps -50%
Asus ZenBook S13 OLED UX5304
Intel Core i7-1355U, Intel Iris Xe Graphics G7 96EUs
20.5 fps -56%
Dell XPS 13 Plus 9320 i5-1240p
Intel Core i5-1240P, Intel Iris Xe Graphics G7 80EUs
19.7 fps -57%
Lenovo ThinkBook 13s G3 20YA0005GE
AMD Ryzen 7 5800U, AMD Radeon RX Vega 8 (Ryzen 4000/5000)
18.8 fps -59%
Lenovo Yoga 6 13 83B2001SGE
AMD Ryzen 7 7730U, AMD Radeon RX Vega 8 (Ryzen 4000/5000)
17.7 fps -62%
Dell XPS 13 9315, i5-1230U
Intel Core i5-1230U, Intel Iris Xe Graphics G7 80EUs
10.8 fps -77%
1920x1080 High Quality
Dell XPS 13 9350
Intel Core Ultra 7 256V, Intel Arc Graphics 140V
31.5 fps
Average Intel Arc Graphics 140V
  (23 - 34.2, n=12)
31.3 fps -1%
Asus Zenbook S 14 UX5406
Intel Core Ultra 7 258V, Intel Arc Graphics 140V
30 fps -5%
HP EliteBook x360 1040 G11
Intel Core Ultra 7 165H, Intel Arc 8-Core iGPU
27.5 fps -13%
Dell XPS 13 9340 Core Ultra 7
Intel Core Ultra 7 155H, Intel Arc 8-Core iGPU
26.4 fps -16%
Framework Laptop 13.5 Ryzen 7 7840U
AMD Ryzen 7 7840U, AMD Radeon 780M
25.7 fps -18%
Dell XPS 13 Plus 9320 4K
Intel Core i7-1260P, Intel Iris Xe Graphics G7 96EUs
25.3 fps -20%
Lenovo ThinkBook 13x G4 21KR0008GE
Intel Core Ultra 5 125H, Intel Arc 7-Core iGPU
25.3 fps -20%
Asus Zenbook S 13 OLED
AMD Ryzen 7 6800U, AMD Radeon 680M
21.9 fps -30%
Dell XPS 13 Plus 9320 i7-1280P OLED
Intel Core i7-1280P, Intel Iris Xe Graphics G7 96EUs
17.6 fps -44%
Dell XPS 13 Plus 9320 Core i7-1360P
Intel Core i7-1360P, Intel Iris Xe Graphics G7 96EUs
17.5 fps -44%
MSI Prestige 13 AI Evo
Intel Core Ultra 7 155H, Intel Arc 8-Core iGPU
17 fps -46%
HP Dragonfly G4
Intel Core i7-1365U, Intel Iris Xe Graphics G7 96EUs
16.4 fps -48%
Asus ZenBook S13 OLED UX5304
Intel Core i7-1355U, Intel Iris Xe Graphics G7 96EUs
14.9 fps -53%
Lenovo Yoga 6 13 83B2001SGE
AMD Ryzen 7 7730U, AMD Radeon RX Vega 8 (Ryzen 4000/5000)
12.9 fps -59%
Lenovo ThinkBook 13s G3 20YA0005GE
AMD Ryzen 7 5800U, AMD Radeon RX Vega 8 (Ryzen 4000/5000)
12.7 fps -60%
Dell XPS 13 Plus 9320 i5-1240p
Intel Core i5-1240P, Intel Iris Xe Graphics G7 80EUs
11.7 fps -63%
Dell XPS 13 9315, i5-1230U
Intel Core i5-1230U, Intel Iris Xe Graphics G7 80EUs
5.24 fps -83%
X-Plane 11.11
1280x720 low (fps_test=1)
Framework Laptop 13.5 Ryzen 7 7840U
AMD Ryzen 7 7840U, AMD Radeon 780M
60 fps +27%
HP EliteBook x360 1040 G11
Intel Core Ultra 7 165H, Intel Arc 8-Core iGPU
58.7 fps +25%
Dell XPS 13 Plus 9320 4K
Intel Core i7-1260P, Intel Iris Xe Graphics G7 96EUs
55.5 fps +18%
Dell XPS 13 Plus 9320 i7-1280P OLED
Intel Core i7-1280P, Intel Iris Xe Graphics G7 96EUs
55.2 fps +17%
Dell XPS 13 9340 Core Ultra 7
Intel Core Ultra 7 155H, Intel Arc 8-Core iGPU
53 fps +13%
Lenovo ThinkBook 13x G4 21KR0008GE
Intel Core Ultra 5 125H, Intel Arc 7-Core iGPU
52 fps +10%
Average Intel Arc Graphics 140V
  (38.9 - 57, n=12)
49.3 fps +5%
MSI Prestige 13 AI Evo
Intel Core Ultra 7 155H, Intel Arc 8-Core iGPU
47.4 fps +1%
Dell XPS 13 9350
Intel Core Ultra 7 256V, Intel Arc Graphics 140V
47.1 fps
Asus Zenbook S 13 OLED
AMD Ryzen 7 6800U, AMD Radeon 680M
46.9 fps 0%
Lenovo ThinkBook 13s G3 20YA0005GE
AMD Ryzen 7 5800U, AMD Radeon RX Vega 8 (Ryzen 4000/5000)
44.1 fps -6%
Dell XPS 13 Plus 9320 Core i7-1360P
Intel Core i7-1360P, Intel Iris Xe Graphics G7 96EUs
42.7 fps -9%
Lenovo Yoga 6 13 83B2001SGE
AMD Ryzen 7 7730U, AMD Radeon RX Vega 8 (Ryzen 4000/5000)
39.5 fps -16%
Asus Zenbook S 14 UX5406
Intel Core Ultra 7 258V, Intel Arc Graphics 140V
38.9 fps -17%
HP Dragonfly G4
Intel Core i7-1365U, Intel Iris Xe Graphics G7 96EUs
37.6 fps -20%
Asus ZenBook S13 OLED UX5304
Intel Core i7-1355U, Intel Iris Xe Graphics G7 96EUs
34.6 fps -27%
Dell XPS 13 9315 2-in-1 Core i5-1230U
Intel Core i5-1230U, Intel Iris Xe Graphics G7 80EUs
31.2 fps -34%
Dell XPS 13 Plus 9320 i5-1240p
Intel Core i5-1240P, Intel Iris Xe Graphics G7 80EUs
28.5 fps -39%
1920x1080 med (fps_test=2)
HP EliteBook x360 1040 G11
Intel Core Ultra 7 165H, Intel Arc 8-Core iGPU
47.6 fps +32%
Framework Laptop 13.5 Ryzen 7 7840U
AMD Ryzen 7 7840U, AMD Radeon 780M
44.4 fps +23%
Dell XPS 13 Plus 9320 4K
Intel Core i7-1260P, Intel Iris Xe Graphics G7 96EUs
42.9 fps +19%
Dell XPS 13 Plus 9320 i7-1280P OLED
Intel Core i7-1280P, Intel Iris Xe Graphics G7 96EUs
40.7 fps +13%
Dell XPS 13 9340 Core Ultra 7
Intel Core Ultra 7 155H, Intel Arc 8-Core iGPU
40.7 fps +13%
Lenovo ThinkBook 13x G4 21KR0008GE
Intel Core Ultra 5 125H, Intel Arc 7-Core iGPU
40.1 fps +11%
Asus Zenbook S 13 OLED
AMD Ryzen 7 6800U, AMD Radeon 680M
39.7 fps +10%
Average Intel Arc Graphics 140V
  (34.4 - 43.8, n=12)
39.5 fps +9%
MSI Prestige 13 AI Evo
Intel Core Ultra 7 155H, Intel Arc 8-Core iGPU
37.7 fps +4%
Dell XPS 13 Plus 9320 Core i7-1360P
Intel Core i7-1360P, Intel Iris Xe Graphics G7 96EUs
36.2 fps 0%
Dell XPS 13 9350
Intel Core Ultra 7 256V, Intel Arc Graphics 140V
36.1 fps
Asus Zenbook S 14 UX5406
Intel Core Ultra 7 258V, Intel Arc Graphics 140V
35.1 fps -3%
Lenovo ThinkBook 13s G3 20YA0005GE
AMD Ryzen 7 5800U, AMD Radeon RX Vega 8 (Ryzen 4000/5000)
34.1 fps -6%
Asus ZenBook S13 OLED UX5304
Intel Core i7-1355U, Intel Iris Xe Graphics G7 96EUs
32.1 fps -11%
HP Dragonfly G4
Intel Core i7-1365U, Intel Iris Xe Graphics G7 96EUs
31.8 fps -12%
Lenovo Yoga 6 13 83B2001SGE
AMD Ryzen 7 7730U, AMD Radeon RX Vega 8 (Ryzen 4000/5000)
30.4 fps -16%
Dell XPS 13 9315 2-in-1 Core i5-1230U
Intel Core i5-1230U, Intel Iris Xe Graphics G7 80EUs
25.1 fps -30%
Dell XPS 13 Plus 9320 i5-1240p
Intel Core i5-1240P, Intel Iris Xe Graphics G7 80EUs
23.7 fps -34%
1920x1080 high (fps_test=3)
HP EliteBook x360 1040 G11
Intel Core Ultra 7 165H, Intel Arc 8-Core iGPU
40.5 fps +35%
Dell XPS 13 Plus 9320 i7-1280P OLED
Intel Core i7-1280P, Intel Iris Xe Graphics G7 96EUs
37.6 fps +25%
Framework Laptop 13.5 Ryzen 7 7840U
AMD Ryzen 7 7840U, AMD Radeon 780M
37.5 fps +25%
Dell XPS 13 Plus 9320 4K
Intel Core i7-1260P, Intel Iris Xe Graphics G7 96EUs
36.9 fps +23%
Lenovo ThinkBook 13x G4 21KR0008GE
Intel Core Ultra 5 125H, Intel Arc 7-Core iGPU
34.2 fps +14%
Average Intel Arc Graphics 140V
  (28.5 - 37.7, n=12)
34 fps +13%
Asus Zenbook S 13 OLED
AMD Ryzen 7 6800U, AMD Radeon 680M
33.6 fps +12%
Dell XPS 13 Plus 9320 Core i7-1360P
Intel Core i7-1360P, Intel Iris Xe Graphics G7 96EUs
33.2 fps +10%
MSI Prestige 13 AI Evo
Intel Core Ultra 7 155H, Intel Arc 8-Core iGPU
32.1 fps +7%
Dell XPS 13 9340 Core Ultra 7
Intel Core Ultra 7 155H, Intel Arc 8-Core iGPU
30.8 fps +2%
Dell XPS 13 9350
Intel Core Ultra 7 256V, Intel Arc Graphics 140V
30.1 fps
Asus Zenbook S 14 UX5406
Intel Core Ultra 7 258V, Intel Arc Graphics 140V
29.8 fps -1%
Lenovo ThinkBook 13s G3 20YA0005GE
AMD Ryzen 7 5800U, AMD Radeon RX Vega 8 (Ryzen 4000/5000)
29.5 fps -2%
HP Dragonfly G4
Intel Core i7-1365U, Intel Iris Xe Graphics G7 96EUs
29.1 fps -3%
Dell XPS 13 Plus 9320 i5-1240p
Intel Core i5-1240P, Intel Iris Xe Graphics G7 80EUs
28.8 fps -4%
Asus ZenBook S13 OLED UX5304
Intel Core i7-1355U, Intel Iris Xe Graphics G7 96EUs
27.3 fps -9%
Lenovo Yoga 6 13 83B2001SGE
AMD Ryzen 7 7730U, AMD Radeon RX Vega 8 (Ryzen 4000/5000)
26.7 fps -11%
Dell XPS 13 9315 2-in-1 Core i5-1230U
Intel Core i5-1230U, Intel Iris Xe Graphics G7 80EUs
22 fps -27%
Far Cry 5
1280x720 Low Preset AA:T
Average Intel Arc Graphics 140V
  (47 - 99, n=12)
82.8 fps +4%
Dell XPS 13 9350
Intel Core Ultra 7 256V, Intel Arc Graphics 140V
80 (42min) fps
Asus Zenbook S 14 UX5406
Intel Core Ultra 7 258V, Intel Arc Graphics 140V
76 fps -5%
Framework Laptop 13.5 Ryzen 7 7840U
AMD Ryzen 7 7840U, AMD Radeon 780M
74 (63min) fps -7%
Lenovo ThinkBook 13x G4 21KR0008GE
Intel Core Ultra 5 125H, Intel Arc 7-Core iGPU
64 fps -20%
Dell XPS 13 Plus 9320 i5-1240p
Intel Core i5-1240P, Intel Iris Xe Graphics G7 80EUs
61 fps -24%
Dell XPS 13 Plus 9320 4K
Intel Core i7-1260P, Intel Iris Xe Graphics G7 96EUs
59 fps -26%
Asus Zenbook S 13 OLED
AMD Ryzen 7 6800U, AMD Radeon 680M
57 fps -29%
Dell XPS 13 9340 Core Ultra 7
Intel Core Ultra 7 155H, Intel Arc 8-Core iGPU
57 fps -29%
HP EliteBook x360 1040 G11
Intel Core Ultra 7 165H, Intel Arc 8-Core iGPU
51 (17min) fps -36%
Lenovo Yoga 6 13 83B2001SGE
AMD Ryzen 7 7730U, AMD Radeon RX Vega 8 (Ryzen 4000/5000)
47 (24min) fps -41%
MSI Prestige 13 AI Evo
Intel Core Ultra 7 155H, Intel Arc 8-Core iGPU
47 fps -41%
Asus ZenBook S13 OLED UX5304
Intel Core i7-1355U, Intel Iris Xe Graphics G7 96EUs
42 fps -47%
Dell XPS 13 9315, i5-1230U
Intel Core i5-1230U, Intel Iris Xe Graphics G7 80EUs
22 (12min) fps -72%
1920x1080 Medium Preset AA:T
Dell XPS 13 9350
Intel Core Ultra 7 256V, Intel Arc Graphics 140V
52 (40min) fps
Average Intel Arc Graphics 140V
  (31 - 59, n=12)
49.5 fps -5%
Asus Zenbook S 14 UX5406
Intel Core Ultra 7 258V, Intel Arc Graphics 140V
46 fps -12%
Framework Laptop 13.5 Ryzen 7 7840U
AMD Ryzen 7 7840U, AMD Radeon 780M
39 (21min) fps -25%
Lenovo ThinkBook 13x G4 21KR0008GE
Intel Core Ultra 5 125H, Intel Arc 7-Core iGPU
37 fps -29%
Asus Zenbook S 13 OLED
AMD Ryzen 7 6800U, AMD Radeon 680M
36 fps -31%
HP EliteBook x360 1040 G11
Intel Core Ultra 7 165H, Intel Arc 8-Core iGPU
36 (2min) fps -31%
MSI Prestige 13 AI Evo
Intel Core Ultra 7 155H, Intel Arc 8-Core iGPU
33 fps -37%
Dell XPS 13 9340 Core Ultra 7
Intel Core Ultra 7 155H, Intel Arc 8-Core iGPU
33 fps -37%
Dell XPS 13 Plus 9320 4K
Intel Core i7-1260P, Intel Iris Xe Graphics G7 96EUs
32 fps -38%
Dell XPS 13 Plus 9320 i5-1240p
Intel Core i5-1240P, Intel Iris Xe Graphics G7 80EUs
28 fps -46%
Asus ZenBook S13 OLED UX5304
Intel Core i7-1355U, Intel Iris Xe Graphics G7 96EUs
25 fps -52%
Lenovo Yoga 6 13 83B2001SGE
AMD Ryzen 7 7730U, AMD Radeon RX Vega 8 (Ryzen 4000/5000)
23 (14min) fps -56%
Dell XPS 13 9315, i5-1230U
Intel Core i5-1230U, Intel Iris Xe Graphics G7 80EUs
14 (11min) fps -73%
1920x1080 High Preset AA:T
Dell XPS 13 9350
Intel Core Ultra 7 256V, Intel Arc Graphics 140V
45 (35min) fps
Average Intel Arc Graphics 140V
  (28 - 54, n=12)
44.8 fps 0%
Asus Zenbook S 14 UX5406
Intel Core Ultra 7 258V, Intel Arc Graphics 140V
42 fps -7%
Framework Laptop 13.5 Ryzen 7 7840U
AMD Ryzen 7 7840U, AMD Radeon 780M
37 (33min) fps -18%
Lenovo ThinkBook 13x G4 21KR0008GE
Intel Core Ultra 5 125H, Intel Arc 7-Core iGPU
35 fps -22%
HP EliteBook x360 1040 G11
Intel Core Ultra 7 165H, Intel Arc 8-Core iGPU
34 (14min) fps -24%
Asus Zenbook S 13 OLED
AMD Ryzen 7 6800U, AMD Radeon 680M
33 fps -27%
MSI Prestige 13 AI Evo
Intel Core Ultra 7 155H, Intel Arc 8-Core iGPU
31 fps -31%
Dell XPS 13 9340 Core Ultra 7
Intel Core Ultra 7 155H, Intel Arc 8-Core iGPU
30 fps -33%
Dell XPS 13 Plus 9320 4K
Intel Core i7-1260P, Intel Iris Xe Graphics G7 96EUs
29 fps -36%
Asus ZenBook S13 OLED UX5304
Intel Core i7-1355U, Intel Iris Xe Graphics G7 96EUs
24 fps -47%
Lenovo Yoga 6 13 83B2001SGE
AMD Ryzen 7 7730U, AMD Radeon RX Vega 8 (Ryzen 4000/5000)
21 (3min) fps -53%
1920x1080 Ultra Preset AA:T
Dell XPS 13 9350
Intel Core Ultra 7 256V, Intel Arc Graphics 140V
42 (32min) fps
Average Intel Arc Graphics 140V
  (26 - 49, n=12)
40.9 fps -3%
Asus Zenbook S 14 UX5406
Intel Core Ultra 7 258V, Intel Arc Graphics 140V
38 fps -10%
Framework Laptop 13.5 Ryzen 7 7840U
AMD Ryzen 7 7840U, AMD Radeon 780M
35 (29min) fps -17%
HP EliteBook x360 1040 G11
Intel Core Ultra 7 165H, Intel Arc 8-Core iGPU
32 (16min) fps -24%
Asus Zenbook S 13 OLED
AMD Ryzen 7 6800U, AMD Radeon 680M
31 fps -26%
Lenovo ThinkBook 13x G4 21KR0008GE
Intel Core Ultra 5 125H, Intel Arc 7-Core iGPU
31 fps -26%
MSI Prestige 13 AI Evo
Intel Core Ultra 7 155H, Intel Arc 8-Core iGPU
28 fps -33%
Dell XPS 13 9340 Core Ultra 7
Intel Core Ultra 7 155H, Intel Arc 8-Core iGPU
28 fps -33%
Dell XPS 13 Plus 9320 4K
Intel Core i7-1260P, Intel Iris Xe Graphics G7 96EUs
26 fps -38%
Asus ZenBook S13 OLED UX5304
Intel Core i7-1355U, Intel Iris Xe Graphics G7 96EUs
22 fps -48%
Lenovo Yoga 6 13 83B2001SGE
AMD Ryzen 7 7730U, AMD Radeon RX Vega 8 (Ryzen 4000/5000)
20 (5min) fps -52%
Strange Brigade
1280x720 lowest AF:1
Average Intel Arc Graphics 140V
  (138.1 - 236, n=10)
207 fps +3%
Dell XPS 13 9350
Intel Core Ultra 7 256V, Intel Arc Graphics 140V
201 (47.5min, 157.9P1) fps
Asus Zenbook S 14 UX5406
Intel Core Ultra 7 258V, Intel Arc Graphics 140V
196.8 (81.1min, 132.4P1) fps -2%
HP EliteBook x360 1040 G11
Intel Core Ultra 7 165H, Intel Arc 8-Core iGPU
178 (42.7min, 127.4P1) fps -11%
Dell XPS 13 9340 Core Ultra 7
Intel Core Ultra 7 155H, Intel Arc 8-Core iGPU
156 fps -22%
Lenovo ThinkBook 13x G4 21KR0008GE
Intel Core Ultra 5 125H, Intel Arc 7-Core iGPU
141 fps -30%
Framework Laptop 13.5 Ryzen 7 7840U
AMD Ryzen 7 7840U, AMD Radeon 780M
139.8 (37.5min, 114.3P1) fps -30%
Asus Zenbook S 13 OLED
AMD Ryzen 7 6800U, AMD Radeon 680M
125.1 (80.9min, 106.8P1) fps -38%
MSI Prestige 13 AI Evo
Intel Core Ultra 7 155H, Intel Arc 8-Core iGPU
121 fps -40%
Dell XPS 13 Plus 9320 i7-1280P OLED
Intel Core i7-1280P, Intel Iris Xe Graphics G7 96EUs
100.2 (22.5min, 36.9P1) fps -50%
Dell XPS 13 Plus 9320 4K
Intel Core i7-1260P, Intel Iris Xe Graphics G7 96EUs
95.2 (21min, 33.1P1) fps -53%
Dell XPS 13 Plus 9320 Core i7-1360P
Intel Core i7-1360P, Intel Iris Xe Graphics G7 96EUs
93.9 (20.3min, 37.7P1) fps -53%
HP Dragonfly G4
Intel Core i7-1365U, Intel Iris Xe Graphics G7 96EUs
88.8 (19.5min, 29.6P1) fps -56%
Asus ZenBook S13 OLED UX5304
Intel Core i7-1355U, Intel Iris Xe Graphics G7 96EUs
88.4 (19.8min, 31.6P1) fps -56%
Lenovo Yoga 6 13 83B2001SGE
AMD Ryzen 7 7730U, AMD Radeon RX Vega 8 (Ryzen 4000/5000)
86.4 (40.5min, 74.7P1) fps -57%
Dell XPS 13 Plus 9320 i5-1240p
Intel Core i5-1240P, Intel Iris Xe Graphics G7 80EUs
67.7 (15.5min, 23.7P1) fps -66%
Dell XPS 13 9315, i5-1230U
Intel Core i5-1230U, Intel Iris Xe Graphics G7 80EUs
47.5 (10.8min, 14.4P1) fps -76%
1920x1080 medium AA:medium AF:4
Dell XPS 13 9350
Intel Core Ultra 7 256V, Intel Arc Graphics 140V
84.4 (36.1min, 70.5P1) fps
HP EliteBook x360 1040 G11
Intel Core Ultra 7 165H, Intel Arc 8-Core iGPU
77.4 (25.7min, 64.2P1) fps -8%
Asus Zenbook S 14 UX5406
Intel Core Ultra 7 258V, Intel Arc Graphics 140V
77.4 (58.1min, 66.4P1) fps -8%
Average Intel Arc Graphics 140V
  (55.5 - 84.4, n=10)
75.6 fps -10%
Dell XPS 13 9340 Core Ultra 7
Intel Core Ultra 7 155H, Intel Arc 8-Core iGPU
68 fps -19%
Lenovo ThinkBook 13x G4 21KR0008GE
Intel Core Ultra 5 125H, Intel Arc 7-Core iGPU
68 fps -19%
Framework Laptop 13.5 Ryzen 7 7840U
AMD Ryzen 7 7840U, AMD Radeon 780M
59.7 (18.3min, 51.4P1) fps -29%
Asus Zenbook S 13 OLED
AMD Ryzen 7 6800U, AMD Radeon 680M
54.7 (25.4min, 48.7P1) fps -35%
MSI Prestige 13 AI Evo
Intel Core Ultra 7 155H, Intel Arc 8-Core iGPU
53 fps -37%
Dell XPS 13 Plus 9320 4K
Intel Core i7-1260P, Intel Iris Xe Graphics G7 96EUs
45.9 (21.6min, 25.1P1) fps -46%
Dell XPS 13 Plus 9320 i7-1280P OLED
Intel Core i7-1280P, Intel Iris Xe Graphics G7 96EUs
45.4 (16.6min, 25.1P1) fps -46%
Dell XPS 13 Plus 9320 Core i7-1360P
Intel Core i7-1360P, Intel Iris Xe Graphics G7 96EUs
43.8 (15.4min, 25.5P1) fps -48%
HP Dragonfly G4
Intel Core i7-1365U, Intel Iris Xe Graphics G7 96EUs
38.4 (17.6min, 22.1P1) fps -55%
Asus ZenBook S13 OLED UX5304
Intel Core i7-1355U, Intel Iris Xe Graphics G7 96EUs
37.8 (13.2min, 21.5P1) fps -55%
Lenovo Yoga 6 13 83B2001SGE
AMD Ryzen 7 7730U, AMD Radeon RX Vega 8 (Ryzen 4000/5000)
33.8 (18min, 29.4P1) fps -60%
Dell XPS 13 Plus 9320 i5-1240p
Intel Core i5-1240P, Intel Iris Xe Graphics G7 80EUs
30.7 (10.4min, 16.6P1) fps -64%
Dell XPS 13 9315, i5-1230U
Intel Core i5-1230U, Intel Iris Xe Graphics G7 80EUs
6 (5min, 5P1) fps -93%
1920x1080 high AA:high AF:8
Dell XPS 13 9350
Intel Core Ultra 7 256V, Intel Arc Graphics 140V
65.2 (28.3min, 51P1) fps
Asus Zenbook S 14 UX5406
Intel Core Ultra 7 258V, Intel Arc Graphics 140V
65.1 (39.9min, 50.6P1) fps 0%
Average Intel Arc Graphics 140V
  (45.3 - 70.1, n=10)
63.2 fps -3%
HP EliteBook x360 1040 G11
Intel Core Ultra 7 165H, Intel Arc 8-Core iGPU
61.7 (7min, 34.8P1) fps -5%
Dell XPS 13 9340 Core Ultra 7
Intel Core Ultra 7 155H, Intel Arc 8-Core iGPU
54 fps -17%
Lenovo ThinkBook 13x G4 21KR0008GE
Intel Core Ultra 5 125H, Intel Arc 7-Core iGPU
54 fps -17%
Framework Laptop 13.5 Ryzen 7 7840U
AMD Ryzen 7 7840U, AMD Radeon 780M
50.5 (17.2min, 27.8P1) fps -23%
Asus Zenbook S 13 OLED
AMD Ryzen 7 6800U, AMD Radeon 680M
46.6 (33.8min, 36.4P1) fps -29%
MSI Prestige 13 AI Evo
Intel Core Ultra 7 155H, Intel Arc 8-Core iGPU
41 fps -37%
Dell XPS 13 Plus 9320 i7-1280P OLED
Intel Core i7-1280P, Intel Iris Xe Graphics G7 96EUs
36.5 (18min, 19.9P1) fps -44%
Dell XPS 13 Plus 9320 4K
Intel Core i7-1260P, Intel Iris Xe Graphics G7 96EUs
36.4 (9.7min, 20.1P1) fps -44%
Dell XPS 13 Plus 9320 Core i7-1360P
Intel Core i7-1360P, Intel Iris Xe Graphics G7 96EUs
35.4 (5.4min, 17.4P1) fps -46%
HP Dragonfly G4
Intel Core i7-1365U, Intel Iris Xe Graphics G7 96EUs
30.4 (8.5min, 15.4P1) fps -53%
Asus ZenBook S13 OLED UX5304
Intel Core i7-1355U, Intel Iris Xe Graphics G7 96EUs
29.1 (8.4min, 14.7P1) fps -55%
Lenovo Yoga 6 13 83B2001SGE
AMD Ryzen 7 7730U, AMD Radeon RX Vega 8 (Ryzen 4000/5000)
27 (5.5min, 8.17P1) fps -59%
Dell XPS 13 Plus 9320 i5-1240p
Intel Core i5-1240P, Intel Iris Xe Graphics G7 80EUs
24.4 (8.4min, 13.2P1) fps -63%
Dell XPS 13 9315, i5-1230U
Intel Core i5-1230U, Intel Iris Xe Graphics G7 80EUs
17.8 (6.6min, 9.19P1) fps -73%
1920x1080 ultra AA:ultra AF:16
Dell XPS 13 9350
Intel Core Ultra 7 256V, Intel Arc Graphics 140V
58 (24.7min, 30.7P1) fps
Average Intel Arc Graphics 140V
  (39 - 62.5, n=10)
55.1 fps -5%
Asus Zenbook S 14 UX5406
Intel Core Ultra 7 258V, Intel Arc Graphics 140V
54 (32min, 42.8P1) fps -7%
HP EliteBook x360 1040 G11
Intel Core Ultra 7 165H, Intel Arc 8-Core iGPU
47.3 (5.3min, 10.1P1) fps -18%
Lenovo ThinkBook 13x G4 21KR0008GE
Intel Core Ultra 5 125H, Intel Arc 7-Core iGPU
44 fps -24%
Framework Laptop 13.5 Ryzen 7 7840U
AMD Ryzen 7 7840U, AMD Radeon 780M
43 (13.6min, 21.3P1) fps -26%
Dell XPS 13 9340 Core Ultra 7
Intel Core Ultra 7 155H, Intel Arc 8-Core iGPU
41 fps -29%
Asus Zenbook S 13 OLED
AMD Ryzen 7 6800U, AMD Radeon 680M
40.2 (17.3min, 27.4P1) fps -31%
MSI Prestige 13 AI Evo
Intel Core Ultra 7 155H, Intel Arc 8-Core iGPU
32 fps -45%
Dell XPS 13 Plus 9320 i7-1280P OLED
Intel Core i7-1280P, Intel Iris Xe Graphics G7 96EUs
29.6 (9min, 10.7P1) fps -49%
Dell XPS 13 Plus 9320 4K
Intel Core i7-1260P, Intel Iris Xe Graphics G7 96EUs
29.5 (8.2min, 10.5P1) fps -49%
Dell XPS 13 Plus 9320 Core i7-1360P
Intel Core i7-1360P, Intel Iris Xe Graphics G7 96EUs
27.5 (5.6min, 7.31P1) fps -53%
HP Dragonfly G4
Intel Core i7-1365U, Intel Iris Xe Graphics G7 96EUs
24.7 (5.3min, 6.86P1) fps -57%
Asus ZenBook S13 OLED UX5304
Intel Core i7-1355U, Intel Iris Xe Graphics G7 96EUs
23.6 (5min, 6.37P1) fps -59%
Lenovo Yoga 6 13 83B2001SGE
AMD Ryzen 7 7730U, AMD Radeon RX Vega 8 (Ryzen 4000/5000)
22.7 (5min, 5.54P1) fps -61%
Tiny Tina's Wonderlands - 1280x720 Lowest Preset (DX12)
Framework Laptop 13.5 Ryzen 7 7840U
AMD Ryzen 7 7840U, AMD Radeon 780M
111.8 fps +15%
Average Intel Arc Graphics 140V
  (96.9 - 111.4, n=4)
102.5 fps +6%
Dell XPS 13 9350
Intel Core Ultra 7 256V, Intel Arc Graphics 140V
96.9 fps
HP EliteBook x360 1040 G11
Intel Core Ultra 7 165H, Intel Arc 8-Core iGPU
80 fps -17%
Dell XPS 13 Plus 9320 Core i7-1360P
Intel Core i7-1360P, Intel Iris Xe Graphics G7 96EUs
53.5 fps -45%
HP Dragonfly G4
Intel Core i7-1365U, Intel Iris Xe Graphics G7 96EUs
53.2 fps -45%
F1 22
1280x720 Ultra Low Preset AA:T AF:16x
Average Intel Arc Graphics 140V
  (132.4 - 154.8, n=4)
142.3 fps +7%
Framework Laptop 13.5 Ryzen 7 7840U
AMD Ryzen 7 7840U, AMD Radeon 780M
133.2 (110min, 87P1) fps +1%
Dell XPS 13 9350
Intel Core Ultra 7 256V, Intel Arc Graphics 140V
132.4 (101min, 88P1) fps
HP EliteBook x360 1040 G11
Intel Core Ultra 7 165H, Intel Arc 8-Core iGPU
104.5 (86min, 78P1) fps -21%
MSI Prestige 13 AI Evo
Intel Core Ultra 7 155H, Intel Arc 8-Core iGPU
86.6 (72min, 63P1) fps -35%
Dell XPS 13 Plus 9320 Core i7-1360P
Intel Core i7-1360P, Intel Iris Xe Graphics G7 96EUs
81.5 (61min, 60P1) fps -38%
HP Dragonfly G4
Intel Core i7-1365U, Intel Iris Xe Graphics G7 96EUs
75.8 (55min, 56P1) fps -43%
Asus ZenBook S13 OLED UX5304
Intel Core i7-1355U, Intel Iris Xe Graphics G7 96EUs
71.8 (54min, 54P1) fps -46%
1920x1080 Low Preset AA:T AF:16x
Average Intel Arc Graphics 140V
  (79.1 - 101, n=4)
90.4 fps +14%
Framework Laptop 13.5 Ryzen 7 7840U
AMD Ryzen 7 7840U, AMD Radeon 780M
80.6 (70min, 55P1) fps +2%
Dell XPS 13 9350
Intel Core Ultra 7 256V, Intel Arc Graphics 140V
79.1 (63min, 61P1) fps
HP EliteBook x360 1040 G11
Intel Core Ultra 7 165H, Intel Arc 8-Core iGPU
71 (57min, 52P1) fps -10%
MSI Prestige 13 AI Evo
Intel Core Ultra 7 155H, Intel Arc 8-Core iGPU
59.1 (46min, 44P1) fps -25%
Dell XPS 13 Plus 9320 Core i7-1360P
Intel Core i7-1360P, Intel Iris Xe Graphics G7 96EUs
47.5 (40min, 37P1) fps -40%
HP Dragonfly G4
Intel Core i7-1365U, Intel Iris Xe Graphics G7 96EUs
43.6 (34min, 31P1) fps -45%
Asus ZenBook S13 OLED UX5304
Intel Core i7-1355U, Intel Iris Xe Graphics G7 96EUs
41.6 (33min, 31P1) fps -47%
Lenovo Yoga 6 13 83B2001SGE
AMD Ryzen 7 7730U, AMD Radeon RX Vega 8 (Ryzen 4000/5000)
35.1 (29min, 25P1) fps -56%
1920x1080 Medium Preset AA:T AF:16x
Average Intel Arc Graphics 140V
  (75.7 - 90, n=4)
83.3 fps +6%
Dell XPS 13 9350
Intel Core Ultra 7 256V, Intel Arc Graphics 140V
78.8 (37min, 40P1) fps
Framework Laptop 13.5 Ryzen 7 7840U
AMD Ryzen 7 7840U, AMD Radeon 780M
72.5 (58min, 45P1) fps -8%
HP EliteBook x360 1040 G11
Intel Core Ultra 7 165H, Intel Arc 8-Core iGPU
57.5 (49min, 37P1) fps -27%
MSI Prestige 13 AI Evo
Intel Core Ultra 7 155H, Intel Arc 8-Core iGPU
49.6 (41min, 37P1) fps -37%
Dell XPS 13 Plus 9320 Core i7-1360P
Intel Core i7-1360P, Intel Iris Xe Graphics G7 96EUs
42.8 (37min, 36P1) fps -46%
HP Dragonfly G4
Intel Core i7-1365U, Intel Iris Xe Graphics G7 96EUs
39.4 (33min, 30P1) fps -50%
Asus ZenBook S13 OLED UX5304
Intel Core i7-1355U, Intel Iris Xe Graphics G7 96EUs
36.6 (31min, 28P1) fps -54%
Lenovo Yoga 6 13 83B2001SGE
AMD Ryzen 7 7730U, AMD Radeon RX Vega 8 (Ryzen 4000/5000)
32.5 (26min, 24P1) fps -59%
1920x1080 High Preset AA:T AF:16x
Dell XPS 13 9350
Intel Core Ultra 7 256V, Intel Arc Graphics 140V
64.5 (45min, 43P1) fps
Average Intel Arc Graphics 140V
  (54.8 - 66.5, n=4)
62.4 fps -3%
Framework Laptop 13.5 Ryzen 7 7840U
AMD Ryzen 7 7840U, AMD Radeon 780M
54.2 (44min, 35P1) fps -16%
HP EliteBook x360 1040 G11
Intel Core Ultra 7 165H, Intel Arc 8-Core iGPU
43.5 (30min, 27P1) fps -33%
MSI Prestige 13 AI Evo
Intel Core Ultra 7 155H, Intel Arc 8-Core iGPU
36.8 (30min, 29P1) fps -43%
Dell XPS 13 Plus 9320 Core i7-1360P
Intel Core i7-1360P, Intel Iris Xe Graphics G7 96EUs
31.9 (24min, 26P1) fps -51%
Asus ZenBook S13 OLED UX5304
Intel Core i7-1355U, Intel Iris Xe Graphics G7 96EUs
27.6 (21min, 21P1) fps -57%
HP Dragonfly G4
Intel Core i7-1365U, Intel Iris Xe Graphics G7 96EUs
27.4 (22min, 22P1) fps -58%
Lenovo Yoga 6 13 83B2001SGE
AMD Ryzen 7 7730U, AMD Radeon RX Vega 8 (Ryzen 4000/5000)
23.6 (21min, 19P1) fps -63%
Cyberpunk 2077 2.1 Phantom Liberty
1280x720 Low Preset (FSR off)
Dell XPS 13 9350
Intel Core Ultra 7 256V, Intel Arc Graphics 140V
66.6 (50.2min) fps
Average Intel Arc Graphics 140V
  (58.8 - 68.8, n=5)
66.1 fps -1%
HP EliteBook x360 1040 G11
Intel Core Ultra 7 165H, Intel Arc 8-Core iGPU
48.9 (41min) fps -27%
1920x1080 Low Preset (FSR off)
Dell XPS 13 9350
Intel Core Ultra 7 256V, Intel Arc Graphics 140V
45.7 (36.4min) fps
Average Intel Arc Graphics 140V
  (30.5 - 47.3, n=12)
42.5 fps -7%
Asus Zenbook S 14 UX5406
Intel Core Ultra 7 258V, Intel Arc Graphics 140V
39.6 (31.4min) fps -13%
HP EliteBook x360 1040 G11
Intel Core Ultra 7 165H, Intel Arc 8-Core iGPU
31.5 (26.7min) fps -31%
Lenovo ThinkBook 13x G4 21KR0008GE
Intel Core Ultra 5 125H, Intel Arc 7-Core iGPU
23.2 (13.7min) fps -49%
1920x1080 Medium Preset (FSR off)
Dell XPS 13 9350
Intel Core Ultra 7 256V, Intel Arc Graphics 140V
37 (30.1min) fps
Average Intel Arc Graphics 140V
  (24.3 - 39.3, n=12)
34.9 fps -6%
Asus Zenbook S 14 UX5406
Intel Core Ultra 7 258V, Intel Arc Graphics 140V
31.7 (26.7min) fps -14%
HP EliteBook x360 1040 G11
Intel Core Ultra 7 165H, Intel Arc 8-Core iGPU
25.7 (22.2min) fps -31%
Lenovo ThinkBook 13x G4 21KR0008GE
Intel Core Ultra 5 125H, Intel Arc 7-Core iGPU
19.8 (11.5min) fps -46%
1920x1080 High Preset (FSR off)
Dell XPS 13 9350
Intel Core Ultra 7 256V, Intel Arc Graphics 140V
32 (26.2min) fps
Average Intel Arc Graphics 140V
  (20 - 34.4, n=12)
29.7 fps -7%
Asus Zenbook S 14 UX5406
Intel Core Ultra 7 258V, Intel Arc Graphics 140V
27.7 (22.8min) fps -13%
HP EliteBook x360 1040 G11
Intel Core Ultra 7 165H, Intel Arc 8-Core iGPU
23.9 (20.8min) fps -25%
Lenovo ThinkBook 13x G4 21KR0008GE
Intel Core Ultra 5 125H, Intel Arc 7-Core iGPU
16.6 (8.88min) fps -48%
1920x1080 Ultra Preset (FSR off)
Average Intel Arc Graphics 140V
  (17.5 - 30.1, n=12)
24.6 fps +29%
Asus Zenbook S 14 UX5406
Intel Core Ultra 7 258V, Intel Arc Graphics 140V
24.3 (19.9min) fps +27%
HP EliteBook x360 1040 G11
Intel Core Ultra 7 165H, Intel Arc 8-Core iGPU
21.6 (18.5min) fps +13%
Dell XPS 13 9350
Intel Core Ultra 7 256V, Intel Arc Graphics 140V
19.1 (15.5min) fps
Lenovo ThinkBook 13x G4 21KR0008GE
Intel Core Ultra 5 125H, Intel Arc 7-Core iGPU
14.8 (7.18min) fps -23%

Cyberpunk 2077 ultra FPS Chart

05101520Tooltip
Dell XPS 13 9350 Core Ultra 7 256V, Arc 140V: Ø22.2 (18.3-23.3)
düşükortayüksekultra
GTA V (2015) 154.9 149.4 60.8 25.6
Dota 2 Reborn (2015) 95.8 87 83 80.7
Final Fantasy XV Benchmark (2018) 79.4 46.1 31.5
X-Plane 11.11 (2018) 47.1 36.1 30.1
Far Cry 5 (2018) 80 52 45 42
Strange Brigade (2018) 201 84.4 65.2 58
Tiny Tina's Wonderlands (2022)
F1 22 (2022) 79.1 78.8 64.5
Baldur's Gate 3 (2023) 36.6 30.5 25.8 25.7
Cyberpunk 2077 2.1 Phantom Liberty (2023) 45.7 37 32 19.1

Emisyonlar

Sistem Gürültüsü

Dahili fanlar, daha yüksek yükler getirildiğinde çok daha uzun süre boşta kalmaları anlamında eskisinden bile daha sessizdir. Örneğin, eski XPS 13 9320 veya XPS 13 9340'ta sırasıyla 35 dB(A) veya 37 dB(A) olan fan gürültüsü, 3DMark 06'da ilk benchmark sahnesini çalıştırdıktan sonra sadece 26,2 dB(A)'da zirveye ulaşır.

Oyun oynarken Performans modunda bile sadece 34 dB(A) fan gürültüsüne neden olur, ancak CPU Prime95 stresini çalıştırırken olduğu gibi yüzde 100 kullanımdaysa bu 45 dB(A)'ya kadar çıkabilir. Performans modu yerine Dengeli modda çalıştırmak fan gürültüsü tavanını 33 ila 38 dB(A) aralığına düşürecektir.

Fan gürültü profili (Beyaz: Arka plan, Kırmızı: Sistem boşta, Mavi: 3DMark 06, Turuncu: Cyberpunk 2077, Yeşil: Prime95 stres)

Ses yüksekliği

Boşta
24.4 / 24.4 / 24.4 dB
Çalışırken
26.2 / 45.2 dB
  red to green bar
 
 
30 dB
sessiz
40 dB(A)
duyulabilirlik
50 dB(A)
gürültülü
 
min: dark, med: mid, max: light   Earthworks M23R, Arta (15 cm uzaklık)   environment noise: 24.1 dB(A)
dB(A) 0102030405060708090Deep BassMiddle BassHigh BassLower RangeMidsHigher MidsLower HighsMid HighsUpper HighsSuper Highs2039.836.835.936.638.22527.427.224.927.325.73124.826.422.123.724.44021.722.220.118.821.65025.924.221.222.724.16324.424232424.38028.428.726.226.327.810024.424.222.922.623.712520.919.41918.32416020.12018.617.421.920021.12019.717.322.325021.218.718.317.62631523.62321.62126.940023.219.218.11730.4500231715.814.23163021.515.213.613.632.180020.311.811.210.732.2100022.910.59.89.731.9125022.79.79.49.533.3160022.39.89.69.534.7200022.710.39.89.934.5250022.910.91010.134.8315023.812.310.510.634.6400024.21410.81134.7500021.515.311.511.633.4630019.51511.411.432.7800018.314.711.711.529.71000013.614.311.811.527.71250013.113.512.611.924.61600012.512.612.51119.2SPL34.226.224.424.145.2N20.80.60.65.1median 21.5median 14.7median 11.8median 11.5median 31Delta1.94.14.13.14.5hearing rangehide median Fan NoiseDell XPS 13 9350
Dell XPS 13 9350
Arc 140V, Core Ultra 7 256V, Micron 2550 512GB
Dell XPS 13 Plus 9320 i7-1280P OLED
Iris Xe G7 96EUs, i7-1280P, WDC PC SN810 512GB
Lenovo ThinkBook 13x G4 21KR0008GE
Arc 7-Core, Ultra 5 125H, Samsung PM9C1a MZAL8512HDLU
HP Dragonfly G4
Iris Xe G7 96EUs, i7-1365U, Micron 3400 MTFDKBA512TFH 512GB
Asus ZenBook S13 OLED UX5304
Iris Xe G7 96EUs, i7-1355U, Samsung PM9A1 MZVL21T0HCLR
MSI Prestige 13 AI Evo
Arc 8-Core, Ultra 7 155H, Samsung PM9A1 MZVL21T0HCLR
Noise
-1%
-5%
3%
-3%
-4%
off / environment *
24.1
23.4
3%
24.5
-2%
23.3
3%
23.3
3%
23.4
3%
Idle Minimum *
24.4
23.4
4%
24.5
-0%
23.5
4%
23.3
5%
23.4
4%
Idle Average *
24.4
23.4
4%
24.5
-0%
23.5
4%
23.3
5%
26.9
-10%
Idle Maximum *
24.4
23.4
4%
27.1
-11%
26.8
-10%
23.3
5%
26.9
-10%
Load Average *
26.2
35
-34%
33.3
-27%
27.2
-4%
37.7
-44%
32
-22%
Cyberpunk 2077 ultra *
34.2
Load Maximum *
45.2
39.9
12%
40.7
10%
35
23%
40.1
11%
40.3
11%
Witcher 3 ultra *
41.6
36.8
32.7
40.1
32

* ... smaller is better

Sıcaklık

Yüzey sıcaklıkları, yakın zamanda üretilenler de dahil olmak üzere eski seçeneklere göre kayda değer bir gelişmedir XPS 13 9340. Klavye ve alt kapaktaki sıcak noktalar, benzer zorlu yükler altında XPS 13 9340'taki 41 C ve 44 C'ye kıyasla sırasıyla sadece 35 C ve 38 C'ye ulaşır. Yeni XPS 13 tasarımına yönelik eleştirilerimizden biri nispeten yüksek yüzey sıcaklıklarıydı, ancak XPS 13 9350 kesinlikle şimdiye kadarki en soğuk yinelemelerden biri.

AC adaptörü zorlu yükleri çalıştırırken 35 C'nin üzerine ulaşır
Çift arka egzoz
Çift arka egzoz
Maksimum yük
 28 °C34.8 °C34.2 °C 
 23.6 °C28 °C26.8 °C 
 26.2 °C26.6 °C27.6 °C 
Maksimum: 34.8 °C
Ortalama: 28.4 °C
35.8 °C37.4 °C34.4 °C
31.2 °C35.8 °C32.6 °C
29.2 °C30.8 °C29.2 °C
Maksimum: 37.4 °C
Ortalama: 32.9 °C
Güç kaynağı  37.4 °C | Oda sıcaklığı 20 °C | Fluke 62 Mini IR Thermometer
(+) The average temperature for the upper side under maximal load is 28.4 °C / 83 F, compared to the average of 30.8 °C / 87 F for the devices in the class Subnotebook.
(+) The maximum temperature on the upper side is 34.8 °C / 95 F, compared to the average of 35.9 °C / 97 F, ranging from 21.4 to 59 °C for the class Subnotebook.
(+) The bottom heats up to a maximum of 37.4 °C / 99 F, compared to the average of 39.4 °C / 103 F
(+) In idle usage, the average temperature for the upper side is 24.9 °C / 77 F, compared to the device average of 30.8 °C / 87 F.
(+) The palmrests and touchpad are cooler than skin temperature with a maximum of 27.6 °C / 81.7 F and are therefore cool to the touch.
(±) The average temperature of the palmrest area of similar devices was 28.3 °C / 82.9 F (+0.7 °C / 1.2 F).
Sistem boşta (C kapağı)
Sistem boşta (D kapağı)
Prime95+FurMark stres (C kapak)
Prime95+FurMark stres (D kapak)
Dell XPS 13 9350
Intel Core Ultra 7 256V, Intel Arc Graphics 140V
Dell XPS 13 9340 Core Ultra 7
Intel Core Ultra 7 155H, Intel Arc 8-Core iGPU
Lenovo ThinkBook 13x G4 21KR0008GE
Intel Core Ultra 5 125H, Intel Arc 7-Core iGPU
HP Dragonfly G4
Intel Core i7-1365U, Intel Iris Xe Graphics G7 96EUs
Asus ZenBook S13 OLED UX5304
Intel Core i7-1355U, Intel Iris Xe Graphics G7 96EUs
MSI Prestige 13 AI Evo
Intel Core Ultra 7 155H, Intel Arc 8-Core iGPU
Heat
-8%
-12%
-10%
-14%
-5%
Maximum Upper Side *
34.8
41
-18%
43.1
-24%
38.6
-11%
43.1
-24%
40.9
-18%
Maximum Bottom *
37.4
43.5
-16%
39.2
-5%
40.4
-8%
45
-20%
40.4
-8%
Idle Upper Side *
25.4
25.3
-0%
28.3
-11%
28.2
-11%
27.3
-7%
25
2%
Idle Bottom *
26.2
25.5
3%
28
-7%
29
-11%
27.8
-6%
25.5
3%

* ... smaller is better

Konuşmacılar

Pembe gürültü, boyuta göre makul bir maksimum ses seviyesi gösteriyor ancak bas üretimi zayıf. HP Spectre serisi hem daha geniş hem de daha yüksek ses sunuyor
dB(A) 0102030405060708090Deep BassMiddle BassHigh BassLower RangeMidsHigher MidsLower HighsMid HighsUpper HighsSuper Highs2036.135.936.12527.624.927.63125.122.125.14020.320.120.35023.921.223.96328.82328.88039.926.239.910049.422.949.412552.11952.116059.818.659.820061.419.761.425058.218.358.231556.621.656.640056.518.156.550064.115.864.163068.213.668.280071.611.271.6100073.39.873.3125069.99.469.9160073.89.673.82000739.873250072.91072.9315072.710.572.7400067.110.867.1500066.111.566.1630067.411.467.4800057.111.757.11000057.511.857.51250059.612.659.61600064.812.564.8SPL82.624.482.6N53.60.653.6median 64.8median 11.8median 64.8Delta6.94.16.926.325.821.422.12624.925.127.622.532.523.448.72655.818.860.922.167.2267019.372.317.674.217.774.319.575.31571.711.871.311.27410.574.21072.710.17210.67210.97511.374.811.671.71269.71269.612.371.112.669.61270.111.269.824.784.70.666.6median 12median 71.73.42.2hearing rangehide median Pink NoiseDell XPS 13 9350Apple MacBook Pro 16 2021 M1 Pro
Frequency diagram (checkboxes can be checked and unchecked to compare devices)
Dell XPS 13 9350 audio analysis

(+) | speakers can play relatively loud (82.6 dB)
Bass 100 - 315 Hz
(±) | reduced bass - on average 8.5% lower than median
(±) | linearity of bass is average (8.3% delta to prev. frequency)
Mids 400 - 2000 Hz
(±) | higher mids - on average 6.2% higher than median
(+) | mids are linear (5.9% delta to prev. frequency)
Highs 2 - 16 kHz
(±) | higher highs - on average 5.3% higher than median
(+) | highs are linear (5.1% delta to prev. frequency)
Overall 100 - 16.000 Hz
(+) | overall sound is linear (13% difference to median)
Compared to same class
» 18% of all tested devices in this class were better, 4% similar, 79% worse
» The best had a delta of 5%, average was 19%, worst was 53%
Compared to all devices tested
» 11% of all tested devices were better, 2% similar, 87% worse
» The best had a delta of 4%, average was 25%, worst was 134%

Apple MacBook Pro 16 2021 M1 Pro audio analysis

(+) | speakers can play relatively loud (84.7 dB)
Bass 100 - 315 Hz
(+) | good bass - only 3.8% away from median
(+) | bass is linear (5.2% delta to prev. frequency)
Mids 400 - 2000 Hz
(+) | balanced mids - only 1.3% away from median
(+) | mids are linear (2.1% delta to prev. frequency)
Highs 2 - 16 kHz
(+) | balanced highs - only 1.9% away from median
(+) | highs are linear (2.7% delta to prev. frequency)
Overall 100 - 16.000 Hz
(+) | overall sound is linear (4.6% difference to median)
Compared to same class
» 0% of all tested devices in this class were better, 0% similar, 100% worse
» The best had a delta of 5%, average was 18%, worst was 45%
Compared to all devices tested
» 0% of all tested devices were better, 0% similar, 100% worse
» The best had a delta of 4%, average was 25%, worst was 134%

Enerji Yönetimi

Güç Tüketimi

Tüketim, en düşük parlaklık ayarında yalnızca <1,4 W ile maksimum parlaklık ve Performans modunda yalnızca 5 W'a kadar inanılmaz derecede düşüktür. Düşük rölanti sayıları muhtemelen aşağıdaki Pil Ömrü bölümümüzde yer alan çok uzun WLAN çalışma süresinden sorumludur. Lenovo ThinkBook 13x gibi alternatif 13 inç dizüstü bilgisayarlar veya HP Dragonfly G4 birkaç watt ile nispeten daha yüksek minimum ve maksimum değerlere sahip olacaktır.

Sistem oyun oynarken 46 W talep ediyor ve bu da yukarıda bahsedilenler gibi rakip 13 inç alt dizüstü bilgisayarlardan neredeyse 10 W daha fazla. Bununla birlikte, Dell sistemi GPU Performansı bölümümüzde belirtildiği gibi önemli ölçüde daha hızlı grafik performansı sunar ve bu nedenle tüketimdeki artış, watt başına performans açısından tartışmaya değerdir.

Ekstra küçük (~6,5 x 5,5 x 2,2 cm) 60 W USB-C AC adaptörü, zorlu yükleri ve pil şarjını aynı anda çalıştırmayı destekleyebilir. CPU yüzde 100 kullanımdaysa tüketim 55 W'ın üzerine çıkabilir, ancak bu oran aşağıdaki ekran görüntülerinde gösterildiği gibi yalnızca geçicidir.

3DMark 06 tüketim
3DMark 06 tüketim
Cyberpunk 2077 1080p Ultra tüketim
Tüketim, Prime95 stresini başlatırken 54 W'a yükselir ve maksimum Turbo Boost potansiyeli sınırlı olduğu için 60 saniye sonra 42 W'a düşer
Prime95+FurMark stresi 10s işaretinde başlatıldı
Anlık tüketim
Kapalı / Bekleme modudarklight 0.35 / 0.56 Watt
Boştadarkmidlight 1.3 / 2.5 / 4.1 Watt
Çalışırken midlight 40.1 / 57.3 Watt
 color bar
Key: min: dark, med: mid, max: light        Metrahit Energy
Dell XPS 13 9350
Core Ultra 7 256V, Arc 140V, Micron 2550 512GB, IPS, 1920x1200, 13.4"
Dell XPS 13 Plus 9320 i7-1280P OLED
i7-1280P, Iris Xe G7 96EUs, WDC PC SN810 512GB, OLED, 3456x2160, 13.4"
Lenovo ThinkBook 13x G4 21KR0008GE
Ultra 5 125H, Arc 7-Core, Samsung PM9C1a MZAL8512HDLU, IPS, 2880x1920, 13.5"
HP Dragonfly G4
i7-1365U, Iris Xe G7 96EUs, Micron 3400 MTFDKBA512TFH 512GB, IPS, 1920x1280, 13.5"
Asus ZenBook S13 OLED UX5304
i7-1355U, Iris Xe G7 96EUs, Samsung PM9A1 MZVL21T0HCLR, OLED, 2880x1800, 13.3"
MSI Prestige 13 AI Evo
Ultra 7 155H, Arc 8-Core, Samsung PM9A1 MZVL21T0HCLR, OLED, 2880x1800, 13.3"
Power Consumption
-176%
-137%
-104%
-139%
-116%
Idle Minimum *
1.3
6.5
-400%
5.4
-315%
4.1
-215%
5.8
-346%
4.5
-246%
Idle Average *
2.5
7.8
-212%
7.8
-212%
7.5
-200%
8.5
-240%
8
-220%
Idle Maximum *
4.1
13
-217%
8.9
-117%
8.2
-100%
8.8
-115%
8.7
-112%
Load Average *
40.1
56.6
-41%
49.4
-23%
35.5
11%
35.1
12%
36.1
10%
Cyberpunk 2077 ultra external monitor *
43.1
Cyberpunk 2077 ultra *
46.1
Load Maximum *
57.3
63
-10%
68.8
-20%
66.5
-16%
59.5
-4%
65
-13%
Witcher 3 ultra *
49.2
44.4
37.5
27.6
29.7

* ... smaller is better

Power Consumption Cyberpunk / Stress Test

051015202530354045505560Tooltip
Dell XPS 13 9350 Core Ultra 7 256V, Arc 140V; 1280x720 Prime95 28.10 and Furmark 1.25: Ø49.1 (41.9-57.2)
Dell XPS 13 9340 Core Ultra 7 Ultra 7 155H, Arc 8-Core; 1280x720 Prime95 28.10 and Furmark 1.25: Ø45.9 (36.1-62.7)
Dell XPS 13 9350 Core Ultra 7 256V, Arc 140V; Idle 150cd/m2: Ø1.954 (1.813-3.29)
Dell XPS 13 9340 Core Ultra 7 Ultra 7 155H, Arc 8-Core; Idle 150cd/m2: Ø5.65 (4.77-8.8)
Dell XPS 13 9350 Core Ultra 7 256V, Arc 140V; Cyberpunk 2077 FHD ultra no FSR 150cd: Ø46.1 (45.1-50.7)

Power Consumption external Monitor

051015202530354045505560Tooltip
Dell XPS 13 9350 Core Ultra 7 256V, Arc 140V; Prime95 V2810 Stress (external Monitor): Ø46.1 (42.2-54.3)
Dell XPS 13 9340 Core Ultra 7 Ultra 7 155H, Arc 8-Core; Prime95 V2810 Stress (external Monitor): Ø47.3 (35.8-62.4)
Dell XPS 13 9350 Core Ultra 7 256V, Arc 140V; Cinebench R15 Multi (external Monitor): Ø50.9 (49.9-51.9)
Dell XPS 13 9340 Core Ultra 7 Ultra 7 155H, Arc 8-Core; Cinebench R15 Multi (external Monitor): Ø60.7 (56.8-61.4)
Dell XPS 13 9350 Core Ultra 7 256V, Arc 140V; 1280x720 FurMark 1.19 GPU Stress Test (external Monitor): Ø35.2 (32.7-44.8)
Dell XPS 13 9340 Core Ultra 7 Ultra 7 155H, Arc 8-Core; 1280x720 FurMark 1.19 GPU Stress Test (external Monitor): Ø40.3 (32.6-57.5)
Dell XPS 13 9350 Core Ultra 7 256V, Arc 140V; Idle 1min (external Monitor): Ø1.596 (1.324-3.63)
Dell XPS 13 9340 Core Ultra 7 Ultra 7 155H, Arc 8-Core; Idle 1min (external Monitor): Ø6.88 (5.99-8.6)
Dell XPS 13 9350 Core Ultra 7 256V, Arc 140V; Cyberpunk 2077 FHD ultra no FSR (external Monitor): Ø43.1 (39.3-47.2)

Pil Ömrü

Çalışma süreleri, tıpkı diğer Lunar Lake dizüstü bilgisayarlarda keşfettiğimiz gibi önemli ölçüde iyileşti. Önceki XPS 13 konfigürasyonlarını ve diğer 13 inç alt dizüstü bilgisayarların çoğunu kolayca geride bırakacak şekilde 20 saatin üzerinde gerçek dünya WLAN taraması kaydedebildik. Daha da şaşırtıcı olanı, çalışma süresi avantajına rağmen pil kapasitesinin aynı rakiplerin çoğundan daha küçük kalmasıdır.

Ürünle birlikte verilen AC adaptörü ile boştan tam kapasiteye şarj etmek yaklaşık 140 dakika ile beklenenden biraz daha uzun sürüyor.

Batarya ömrü
Boşta (WLAN kapalı, minimum parlaklık)
56h 47min
WiFi Websurfing
20h 36min
Çalışırken (maksimum parlaklık)
2h 22min
Dell XPS 13 9350
Core Ultra 7 256V, Arc 140V, 55 Wh
Dell XPS 13 Plus 9320 i7-1280P OLED
i7-1280P, Iris Xe G7 96EUs, 55 Wh
Lenovo ThinkBook 13x G4 21KR0008GE
Ultra 5 125H, Arc 7-Core, 74 Wh
HP Dragonfly G4
i7-1365U, Iris Xe G7 96EUs, 68 Wh
Asus ZenBook S13 OLED UX5304
i7-1355U, Iris Xe G7 96EUs, 63 Wh
MSI Prestige 13 AI Evo
Ultra 7 155H, Arc 8-Core, 75 Wh
Battery Runtime
-72%
-32%
-4%
-21%
-13%
Reader / Idle
3407
2550
-25%
WiFi v1.3
1236
346
-72%
684
-45%
954
-23%
678
-45%
694
-44%
Load
142
116
-18%
192
35%
146
3%
169
19%
H.264
1229
829
1002

Notebookcheck Değerlendirmesi

Lunar Lake, XPS 13'ü MacBook Air 13 serisine karşı daha iyi bir rakip haline getirdi.

Dell XPS 13 9350 - 11/05/2024 v8
Allen Ngo

İşcilik
87 / 98 → 88%
Klavye
78%
Mouse
83%
Bağlanılabilirlik
60 / 74 → 81%
Ağırlık
73 / 20-77 → 92%
Batarya
92%
Görüntü
86%
Oyun performansı
52 / 75 → 70%
Uygulama performansı
82 / 92 → 89%
AI Performance
89%
Isınma
94%
Ses
89%
Audio
77 / 91 → 84%
Camera
32 / 75 → 42%
Ortalama
71%
85%
Subnotebook - Ortalama Ağırlık
CO2 Emissions
No Data
Materials
100%
Packaging
100%
Power Use
88%
Repairability
40%
Software Updates
22.3%
Recycle Logo Total Sustainability Score: 58.4%

Transparency

The selection of devices to be reviewed is made by our editorial team. The test sample was provided to the author as a loan by the manufacturer or retailer for the purpose of this review. The lender had no influence on this review, nor did the manufacturer receive a copy of this review before publication. There was no obligation to publish this review. We never accept compensation or payment in return for our reviews. As an independent media company, Notebookcheck is not subjected to the authority of manufacturers, retailers or publishers.

This is how Notebookcheck is testing

Every year, Notebookcheck independently reviews hundreds of laptops and smartphones using standardized procedures to ensure that all results are comparable. We have continuously developed our test methods for around 20 years and set industry standards in the process. In our test labs, high-quality measuring equipment is utilized by experienced technicians and editors. These tests involve a multi-stage validation process. Our complex rating system is based on hundreds of well-founded measurements and benchmarks, which maintains objectivity. Further information on our test methods can be found here.

Please share our article, every link counts!
Mail Logo
> Notebooklar Hakkında Aradığınız Herşey > İnceleme > Dell XPS 13 9350 dizüstü bilgisayar incelemesi: Intel Lunar Lake mükemmel uyum sağlıyor
Allen Ngo, 2024-11- 7 (Update: 2024-11- 7)