

Dell XPS 13 9345 Snapdragon X Elite incelemesi: Intel Core Ultra 7'nin altını oyuyor

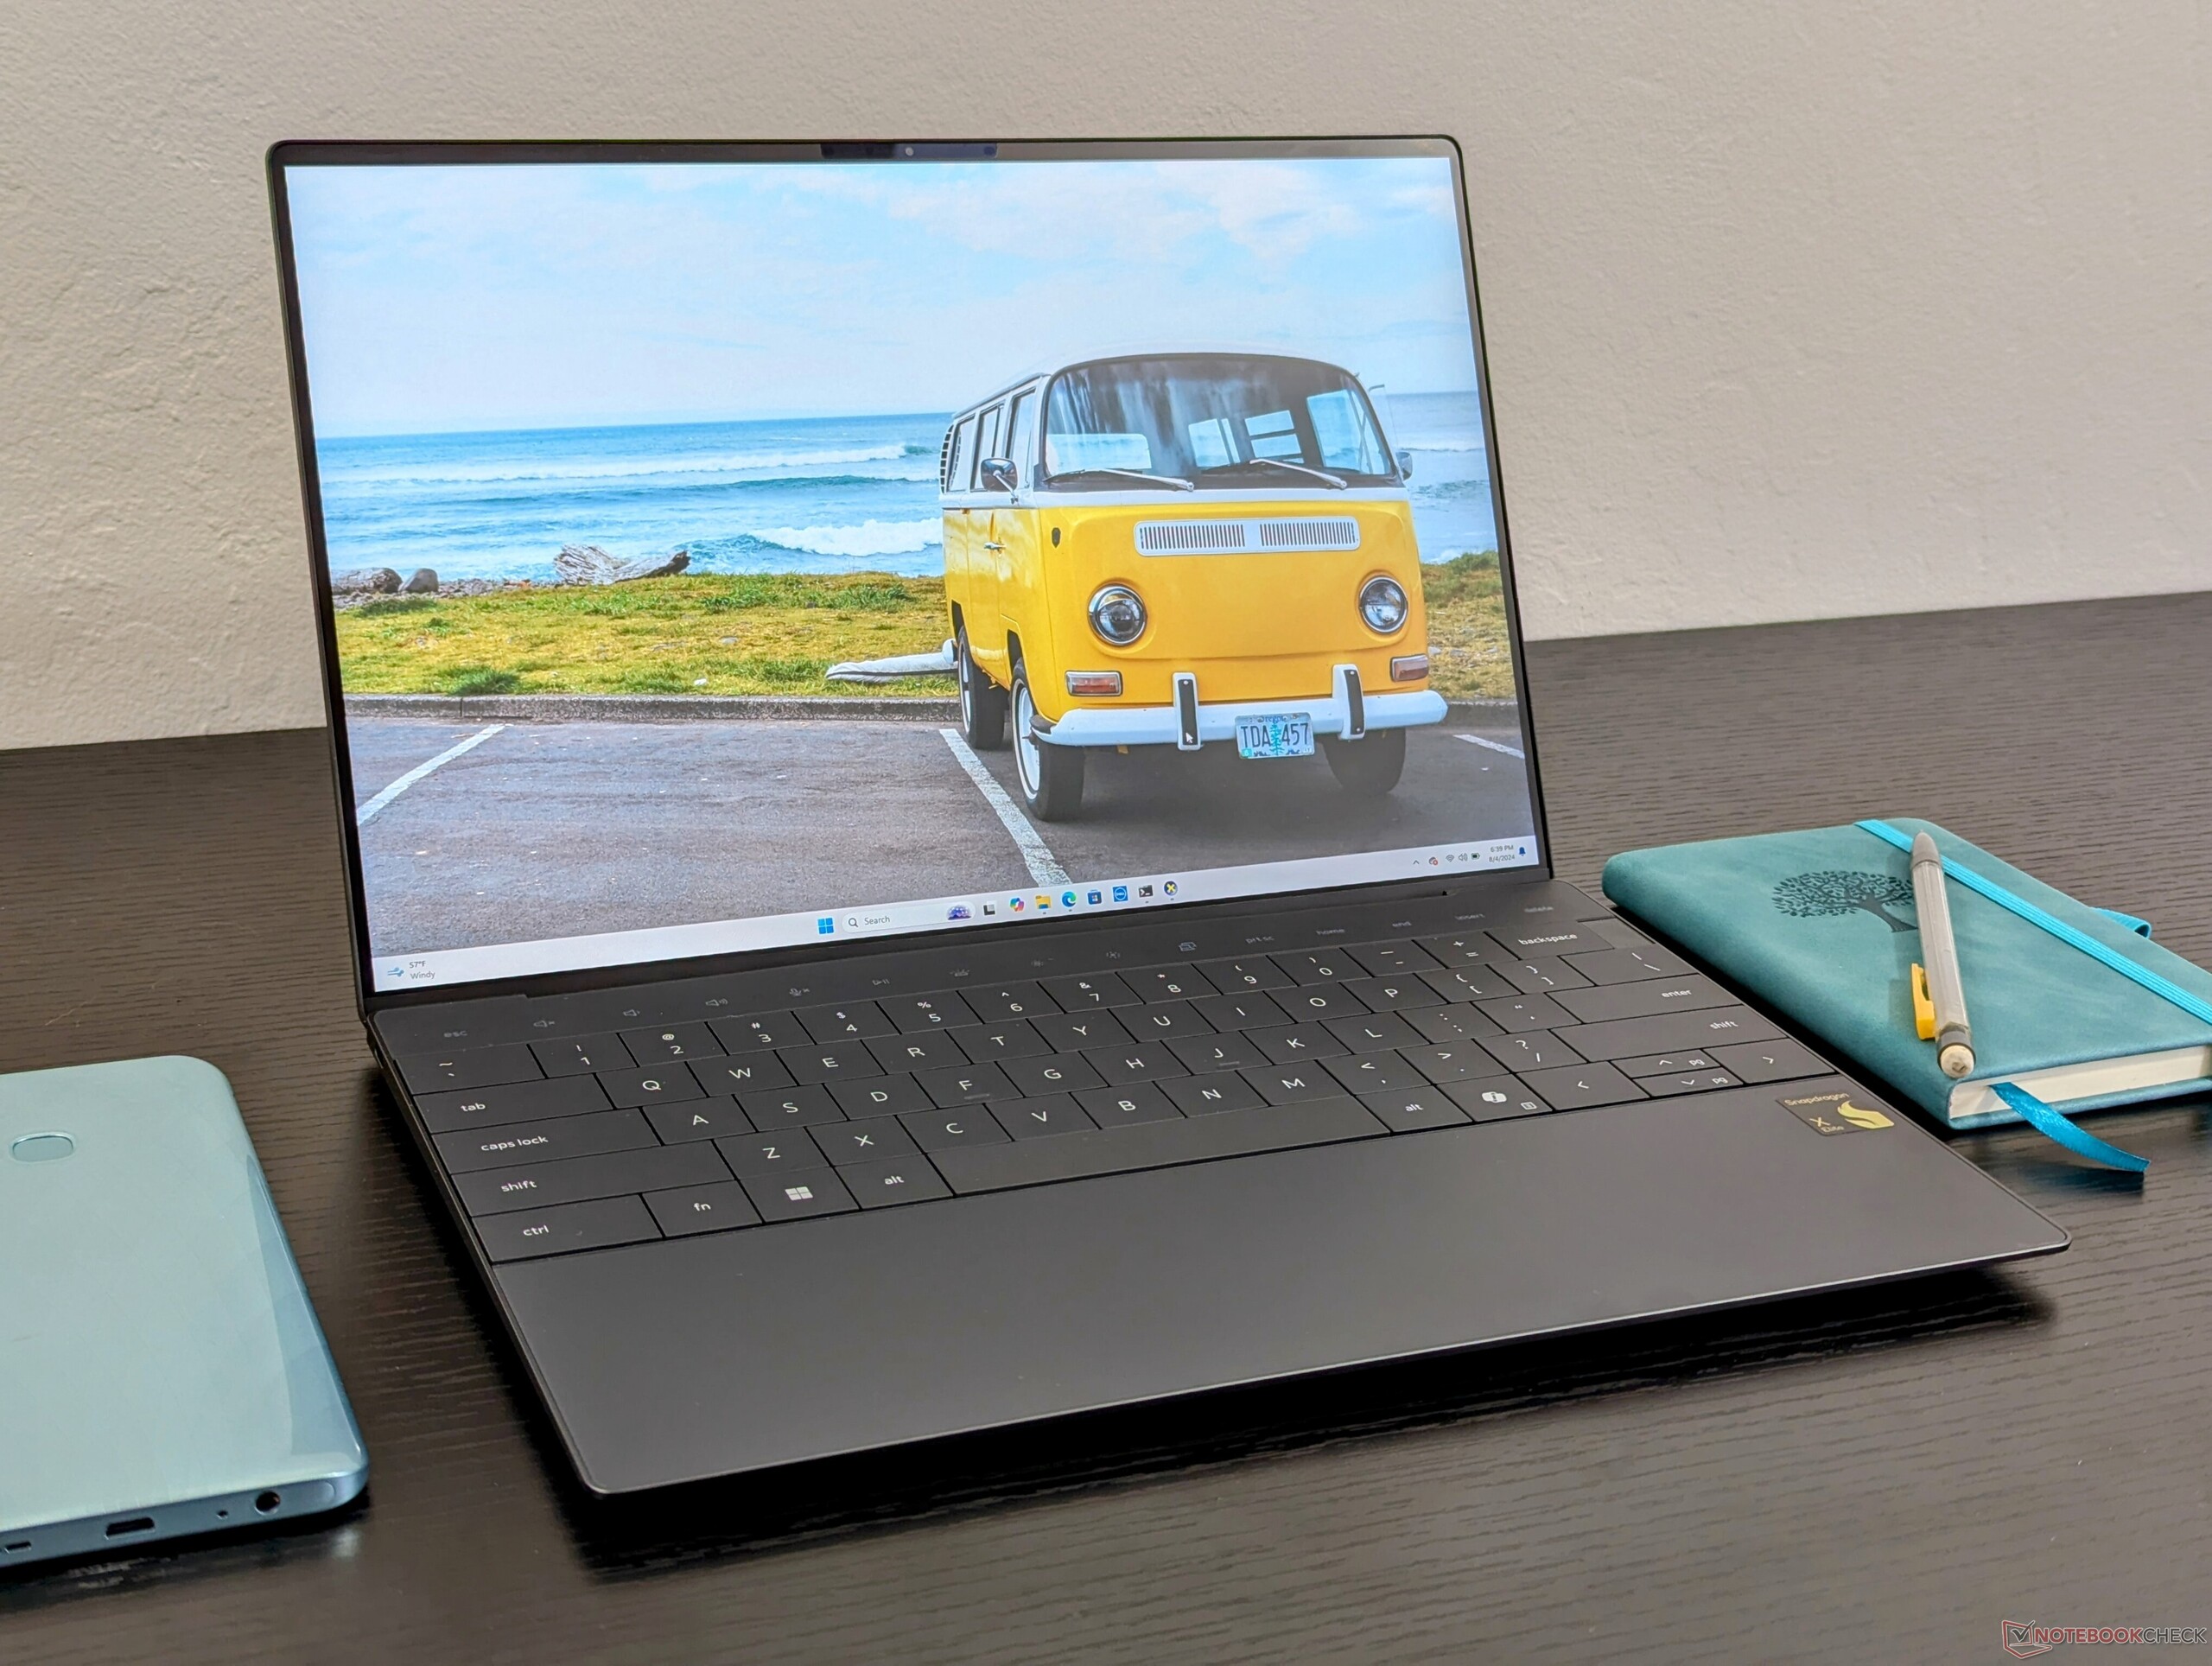
İşlemcinizi göstermek için Dell'in en popüler tüketici dizüstü bilgisayarlarından birinde piyasaya sürmekten daha iyi bir yol olabilir mi? XPS 13 Plus 9320/9340 kasası, en yeni Snapdragon X Elite CPU ile yeniden tasarlanarak bu yıl piyasaya sürülen Qualcomm destekli az sayıdaki Windows dizüstü bilgisayar arasında yerini aldı. XPS 13 9345 olarak adlandırılan Snapdragon modeli, görsel olarak mevcut modelle aynı XPS 13 Plus 9320 veya 9340 geleneksel Intel CPU'lar ile.
İnceleme yapılandırmamız yaklaşık 1300 USD karşılığında Snapdragon X1 Elite X1E-80-100, 16 GB LPDDR5X-8448 RAM ve 1200p 120 Hz IPS ekran ile donatılmıştır. Daha üst düzey OLED paneller mevcuttur ve bazı bölgelerde ikinci bir Snapdragon X1 Plus X1P işlemci seçeneği bulunabilir, ancak entegre GPU genel olarak aynı kalır.
XPS 13 9345'in alternatifleri arasında şunlar yer alıyor Microsoft Surface Pro veya Samsung Galaxy Book4 Edge 16 her ikisi de aynı Snapdragon X1 Elite X1E-80-100 işlemciden güç alıyor. Tabii ki, aynı zamanda daha geleneksel 13 inç ve 14 inç ofis alt dizüstü bilgisayarları ile doğrudan rekabet ediyor Lenovo ThinkBook 13x G4, Asus ZenBook S13veya Dell'in kendi XPS 13 9340'ı.
Daha fazla Dell incelemesi:
Karşılaştırmalı olarak olası rakipler
Derecelendirme | Sürüm | Tarih | Modeli | Ağırlık | Yükseklik | Boyut | Çözünürlük | Fiyat |
|---|---|---|---|---|---|---|---|---|
| 84.5 % | v8 | 08/2024 | Dell XPS 13 9345 SD X Elite X1E-80-100, Adreno X1-85 3.8 TFLOPS | 1.2 kg | 15.3 mm | 13.40" | 1920x1200 | |
| 86.5 % v7 (old) | v7 (old) | 05/2024 | Dell XPS 13 9340 Core Ultra 7 Ultra 7 155H, Arc 8-Core | 1.2 kg | 15.3 mm | 13.40" | 1920x1200 | |
| 86.2 % | v8 | 07/2024 | Microsoft Surface Laptop 7 13.8 Copilot+ SD X Elite X1E-80-100, Adreno X1-85 3.8 TFLOPS | 1.3 kg | 17.5 mm | 13.80" | 2304x1536 | |
| 90.1 % v7 (old) | v7 (old) | 05/2024 | Lenovo ThinkBook 13x G4 21KR0008GE Ultra 5 125H, Arc 7-Core | 1.2 kg | 12.9 mm | 13.50" | 2880x1920 | |
| 82.3 % | v8 | 07/2024 | HP EliteBook Ultra G1q 14 SD X Elite X1E-78-100, Adreno X1-85 3.8 TFLOPS | 1.3 kg | 11.2 mm | 14.00" | 2240x1400 | |
| 85.4 % v7 (old) | v7 (old) | 05/2023 | Asus ZenBook S13 OLED UX5304 i7-1355U, Iris Xe G7 96EUs | 1 kg | 11.8 mm | 13.30" | 2880x1800 |
İpucu: Derecelendirme Sistemimizi kısa bir süre önce güncelledik ve Sürüm 8'in sonuçları Sürüm 7'nin sonuçlarıyla karşılaştırılamaz. Daha fazla bilgi için hier verfügbar.
Not: Derecelendirme sistemimizi yakın zamanda güncelledik ve 8. sürümün sonuçları 7. sürümün sonuçları ile karşılaştırılamaz. Daha fazla bilgi için burada .
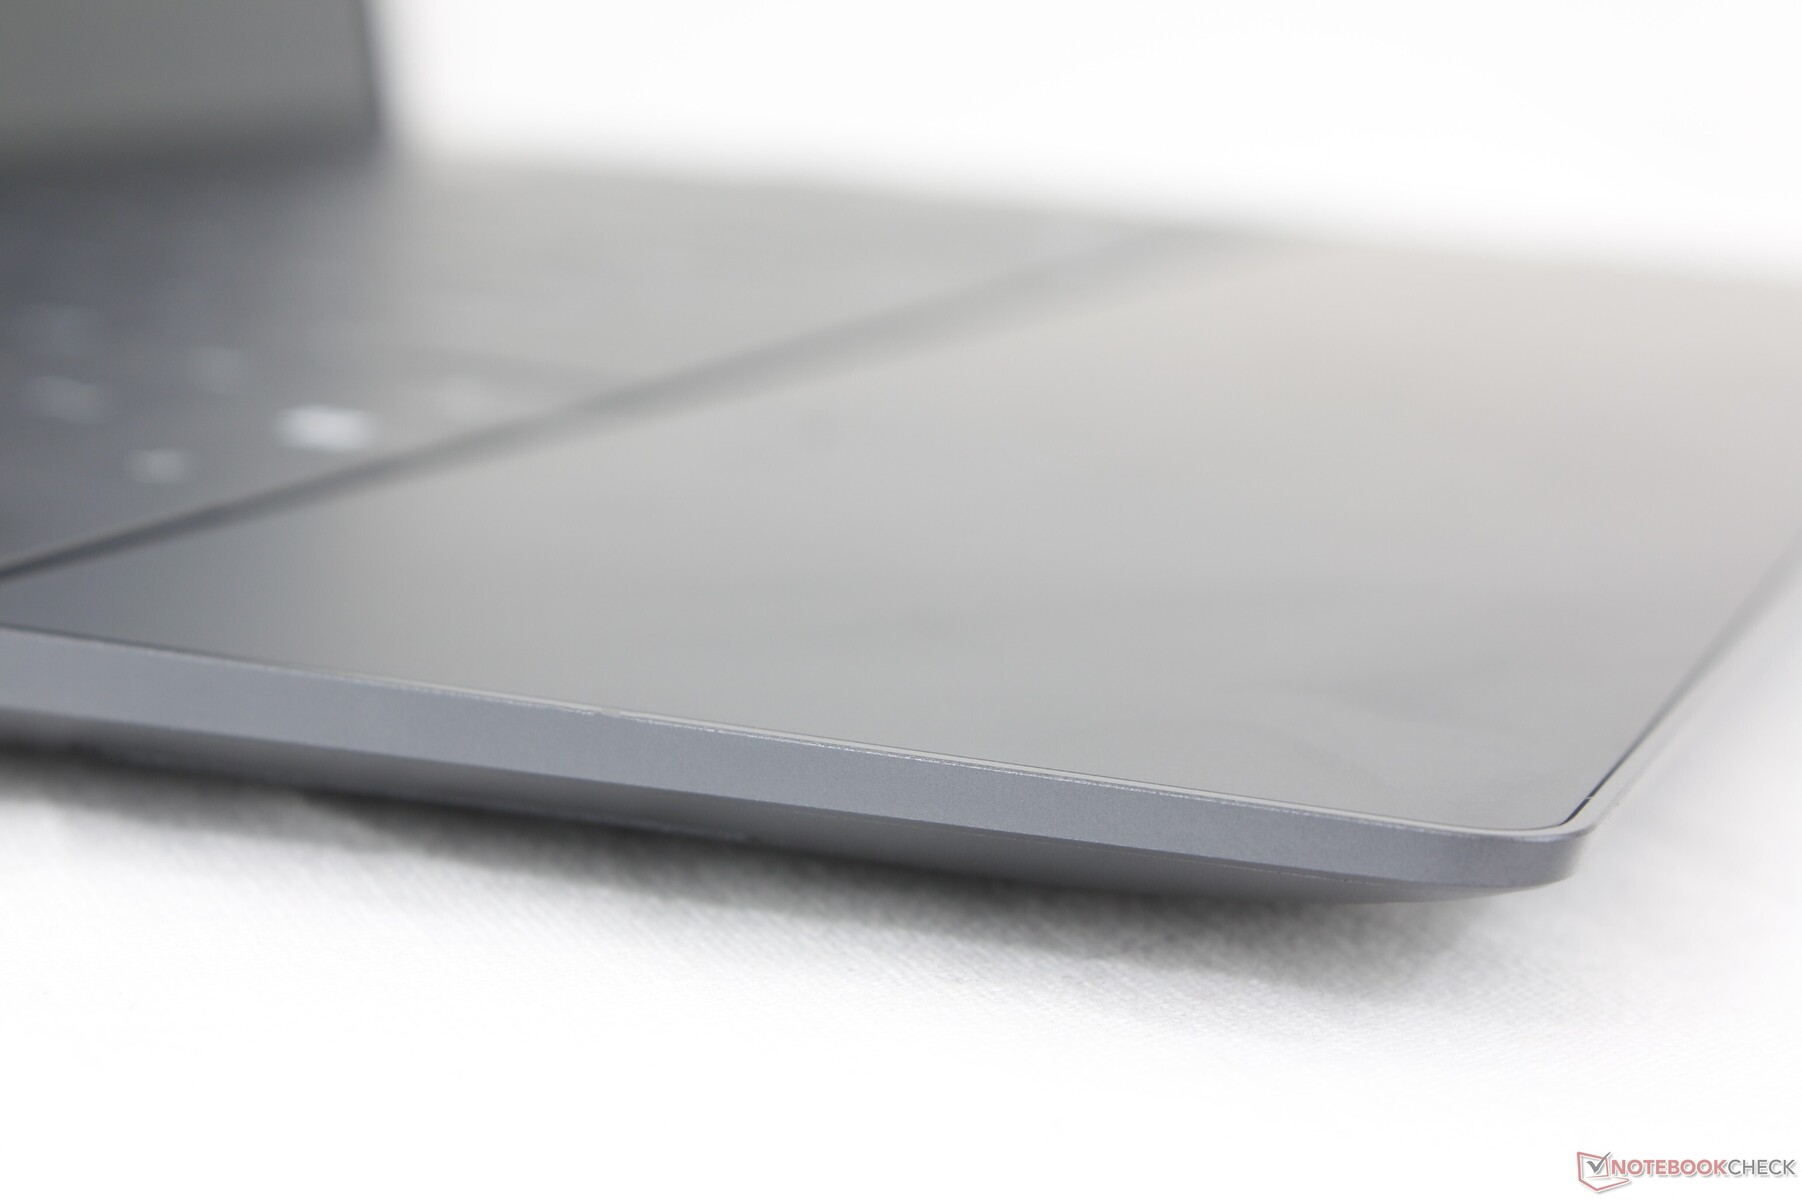
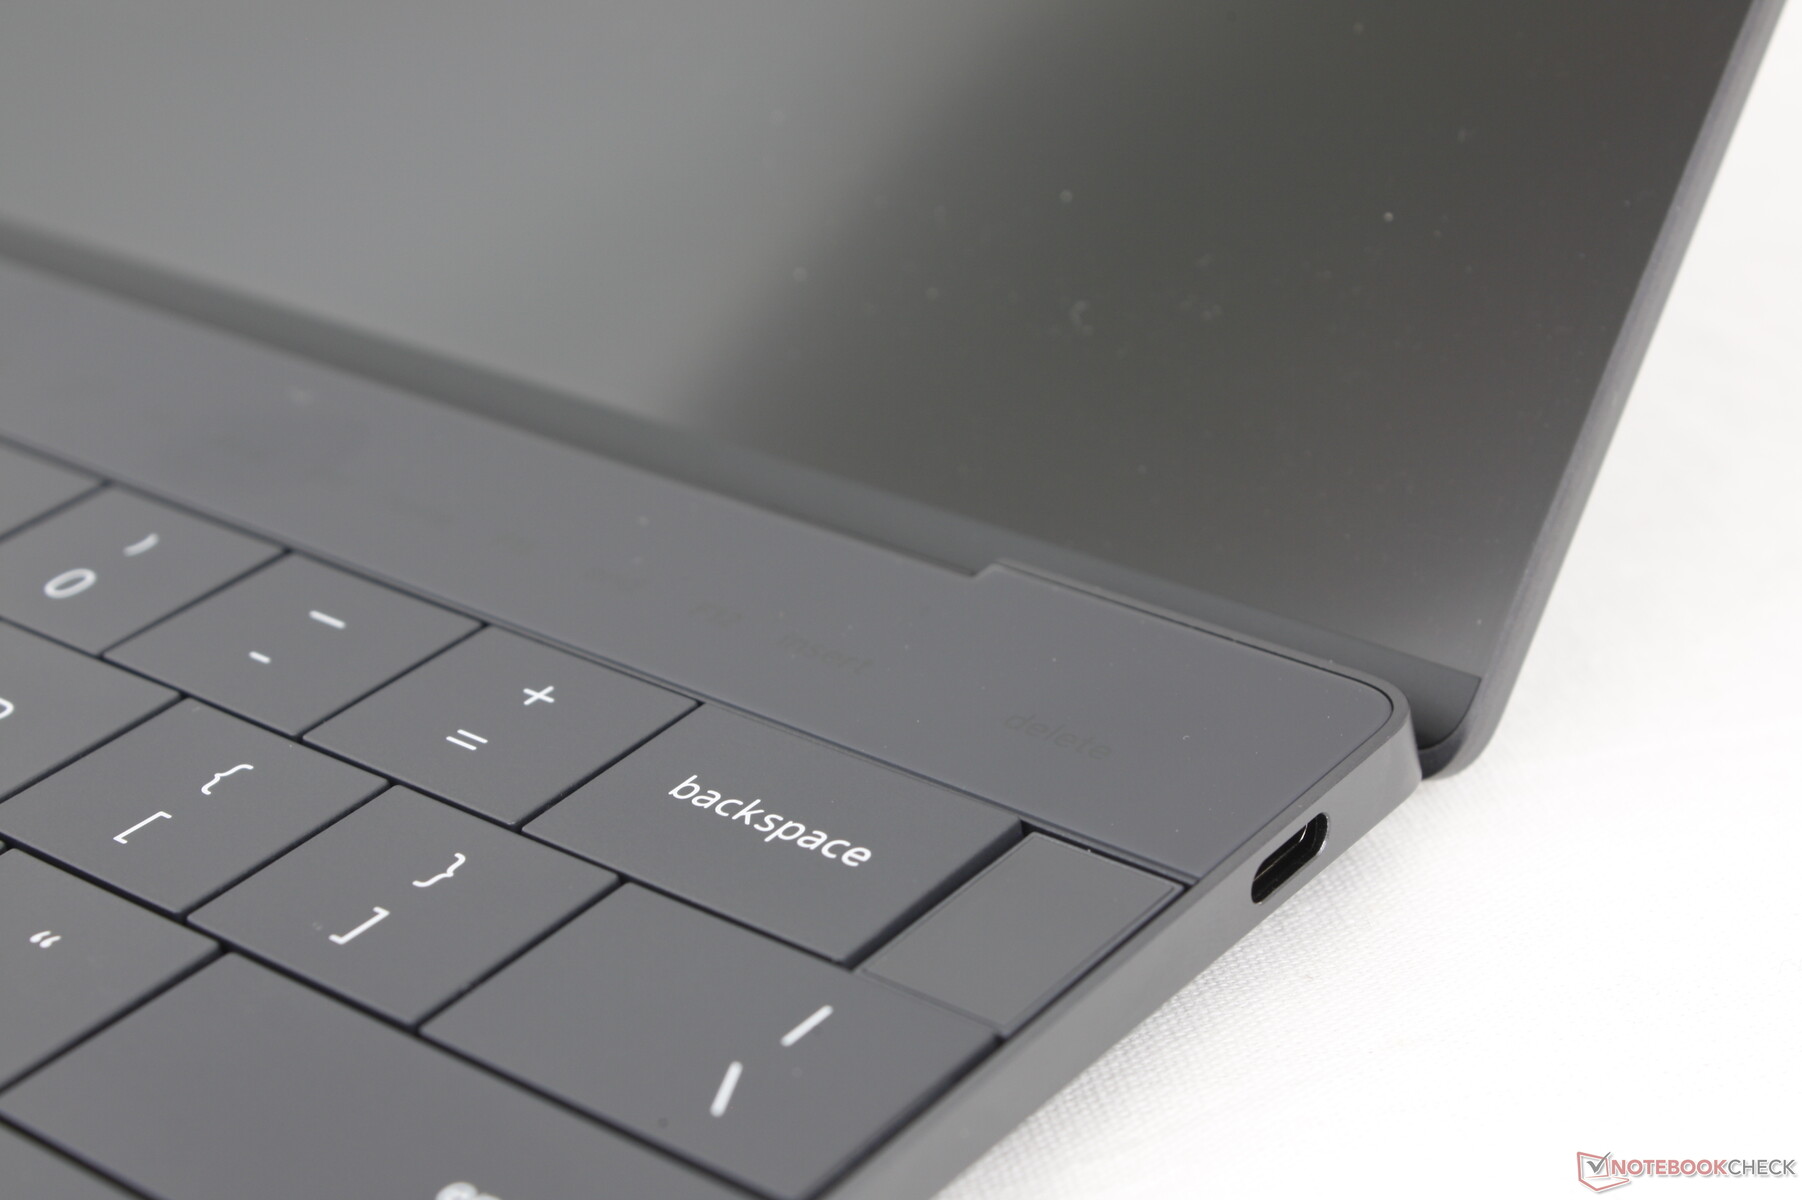
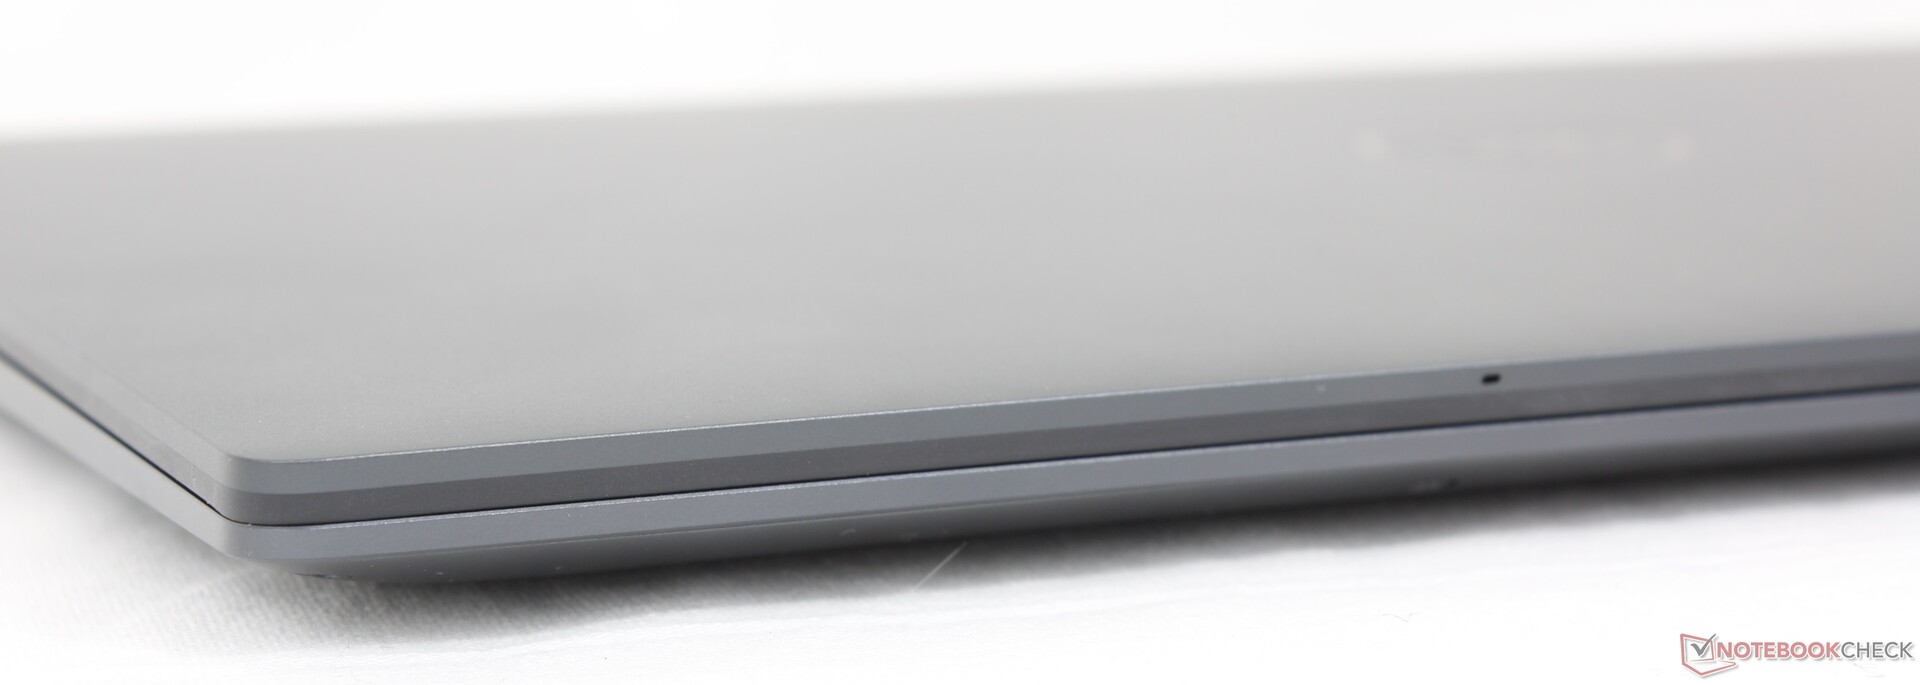
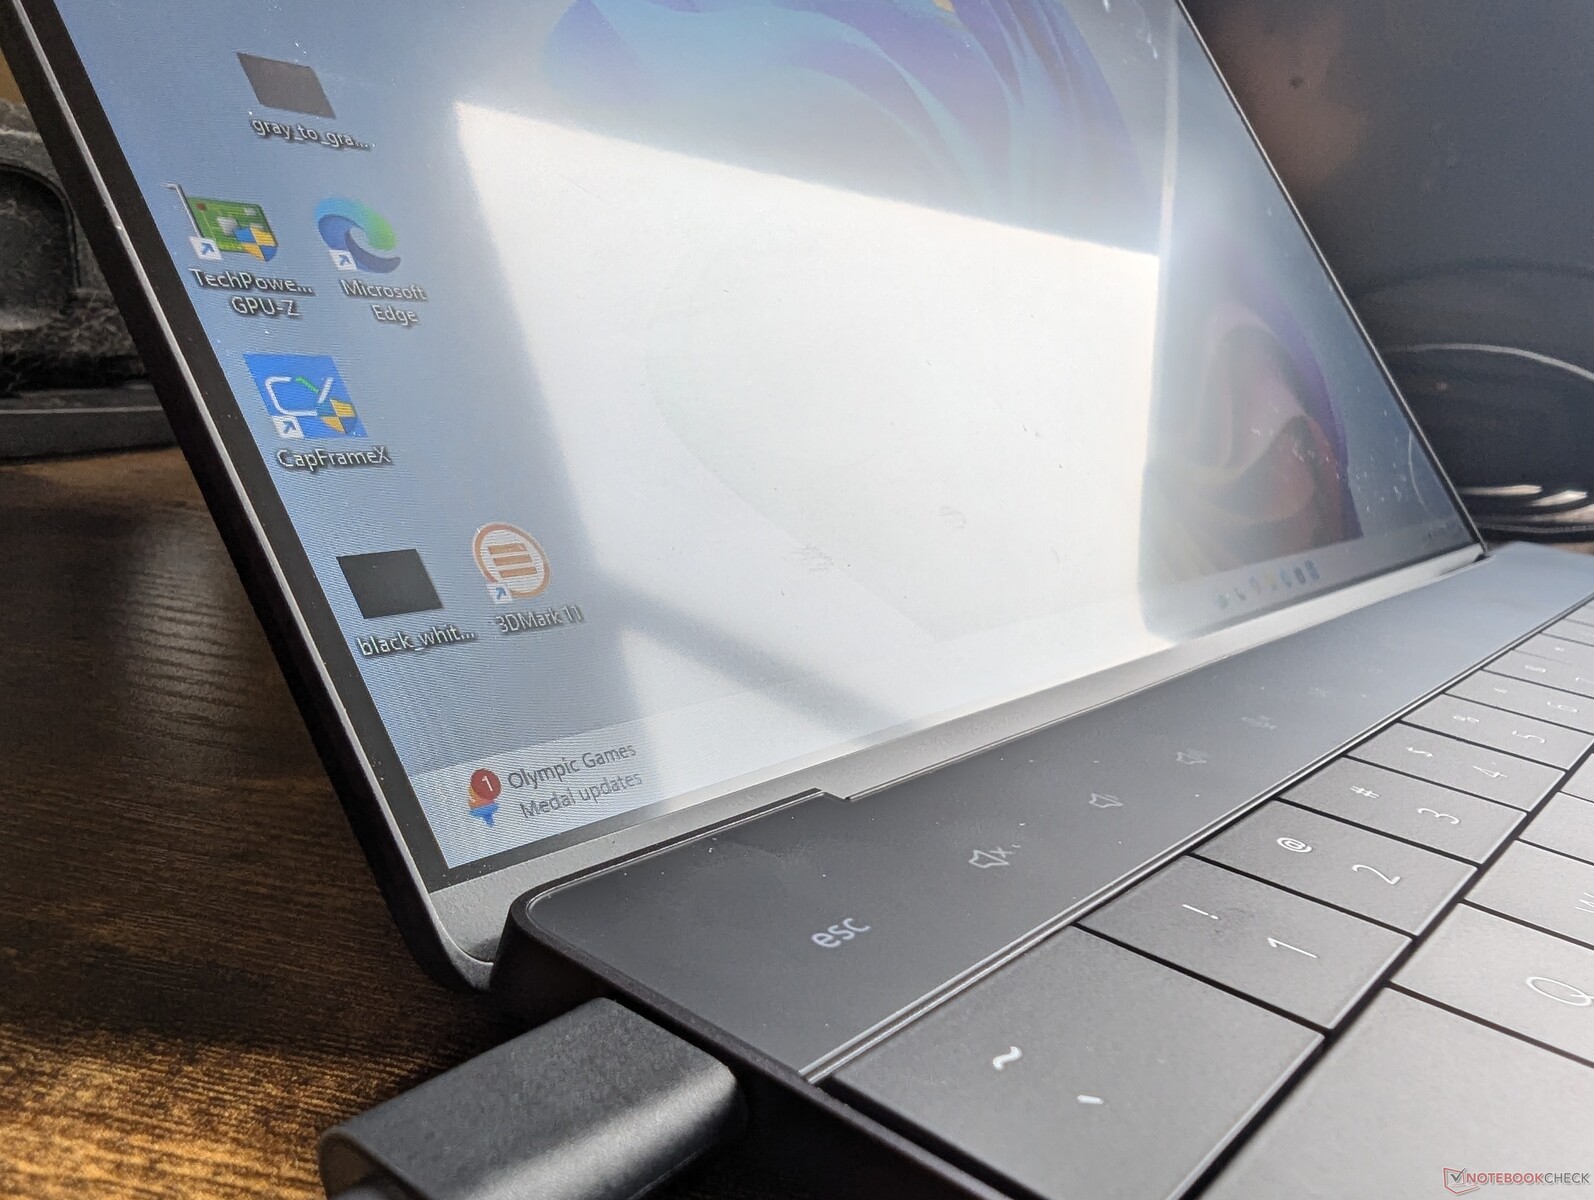
Kasa - Tanıdık Görünüm ve His
Qualcomm modelini Intel modelinden ayıran hiçbir dış fark yoktur ve bu nedenle intel modeli hakkındaki yorumlarımız burada da geçerli. Bazı yeni renk seçenekleri iyi olurdu, ancak aynı Platin ve Grafit seçenekleri geçerlidir. Parlak beyaz rengi parmak izlerini Qualcomm test ünitemizin koyu Grafit seçeneğinden daha iyi gizlediği için Platin seçeneğini biraz tercih ediyoruz, özellikle de avuç içi dayanakları ve dış kapak boyunca.
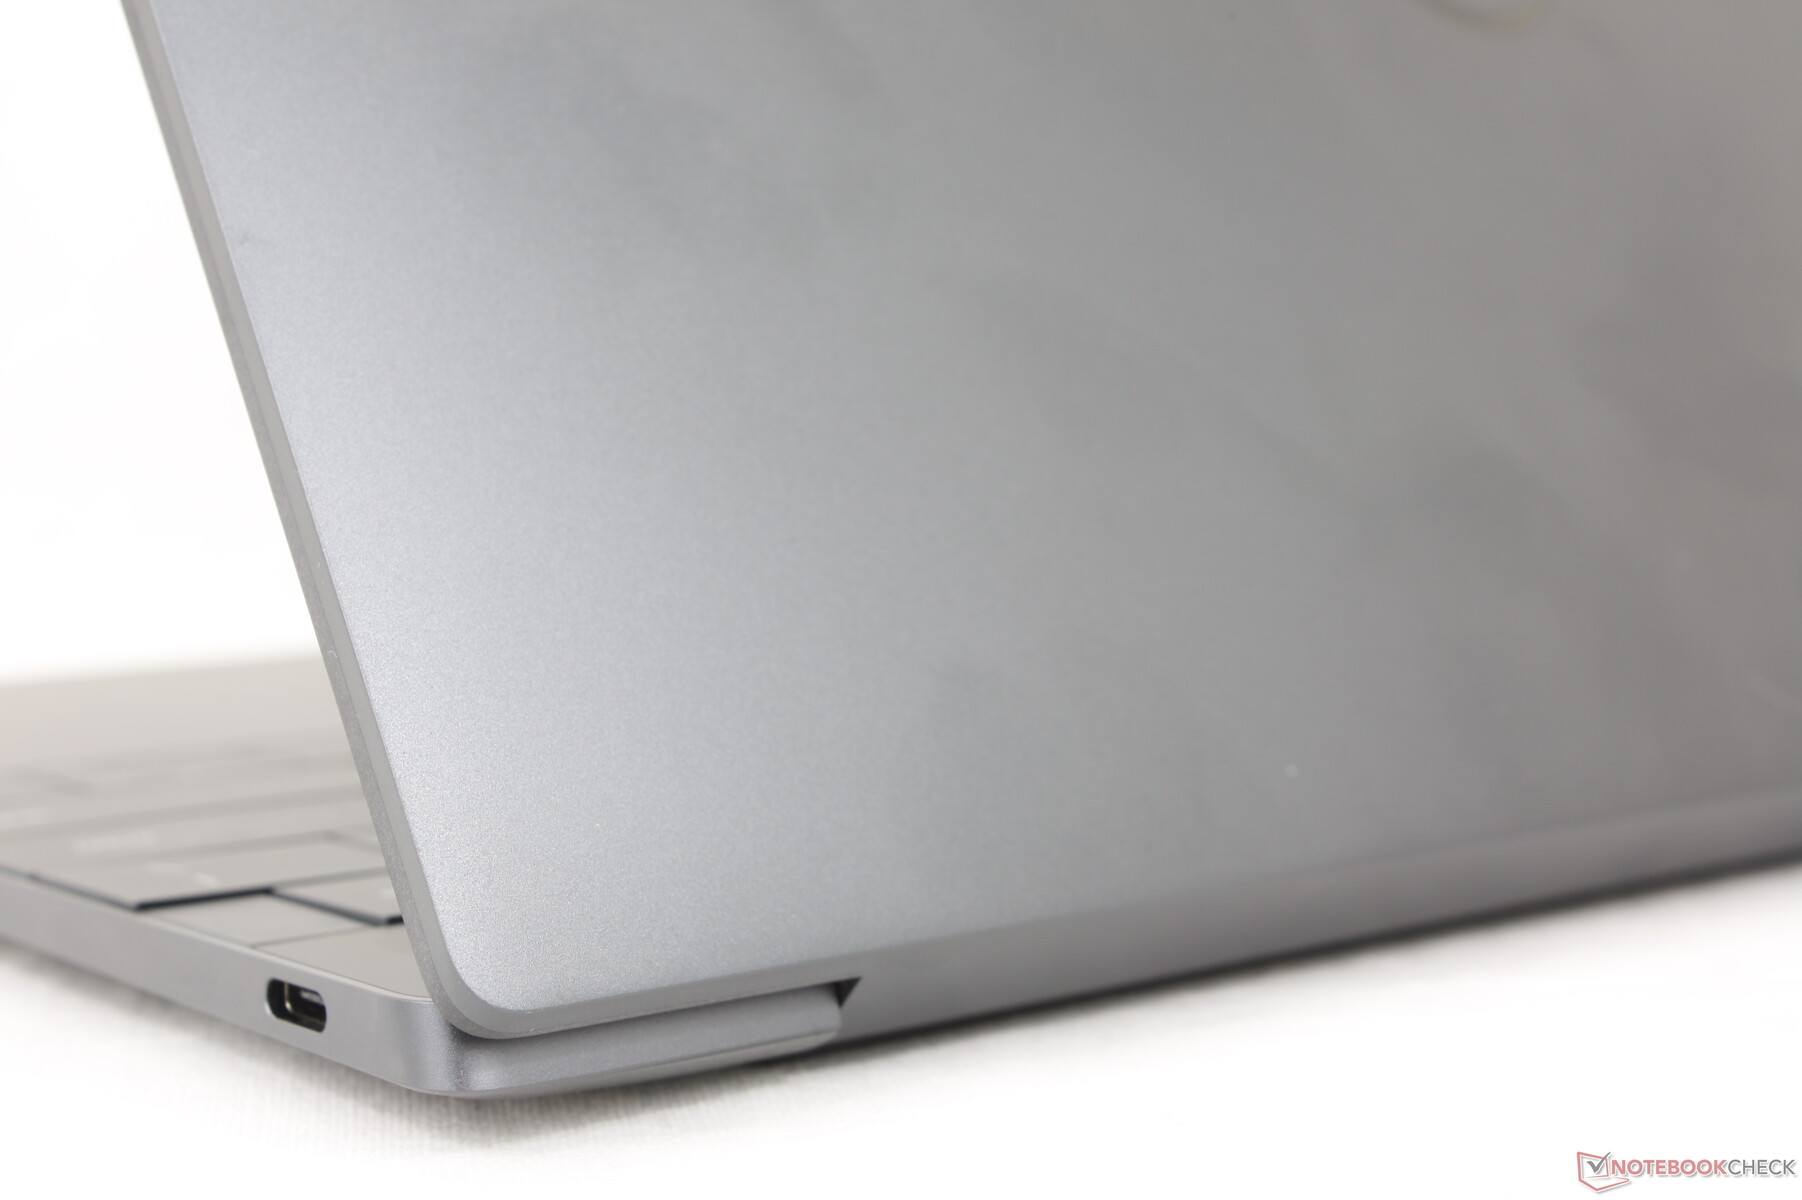
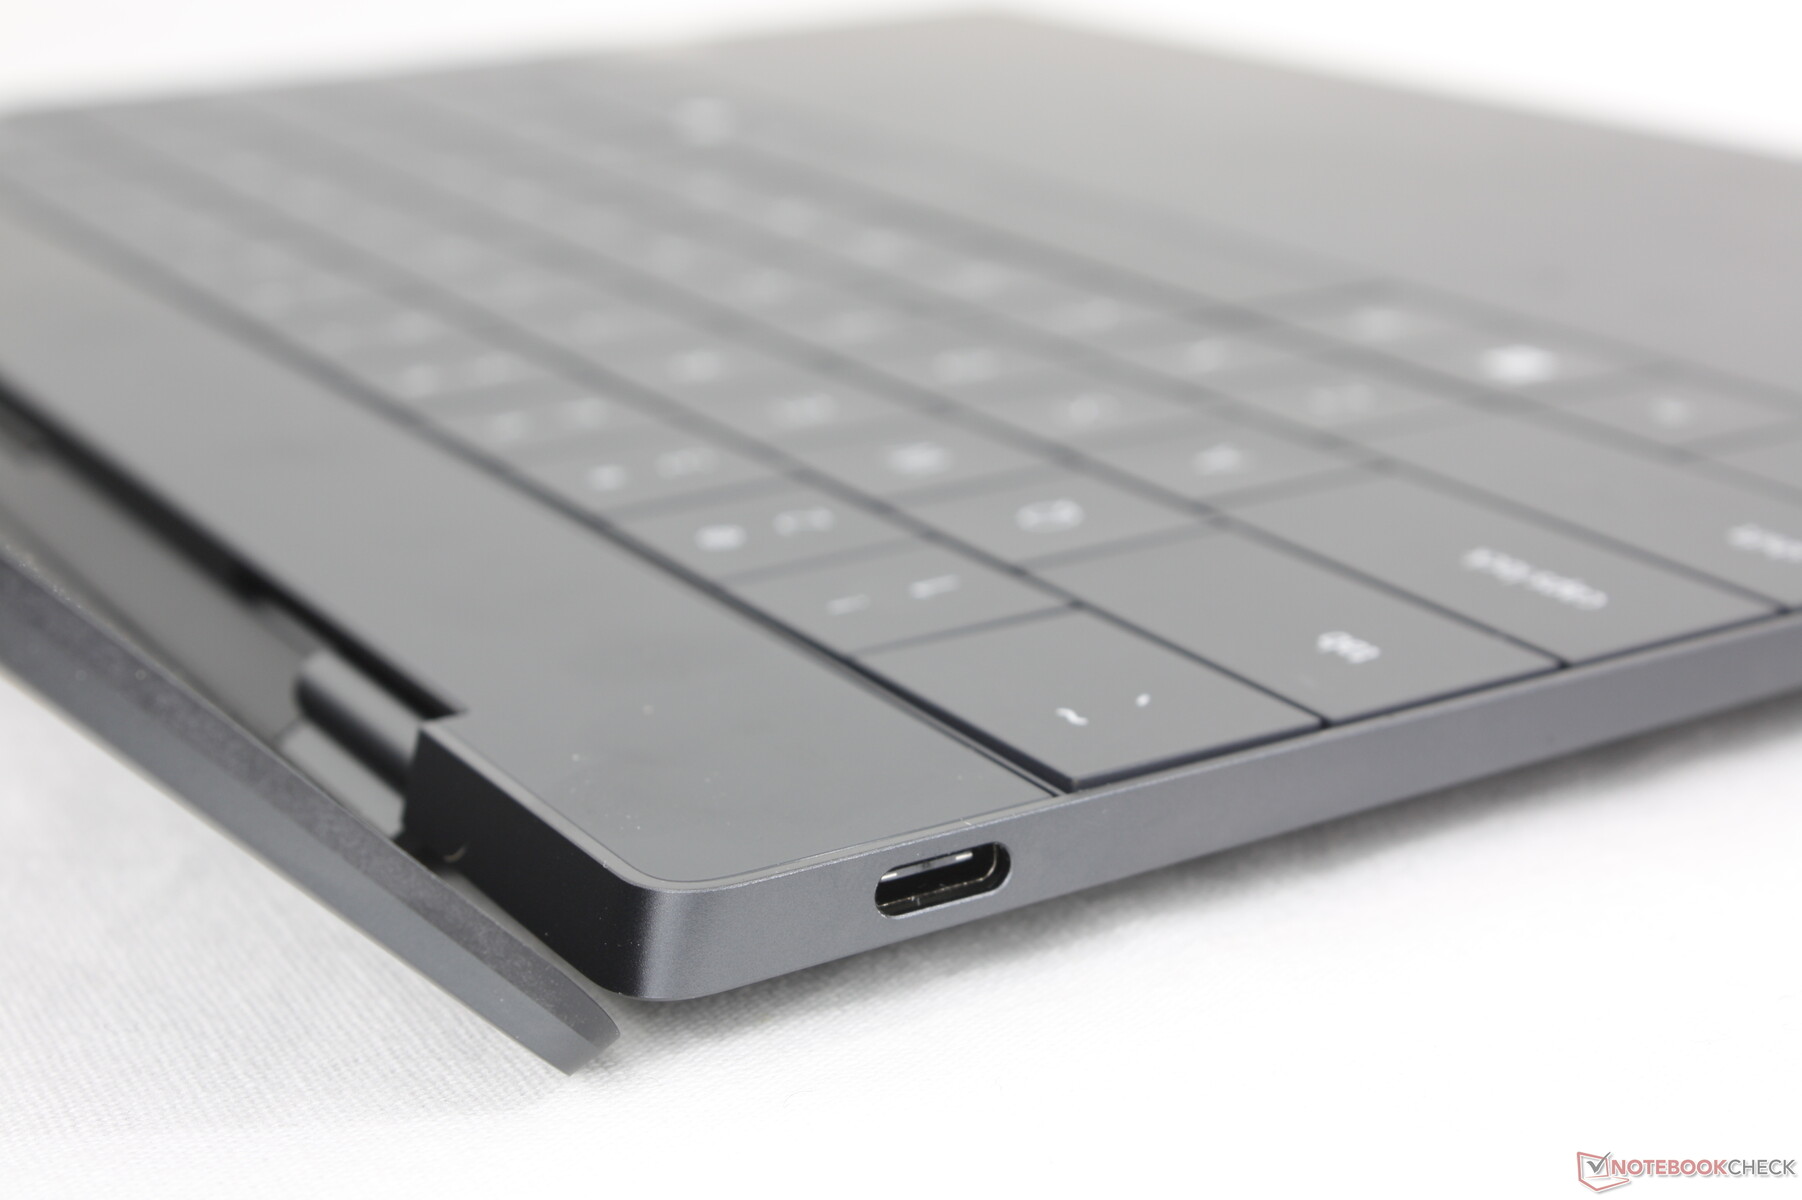
Bağlanabilirlik
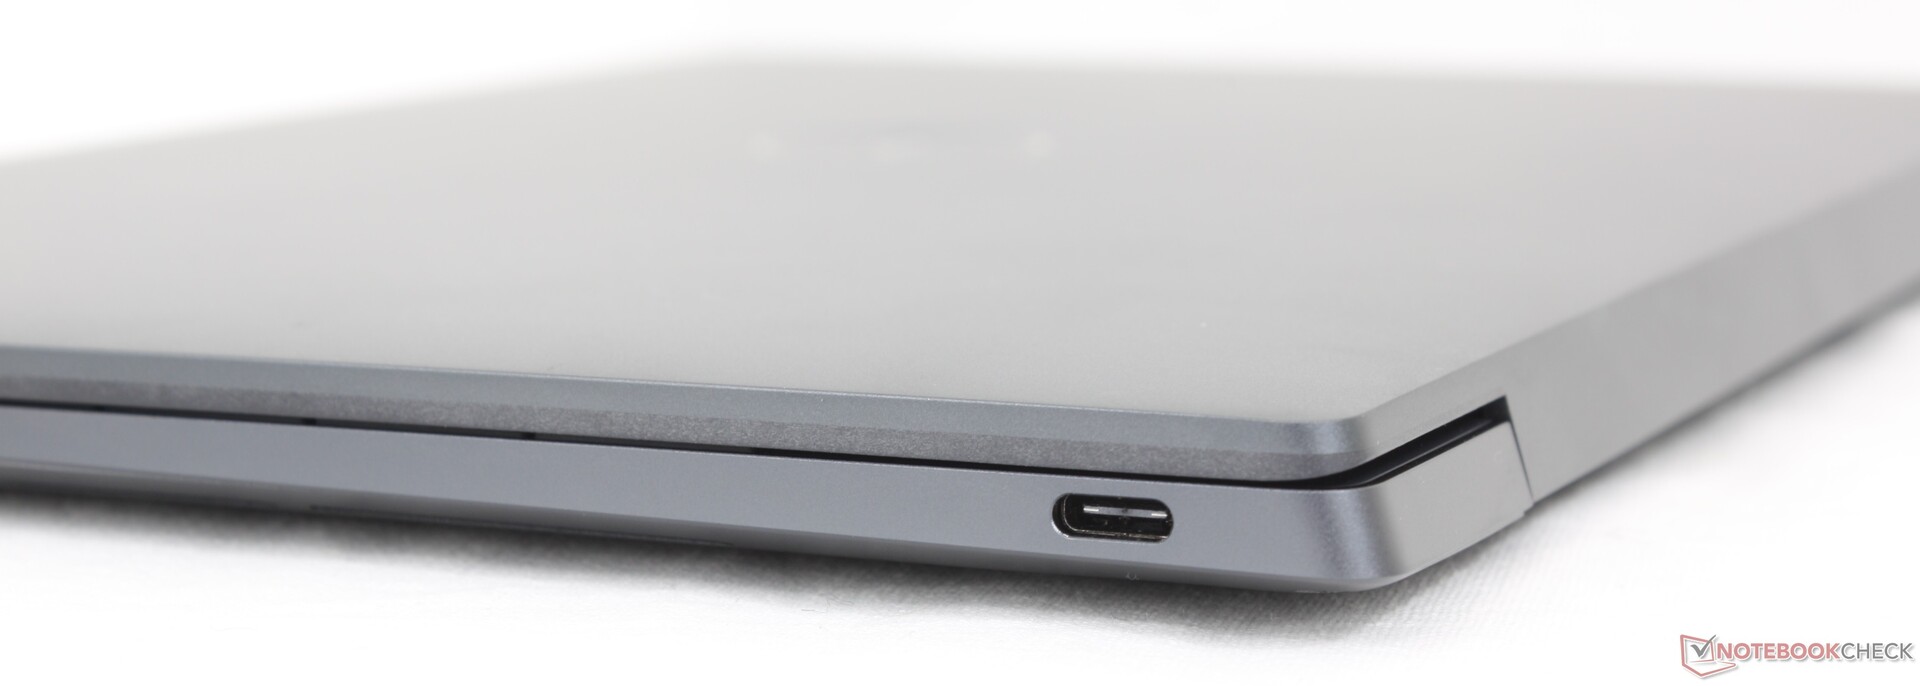
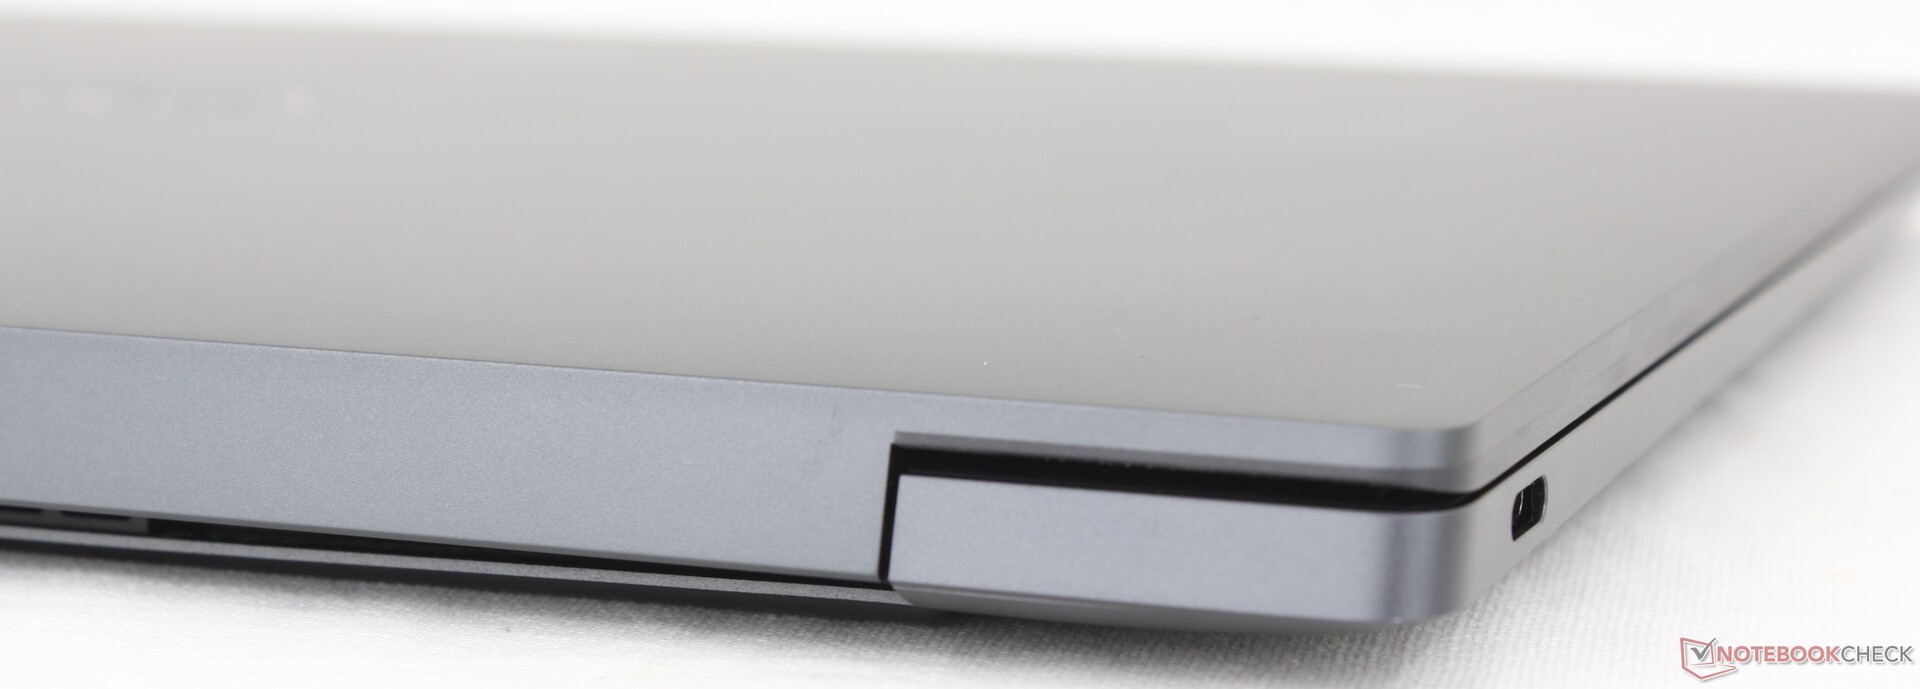
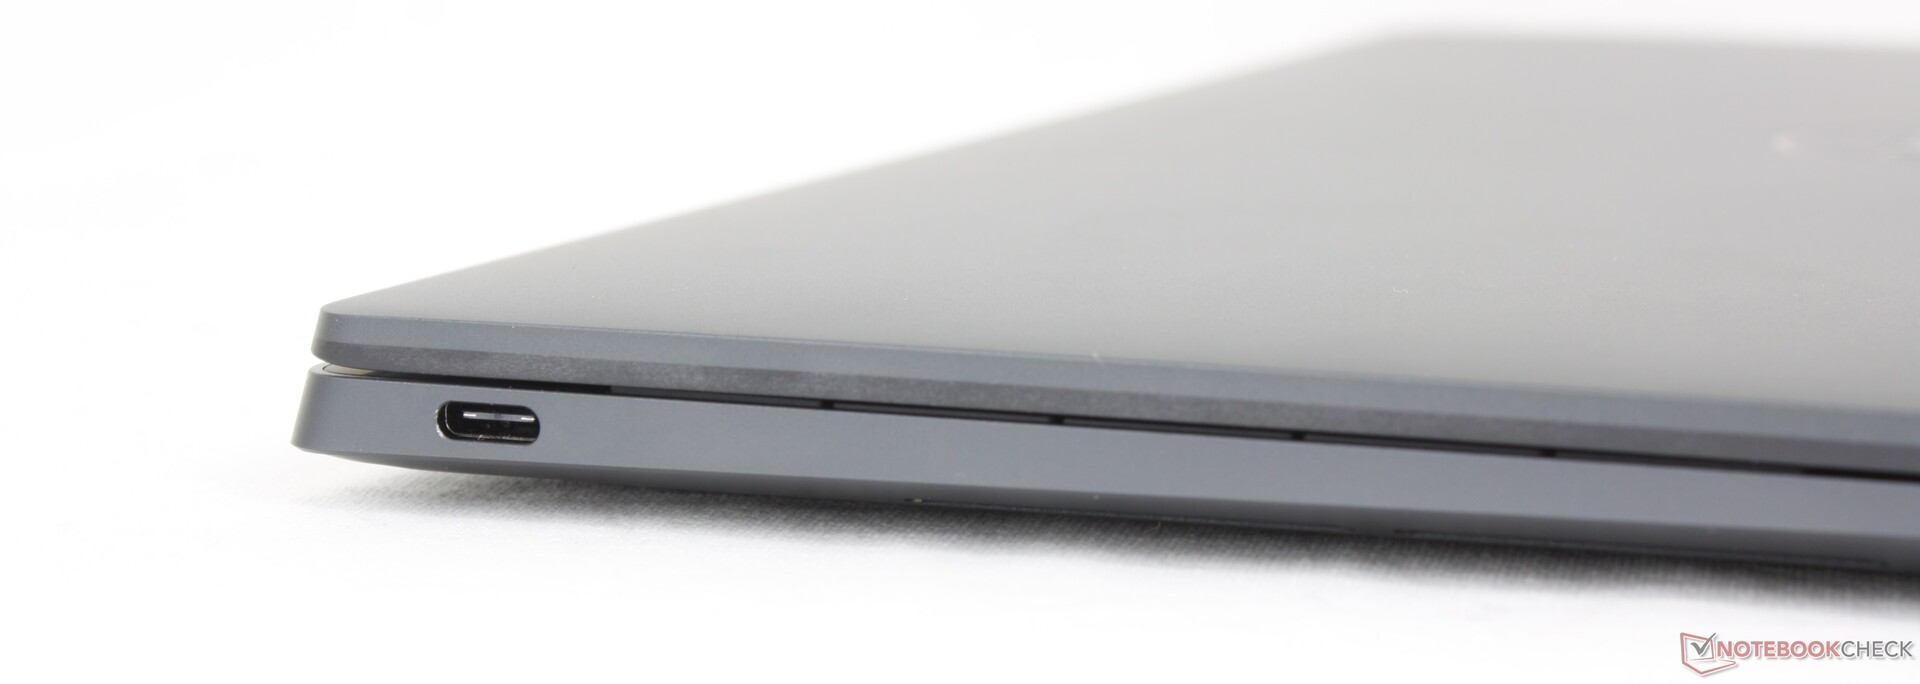
XPS 13'ün Intel versiyonunda olduğu gibi iki adet USB-C 4.0 portu bulunmaktadır. Ancak buradaki bağlantı noktaları Thunderbolt desteğinden yoksundur ve bu nedenle eGPU uyumluluğu garanti edilmez. Bağlamaya çalışırken Aorus RTX 2080 Ti Oyun Kutusuörneğin, Qualcomm dizüstü bilgisayar eGPU'yu tanıyamazken, Thunderbolt özellikli bir bilgisayar Aygıt Yöneticisi aracılığıyla otomatik olarak tanıyacaktır. Qualcomm, herhangi bir destek ve uygulanabilir sürücülerin mevcut eGPU sahipleri için umut verici olmayan bireysel eGPU üreticilerine bağlı olacağını söyledi.
İletişim
Dell, Intel XPS 13'teki BE200'ü Qualcomm XPS 13'teki FastConnect 7800 ile değiştirdi. Modül, çoğu evde hala yaygın olmayan Wi-Fi 7 bağlantısını destekliyor. Wi-Fi 6E AXE11000 test yönlendiricimizle eşleştirildiğinde performans yine de istikrarlı.
Web kamerası
Model standart olarak orijinal XPS 13 9320'deki 1 MP web kamerası yerine XPS 13 9340'ta bulunan aynı 2 MP web kamerası ile birlikte geliyor. Windows Hello yüz tanımayı desteklemek için IR de yerleşiktir. Ancak hala kamera kapağı ya da kapatma düğmesi bulunmuyor.


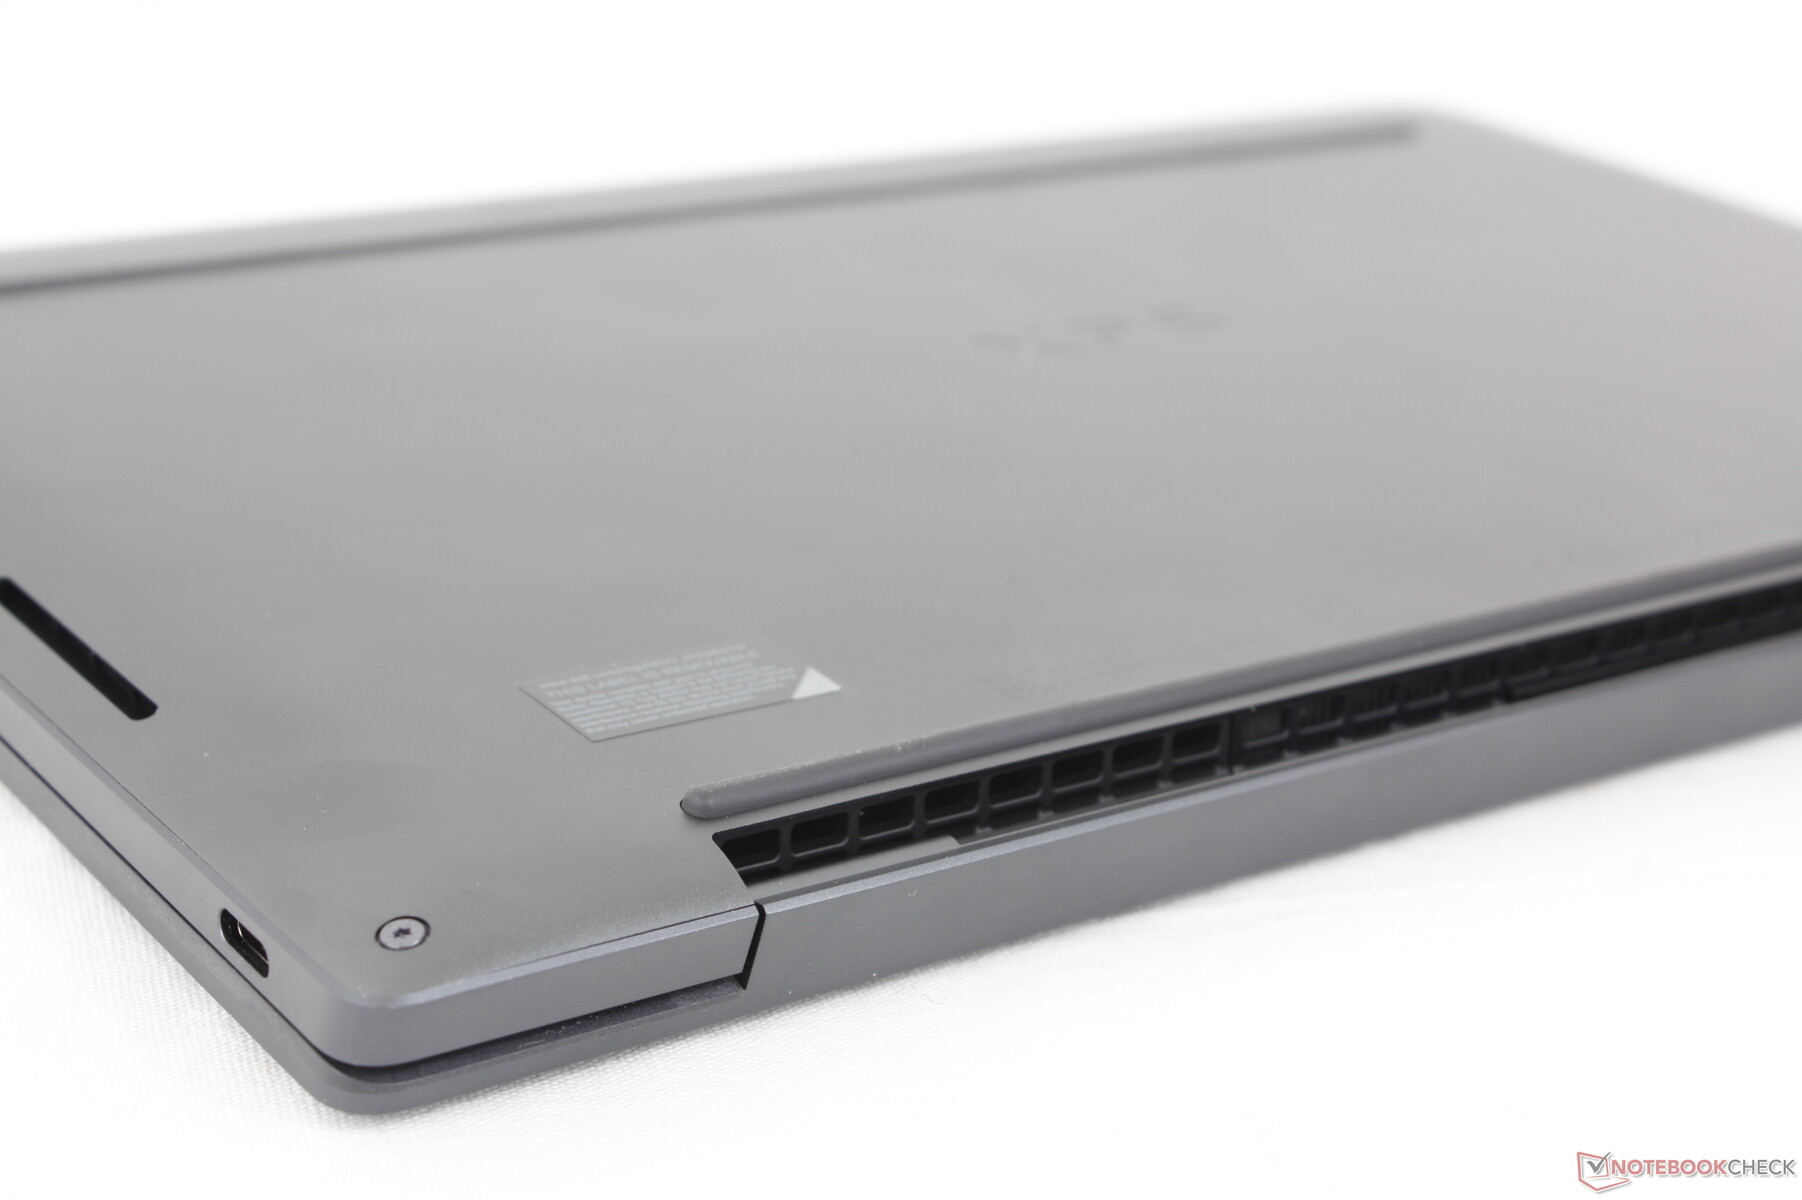
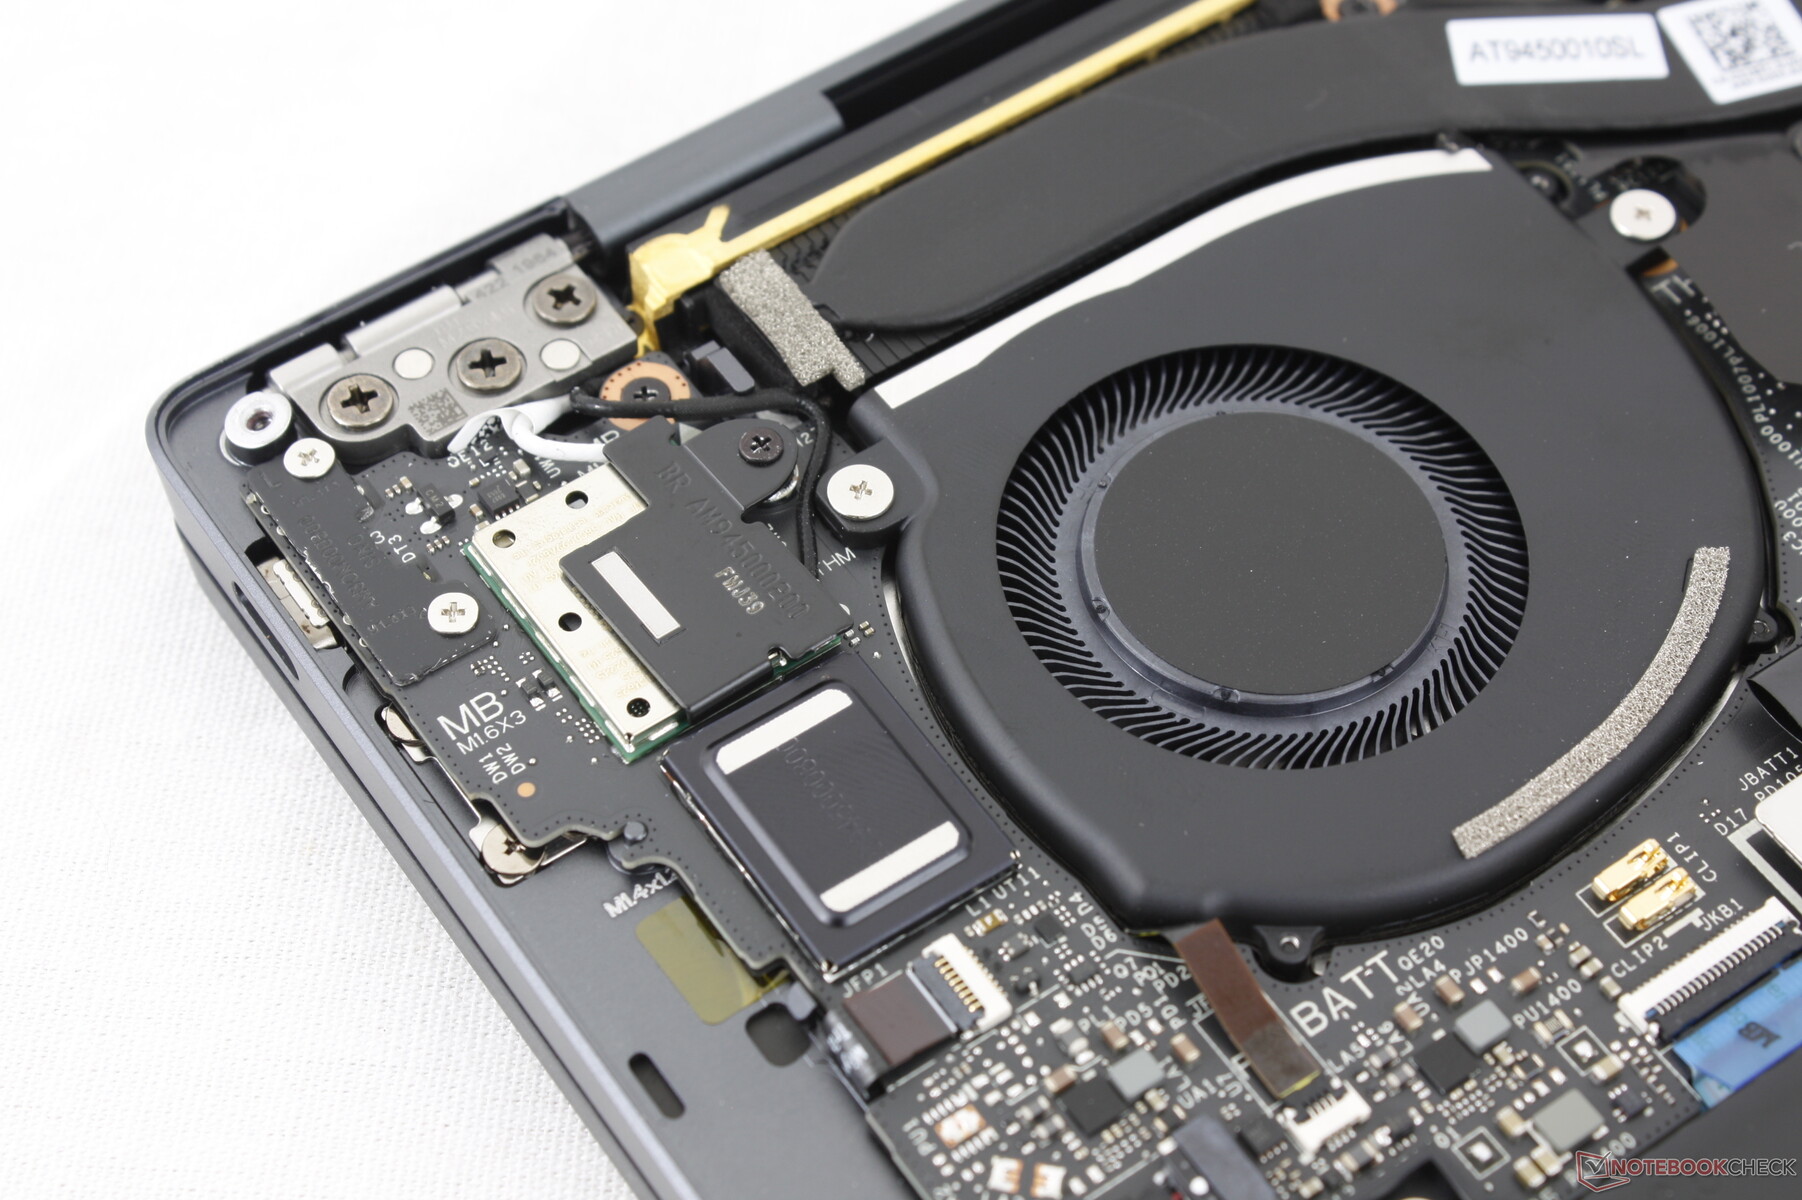
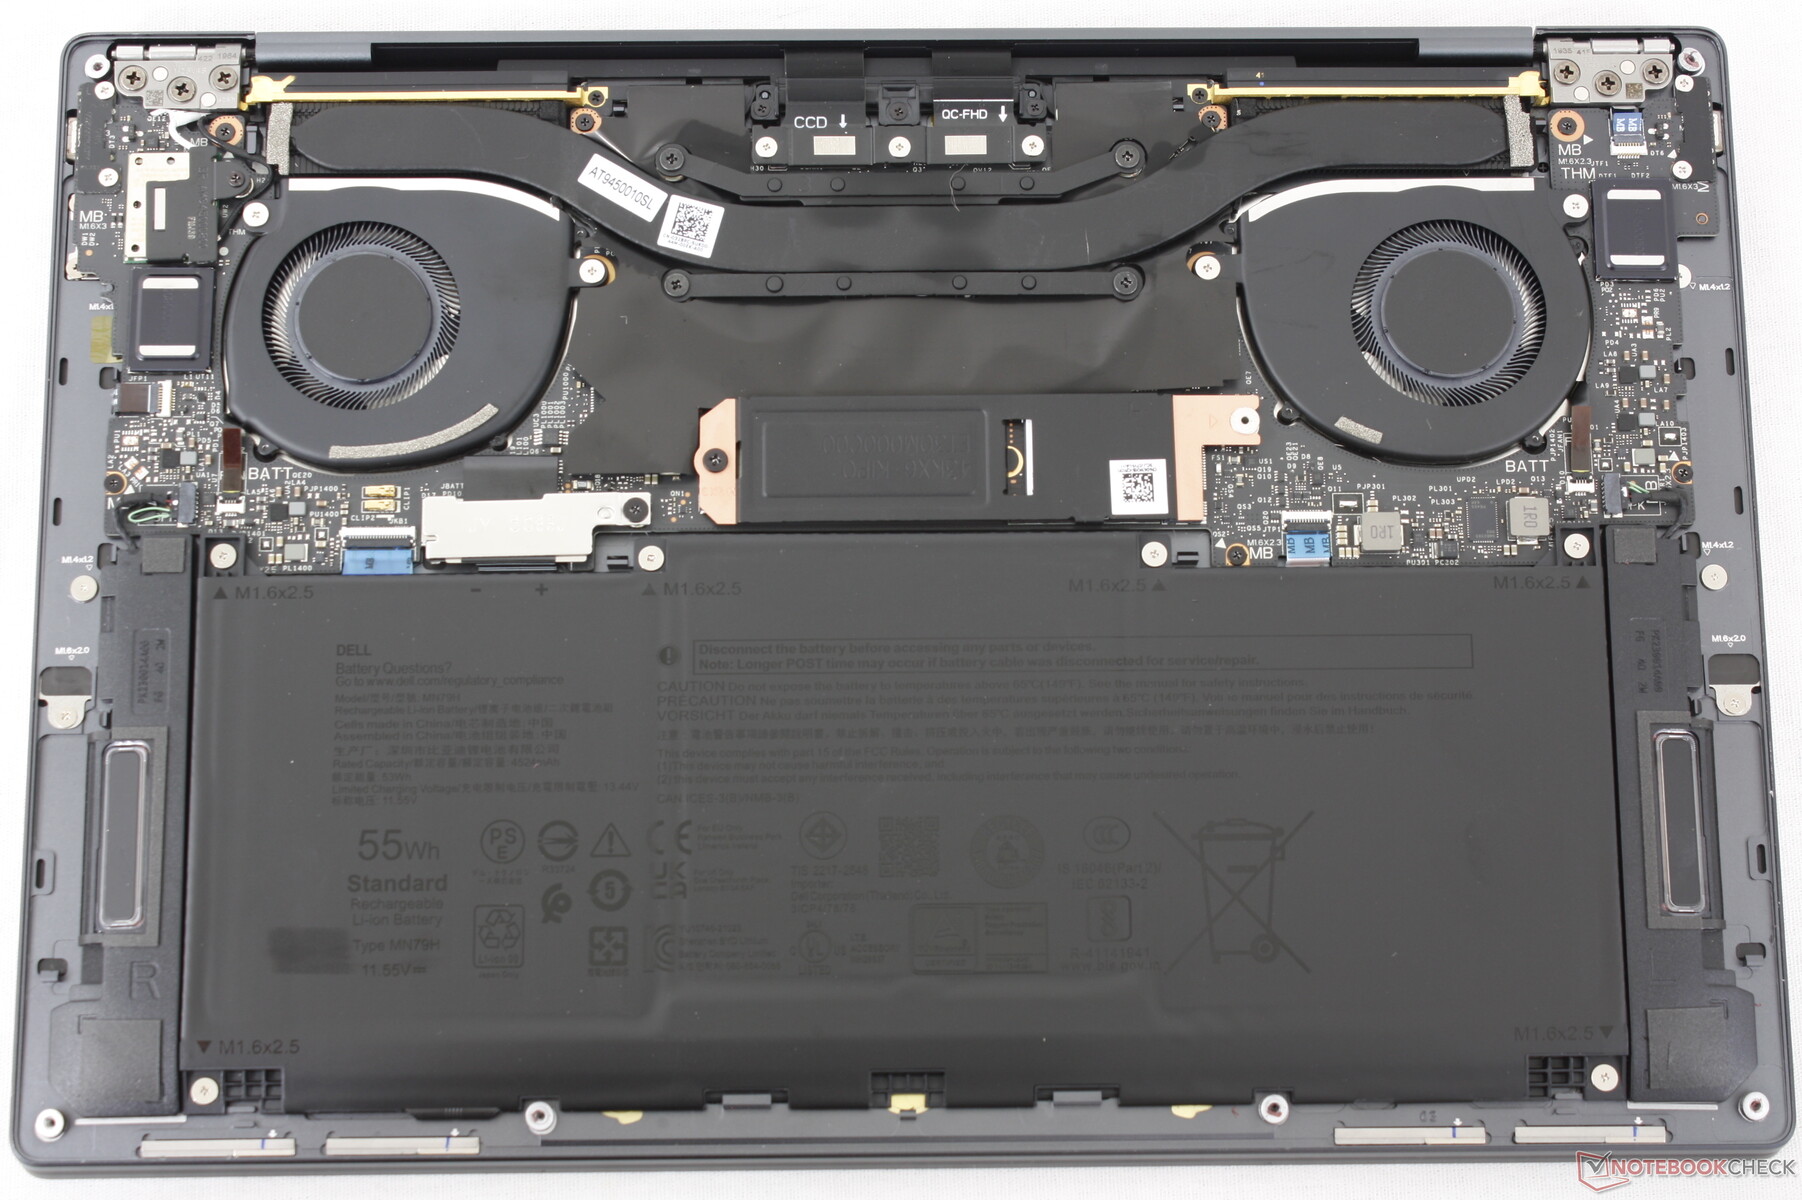
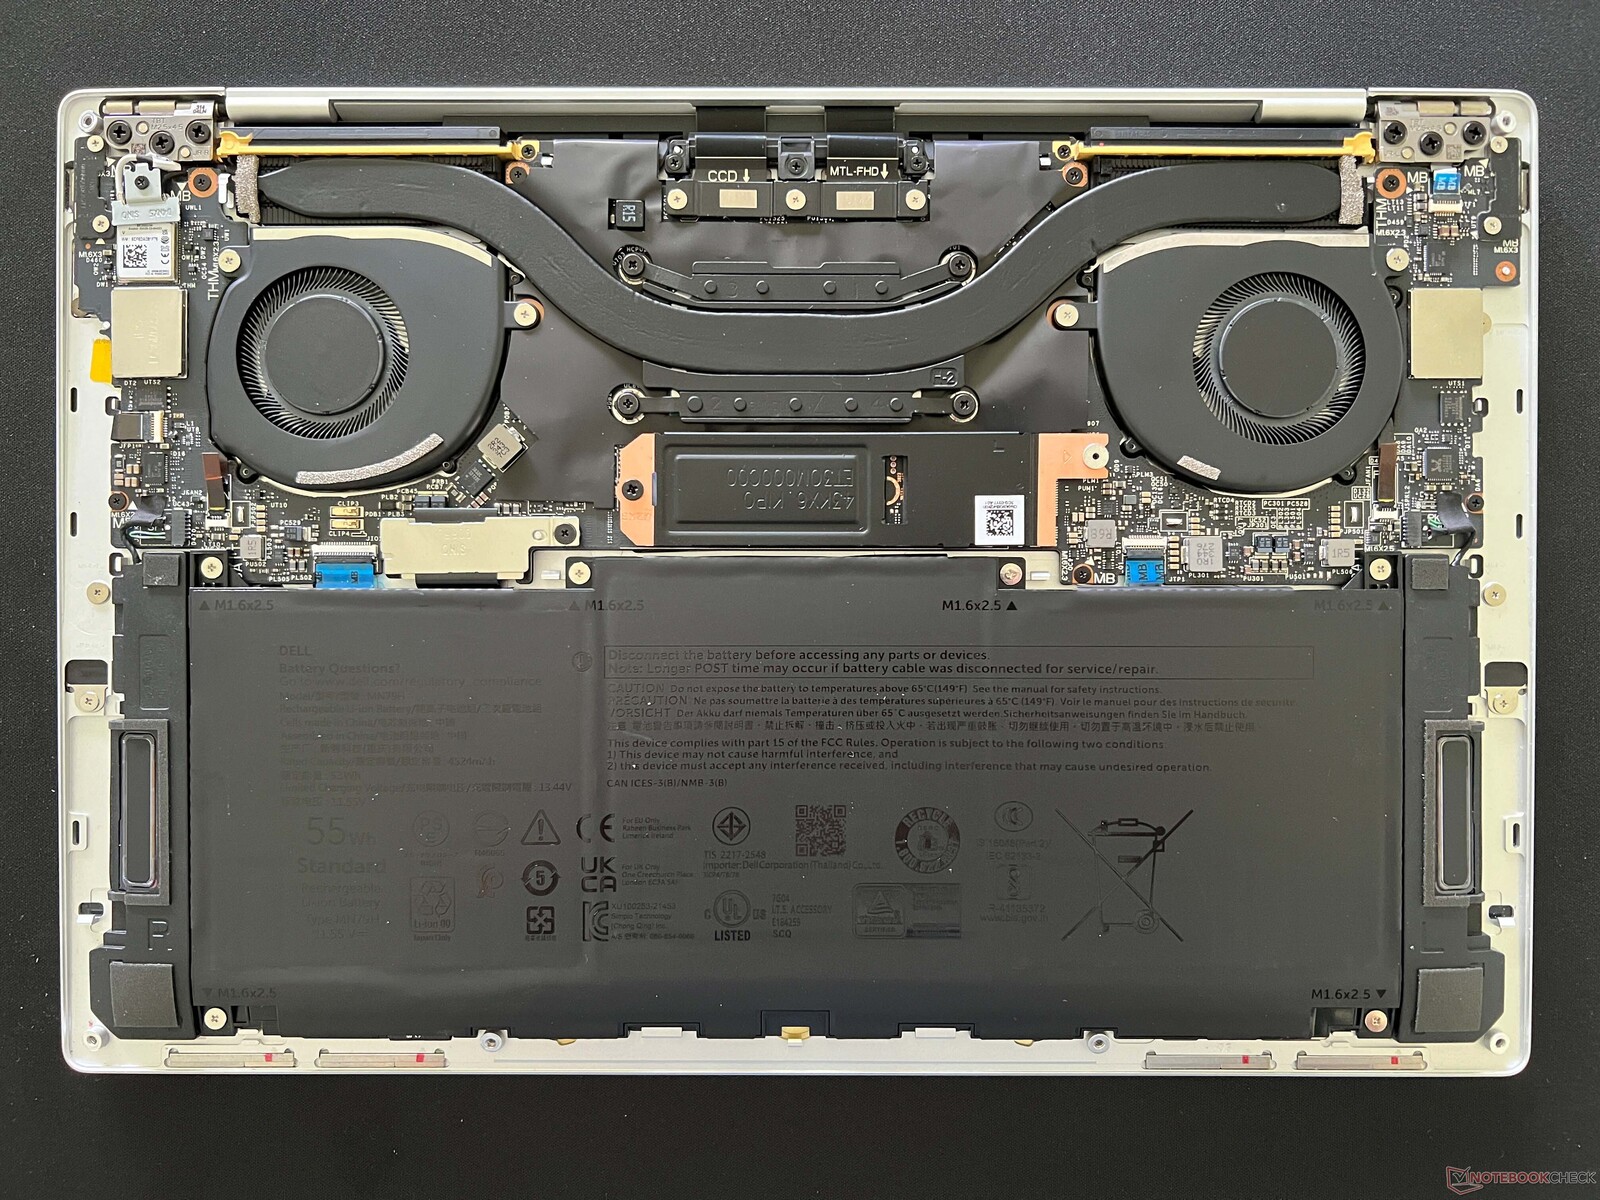
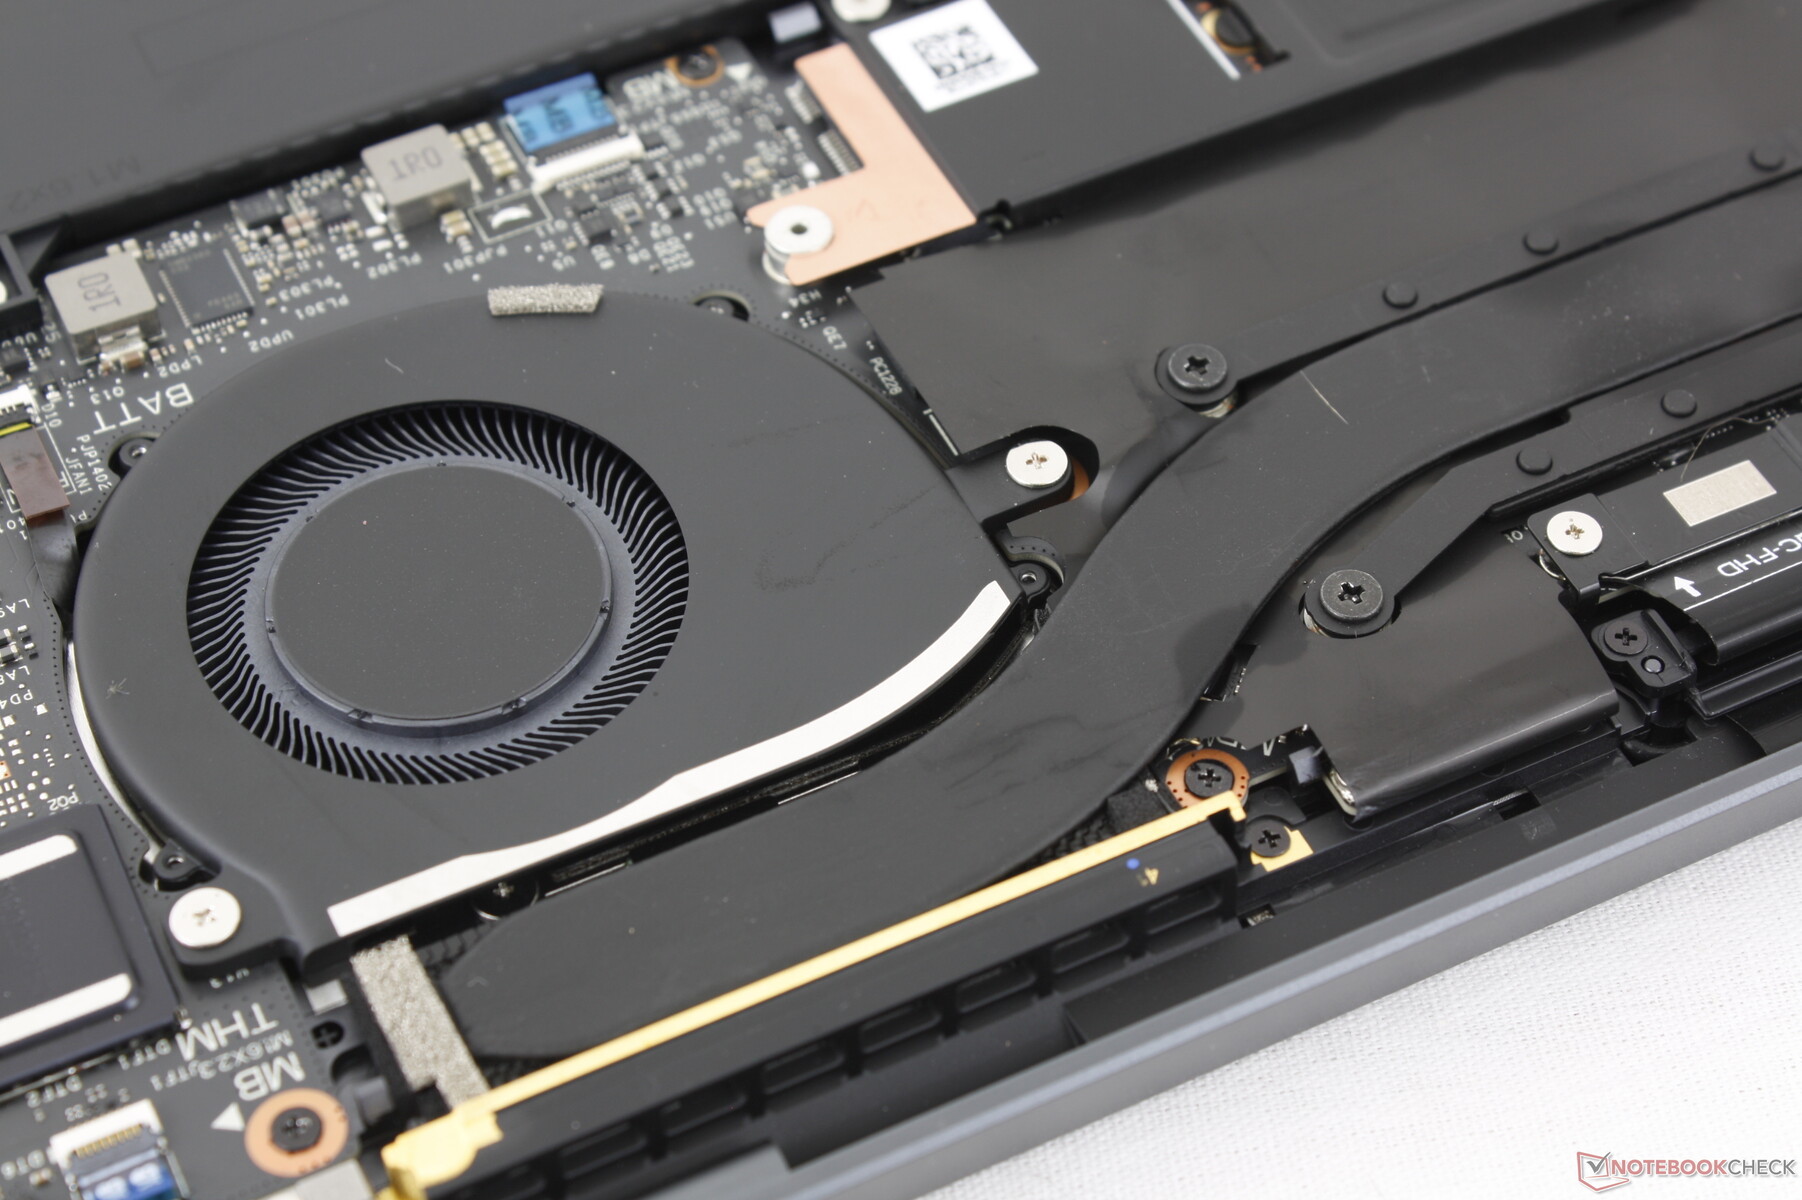
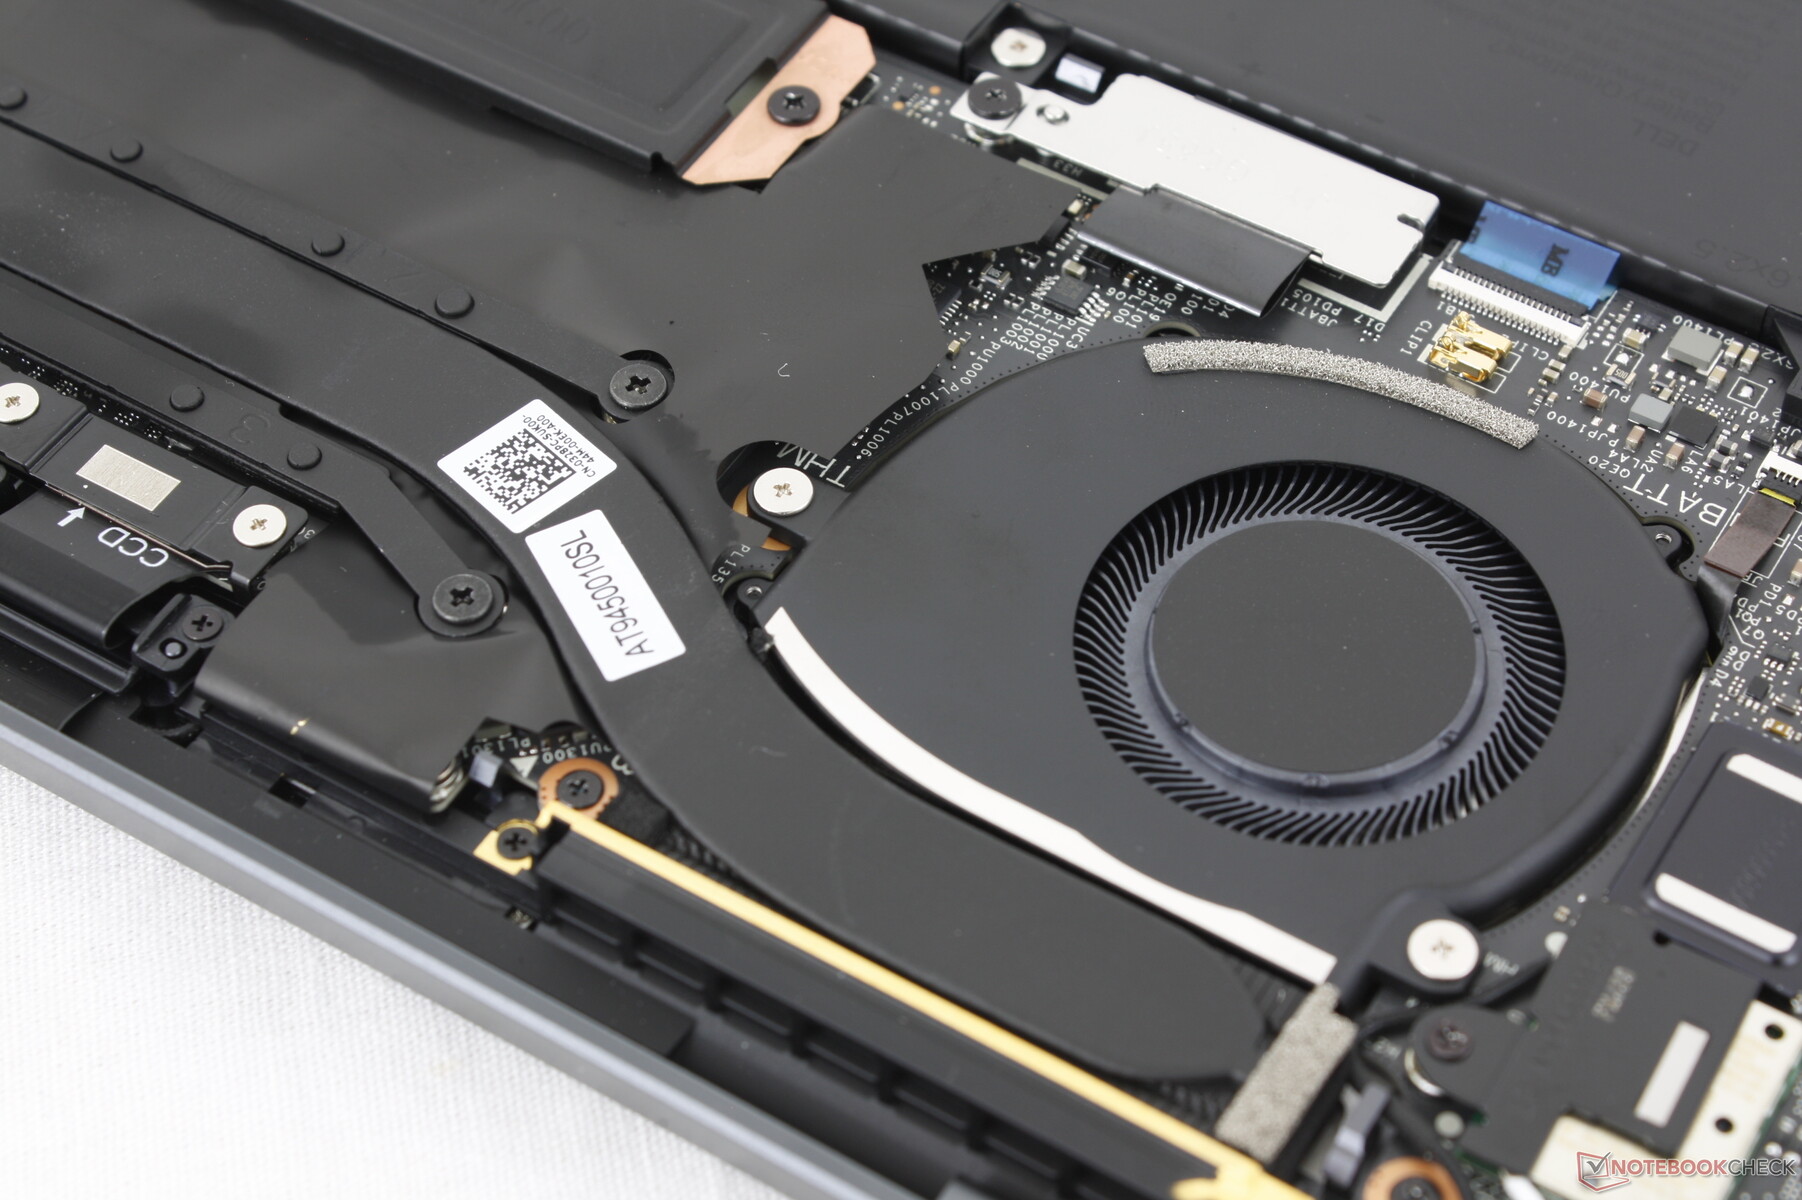
Bakım
Alt paneli çıkarmak için yalnızca bir Torx tornavida gerekir. RAM ve WLAN lehimli olduğu için tek M.2 SSD'nin ötesinde yükseltilecek bir şey yoktur.
Sürdürülebilirlik
Ambalaj, tamamen geri dönüştürülebilir olması için yüzde 75 geri dönüştürülmüş malzeme ve yüzde 25 yenilenebilir malzemeden oluşmaktadır. Bu arada, dizüstü bilgisayarın kendisi de en az yüzde 20 oranında geri dönüştürülmüş alüminyum ve camdan üretilmiştir.
Aksesuarlar ve Garanti
Intel tabanlı XPS modellerinde genellikle USB-C - USB-A adaptörü ücretsiz olarak verilirken, kutuda AC adaptörü ve evraklar dışında ekstra bir şey yok.
ABD'de satın alınması halinde olağan bir yıllık sınırlı üretici garantisi geçerlidir.
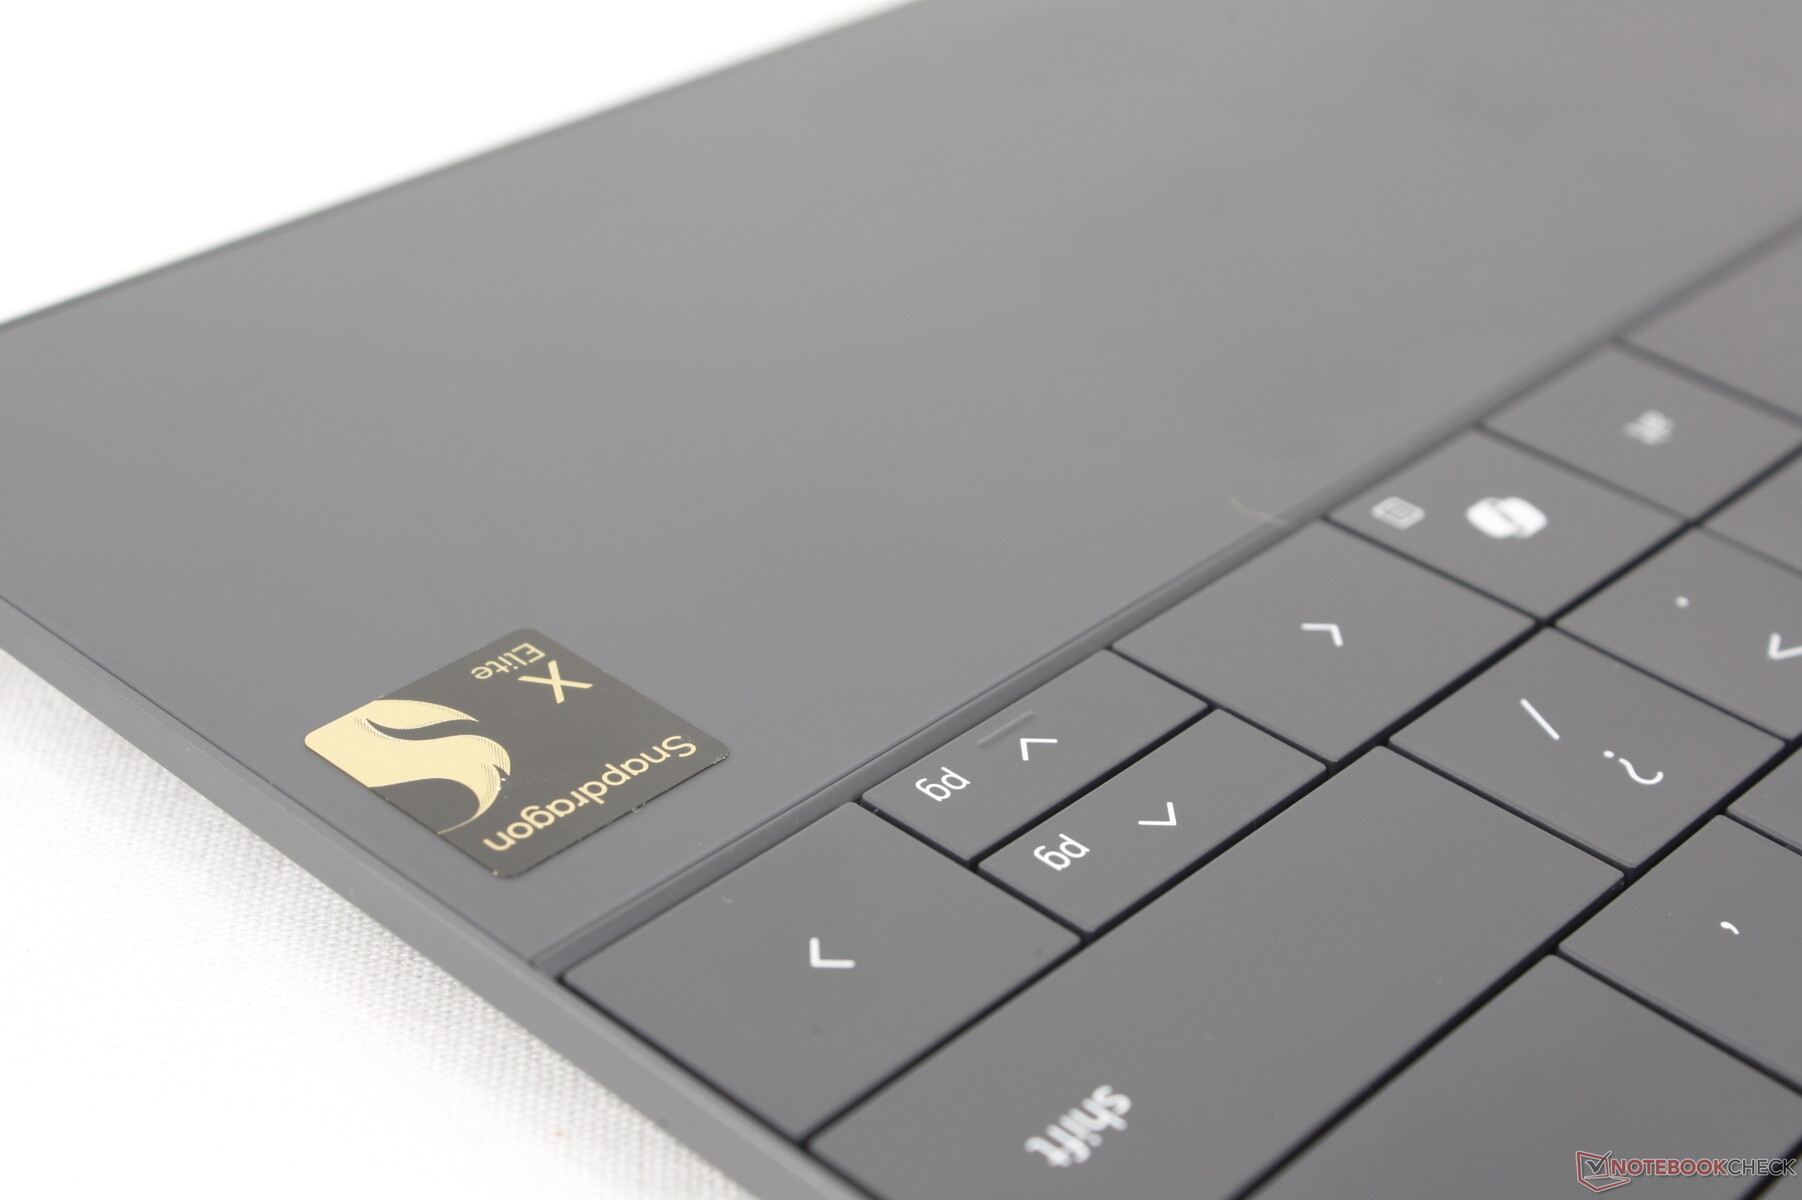
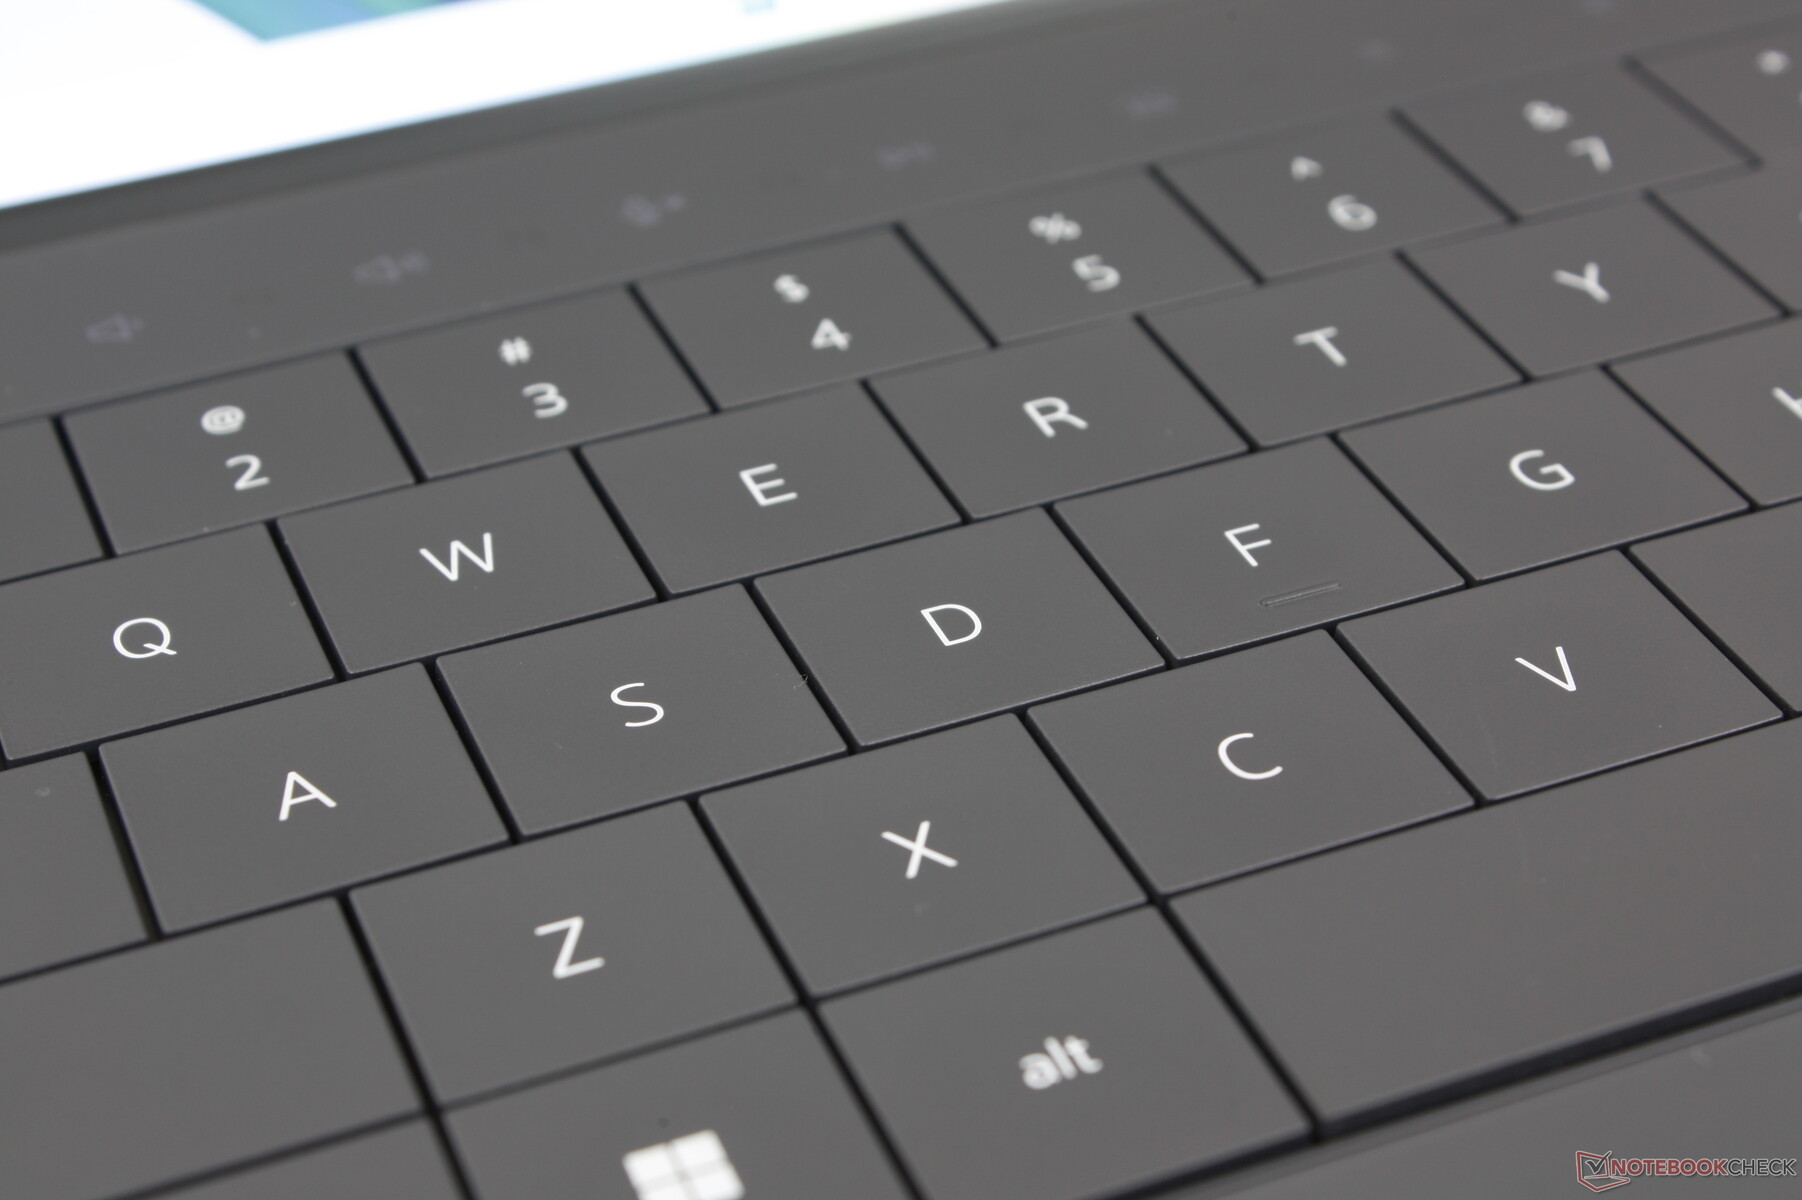
Giriş Aygıtları - Kullanılabilirlik Pahasına Daha Temiz Görünüyor
Klavye
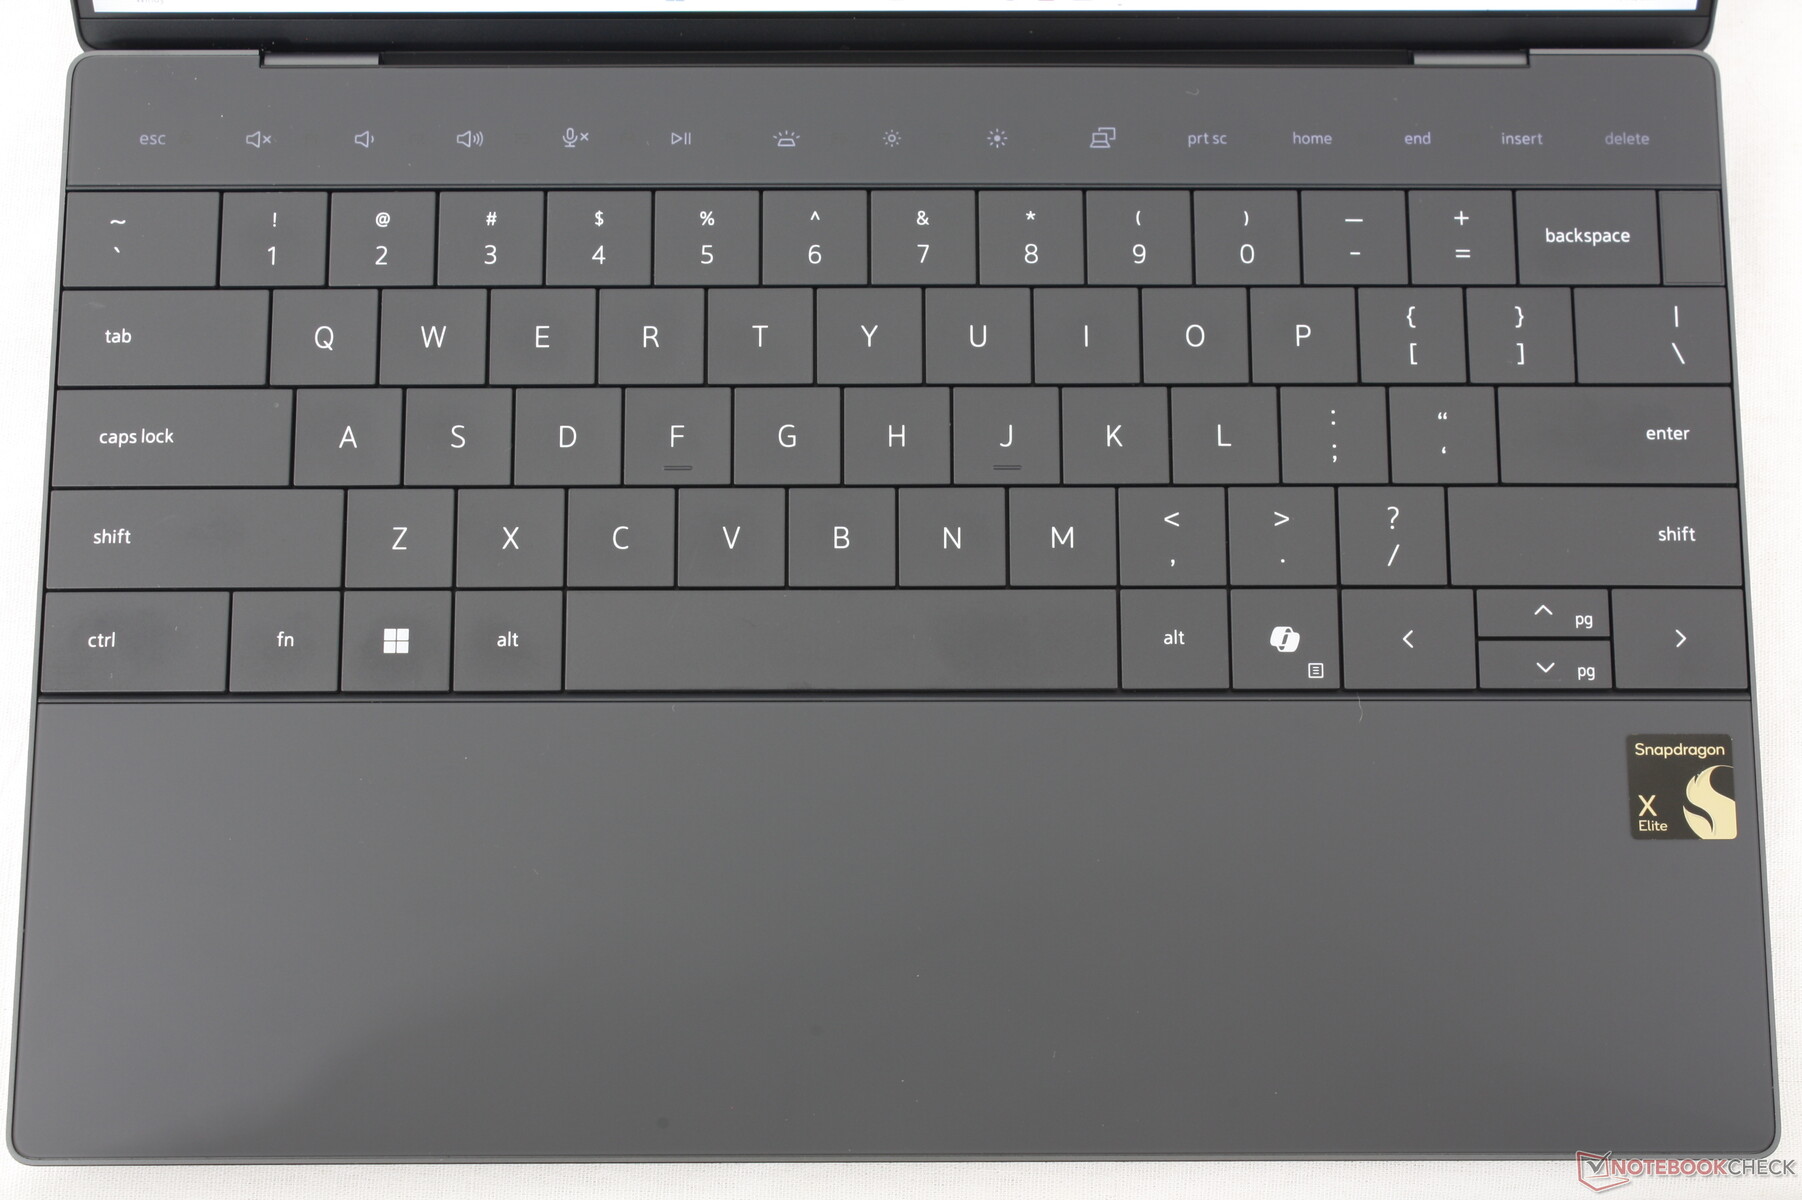
Sıfır kafesli klavyeye alışmak, diğer çoğu dizüstü bilgisayardaki geleneksel klavyelerle karşılaştırıldığında biraz zaman alıyor. Tuş hareket mesafesi sadece 1.0 mm ile normalden daha da sığ ve geri bildirim daha süngerimsi bir yazma deneyimi için nispeten yumuşak. XPS 13 9345 ile diğer dizüstü bilgisayarlardaki daha sert tuşlar arasında gece gündüz fark var HP Spectre x360 14.
Dokunmatik fonksiyon tuşları da karışık bir durum. Lenovo birkaç yıl önce ThinkPad serisinde çok benzer bir şey uygulamış ve hemen bırakmıştı, bu yüzden rakip bir üreticide yeniden ortaya çıktıklarını görmek biraz şaşırtıcı. Asıl sorun, tuşların en ufak dokunuşlara bile duyarlı olması ve bunun da yanlışlıkla girişlere neden olabilmesi.
Dokunmatik yüzey
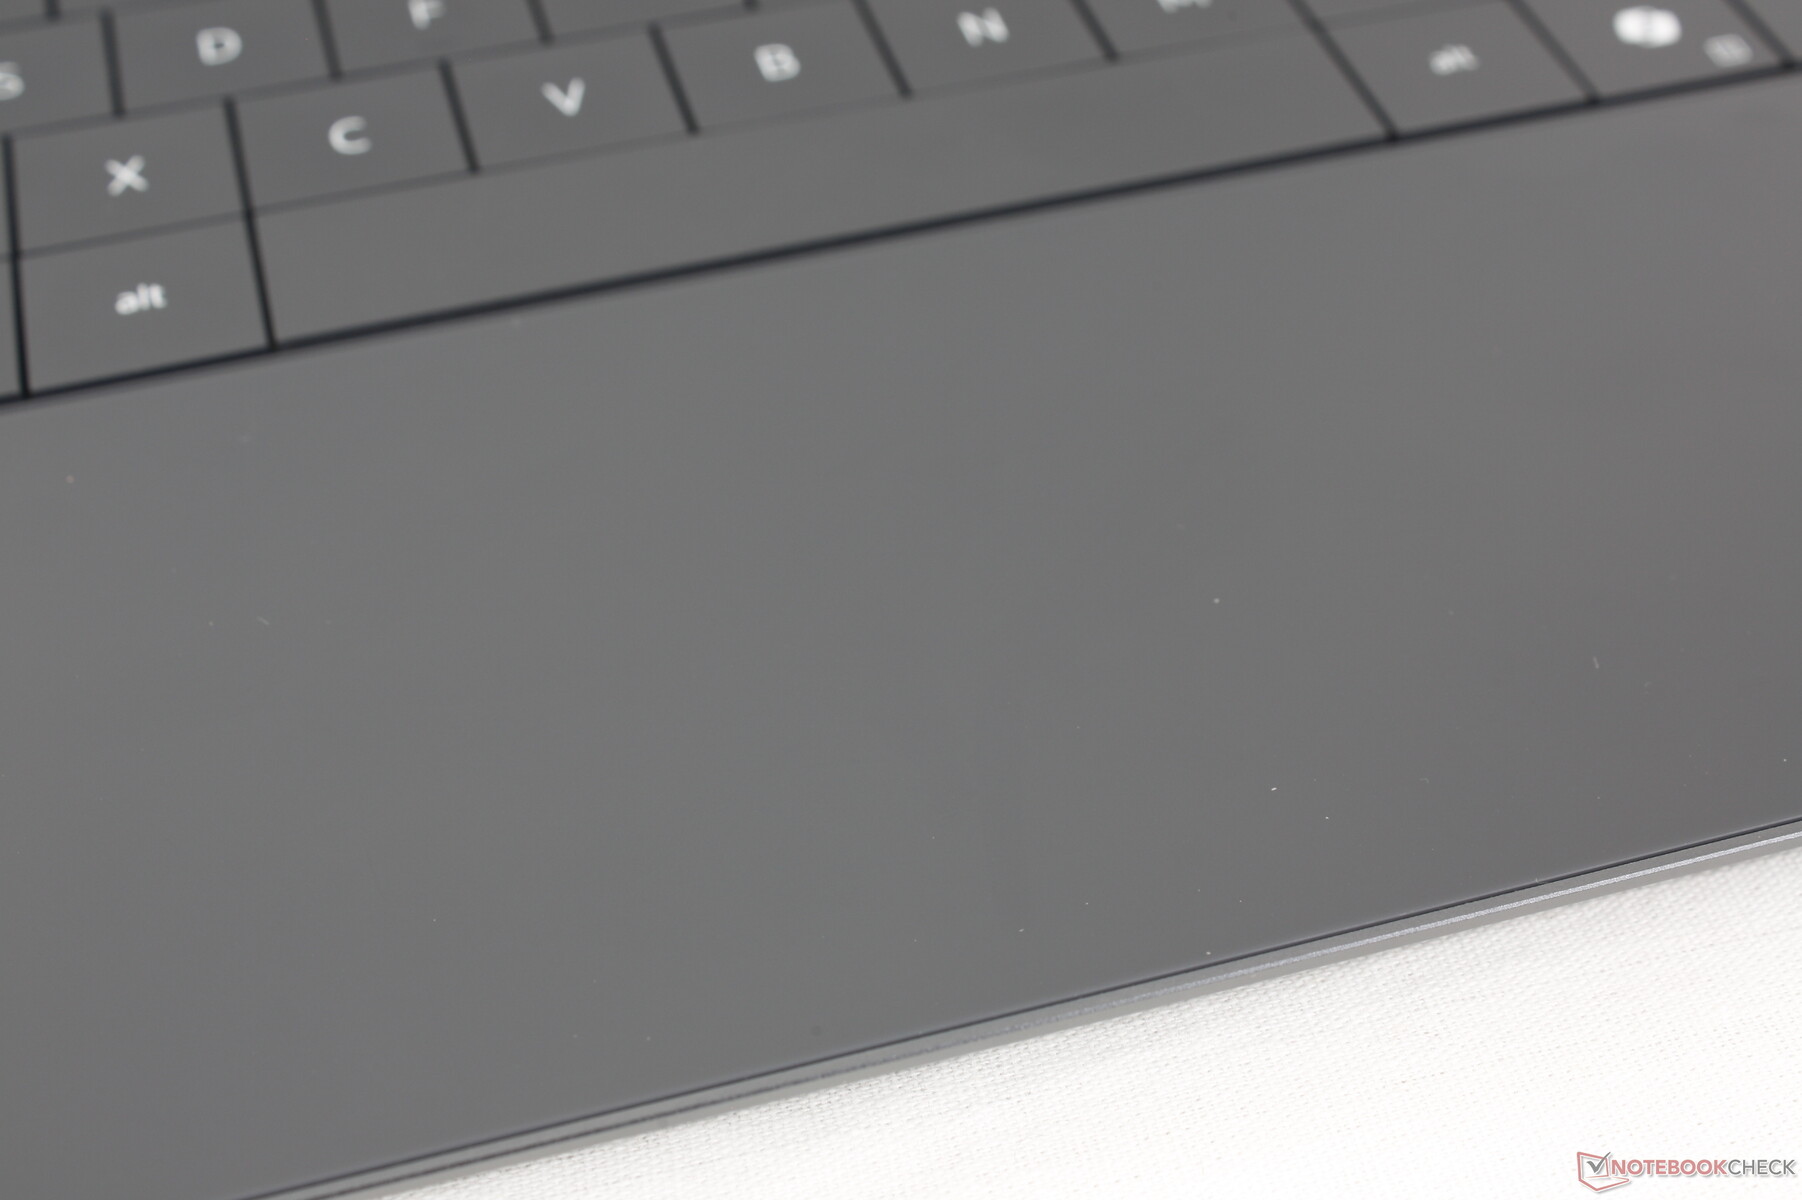
Görünmez XPS clickpad kullanıcı dostu olmamasıyla ün salmıştır ve bu eğilim Snapdragon modelinde de devam etmektedir. Kullanılabilir yüzey alanı yaklaşık 11,5 x 7,5 cm ile 13 inçlik bir form faktörü için oldukça geniş olsa da, zayıf geri bildirim nedeniyle tıklama tatmin edici değil. Daha da kötüsü, bir tıklama girişi için gereken kuvvet diğer dizüstü bilgisayarların çoğundan çok daha düşüktür ve bu da imleci hareket ettirmeye çalışırken birçok yanlışlıkla tıklamaya ve sürüklemeye neden olur. Bu tasarımla geçirdiğimiz iki yılın ardından bu konuda bazı gelişmeler olmasını umuyorduk, ancak maalesef durum böyle değil.

Ekran
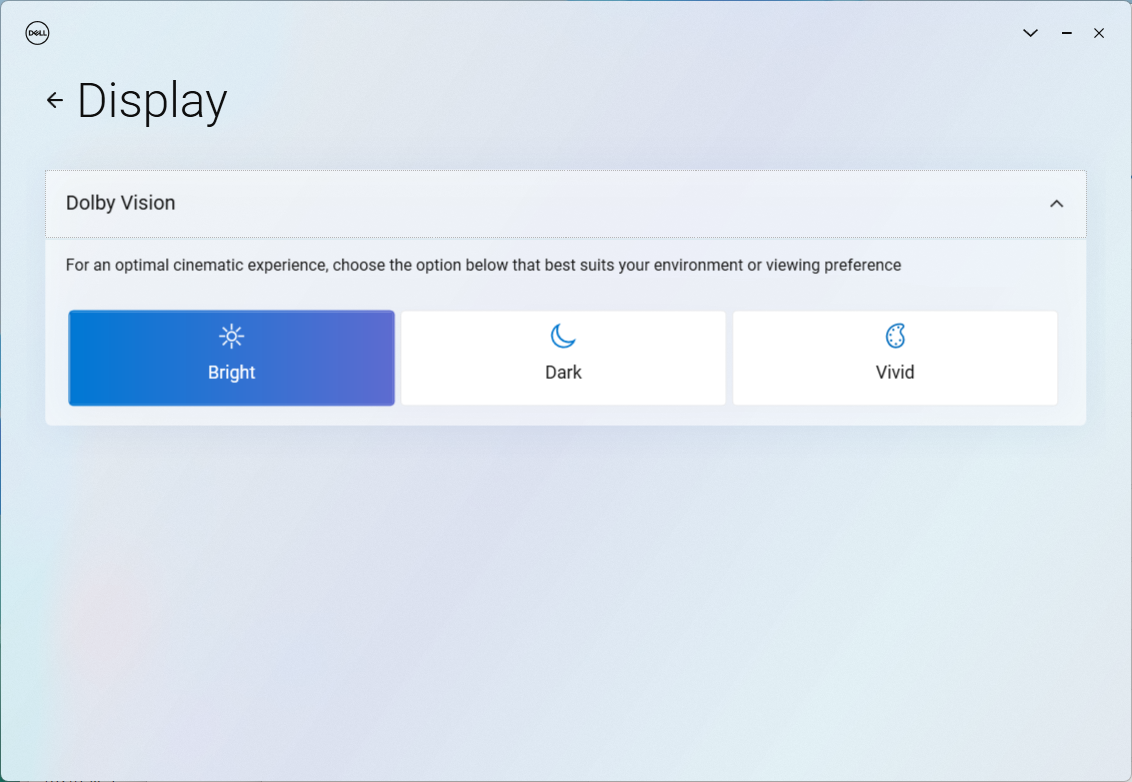
Aşağıdaki gibi üç ekran seçeneği mevcuttur. İnceleme konfigürasyonumuz kalınlaştırılmış seçenekle geliyor.
- 1920 x 1200, IPS, 120 Hz, dokunmatik olmayan, mat
- 2560 x 1600, IPS, 120 Hz, dokunmatik, parlak
- 2880 x 1800, OLED, 60 Hz, dokunmatik, parlak
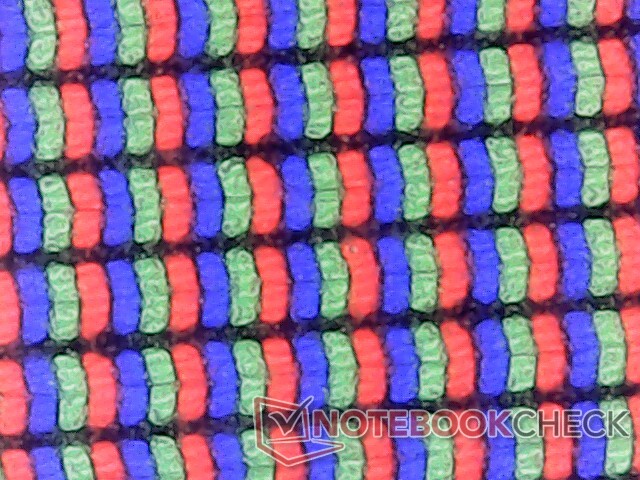
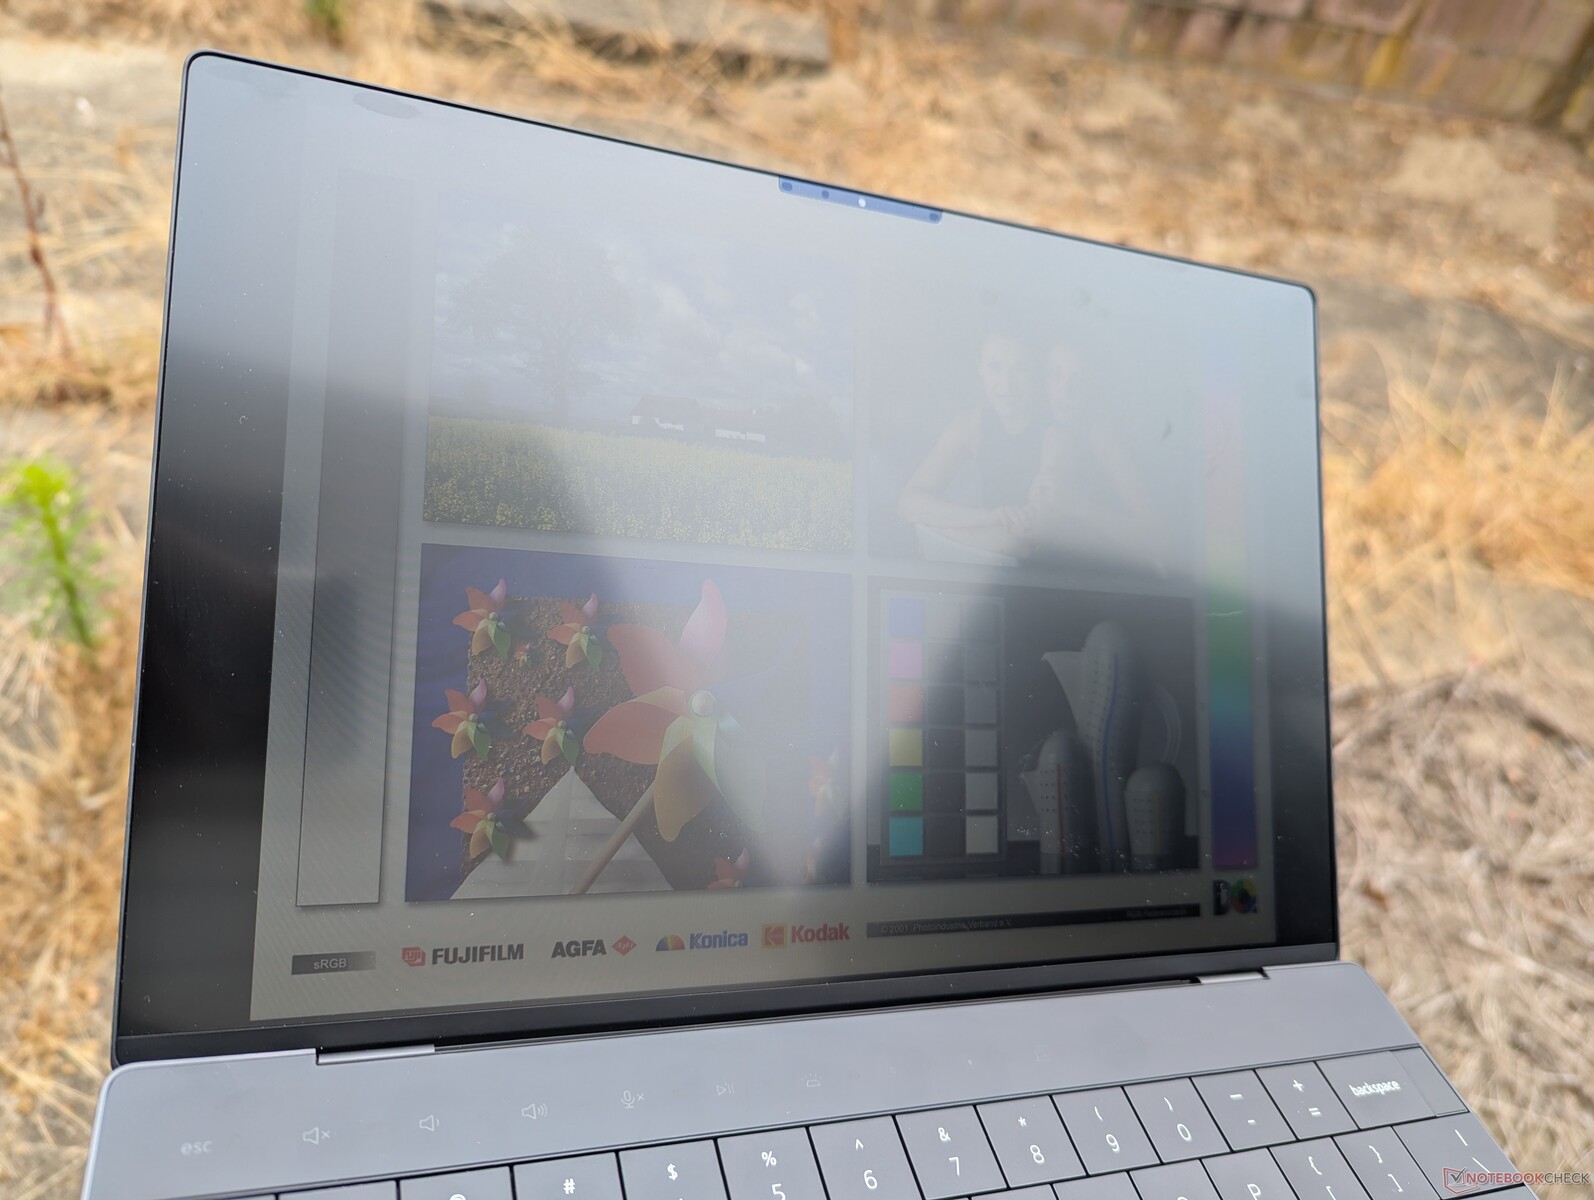
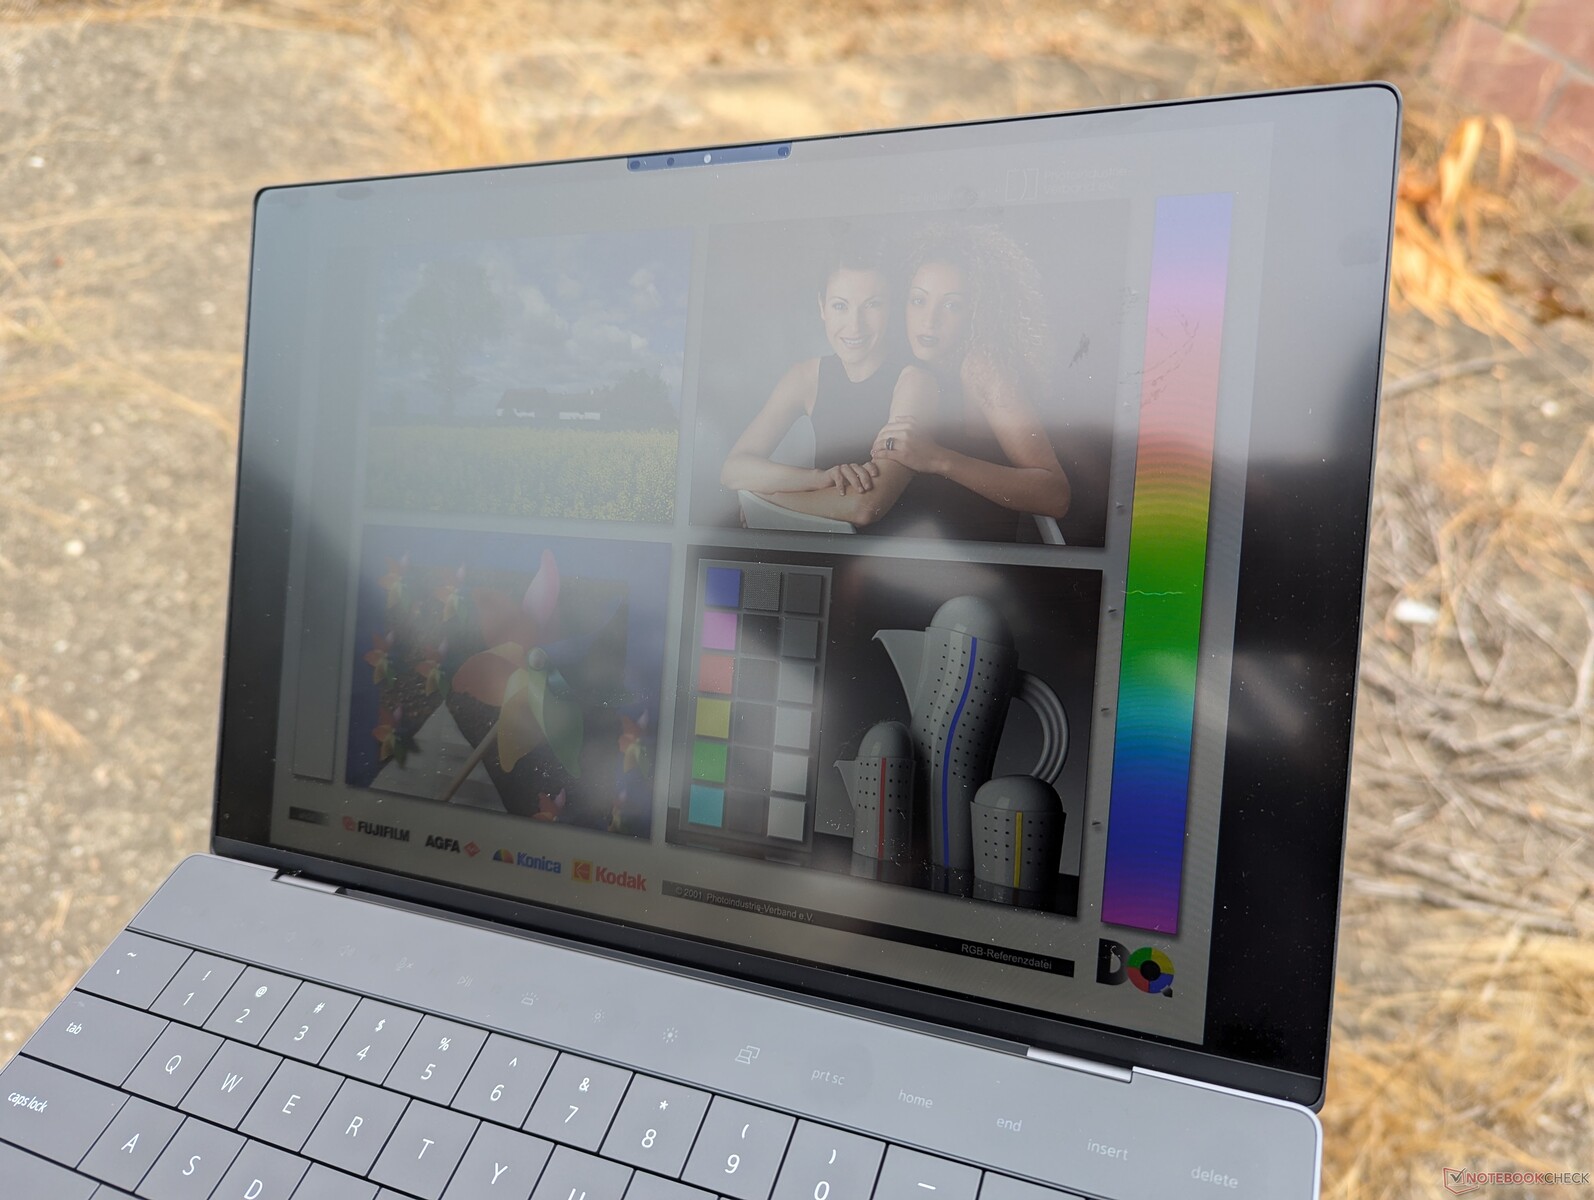
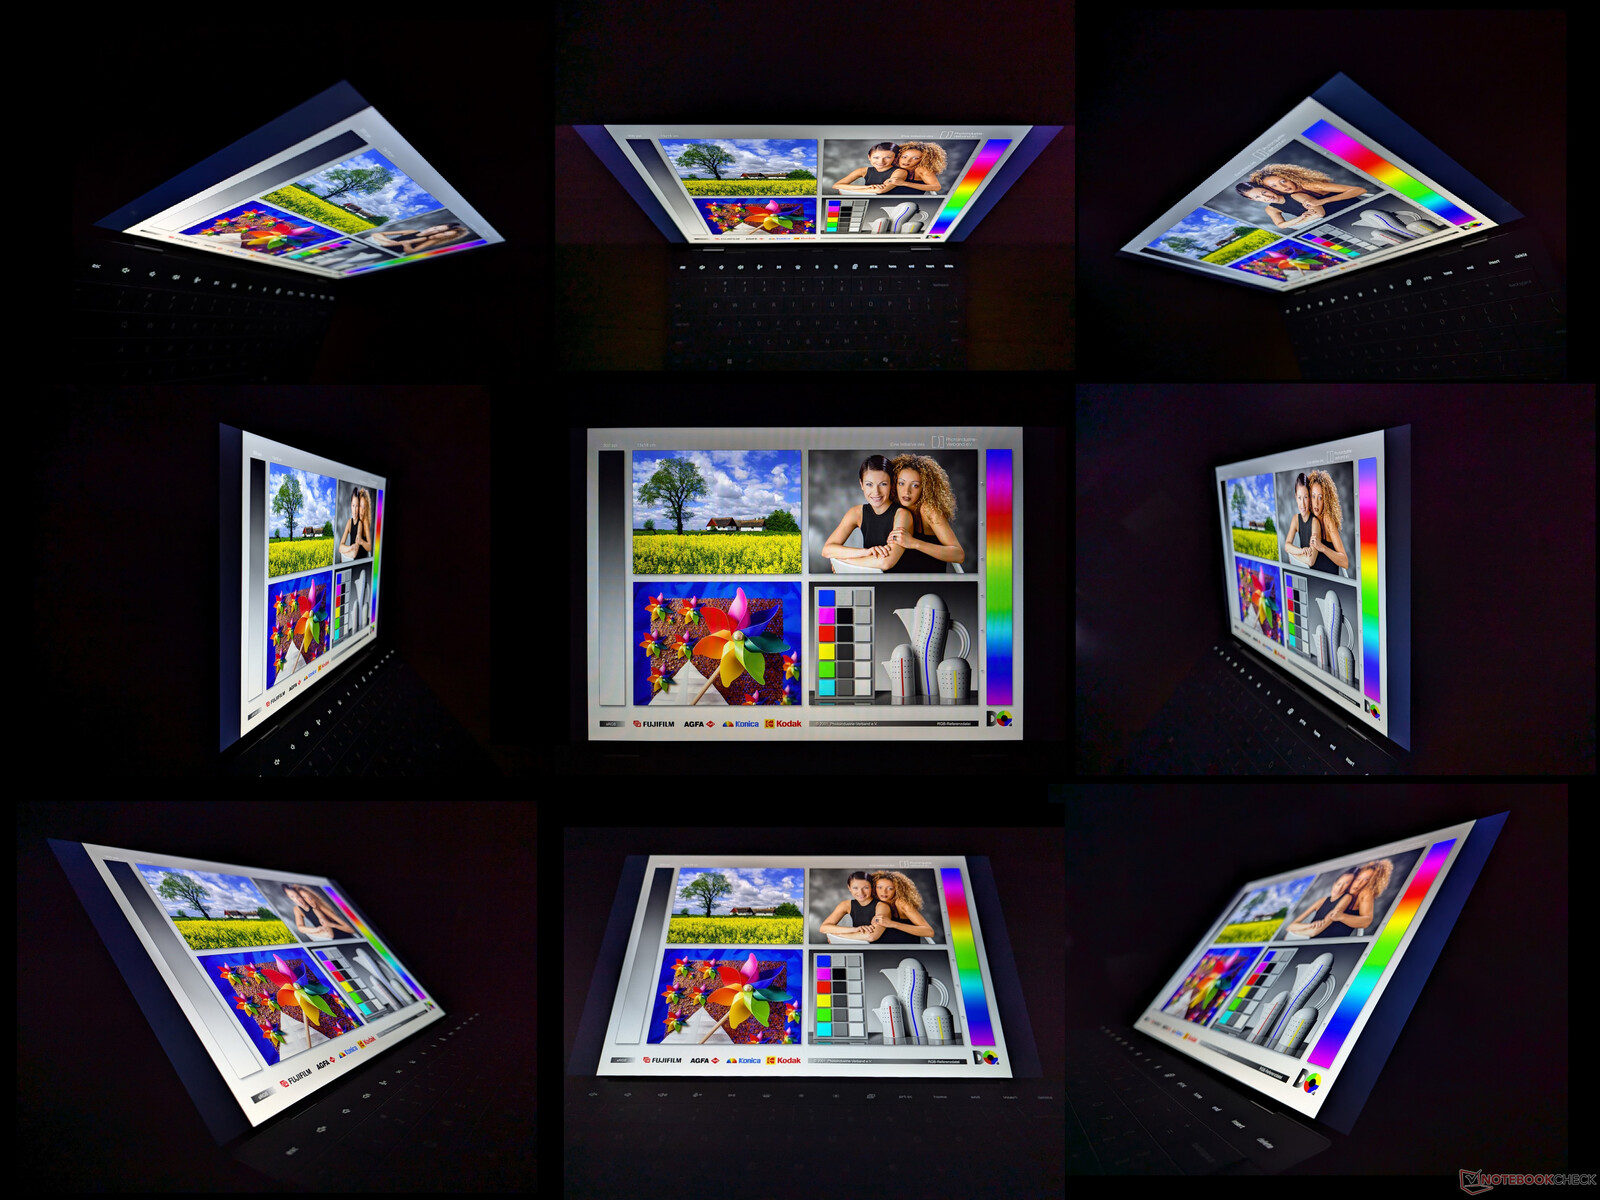
Tüm göstergeler 120 Hz panelimizin Intel tabanlı XPS 13 için kullanılan panelin aynısı olduğuna işaret ediyor. VRR desteğinden 30 Hz'e kadar her şey, yeterli tepki süreleri ve 500 nit maksimum parlaklık, son Core Ultra 7 XPS 13 test ünitemizde bulunan benzer özelliklerdir. En dikkat çekici özellik ise diğer dizüstü bilgisayarlarda bulunan çoğu IPS panelde 1000:1 olan kontrast oranına kıyasla neredeyse 2000:1 olan yüksek kontrast oranı. XPS modellerindeki ekranlar her zaman sınıfının en iyilerinden olmuştur ve bu nedenle en ucuz IPS seçeneği bile hala harika görünüyor.
Renk kapsamı, temel seçenekle yapılandırıldığında >%95 sRGB ile sınırlıyken DCI-P3 renkleri daha pahalı 1600p IPS ve 1800p OLED paneller için ayrılmıştır. Kullanıcılar, fotoğraf düzenleme sırasında küçük renk değişikliklerini önlemek için Adaptive Color'ı devre dışı bırakmak isteyebilir.
Bu panel hakkında bahsetmeye değer bir şey, Core i7 modelimizde de fark ettiğimiz bir şey olan 49 nitlik nispeten yüksek minimum parlaklık seviyesidir. Buna kıyasla, diğer dizüstü bilgisayarların çoğundaki ekranlar, minimum parlaklık ayarındayken genellikle 15 nit veya daha düşük bir değere ulaşır. Dell'in daha yüksek parlaklık katsayısı, karanlık ortamlarda görüntüleme yaparken göz yorgunluğuna neden olabilir. Bu potansiyel sorun, çok daha düşük parlaklık seviyelerine ulaşabilen OLED konfigürasyonunda mevcut değildir.
| |||||||||||||||||||||||||
Aydınlatma: 86 %
Batarya modunda parlaklık: 518.3 cd/m²
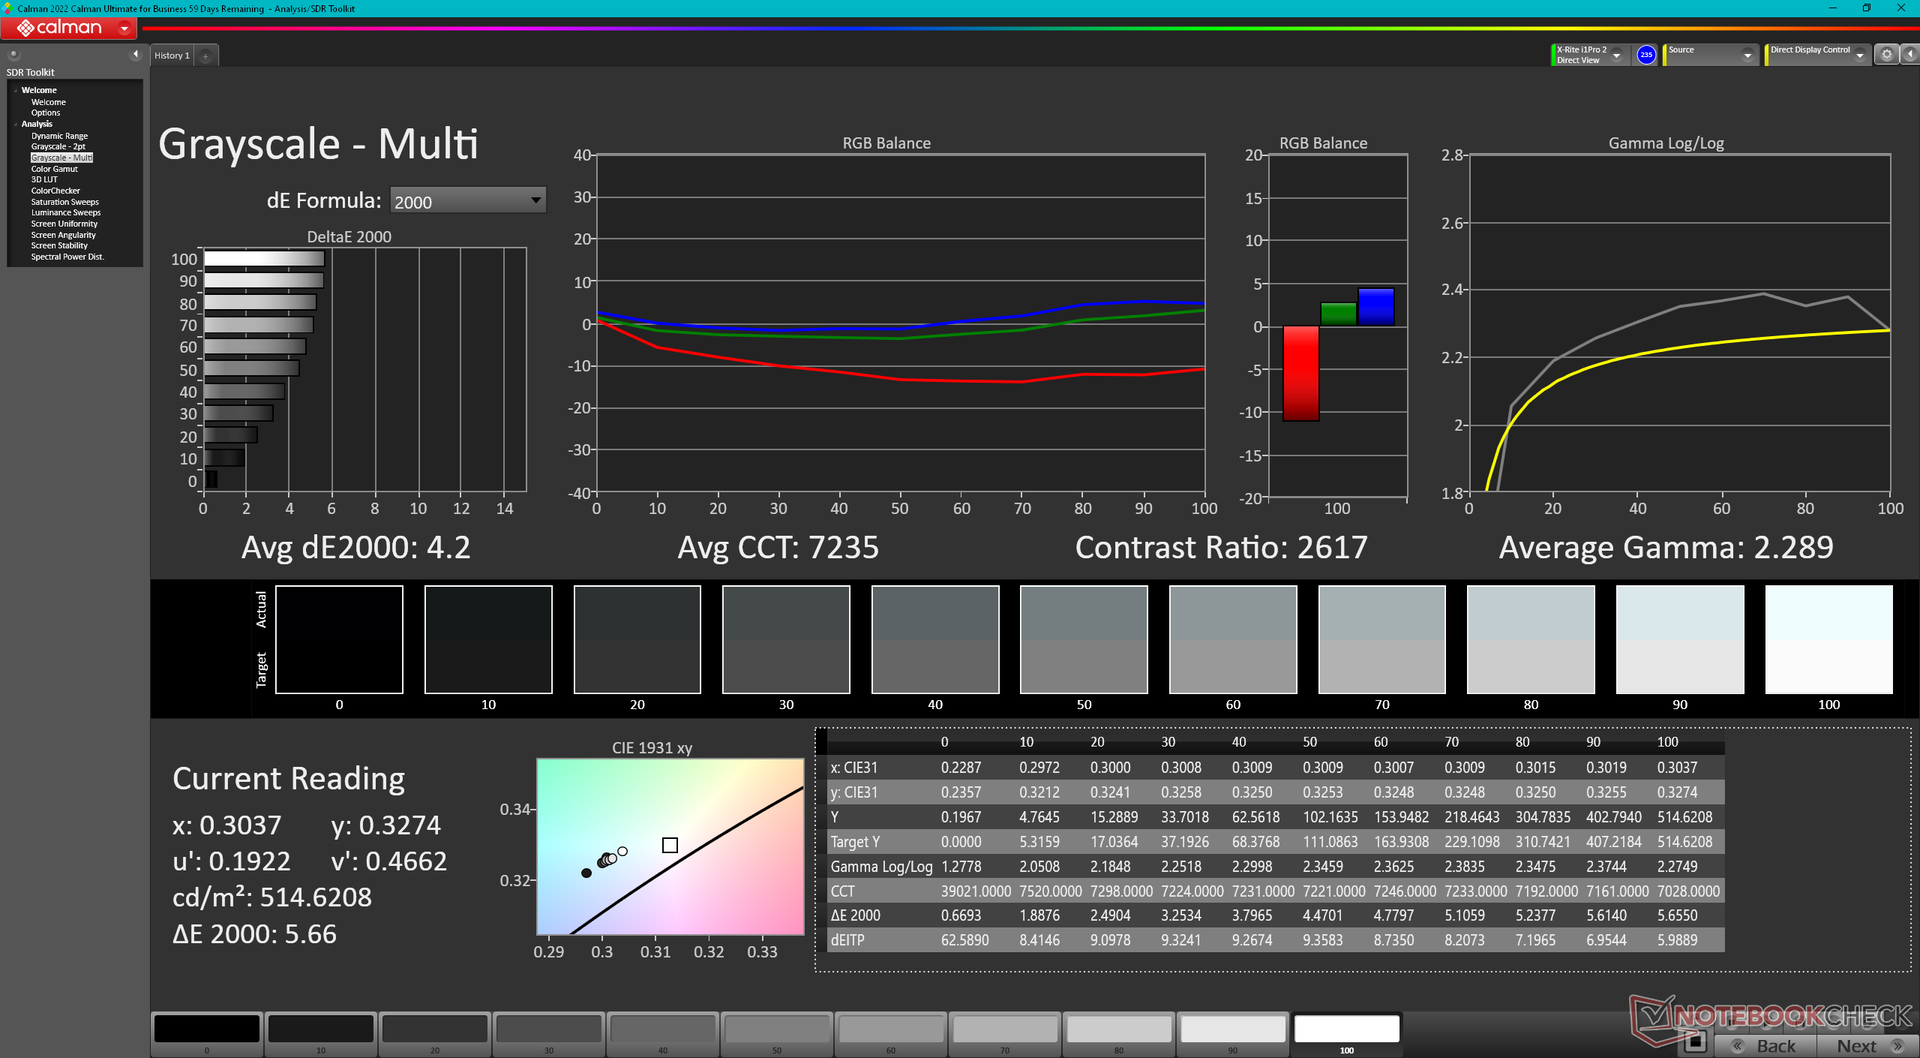
Kontrast: 1993:1 (Siyah: 0.26 cd/m²)
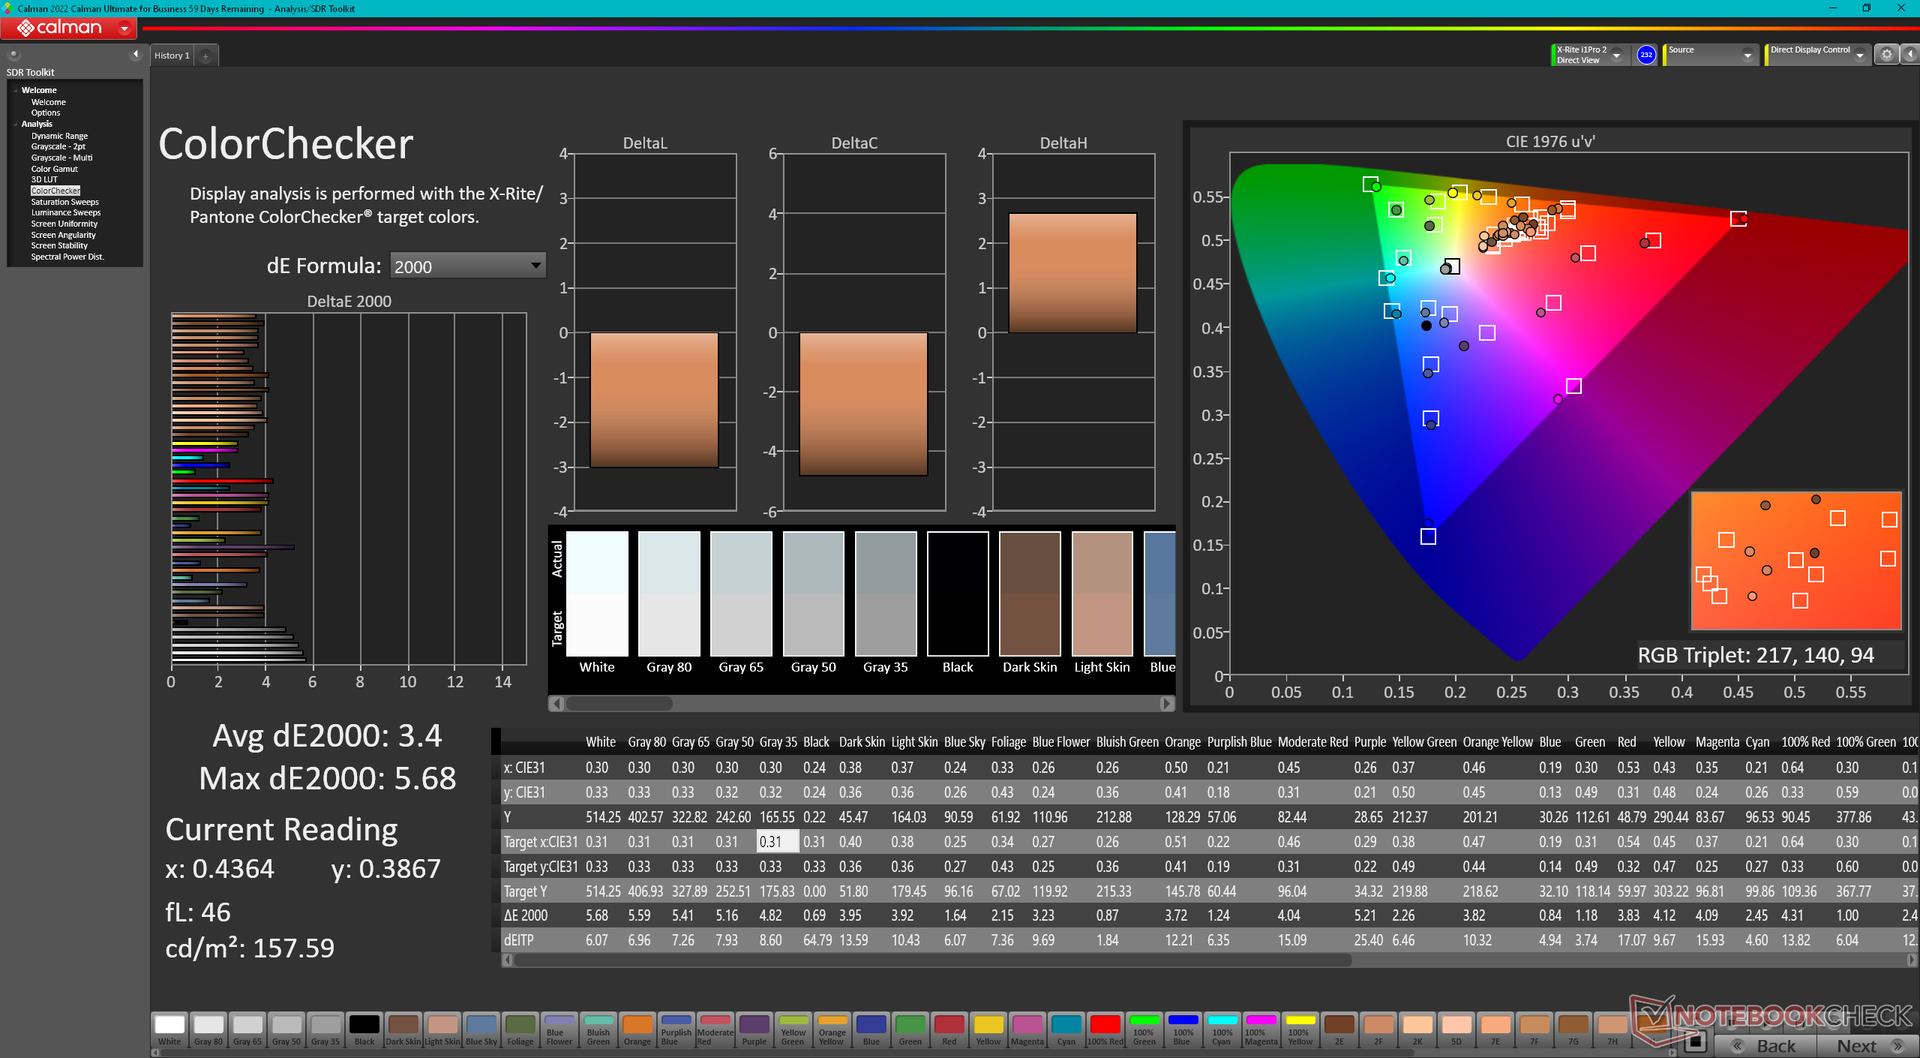
ΔE Color 3.4 | 0.5-29.43 Ø4.86
ΔE Greyscale 4.2 | 0.5-98 Ø5.1
71.7% AdobeRGB 1998 (Argyll 2.2.0 3D)
97.8% sRGB (Argyll 2.2.0 3D)
69.4% Display P3 (Argyll 2.2.0 3D)
Gamma: 2.29
| Dell XPS 13 9345 IPS, 1920x1200, 13.4", 120 Hz | Dell XPS 13 9340 Core Ultra 7 SHP1593, IPS, 1920x1200, 13.4", 120 Hz | Microsoft Surface Laptop 7 13.8 Copilot+ LQ138P1JX61, IPS, 2304x1536, 13.8", 120 Hz | Lenovo ThinkBook 13x G4 21KR0008GE LEN135WQ+, IPS, 2880x1920, 13.5", 120 Hz | HP EliteBook Ultra G1q 14 IPS, 2240x1400, 14", 60 Hz | Asus ZenBook S13 OLED UX5304 SDC417B, OLED, 2880x1800, 13.3", 60 Hz | |
|---|---|---|---|---|---|---|
| Display | 0% | 21% | -4% | 27% | ||
| Display P3 Coverage | 69.4 | 69.4 0% | 97.8 41% | 65.5 -6% | 99.7 44% | |
| sRGB Coverage | 97.8 | 97.8 0% | 98.2 0% | 97.3 -1% | 100 2% | |
| AdobeRGB 1998 Coverage | 71.7 | 71.7 0% | 87.3 22% | 67.7 -6% | 96.9 35% | |
| Response Times | -25% | 5% | 32% | 27% | 94% | |
| Response Time Grey 50% / Grey 80% * | 35.2 ? | 43.2 ? -23% | 38.9 ? -11% | 27.3 ? 22% | 22.8 ? 35% | 2 ? 94% |
| Response Time Black / White * | 21.8 ? | 27.6 ? -27% | 17.4 ? 20% | 12.8 ? 41% | 17.9 ? 18% | 1.6 ? 93% |
| PWM Frequency | 240 ? | |||||
| Screen | -6% | 16% | 10% | -58% | 27% | |
| Brightness middle | 518.3 | 429 -17% | 606 17% | 539 4% | 341.4 -34% | 361 -30% |
| Brightness | 487 | 407 -16% | 592 22% | 513 5% | 315 -35% | 365 -25% |
| Brightness Distribution | 86 | 90 5% | 94 9% | 89 3% | 87 1% | 98 14% |
| Black Level * | 0.26 | 0.28 -8% | 0.43 -65% | 0.38 -46% | 0.39 -50% | |
| Contrast | 1993 | 1532 -23% | 1409 -29% | 1418 -29% | 875 -56% | |
| Colorchecker dE 2000 * | 3.4 | 2.6 24% | 1.3 62% | 1.4 59% | 5.63 -66% | 1.2 65% |
| Colorchecker dE 2000 max. * | 5.68 | 6.6 -16% | 2.1 63% | 3.5 38% | 11.94 -110% | 1.9 67% |
| Greyscale dE 2000 * | 4.2 | 4 5% | 2.1 50% | 2.2 48% | 8.8 -110% | 1.2 71% |
| Gamma | 2.29 96% | 2.23 99% | 2.16 102% | 2.19 100% | 2.14 103% | 2.27 97% |
| CCT | 7235 90% | 7332 89% | 6842 95% | 6710 97% | 6034 108% | 6486 100% |
| Colorchecker dE 2000 calibrated * | 1.4 | 0.7 | ||||
| Toplam Ortalama (Program / Ayarlar) | -10% /
-7% | 14% /
15% | 13% /
10% | -16% /
-41% | 49% /
39% |
* ... daha küçük daha iyidir
X-Rite renk ölçerimiz, ekranın sRGB'yi hedeflediğini ve sırasıyla 4,2 ve 3,4'lük iyi ortalama gri tonlama ve renk deltaE değerlerine sahip olduğunu gösteriyor. Bununla birlikte, renk sıcaklığı 7235'te biraz fazla soğuktur ve bu da düşük doygunluk seviyelerinde renk doğruluğunu bozar. Çoğu kalibrasyon yazılımı henüz i1Profiler dahil ARM ile uyumlu olmadığından Dell'in paneli fabrikada kalibre etmemesi utanç verici.

Yanıt Sürelerini Görüntüle
| ↔ Tepki Süresi Siyahtan Beyaza | ||
|---|---|---|
| 21.8 ms ... yükseliş ↗ ve sonbahar↘ birleşimi | ↗ 10.5 ms yükseliş | 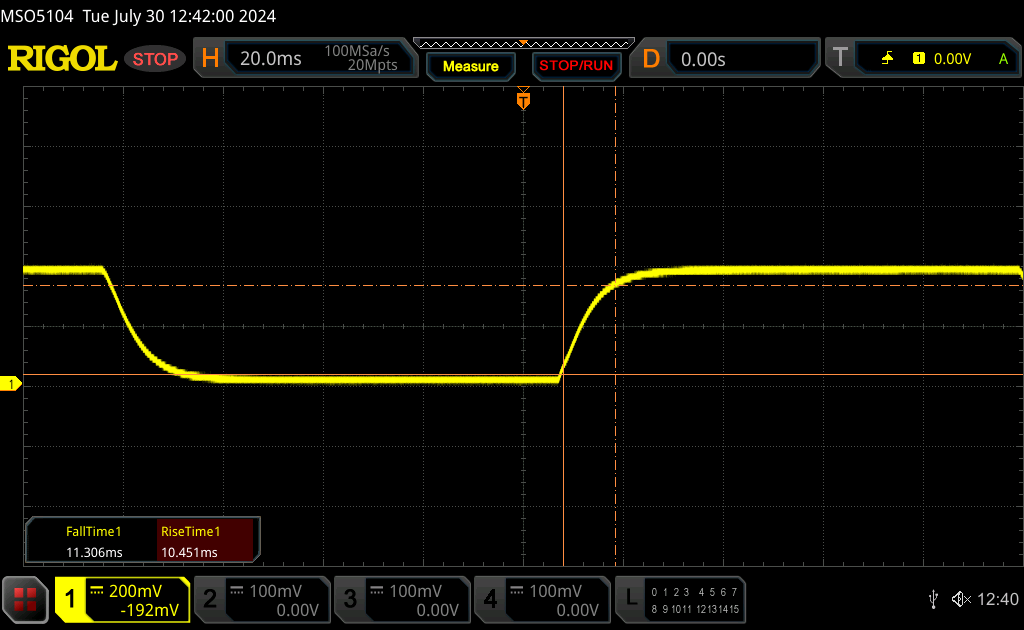 |
| ↘ 11.3 ms sonbahar | ||
| Ekran, testlerimizde iyi yanıt oranları gösteriyor ancak rekabetçi oyuncular için çok yavaş olabilir. Karşılaştırıldığında, test edilen tüm cihazlar 0.1 (minimum) ile 240 (maksimum) ms arasında değişir. » Tüm cihazların 45 %'si daha iyi. Bu, ölçülen yanıt süresinin test edilen tüm cihazların ortalamasına benzer olduğu anlamına gelir (20.7 ms). | ||
| ↔ Tepki Süresi %50 Griden %80 Griye | ||
| 35.2 ms ... yükseliş ↗ ve sonbahar↘ birleşimi | ↗ 15.2 ms yükseliş | 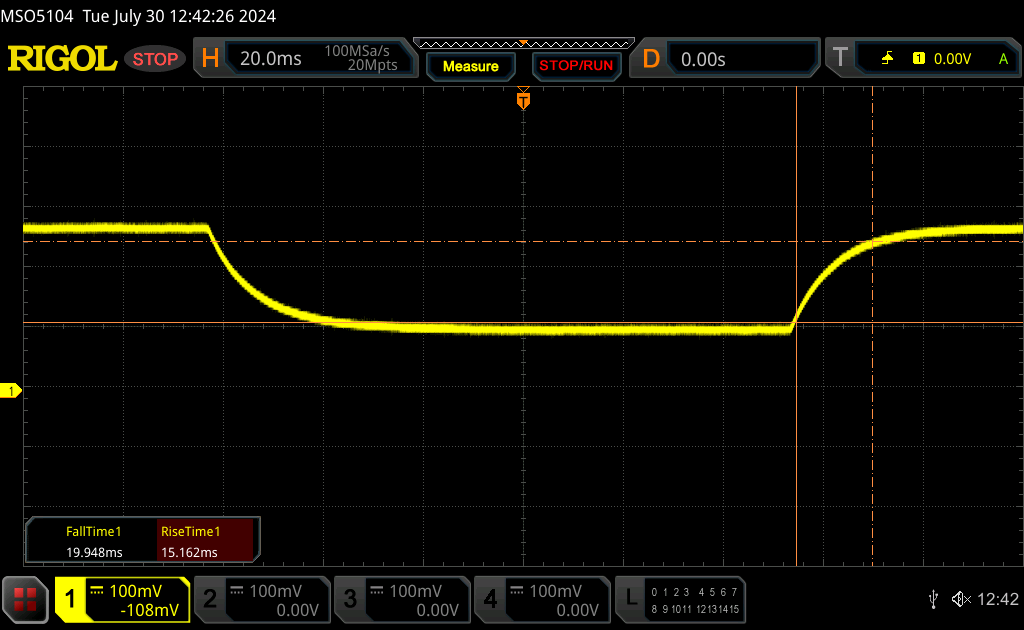 |
| ↘ 20 ms sonbahar | ||
| Ekran, testlerimizde yavaş yanıt oranları gösteriyor ve oyuncular için yetersiz olacaktır. Karşılaştırıldığında, test edilen tüm cihazlar 0.165 (minimum) ile 636 (maksimum) ms arasında değişir. » Tüm cihazların 46 %'si daha iyi. Bu, ölçülen yanıt süresinin test edilen tüm cihazların ortalamasına benzer olduğu anlamına gelir (32.4 ms). | ||
Ekran Titremesi / PWM (Darbe Genişliği Modülasyonu)
| Ekran titriyor / PWM algılanmadı | 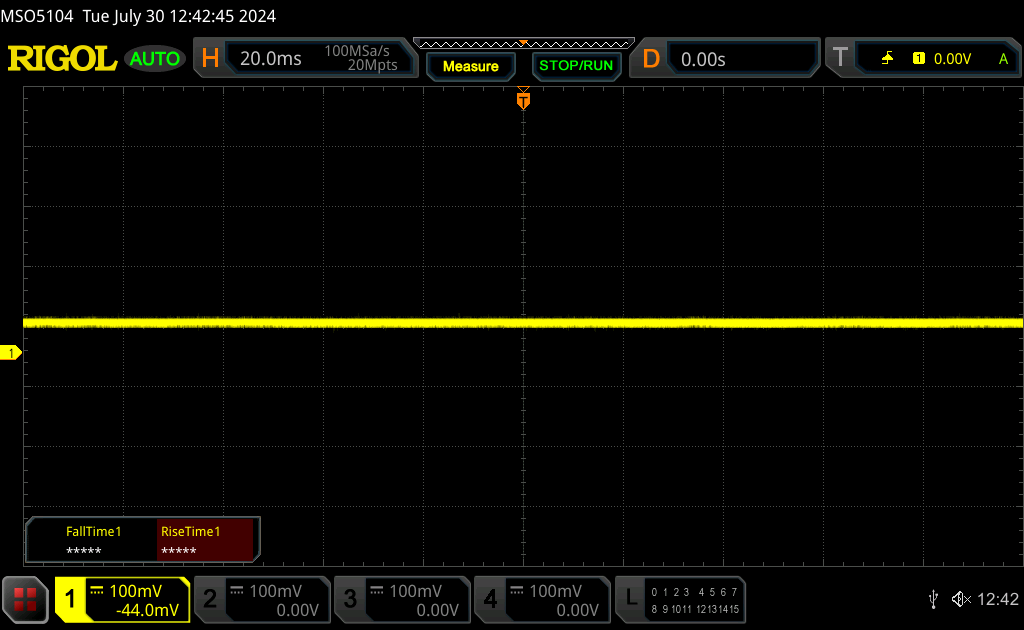 | ||
Karşılaştırıldığında: Test edilen tüm cihazların %53 %'si ekranı karartmak için PWM kullanmıyor. PWM tespit edilirse, ortalama 8482 (minimum: 5 - maksimum: 343500) Hz ölçüldü. | |||

Performans
Test Koşulları
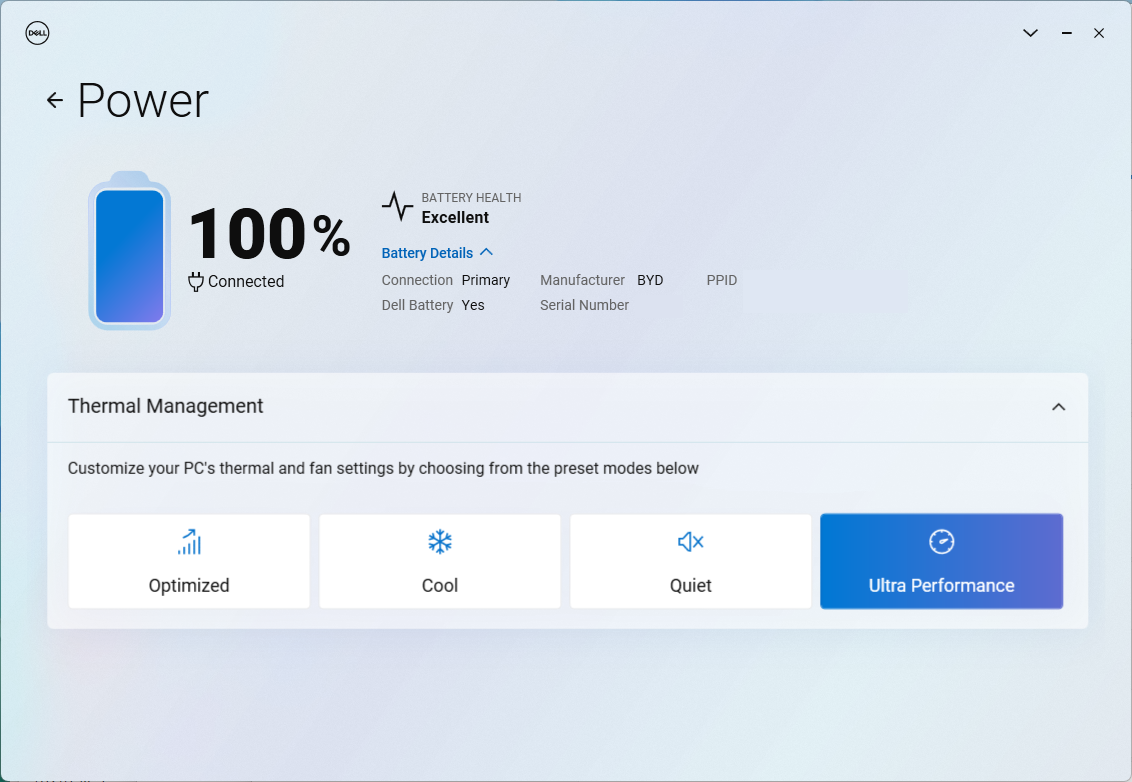
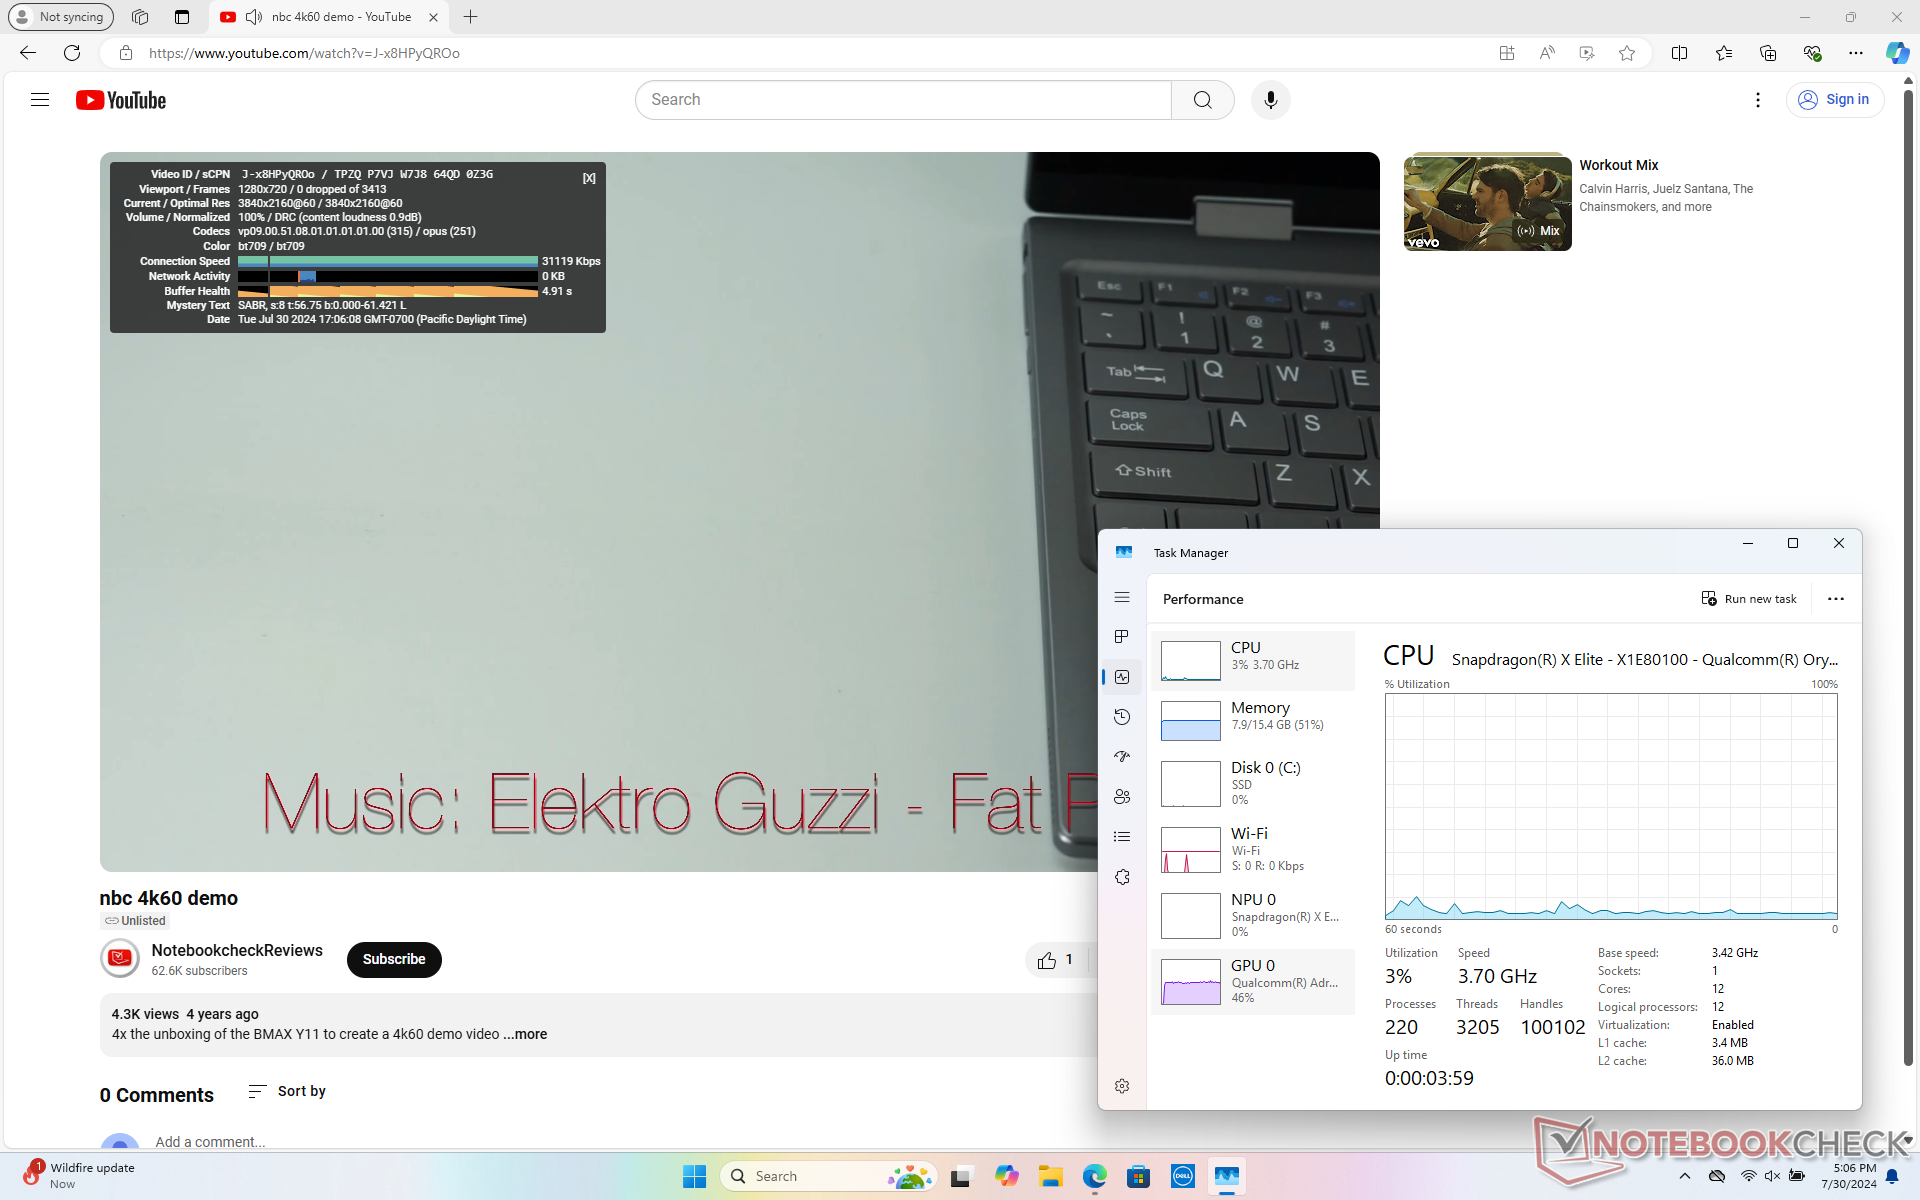
Aşağıdaki kıyaslamaları çalıştırmadan önce Windows ve MyDell'i Performans moduna ayarladık. MyDell, Intel tabanlı XPS 13'teki aynı yazılıma kıyasla Snapdragon modelinde kullanımı daha basit olacak şekilde yeniden tasarlandı. Daha önce yazılımda bulunan Varlık Algılama gibi bazı özellikler bunun yerine Windows Güç ve Pil menüsüne taşınmıştır.
İşlemci
Performans büyük ölçüde uygulamanın yerel ya da taklit olup olmamasına bağlıdır. Örneğin, işlemci CineBench 2024 ve GeekBench 6'da üstündür çünkü her ikisi de ARM ortamı için optimize edilmiştir. Bizim Snapdragon X Elite X1E-80-100 daha iyi performans gösterecektir Core Ultra 7 155H bu koşullar altında hem çok iş parçacıklı hem de tek iş parçacıklı işlemlerde. Aksi takdirde, emüle edilmiş kıyaslamalar Snapdragon CPU'muzu eski modellerle daha eşit performans seviyelerine çekmektedir Core i5-1240P veya Core i7-1260P. Başka bir deyişle, Qualcomm CPU, üreticinin iddia etmeyi sevdiği gibi Core Ultra 7 155H'ye karşı rekabet edebilir, ancak bu avantajların ortaya çıkması için koşulların ve uygulamaların doğru olması gerekir.
Snapdragon CPU'lar arasında performans tutarlılığını ölçmek de zor olabilir. Örneğimiz için, Snapdragon X Elite X1E-80-100, Core Ultra 7 155H'den rahatlıkla daha iyi performans gösterecektir Snapdragon X Elite X1E-78-100 içinde EliteBook Ultra G1q 14 cineBench 2024'te, ancak CineBench R23 ve R15'te tam tersi geçerlidir.
Cinebench R15 Multi Loop
Cinebench 2024: CPU Multi Core | CPU Single Core
Cinebench R23: Multi Core | Single Core
Cinebench R20: CPU (Multi Core) | CPU (Single Core)
Cinebench R15: CPU Multi 64Bit | CPU Single 64Bit
Blender: v2.79 BMW27 CPU
7-Zip 18.03: 7z b 4 | 7z b 4 -mmt1
Geekbench 6.4: Multi-Core | Single-Core
HWBOT x265 Benchmark v2.2: 4k Preset
LibreOffice : 20 Documents To PDF
R Benchmark 2.5: Overall mean
| CPU Performance Rating | |
| Dell XPS 14 2024 OLED | |
| Dell XPS 13 9340 Core Ultra 7 | |
| Dell XPS 13 Plus 9320 Core i7-1360P -4! | |
| Dell XPS 13 Plus 9320 i7-1280P OLED -4! | |
| Dell XPS 13 Plus 9320 4K -4! | |
| Microsoft Surface Laptop 7 13.8 Copilot+ | |
| Dell XPS 13 9345 | |
| Ortalama Qualcomm Snapdragon X Elite X1E-80-100 | |
| HP EliteBook Ultra G1q 14 | |
| Medion SPRCHRGD 14 S1 Elite | |
| Dell XPS 13 Plus 9320 i5-1240p -4! | |
| Lenovo ThinkPad T14s Gen 6 21N10007GE | |
| Dell XPS 13 9315 2-in-1 Core i5-1230U -4! | |
| Dell XPS 13 9315, i5-1230U -8! | |
| Dell XPS 13 9310 Core i7 4K -4! | |
| Dell XPS 13 9310 OLED -4! | |
| Dell XPS 13 9310 2-in-1 -5! | |
| Dell XPS 13 9305 Core i5 FHD -6! | |
| Cinebench 2024 / CPU Multi Core | |
| Dell XPS 13 9345 | |
| Microsoft Surface Laptop 7 13.8 Copilot+ | |
| Ortalama Qualcomm Snapdragon X Elite X1E-80-100 (621 - 927, n=7) | |
| Medion SPRCHRGD 14 S1 Elite | |
| HP EliteBook Ultra G1q 14 | |
| Lenovo ThinkPad T14s Gen 6 21N10007GE | |
| Dell XPS 13 9340 Core Ultra 7 | |
| Dell XPS 14 2024 OLED | |
| Cinebench 2024 / CPU Single Core | |
| Microsoft Surface Laptop 7 13.8 Copilot+ | |
| Ortalama Qualcomm Snapdragon X Elite X1E-80-100 (122 - 123, n=7) | |
| Dell XPS 13 9345 | |
| Lenovo ThinkPad T14s Gen 6 21N10007GE | |
| Medion SPRCHRGD 14 S1 Elite | |
| HP EliteBook Ultra G1q 14 | |
| Dell XPS 14 2024 OLED | |
| Dell XPS 13 9340 Core Ultra 7 | |
| Geekbench 6.4 / Multi-Core | |
| Lenovo ThinkPad T14s Gen 6 21N10007GE | |
| Dell XPS 13 9345 | |
| Medion SPRCHRGD 14 S1 Elite | |
| Microsoft Surface Laptop 7 13.8 Copilot+ | |
| Dell XPS 14 2024 OLED | |
| HP EliteBook Ultra G1q 14 | |
| Ortalama Qualcomm Snapdragon X Elite X1E-80-100 (7596 - 14998, n=9) | |
| Dell XPS 13 9340 Core Ultra 7 | |
| Geekbench 6.4 / Single-Core | |
| Dell XPS 13 9345 | |
| Microsoft Surface Laptop 7 13.8 Copilot+ | |
| Ortalama Qualcomm Snapdragon X Elite X1E-80-100 (1896 - 2845, n=9) | |
| Lenovo ThinkPad T14s Gen 6 21N10007GE | |
| Medion SPRCHRGD 14 S1 Elite | |
| Dell XPS 14 2024 OLED | |
| Dell XPS 13 9340 Core Ultra 7 | |
| HP EliteBook Ultra G1q 14 | |
| LibreOffice / 20 Documents To PDF | |
| Microsoft Surface Laptop 7 13.8 Copilot+ | |
| Dell XPS 13 Plus 9320 i5-1240p | |
| HP EliteBook Ultra G1q 14 | |
| Ortalama Qualcomm Snapdragon X Elite X1E-80-100 (50.9 - 98.5, n=7) | |
| Dell XPS 13 9305 Core i5 FHD | |
| Lenovo ThinkPad T14s Gen 6 21N10007GE | |
| Medion SPRCHRGD 14 S1 Elite | |
| Dell XPS 13 9345 | |
| Dell XPS 13 9315 2-in-1 Core i5-1230U | |
| Dell XPS 14 2024 OLED | |
| Dell XPS 13 Plus 9320 i7-1280P OLED | |
| Dell XPS 13 9340 Core Ultra 7 | |
| Dell XPS 13 9310 Core i7 4K | |
| Dell XPS 13 Plus 9320 Core i7-1360P | |
| Dell XPS 13 Plus 9320 4K | |
| Dell XPS 13 9310 OLED | |
Cinebench 2024: CPU Multi Core | CPU Single Core
Cinebench R23: Multi Core | Single Core
Cinebench R20: CPU (Multi Core) | CPU (Single Core)
Cinebench R15: CPU Multi 64Bit | CPU Single 64Bit
Blender: v2.79 BMW27 CPU
7-Zip 18.03: 7z b 4 | 7z b 4 -mmt1
Geekbench 6.4: Multi-Core | Single-Core
HWBOT x265 Benchmark v2.2: 4k Preset
LibreOffice : 20 Documents To PDF
R Benchmark 2.5: Overall mean
* ... daha küçük daha iyidir
AIDA64: FP32 Ray-Trace | FPU Julia | CPU SHA3 | CPU Queen | FPU SinJulia | FPU Mandel | CPU AES | CPU ZLib | FP64 Ray-Trace | CPU PhotoWorxx
| Performance Rating | |
| Dell XPS 13 9340 Core Ultra 7 | |
| Lenovo ThinkBook 13x G4 21KR0008GE | |
| Microsoft Surface Laptop 7 13.8 Copilot+ | |
| Dell XPS 13 9345 | |
| HP EliteBook Ultra G1q 14 | |
| Ortalama Qualcomm Snapdragon X Elite X1E-80-100 | |
| Asus ZenBook S13 OLED UX5304 | |
| AIDA64 / FP32 Ray-Trace | |
| Dell XPS 13 9340 Core Ultra 7 | |
| Lenovo ThinkBook 13x G4 21KR0008GE | |
| HP EliteBook Ultra G1q 14 | |
| Microsoft Surface Laptop 7 13.8 Copilot+ | |
| Dell XPS 13 9345 | |
| Ortalama Qualcomm Snapdragon X Elite X1E-80-100 (2184 - 7469, n=7) | |
| Asus ZenBook S13 OLED UX5304 | |
| AIDA64 / FPU Julia | |
| Dell XPS 13 9340 Core Ultra 7 | |
| Lenovo ThinkBook 13x G4 21KR0008GE | |
| Asus ZenBook S13 OLED UX5304 | |
| Microsoft Surface Laptop 7 13.8 Copilot+ | |
| Dell XPS 13 9345 | |
| HP EliteBook Ultra G1q 14 | |
| Ortalama Qualcomm Snapdragon X Elite X1E-80-100 (5687 - 26391, n=7) | |
| AIDA64 / CPU SHA3 | |
| HP EliteBook Ultra G1q 14 | |
| Microsoft Surface Laptop 7 13.8 Copilot+ | |
| Dell XPS 13 9340 Core Ultra 7 | |
| Dell XPS 13 9345 | |
| Ortalama Qualcomm Snapdragon X Elite X1E-80-100 (2607 - 3122, n=7) | |
| Lenovo ThinkBook 13x G4 21KR0008GE | |
| Asus ZenBook S13 OLED UX5304 | |
| AIDA64 / CPU Queen | |
| Lenovo ThinkBook 13x G4 21KR0008GE | |
| Dell XPS 13 9340 Core Ultra 7 | |
| Microsoft Surface Laptop 7 13.8 Copilot+ | |
| Ortalama Qualcomm Snapdragon X Elite X1E-80-100 (67219 - 69762, n=7) | |
| Dell XPS 13 9345 | |
| HP EliteBook Ultra G1q 14 | |
| Asus ZenBook S13 OLED UX5304 | |
| AIDA64 / FPU SinJulia | |
| Dell XPS 13 9340 Core Ultra 7 | |
| Lenovo ThinkBook 13x G4 21KR0008GE | |
| Asus ZenBook S13 OLED UX5304 | |
| Microsoft Surface Laptop 7 13.8 Copilot+ | |
| Dell XPS 13 9345 | |
| Ortalama Qualcomm Snapdragon X Elite X1E-80-100 (1521 - 2357, n=7) | |
| HP EliteBook Ultra G1q 14 | |
| AIDA64 / FPU Mandel | |
| Dell XPS 13 9340 Core Ultra 7 | |
| Lenovo ThinkBook 13x G4 21KR0008GE | |
| Asus ZenBook S13 OLED UX5304 | |
| HP EliteBook Ultra G1q 14 | |
| Microsoft Surface Laptop 7 13.8 Copilot+ | |
| Ortalama Qualcomm Snapdragon X Elite X1E-80-100 (10117 - 15669, n=7) | |
| Dell XPS 13 9345 | |
| AIDA64 / CPU AES | |
| HP EliteBook Ultra G1q 14 | |
| Dell XPS 13 9340 Core Ultra 7 | |
| Microsoft Surface Laptop 7 13.8 Copilot+ | |
| Ortalama Qualcomm Snapdragon X Elite X1E-80-100 (39956 - 71089, n=7) | |
| Dell XPS 13 9345 | |
| Lenovo ThinkBook 13x G4 21KR0008GE | |
| Asus ZenBook S13 OLED UX5304 | |
| AIDA64 / CPU ZLib | |
| Dell XPS 13 9340 Core Ultra 7 | |
| HP EliteBook Ultra G1q 14 | |
| Microsoft Surface Laptop 7 13.8 Copilot+ | |
| Dell XPS 13 9345 | |
| Ortalama Qualcomm Snapdragon X Elite X1E-80-100 (398 - 802, n=7) | |
| Lenovo ThinkBook 13x G4 21KR0008GE | |
| Asus ZenBook S13 OLED UX5304 | |
| AIDA64 / FP64 Ray-Trace | |
| Dell XPS 13 9340 Core Ultra 7 | |
| Lenovo ThinkBook 13x G4 21KR0008GE | |
| Microsoft Surface Laptop 7 13.8 Copilot+ | |
| Dell XPS 13 9345 | |
| Ortalama Qualcomm Snapdragon X Elite X1E-80-100 (2581 - 4044, n=7) | |
| Asus ZenBook S13 OLED UX5304 | |
| HP EliteBook Ultra G1q 14 | |
| AIDA64 / CPU PhotoWorxx | |
| Dell XPS 13 9340 Core Ultra 7 | |
| Lenovo ThinkBook 13x G4 21KR0008GE | |
| Asus ZenBook S13 OLED UX5304 | |
| Microsoft Surface Laptop 7 13.8 Copilot+ | |
| Dell XPS 13 9345 | |
| Ortalama Qualcomm Snapdragon X Elite X1E-80-100 (28474 - 38707, n=7) | |
| HP EliteBook Ultra G1q 14 | |
Sistem Performansı
ARM için optimize edilmiş Edge tarayıcısında yerel olarak çalışan WebXPRT ve Kraken, Qualcomm XPS'imizi Intel XPS'in önünde iyi bir farkla sıralıyor.
WebXPRT 3: Overall
WebXPRT 4: Overall
Mozilla Kraken 1.1: Total
| CrossMark / Overall | |
| Dell XPS 13 9340 Core Ultra 7 | |
| Asus ZenBook S13 OLED UX5304 | |
| Lenovo ThinkBook 13x G4 21KR0008GE | |
| Microsoft Surface Laptop 7 13.8 Copilot+ | |
| Ortalama Qualcomm Snapdragon X Elite X1E-80-100, Qualcomm SD X Adreno X1-85 3.8 TFLOPS (1356 - 1443, n=7) | |
| Dell XPS 13 9345 | |
| HP EliteBook Ultra G1q 14 | |
| CrossMark / Productivity | |
| Dell XPS 13 9340 Core Ultra 7 | |
| Asus ZenBook S13 OLED UX5304 | |
| Lenovo ThinkBook 13x G4 21KR0008GE | |
| Microsoft Surface Laptop 7 13.8 Copilot+ | |
| Ortalama Qualcomm Snapdragon X Elite X1E-80-100, Qualcomm SD X Adreno X1-85 3.8 TFLOPS (1271 - 1375, n=7) | |
| Dell XPS 13 9345 | |
| HP EliteBook Ultra G1q 14 | |
| CrossMark / Creativity | |
| Dell XPS 13 9340 Core Ultra 7 | |
| Lenovo ThinkBook 13x G4 21KR0008GE | |
| Asus ZenBook S13 OLED UX5304 | |
| Microsoft Surface Laptop 7 13.8 Copilot+ | |
| Ortalama Qualcomm Snapdragon X Elite X1E-80-100, Qualcomm SD X Adreno X1-85 3.8 TFLOPS (1402 - 1537, n=7) | |
| Dell XPS 13 9345 | |
| HP EliteBook Ultra G1q 14 | |
| CrossMark / Responsiveness | |
| Dell XPS 13 9340 Core Ultra 7 | |
| Asus ZenBook S13 OLED UX5304 | |
| Microsoft Surface Laptop 7 13.8 Copilot+ | |
| Ortalama Qualcomm Snapdragon X Elite X1E-80-100, Qualcomm SD X Adreno X1-85 3.8 TFLOPS (1237 - 1401, n=7) | |
| Lenovo ThinkBook 13x G4 21KR0008GE | |
| Dell XPS 13 9345 | |
| HP EliteBook Ultra G1q 14 | |
| WebXPRT 3 / Overall | |
| Ortalama Qualcomm Snapdragon X Elite X1E-80-100, Qualcomm SD X Adreno X1-85 3.8 TFLOPS (430 - 455, n=7) | |
| Microsoft Surface Laptop 7 13.8 Copilot+ | |
| Dell XPS 13 9345 | |
| HP EliteBook Ultra G1q 14 | |
| Asus ZenBook S13 OLED UX5304 | |
| Dell XPS 13 9340 Core Ultra 7 | |
| Lenovo ThinkBook 13x G4 21KR0008GE | |
| WebXPRT 4 / Overall | |
| Dell XPS 13 9345 | |
| Ortalama Qualcomm Snapdragon X Elite X1E-80-100, Qualcomm SD X Adreno X1-85 3.8 TFLOPS (295 - 324, n=7) | |
| Microsoft Surface Laptop 7 13.8 Copilot+ | |
| HP EliteBook Ultra G1q 14 | |
| Dell XPS 13 9340 Core Ultra 7 | |
| Asus ZenBook S13 OLED UX5304 | |
| Lenovo ThinkBook 13x G4 21KR0008GE | |
| Mozilla Kraken 1.1 / Total | |
| Lenovo ThinkBook 13x G4 21KR0008GE | |
| Dell XPS 13 9340 Core Ultra 7 | |
| Asus ZenBook S13 OLED UX5304 | |
| HP EliteBook Ultra G1q 14 | |
| Dell XPS 13 9345 | |
| Ortalama Qualcomm Snapdragon X Elite X1E-80-100, Qualcomm SD X Adreno X1-85 3.8 TFLOPS (391 - 422, n=7) | |
| Microsoft Surface Laptop 7 13.8 Copilot+ | |
* ... daha küçük daha iyidir
| AIDA64 / Memory Copy | |
| Dell XPS 13 9340 Core Ultra 7 | |
| Lenovo ThinkBook 13x G4 21KR0008GE | |
| Dell XPS 13 9345 | |
| Microsoft Surface Laptop 7 13.8 Copilot+ | |
| Asus ZenBook S13 OLED UX5304 | |
| Ortalama Qualcomm Snapdragon X Elite X1E-80-100 (44795 - 63495, n=7) | |
| HP EliteBook Ultra G1q 14 | |
| AIDA64 / Memory Read | |
| Dell XPS 13 9345 | |
| Microsoft Surface Laptop 7 13.8 Copilot+ | |
| Ortalama Qualcomm Snapdragon X Elite X1E-80-100 (58855 - 125604, n=7) | |
| Dell XPS 13 9340 Core Ultra 7 | |
| Lenovo ThinkBook 13x G4 21KR0008GE | |
| HP EliteBook Ultra G1q 14 | |
| Asus ZenBook S13 OLED UX5304 | |
| AIDA64 / Memory Write | |
| Dell XPS 13 9340 Core Ultra 7 | |
| Asus ZenBook S13 OLED UX5304 | |
| Lenovo ThinkBook 13x G4 21KR0008GE | |
| Dell XPS 13 9345 | |
| Microsoft Surface Laptop 7 13.8 Copilot+ | |
| Ortalama Qualcomm Snapdragon X Elite X1E-80-100 (37270 - 45265, n=7) | |
| HP EliteBook Ultra G1q 14 | |
| AIDA64 / Memory Latency | |
| Lenovo ThinkBook 13x G4 21KR0008GE | |
| Dell XPS 13 9340 Core Ultra 7 | |
| Asus ZenBook S13 OLED UX5304 | |
| Ortalama Qualcomm Snapdragon X Elite X1E-80-100 (7.4 - 8.8, n=5) | |
| HP EliteBook Ultra G1q 14 | |
| Dell XPS 13 9345 | |
| Microsoft Surface Laptop 7 13.8 Copilot+ | |
* ... daha küçük daha iyidir
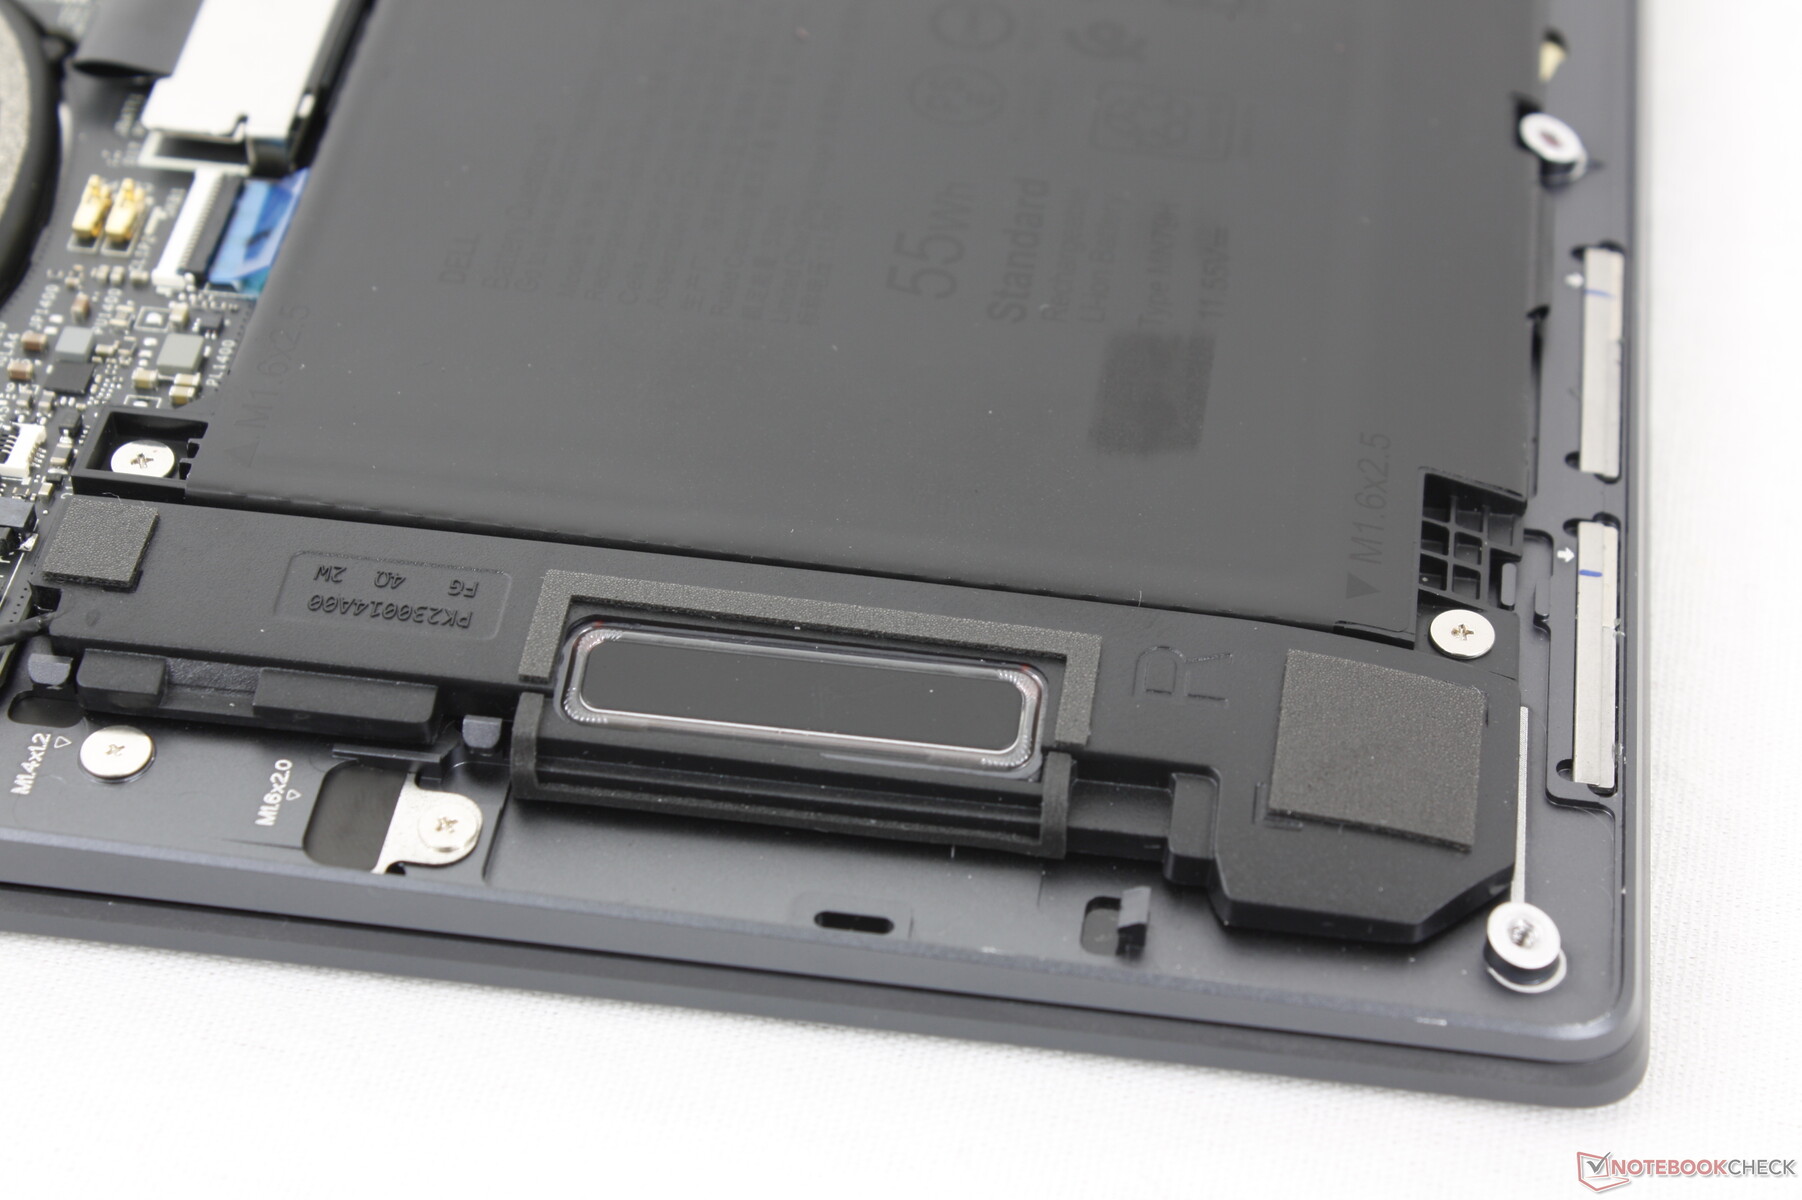
Depolama Cihazları
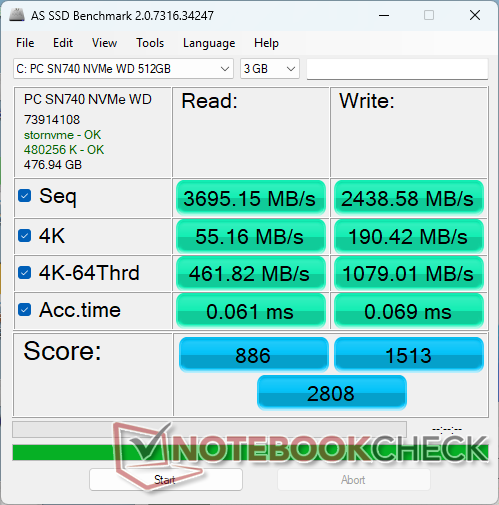
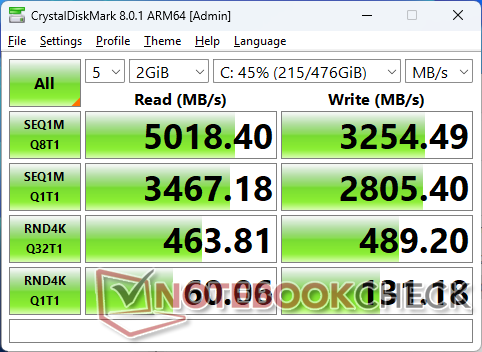
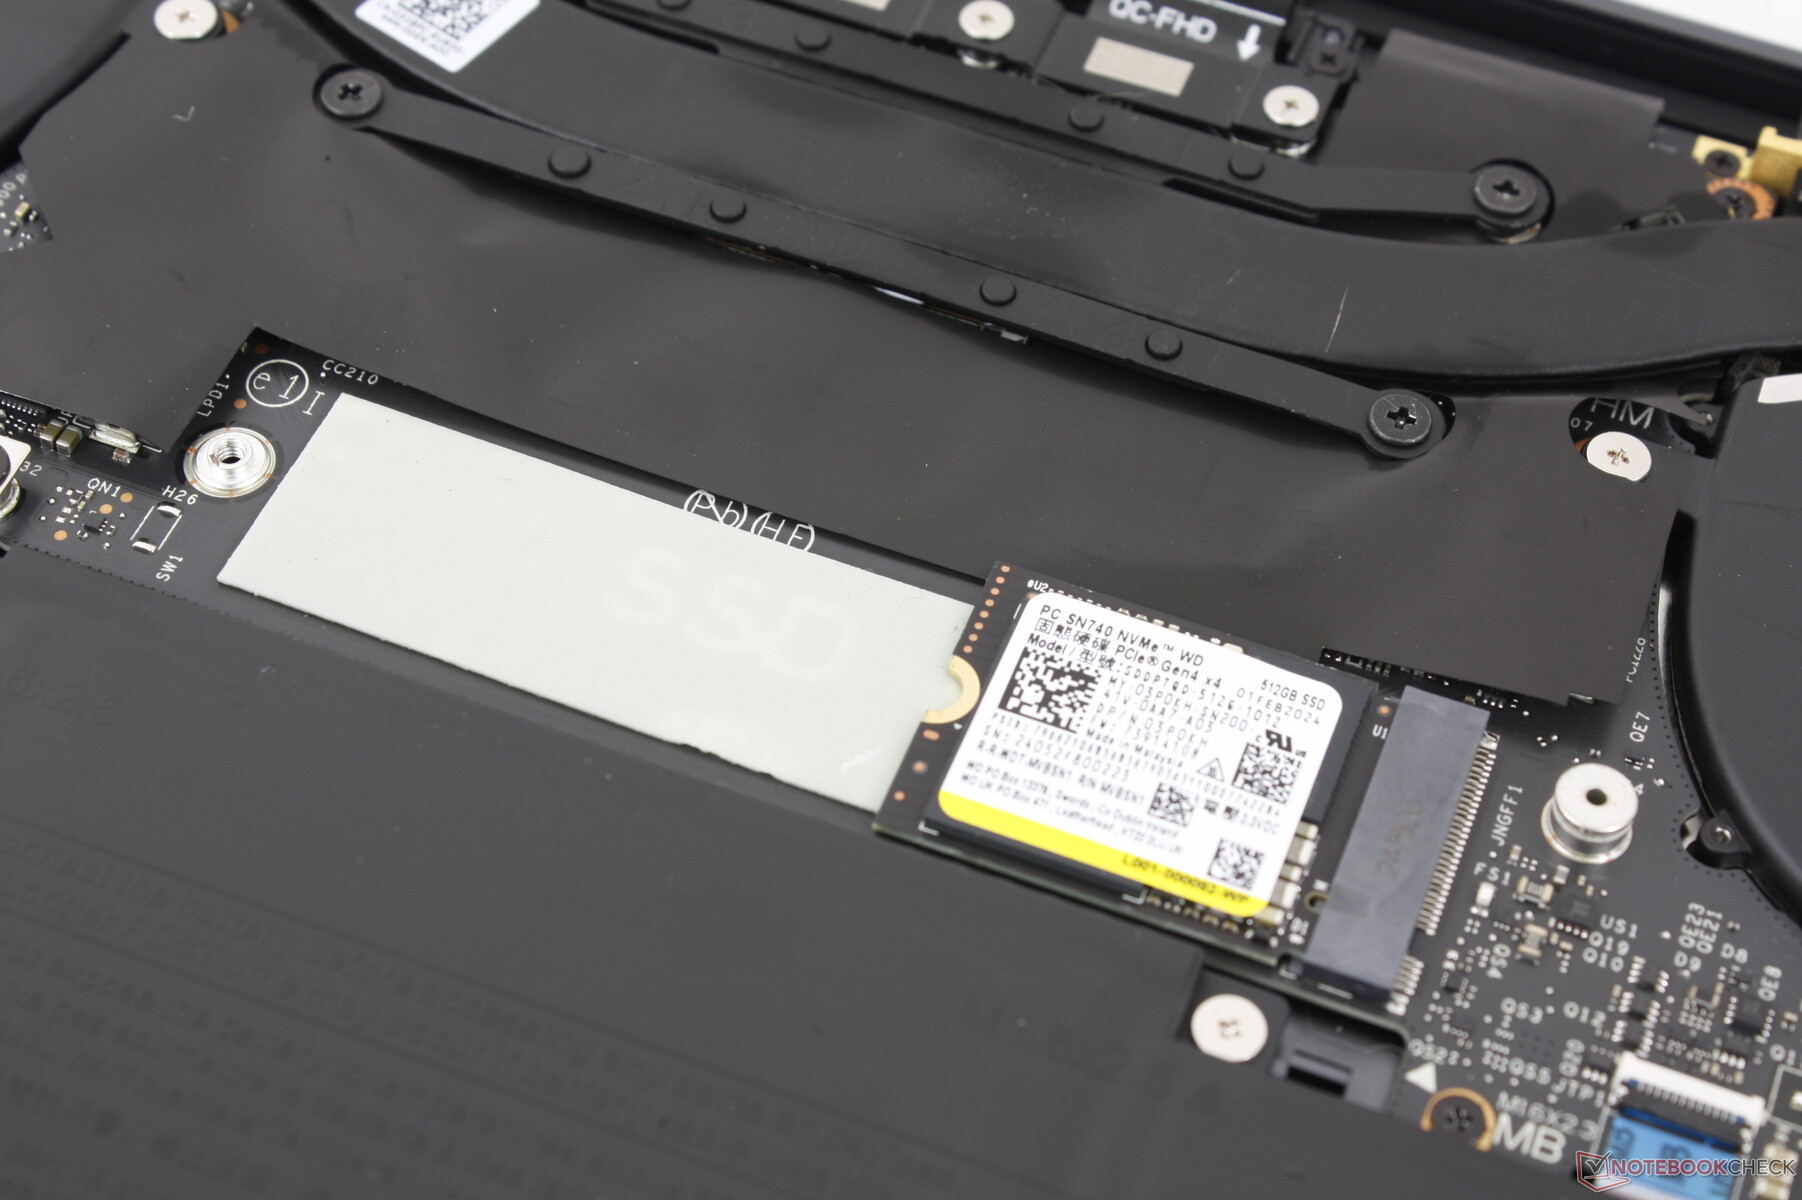
Dell, SSD'lerini çok çeşitli üreticilerden temin etmektedir ve bu nedenle satın almadan önce hangi sürücüyü aldığınızı bilmeniz zordur. Örneğin, 10'dan fazla farklı şirket içi XPS 13 ünitesinde Micron, Samsung, WD, Toshiba ve SK Hynix'in sürücülerini kullandık. Qualcomm'a özel ünitemiz, 5000 MB/s'ye kadar istikrarlı aktarım hızları sunan orta sınıf WD SN740 ile birlikte geliyor. Küçük 42 mm uzunluğuna rağmen, muhtemelen birlikte verilen SSD ısı dağıtıcısı nedeniyle herhangi bir kısılma davranışı gözlemlemedik.

* ... daha küçük daha iyidir
Disk Throttling: DiskSpd Read Loop, Queue Depth 8
GPU Performansı
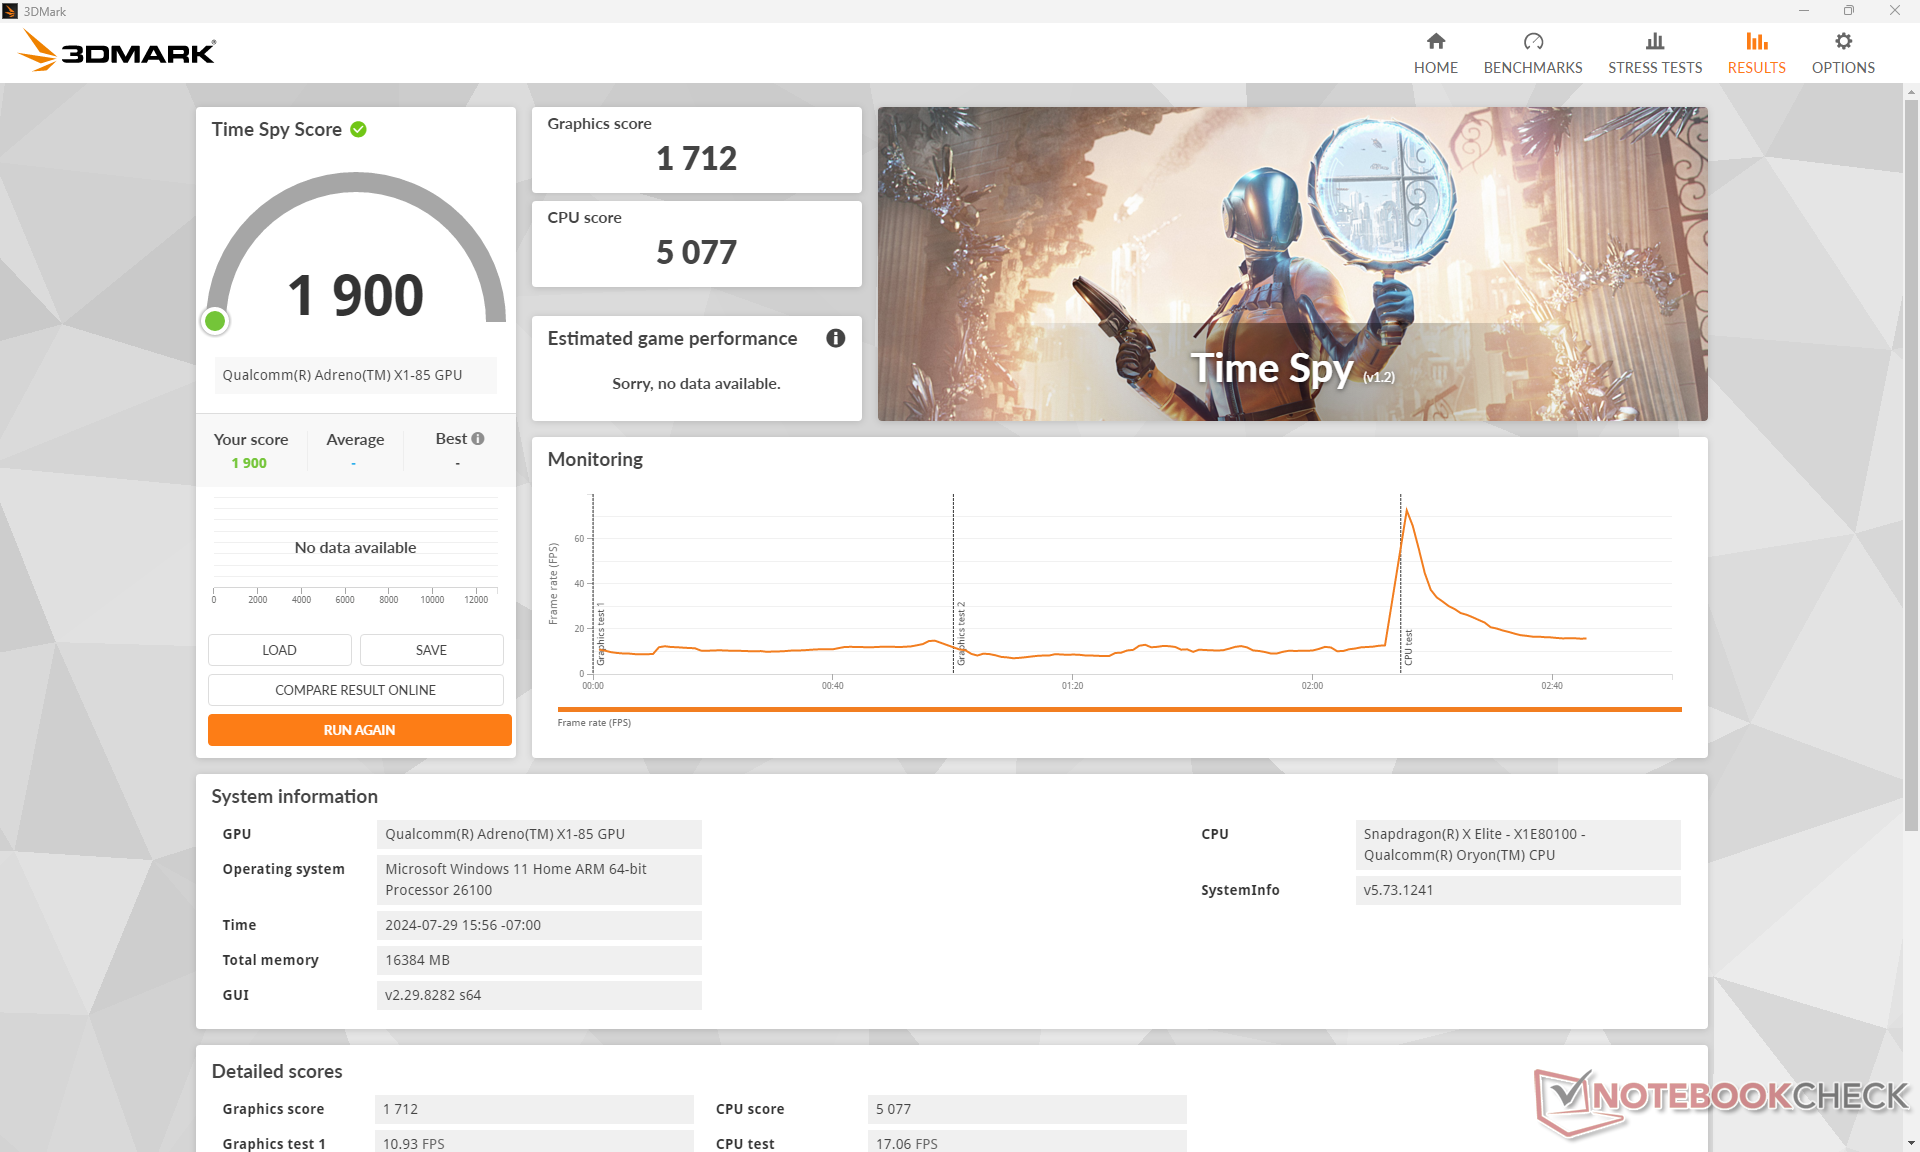
Emüle edilmiş 3DMark'a göre grafik performansı Iris Xe 96 EUs ama çok geride Ark 8 veya Radeon 680M/780M serisine göre yüzde 20 ila 40'a varan oranda daha iyi. Bununla birlikte, sonuçlar sürekli olarak HP EliteBook Ultra G1q 14 deltalar ortalama olarak küçük olsa bile.
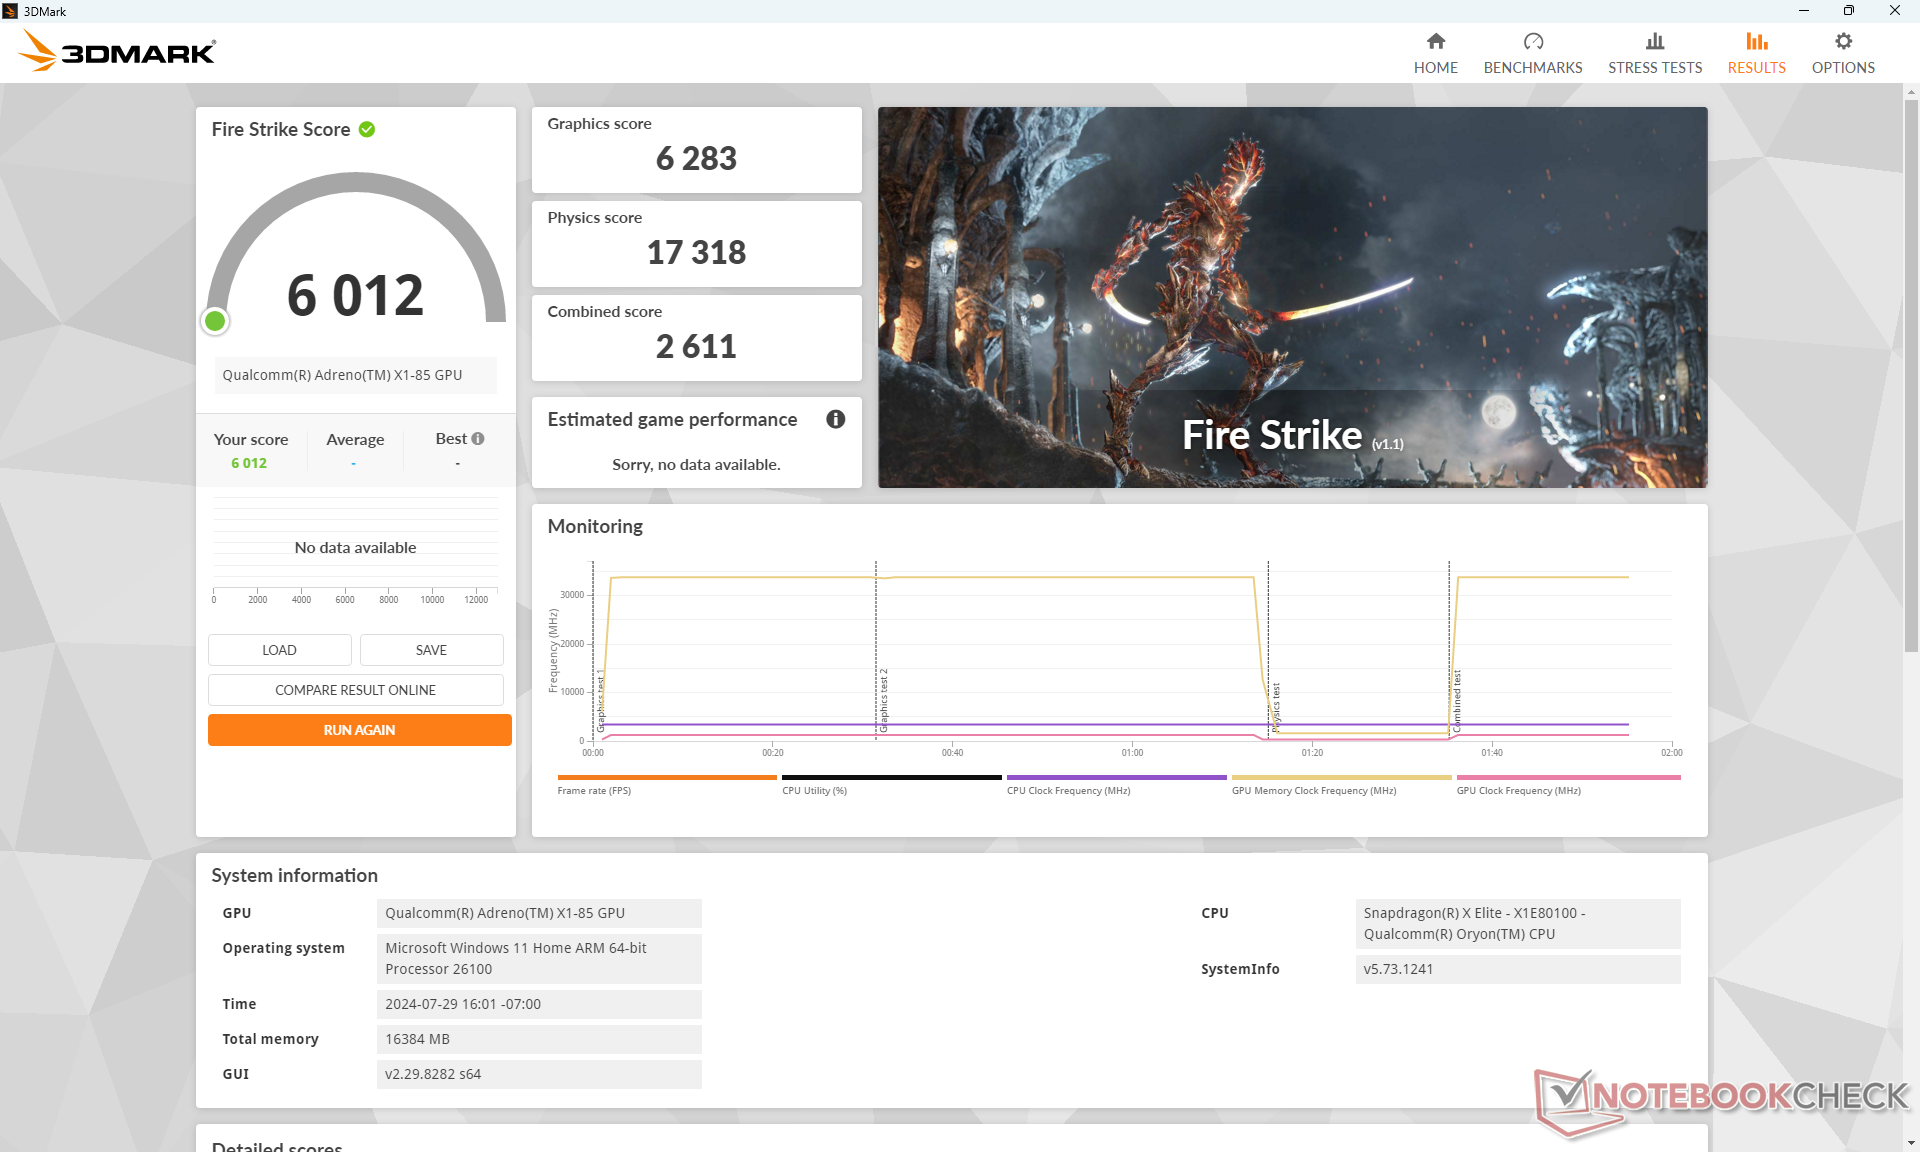
| Güç Profili | Grafik Puanı | Fizik Puanı | Birleşik Puan |
| Performans modu | 6283 | 17318 | 2611 |
| Dengeli mod | 6209 | 18348 | 2643 |
| Pil gücü | 6287 | 18156 | 2687 |
Yukarıdaki Fire Strike sonuç tablomuzda örneklendiği gibi Performans, Dengeli veya pil gücü modları arasında geçiş yapıldığında performansta önemli bir düşüş yaşanmıyor.
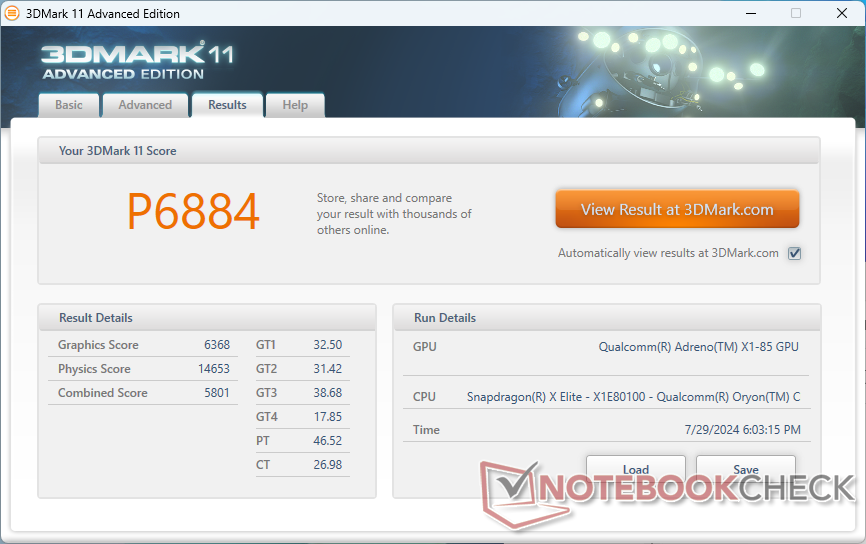
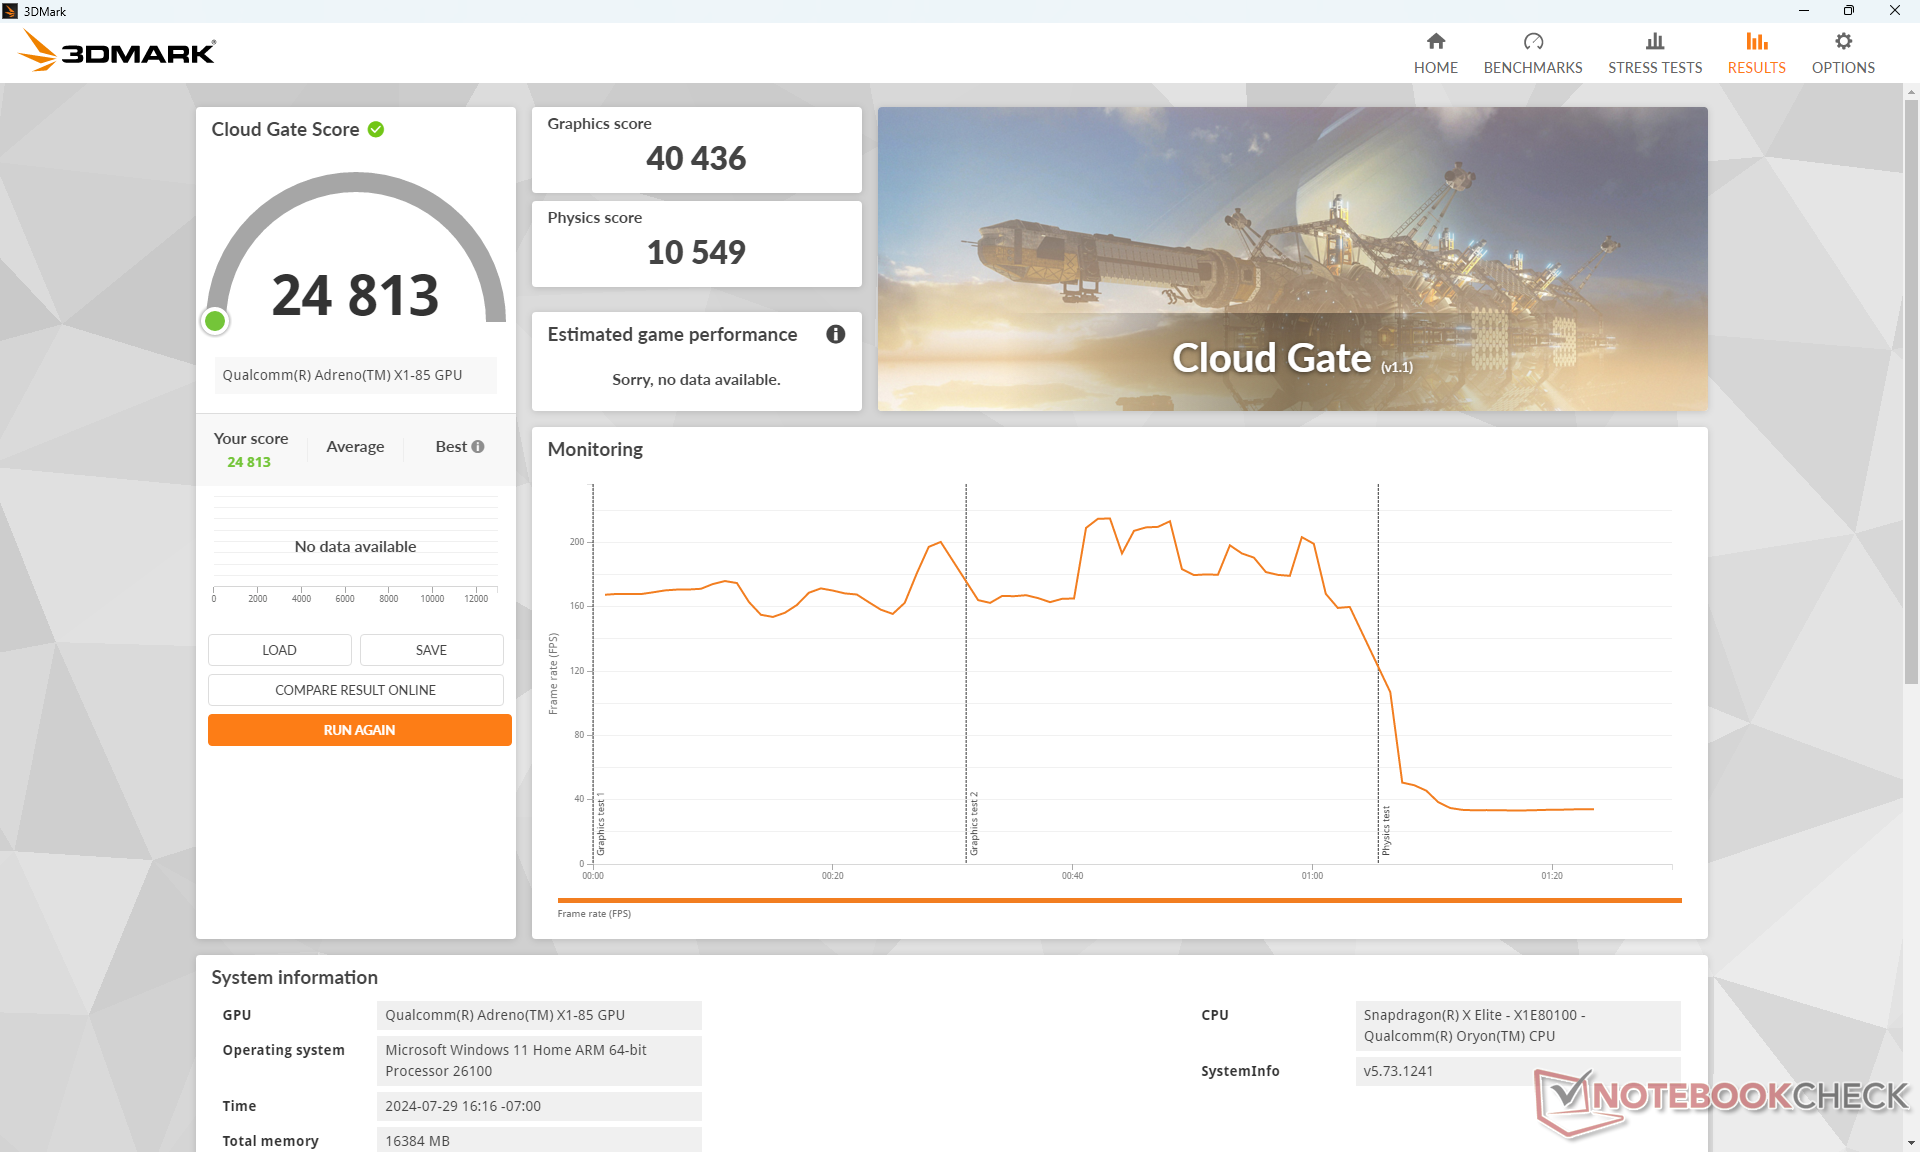
| 3DMark 11 Performance | 6884 puan | |
| 3DMark Cloud Gate Standard Score | 24813 puan | |
| 3DMark Fire Strike Score | 6012 puan | |
| 3DMark Time Spy Score | 1900 puan | |
Yardım | ||
* ... daha küçük daha iyidir
Oyun Performansı
EliteBook Ultra G1q 14'e göre biraz daha yüksek 3DMark sonuçlarımız, aşağıdaki test edilen oyunlarda biraz daha hızlı performans anlamına geliyor. İlginç bir şekilde, bazı oyunlar Dell ünitemizde çalışırken HP ünitemizde çalışmadı veya tam tersi oldu. Örneğin, Far Cry 5 Dell'de çalışırken HP'de çalışmadı ve Baldur's Gate 3 DirectX modu ne olursa olsun HP'de çalışırken Dell'de çalışmadı. Bu tutarsızlık iki model arasındaki sürücü farklılıklarından kaynaklanıyor olabilir, ancak bu aynı zamanda grafik sürücüsü ile ilgili daha fazla çalışma yapılması gerektiğini de göstermektedir.
| Performance Rating - Percent | |
| Lenovo ThinkBook 13x G4 21KR0008GE -2! | |
| Dell XPS 13 9340 Core Ultra 7 -2! | |
| Dell XPS 13 9345 | |
| Microsoft Surface Laptop 7 13.8 Copilot+ -2! | |
| HP EliteBook Ultra G1q 14 -1! | |
| Asus ZenBook S13 OLED UX5304 -1! | |
| The Witcher 3 - 1920x1080 Ultra Graphics & Postprocessing (HBAO+) | |
| Lenovo ThinkBook 13x G4 21KR0008GE | |
| Dell XPS 13 9340 Core Ultra 7 | |
| Dell XPS 13 9345 | |
| HP EliteBook Ultra G1q 14 | |
| Asus ZenBook S13 OLED UX5304 | |
| GTA V - 1920x1080 Highest Settings possible AA:4xMSAA + FX AF:16x | |
| Microsoft Surface Laptop 7 13.8 Copilot+ | |
| Dell XPS 13 9345 | |
| Lenovo ThinkBook 13x G4 21KR0008GE | |
| Dell XPS 13 9340 Core Ultra 7 | |
| Asus ZenBook S13 OLED UX5304 | |
| Final Fantasy XV Benchmark - 1920x1080 High Quality | |
| Dell XPS 13 9340 Core Ultra 7 | |
| Lenovo ThinkBook 13x G4 21KR0008GE | |
| Microsoft Surface Laptop 7 13.8 Copilot+ | |
| Dell XPS 13 9345 | |
| Asus ZenBook S13 OLED UX5304 | |
| HP EliteBook Ultra G1q 14 | |
| Strange Brigade - 1920x1080 ultra AA:ultra AF:16 | |
| Lenovo ThinkBook 13x G4 21KR0008GE | |
| Dell XPS 13 9340 Core Ultra 7 | |
| Microsoft Surface Laptop 7 13.8 Copilot+ | |
| Dell XPS 13 9345 | |
| HP EliteBook Ultra G1q 14 | |
| Asus ZenBook S13 OLED UX5304 | |
| Dota 2 Reborn - 1920x1080 ultra (3/3) best looking | |
| Dell XPS 13 9340 Core Ultra 7 | |
| Lenovo ThinkBook 13x G4 21KR0008GE | |
| Microsoft Surface Laptop 7 13.8 Copilot+ | |
| Asus ZenBook S13 OLED UX5304 | |
| Dell XPS 13 9345 | |
| HP EliteBook Ultra G1q 14 | |
| Tiny Tina's Wonderlands - 1920x1080 Badass Preset (DX12) | |
| Dell XPS 13 9345 | |
| HP EliteBook Ultra G1q 14 | |
| F1 22 - 1920x1080 High Preset AA:T AF:16x | |
| Dell XPS 13 9345 | |
| Microsoft Surface Laptop 7 13.8 Copilot+ | |
| HP EliteBook Ultra G1q 14 | |
| Asus ZenBook S13 OLED UX5304 | |
| Tiny Tina's Wonderlands | |
| 1280x720 Lowest Preset (DX12) | |
| Dell XPS 13 9345 | |
| Ortalama Qualcomm SD X Adreno X1-85 3.8 TFLOPS (67.6 - 73.9, n=3) | |
| HP EliteBook Ultra G1q 14 | |
| Dell XPS 13 Plus 9320 Core i7-1360P | |
| 1920x1080 Low Preset (DX12) | |
| Dell XPS 13 9345 | |
| Ortalama Qualcomm SD X Adreno X1-85 3.8 TFLOPS (41.5 - 44.7, n=3) | |
| HP EliteBook Ultra G1q 14 | |
| Dell XPS 13 Plus 9320 Core i7-1360P | |
| 1920x1080 Medium Preset (DX12) | |
| Dell XPS 13 9345 | |
| Ortalama Qualcomm SD X Adreno X1-85 3.8 TFLOPS (30.8 - 33.7, n=3) | |
| HP EliteBook Ultra G1q 14 | |
| Dell XPS 13 Plus 9320 Core i7-1360P | |
| 1920x1080 High Preset (DX12) | |
| Dell XPS 13 9345 | |
| Ortalama Qualcomm SD X Adreno X1-85 3.8 TFLOPS (20.6 - 22.4, n=3) | |
| HP EliteBook Ultra G1q 14 | |
| Dell XPS 13 Plus 9320 Core i7-1360P | |
| 1920x1080 Badass Preset (DX12) | |
| Dell XPS 13 9345 | |
| Ortalama Qualcomm SD X Adreno X1-85 3.8 TFLOPS (16.8 - 18, n=3) | |
| HP EliteBook Ultra G1q 14 | |
| Dell XPS 13 Plus 9320 Core i7-1360P | |
Cyberpunk 2077 ultra FPS Chart
| düşük | orta | yüksek | ultra | |
|---|---|---|---|---|
| GTA V (2015) | 96.3 | 94.2 | 49.5 | 21.2 |
| The Witcher 3 (2015) | 104 | 74.5 | 43.7 | 19.2 |
| Dota 2 Reborn (2015) | 80 | 60.7 | 57.4 | 50.7 |
| Final Fantasy XV Benchmark (2018) | 56.1 | 25 | 15.8 | |
| X-Plane 11.11 (2018) | 38 | |||
| Far Cry 5 (2018) | 42 | 33 | 31 | 28 |
| Strange Brigade (2018) | 123.9 | 50.8 | 41.8 | 33.9 |
| Tiny Tina's Wonderlands (2022) | 44.5 | 33.6 | 22.4 | 18 |
| F1 22 (2022) | 62.9 | 55.4 | 38.5 | |
| Cyberpunk 2077 2.2 Phantom Liberty (2023) | 24.1 | 19.5 | 16.9 | 14.7 |
Emisyonlar
Sistem Gürültüsü - Daha Rahat Fan Aktivitesi
Fan gürültüsü, fan gürültüsünden biraz daha sessizdir Intel Core Ultra 7 modeli artan yüklere yanıt olarak dahili fanların daha yavaş yükselmesi anlamında. Aksi takdirde, her iki modelin fanları da uzun süre boyunca zorlu yükleri çalıştırırken benzer maksimum RPM değerlerine ulaşır. Örneğin, 3DMark 06'daki ilk 90 saniyelik kıyaslama sahnesinin sonuna doğru fan gürültüsü 32,8 dB(A)'ya ulaşırken, benzer koşullar altında Intel modelinde bu değer 37,4 dB(A)'dır. Ancak Cyberpunk 2077 gibi oyunları çalıştırırken her iki model de düşük 40 dB(A) aralığına yerleşiyor. Qualcomm destekli sistem yüksek yüklerde çalışırken daha sessiz değildir, ancak web'de gezinirken veya video akışı yaparken herhangi bir fan etkinliğini fark etme olasılığınız da daha düşüktür.
Ses yüksekliği
| Boşta |
| 22.9 / 22.9 / 22.9 dB |
| Çalışırken |
| 32.8 / 40.6 dB |
 | ||
30 dB sessiz 40 dB(A) duyulabilirlik 50 dB(A) gürültülü |
||
min: | ||
| Dell XPS 13 9345 Adreno X1-85 3.8 TFLOPS, SD X Elite X1E-80-100 | Dell XPS 13 9340 Core Ultra 7 Arc 8-Core, Ultra 7 155H, Micron 2550 512GB | Microsoft Surface Laptop 7 13.8 Copilot+ Adreno X1-85 3.8 TFLOPS, SD X Elite X1E-80-100, Samsung MZ9L4512HBLU-00BMV | Lenovo ThinkBook 13x G4 21KR0008GE Arc 7-Core, Ultra 5 125H, Samsung PM9C1a MZAL8512HDLU | HP EliteBook Ultra G1q 14 Adreno X1-85 3.8 TFLOPS, SD X Elite X1E-78-100, SK hynix PC801 HFS512GEJ9X101N BF | Asus ZenBook S13 OLED UX5304 Iris Xe G7 96EUs, i7-1355U, Samsung PM9A1 MZVL21T0HCLR | |
|---|---|---|---|---|---|---|
| Noise | -10% | 4% | -7% | 4% | -4% | |
| kapalı / ortam * | 22.9 | 25.1 -10% | 23.8 -4% | 24.5 -7% | 23.4 -2% | 23.3 -2% |
| Idle Minimum * | 22.9 | 25.1 -10% | 23.8 -4% | 24.5 -7% | 23.4 -2% | 23.3 -2% |
| Idle Average * | 22.9 | 25.1 -10% | 23.8 -4% | 24.5 -7% | 23.4 -2% | 23.3 -2% |
| Idle Maximum * | 22.9 | 25.1 -10% | 23.8 -4% | 27.1 -18% | 24.3 -6% | 23.3 -2% |
| Load Average * | 32.8 | 37.4 -14% | 26 21% | 33.3 -2% | 25 24% | 37.7 -15% |
| Cyberpunk 2077 ultra * | 40.6 | 31.5 22% | ||||
| Load Maximum * | 40.6 | 42.5 -5% | 40.3 1% | 40.7 -0% | 34.8 14% | 40.1 1% |
| Witcher 3 ultra * | 42.5 | 36.8 | 30.6 | 40.1 |
* ... daha küçük daha iyidir
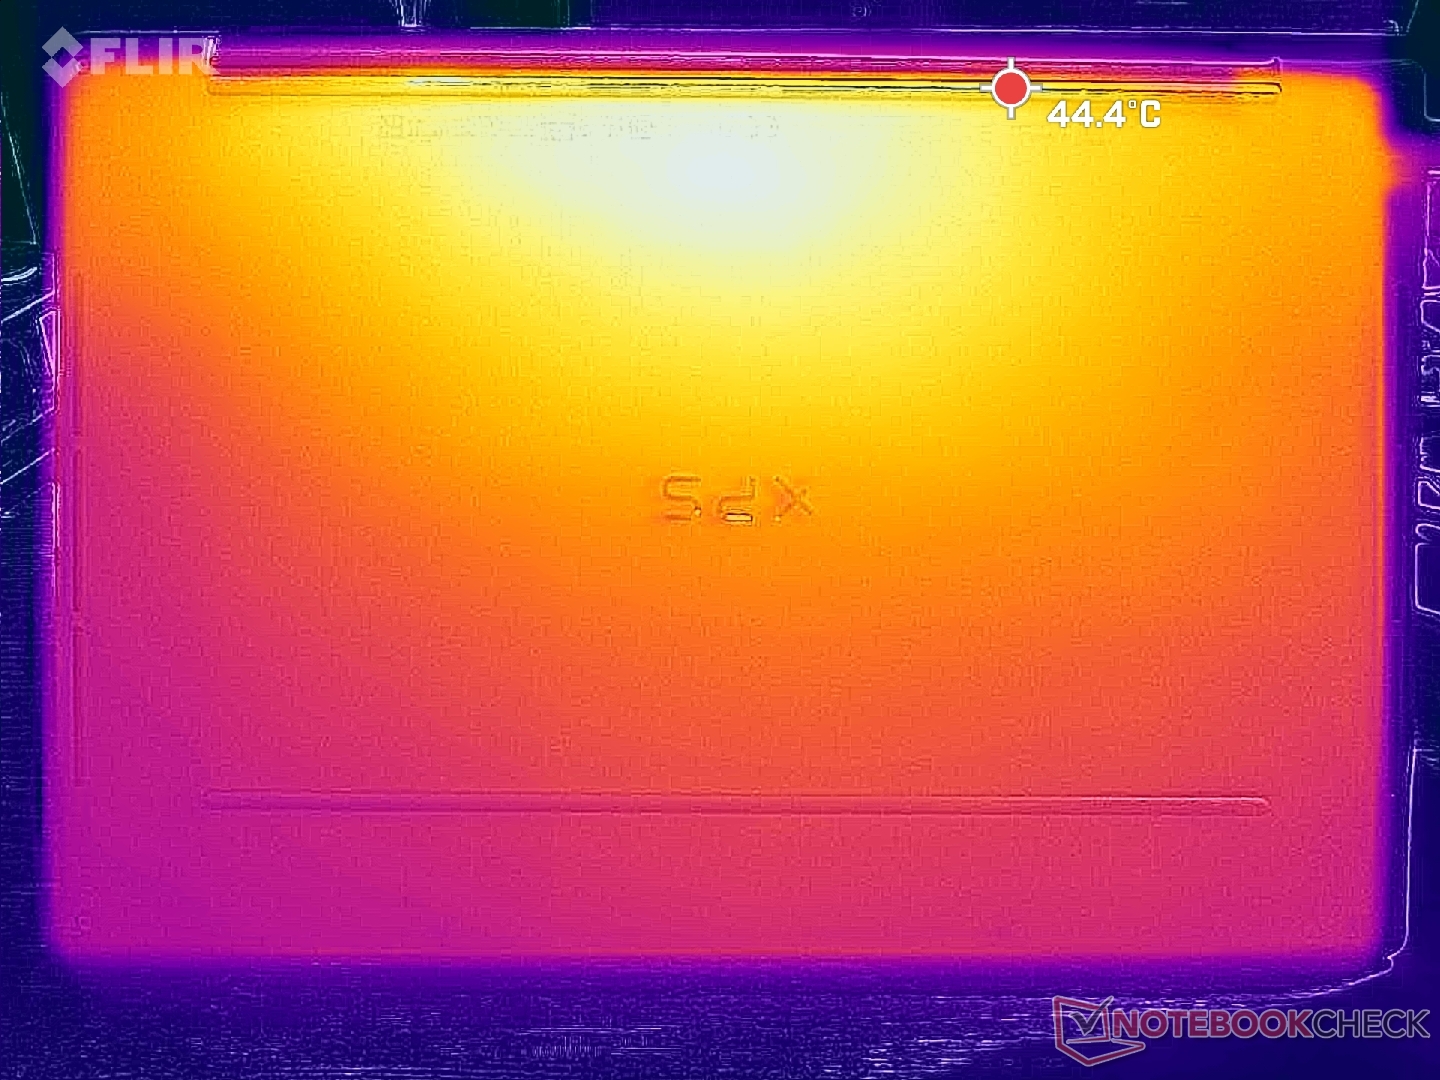
Sıcaklık
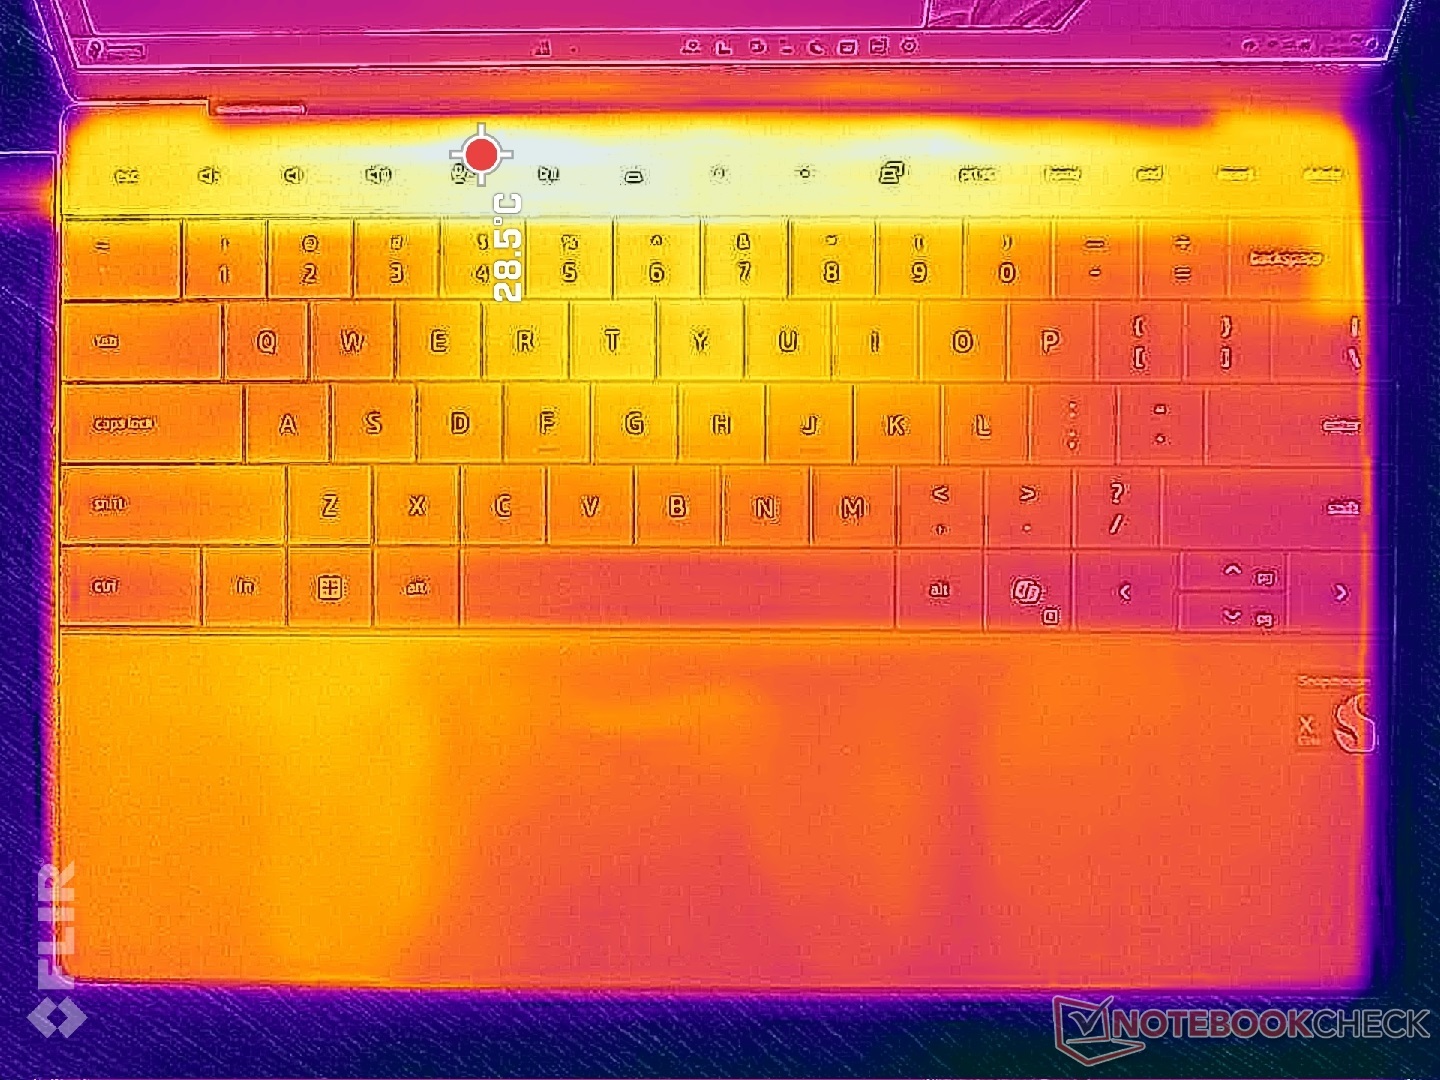
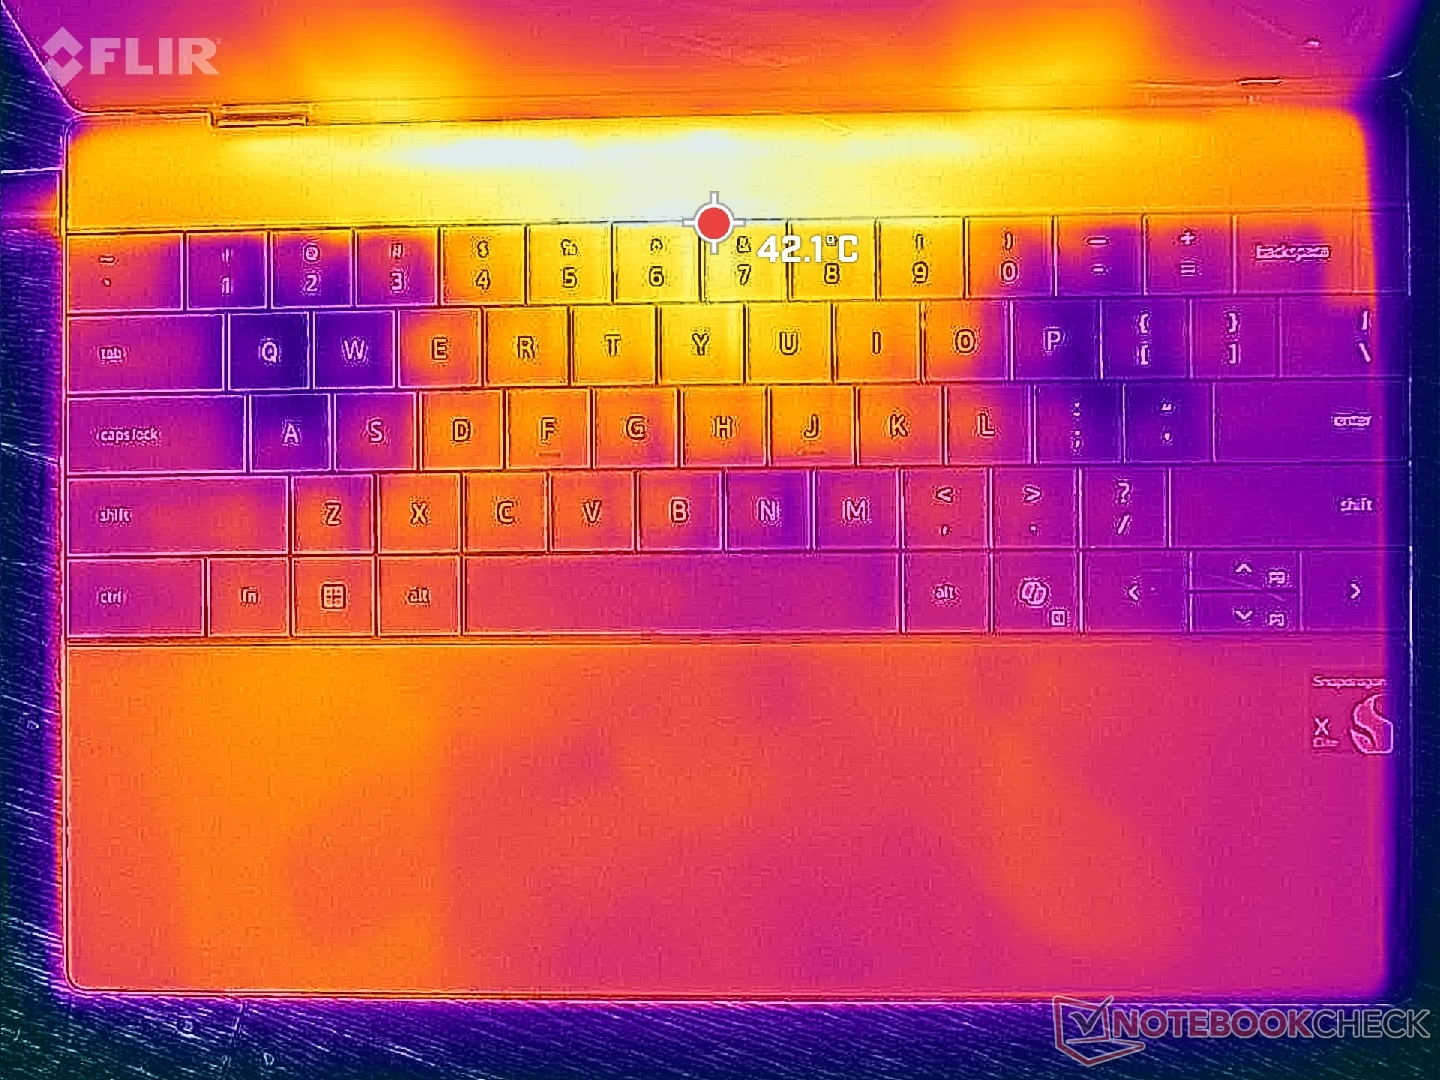
Yüzey sıcaklıkları Intel destekli XPS 13 9340'ta kaydettiklerimize çok yakın olup Qualcomm modelinin işlemci değişimine rağmen belirgin bir şekilde daha sıcak veya daha soğuk çalışmadığını göstermektedir. Sistemin merkezine doğru sıcak noktalar 45 C'ye kadar ulaşabilir ki bu da her ikisi de uzun süre boyunca zorlu yükleri çalıştırırken Intel modeline benzer. Ortalama sıcaklıklar, Intel modelinde kaydettiğimizden daha düşüktür Microsoft Surface Laptop 7 13.8 ama daha sıcak HP EliteBook Ultra G1q 14 her biri benzer Snapdragon Elite CPU'lara sahip.
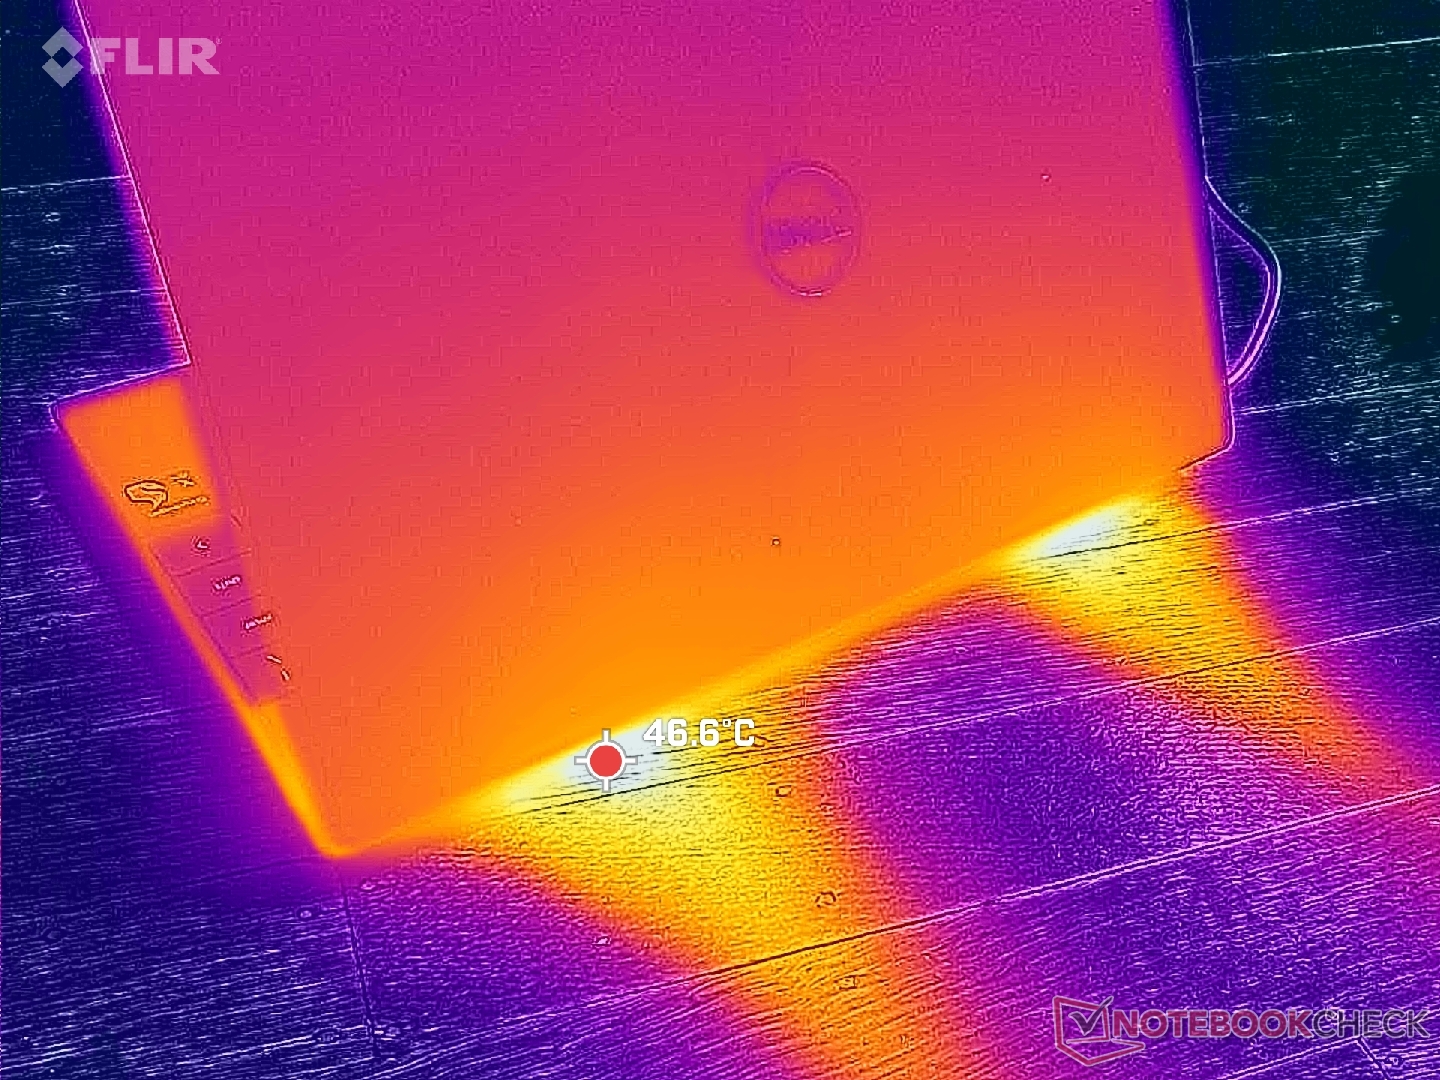
(-) Üst taraftaki maksimum sıcaklık, 35.9 °C / 97 F ortalamasına kıyasla 45.2 °C / 113 F'dir. , Subnotebook sınıfı için 21.4 ile 59 °C arasında değişir.
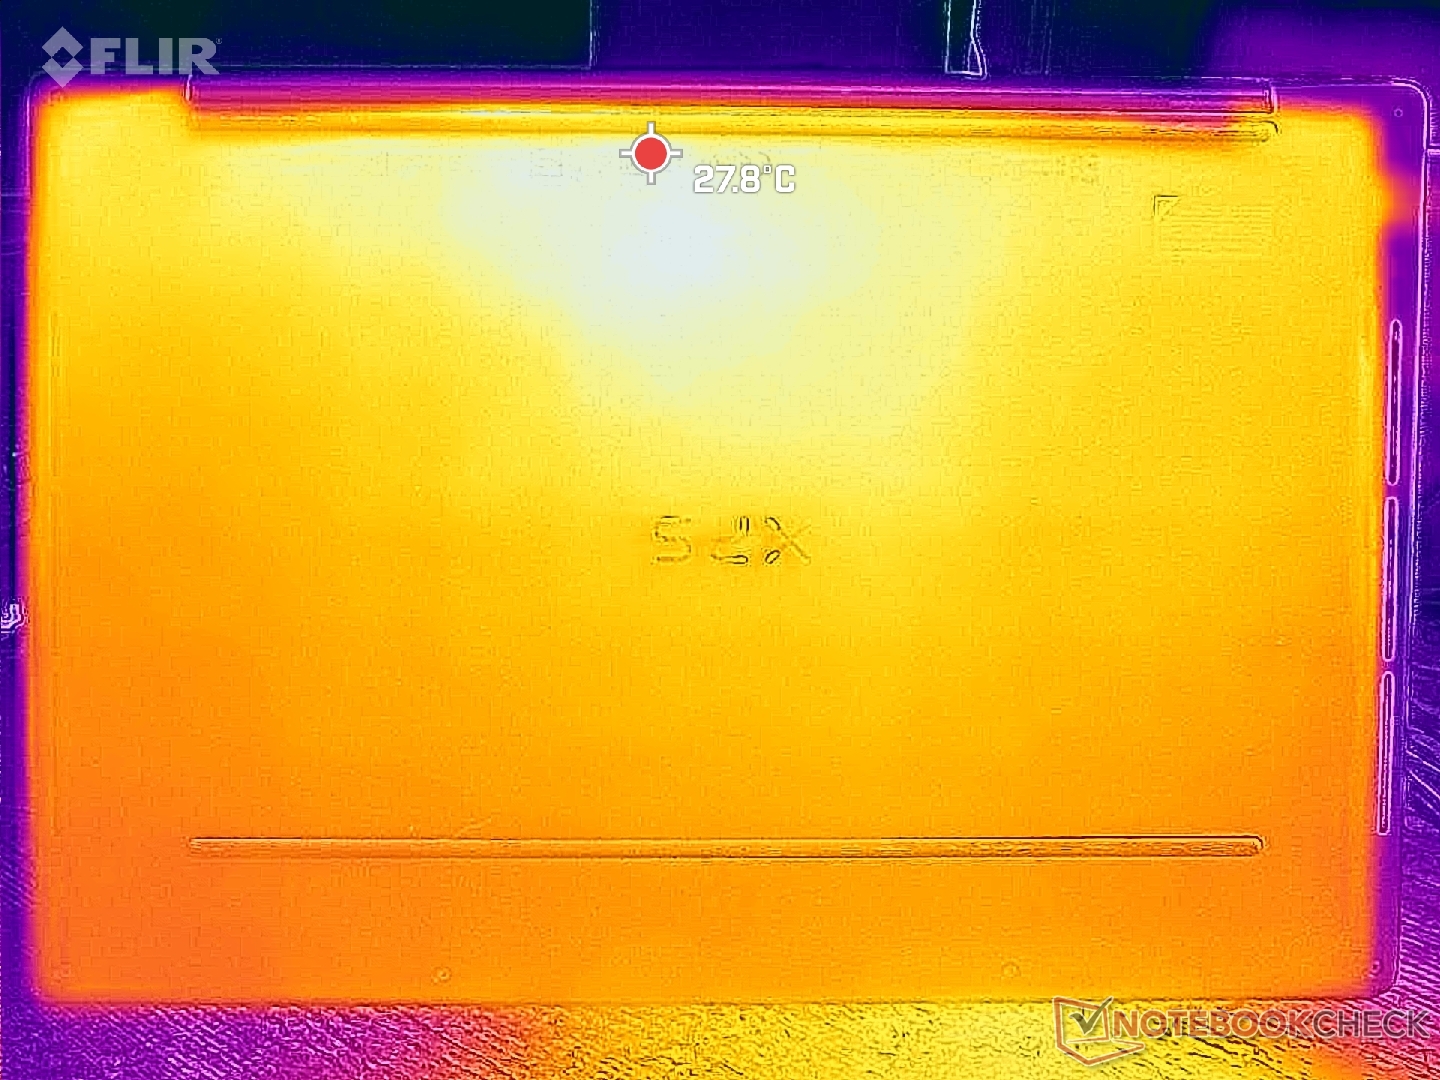
(±) Alt kısım, 39.3 °C / 103 F ortalamasına kıyasla maksimum 44.2 °C / 112 F'ye kadar ısınır
(+) Boşta kullanımda, üst tarafın ortalama sıcaklığı 29.1 °C / 84 F olup, cihazın 30.8 °C / 87 F.
(+) Avuç içi dayanakları ve dokunmatik yüzey maksimum (34.4 °C / 93.9 F) cilt sıcaklığına ulaşıyor ve bu nedenle sıcak değil.
(-) Benzer cihazların avuç içi dayanağı alanının ortalama sıcaklığı 28.2 °C / 82.8 F (-6.2 °C / -11.1 F) idi.
| Dell XPS 13 9345 Qualcomm Snapdragon X Elite X1E-80-100, Qualcomm SD X Adreno X1-85 3.8 TFLOPS | Dell XPS 13 9340 Core Ultra 7 Intel Core Ultra 7 155H, Intel Arc 8-Core iGPU | Microsoft Surface Laptop 7 13.8 Copilot+ Qualcomm Snapdragon X Elite X1E-80-100, Qualcomm SD X Adreno X1-85 3.8 TFLOPS | Lenovo ThinkBook 13x G4 21KR0008GE Intel Core Ultra 5 125H, Intel Arc 7-Core iGPU | HP EliteBook Ultra G1q 14 Qualcomm Snapdragon X Elite X1E-78-100, Qualcomm SD X Adreno X1-85 3.8 TFLOPS | Asus ZenBook S13 OLED UX5304 Intel Core i7-1355U, Intel Iris Xe Graphics G7 96EUs | |
|---|---|---|---|---|---|---|
| Heat | 12% | 9% | 9% | 4% | 6% | |
| Maximum Upper Side * | 45.2 | 41 9% | 47.1 -4% | 43.1 5% | 40.8 10% | 43.1 5% |
| Maximum Bottom * | 44.2 | 43.5 2% | 44.6 -1% | 39.2 11% | 40.4 9% | 45 -2% |
| Idle Upper Side * | 30.4 | 25.3 17% | 24.7 19% | 28.3 7% | 32.2 -6% | 27.3 10% |
| Idle Bottom * | 31.6 | 25.5 19% | 24.5 22% | 28 11% | 31.2 1% | 27.8 12% |
* ... daha küçük daha iyidir
Konuşmacılar
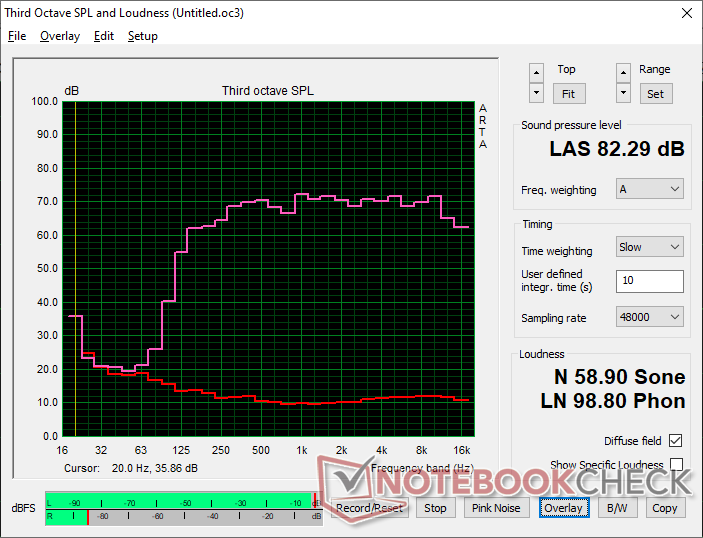
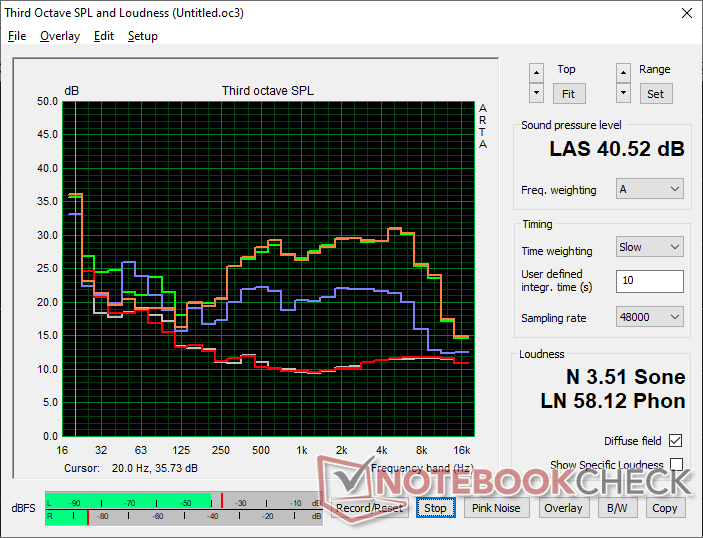
Dell XPS 13 9345 ses analizi
(+) | hoparlörler nispeten yüksek sesle çalabilir (82.3 dB)
Bas 100 - 315Hz
(±) | azaltılmış bas - ortalama olarak medyandan 9.9% daha düşük
(±) | Bas doğrusallığı ortalamadır (12.4% delta - önceki frekans)
Ortalar 400 - 2000 Hz
(+) | dengeli ortalar - medyandan yalnızca 1.9% uzakta
(+) | orta frekanslar doğrusaldır (3.2% deltadan önceki frekansa)
Yüksekler 2 - 16 kHz
(+) | dengeli yüksekler - medyandan yalnızca 1.5% uzakta
(+) | yüksekler doğrusaldır (3% deltadan önceki frekansa)
Toplam 100 - 16.000 Hz
(+) | genel ses doğrusaldır (8.2% ortancaya göre fark)
Aynı sınıfla karşılaştırıldığında
» Bu sınıftaki tüm test edilen cihazların %2%'si daha iyi, 1% benzer, 97% daha kötüydü
» En iyisinin deltası 5% idi, ortalama 19% idi, en kötüsü 53% idi
Test edilen tüm cihazlarla karşılaştırıldığında
» Test edilen tüm cihazların %1'si daha iyi, 1 benzer, % 98 daha kötüydü
» En iyisinin deltası 4% idi, ortalama 24% idi, en kötüsü 134% idi
Apple MacBook Pro 16 2021 M1 Pro ses analizi
(+) | hoparlörler nispeten yüksek sesle çalabilir (84.7 dB)
Bas 100 - 315Hz
(+) | iyi bas - medyandan yalnızca 3.8% uzakta
(+) | bas doğrusaldır (5.2% delta ile önceki frekans)
Ortalar 400 - 2000 Hz
(+) | dengeli ortalar - medyandan yalnızca 1.3% uzakta
(+) | orta frekanslar doğrusaldır (2.1% deltadan önceki frekansa)
Yüksekler 2 - 16 kHz
(+) | dengeli yüksekler - medyandan yalnızca 1.9% uzakta
(+) | yüksekler doğrusaldır (2.7% deltadan önceki frekansa)
Toplam 100 - 16.000 Hz
(+) | genel ses doğrusaldır (4.6% ortancaya göre fark)
Aynı sınıfla karşılaştırıldığında
» Bu sınıftaki tüm test edilen cihazların %0%'si daha iyi, 0% benzer, 100% daha kötüydü
» En iyisinin deltası 5% idi, ortalama 18% idi, en kötüsü 45% idi
Test edilen tüm cihazlarla karşılaştırıldığında
» Test edilen tüm cihazların %0'si daha iyi, 0 benzer, % 100 daha kötüydü
» En iyisinin deltası 4% idi, ortalama 24% idi, en kötüsü 134% idi
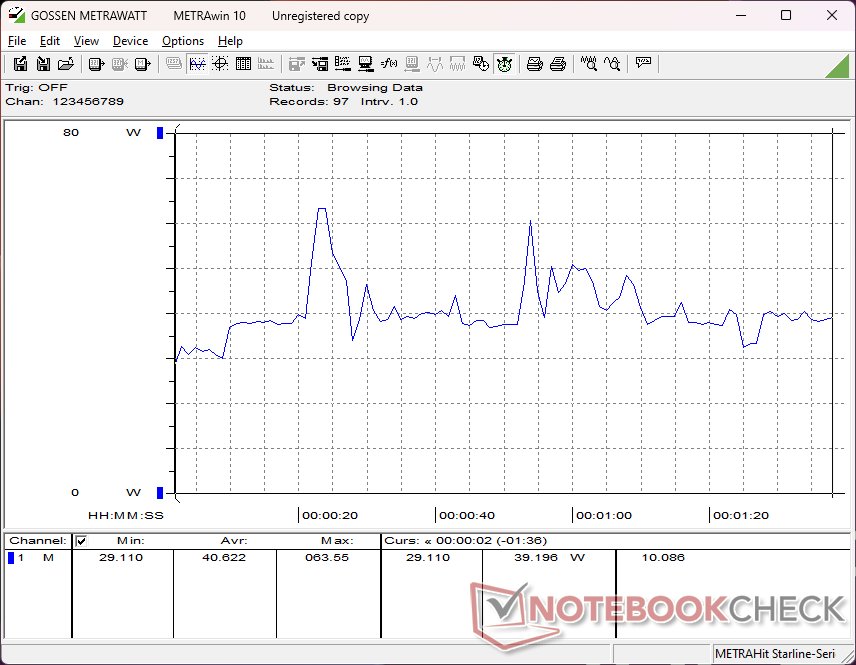
Enerji Yönetimi
Güç Tüketimi
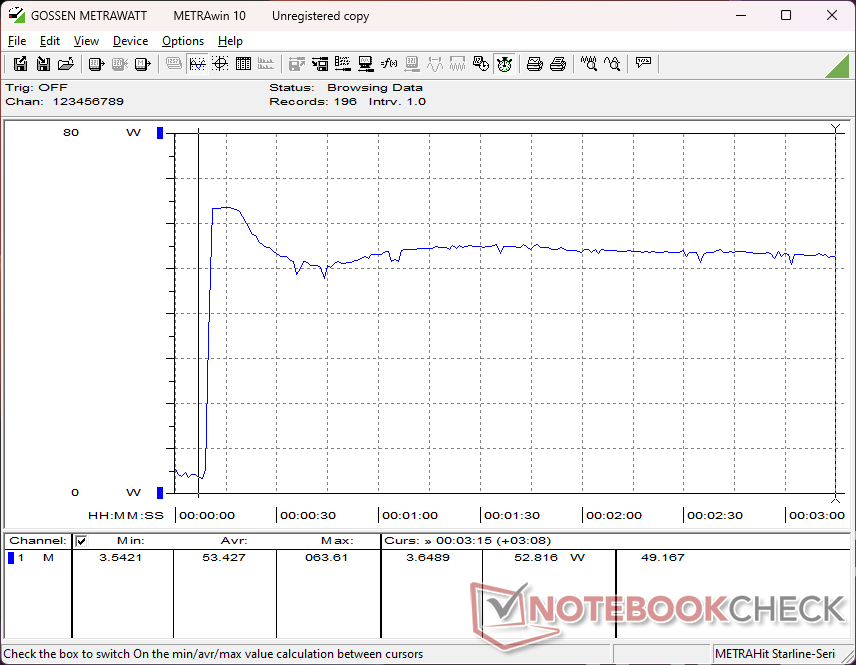
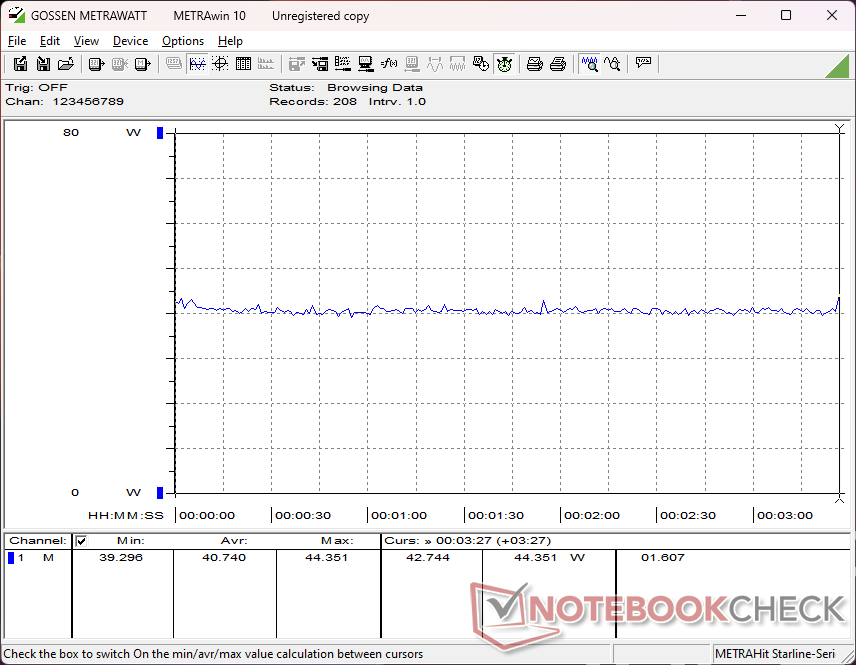
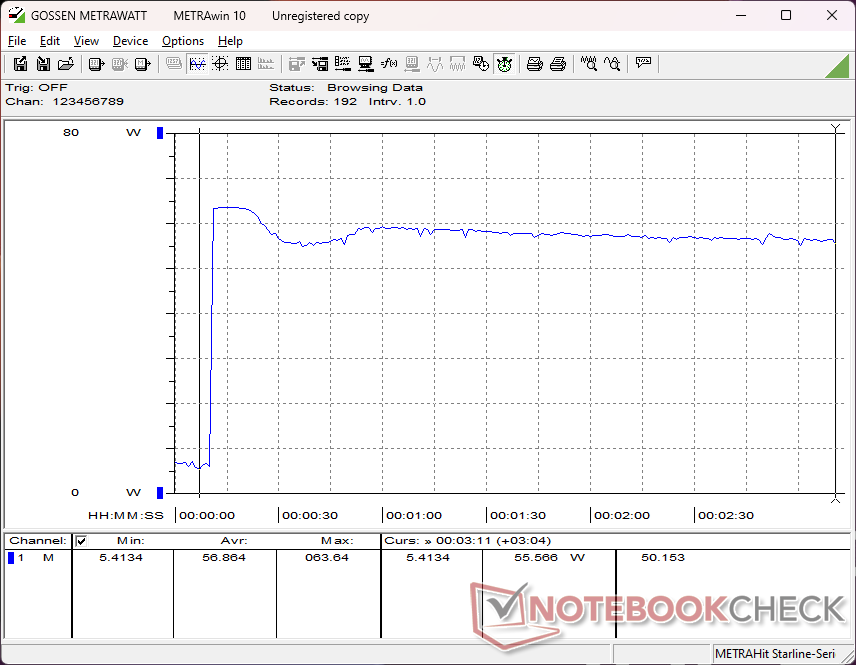
Güç tüketimi ölçümleri, aşağıdaki değerlerle karşılaştırıldığında bazı ilginç sonuçlar göstermektedir Core Ultra 7 XPS 13. Snapdragon XPS 13'ümüz orta veya daha düşük yükleri çalıştırırken, Intel versiyonundan sürekli olarak daha az güç talep eder ve bu da aşağıdaki bir sonraki bölümde örneklendiği gibi daha uzun pil ömrünün yolunu açar. Ancak oyunlar gibi daha zorlu yükleri çalıştırırken, Core Ultra 7 genellikle daha hızlı grafik performansı sunsa da ortalama tüketim her biri yaklaşık 40 W ile hemen hemen aynı olacaktır.
CPU'yu zorlamak için Prime95 çalıştırıldığında tüketim, Snapdragon modelinin Intel modelinden ortalama olarak daha fazla güç talep ettiğini göstermektedir, çünkü ikincisi zaman içinde daha dik bir şekilde kısılacaktır. Öte yandan, GPU'yu zorlamak için FurMark çalıştırıldığında tüketim, Intel modelindeki 34 W veya daha yüksek değere kıyasla ortalama sadece 18 W olacaktır. Bu da Qualcomm'un entegre GPU tasarımı için rakip Arc 8 serisine kıyasla daha az yüzey alanı ya da silikon bütçesi ayırdığını göstermektedir ki bu da ortalama olarak hem daha güçlü hem de daha zorludur.
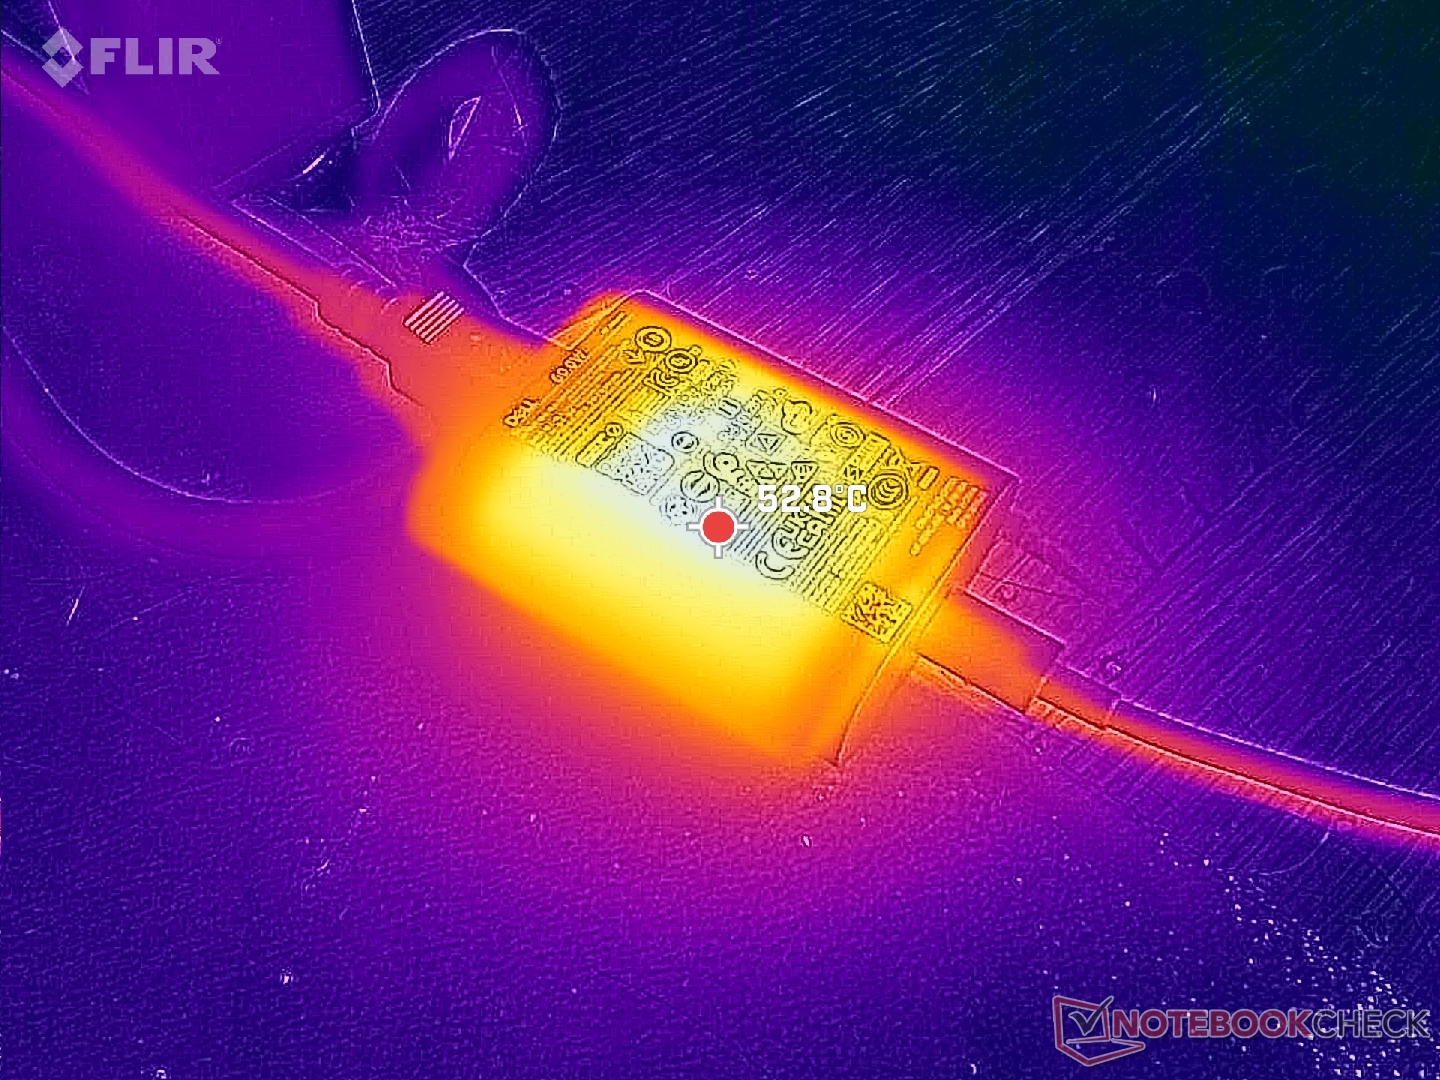
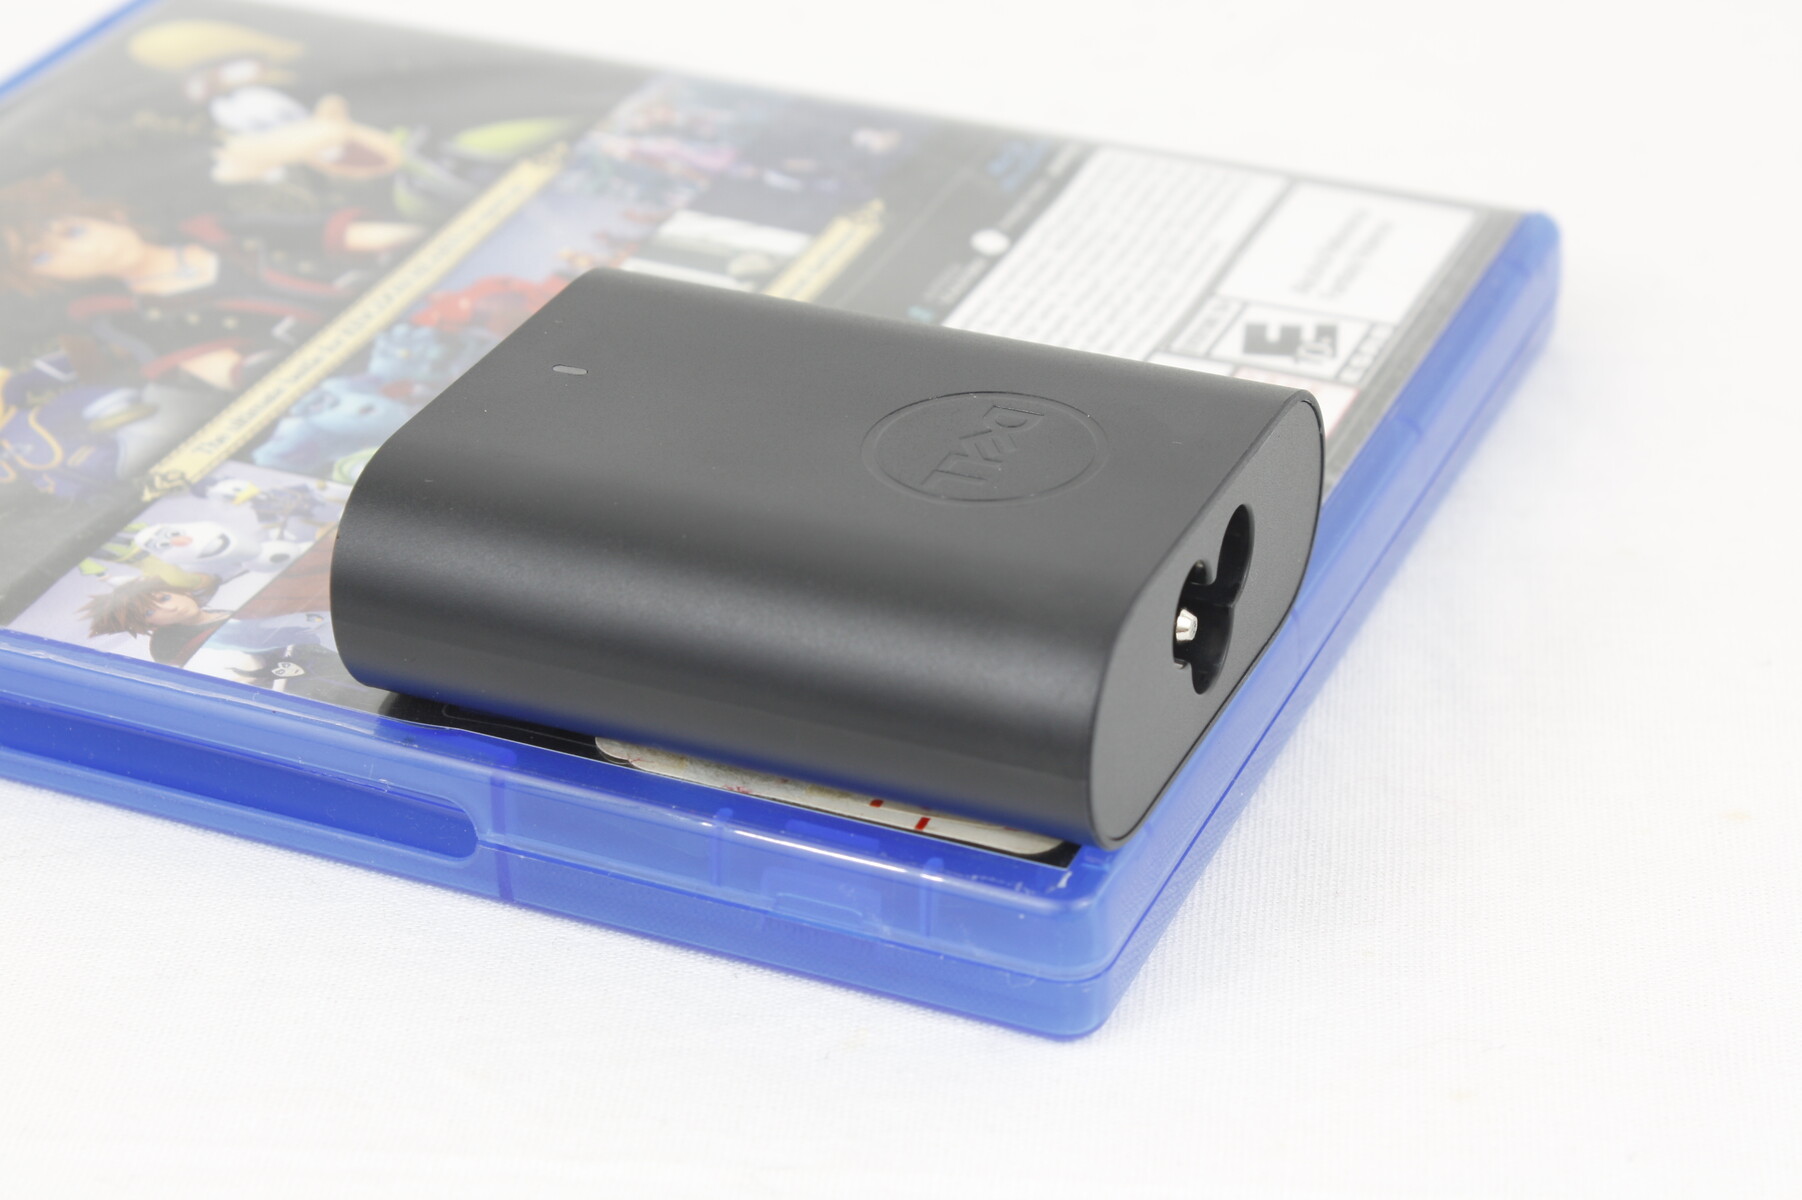
Maksimum tüketim, Intel modelinde olduğu gibi ekstra küçük (~6,5 x 5,5 x 2,3 cm) 65 W USB-C AC adaptöründen 64 W'a ulaşabilir.
| Kapalı / Bekleme modu | |
| Boşta | |
| Çalışırken |
|
Key:
min: | |
| Dell XPS 13 9345 SD X Elite X1E-80-100, Adreno X1-85 3.8 TFLOPS, , IPS, 1920x1200, 13.4" | Dell XPS 13 9340 Core Ultra 7 Ultra 7 155H, Arc 8-Core, Micron 2550 512GB, IPS, 1920x1200, 13.4" | Microsoft Surface Laptop 7 13.8 Copilot+ SD X Elite X1E-80-100, Adreno X1-85 3.8 TFLOPS, Samsung MZ9L4512HBLU-00BMV, IPS, 2304x1536, 13.8" | Lenovo ThinkBook 13x G4 21KR0008GE Ultra 5 125H, Arc 7-Core, Samsung PM9C1a MZAL8512HDLU, IPS, 2880x1920, 13.5" | HP EliteBook Ultra G1q 14 SD X Elite X1E-78-100, Adreno X1-85 3.8 TFLOPS, SK hynix PC801 HFS512GEJ9X101N BF, IPS, 2240x1400, 14" | Asus ZenBook S13 OLED UX5304 i7-1355U, Iris Xe G7 96EUs, Samsung PM9A1 MZVL21T0HCLR, OLED, 2880x1800, 13.3" | |
|---|---|---|---|---|---|---|
| Power Consumption | -27% | 11% | -48% | 11% | -43% | |
| Idle Minimum * | 2.8 | 3.8 -36% | 1.4 50% | 5.4 -93% | 2.5 11% | 5.8 -107% |
| Idle Average * | 4.9 | 7 -43% | 6.3 -29% | 7.8 -59% | 5.7 -16% | 8.5 -73% |
| Idle Maximum * | 5.7 | 7.3 -28% | 7.6 -33% | 8.9 -56% | 5.8 -2% | 8.8 -54% |
| Load Average * | 40.6 | 52.6 -30% | 26.9 34% | 49.4 -22% | 24.2 40% | 35.1 14% |
| Cyberpunk 2077 ultra external monitor * | 39.4 | 26.8 32% | ||||
| Cyberpunk 2077 ultra * | 40.7 | 38.5 5% | 33.5 18% | |||
| Load Maximum * | 64 | 62.7 2% | 40.7 36% | 68.8 -8% | 66.4 -4% | 59.5 7% |
| Witcher 3 ultra * | 38.3 | 44.4 | 23.1 | 27.6 |
* ... daha küçük daha iyidir
Power Consumption Cyberpunk / Stress Test
Power Consumption external Monitor
Pil Ömrü
Sistemin tartışmasız üstün olduğu bir şey varsa o da pil ömrüdür. Core Ultra 7 155H ve aynı 1200p IPS ekranla donatılmış XPS 13 9340'tan neredeyse 26,5 saat veya 2 kat daha uzun bir gerçek dünya WLAN tarama çalışma süresi kaydedebildik. Bunun yerine OLED panel ile yapılandırılırsa çalışma sürelerinin daha kısa olacağı garanti edilir, ancak yine de inanılmaz derecede uzun olacak ve 13 inçlik herhangi bir alt dizüstü bilgisayarın en uzunlarından biri olacaktır MacBook Air serisi.
Testimiz, Dell'in Snapdragon modelinde pil ömrünü iyileştirmek için özel olarak tasarlanmış en son BIOS güncellemesini uyguladıktan sonra gerçekleştirildi. Güncellemeyi buradan yüklemenizi öneririz.
Boş kapasiteden tam kapasiteye şarj etmek, çoğu dizüstü bilgisayarda yaygın olan 90 dakikadan biraz fazla sürüyor.
| Dell XPS 13 9345 SD X Elite X1E-80-100, Adreno X1-85 3.8 TFLOPS, 55 Wh | Dell XPS 13 9340 Core Ultra 7 Ultra 7 155H, Arc 8-Core, 55 Wh | Microsoft Surface Laptop 7 13.8 Copilot+ SD X Elite X1E-80-100, Adreno X1-85 3.8 TFLOPS, 54 Wh | Lenovo ThinkBook 13x G4 21KR0008GE Ultra 5 125H, Arc 7-Core, 74 Wh | HP EliteBook Ultra G1q 14 SD X Elite X1E-78-100, Adreno X1-85 3.8 TFLOPS, 59 Wh | Asus ZenBook S13 OLED UX5304 i7-1355U, Iris Xe G7 96EUs, 63 Wh | |
|---|---|---|---|---|---|---|
| Pil Çalışma Süresi | 40% | -3% | 24% | 4% | 50% | |
| Reader / Idle | 2785 | 1222 -56% | ||||
| WiFi v1.3 | 1585 | 769 -51% | 852 -46% | 684 -57% | 792 -50% | 678 -57% |
| Load | 57 | 131 130% | 80 40% | 116 104% | 124 118% | 146 156% |
| H.264 | 1053 | 1181 | 1229 | 829 |
Artılar
Eksiler
Karar - Intel XPS 13'e Saygın Bir Alternatif
1300 dolarlık Snapdragon XPS 13, 1400 dolarlık modelden biraz daha ucuza geliyor Core Ultra 7 XPS 13 önemli ölçüde daha uzun pil ömrü, Co-Pilot+ entegrasyonu ve aynı donanım özelliklerini sunarken. Bununla birlikte, gerçek kullanıcı deneyimi büyük ölçüde iş yüküne ve uygulamaya bağlı olacaktır. Çoğunlukla tarama, kelime işlem, video ve akış için kullanılıyorsa, Snapdragon XPS 13, özellikle programlar ARM üzerinde yerel olarak çalışabildiğinde daha verimli olma eğilimindedir. Öte yandan, grafik düzenleme, video kodlama, Thunderbolt yerleştirme veya ARM üzerinde taklit edilmesi gereken belirli uygulamalar gibi daha zorlu görevler, geleneksel Intel XPS 13 için en uygun olanıdır. Bu açıdan Intel modeli, tüm kullanım senaryolarında daha öngörülebilir bir performans seviyesi sunarak Snapdragon modelinin öne çıkabileceği birkaç uç durumdan daha ağır basıyor.
Snapdragon XPS 13, Intel XPS 13'e dolar bazında harika bir alternatiftir. Bununla birlikte, kullanıcı deneyimi, sistemi kullanmayı düşündüğünüz uygulama ve görev türlerine bağlı olarak büyük ölçüde değişecektir.
Intel XPS 13'ün pil ömrü zaten oldukça iyiyken ve Co-Pilot+'ın gelecekteki Intel ve AMD CPU'lara gelmesi beklenirken, pil ömrü ve Co-Pilot+ uyumluluğundaki avantajlar alıcıları ikna etmek için yeterli olmayabilir. Bununla birlikte, çalışma sürelerini en üst düzeye çıkarmak ve en son Microsoft AI özelliklerini bugün deneyimlemek isteyen kullanıcılar Snapdragon XPS 13'ü daha üretken bir seçenek olarak bulabilirler.
Fiyat ve Bulunabilirlik
Dell şu anda XPS 13 9345'i OLED panel ile yapılandırıldığında 1300$'dan 1800$+'a kadar yapılandırılmış olarak gönderiyor.
İpucu: Derecelendirme Sistemimizi kısa bir süre önce güncelledik ve Sürüm 8'in sonuçları Sürüm 7'nin sonuçlarıyla karşılaştırılamaz. Daha fazla bilgi için hier verfügbar.
Not: Derecelendirme sistemimizi yakın zamanda güncelledik ve 8. sürümün sonuçları 7. sürümün sonuçları ile karşılaştırılamaz. Daha fazla bilgi için burada .
Dell XPS 13 9345
- 08/04/2024 v8
Allen Ngo
 Total Sustainability Score:
 Şeffaflık
İncelenecek cihazların seçimi editör ekibimiz tarafından yapılır. Test örneği, bu incelemenin amacı doğrultusunda üretici veya perakendeci tarafından yazara ödünç olarak sağlanmıştır. Borç verenin bu inceleme üzerinde herhangi bir etkisi olmadığı gibi, üretici de yayınlanmadan önce bu incelemenin bir kopyasını almamıştır. Bu incelemeyi yayınlama zorunluluğu yoktu. İncelemelerimiz karşılığında asla tazminat veya ödeme kabul etmiyoruz. Bağımsız bir medya şirketi olarak Notebookcheck, üreticilerin, perakendecilerin veya yayıncıların otoritesine tabi değildir.
Notebookcheck bu şekilde test yapıyor
Notebookcheck, tüm sonuçların karşılaştırılabilir olmasını sağlamak için her yıl yüzlerce dizüstü bilgisayarı ve akıllı telefonu standart prosedürler kullanarak bağımsız olarak inceliyor. Yaklaşık 20 yıldır test yöntemlerimizi sürekli olarak geliştirdik ve bu süreçte endüstri standartlarını belirledik. Test laboratuvarlarımızda deneyimli teknisyenler ve editörler tarafından yüksek kaliteli ölçüm ekipmanları kullanılmaktadır. Bu testler çok aşamalı bir doğrulama sürecini içerir. Karmaşık derecelendirme sistemimiz, nesnelliği koruyan yüzlerce sağlam temellere dayanan ölçüm ve kıyaslamaya dayanmaktadır.Price comparison

