

MSI Raider 18 HX A14V incelemesi: Titan fiyatı olmadan Titan performansı
")
18 inçlik daha büyük oyun dizüstü bilgisayarları, serinin istikrarlı bir şekilde genişlemeye devam etmesiyle bir tür geri dönüş yapıyor. MSI halihazırda 18 inçlik "en üst düzey" oyun deneyimini Titan 18 HXancak bu son Raider 18 HX modeli, giriş bariyerini düşürmek için özellikler açısından bir kademe aşağıdadır.
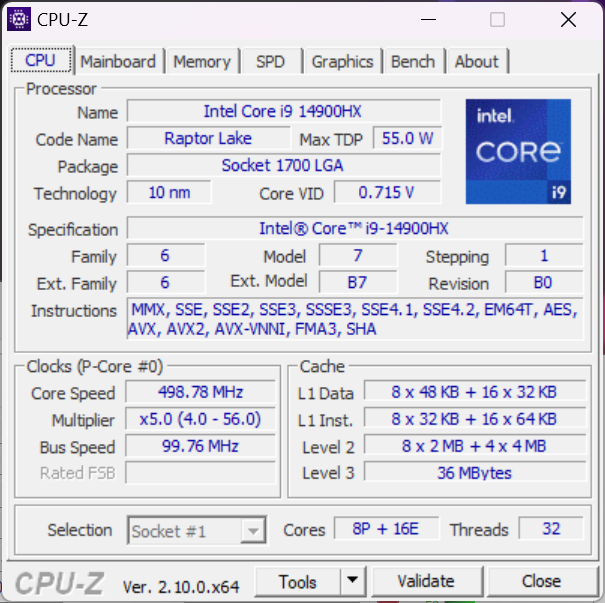
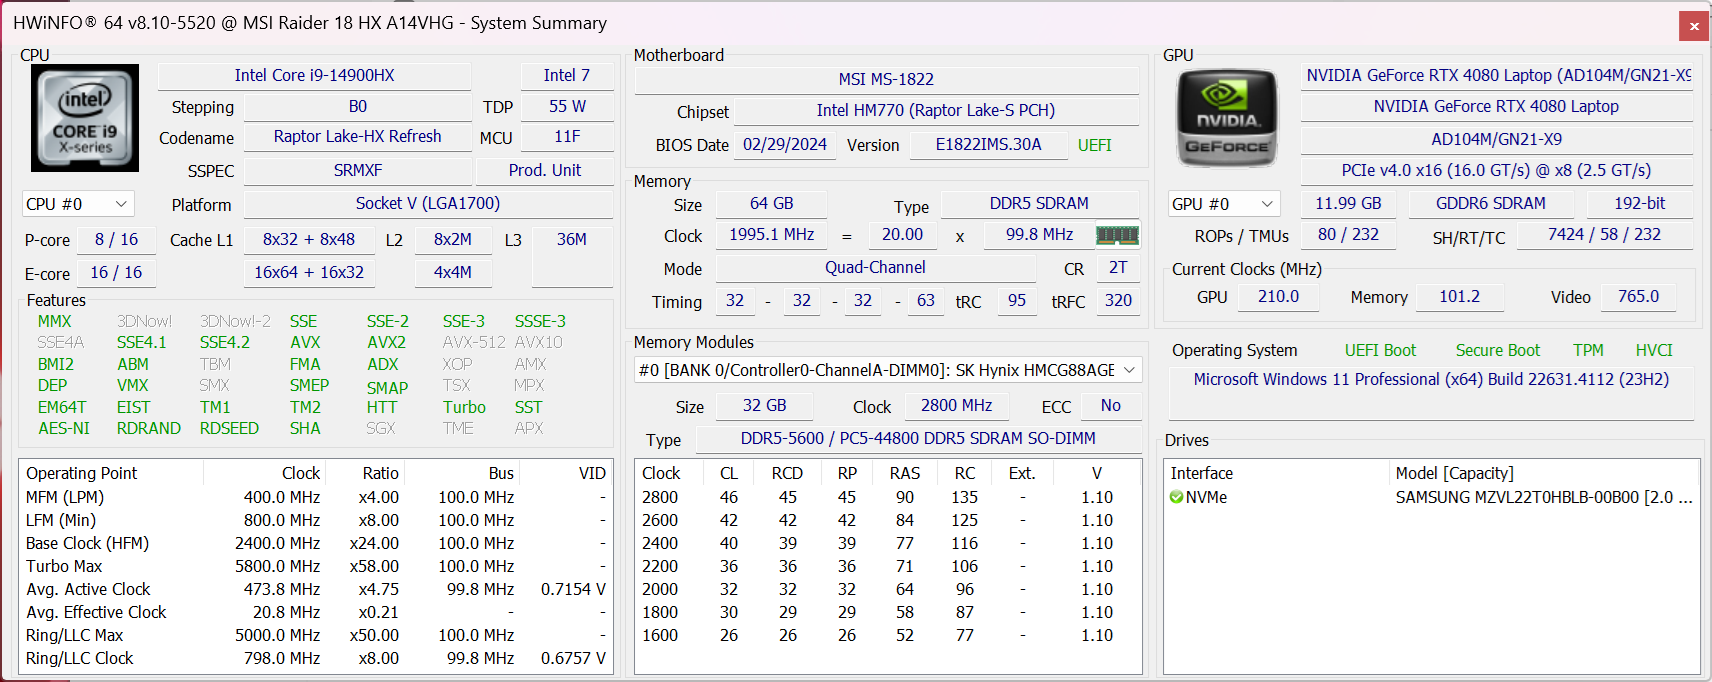
Test ünitemiz, Raptor Lake-R Core i9-14900HX CPU, 175 W GeForce RTX 4080 GPU ve 3840 x 2400 120 Hz Mini-LED ekran ile yaklaşık 3200 $ perakende satış fiyatına sahip bir orta konfigürasyondur. Diğer SKU'lar bunun yerine Zen 4 Ryzen 9 7945HX, RTX 4070, RTX 4090 veya QHD+ 2560 x 1600 240 Hz IPS ekranı içerir.
Raider 18 HX'in rakipleri arasında aşağıdaki gibi diğer 18 inç oyun dizüstü bilgisayarları yer alıyor Razer Blade 18, Alienware m18 R2veya Asus ROG Strix G18.
Daha fazla MSI incelemesi:
Karşılaştırmalı olarak olası rakipler
Derecelendirme | Sürüm | Tarih | Modeli | Ağırlık | Yükseklik | Boyut | Çözünürlük | Fiyat |
|---|---|---|---|---|---|---|---|---|
| 84.7 % | v8 | 09/2024 | MSI Raider 18 HX A14V i9-14900HX, NVIDIA GeForce RTX 4080 Laptop GPU | 3.6 kg | 32 mm | 18.00" | 3840x2400 | |
| 90.5 % v7 (old) | v7 (old) | 05/2024 | Razer Blade 18 2024 RZ09-0509 i9-14900HX, NVIDIA GeForce RTX 4090 Laptop GPU | 3.1 kg | 21.9 mm | 18.00" | 2560x1600 | |
| 89.5 % v7 (old) | v7 (old) | 03/2024 | Alienware m18 R2 i9-14900HX, NVIDIA GeForce RTX 4090 Laptop GPU | 4 kg | 26.7 mm | 18.00" | 2560x1600 | |
| 88.8 % v7 (old) | v7 (old) | 01/2024 | MSI Titan 18 HX A14VIG i9-14900HX, NVIDIA GeForce RTX 4090 Laptop GPU | 3.6 kg | 32.1 mm | 18.00" | 3840x2400 | |
| 87.4 % v7 (old) | v7 (old) | 04/2023 | Asus ROG Strix G18 G814JI i7-13650HX, NVIDIA GeForce RTX 4070 Laptop GPU | 3 kg | 31 mm | 18.00" | 2560x1600 | |
| 87.1 % v7 (old) | v7 (old) | 03/2024 | Acer Predator Helios 18 PH18-72-98MW i9-14900HX, NVIDIA GeForce RTX 4090 Laptop GPU | 3.3 kg | 29.5 mm | 18.00" | 2560x1600 |
Not: Derecelendirme sistemimizi yakın zamanda güncelledik ve 8. sürümün sonuçları 7. sürümün sonuçları ile karşılaştırılamaz. Daha fazla bilgi için burada .
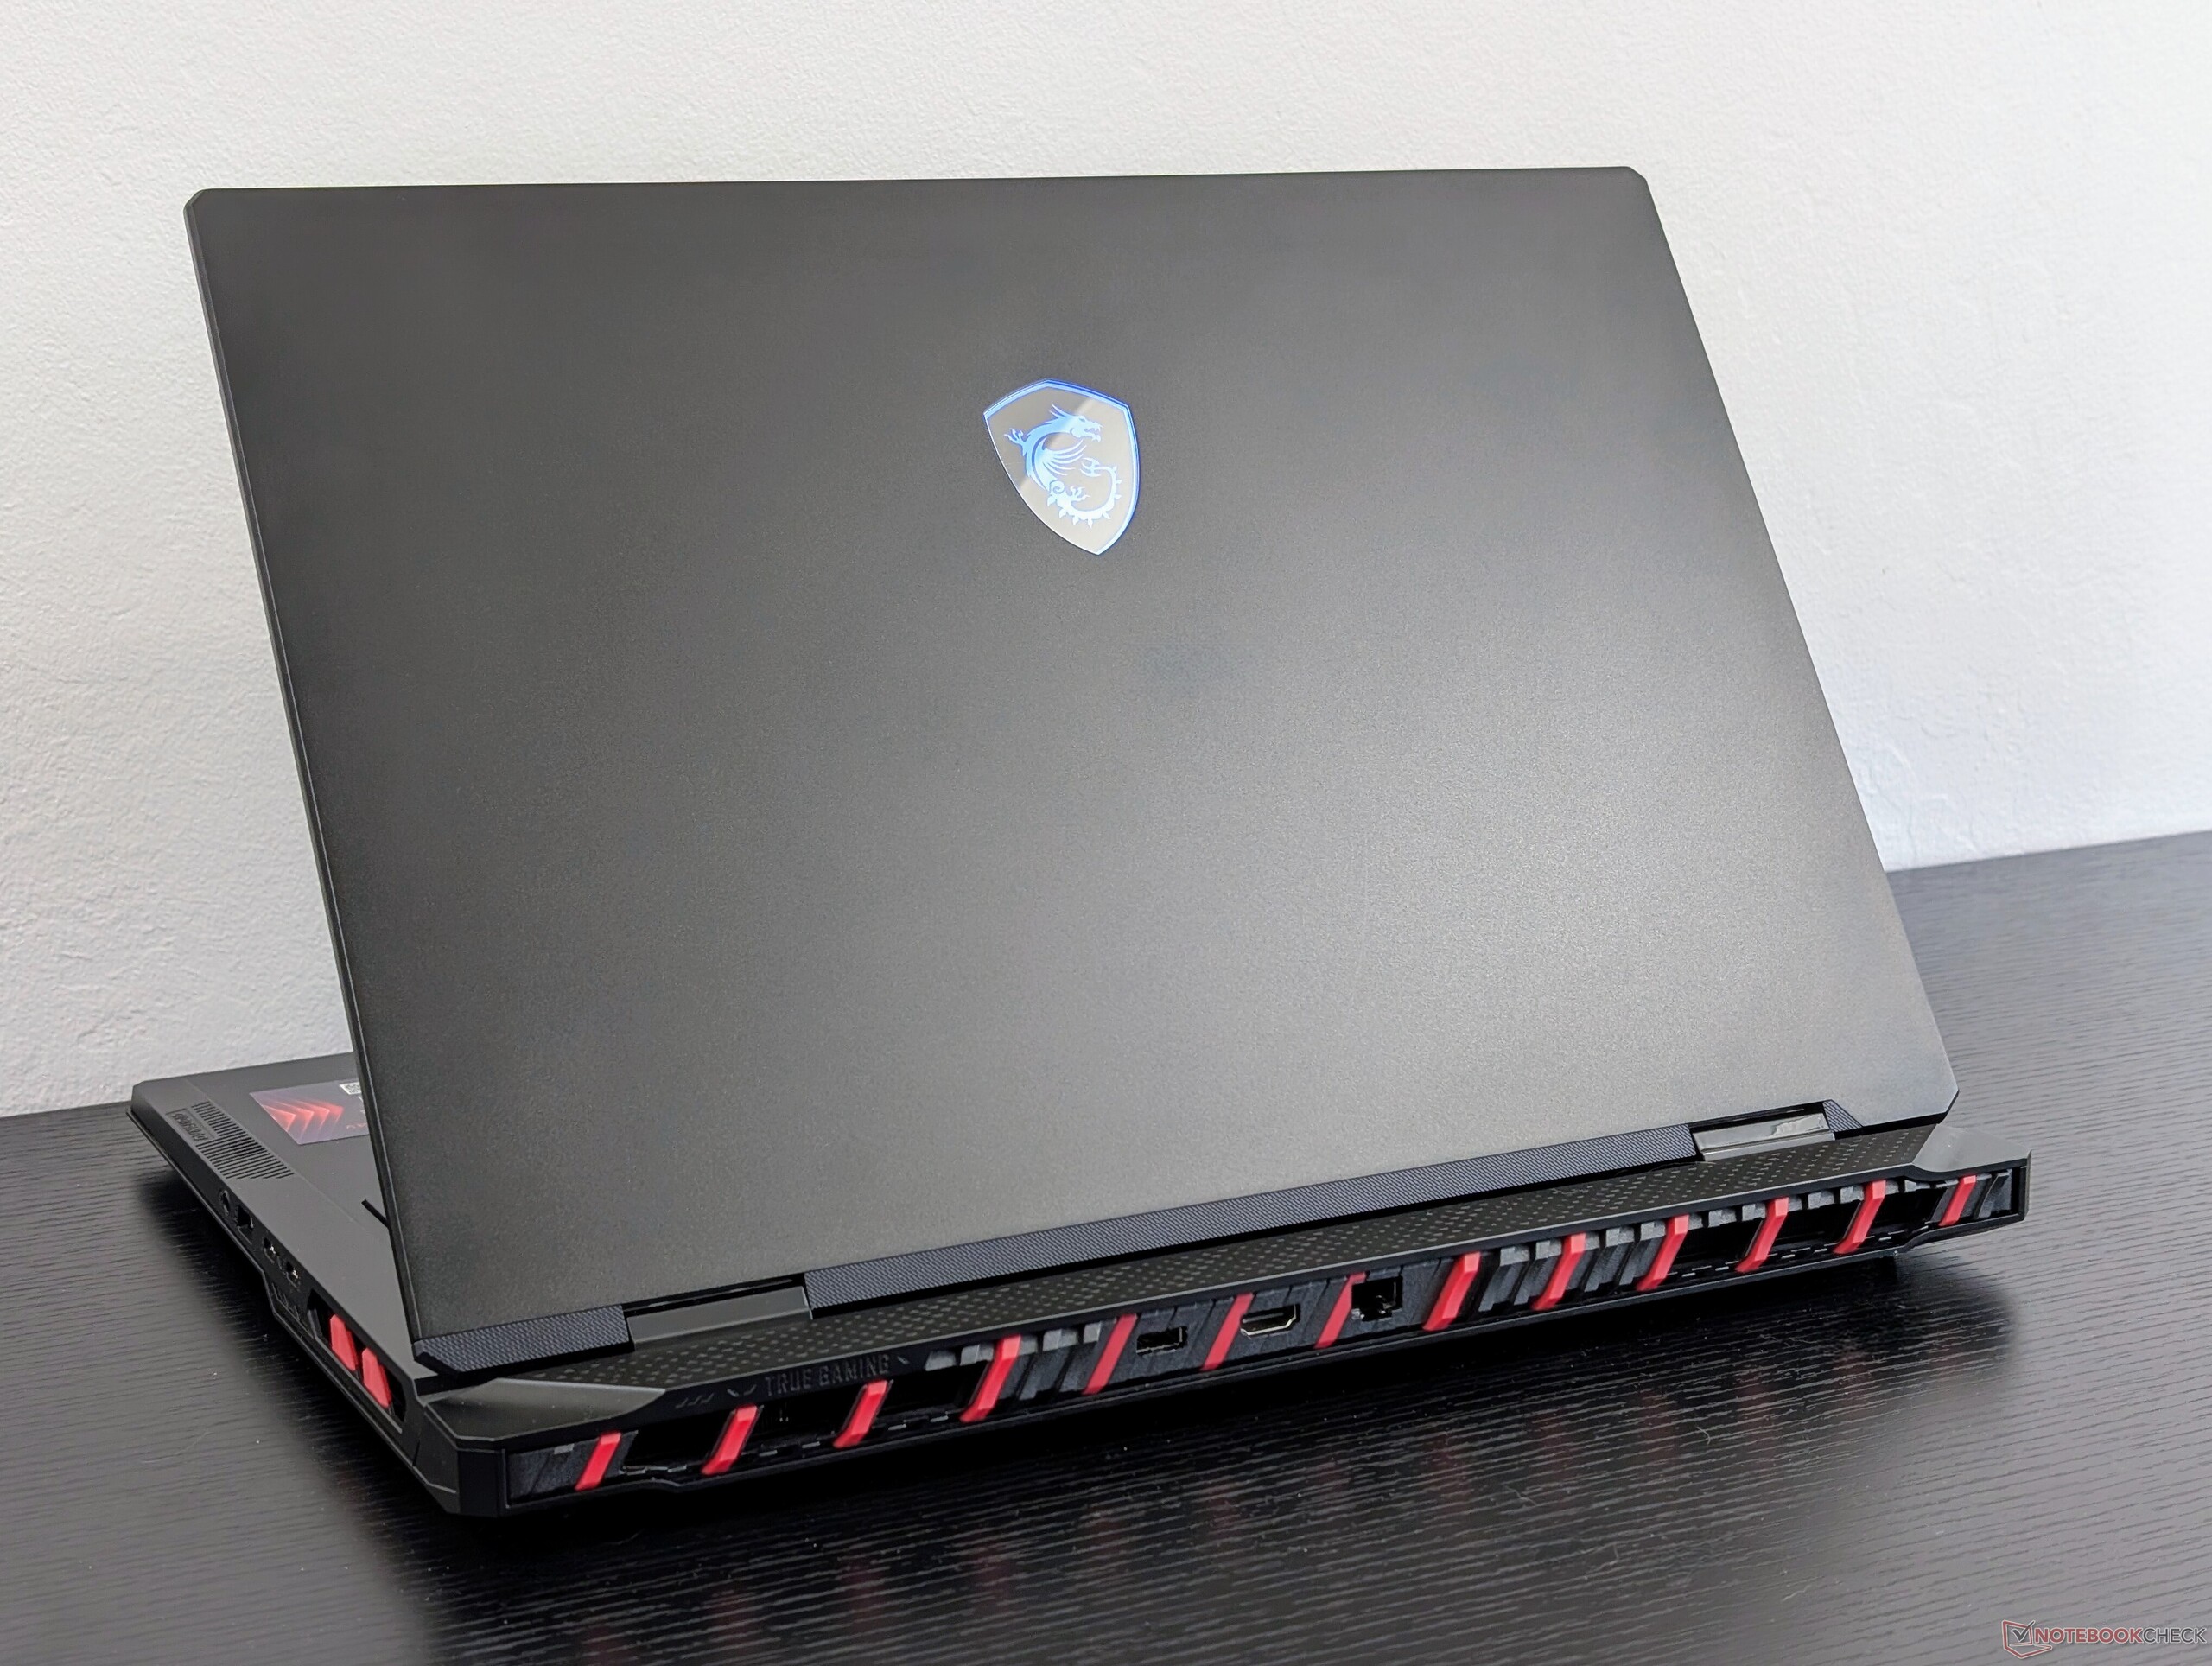
Dava - Mavi Ejderhadan Kırmızıya
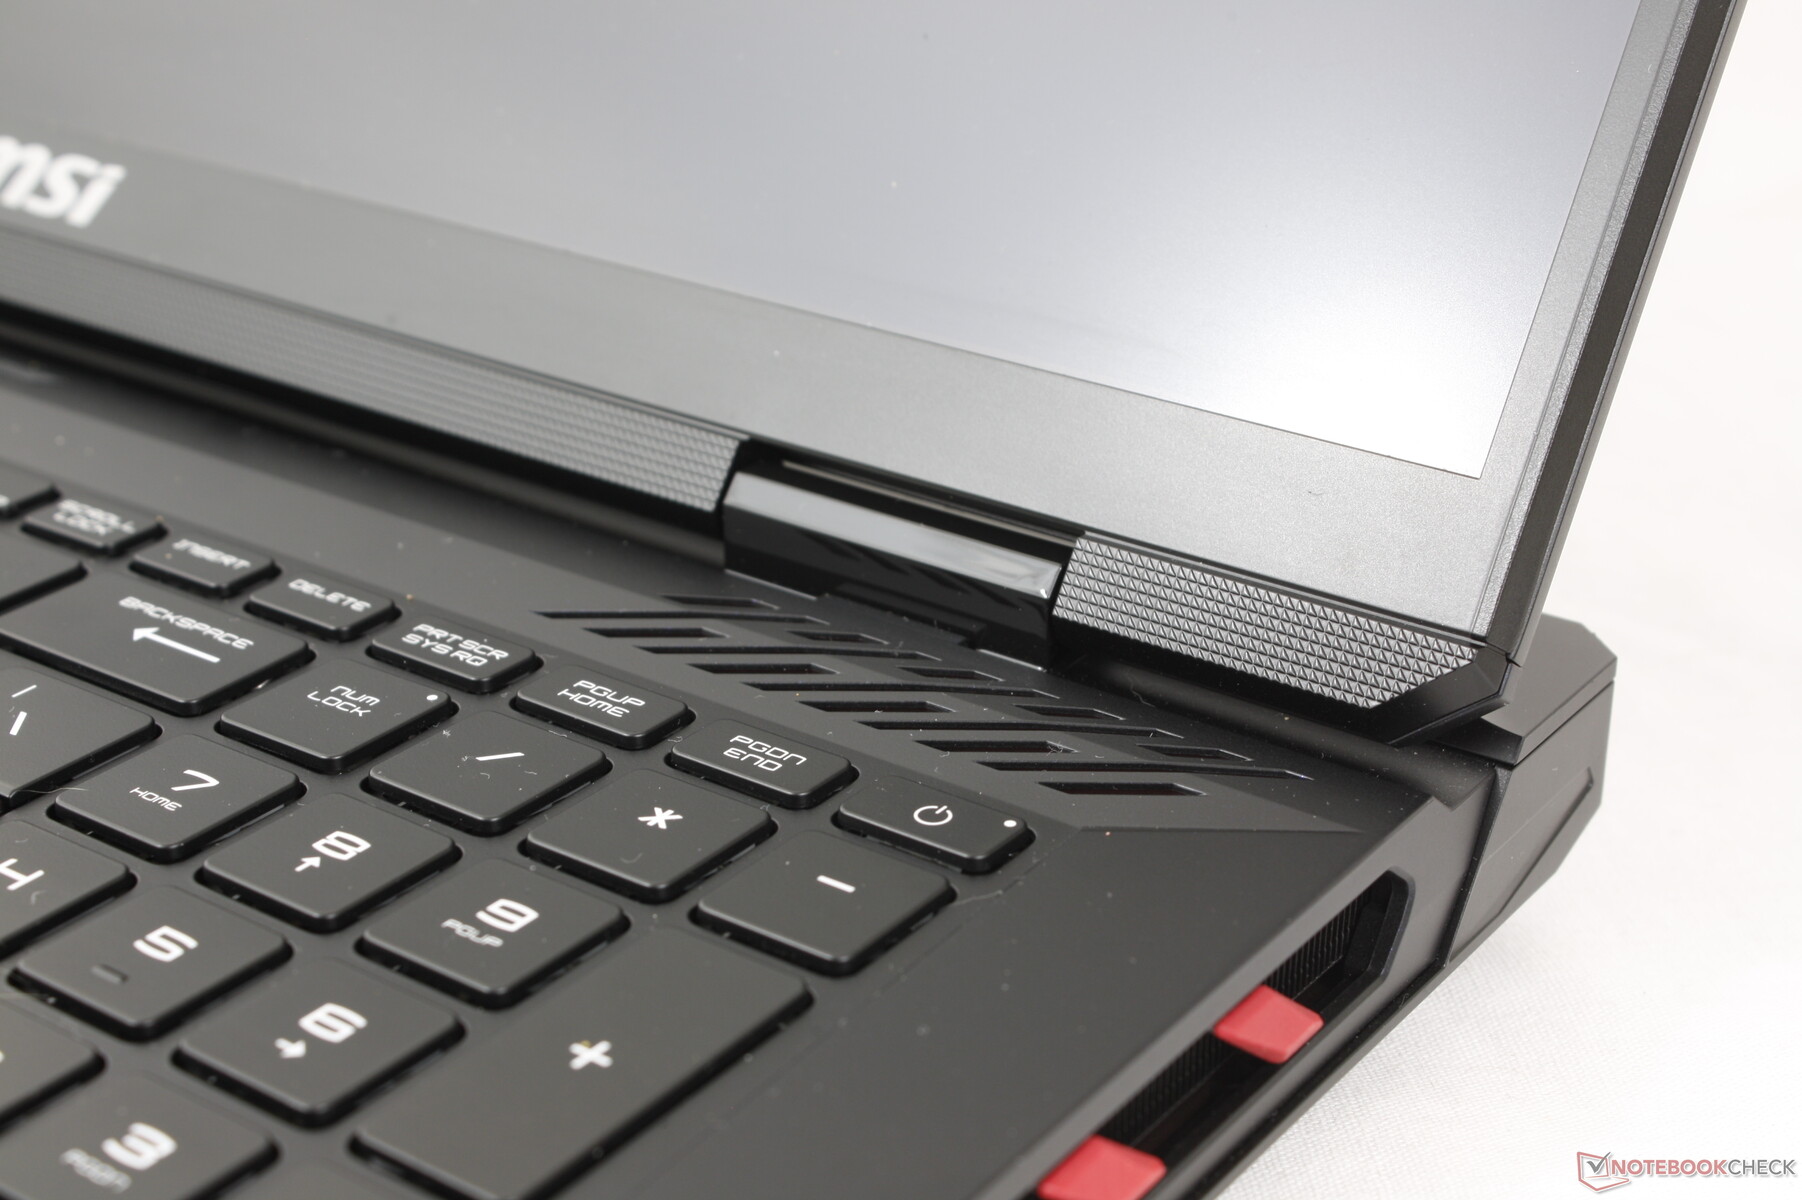
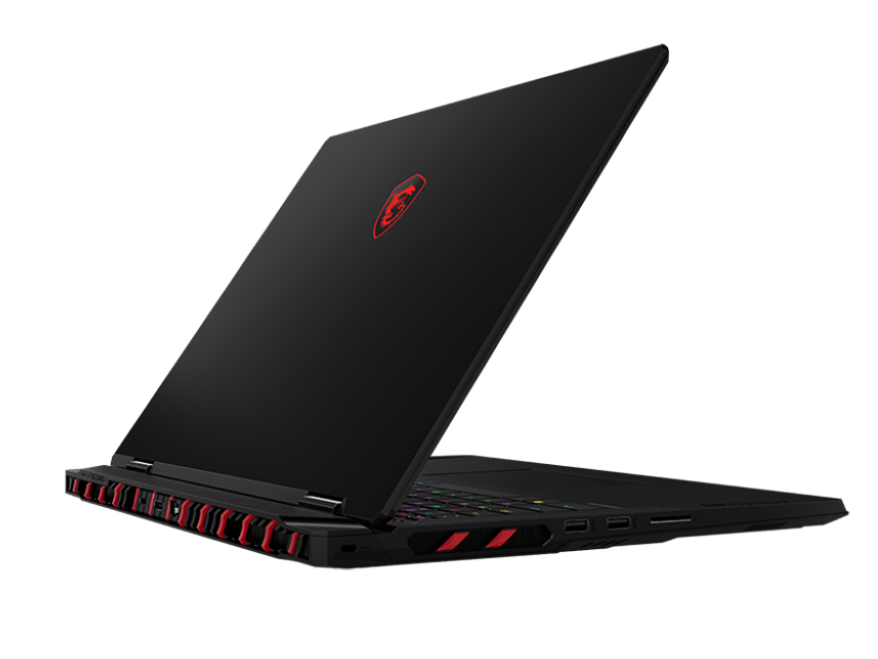
Şasi Titan 18 HX'in bir türevidir. Titan'ın kırmızı vurguları yeni Raider'da mavi yerine mavi ve çoğu yüzey genel olarak daha koyu bir görünüm için gri veya gümüş yerine jet siyahı. MSI ayrıca sistemin ön kenarı boyunca bir LED çubuk eklemiş, oysa Titan'da bu eksikti. Değişiklikler büyük ölçüde estetik ve bu nedenle Raider, altta yatan malzemeler ve iskelet aynı olduğu için hala daha pahalı kardeşi kadar güçlü hissettiriyor.
Raider 18 HX ve Titan 18 HX arasındaki belki de en dikkat çekici görsel fark, yeniden tasarlanan klavye güvertesidir. Titan 18 HX, avuç içi dayanakları ve clickpad boyunca uzanan süslü bir cam panel ile daha düz bir güverteye sahipken, Raider camsız ve sadece basit bir clickpad ile daha geleneksel bir yaklaşım benimsiyor.
Boyutlar ve ağırlık, aralarındaki tüm dış farklılıklara rağmen Titan 18 HX ile esasen aynıdır. Bu nedenle bu model, taşınabilirlik açısından Titan 18 HX gibi alternatifler arasında orta sıralarda yer alıyor Alienware m18 R2 daha ağır ve büyükken, ROG Strix G18 veya Blade 18'in her biri çok daha hafiftir.
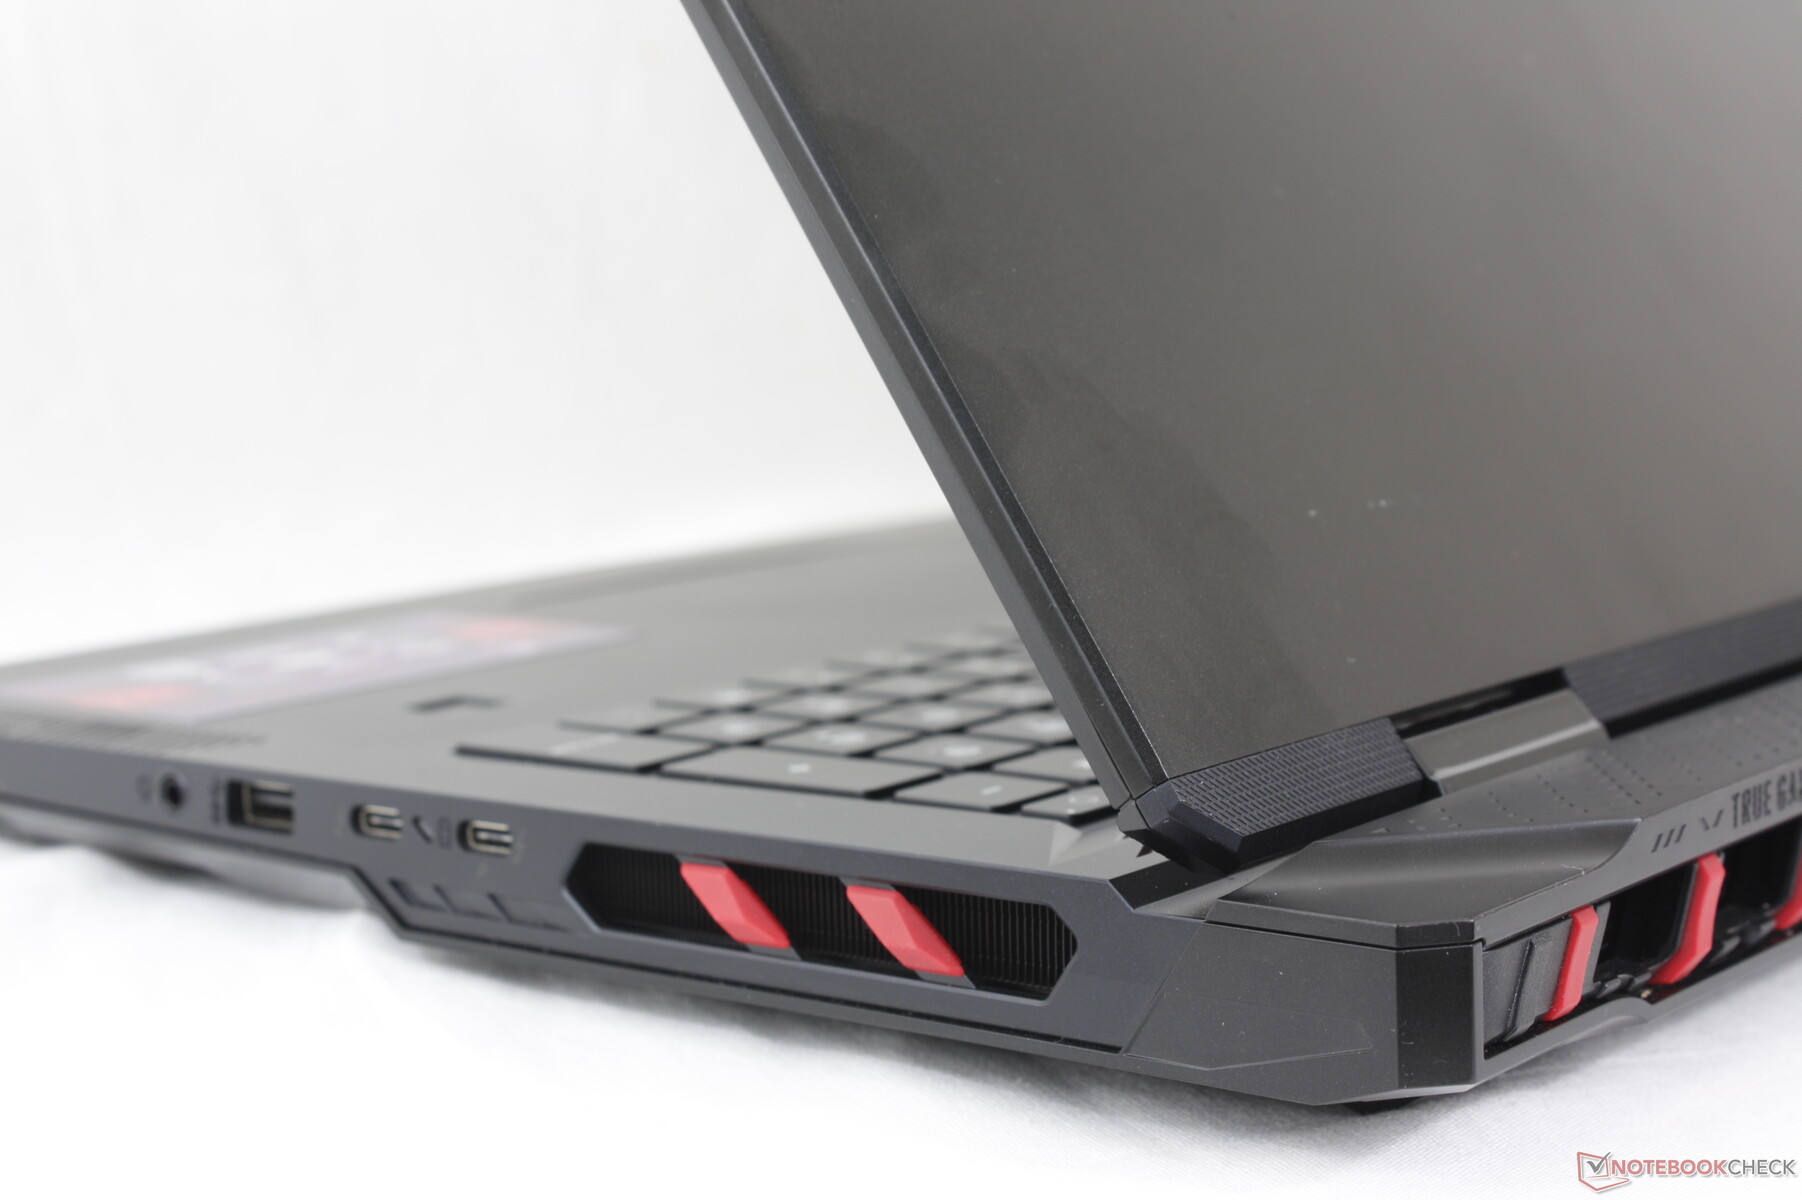
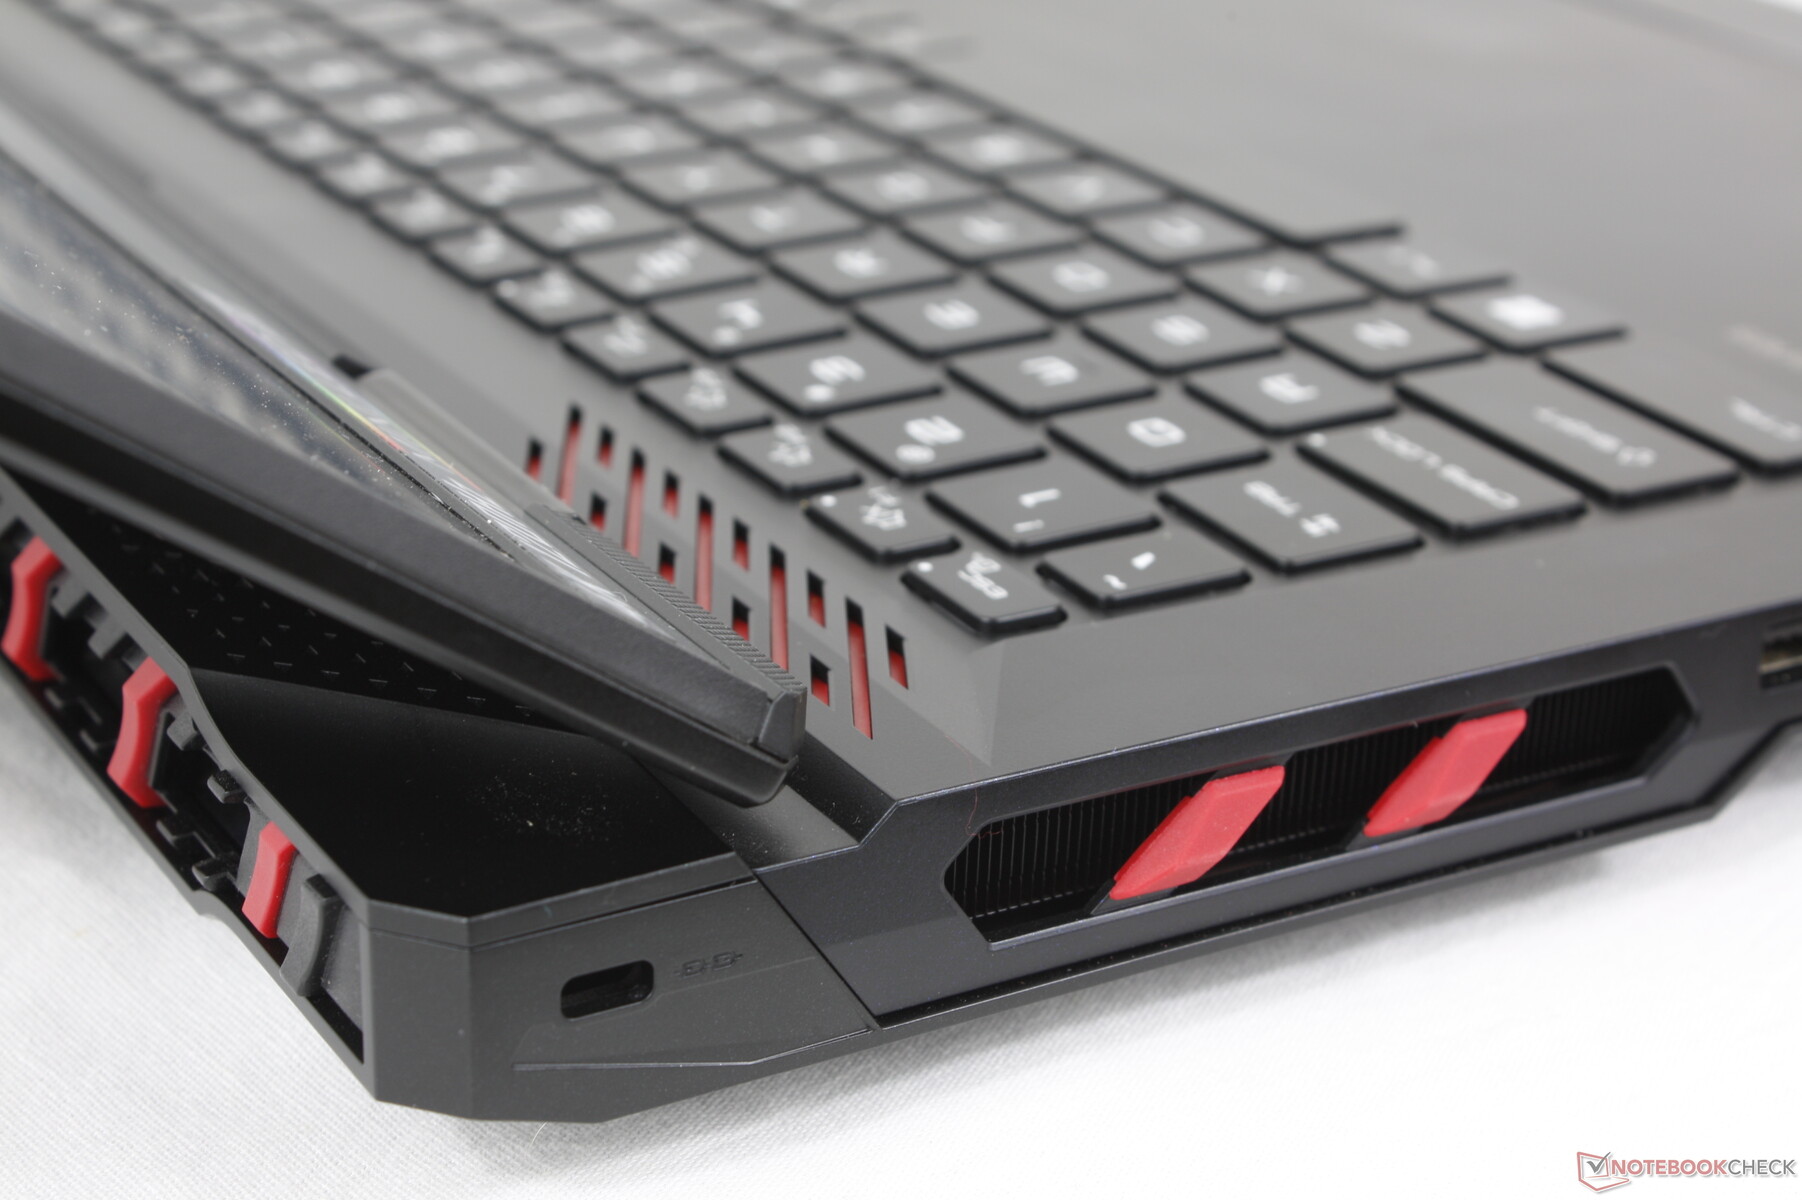
Bağlanabilirlik
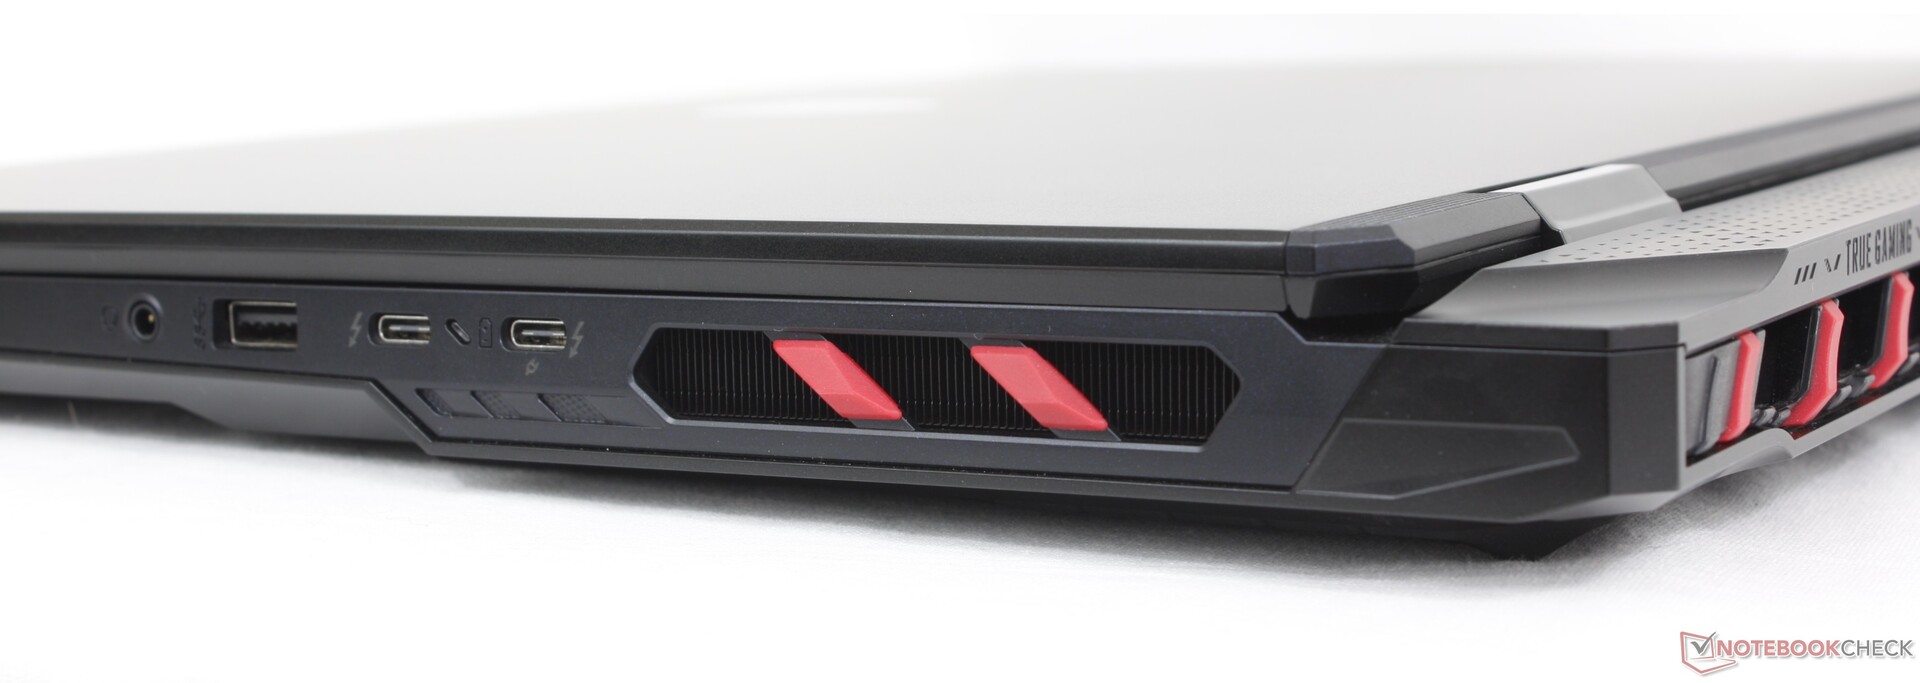
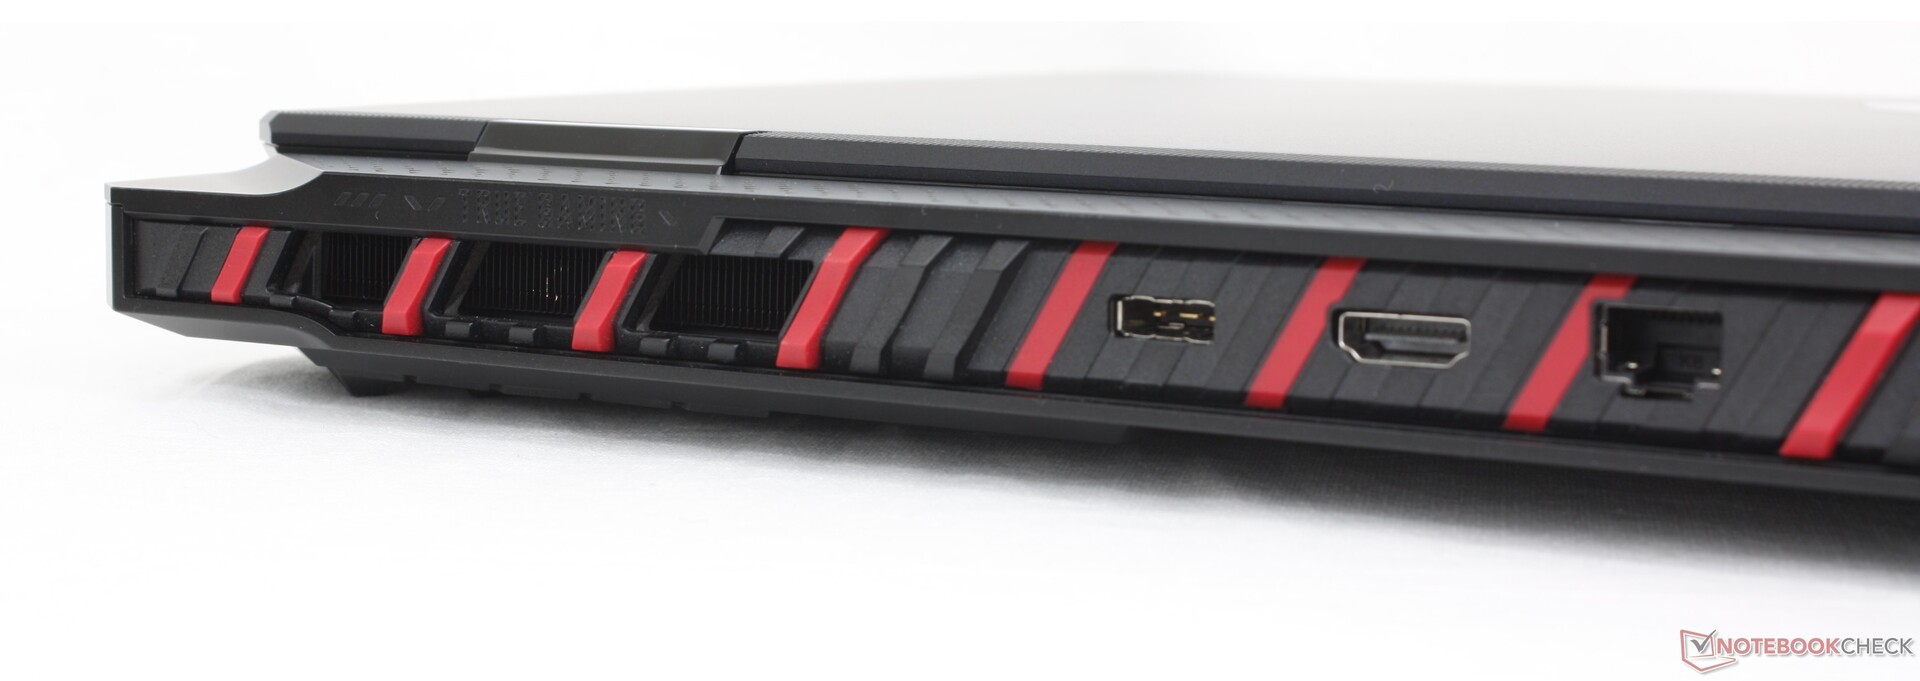
Portlar ve konumlandırma Titan 18 HX ile aynıdır, bu da kaputun altında ne bekleyeceğiniz hakkında büyük bir ipucudur. Entegre seçenekler, Titan 18 HX'te bulacaklarınızla karşılaştırılabilir Bıçak 18 veya ROG Strix G18'den çok farklı düzenlemelerde olsa da.
İki USB-C bağlantı noktasından yalnızca birinin Güç Dağıtımı'nı desteklediğini unutmayın. Bunun dışında her ikisi de DisplayPort ile uyumludur.

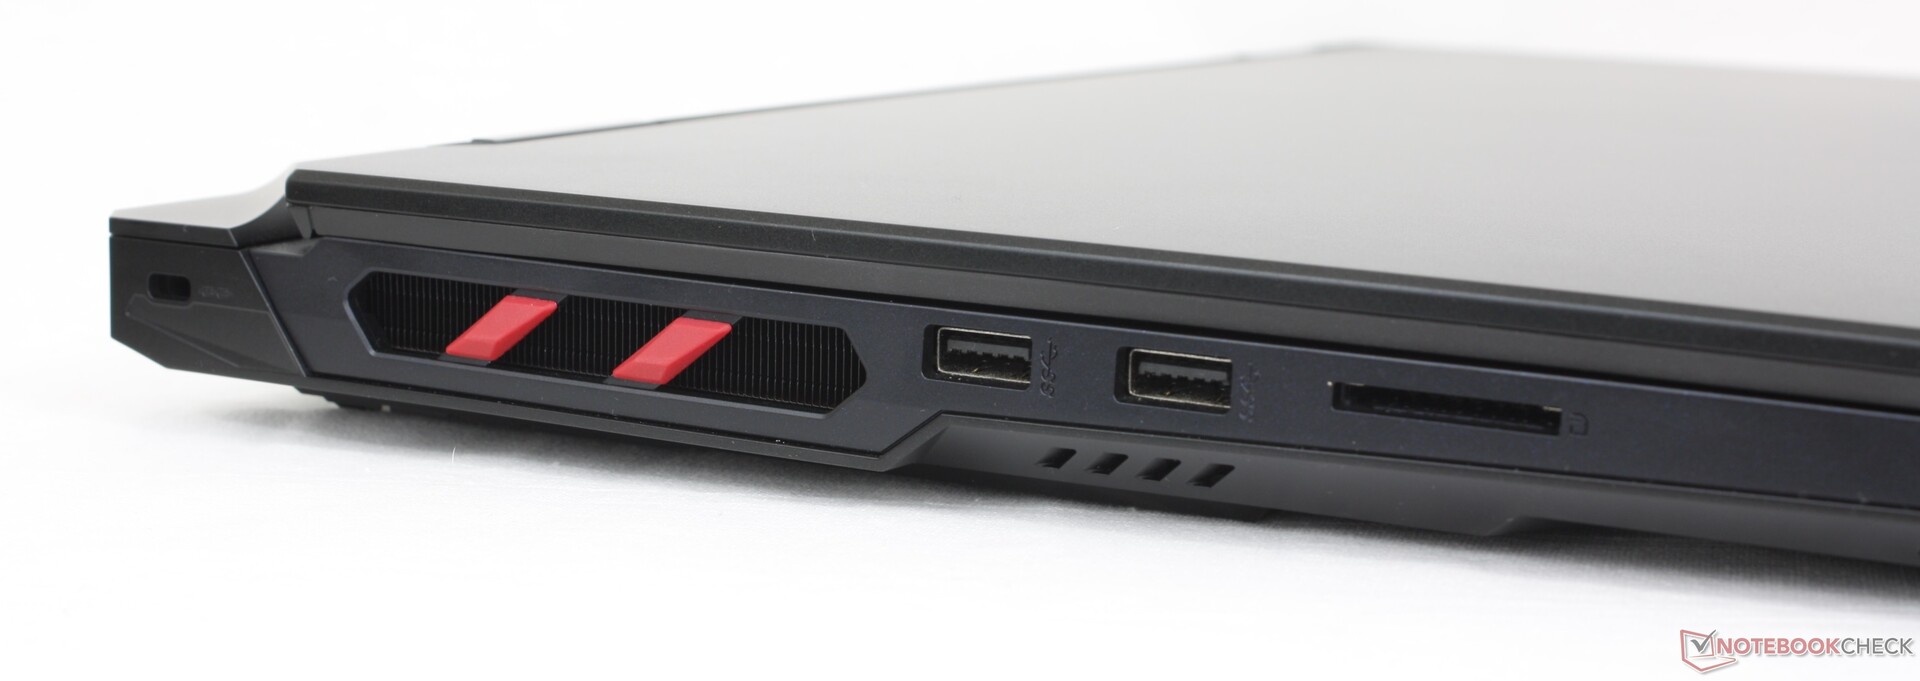
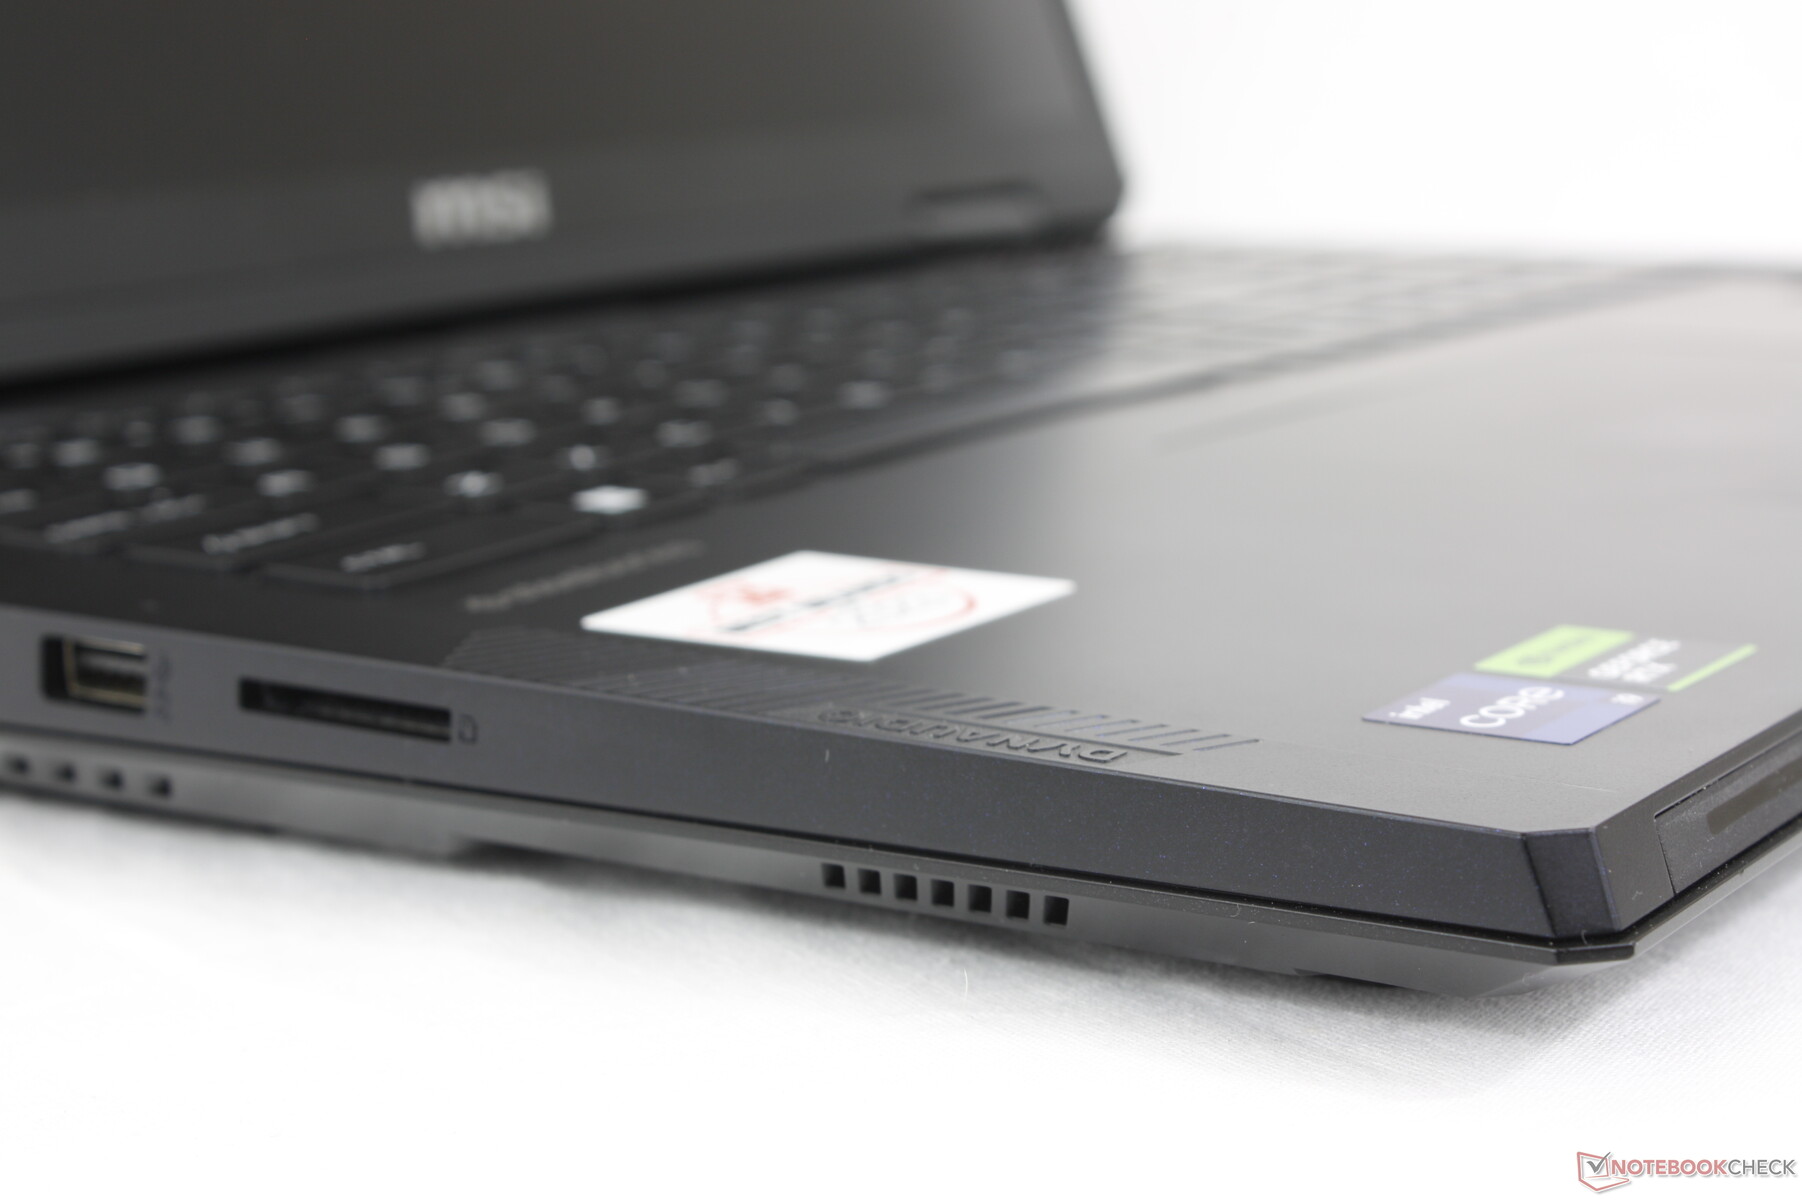
SD Kart Okuyucu
Entegre SD okuyucu yaklaşık 90 MB/sn ile iyi bir performans sergiliyor ancak Raider 18 HX'in yüksek fiyatına kıyasla yavaş kalıyor. Razer Blade 18'deki SD kart okuyucular veya Alienware m18 R2örneğin, karşılaştırıldığında iki kattan fazla daha hızlıdır.
| SD Card Reader | |
| average JPG Copy Test (av. of 3 runs) | |
| Alienware m18 R2 (Toshiba Exceria Pro SDXC 64 GB UHS-II) | |
| Razer Blade 18 2024 RZ09-0509 (Toshiba Exceria Pro SDXC 64 GB UHS-II) | |
| Acer Predator Helios 18 PH18-72-98MW (AV PRO microSD 128 GB V60) | |
| MSI Raider 18 HX A14V (Toshiba Exceria Pro SDXC 64 GB UHS-II) | |
| MSI Titan 18 HX A14VIG (Toshiba Exceria Pro SDXC 64 GB UHS-II) | |
| maximum AS SSD Seq Read Test (1GB) | |
| Razer Blade 18 2024 RZ09-0509 (Toshiba Exceria Pro SDXC 64 GB UHS-II) | |
| Alienware m18 R2 (Toshiba Exceria Pro SDXC 64 GB UHS-II) | |
| MSI Titan 18 HX A14VIG (Toshiba Exceria Pro SDXC 64 GB UHS-II) | |
| MSI Raider 18 HX A14V (Toshiba Exceria Pro SDXC 64 GB UHS-II) | |
| Acer Predator Helios 18 PH18-72-98MW (AV PRO microSD 128 GB V60) | |
İletişim
Killer BE1750x, Wi-Fi 7 ve Bluetooth 5.4 bağlantısı için standart olarak gelir. Wi-Fi 6E test yönlendiricimizle eşleştirildiğinde aktarım hızları sabit ve güvenilirdir.
Web kamerası
Titan 18 HX'te olduğu gibi IR ve fiziksel deklanşörlü 2 MP web kamerası standart olarak geliyor. İlginç bir şekilde, kamera da benzer parlaklık sorunları sergileyecektir.


Bakım
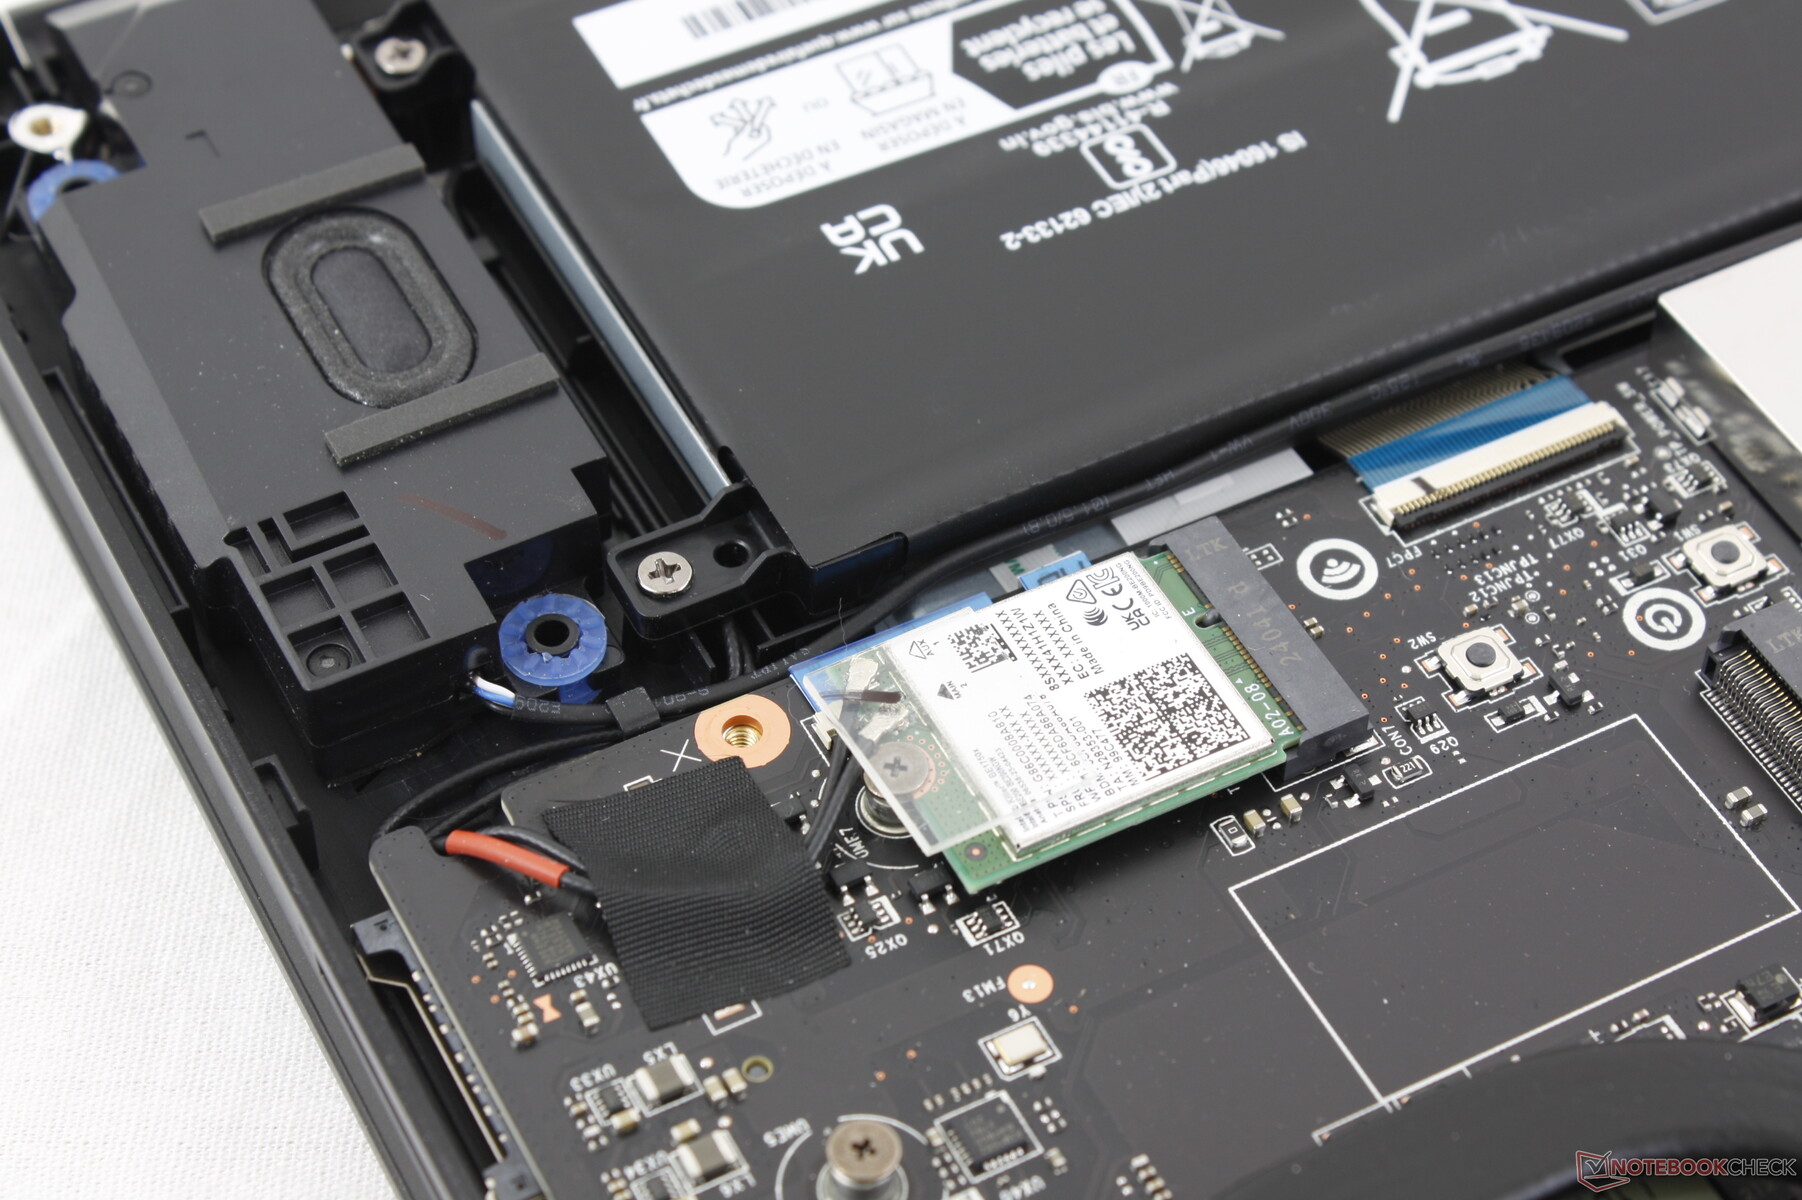
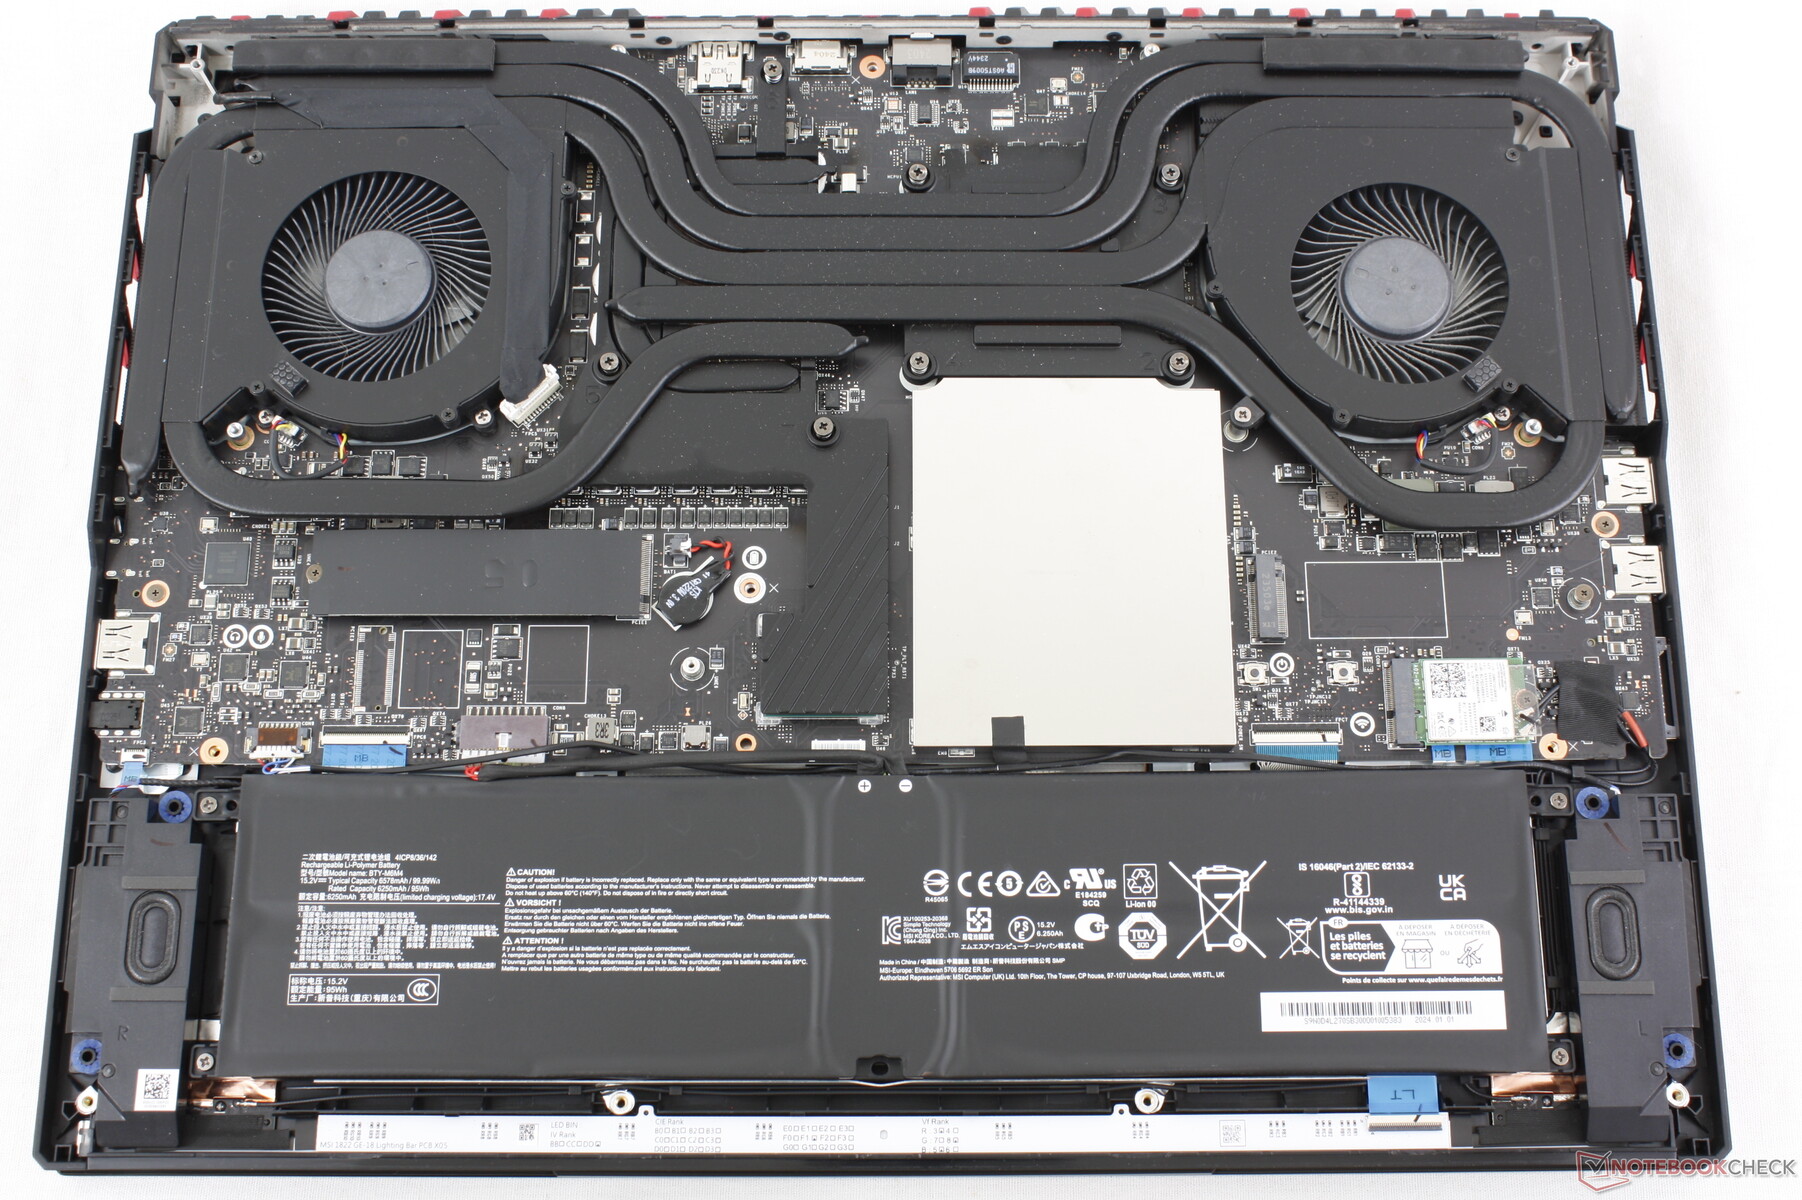
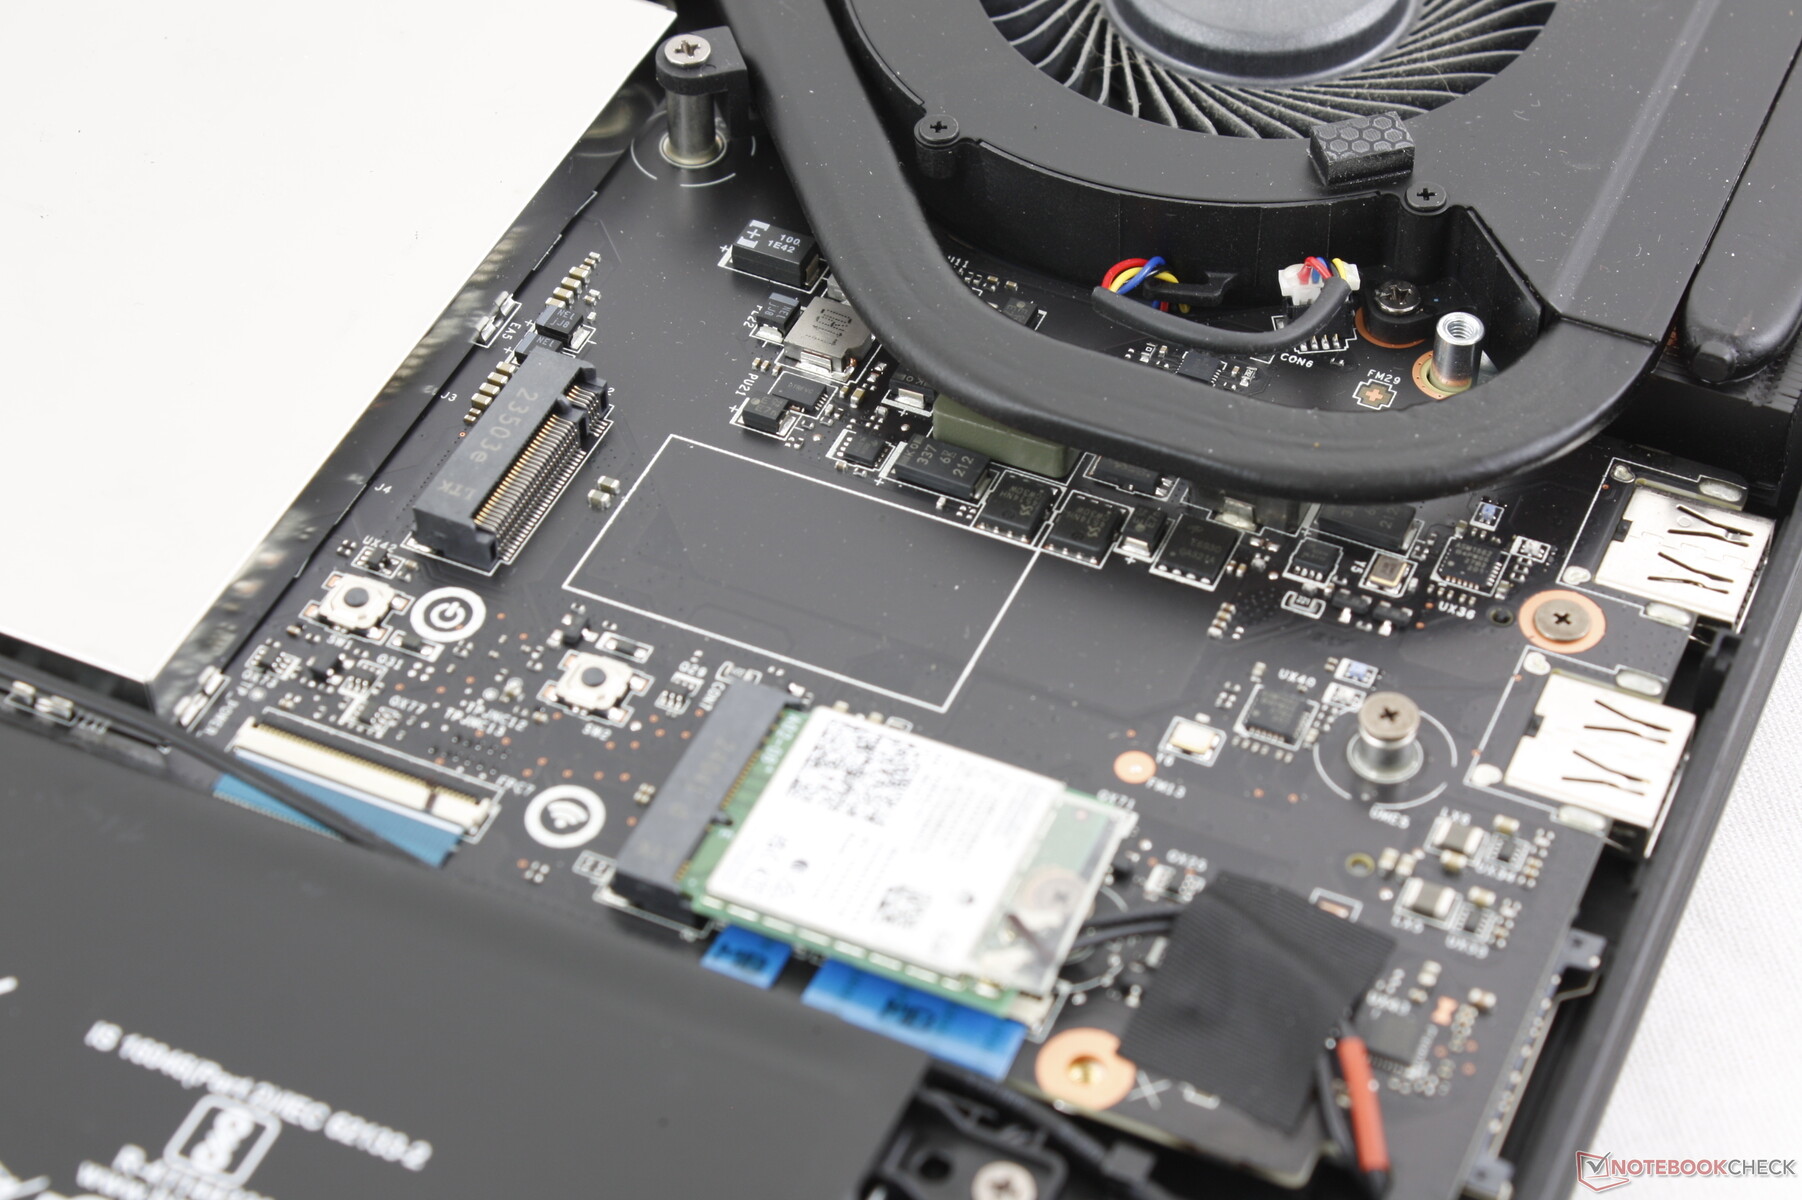
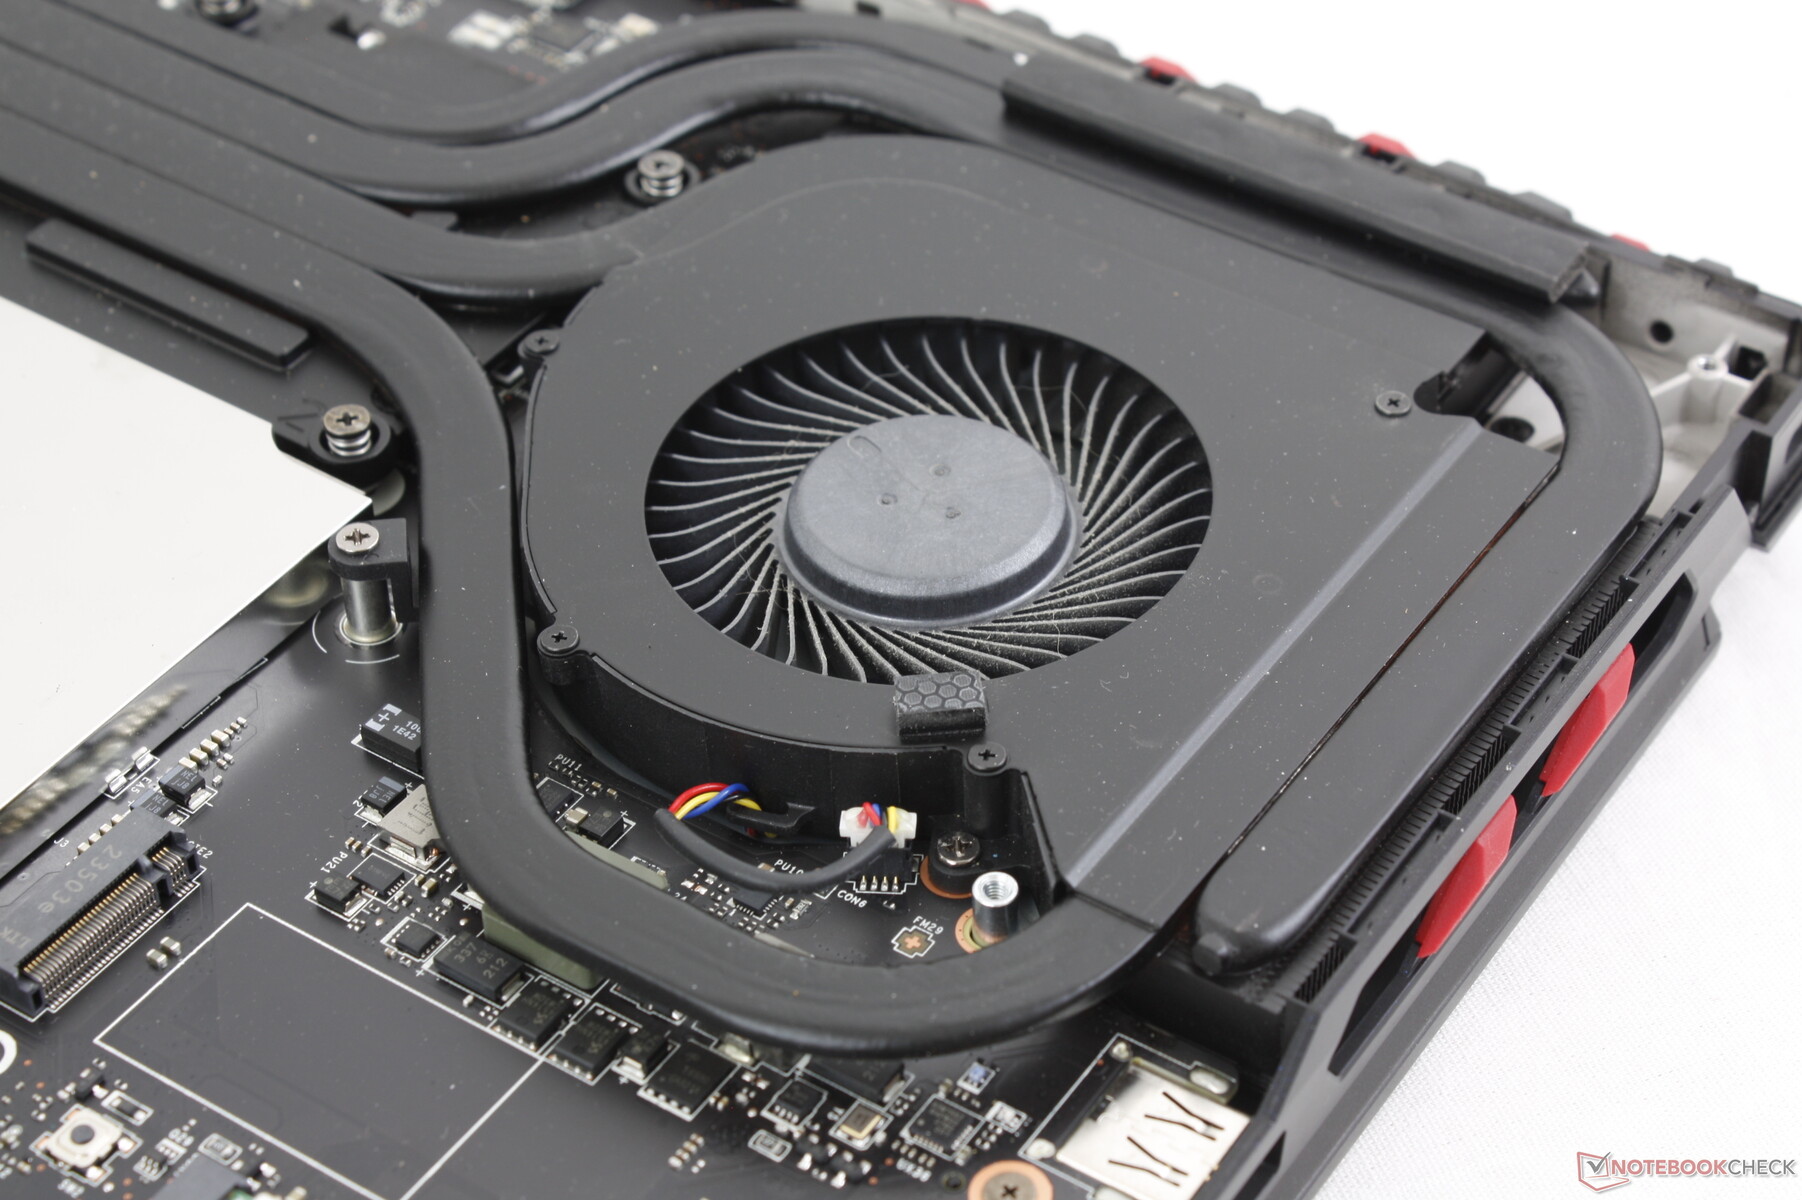
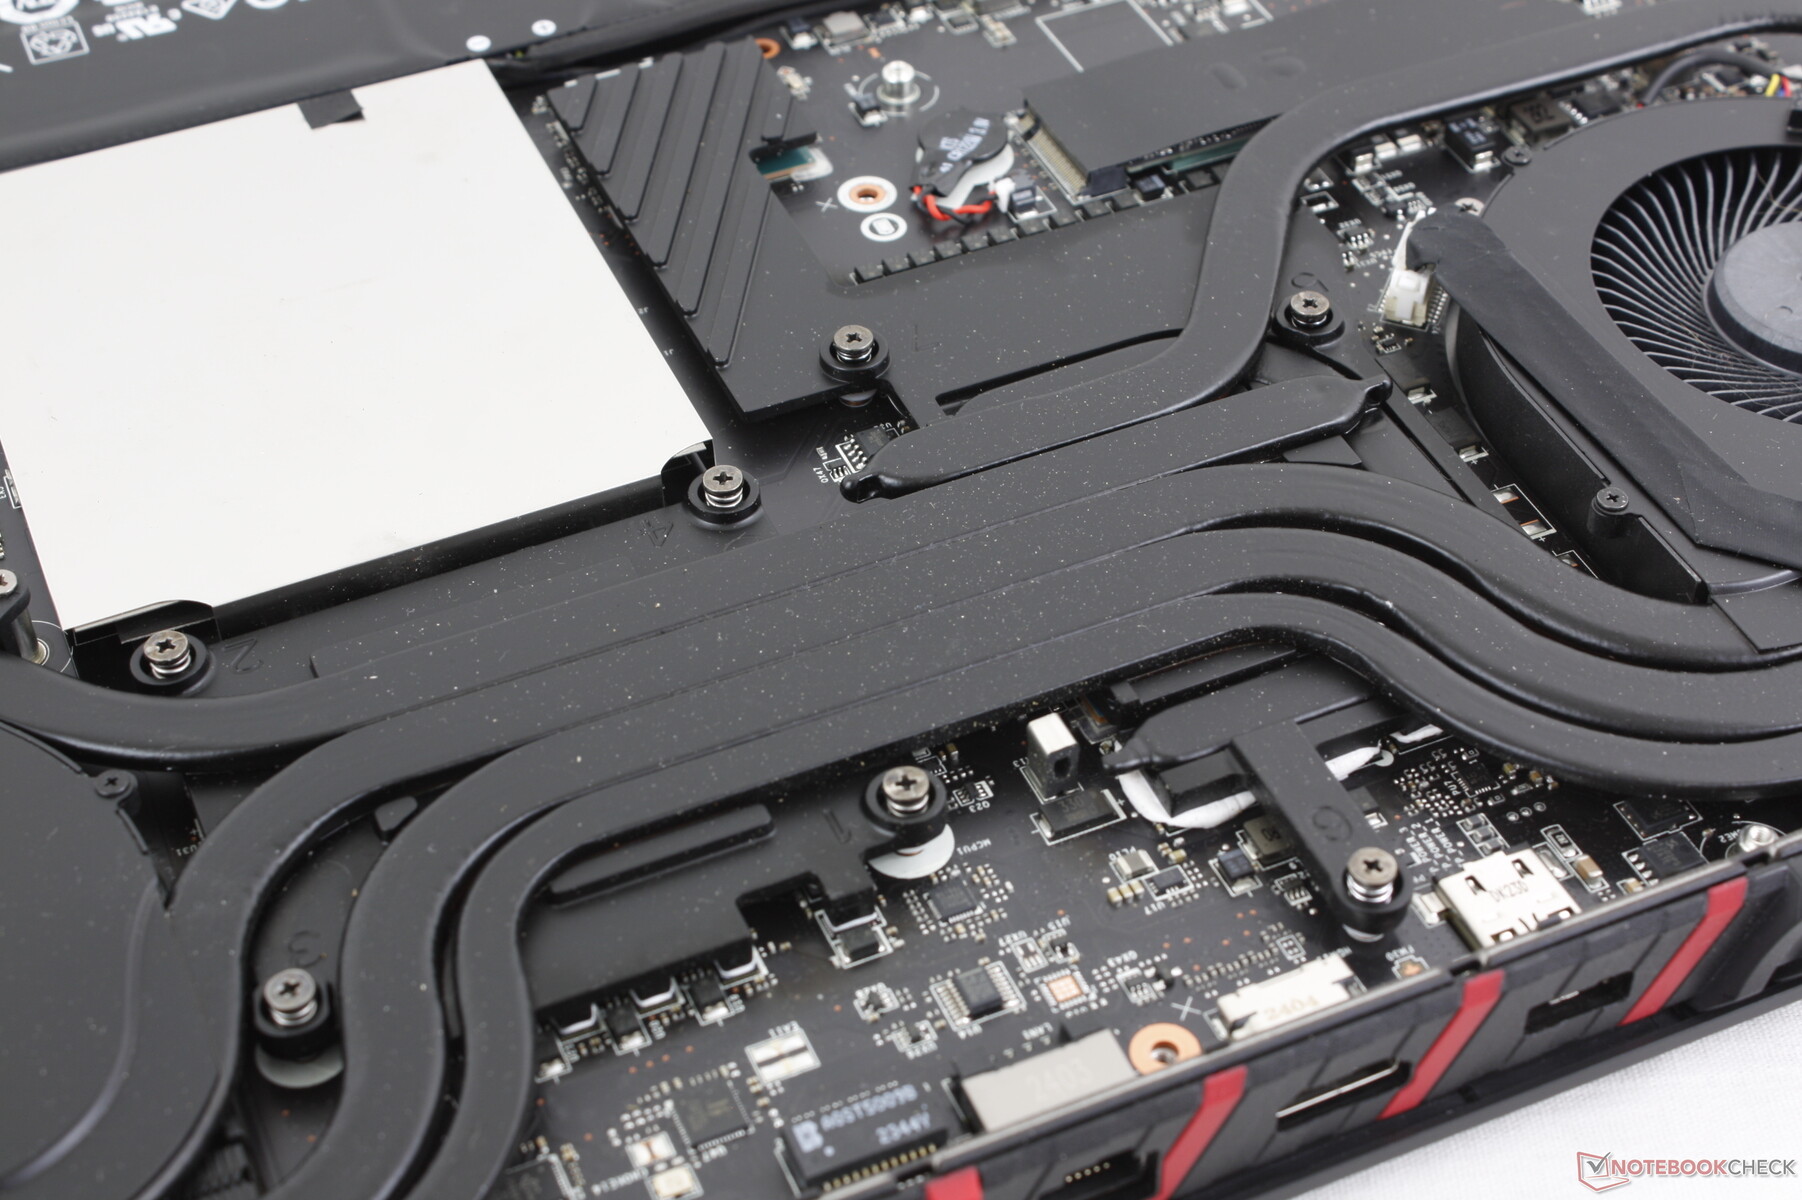
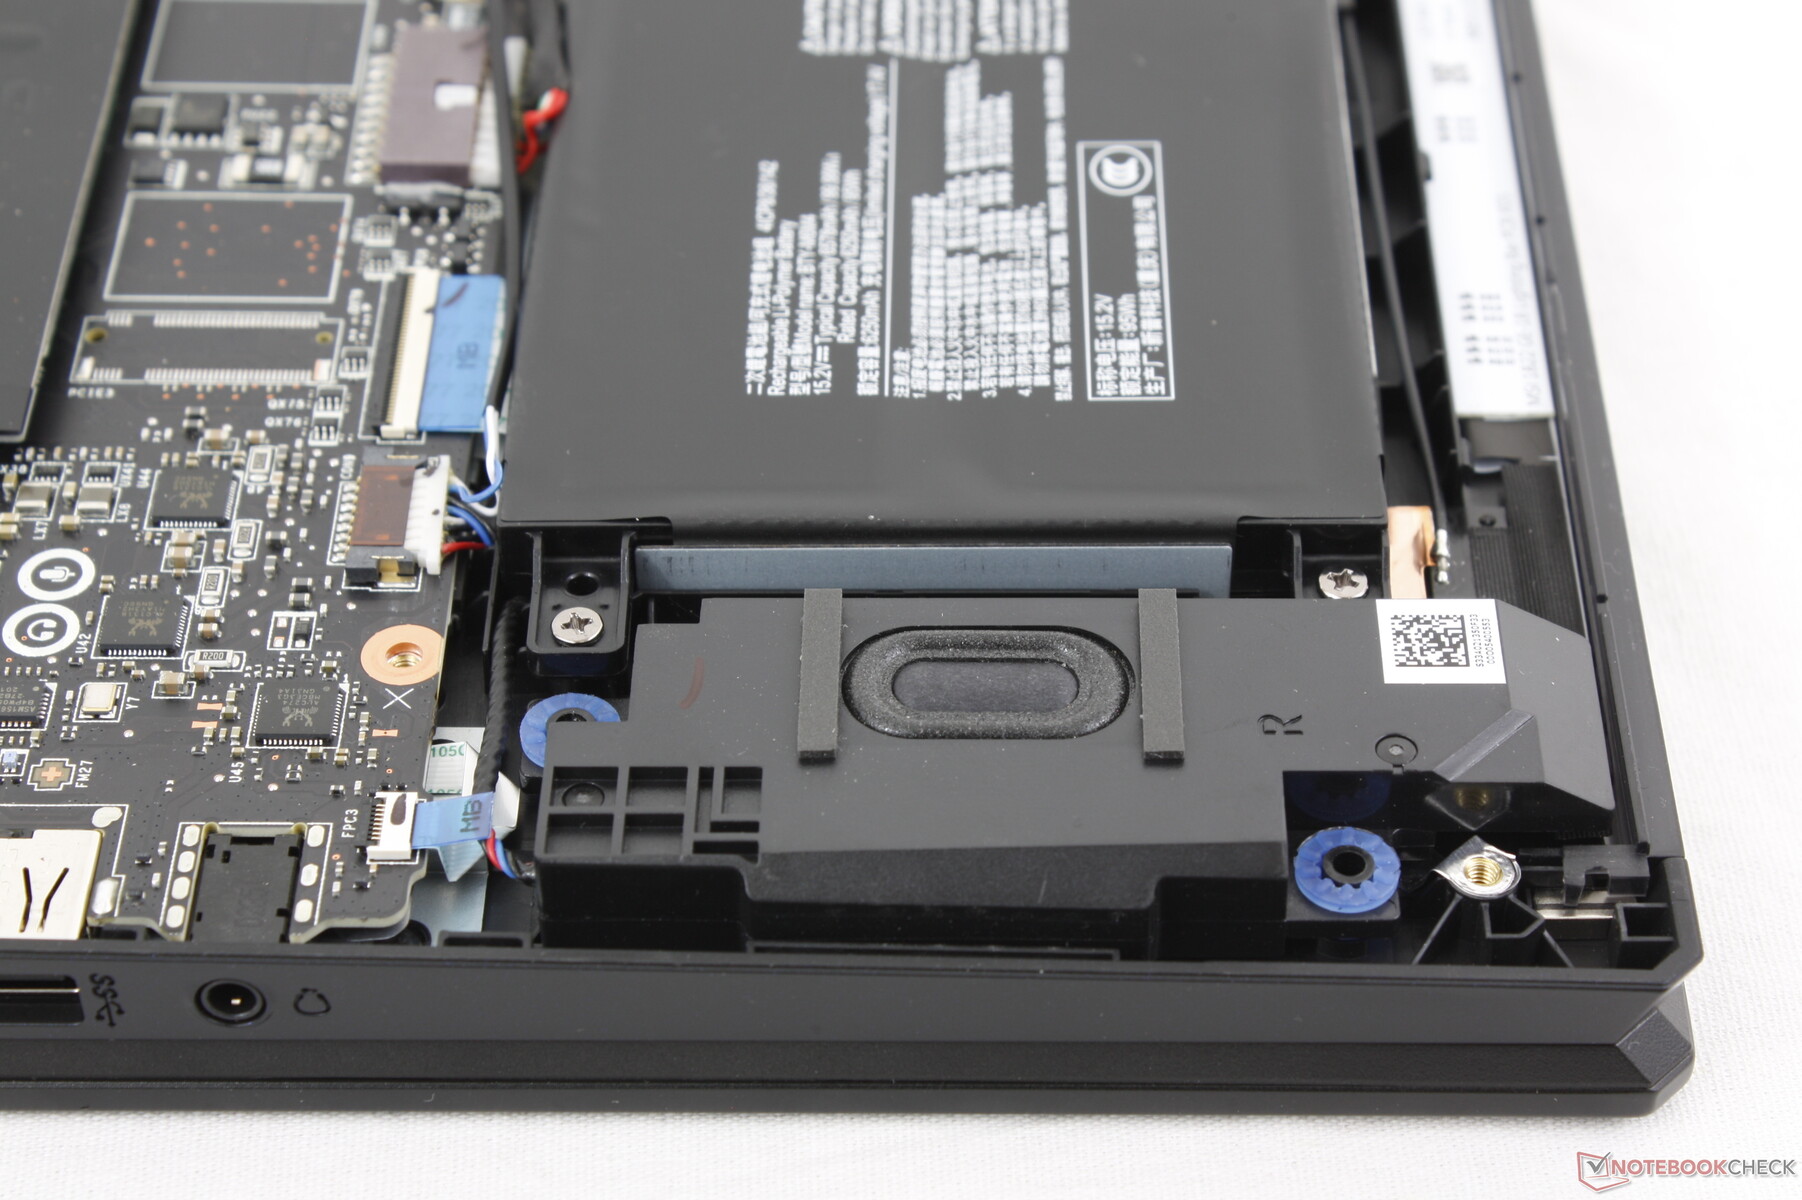
Alt panel, nispeten kolay çıkarılması için 12 Phillips vida ile sabitlenmiştir. Bununla birlikte MSI, RAM veya depolama gibi basit yükseltmeler için bile kırılması gereken vidalardan birini kaplayan kurcalamayı önleyici bir etikete sahip birkaç üreticiden biri olmaya devam ediyor.
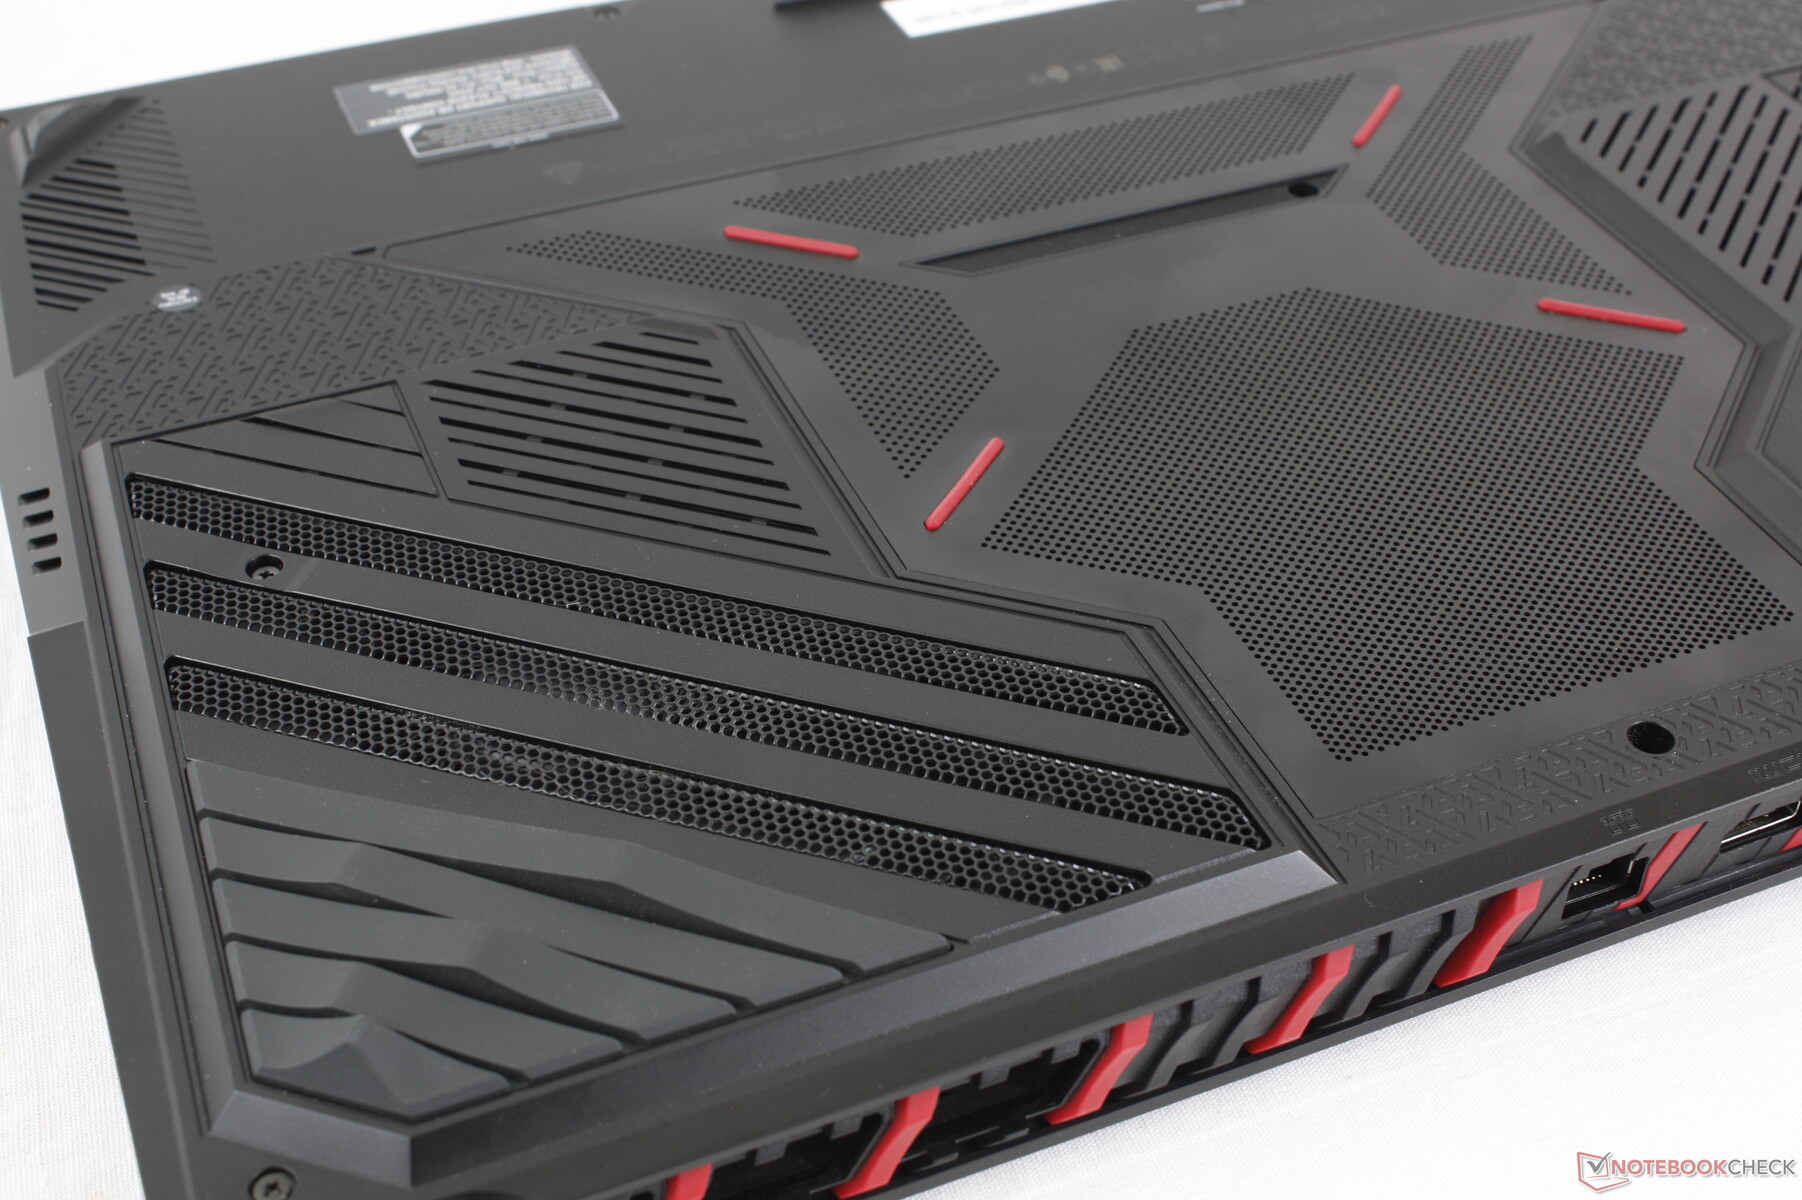
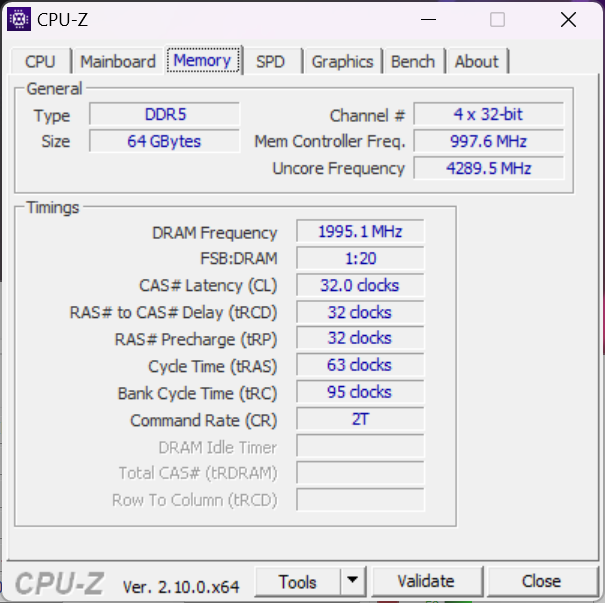
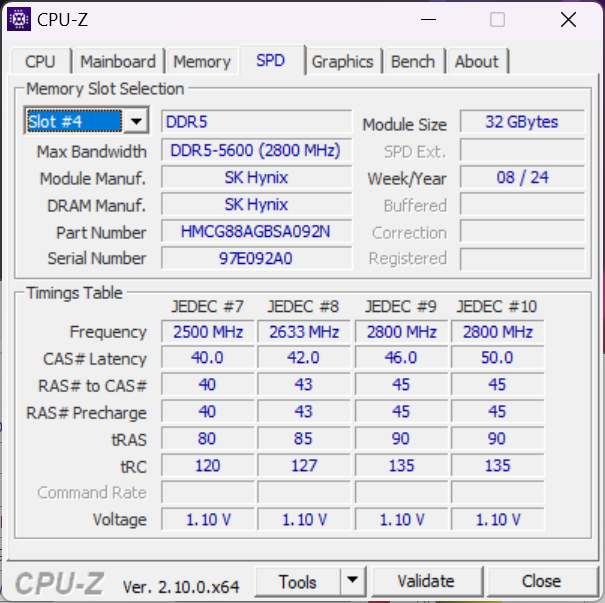
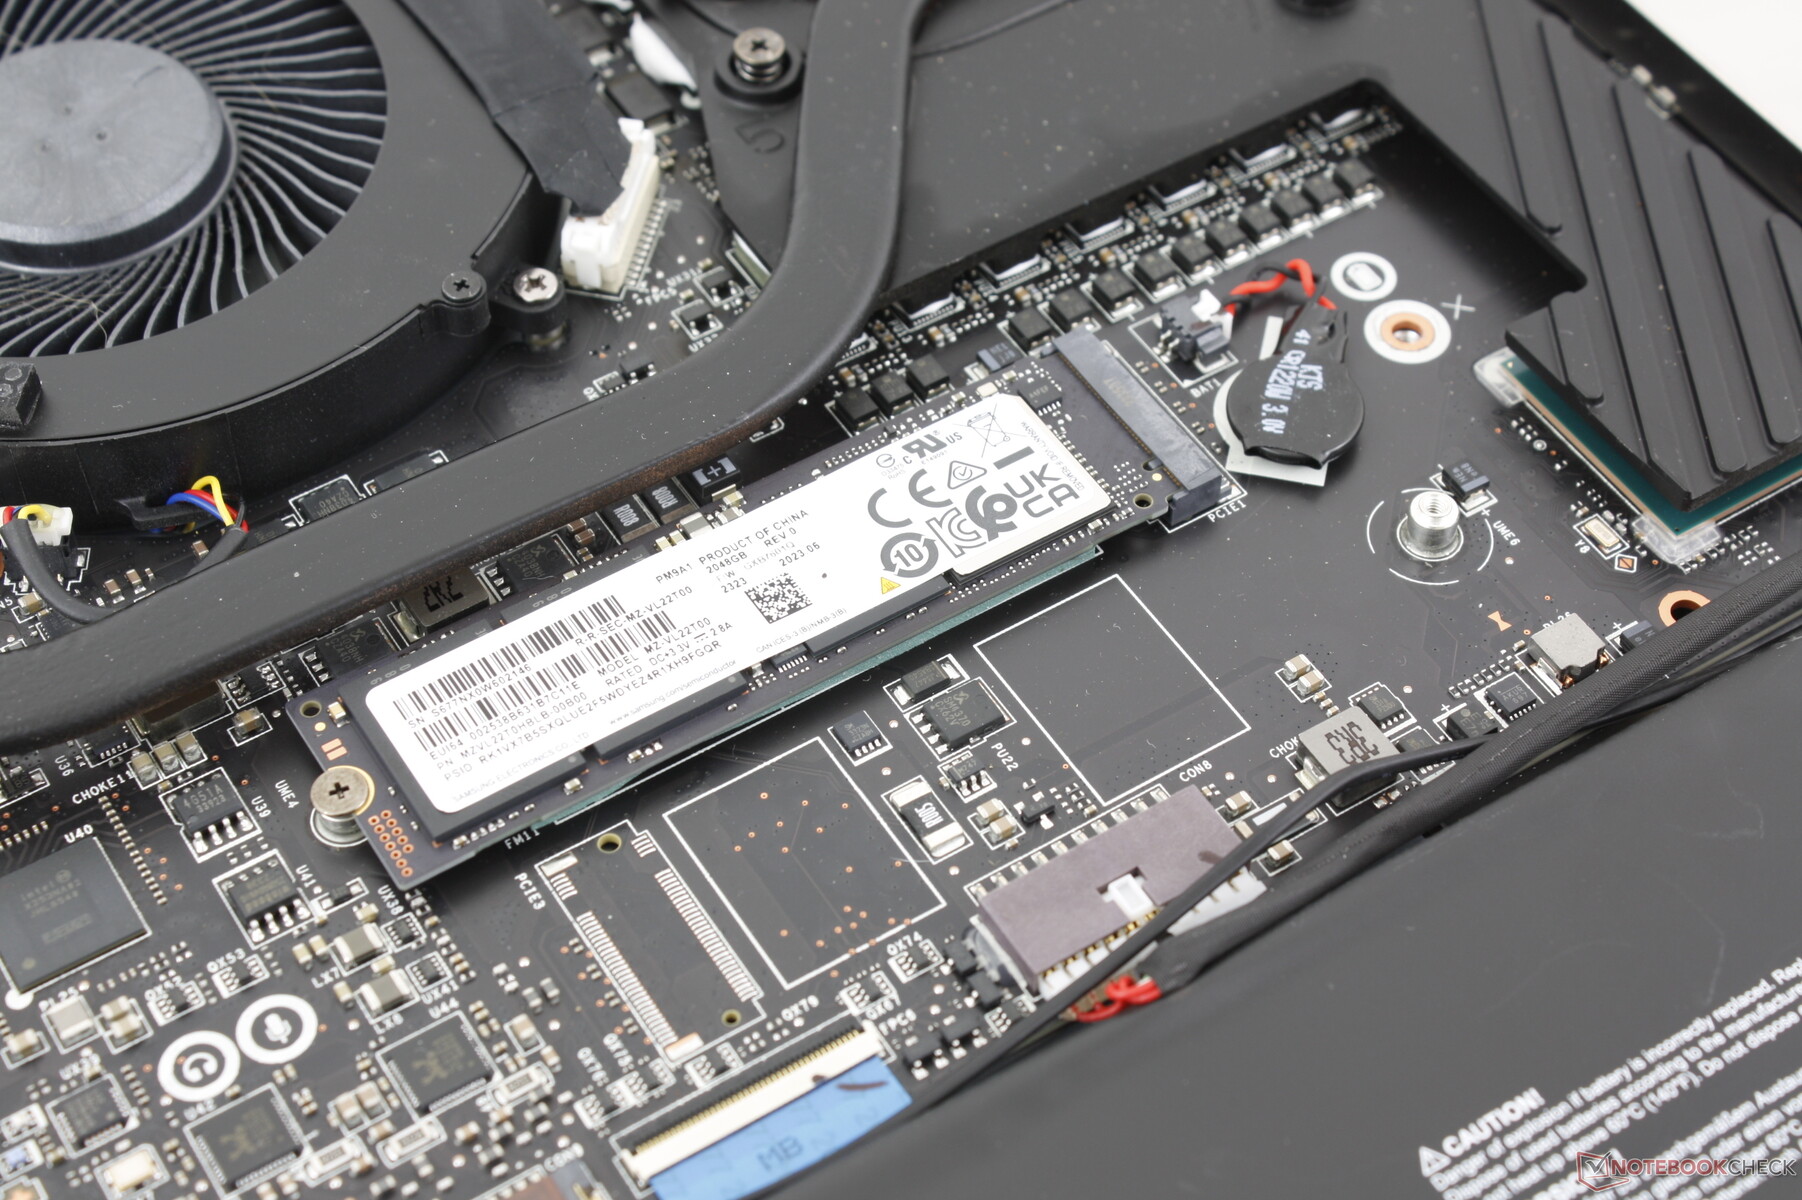
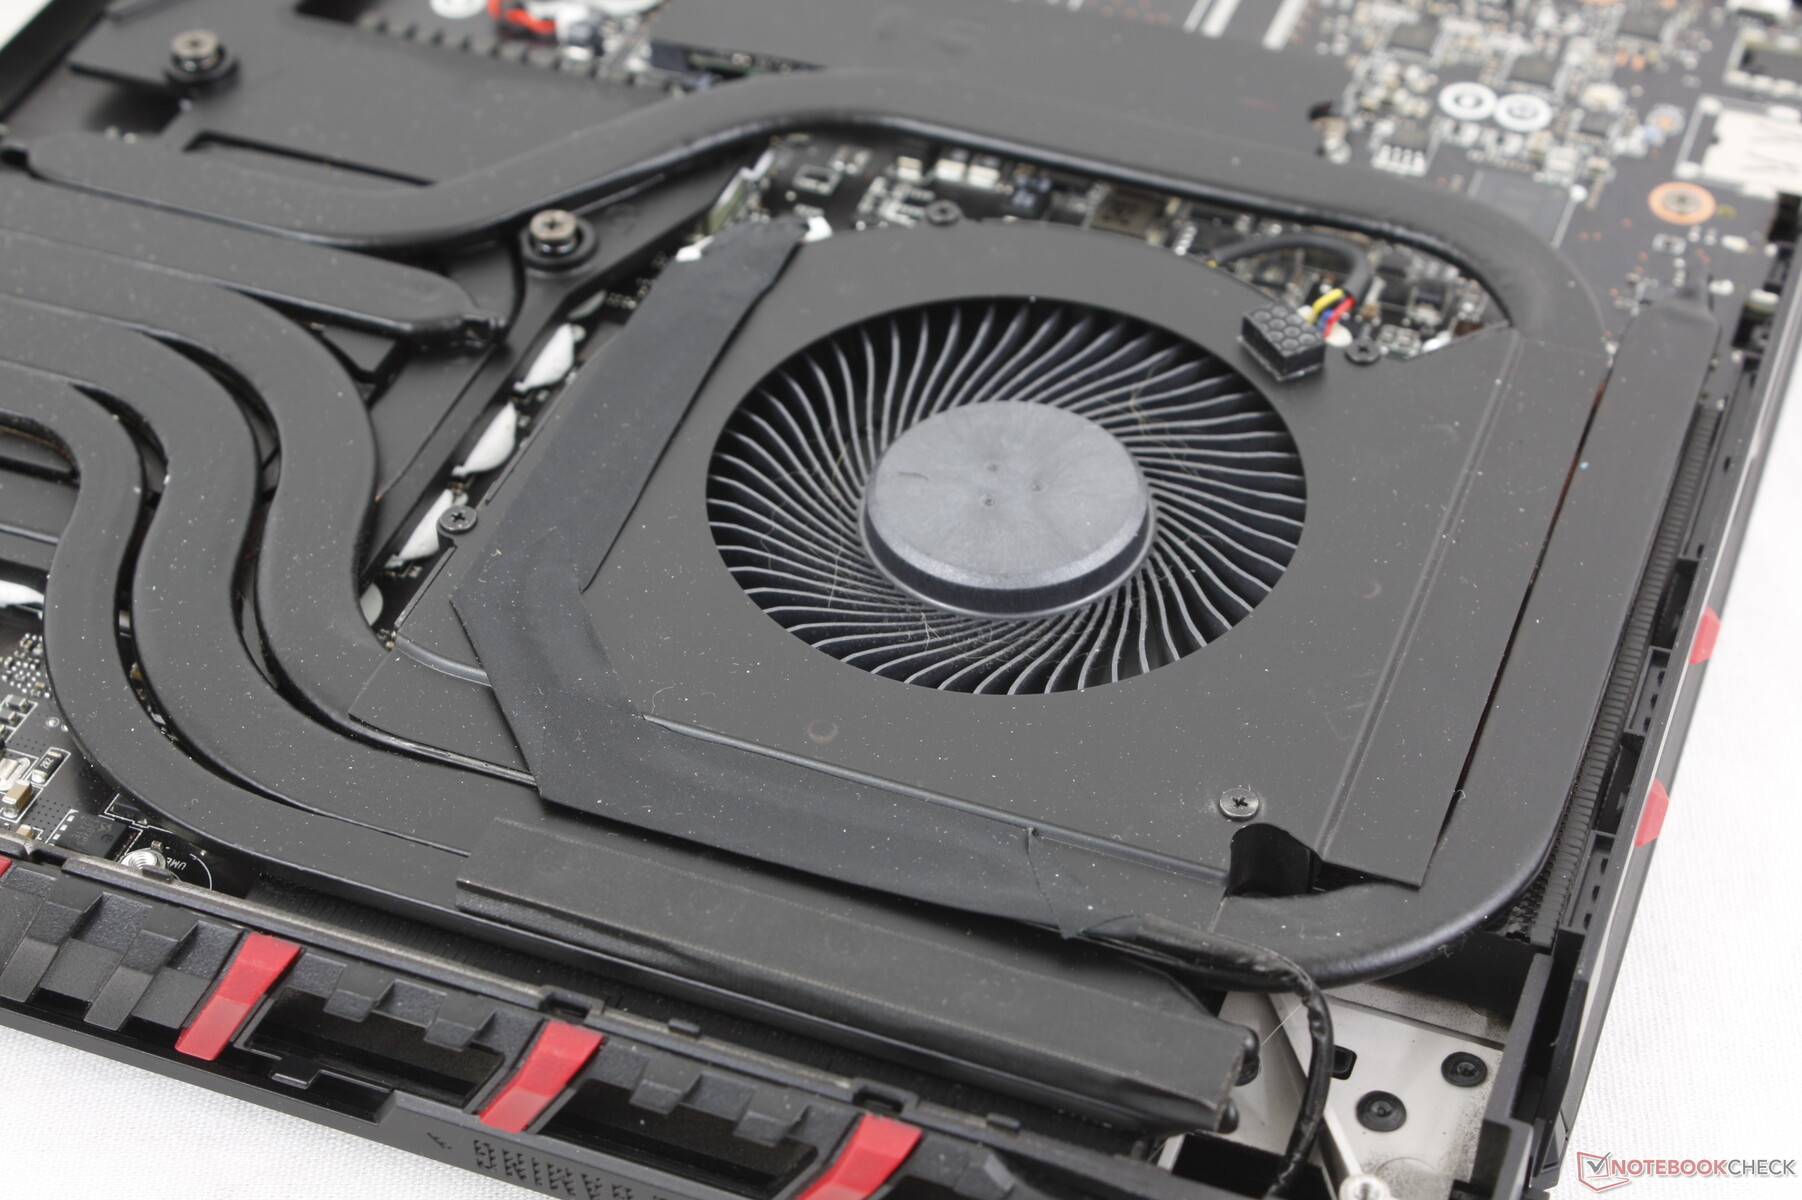
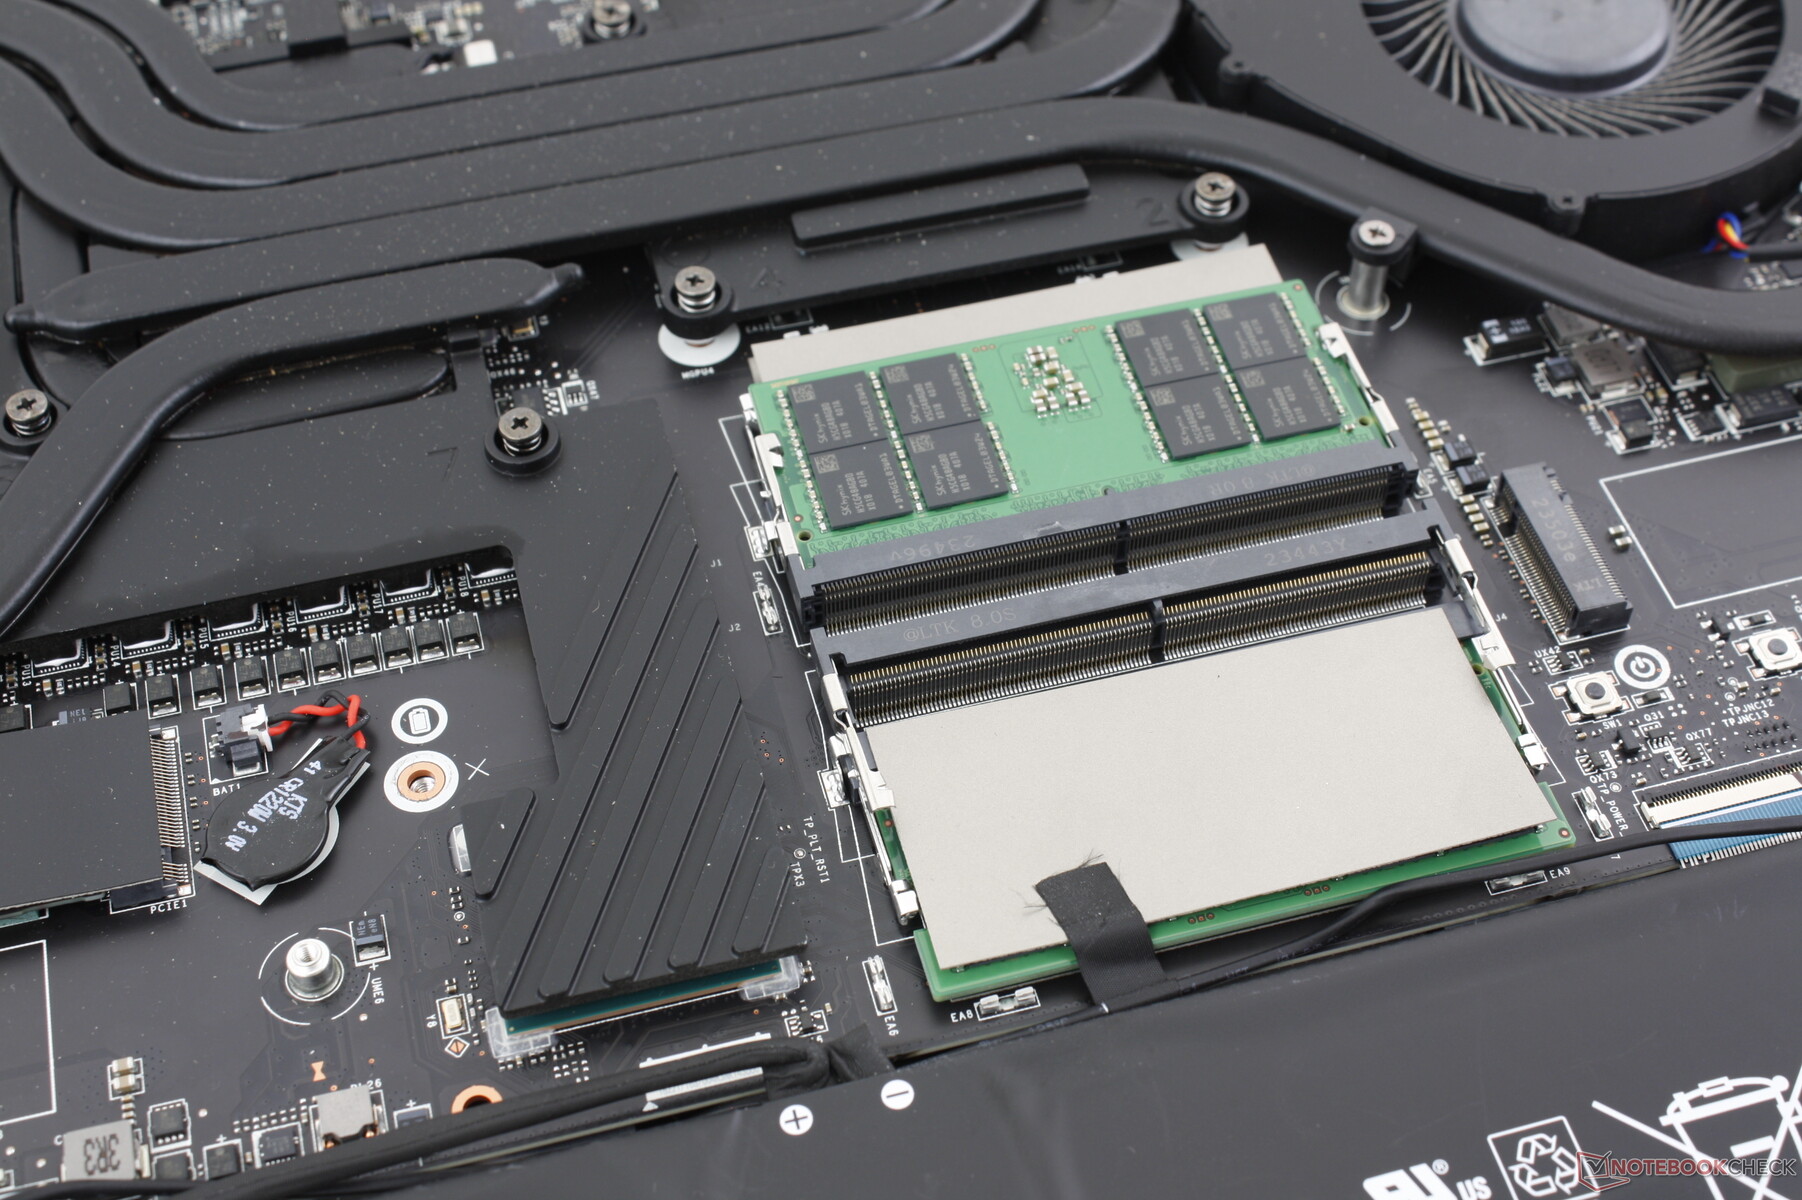
Raider 18 HX, Titan 18 HX ile aynı dahili bileşenlerin çoğunu paylaşıyor. Kullanıcılar iki M.2 2280 SSD yuvasına ve dört DDR5 SODIMM yuvasına erişebilir. Üçüncü M.2 SSD yuvasının bu modelden kaldırıldığını unutmayın; kullanıcıların böyle bir özellik için Titan 18 HX'e yükseltmeleri gerekir.

Sürdürülebilirlik
Ambalaj tamamen geri dönüştürülebilir ve neredeyse tamamı kartondan oluşuyor, sadece kullanım kılavuzu için biraz plastik ambalaj kullanılmış. Bununla birlikte, sistemin üretimi sırasında kullanılan geri dönüştürülmüş malzemelere ilişkin herhangi bir bilgi bulunmamaktadır.
Aksesuarlar ve Garanti
Kutuda AC adaptörü ve evraklar dışında ekstra bir şey yok. Eski Raider modelleri kadife bir temizleme beziyle birlikte gönderilirdi, ancak artık durum böyle değil gibi görünüyor.
ABD'de satın alındıysa olağan bir yıllık sınırlı üretici garantisi geçerlidir.
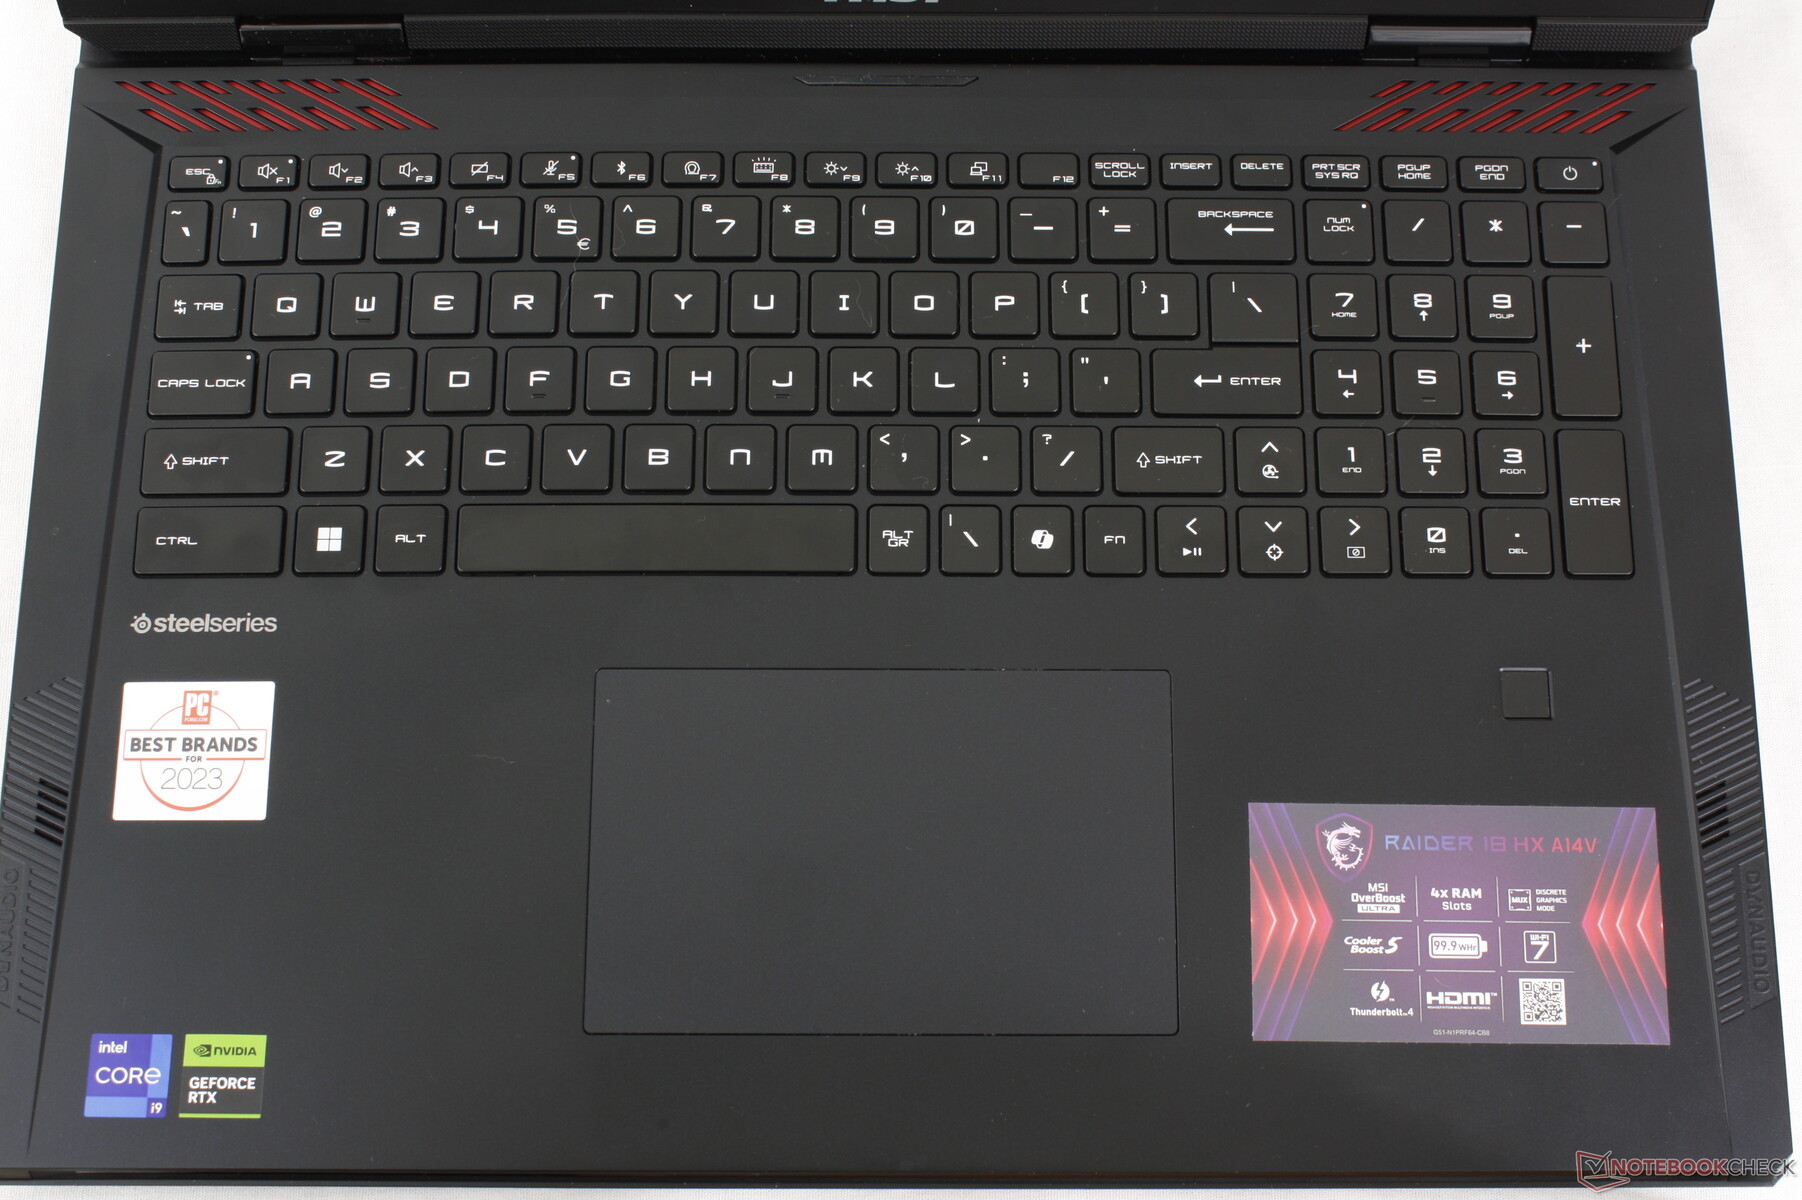
Giriş Aygıtları - Süslüden Çok Tanıdık
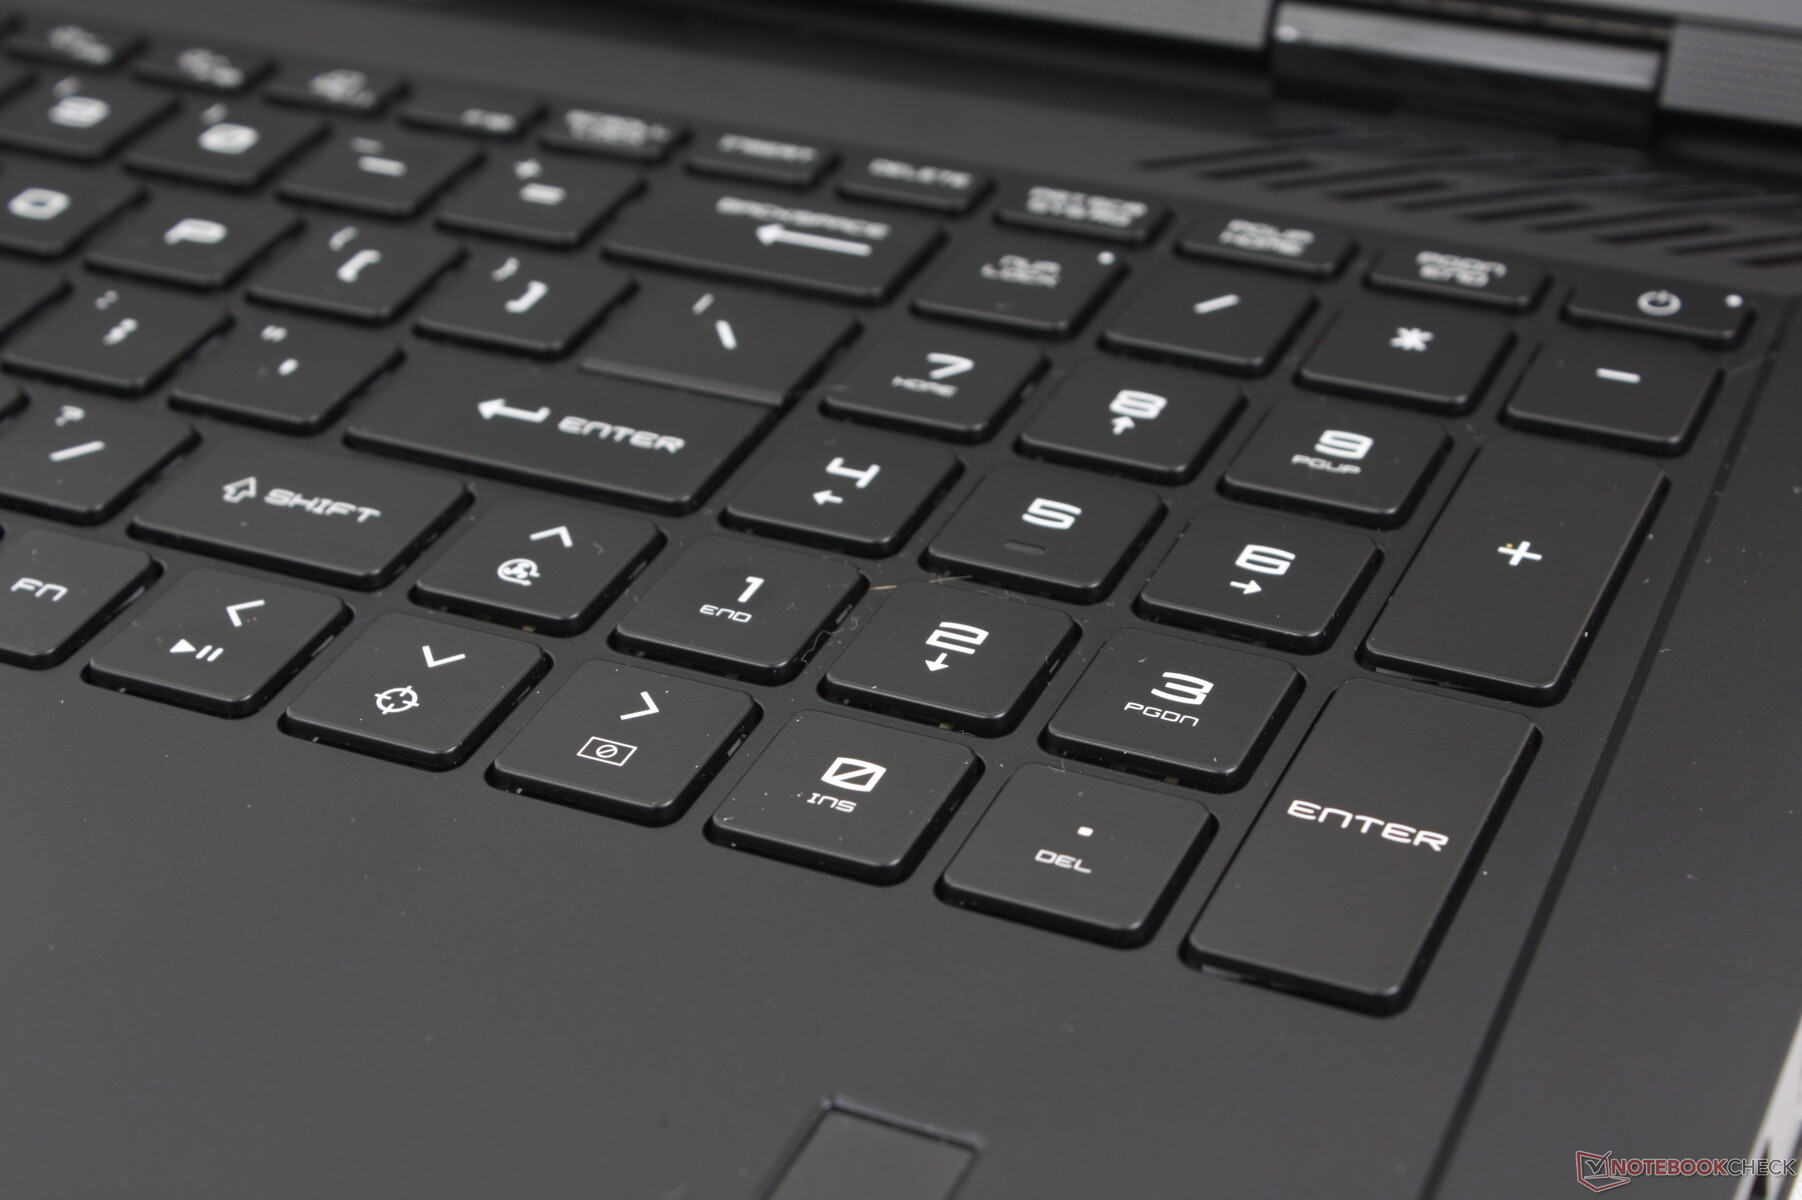
Klavye
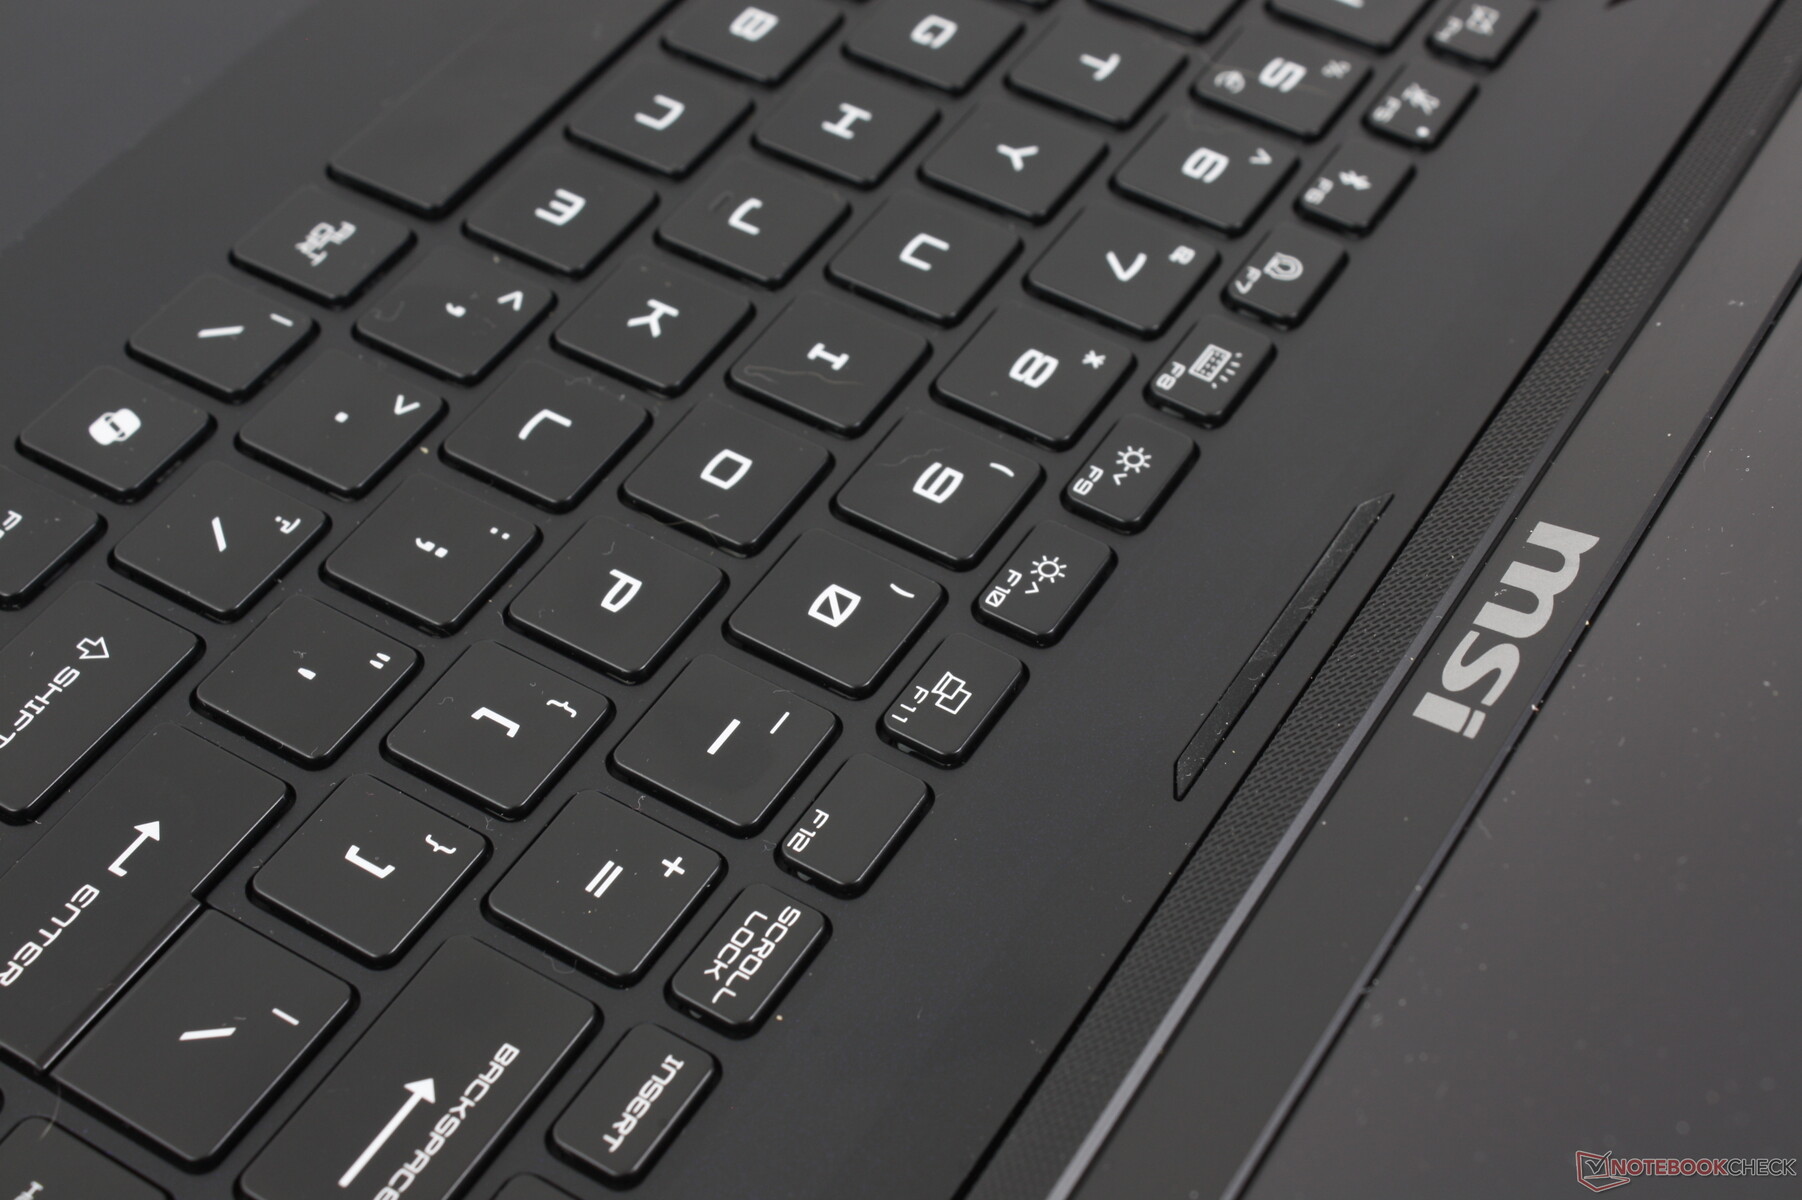
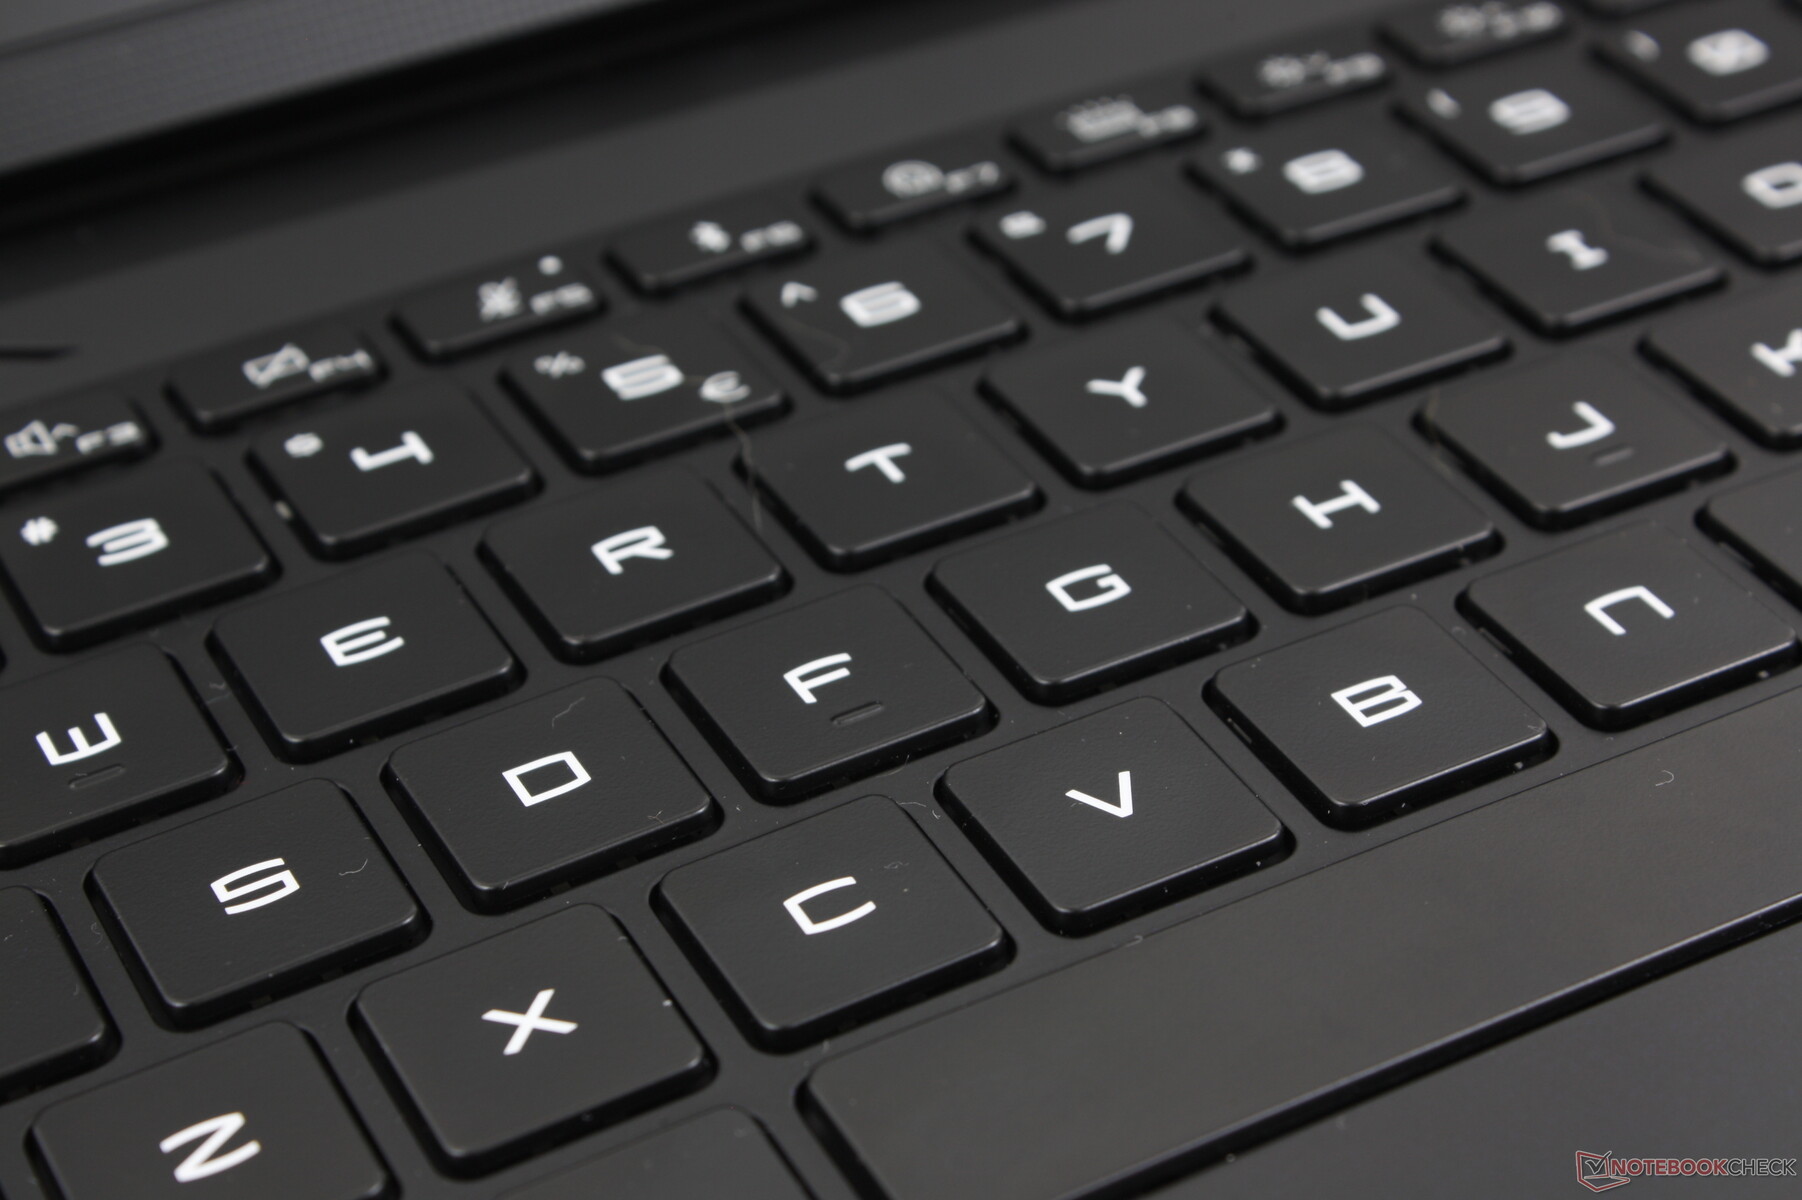
Klavye görsel olarak Titan 18 HX ile aynıdır ancak çok önemli bir fark vardır: Herhangi bir CherryMX mekanik seçeneğinin olmaması. Bu nedenle Raider 18 HX üzerinde yazı yazmak, Titan 18 HX gibi daha geleneksel dizüstü bilgisayar klavyelerinde yazı yazmaya daha yakındır MSI Stealth 16 veya eski nesil Raider modelleri. Geri bildirim, tıkırtı veya sertliğe yakın değildir, ancak daha yumuşak tıkırtı konferans salonları, sınıflar, kütüphaneler veya yurt odaları gibi ortamlar için tercih edilebilir.
Özellikle tam boyutlu numpad ve ok tuşlarını takdir ediyoruz çünkü bunlar genellikle diğer dizüstü bilgisayarların çoğundaki ana QWERTY tuşlarından daha dar ve daha küçüktür. Bu nedenle elektronik tablo çalışmaları Raider 18 HX üzerinde Blade 18 veya ROG Strix G18.
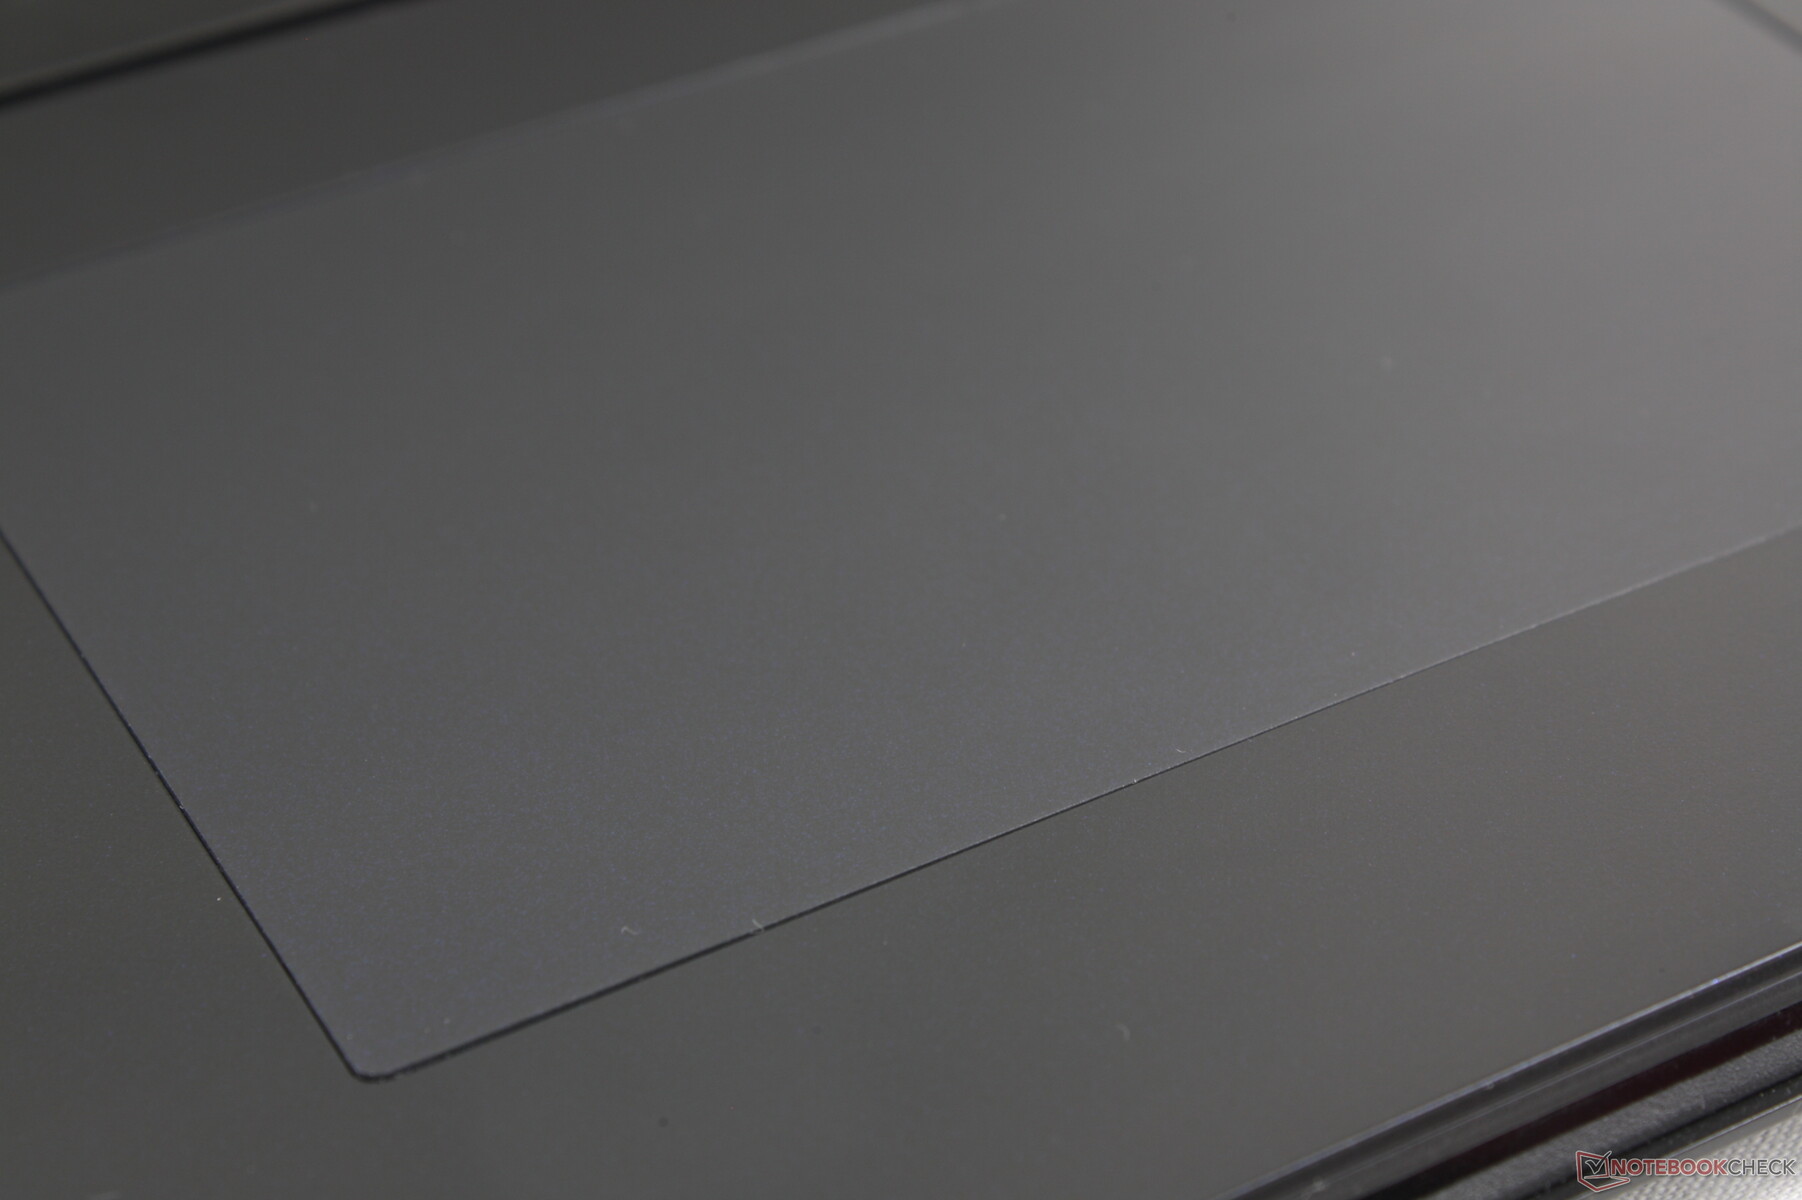
Dokunmatik yüzey
Titan 18 HX'teki süslü LED aydınlatmalı kenarsız clickpad'in aksine, Raider 18 HX daha tanıdık bir his için geleneksel bir clickpad kullanıyor. Boyut tamamen aynı (13 x 8,2 cm) ve yeni bir şey olmaya çalışmadığı veya ilk etapta olmayan bir sorunu düzeltmediği için kullanımı tartışmasız daha rahat. Çekiş gücü son derece akıcı ve doğruluk için daha düşük hızlarda biraz takılma oluyor.
Bir tıklama girmek için aşağı bastırmak ne yazık ki hala tatmin edici olmayan bir geri bildirimle sığ ve yumuşak. Daha güçlü ve sıkı bir tıklama tercih edilebilirdi, hatta klavye bölümü oldukça geniş olduğu için özel fare tuşlarının geri dönüşü de olabilirdi.
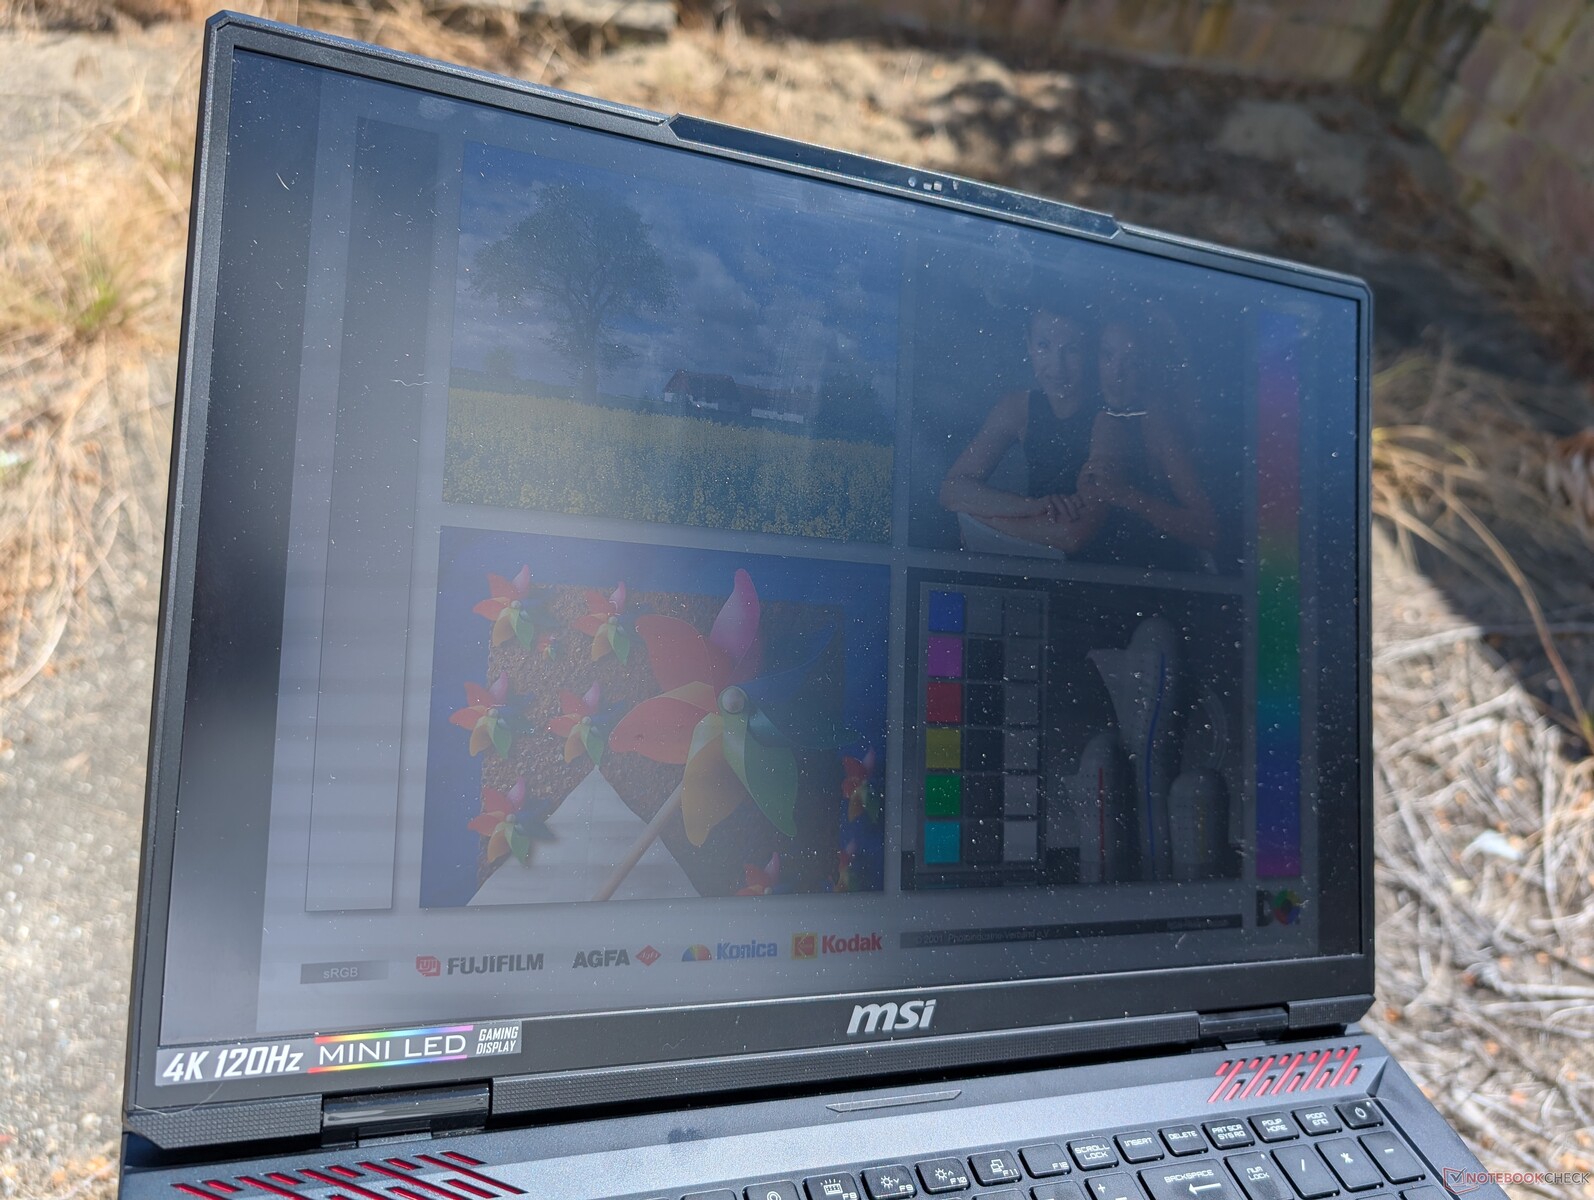
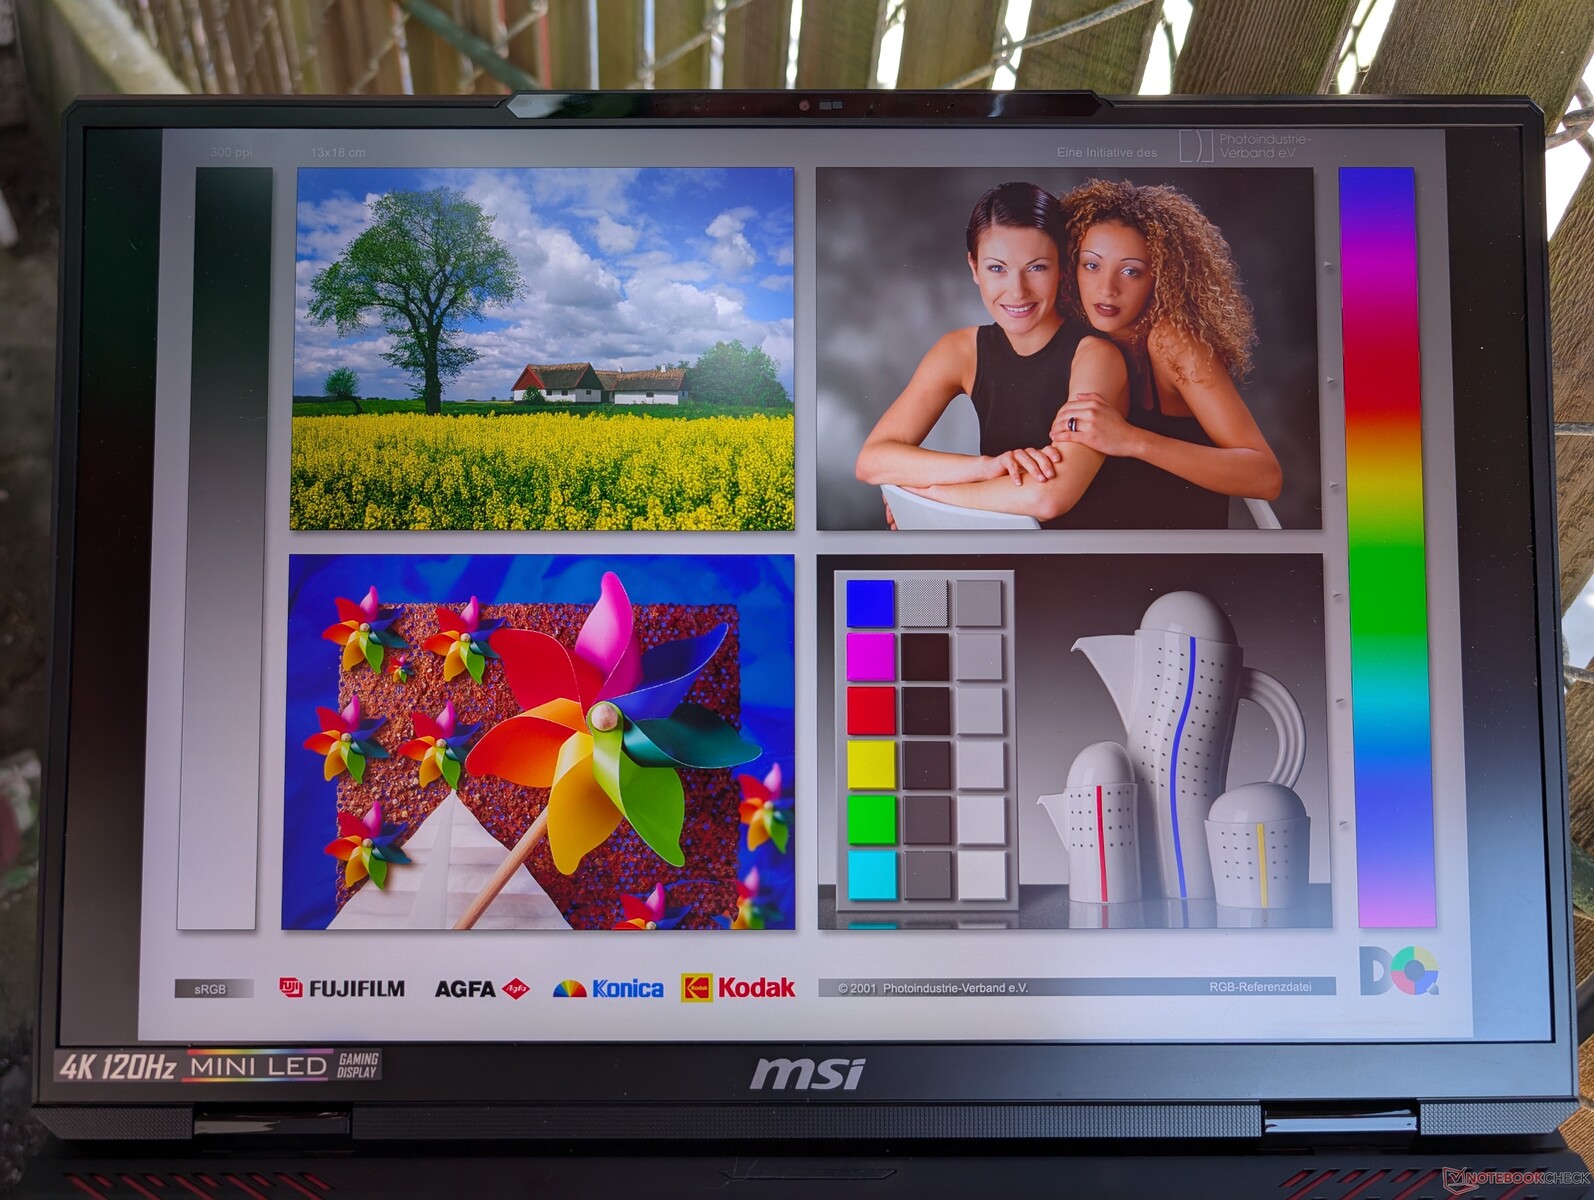
Ekran - Titan 18 HX Deneyimini Daha Ucuza Yaşayın
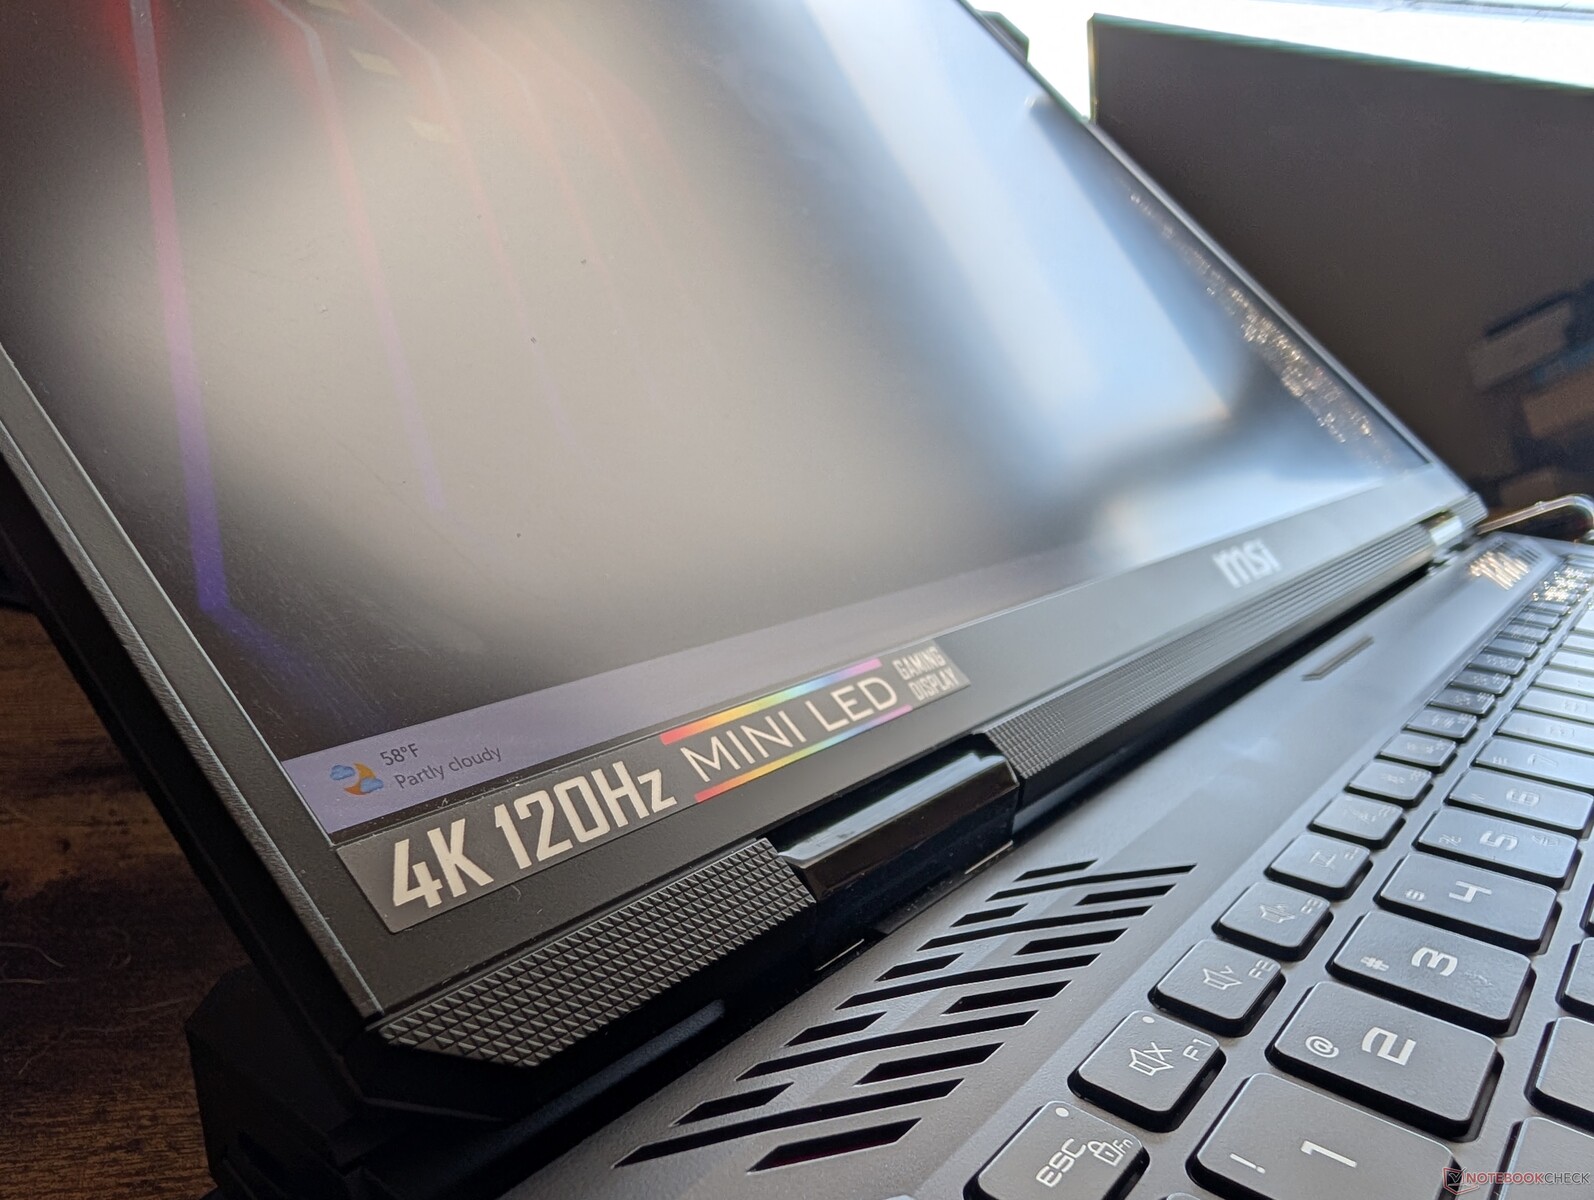
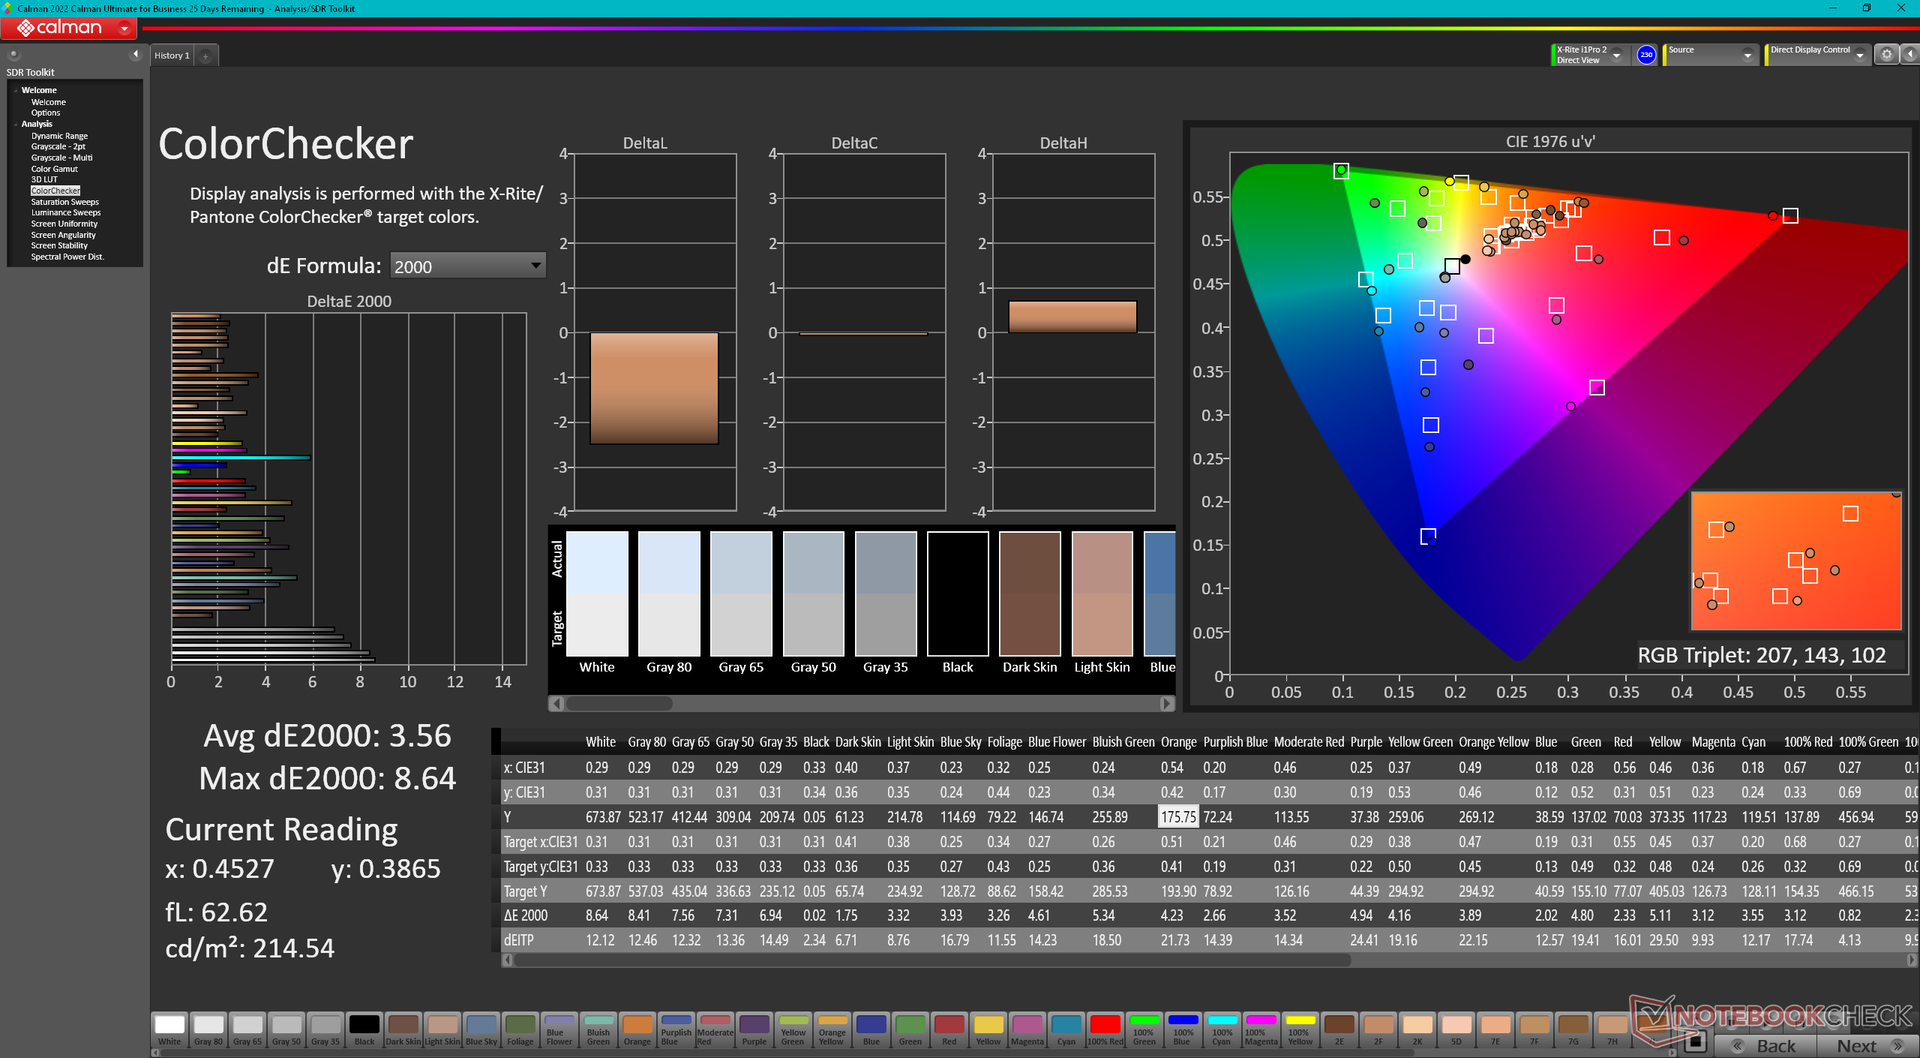
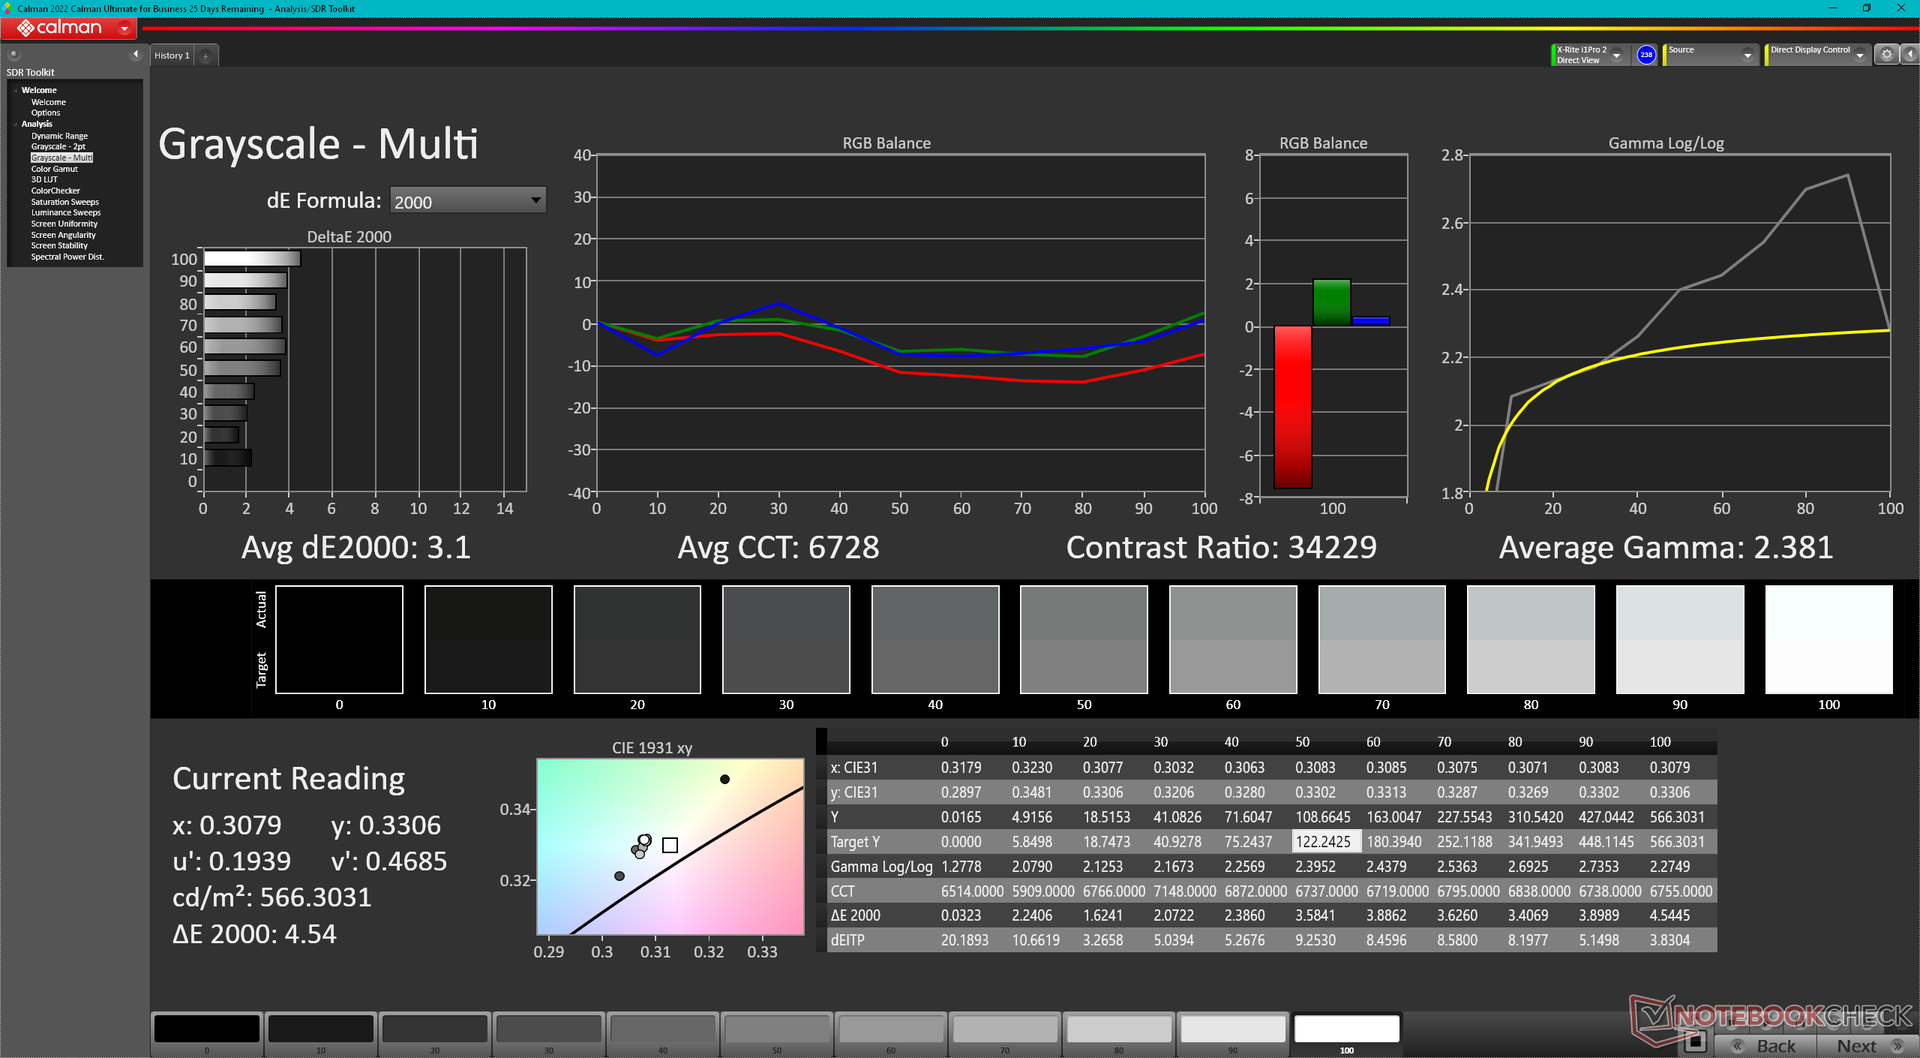
Raider 18 HX, neredeyse aynı görüntüleme deneyimi için Titan 18 HX'te bulunan AU Optronics B180ZAN01.0 120 Hz mini LED panel ile birlikte gelir. Maksimum parlaklık, HDR kapalıyken yaklaşık 600 nit veya HDR açıkken 935 nit'e ulaşıyor. IPS veya OLED ile karşılaştırıldığında mini-LED, daha yüksek güç tüketimi pahasına her ikisinden de daha yüksek parlaklık seviyelerine ulaşabildiğinden daha iyi bir HDR görüntüleme deneyimi sağlar. IPS veya OLED dizüstü bilgisayarlar genellikle en iyi ihtimalle HDR600'ü desteklerken mini-LED paneller genellikle HDR1000 vaat eder.
| |||||||||||||||||||||||||
Aydınlatma: 94 %
Batarya modunda parlaklık: 392.2 cd/m²
Kontrast: ∞:1 (Siyah: 0 cd/m²)
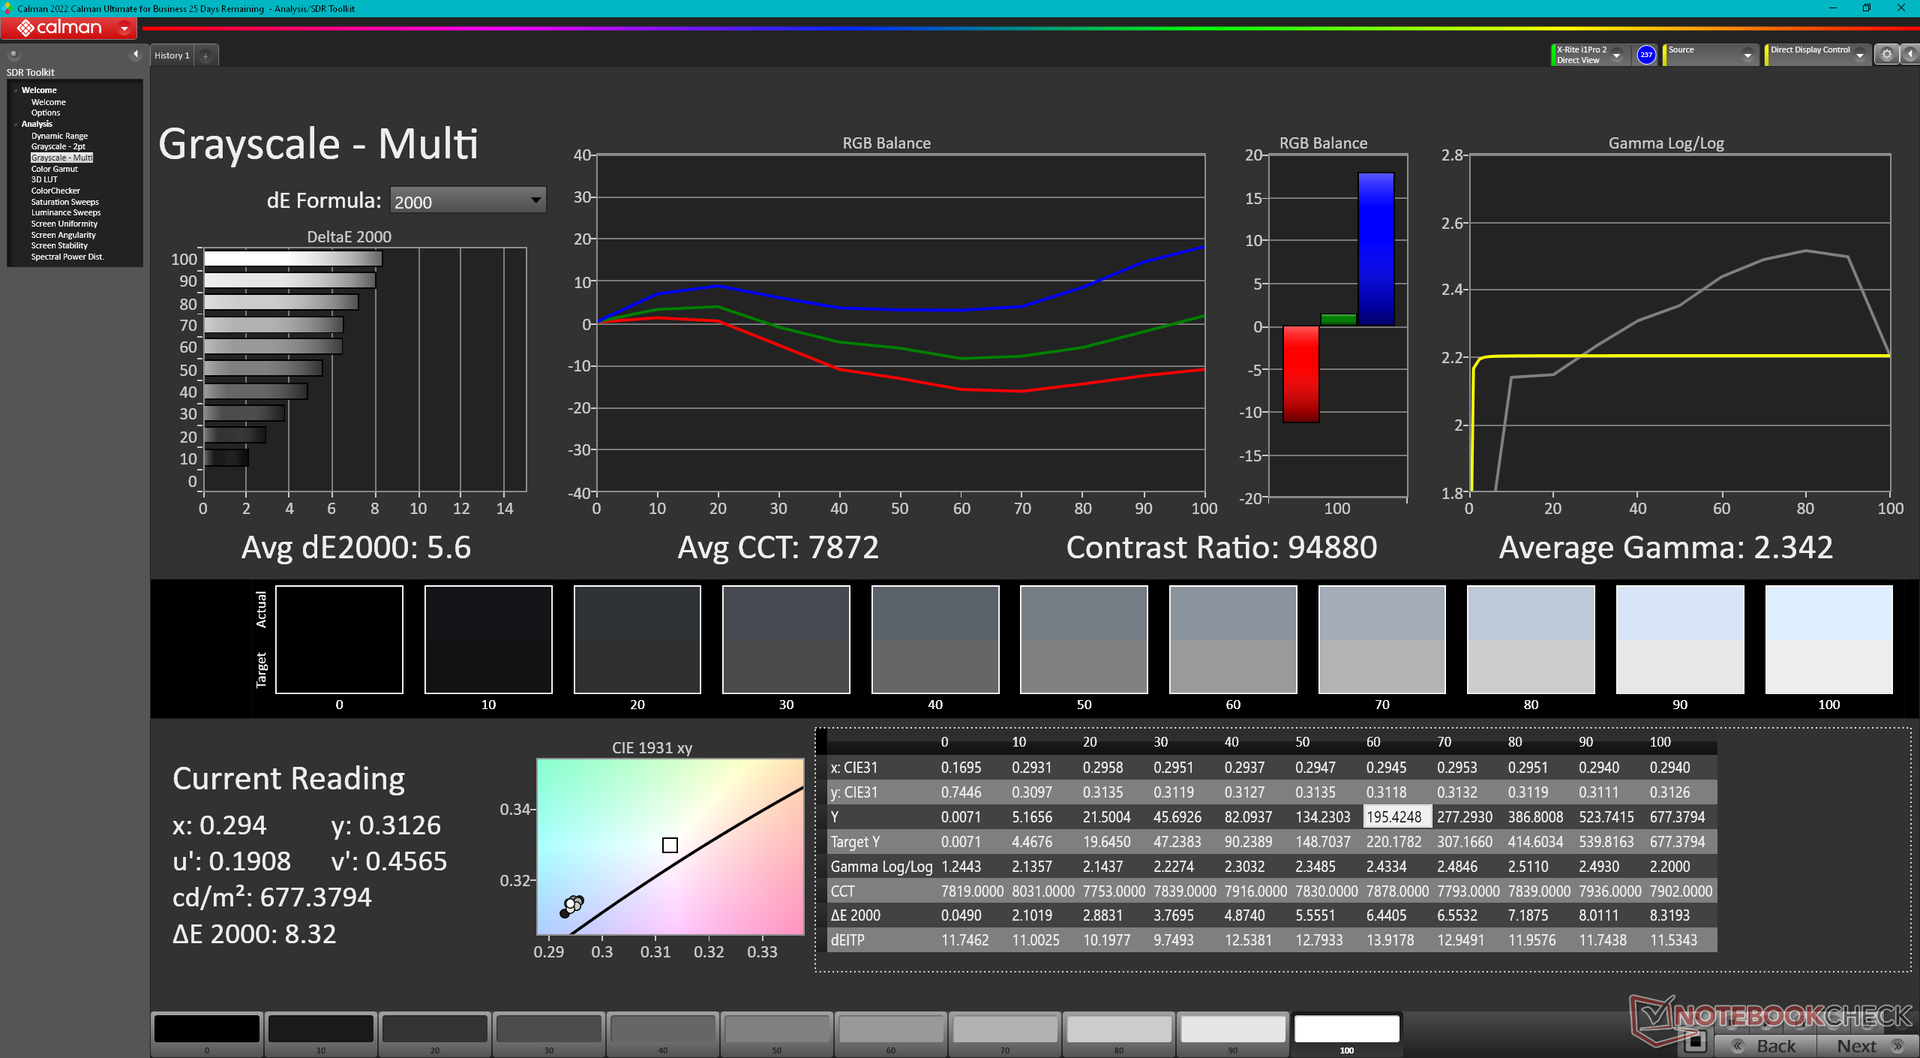
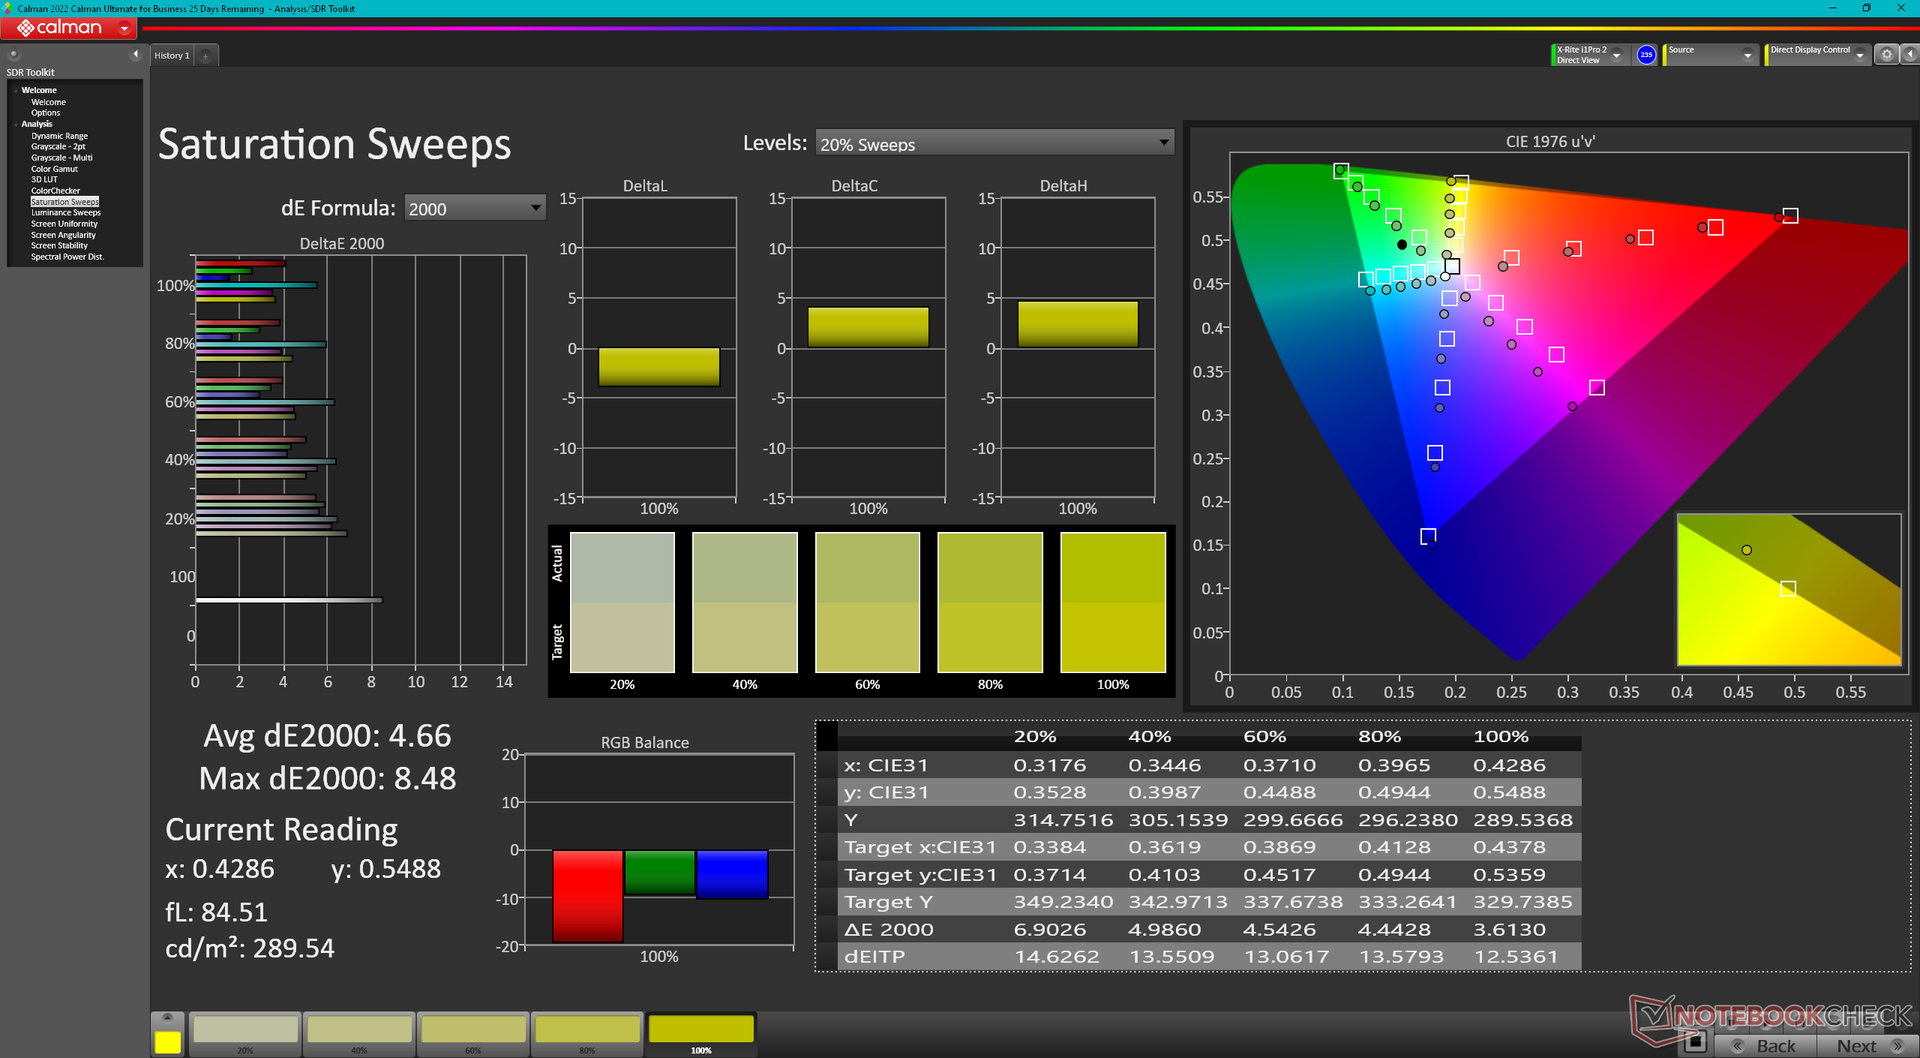
ΔE Color 3.56 | 0.5-29.43 Ø4.87, calibrated: 2.69
ΔE Greyscale 5.6 | 0.5-98 Ø5.1
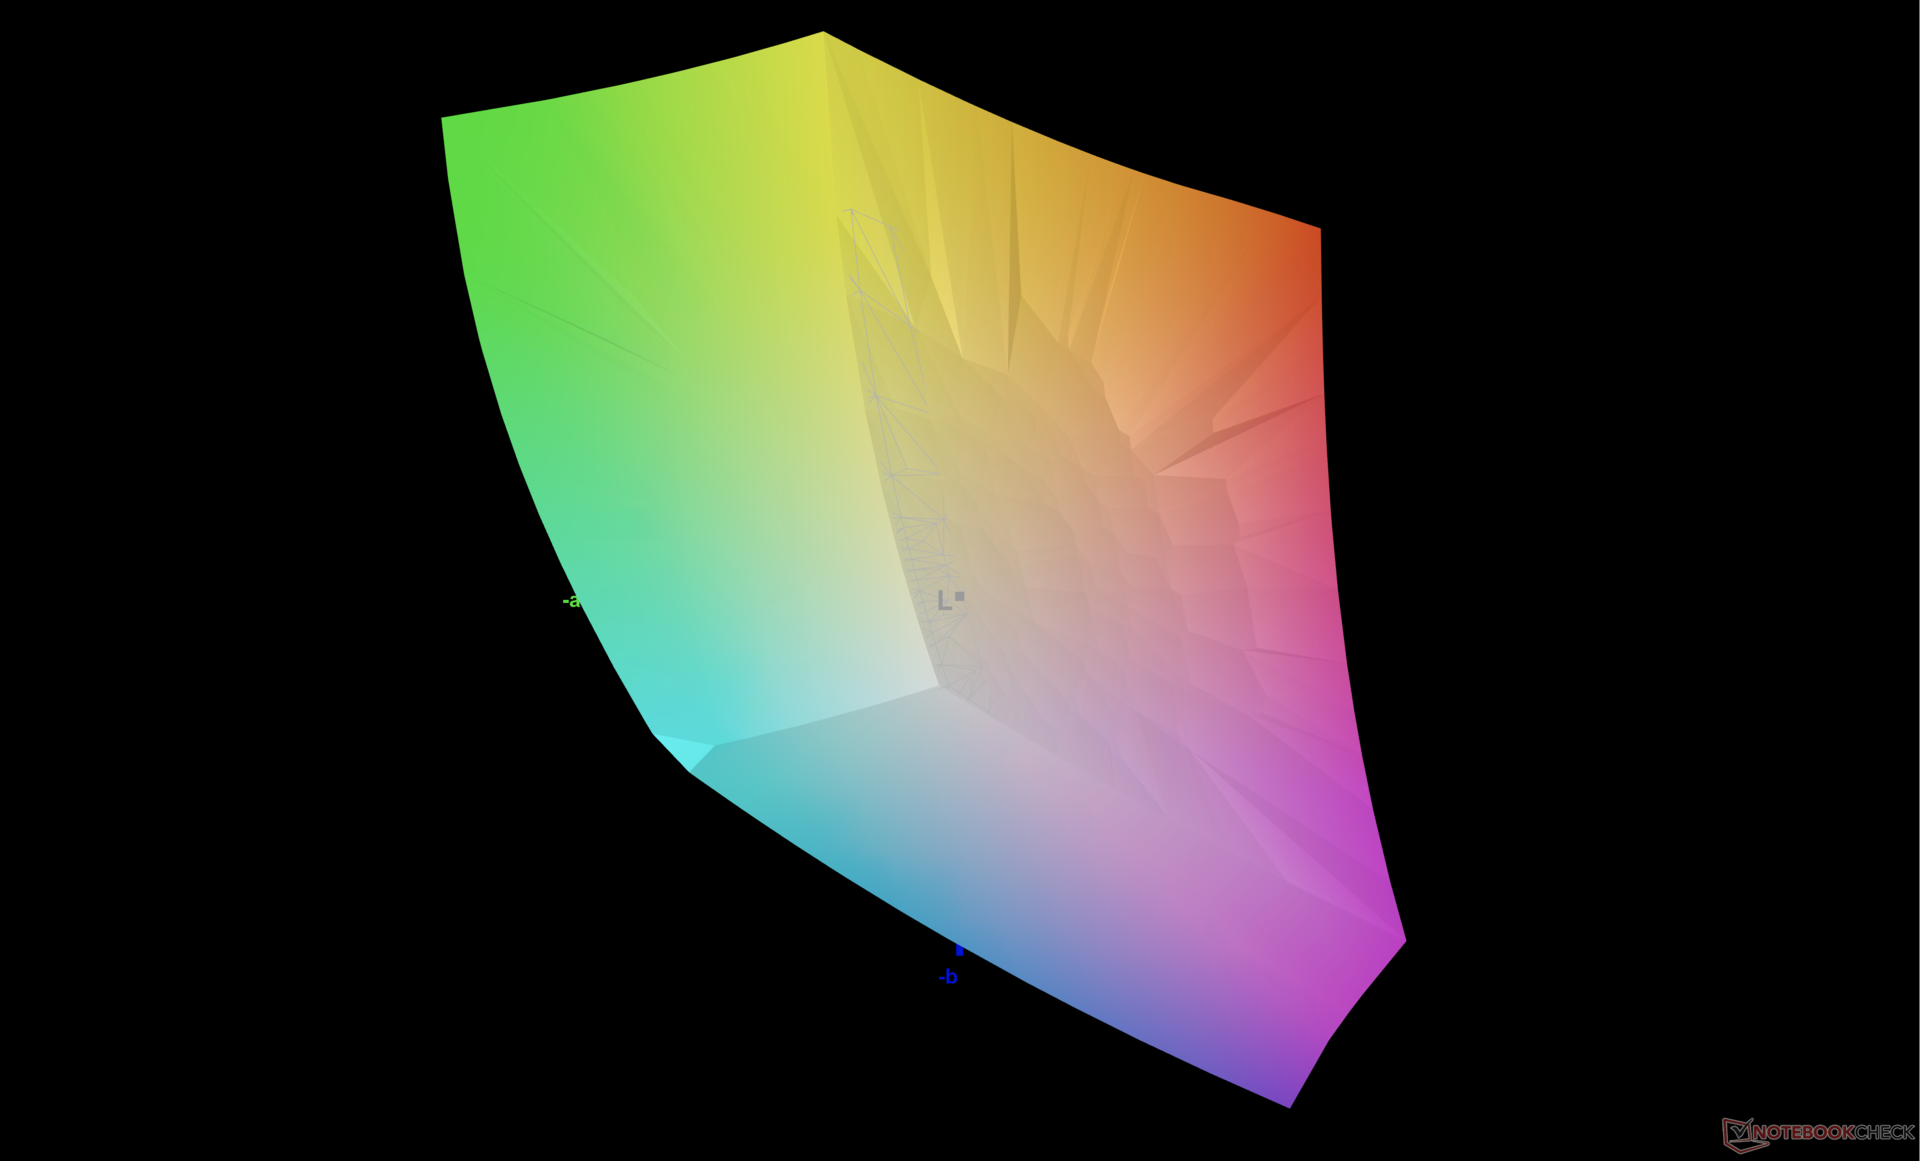
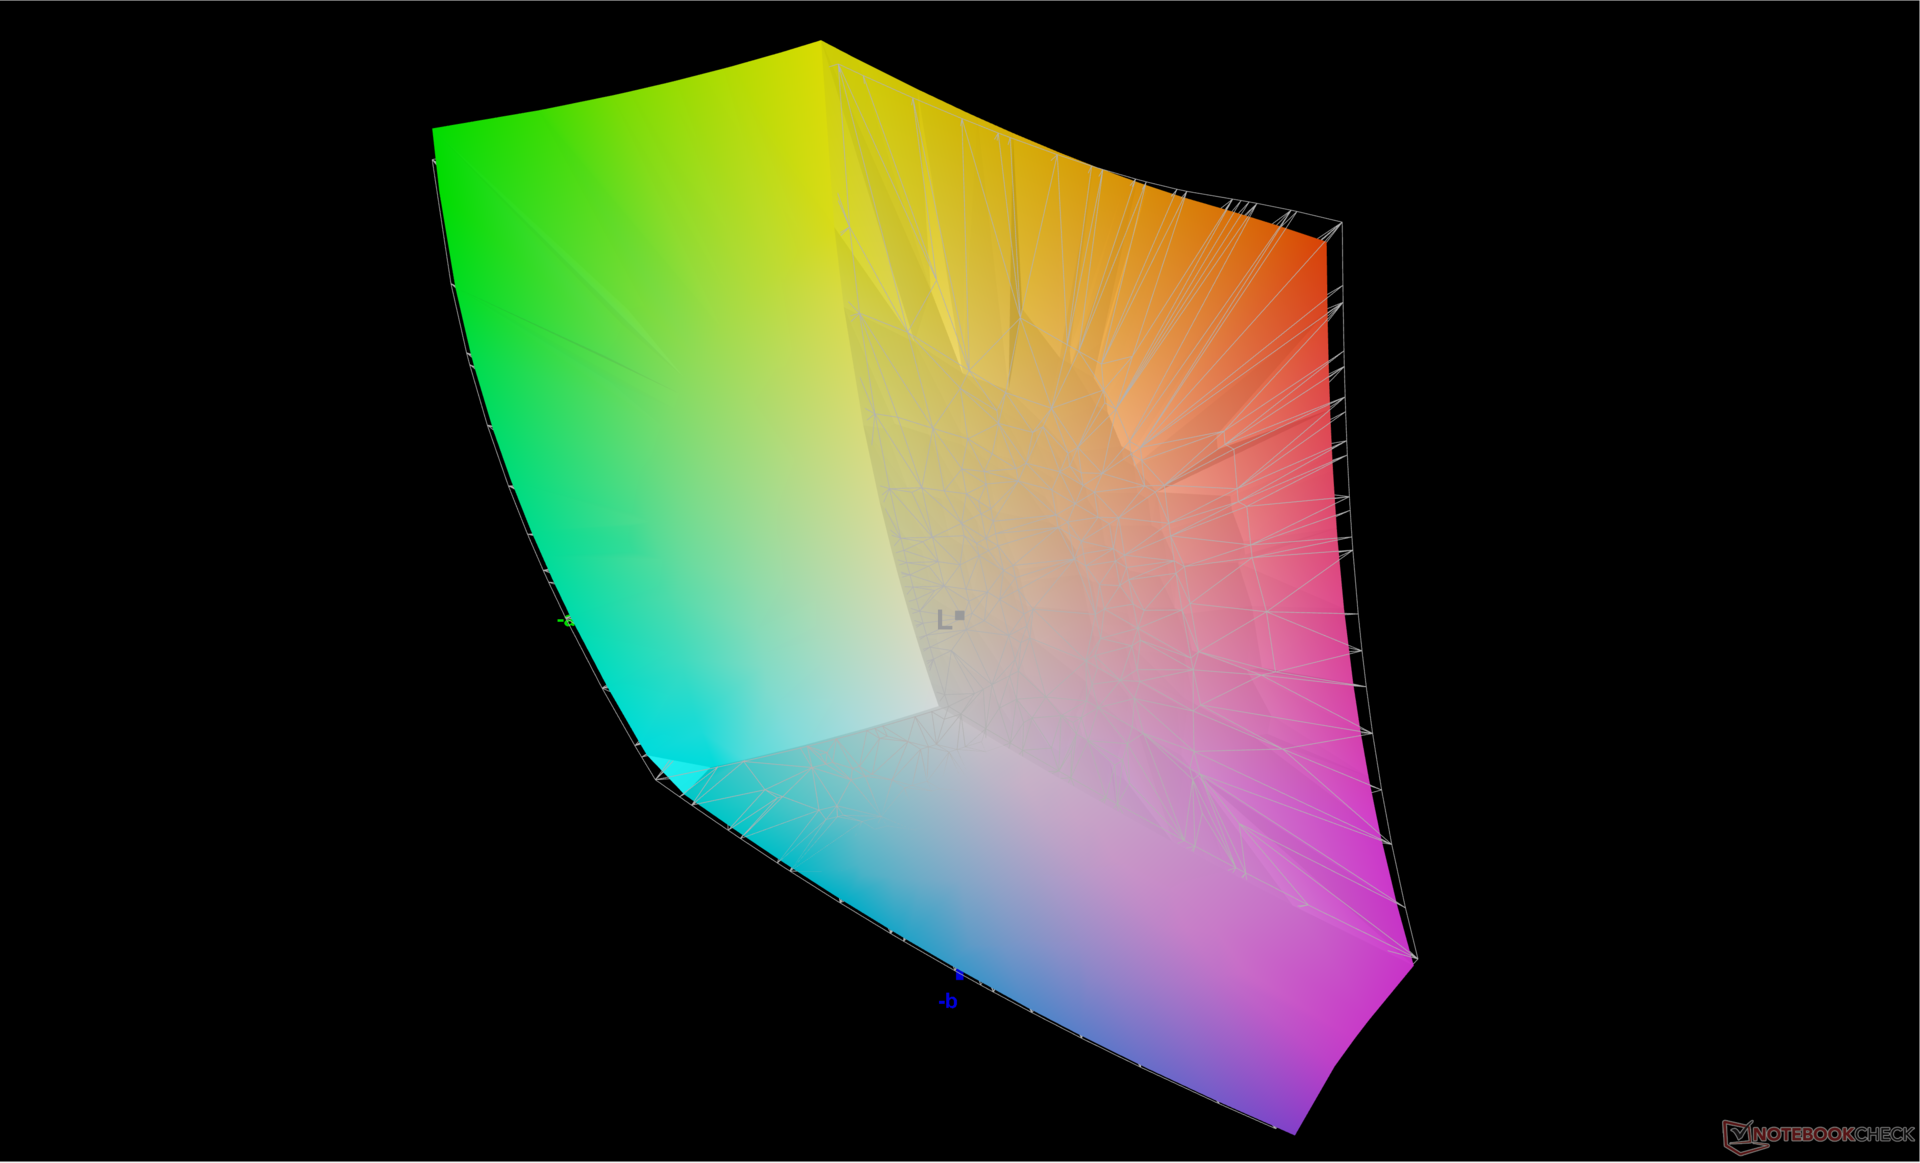
84.8% AdobeRGB 1998 (Argyll 2.2.0 3D)
99.9% sRGB (Argyll 2.2.0 3D)
96.6% Display P3 (Argyll 2.2.0 3D)
Gamma: 2.34
| MSI Raider 18 HX A14V AU Optronics B180ZAN1.0, Mini-LED, 3840x2400, 18", 120 Hz | Razer Blade 18 2024 RZ09-0509 BOE NE180QDM-NM1, Mini-LED, 2560x1600, 18", 300 Hz | Alienware m18 R2 BOE NE18NZ1, IPS, 2560x1600, 18", 165 Hz | MSI Titan 18 HX A14VIG AU Optronics B180ZAN01.0, Mini-LED, 3840x2400, 18", 120 Hz | Asus ROG Strix G18 G814JI NE180QDM-NZ2 (BOE0B35), IPS, 2560x1600, 18", 240 Hz | Acer Predator Helios 18 PH18-72-98MW B180QAN01.2 (AUO45A8), Mini-LED, 2560x1600, 18", 250 Hz | |
|---|---|---|---|---|---|---|
| Display | 1% | 2% | 1% | 1% | 4% | |
| Display P3 Coverage | 96.6 | 99 2% | 97.8 1% | 98.1 2% | 98.1 2% | 99.7 3% |
| sRGB Coverage | 99.9 | 100 0% | 99.5 0% | 99.8 0% | 99.9 0% | 100 0% |
| AdobeRGB 1998 Coverage | 84.8 | 86.9 2% | 88.9 5% | 86.2 2% | 85.6 1% | 91.6 8% |
| Response Times | 341% | 68% | 3% | 67% | 62% | |
| Response Time Grey 50% / Grey 80% * | 10.4 ? | 7.6 ? 27% | 5.3 ? 49% | 8.6 ? 17% | 5.6 ? 46% | 8 ? 23% |
| Response Time Black / White * | 75.8 ? | 14 ? 82% | 10.4 ? 86% | 81.8 ? -8% | 9 ? 88% | 17.6 ? 77% |
| PWM Frequency | 2606.2 ? | 26444 ? 915% | 2592 ? -1% | 4832 ? 85% | ||
| Screen | 29% | 8% | 2% | 23% | 24% | |
| Brightness middle | 575.7 | 605.4 5% | 271.8 -53% | 467.5 -19% | 471 -18% | 722 25% |
| Brightness | 574 | 600 5% | 275 -52% | 459 -20% | 422 -26% | 724 26% |
| Brightness Distribution | 94 | 97 3% | 78 -17% | 90 -4% | 83 -12% | 93 -1% |
| Black Level * | 0.62 | 0.27 | 0.47 | 0.04 | ||
| Colorchecker dE 2000 * | 3.56 | 1.53 57% | 2.48 30% | 3.77 -6% | 2.05 42% | 3.4 4% |
| Colorchecker dE 2000 max. * | 8.64 | 4.15 52% | 5.59 35% | 6.12 29% | 4.15 52% | 5.32 38% |
| Colorchecker dE 2000 calibrated * | 2.69 | 0.56 79% | 2.94 -9% | 0.8 70% | 1.6 41% | |
| Greyscale dE 2000 * | 5.6 | 2.6 54% | 3.7 34% | 3.2 43% | 2.8 50% | 3.8 32% |
| Gamma | 2.34 94% | 2.22 99% | 2.2 100% | 2.43 91% | 2.204 100% | 2.383 92% |
| CCT | 7872 83% | 6843 95% | 6355 102% | 6478 100% | 7122 91% | 7051 92% |
| Contrast | 976 | 1007 | 1002 | 18050 | ||
| Toplam Ortalama (Program / Ayarlar) | 124% /
100% | 26% /
16% | 2% /
2% | 30% /
25% | 30% /
28% |
* ... daha küçük daha iyidir
Ekran P3 ve HDR kapalı olarak ayarlandığında renk sıcaklığı 7872'de oldukça soğuktur. HDR'nin etkinleştirilmesi MSI TrueColor ayarlarını otomatik olarak devre dışı bırakır, ancak renk sıcaklığı da daha doğru renkler için 6521'de otomatik olarak daha sıcak hale gelir. MSI, bu Raider modeli için fabrika kalibrasyonunun reklamını yapmıyor.
Yanıt Sürelerini Görüntüle
| ↔ Tepki Süresi Siyahtan Beyaza | ||
|---|---|---|
| 75.8 ms ... yükseliş ↗ ve sonbahar↘ birleşimi | ↗ 71 ms yükseliş |  |
| ↘ 4.8 ms sonbahar | ||
| Ekran, testlerimizde yavaş yanıt oranları gösteriyor ve oyuncular için yetersiz olacaktır. Karşılaştırıldığında, test edilen tüm cihazlar 0.1 (minimum) ile 240 (maksimum) ms arasında değişir. » Tüm cihazların 100 %'si daha iyi. Bu, ölçülen yanıt süresinin test edilen tüm cihazların ortalamasından (20.8 ms) daha kötü olduğu anlamına gelir. | ||
| ↔ Tepki Süresi %50 Griden %80 Griye | ||
| 10.4 ms ... yükseliş ↗ ve sonbahar↘ birleşimi | ↗ 4.8 ms yükseliş | 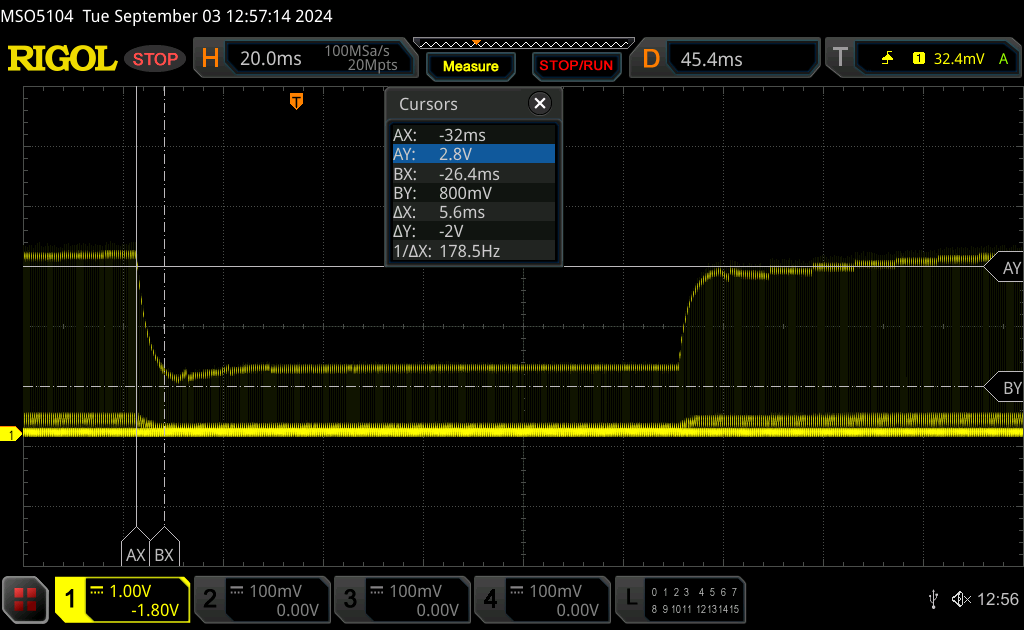 |
| ↘ 5.6 ms sonbahar | ||
| Ekran, testlerimizde iyi yanıt oranları gösteriyor ancak rekabetçi oyuncular için çok yavaş olabilir. Karşılaştırıldığında, test edilen tüm cihazlar 0.165 (minimum) ile 636 (maksimum) ms arasında değişir. » Tüm cihazların 21 %'si daha iyi. Bu, ölçülen yanıt süresinin test edilen tüm cihazların ortalamasından (32.5 ms) daha iyi olduğu anlamına gelir. | ||
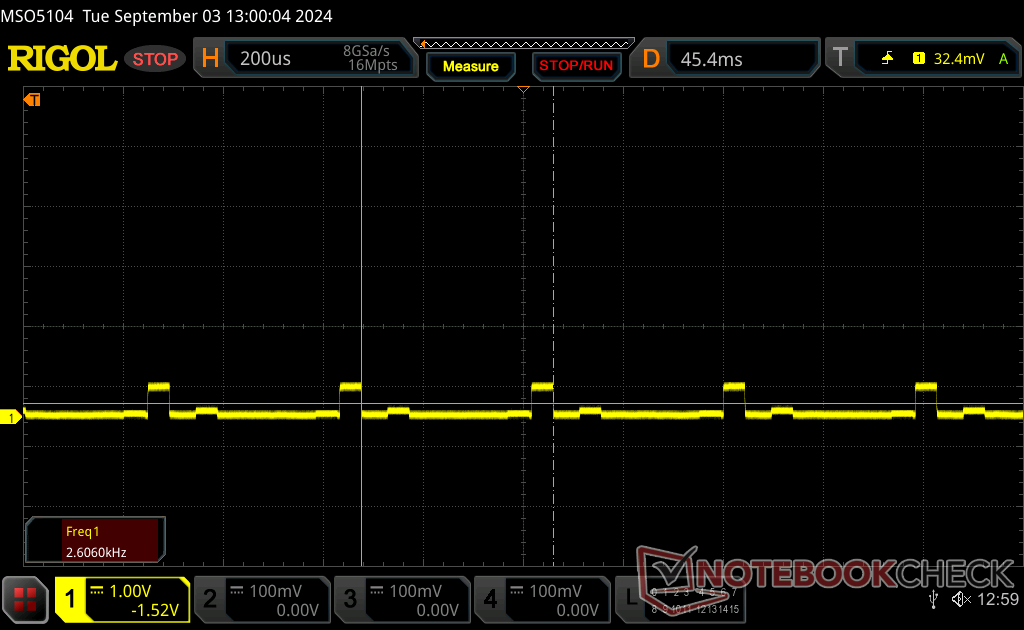
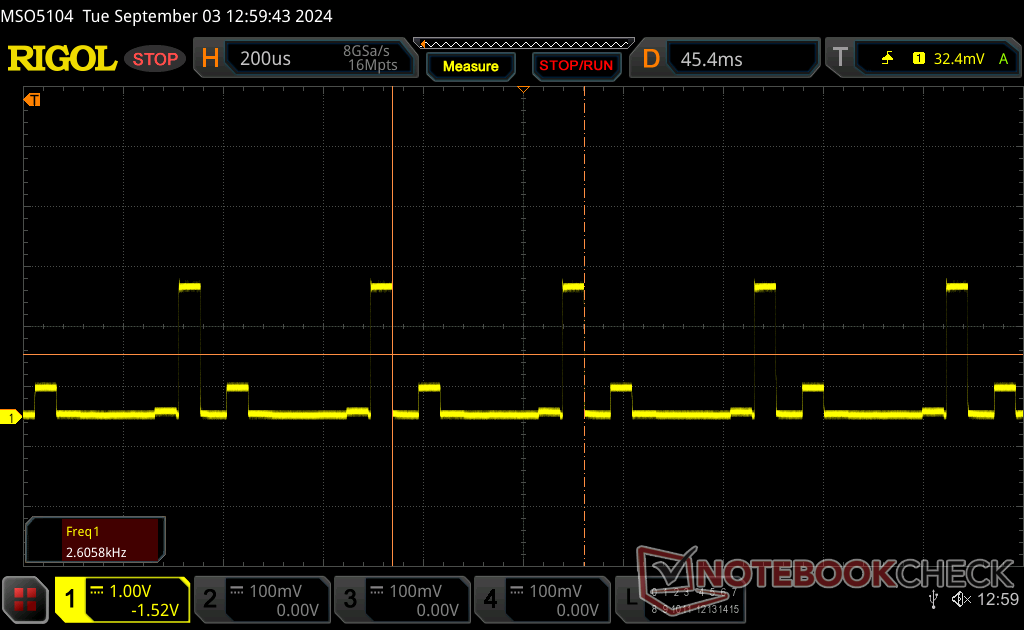
Ekran Titremesi / PWM (Darbe Genişliği Modülasyonu)
| Ekran titriyor / PWM algılandı | 2606.2 Hz Amplitude: 90 % | ≤ 100 % parlaklık ayarı | 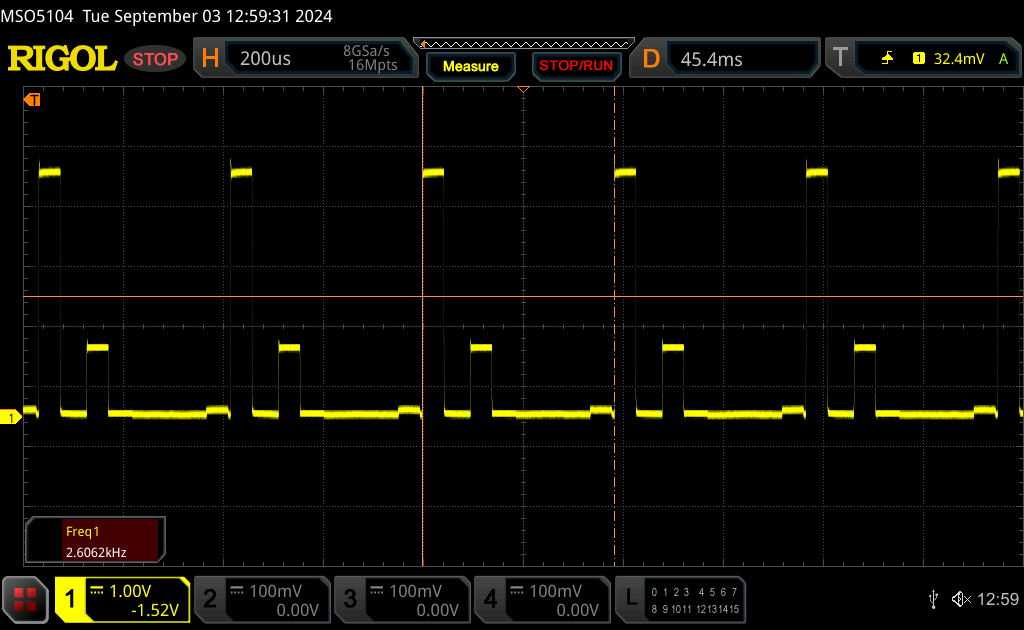 |
Ekran arka ışığı 2606.2 Hz'de titriyor (en kötü durum, örneğin PWM kullanılması) 100 % ve altındaki parlaklık ayarında titreme algılandı. Bu parlaklık ayarının üzerinde titreme veya PWM olmamalıdır. 2606.2 Hz frekansı oldukça yüksektir, bu nedenle PWM'ye duyarlı çoğu kullanıcı herhangi bir titremeyi fark etmemelidir. Karşılaştırıldığında: Test edilen tüm cihazların %53 %'si ekranı karartmak için PWM kullanmıyor. PWM tespit edilirse, ortalama 8516 (minimum: 5 - maksimum: 343500) Hz ölçüldü. | |||


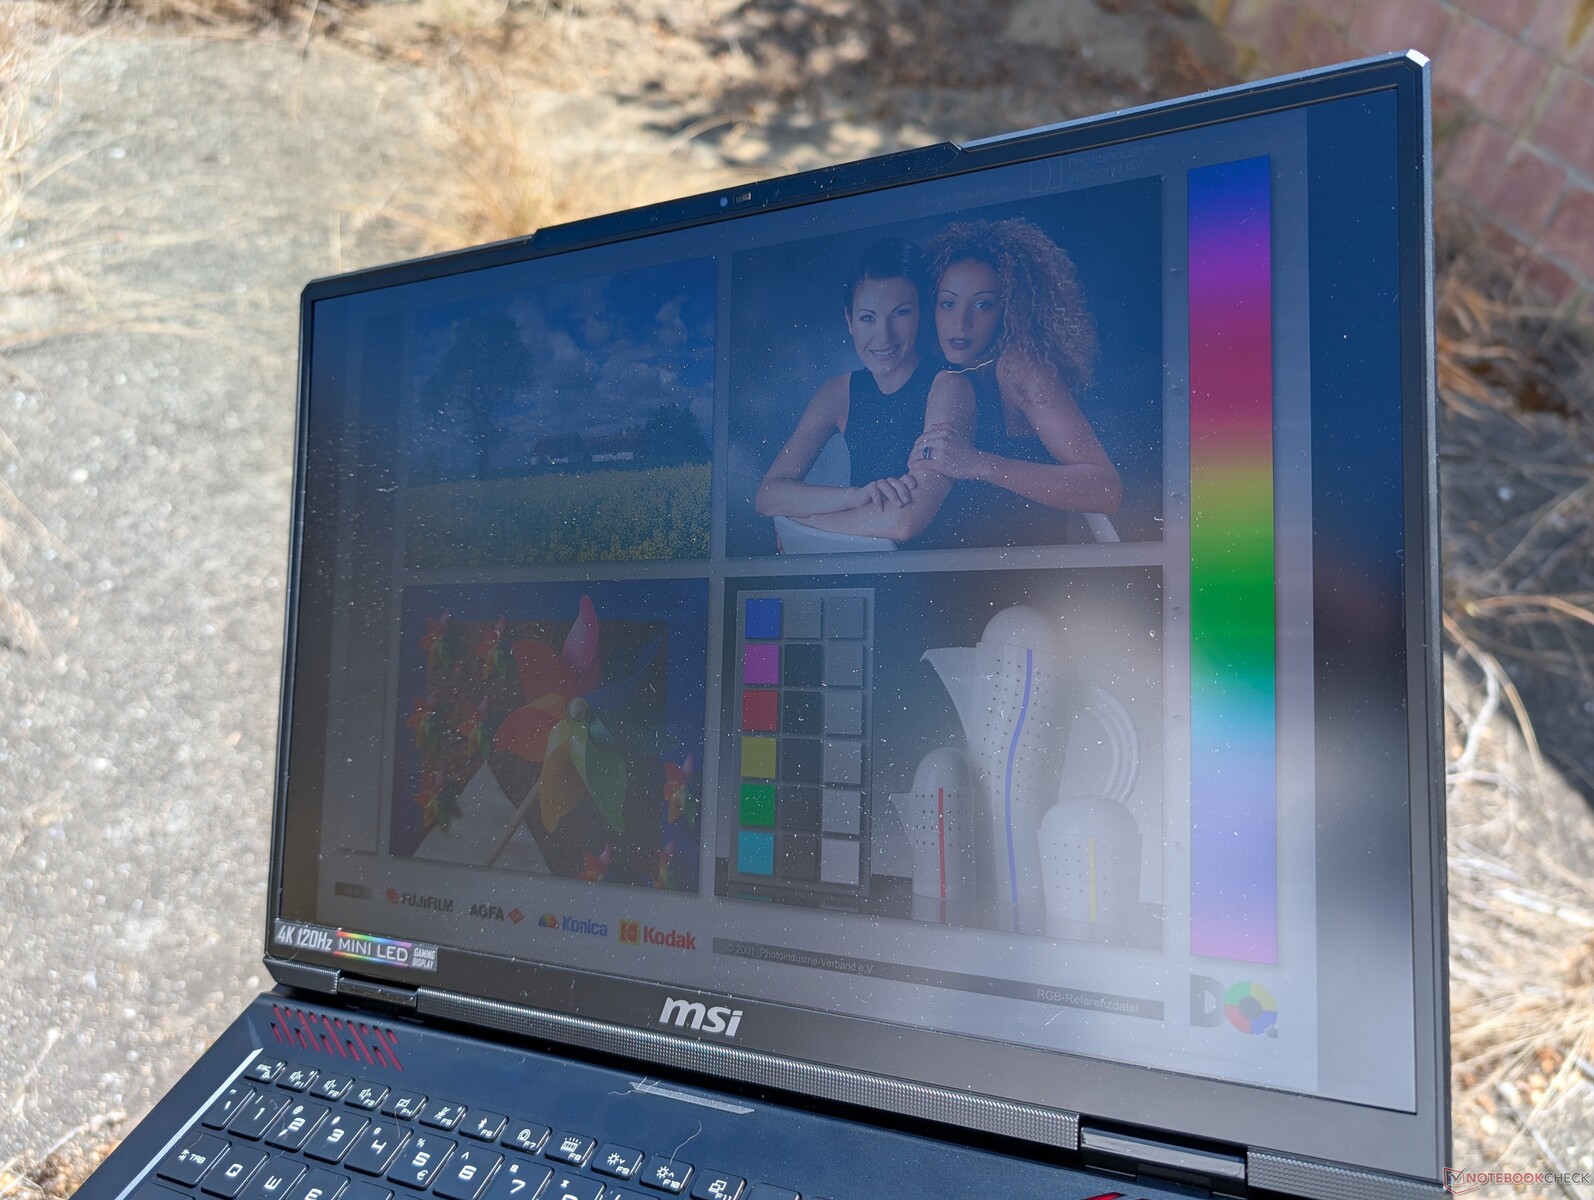
Dış mekan görünürlüğü sadece gölgede iyi ve güneş ışığı altında o kadar da iyi değil. Pil gücüyle çalışmak maksimum parlaklığı sadece 392 nit'e düşürür ve Windows HDR otomatik olarak devre dışı kalır.
Performans - Yeni CPU Adı, Aynı CPU Performansı
Test Koşulları
Aşağıdaki kıyaslamaları çalıştırmadan önce GPU'yu ayrık grafik moduna, Windows'u Performans moduna ve MSI Center'ı da Aşırı Performans moduna ayarladık. Cooler Boost modu (yani maksimum fan modu), Extreme Performance modundaki bir başka ayardır, ancak bulgularımızın göstereceği gibi bu seçenek genellikle maksimum performans için gerekli değildir. Bu, aynı Cooler Boost özelliğine sahip diğer MSI dizüstü bilgisayarlardaki deneyimlerimizle tutarlıdır.
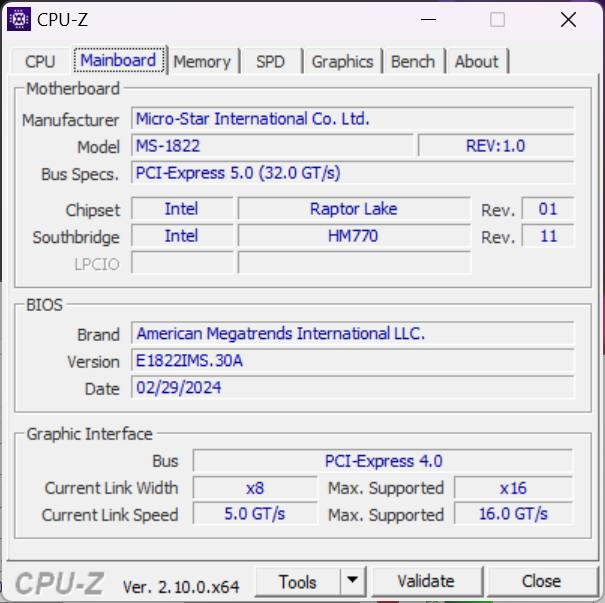
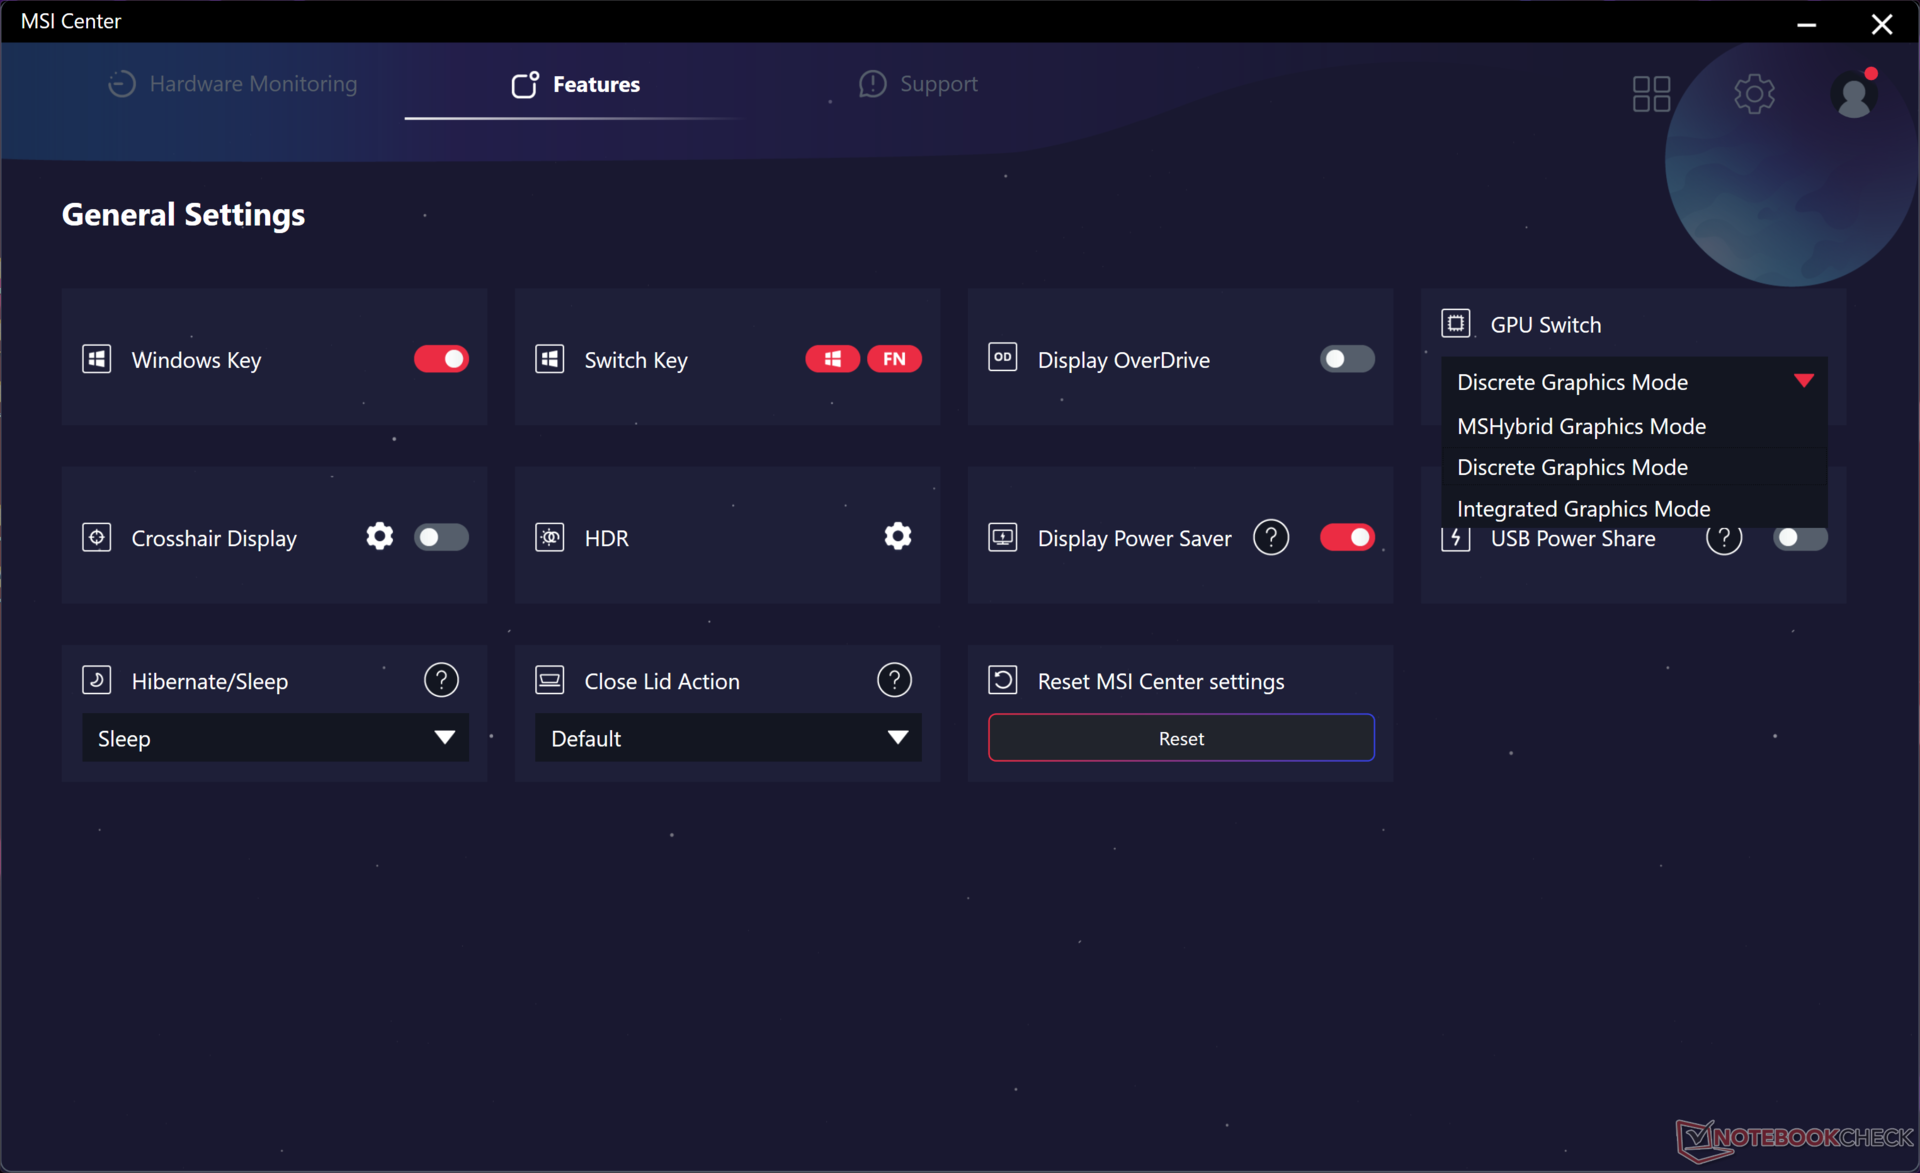
MUX, dGPU, iGPU ve MSHybrid modları arasında geçiş yapmak için desteklenir ancak Advanced Optimus, Titan 18 HX'de olduğu gibi değildir. Gerçekten de, 4K mini LED panelin önemli bir dezavantajı G-Sync desteğinin olmamasıdır.
İşlemci
Bu Core i9-14900HX sadece yeniden markalanmış bir Core i9-13900HX ve bu nedenle en iyi ihtimalle yalnızca marjinal faydalar sağlar. Buna rağmen, CineBench veya Blender işleme gibi geleneksel performans ölçümleri söz konusu olduğunda dizüstü bilgisayarlarda bulunan en hızlı CPU'lardan biri olmaya devam ediyor. CPU, Meteor Lake'i tamamlıyor Core Ultra 9 185H bu da yapay zeka görevlerini hızlandırmak için entegre bir NPU için bazı ham performanslardan vazgeçiyor.
Performans sürdürülebilirliği mükemmeldir, stres altındayken saat hızlarında büyük düşüşler yaşanmaz Acer Predator Helios 18 aynı Core i9-14900HX CPU ile donatılmıştır.
AMD tabanlı işlemciye geçiş Ryzen 9 7945HX yapılandırmasının çoklu iş parçacığı performansını yaklaşık yüzde 10 ila 15 oranında artırırken tek iş parçacığı performansına yüzde 10 ila 15 oranında bir darbe vurması bekleniyor.
Cinebench R15 Multi Loop
Cinebench R23: Multi Core | Single Core
Cinebench R20: CPU (Multi Core) | CPU (Single Core)
Cinebench R15: CPU Multi 64Bit | CPU Single 64Bit
Blender: v2.79 BMW27 CPU
7-Zip 18.03: 7z b 4 | 7z b 4 -mmt1
Geekbench 6.4: Multi-Core | Single-Core
Geekbench 5.5: Multi-Core | Single-Core
HWBOT x265 Benchmark v2.2: 4k Preset
LibreOffice : 20 Documents To PDF
R Benchmark 2.5: Overall mean
* ... daha küçük daha iyidir
AIDA64: FP32 Ray-Trace | FPU Julia | CPU SHA3 | CPU Queen | FPU SinJulia | FPU Mandel | CPU AES | CPU ZLib | FP64 Ray-Trace | CPU PhotoWorxx
| Performance Rating | |
| Alienware m18 R2 | |
| MSI Titan 18 HX A14VIG | |
| MSI Raider 18 HX A14V | |
| Ortalama Intel Core i9-14900HX | |
| Razer Blade 18 2024 RZ09-0509 | |
| Acer Predator Helios 18 PH18-72-98MW | |
| Asus ROG Strix G18 G814JI | |
| AIDA64 / FP32 Ray-Trace | |
| MSI Titan 18 HX A14VIG | |
| Alienware m18 R2 | |
| MSI Raider 18 HX A14V | |
| Razer Blade 18 2024 RZ09-0509 | |
| Ortalama Intel Core i9-14900HX (13098 - 33474, n=36) | |
| Acer Predator Helios 18 PH18-72-98MW | |
| Asus ROG Strix G18 G814JI | |
| AIDA64 / FPU Julia | |
| MSI Titan 18 HX A14VIG | |
| Alienware m18 R2 | |
| MSI Raider 18 HX A14V | |
| Razer Blade 18 2024 RZ09-0509 | |
| Ortalama Intel Core i9-14900HX (67573 - 166040, n=36) | |
| Acer Predator Helios 18 PH18-72-98MW | |
| Asus ROG Strix G18 G814JI | |
| AIDA64 / CPU SHA3 | |
| MSI Titan 18 HX A14VIG | |
| Alienware m18 R2 | |
| MSI Raider 18 HX A14V | |
| Razer Blade 18 2024 RZ09-0509 | |
| Ortalama Intel Core i9-14900HX (3589 - 7979, n=36) | |
| Acer Predator Helios 18 PH18-72-98MW | |
| Asus ROG Strix G18 G814JI | |
| AIDA64 / CPU Queen | |
| MSI Titan 18 HX A14VIG | |
| MSI Raider 18 HX A14V | |
| Alienware m18 R2 | |
| Acer Predator Helios 18 PH18-72-98MW | |
| Ortalama Intel Core i9-14900HX (118405 - 148966, n=36) | |
| Razer Blade 18 2024 RZ09-0509 | |
| Asus ROG Strix G18 G814JI | |
| AIDA64 / FPU SinJulia | |
| MSI Titan 18 HX A14VIG | |
| MSI Raider 18 HX A14V | |
| Alienware m18 R2 | |
| Razer Blade 18 2024 RZ09-0509 | |
| Ortalama Intel Core i9-14900HX (10475 - 18517, n=36) | |
| Acer Predator Helios 18 PH18-72-98MW | |
| Asus ROG Strix G18 G814JI | |
| AIDA64 / FPU Mandel | |
| Alienware m18 R2 | |
| MSI Titan 18 HX A14VIG | |
| MSI Raider 18 HX A14V | |
| Razer Blade 18 2024 RZ09-0509 | |
| Ortalama Intel Core i9-14900HX (32543 - 83662, n=36) | |
| Acer Predator Helios 18 PH18-72-98MW | |
| Asus ROG Strix G18 G814JI | |
| AIDA64 / CPU AES | |
| Ortalama Intel Core i9-14900HX (86964 - 241777, n=36) | |
| MSI Titan 18 HX A14VIG | |
| Alienware m18 R2 | |
| MSI Raider 18 HX A14V | |
| Razer Blade 18 2024 RZ09-0509 | |
| Acer Predator Helios 18 PH18-72-98MW | |
| Asus ROG Strix G18 G814JI | |
| AIDA64 / CPU ZLib | |
| MSI Titan 18 HX A14VIG | |
| Alienware m18 R2 | |
| MSI Raider 18 HX A14V | |
| Razer Blade 18 2024 RZ09-0509 | |
| Ortalama Intel Core i9-14900HX (1054 - 2292, n=36) | |
| Acer Predator Helios 18 PH18-72-98MW | |
| Asus ROG Strix G18 G814JI | |
| AIDA64 / FP64 Ray-Trace | |
| Alienware m18 R2 | |
| MSI Titan 18 HX A14VIG | |
| MSI Raider 18 HX A14V | |
| Razer Blade 18 2024 RZ09-0509 | |
| Ortalama Intel Core i9-14900HX (6809 - 18349, n=36) | |
| Acer Predator Helios 18 PH18-72-98MW | |
| Asus ROG Strix G18 G814JI | |
| AIDA64 / CPU PhotoWorxx | |
| Alienware m18 R2 | |
| Razer Blade 18 2024 RZ09-0509 | |
| Acer Predator Helios 18 PH18-72-98MW | |
| Ortalama Intel Core i9-14900HX (23903 - 54702, n=36) | |
| Asus ROG Strix G18 G814JI | |
| MSI Raider 18 HX A14V | |
| MSI Titan 18 HX A14VIG | |
Stres Testi
CPU, Prime95 stresini başlatırken 4 GHz, 86 C ve 145 W'a yükselir ve zaman içinde saat hızlarında veya performansta büyük düşüşler olmaz. Büyük kasa ve soğutma çözümü, Core i9-14900HX'ten aynı işlemciye sahip daha küçük sistemlere kıyasla daha fazla performans elde edebilir RedMagic Titan 16 Pro bu da oldukça ağır bir şekilde yavaşlatır.
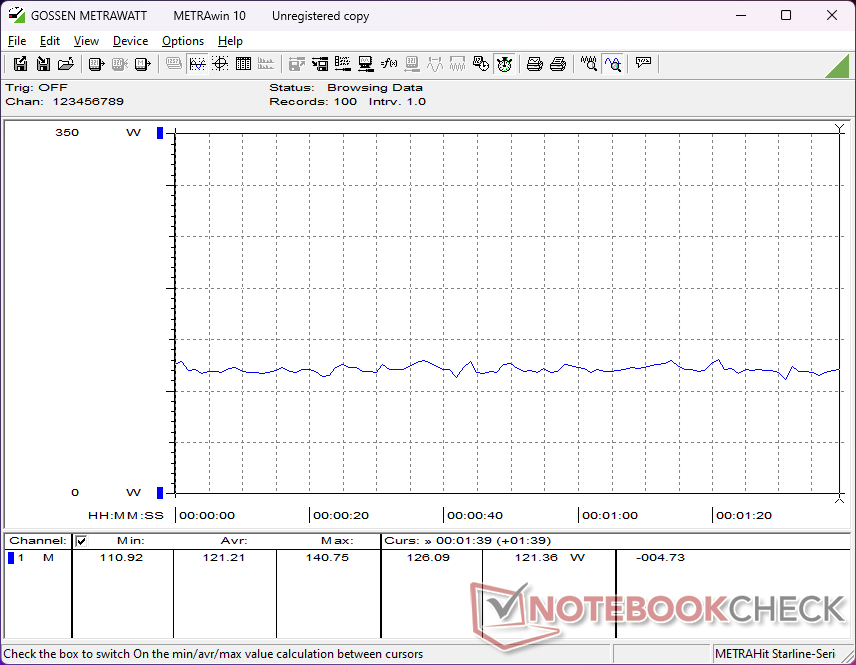
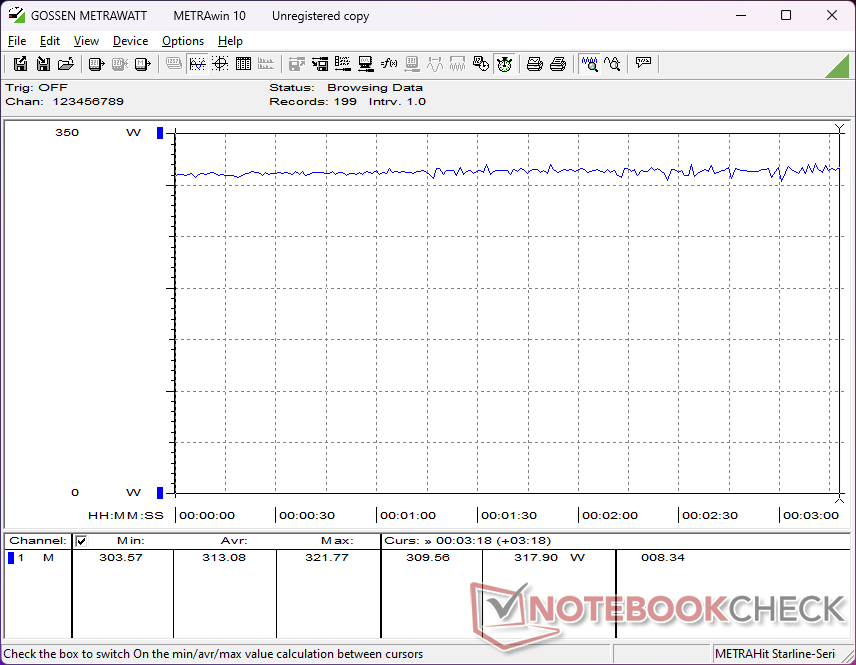
Cooler Boost açıkken Extreme Performance modunda çalıştırmak, oyun oynarken Cooler Boost'un kapalı olmasına kıyasla somut bir performans avantajı sağlamıyor. Cyberpunk 2077 'yi çalıştırırken GPU saat hızları, bellek saat hızları ve kart güç çekişi iki ayar arasında sırasıyla 2550 MHz, 2250 MHz ve 159 W'da sabitlenir. Fan gürültüsü daha yüksek olduğu için Cooler Boost açıkken çekirdek sıcaklıkları birkaç C derece daha düşüktür, ancak bu kayda değer tek avantajdır.
Dengeli moda düşmek GPU saat hızlarını ve kart güç çekimini sırasıyla 2295 MHz ve 150 W'a düşürür, bu da Extreme Performance modundan yalnızca marjinal olarak daha yavaştır. Bu nedenle Dengeli ve Aşırı Performans modları arasındaki performans farkları beklenenden daha azdır.
GPU sıcaklıkları diğer modlara göre daha sıcak Razer Blade 18 mSI'ımız daha kalın ve daha ağır bir sistem olmasına rağmen oyun oynarken 9 C'ye kadar.
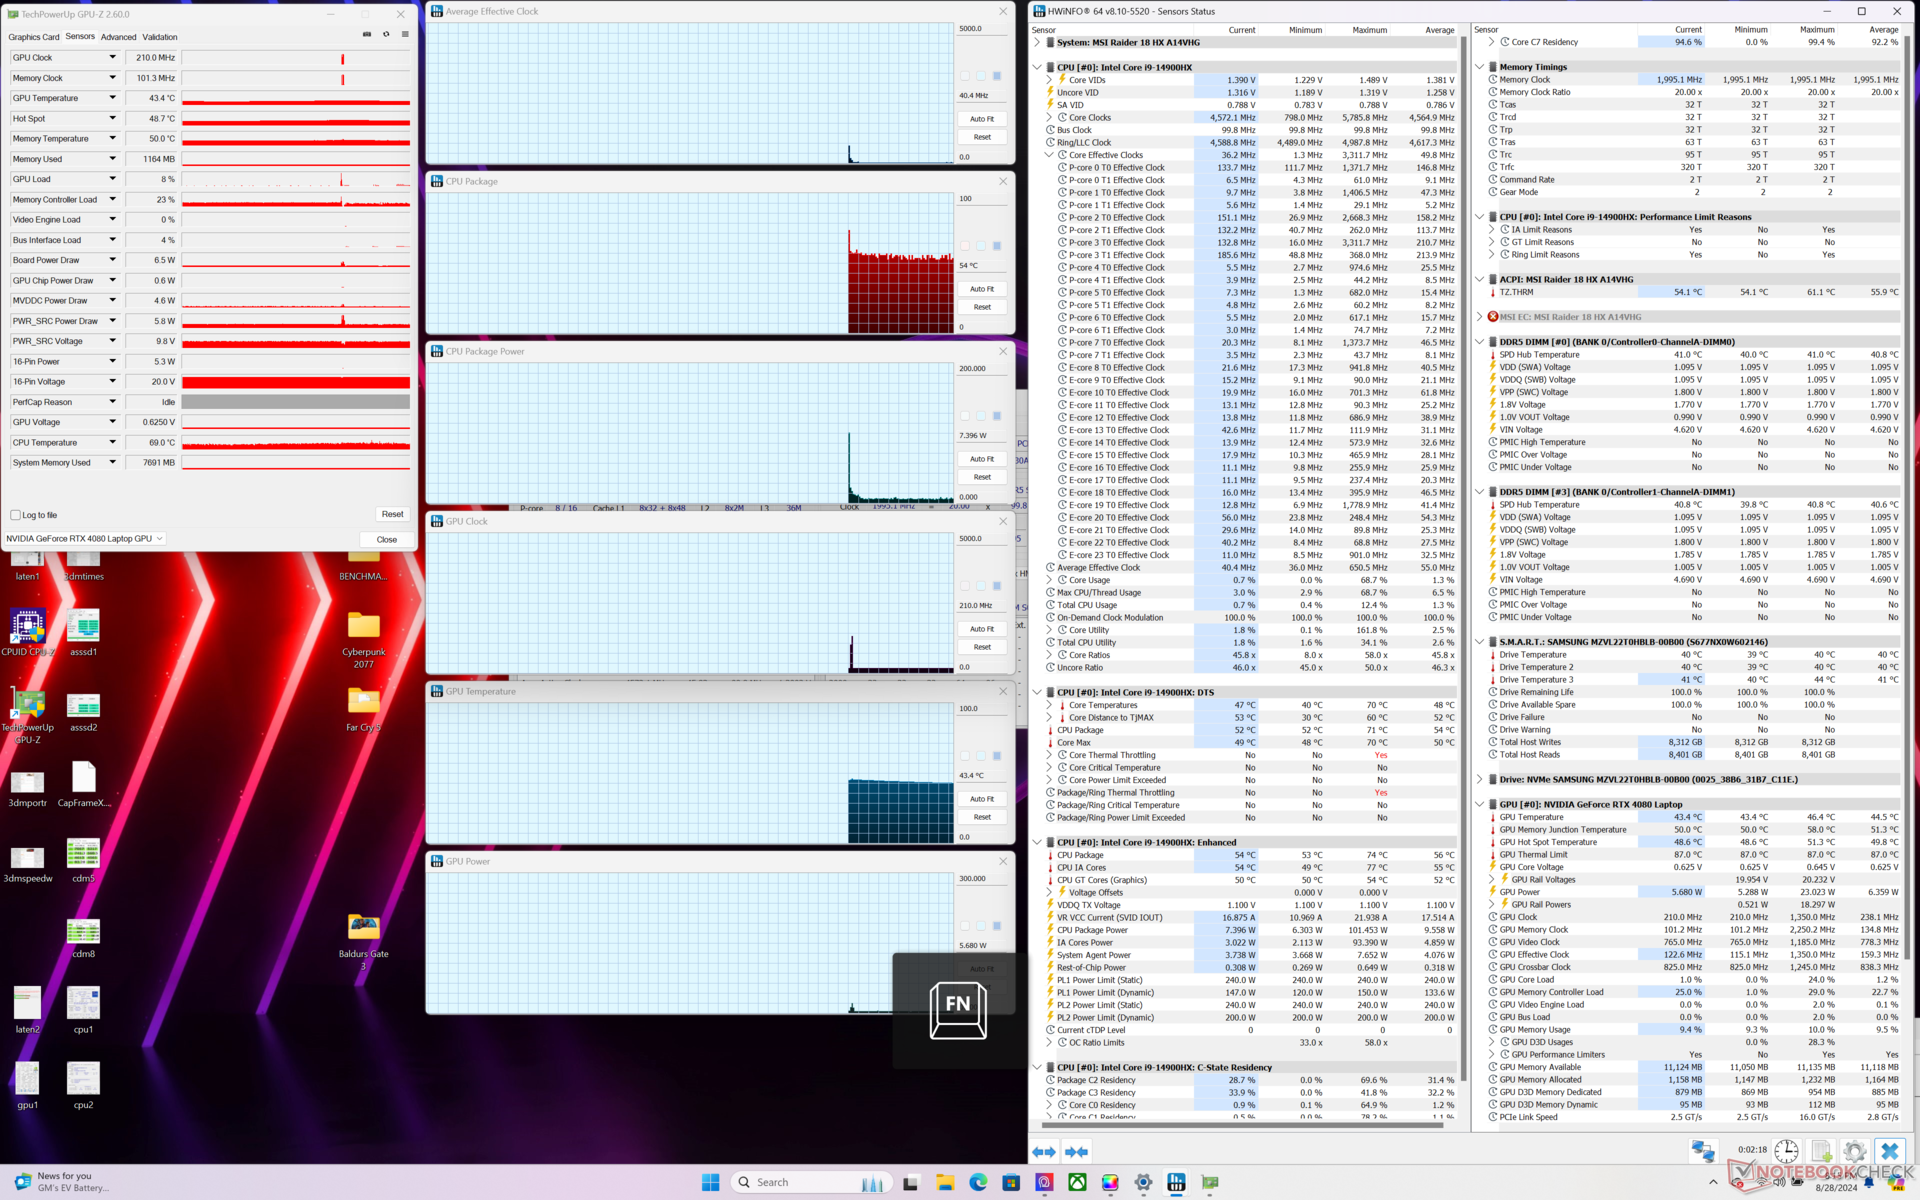

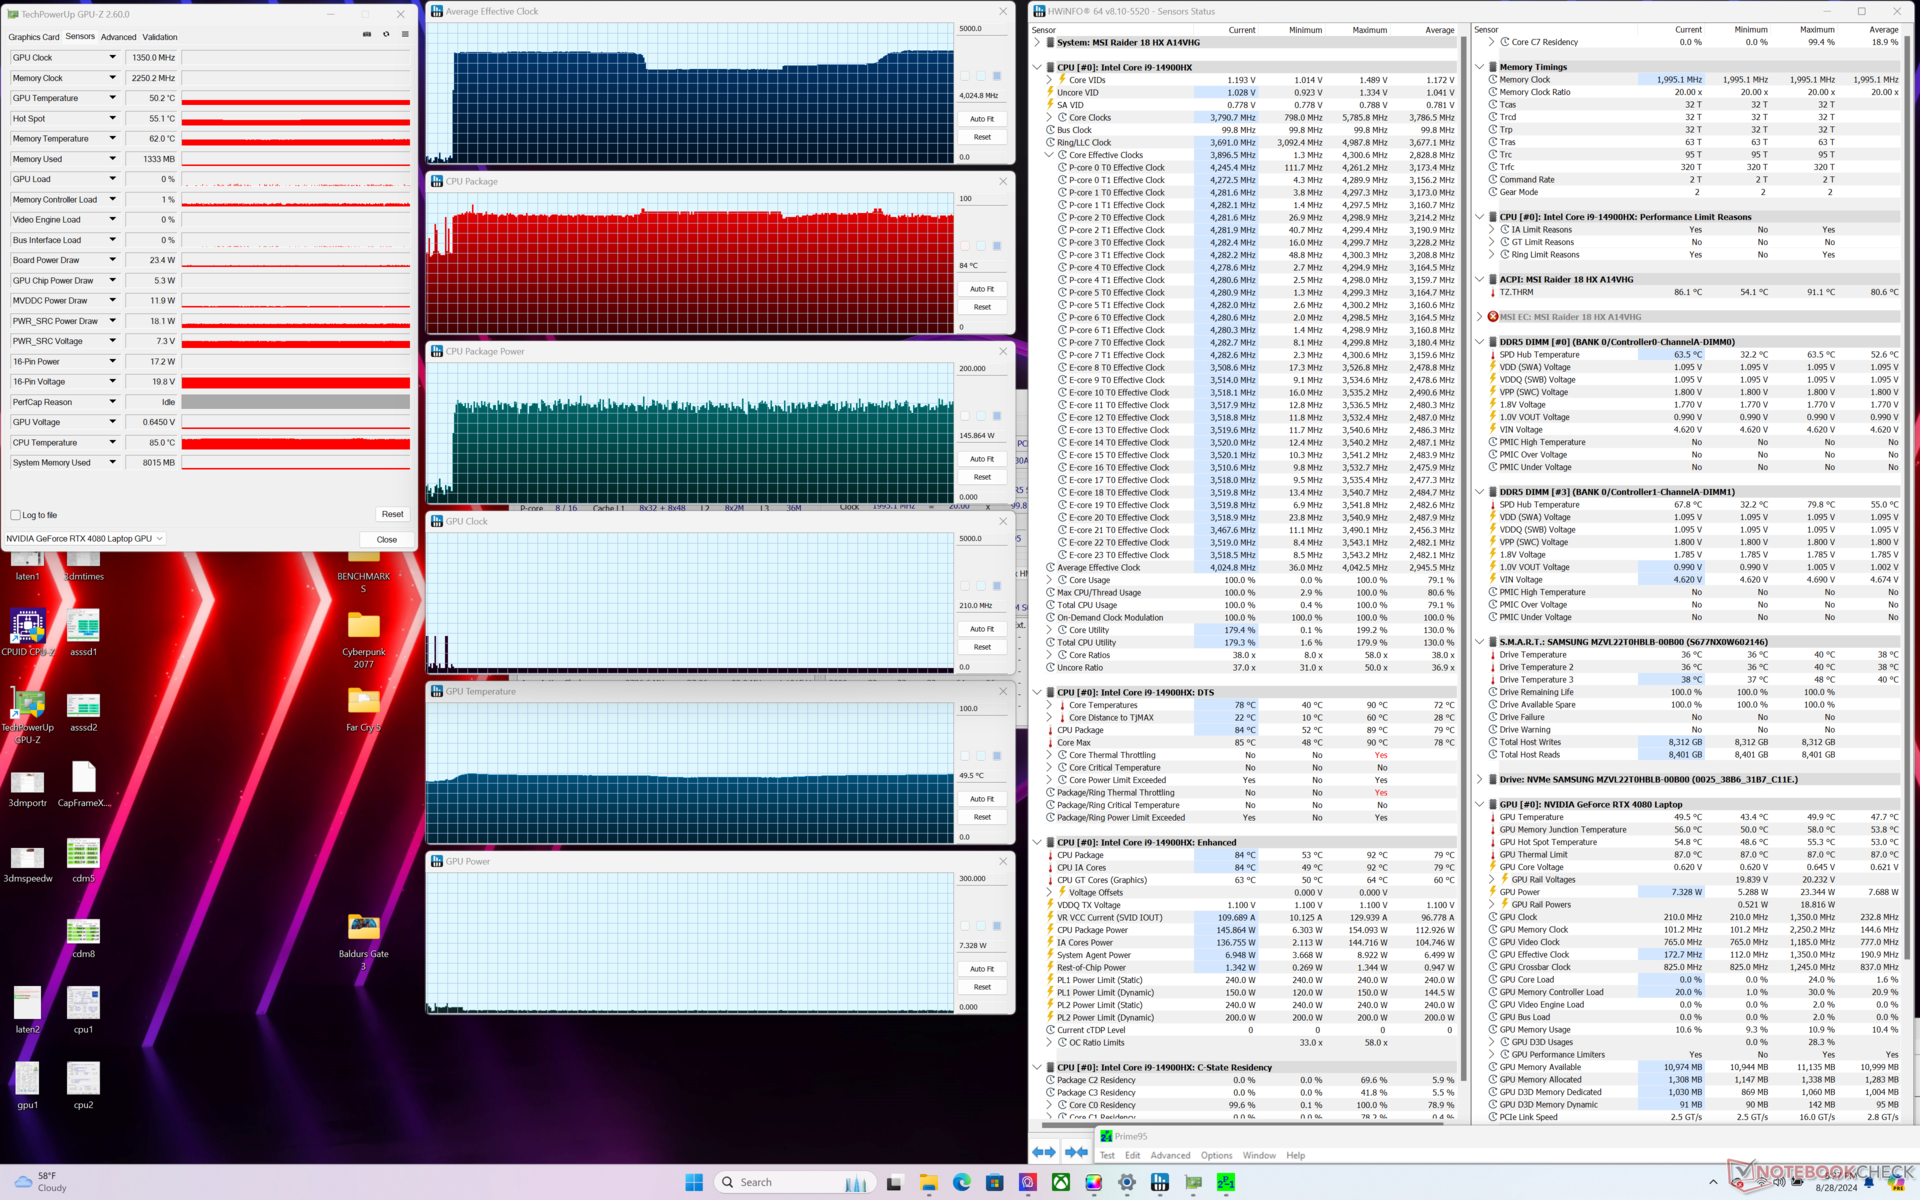
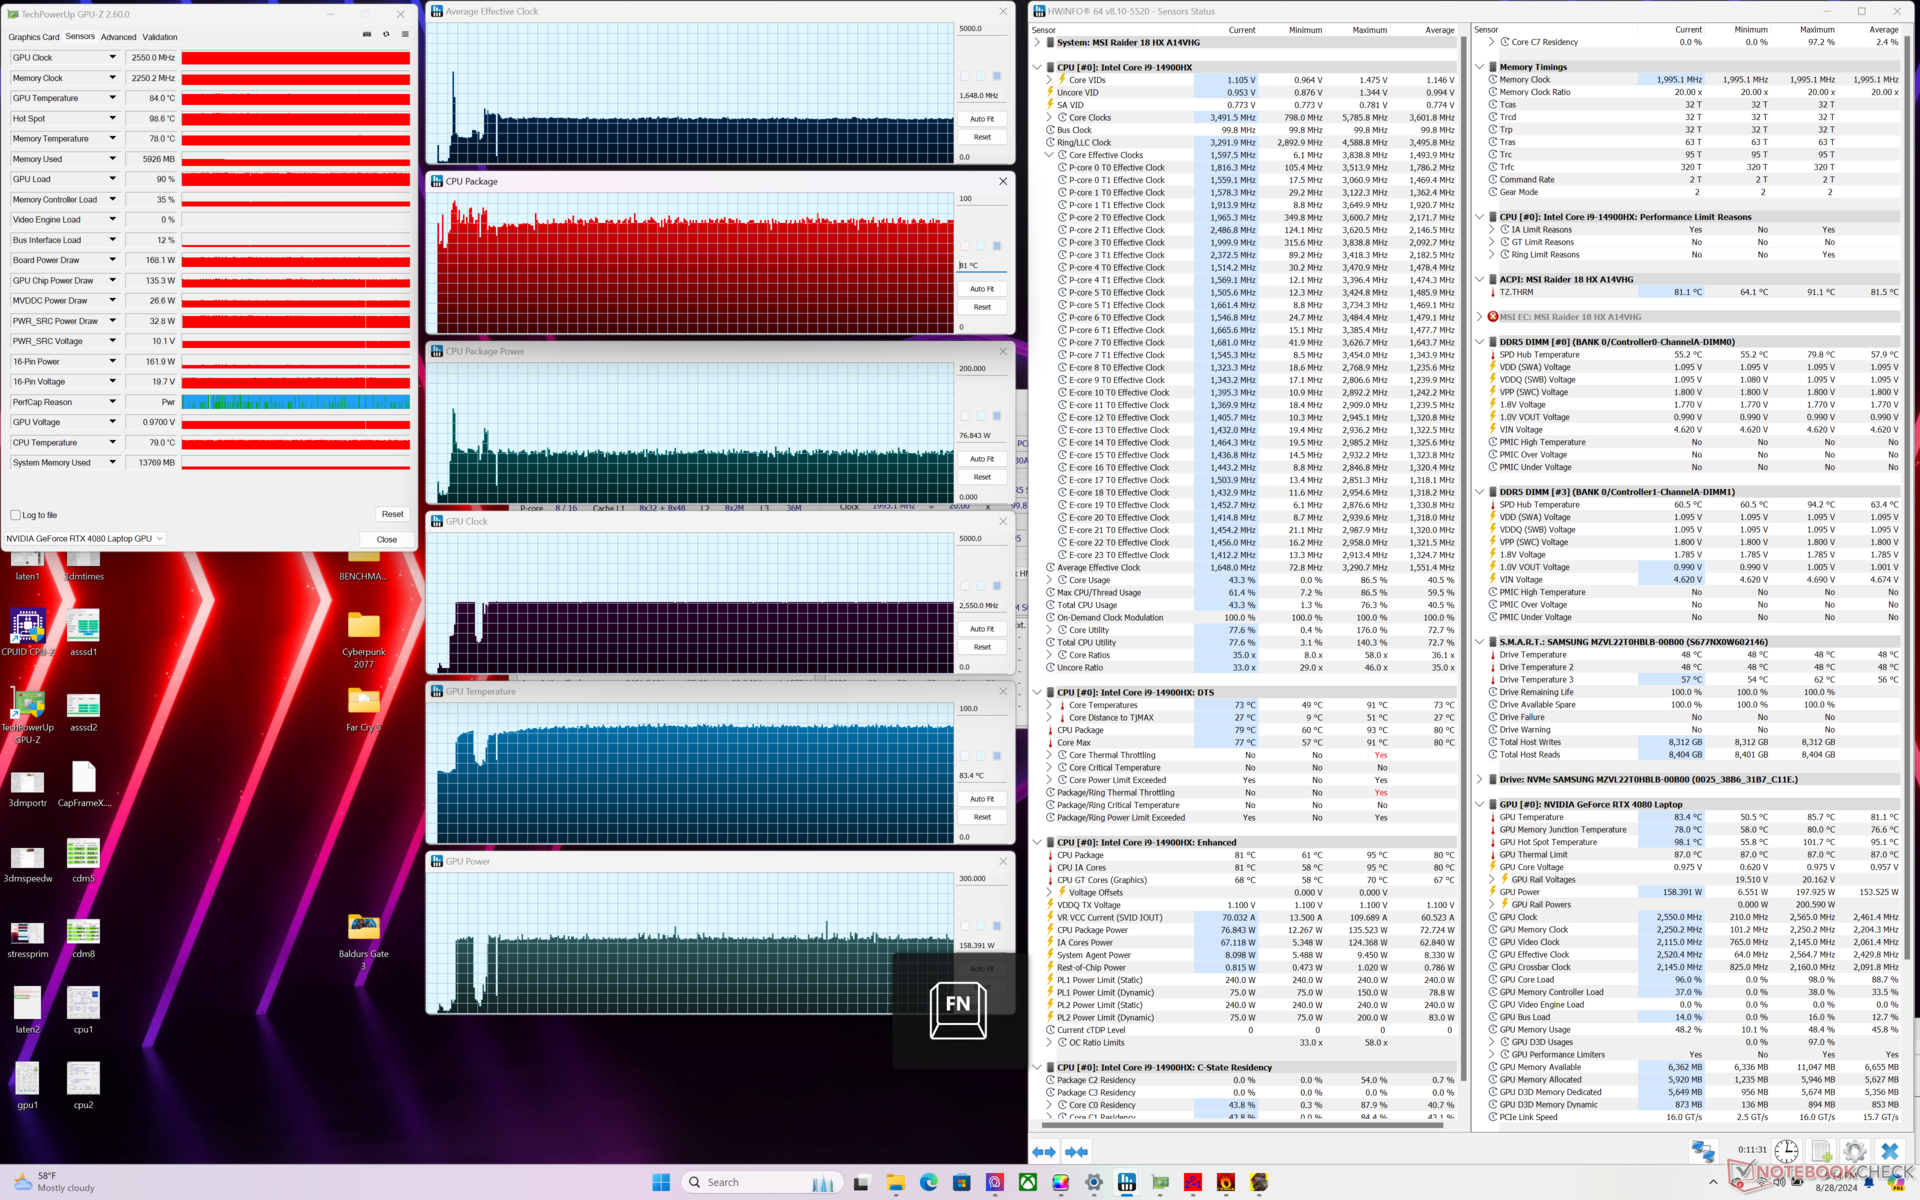
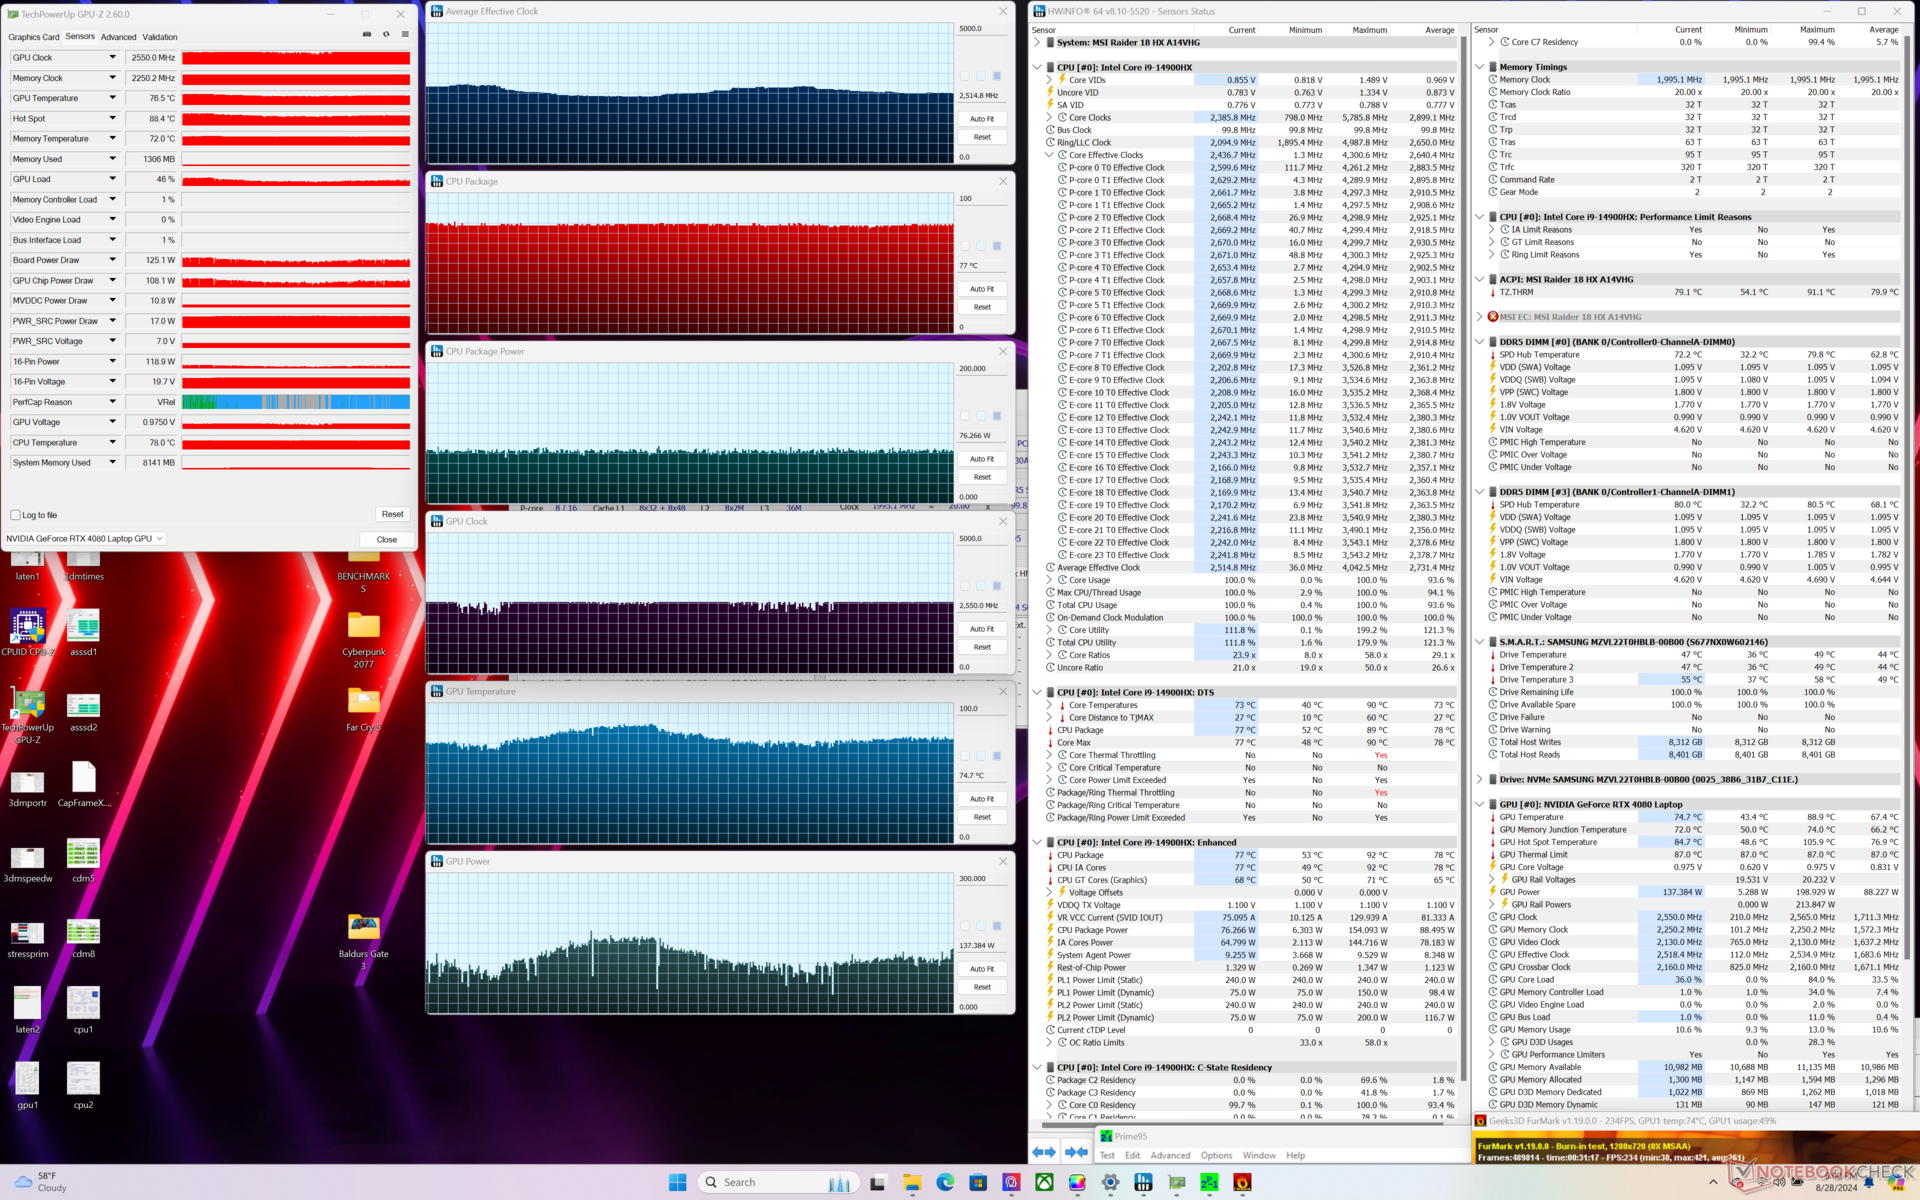
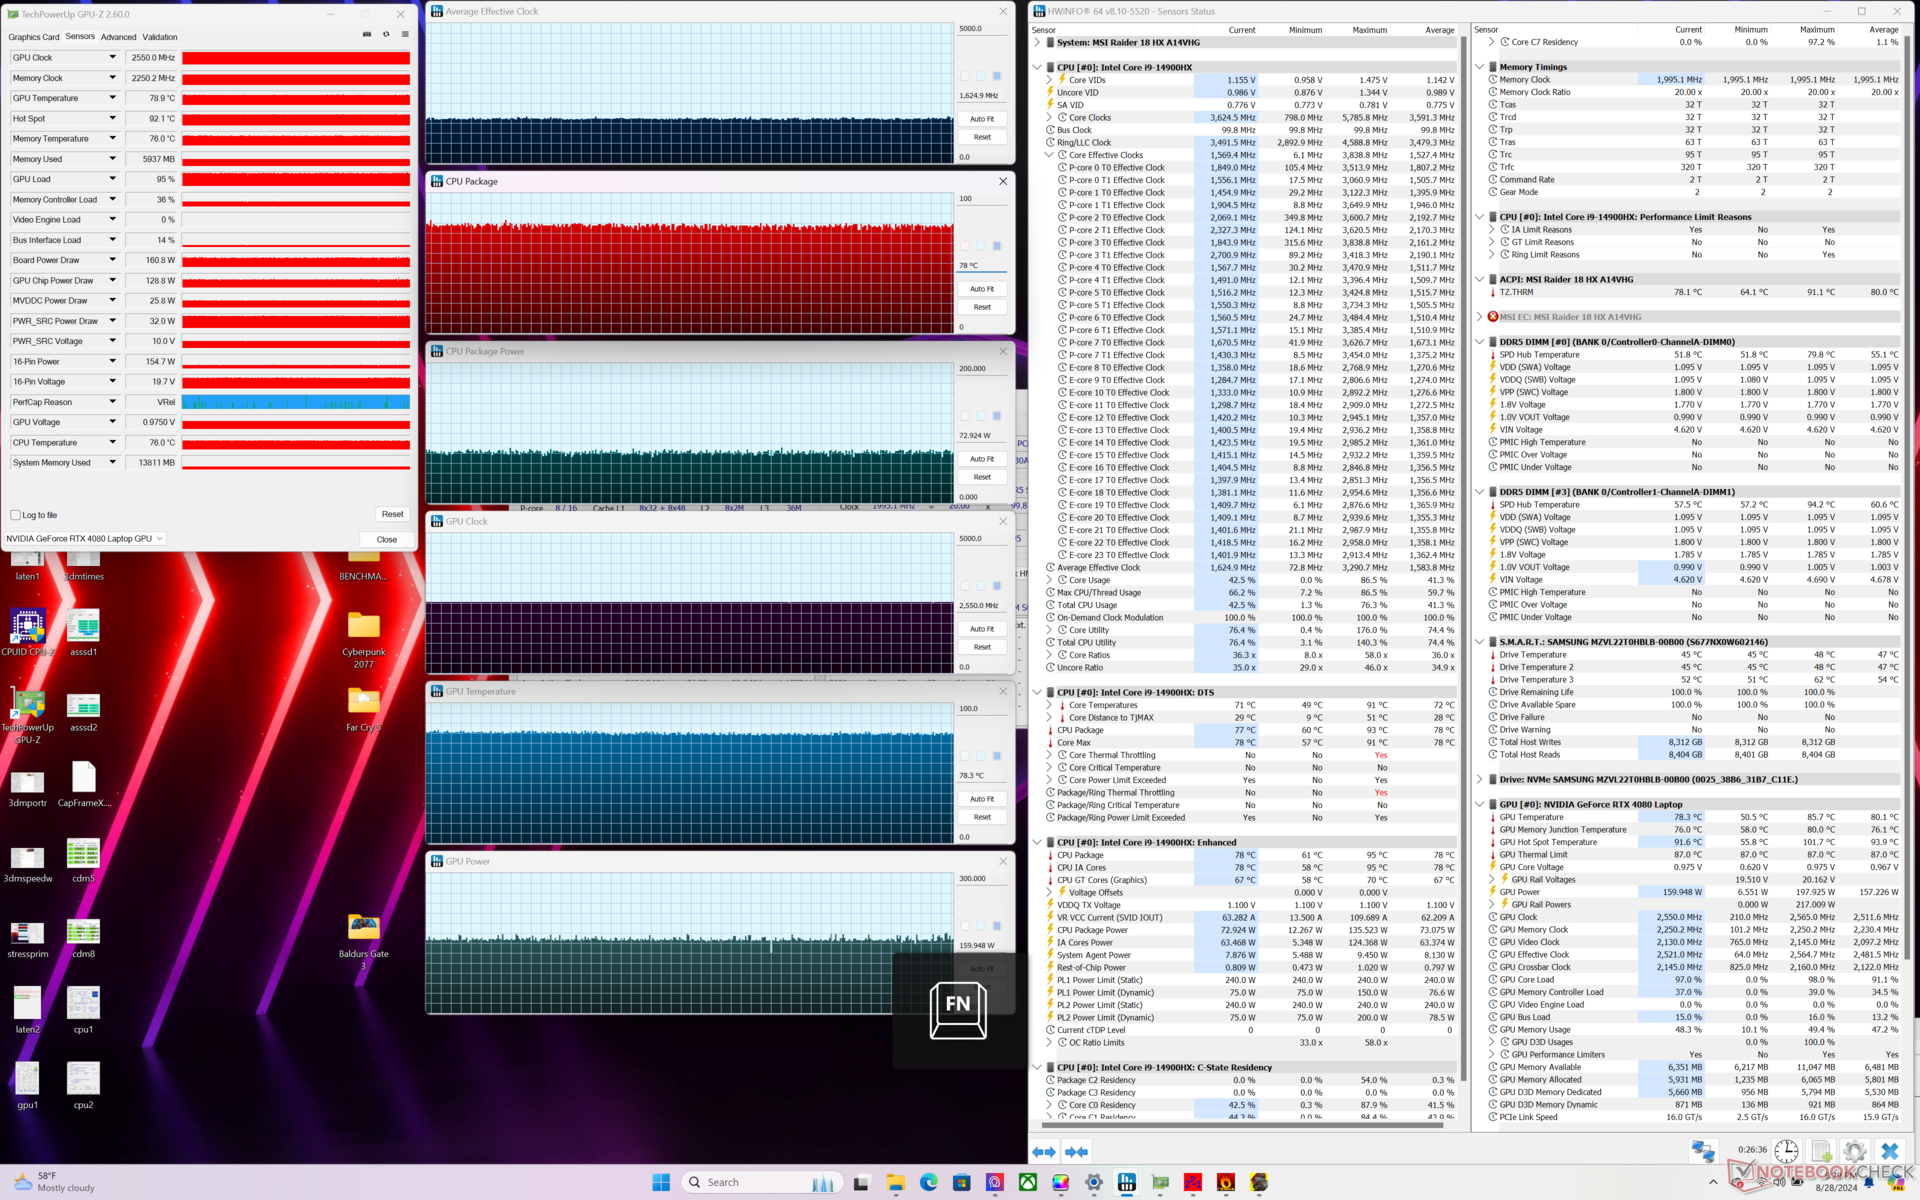
| Ortalama CPU Saati (GHz) | GPU Saati (MHz) | Ortalama CPU Sıcaklığı (°C) | Ortalama GPU Sıcaklığı (°C) | |
| Sistem Boşta | -- | -- | 54 | 43 |
| Prime95 Stres | 4.0 | -- | 84 | 50 |
| Prime95 + FurMark Stres | 2.5 | 2550 | 77 | 75 |
| Cyberpunk 2077 Stres (Dengeli mod) | 1.5 | 2295 | 78 | 85 |
| Cyberpunk 2077 Stres (Cooler Boost kapalıyken Aşırı Performans) | 1.7 | 2550 | 81 | 83 |
| Cyberpunk 2077 Stres (Cooler Boost açıkken Aşırı Performans) | 1.6 | 2550 | 78 | 78 |
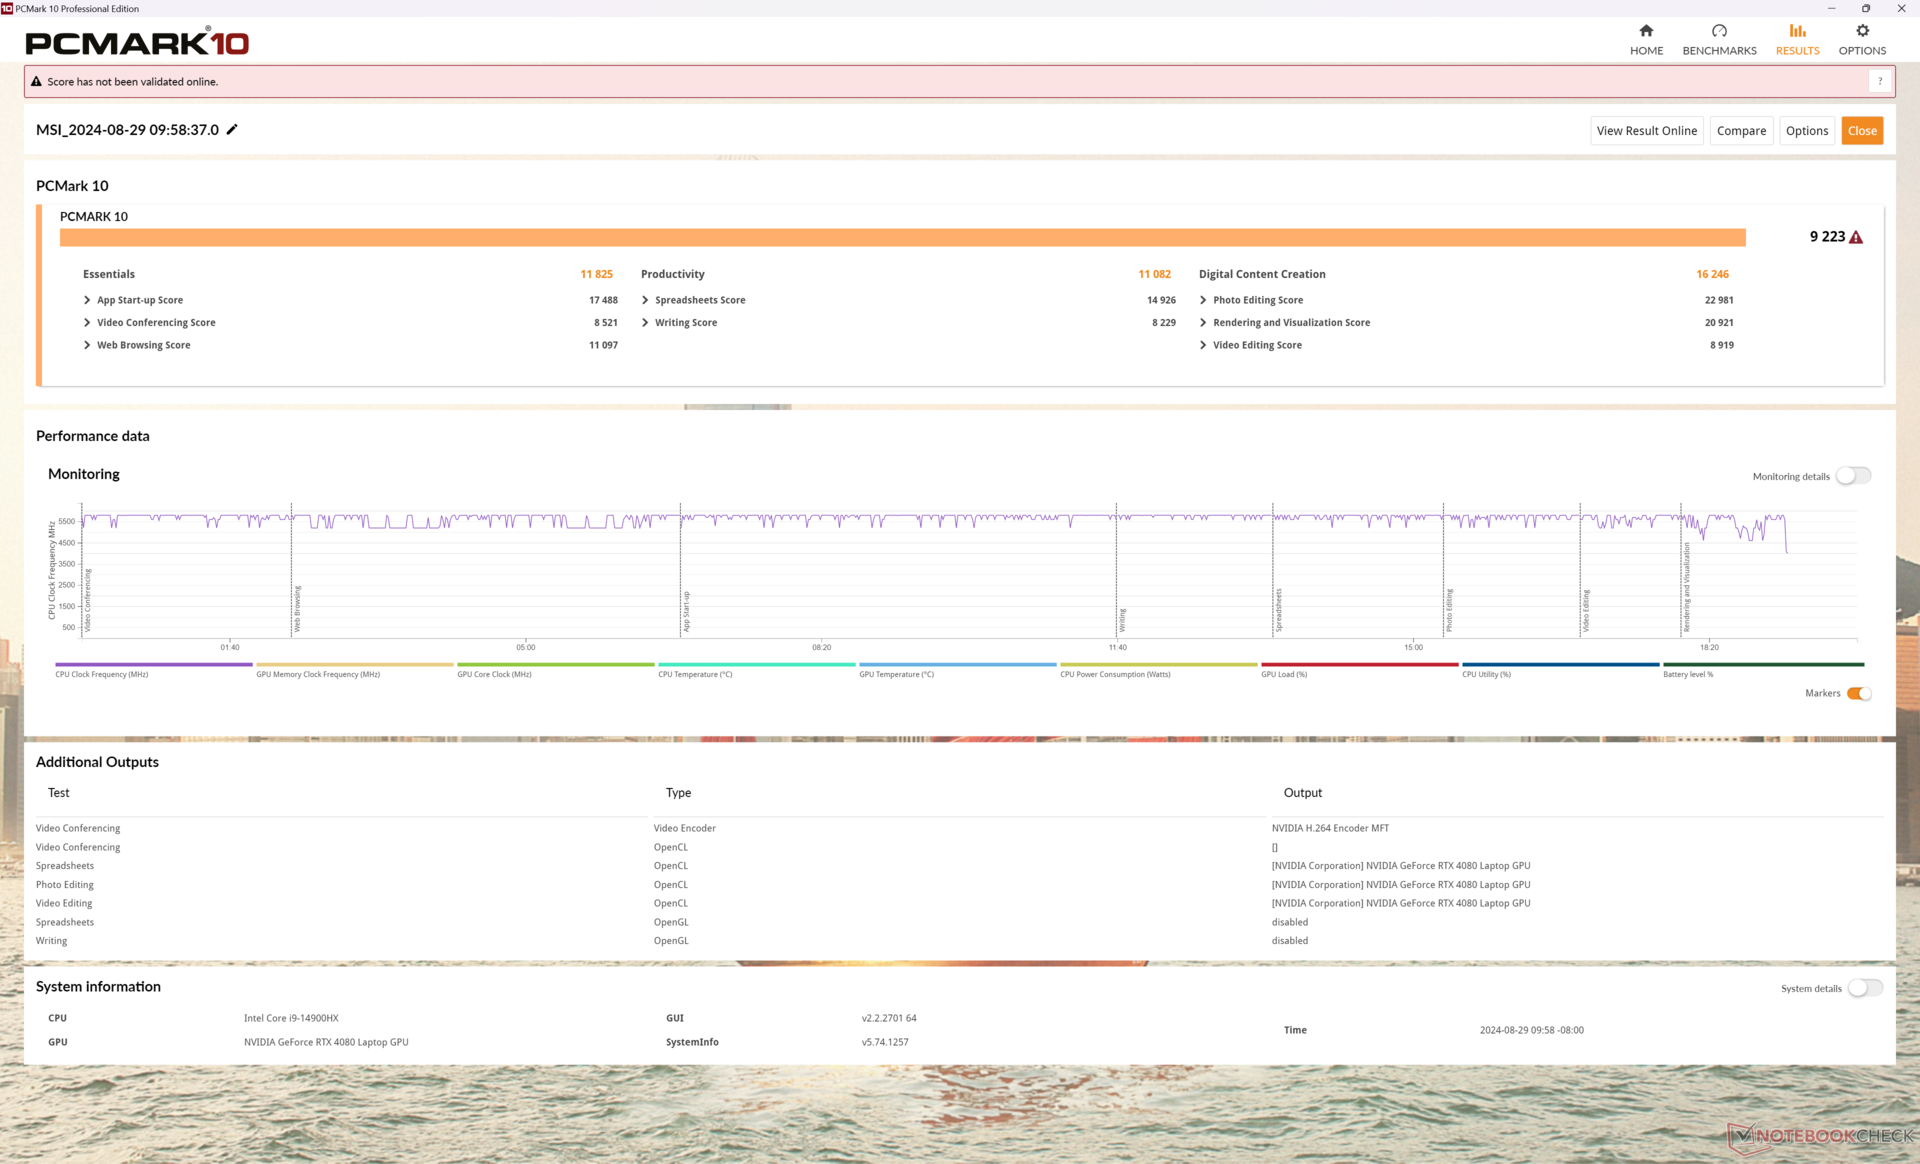
Sistem Performansı
PCMark 10 skorları MSI Titan 18 HX ile karşılaştırılabilir düzeyde olup, esasen Titan'ın tonunun düşürülmüş hali olmasına rağmen Raider 18 HX'te günlük görevlerin gerçekten daha yavaş olmadığını göstermektedir.
Test ünitemizde dGPU ve iGPU modları arasında geçiş yaparken her seferinde PIN'i sıfırlamamıza neden olan garip giriş sorunları yaşadık.
CrossMark: Overall | Productivity | Creativity | Responsiveness
WebXPRT 3: Overall
WebXPRT 4: Overall
Mozilla Kraken 1.1: Total
| PCMark 10 / Score | |
| Alienware m18 R2 | |
| MSI Raider 18 HX A14V | |
| MSI Titan 18 HX A14VIG | |
| Razer Blade 18 2024 RZ09-0509 | |
| Ortalama Intel Core i9-14900HX, NVIDIA GeForce RTX 4080 Laptop GPU (7703 - 9223, n=7) | |
| Acer Predator Helios 18 PH18-72-98MW | |
| Asus ROG Strix G18 G814JI | |
| PCMark 10 / Essentials | |
| MSI Raider 18 HX A14V | |
| Ortalama Intel Core i9-14900HX, NVIDIA GeForce RTX 4080 Laptop GPU (11255 - 12600, n=7) | |
| MSI Titan 18 HX A14VIG | |
| Alienware m18 R2 | |
| Razer Blade 18 2024 RZ09-0509 | |
| Acer Predator Helios 18 PH18-72-98MW | |
| Asus ROG Strix G18 G814JI | |
| PCMark 10 / Productivity | |
| Alienware m18 R2 | |
| MSI Raider 18 HX A14V | |
| Ortalama Intel Core i9-14900HX, NVIDIA GeForce RTX 4080 Laptop GPU (6662 - 11410, n=7) | |
| MSI Titan 18 HX A14VIG | |
| Razer Blade 18 2024 RZ09-0509 | |
| Acer Predator Helios 18 PH18-72-98MW | |
| Asus ROG Strix G18 G814JI | |
| PCMark 10 / Digital Content Creation | |
| MSI Titan 18 HX A14VIG | |
| Alienware m18 R2 | |
| MSI Raider 18 HX A14V | |
| Razer Blade 18 2024 RZ09-0509 | |
| Ortalama Intel Core i9-14900HX, NVIDIA GeForce RTX 4080 Laptop GPU (14211 - 16246, n=7) | |
| Acer Predator Helios 18 PH18-72-98MW | |
| Asus ROG Strix G18 G814JI | |
| CrossMark / Overall | |
| Ortalama Intel Core i9-14900HX, NVIDIA GeForce RTX 4080 Laptop GPU (1992 - 2334, n=7) | |
| MSI Raider 18 HX A14V | |
| Alienware m18 R2 | |
| Razer Blade 18 2024 RZ09-0509 | |
| MSI Titan 18 HX A14VIG | |
| CrossMark / Productivity | |
| Ortalama Intel Core i9-14900HX, NVIDIA GeForce RTX 4080 Laptop GPU (1812 - 2204, n=7) | |
| MSI Raider 18 HX A14V | |
| Razer Blade 18 2024 RZ09-0509 | |
| Alienware m18 R2 | |
| MSI Titan 18 HX A14VIG | |
| CrossMark / Creativity | |
| Ortalama Intel Core i9-14900HX, NVIDIA GeForce RTX 4080 Laptop GPU (2327 - 2500, n=7) | |
| Alienware m18 R2 | |
| MSI Raider 18 HX A14V | |
| Razer Blade 18 2024 RZ09-0509 | |
| MSI Titan 18 HX A14VIG | |
| CrossMark / Responsiveness | |
| Ortalama Intel Core i9-14900HX, NVIDIA GeForce RTX 4080 Laptop GPU (1520 - 2254, n=7) | |
| MSI Raider 18 HX A14V | |
| Alienware m18 R2 | |
| Razer Blade 18 2024 RZ09-0509 | |
| MSI Titan 18 HX A14VIG | |
| WebXPRT 3 / Overall | |
| Razer Blade 18 2024 RZ09-0509 | |
| MSI Raider 18 HX A14V | |
| Ortalama Intel Core i9-14900HX, NVIDIA GeForce RTX 4080 Laptop GPU (310 - 345, n=7) | |
| MSI Titan 18 HX A14VIG | |
| Alienware m18 R2 | |
| Asus ROG Strix G18 G814JI | |
| Asus ROG Strix G18 G814JI | |
| WebXPRT 4 / Overall | |
| MSI Raider 18 HX A14V | |
| Ortalama Intel Core i9-14900HX, NVIDIA GeForce RTX 4080 Laptop GPU (300 - 321, n=7) | |
| Alienware m18 R2 | |
| MSI Titan 18 HX A14VIG | |
| Asus ROG Strix G18 G814JI | |
| Asus ROG Strix G18 G814JI | |
| Mozilla Kraken 1.1 / Total | |
| Asus ROG Strix G18 G814JI | |
| Asus ROG Strix G18 G814JI | |
| MSI Titan 18 HX A14VIG | |
| Razer Blade 18 2024 RZ09-0509 | |
| MSI Raider 18 HX A14V | |
| Acer Predator Helios 18 PH18-72-98MW | |
| Ortalama Intel Core i9-14900HX, NVIDIA GeForce RTX 4080 Laptop GPU (437 - 446, n=7) | |
| Alienware m18 R2 | |
* ... daha küçük daha iyidir
| PCMark 10 Score | 9223 puan | |
Yardım | ||
| AIDA64 / Memory Copy | |
| Alienware m18 R2 | |
| Acer Predator Helios 18 PH18-72-98MW | |
| Razer Blade 18 2024 RZ09-0509 | |
| Ortalama Intel Core i9-14900HX (38028 - 83392, n=36) | |
| MSI Raider 18 HX A14V | |
| Asus ROG Strix G18 G814JI | |
| MSI Titan 18 HX A14VIG | |
| AIDA64 / Memory Read | |
| Alienware m18 R2 | |
| Acer Predator Helios 18 PH18-72-98MW | |
| Razer Blade 18 2024 RZ09-0509 | |
| Ortalama Intel Core i9-14900HX (43306 - 87568, n=36) | |
| Asus ROG Strix G18 G814JI | |
| MSI Raider 18 HX A14V | |
| MSI Titan 18 HX A14VIG | |
| AIDA64 / Memory Write | |
| Alienware m18 R2 | |
| Ortalama Intel Core i9-14900HX (37146 - 80589, n=36) | |
| Acer Predator Helios 18 PH18-72-98MW | |
| Razer Blade 18 2024 RZ09-0509 | |
| MSI Raider 18 HX A14V | |
| Asus ROG Strix G18 G814JI | |
| MSI Titan 18 HX A14VIG | |
| AIDA64 / Memory Latency | |
| MSI Titan 18 HX A14VIG | |
| MSI Raider 18 HX A14V | |
| Razer Blade 18 2024 RZ09-0509 | |
| Alienware m18 R2 | |
| Ortalama Intel Core i9-14900HX (76.1 - 105, n=36) | |
| Asus ROG Strix G18 G814JI | |
| Acer Predator Helios 18 PH18-72-98MW | |
* ... daha küçük daha iyidir
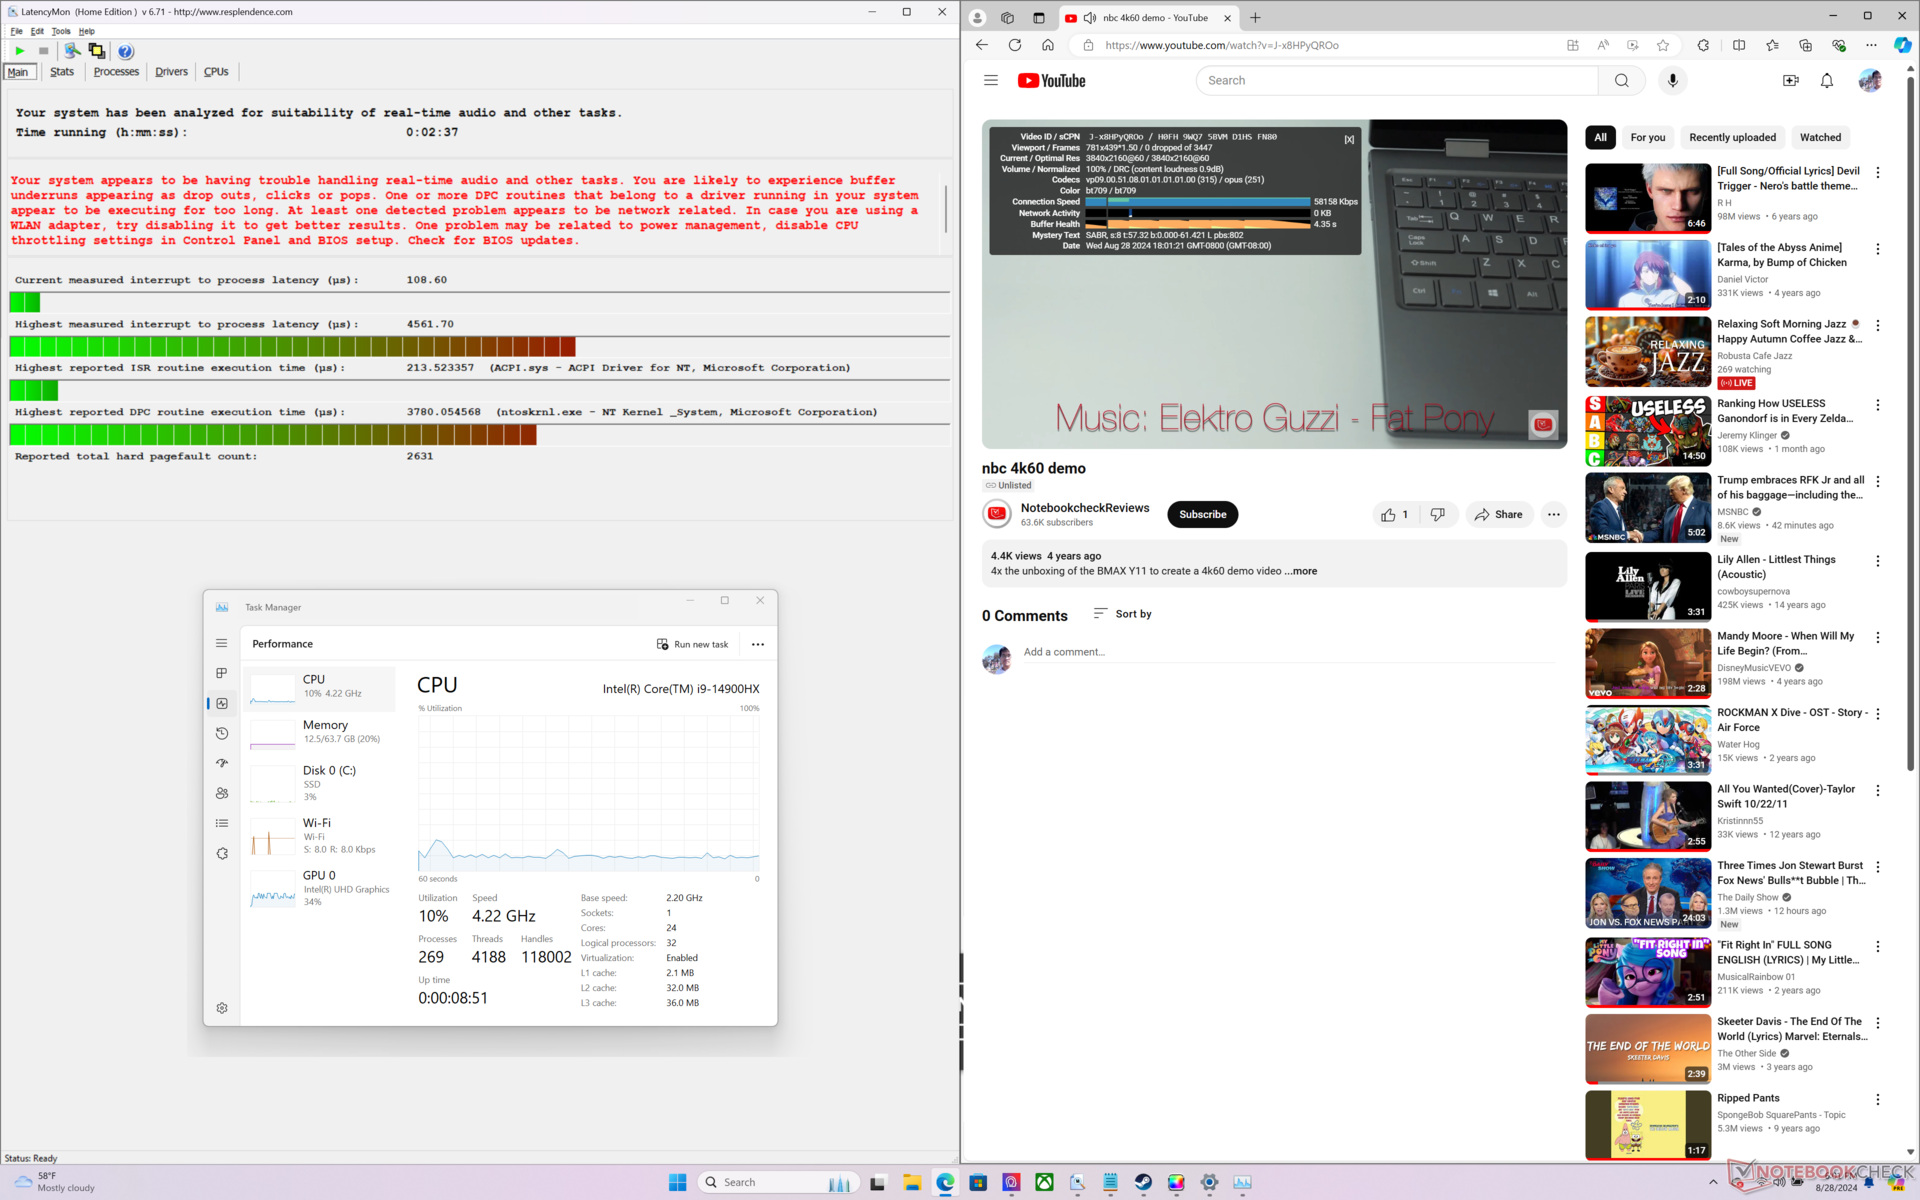
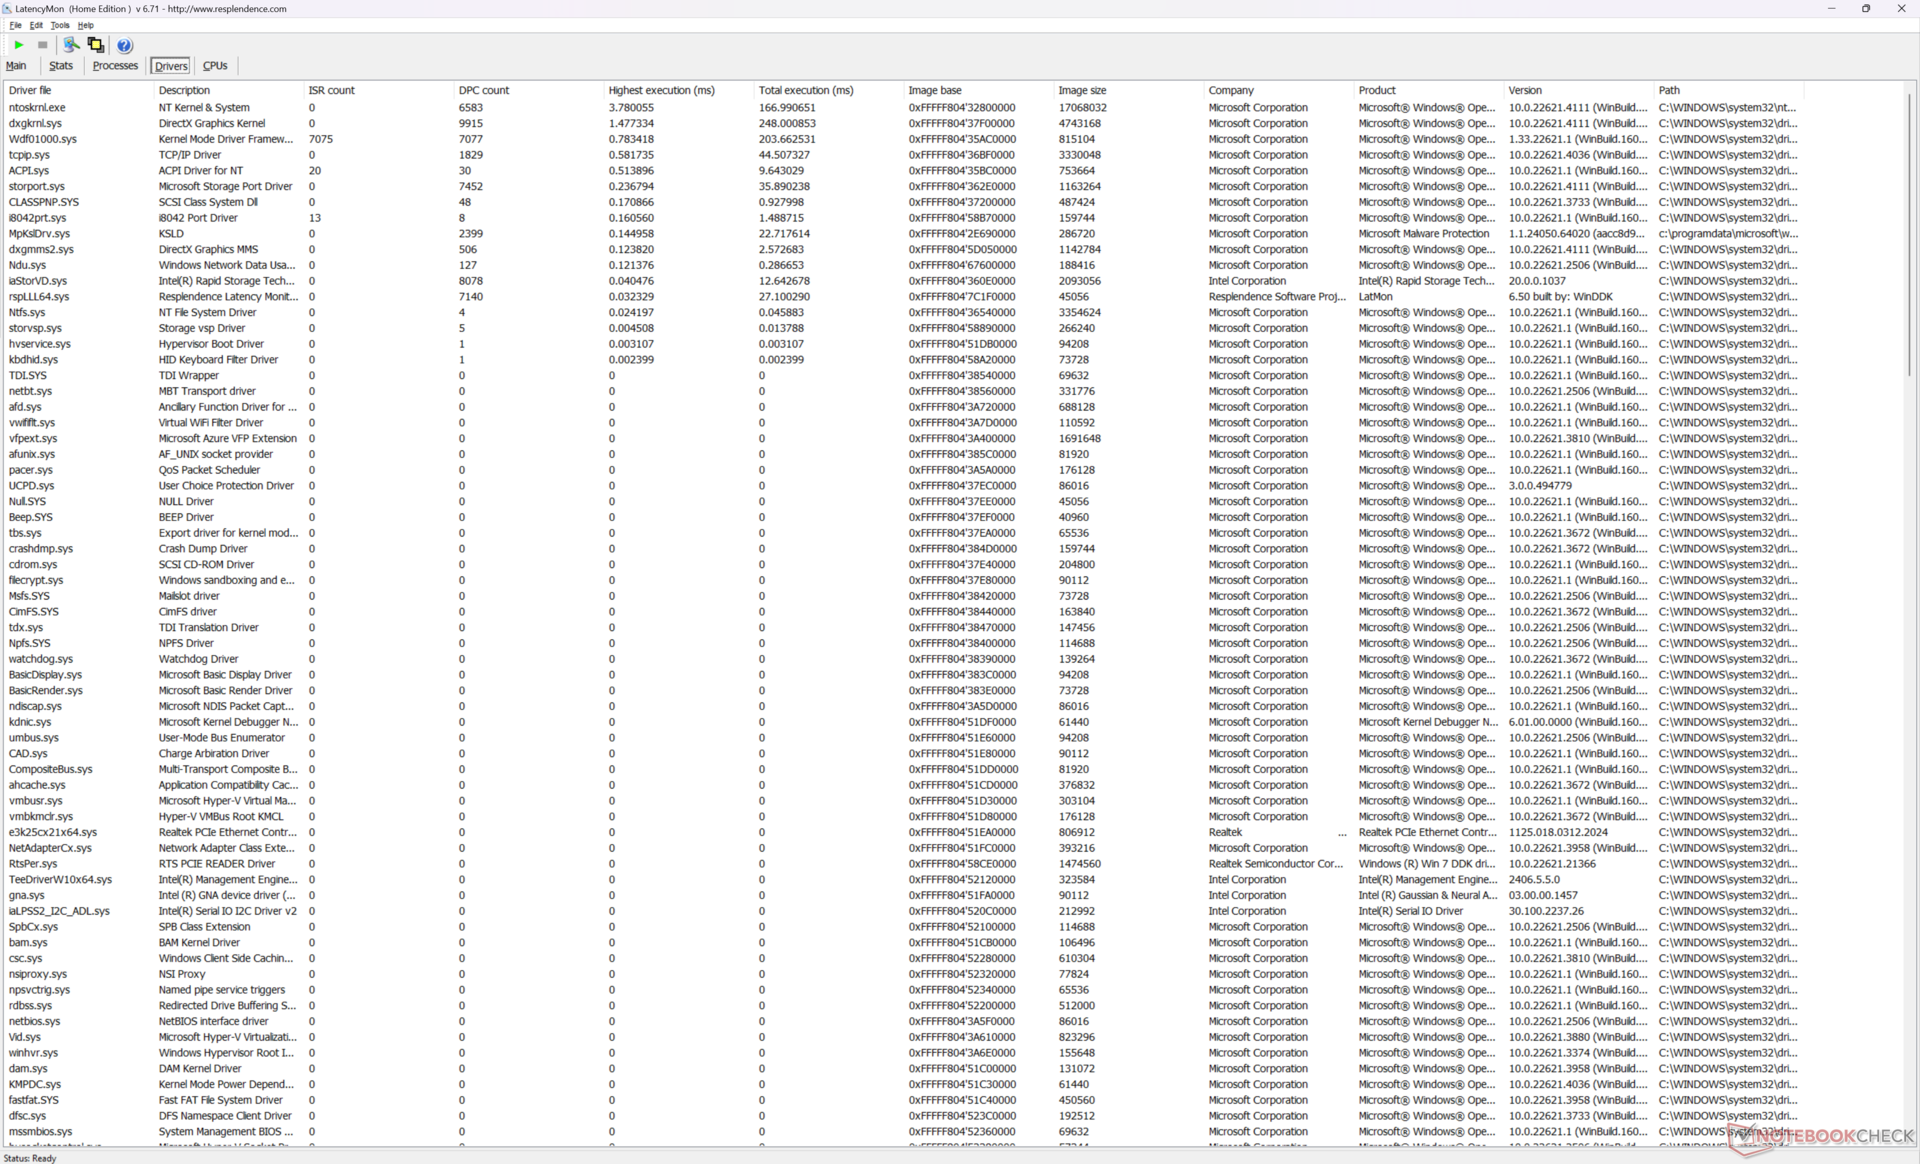
DPC Gecikme Süresi
LatencyMon, iGPU moduna ayarlandığında bile ana sayfamızın birden fazla sekmesini açarken DPC sorunlarını ortaya çıkarıyor. 60 FPS'de 4K video oynatma, kaydedilen hiçbir kare düşmesi olmadan mükemmeldir.
| DPC Latencies / LatencyMon - interrupt to process latency (max), Web, Youtube, Prime95 | |
| MSI Raider 18 HX A14V | |
| Acer Predator Helios 18 PH18-72-98MW | |
| Alienware m18 R2 | |
| MSI Titan 18 HX A14VIG | |
| Razer Blade 18 2024 RZ09-0509 | |
| Asus ROG Strix G18 G814JI | |
* ... daha küçük daha iyidir
Depolama Cihazları
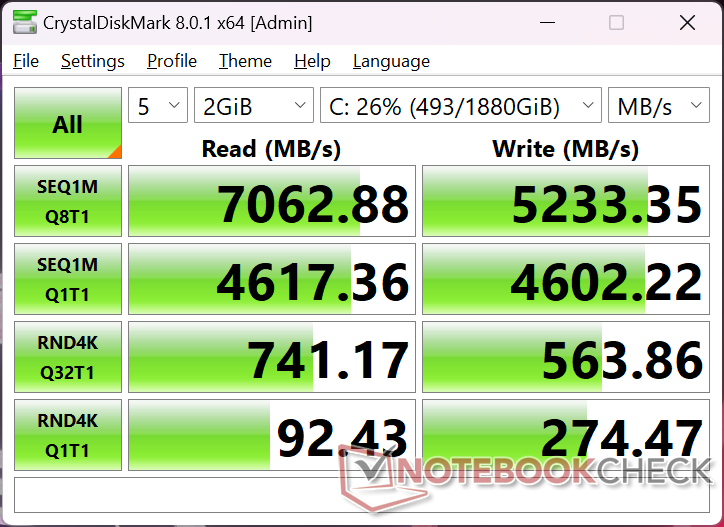
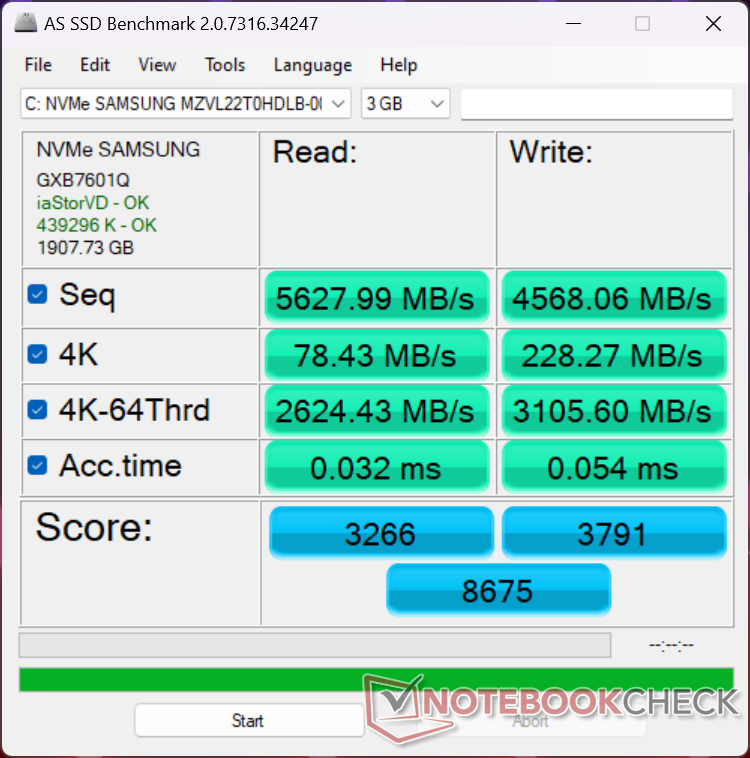
Ünitemiz aşağıdakilerle birlikte gönderilir Samsung PM9A1a MZVL22T0HDLB Genellikle üst düzey dizüstü bilgisayarlarda bulunan PCIe4 SSD. Aktarım hızları, stres altındayken bile ~7000 MB/s'de sabittir ve PCIe5 sürücü ile yapılandırılırsa daha da hızlı olabilir. Ancak ısı dağıtıcısının bulunmaması, PCIe5 sürücülerin daha fazla tıkanmasına neden olabilir.

| Drive Performance Rating - Percent | |
| Alienware m18 R2 | |
| MSI Raider 18 HX A14V | |
| Acer Predator Helios 18 PH18-72-98MW | |
| MSI Titan 18 HX A14VIG | |
| Razer Blade 18 2024 RZ09-0509 | |
| Asus ROG Strix G18 G814JI | |
* ... daha küçük daha iyidir
Disk Throttling: DiskSpd Read Loop, Queue Depth 8
GPU Performansı - 175 W TGP Graphics
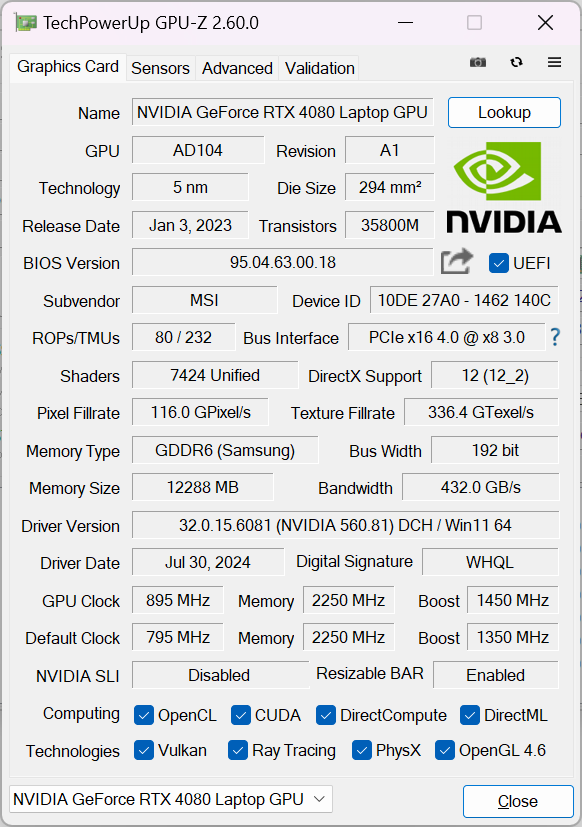
Daha ince dizüstü bilgisayarların aksine daha zayıf 80 W GeForce RTX 4080 grafiklerdaha büyük olan Raider 18 HX ise daha güçlü 175 W (150 W + 25 W dinamik güçlendirme) versiyonuyla geliyor. Performans, veritabanımızdaki ortalama dizüstü bilgisayardan yaklaşık yüzde 5 daha hızlıdır aynı GPU rTX 4090'a yükseltmek ise performansı yüzde 10 daha artıracak.
Genel performansın hala yüzde 30 ila 35 daha yavaş olduğunu unutmayın GeForce RTX 4080'in masaüstü sürümü mobil versiyon aynı adı paylaşsa bile. Bu nedenle mobil RTX 4080'imiz performans açısından masaüstü RTX 4070.
| Güç Profili | Grafik Puanı | Fizik Puanı | Birleşik Puan |
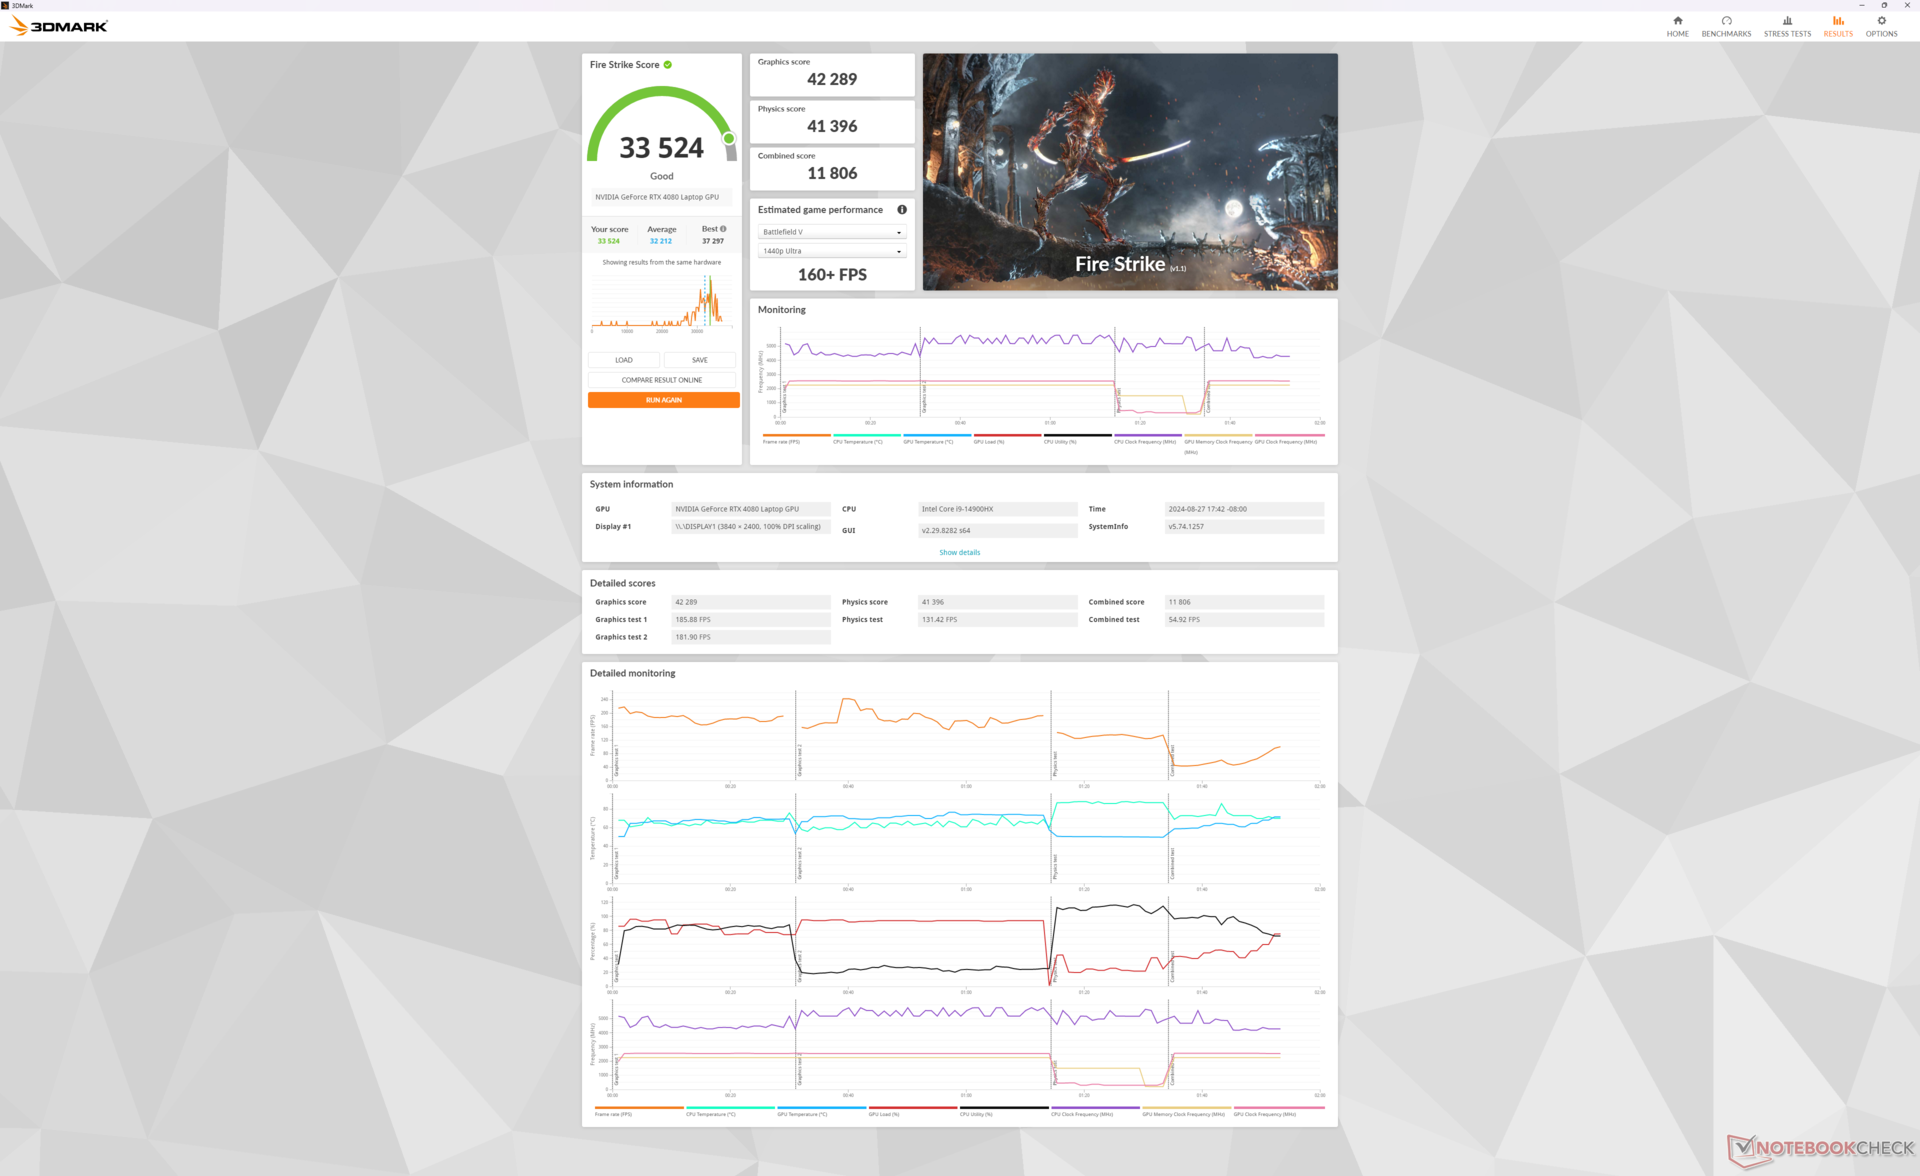
| Olağanüstü Performans (Cooler Boost açık) | 42289 | 41396 | 11806 |
| Aşırı Performans (Cooler Boost kapalı) | 41778 (-1%) | 40723 (-2%) | 11968 (-1%) |
| Dengeli Mod | 41673 (-2%) | 41013 (-1%) | 10404 (-12%) |
| Akü Gücü | 21731 (-49%) | 17988 (-57%) | 5809 (-51%) |
Aşırı Performans modundan Dengeli moda düşmek, yukarıdaki Stres Testi gözlemleriyle uyumlu olarak performansı çok az etkiliyor. Cooler Boost'u etkinleştirmek de fan gürültüsünü önemli ölçüde artırarak çekirdek sıcaklıklarını düşürmek dışında çok az fark yaratıyor.

| 3DMark Performance Rating - Percent | |
| NVIDIA GeForce RTX 4080 Founders Edition -1! | |
| Alienware m18 R2 -1! | |
| Razer Blade 18 2024 RZ09-0509 -1! | |
| MSI Raider 18 HX A14V | |
| Alienware m18 R1 AMD -2! | |
| Ortalama NVIDIA GeForce RTX 4080 Laptop GPU | |
| Zotac Gaming GeForce RTX 4070 AMP Airo -1! | |
| Asus ROG Strix Scar 17 SE G733CX-LL014W -1! | |
| Alienware x17 RTX 3080 P48E -2! | |
| Asus ROG Strix G18 G814JI -2! | |
| SCHENKER XMG Ultra 17 Comet Lake -2! | |
| MSI Pulse GL76 12UGK -1! | |
| 3DMark 11 - 1280x720 Performance GPU | |
| NVIDIA GeForce RTX 4080 Founders Edition | |
| Alienware m18 R2 | |
| Razer Blade 18 2024 RZ09-0509 | |
| Alienware m18 R1 AMD | |
| Zotac Gaming GeForce RTX 4070 AMP Airo | |
| Ortalama NVIDIA GeForce RTX 4080 Laptop GPU (45199 - 63128, n=24) | |
| MSI Raider 18 HX A14V | |
| Asus ROG Strix Scar 17 SE G733CX-LL014W | |
| Alienware x17 RTX 3080 P48E | |
| Asus ROG Strix G18 G814JI | |
| SCHENKER XMG Ultra 17 Comet Lake | |
| MSI Pulse GL76 12UGK | |
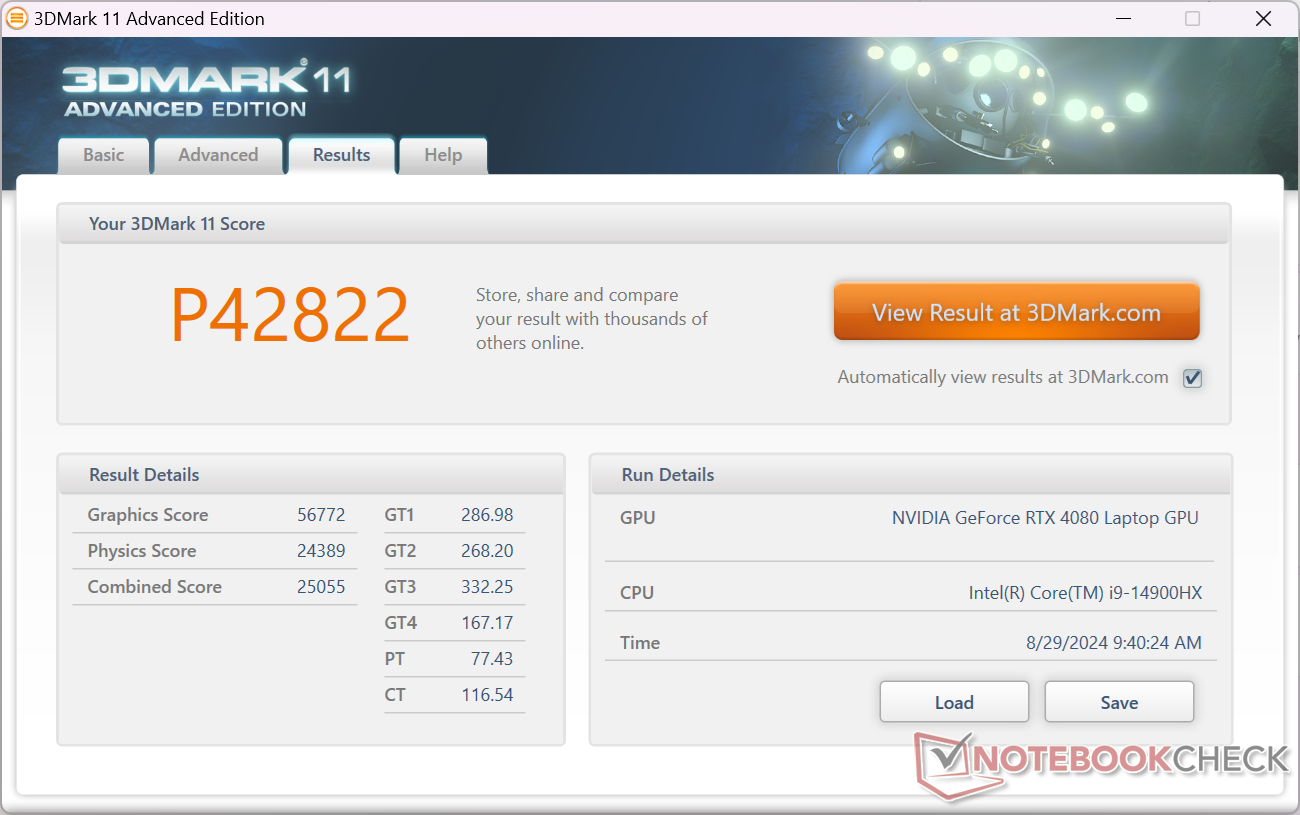
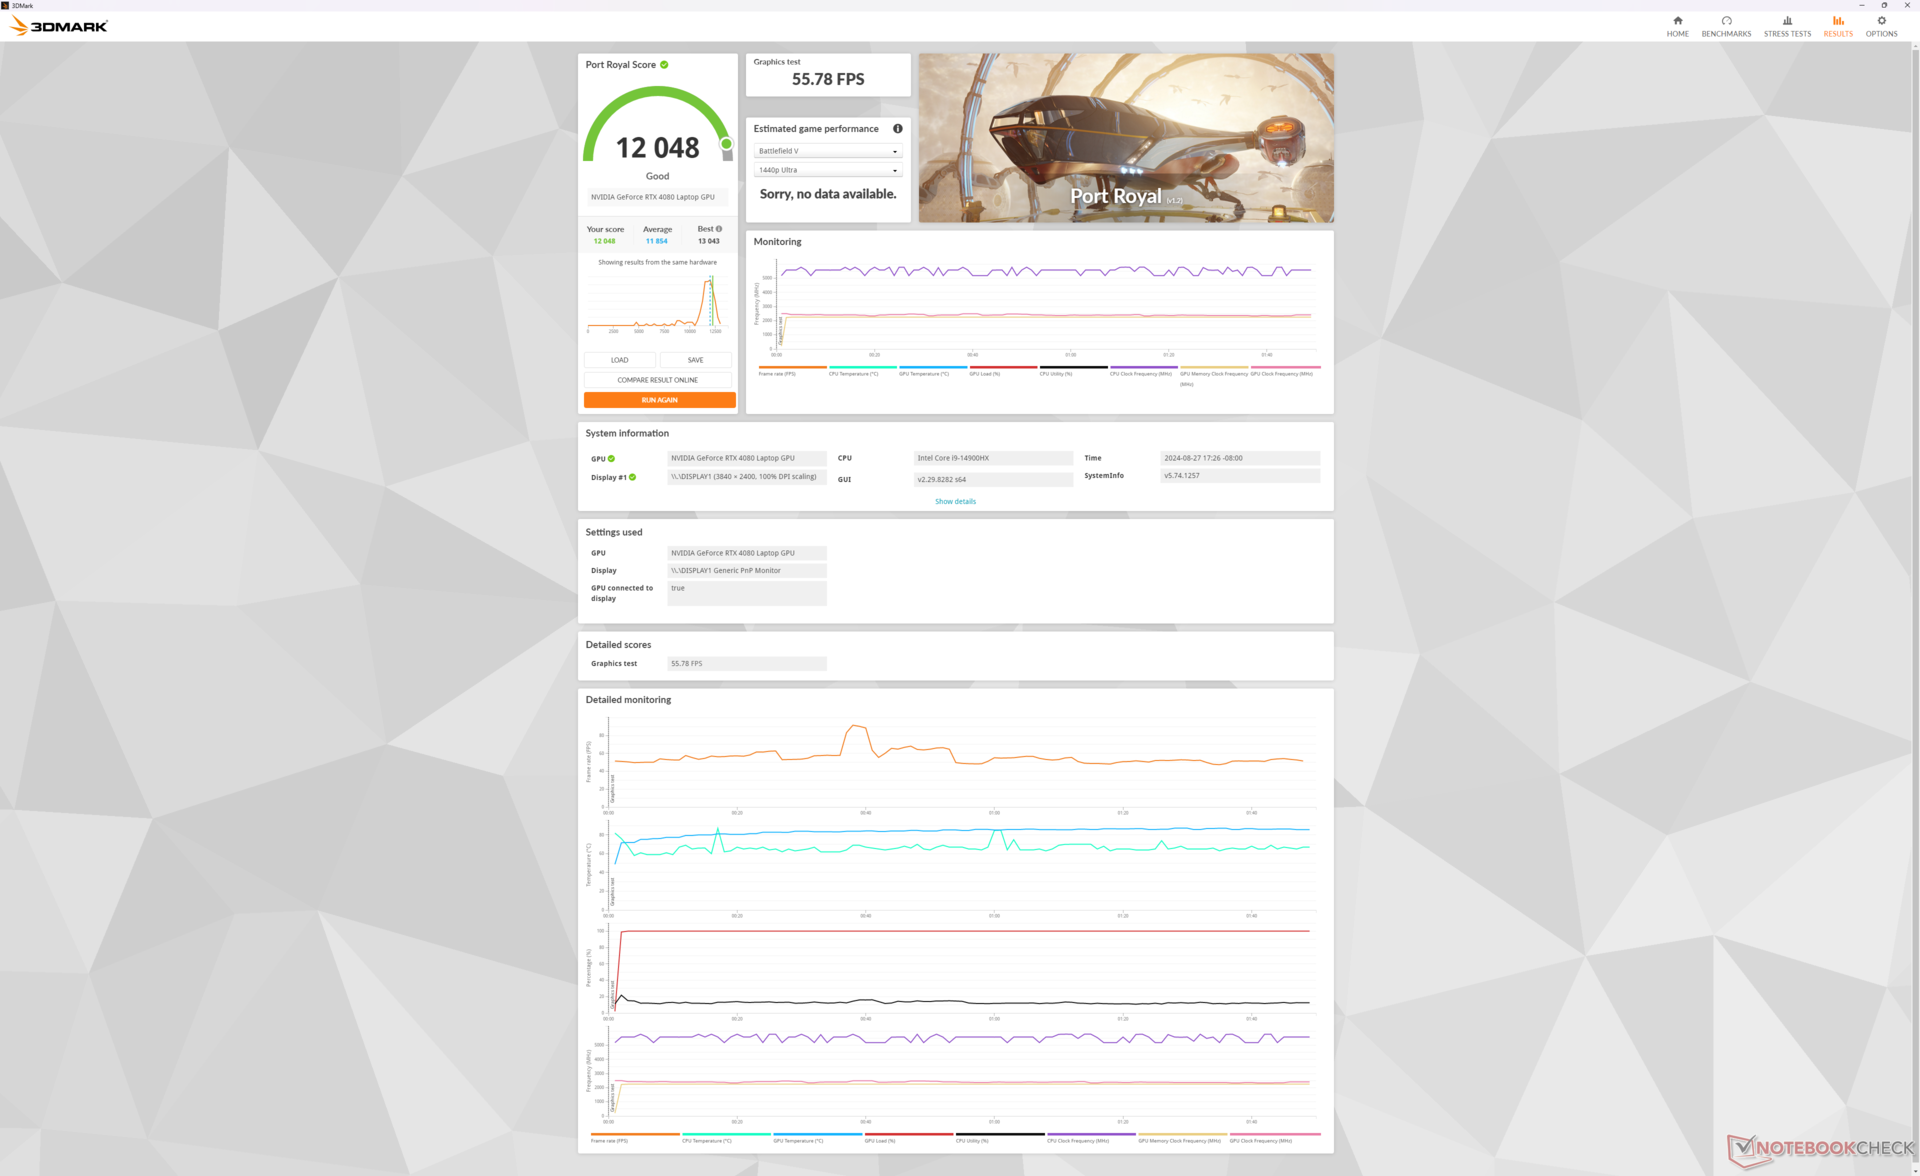
| 3DMark 11 Performance | 42822 puan | |
| 3DMark Fire Strike Score | 33524 puan | |
| 3DMark Time Spy Score | 18608 puan | |
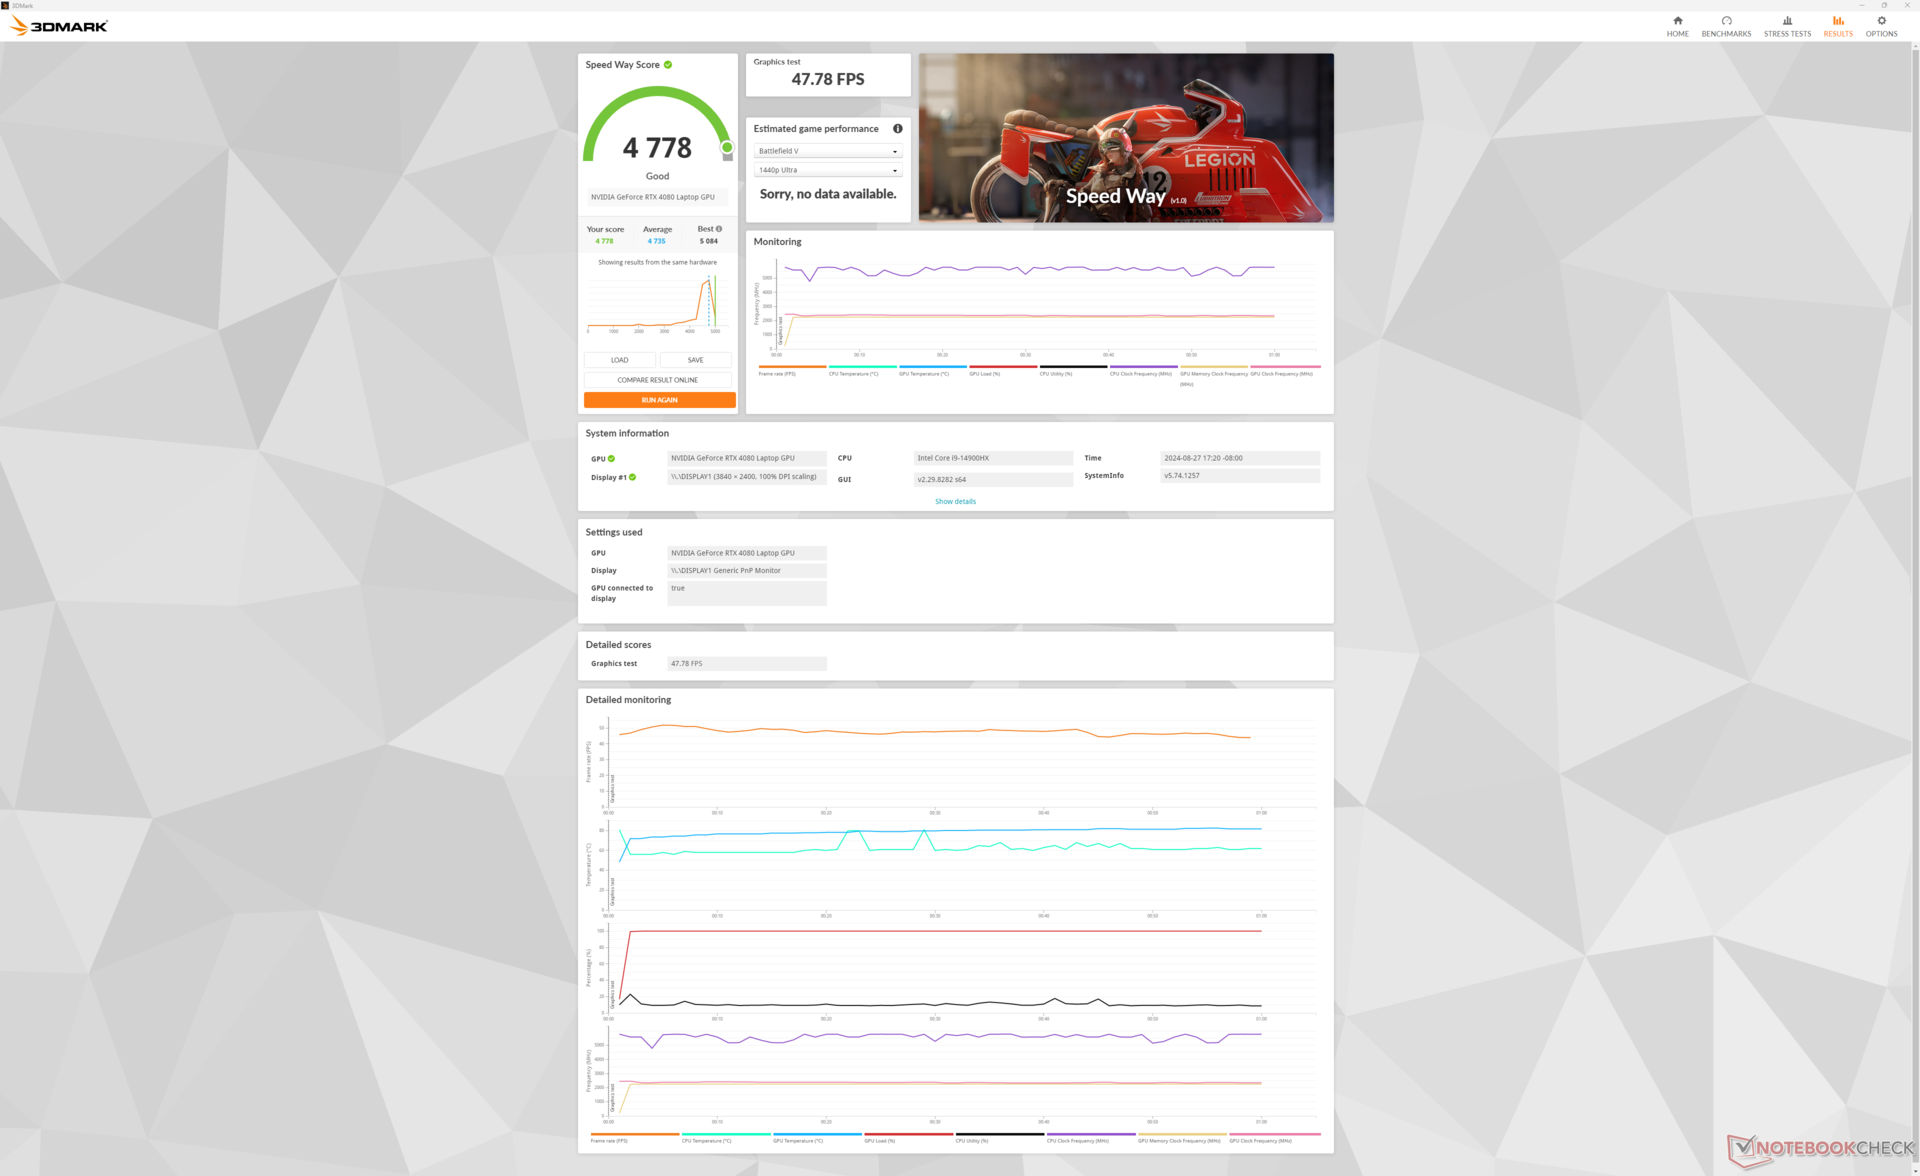
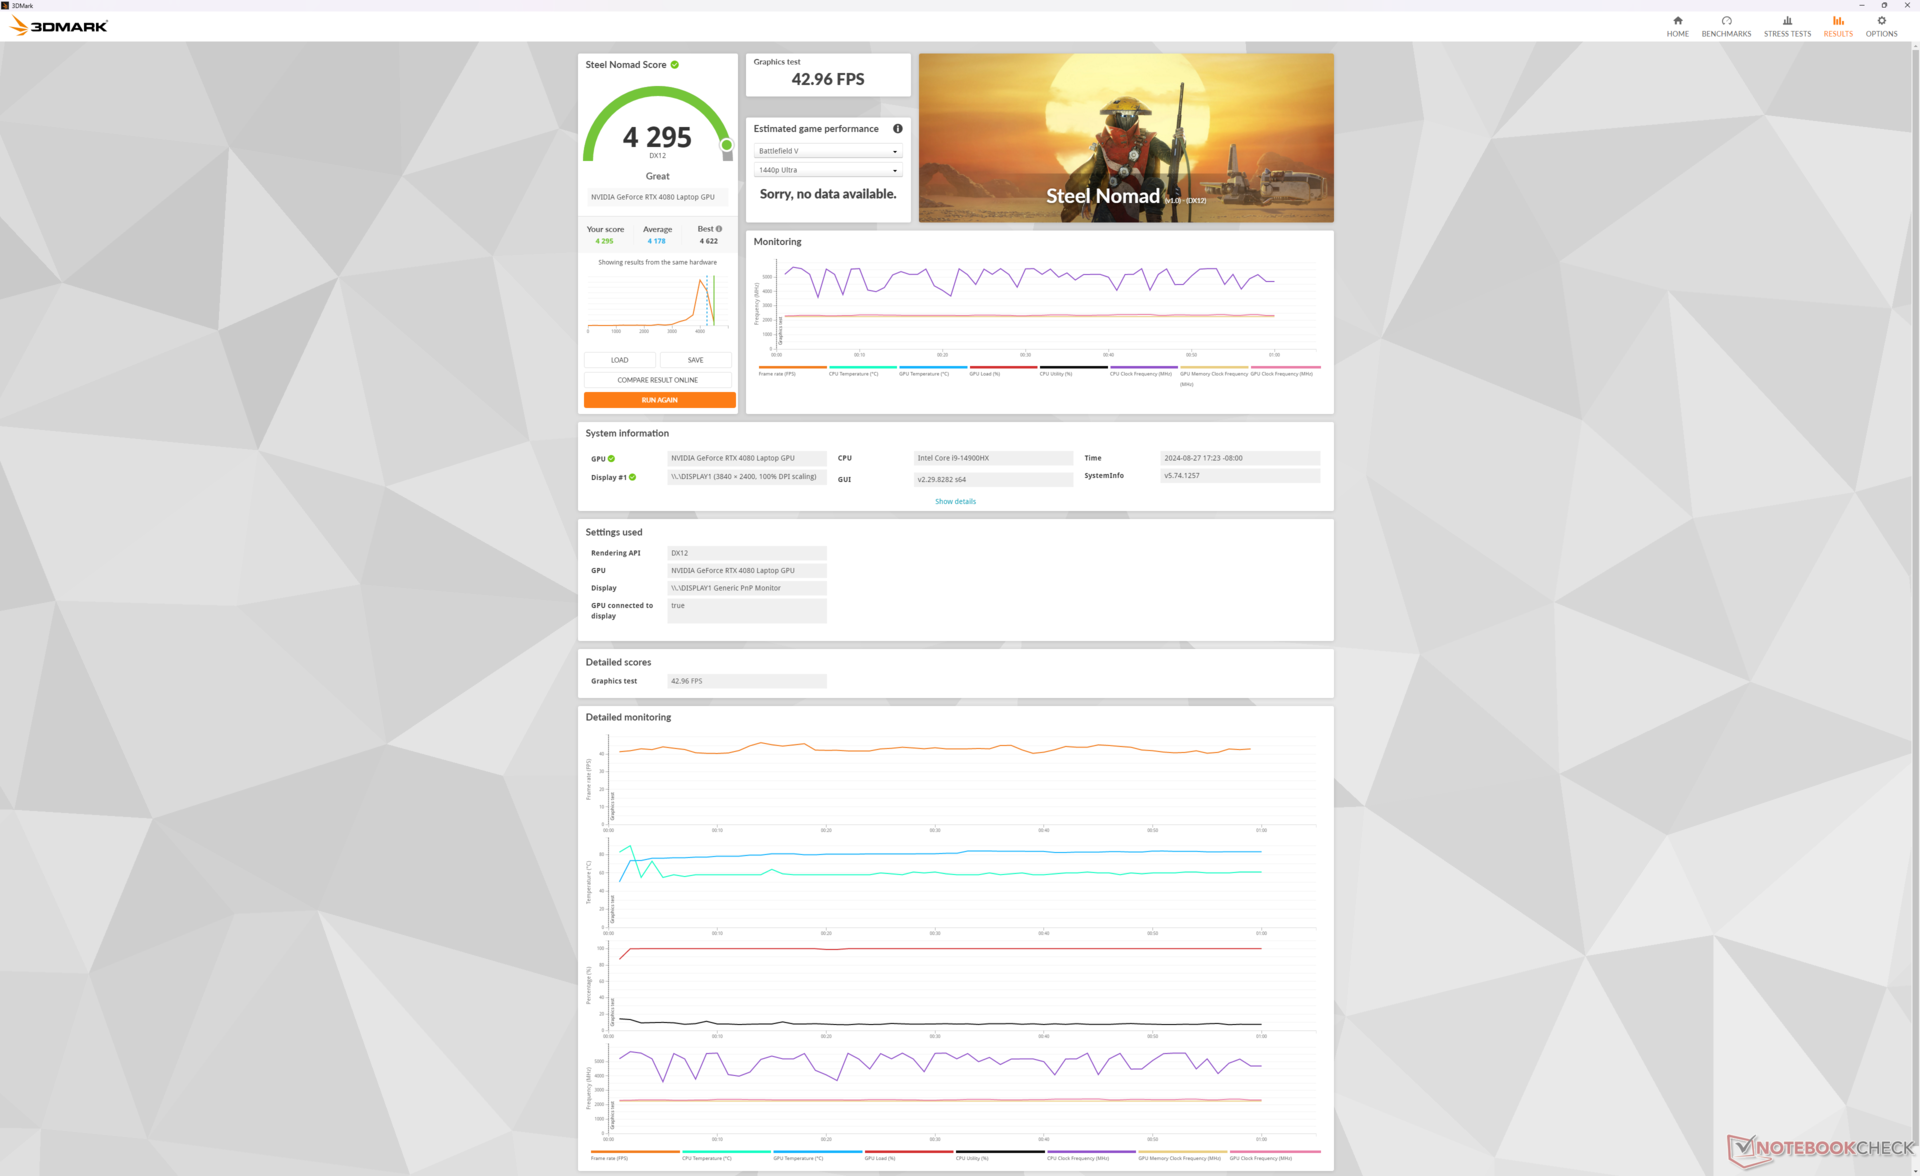
| 3DMark Steel Nomad Score | 4295 puan | |
Yardım | ||
* ... daha küçük daha iyidir
Oyun Performansı
Modern oyunlar doğal 4K UHD+ çözünürlükte gayet iyi çalışıyor. Cyberpunk 2077 gibi daha zorlu oyunları çalıştırırken kare hızlarını 60 FPS ' ye yaklaştırmak için DLSS önerilir.
Garip bir şekilde, Baldur's Gate 3, DX11 veya DX12 modlarında birden fazla sistem sıfırlamasından sonra bile ünitemizde başlatılamadı.
| Performance Rating - Percent | |
| Alienware m18 R2 | |
| MSI Titan 18 HX A14VIG | |
| MSI Raider 18 HX A14V | |
| Razer Blade 18 2024 RZ09-0509 -1! | |
| Acer Predator Helios 18 PH18-72-98MW | |
| Asus ROG Strix G18 G814JI | |
| GTA V - 1920x1080 Highest Settings possible AA:4xMSAA + FX AF:16x | |
| MSI Raider 18 HX A14V | |
| MSI Titan 18 HX A14VIG | |
| Alienware m18 R2 | |
| Acer Predator Helios 18 PH18-72-98MW | |
| Razer Blade 18 2024 RZ09-0509 | |
| Asus ROG Strix G18 G814JI | |
| Final Fantasy XV Benchmark - 1920x1080 High Quality | |
| Alienware m18 R2 | |
| MSI Titan 18 HX A14VIG | |
| MSI Raider 18 HX A14V | |
| Acer Predator Helios 18 PH18-72-98MW | |
| Razer Blade 18 2024 RZ09-0509 | |
| Asus ROG Strix G18 G814JI | |
| Strange Brigade - 1920x1080 ultra AA:ultra AF:16 | |
| MSI Titan 18 HX A14VIG | |
| Alienware m18 R2 | |
| MSI Raider 18 HX A14V | |
| Razer Blade 18 2024 RZ09-0509 | |
| Acer Predator Helios 18 PH18-72-98MW | |
| Asus ROG Strix G18 G814JI | |
| Dota 2 Reborn - 1920x1080 ultra (3/3) best looking | |
| Acer Predator Helios 18 PH18-72-98MW | |
| MSI Titan 18 HX A14VIG | |
| MSI Raider 18 HX A14V | |
| Alienware m18 R2 | |
| Razer Blade 18 2024 RZ09-0509 | |
| Asus ROG Strix G18 G814JI | |
| X-Plane 11.11 - 1920x1080 high (fps_test=3) | |
| MSI Raider 18 HX A14V | |
| Alienware m18 R2 | |
| Razer Blade 18 2024 RZ09-0509 | |
| MSI Titan 18 HX A14VIG | |
| Acer Predator Helios 18 PH18-72-98MW | |
| Asus ROG Strix G18 G814JI | |
| Far Cry 5 - 1920x1080 Ultra Preset AA:T | |
| Alienware m18 R2 | |
| MSI Titan 18 HX A14VIG | |
| MSI Raider 18 HX A14V | |
| Asus ROG Strix G18 G814JI | |
| Acer Predator Helios 18 PH18-72-98MW | |
| Tiny Tina's Wonderlands | |
| 1920x1080 High Preset (DX12) | |
| Alienware m18 R2 | |
| MSI Raider 18 HX A14V | |
| Ortalama NVIDIA GeForce RTX 4080 Laptop GPU (166.7 - 213, n=6) | |
| 1920x1080 Badass Preset (DX12) | |
| Alienware m18 R2 | |
| MSI Raider 18 HX A14V | |
| Alienware m18 R1 AMD | |
| Ortalama NVIDIA GeForce RTX 4080 Laptop GPU (112.9 - 167.1, n=9) | |
| 2560x1440 Badass Preset (DX12) | |
| Alienware m18 R2 | |
| MSI Raider 18 HX A14V | |
| Alienware m18 R1 AMD | |
| Ortalama NVIDIA GeForce RTX 4080 Laptop GPU (85 - 114.8, n=9) | |
| 3840x2160 Badass Preset (DX12) | |
| Alienware m18 R2 | |
| MSI Raider 18 HX A14V | |
| Alienware m18 R1 AMD | |
| Ortalama NVIDIA GeForce RTX 4080 Laptop GPU (46.4 - 60.9, n=9) | |
| Final Fantasy XV Benchmark | |
| 1920x1080 High Quality | |
| NVIDIA GeForce RTX 4080 Founders Edition | |
| Alienware m18 R2 | |
| MSI Raider 18 HX A14V | |
| Zotac Gaming GeForce RTX 4070 AMP Airo | |
| Ortalama NVIDIA GeForce RTX 4080 Laptop GPU (129 - 182.1, n=23) | |
| Razer Blade 18 2024 RZ09-0509 | |
| Alienware m18 R1 AMD | |
| Asus ROG Strix Scar 17 SE G733CX-LL014W | |
| Asus ROG Strix G18 G814JI | |
| Alienware x17 RTX 3080 P48E | |
| MSI Pulse GL76 12UGK | |
| 2560x1440 High Quality | |
| NVIDIA GeForce RTX 4080 Founders Edition | |
| Alienware m18 R2 | |
| MSI Raider 18 HX A14V | |
| Razer Blade 18 2024 RZ09-0509 | |
| Zotac Gaming GeForce RTX 4070 AMP Airo | |
| Ortalama NVIDIA GeForce RTX 4080 Laptop GPU (98 - 142, n=22) | |
| Alienware m18 R1 AMD | |
| Asus ROG Strix Scar 17 SE G733CX-LL014W | |
| Alienware x17 RTX 3080 P48E | |
| 3840x2160 High Quality | |
| NVIDIA GeForce RTX 4080 Founders Edition | |
| Alienware m18 R2 | |
| Razer Blade 18 2024 RZ09-0509 | |
| MSI Raider 18 HX A14V | |
| Zotac Gaming GeForce RTX 4070 AMP Airo | |
| Ortalama NVIDIA GeForce RTX 4080 Laptop GPU (60.8 - 79.5, n=13) | |
| Alienware m18 R1 AMD | |
| Alienware x17 RTX 3080 P48E | |
Cyberpunk 2077 ultra FPS Chart
| düşük | orta | yüksek | ultra | QHD | 4K | |
|---|---|---|---|---|---|---|
| GTA V (2015) | 185.1 | 183.8 | 181.6 | 143.4 | 134.6 | 158.3 |
| Dota 2 Reborn (2015) | 218 | 193.1 | 184.6 | 172.5 | 166.4 | |
| Final Fantasy XV Benchmark (2018) | 223 | 212 | 177 | 141.8 | 78.6 | |
| X-Plane 11.11 (2018) | 199 | 178.5 | 143.5 | 119.3 | ||
| Far Cry 5 (2018) | 173 | 163 | 151 | 149 | 96 | |
| Strange Brigade (2018) | 504 | 408 | 378 | 349 | 246 | 122.6 |
| Tiny Tina's Wonderlands (2022) | 352.5 | 292.6 | 203.3 | 159.4 | 111.2 | 60.9 |
| F1 22 (2022) | 305 | 299 | 271 | 121.2 | 77.8 | 39.8 |
| Cyberpunk 2077 2.2 Phantom Liberty (2023) | 150.6 | 150 | 140.7 | 125.5 | 82.5 | 35.1 |
Emisyonlar - Rölantide Çalışırken Sessiz, Oyun Oynarken Gürültülü
Sistem Gürültüsü
Fan gürültüsü ve davranışı aşağıdakilere benzer Titan 18 HX soğutma çözümü farklılıklarına rağmen. Fanlar, Titan'da olduğu gibi Dengeli modda veya Sessiz modda web'de gezinirken bile titreşmeye eğilimlidir, ancak gürültü artışı neyse ki dikkat dağıtıcı olacak kadar keskin değildir.
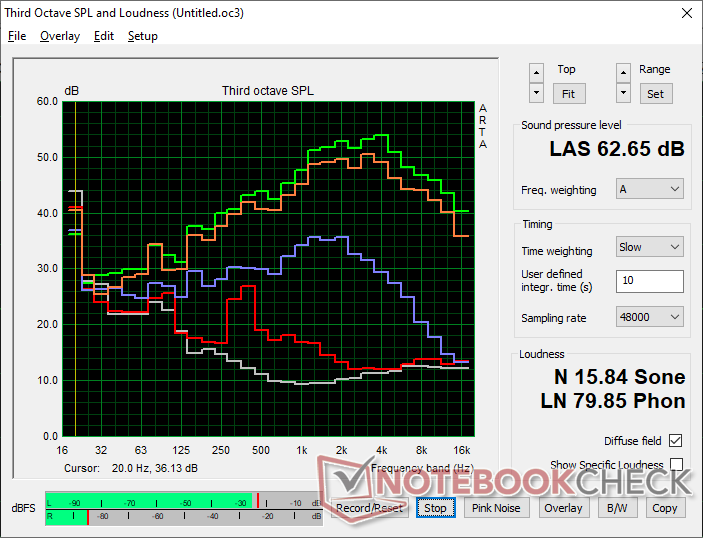
MSI Center, fan gürültüsü seçtiğiniz güç profiline yakından bağlı olduğu için oyun deneyimini doğrudan etkiliyor. Cyberpunk 2077 'yi Dengeli modda, Cooler Boost kapalıyken Extreme Performance modunda ve Cooler Boost açıkken Extreme Performance modunda çalıştırdığınızda sırasıyla 52,8 dB(A), 59,4 dB(A) ve 62,7 dB(A) sabit fan gürültüsü elde edersiniz. Dengeli ve Aşırı Performans modları arasındaki gürültü farkı, aralarındaki performans farkı küçük olsa da önemlidir, bu da çoğu oyun senaryosu için Dengeli modun önerildiği anlamına gelir. Cooler Boost bu nedenle çoğunlukla manuel hız aşırtma için kullanışlıdır, aksi takdirde stok ayarlarında önemli bir oyun avantajı sağlamaz.
Oyun oynarken düşük ila orta 50 dB(A) aralığı en çok Blade 18 veya Alienware m18 R2. Özellikle Aşırı Performans modunda oyun oynarken kulaklık kullanılması önerilir.
Ses yüksekliği
| Boşta |
| 28.6 / 28.6 / 31.3 dB |
| Çalışırken |
| 44.1 / 62.7 dB |
 | ||
30 dB sessiz 40 dB(A) duyulabilirlik 50 dB(A) gürültülü |
||
min: | ||
| MSI Raider 18 HX A14V NVIDIA GeForce RTX 4080 Laptop GPU, i9-14900HX, Samsung PM9A1 MZVL22T0HBLB | Razer Blade 18 2024 RZ09-0509 NVIDIA GeForce RTX 4090 Laptop GPU, i9-14900HX | Alienware m18 R2 NVIDIA GeForce RTX 4090 Laptop GPU, i9-14900HX, SK Hynix PC811 HFS002TEM9X152N | MSI Titan 18 HX A14VIG NVIDIA GeForce RTX 4090 Laptop GPU, i9-14900HX, 2x Samsung PM9A1a MZVL22T0HDLB (RAID 0) | Asus ROG Strix G18 G814JI NVIDIA GeForce RTX 4070 Laptop GPU, i7-13650HX, Micron 2400 MTFDKBA1T0QFM | Acer Predator Helios 18 PH18-72-98MW NVIDIA GeForce RTX 4090 Laptop GPU, i9-14900HX, 2x SK Hynix HFS001TEJ9X115N (RAID 0) | |
|---|---|---|---|---|---|---|
| Noise | 7% | 11% | 10% | 8% | -12% | |
| kapalı / ortam * | 23.3 | 23.4 -0% | 23.6 -1% | 22.8 2% | 25 -7% | 25 -7% |
| Idle Minimum * | 28.6 | 23.9 16% | 23.8 17% | 23.8 17% | 26 9% | 30 -5% |
| Idle Average * | 28.6 | 28.2 1% | 26.1 9% | 23.8 17% | 28 2% | 36 -26% |
| Idle Maximum * | 31.3 | 29 7% | 31.5 -1% | 28 11% | 29 7% | 44 -41% |
| Load Average * | 44.1 | 36.8 17% | 31.5 29% | 38 14% | 41 7% | 48 -9% |
| Cyberpunk 2077 ultra * | 59.4 | |||||
| Load Maximum * | 62.7 | 61.1 3% | 56.6 10% | 62.8 -0% | 46 27% | 51 19% |
| Witcher 3 ultra * | 54.1 | 52.1 | 57.3 | 44 | 49 |
* ... daha küçük daha iyidir
Sıcaklık
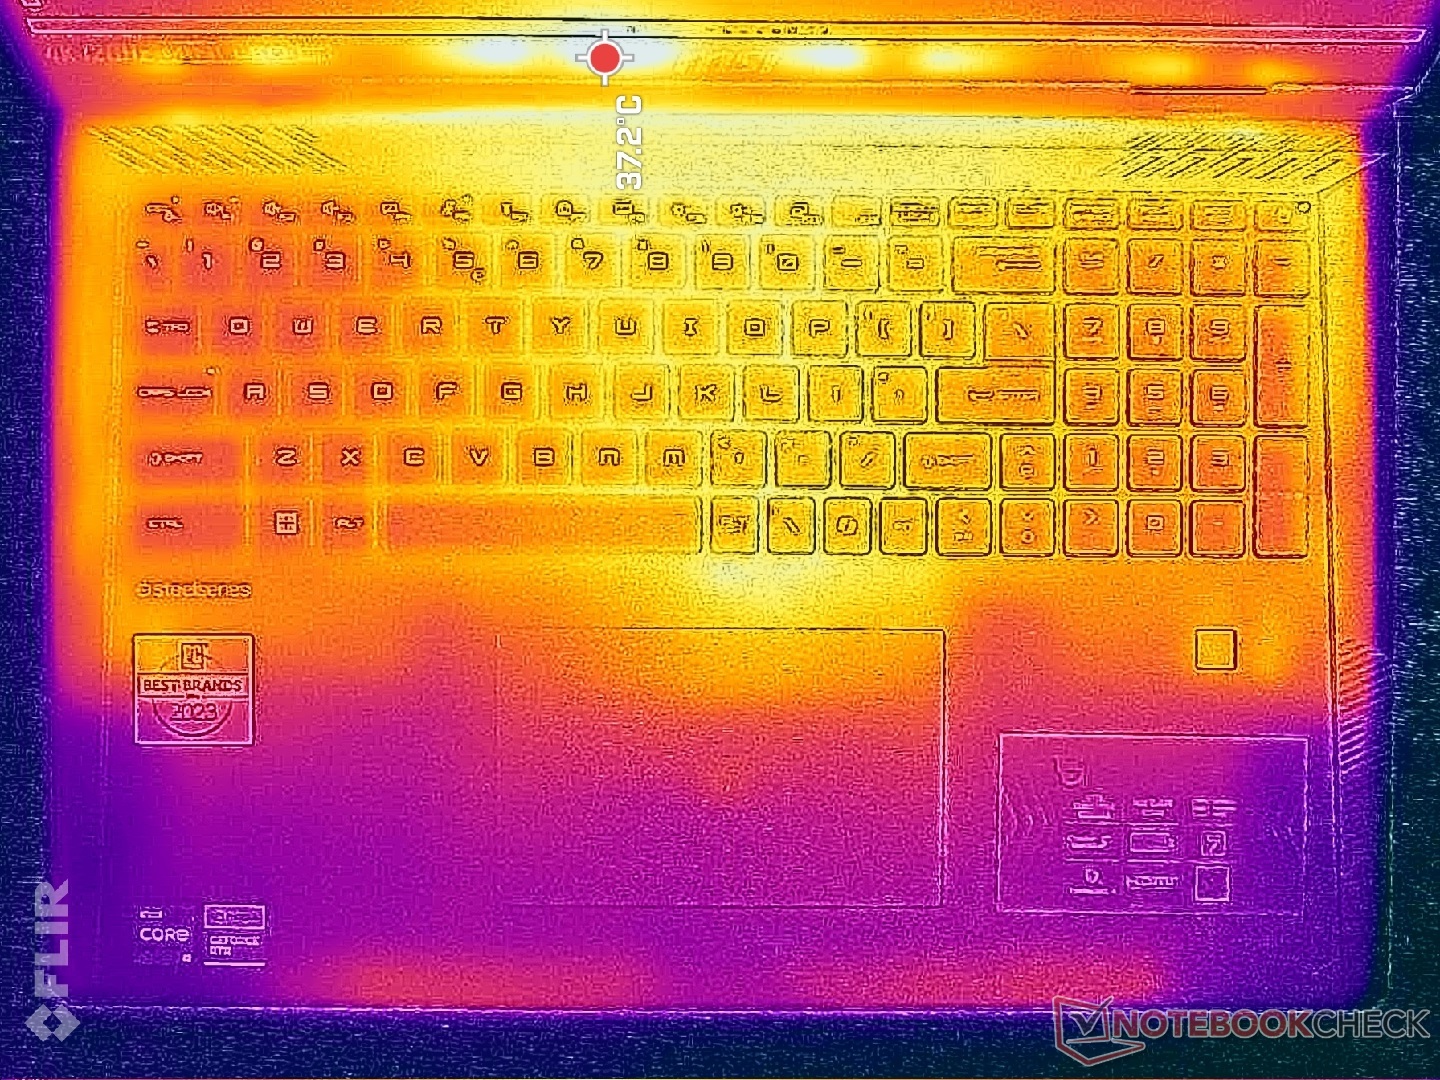
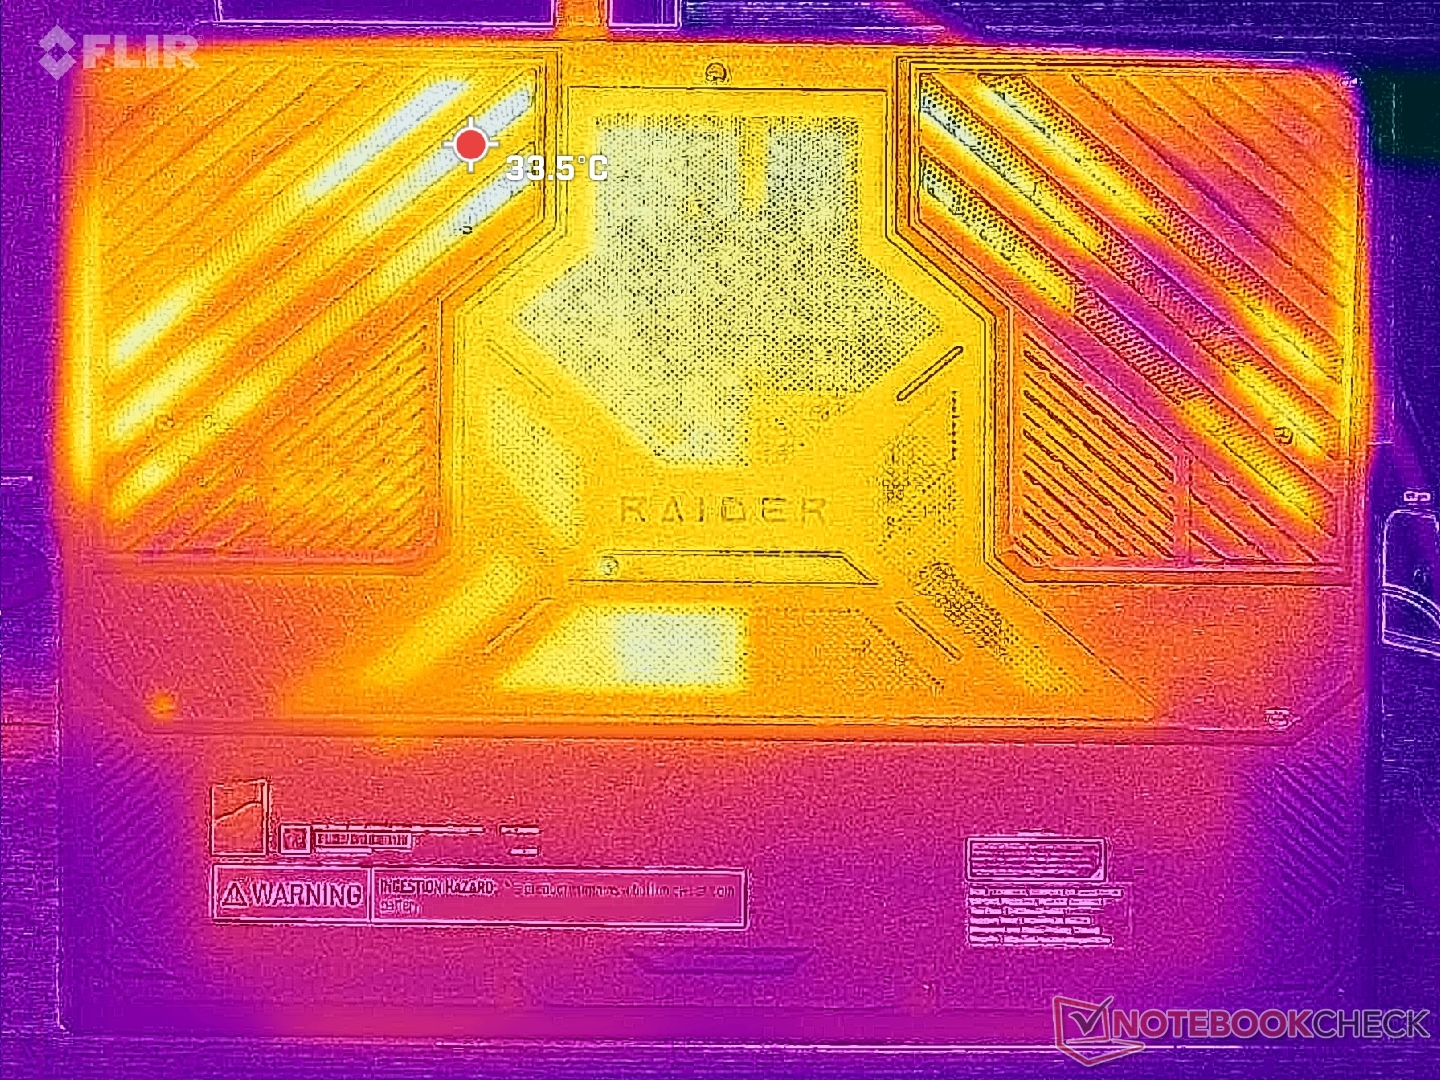
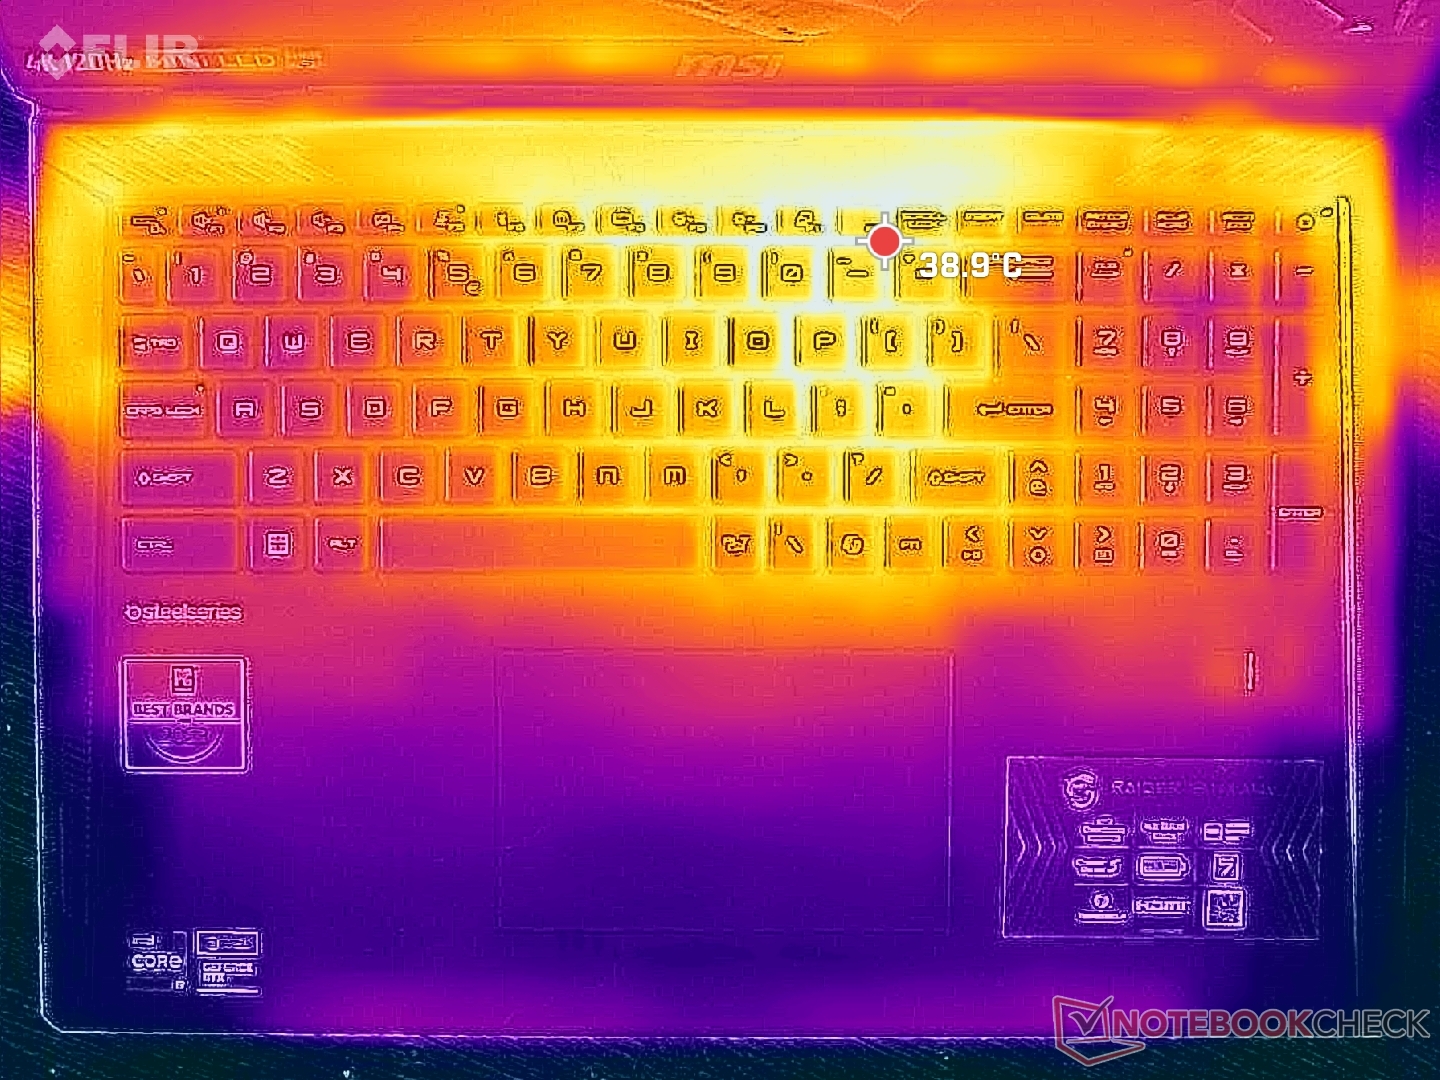
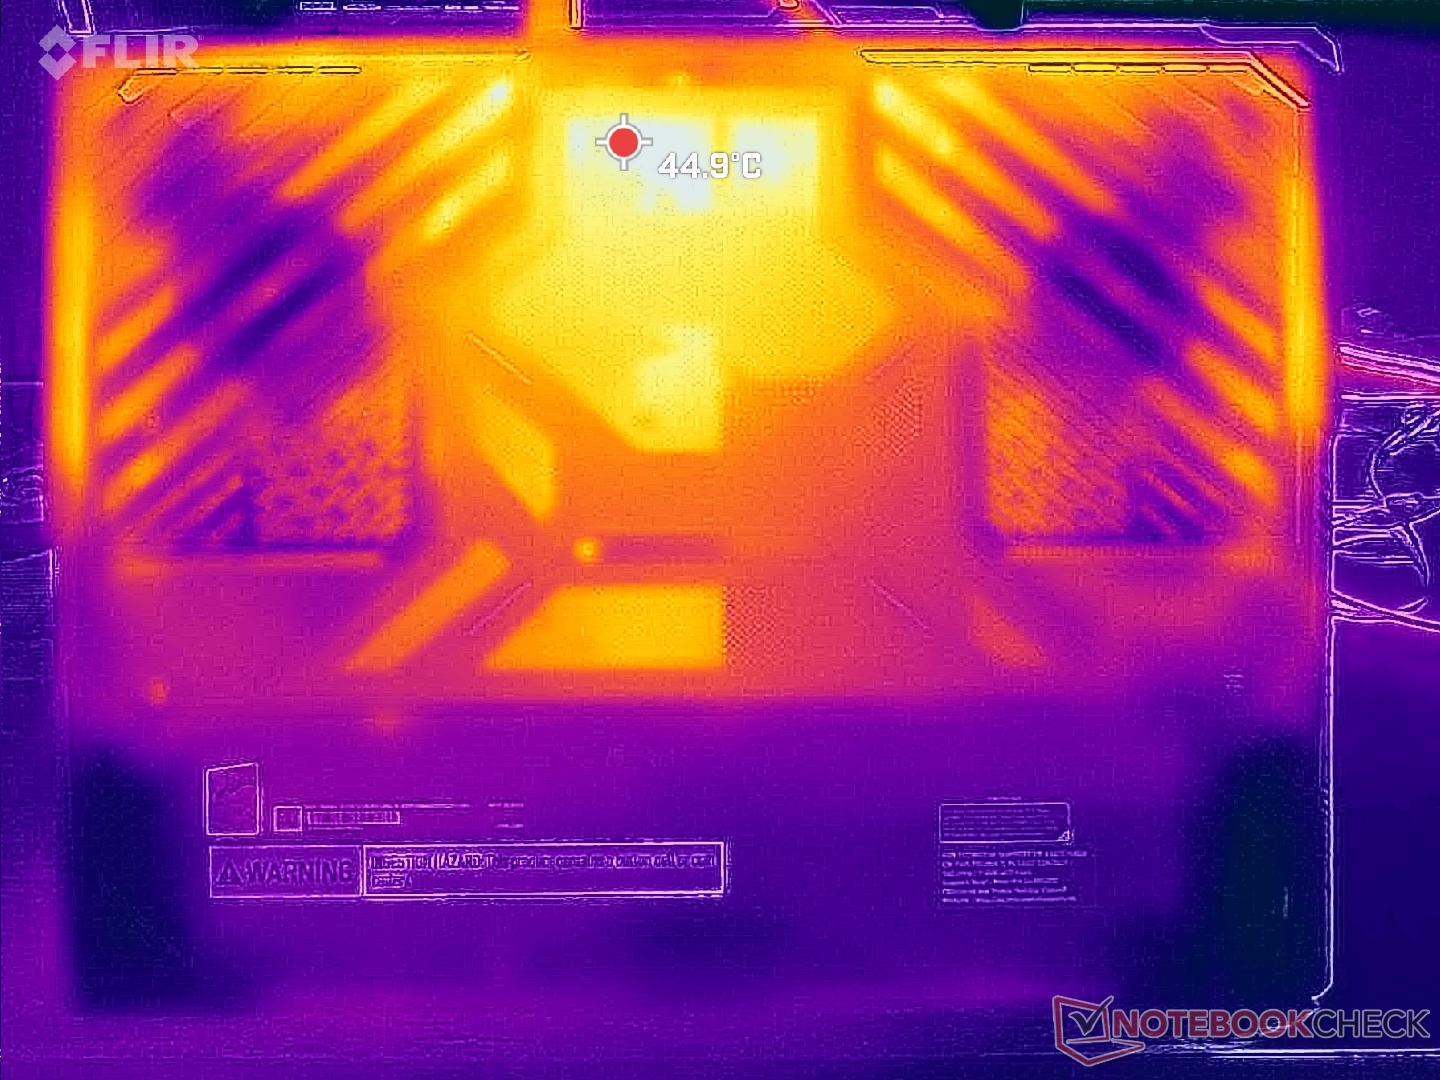
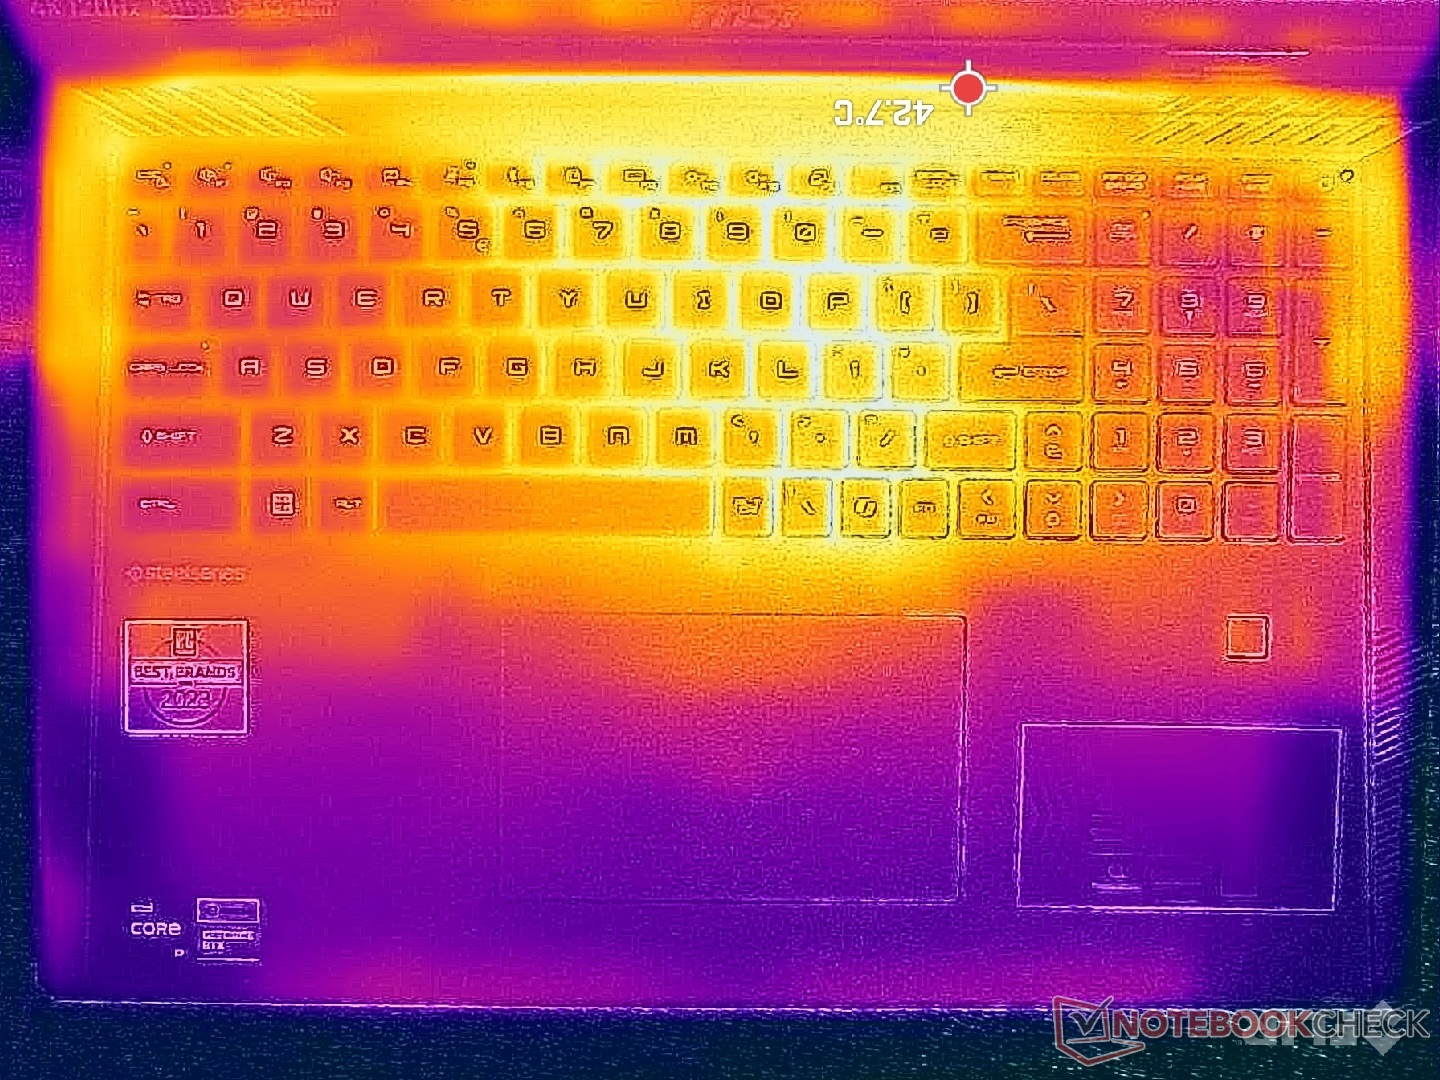
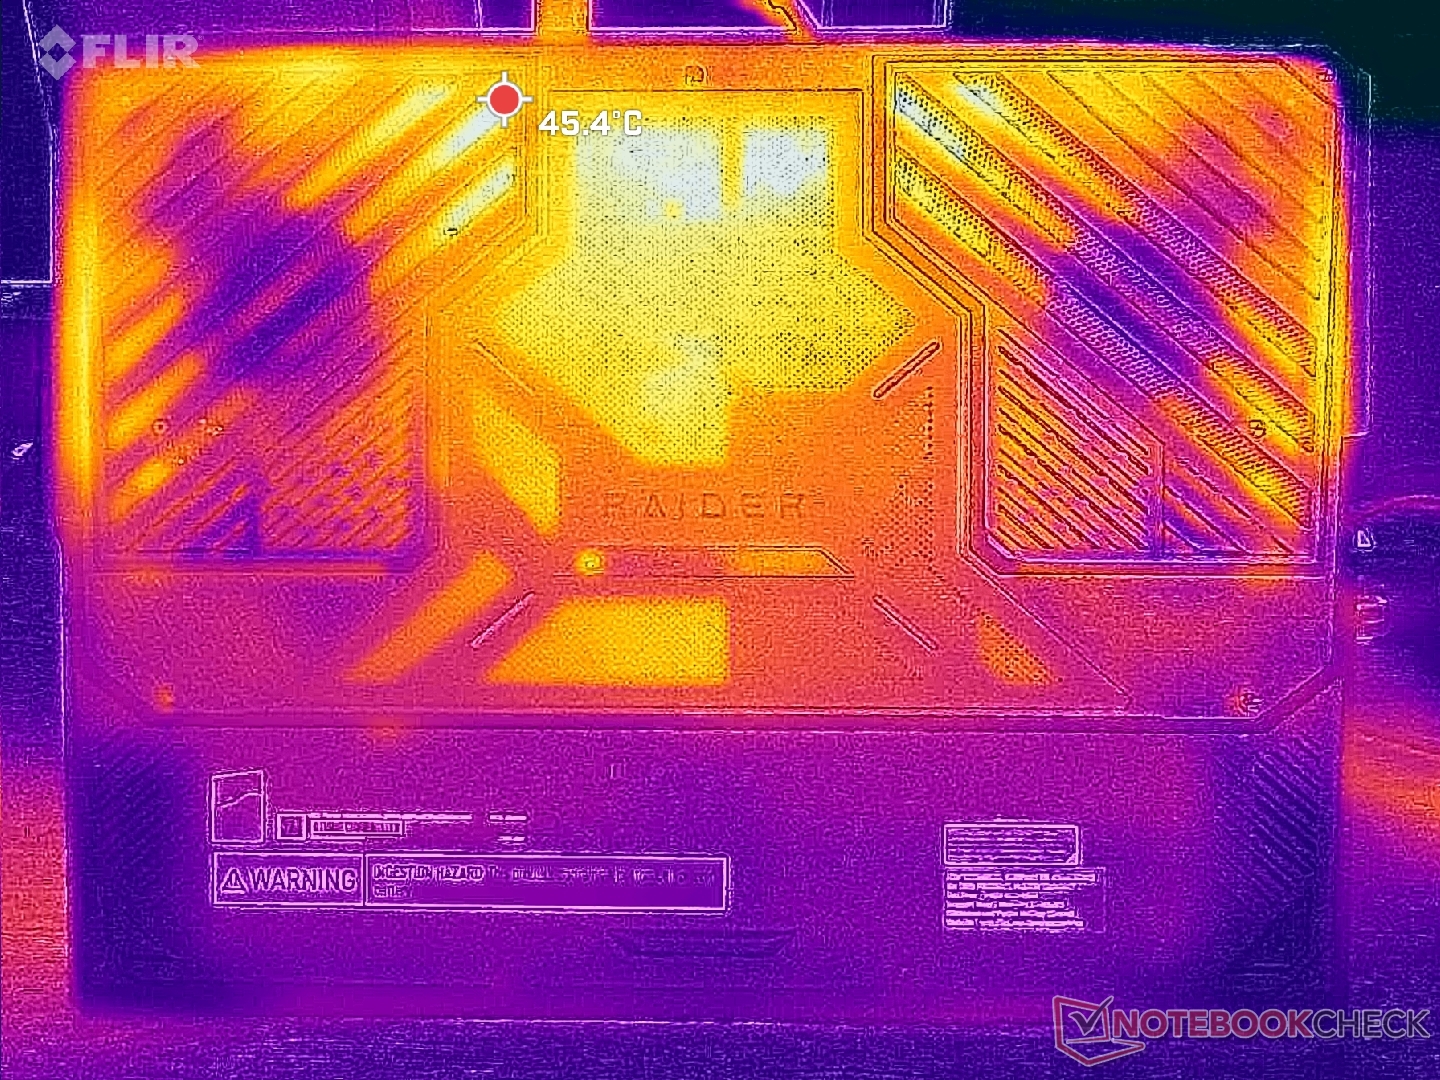
Titan 18 HX'te olduğu gibi oyun oynarken sıcak noktalar 40 C'nin biraz üzerine çıkabilir. Daha sıcak bölgeler klavyenin merkezine doğru olduğundan WASD tuşları, numpad ve avuç içi dayanakları çok daha serin ve cilt için daha rahat kalacaktır.
(±) Üst taraftaki maksimum sıcaklık, 40.4 °C / 105 F ortalamasına kıyasla 40.8 °C / 105 F'dir. , Gaming sınıfı için 21.2 ile 68.8 °C arasında değişir.
(±) Alt kısım, 43.2 °C / 110 F ortalamasına kıyasla maksimum 43.4 °C / 110 F'ye kadar ısınır
(±) Boşta kullanımda, üst tarafın ortalama sıcaklığı 33.7 °C / 93 F olup, cihazın 33.9 °C / 93 F.
(±) 3: The average temperature for the upper side is 34.4 °C / 94 F, compared to the average of 33.9 °C / 93 F for the class Gaming.
(+) Avuç içi dayanakları ve dokunmatik yüzey maksimum (32.6 °C / 90.7 F) cilt sıcaklığına ulaşıyor ve bu nedenle sıcak değil.
(-) Benzer cihazların avuç içi dayanağı alanının ortalama sıcaklığı 28.9 °C / 84 F (-3.7 °C / -6.7 F) idi.
| MSI Raider 18 HX A14V Intel Core i9-14900HX, NVIDIA GeForce RTX 4080 Laptop GPU | Razer Blade 18 2024 RZ09-0509 Intel Core i9-14900HX, NVIDIA GeForce RTX 4090 Laptop GPU | Alienware m18 R2 Intel Core i9-14900HX, NVIDIA GeForce RTX 4090 Laptop GPU | MSI Titan 18 HX A14VIG Intel Core i9-14900HX, NVIDIA GeForce RTX 4090 Laptop GPU | Asus ROG Strix G18 G814JI Intel Core i7-13650HX, NVIDIA GeForce RTX 4070 Laptop GPU | Acer Predator Helios 18 PH18-72-98MW Intel Core i9-14900HX, NVIDIA GeForce RTX 4090 Laptop GPU | |
|---|---|---|---|---|---|---|
| Heat | -1% | -5% | 6% | 5% | -6% | |
| Maximum Upper Side * | 40.8 | 43.2 -6% | 41.2 -1% | 37.8 7% | 45 -10% | 43 -5% |
| Maximum Bottom * | 43.4 | 42.6 2% | 34.6 20% | 37.6 13% | 47 -8% | 59 -36% |
| Idle Upper Side * | 36.4 | 36 1% | 42.8 -18% | 34.8 4% | 28 23% | 32 12% |
| Idle Bottom * | 36.4 | 36.4 -0% | 43.6 -20% | 36 1% | 31 15% | 34 7% |
* ... daha küçük daha iyidir
Konuşmacılar
MSI Raider 18 HX A14V ses analizi
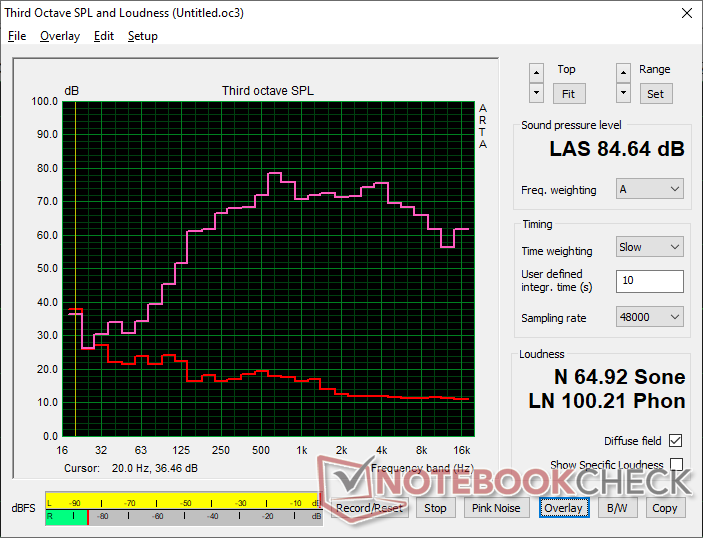
(+) | hoparlörler nispeten yüksek sesle çalabilir (84.6 dB)
Bas 100 - 315Hz
(±) | azaltılmış bas - ortalama olarak medyandan 9.2% daha düşük
(±) | Bas doğrusallığı ortalamadır (9.2% delta - önceki frekans)
Ortalar 400 - 2000 Hz
(+) | dengeli ortalar - medyandan yalnızca 4.3% uzakta
(+) | orta frekanslar doğrusaldır (5.1% deltadan önceki frekansa)
Yüksekler 2 - 16 kHz
(+) | dengeli yüksekler - medyandan yalnızca 3.8% uzakta
(+) | yüksekler doğrusaldır (4.9% deltadan önceki frekansa)
Toplam 100 - 16.000 Hz
(+) | genel ses doğrusaldır (11.9% ortancaya göre fark)
Aynı sınıfla karşılaştırıldığında
» Bu sınıftaki tüm test edilen cihazların %11%'si daha iyi, 4% benzer, 85% daha kötüydü
» En iyisinin deltası 6% idi, ortalama 18% idi, en kötüsü 132% idi
Test edilen tüm cihazlarla karşılaştırıldığında
» Test edilen tüm cihazların %8'si daha iyi, 2 benzer, % 90 daha kötüydü
» En iyisinin deltası 4% idi, ortalama 24% idi, en kötüsü 134% idi
Apple MacBook Pro 16 2021 M1 Pro ses analizi
(+) | hoparlörler nispeten yüksek sesle çalabilir (84.7 dB)
Bas 100 - 315Hz
(+) | iyi bas - medyandan yalnızca 3.8% uzakta
(+) | bas doğrusaldır (5.2% delta ile önceki frekans)
Ortalar 400 - 2000 Hz
(+) | dengeli ortalar - medyandan yalnızca 1.3% uzakta
(+) | orta frekanslar doğrusaldır (2.1% deltadan önceki frekansa)
Yüksekler 2 - 16 kHz
(+) | dengeli yüksekler - medyandan yalnızca 1.9% uzakta
(+) | yüksekler doğrusaldır (2.7% deltadan önceki frekansa)
Toplam 100 - 16.000 Hz
(+) | genel ses doğrusaldır (4.6% ortancaya göre fark)
Aynı sınıfla karşılaştırıldığında
» Bu sınıftaki tüm test edilen cihazların %0%'si daha iyi, 0% benzer, 100% daha kötüydü
» En iyisinin deltası 5% idi, ortalama 18% idi, en kötüsü 45% idi
Test edilen tüm cihazlarla karşılaştırıldığında
» Test edilen tüm cihazların %0'si daha iyi, 0 benzer, % 100 daha kötüydü
» En iyisinin deltası 4% idi, ortalama 24% idi, en kötüsü 134% idi
Enerji Yönetimi
Güç Tüketimi
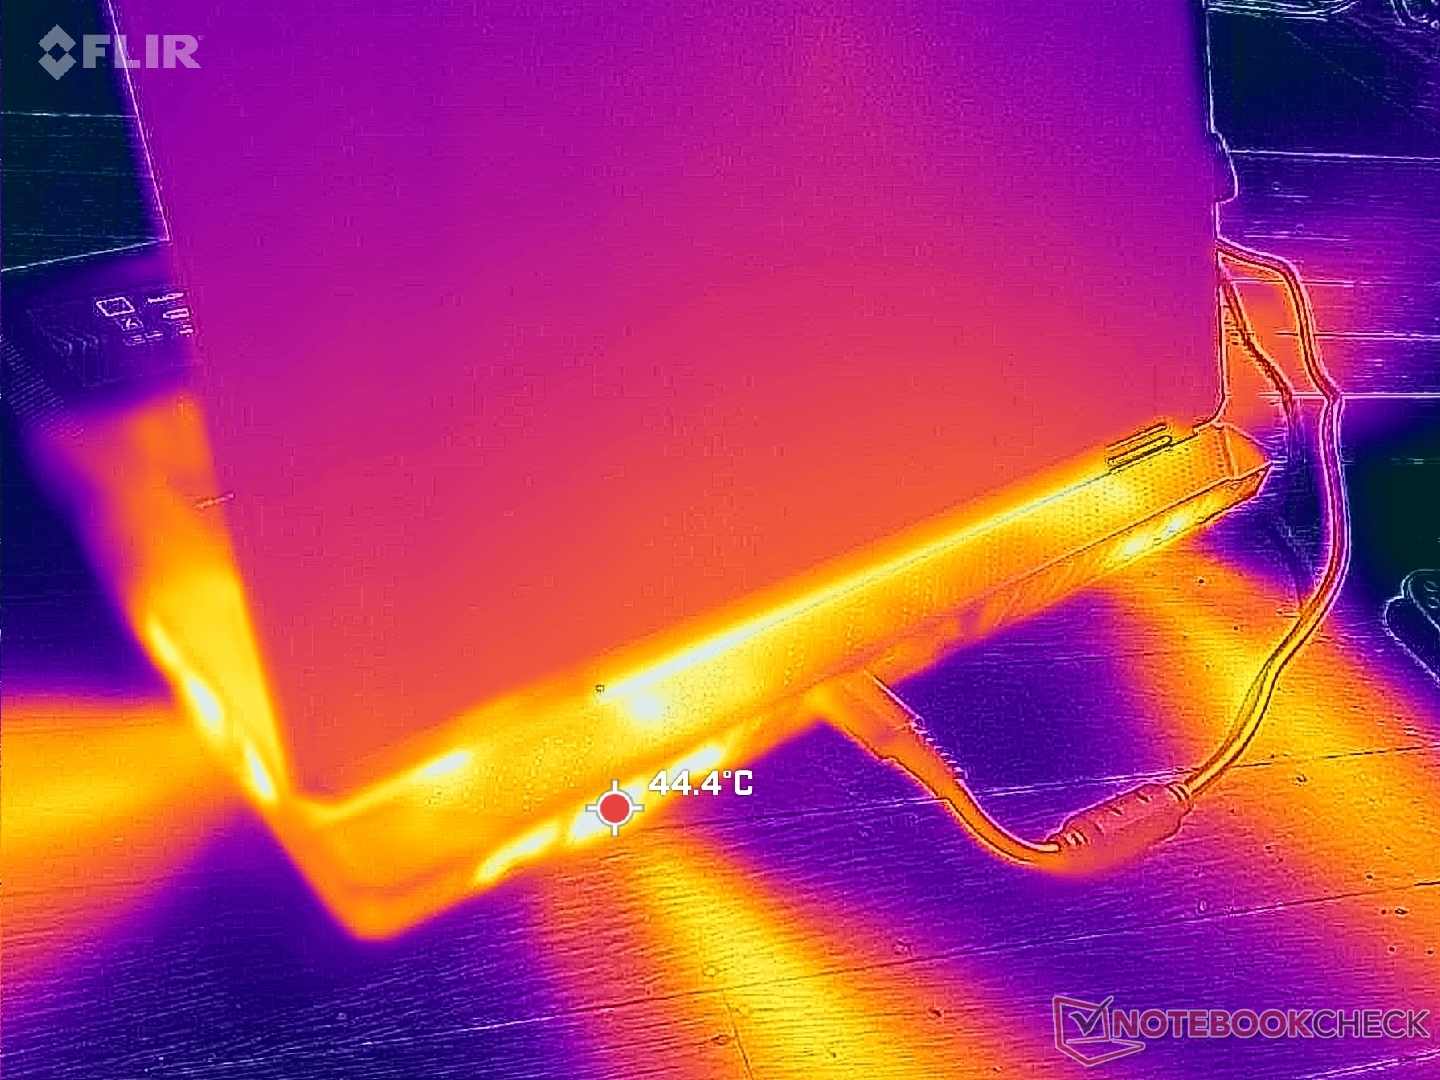
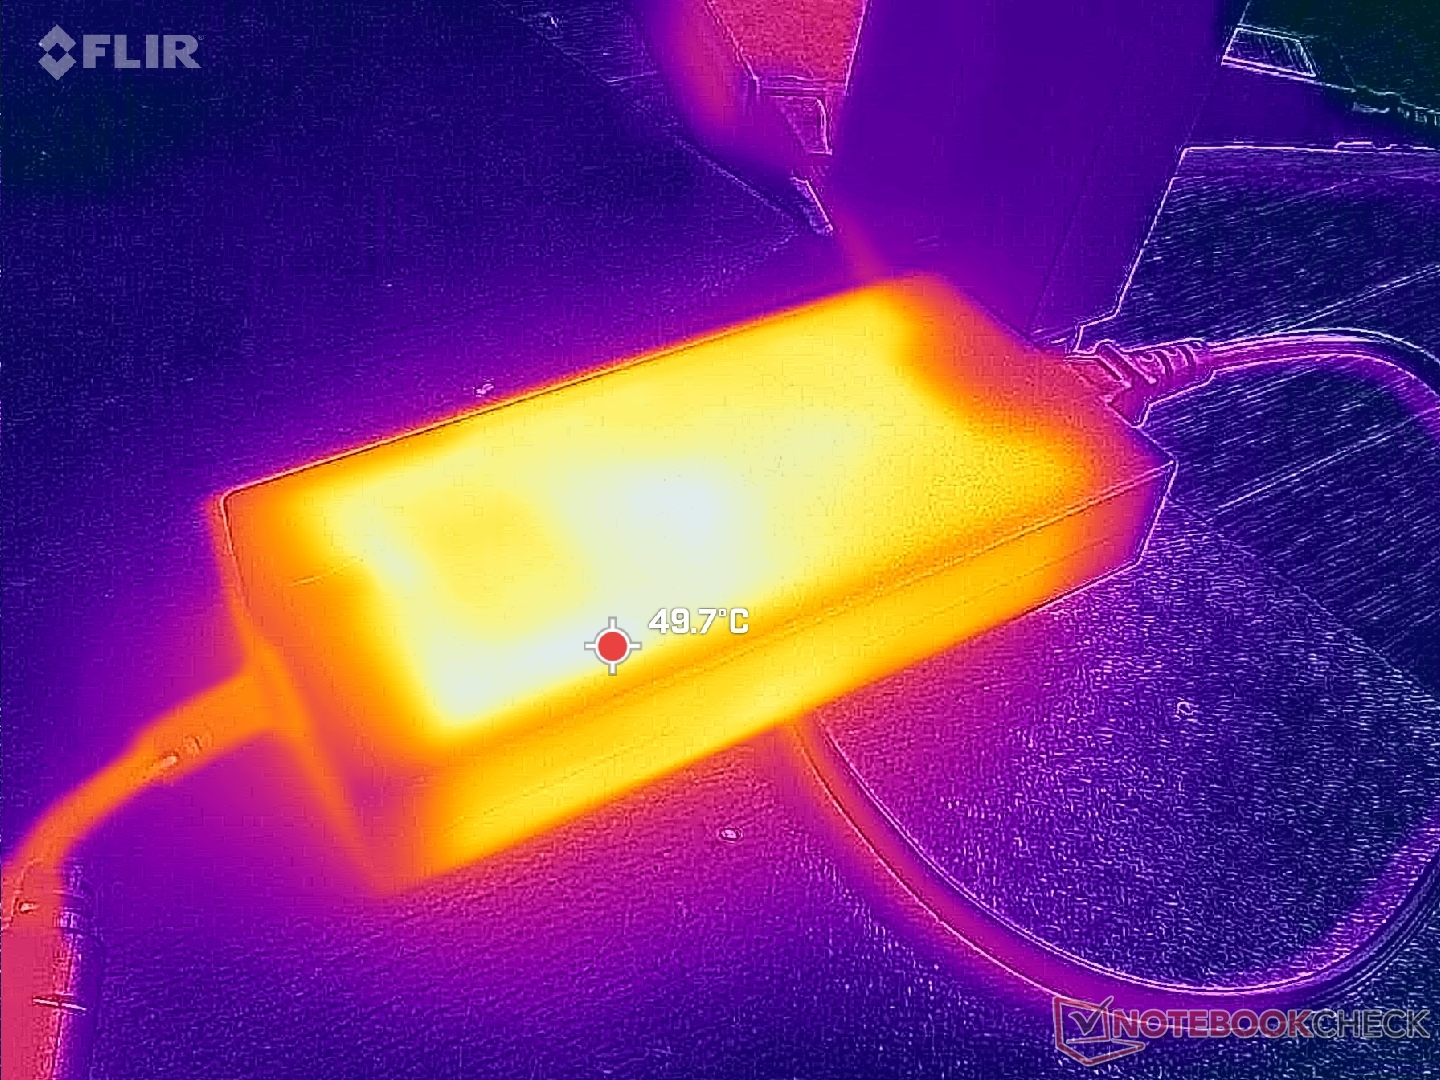
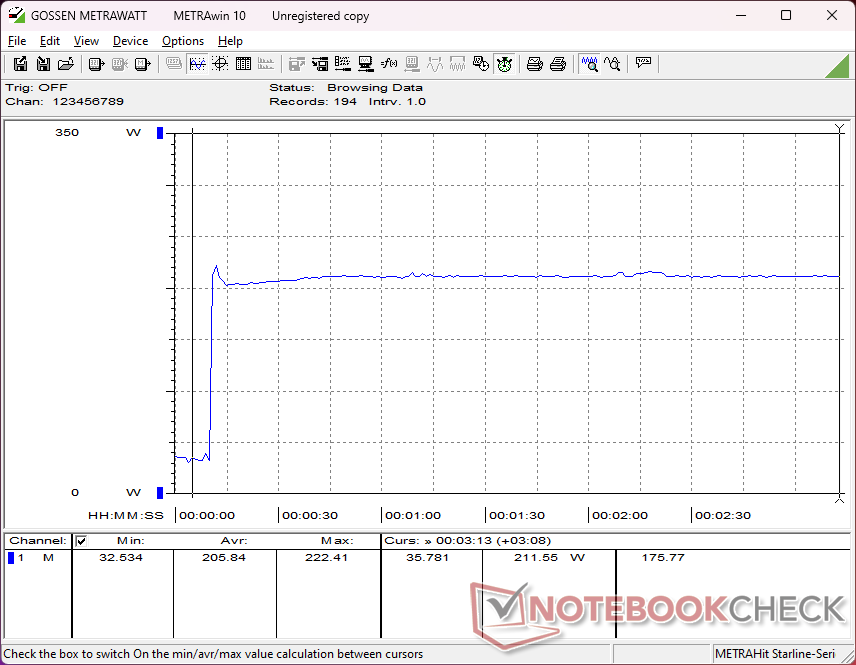
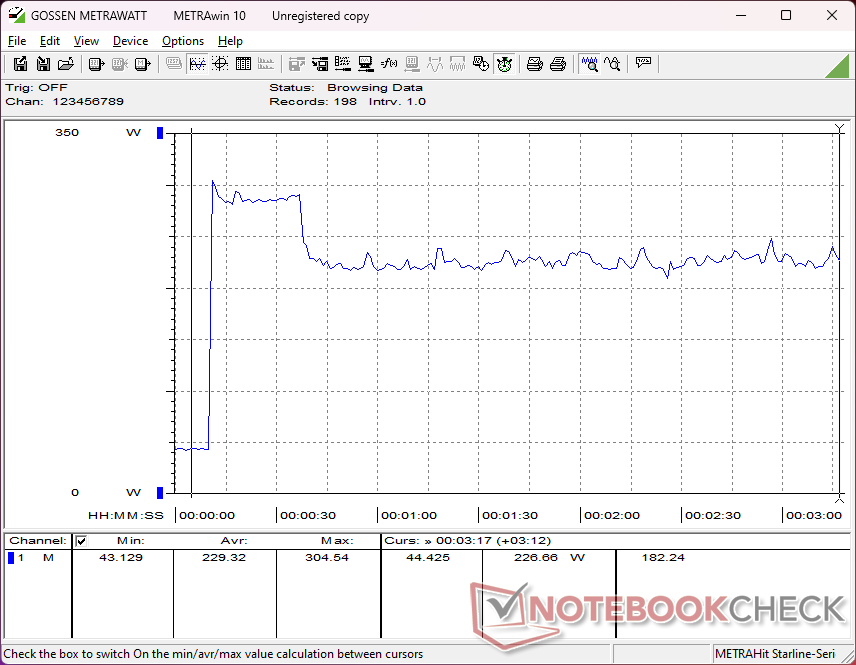
Genel tüketim, zorlu bir 4K mini LED panel ile donatılmış 18 inçlik bir DTR'den bekleneceği gibi çok yüksektir. Masaüstünde rölantide çalışma, parlaklık ayarına, GPU ayarına ve güç profili ayarına bağlı olarak 27 W ile 48 W arasında tüketim yapıyor. Oyun oynamak için 300 W'ın biraz üzerinde güç gerekirken bu değer masaüstünde yalnızca 220 W'tır Acer Predator Helios 18.
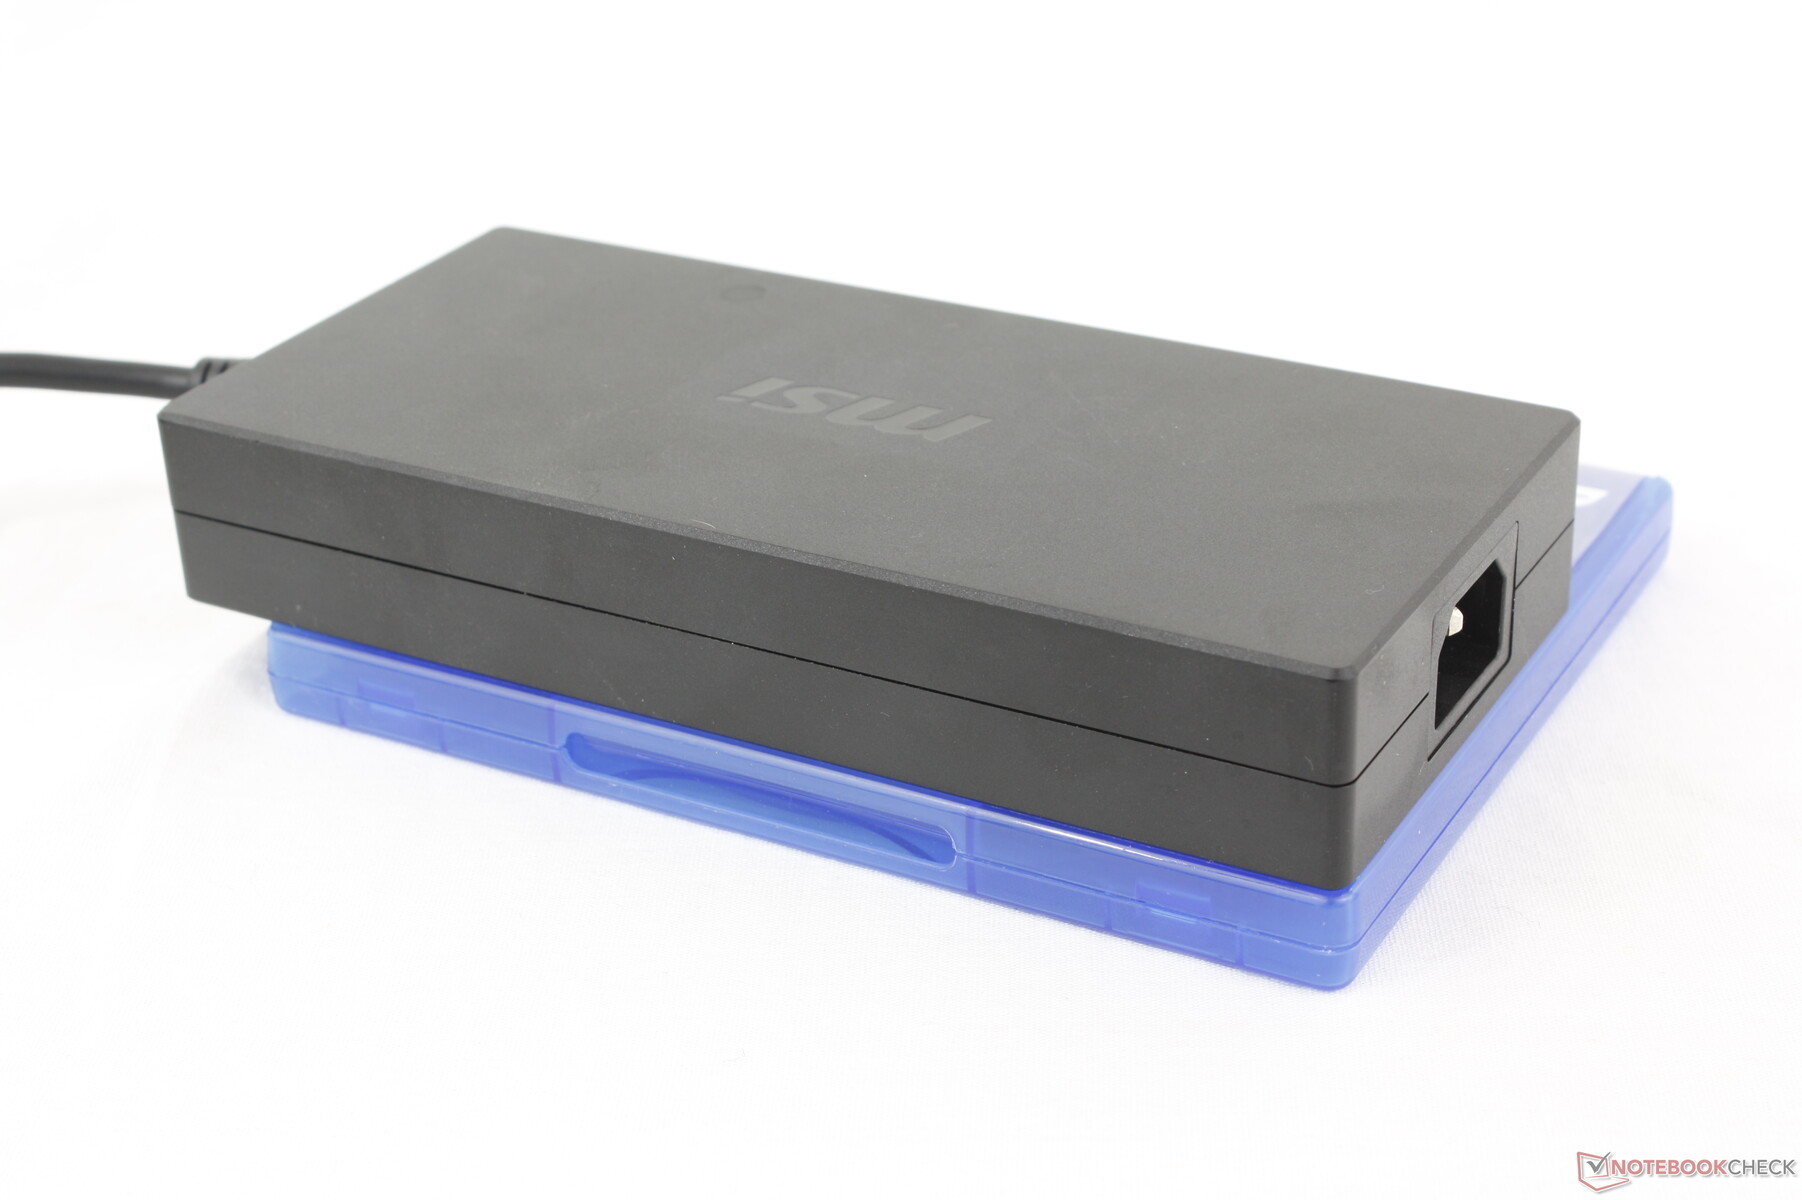
Büyük 330 W AC adaptörden 322 W'a kadar tüketim kaydedebiliyoruz. Titan 18 HX'in 400 W AC adaptörüyle karşılaştırıldığında, 330 W'lık adaptör biraz daha küçüktür (~18,4 x 8,4 x 3,1 cm'ye karşılık ~18,8 x 8,8 x 3,2 cm). CPU yoğun görevleri çalıştırırken tüketim, yukarıdaki CineBench bölümümüzde kaydedilen biraz daha yavaş CPU performansıyla uyumlu olan Titan 18 HX ile aynı CPU ile birlikte gelmesine rağmen Raider 18 HX'de genellikle daha düşüktür.
| Kapalı / Bekleme modu | |
| Boşta | |
| Çalışırken |
|
Key:
min: | |
| MSI Raider 18 HX A14V i9-14900HX, NVIDIA GeForce RTX 4080 Laptop GPU, Samsung PM9A1 MZVL22T0HBLB, Mini-LED, 3840x2400, 18" | Razer Blade 18 2024 RZ09-0509 i9-14900HX, NVIDIA GeForce RTX 4090 Laptop GPU, , Mini-LED, 2560x1600, 18" | Alienware m18 R2 i9-14900HX, NVIDIA GeForce RTX 4090 Laptop GPU, SK Hynix PC811 HFS002TEM9X152N, IPS, 2560x1600, 18" | MSI Titan 18 HX A14VIG i9-14900HX, NVIDIA GeForce RTX 4090 Laptop GPU, 2x Samsung PM9A1a MZVL22T0HDLB (RAID 0), Mini-LED, 3840x2400, 18" | Asus ROG Strix G18 G814JI i7-13650HX, NVIDIA GeForce RTX 4070 Laptop GPU, Micron 2400 MTFDKBA1T0QFM, IPS, 2560x1600, 18" | Acer Predator Helios 18 PH18-72-98MW i9-14900HX, NVIDIA GeForce RTX 4090 Laptop GPU, 2x SK Hynix HFS001TEJ9X115N (RAID 0), Mini-LED, 2560x1600, 18" | |
|---|---|---|---|---|---|---|
| Power Consumption | -2% | 8% | 5% | 42% | -2% | |
| Idle Minimum * | 27.7 | 25.4 8% | 10.6 62% | 13.2 52% | 8 71% | 31 -12% |
| Idle Average * | 38.3 | 37.7 2% | 20.9 45% | 25.4 34% | 15 61% | 35 9% |
| Idle Maximum * | 47.1 | 57.9 -23% | 40 15% | 53.5 -14% | 26 45% | 43 9% |
| Load Average * | 121.2 | 128.4 -6% | 201.1 -66% | 151.4 -25% | 102 16% | 144 -19% |
| Cyberpunk 2077 ultra * | 313 | |||||
| Cyberpunk 2077 ultra external monitor * | 306 | |||||
| Load Maximum * | 321.8 | 297.9 7% | 378.9 -18% | 395.2 -23% | 267 17% | 318 1% |
| Witcher 3 ultra * | 273.1 | 358 | 336 | 178.6 | 228 |
* ... daha küçük daha iyidir
Power Consumption Cyberpunk / Stress Test
Power Consumption external Monitor
Pil Ömrü
Zorlu donanım nedeniyle çalışma süreleri kısadır. Pil Tasarrufu modu ve iGPU moduna ayarlandığında bile 3 saatin biraz üzerinde gerçek dünya WLAN kullanımı kaydedebildik ROG Strix G18 iPS ekranı ile iki kat daha uzun süre dayanabilir. Pil kapasitesi halihazırda yasal maksimum değer olan 99,9 Wh'a ulaşmış durumda.
Boş durumdan tam kapasiteye şarj etmek neredeyse 2,5 saat sürüyor ki bu süre diğer dizüstü bilgisayarların çoğundan biraz daha uzun. Üçüncü taraf USB-C AC adaptörleri ile şarj etmek daha da yavaş olacaktır.
| MSI Raider 18 HX A14V i9-14900HX, NVIDIA GeForce RTX 4080 Laptop GPU, 99.9 Wh | Razer Blade 18 2024 RZ09-0509 i9-14900HX, NVIDIA GeForce RTX 4090 Laptop GPU, 91.7 Wh | Alienware m18 R2 i9-14900HX, NVIDIA GeForce RTX 4090 Laptop GPU, 97 Wh | MSI Titan 18 HX A14VIG i9-14900HX, NVIDIA GeForce RTX 4090 Laptop GPU, 99.9 Wh | Asus ROG Strix G18 G814JI i7-13650HX, NVIDIA GeForce RTX 4070 Laptop GPU, 90 Wh | Acer Predator Helios 18 PH18-72-98MW i9-14900HX, NVIDIA GeForce RTX 4090 Laptop GPU, 90 Wh | |
|---|---|---|---|---|---|---|
| Pil Çalışma Süresi | 20% | 46% | 19% | 101% | -10% | |
| Reader / Idle | 264 | 395 50% | 353 34% | 702 166% | ||
| WiFi v1.3 | 198 | 263 33% | 290 46% | 252 27% | 484 144% | 192 -3% |
| Load | 76 | 58 -24% | 72 -5% | 71 -7% | 64 -16% |
Artılar
Eksiler
Karar - Kalbinde Bir Titan
İncelediğimizde Titan 18 HX bu yılın başlarında, performansını övmüştük ancak 5000 USD'den fazla fiyatını öğrendiğimizde şok olmuştuk. CPU ve GPU'nun etkin bir şekilde yeni bir şey olmaması, modeli çok daha az çekici hale getirdi. Raider 18 HX, Titan 18 HX'in fahiş fiyatını, aynı CPU, GPU ve ekran seçeneklerini korurken yağı kırparak ele alıyor. Raider sahipleri arkadan aydınlatmalı clickpad, buhar odası soğutması, mekanik tuşlar ve üçüncül M.2 SSD desteğini kaybediyor, ancak Raider ve Titan arasındaki oyun deneyimi tamamen aynıyken bu tür lüks özelliklerden ayrılmak kolaydır. Aslında, Raider'ın geleneksel tıklama yüzeyi ve membran tabanlı klavyesi Titan'daki atipik yaklaşıma göre daha tanıdık geldiği için kullanımının daha rahat olduğu iddia edilebilir.
Raider 18 HX, rakiplerinin çoğundan daha büyük, daha ağır ve çoğu zaman daha gürültülü olması gerekse bile Core i9 CPU ve 175 W GPU'dan alabileceği her ons performansı alıyor.
Diğer 18 inçlik oyun dizüstü bilgisayarlarıyla karşılaştırıldığında, Raider 18 HX daha geniş bir yazma deneyimi ve dört SODIMM yuvası sunarken Bıçak 18 veya ROG Strix G18 hiç sayısal tuş takımı yok ya da sadece iki SODIMM modülünü destekleyebiliyor. Bununla birlikte, MSI sistemi hala rakiplerinin çoğundan belirgin şekilde daha büyük ve ağırdır ve bunu telafi etmek için daha sessiz çalışması gerekmez. CPU ve GPU performansı biraz daha hızlı olabilir, ancak birçok kullanıcı pratikte bunu fark etmeyebilir. Bu durumda, Raider'ın ağırlığını haklı çıkarmak için daha kolay servis ve 4K mini LED seçeneklerine değer vermeniz gerekecek.
Fiyat ve Bulunabilirlik
İncelememizde yapılandırılan MSI Raider 18 HX şu anda Amazon'da $3190' a satılıyor. Alternatif olarak IPS versiyonu da 3290 dolara satılıyor.
Not: Derecelendirme sistemimizi yakın zamanda güncelledik ve 8. sürümün sonuçları 7. sürümün sonuçları ile karşılaştırılamaz. Daha fazla bilgi için burada .
MSI Raider 18 HX A14V
- 09/03/2024 v8
Allen Ngo
 Total Sustainability Score:
 Şeffaflık
İncelenecek cihazların seçimi editör ekibimiz tarafından yapılır. Test örneği, bu incelemenin amacı doğrultusunda üretici veya perakendeci tarafından yazara ödünç olarak sağlanmıştır. Borç verenin bu inceleme üzerinde herhangi bir etkisi olmadığı gibi, üretici de yayınlanmadan önce bu incelemenin bir kopyasını almamıştır. Bu incelemeyi yayınlama zorunluluğu yoktu. İncelemelerimiz karşılığında asla tazminat veya ödeme kabul etmiyoruz. Bağımsız bir medya şirketi olarak Notebookcheck, üreticilerin, perakendecilerin veya yayıncıların otoritesine tabi değildir.
Notebookcheck bu şekilde test yapıyor
Notebookcheck, tüm sonuçların karşılaştırılabilir olmasını sağlamak için her yıl yüzlerce dizüstü bilgisayarı ve akıllı telefonu standart prosedürler kullanarak bağımsız olarak inceliyor. Yaklaşık 20 yıldır test yöntemlerimizi sürekli olarak geliştirdik ve bu süreçte endüstri standartlarını belirledik. Test laboratuvarlarımızda deneyimli teknisyenler ve editörler tarafından yüksek kaliteli ölçüm ekipmanları kullanılmaktadır. Bu testler çok aşamalı bir doğrulama sürecini içerir. Karmaşık derecelendirme sistemimiz, nesnelliği koruyan yüzlerce sağlam temellere dayanan ölçüm ve kıyaslamaya dayanmaktadır.Price comparison

