

RedMagic Titan 16 Pro incelemesi: Akıllı telefon üreticisi tarafından üretilen bir dizüstü oyun bilgisayarı
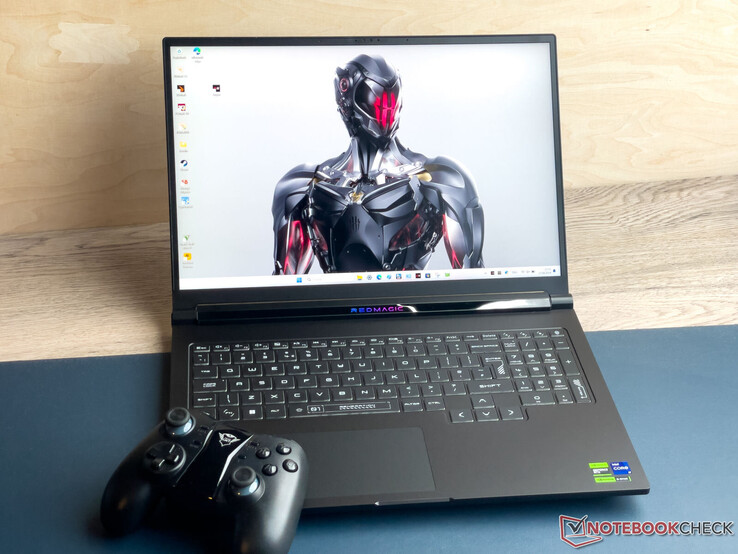
Bu web sitesinin düzenli ziyaretçileri "RedMagic" markasını oyun akıllı telefon segmentinden zaten tanıyor olabilirler (örneğin Nubia RedMagic 9 Pro). RedMagic Titan 16 Pro, Nubia'nın dizüstü oyun dünyasına ilk adımını atıyor. Veri sayfasında sürpriz yok: A Core i9-14900HX ile eşleştirilir GeForce RTX 4060. Buna 16:10 en boy oranına sahip 16 inç ekran, Thunderbolt 4, DDR5 RAM ve 2 SSD yuvası da eşlik ediyor.
Nubia'nın zaten köklü olan rekabete karşı durup duramayacağını göreceğiz. Titan aşağıdaki cihazlara karşı yarışıyor: Lenovo Legion Pro 5 16IRX9, HP Victus 16 (2024), Acer Predator Helios Neo 16 (2024), XMG Pro 16 Studio (Mid 24) ve Gigabyte G6X 9KG (2024).
Karşılaştırmalı olarak olası rakipler
Derecelendirme | Sürüm | Tarih | Modeli | Ağırlık | Yükseklik | Boyut | Çözünürlük | Fiyat |
|---|---|---|---|---|---|---|---|---|
| 81.2 % | v8 | 08/2024 | Nubia RedMagic Titan 16 Pro i9-14900HX, NVIDIA GeForce RTX 4060 Laptop GPU | 2.4 kg | 23.9 mm | 16.00" | 2560x1600 | |
| 82.3 % | v8 | 07/2024 | Lenovo Legion Pro 5 16IRX9 G9 i7-14700HX, NVIDIA GeForce RTX 4060 Laptop GPU | 2.5 kg | 26.55 mm | 16.00" | 2560x1600 | |
| 84.3 % v7 (old) | v7 (old) | 05/2024 | HP Victus 16 (2024) i7-14700HX, NVIDIA GeForce RTX 4060 Laptop GPU | 2.4 kg | 23.9 mm | 16.10" | 1920x1080 | |
| 86.8 % v7 (old) | v7 (old) | 05/2024 | Acer Predator Helios Neo 16 (2024) i7-14700HX, NVIDIA GeForce RTX 4070 Laptop GPU | 2.6 kg | 25.95 mm | 16.00" | 2560x1600 | |
| 81.2 % | v8 | 07/2024 | SCHENKER XMG Pro 16 Studio (Mid 24) i9-14900HX, NVIDIA GeForce RTX 4070 Laptop GPU | 2.3 kg | 19.9 mm | 16.00" | 2560x1600 | |
| 83.2 % v7 (old) | v7 (old) | 03/2024 | Gigabyte G6X 9KG (2024) i7-13650HX, NVIDIA GeForce RTX 4060 Laptop GPU | 2.6 kg | 25.1 mm | 16.00" | 1920x1200 |
Lütfen dikkat: Derecelendirme sistemimizi yakın zamanda güncelledik ve 8. sürümün sonuçları 7. sürümün sonuçlarıyla karşılaştırılabilir değildir. Daha fazla bilgi için burada.
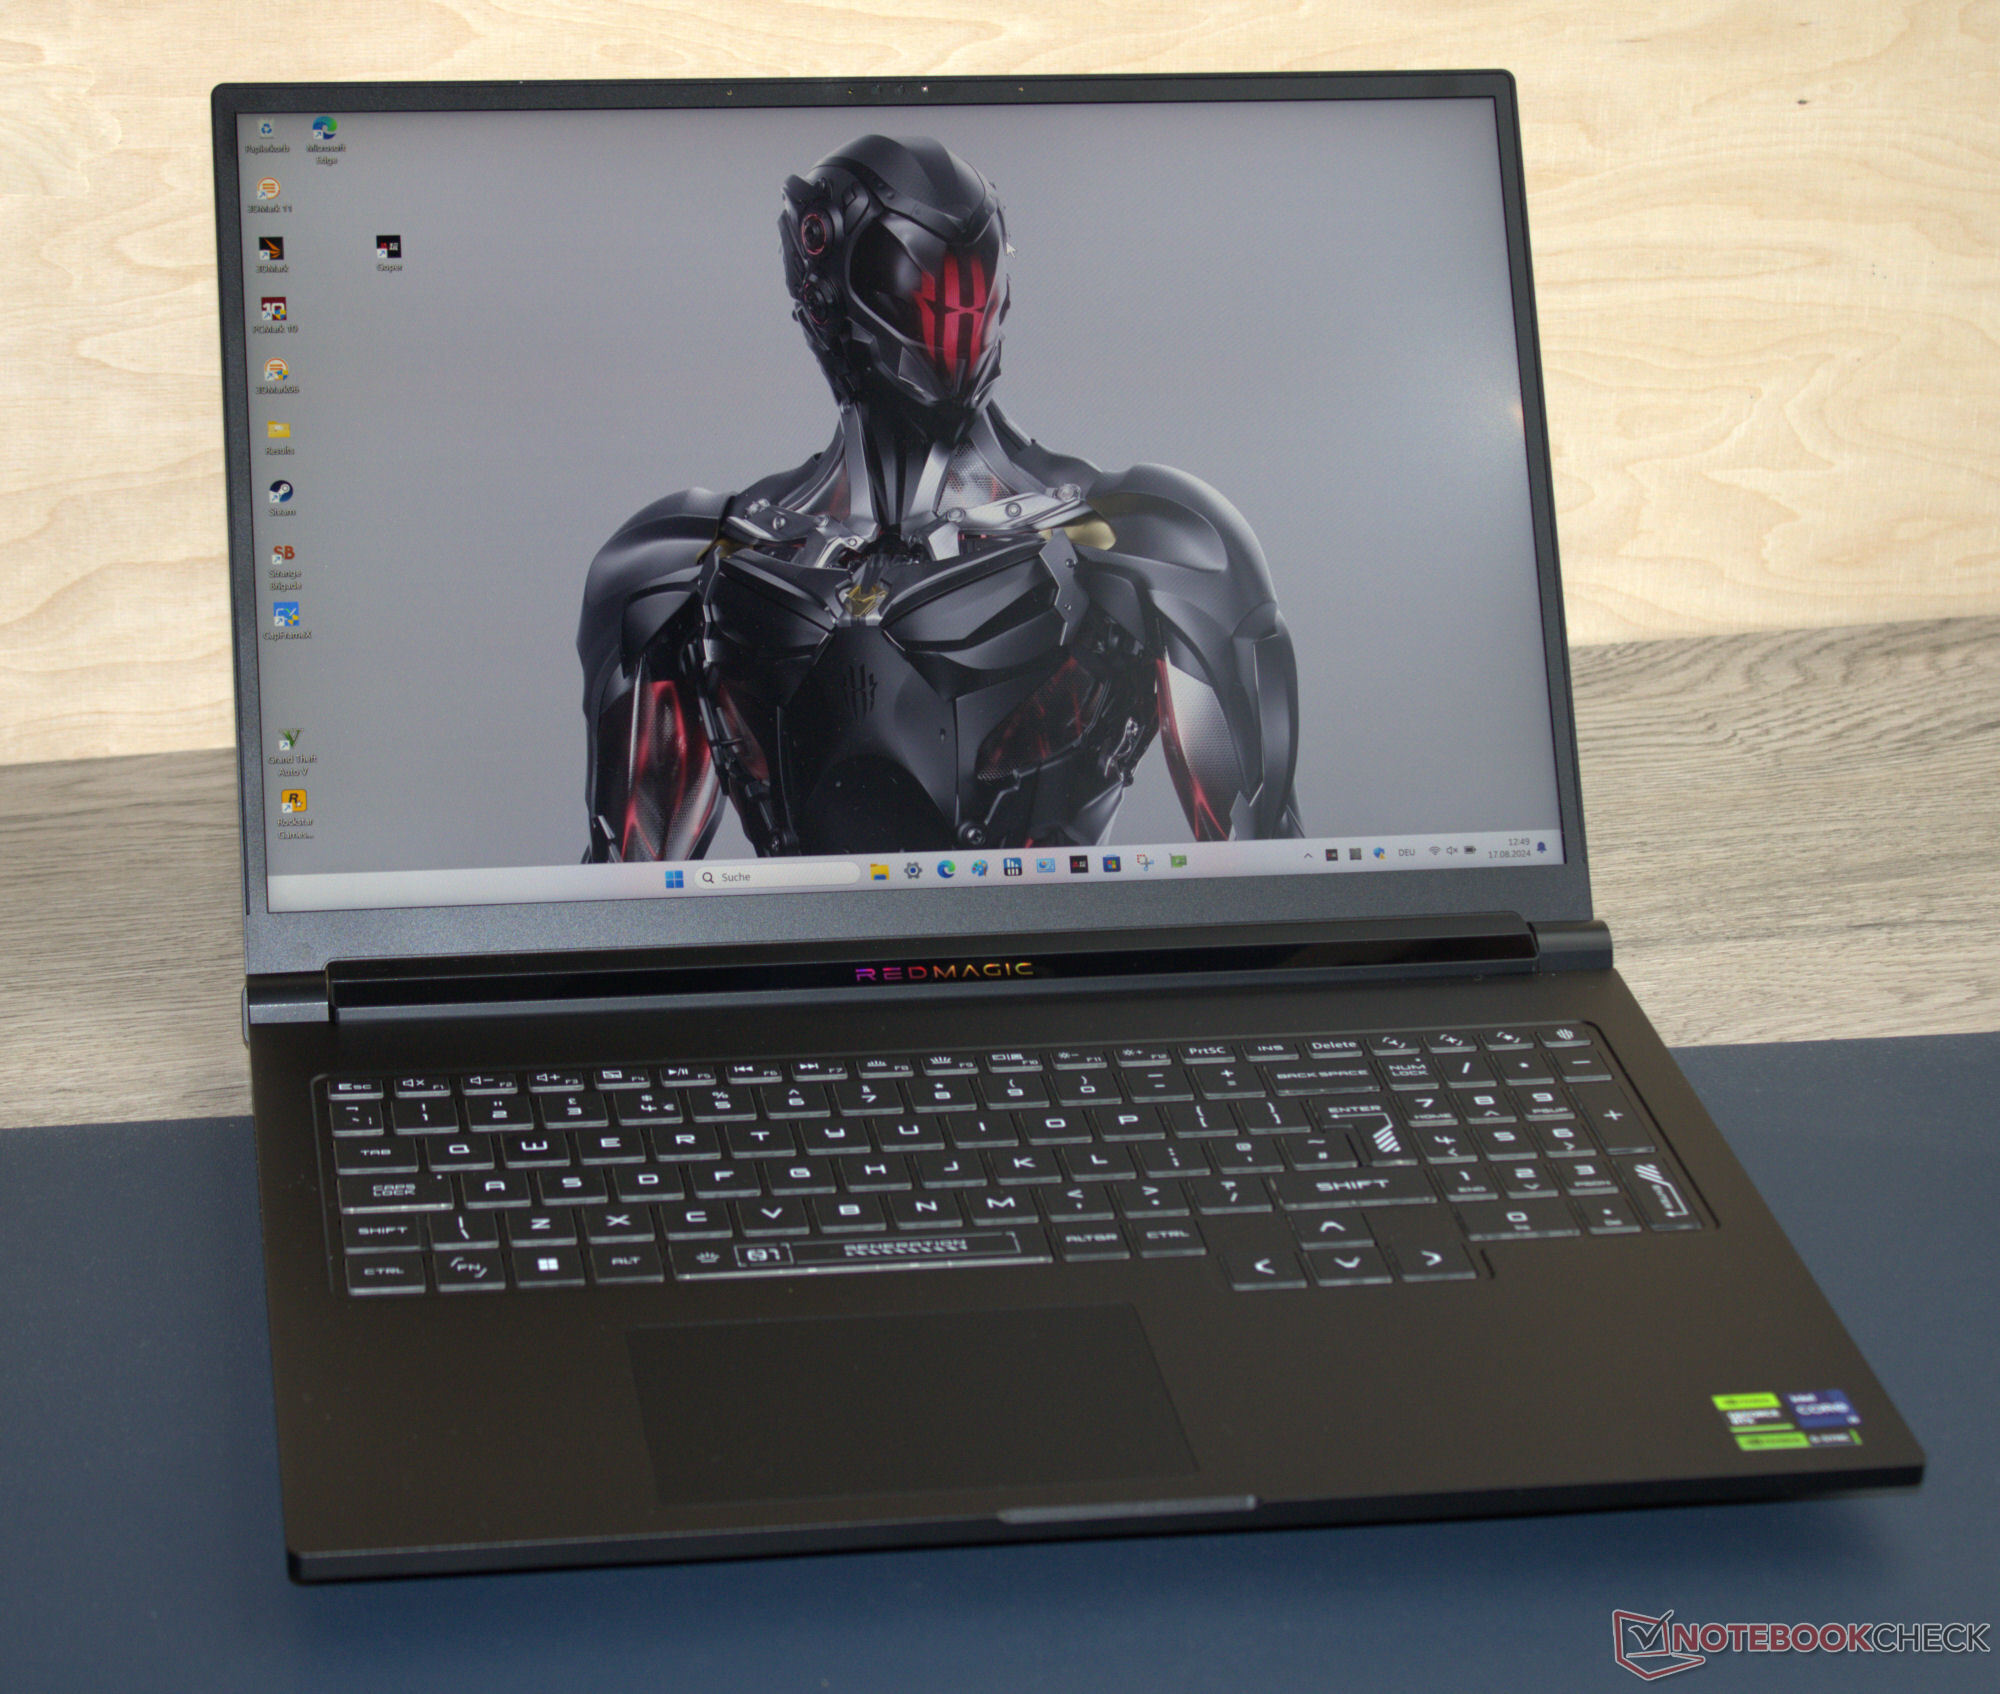
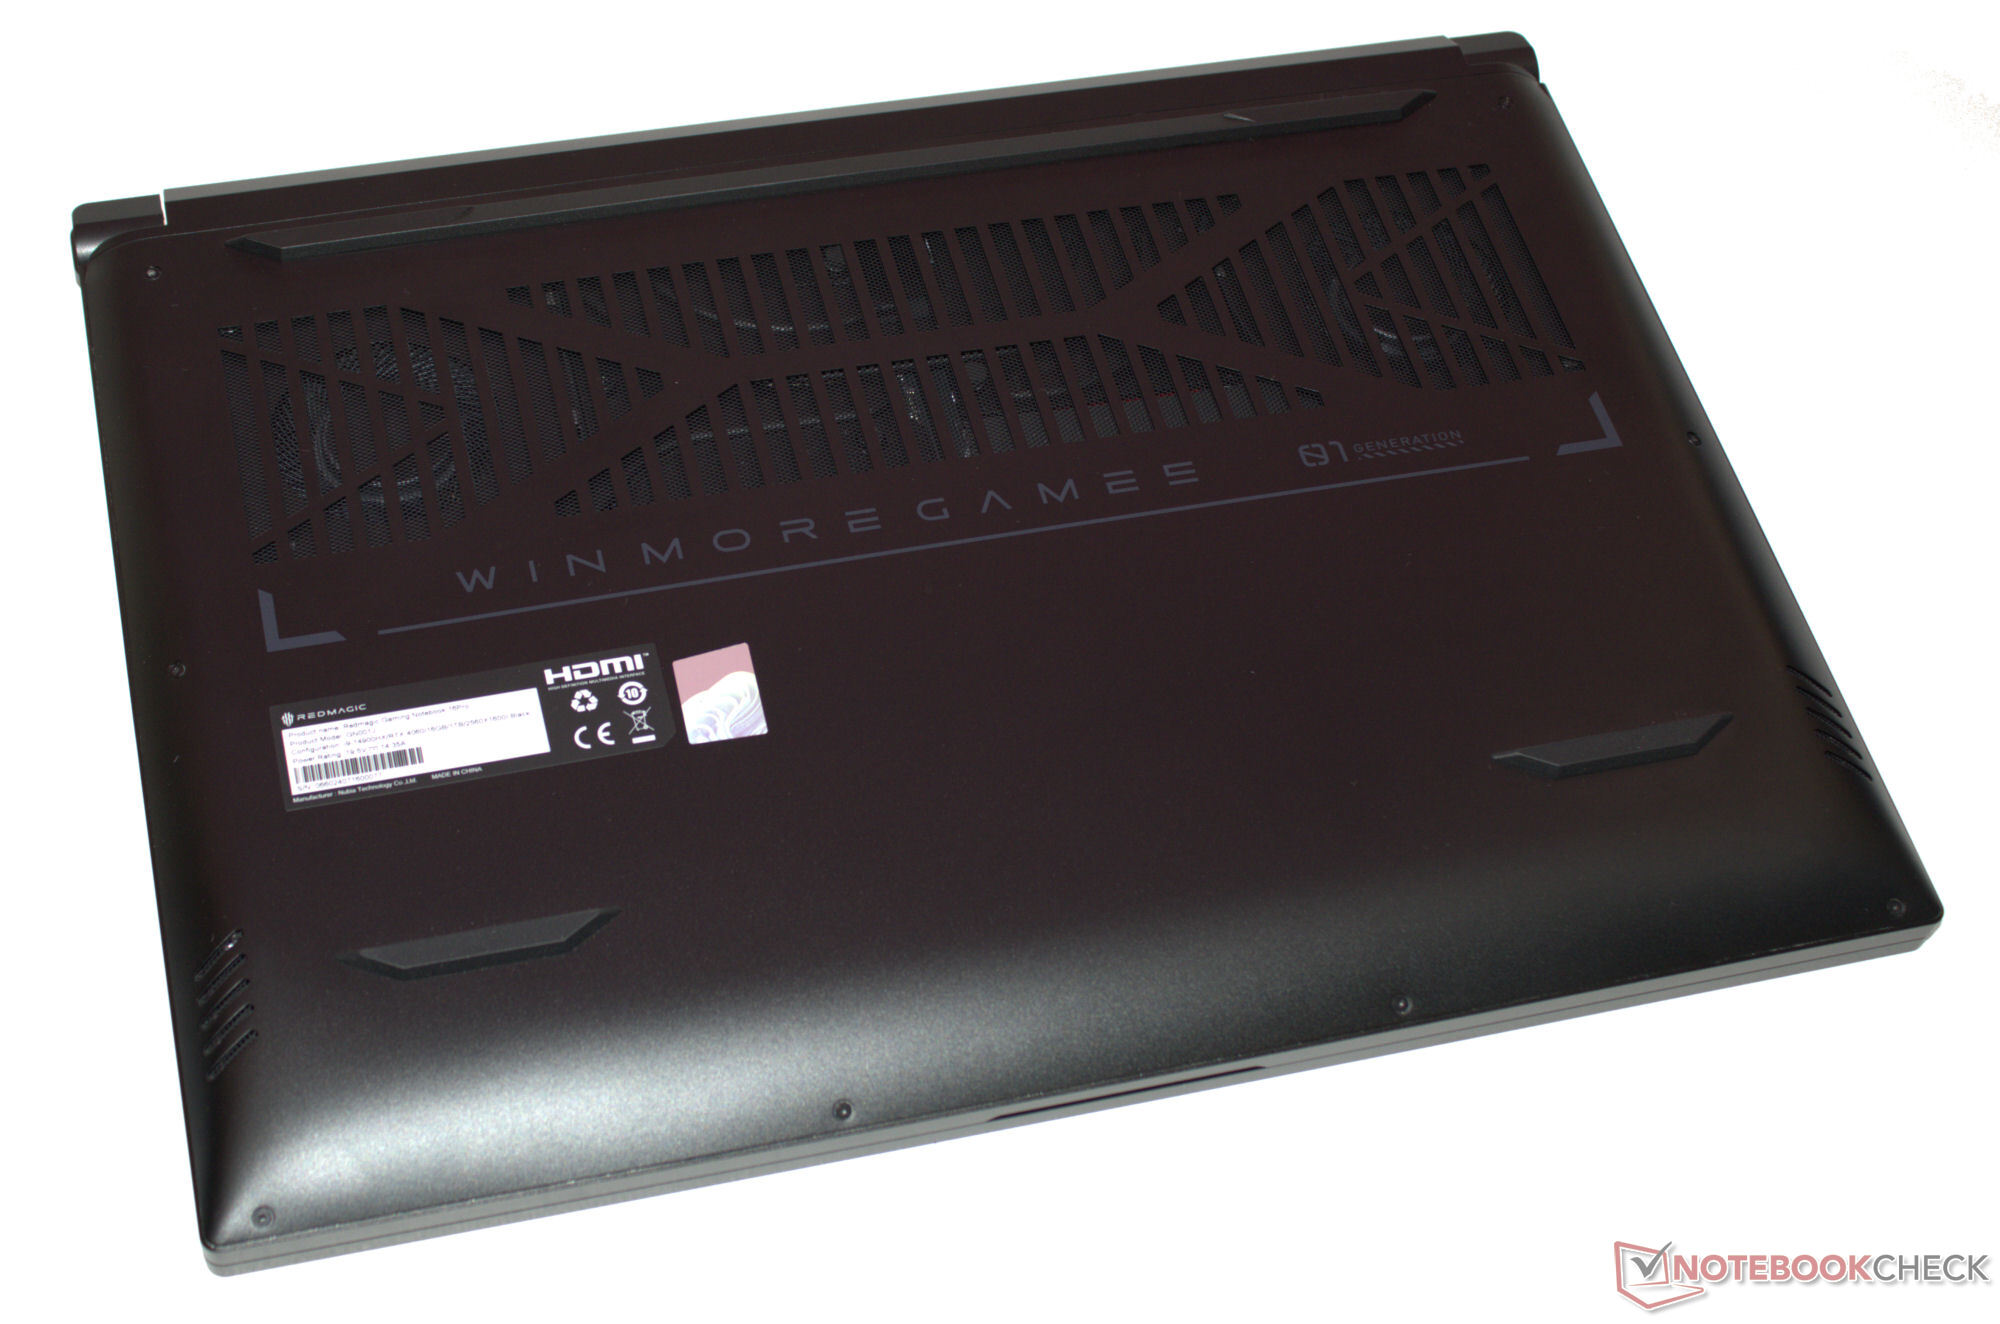
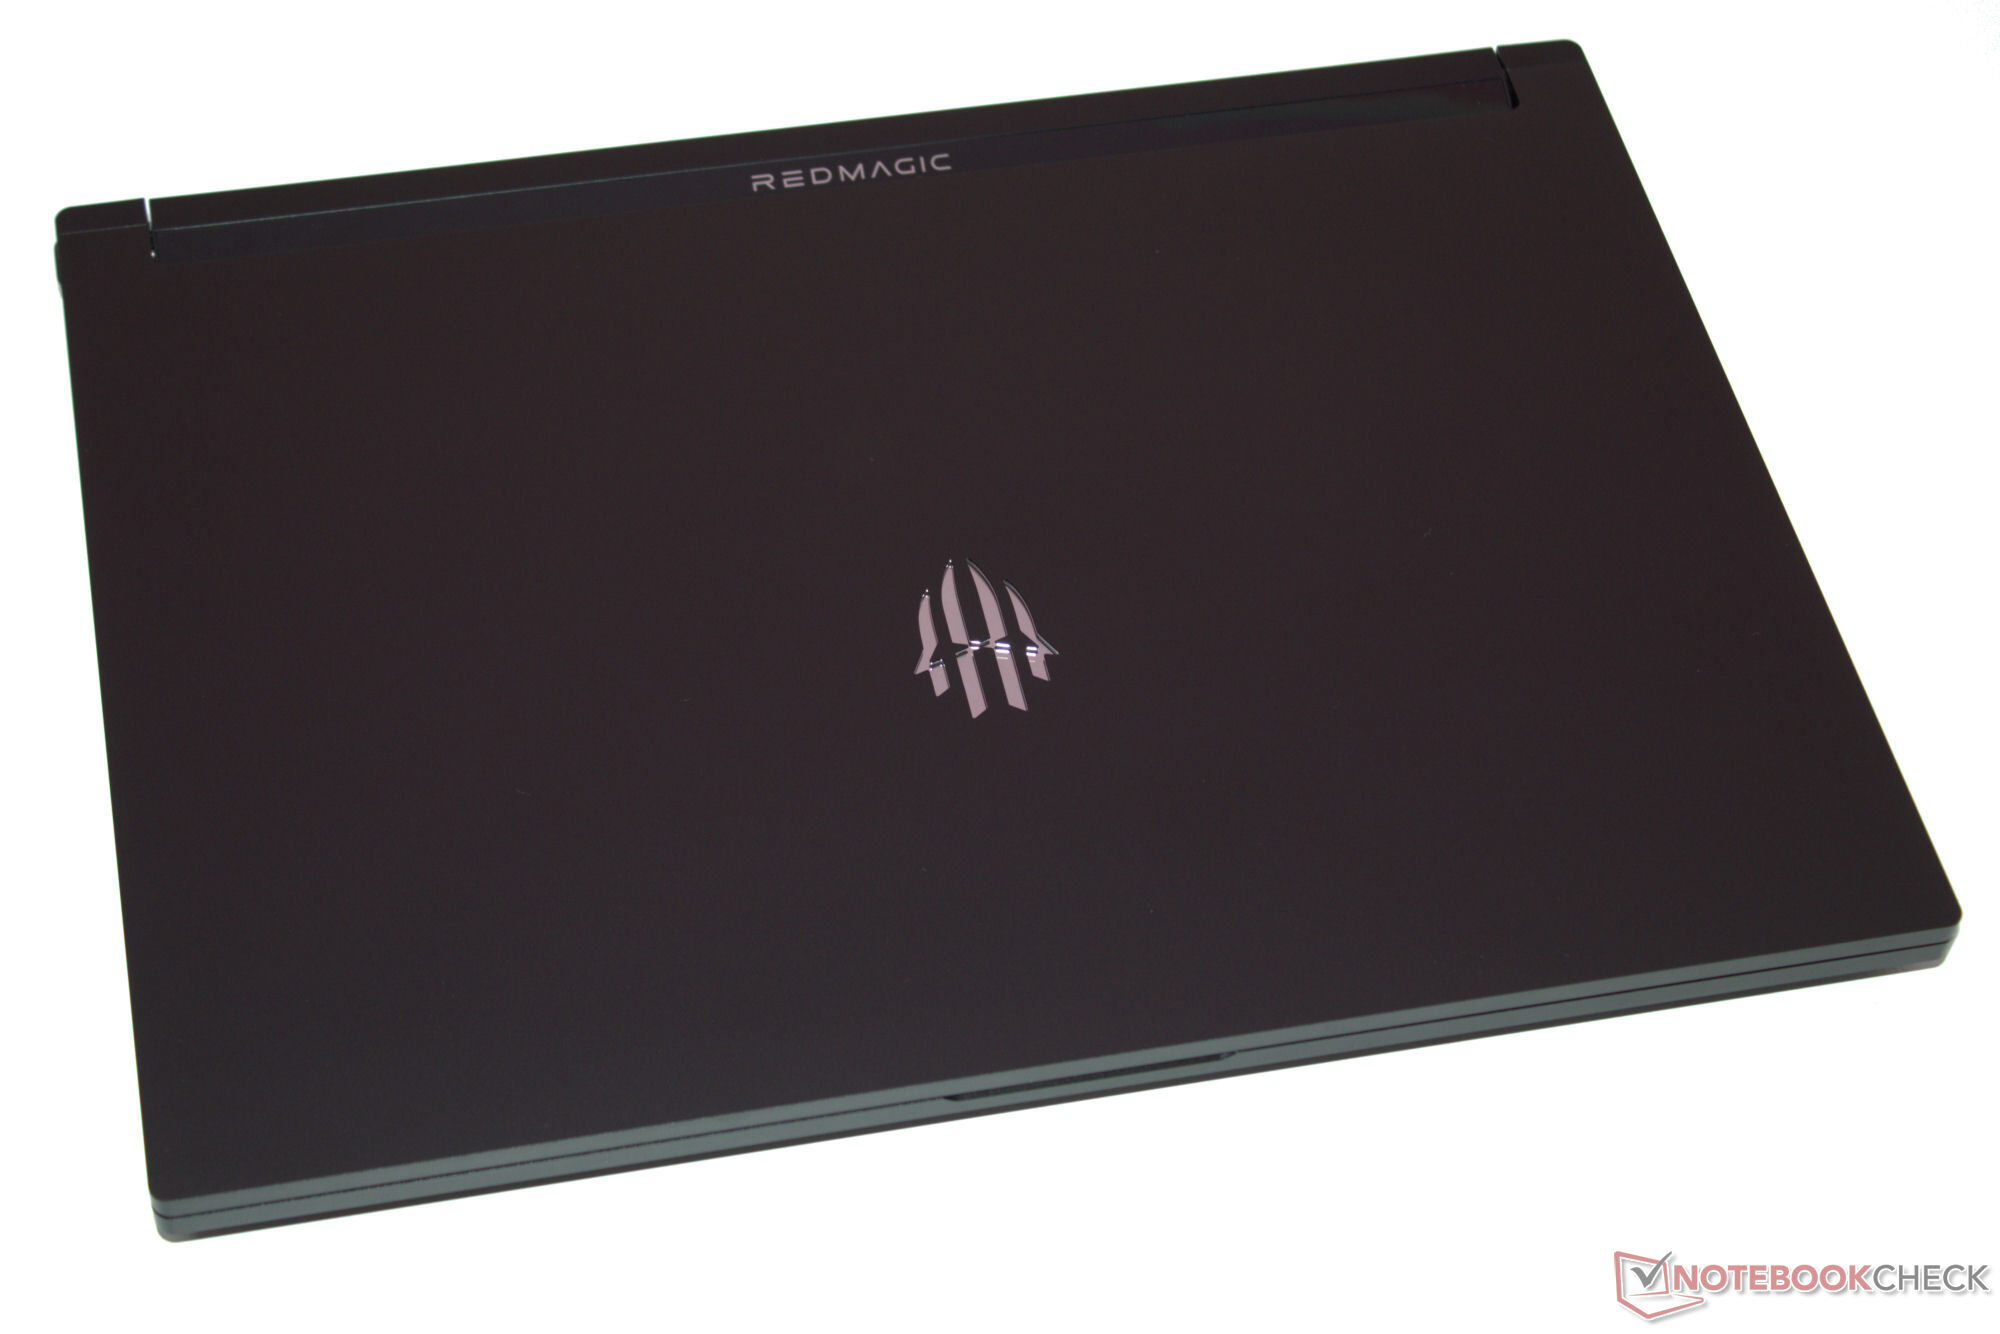
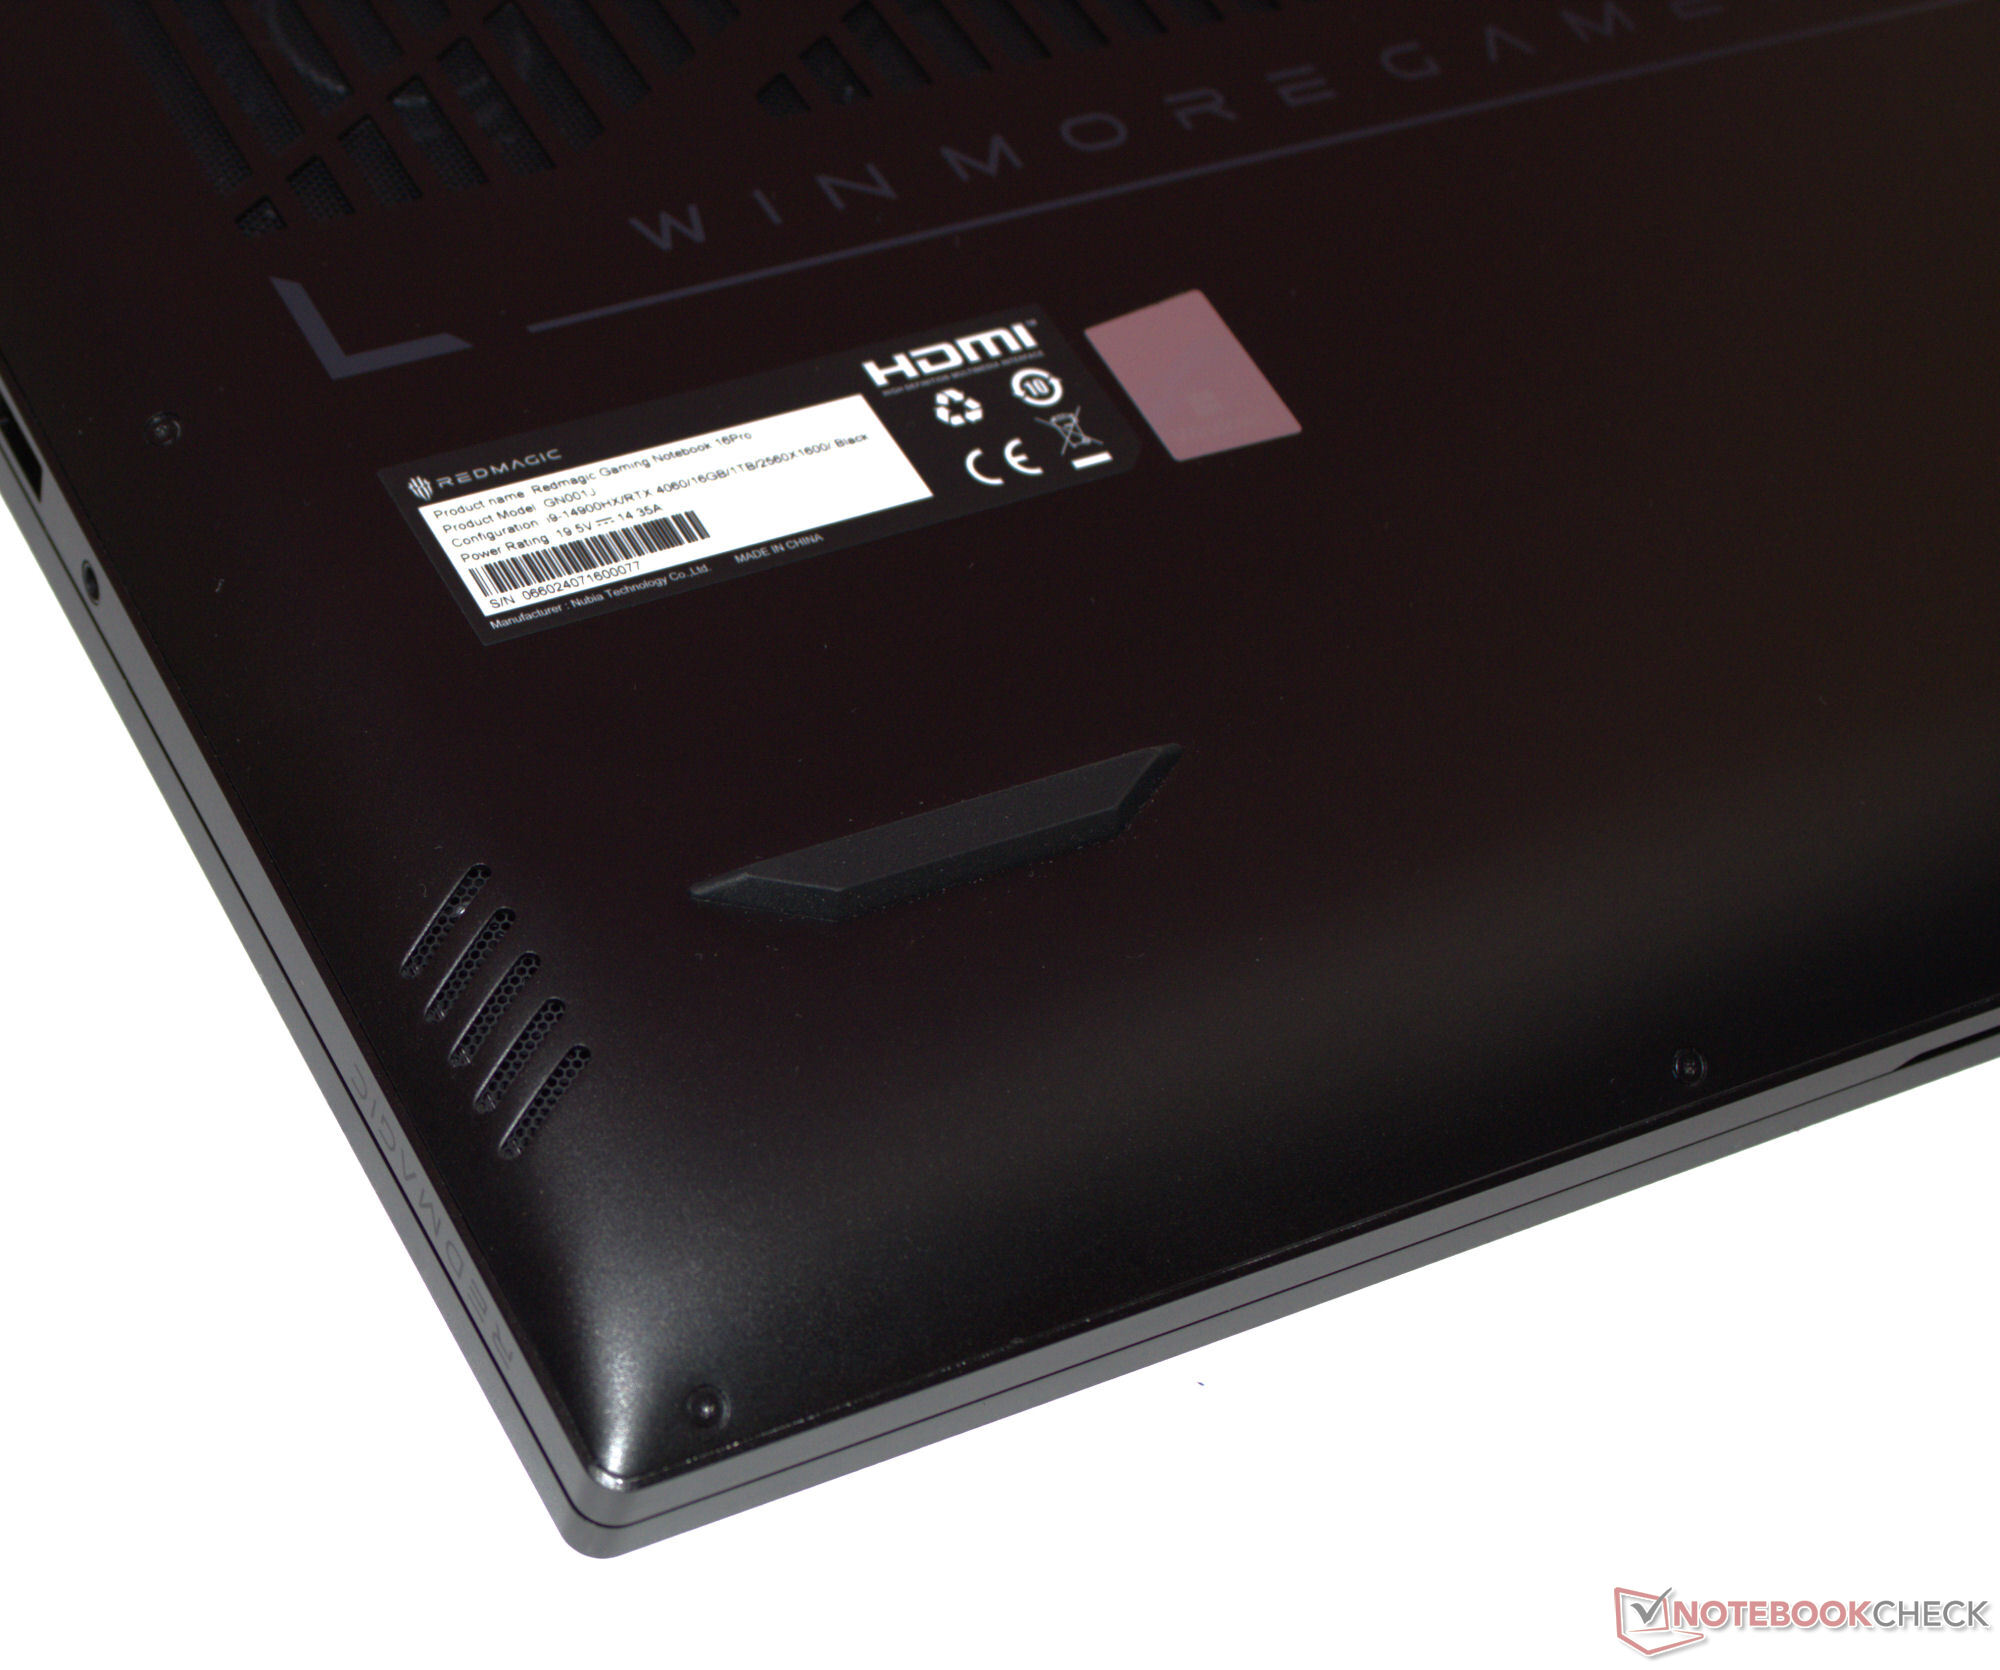
Kasa - Nubia alüminyum bir kasa tercih etti
Her zaman yanınızda bir temizlik bezi bulundurmalısınız: Mat siyah kasanın yüzeyleri parmak izi toplamaya karşı çok hassastır. Alüminyum kasanın ana ünitesi ve kapağı yalnızca küçük bir miktar bükülebiliyor ve herhangi bir yapı hatasıyla karşılaşmadık. Kapağın arkasına basınç uygulamak herhangi bir görüntü değişikliğine neden olmuyor. Çok sıkı menteşeler kapağı sıkıca yerinde tutuyor ve sadece minimum düzeyde sallanıyor. Maksimum açılma açısı 130 derecedir ve tek elle açabilirsiniz.
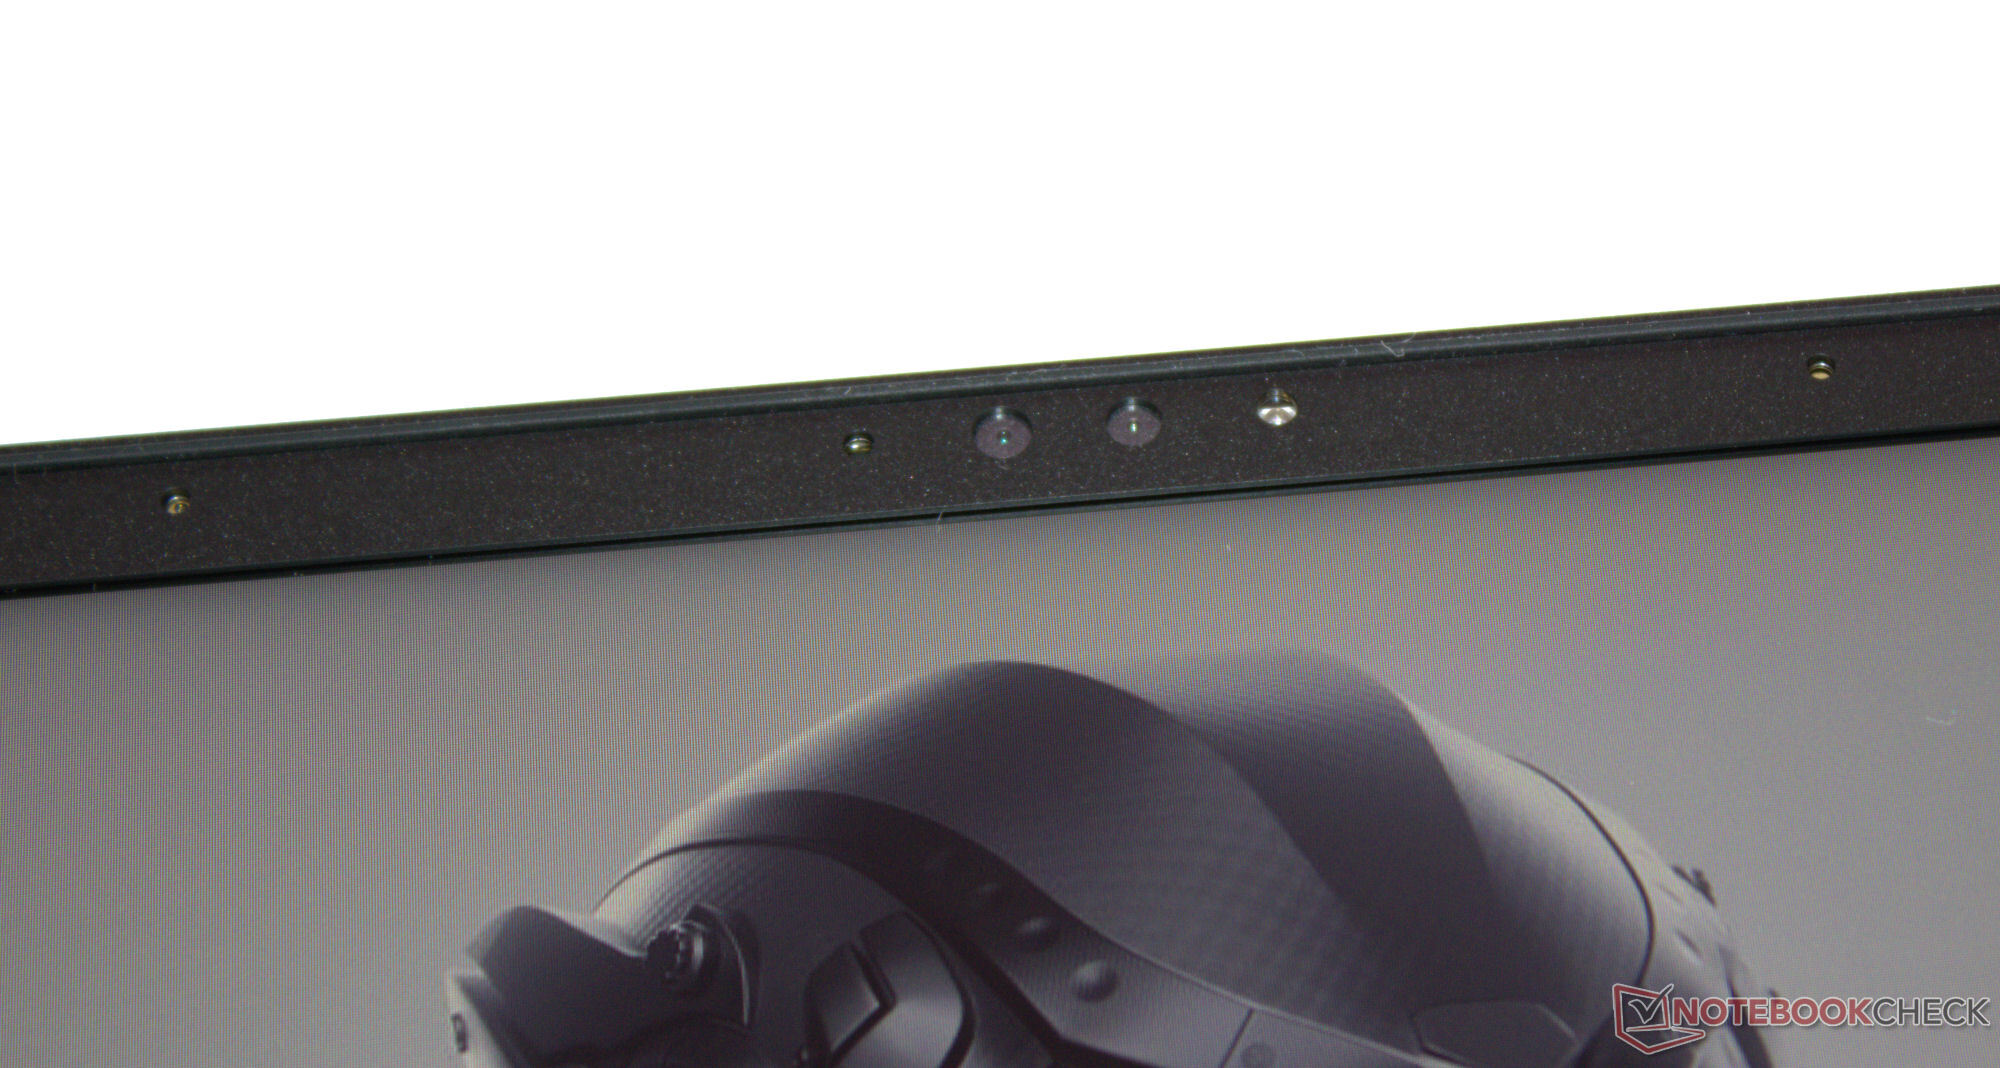
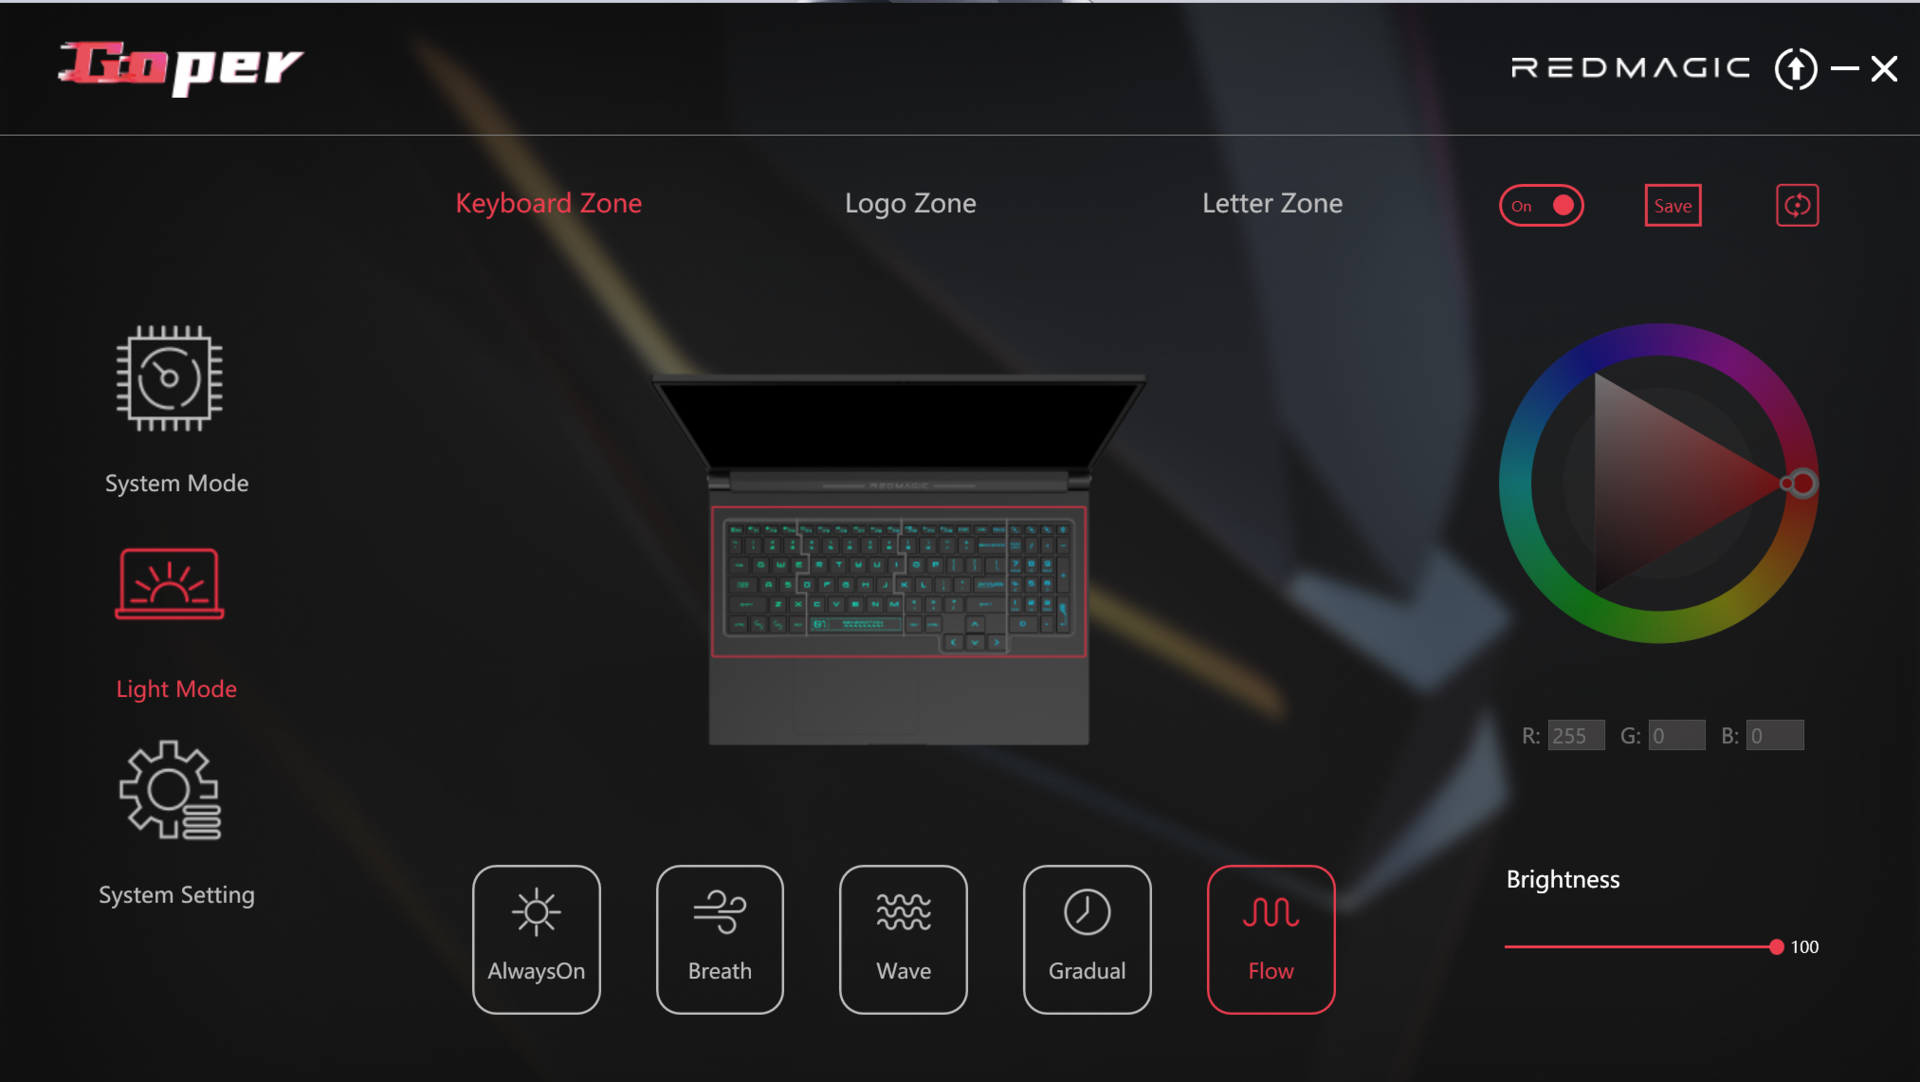
Dizüstü bilgisayarın arkadan aydınlatmalı klavyesinin yanı sıra, iki LED öğesi karışıma biraz renk katıyor: Menteşe kapağındaki RedMagic yazısı ve kapaktaki logo gökkuşağının tüm renklerinde parlıyor. Tüm öğeler ayrı ayrı kontrol edilebiliyor. Yazı aynı zamanda pil göstergesi olarak da kullanılıyor: yanıp sönen kırmızı ışık şarj seviyesinin düşük olduğunu gösteriyor.

Karşılaştırma alanında Titan en kompakt ve hafif cihazlardan biri olduğunu kanıtlıyor. Öyle olsa bile, rekabete kıyasla farklar oldukça küçük.
Bağlanabilirlik - Titan Thunderbolt 4 özelliğine sahiptir
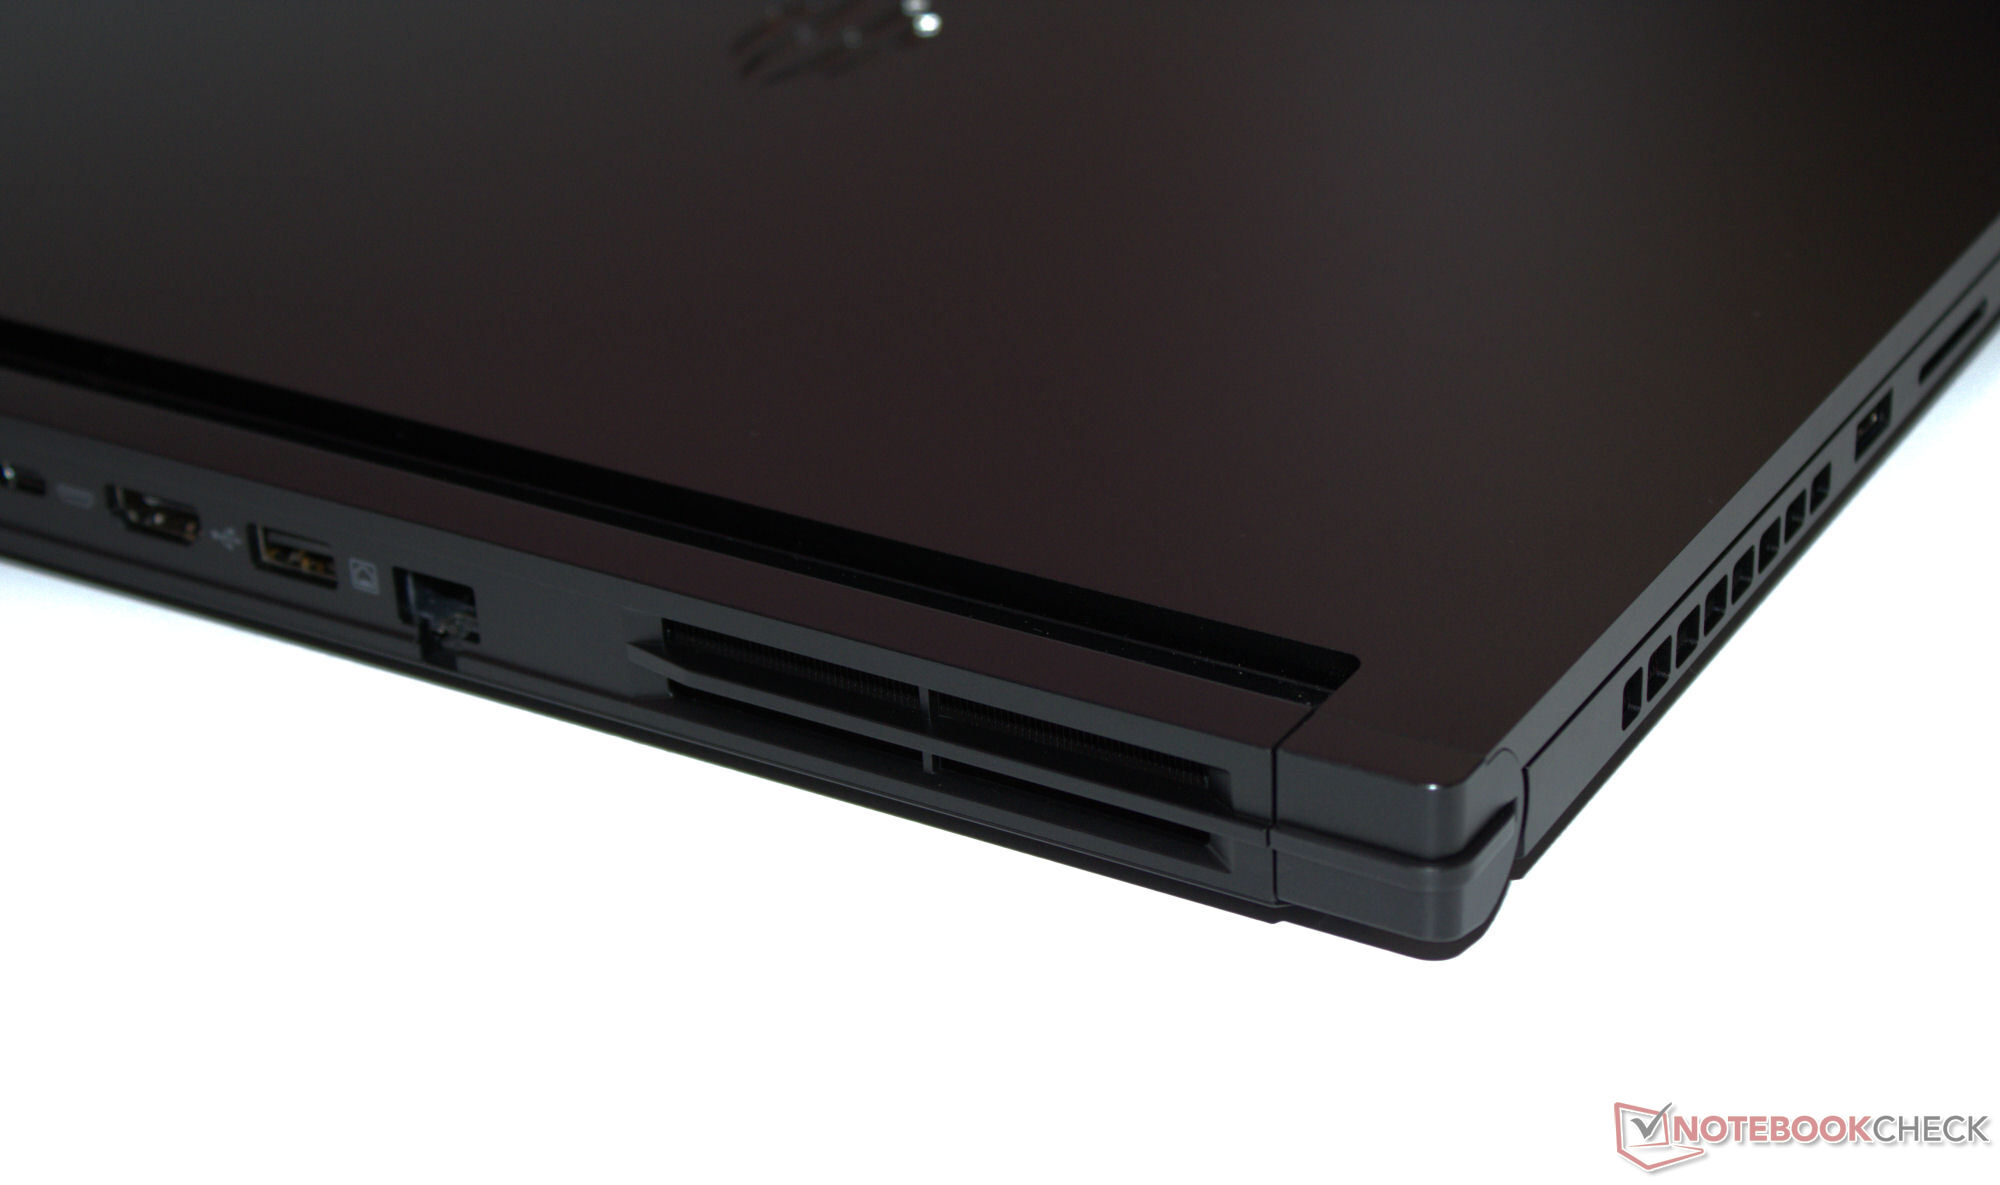
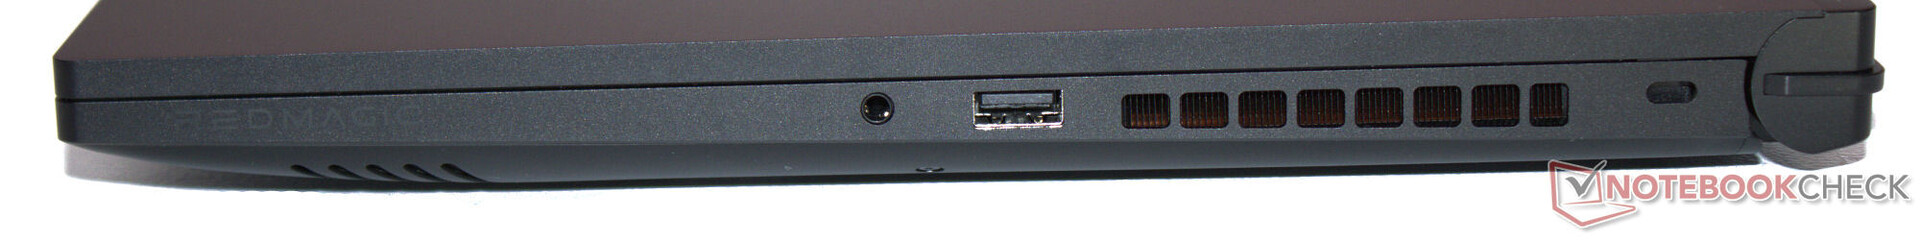
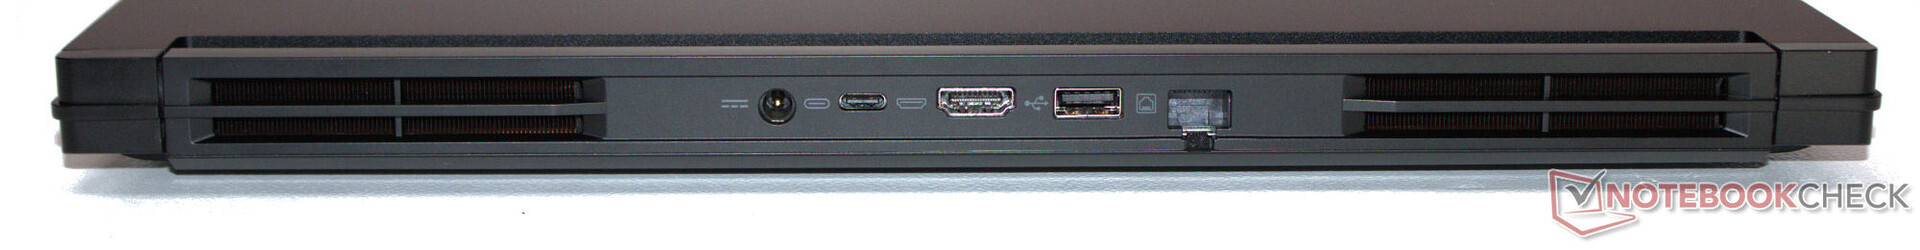
Titan, üç USB-A bağlantı noktasının (2x USB 3.2 Gen 2, 1x USB 3.2 Gen 1) yanı sıra bir USB-C bağlantı noktası (Thunderbolt 4) ile donatılmıştır. İkincisi Güç Dağıtımı ve DP Alt modunu destekler. Toplam iki video çıkışı vardır (1x HDMI, 1x DP). Bir ses jakı ve bir ethernet portu (1 GBit/s) toplam paketini tamamlıyor.
Video çıkışları, ağ soketi ve güç bağlantısının tümü cihazın arkasında yer alıyor, bu nedenle ilgili kablolar kullanım sırasında yolunuza çıkmamalı. Dizüstü bilgisayarın sol ve sağ tarafında birer USB-A bağlantı noktası bulunması da olumlu bir özellik.
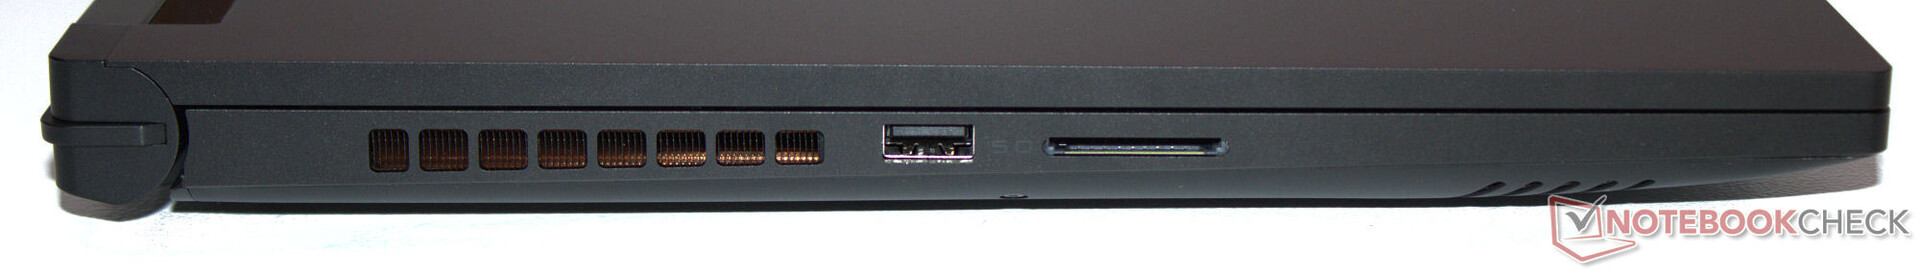
SD kart okuyucu
SD kart okuyucu (referans kart: AV PRO microSD 128 GB V60) türünün en hızlılarından biri değil ancak orta-hızlı aralıkta sağlam veri hızları sunuyor. Bu değerlerle karşılaştırıldığında Blade 16 (2024) önemli ölçüde daha yüksek aktarım hızlarının mümkün olabileceğini kanıtlamaktadır.
| SD Card Reader | |
| average JPG Copy Test (av. of 3 runs) | |
| Razer Blade 16 2024, RTX 4090 | |
| Sınıf ortalaması Gaming (19 - 197.3, n=68, son 2 yıl) | |
| SCHENKER XMG Pro 16 Studio (Mid 24) (AV PRO microSD 128 GB V60) | |
| Nubia RedMagic Titan 16 Pro (AV PRO microSD 128 GB V60) | |
| Acer Predator Helios Neo 16 (2024) (AV PRO microSD 128 GB V60) | |
| maximum AS SSD Seq Read Test (1GB) | |
| Razer Blade 16 2024, RTX 4090 | |
| Sınıf ortalaması Gaming (25.8 - 263, n=67, son 2 yıl) | |
| SCHENKER XMG Pro 16 Studio (Mid 24) (AV PRO microSD 128 GB V60) | |
| Nubia RedMagic Titan 16 Pro (AV PRO microSD 128 GB V60) | |
| Acer Predator Helios Neo 16 (2024) (AV PRO microSD 128 GB V60) | |
İletişim
Ağ seçenekleri söz konusu olduğunda sürpriz yok: Kablolu bağlantılar, Realtek'in yerleşik bir Gigabit Ethernet denetleyicisi (RTL8168/8111, 1 GBit/s) tarafından gerçekleştirilir. Intel'in WiFi 6E çipi (AX211), optimum koşullar altında (çevrede WiFi cihazı yok, dizüstü bilgisayar ile sunucu arasında kısa mesafe) iyi ila çok iyi veri hızları sunar.
Web kamerası
Web kamerası (2,1 MP) Windows Hello desteği de dahil olmak üzere standart bir özelliktir. Kameranın mekanik bir kapağı veya fiziksel bir açma/kapama düğmesi yoktur.


Aksesuarlar
Olağan belgelerin (hızlı başlangıç kılavuzu ve garanti bilgileri) yanı sıra, dizüstü bilgisayarla birlikte hiçbir ek aksesuar verilmiyor.
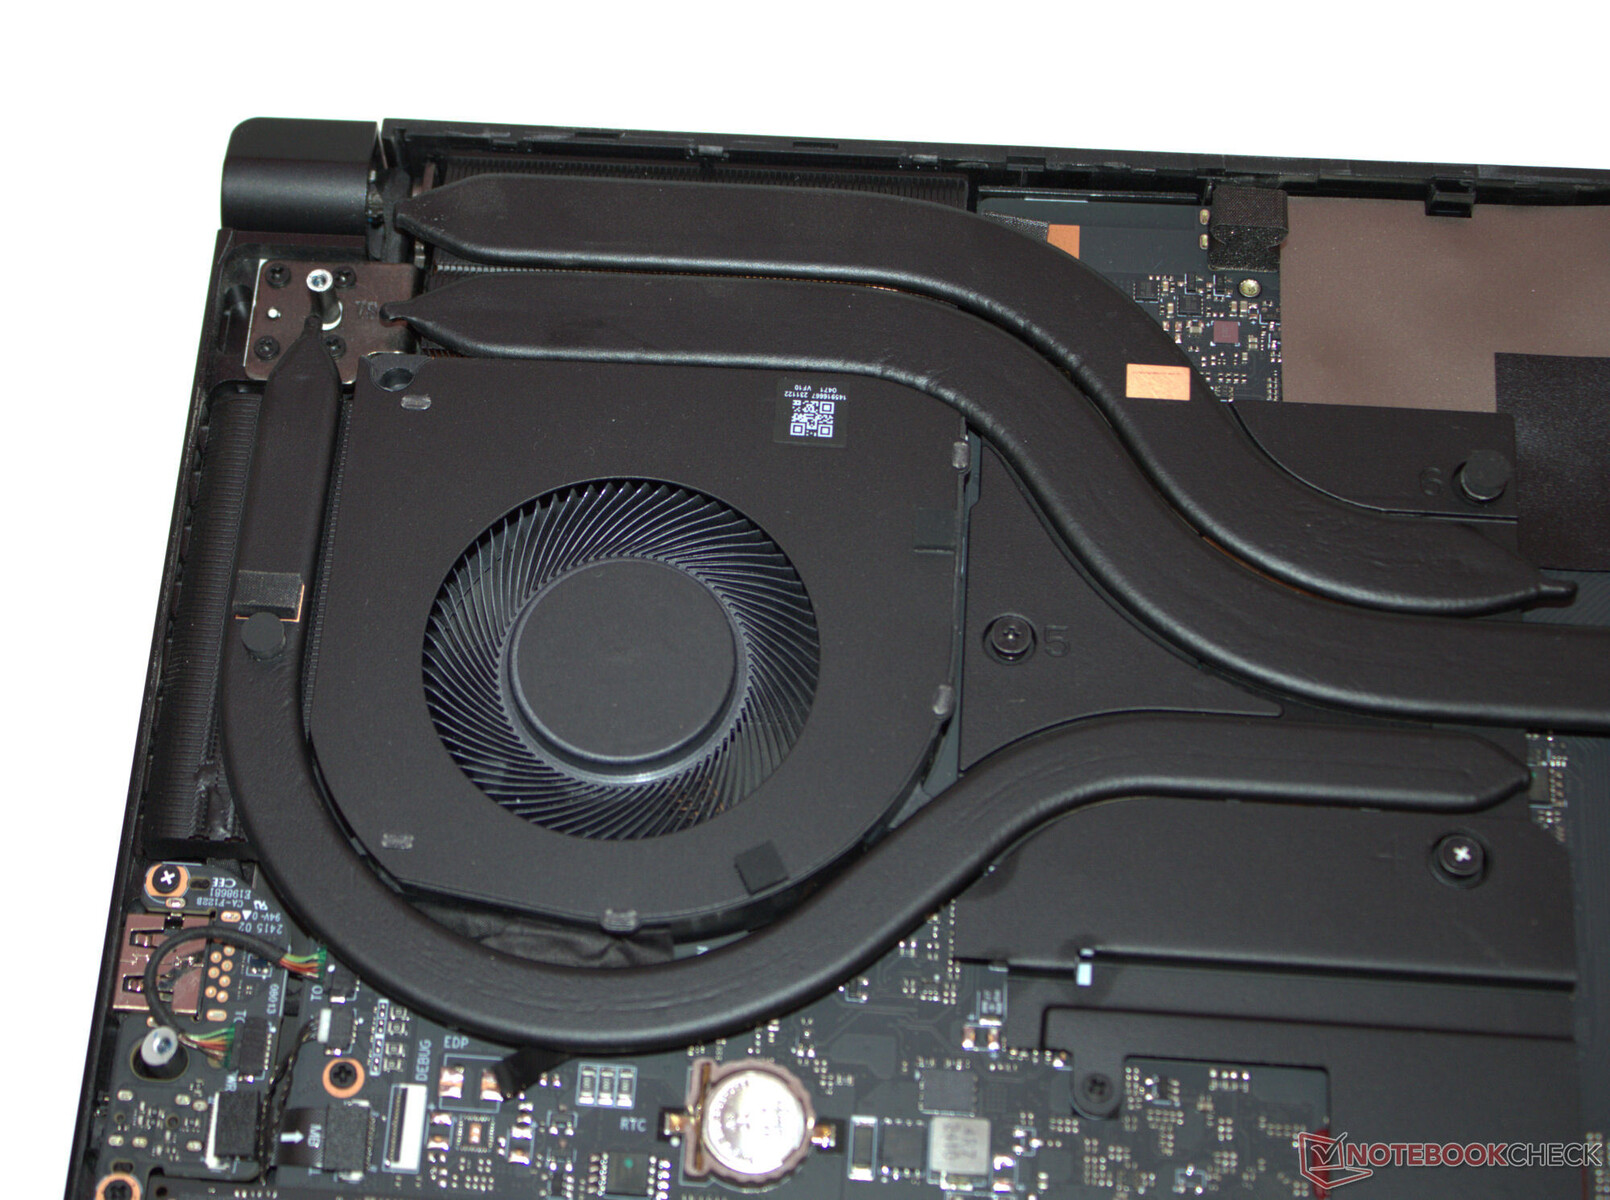
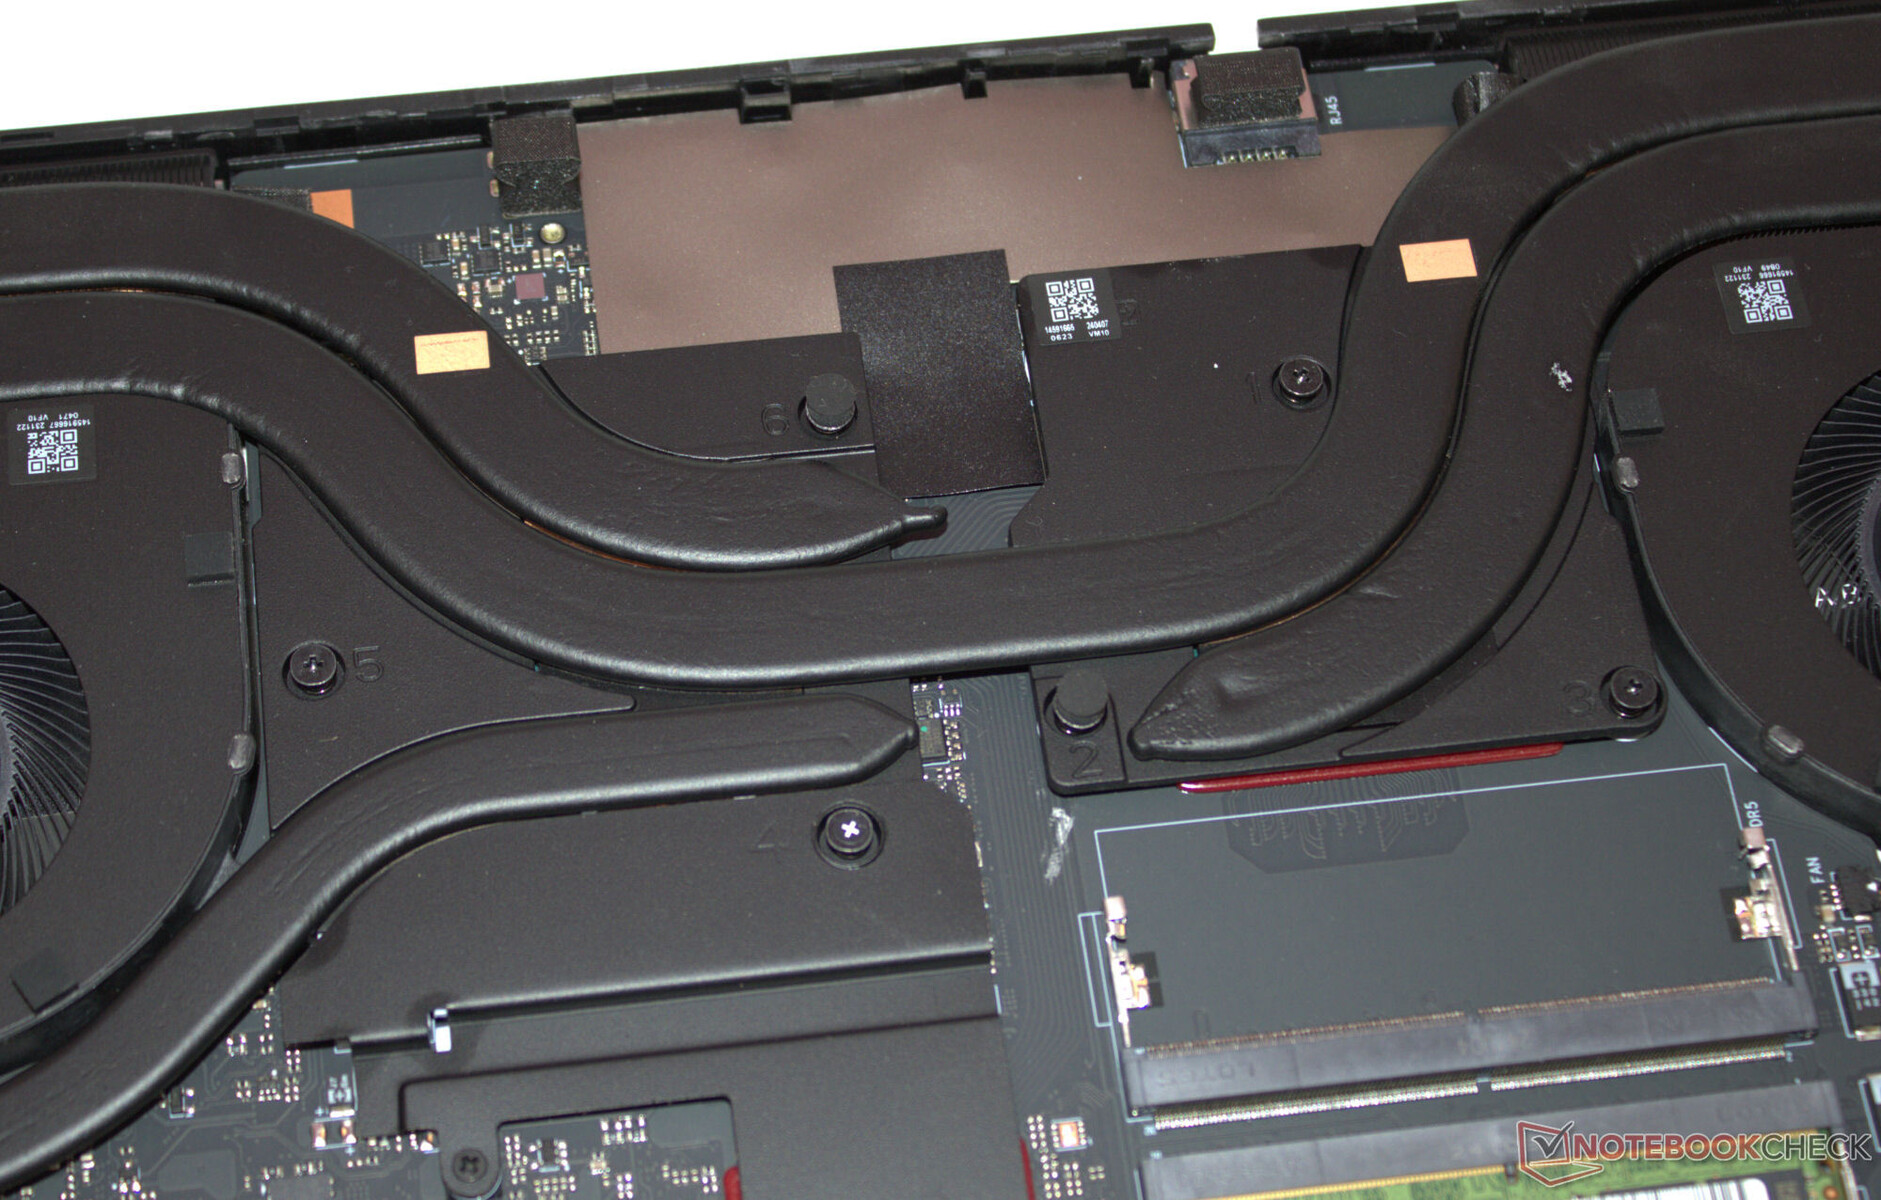
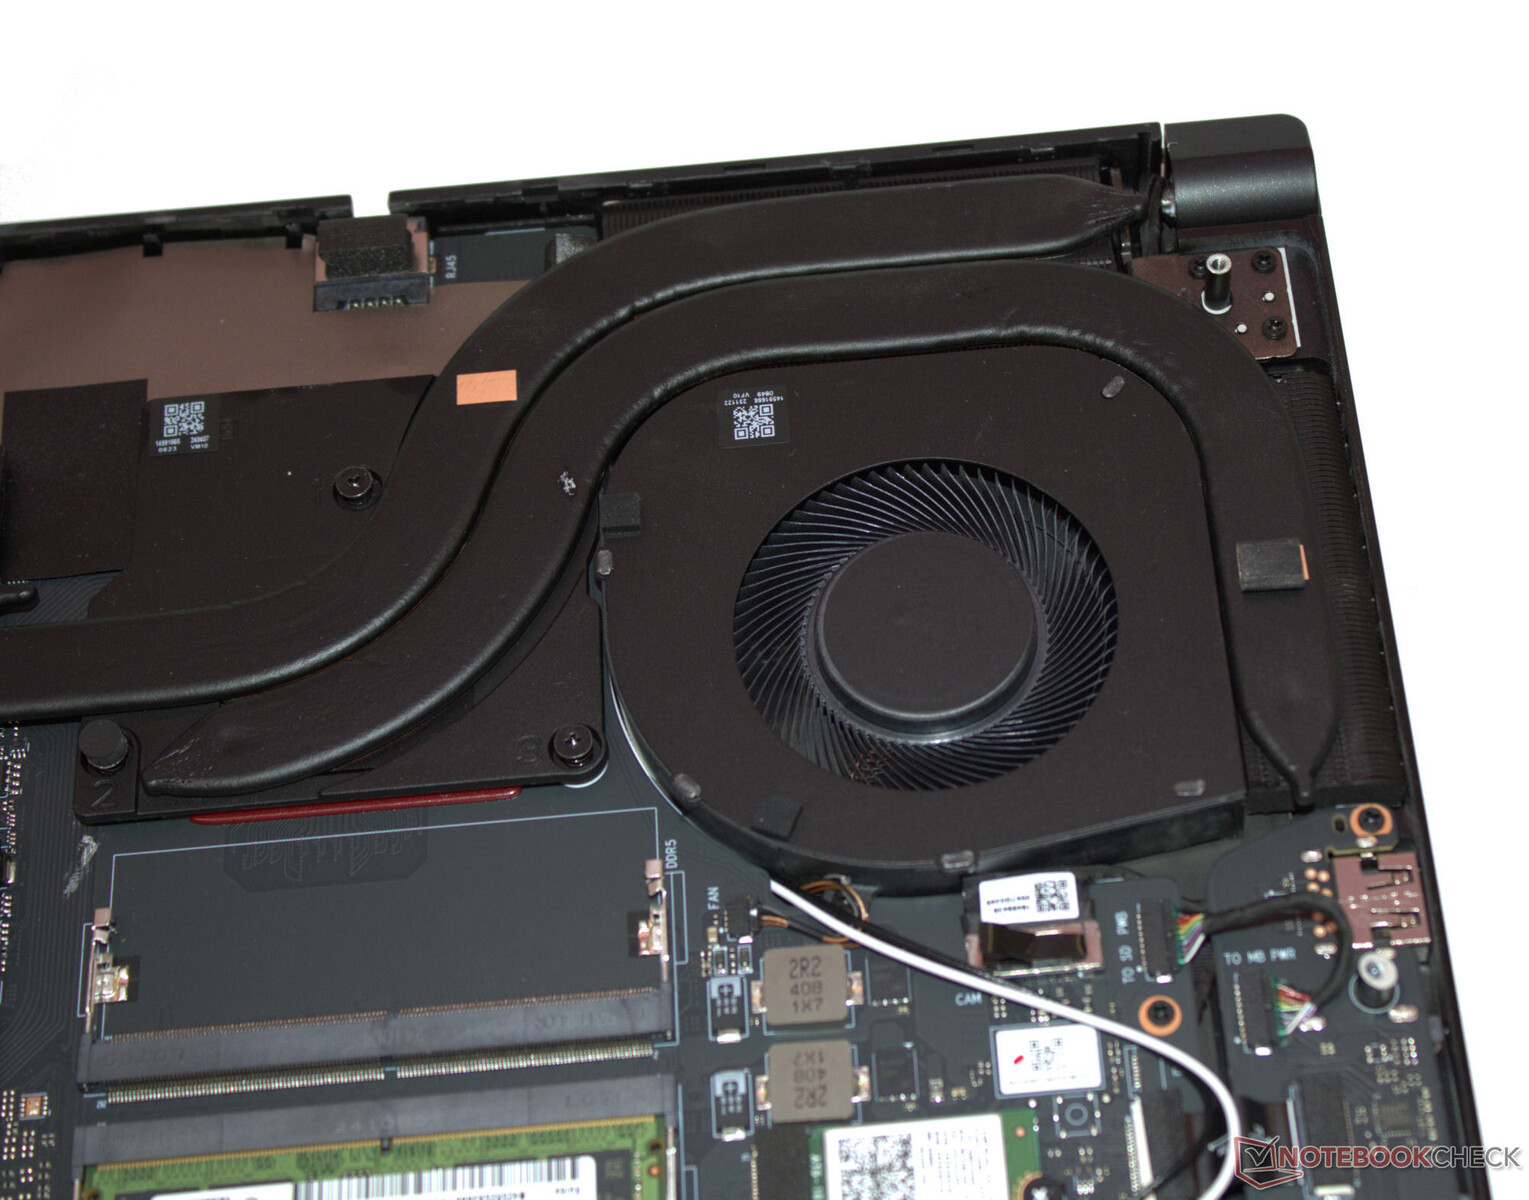
Bakım
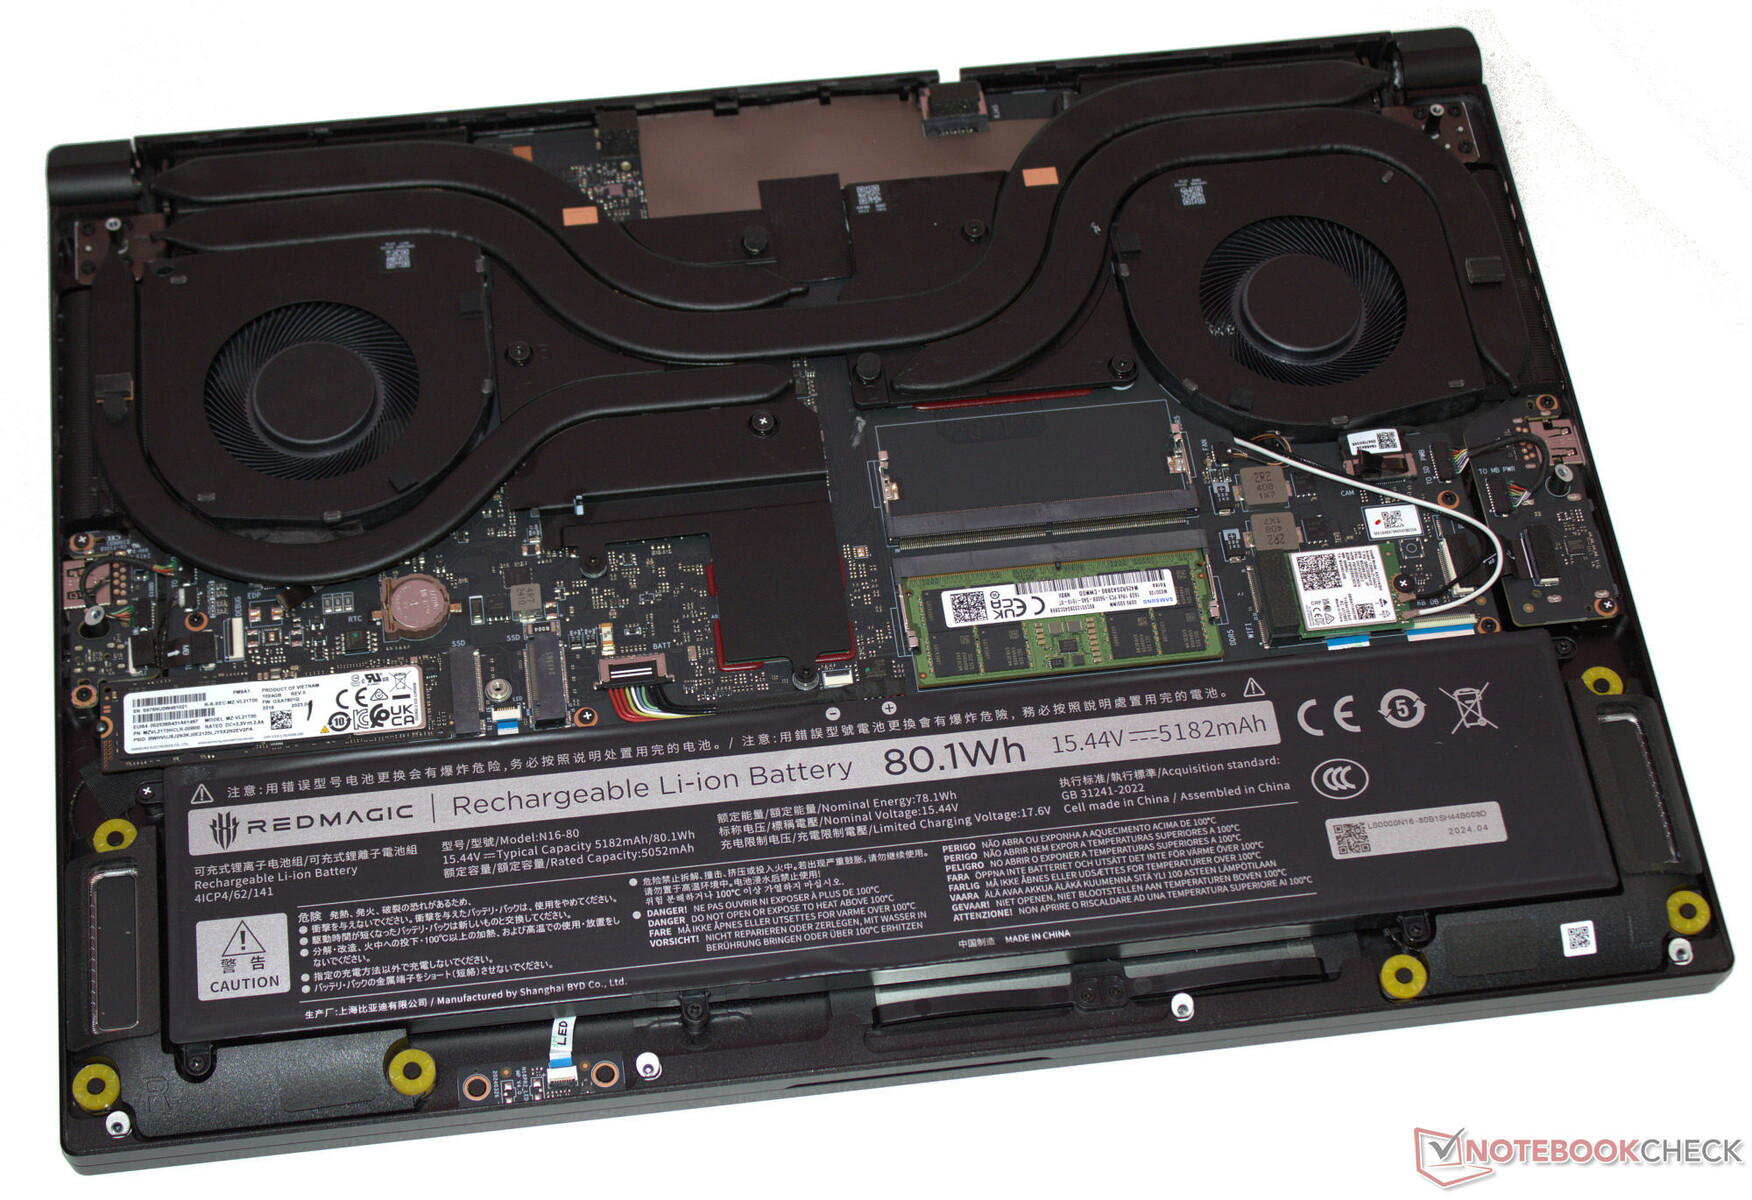
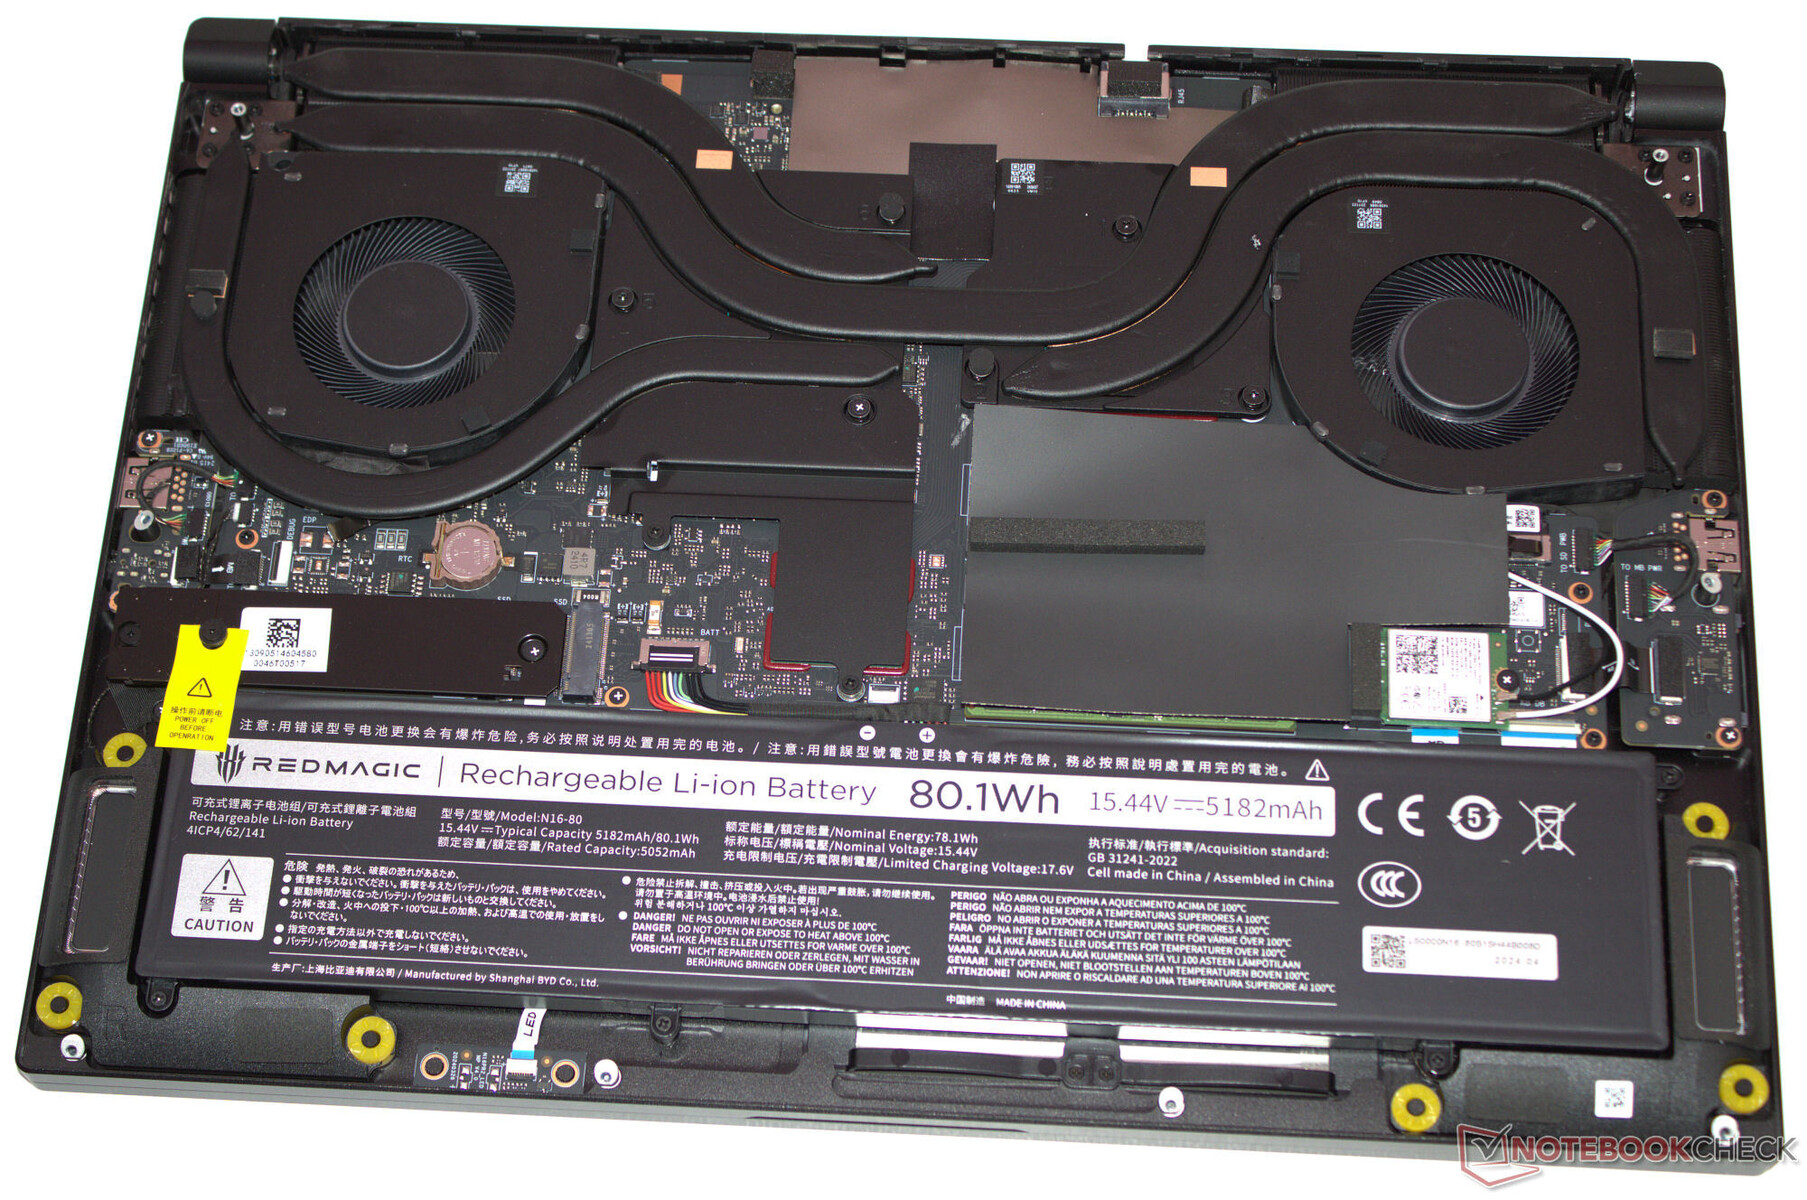
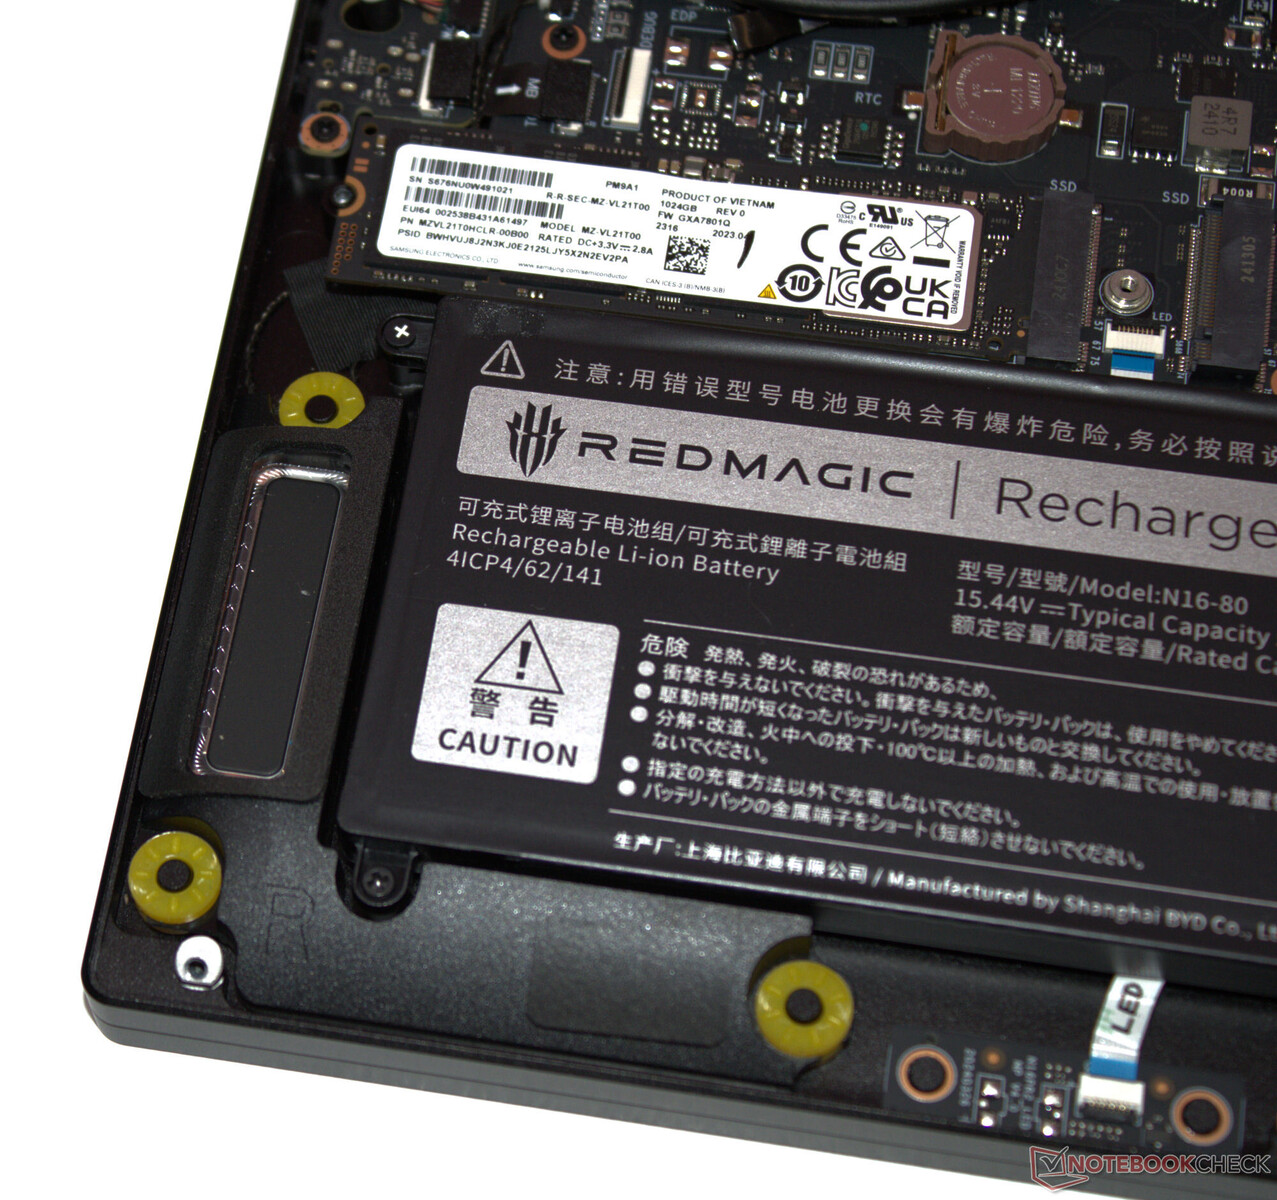
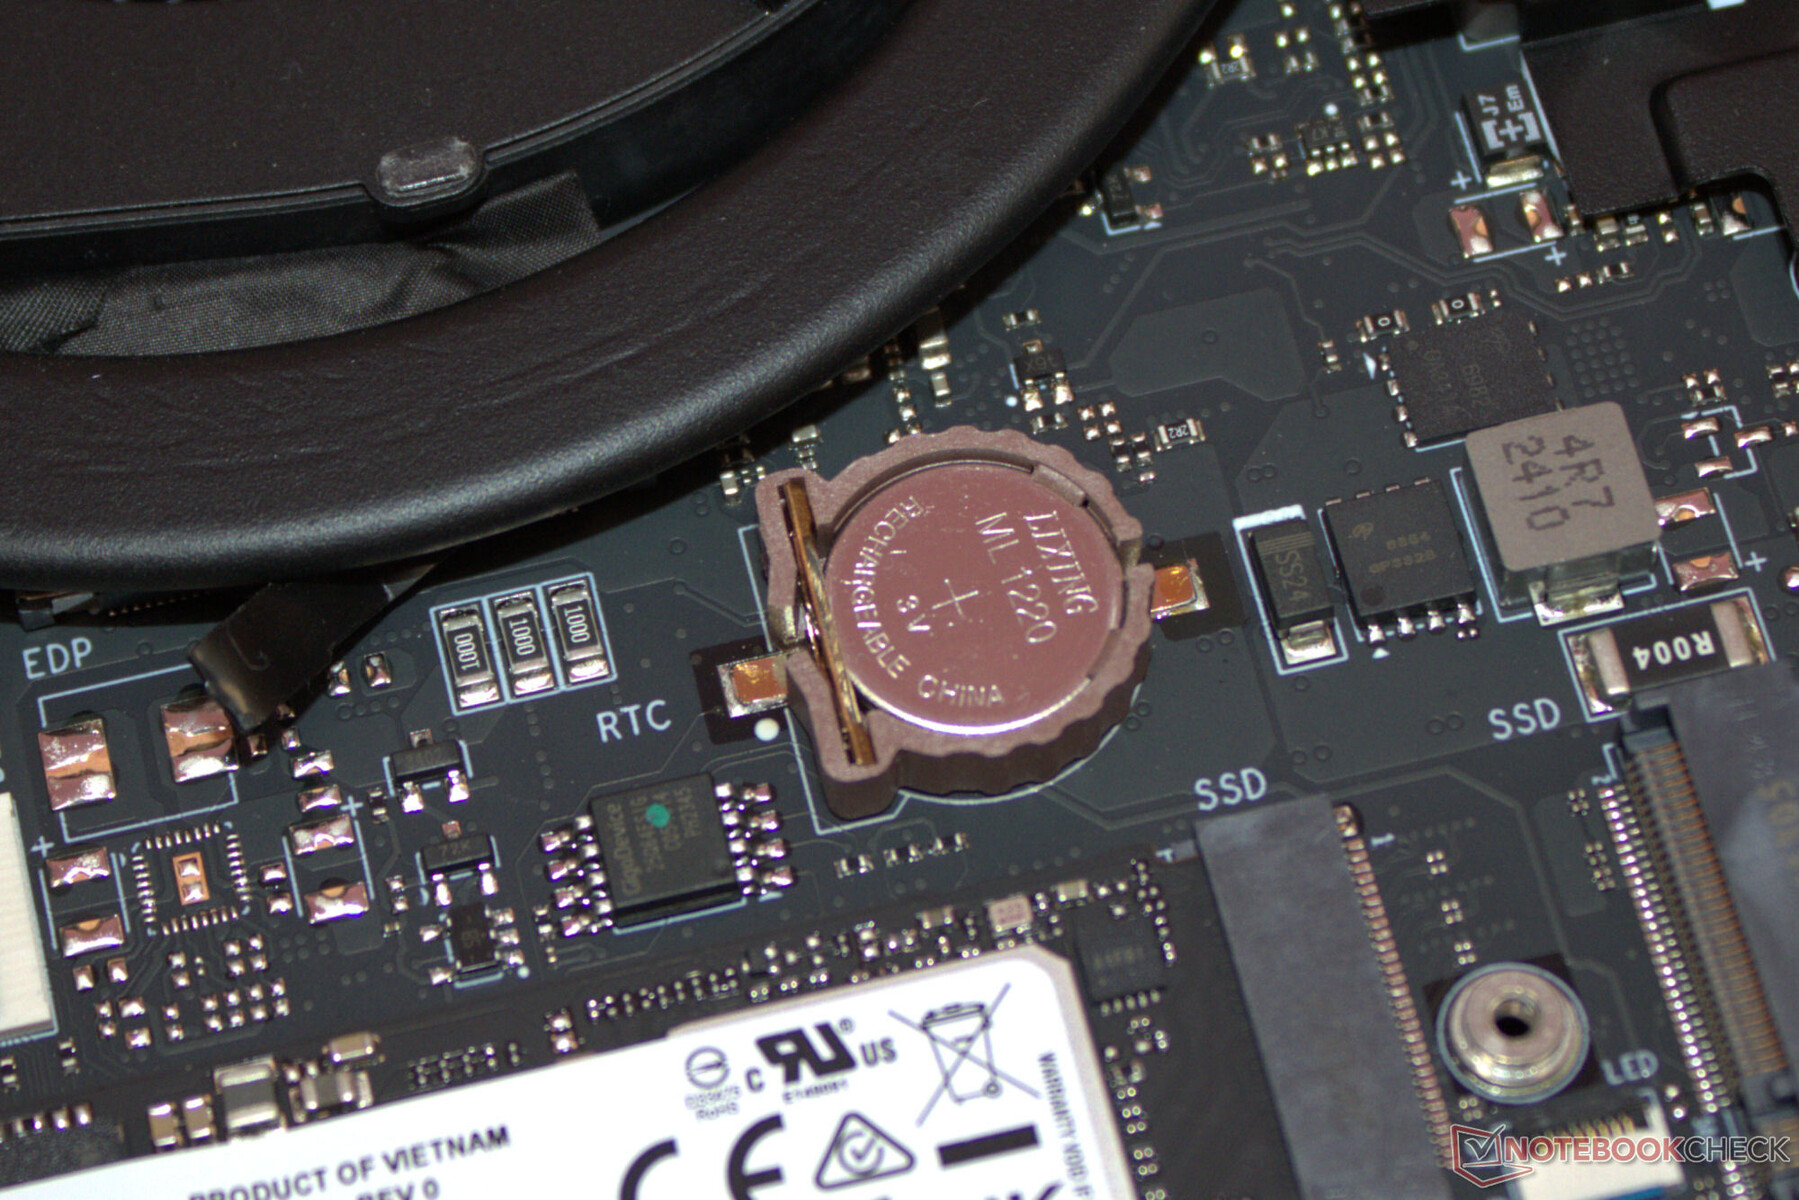
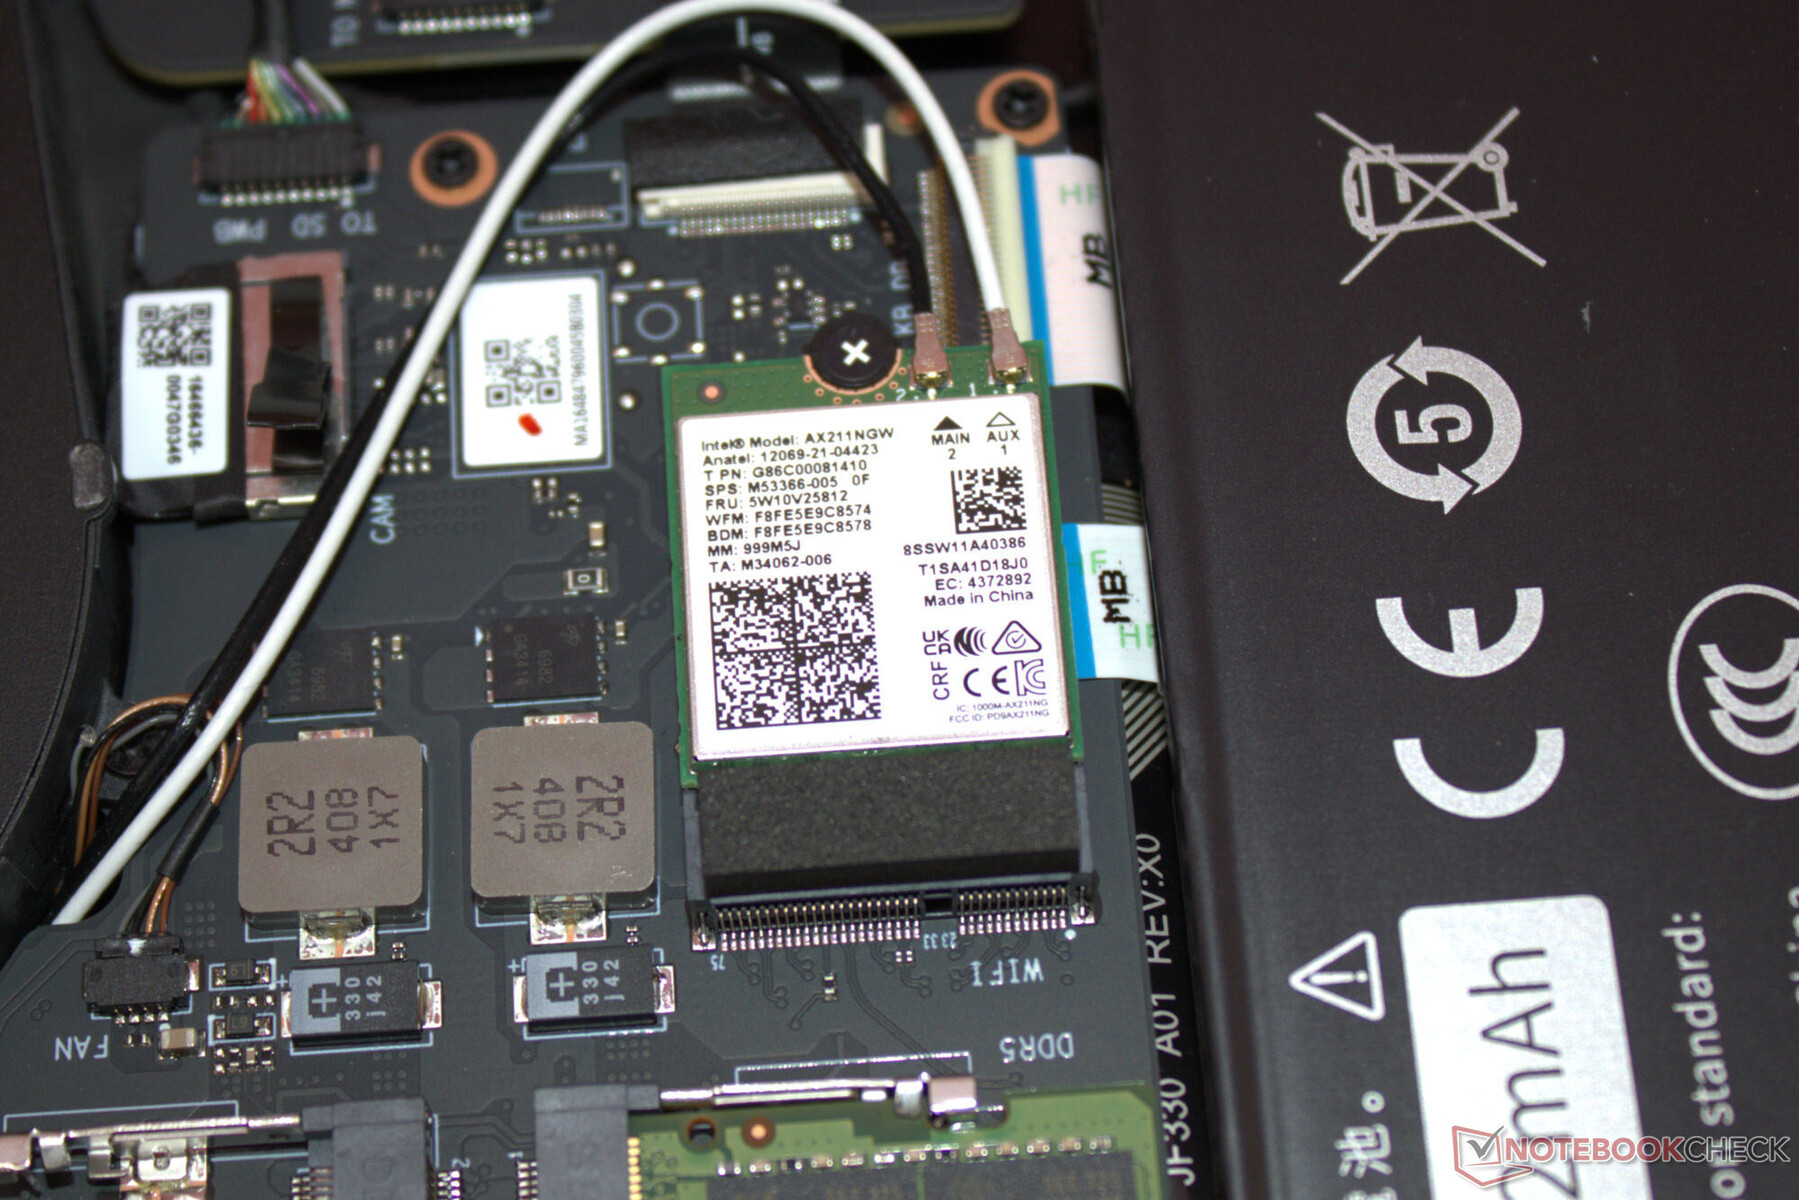
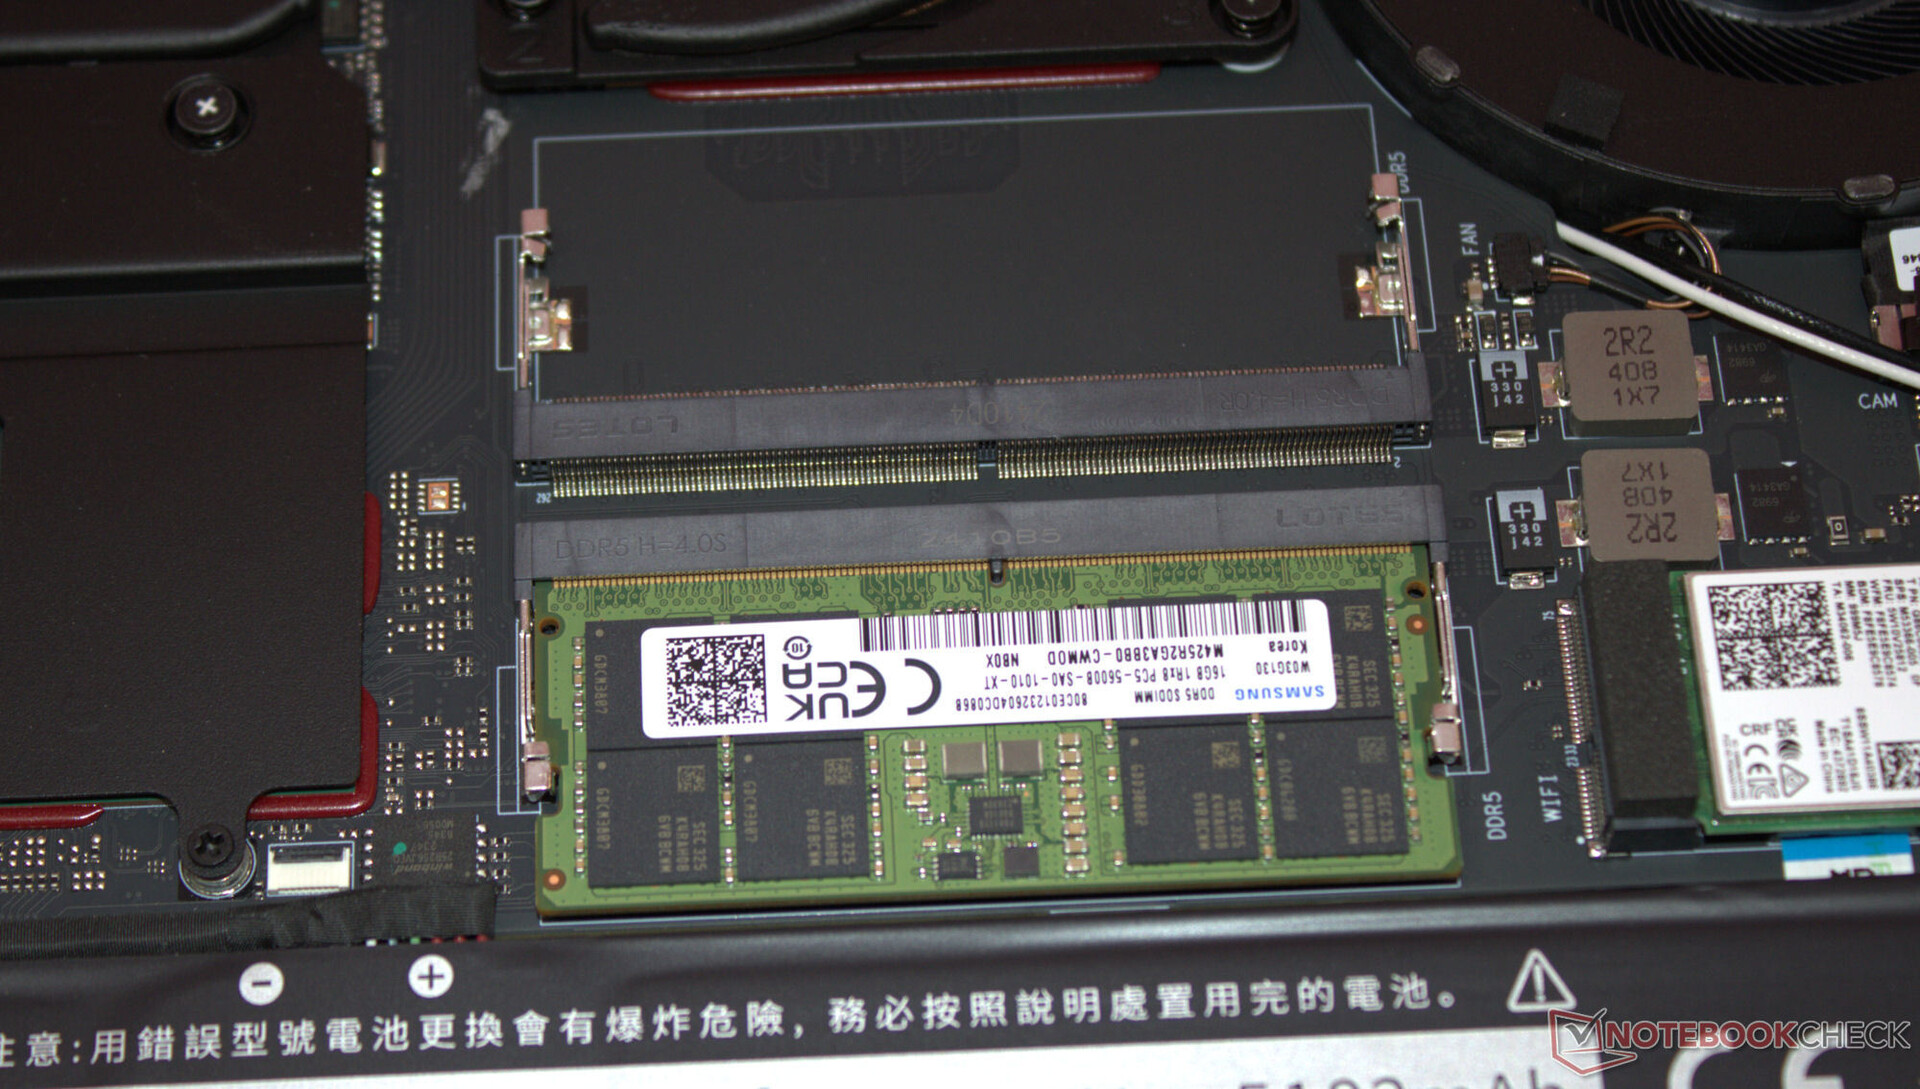
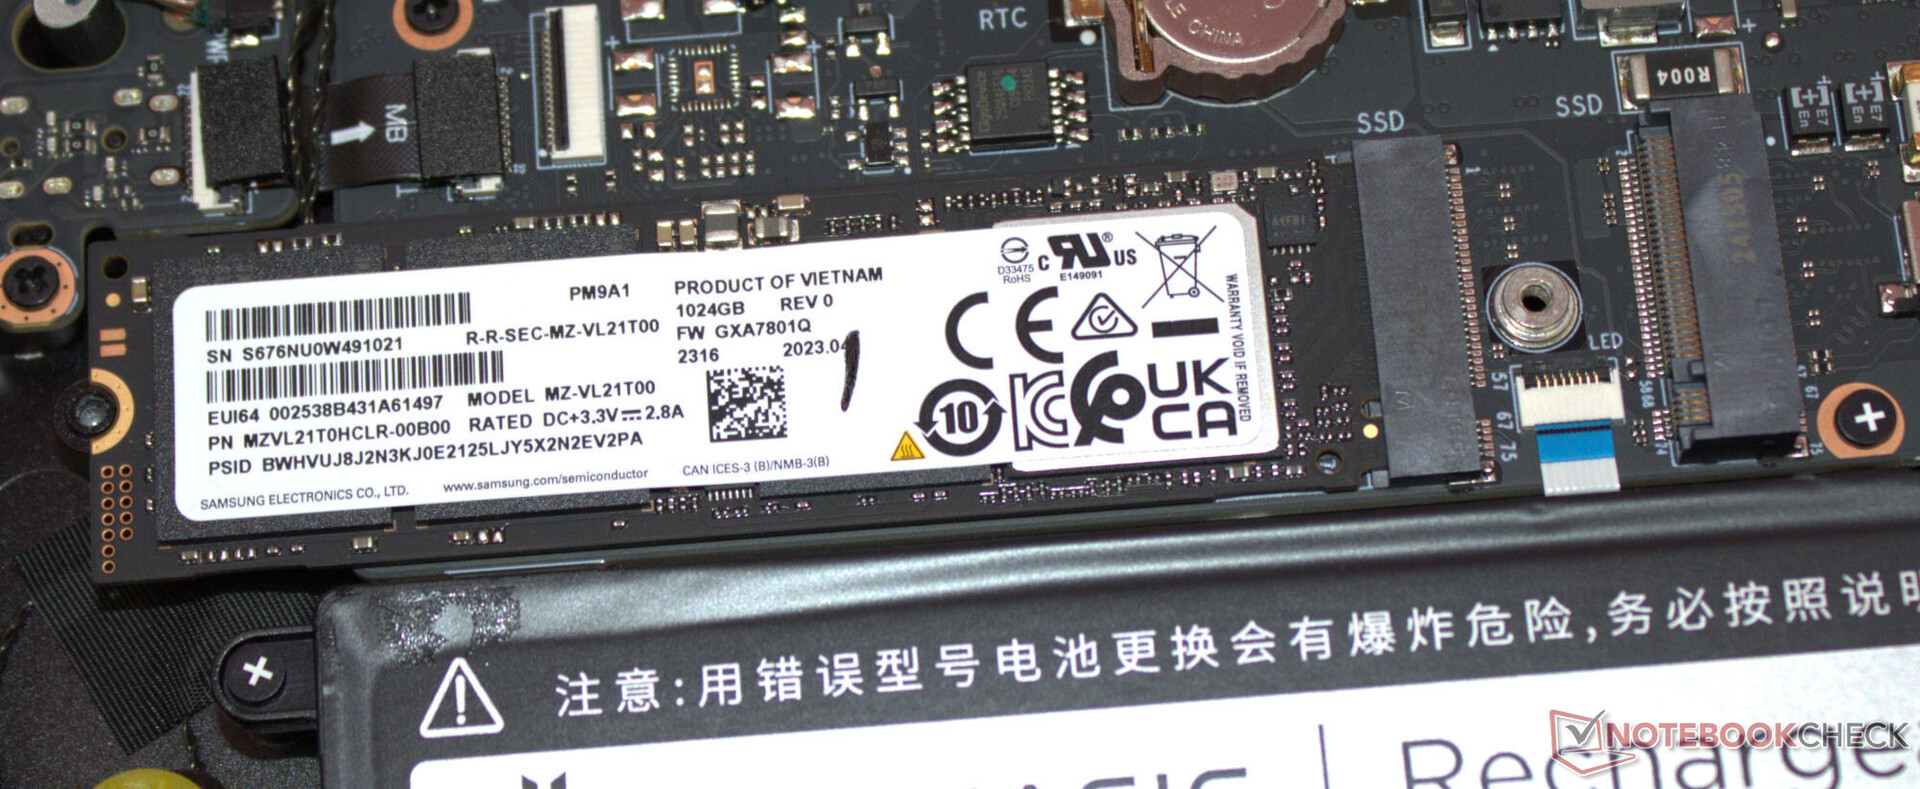
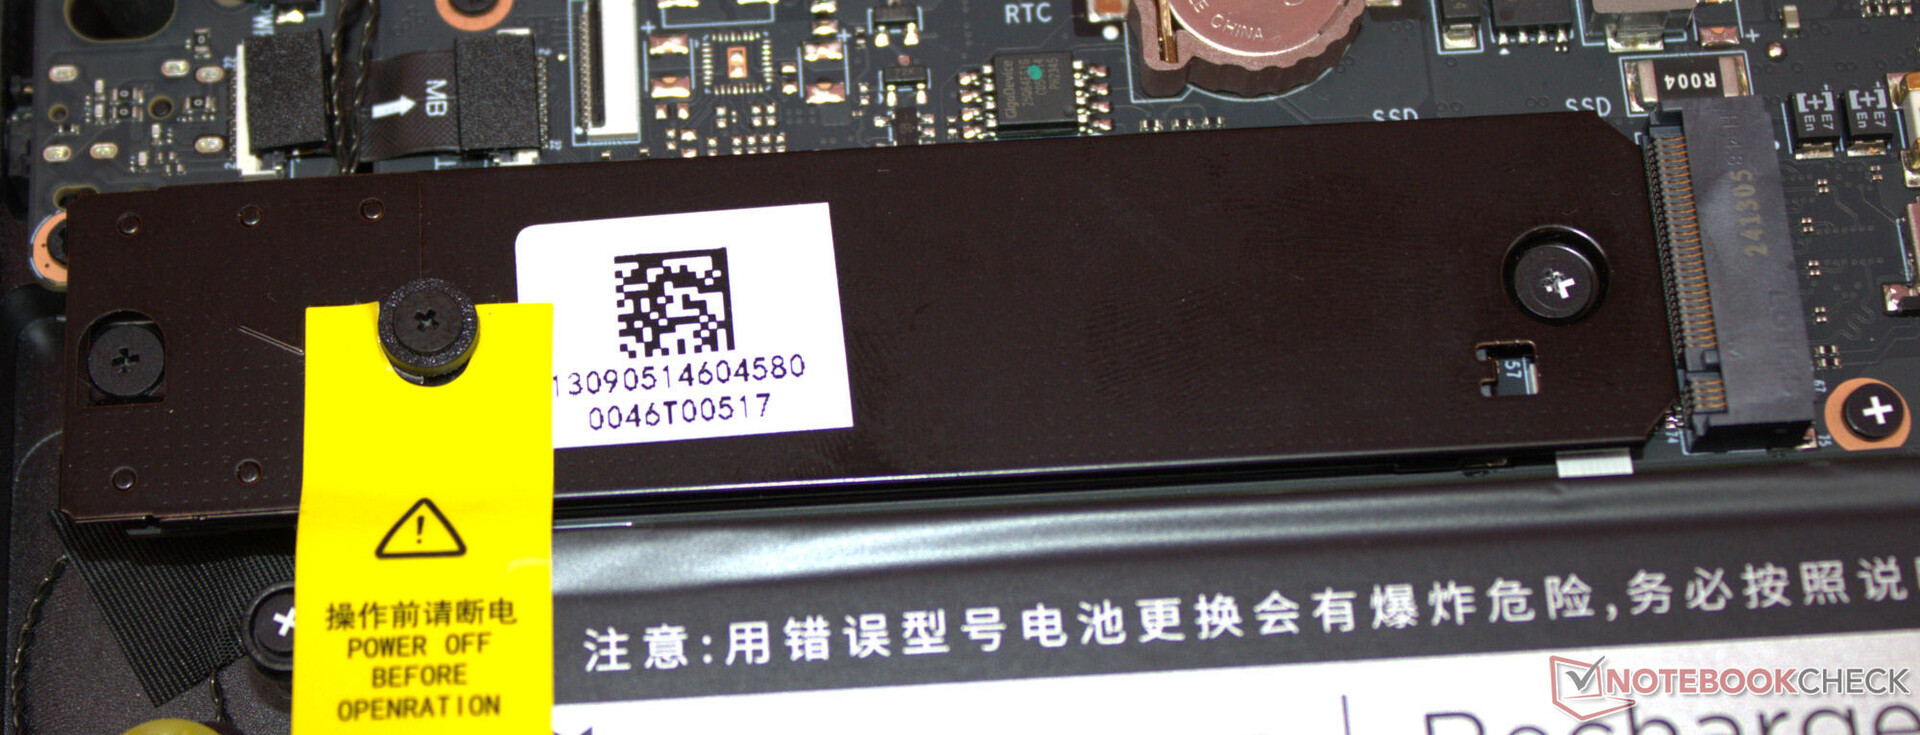
Kasanın altındaki tüm vidaları söktükten sonra, alt kasa kısmı bir mızrap veya düz bir spatula yardımıyla çıkarılabilir. Ardından bellek bankalarına (biri dolu), SSD'ye (PCIe 4, M.2-2280), ikinci SSD yuvasına (PCIe 4, M.2-2280) WLAN modülüne, BIOS piline, fanlara ve pile erişebilirsiniz.
Sürdürülebilirlik
Çok fazla karton, az plastik: Dizüstü bilgisayar bir filmle kaplıdır ve ince bir köpük mat cihazın üstünü korur. Basılı hızlı başlangıç kılavuzu plastik bir torba içinde. Çıkarılabilir bir taban plakası dizüstü bilgisayarın onarımını mümkün kılıyor; tüm donanıma erişilebiliyor. Yazılım güncellemeleri önümüzdeki birkaç yıl için sorun teşkil etmeyecektir; ne de olsa işletim sistemi olarak Windows 11 kullanılmaktadır.
Nubia'nın kendi yazılımı için yedek parça ve destek tedarikini nasıl ele alacağını göreceğiz. Test sırasında, Nubia web sitesinde Titan için hala bir indirme alanı bulunmuyor.
Garanti
Dizüstü bilgisayarın garantisine ilişkin herhangi bir bilgi veremiyoruz; muhtemelen ABD'de standart olan 12 ay civarında olacaktır. Uzatılmış garantilerin pek olası olmadığını düşünüyoruz.
Giriş cihazları - RGB aydınlatmalı RedMagic dizüstü bilgisayar
Klavye
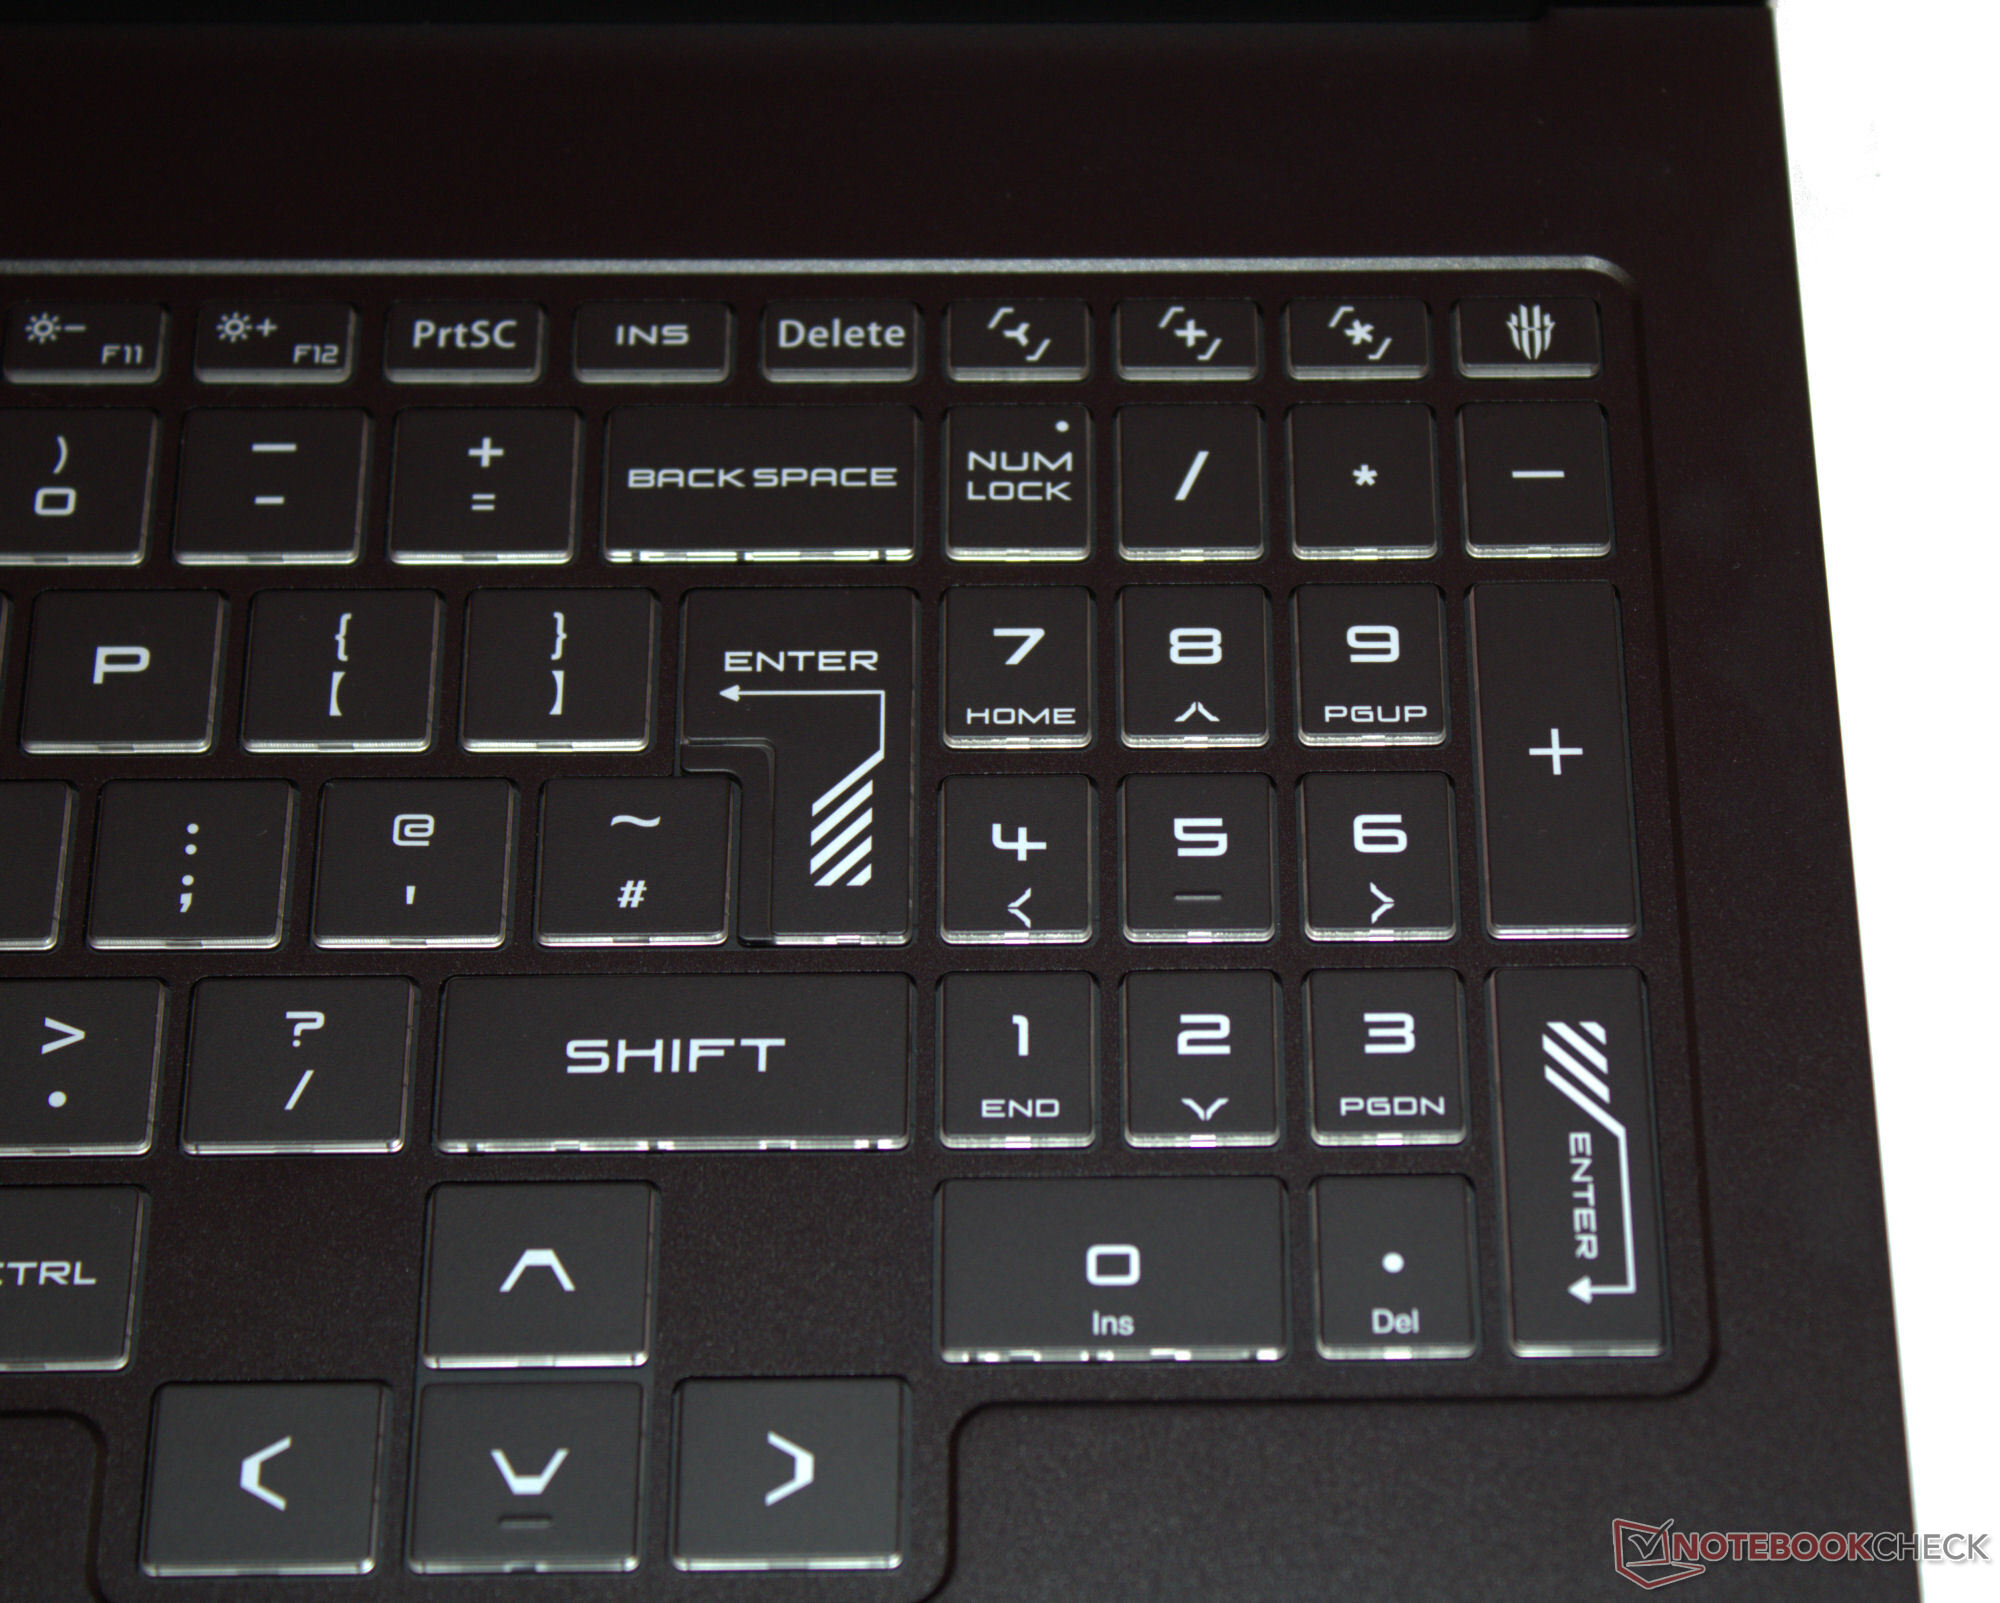
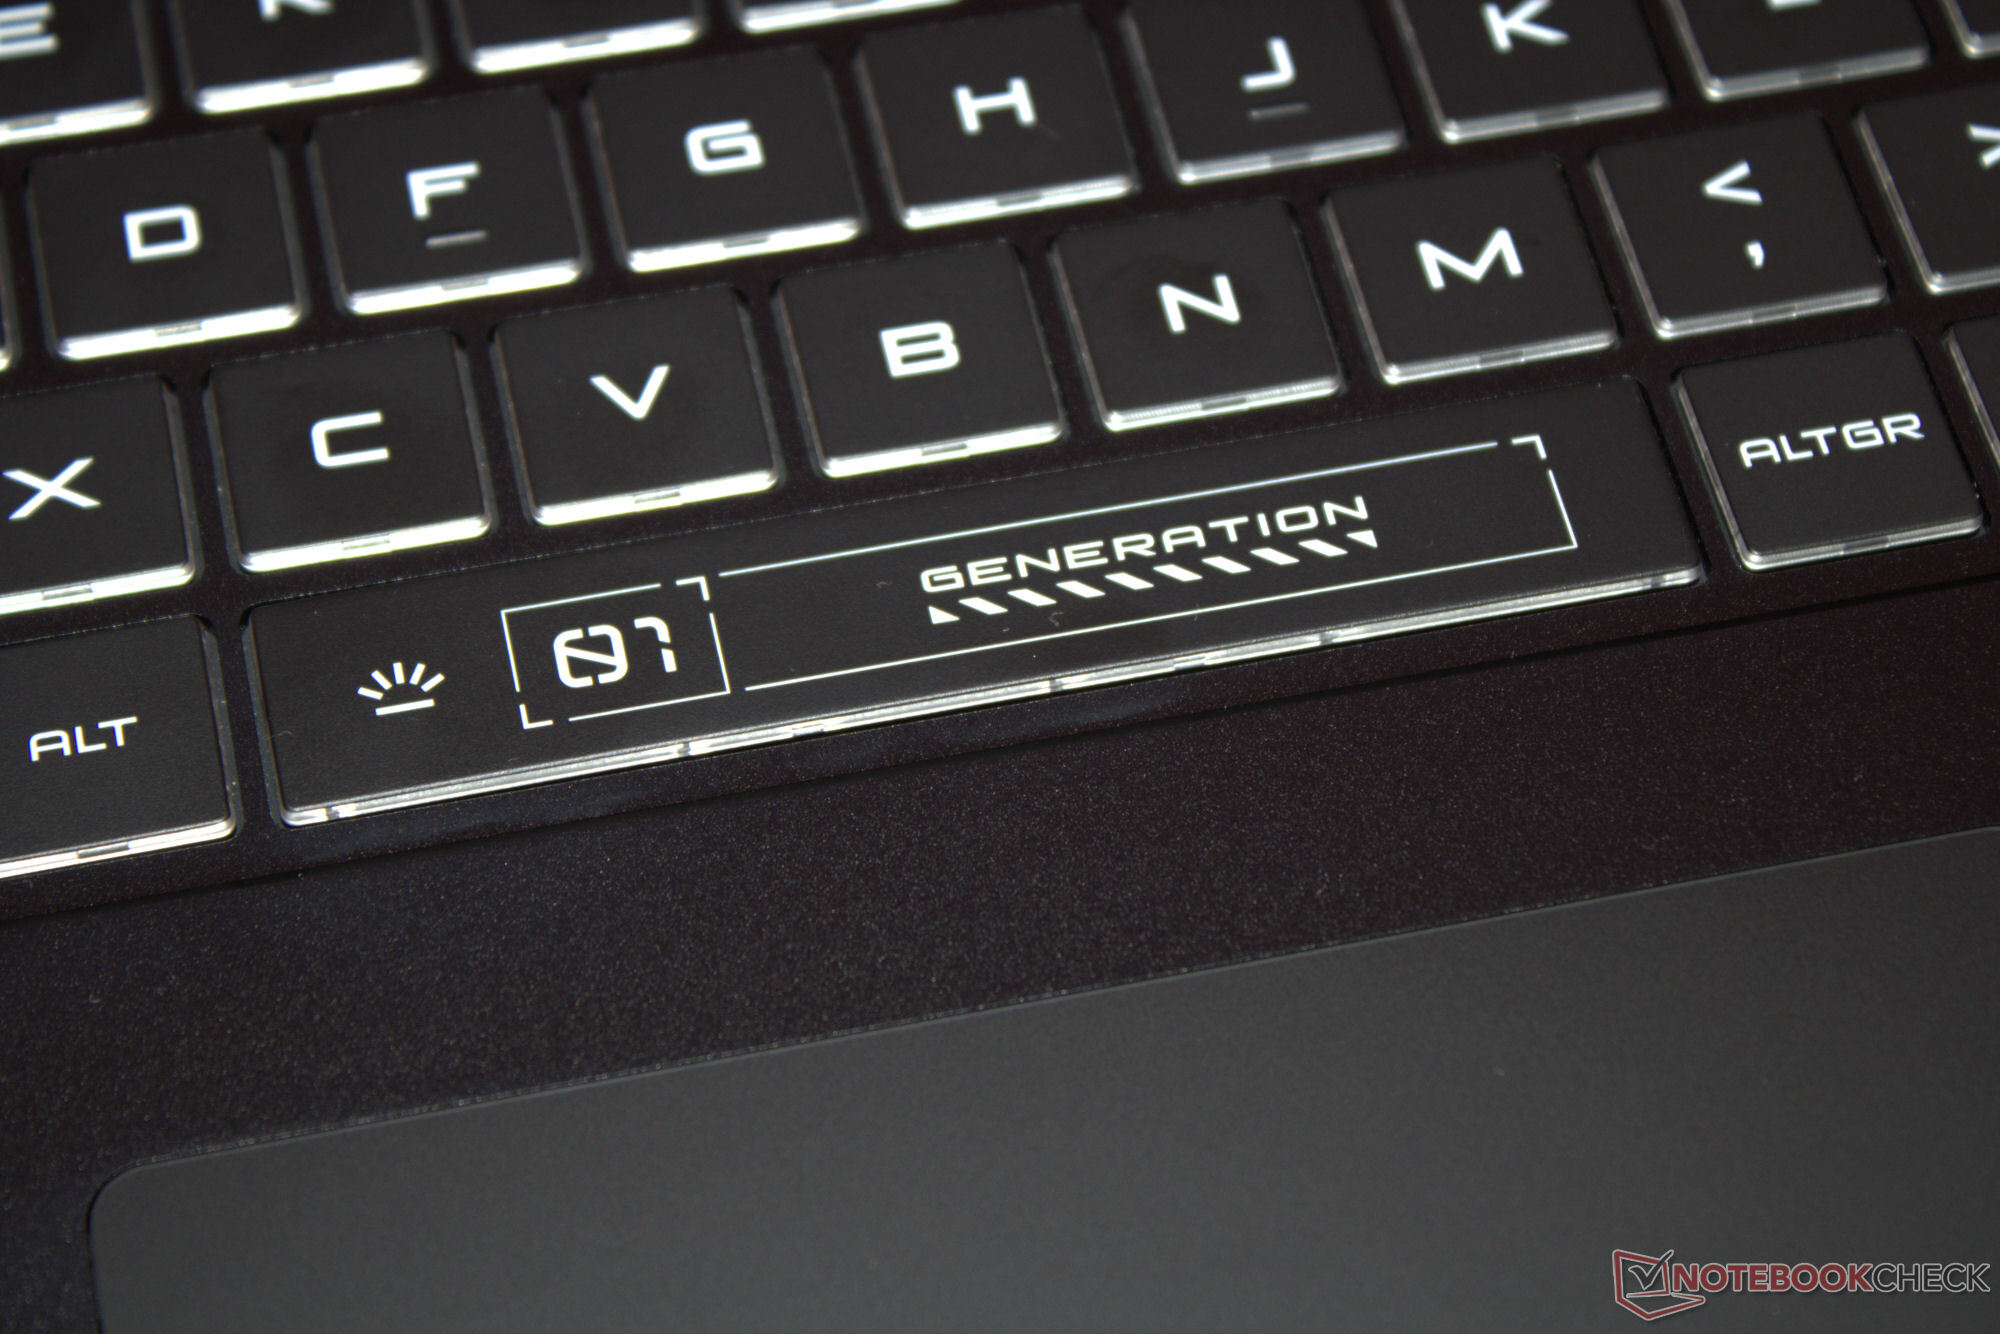
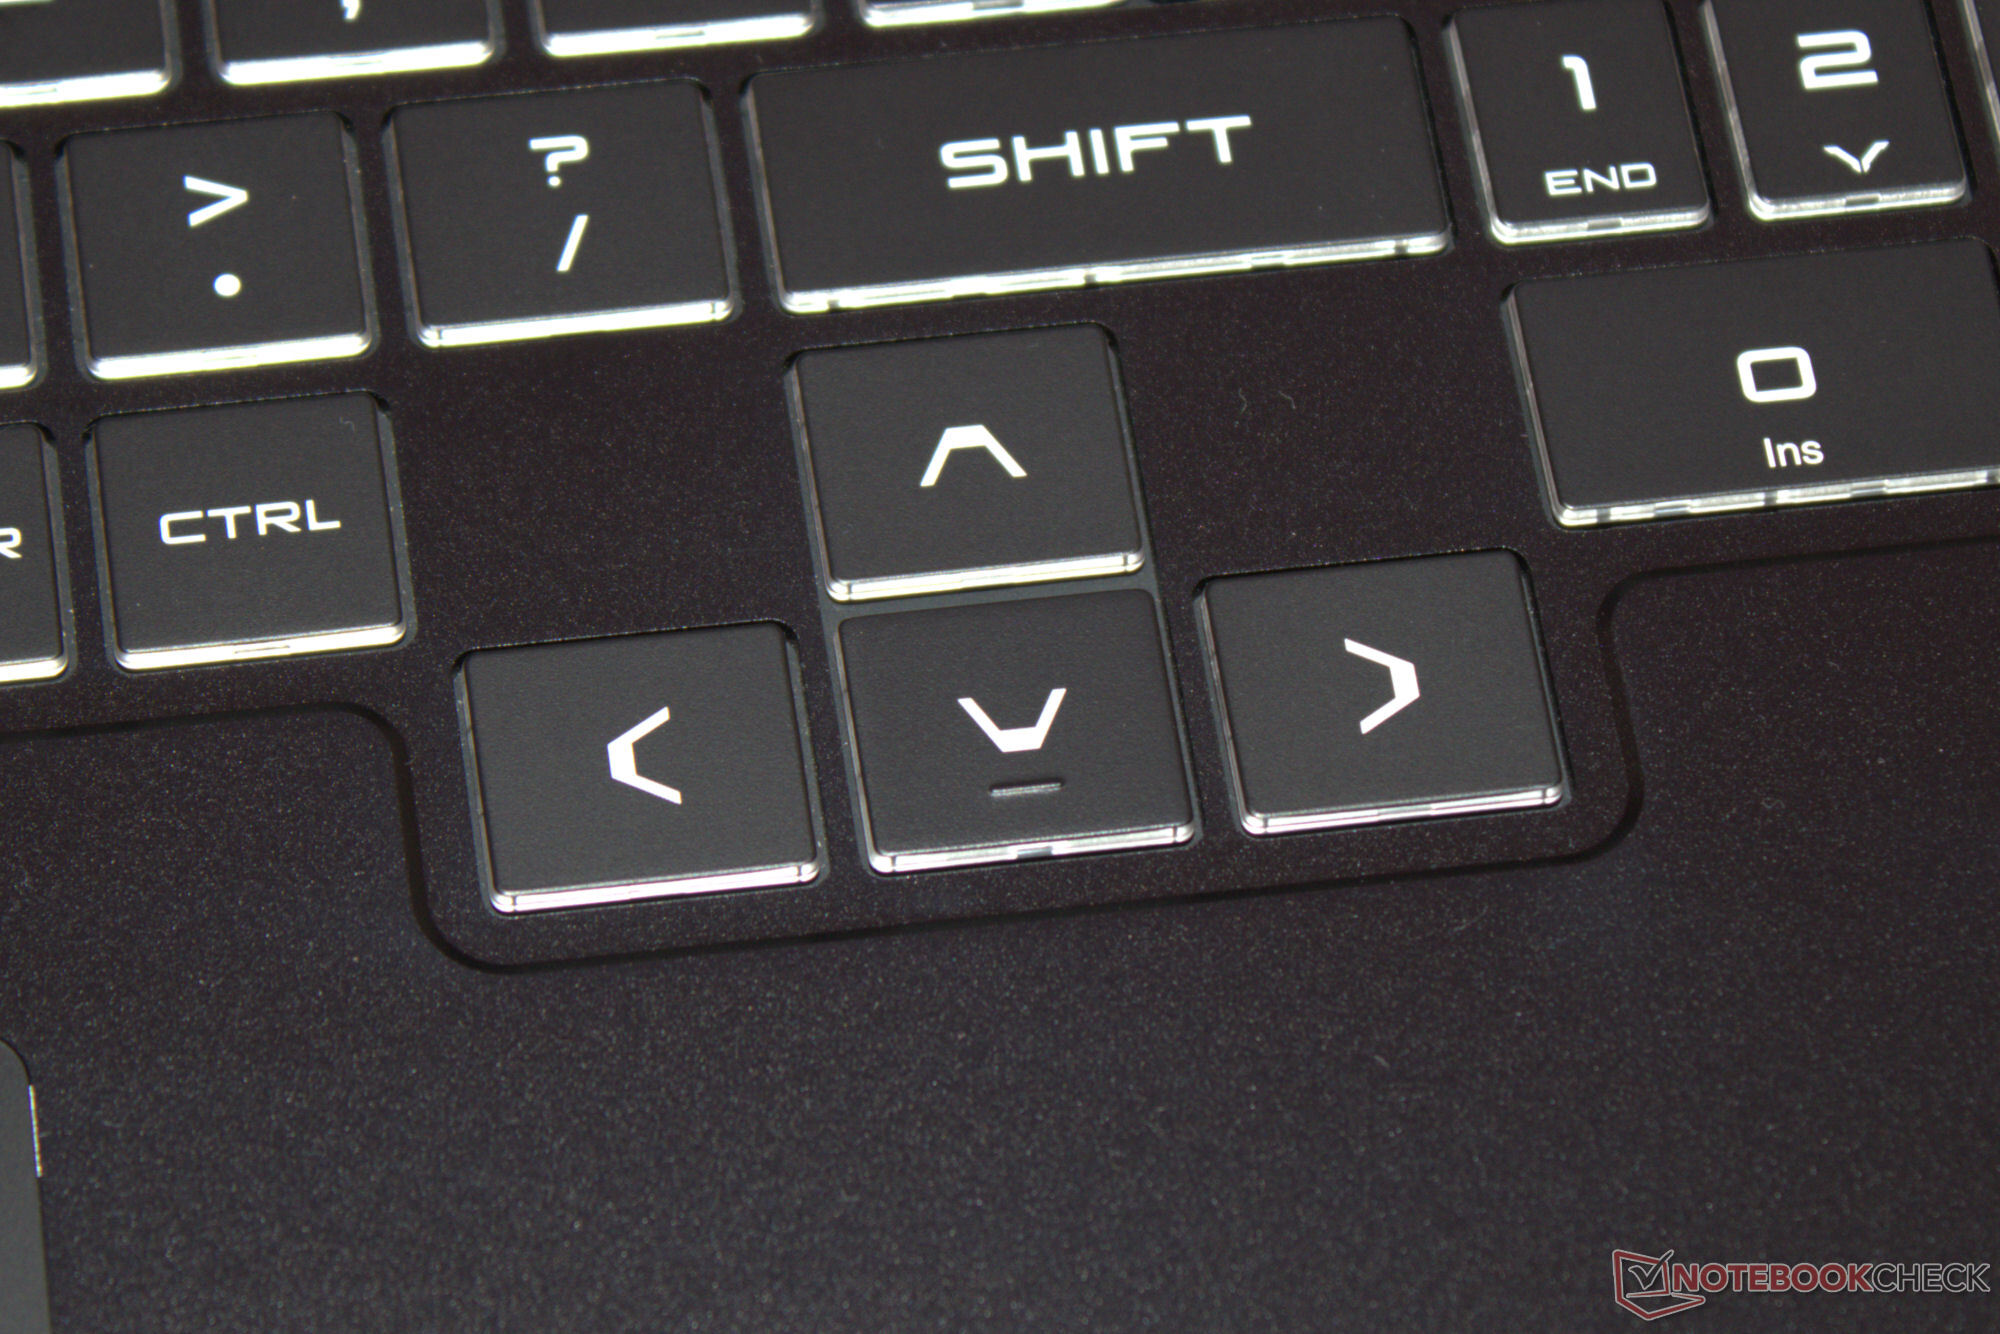
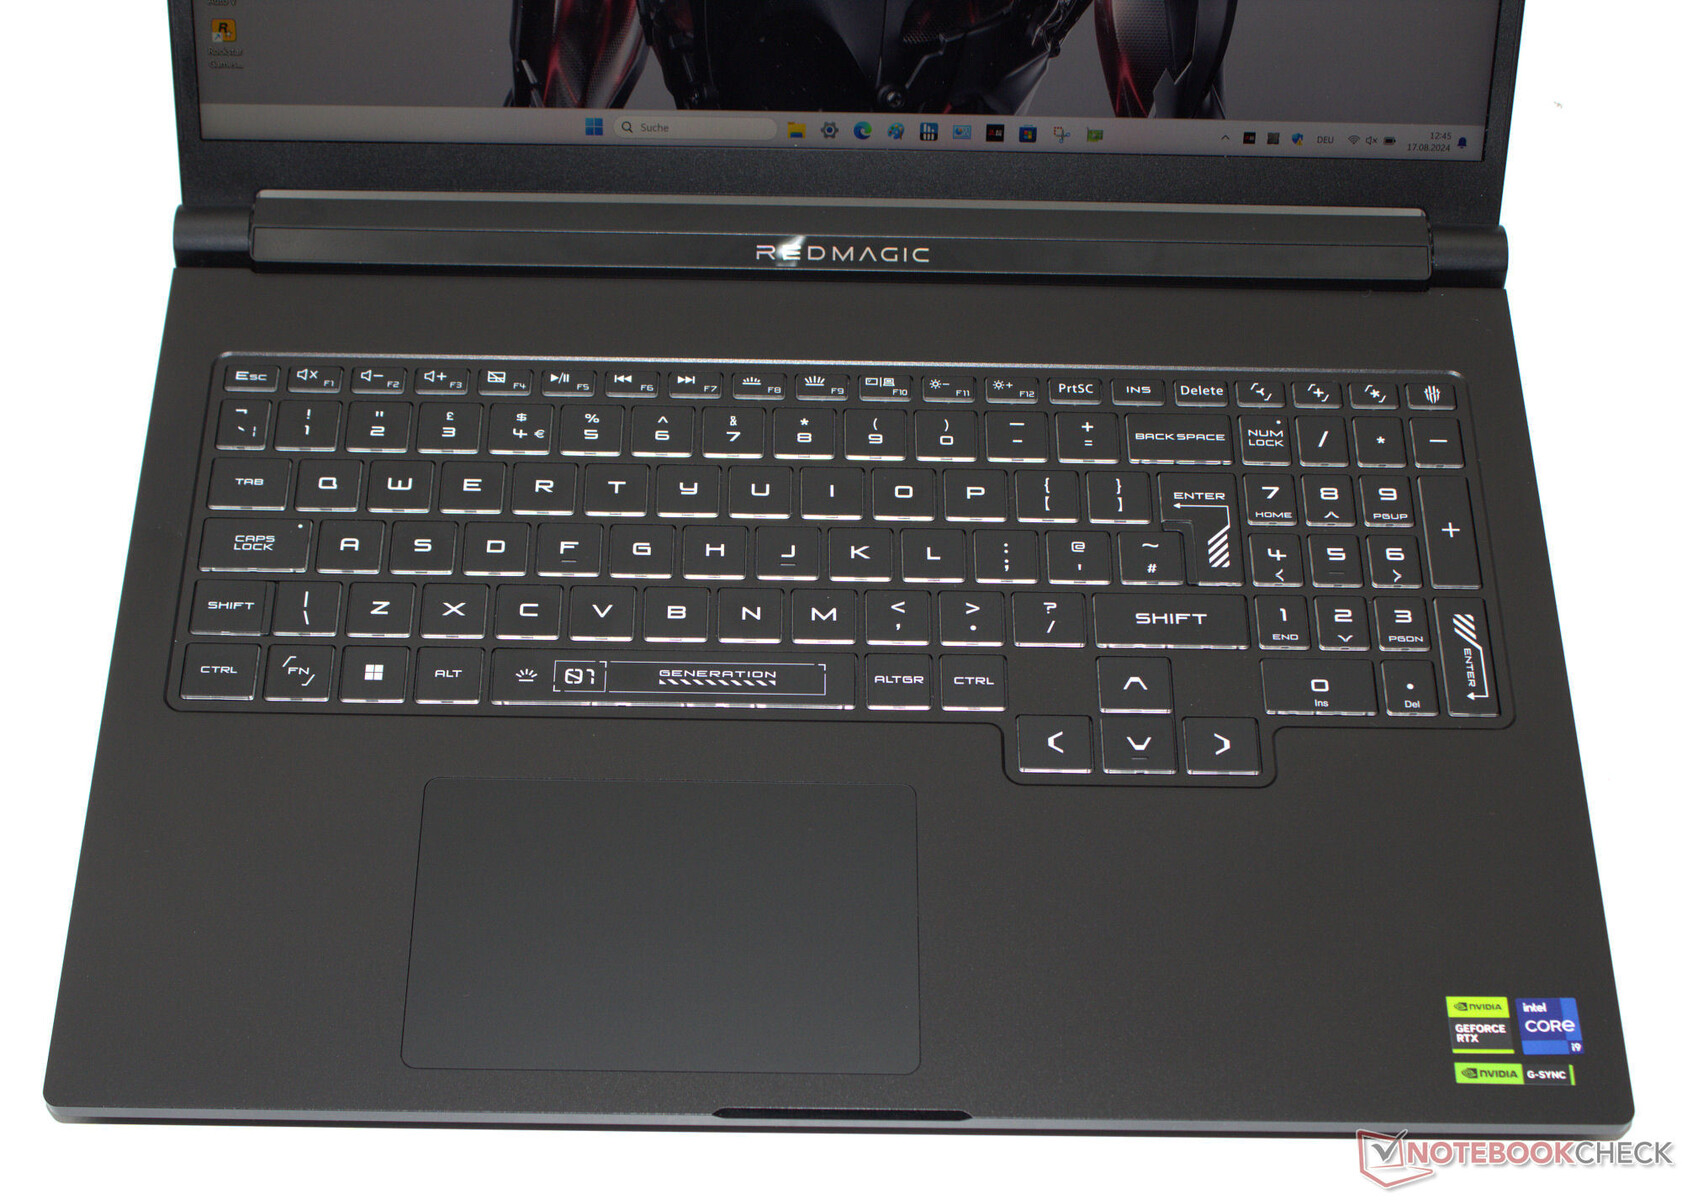
Nubia, sayısal tuş takımı içeren bir chiclet klavye tercih etmiştir. Eşit şekilde aydınlatılmış tuşlar kısa bir hareket mesafesine ve net bir basınç noktasına sahiptir. Klavye, üzerine yazarken eğilmiyor. Ofset ok tuşlarının tam boyutlu olması olumlu bir özellik. RGB arka aydınlatması dört bölgeye ayrılmıştır ve test cihazımız QWERTY klavye düzenine sahiptir. Üreticinin yerelleştirilmiş düzenler sunup sunmadığını söyleyemeyiz.
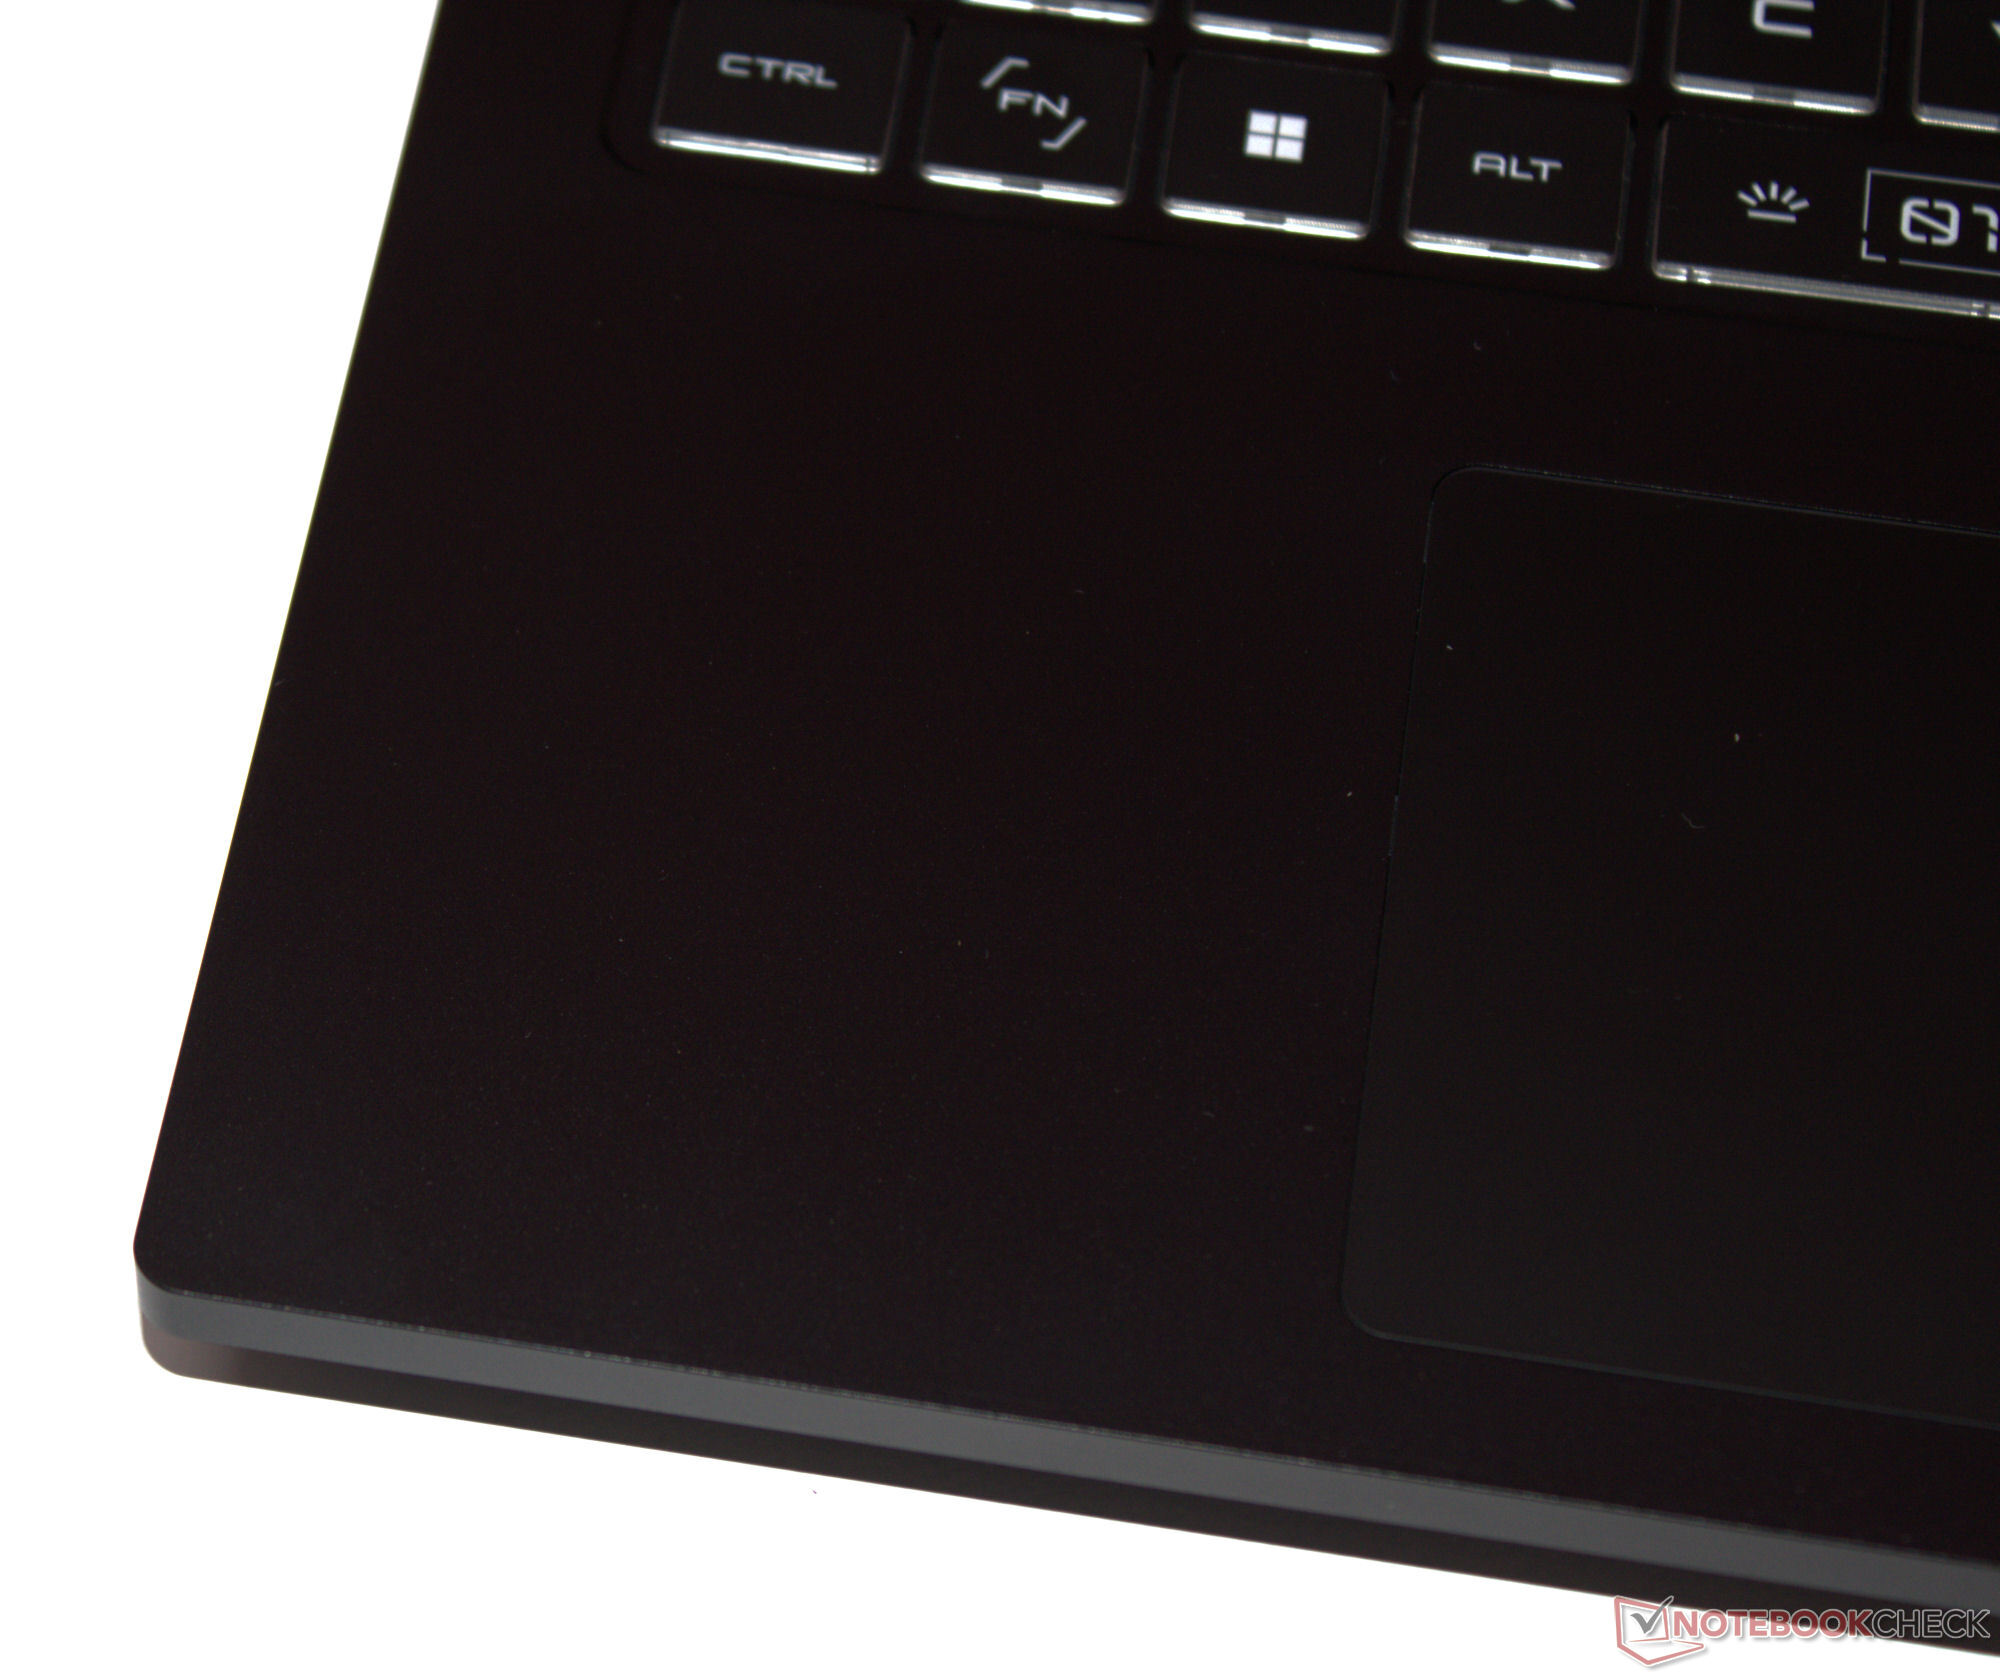
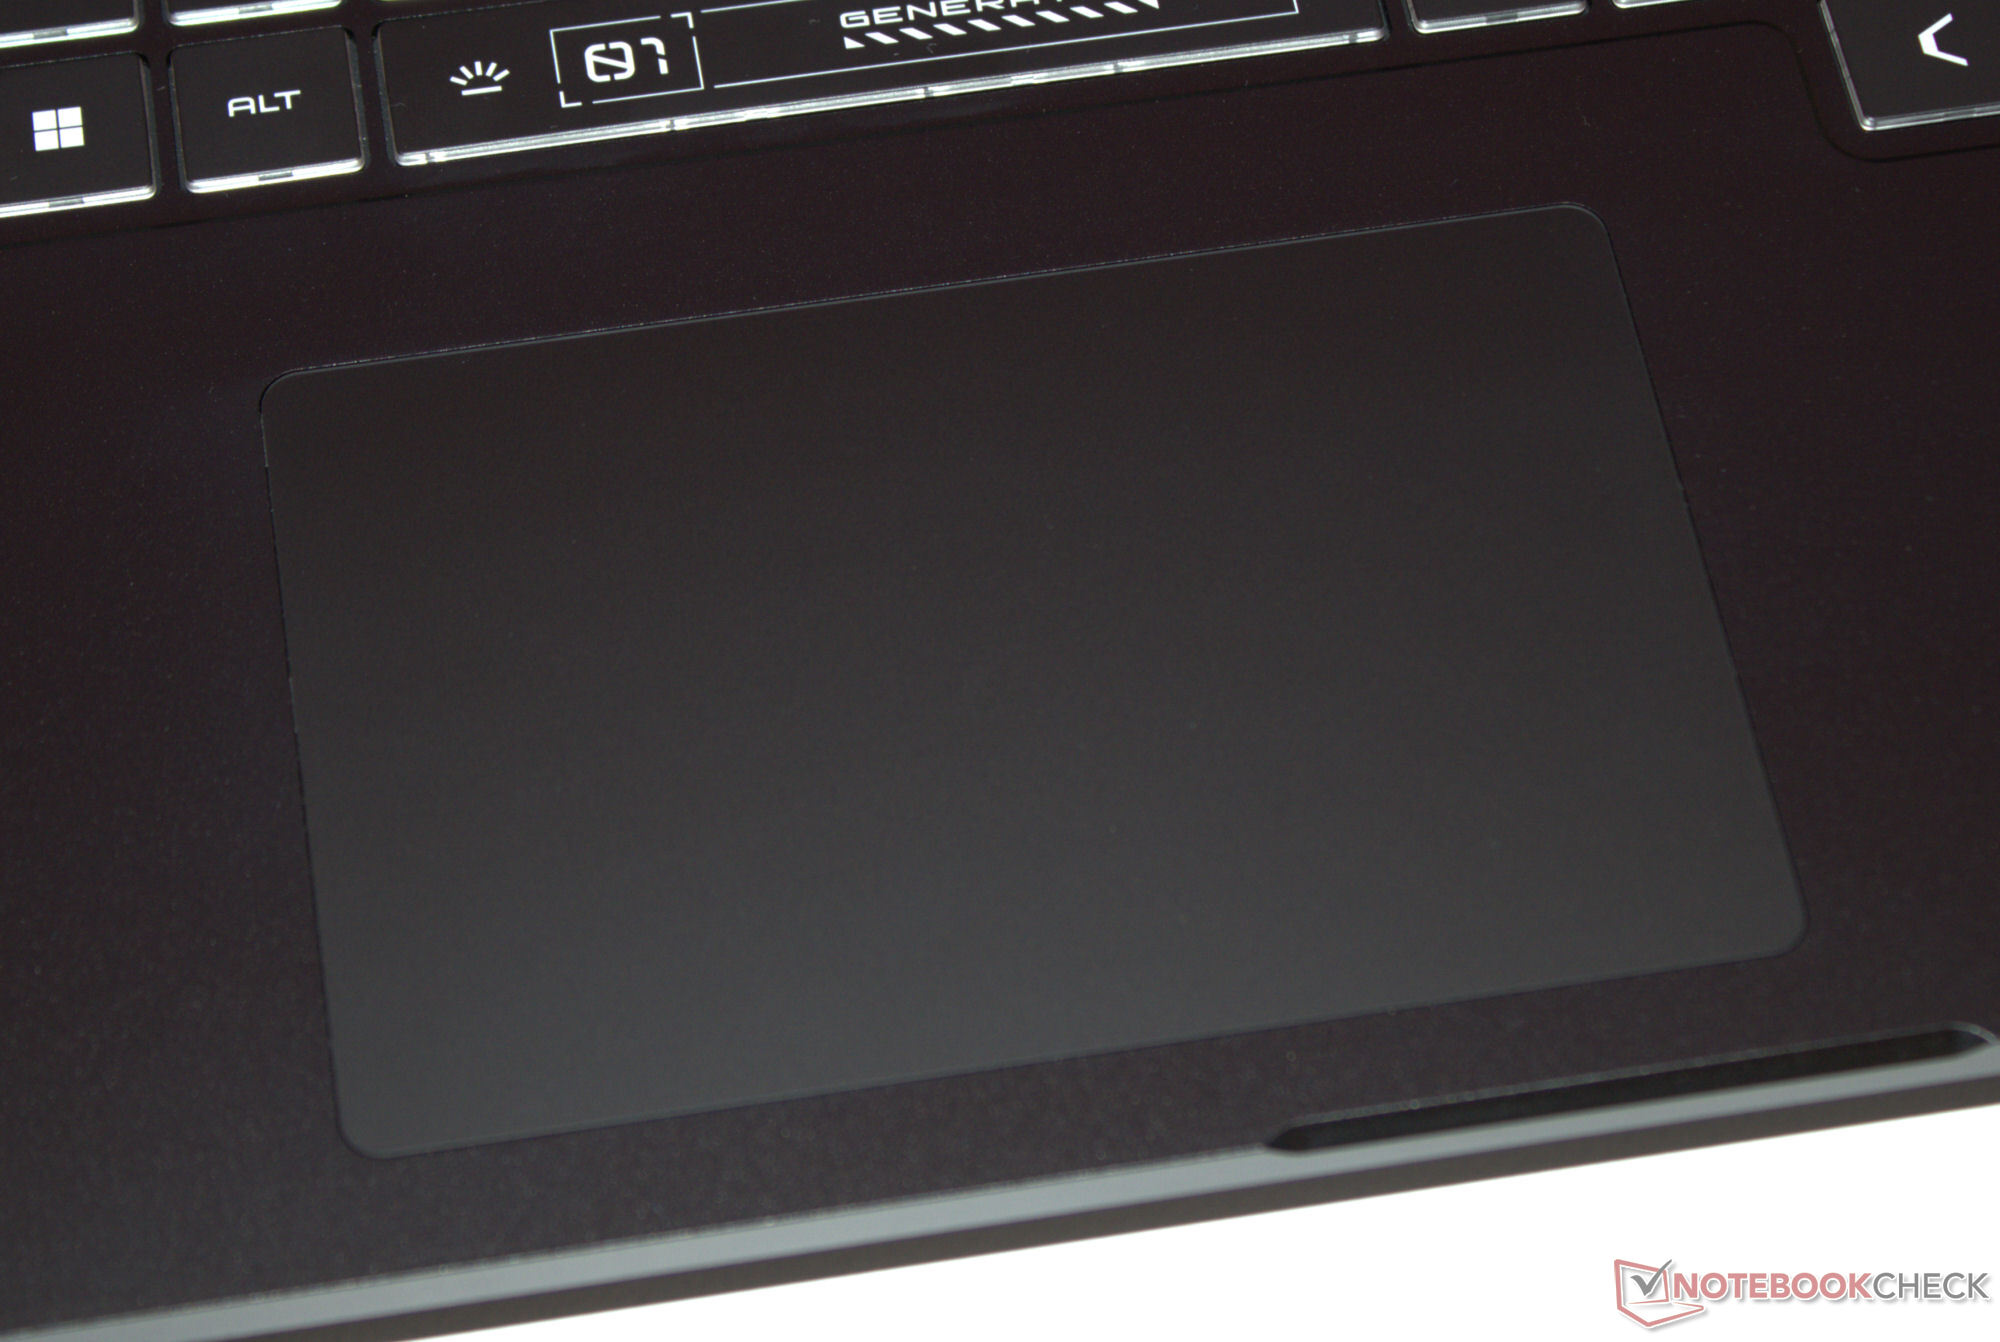
Dokunmatik yüzey
Cam yüzeyli çoklu dokunmatik tıklama yüzeyi (yaklaşık 11,7 x 7,5 cm) fare yerine kullanılır. Kısa bir hareket mesafesine ve net bir basınç noktasına sahiptir. Ped gerektiğinde devre dışı bırakılabilir.
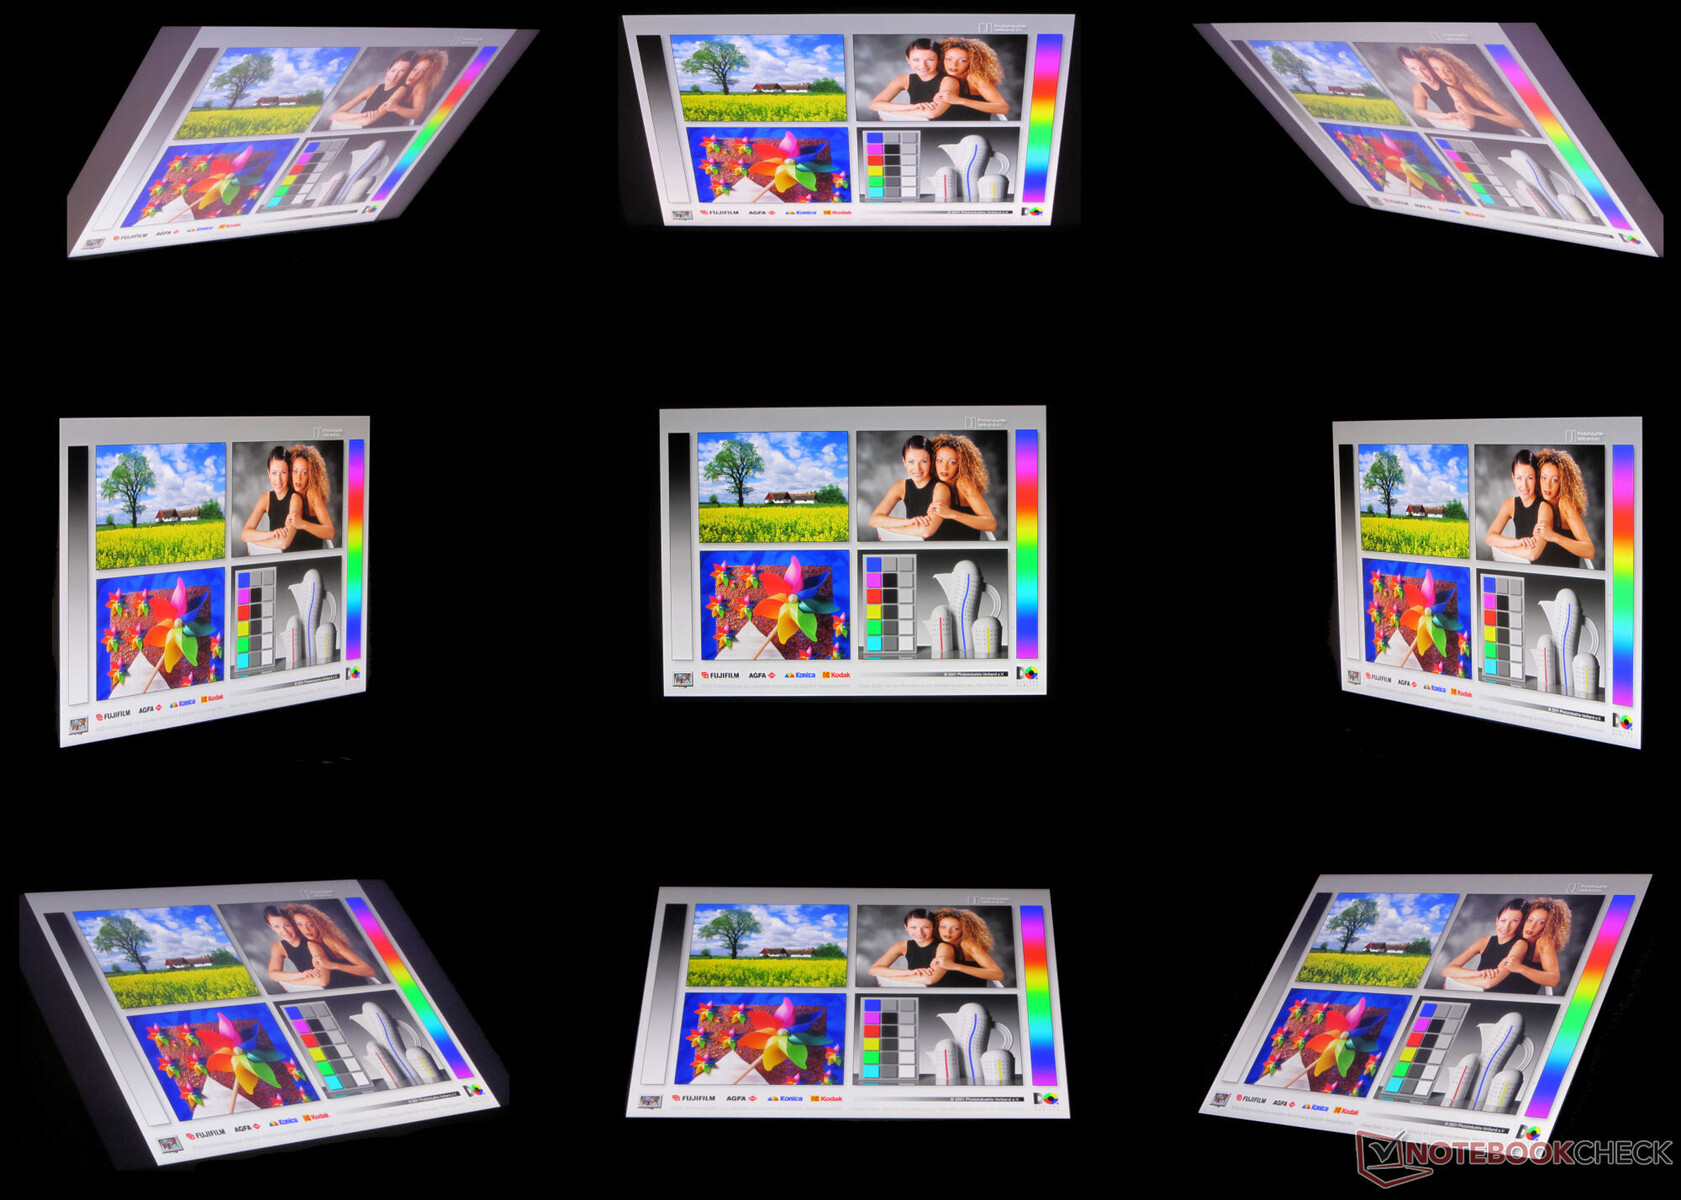
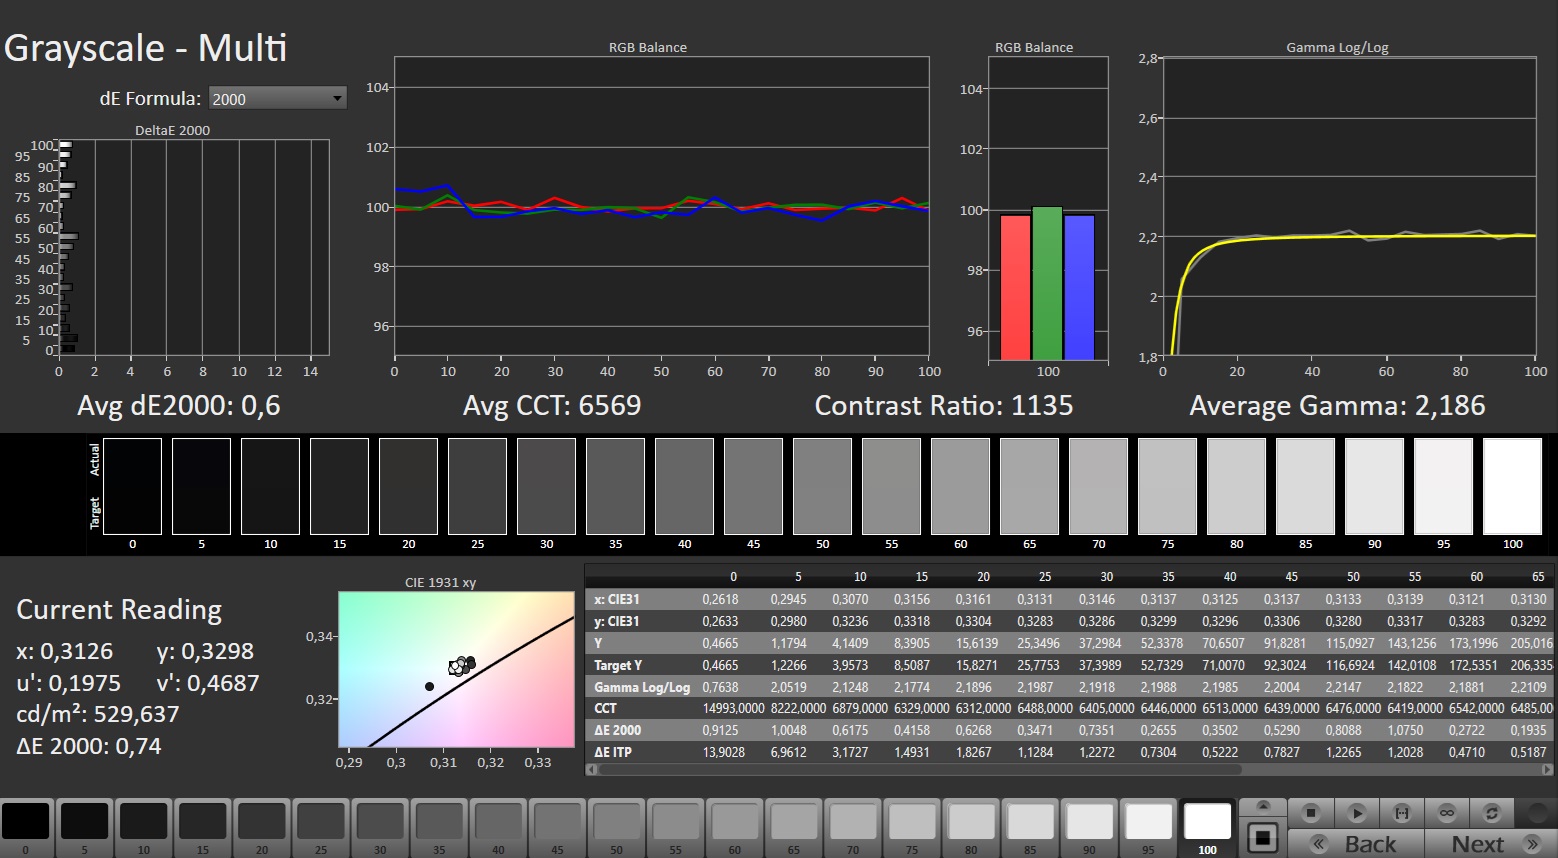
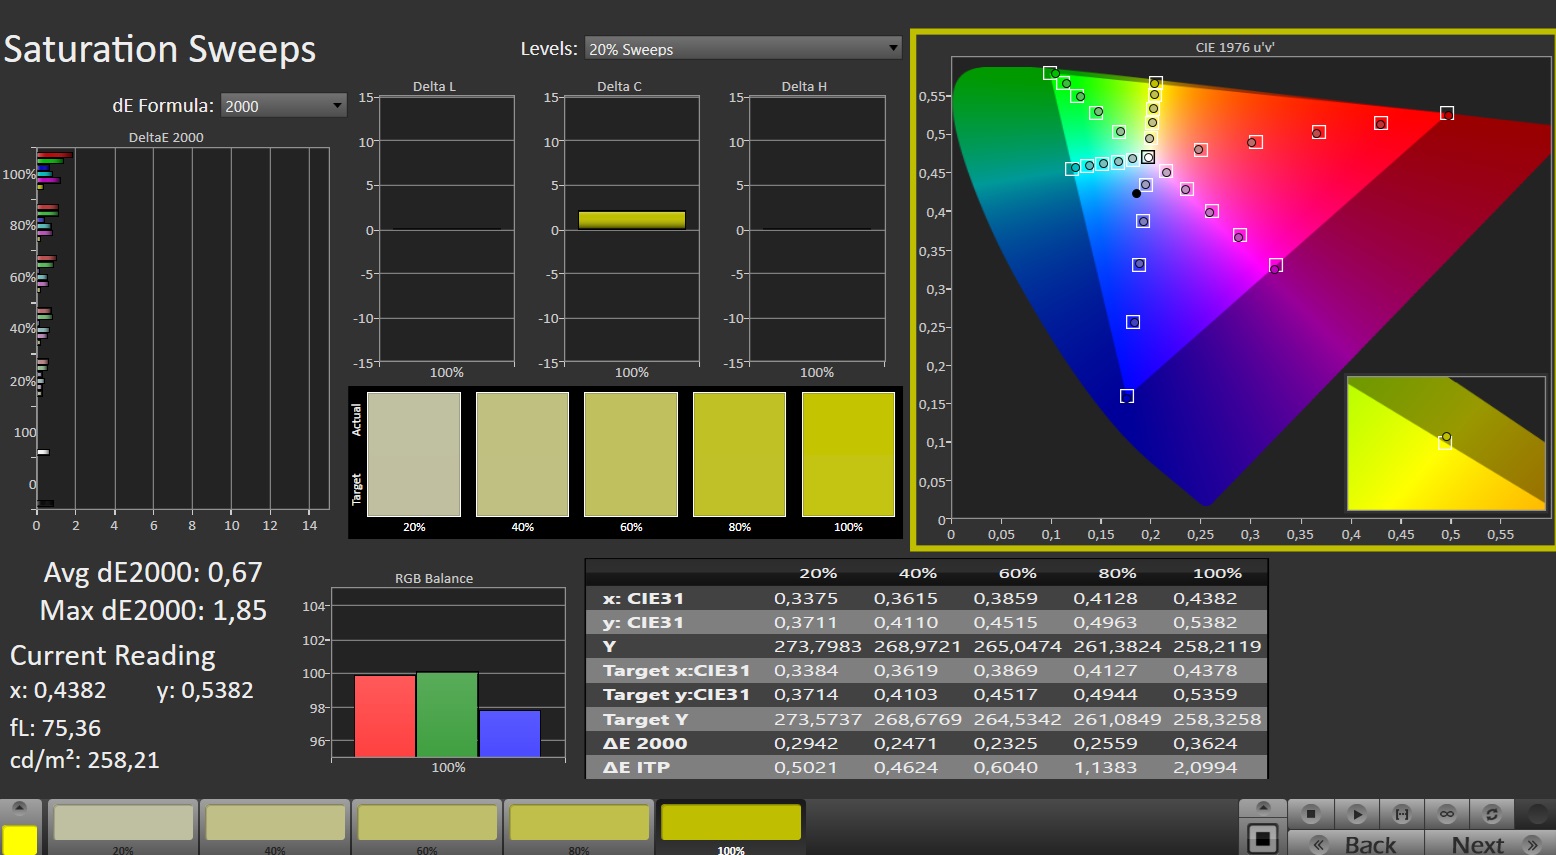
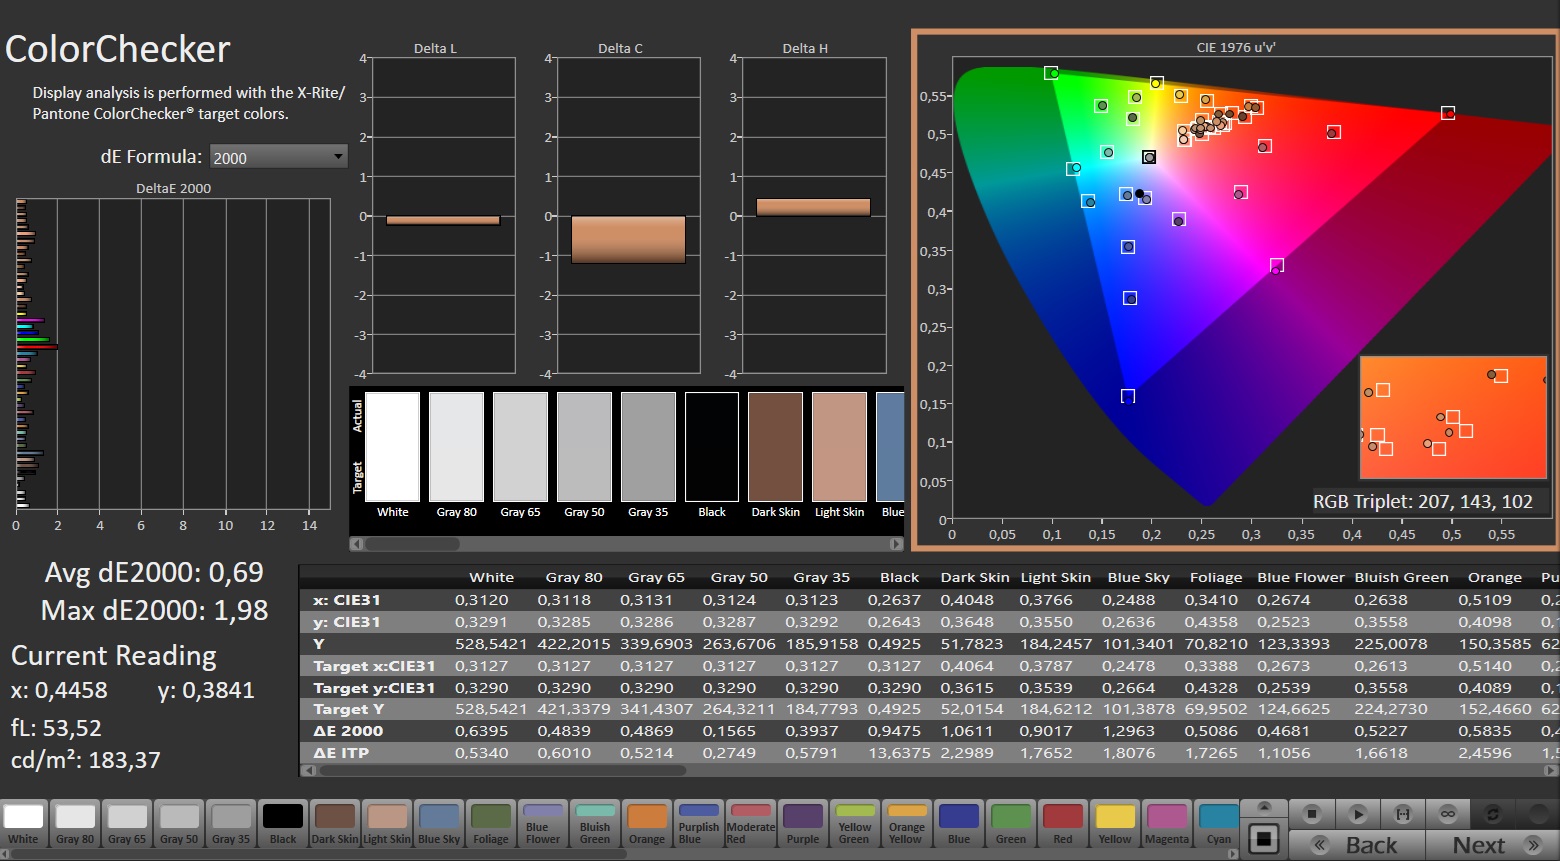
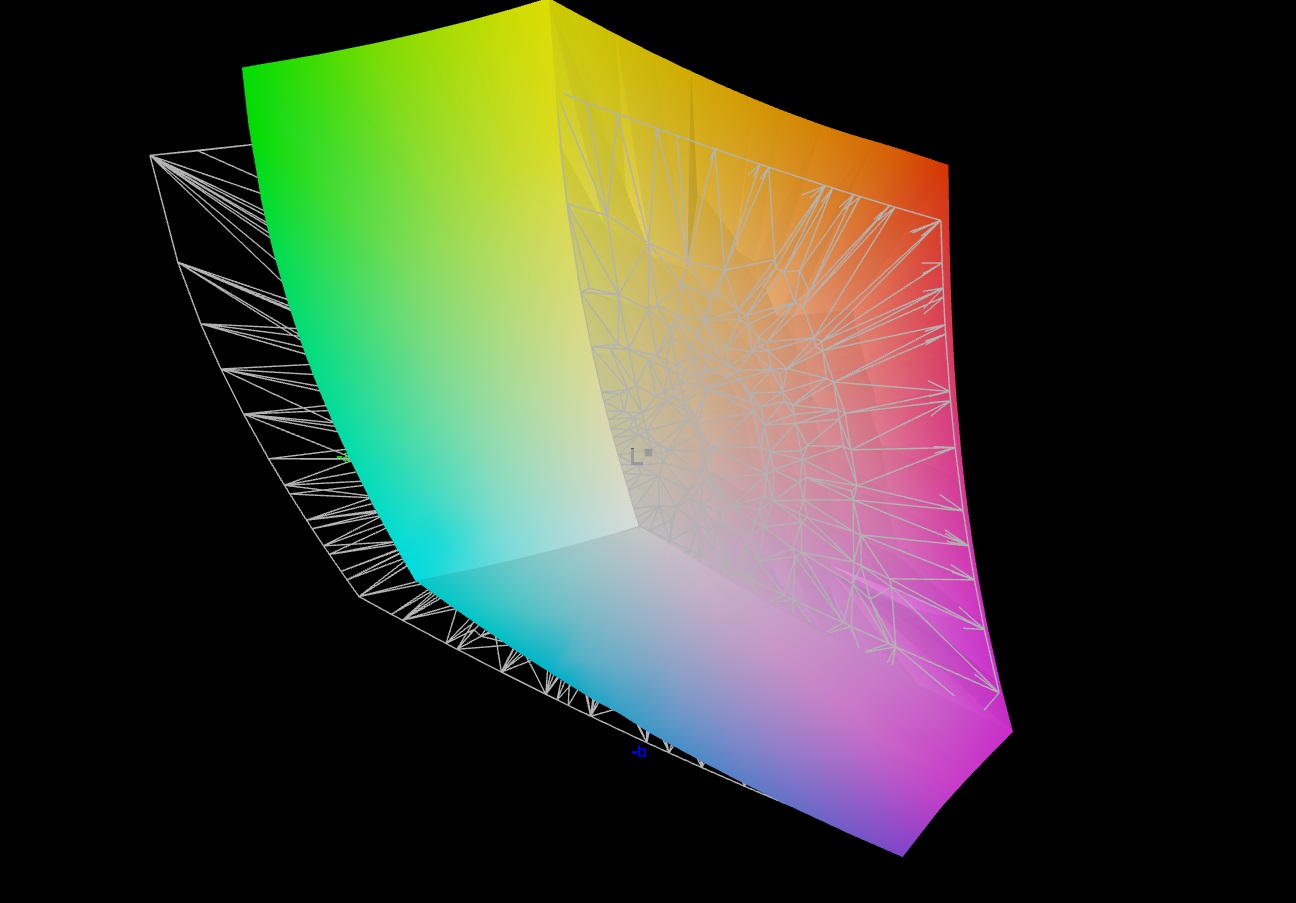
Ekran - DCI-P3 kapsamına sahip bir IPS panel
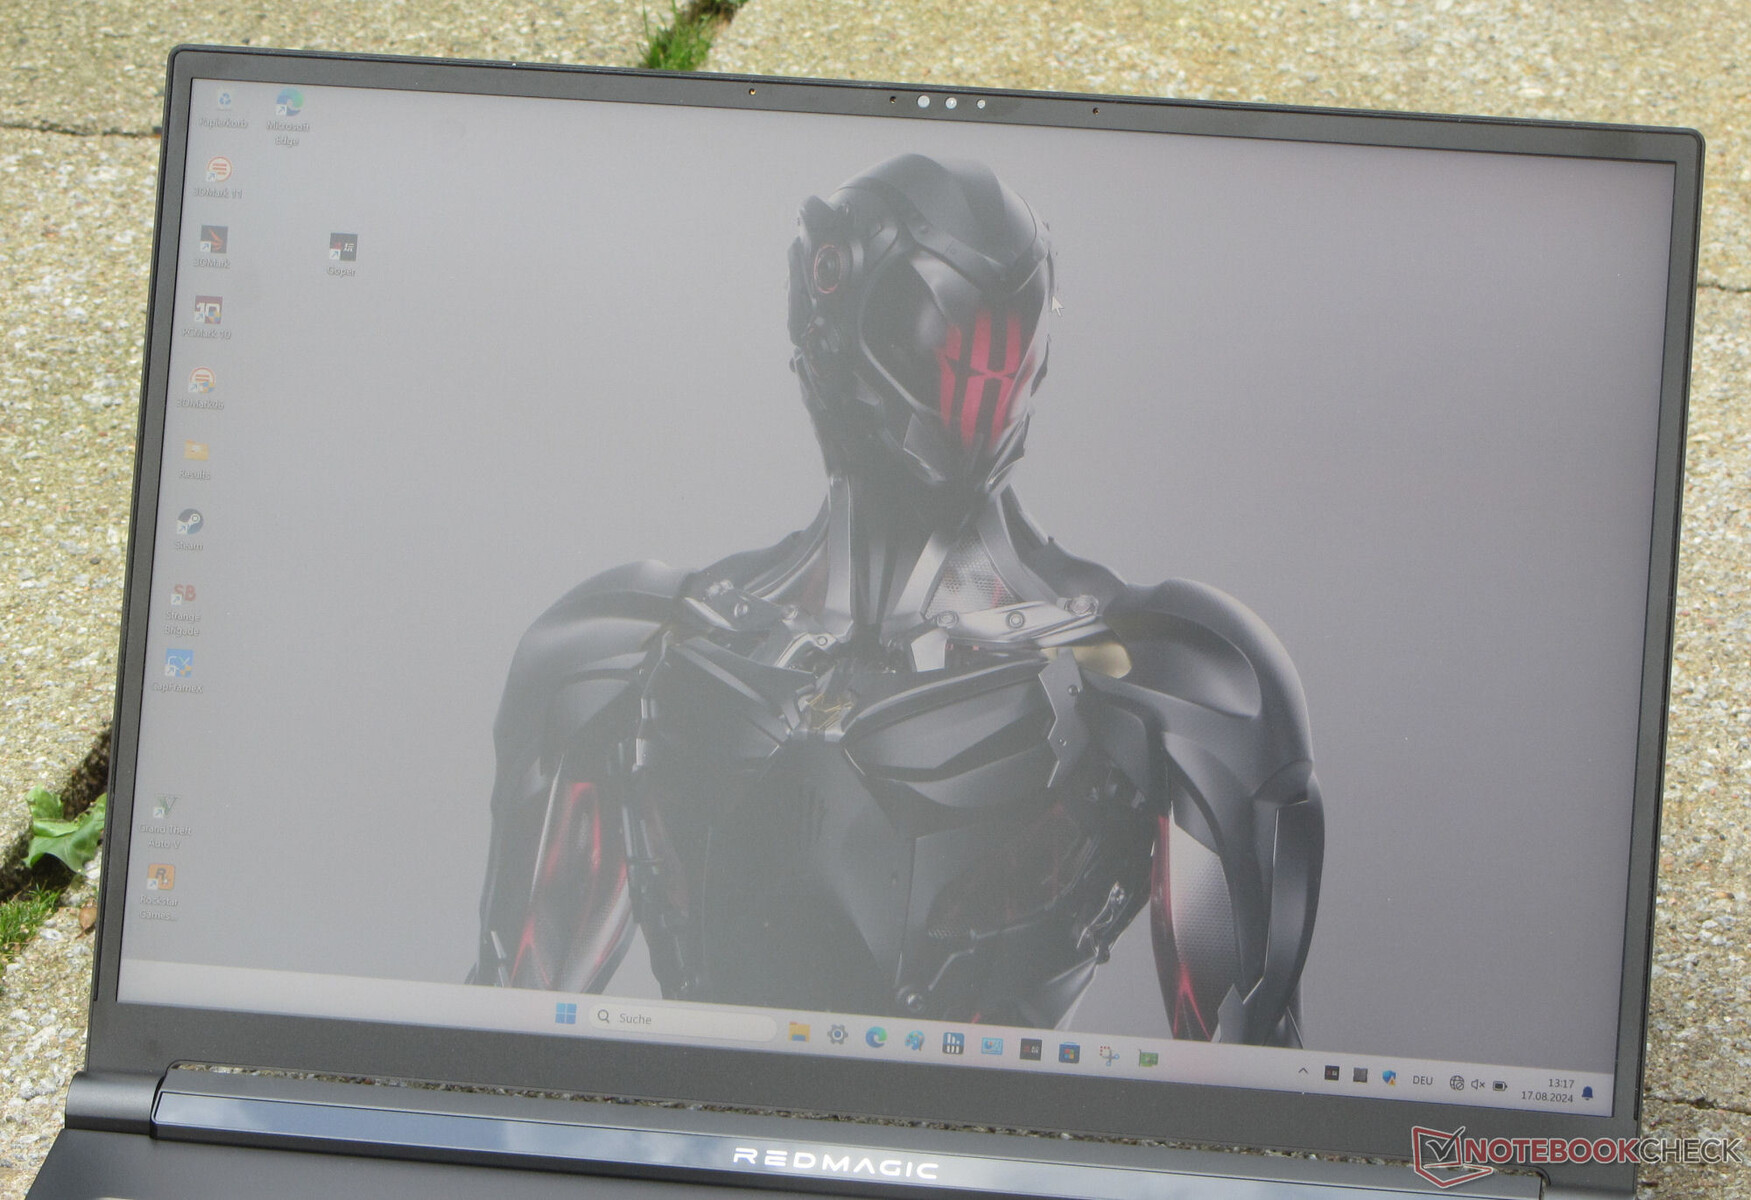
Görünüşe göre iş dostu 16:10 en-boy oranı kendini kabul ettirmiş durumda, zira Titan da dahil olmak üzere karşılaştırma alanındaki çoğu dizüstü bilgisayar bu en-boy oranına sahip ekranlara sahip. Nubia dizüstü bilgisayarını 16 inç diyagonal mat, görüş açısı sabit IPS ekranla (2.560 x 1.600 piksel) donattı. Panel süper parlak ve kontrastı hedef değeri karşılıyor. Açık havada ekrandan okumak mükemmel bir şekilde mümkün. 240-Hz panelin PWM titremesi belirtisi göstermemesi ve G-Sync'i desteklemesi olumlu bir özellik. Alternatif ekranlar mevcut değil.
| |||||||||||||||||||||||||
Aydınlatma: 86 %
Batarya modunda parlaklık: 543 cd/m²
Kontrast: 1065:1 (Siyah: 0.51 cd/m²)
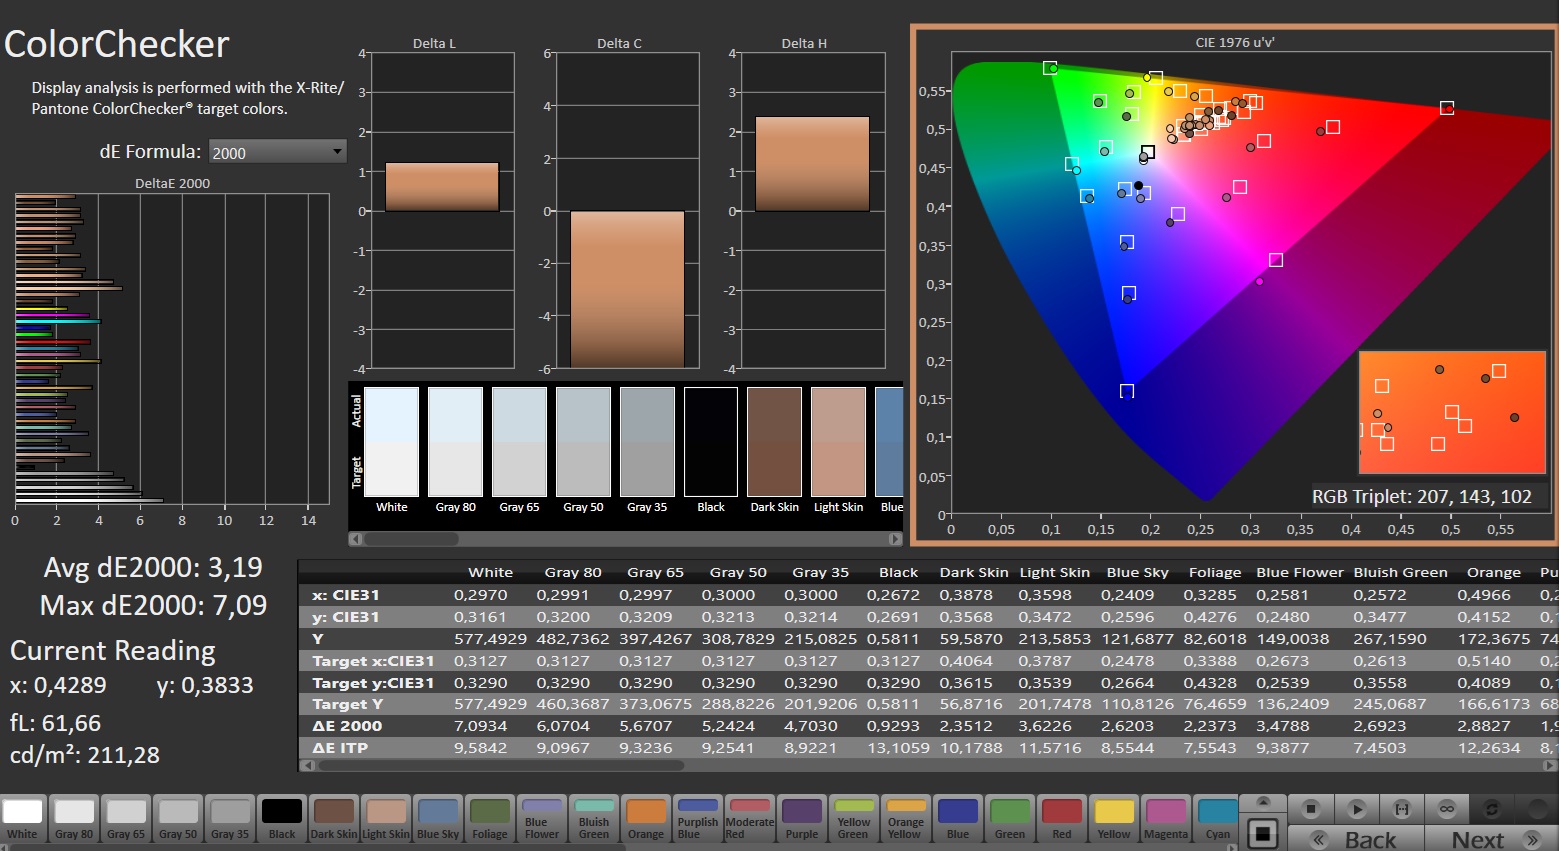
ΔE Color 3.19 | 0.5-29.43 Ø4.87, calibrated: 0.69
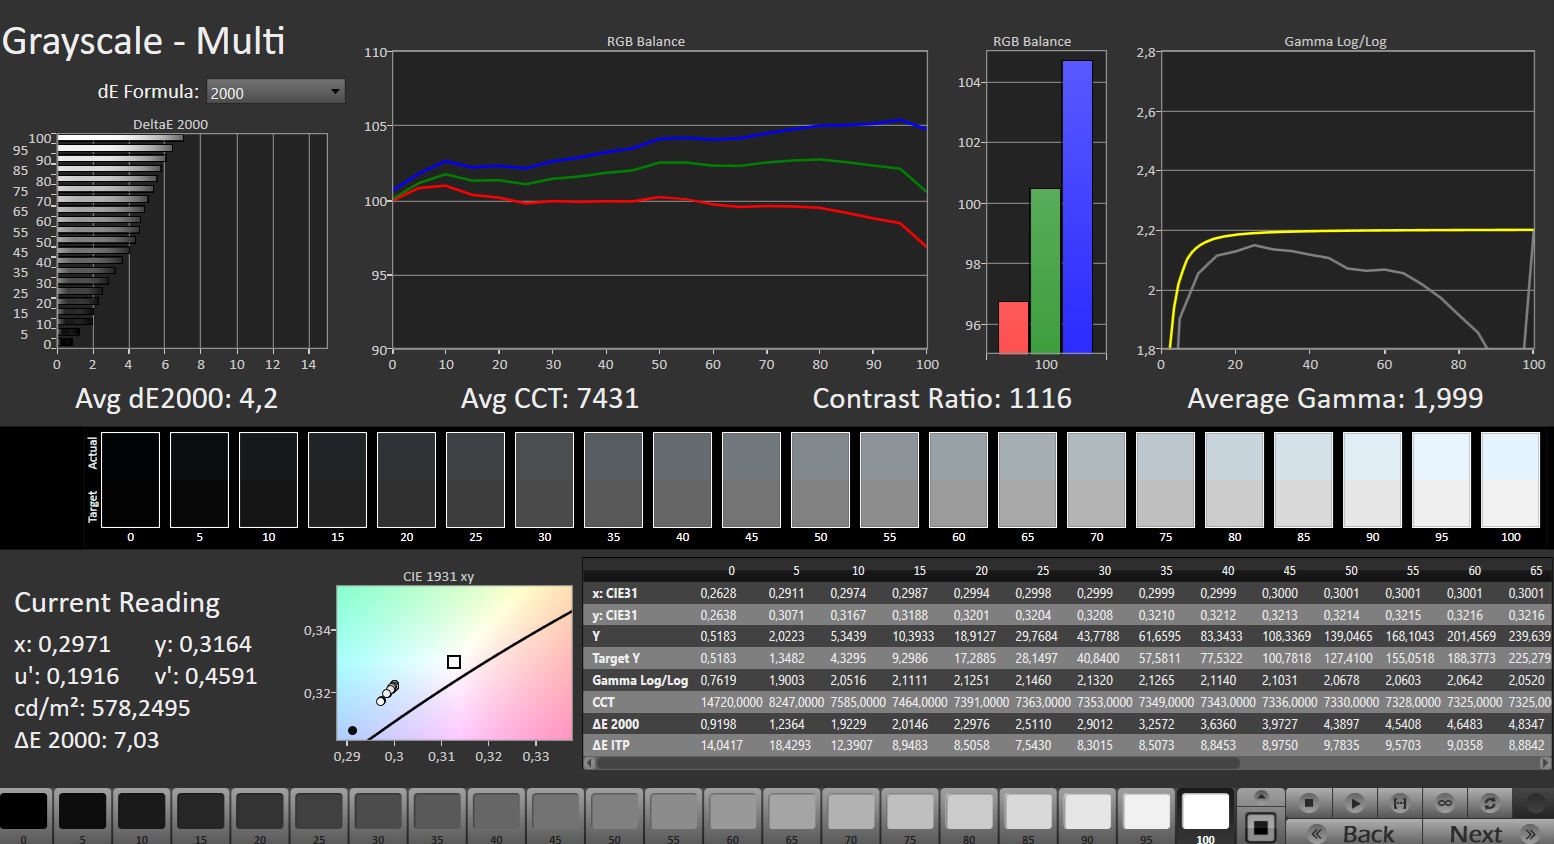
ΔE Greyscale 4.2 | 0.5-98 Ø5.1
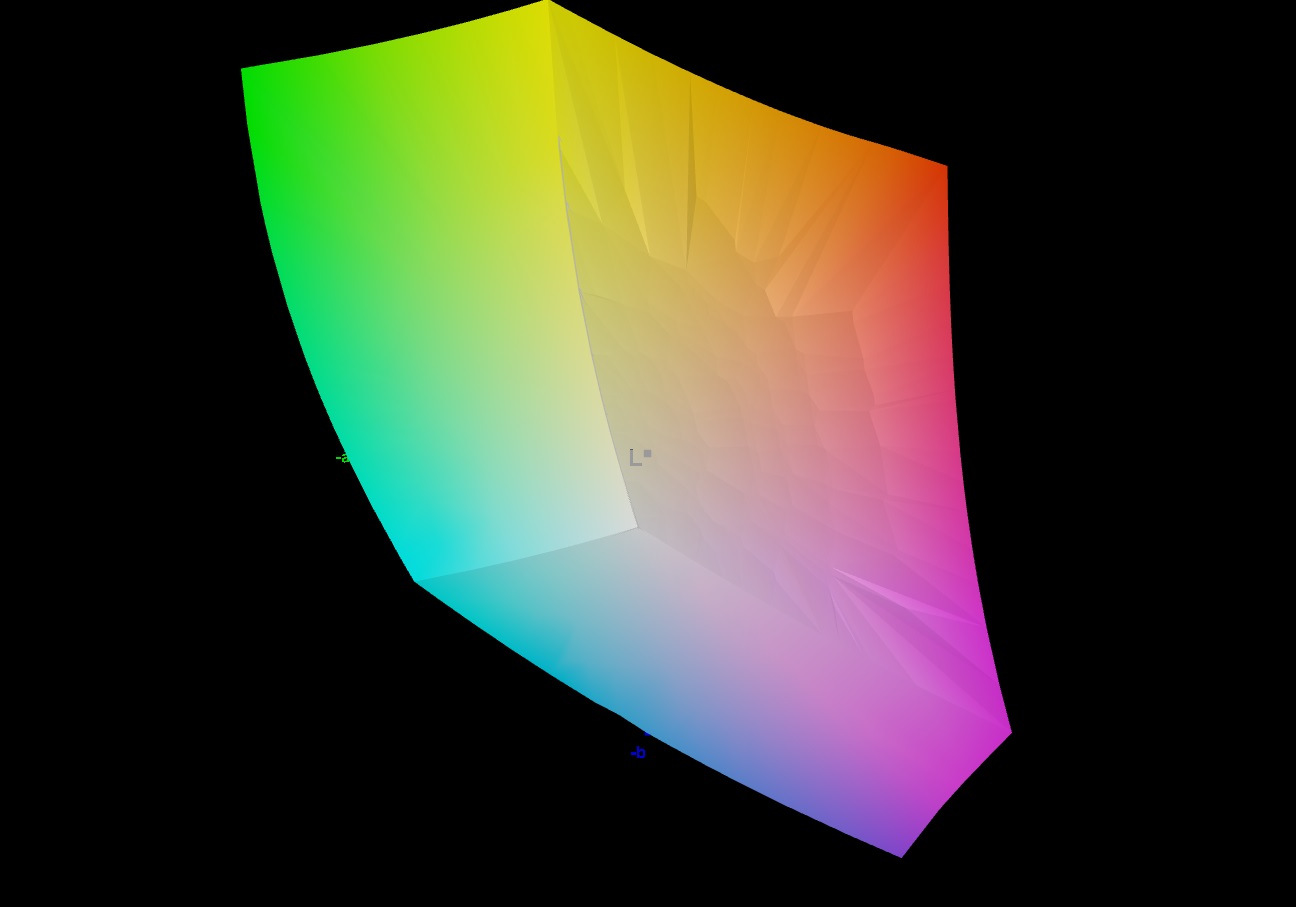
84.1% AdobeRGB 1998 (Argyll 2.2.0 3D)
100% sRGB (Argyll 2.2.0 3D)
96.3% Display P3 (Argyll 2.2.0 3D)
Gamma: 1.999
| Nubia RedMagic Titan 16 Pro BOE CQ NE160QDM-NZ2, IPS, 2560x1600, 16", 240 Hz | Lenovo Legion Pro 5 16IRX9 G9 BOE NE160QDM-NZB, IPS, 2560x1600, 16", 240 Hz | HP Victus 16 (2024) Chi Mei CMN163E, IPS, 1920x1080, 16.1", 144 Hz | Acer Predator Helios Neo 16 (2024) Chi Mei N160GME-GTB, LED, 2560x1600, 16", 240 Hz | SCHENKER XMG Pro 16 Studio (Mid 24) BOE CQ NE160QDM-NZ1, IPS, 2560x1600, 16", 240 Hz | Gigabyte G6X 9KG (2024) BOE NE160WUM-NX6, IPS, 1920x1200, 16", 165 Hz | |
|---|---|---|---|---|---|---|
| Display | 2% | -48% | 1% | -15% | -48% | |
| Display P3 Coverage | 96.3 | 99.22 3% | 41.3 -57% | 95.9 0% | 68.8 -29% | 41.8 -57% |
| sRGB Coverage | 100 | 99.93 0% | 61.7 -38% | 99.8 0% | 99.5 0% | 62.4 -38% |
| AdobeRGB 1998 Coverage | 84.1 | 87.81 4% | 42.7 -49% | 86.4 3% | 70.8 -16% | 43.3 -49% |
| Response Times | -54% | -454% | -52% | -126% | -635% | |
| Response Time Grey 50% / Grey 80% * | 3.9 ? | 4.8 ? -23% | 28.6 ? -633% | 5 ? -28% | 12.7 ? -226% | 40.5 ? -938% |
| Response Time Black / White * | 5 ? | 9.2 ? -84% | 18.7 ? -274% | 8.8 ? -76% | 6.3 ? -26% | 21.6 ? -332% |
| PWM Frequency | ||||||
| Screen | 4% | -74% | 18% | -2% | -68% | |
| Brightness middle | 543 | 518 -5% | 287 -47% | 521 -4% | 416 -23% | 353 -35% |
| Brightness | 516 | 491 -5% | 288 -44% | 506 -2% | 392 -24% | 318 -38% |
| Brightness Distribution | 86 | 90 5% | 86 0% | 85 -1% | 86 0% | 81 -6% |
| Black Level * | 0.51 | 0.36 29% | 0.19 63% | 0.44 14% | 0.38 25% | 0.21 59% |
| Contrast | 1065 | 1439 35% | 1511 42% | 1184 11% | 1095 3% | 1681 58% |
| Colorchecker dE 2000 * | 3.19 | 4.32 -35% | 5.46 -71% | 1.74 45% | 2.33 27% | 5.21 -63% |
| Colorchecker dE 2000 max. * | 7.09 | 6.37 10% | 20.36 -187% | 3.88 45% | 6.07 14% | 19.95 -181% |
| Colorchecker dE 2000 calibrated * | 0.69 | 0.75 -9% | 3.52 -410% | 0.52 25% | 1.02 -48% | 3.61 -423% |
| Greyscale dE 2000 * | 4.2 | 3.66 13% | 4.8 -14% | 3 29% | 3.7 12% | 3.6 14% |
| Gamma | 1.999 110% | 2.19 100% | 2.108 104% | 2.164 102% | 2.161 102% | 2.367 93% |
| CCT | 7431 87% | 6841 95% | 6442 101% | 6816 95% | 7102 92% | 7138 91% |
| Toplam Ortalama (Program / Ayarlar) | -16% /
-4% | -192% /
-123% | -11% /
4% | -48% /
-22% | -250% /
-145% |
* ... daha küçük daha iyidir
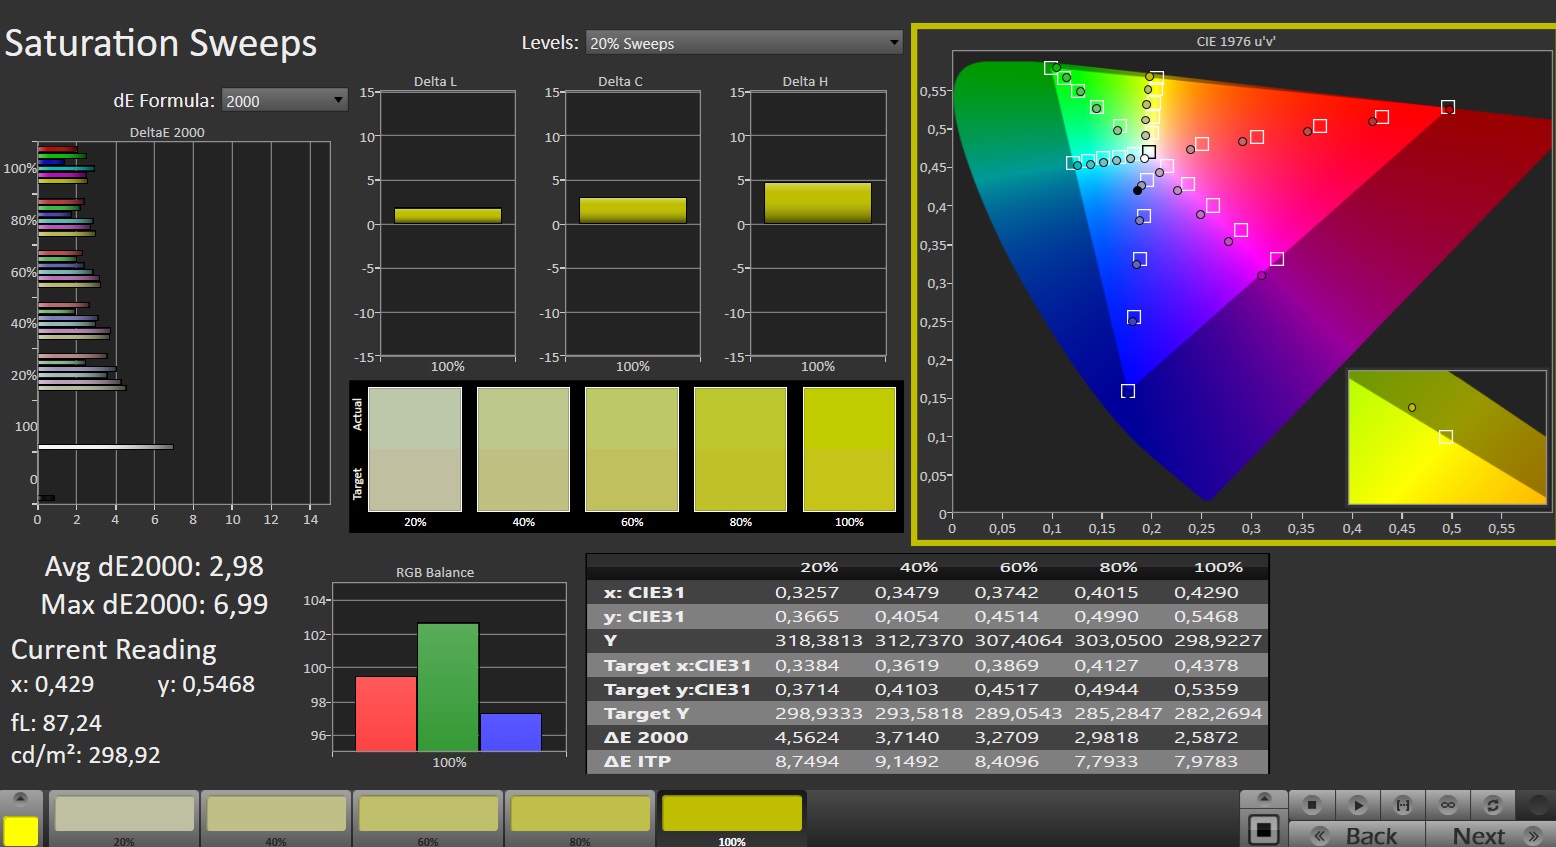
Panel, sRGB ve DCI-P3 renk alanlarını tamamen veya neredeyse tamamen kapsar, ancak AdobeRGB alanını kapsamaz - bu, çoğu rakibin ekranlarına benzer. Kutudan çıktığı andaki iyi renk üretimi, bir kalibrasyon yapılarak çok iyi aralığa yükseltilebilir: Bu durumda renk sapması 3,19'dan 0,69'a düşüyor (hedef: DeltaE < 3). Aynı zamanda, gri tonlama tasviri çok daha dengeli görünüyor.
Renk profilimiz ücretsiz olarak indirilebilir ve kullanılabilir. Ekranın bilgi kutusunda bir bağlantı bulunabilir.

Yanıt Sürelerini Görüntüle
| ↔ Tepki Süresi Siyahtan Beyaza | ||
|---|---|---|
| 5 ms ... yükseliş ↗ ve sonbahar↘ birleşimi | ↗ 1.2 ms yükseliş | 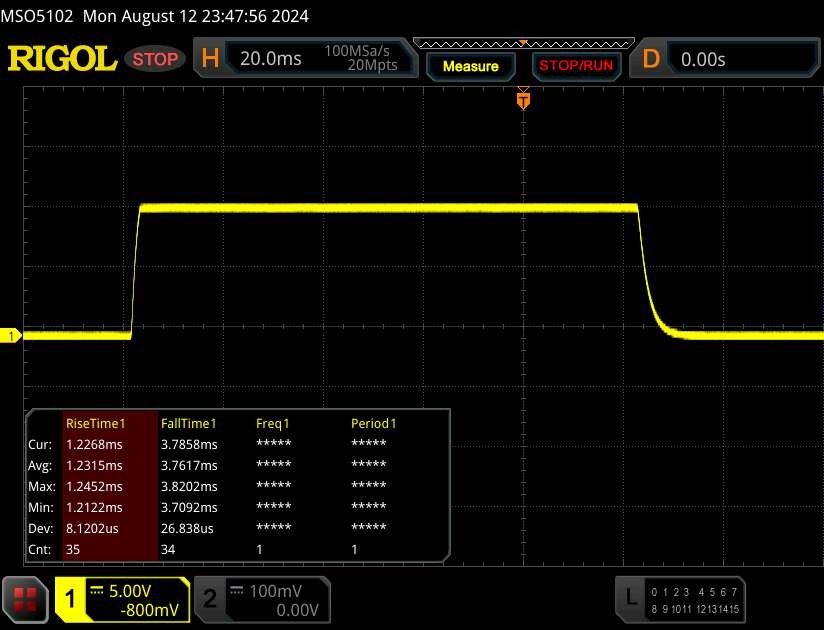 |
| ↘ 3.8 ms sonbahar | ||
| Ekran, testlerimizde çok hızlı yanıt oranları gösteriyor ve hızlı oyun oynamaya çok uygun olmalı. Karşılaştırıldığında, test edilen tüm cihazlar 0.1 (minimum) ile 240 (maksimum) ms arasında değişir. » Tüm cihazların 15 %'si daha iyi. Bu, ölçülen yanıt süresinin test edilen tüm cihazların ortalamasından (20.8 ms) daha iyi olduğu anlamına gelir. | ||
| ↔ Tepki Süresi %50 Griden %80 Griye | ||
| 3.9 ms ... yükseliş ↗ ve sonbahar↘ birleşimi | ↗ 1.7 ms yükseliş | 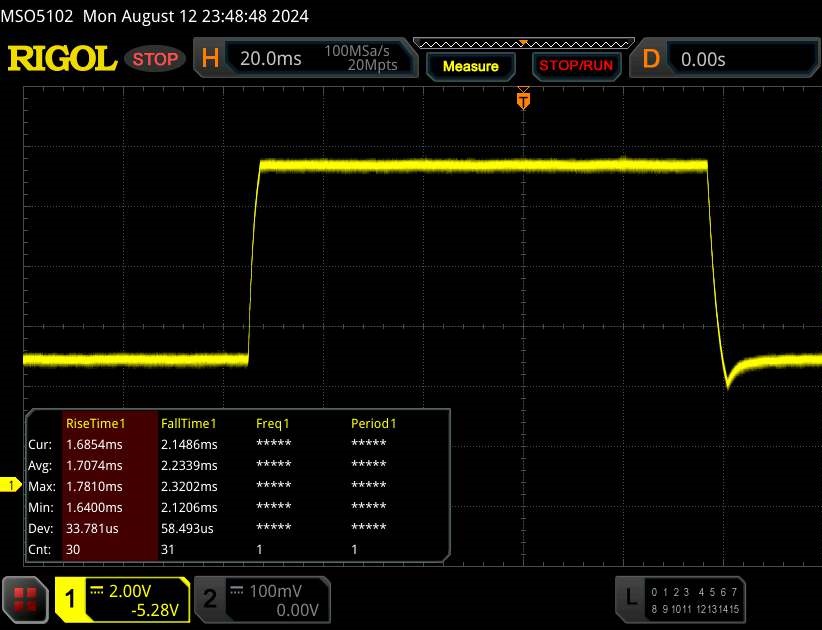 |
| ↘ 2.2 ms sonbahar | ||
| Ekran, testlerimizde çok hızlı yanıt oranları gösteriyor ve hızlı oyun oynamaya çok uygun olmalı. Karşılaştırıldığında, test edilen tüm cihazlar 0.165 (minimum) ile 636 (maksimum) ms arasında değişir. » Tüm cihazların 12 %'si daha iyi. Bu, ölçülen yanıt süresinin test edilen tüm cihazların ortalamasından (32.5 ms) daha iyi olduğu anlamına gelir. | ||
Ekran Titremesi / PWM (Darbe Genişliği Modülasyonu)
| Ekran titriyor / PWM algılanmadı | 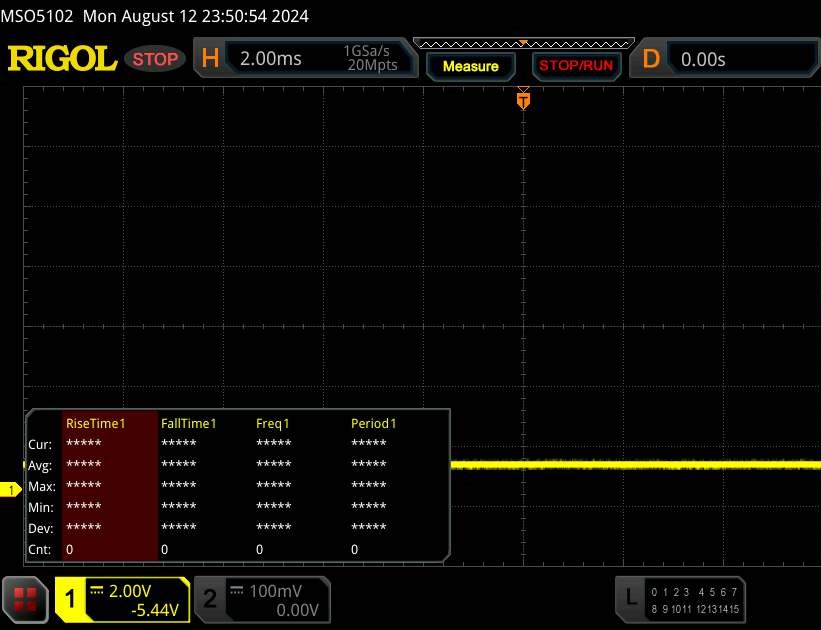 | ||
Karşılaştırıldığında: Test edilen tüm cihazların %53 %'si ekranı karartmak için PWM kullanmıyor. PWM tespit edilirse, ortalama 8516 (minimum: 5 - maksimum: 343500) Hz ölçüldü. | |||
Performans - Raptor Lake ve Ada Lovelace dizüstü bilgisayara güç veriyor
Titan 16 Pro, oyuncuları ve yaratıcıları hedefliyor, bu nedenle odak noktası muhtemelen ilkinde yatıyor. A Core i9-14900HX ve bir GeForce RTX 4060 dizüstü bilgisayara güç sağlar. MRSP'si 1.699 ABD dolarıdır. Nubia bu cihazın ek varyantlarını sunuyor, ancak bunlar henüz küresel olarak bulunamıyor.
Test koşulları
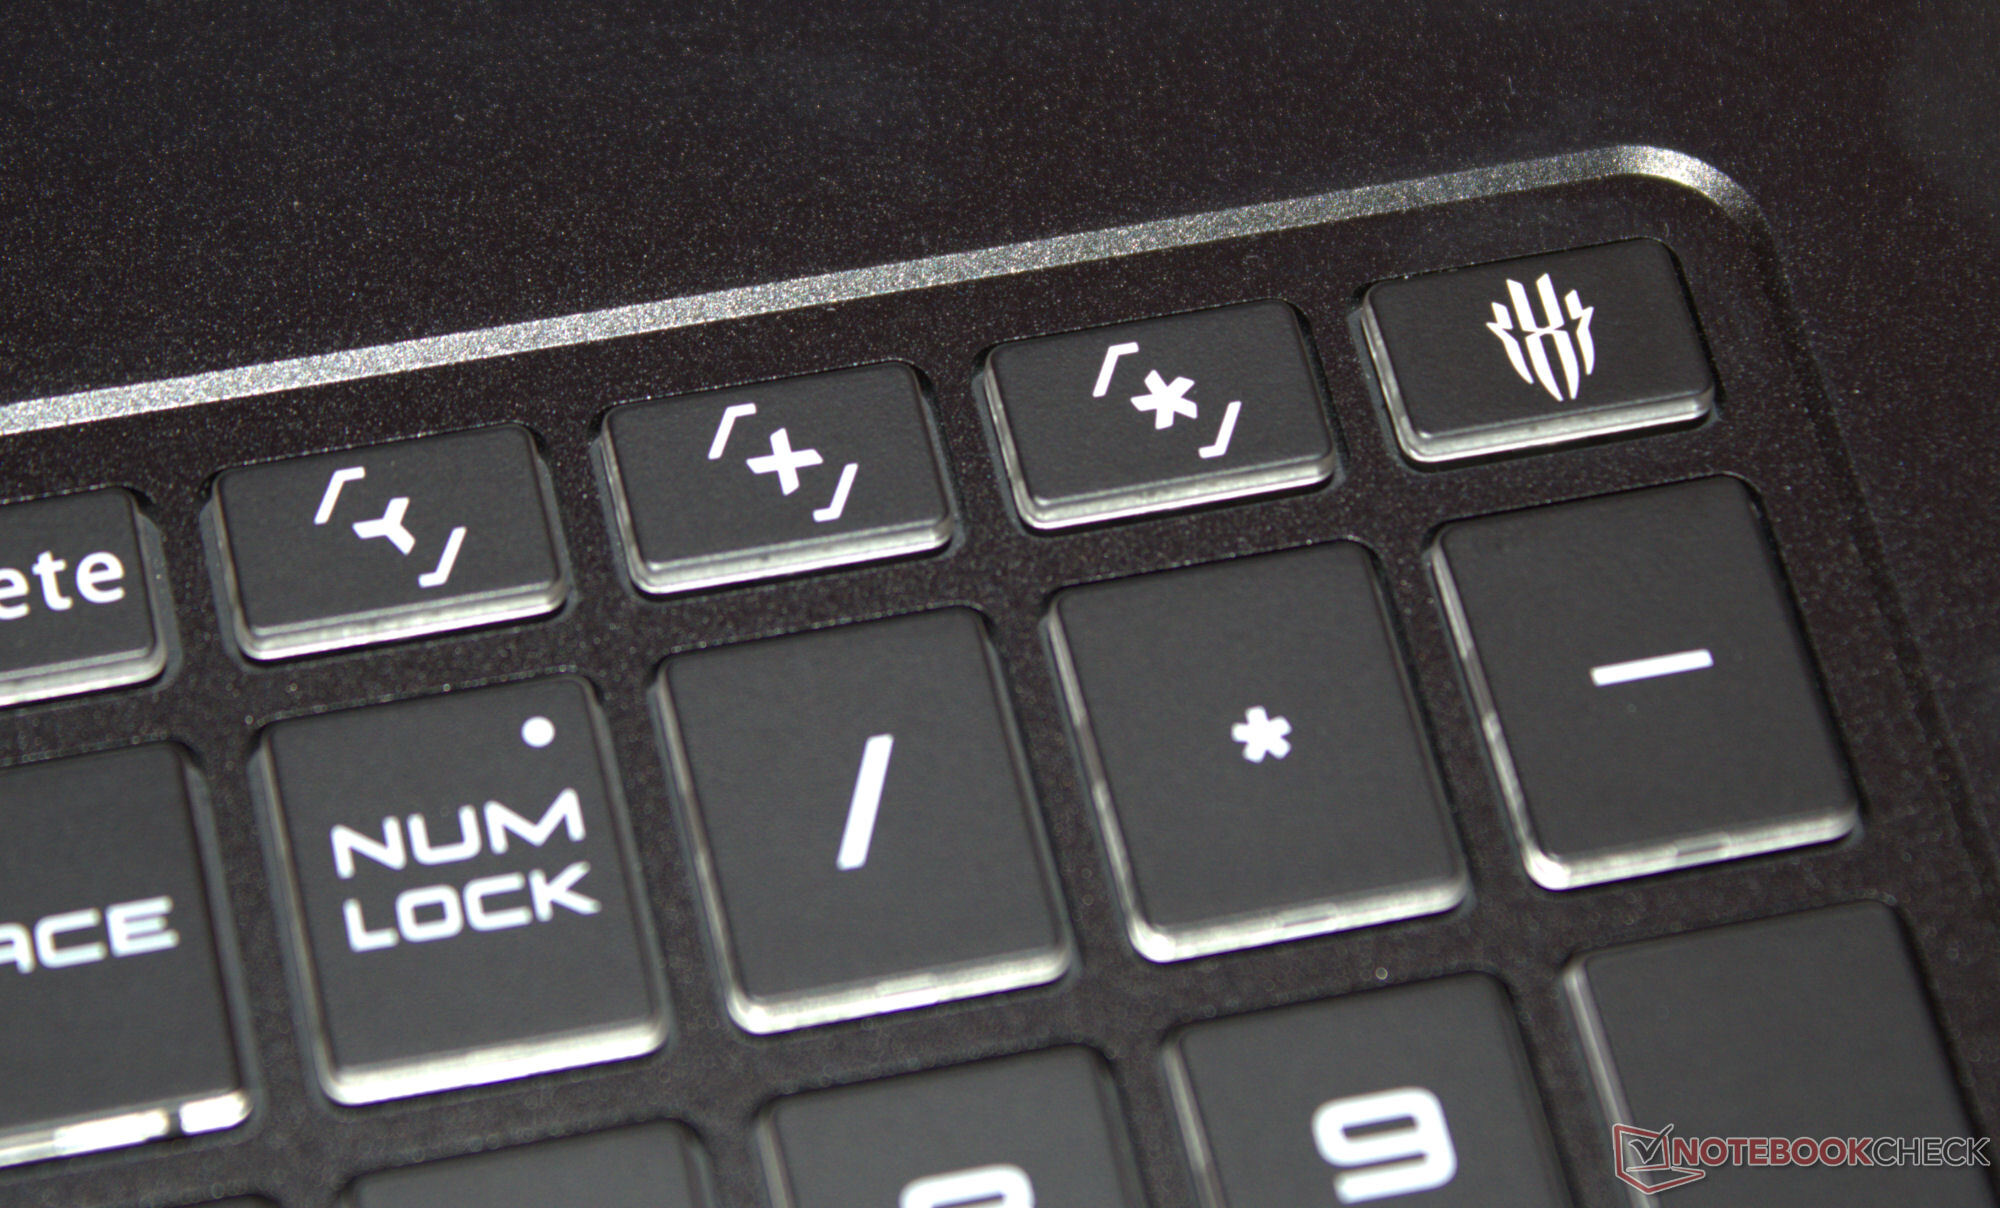
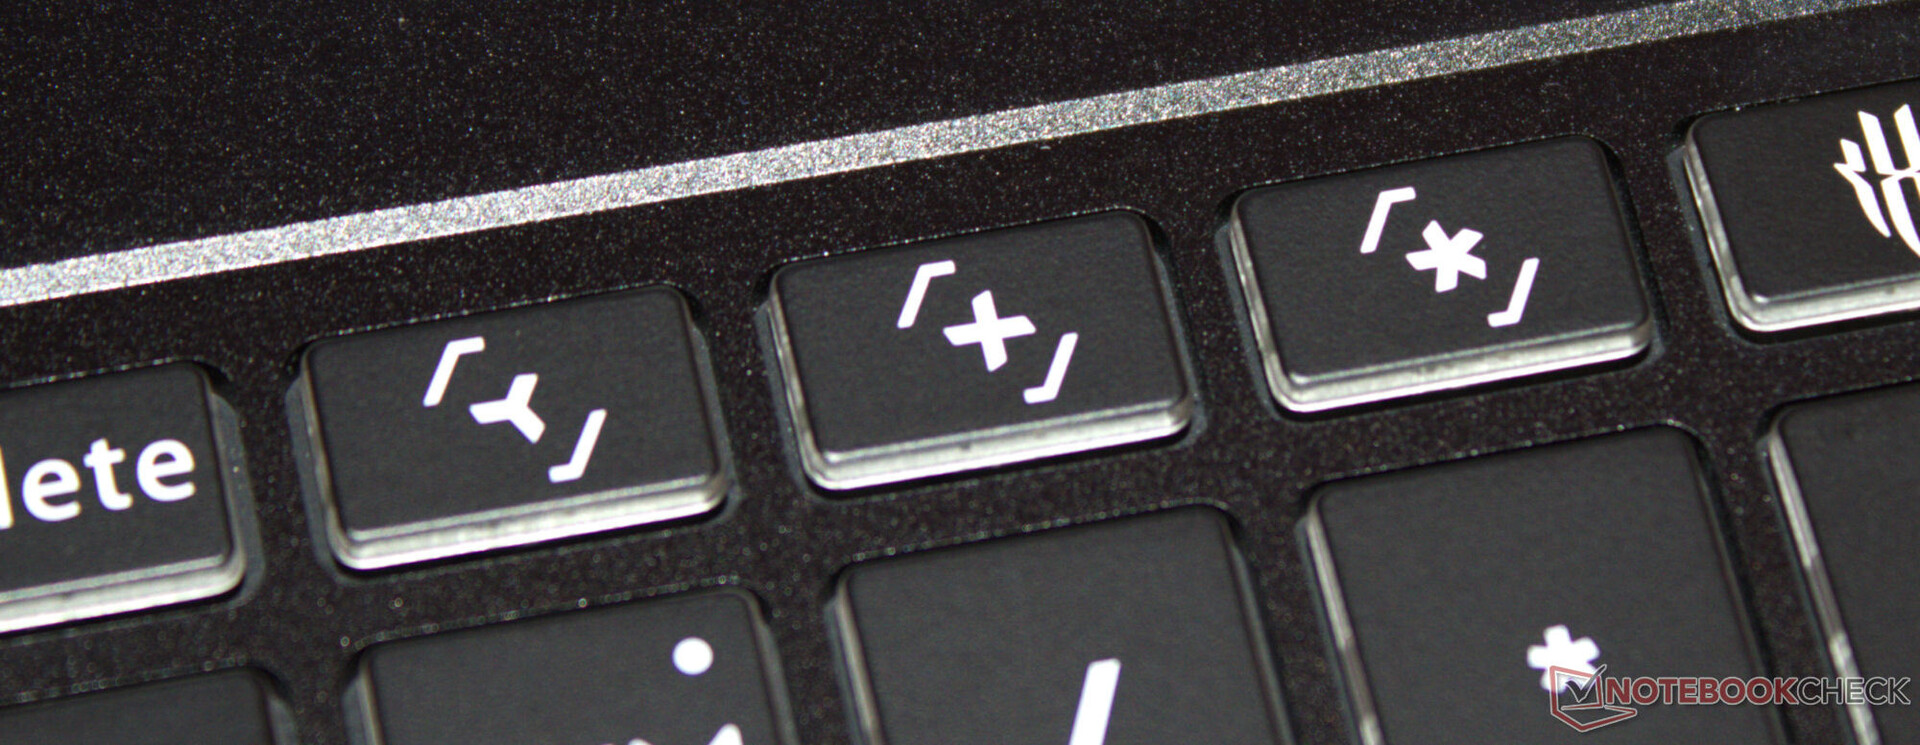
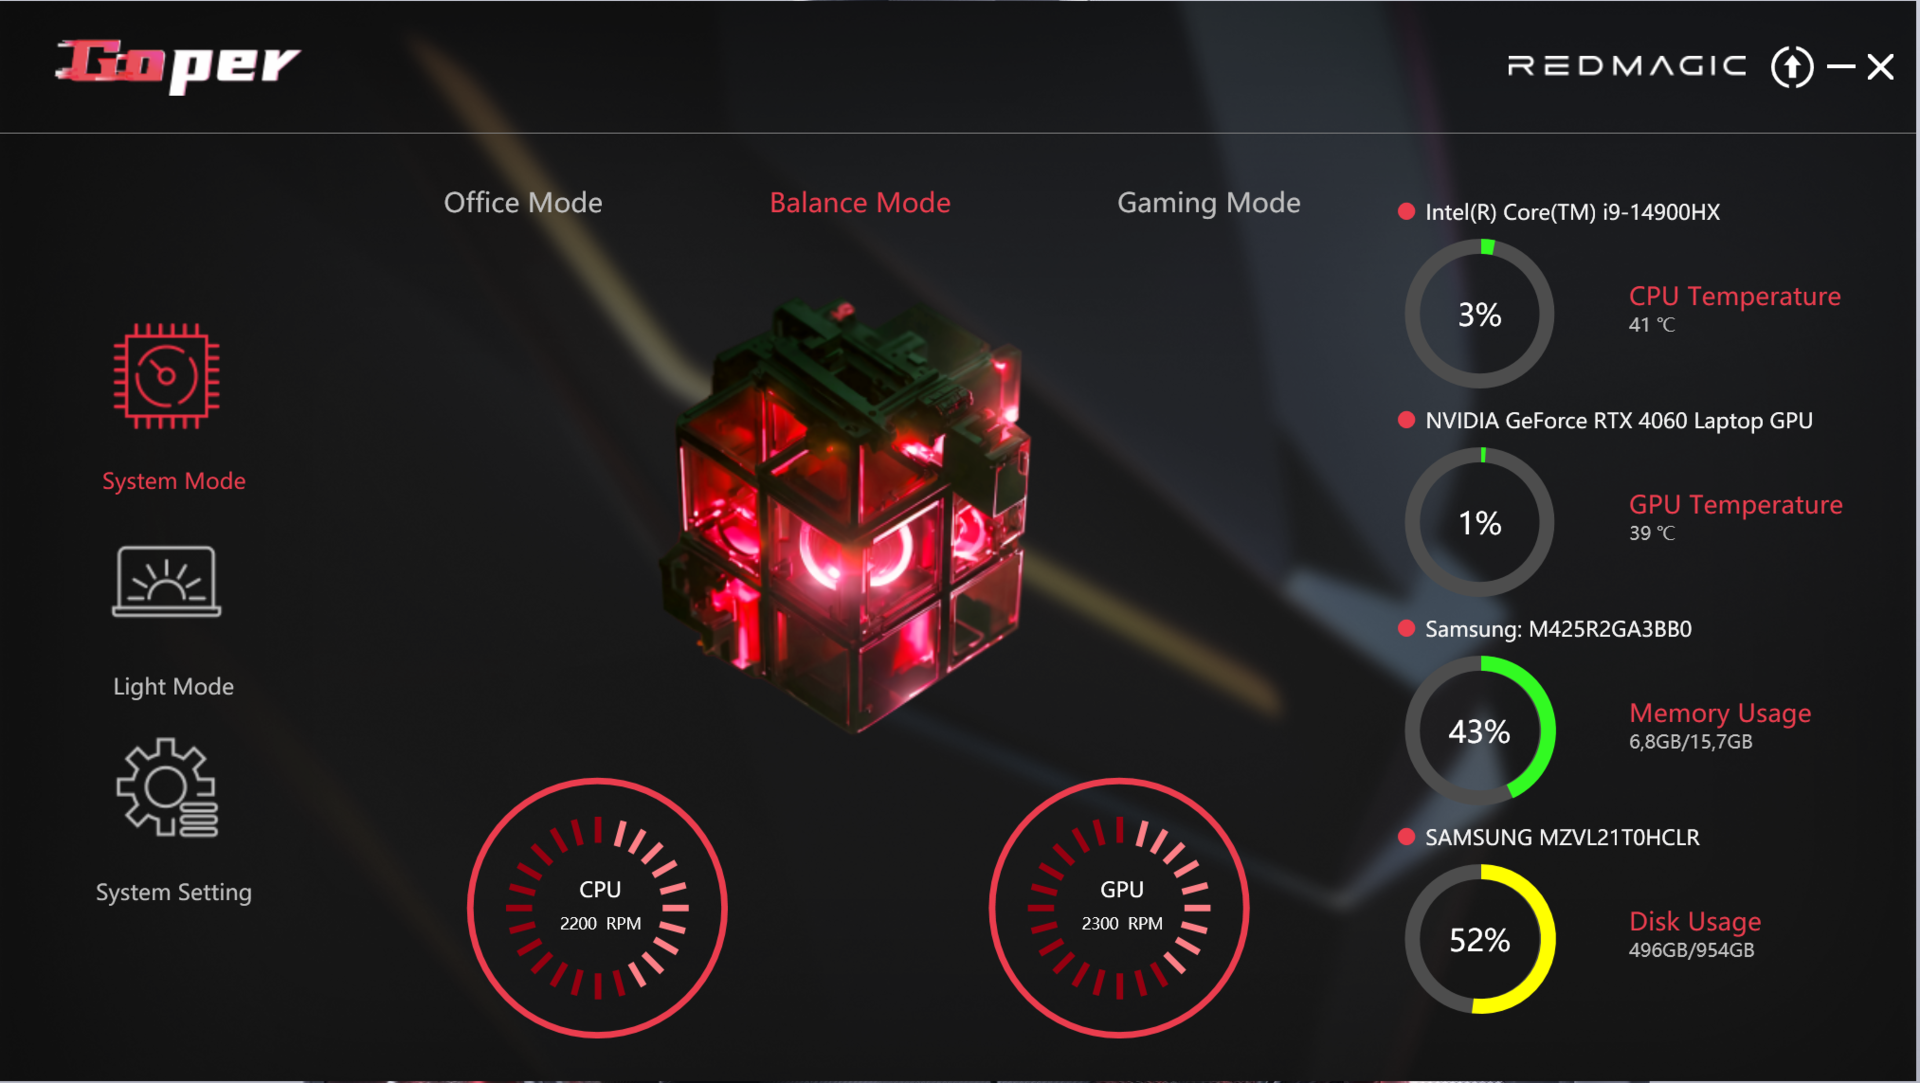
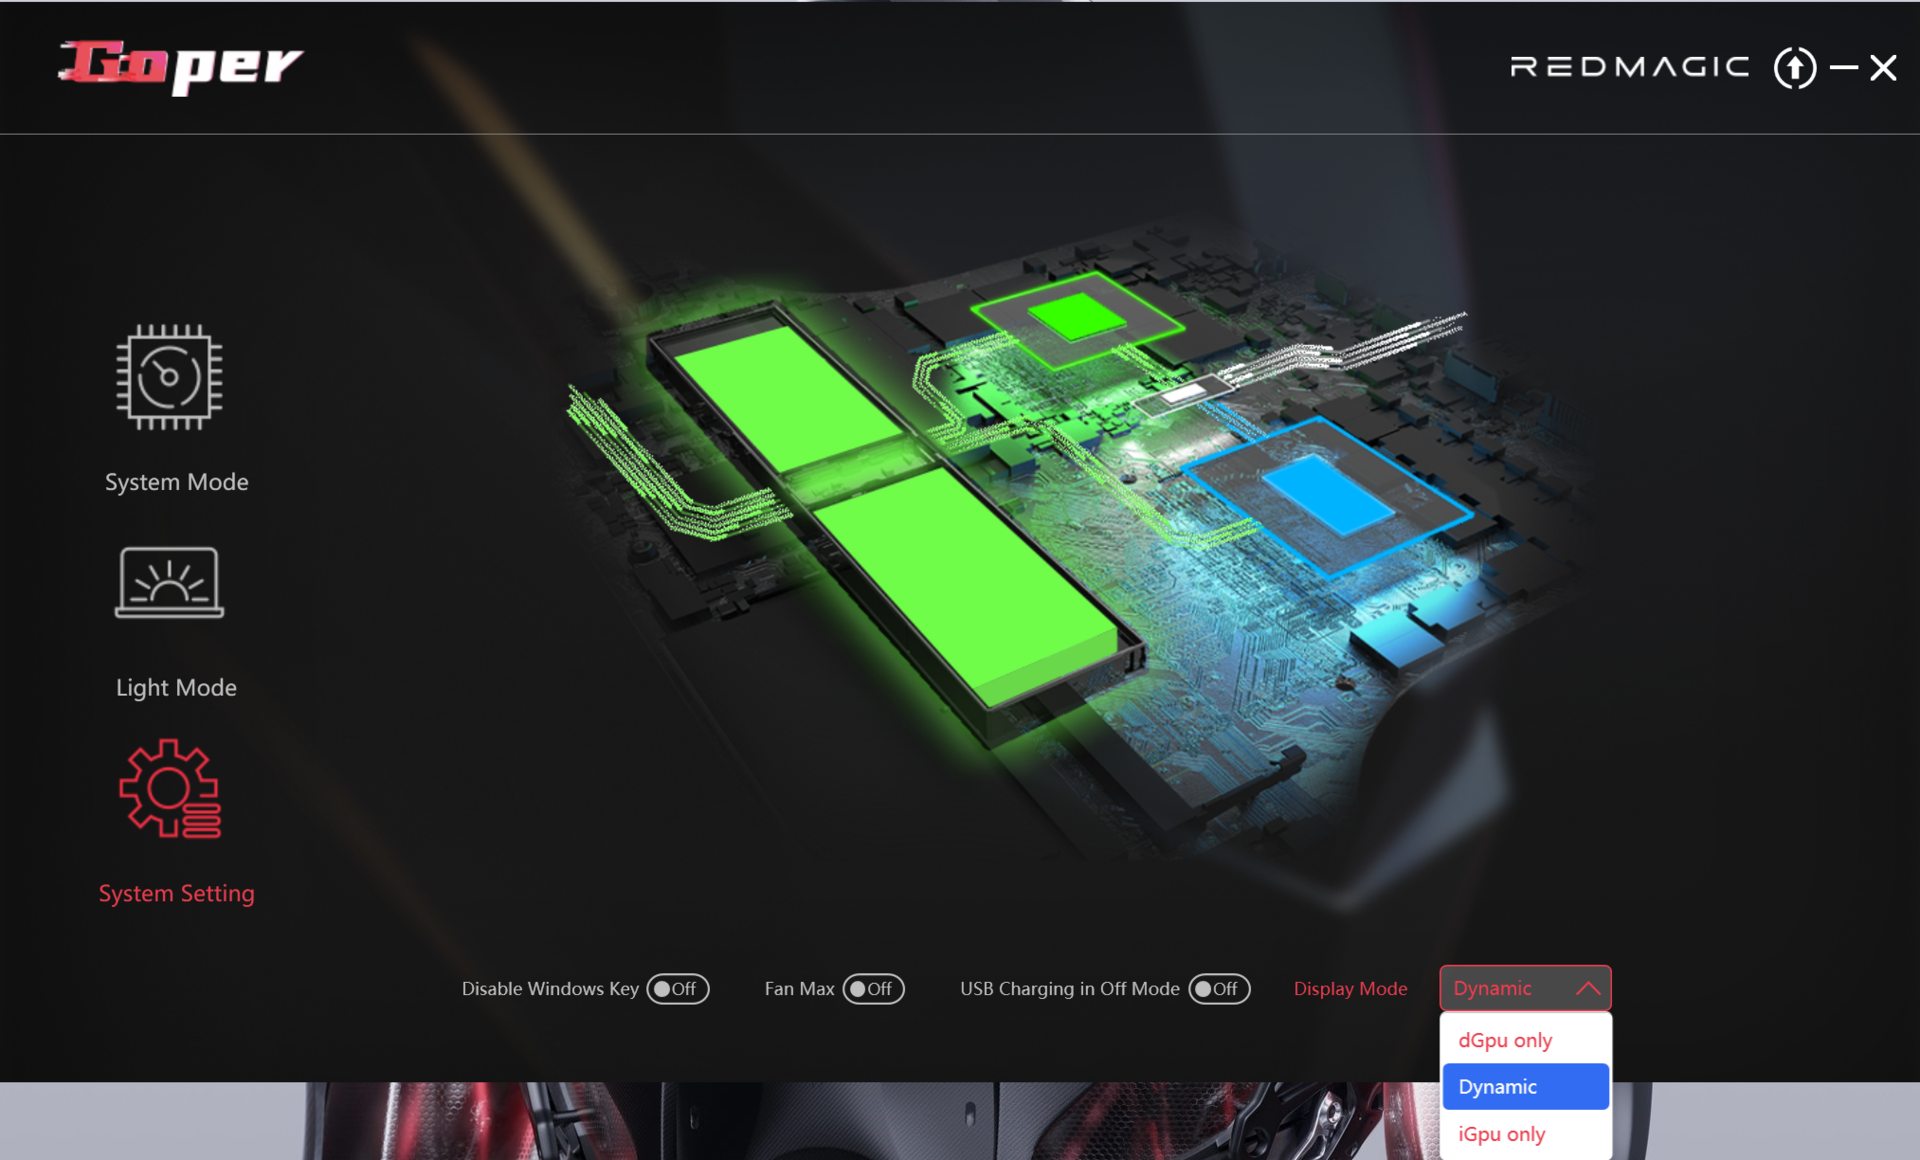
Üreticiye özel üç performans profili (tabloya bakınız) arasından seçim yapılabilir. Testimiz sırasında dengeli mod (kıyaslamalar) ve ofis modu (pil testleri) kullanılmıştır. GPU modu dinamik (= Optimus) olarak ayarlanmıştır. Her profil, sayısal tuş takımının üst satırındaki ayrı bir tuş aracılığıyla doğrudan çağrılabilir. Alternatif olarak, bunları Goper uygulaması (dizüstü bilgisayarın kontrol merkezi) aracılığıyla değiştirebilirsiniz.
| Dengeli mod | Oyun modu | Ofis modu | |
|---|---|---|---|
| Güç Sınırı 1 (HWInfo) | 45 watt | 100 watt | 35 watt |
| Güç Sınırı 2 (HWInfo) | 140 watt | 140 watt | 140 watt |
| Gürültü (Cyberpunk 2077) | 50 dB(A) | 53 dB(A) | 47 dB(A) |
| Performans (Cyberpunk 2077) | 66 fps | 66 fps | 60 fps |
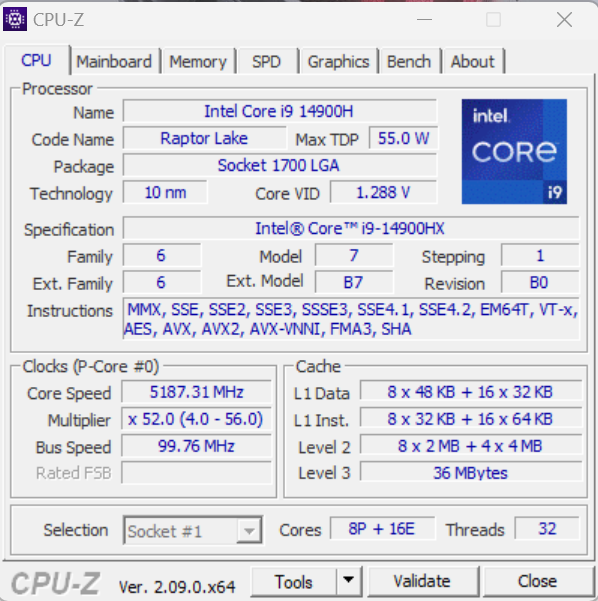
İşlemci
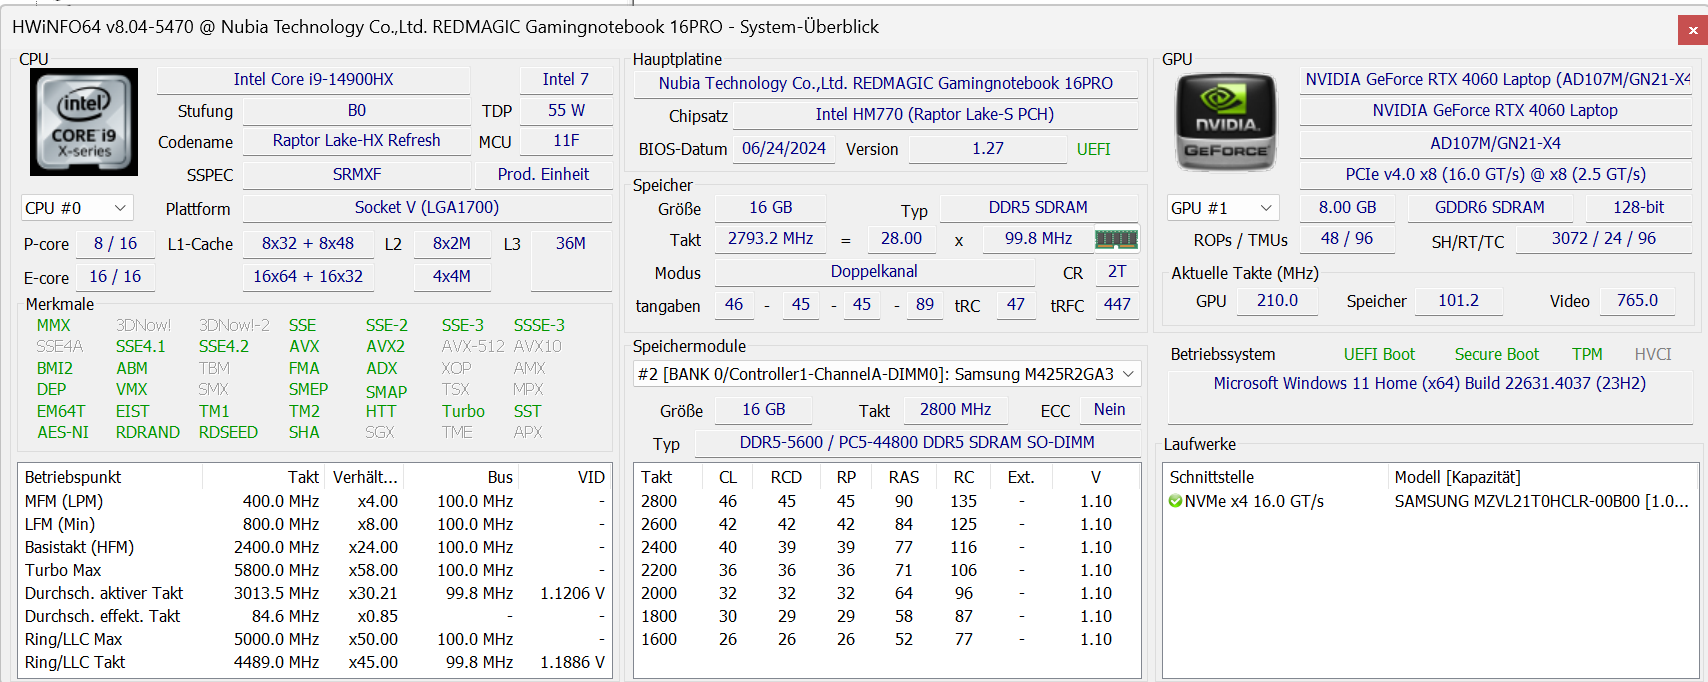
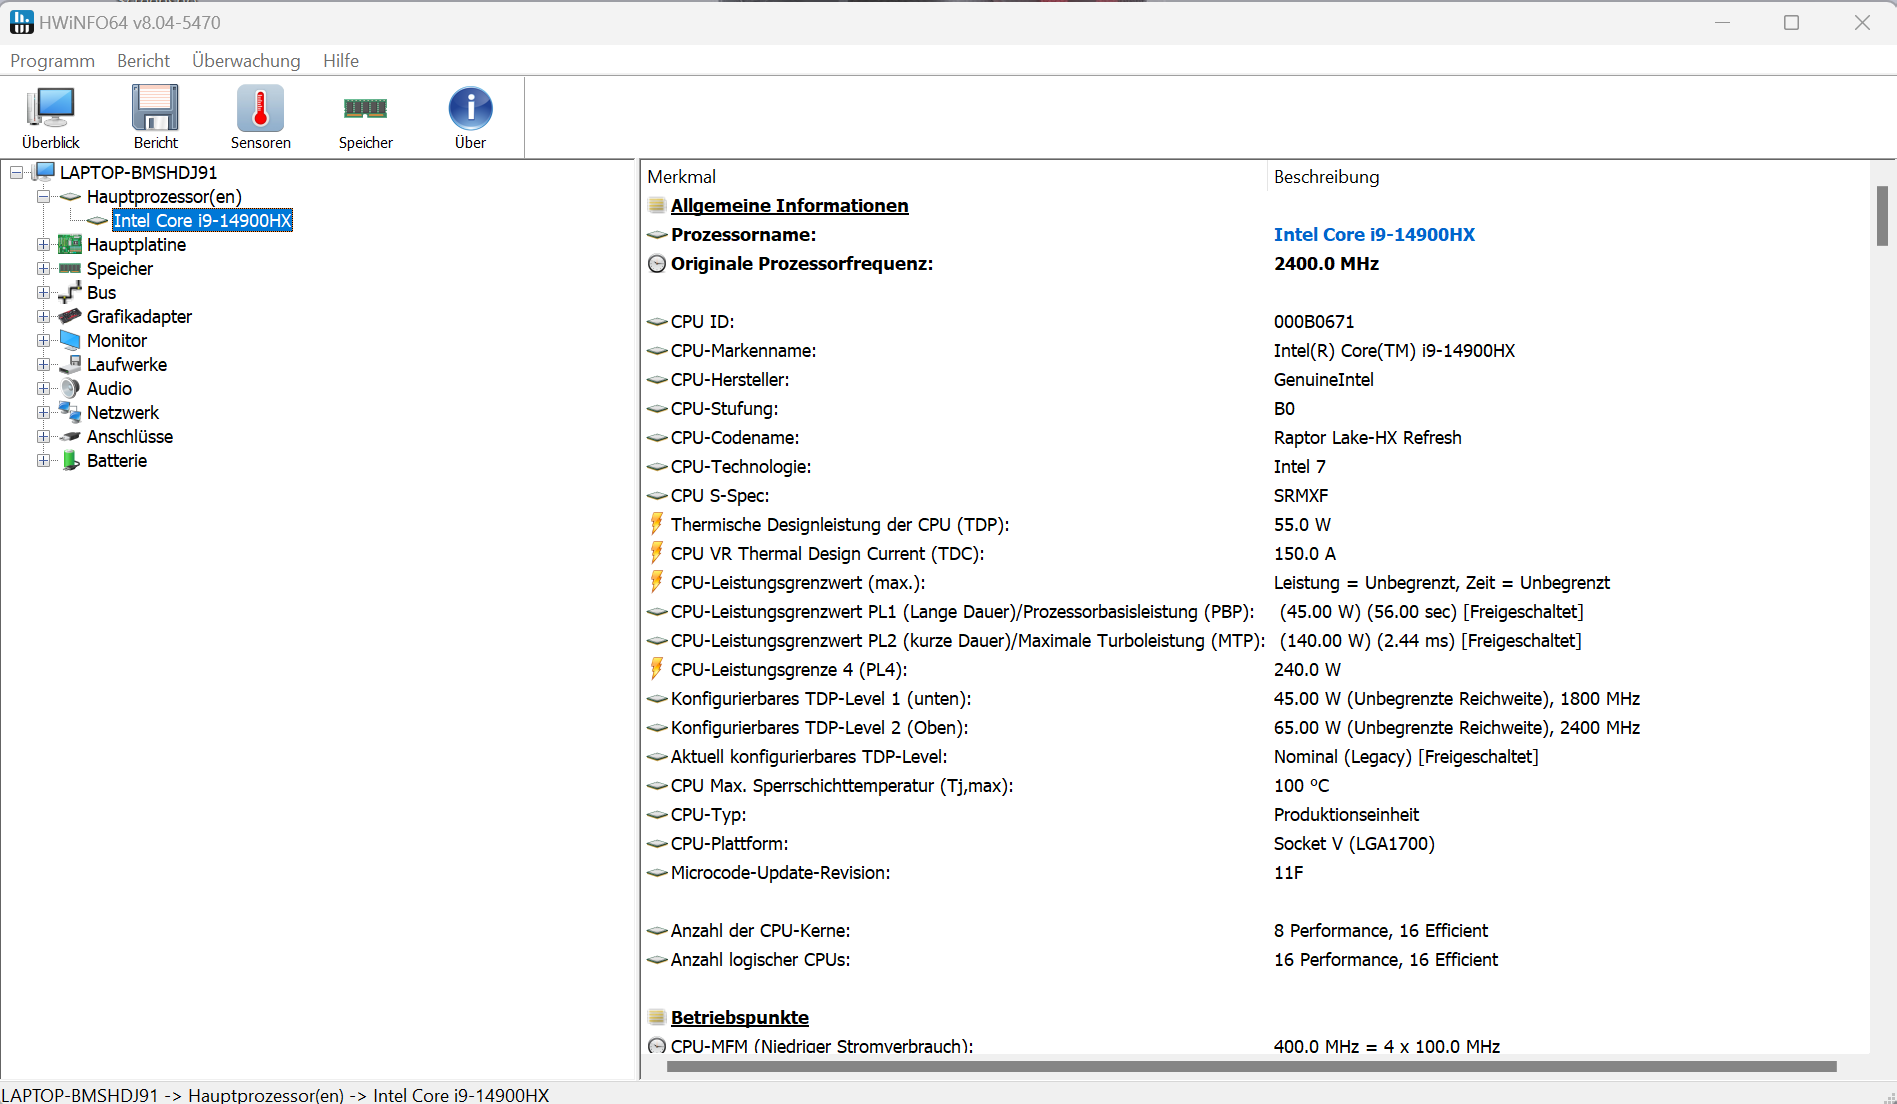
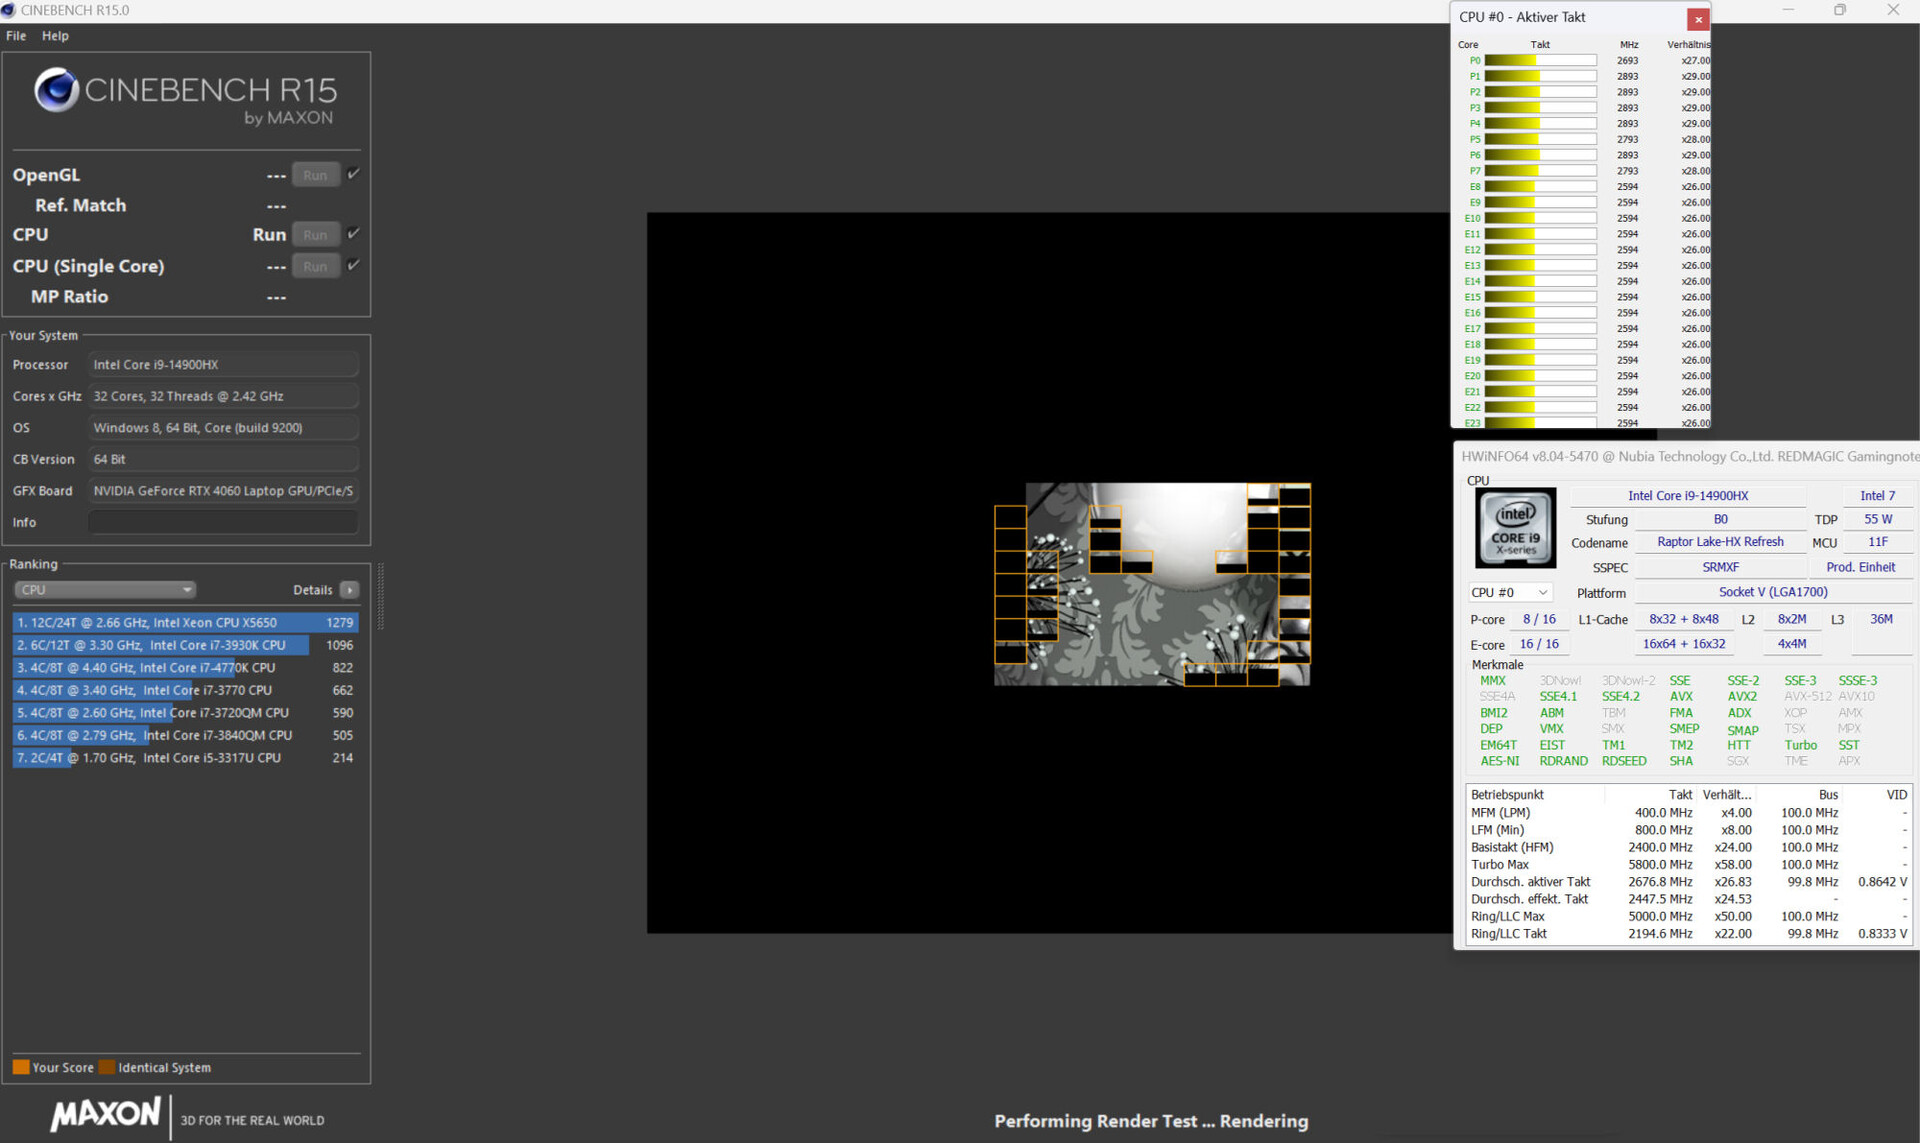
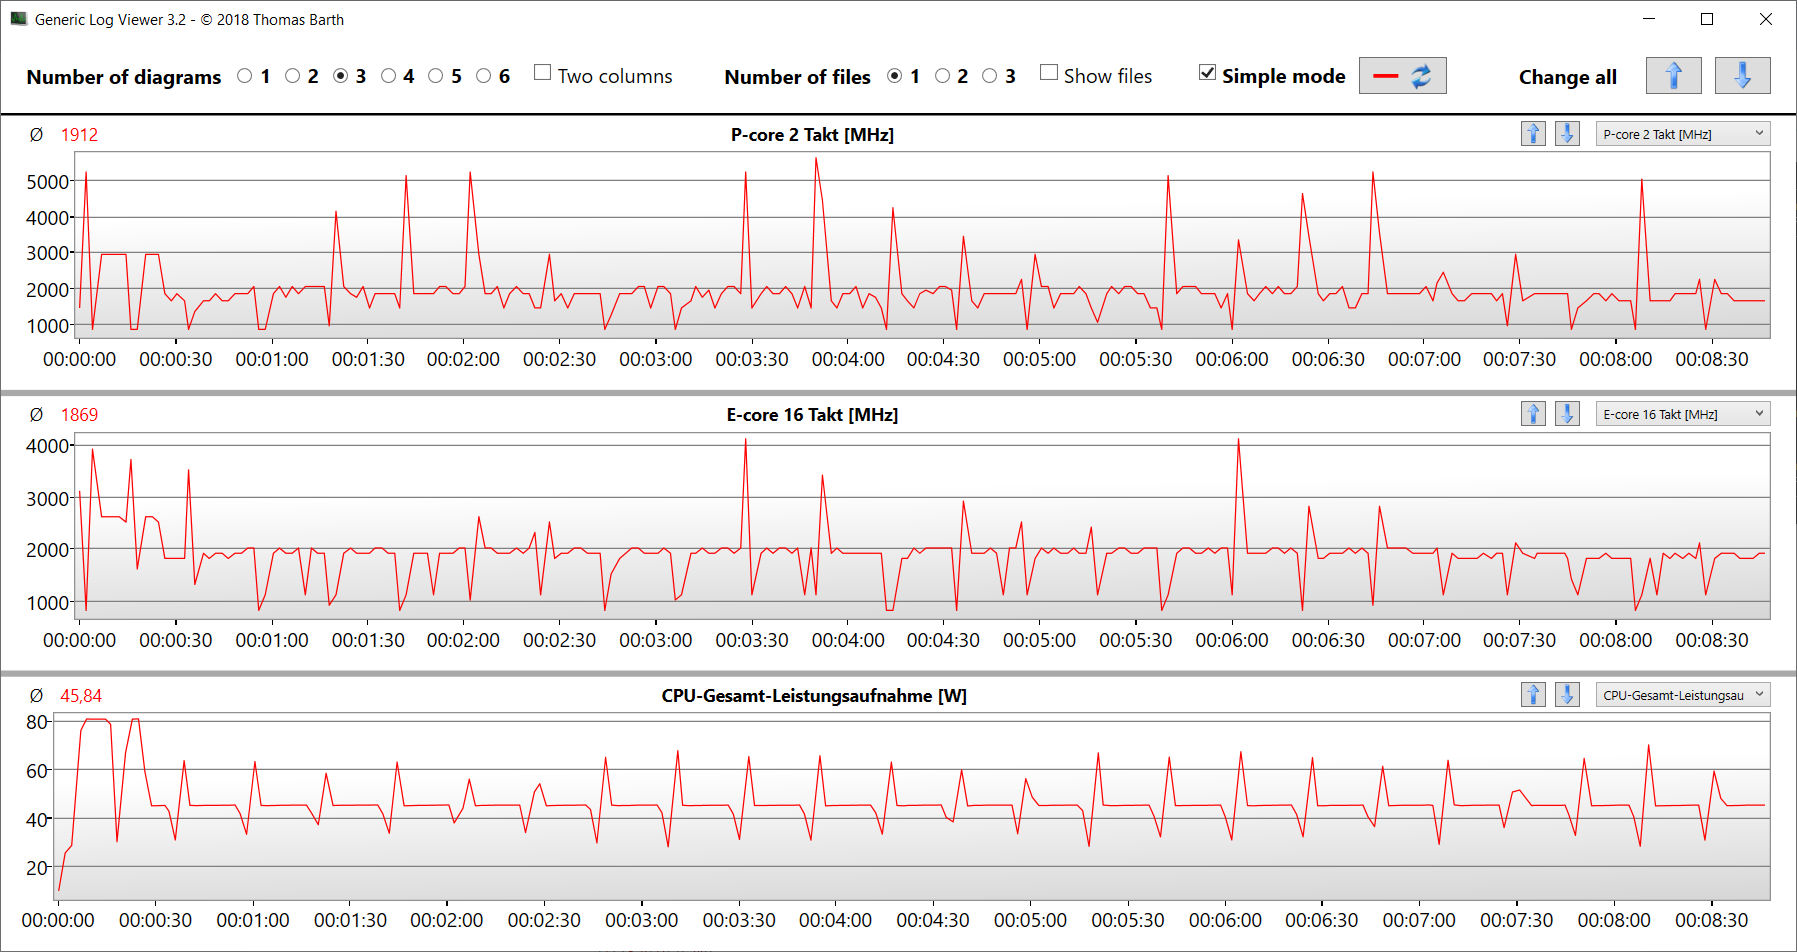
Titan'ın yalnızca bir CPU seçeneği vardır, yani Core i9-14900HX (Raptor Lake). 24 CPU çekirdeği (8P + 16E = 32 iş parçacığı) maksimum 5,8 GHz (P) ve 4,1 GHz (E) saat hızlarına ulaşmaktadır. Sürekli çoklu iş parçacığı yükü (CB15 döngüsü) CPU saatinin ilk çalıştırmadan üçüncü çalıştırmaya kadar önemli ölçüde düşmesine neden olmuştur. Bundan sonra oldukça sabit bir seviye korunmuştur. Oyun modu profili önemli ölçüde daha yüksek bir performans seviyesi sağlıyor.
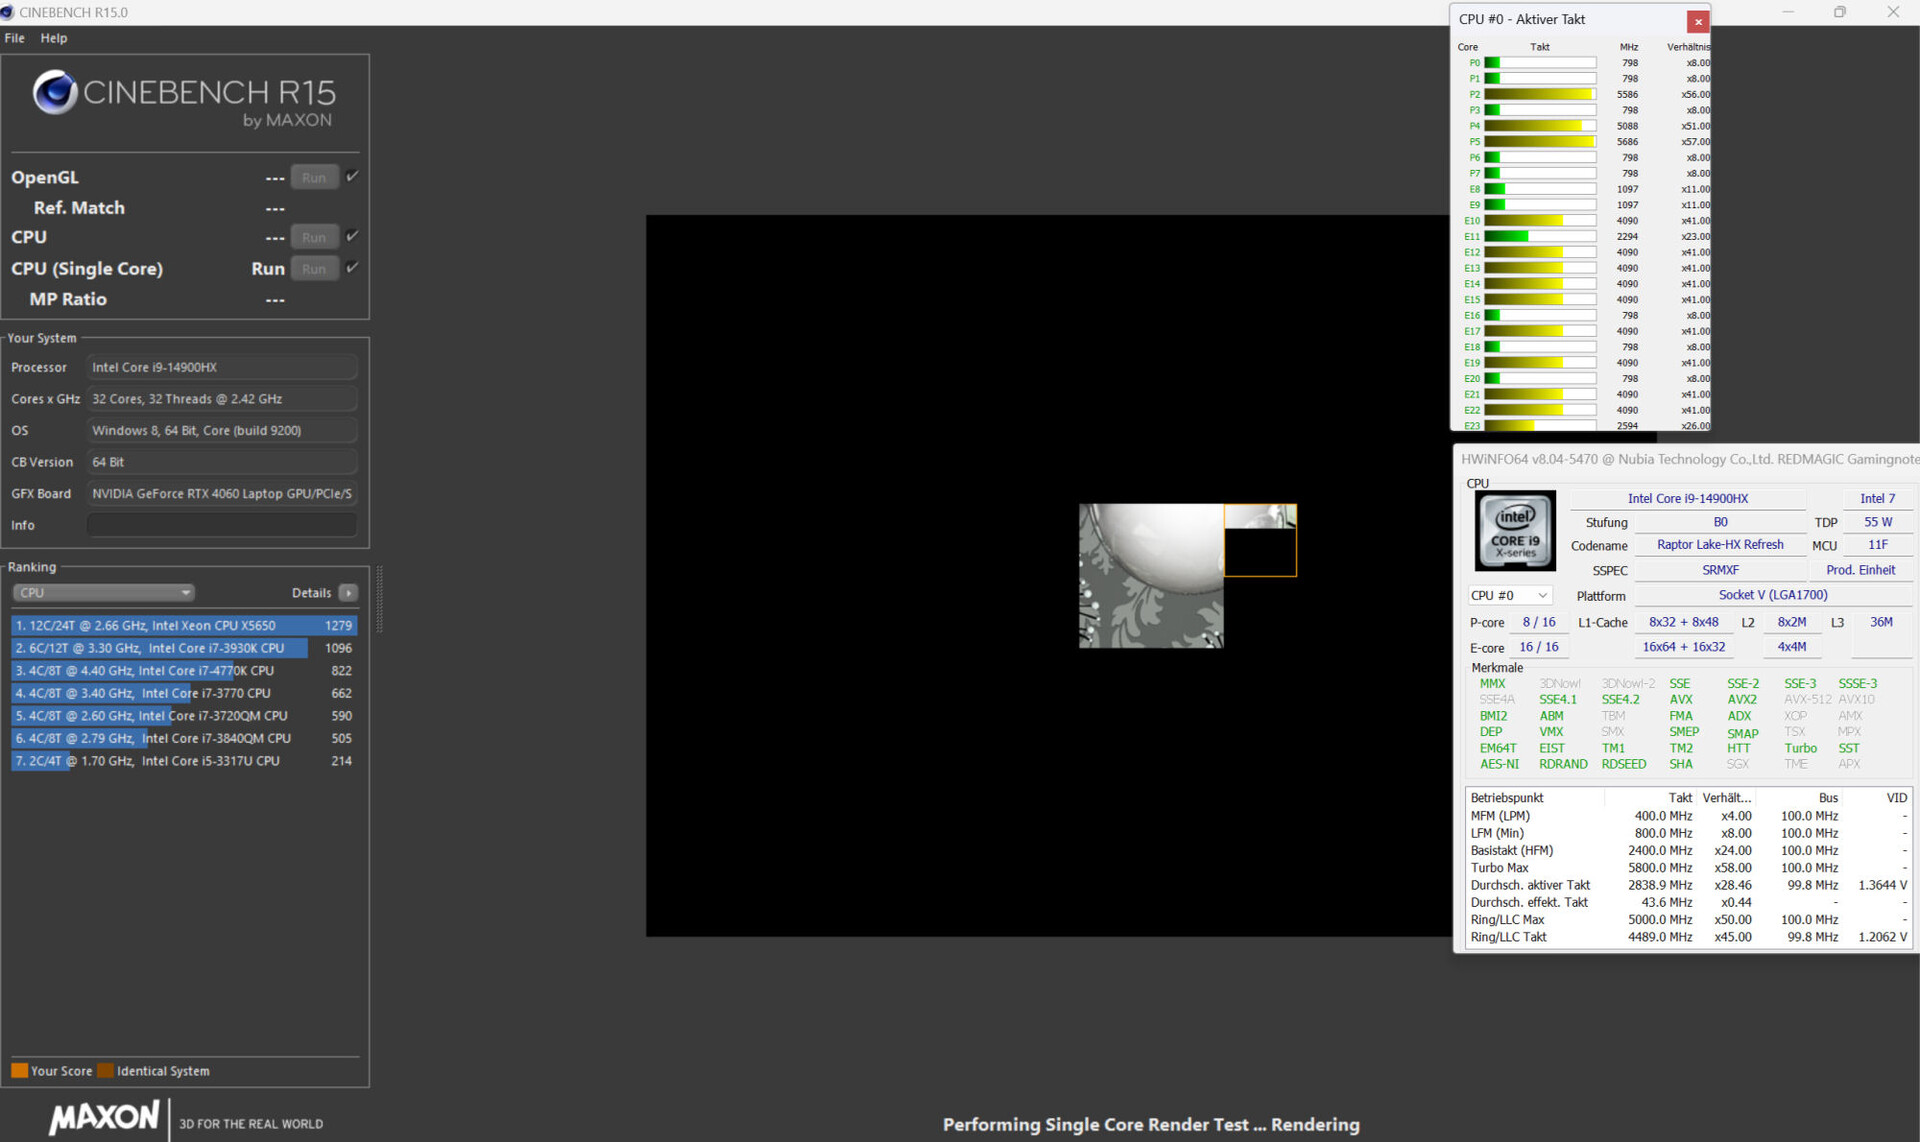
Üç güç modu, CPU'nun ortalamasıyla yaklaşık aynı seviyede çok benzer tek iş parçacığı performansı sunar. Çoklu iş parçacığı performansı çok daha büyük ölçüde farklılık göstermektedir: Testimiz sırasında yalnızca oyun modu CPU'nun ortalaması düzeyinde değerlerle sonuçlanırken, diğer iki mod önemli ölçüde daha düşüktü.
Core i9 hakkında daha fazla bilgi için aNALİZ MAKALESİ.
Cinebench R15 Multi continuous test
| CPU Performance Rating - Percent | |
| Ortalama Intel Core i9-14900HX | |
| Lenovo Legion Pro 5 16IRX9 G9 | |
| Nubia RedMagic Titan 16 Pro | |
| SCHENKER XMG Pro 16 Studio (Mid 24) | |
| Acer Predator Helios Neo 16 (2024) | |
| Nubia RedMagic Titan 16 Pro | |
| Sınıf ortalaması Gaming | |
| HP Victus 16 (2024) | |
| Gigabyte G6X 9KG (2024) | |
| Cinebench R20 | |
| CPU (Multi Core) | |
| Nubia RedMagic Titan 16 Pro (Gaming Mode) | |
| Ortalama Intel Core i9-14900HX (6579 - 13832, n=37) | |
| Lenovo Legion Pro 5 16IRX9 G9 | |
| SCHENKER XMG Pro 16 Studio (Mid 24) | |
| HP Victus 16 (2024) | |
| Acer Predator Helios Neo 16 (2024) | |
| Sınıf ortalaması Gaming (2179 - 15517, n=151, son 2 yıl) | |
| Gigabyte G6X 9KG (2024) | |
| Nubia RedMagic Titan 16 Pro | |
| CPU (Single Core) | |
| Nubia RedMagic Titan 16 Pro | |
| Ortalama Intel Core i9-14900HX (657 - 859, n=37) | |
| Lenovo Legion Pro 5 16IRX9 G9 | |
| Nubia RedMagic Titan 16 Pro (Gaming Mode) | |
| Acer Predator Helios Neo 16 (2024) | |
| SCHENKER XMG Pro 16 Studio (Mid 24) | |
| Sınıf ortalaması Gaming (439 - 866, n=151, son 2 yıl) | |
| Gigabyte G6X 9KG (2024) | |
| HP Victus 16 (2024) | |
| Cinebench R15 | |
| CPU Multi 64Bit | |
| Nubia RedMagic Titan 16 Pro (Gaming Mode) | |
| Ortalama Intel Core i9-14900HX (3263 - 5589, n=38) | |
| SCHENKER XMG Pro 16 Studio (Mid 24) | |
| Lenovo Legion Pro 5 16IRX9 G9 | |
| HP Victus 16 (2024) | |
| Acer Predator Helios Neo 16 (2024) | |
| Nubia RedMagic Titan 16 Pro | |
| Sınıf ortalaması Gaming (905 - 6074, n=154, son 2 yıl) | |
| Gigabyte G6X 9KG (2024) | |
| CPU Single 64Bit | |
| Nubia RedMagic Titan 16 Pro | |
| Nubia RedMagic Titan 16 Pro (Gaming Mode) | |
| Ortalama Intel Core i9-14900HX (247 - 323, n=37) | |
| Lenovo Legion Pro 5 16IRX9 G9 | |
| Acer Predator Helios Neo 16 (2024) | |
| SCHENKER XMG Pro 16 Studio (Mid 24) | |
| Sınıf ortalaması Gaming (191.9 - 343, n=151, son 2 yıl) | |
| Gigabyte G6X 9KG (2024) | |
| HP Victus 16 (2024) | |
| Blender - v2.79 BMW27 CPU | |
| Gigabyte G6X 9KG (2024) | |
| Nubia RedMagic Titan 16 Pro | |
| Sınıf ortalaması Gaming (81 - 555, n=144, son 2 yıl) | |
| HP Victus 16 (2024) | |
| Acer Predator Helios Neo 16 (2024) | |
| SCHENKER XMG Pro 16 Studio (Mid 24) | |
| Nubia RedMagic Titan 16 Pro (Gaming Mode) | |
| Lenovo Legion Pro 5 16IRX9 G9 | |
| Ortalama Intel Core i9-14900HX (91 - 206, n=37) | |
| Geekbench 6.4 | |
| Multi-Core | |
| Lenovo Legion Pro 5 16IRX9 G9 (6.2.1) | |
| Ortalama Intel Core i9-14900HX (13158 - 19665, n=37) | |
| Acer Predator Helios Neo 16 (2024) (6.2.1) | |
| SCHENKER XMG Pro 16 Studio (Mid 24) (6.2.1) | |
| HP Victus 16 (2024) (6.2.1) | |
| Nubia RedMagic Titan 16 Pro (6.2.1, Gaming Mode) | |
| Sınıf ortalaması Gaming (5340 - 21668, n=119, son 2 yıl) | |
| Gigabyte G6X 9KG (2024) (6.2.1) | |
| Nubia RedMagic Titan 16 Pro (6.2.1) | |
| Single-Core | |
| Nubia RedMagic Titan 16 Pro (6.2.1) | |
| Nubia RedMagic Titan 16 Pro (6.2.1, Gaming Mode) | |
| Acer Predator Helios Neo 16 (2024) (6.2.1) | |
| Ortalama Intel Core i9-14900HX (2419 - 3129, n=37) | |
| Lenovo Legion Pro 5 16IRX9 G9 (6.2.1) | |
| SCHENKER XMG Pro 16 Studio (Mid 24) (6.2.1) | |
| Sınıf ortalaması Gaming (1490 - 3219, n=119, son 2 yıl) | |
| Gigabyte G6X 9KG (2024) (6.2.1) | |
| HP Victus 16 (2024) (6.2.1) | |
| HWBOT x265 Benchmark v2.2 - 4k Preset | |
| Nubia RedMagic Titan 16 Pro (Gaming Mode) | |
| Ortalama Intel Core i9-14900HX (16.8 - 38.9, n=37) | |
| Lenovo Legion Pro 5 16IRX9 G9 | |
| SCHENKER XMG Pro 16 Studio (Mid 24) | |
| Acer Predator Helios Neo 16 (2024) | |
| Sınıf ortalaması Gaming (6.72 - 42.9, n=148, son 2 yıl) | |
| HP Victus 16 (2024) | |
| Gigabyte G6X 9KG (2024) | |
| Nubia RedMagic Titan 16 Pro | |
| LibreOffice - 20 Documents To PDF | |
| HP Victus 16 (2024) (6.3.4.2) | |
| Lenovo Legion Pro 5 16IRX9 G9 (6.3.4.2) | |
| Sınıf ortalaması Gaming (19 - 96.6, n=147, son 2 yıl) | |
| SCHENKER XMG Pro 16 Studio (Mid 24) (6.3.4.2) | |
| Ortalama Intel Core i9-14900HX (19 - 85.1, n=37) | |
| Acer Predator Helios Neo 16 (2024) (6.3.4.2) | |
| Nubia RedMagic Titan 16 Pro (6.3.4.2, Gaming Mode) | |
| Gigabyte G6X 9KG (2024) (6.3.4.2) | |
| Nubia RedMagic Titan 16 Pro (6.3.4.2) | |
| R Benchmark 2.5 - Overall mean | |
| HP Victus 16 (2024) | |
| Sınıf ortalaması Gaming (0.3609 - 0.759, n=150, son 2 yıl) | |
| Gigabyte G6X 9KG (2024) | |
| SCHENKER XMG Pro 16 Studio (Mid 24) | |
| Lenovo Legion Pro 5 16IRX9 G9 | |
| Ortalama Intel Core i9-14900HX (0.3604 - 0.4859, n=37) | |
| Acer Predator Helios Neo 16 (2024) | |
| Nubia RedMagic Titan 16 Pro | |
| Nubia RedMagic Titan 16 Pro (Gaming Mode) | |
* ... daha küçük daha iyidir
AIDA64: FP32 Ray-Trace | FPU Julia | CPU SHA3 | CPU Queen | FPU SinJulia | FPU Mandel | CPU AES | CPU ZLib | FP64 Ray-Trace | CPU PhotoWorxx
| Performance Rating | |
| Ortalama Intel Core i9-14900HX | |
| Nubia RedMagic Titan 16 Pro | |
| Lenovo Legion Pro 5 16IRX9 G9 | |
| SCHENKER XMG Pro 16 Studio (Mid 24) | |
| Acer Predator Helios Neo 16 (2024) | |
| Sınıf ortalaması Gaming | |
| HP Victus 16 (2024) | |
| Nubia RedMagic Titan 16 Pro | |
| Gigabyte G6X 9KG (2024) | |
| AIDA64 / FP32 Ray-Trace | |
| Ortalama Intel Core i9-14900HX (13098 - 33474, n=36) | |
| Nubia RedMagic Titan 16 Pro (v6.92.6600, Gaming Mode) | |
| Lenovo Legion Pro 5 16IRX9 G9 (v6.92.6600) | |
| Sınıf ortalaması Gaming (4986 - 81639, n=147, son 2 yıl) | |
| Acer Predator Helios Neo 16 (2024) (v6.92.6600) | |
| SCHENKER XMG Pro 16 Studio (Mid 24) (v6.92.6600) | |
| HP Victus 16 (2024) (v6.92.6600) | |
| Gigabyte G6X 9KG (2024) (v6.92.6600) | |
| Nubia RedMagic Titan 16 Pro (v6.92.6600) | |
| AIDA64 / FPU Julia | |
| Ortalama Intel Core i9-14900HX (67573 - 166040, n=36) | |
| Nubia RedMagic Titan 16 Pro (v6.92.6600, Gaming Mode) | |
| Lenovo Legion Pro 5 16IRX9 G9 (v6.92.6600) | |
| SCHENKER XMG Pro 16 Studio (Mid 24) (v6.92.6600) | |
| Acer Predator Helios Neo 16 (2024) (v6.92.6600) | |
| Sınıf ortalaması Gaming (25360 - 252486, n=147, son 2 yıl) | |
| HP Victus 16 (2024) (v6.92.6600) | |
| Gigabyte G6X 9KG (2024) (v6.92.6600) | |
| Nubia RedMagic Titan 16 Pro (v6.92.6600) | |
| AIDA64 / CPU SHA3 | |
| Nubia RedMagic Titan 16 Pro (v6.92.6600, Gaming Mode) | |
| Ortalama Intel Core i9-14900HX (3589 - 7979, n=36) | |
| SCHENKER XMG Pro 16 Studio (Mid 24) (v6.92.6600) | |
| Lenovo Legion Pro 5 16IRX9 G9 (v6.92.6600) | |
| Acer Predator Helios Neo 16 (2024) (v6.92.6600) | |
| Sınıf ortalaması Gaming (1339 - 10389, n=147, son 2 yıl) | |
| HP Victus 16 (2024) (v6.92.6600) | |
| Nubia RedMagic Titan 16 Pro (v6.92.6600) | |
| Gigabyte G6X 9KG (2024) (v6.92.6600) | |
| AIDA64 / CPU Queen | |
| Lenovo Legion Pro 5 16IRX9 G9 (v6.92.6600) | |
| Acer Predator Helios Neo 16 (2024) (v6.92.6600) | |
| Nubia RedMagic Titan 16 Pro (v6.92.6600, Gaming Mode) | |
| Ortalama Intel Core i9-14900HX (118405 - 148966, n=36) | |
| SCHENKER XMG Pro 16 Studio (Mid 24) (v6.92.6600) | |
| HP Victus 16 (2024) (v6.92.6600) | |
| Nubia RedMagic Titan 16 Pro (v6.92.6600) | |
| Sınıf ortalaması Gaming (50699 - 200651, n=147, son 2 yıl) | |
| Gigabyte G6X 9KG (2024) (v6.92.6600) | |
| AIDA64 / FPU SinJulia | |
| Nubia RedMagic Titan 16 Pro (v6.92.6600, Gaming Mode) | |
| Ortalama Intel Core i9-14900HX (10475 - 18517, n=36) | |
| Lenovo Legion Pro 5 16IRX9 G9 (v6.92.6600) | |
| SCHENKER XMG Pro 16 Studio (Mid 24) (v6.92.6600) | |
| Acer Predator Helios Neo 16 (2024) (v6.92.6600) | |
| Sınıf ortalaması Gaming (4800 - 32988, n=147, son 2 yıl) | |
| HP Victus 16 (2024) (v6.92.6600) | |
| Nubia RedMagic Titan 16 Pro (v6.92.6600) | |
| Gigabyte G6X 9KG (2024) (v6.92.6600) | |
| AIDA64 / FPU Mandel | |
| Ortalama Intel Core i9-14900HX (32543 - 83662, n=36) | |
| Nubia RedMagic Titan 16 Pro (v6.92.6600, Gaming Mode) | |
| Lenovo Legion Pro 5 16IRX9 G9 (v6.92.6600) | |
| Acer Predator Helios Neo 16 (2024) (v6.92.6600) | |
| Sınıf ortalaması Gaming (12321 - 134044, n=147, son 2 yıl) | |
| SCHENKER XMG Pro 16 Studio (Mid 24) (v6.92.6600) | |
| HP Victus 16 (2024) (v6.92.6600) | |
| Gigabyte G6X 9KG (2024) (v6.92.6600) | |
| Nubia RedMagic Titan 16 Pro | |
| AIDA64 / CPU AES | |
| Nubia RedMagic Titan 16 Pro (v6.92.6600, Gaming Mode) | |
| Ortalama Intel Core i9-14900HX (86964 - 241777, n=36) | |
| Nubia RedMagic Titan 16 Pro (v6.92.6600) | |
| Lenovo Legion Pro 5 16IRX9 G9 (v6.92.6600) | |
| SCHENKER XMG Pro 16 Studio (Mid 24) (v6.92.6600) | |
| Sınıf ortalaması Gaming (19065 - 328679, n=147, son 2 yıl) | |
| Acer Predator Helios Neo 16 (2024) (v6.92.6600) | |
| HP Victus 16 (2024) (v6.92.6600) | |
| Gigabyte G6X 9KG (2024) (v6.92.6600) | |
| AIDA64 / CPU ZLib | |
| Nubia RedMagic Titan 16 Pro (v6.92.6600, Gaming Mode) | |
| Ortalama Intel Core i9-14900HX (1054 - 2292, n=36) | |
| Lenovo Legion Pro 5 16IRX9 G9 (v6.92.6600) | |
| SCHENKER XMG Pro 16 Studio (Mid 24) (v6.92.6600) | |
| Acer Predator Helios Neo 16 (2024) (v6.92.6600) | |
| Sınıf ortalaması Gaming (373 - 2531, n=147, son 2 yıl) | |
| HP Victus 16 (2024) (v6.92.6600) | |
| Gigabyte G6X 9KG (2024) (v6.92.6600) | |
| Nubia RedMagic Titan 16 Pro (v6.92.6600) | |
| AIDA64 / FP64 Ray-Trace | |
| Ortalama Intel Core i9-14900HX (6809 - 18349, n=36) | |
| Lenovo Legion Pro 5 16IRX9 G9 (v6.92.6600) | |
| Nubia RedMagic Titan 16 Pro (v6.92.6600, Gaming Mode) | |
| Sınıf ortalaması Gaming (2540 - 43430, n=147, son 2 yıl) | |
| SCHENKER XMG Pro 16 Studio (Mid 24) (v6.92.6600) | |
| Acer Predator Helios Neo 16 (2024) (v6.92.6600) | |
| HP Victus 16 (2024) (v6.92.6600) | |
| Gigabyte G6X 9KG (2024) (v6.92.6600) | |
| Nubia RedMagic Titan 16 Pro (v6.92.6600) | |
| AIDA64 / CPU PhotoWorxx | |
| Lenovo Legion Pro 5 16IRX9 G9 (v6.92.6600) | |
| SCHENKER XMG Pro 16 Studio (Mid 24) (v6.92.6600) | |
| Ortalama Intel Core i9-14900HX (23903 - 54702, n=36) | |
| Acer Predator Helios Neo 16 (2024) (v6.92.6600) | |
| Sınıf ortalaması Gaming (10805 - 60161, n=147, son 2 yıl) | |
| HP Victus 16 (2024) (v6.92.6600) | |
| Gigabyte G6X 9KG (2024) (v6.92.6600) | |
| Nubia RedMagic Titan 16 Pro (v6.92.6600) | |
| Nubia RedMagic Titan 16 Pro (v6.92.6600, Gaming Mode) | |
Sistem performansı
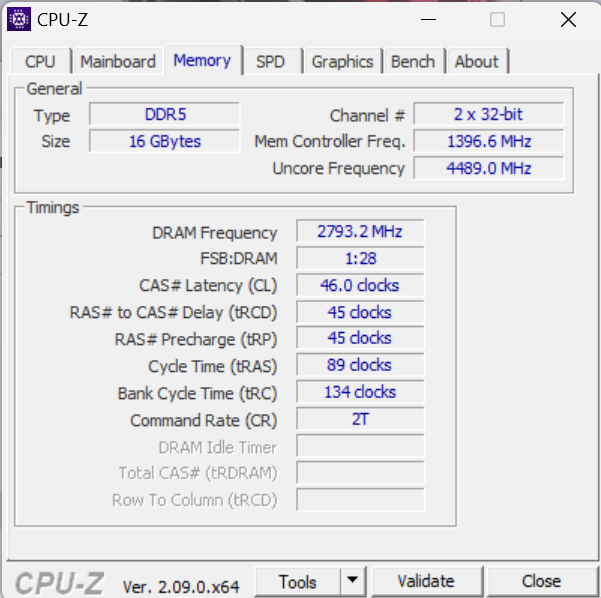
Sorunsuz çalışan sistem, oyun, render ve akış gibi zorlu uygulamalar için yeterli güç sağlıyor. Ancak RAM (16 GB, DDR5-5600) yalnızca tek kanal modunda çalıştığı için işlem gücünün bir kısmı kullanılmadan kalıyor; dizüstü bilgisayarın rakiplerine kıyasla düşük bellek aktarım hızları da bunu doğruluyor. İkinci bir bellek modülünün takılması (= çift kanal modu etkin) buna bir çözüm sağlayacaktır.
CrossMark: Overall | Productivity | Creativity | Responsiveness
WebXPRT 3: Overall
WebXPRT 4: Overall
Mozilla Kraken 1.1: Total
| PCMark 10 / Score | |
| Acer Predator Helios Neo 16 (2024) | |
| Lenovo Legion Pro 5 16IRX9 G9 | |
| SCHENKER XMG Pro 16 Studio (Mid 24) | |
| Ortalama Intel Core i9-14900HX, NVIDIA GeForce RTX 4060 Laptop GPU (7830 - 8322, n=2) | |
| Nubia RedMagic Titan 16 Pro | |
| Sınıf ortalaması Gaming (5776 - 9852, n=133, son 2 yıl) | |
| Gigabyte G6X 9KG (2024) | |
| HP Victus 16 (2024) | |
| PCMark 10 / Essentials | |
| Acer Predator Helios Neo 16 (2024) | |
| Ortalama Intel Core i9-14900HX, NVIDIA GeForce RTX 4060 Laptop GPU (11022 - 11413, n=2) | |
| Lenovo Legion Pro 5 16IRX9 G9 | |
| Nubia RedMagic Titan 16 Pro | |
| HP Victus 16 (2024) | |
| Sınıf ortalaması Gaming (9057 - 12600, n=133, son 2 yıl) | |
| SCHENKER XMG Pro 16 Studio (Mid 24) | |
| Gigabyte G6X 9KG (2024) | |
| PCMark 10 / Productivity | |
| SCHENKER XMG Pro 16 Studio (Mid 24) | |
| Acer Predator Helios Neo 16 (2024) | |
| Gigabyte G6X 9KG (2024) | |
| Ortalama Intel Core i9-14900HX, NVIDIA GeForce RTX 4060 Laptop GPU (9776 - 10558, n=2) | |
| HP Victus 16 (2024) | |
| Sınıf ortalaması Gaming (6662 - 14612, n=133, son 2 yıl) | |
| Lenovo Legion Pro 5 16IRX9 G9 | |
| Nubia RedMagic Titan 16 Pro | |
| PCMark 10 / Digital Content Creation | |
| Lenovo Legion Pro 5 16IRX9 G9 | |
| Acer Predator Helios Neo 16 (2024) | |
| Ortalama Intel Core i9-14900HX, NVIDIA GeForce RTX 4060 Laptop GPU (12091 - 12979, n=2) | |
| SCHENKER XMG Pro 16 Studio (Mid 24) | |
| Sınıf ortalaması Gaming (6807 - 18475, n=133, son 2 yıl) | |
| Nubia RedMagic Titan 16 Pro | |
| Gigabyte G6X 9KG (2024) | |
| HP Victus 16 (2024) | |
| CrossMark / Overall | |
| Acer Predator Helios Neo 16 (2024) | |
| Ortalama Intel Core i9-14900HX, NVIDIA GeForce RTX 4060 Laptop GPU (2103 - 2184, n=2) | |
| Lenovo Legion Pro 5 16IRX9 G9 | |
| Nubia RedMagic Titan 16 Pro | |
| SCHENKER XMG Pro 16 Studio (Mid 24) | |
| Gigabyte G6X 9KG (2024) | |
| HP Victus 16 (2024) | |
| Sınıf ortalaması Gaming (1247 - 2344, n=114, son 2 yıl) | |
| CrossMark / Productivity | |
| Acer Predator Helios Neo 16 (2024) | |
| Nubia RedMagic Titan 16 Pro | |
| Ortalama Intel Core i9-14900HX, NVIDIA GeForce RTX 4060 Laptop GPU (2040 - 2042, n=2) | |
| Lenovo Legion Pro 5 16IRX9 G9 | |
| SCHENKER XMG Pro 16 Studio (Mid 24) | |
| Gigabyte G6X 9KG (2024) | |
| Sınıf ortalaması Gaming (1299 - 2204, n=114, son 2 yıl) | |
| HP Victus 16 (2024) | |
| CrossMark / Creativity | |
| Acer Predator Helios Neo 16 (2024) | |
| Lenovo Legion Pro 5 16IRX9 G9 | |
| SCHENKER XMG Pro 16 Studio (Mid 24) | |
| Ortalama Intel Core i9-14900HX, NVIDIA GeForce RTX 4060 Laptop GPU (2240 - 2472, n=2) | |
| Nubia RedMagic Titan 16 Pro | |
| HP Victus 16 (2024) | |
| Sınıf ortalaması Gaming (1275 - 2660, n=114, son 2 yıl) | |
| Gigabyte G6X 9KG (2024) | |
| CrossMark / Responsiveness | |
| Acer Predator Helios Neo 16 (2024) | |
| Gigabyte G6X 9KG (2024) | |
| Nubia RedMagic Titan 16 Pro | |
| Lenovo Legion Pro 5 16IRX9 G9 | |
| Ortalama Intel Core i9-14900HX, NVIDIA GeForce RTX 4060 Laptop GPU (1849 - 1899, n=2) | |
| HP Victus 16 (2024) | |
| SCHENKER XMG Pro 16 Studio (Mid 24) | |
| Sınıf ortalaması Gaming (1030 - 2330, n=114, son 2 yıl) | |
| WebXPRT 3 / Overall | |
| Ortalama Intel Core i9-14900HX, NVIDIA GeForce RTX 4060 Laptop GPU (329 - 339, n=2) | |
| Nubia RedMagic Titan 16 Pro | |
| Acer Predator Helios Neo 16 (2024) | |
| SCHENKER XMG Pro 16 Studio (Mid 24) | |
| Gigabyte G6X 9KG (2024) | |
| Lenovo Legion Pro 5 16IRX9 G9 | |
| Sınıf ortalaması Gaming (215 - 480, n=127, son 2 yıl) | |
| HP Victus 16 (2024) | |
| WebXPRT 4 / Overall | |
| Ortalama Intel Core i9-14900HX, NVIDIA GeForce RTX 4060 Laptop GPU (309 - 319, n=2) | |
| Nubia RedMagic Titan 16 Pro | |
| Acer Predator Helios Neo 16 (2024) | |
| SCHENKER XMG Pro 16 Studio (Mid 24) | |
| Lenovo Legion Pro 5 16IRX9 G9 | |
| Sınıf ortalaması Gaming (176.4 - 335, n=115, son 2 yıl) | |
| Gigabyte G6X 9KG (2024) | |
| HP Victus 16 (2024) | |
| Mozilla Kraken 1.1 / Total | |
| HP Victus 16 (2024) | |
| Gigabyte G6X 9KG (2024) | |
| Sınıf ortalaması Gaming (409 - 674, n=139, son 2 yıl) | |
| Lenovo Legion Pro 5 16IRX9 G9 | |
| SCHENKER XMG Pro 16 Studio (Mid 24) | |
| Acer Predator Helios Neo 16 (2024) | |
| Nubia RedMagic Titan 16 Pro | |
| Ortalama Intel Core i9-14900HX, NVIDIA GeForce RTX 4060 Laptop GPU (430 - 439, n=2) | |
* ... daha küçük daha iyidir
| PCMark 10 Score | 7830 puan | |
Yardım | ||
| AIDA64 / Memory Copy | |
| SCHENKER XMG Pro 16 Studio (Mid 24) | |
| Lenovo Legion Pro 5 16IRX9 G9 | |
| Acer Predator Helios Neo 16 (2024) | |
| Ortalama Intel Core i9-14900HX (38028 - 83392, n=36) | |
| HP Victus 16 (2024) | |
| Sınıf ortalaması Gaming (21750 - 97515, n=147, son 2 yıl) | |
| Gigabyte G6X 9KG (2024) | |
| Nubia RedMagic Titan 16 Pro | |
| AIDA64 / Memory Read | |
| Lenovo Legion Pro 5 16IRX9 G9 | |
| SCHENKER XMG Pro 16 Studio (Mid 24) | |
| Acer Predator Helios Neo 16 (2024) | |
| Ortalama Intel Core i9-14900HX (43306 - 87568, n=36) | |
| HP Victus 16 (2024) | |
| Sınıf ortalaması Gaming (22956 - 102937, n=147, son 2 yıl) | |
| Gigabyte G6X 9KG (2024) | |
| Nubia RedMagic Titan 16 Pro | |
| AIDA64 / Memory Write | |
| Lenovo Legion Pro 5 16IRX9 G9 | |
| SCHENKER XMG Pro 16 Studio (Mid 24) | |
| Ortalama Intel Core i9-14900HX (37146 - 80589, n=36) | |
| Acer Predator Helios Neo 16 (2024) | |
| Sınıf ortalaması Gaming (22297 - 108954, n=147, son 2 yıl) | |
| HP Victus 16 (2024) | |
| Gigabyte G6X 9KG (2024) | |
| Nubia RedMagic Titan 16 Pro | |
| AIDA64 / Memory Latency | |
| HP Victus 16 (2024) | |
| Sınıf ortalaması Gaming (59.5 - 259, n=147, son 2 yıl) | |
| Acer Predator Helios Neo 16 (2024) | |
| Gigabyte G6X 9KG (2024) | |
| Ortalama Intel Core i9-14900HX (76.1 - 105, n=36) | |
| SCHENKER XMG Pro 16 Studio (Mid 24) | |
| Lenovo Legion Pro 5 16IRX9 G9 | |
| Nubia RedMagic Titan 16 Pro | |
* ... daha küçük daha iyidir
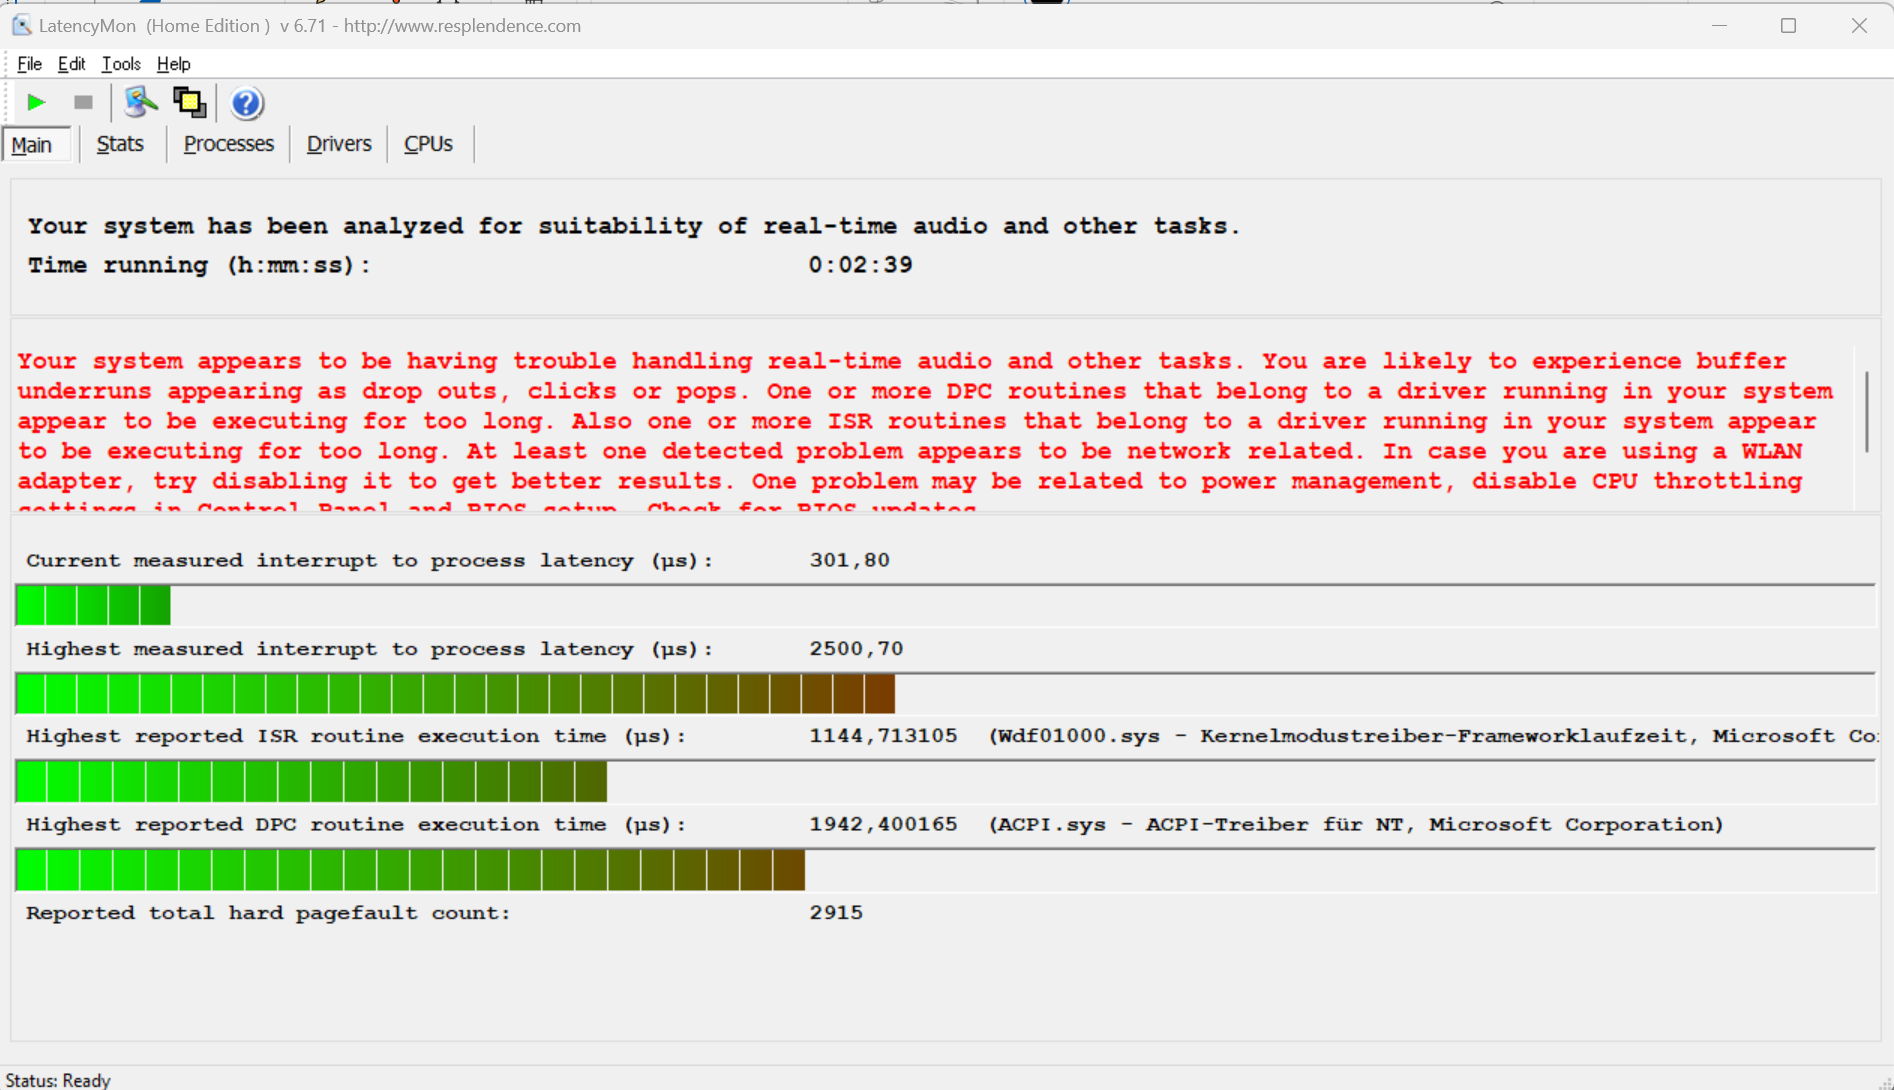
DPC gecikme süreleri
Yüksek gecikme süreleri, gerçek zamanlı video ve ses düzenlemesini engeller. Gelecekteki yazılım güncellemeleri iyileştirmelere ve hatta kötüleşmelere yol açabilir.
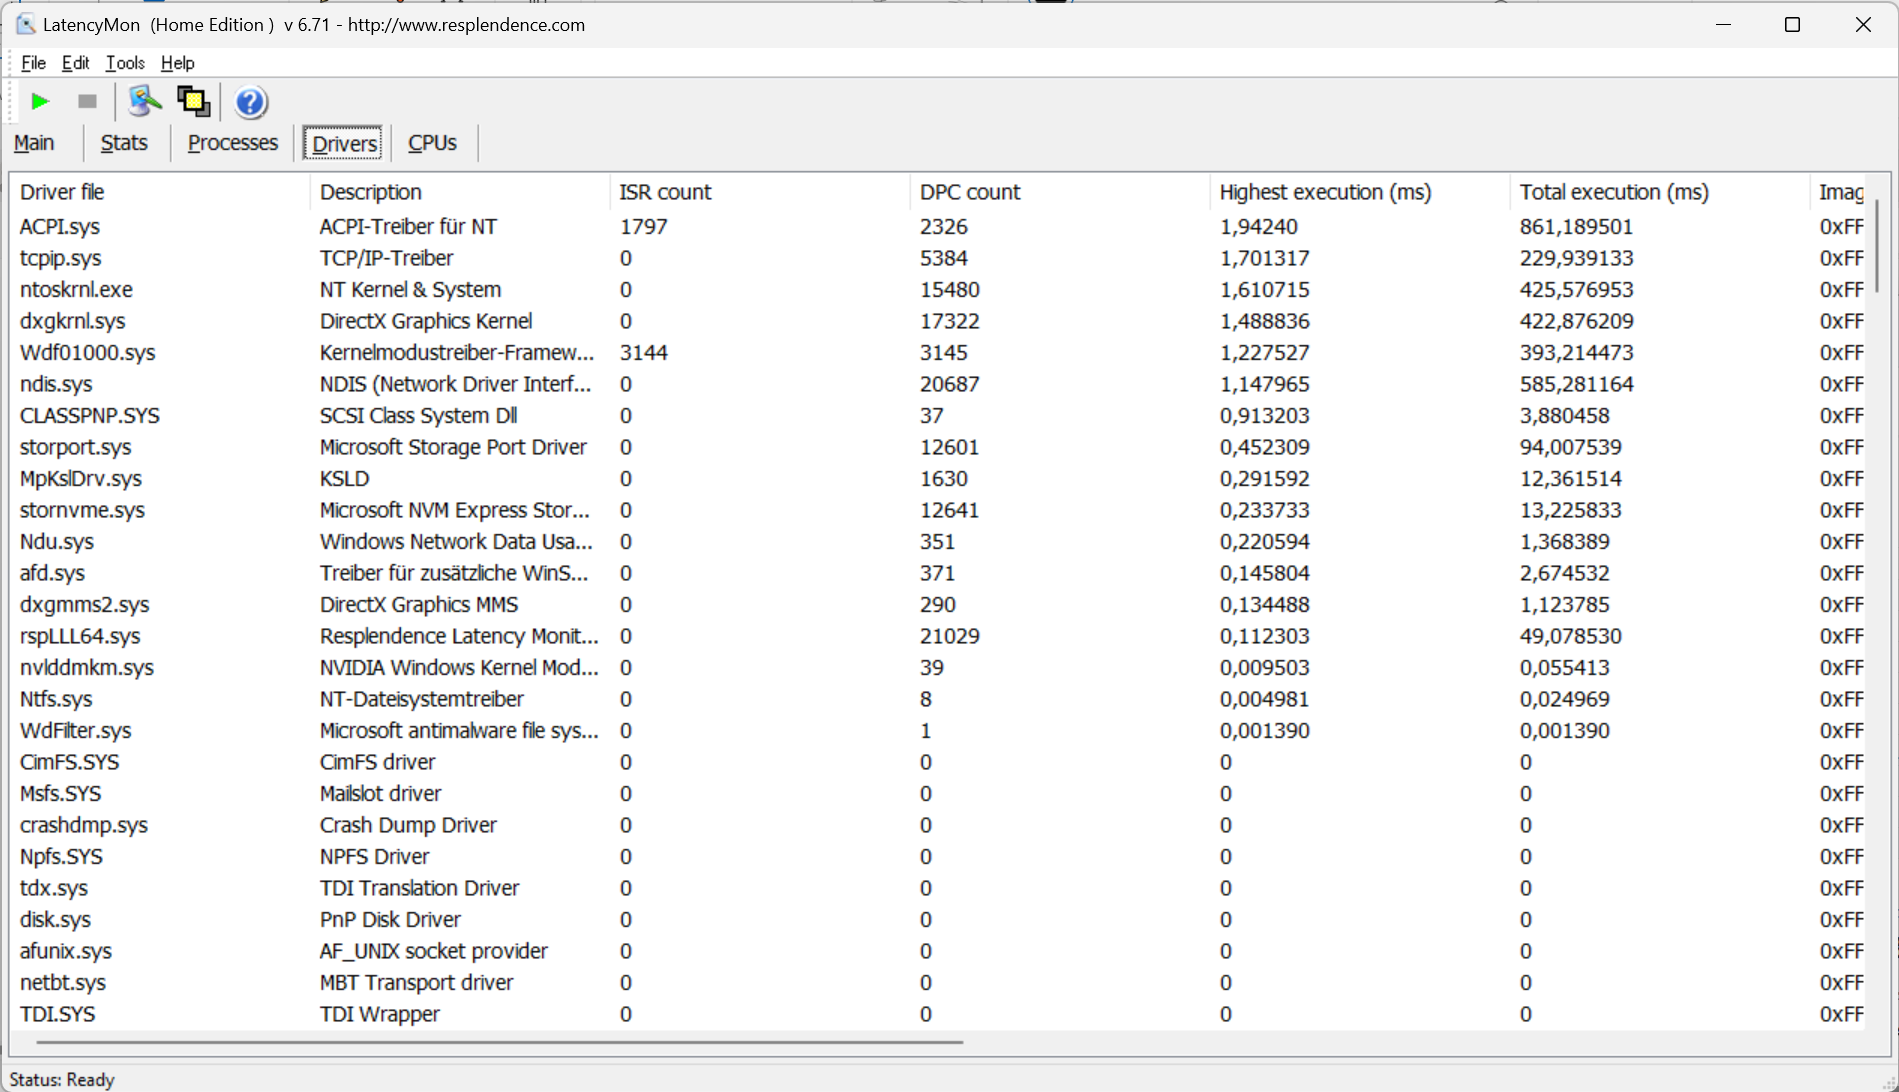
| DPC Latencies / LatencyMon - interrupt to process latency (max), Web, Youtube, Prime95 | |
| Nubia RedMagic Titan 16 Pro | |
| Gigabyte G6X 9KG (2024) | |
| SCHENKER XMG Pro 16 Studio (Mid 24) | |
| Acer Predator Helios Neo 16 (2024) | |
| Lenovo Legion Pro 5 16IRX9 G9 | |
| HP Victus 16 (2024) | |
* ... daha küçük daha iyidir
Depolama cihazları
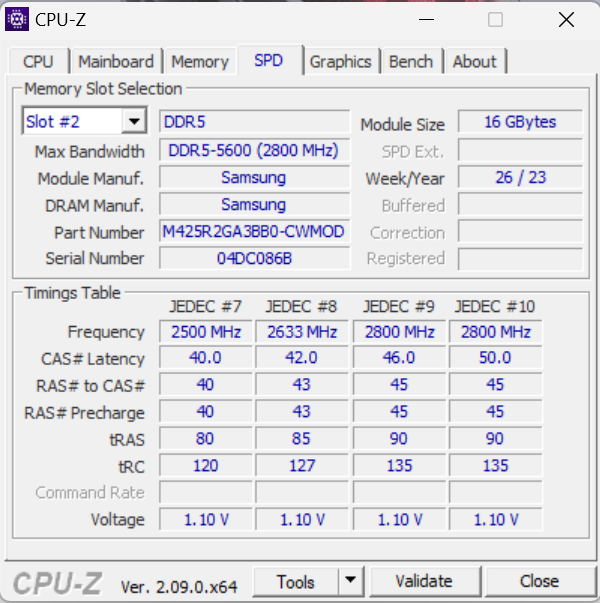
Samsung'un PCIe 4 SSD'si (M.2-2280) 1 TB depolama kapasitesi sunar ve çok iyi veri hızları sağlar. Olumlu: Termal kaynaklı bir yavaşlama gözlemlemedik. Dizüstü bilgisayarda ikinci bir PCIe 4 SSD için yer vardır.

* ... daha küçük daha iyidir
Reading continuous performance: DiskSpd Read Loop, Queue Depth 8
Grafik kartı
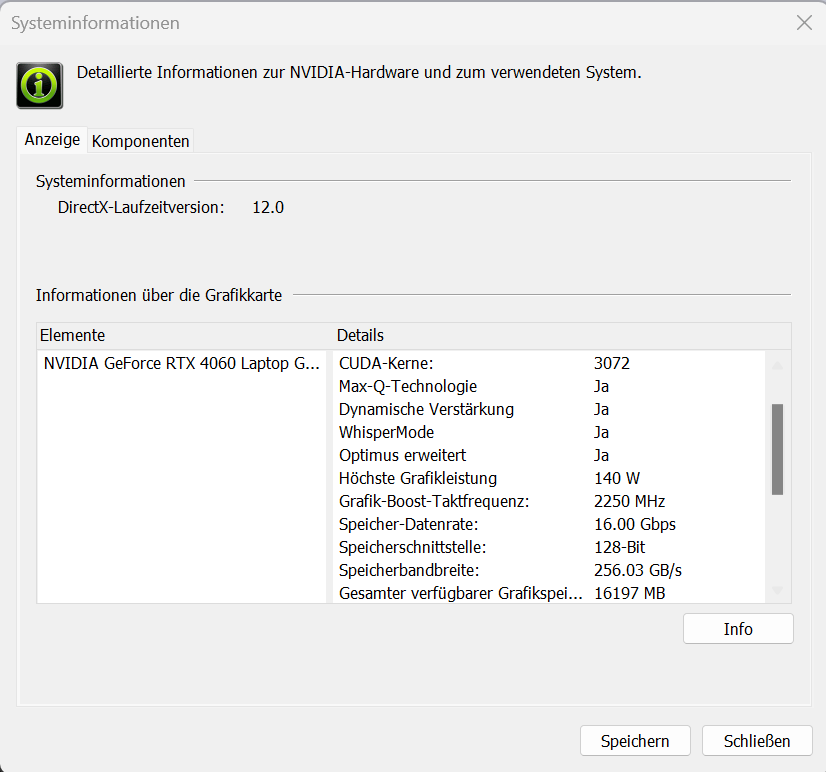
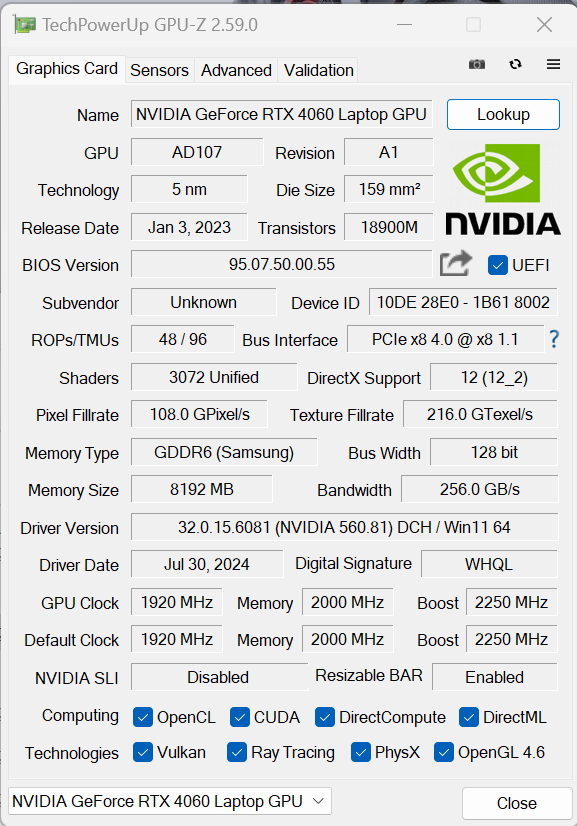
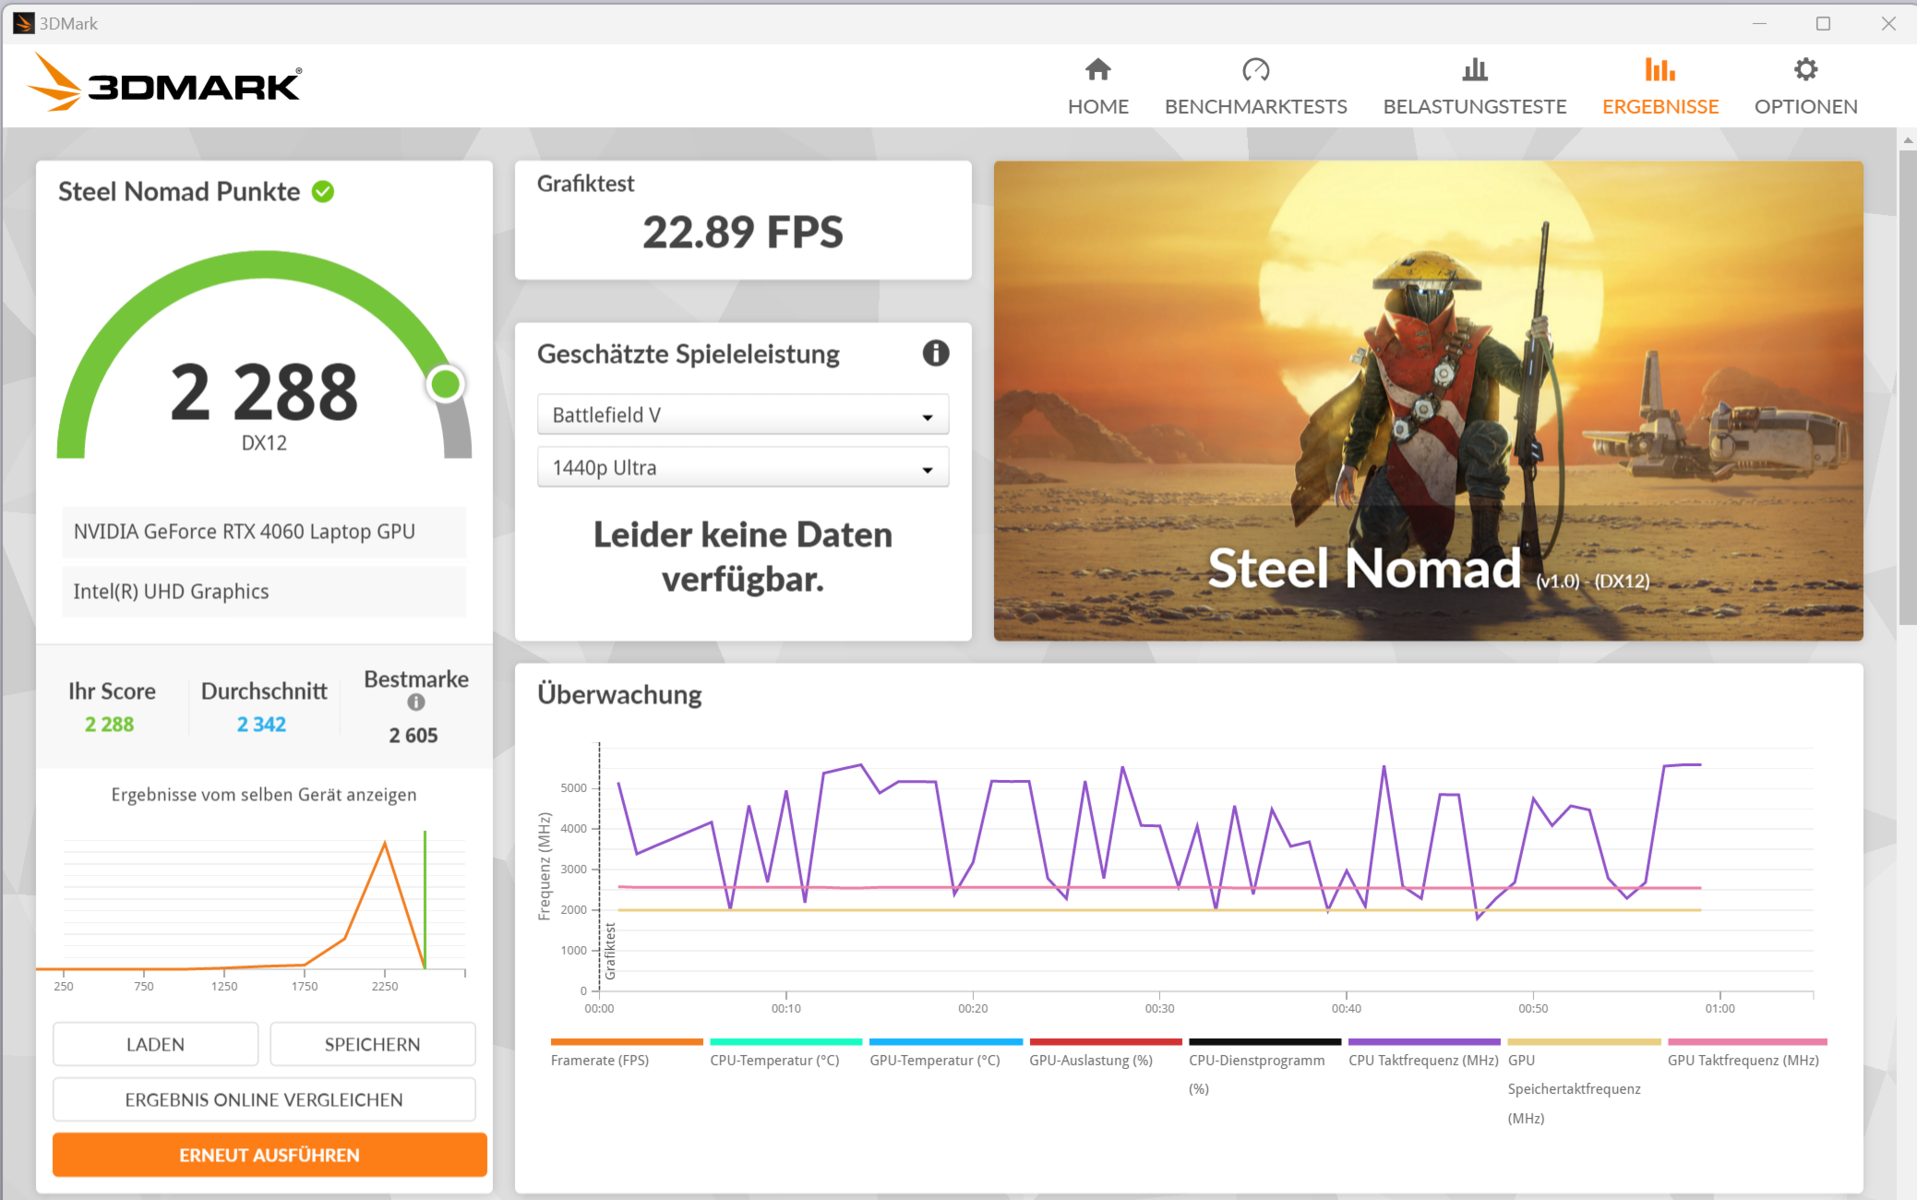
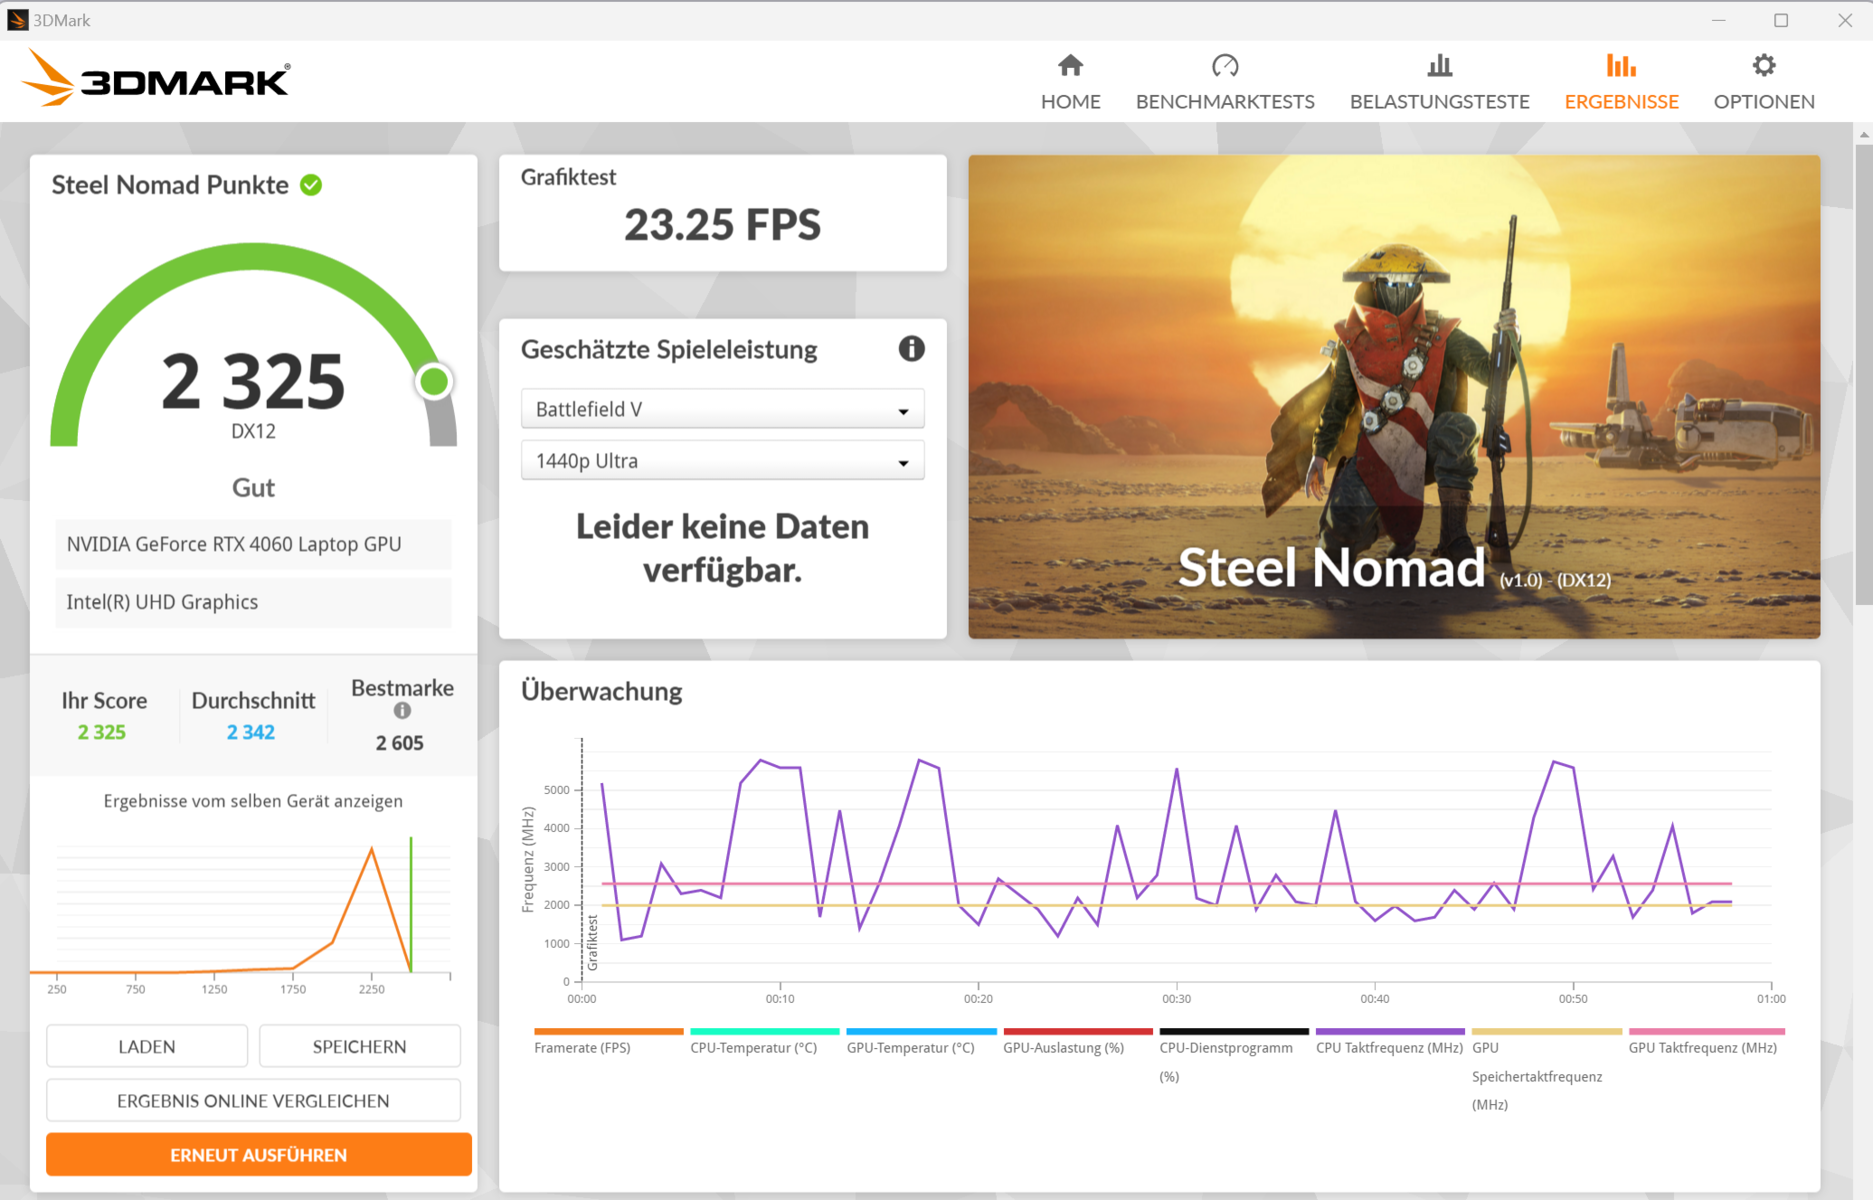
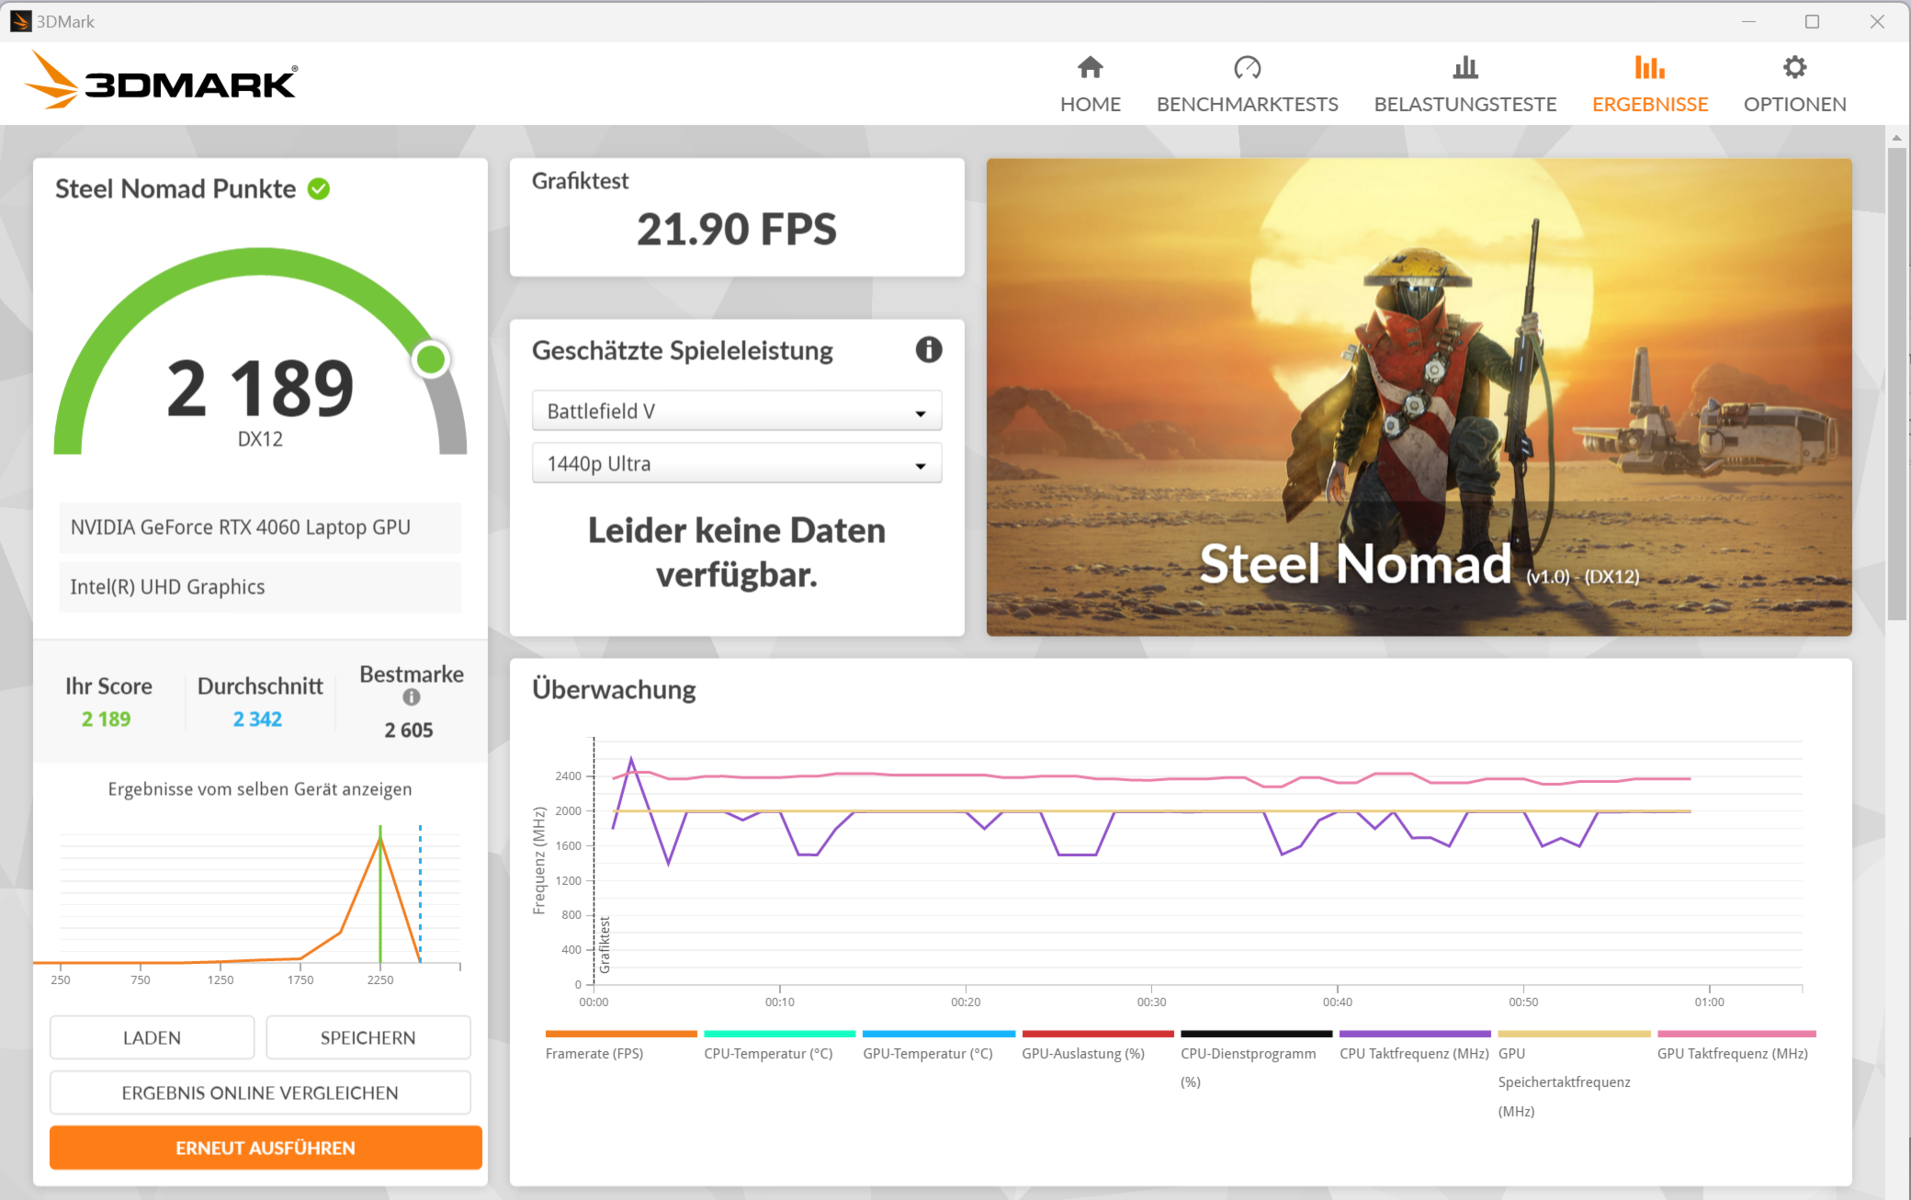
Bu GeForce RTX 4060 (3.072 shader, 128 bit veri yolu, 8 GB GDDR6) şu anda (alt) orta sınıf bir oyun GPU'sudur. Nubia ona maksimum 140 watt TGP veriyor - daha fazlası mümkün değil. Benchmark sonuçları RTX-4060 ortalamasının biraz üzerinde(dengeli mod). Oyun modu bir artışa neden olmaz. DGPU ve Optimus arasında geçiş yapmak yeniden başlatma gerektirmez - Gelişmiş Optimus desteklenir.

| 3DMark Performance Rating - Percent | |
| Acer Predator Helios Neo 16 (2024) | |
| Sınıf ortalaması Gaming | |
| SCHENKER XMG Pro 16 Studio (Mid 24) | |
| Lenovo Legion Pro 5 16IRX9 G9 | |
| Nubia RedMagic Titan 16 Pro | |
| Nubia RedMagic Titan 16 Pro | |
| Gigabyte G6X 9KG (2024) | |
| HP Victus 16 (2024) | |
| Ortalama NVIDIA GeForce RTX 4060 Laptop GPU | |
| 3DMark 11 - 1280x720 Performance GPU | |
| Acer Predator Helios Neo 16 (2024) | |
| Sınıf ortalaması Gaming (10741 - 72178, n=143, son 2 yıl) | |
| SCHENKER XMG Pro 16 Studio (Mid 24) | |
| Lenovo Legion Pro 5 16IRX9 G9 | |
| Nubia RedMagic Titan 16 Pro (Gaming Mode) | |
| Nubia RedMagic Titan 16 Pro | |
| Gigabyte G6X 9KG (2024) | |
| HP Victus 16 (2024) | |
| Ortalama NVIDIA GeForce RTX 4060 Laptop GPU (28136 - 38912, n=57) | |
| 3DMark | |
| 1920x1080 Fire Strike Graphics | |
| Acer Predator Helios Neo 16 (2024) | |
| Sınıf ortalaması Gaming (2913 - 56116, n=155, son 2 yıl) | |
| SCHENKER XMG Pro 16 Studio (Mid 24) | |
| Lenovo Legion Pro 5 16IRX9 G9 | |
| Gigabyte G6X 9KG (2024) | |
| HP Victus 16 (2024) | |
| Nubia RedMagic Titan 16 Pro (Gaming Mode) | |
| Nubia RedMagic Titan 16 Pro | |
| Ortalama NVIDIA GeForce RTX 4060 Laptop GPU (20533 - 29656, n=54) | |
| 2560x1440 Time Spy Graphics | |
| Acer Predator Helios Neo 16 (2024) | |
| Sınıf ortalaması Gaming (2295 - 24599, n=151, son 2 yıl) | |
| SCHENKER XMG Pro 16 Studio (Mid 24) | |
| Lenovo Legion Pro 5 16IRX9 G9 | |
| Nubia RedMagic Titan 16 Pro (Gaming Mode) | |
| Nubia RedMagic Titan 16 Pro | |
| Ortalama NVIDIA GeForce RTX 4060 Laptop GPU (7484 - 11451, n=56) | |
| HP Victus 16 (2024) | |
| Gigabyte G6X 9KG (2024) | |
| 3DMark 06 Standard Score | 55770 puan | |
| 3DMark 11 Performance | 28427 puan | |
| 3DMark Fire Strike Score | 22307 puan | |
| 3DMark Time Spy Score | 10789 puan | |
| 3DMark Steel Nomad Score | 2288 puan | |
Yardım | ||
| Geekbench 6.4 | |
| GPU OpenCL | |
| Acer Predator Helios Neo 16 (2024) (6.2.1) | |
| Sınıf ortalaması Gaming (4321 - 234213, n=118, son 2 yıl) | |
| SCHENKER XMG Pro 16 Studio (Mid 24) (6.2.1) | |
| Nubia RedMagic Titan 16 Pro (6.2.1, Gaming Mode) | |
| Nubia RedMagic Titan 16 Pro (6.2.1) | |
| Gigabyte G6X 9KG (2024) (6.2.1) | |
| HP Victus 16 (2024) (6.2.1) | |
| Ortalama NVIDIA GeForce RTX 4060 Laptop GPU (4321 - 100831, n=40) | |
| Lenovo Legion Pro 5 16IRX9 G9 (6.2.1) | |
| GPU Vulkan | |
| SCHENKER XMG Pro 16 Studio (Mid 24) (6.2.1) | |
| Nubia RedMagic Titan 16 Pro (6.2.1, Gaming Mode) | |
| Gigabyte G6X 9KG (2024) (6.2.1) | |
| Acer Predator Helios Neo 16 (2024) (6.2.1) | |
| HP Victus 16 (2024) (6.2.1) | |
| Sınıf ortalaması Gaming (4286 - 231659, n=110, son 2 yıl) | |
| Nubia RedMagic Titan 16 Pro (6.2.1) | |
| Lenovo Legion Pro 5 16IRX9 G9 (6.2.1) | |
| Ortalama NVIDIA GeForce RTX 4060 Laptop GPU (4286 - 101001, n=36) | |
| V-Ray Benchmark Next 4.10 | |
| GPU | |
| Sınıf ortalaması Gaming (54 - 1317, n=122, son 2 yıl) | |
| Lenovo Legion Pro 5 16IRX9 G9 (v4.10.07 ) | |
| Acer Predator Helios Neo 16 (2024) (v4.10.07 ) | |
| Gigabyte G6X 9KG (2024) (v4.10.07 ) | |
| Nubia RedMagic Titan 16 Pro (v4.10.07 ) | |
| Nubia RedMagic Titan 16 Pro (v4.10.07, Gaming Mode ) | |
| Ortalama NVIDIA GeForce RTX 4060 Laptop GPU (483 - 715, n=46) | |
| HP Victus 16 (2024) (v4.10.07 ) | |
| SCHENKER XMG Pro 16 Studio (Mid 24) (v4.10.07 ) | |
| CPU | |
| Nubia RedMagic Titan 16 Pro (v4.10.07, Gaming Mode) | |
| Lenovo Legion Pro 5 16IRX9 G9 (v4.10.07 ) | |
| SCHENKER XMG Pro 16 Studio (Mid 24) (v4.10.07 ) | |
| Acer Predator Helios Neo 16 (2024) (v4.10.07 ) | |
| HP Victus 16 (2024) (v4.10.07 ) | |
| Sınıf ortalaması Gaming (5413 - 44129, n=122, son 2 yıl) | |
| Ortalama NVIDIA GeForce RTX 4060 Laptop GPU (12680 - 32360, n=46) | |
| Gigabyte G6X 9KG (2024) (v4.10.07 ) | |
| Nubia RedMagic Titan 16 Pro (v4.10.07 ) | |
* ... daha küçük daha iyidir
Oyun performansı
Titan, yüksek ila maksimum ayarlarda QHD oyun için tasarlanmıştır. Kurulu donanım, RTX 4060 ortalamasının biraz üzerinde kare hızları üretir(dengeli mod). Oyun modu, Dota 2 Reborn ve X-Plane 11 gibi daha yüksek CPU performansından yararlanan oyunları çalıştırırken bir artı ile sonuçlanır. Bunun dışında grafik performansı aynıdır.
| Cyberpunk 2077 2.2 Phantom Liberty - 1920x1080 Ultra Preset (FSR off) | |
| Sınıf ortalaması Gaming (6.76 - 158, n=90, son 2 yıl) | |
| Acer Predator Helios Neo 16 (2024) (2.02) | |
| SCHENKER XMG Pro 16 Studio (Mid 24) (2.12) | |
| Lenovo Legion Pro 5 16IRX9 G9 (2.12) | |
| Nubia RedMagic Titan 16 Pro (2.12, Gaming Mode) | |
| Nubia RedMagic Titan 16 Pro (2.12) | |
| Ortalama NVIDIA GeForce RTX 4060 Laptop GPU (56.4 - 93.1, n=31) | |
| Gigabyte G6X 9KG (2024) (2.02) | |
| HP Victus 16 (2024) (2.02) | |
| Final Fantasy XV Benchmark - 1920x1080 High Quality | |
| Acer Predator Helios Neo 16 (2024) (1.3) | |
| SCHENKER XMG Pro 16 Studio (Mid 24) (1.3) | |
| Sınıf ortalaması Gaming (19.2 - 201, n=144, son 2 yıl) | |
| Lenovo Legion Pro 5 16IRX9 G9 (1.3) | |
| Nubia RedMagic Titan 16 Pro (1.3) | |
| Nubia RedMagic Titan 16 Pro (1.3, Gaming Mode ) | |
| Gigabyte G6X 9KG (2024) (1.3) | |
| HP Victus 16 (2024) (1.3) | |
| Ortalama NVIDIA GeForce RTX 4060 Laptop GPU (75.1 - 109.8, n=51) | |
| Strange Brigade - 1920x1080 ultra AA:ultra AF:16 | |
| Sınıf ortalaması Gaming (38.9 - 420, n=140, son 2 yıl) | |
| Acer Predator Helios Neo 16 (2024) (1.47.22.14 D3D12) | |
| SCHENKER XMG Pro 16 Studio (Mid 24) (1.47.22.14 D3D12) | |
| Lenovo Legion Pro 5 16IRX9 G9 (1.47.22.14 D3D12) | |
| Nubia RedMagic Titan 16 Pro (1.47.22.14 D3D12, Gaming Mode ) | |
| Nubia RedMagic Titan 16 Pro (1.47.22.14 D3D12) | |
| Gigabyte G6X 9KG (2024) (1.47.22.14 D3D12) | |
| Ortalama NVIDIA GeForce RTX 4060 Laptop GPU (135.3 - 210, n=50) | |
| HP Victus 16 (2024) (1.47.22.14 D3D12) | |
| Dota 2 Reborn - 1920x1080 ultra (3/3) best looking | |
| Lenovo Legion Pro 5 16IRX9 G9 | |
| Acer Predator Helios Neo 16 (2024) | |
| Nubia RedMagic Titan 16 Pro (Gaming Mode) | |
| SCHENKER XMG Pro 16 Studio (Mid 24) | |
| HP Victus 16 (2024) | |
| Sınıf ortalaması Gaming (65.1 - 220, n=148, son 2 yıl) | |
| Nubia RedMagic Titan 16 Pro | |
| Ortalama NVIDIA GeForce RTX 4060 Laptop GPU (115 - 183.8, n=53) | |
| Gigabyte G6X 9KG (2024) | |
| X-Plane 11.11 - 1920x1080 high (fps_test=3) | |
| Nubia RedMagic Titan 16 Pro (Gaming Mode) | |
| Lenovo Legion Pro 5 16IRX9 G9 | |
| Acer Predator Helios Neo 16 (2024) | |
| SCHENKER XMG Pro 16 Studio (Mid 24) | |
| Nubia RedMagic Titan 16 Pro | |
| Gigabyte G6X 9KG (2024) | |
| Sınıf ortalaması Gaming (32.8 - 166.2, n=151, son 2 yıl) | |
| Ortalama NVIDIA GeForce RTX 4060 Laptop GPU (60.7 - 141.1, n=54) | |
| HP Victus 16 (2024) | |
| Once Human | |
| 1920x1080 Very High Preset | |
| Nubia RedMagic Titan 16 Pro | |
| Ortalama NVIDIA GeForce RTX 4060 Laptop GPU (88.7 - 94.2, n=2) | |
| Sınıf ortalaması Gaming (14.2 - 94.2, n=2, son 2 yıl) | |
| 2560x1440 Very High Preset | |
| Nubia RedMagic Titan 16 Pro | |
| Sınıf ortalaması Gaming (n=1son 2 yıl) | |
| Ortalama NVIDIA GeForce RTX 4060 Laptop GPU (59.1 - 62.3, n=2) | |
| 2560x1440 Very High Preset + Quality FSR | |
| Nubia RedMagic Titan 16 Pro | |
| Ortalama NVIDIA GeForce RTX 4060 Laptop GPU (n=1) | |
| Sınıf ortalaması Gaming (n=1son 2 yıl) | |
| F1 24 | |
| 1920x1080 Ultra High Preset AA:T AF:16x | |
| Sınıf ortalaması Gaming (54.1 - 148, n=19, son 2 yıl) | |
| SCHENKER XMG Pro 16 Studio (Mid 24) | |
| Lenovo Legion Pro 5 16IRX9 G9 | |
| Nubia RedMagic Titan 16 Pro | |
| Ortalama NVIDIA GeForce RTX 4060 Laptop GPU (47.5 - 61.6, n=10) | |
| 2560x1440 Ultra High Preset AA:T AF:16x | |
| Sınıf ortalaması Gaming (36.7 - 100, n=16, son 2 yıl) | |
| SCHENKER XMG Pro 16 Studio (Mid 24) | |
| Nubia RedMagic Titan 16 Pro | |
| Ortalama NVIDIA GeForce RTX 4060 Laptop GPU (24.3 - 38.8, n=6) | |
| 2560x1440 Ultra High Preset + Quality DLSS AF:16x | |
| Sınıf ortalaması Gaming (59.2 - 150.4, n=12, son 2 yıl) | |
| SCHENKER XMG Pro 16 Studio (Mid 24) | |
| Nubia RedMagic Titan 16 Pro | |
| Ortalama NVIDIA GeForce RTX 4060 Laptop GPU (48.6 - 61, n=3) | |
| Ghost of Tsushima | |
| 1920x1080 Very High Preset AA:T | |
| SCHENKER XMG Pro 16 Studio (Mid 24) | |
| Nubia RedMagic Titan 16 Pro | |
| Ortalama NVIDIA GeForce RTX 4060 Laptop GPU (55.6 - 63.4, n=5) | |
| Sınıf ortalaması Gaming (28.5 - 73.7, n=7, son 2 yıl) | |
| 2560x1440 Very High Preset AA:T | |
| SCHENKER XMG Pro 16 Studio (Mid 24) | |
| Nubia RedMagic Titan 16 Pro | |
| Ortalama NVIDIA GeForce RTX 4060 Laptop GPU (41.1 - 47.7, n=3) | |
| Sınıf ortalaması Gaming (22.7 - 56.1, n=5, son 2 yıl) | |
| 2560x1440 Very High Preset + Quality DLSS | |
| SCHENKER XMG Pro 16 Studio (Mid 24) | |
| Sınıf ortalaması Gaming (63.6 - 74.2, n=3, son 2 yıl) | |
| Nubia RedMagic Titan 16 Pro | |
| Ortalama NVIDIA GeForce RTX 4060 Laptop GPU (n=1) | |
| The First Descendant | |
| 1920x1080 Ultra Preset | |
| SCHENKER XMG Pro 16 Studio (Mid 24) | |
| Nubia RedMagic Titan 16 Pro | |
| Ortalama NVIDIA GeForce RTX 4060 Laptop GPU (67.6 - 69.4, n=3) | |
| Sınıf ortalaması Gaming (15.4 - 80, n=5, son 2 yıl) | |
| 2560x1440 Ultra Preset | |
| SCHENKER XMG Pro 16 Studio (Mid 24) | |
| Sınıf ortalaması Gaming (43.7 - 51.2, n=3, son 2 yıl) | |
| Nubia RedMagic Titan 16 Pro | |
| Ortalama NVIDIA GeForce RTX 4060 Laptop GPU (43.5 - 43.7, n=2) | |
| 2560x1440 Ultra Preset + Ultra Ray Tracing + DLSS Quality | |
| SCHENKER XMG Pro 16 Studio (Mid 24) | |
| Sınıf ortalaması Gaming (43.3 - 51.8, n=2, son 2 yıl) | |
| Nubia RedMagic Titan 16 Pro | |
| Ortalama NVIDIA GeForce RTX 4060 Laptop GPU (n=1) | |
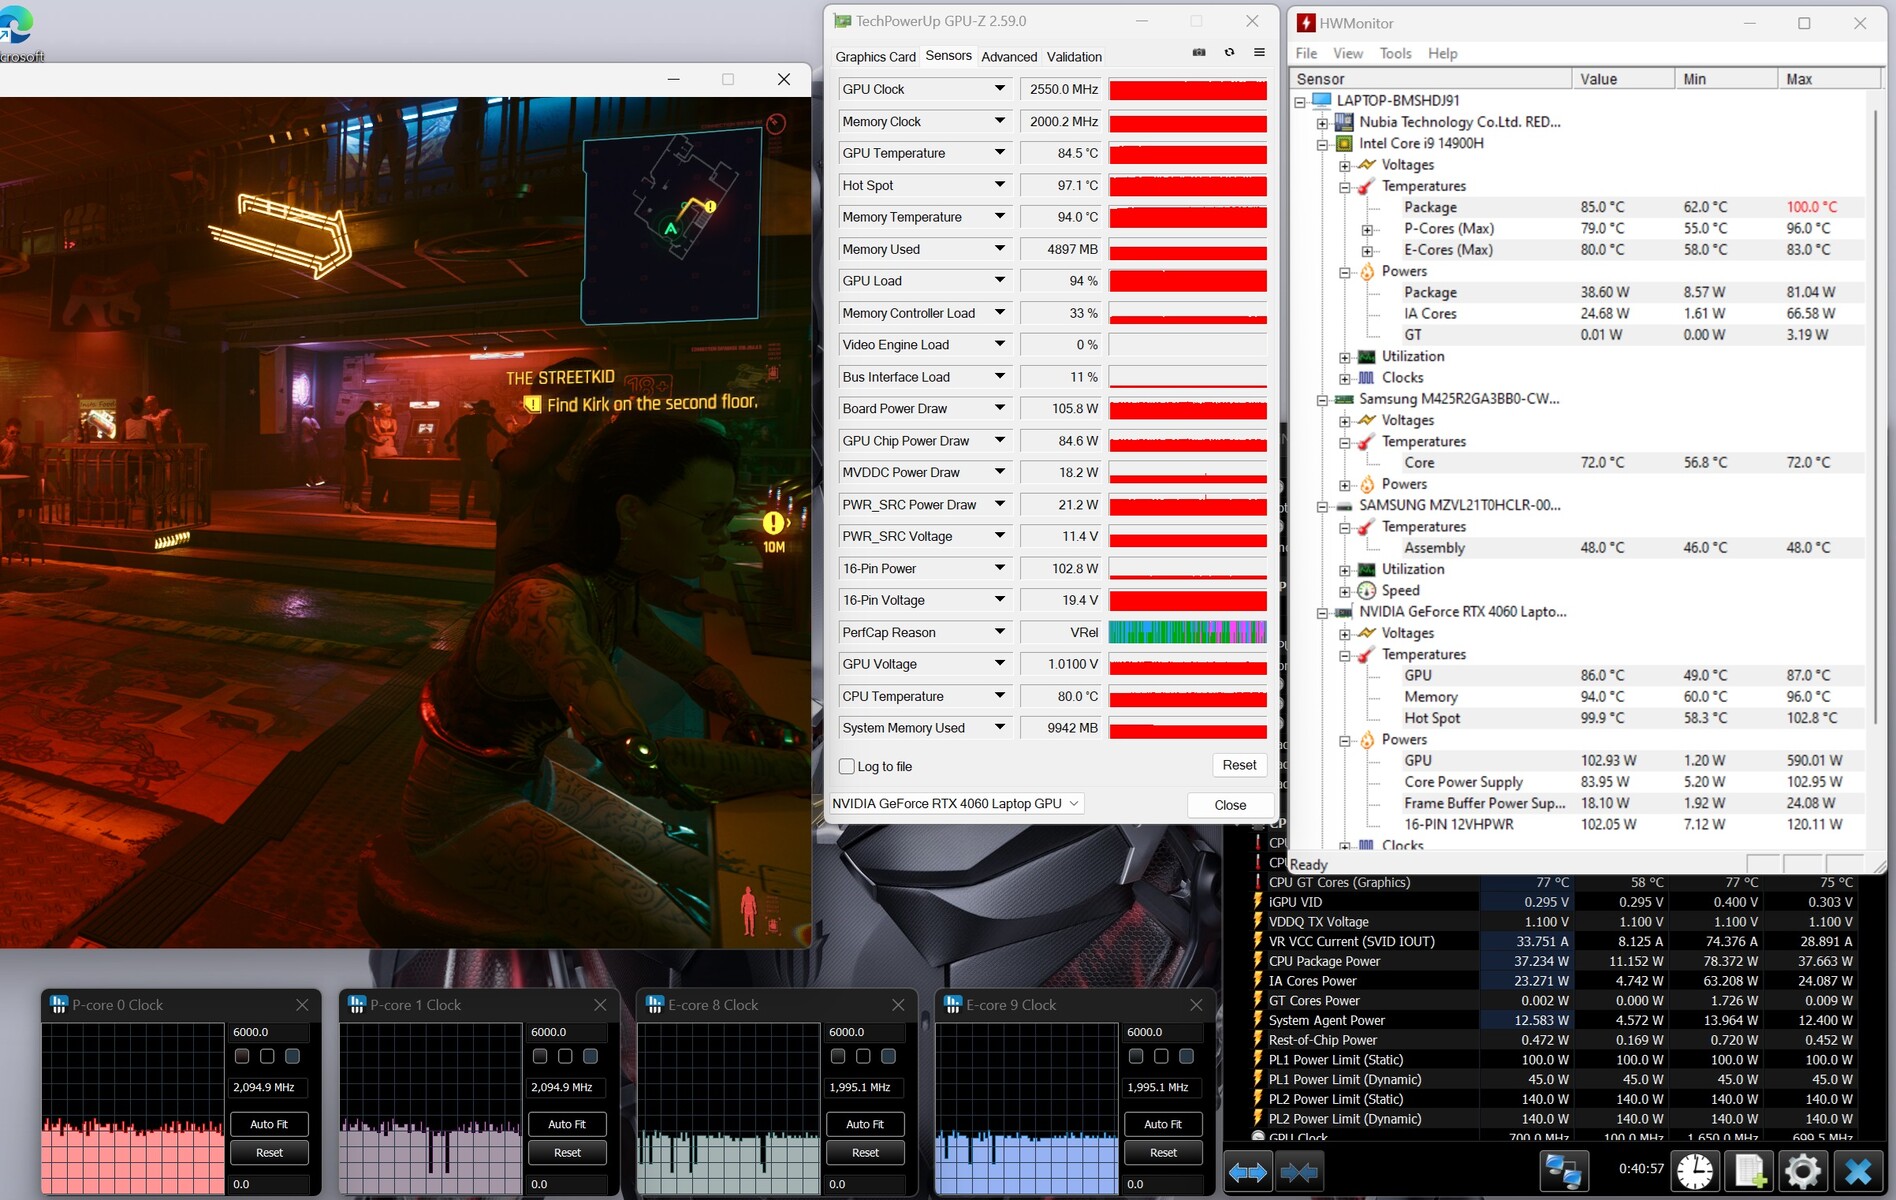
Cyberpunk 2077 Phantom Liberty, 30 dakikalık testimiz sırasında (maksimum ayarlar, FHD) oldukça istikrarlı bir seviyede hafif dalgalanan kare hızları sundu. Performansta fark edilir bir düşüş gözlemlemedik.
Cyberpunk 2077 ultra FPS diagram
| düşük | orta | yüksek | ultra | QHD DLSS | QHD FSR | QHD | |
|---|---|---|---|---|---|---|---|
| GTA V (2015) | 186.1 | 184 | 177.7 | 118.4 | 89.3 | ||
| Dota 2 Reborn (2015) | 206 | 170.9 | 160.2 | 146.9 | |||
| Final Fantasy XV Benchmark (2018) | 199.7 | 146 | 105.4 | 76.9 | |||
| X-Plane 11.11 (2018) | 167 | 142.8 | 117.2 | ||||
| Strange Brigade (2018) | 480 | 277 | 219 | 189.2 | 126.9 | ||
| Baldur's Gate 3 (2023) | 140.3 | 110.8 | 97.5 | 96.5 | 65.9 | ||
| Cyberpunk 2077 2.2 Phantom Liberty (2023) | 121.4 | 101.1 | 86.2 | 74.7 | 46.9 | ||
| Dragon's Dogma 2 (2024) | 71.9 | 67.7 | 52.9 | ||||
| Ghost of Tsushima (2024) | 91.3 | 86.8 | 78.2 | 63.4 | 63.6 | 47.7 | |
| F1 24 (2024) | 243 | 225 | 175.8 | 58.8 | 36.7 | ||
| The First Descendant (2024) | 159 | 100.9 | 80.6 | 69.4 | 43.7 | ||
| Once Human (2024) | 164.8 | 132.9 | 108.3 | 94.2 | 76.5 | 62.3 |
Emisyonlar - Çok gürültülü, çok sıcak
Gürültü emisyonları
Titan hiçbir şekilde sessiz çalışan bir dizüstü bilgisayar değil. Rölanti modunda bile iki fan sürekli olarak duyulabiliyor. Cyberpunk, seviyenin yüksek 50 dB(A)'ya(dengeli mod) veya daha da yüksek 53 dB(A)'ya(oyun modu) çıkmasına neden oldu. Ofis modu 47 dB(A) gibi biraz daha ılımlı bir değerle sonuçlandı. Fanlar pil modunda daha sessizdir ve zaman zaman hareketsiz kalır.
Ses yüksekliği
| Boşta |
| 35 / 36 / 40 dB |
| Çalışırken |
| 49 / 52 dB |
 | ||
30 dB sessiz 40 dB(A) duyulabilirlik 50 dB(A) gürültülü |
||
min: | ||
| Nubia RedMagic Titan 16 Pro NVIDIA GeForce RTX 4060 Laptop GPU, i9-14900HX, Samsung PM9A1 MZVL21T0HCLR | Lenovo Legion Pro 5 16IRX9 G9 NVIDIA GeForce RTX 4060 Laptop GPU, i7-14700HX, Samsung PM9A1 MZVL21T0HCLR | HP Victus 16 (2024) NVIDIA GeForce RTX 4060 Laptop GPU, i7-14700HX, Kioxia XG8 KXG80ZNV512G | Acer Predator Helios Neo 16 (2024) NVIDIA GeForce RTX 4070 Laptop GPU, i7-14700HX, Samsung PM9A1a MZVL21T0HDLU | SCHENKER XMG Pro 16 Studio (Mid 24) NVIDIA GeForce RTX 4070 Laptop GPU, i9-14900HX, Samsung 990 Pro 1 TB | Gigabyte G6X 9KG (2024) NVIDIA GeForce RTX 4060 Laptop GPU, i7-13650HX, Gigabyte AG450E1024-SI | |
|---|---|---|---|---|---|---|
| Noise | 17% | 13% | 10% | 5% | 5% | |
| kapalı / ortam * | 26 | 23 12% | 25 4% | 25.2 3% | 25 4% | 26 -0% |
| Idle Minimum * | 35 | 23 34% | 28 20% | 27.8 21% | 28 20% | 30 14% |
| Idle Average * | 36 | 23 36% | 29 19% | 32 11% | 31 14% | 32 11% |
| Idle Maximum * | 40 | 25 37% | 33 17% | 29.6 26% | 35 12% | 35 12% |
| Load Average * | 49 | 45.18 8% | 45 8% | 45.2 8% | 52 -6% | 51 -4% |
| Cyberpunk 2077 ultra * | 50 | 52.69 -5% | 53 -6% | |||
| Load Maximum * | 52 | 53.13 -2% | 48 8% | 55.8 -7% | 52 -0% | 54 -4% |
| Witcher 3 ultra * | 43 | 51 |
* ... daha küçük daha iyidir
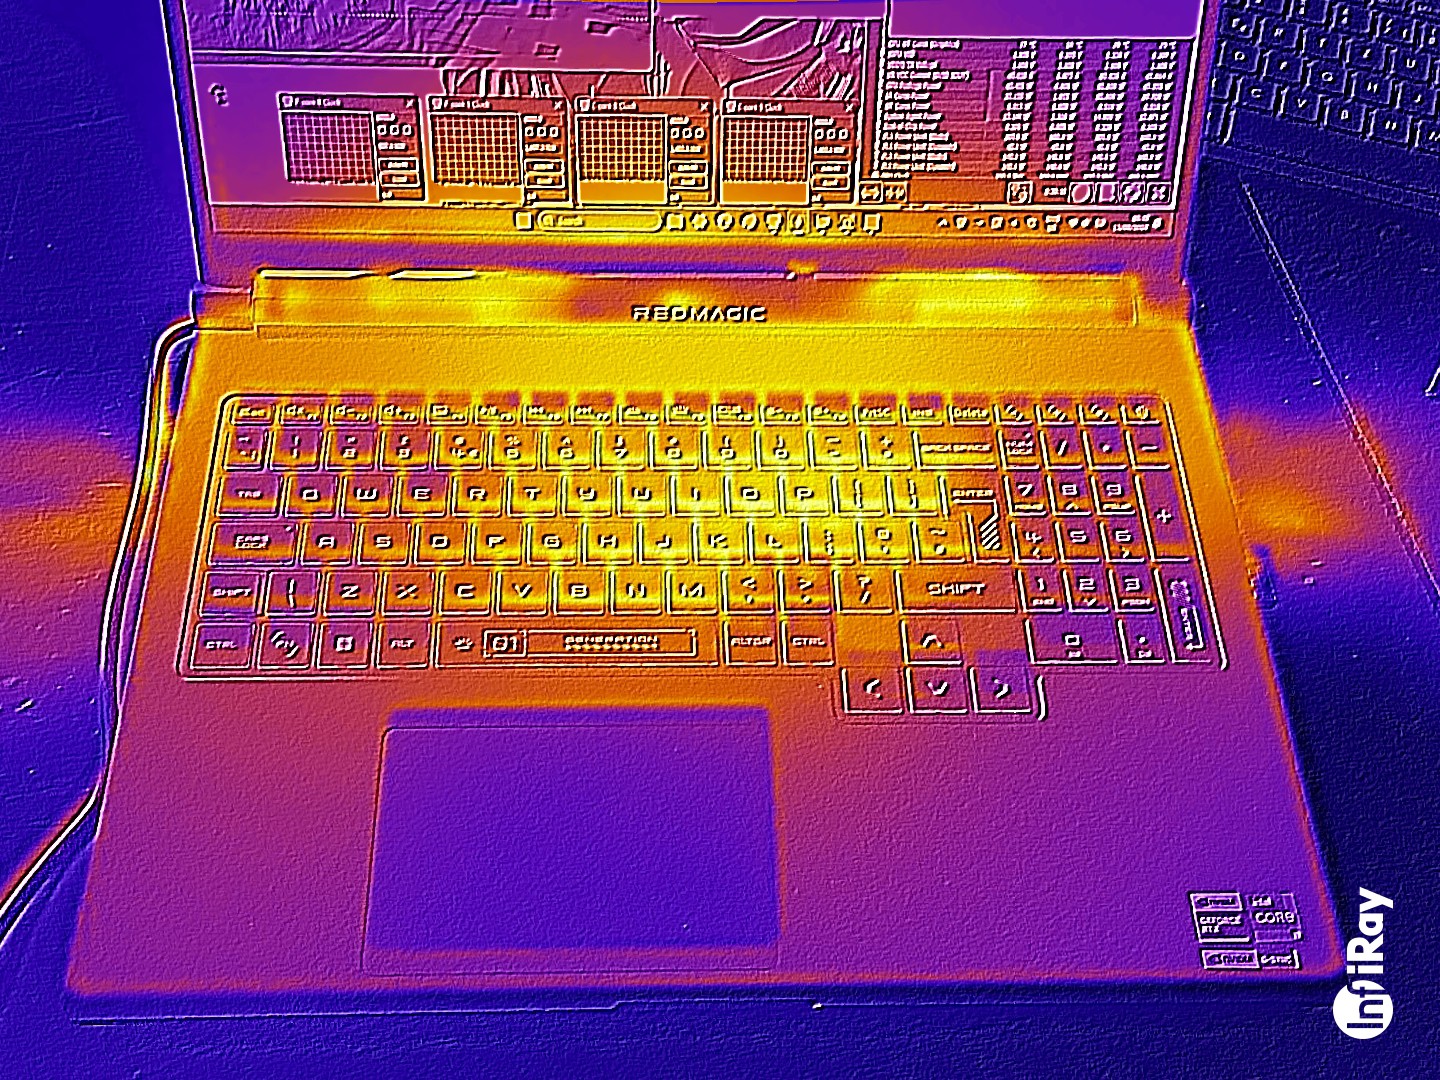
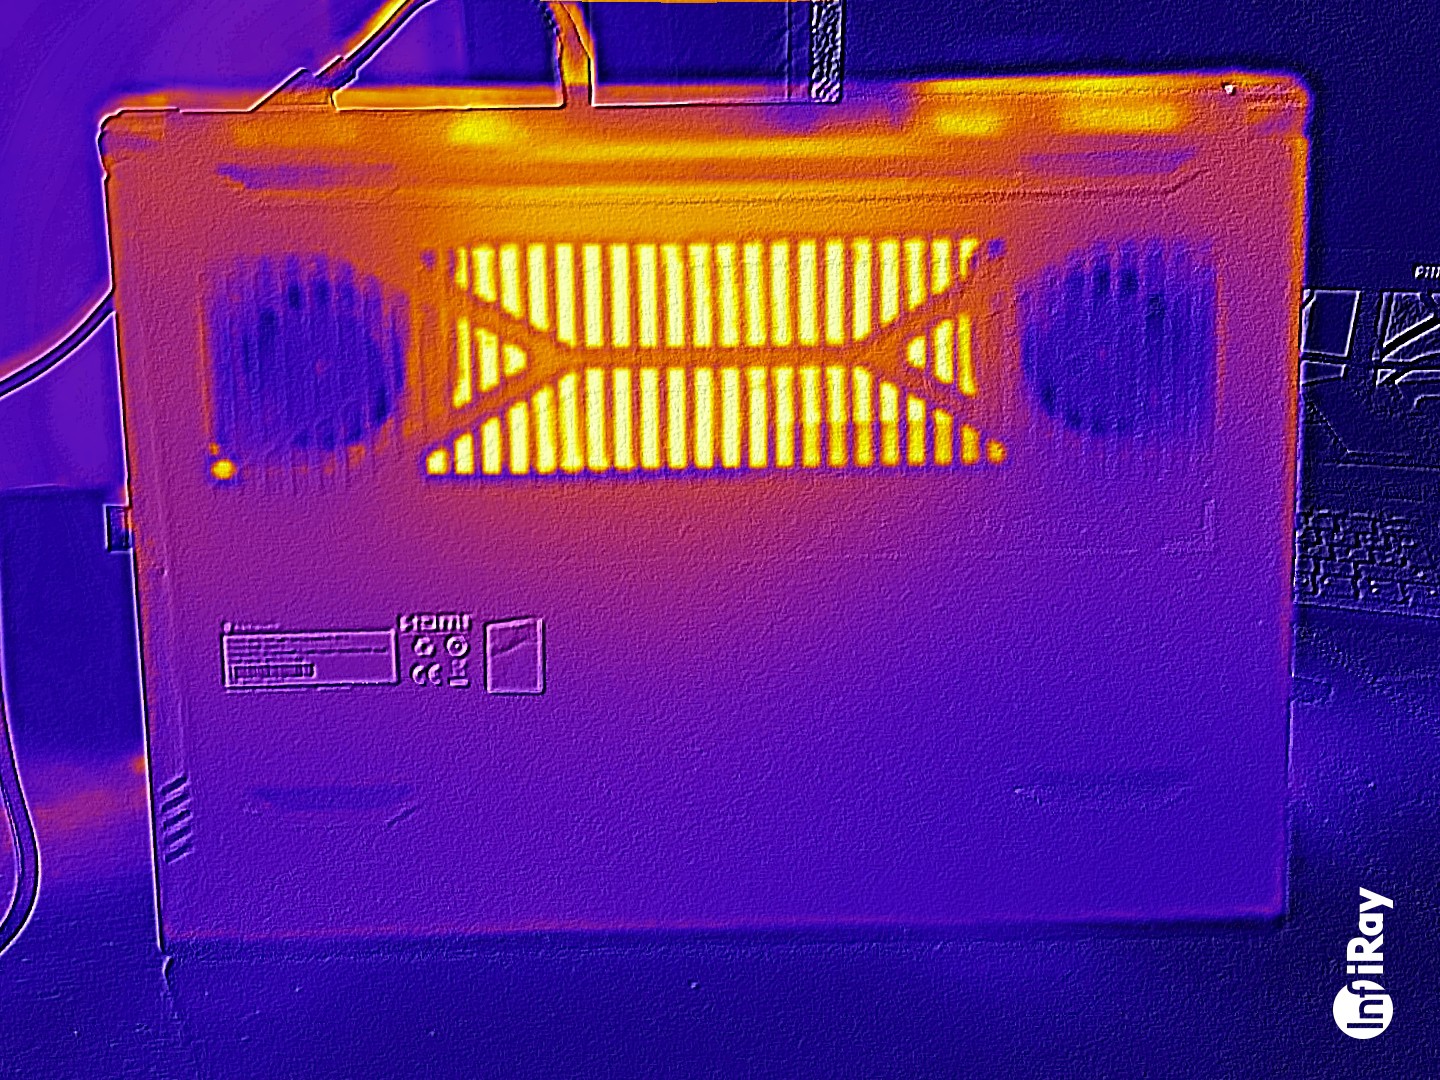
Sıcaklık
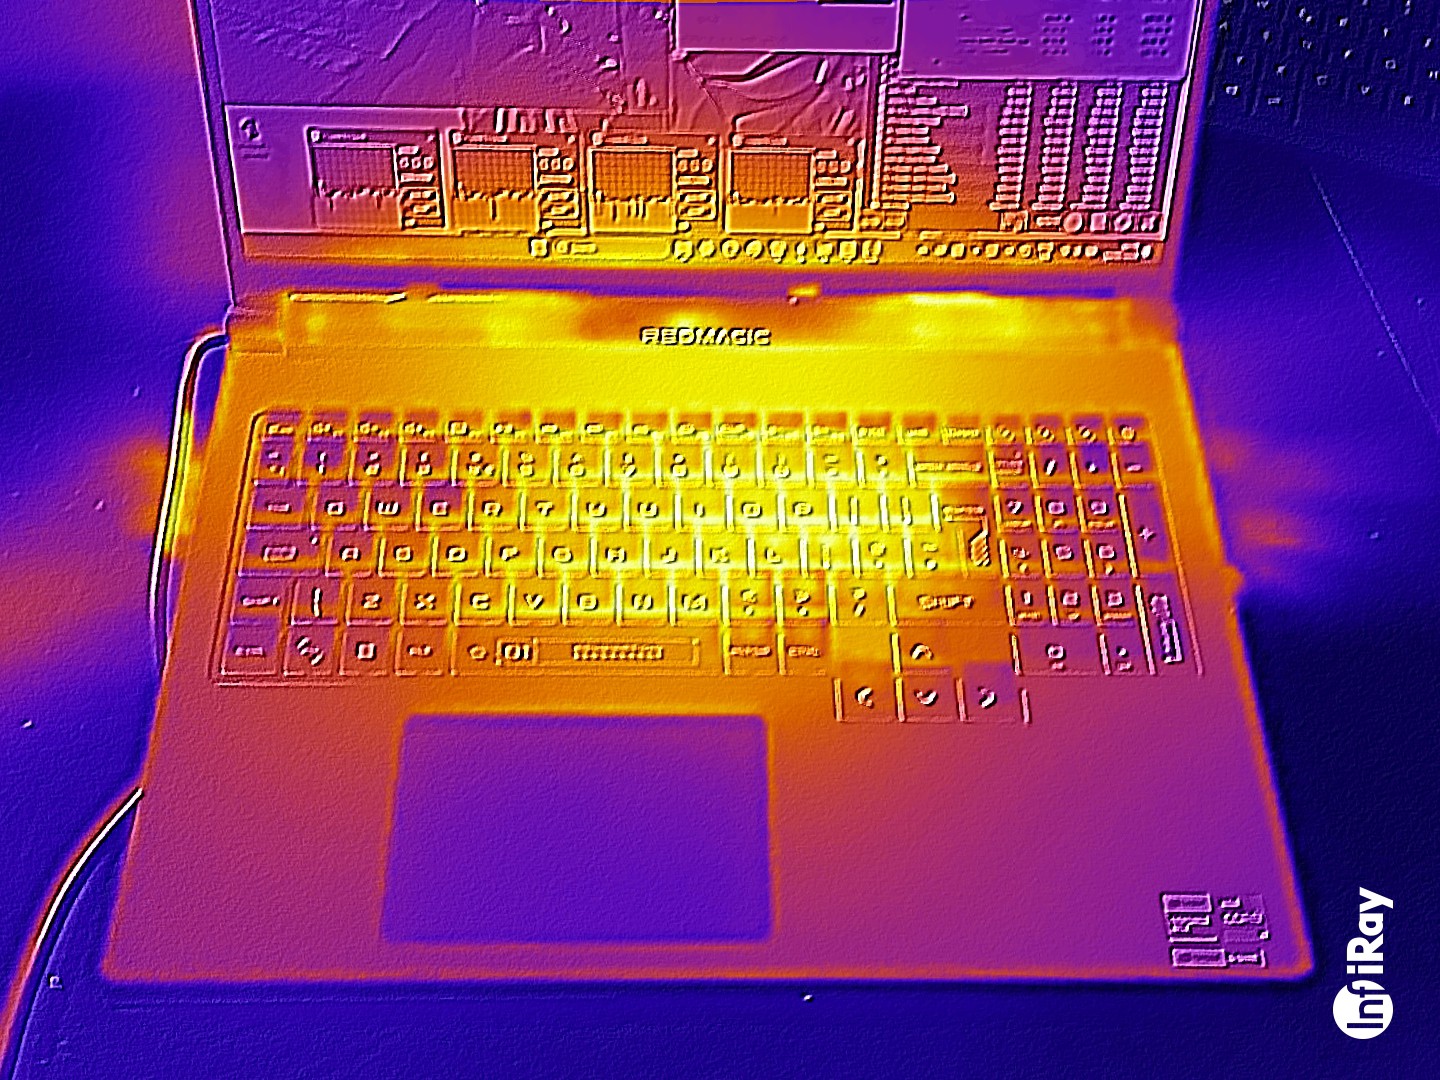
Dizüstü bilgisayar yük altında önemli ölçüde ısınıyor: Cyberpunk 2077 ve stres testi belirli noktalarda 50 santigrat derecenin üzerinde sıcaklıklara neden oldu. Avuç içi dayanağının sıcaklıkları bazen neredeyse çok sıcaktı. Boş modda da ortalamanın üzerinde değerler kaydettik.
(-) Üst taraftaki maksimum sıcaklık, 40.4 °C / 105 F ortalamasına kıyasla 50 °C / 122 F'dir. , Gaming sınıfı için 21.2 ile 68.8 °C arasında değişir.
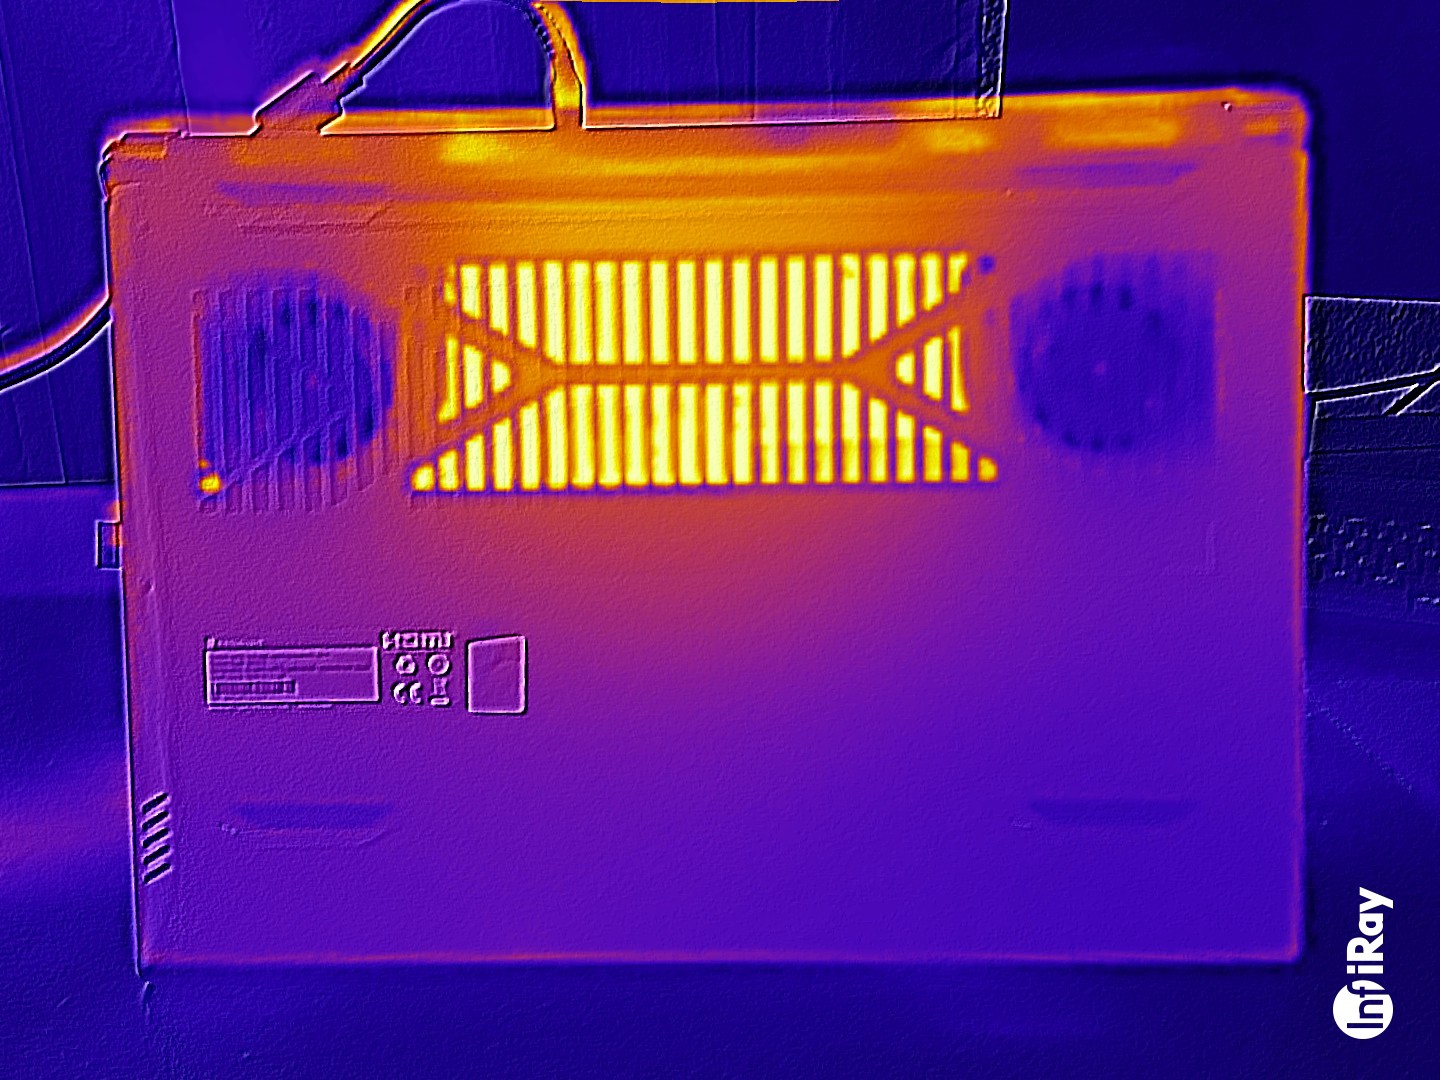
(-) Alt kısım, 43.2 °C / 110 F ortalamasına kıyasla maksimum 58 °C / 136 F'ye kadar ısınır
(+) Boşta kullanımda, üst tarafın ortalama sıcaklığı 30.4 °C / 87 F olup, cihazın 33.9 °C / 93 F.
(-) 3: The average temperature for the upper side is 45.1 °C / 113 F, compared to the average of 33.9 °C / 93 F for the class Gaming.
(-) Avuç içi dayanakları ve dokunmatik yüzey maksimum 40 °C / 104 F ile dokunulamayacak kadar ısınabilir.
(-) Benzer cihazların avuç içi dayanağı alanının ortalama sıcaklığı 28.9 °C / 84 F (-11.1 °C / -20 F) idi.
| Nubia RedMagic Titan 16 Pro Intel Core i9-14900HX, NVIDIA GeForce RTX 4060 Laptop GPU | Lenovo Legion Pro 5 16IRX9 G9 Intel Core i7-14700HX, NVIDIA GeForce RTX 4060 Laptop GPU | HP Victus 16 (2024) Intel Core i7-14700HX, NVIDIA GeForce RTX 4060 Laptop GPU | Acer Predator Helios Neo 16 (2024) Intel Core i7-14700HX, NVIDIA GeForce RTX 4070 Laptop GPU | SCHENKER XMG Pro 16 Studio (Mid 24) Intel Core i9-14900HX, NVIDIA GeForce RTX 4070 Laptop GPU | Gigabyte G6X 9KG (2024) Intel Core i7-13650HX, NVIDIA GeForce RTX 4060 Laptop GPU | |
|---|---|---|---|---|---|---|
| Heat | -9% | 13% | -3% | -13% | 6% | |
| Maximum Upper Side * | 50 | 50 -0% | 50 -0% | 58 -16% | 51 -2% | 41 18% |
| Maximum Bottom * | 58 | 57 2% | 50 14% | 45.2 22% | 66 -14% | 43 26% |
| Idle Upper Side * | 31 | 36 -16% | 25 19% | 31.1 -0% | 35 -13% | 32 -3% |
| Idle Bottom * | 32 | 39 -22% | 26 19% | 37.2 -16% | 39 -22% | 37 -16% |
* ... daha küçük daha iyidir
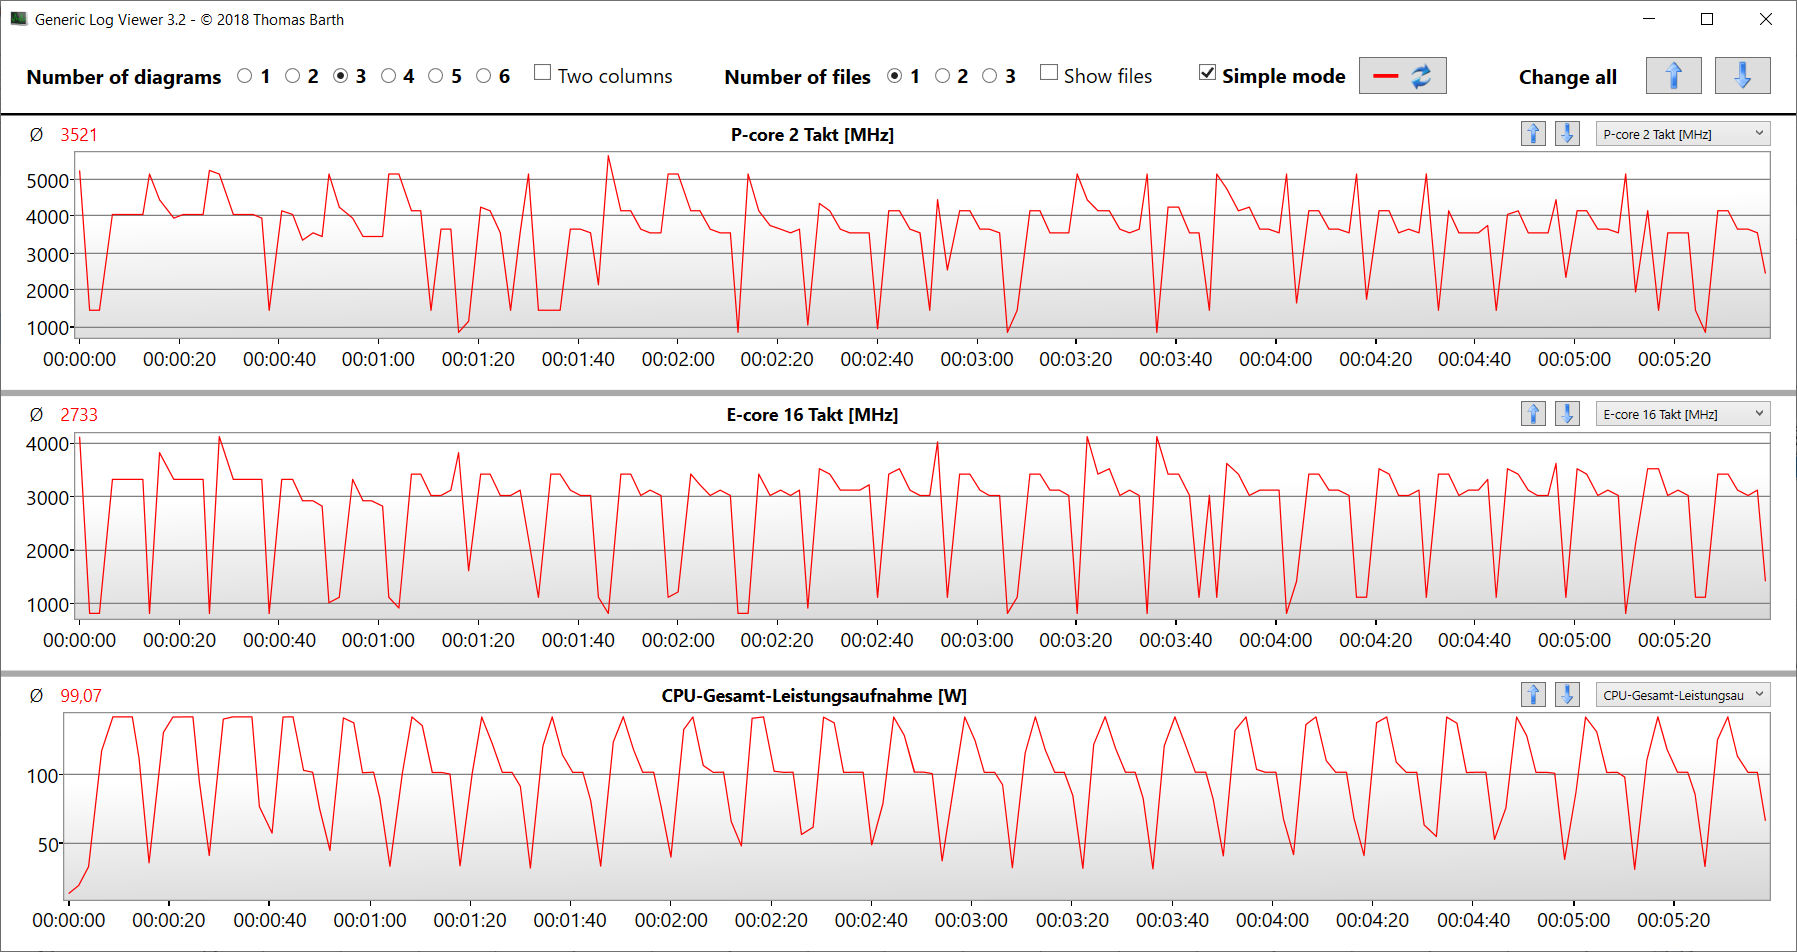
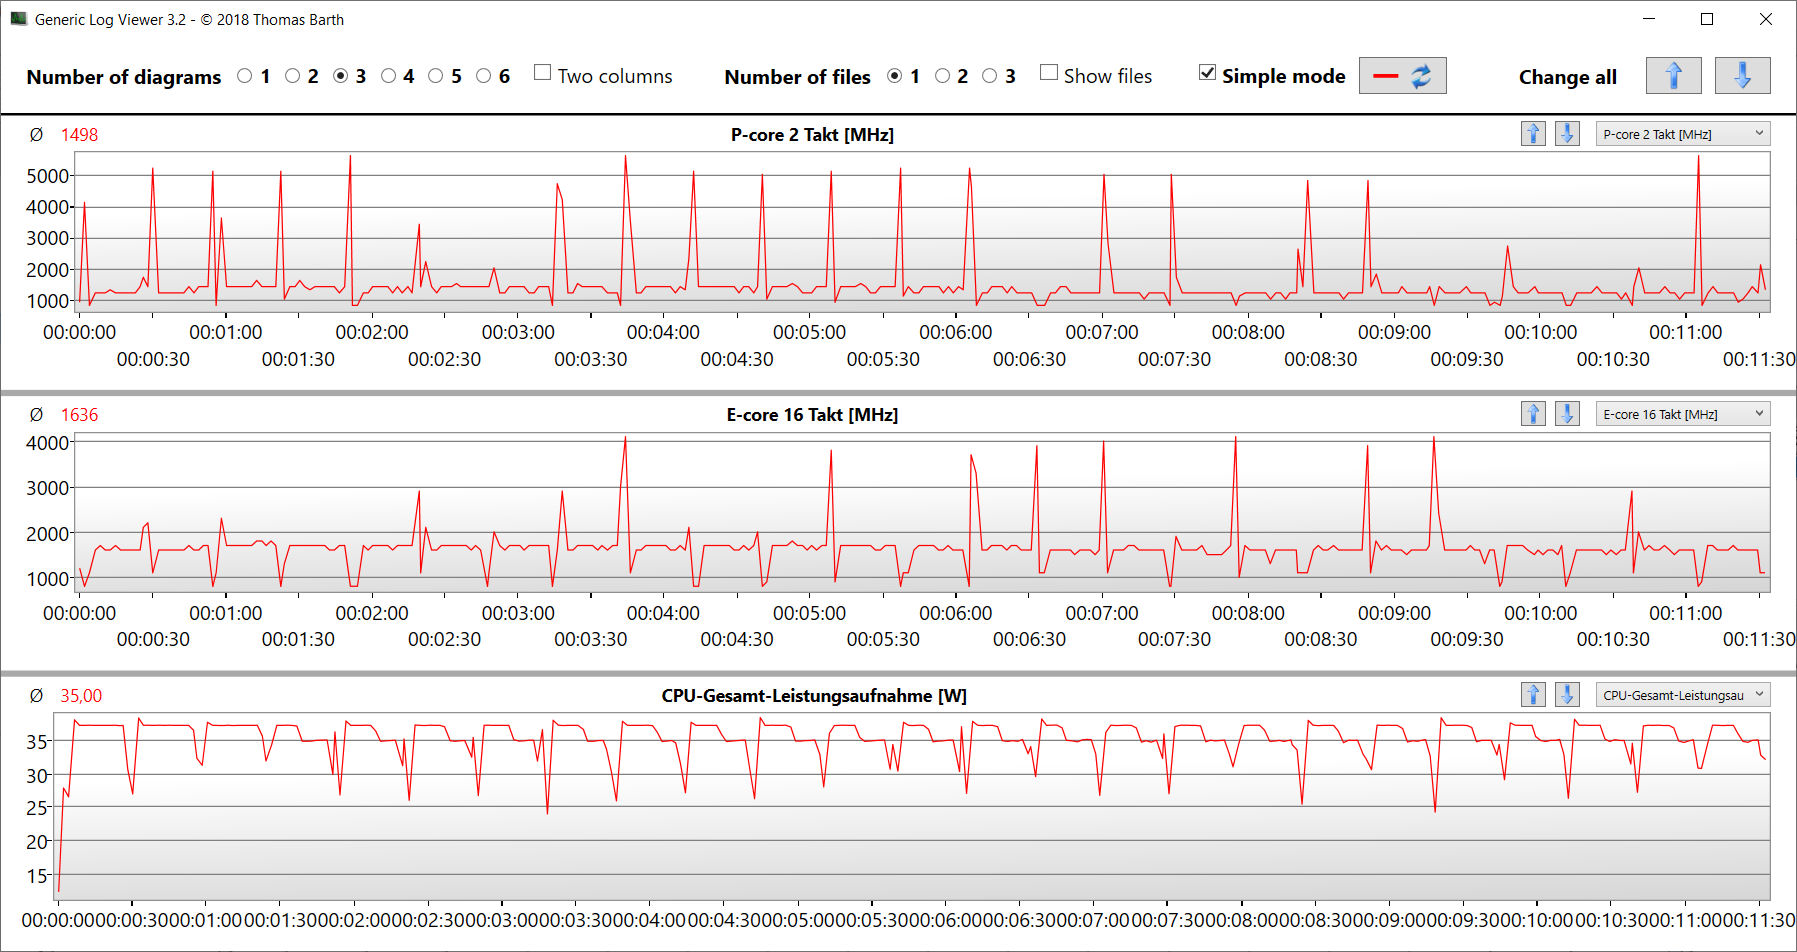
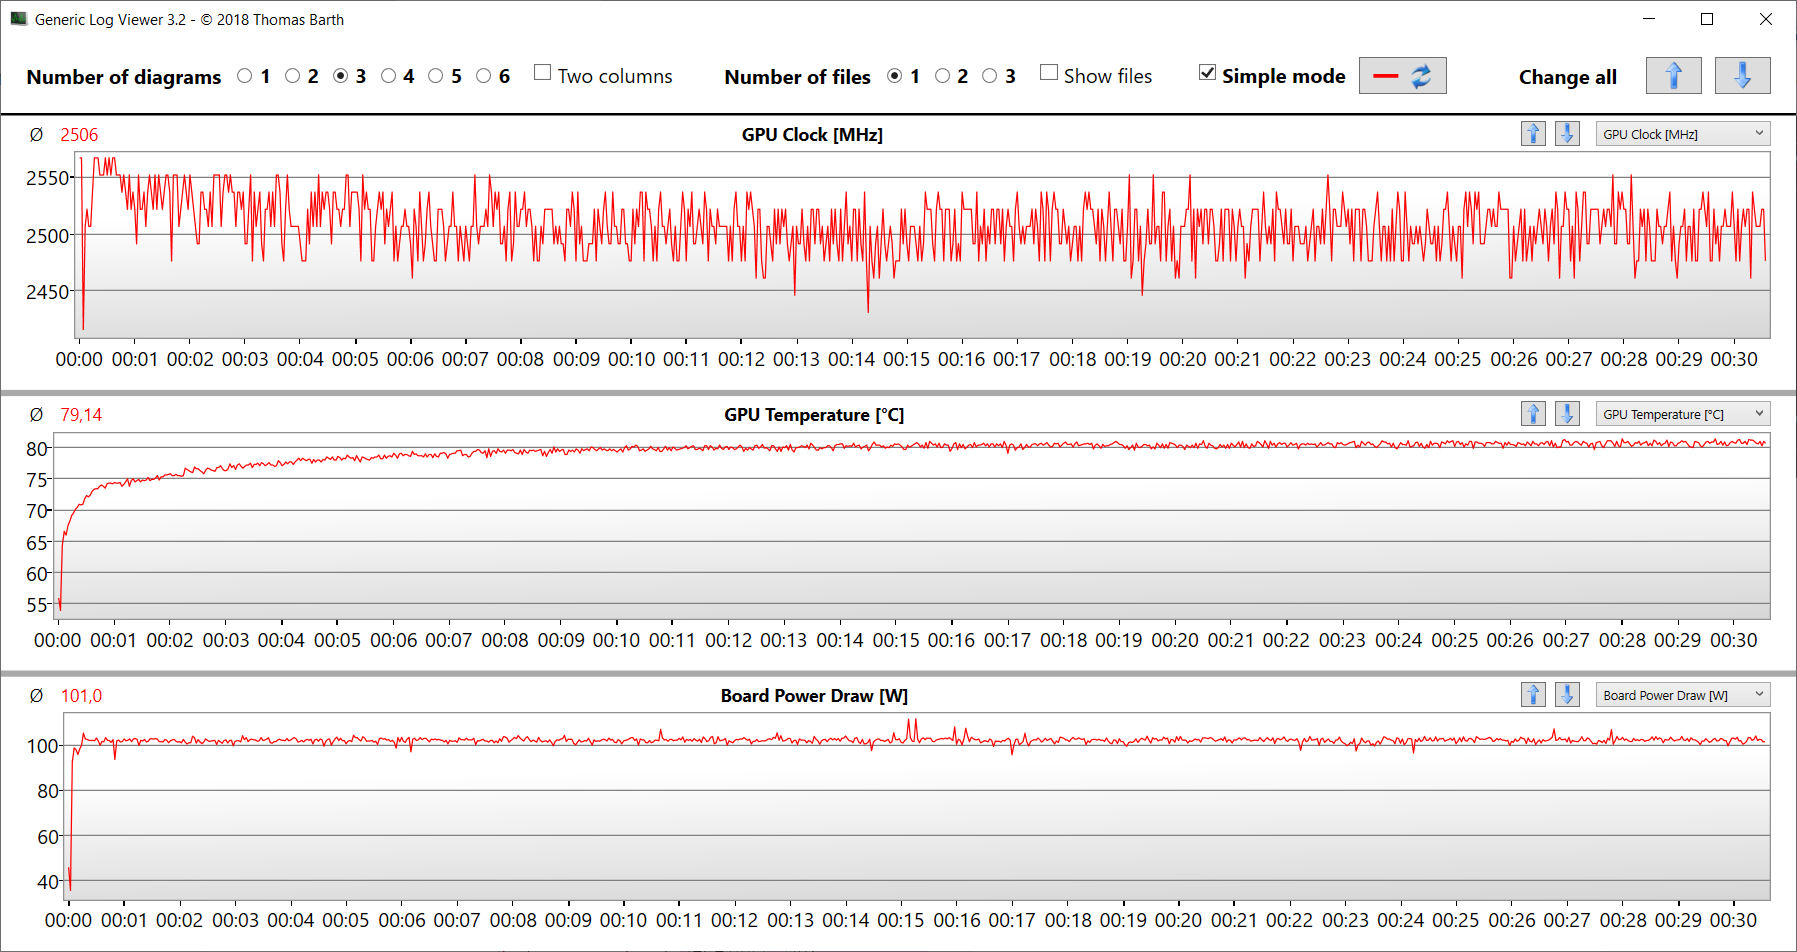
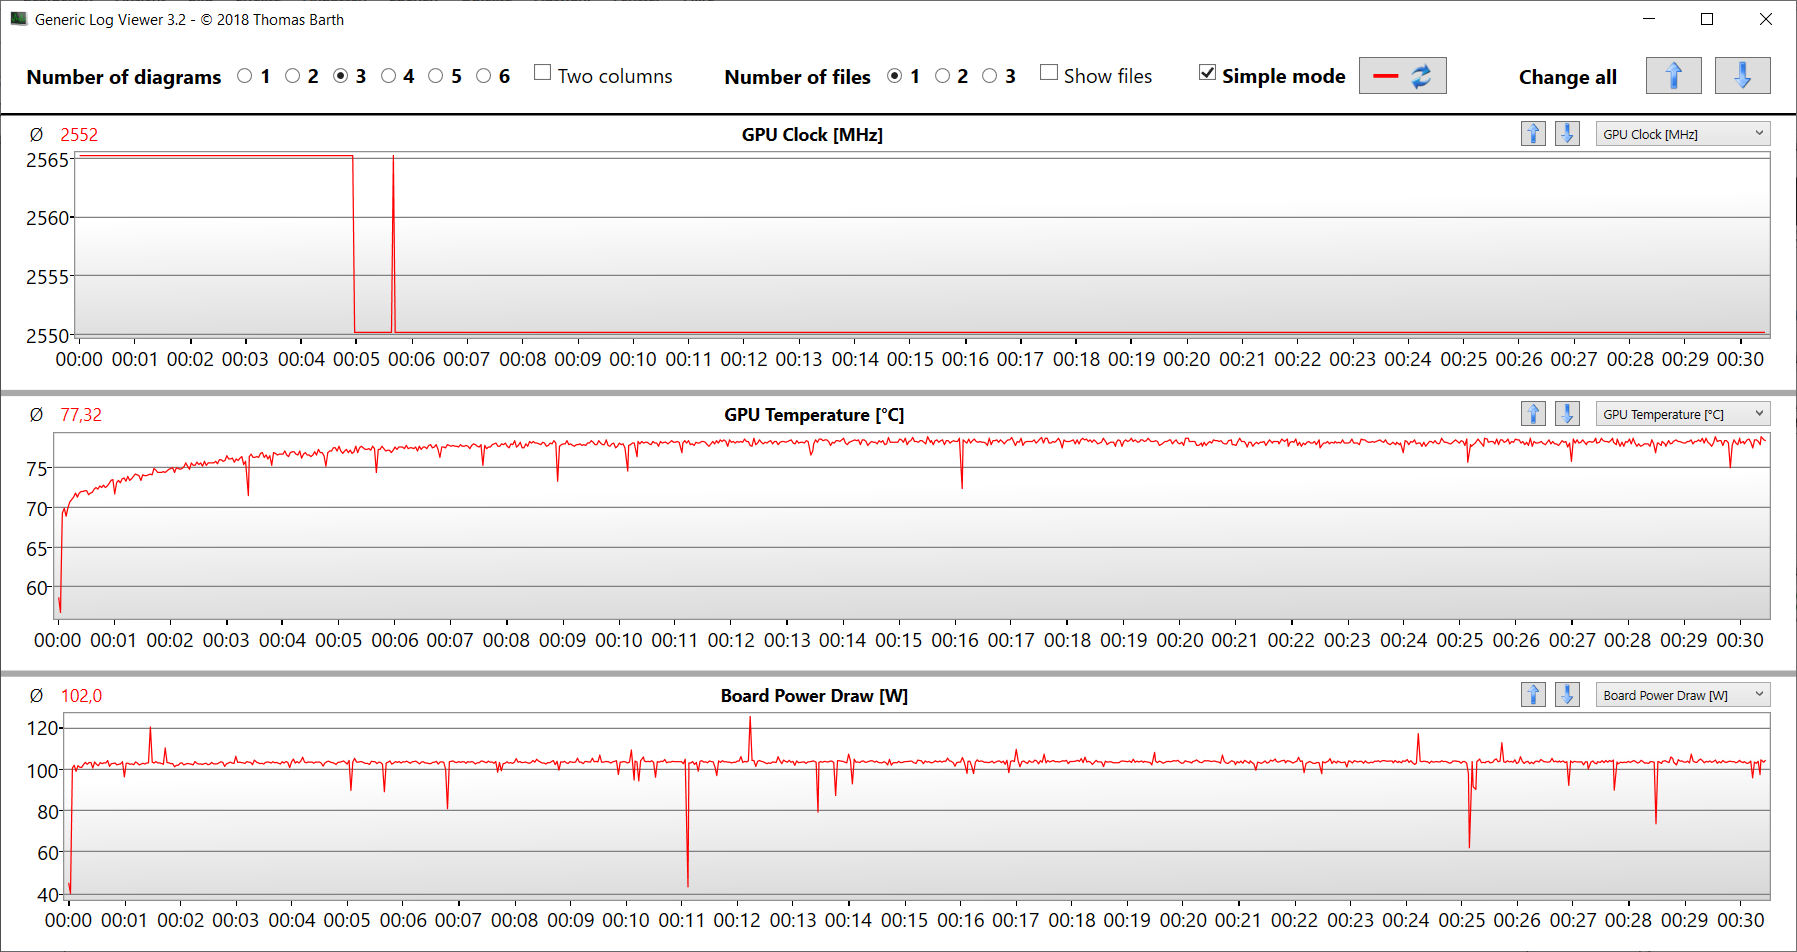
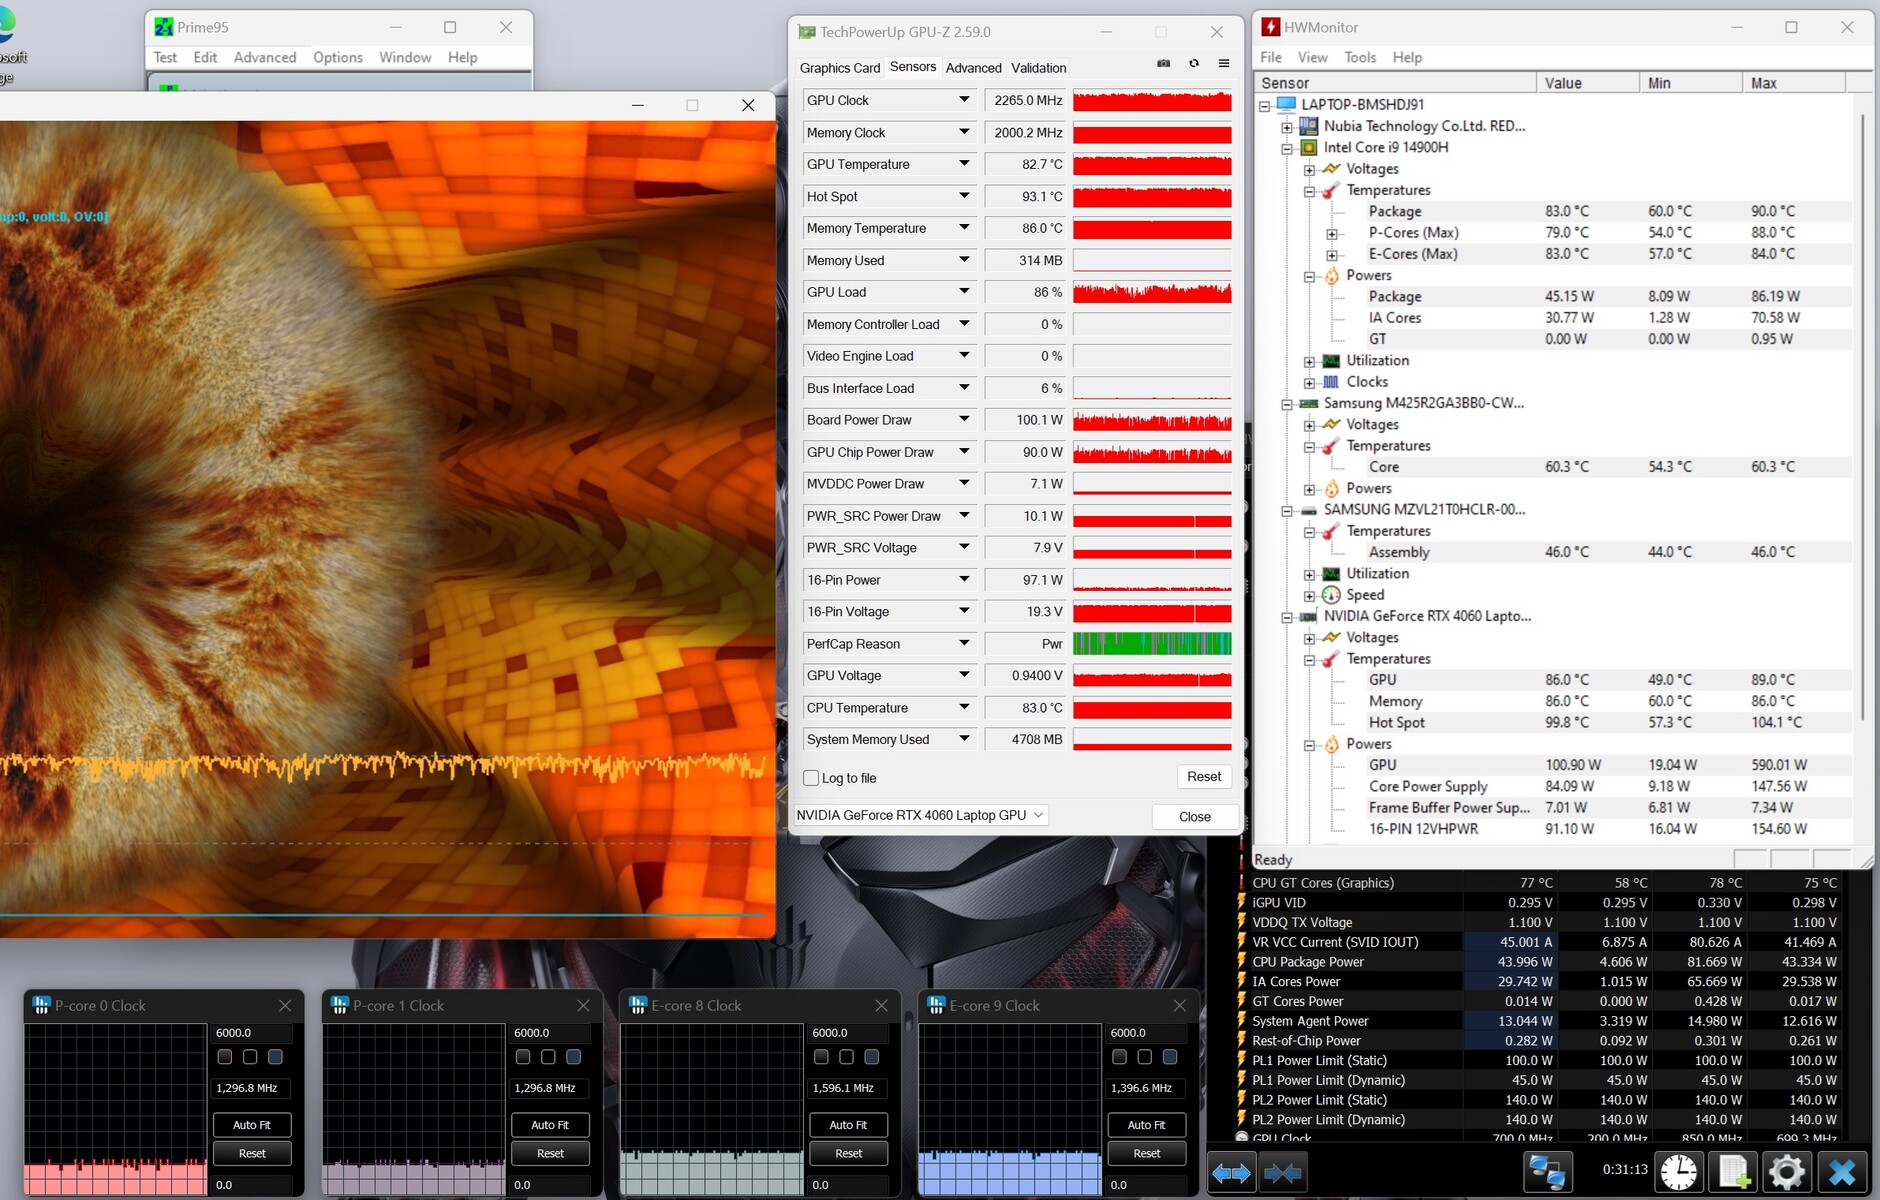
Stres testi
Aşırı stres testi senaryosu (Prime95 ve Furmark sürekli çalışmada) sistemin tam yük altında kararlılığını kontrol etti. CPU testin başında yüksek saat hızlarında çalışmış, ancak daha sonra 2 GHz'in altındaki değerlere düşürülmüştür. GPU tam güçte çalıştı.
Konuşmacılar
Stereo hoparlörler genel olarak oldukça iyi bir ses üretiyor. Baslar biraz daha belirgin olabilir.
Nubia RedMagic Titan 16 Pro ses analizi
(+) | hoparlörler nispeten yüksek sesle çalabilir (84 dB)
Bas 100 - 315Hz
(±) | azaltılmış bas - ortalama olarak medyandan 14.3% daha düşük
(±) | Bas doğrusallığı ortalamadır (11.3% delta - önceki frekans)
Ortalar 400 - 2000 Hz
(+) | dengeli ortalar - medyandan yalnızca 1.8% uzakta
(+) | orta frekanslar doğrusaldır (4.9% deltadan önceki frekansa)
Yüksekler 2 - 16 kHz
(+) | dengeli yüksekler - medyandan yalnızca 2.7% uzakta
(+) | yüksekler doğrusaldır (5.4% deltadan önceki frekansa)
Toplam 100 - 16.000 Hz
(+) | genel ses doğrusaldır (11.5% ortancaya göre fark)
Aynı sınıfla karşılaştırıldığında
» Bu sınıftaki tüm test edilen cihazların %9%'si daha iyi, 3% benzer, 88% daha kötüydü
» En iyisinin deltası 6% idi, ortalama 18% idi, en kötüsü 132% idi
Test edilen tüm cihazlarla karşılaştırıldığında
» Test edilen tüm cihazların %6'si daha iyi, 2 benzer, % 92 daha kötüydü
» En iyisinin deltası 4% idi, ortalama 24% idi, en kötüsü 134% idi
Lenovo Legion Pro 5 16IRX9 G9 ses analizi
(±) | hoparlör ses yüksekliği ortalama ama iyi (77.13 dB)
Bas 100 - 315Hz
(-) | neredeyse hiç bas yok - ortalama olarak medyandan 18.3% daha düşük
(±) | Bas doğrusallığı ortalamadır (12% delta - önceki frekans)
Ortalar 400 - 2000 Hz
(±) | daha yüksek ortalar - ortalama olarak medyandan 6.9% daha yüksek
(+) | orta frekanslar doğrusaldır (4.9% deltadan önceki frekansa)
Yüksekler 2 - 16 kHz
(+) | dengeli yüksekler - medyandan yalnızca 4.5% uzakta
(±) | Yükseklerin doğrusallığı ortalamadır (9.5% delta - önceki frekans)
Toplam 100 - 16.000 Hz
(±) | Genel sesin doğrusallığı ortalamadır (21.6% ortancaya göre fark)
Aynı sınıfla karşılaştırıldığında
» Bu sınıftaki tüm test edilen cihazların %76%'si daha iyi, 5% benzer, 19% daha kötüydü
» En iyisinin deltası 6% idi, ortalama 18% idi, en kötüsü 132% idi
Test edilen tüm cihazlarla karşılaştırıldığında
» Test edilen tüm cihazların %58'si daha iyi, 7 benzer, % 34 daha kötüydü
» En iyisinin deltası 4% idi, ortalama 24% idi, en kötüsü 134% idi
Güç yönetimi - Titan 16 vasat çalışma süreleri sunar
Güç tüketimi
Güç tüketimi, kurulu donanım için normaldir. Cyberpunk 2077 ve stres testi sabit güç tüketimi ile çalıştırıldı. Güç kaynağı (280 watt) boyut olarak yeterlidir.
| Kapalı / Bekleme modu | |
| Boşta | |
| Çalışırken |
|
Key:
min: | |
| Nubia RedMagic Titan 16 Pro i9-14900HX, NVIDIA GeForce RTX 4060 Laptop GPU | Lenovo Legion Pro 5 16IRX9 G9 i7-14700HX, NVIDIA GeForce RTX 4060 Laptop GPU | HP Victus 16 (2024) i7-14700HX, NVIDIA GeForce RTX 4060 Laptop GPU | Acer Predator Helios Neo 16 (2024) i7-14700HX, NVIDIA GeForce RTX 4070 Laptop GPU | SCHENKER XMG Pro 16 Studio (Mid 24) i9-14900HX, NVIDIA GeForce RTX 4070 Laptop GPU | Gigabyte G6X 9KG (2024) i7-13650HX, NVIDIA GeForce RTX 4060 Laptop GPU | Ortalama NVIDIA GeForce RTX 4060 Laptop GPU | Sınıf ortalaması Gaming | |
|---|---|---|---|---|---|---|---|---|
| Power Consumption | -4% | 16% | -23% | -35% | 17% | 21% | 7% | |
| Idle Minimum * | 16 | 13.7 14% | 9 44% | 26.7 -67% | 31 -94% | 12 25% | 11.5 ? 28% | 13.4 ? 16% |
| Idle Average * | 19 | 17.7 7% | 15 21% | 24.4 -28% | 33 -74% | 13 32% | 16 ? 16% | 18.9 ? 1% |
| Idle Maximum * | 27 | 18.5 31% | 23 15% | 32.7 -21% | 41 -52% | 27 -0% | 20.3 ? 25% | 26.3 ? 3% |
| Load Average * | 123 | 124 -1% | 123 -0% | 122.1 1% | 114 7% | 105 15% | 92.9 ? 24% | 102.7 ? 17% |
| Cyberpunk 2077 ultra external monitor * | 174.2 | 224 -29% | 196.8 -13% | |||||
| Cyberpunk 2077 ultra * | 184.3 | 229 -24% | 218 -18% | |||||
| Load Maximum * | 240 | 297 -24% | 241 -0% | 241 -0% | 250 -4% | 210 12% | 210 ? 12% | 244 ? -2% |
| Witcher 3 ultra * | 143.7 | 190.6 | 167.8 |
* ... daha küçük daha iyidir
Power consumption Cyberpunk / stress test
Power consumption with external monitor
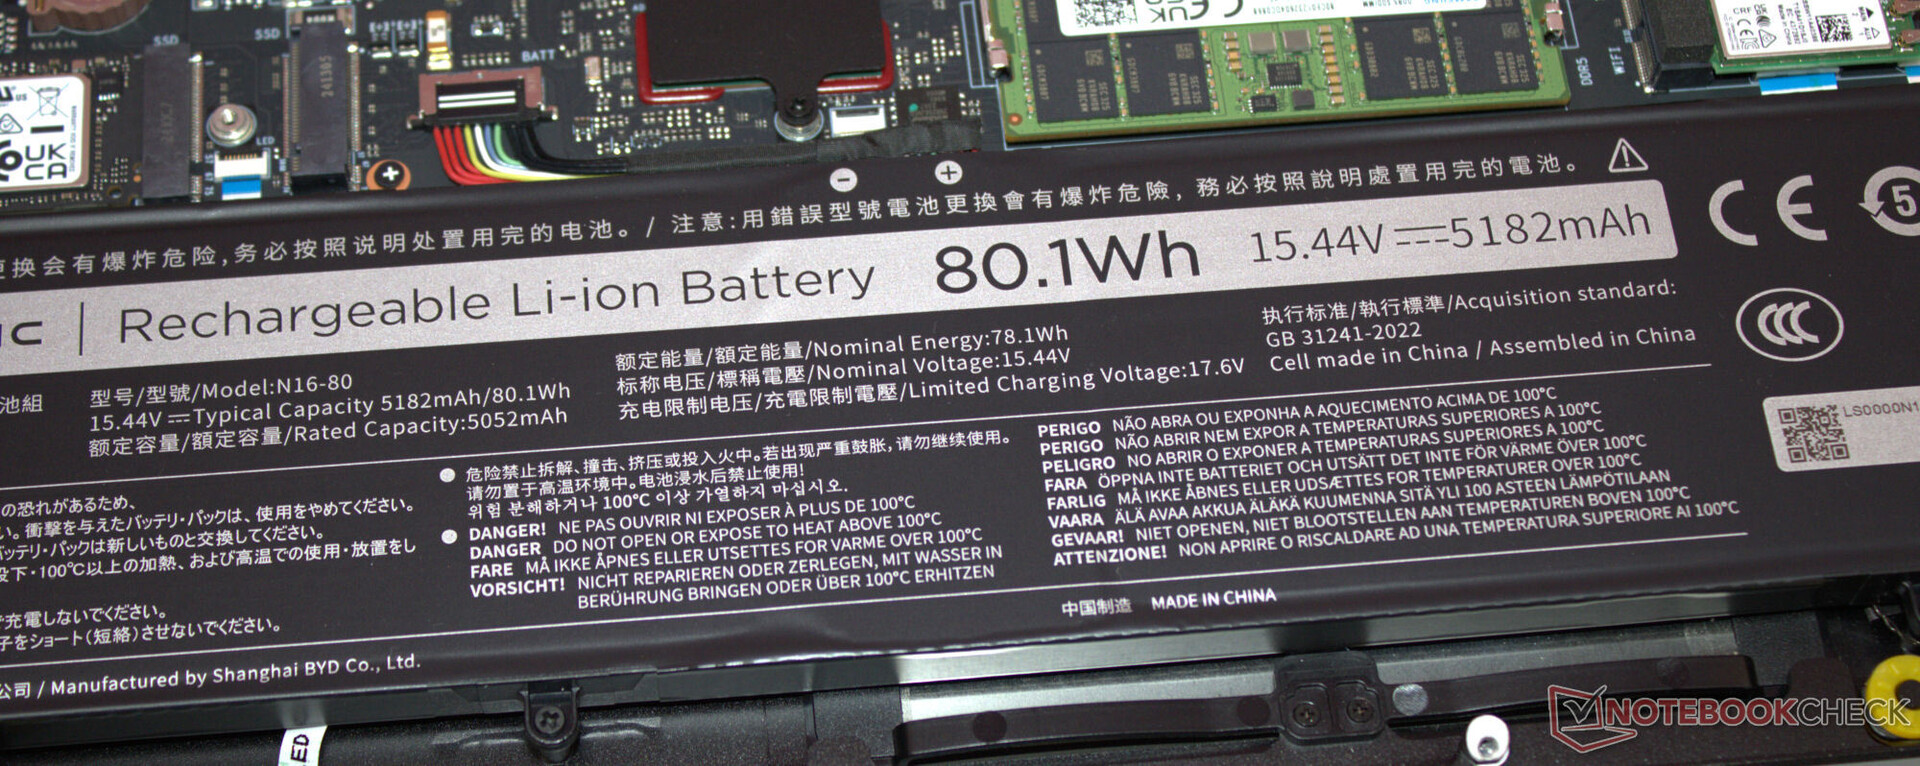
Çalışma Zamanları
16 inçlik cihaz, WiFi testi sırasında 4:40 saat (bir komut dosyası kullanarak web sitelerine erişim) ve video testi sırasında 5:16 saat (bir döngüde kısa film Big Buck Bunny (H.264 kodlama, FHD)) çalışma süreleri elde etti - büyük değerler değil. Rakiplerinden bazıları çok daha uzun süre çalışıyor.
| Nubia RedMagic Titan 16 Pro i9-14900HX, NVIDIA GeForce RTX 4060 Laptop GPU, 80.1 Wh | Lenovo Legion Pro 5 16IRX9 G9 i7-14700HX, NVIDIA GeForce RTX 4060 Laptop GPU, 80 Wh | HP Victus 16 (2024) i7-14700HX, NVIDIA GeForce RTX 4060 Laptop GPU, 83 Wh | Acer Predator Helios Neo 16 (2024) i7-14700HX, NVIDIA GeForce RTX 4070 Laptop GPU, 90.61 Wh | SCHENKER XMG Pro 16 Studio (Mid 24) i9-14900HX, NVIDIA GeForce RTX 4070 Laptop GPU, 73 Wh | Gigabyte G6X 9KG (2024) i7-13650HX, NVIDIA GeForce RTX 4060 Laptop GPU, 73 Wh | Sınıf ortalaması Gaming | |
|---|---|---|---|---|---|---|---|
| Pil Çalışma Süresi | 16% | 83% | -16% | 20% | 69% | 28% | |
| Reader / Idle | 481 | 356 -26% | 585 ? 22% | ||||
| H.264 | 316 | 312 -1% | 242 -23% | 447 ? 41% | |||
| WiFi v1.3 | 280 | 308 10% | 511 83% | 227 -19% | 337 20% | 474 69% | 387 ? 38% |
| Load | 76 | 105 38% | 79 4% | 84.5 ? 11% |
Artılar
Eksiler
Karar - İyileştirme için yer var

A Core i9-14900HX ve bir GeForce RTX 4060 yüksek ila maksimum ayarlarda QHD oyun oynamayı sağlar. RAM tek kanal modunda çalıştığı için takılı donanım tam potansiyeliyle kullanılamıyor. İkinci bir bellek modülünün takılması önerilir.
Nubia'nın ilk ürünü yapmak için tasarlandığı şeyi yapıyor: Oyunları sorunsuz bir şekilde ekrana getiriyor. Ancak rekabetin korkması için bir nedene ihtiyacı yok.
Emisyon değerleri son derece hayal kırıklığı yaratıyor: Dizüstü bilgisayar tüm yük aralığında (çok) fazla gürültü üretiyor, ayrıca çok fazla ısınıyor. Öte yandan, iş dostu 16:10 en boy oranına sahip parlak, gerçek renkli IPS ekranı (16 inç, 2.560 x 1.600 piksel, 240 Hz, G-Sync, DCI-P3) üzerimizde iyi bir izlenim bıraktı.
Dizüstü bilgisayarın pil ömrü kimseyi şaşırtmayacak. Bir oyun dizüstü bilgisayarından 80 Wh batarya ile (biraz) daha fazlasını beklersiniz. En azından takılı USB-C bağlantı noktası (Thunderbolt 4) Güç Dağıtımı'nı (ve DP Alt modunu) destekliyor. Bu, hantal tescilli güç kaynağını her zaman yanınızda taşımak zorunda olmadığınız anlamına gelir.
Cihazı satın almadan önce göz önünde bulundurmanız gereken bir gerçek var: Acer, Lenovo veya HP gibi köklü üreticilerin aksine, Nubia'nın dünya çapında bir varlığı yok. Sonuç olarak, yedek parça temini, destek ve onarımlar konusunda durumun ne olacağını tahmin etmek mümkün değildir.
1.699 ABD doları tutarındaki fiyatı kesinlikle dizüstü bilgisayarın lehine konuşmuyor: Örneğin, neredeyse aynı konfigürasyona sahip Acer Predator Helios Neo 16 (16 GB yerine 32 GB olan RAM'i hariç) şu anda yalnızca 1.350 ABD dolarıdır. Başka bir alternatif de şu olabilir XMG Pro 16 Studio (Orta 24). Bu cihazın karşılaştırılabilir bir versiyonunun fiyatı yaklaşık 2.000 ABD Doları (Windows 11 ile) veya 1.950 ABD Dolarıdır (işletim sistemi olarak Windows olmadan).
Fiyat ve bulunabilirlik
Nubia RedMagic Titan 16 Pro 29/08/2024 tarihinden itibaren RedMagic mağazası üzerinden 1.699 ABD Doları karşılığında satın alınabilir.
Lütfen dikkat: Derecelendirme sistemimizi yakın zamanda güncelledik ve 8. sürümün sonuçları 7. sürümün sonuçları ile karşılaştırılamaz. Daha fazla bilgiye buradan ulaşabilirsiniz.
Nubia RedMagic Titan 16 Pro
- 08/21/2024 v8
Sascha Mölck
 Total Sustainability Score:
 Şeffaflık
İncelenecek cihazların seçimi editör ekibimiz tarafından yapılır. Test örneği, bu incelemenin amacı doğrultusunda üretici veya perakendeci tarafından yazara ödünç olarak sağlanmıştır. Borç verenin bu inceleme üzerinde herhangi bir etkisi olmadığı gibi, üretici de yayınlanmadan önce bu incelemenin bir kopyasını almamıştır. Bu incelemeyi yayınlama zorunluluğu yoktu. İncelemelerimiz karşılığında asla tazminat veya ödeme kabul etmiyoruz. Bağımsız bir medya şirketi olarak Notebookcheck, üreticilerin, perakendecilerin veya yayıncıların otoritesine tabi değildir.
Notebookcheck bu şekilde test yapıyor
Notebookcheck, tüm sonuçların karşılaştırılabilir olmasını sağlamak için her yıl yüzlerce dizüstü bilgisayarı ve akıllı telefonu standart prosedürler kullanarak bağımsız olarak inceliyor. Yaklaşık 20 yıldır test yöntemlerimizi sürekli olarak geliştirdik ve bu süreçte endüstri standartlarını belirledik. Test laboratuvarlarımızda deneyimli teknisyenler ve editörler tarafından yüksek kaliteli ölçüm ekipmanları kullanılmaktadır. Bu testler çok aşamalı bir doğrulama sürecini içerir. Karmaşık derecelendirme sistemimiz, nesnelliği koruyan yüzlerce sağlam temellere dayanan ölçüm ve kıyaslamaya dayanmaktadır.Price comparison

