

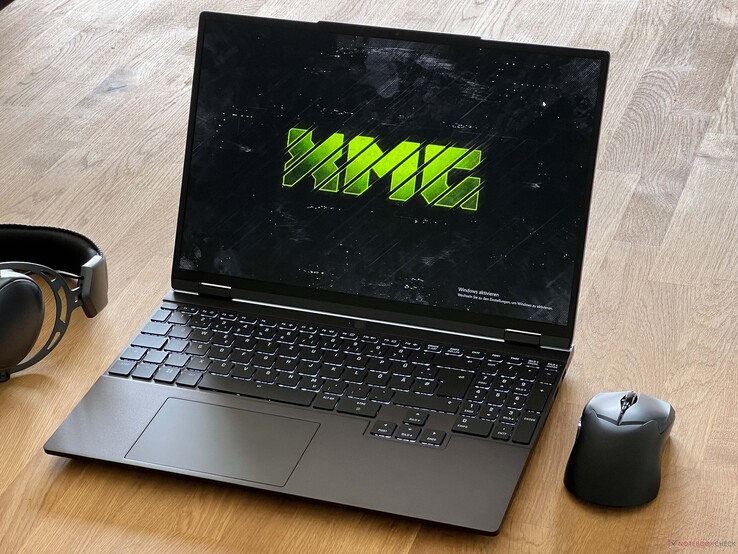
Schenker XMG Evo 15 (M24) Dizüstü Bilgisayar incelemesi - Parlak ekranlı ve mükemmel bakım seçeneklerine sahip Alman Ultrabook
Şimdiye kadar XMG dizüstü bilgisayarlar öncelikle oyunculara ve hızlı özel grafik kartlarına ihtiyaç duyan müşterilere yönelikti. Yeni XMG Evo modelleri (14 ve 15 inç) ile Alman üretici artık özel GPU'ları olmayan iki ultrabook'u da piyasaya sürüyor. Kasalar daha kompakt, ancak aynı zamanda kapsamlı bakım seçenekleri olmadan yapmak zorunda değilsiniz. Üretici ayrıca müşterilerine AMD'nin Ryzen 8000 CPU'ları (1.049 €'dan başlayan fiyatlarla) ya da Intel'in Meteor Lake çipleri (1.199 €'dan başlayan fiyatlarla) arasında seçim yapma şansı tanıyor, ki Schenker'e göre bu da performansta büyük farklılıklara yol açmıyor. Ekran her zaman 500 nit parlaklığa ve 240 Hz frekansa sahip mat bir WQHD paneldir (2.560 x 1.600 piksel).
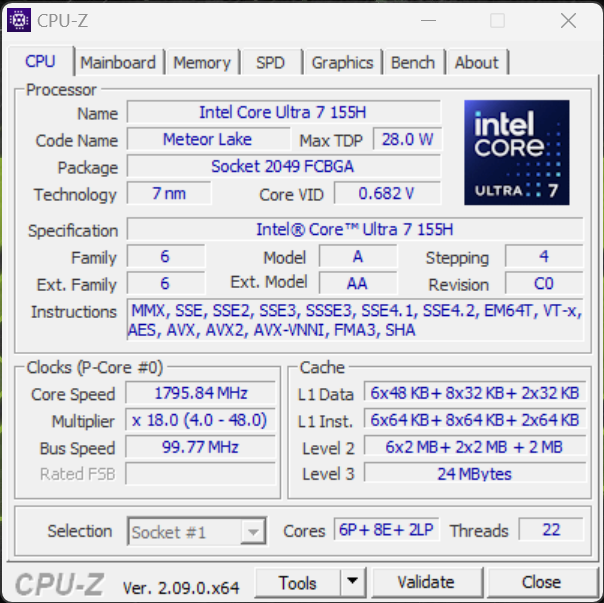
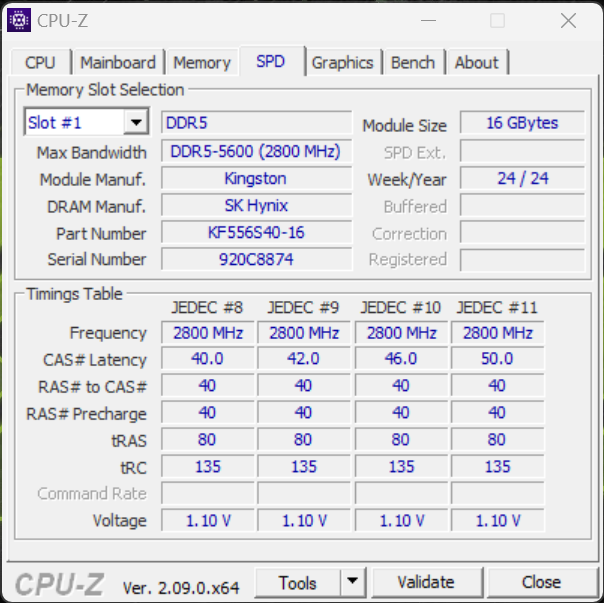
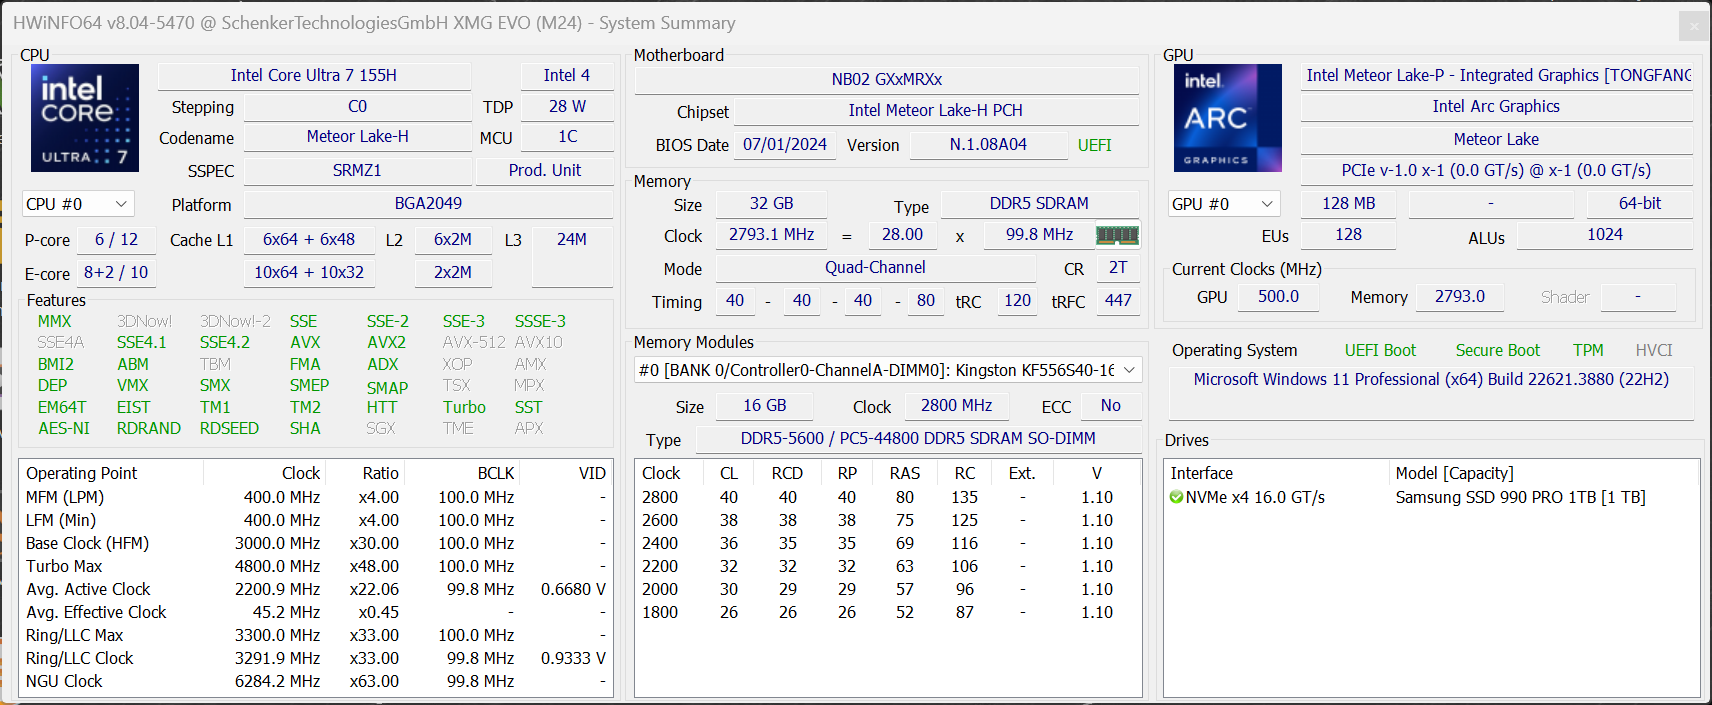
Yeni XMG Evo 15'i (M24) şu özelliklerle test ediyoruz Intel Core Ultra 7 155H arc Graphics iGPU ile birlikte 32 GB RAM (DDR5-5600) ve Samsung 990 Pro'nun 1 TB versiyonu dahil. Bu konfigürasyonda (Windows 11'in ön kurulumu dahil) fiyat 1.400 Euro'dur.
Karşılaştırmalı olarak olası rakipler
Derecelendirme | Sürüm | Tarih | Modeli | Ağırlık | Yükseklik | Boyut | Çözünürlük | Fiyat |
|---|---|---|---|---|---|---|---|---|
| 84.7 % | v8 | 08/2024 | SCHENKER XMG Evo 15 (M24) Ultra 7 155H, Arc 8-Core | 1.7 kg | 19.9 mm | 15.30" | 2560x1600 | |
| 82.1 % | v8 | 07/2024 | Dell Inspiron 16 7640 2-in-1 Ultra 7 155H, Arc 8-Core | 2.1 kg | 18.99 mm | 16.00" | 2560x1600 | |
| 76.7 % | v8 | 07/2024 | Medion S10 OLED Ultra 7 155H, Arc 8-Core | 1.6 kg | 17.8 mm | 16.00" | 3840x2400 | |
| 89.7 % v7 (old) | v7 (old) | 04/2024 | Xiaomi RedmiBook Pro 16 2024 Ultra 7 155H, Arc 8-Core | 1.9 kg | 15.9 mm | 16.00" | 3072x1920 | |
| 87.9 % v7 (old) | v7 (old) | 05/2024 | Lenovo IdeaPad Pro 5 16IMH G9 Ultra 7 155H, Arc 8-Core | 1.9 kg | 17.5 mm | 16.00" | 2560x1600 | |
| 89.9 % v7 (old) | v7 (old) | 05/2024 | Lenovo ThinkPad T16 G2 21K70035GE R7 7840U, Radeon 780M | 1.8 kg | 23.8 mm | 16.00" | 1920x1200 |
Not: Derecelendirme sistemimizi yakın zamanda güncelledik ve 8. versiyonun sonuçları 7. versiyonun sonuçları ile karşılaştırılamaz. Daha fazla bilgi için burada.
Kasa - Sağlam alüminyum kapak

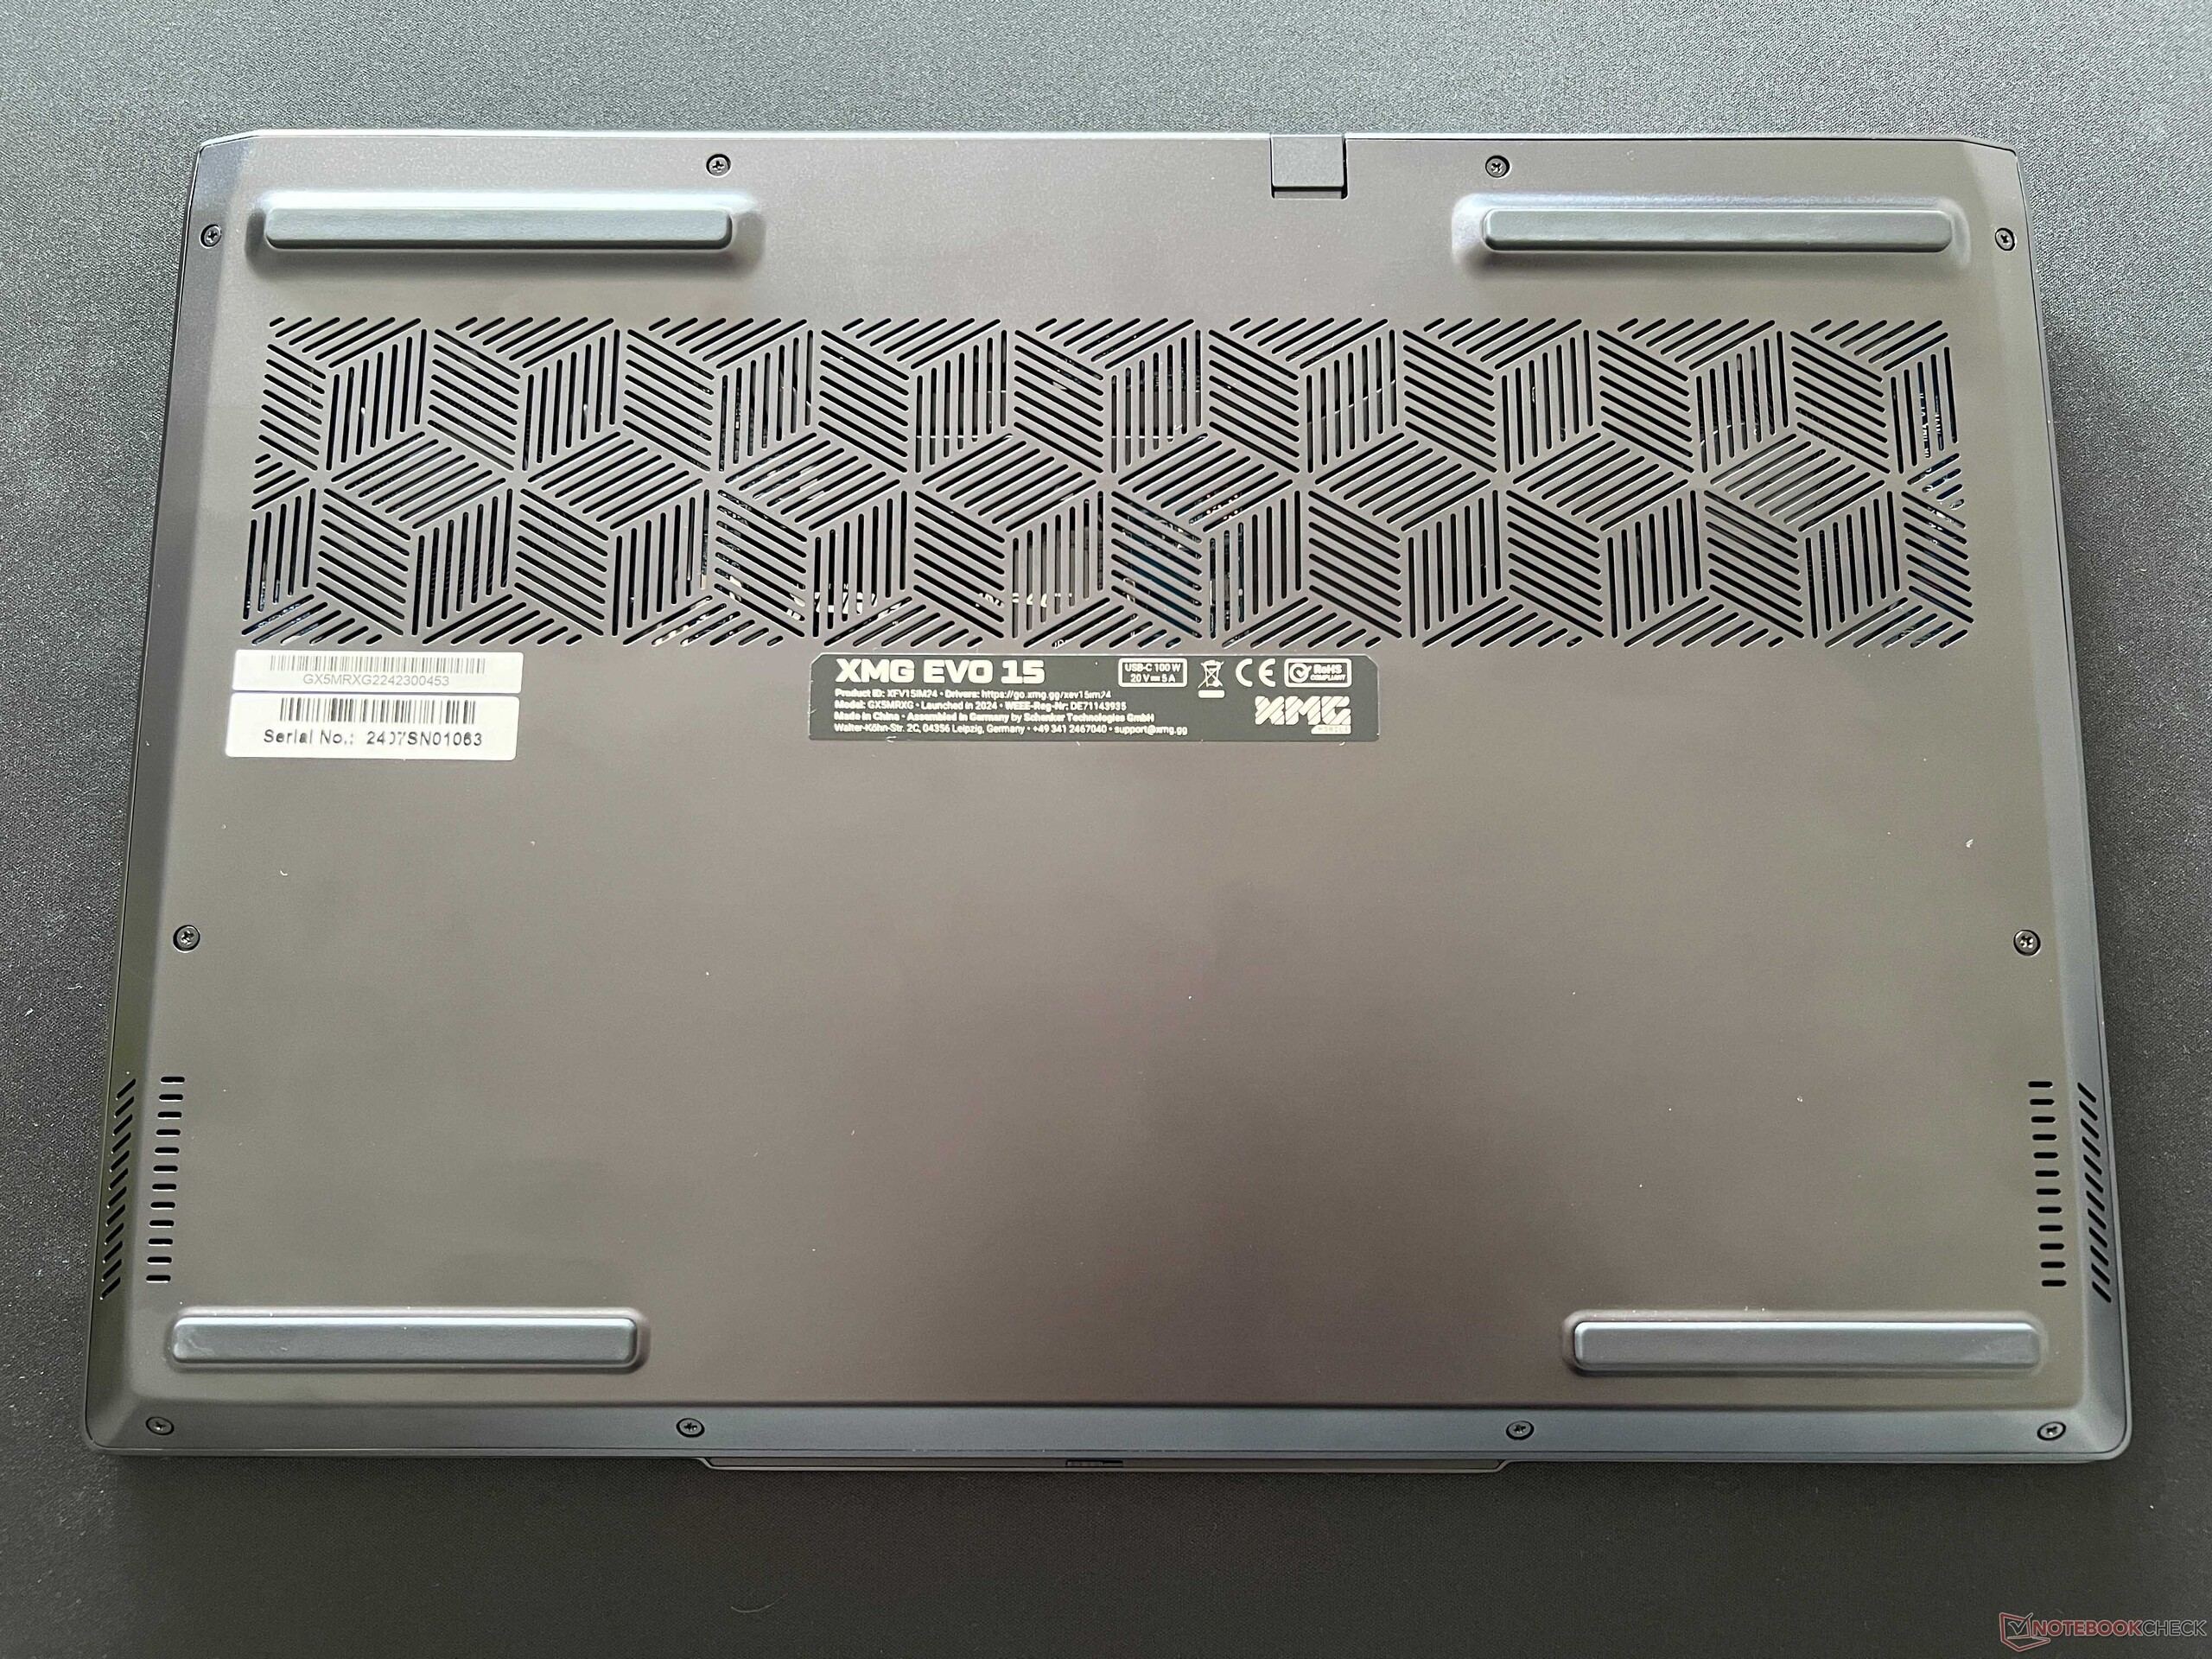
XMG Evo 15, siyah alüminyum şasiye sahiptir ve bu şasi bir şekilde XMG Fusion 15 oyuncu. Bununla birlikte, Evo 15 daha kompakttır (özellikle daha incedir) ve ayrıca her iki tarafta soğutma delikleri yoktur. Genel olarak, dizüstü bilgisayar çok basit görünüyor ve profesyonel bir ortamda da sorunsuz bir şekilde kullanılabilir; gerekirse, dizüstü bilgisayar ekran kapağında logo olmadan da sipariş edilebilir. Bununla birlikte, alüminyum yüzeyler parmak izlerine karşı oldukça hassastır ve düzenli olarak temizlenmesi gerekir.
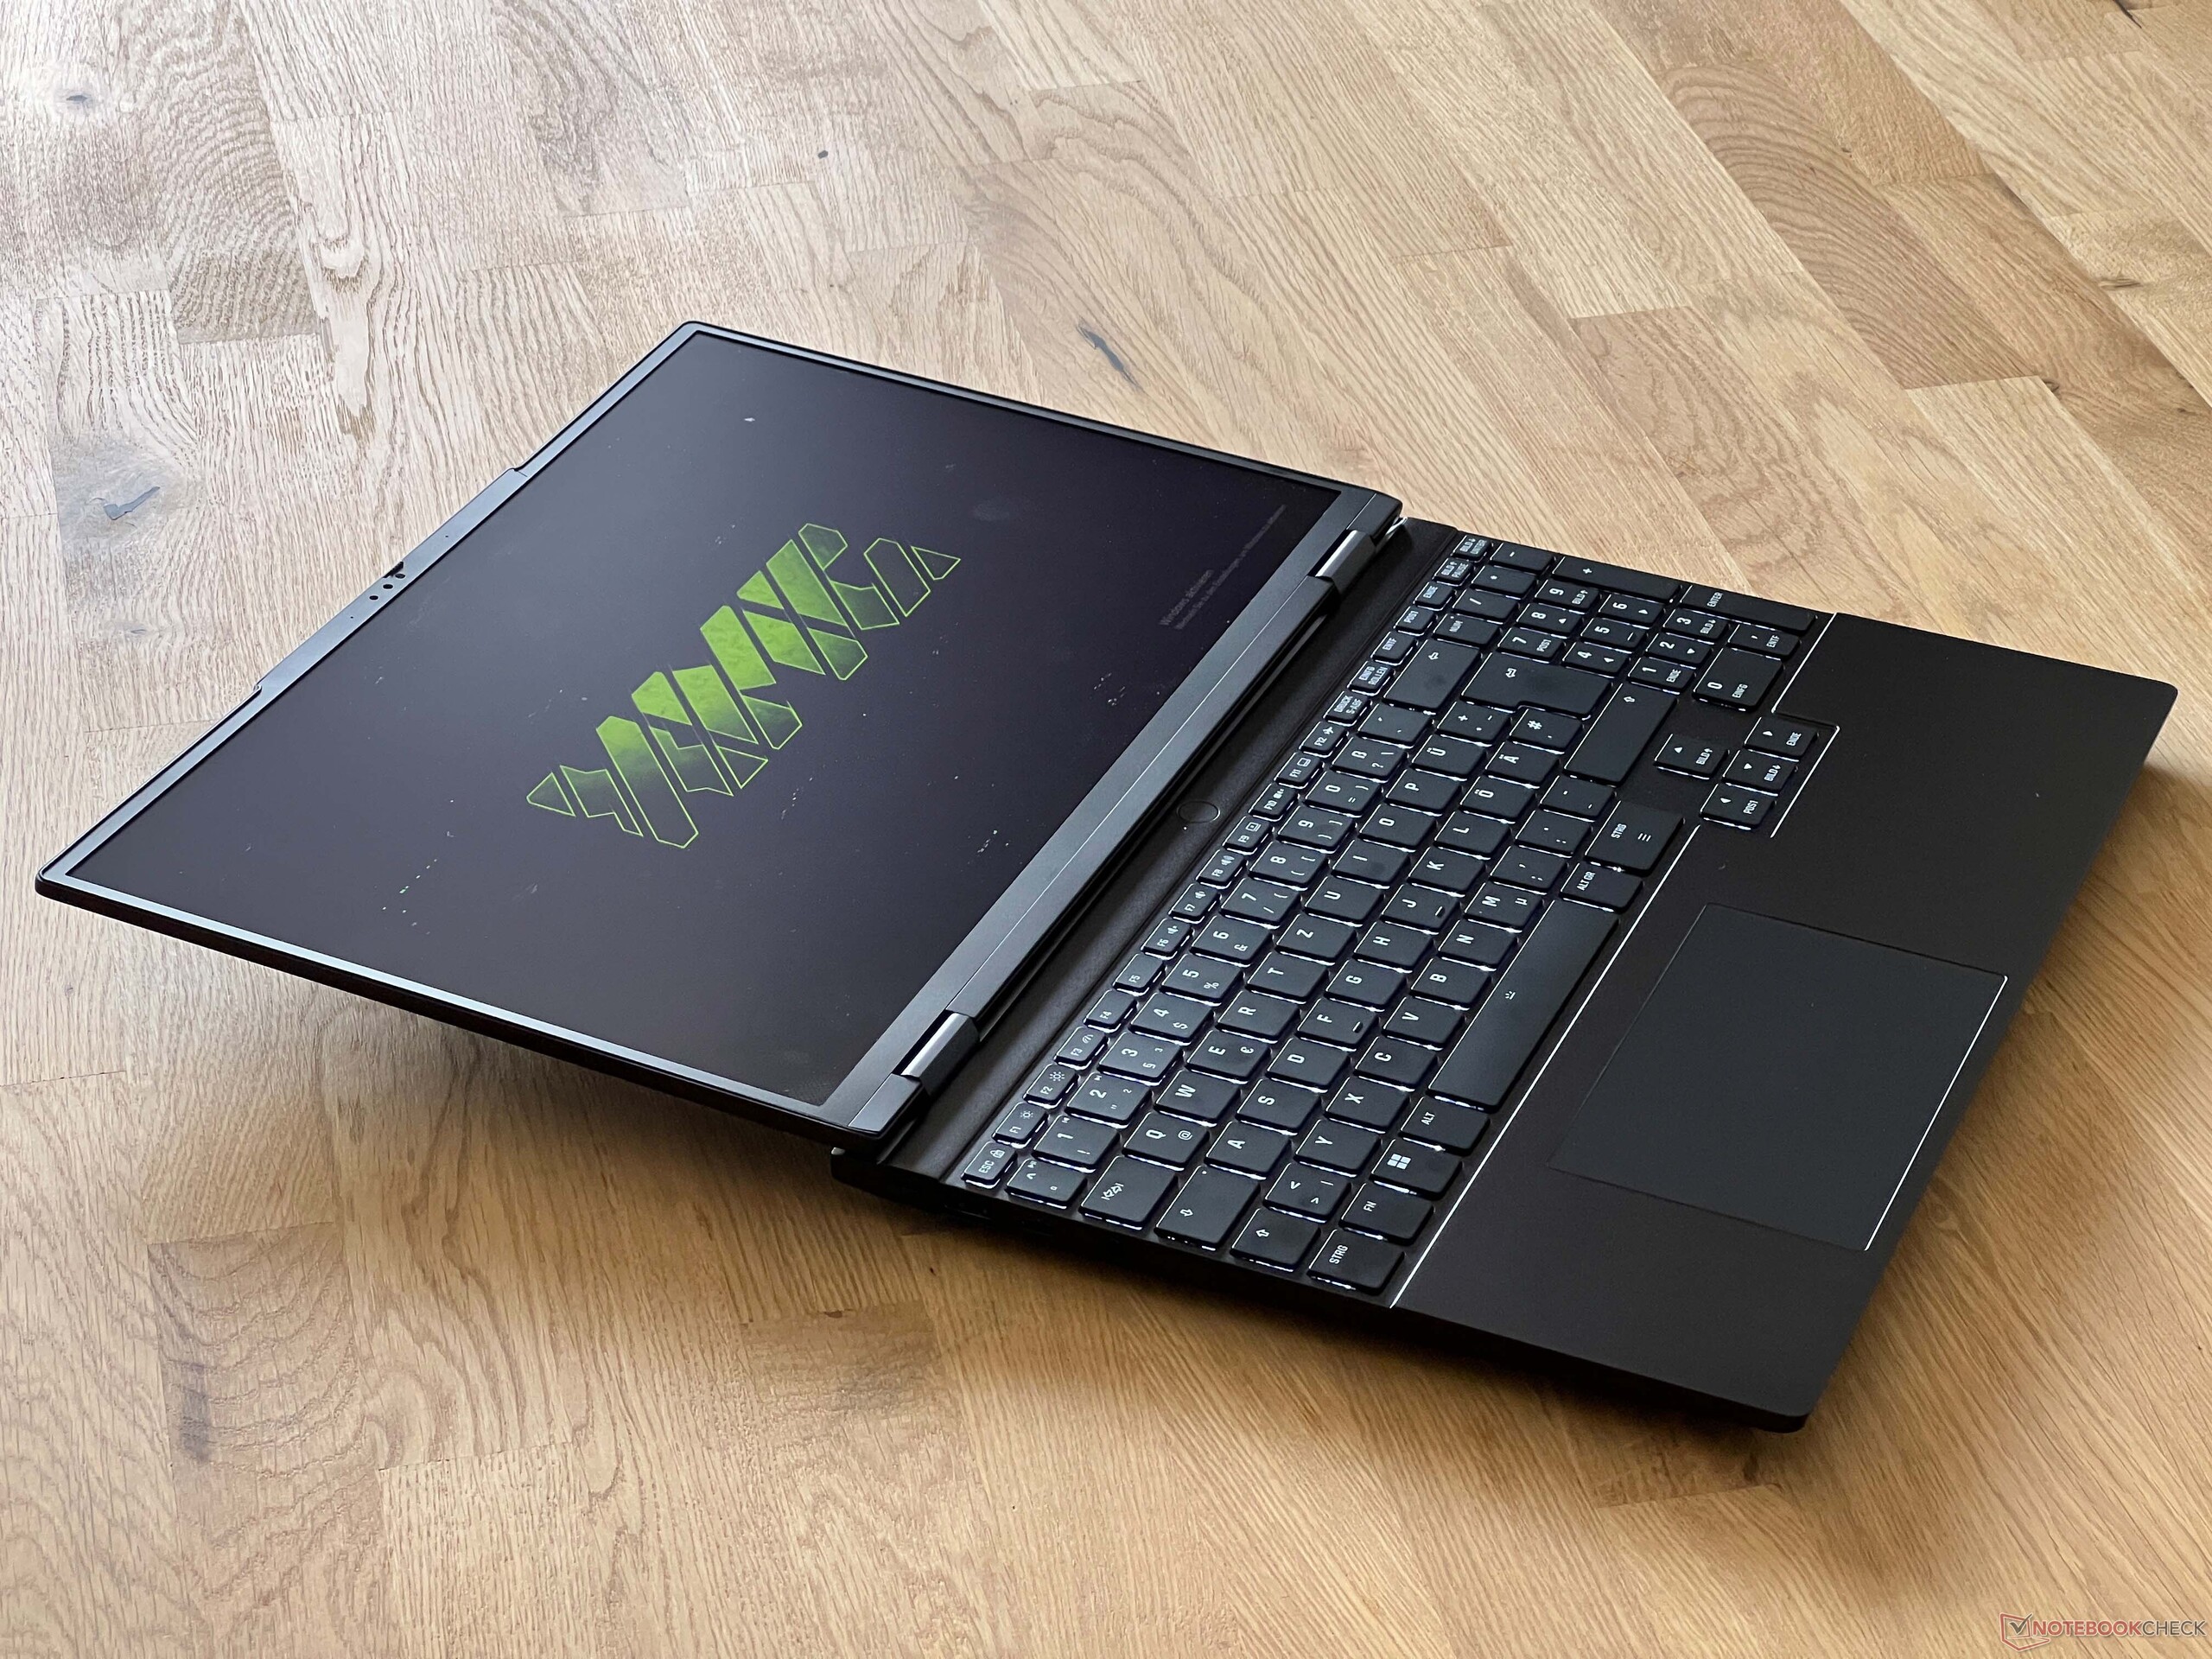
Kalite açısından, yeni Evo 15 iyi bir performans sergiliyor, çünkü işçilik çok iyi ve dizüstü bilgisayar genel olarak yüksek kaliteli bir izlenim bırakıyor. Ana ünite çok sağlam ve elinizi üzerine koyduğunuzda sadece orta klavye alanında biraz çukur oluşabiliyor. Ekran kapağı da sağlam ve herhangi bir görüntü bozukluğuna neden olamıyoruz. Maksimum açılma açısı 180 derecedir ve menteşeler hafif bir sıçrama dışında ekranı güvenli bir şekilde yerinde tutar, ancak hafif kamera çıkıntısı sayesinde tek elle açmak da sorunsuz bir şekilde mümkündür.

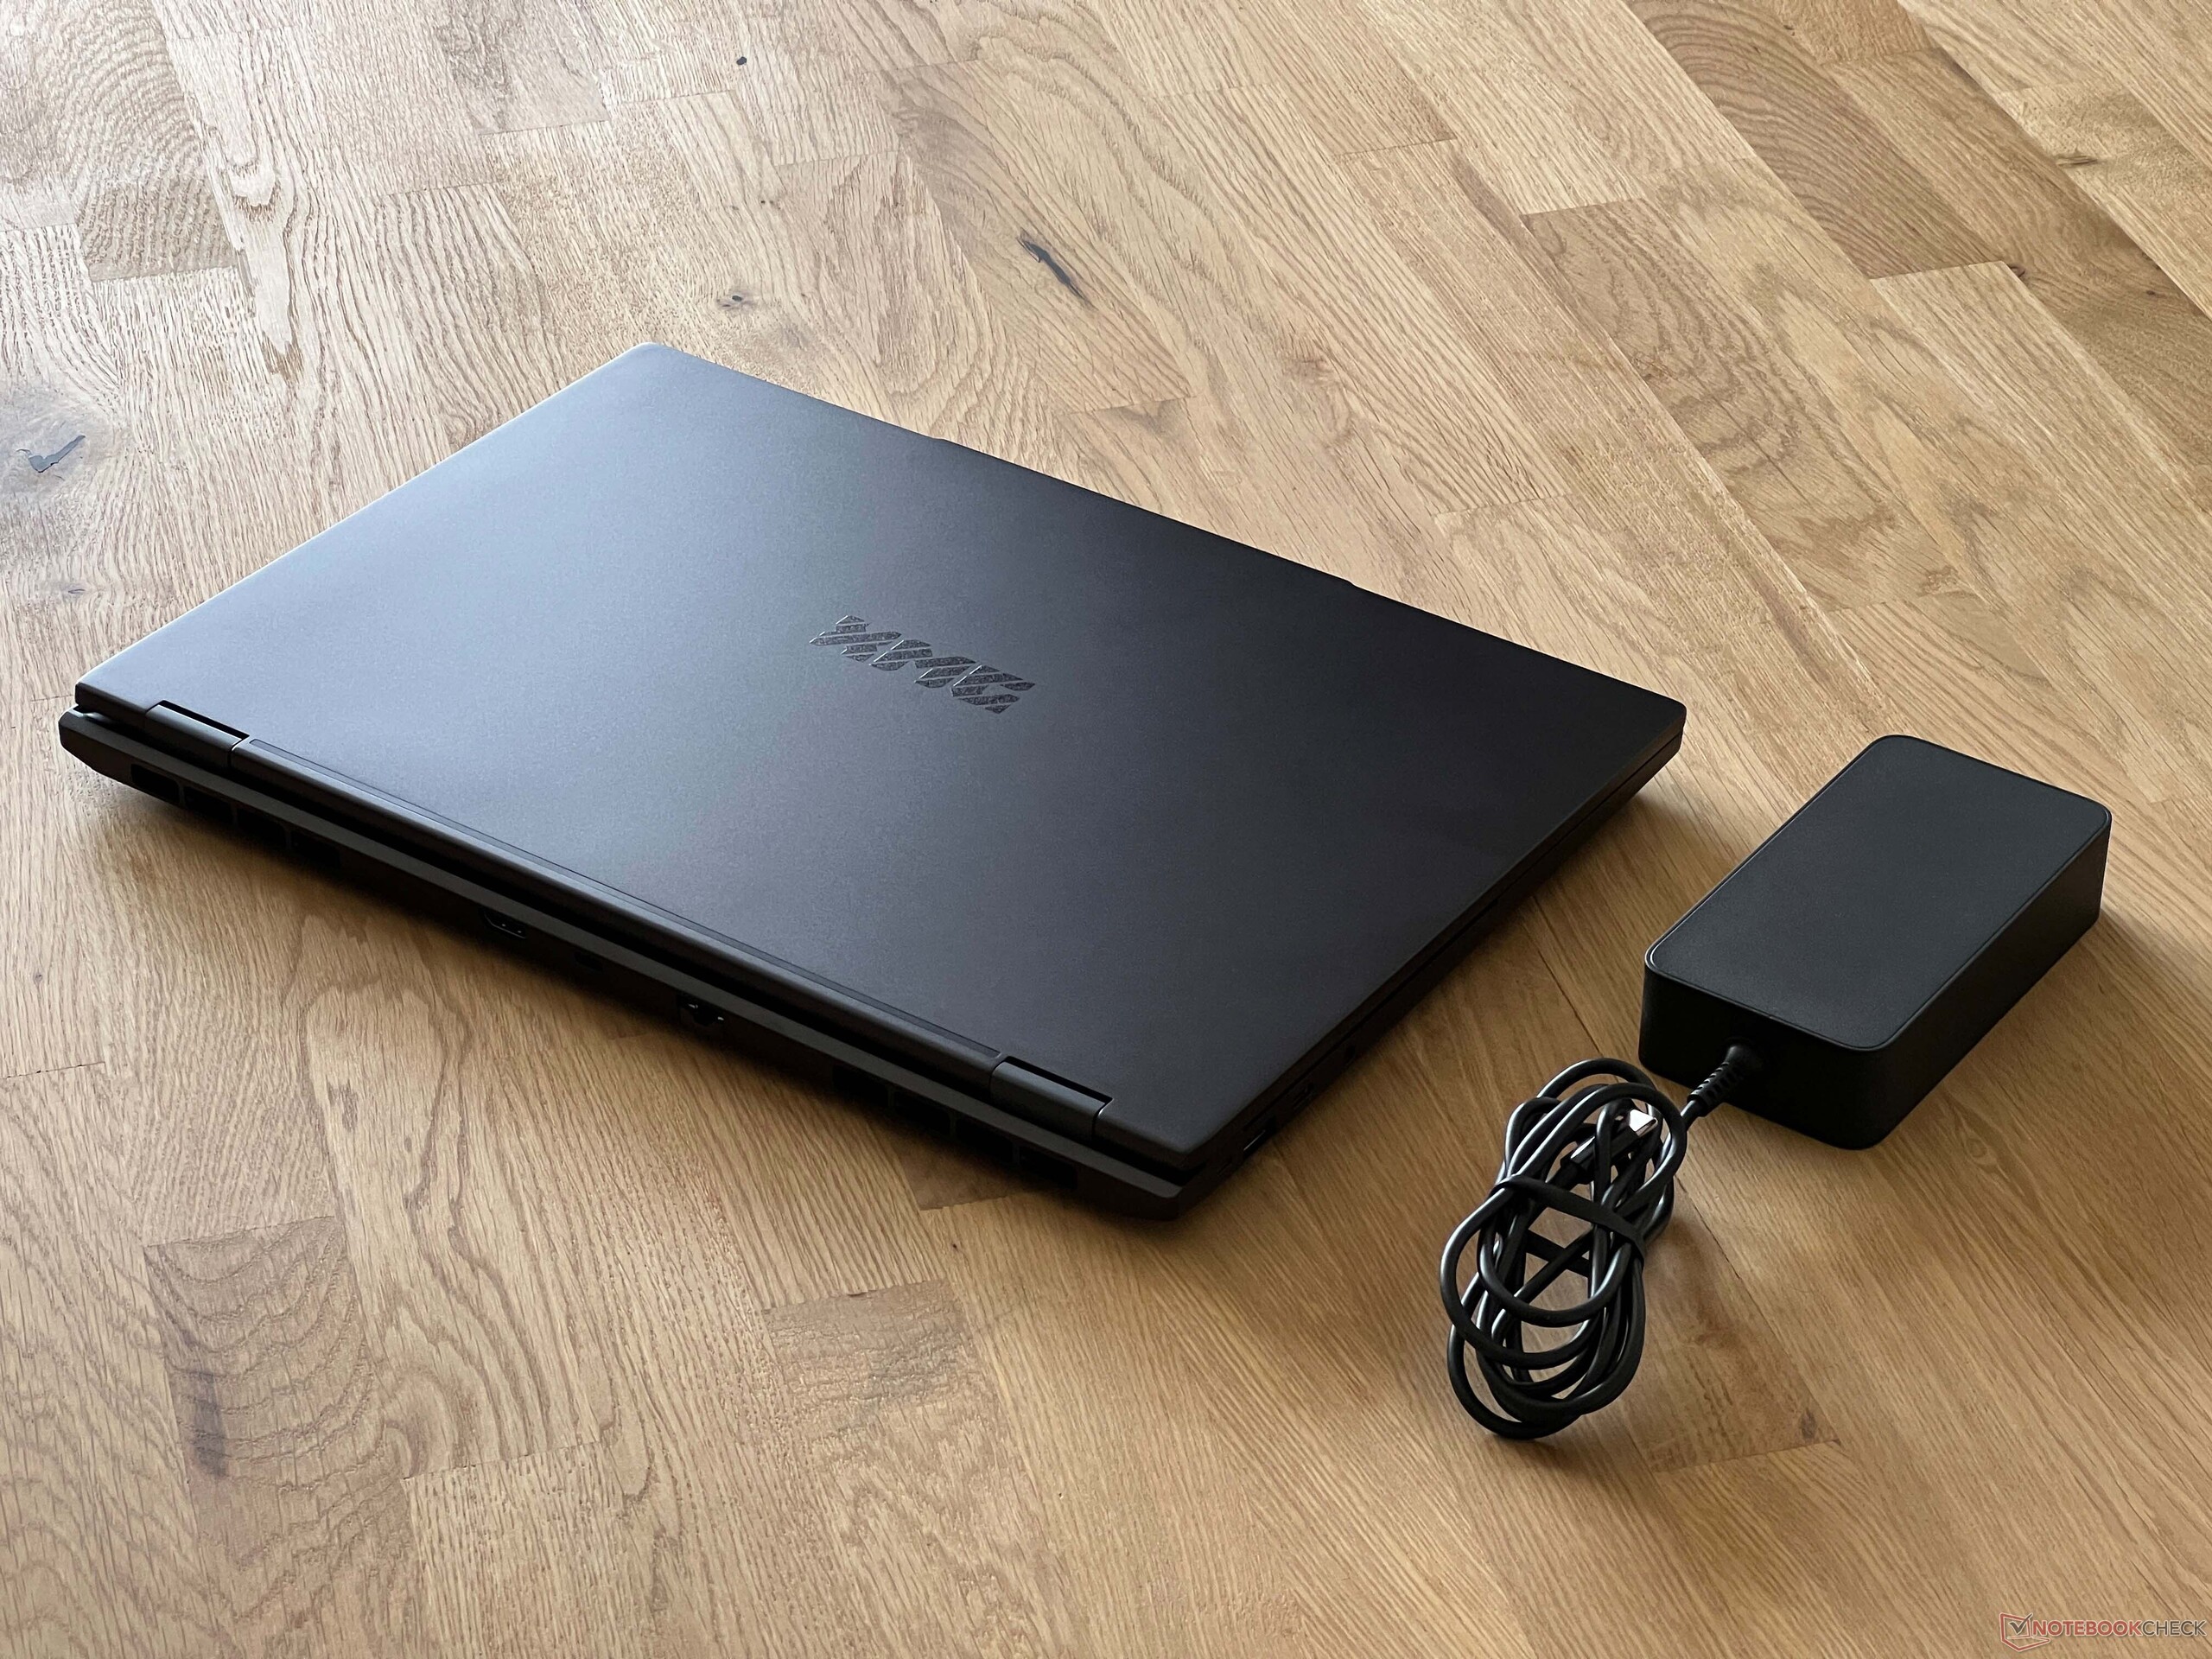
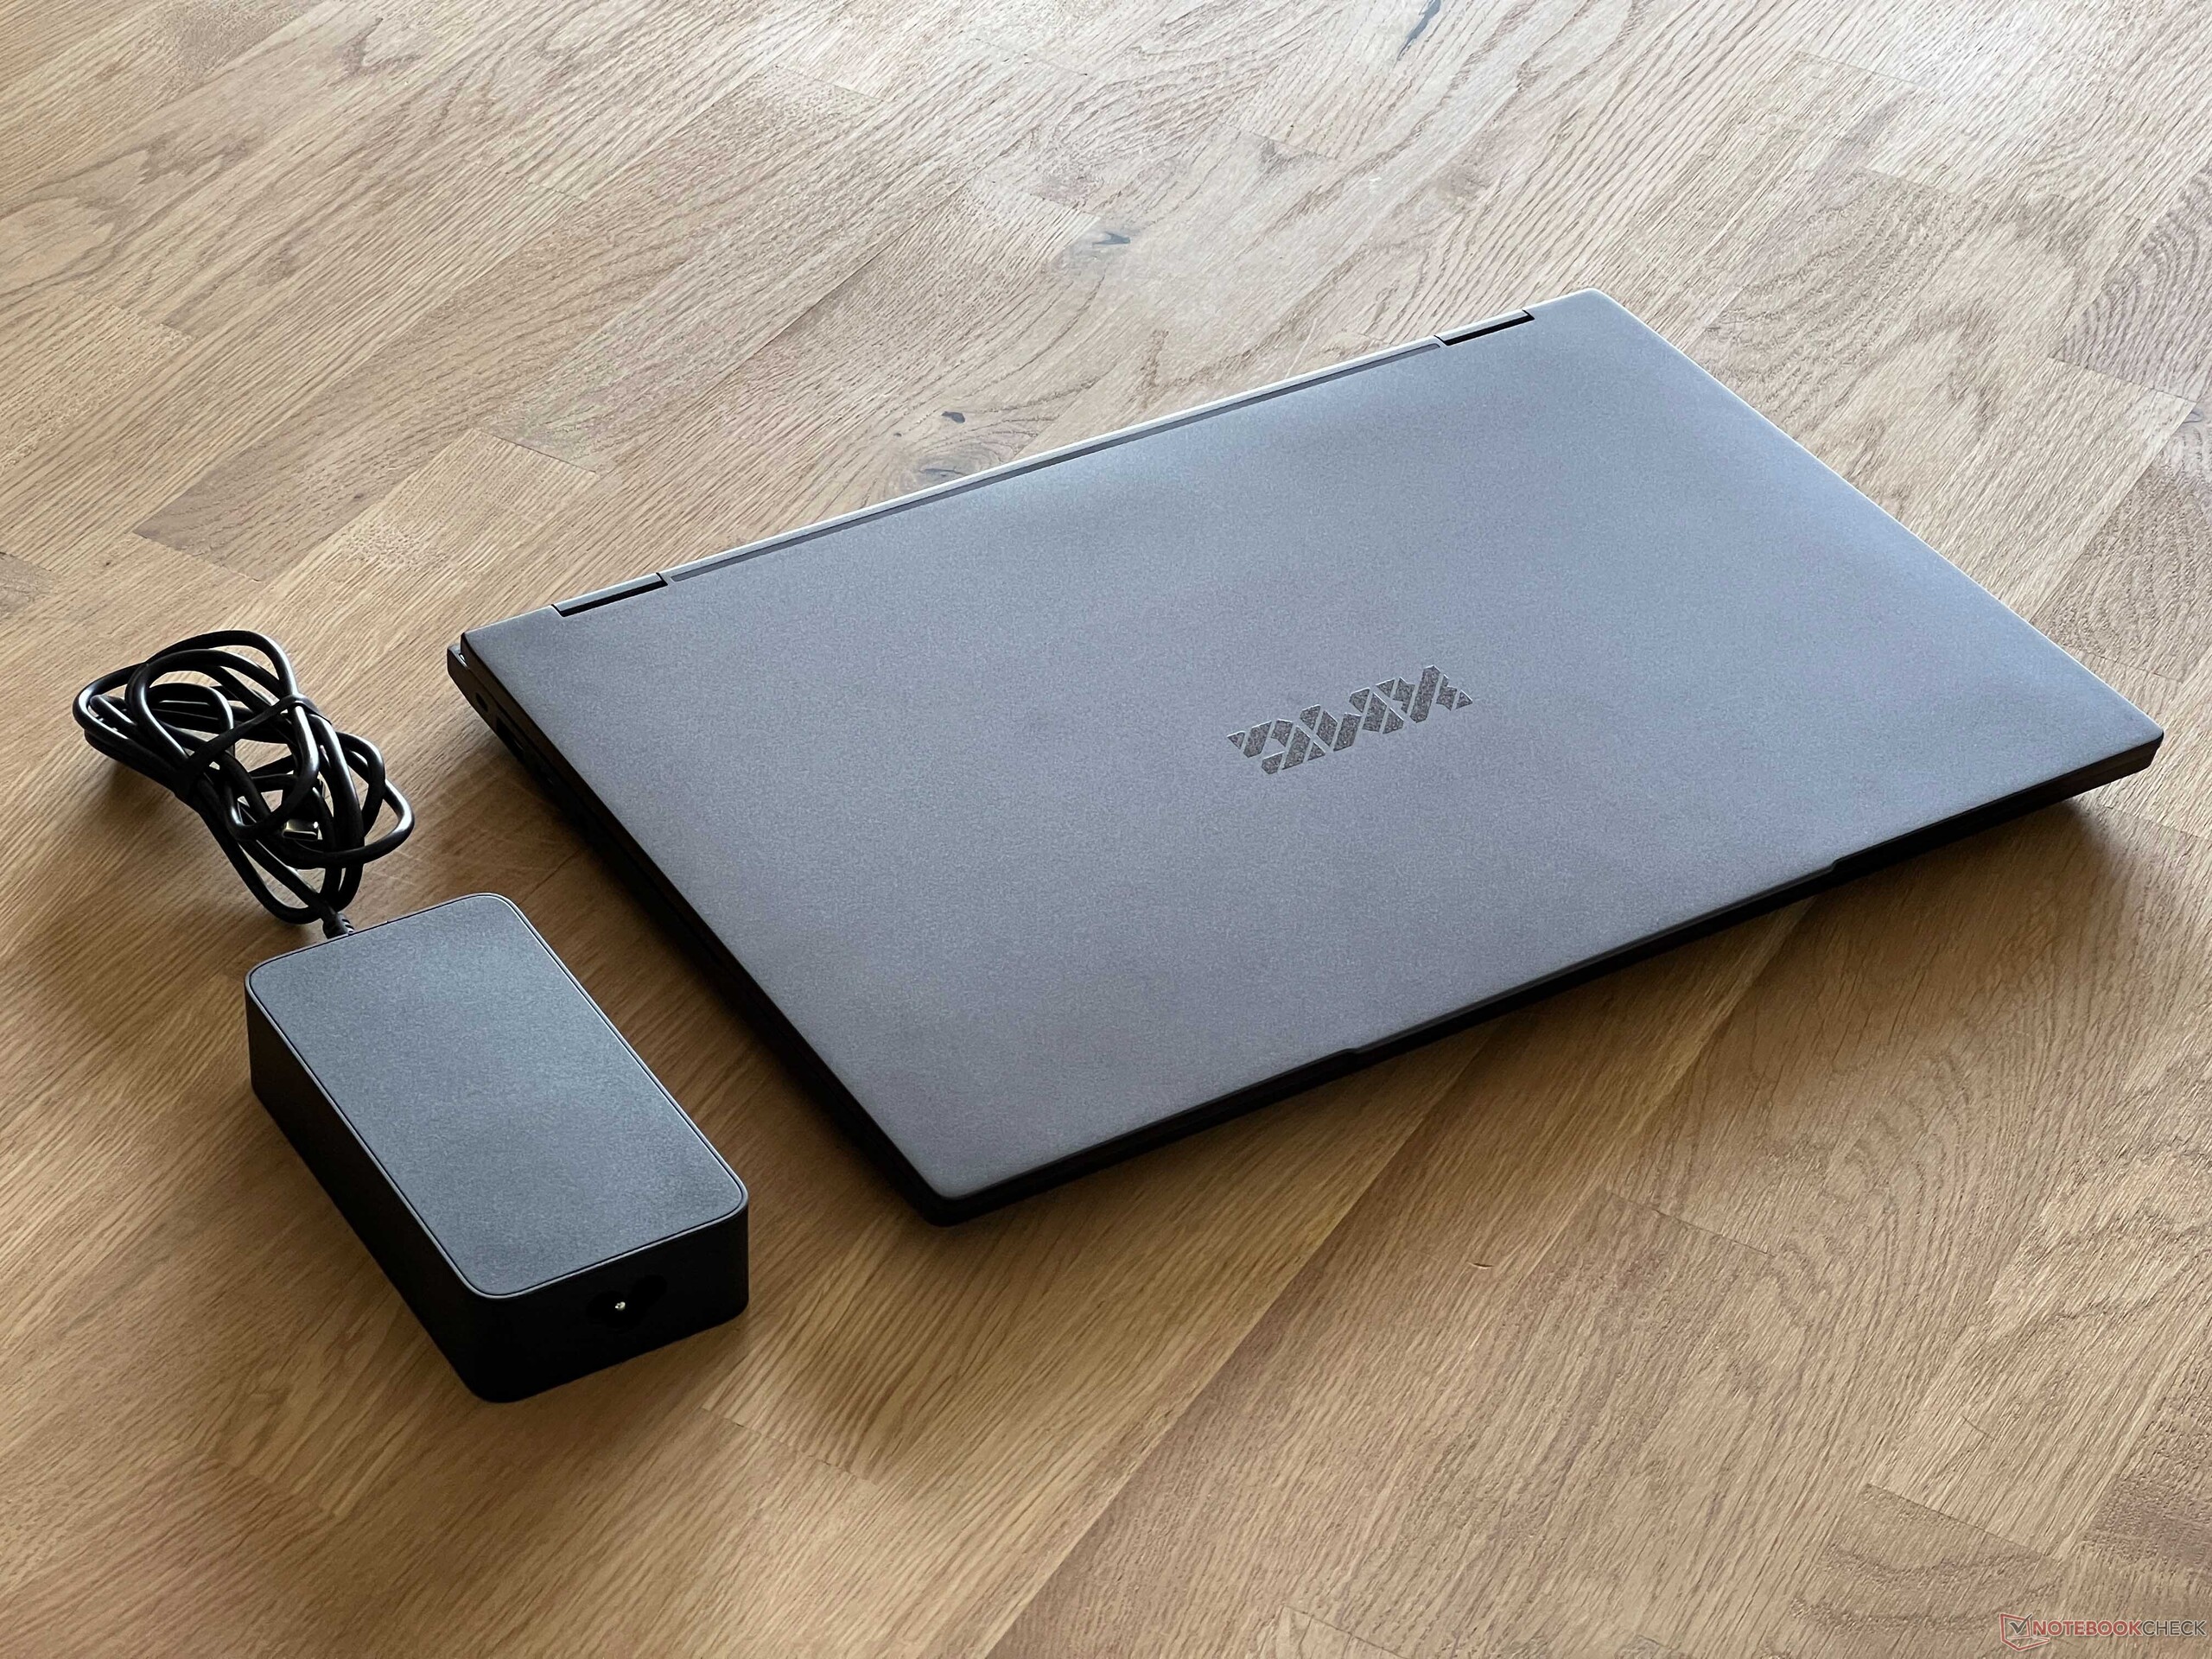
Yaklaşık 2 cm kalınlığıyla Evo 15 en ince dizüstü bilgisayar değildir, ancak öyle olmayı da amaçlamaz. Bununla birlikte, kapladığı alan 16 inçlik rakiplerine göre belirgin şekilde daha kompakttır. Yaklaşık 1,7 kg ağırlığı ile karşılaştırma alanımızdaki en hafif modellerden biridir. 100 watt'lık güç kaynağı 513 gram ağırlığındadır, ancak buna uzun güç kablosu da dahildir (1,8 + 1,5 metre).
Özellikler - Thunderbolt 4 ve USB 2.0
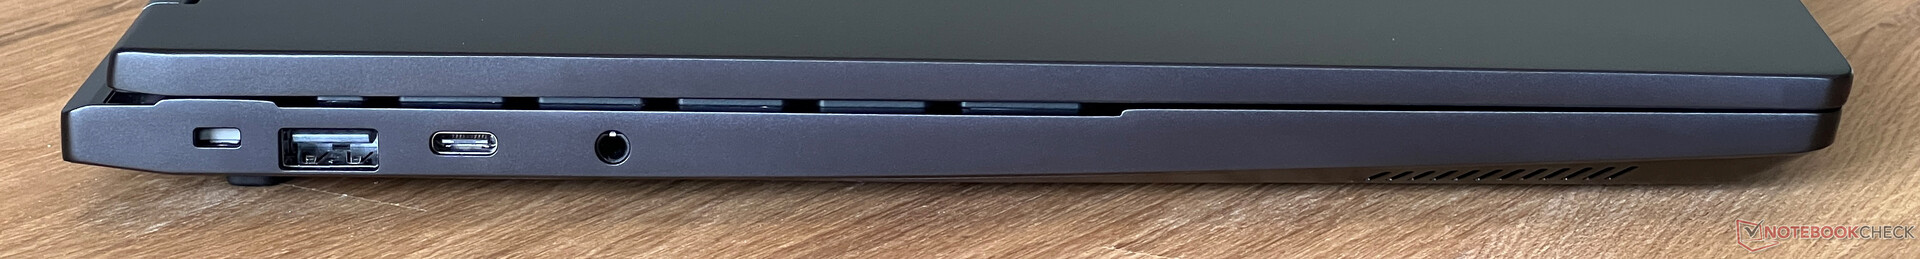
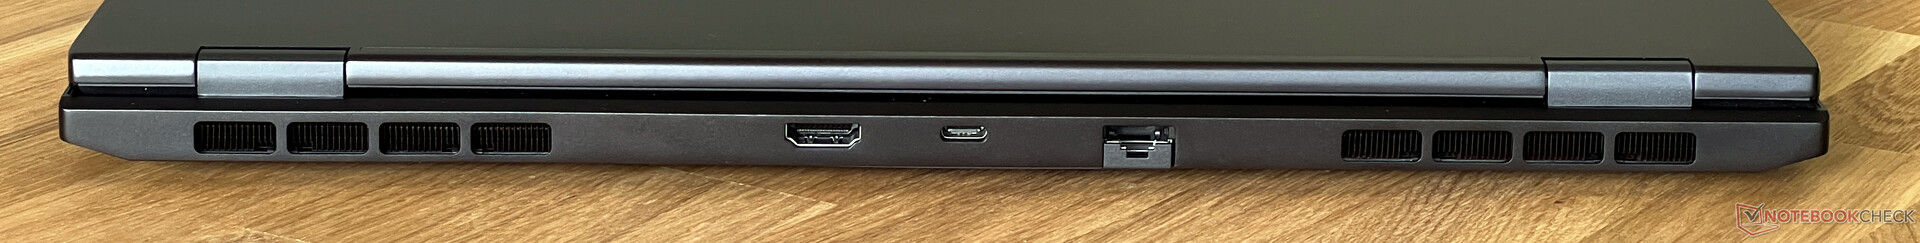
Bağlantı noktaları iki arka yan alana ve arka tarafa yayılmıştır. Prensip olarak, Thunderbolt 4 (veya AMD modelinde USB 4.0) dahil olmak üzere tüm modern standartlar mevcuttur ve yeterli USB bağlantı noktası da vardır, ancak USB 2.0 bağlantı noktasının modern bir dizüstü bilgisayarda ne işe yaradığını bilmiyoruz. En azından sadece bir tane var, diğer ikisi USB 3.2 Gen1 standardına uygun.
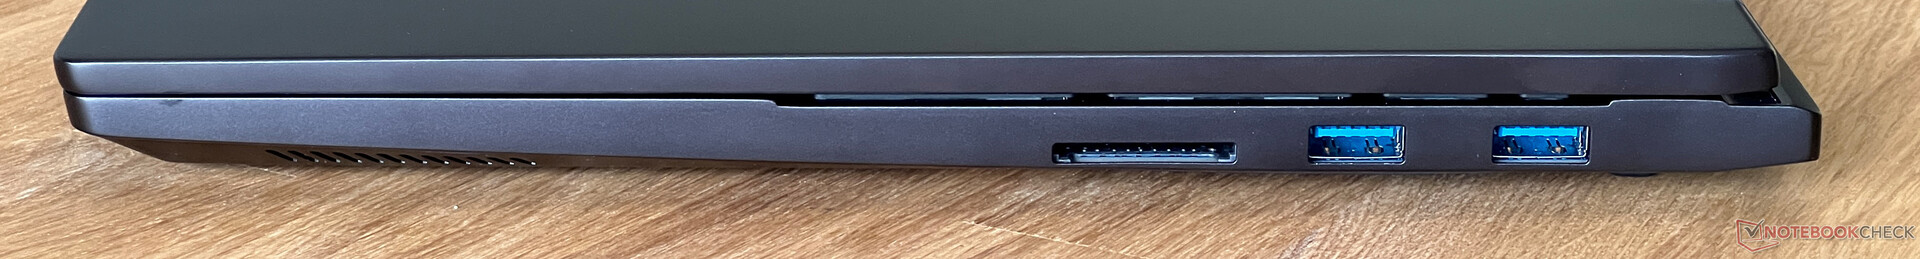
SD Kart Okuyucu
Referans kartımızla (Angelbird AV Pro V60) birlikte, tam teşekküllü SD kart okuyucu veri kopyalarken 90 MB/s ve ~50 MB/s'ye kadar aktarım hızlarına ulaşıyor. Genel olarak bunlar ortalamanın biraz altında sonuçlar.
| SD Card Reader | |
| average JPG Copy Test (av. of 3 runs) | |
| SCHENKER XMG Evo 15 (M24) (ADATA V90) | |
| SCHENKER XMG Evo 15 (M24) (Angelbird AV Pro V60) | |
| Sınıf ortalaması Multimedia (18.4 - 201, n=56, son 2 yıl) | |
| Lenovo IdeaPad Pro 5 16IMH G9 (Angelbird AV Pro V60) | |
| Dell Inspiron 16 7640 2-in-1 (Toshiba Exceria Pro SDXC 64 GB UHS-II) | |
| maximum AS SSD Seq Read Test (1GB) | |
| SCHENKER XMG Evo 15 (M24) (ADATA V90) | |
| SCHENKER XMG Evo 15 (M24) (Angelbird AV Pro V60) | |
| Sınıf ortalaması Multimedia (25.8 - 266, n=56, son 2 yıl) | |
| Lenovo IdeaPad Pro 5 16IMH G9 (Angelbird AV Pro V60) | |
| Dell Inspiron 16 7640 2-in-1 (Toshiba Exceria Pro SDXC 64 GB UHS-II) | |
İletişim
Evo 15, hala RJ45 Gigabit ağ bağlantısına sahip olan birkaç modern multimedya dizüstü bilgisayardan biridir. Intel'in AX211 modülü kablosuz ağlar için de kullanılabilir (Wi-Fi 6E). Asus'un referans yönlendiricisi ile birlikte, aktarım hızları iyiydi ve test sırasında Wi-Fi sinyali ile ilgili herhangi bir sorun yaşamadık.
| Networking | |
| SCHENKER XMG Evo 15 (M24) | |
| iperf3 transmit AXE11000 | |
| iperf3 receive AXE11000 | |
| Dell Inspiron 16 7640 2-in-1 | |
| iperf3 transmit AXE11000 | |
| iperf3 receive AXE11000 | |
| iperf3 transmit AXE11000 6GHz | |
| iperf3 receive AXE11000 6GHz | |
| Medion S10 OLED | |
| iperf3 transmit AXE11000 | |
| iperf3 receive AXE11000 | |
| Xiaomi RedmiBook Pro 16 2024 | |
| iperf3 transmit AXE11000 | |
| iperf3 receive AXE11000 | |
| Lenovo IdeaPad Pro 5 16IMH G9 | |
| iperf3 transmit AXE11000 | |
| iperf3 receive AXE11000 | |
| Lenovo ThinkPad T16 G2 21K70035GE | |
| iperf3 transmit AXE11000 | |
| iperf3 receive AXE11000 | |
| iperf3 transmit AXE11000 6GHz | |
| iperf3 receive AXE11000 6GHz | |
Web kamerası
Mekanik deklanşörlü 2 MP kamera ekranın üst kenarına yerleştirilmiştir ve ortalama görüntü kalitesi sunar. Microsoft Studio efektleri de desteklenir ve ek IR kamera Windows Hello aracılığıyla yüz tanıma özelliğini etkinleştirir.

 Arc 8-Core, Ultra 7 155H, Samsung 990 Pro 1 TB")
 Arc 8-Core, Ultra 7 155H, Samsung 990 Pro 1 TB")
Aksesuarlar
Teslimat kapsamında 100 watt'lık güç kaynağı ünitesinin yanı sıra sürücüleri içeren bir USB bellek ve kumaştan yapılmış büyük bir XMG mouse pad de yer alıyor.
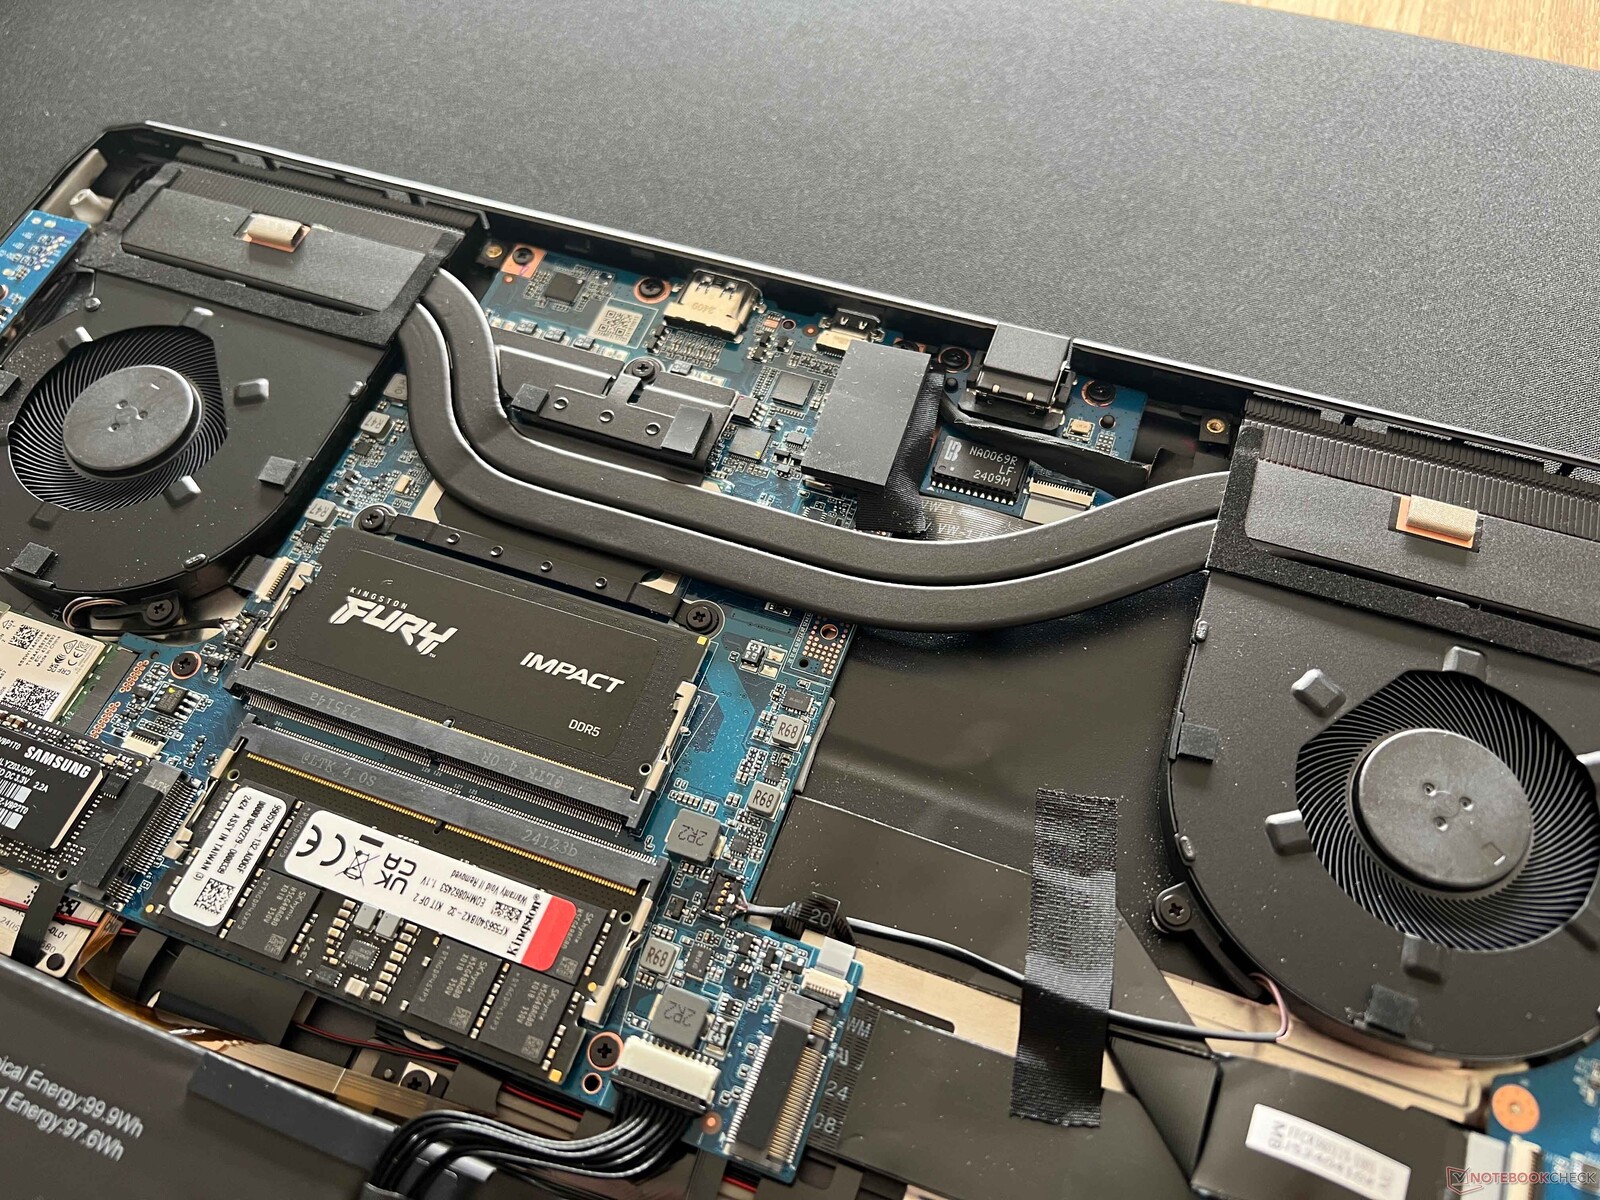
Bakım
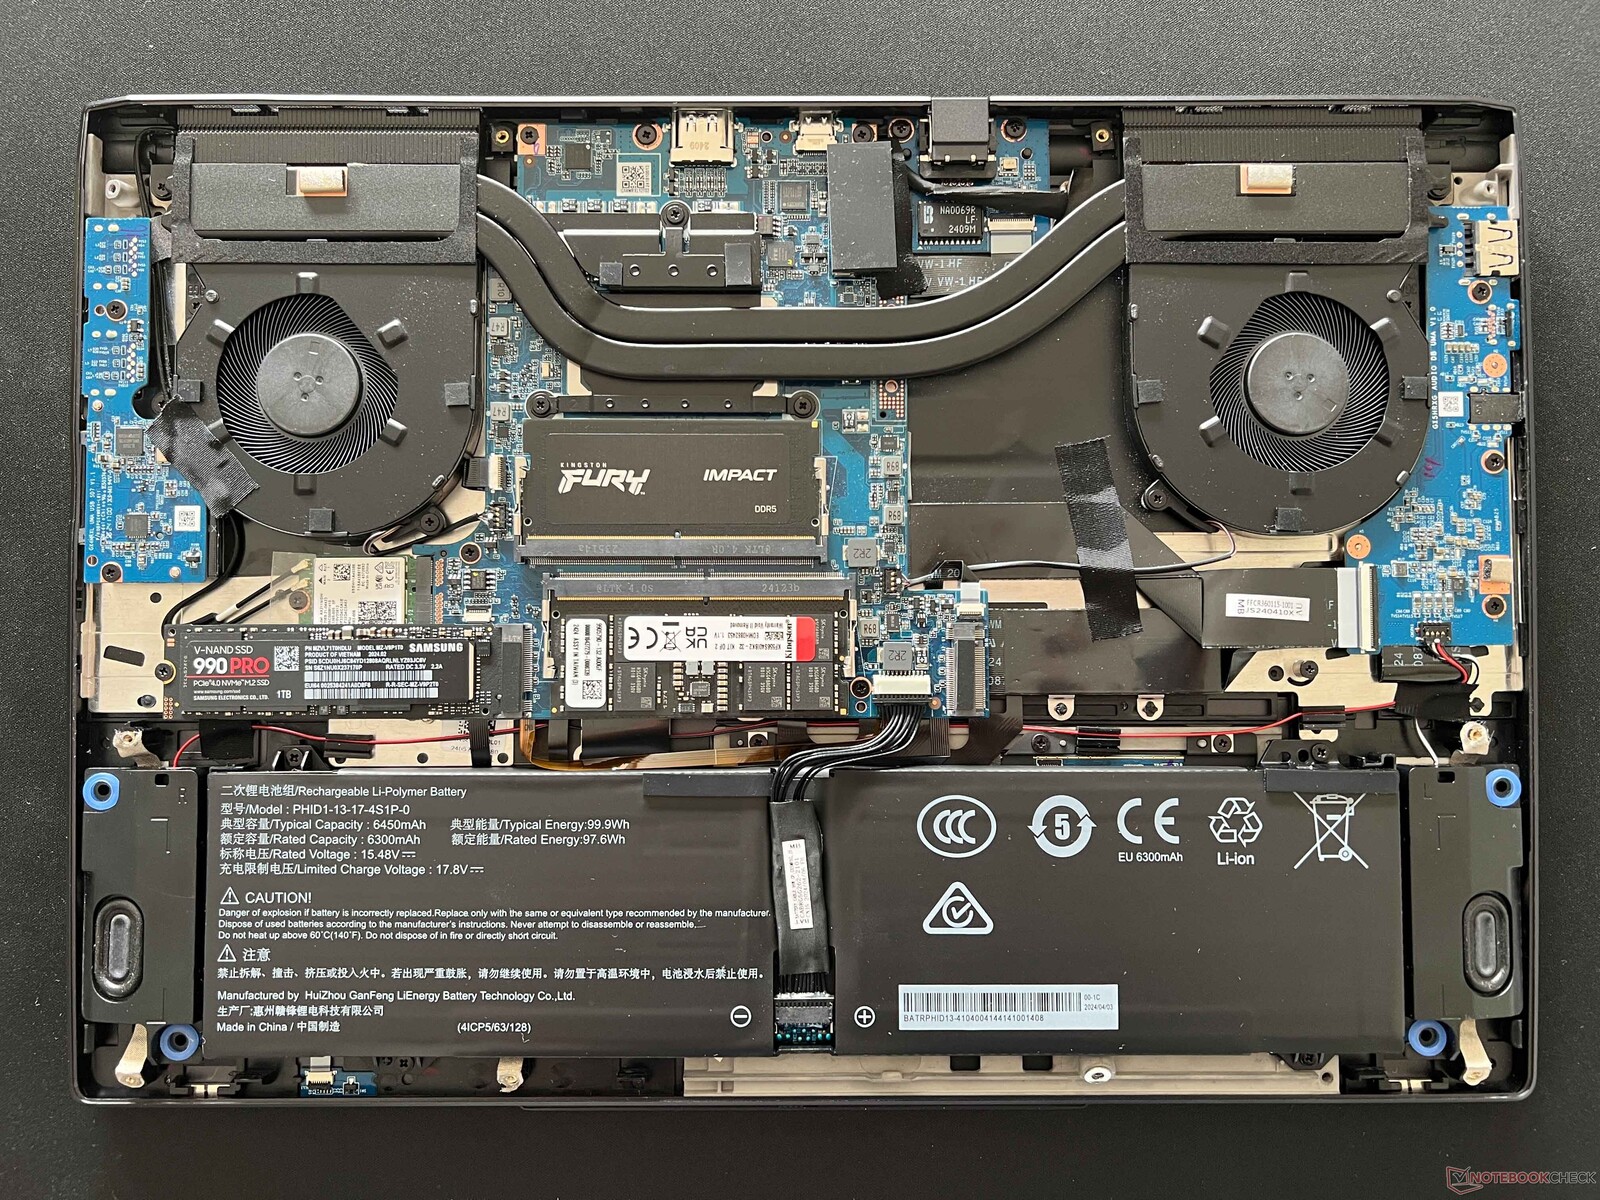
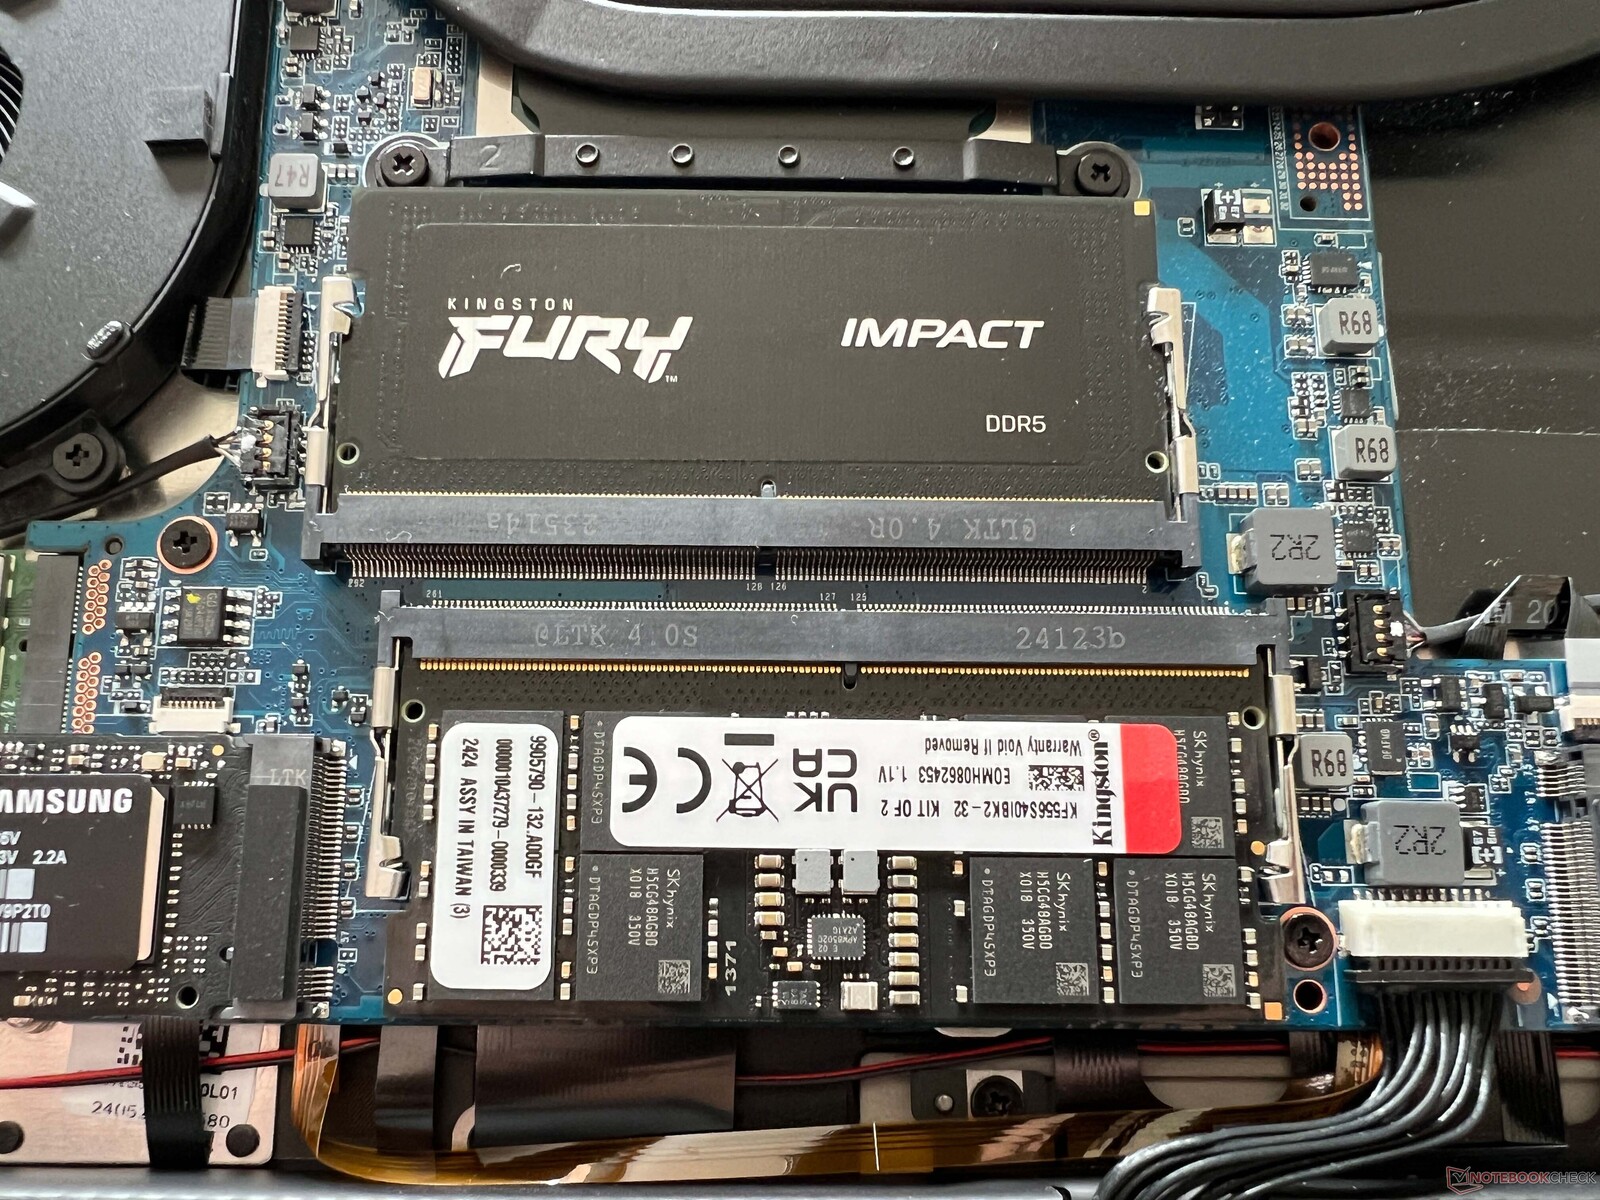
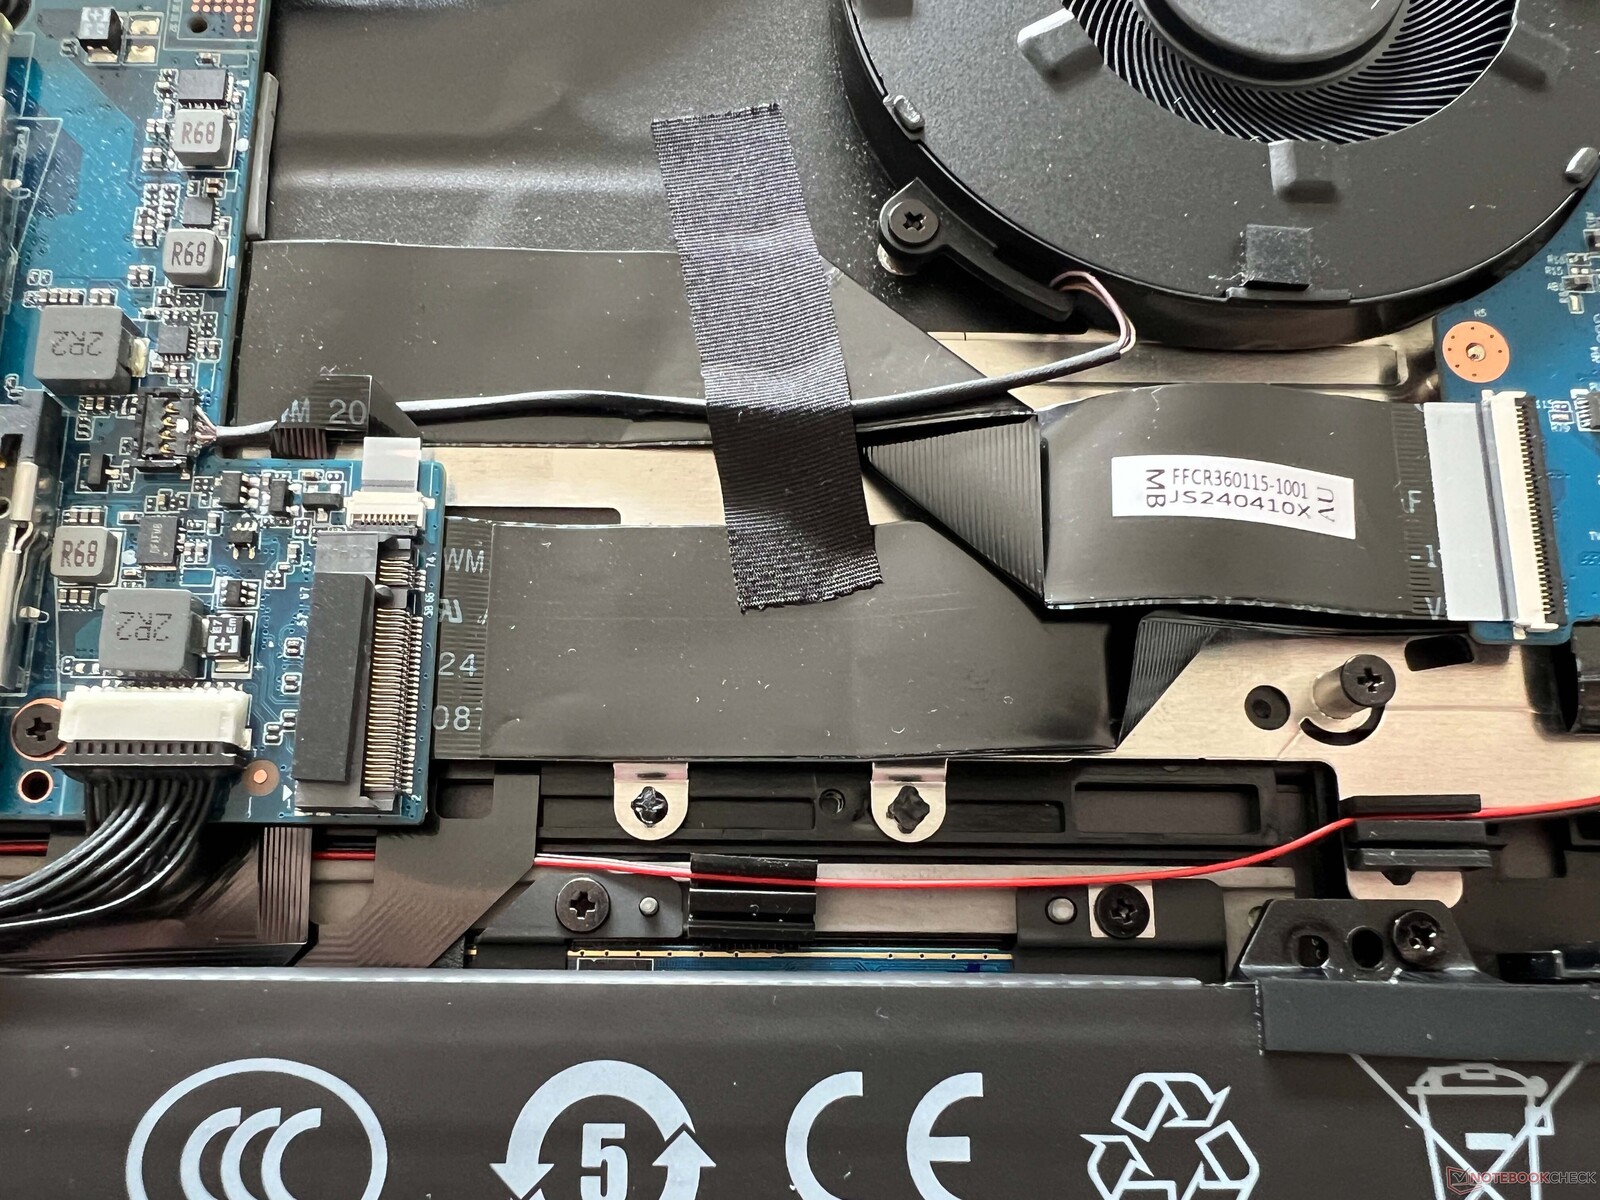
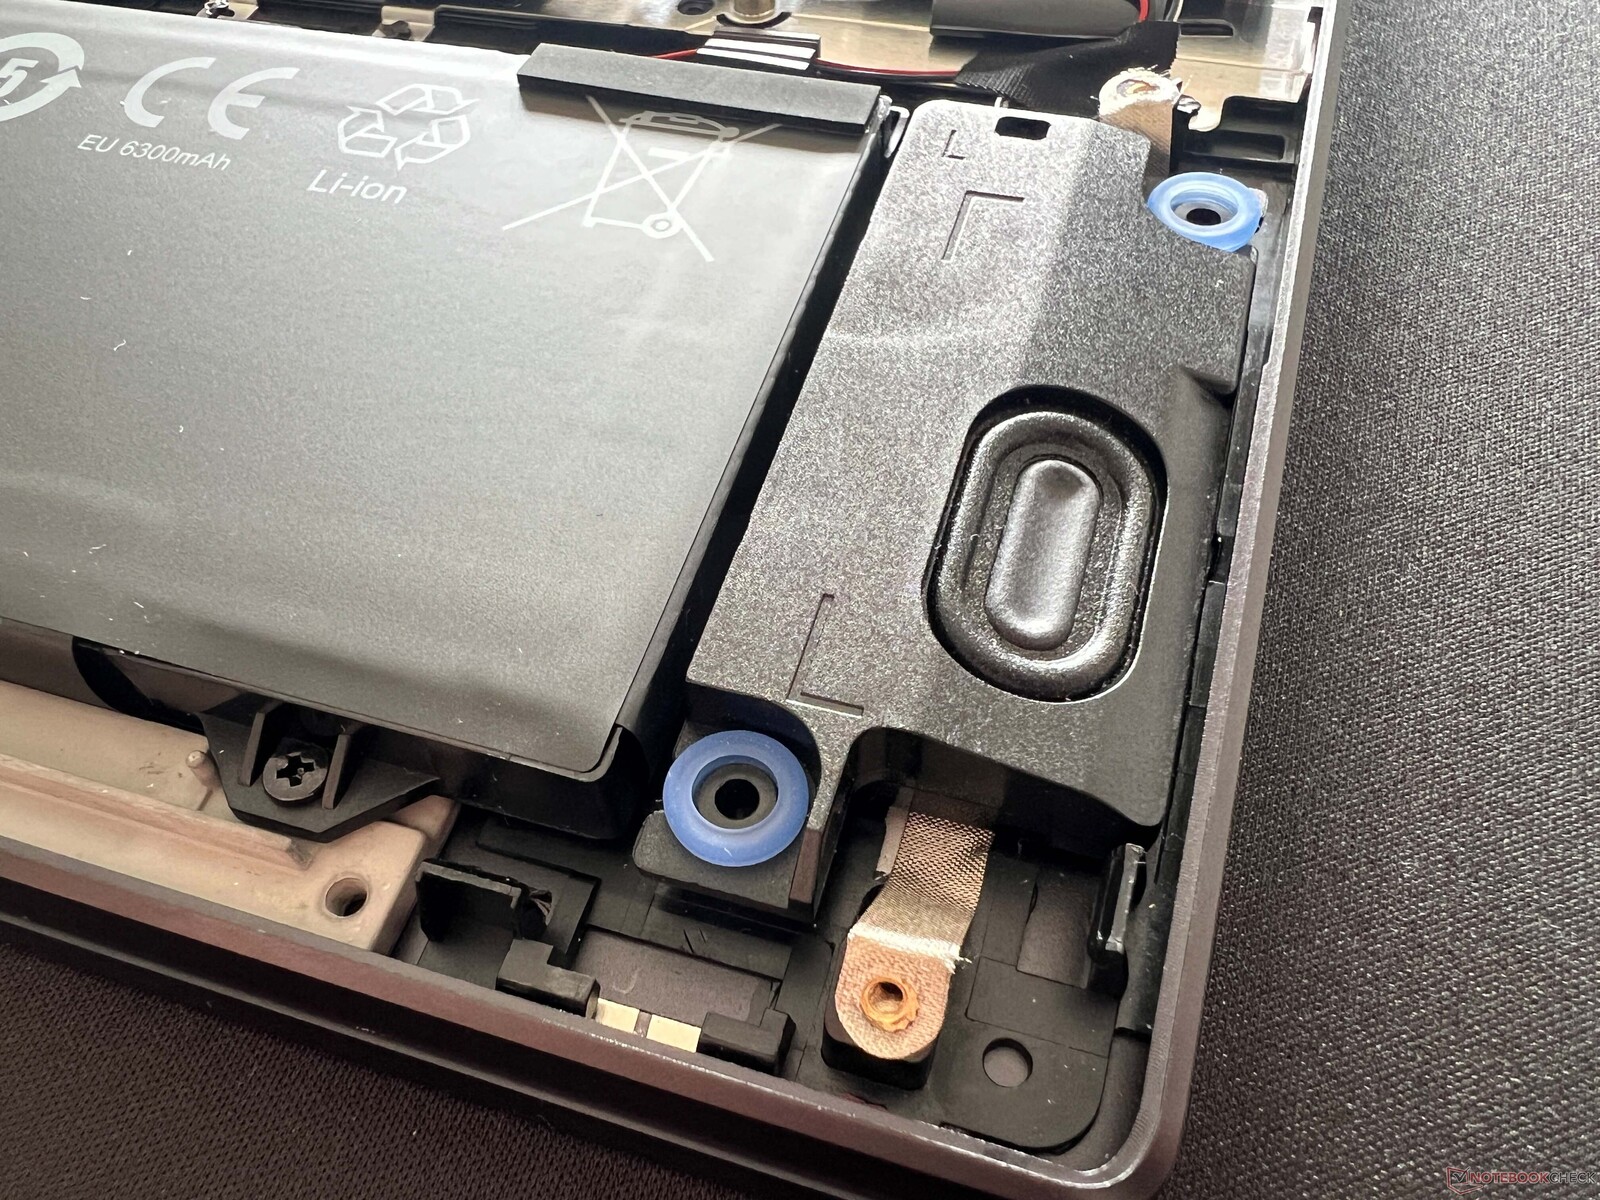
Şimdi Evo 15'in en önemli özelliklerinden biri olan bakım seçeneklerine geliyoruz. Alt kapağı çıkardıktan sonra (normal Phillips vidalarla tutturulmuş), fanlara ve vidalı bataryaya, ayrıca RAM için iki SO-DIMM yuvasına ve iki M.2 2280 SSD yuvasına erişebilirsiniz; bu nedenle yükseltmeler çocuk oyuncağıdır. Gerekirse WLAN modülü de değiştirilebilir.
Sürdürülebilirlik
Schenker'in ürün sayfasında dizüstü bilgisayar üretimi sırasında ortaya çıkan CO2 emisyonları hakkında herhangi bir bilgi bulunmuyor. Ambalaj büyük ölçüde karton ve plastikten yapılmış. Güç tüketimi hakkında daha sonra konuşacağız, ancak 1,4 watt'lık bekleme tüketimi çok yüksek.
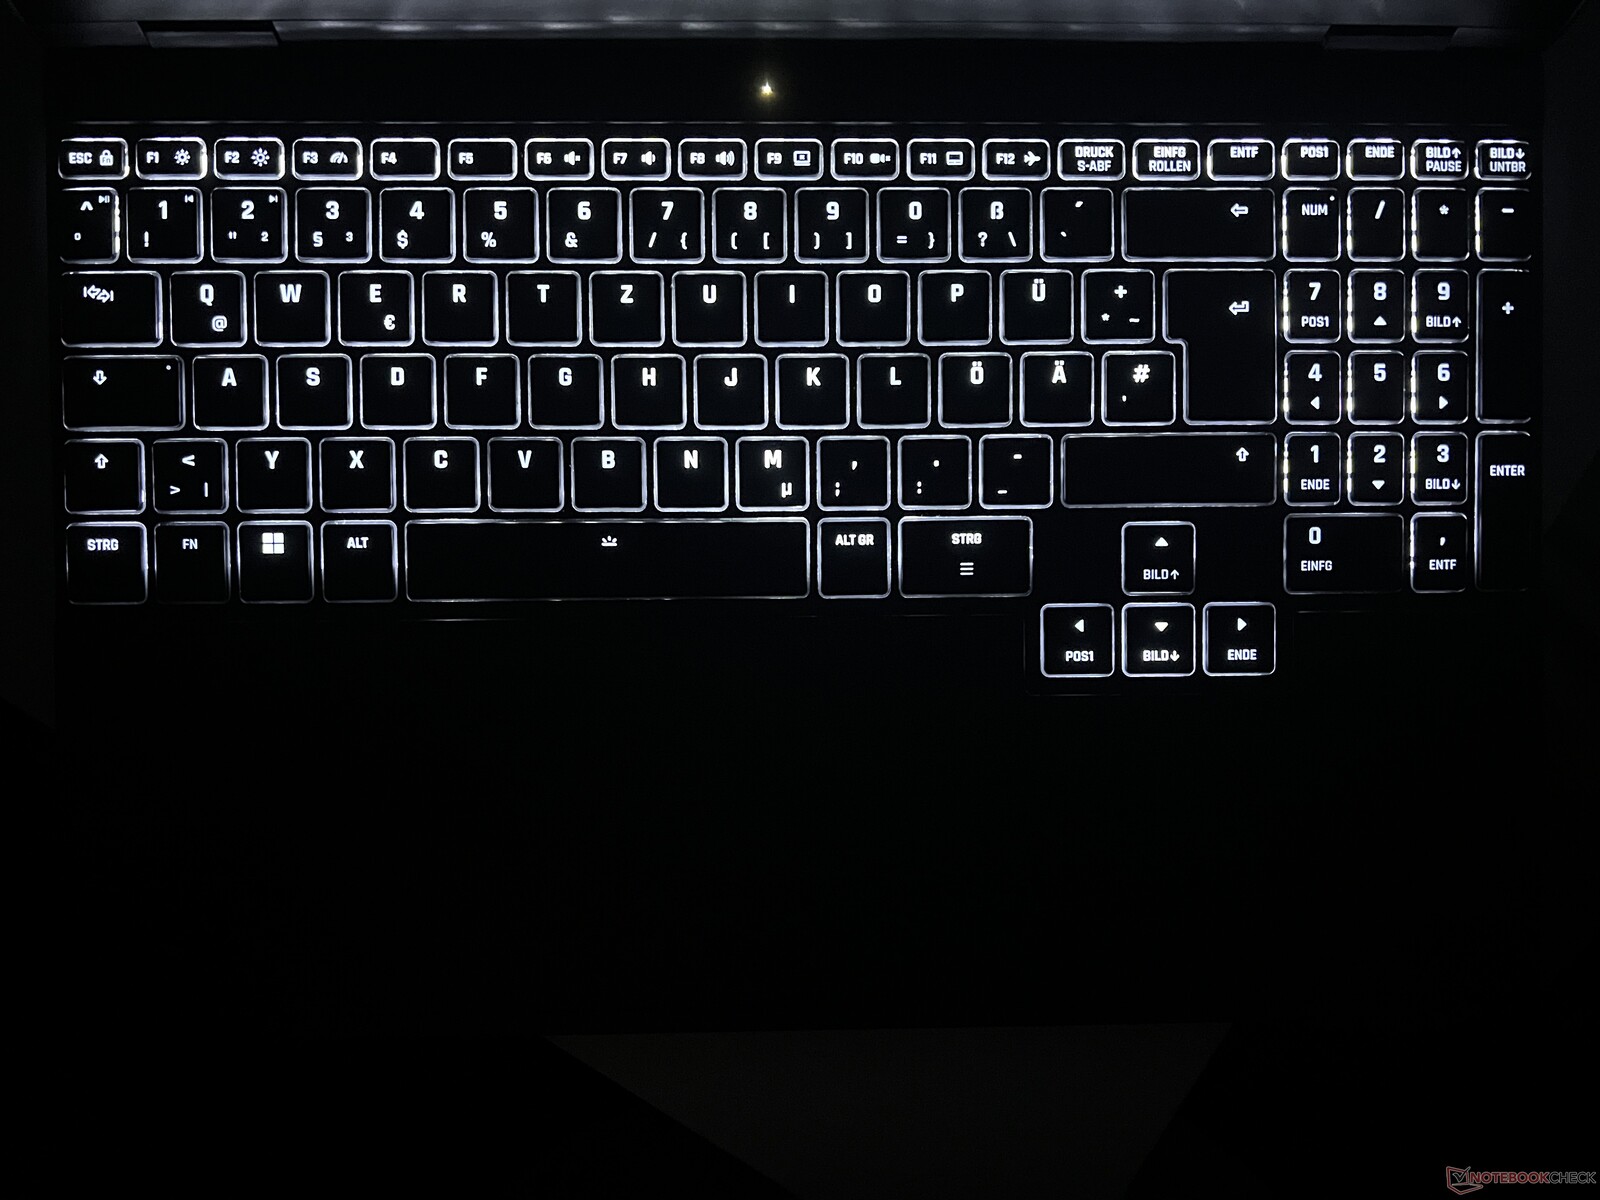
Giriş aygıtları - Sayısal tuş takımlı büyük klavye
Klavye ana ünitenin tüm genişliğini kaplar ve ayrıca bu tuşlar biraz daha dar olmasına rağmen özel bir sayısal tuş takımı sunar. Ancak ok tuşlarının boyutu küçültülmemiştir. Genel yazma deneyimi rahattır ve uzun metinler bile sorun yaratmaz, ancak iş dizüstü bilgisayarları gibi ThinkPad T16 burada hala avantajlar sunuyor. Buna ek olarak, özellikle büyük tuşlar oldukça gürültülüdür ve biraz cılız hissettirir. Schenker, müşterileriyle yaptığı bir ankete dayanarak özel bir yardımcı pilot tuşu takmamaya karar verdi. Beyaz arka ışık şu anda iki yoğunluk seviyesi sunuyor, ancak yakında dört yoğunluk seviyesi sunacak bir güncelleme yayınlanacak.
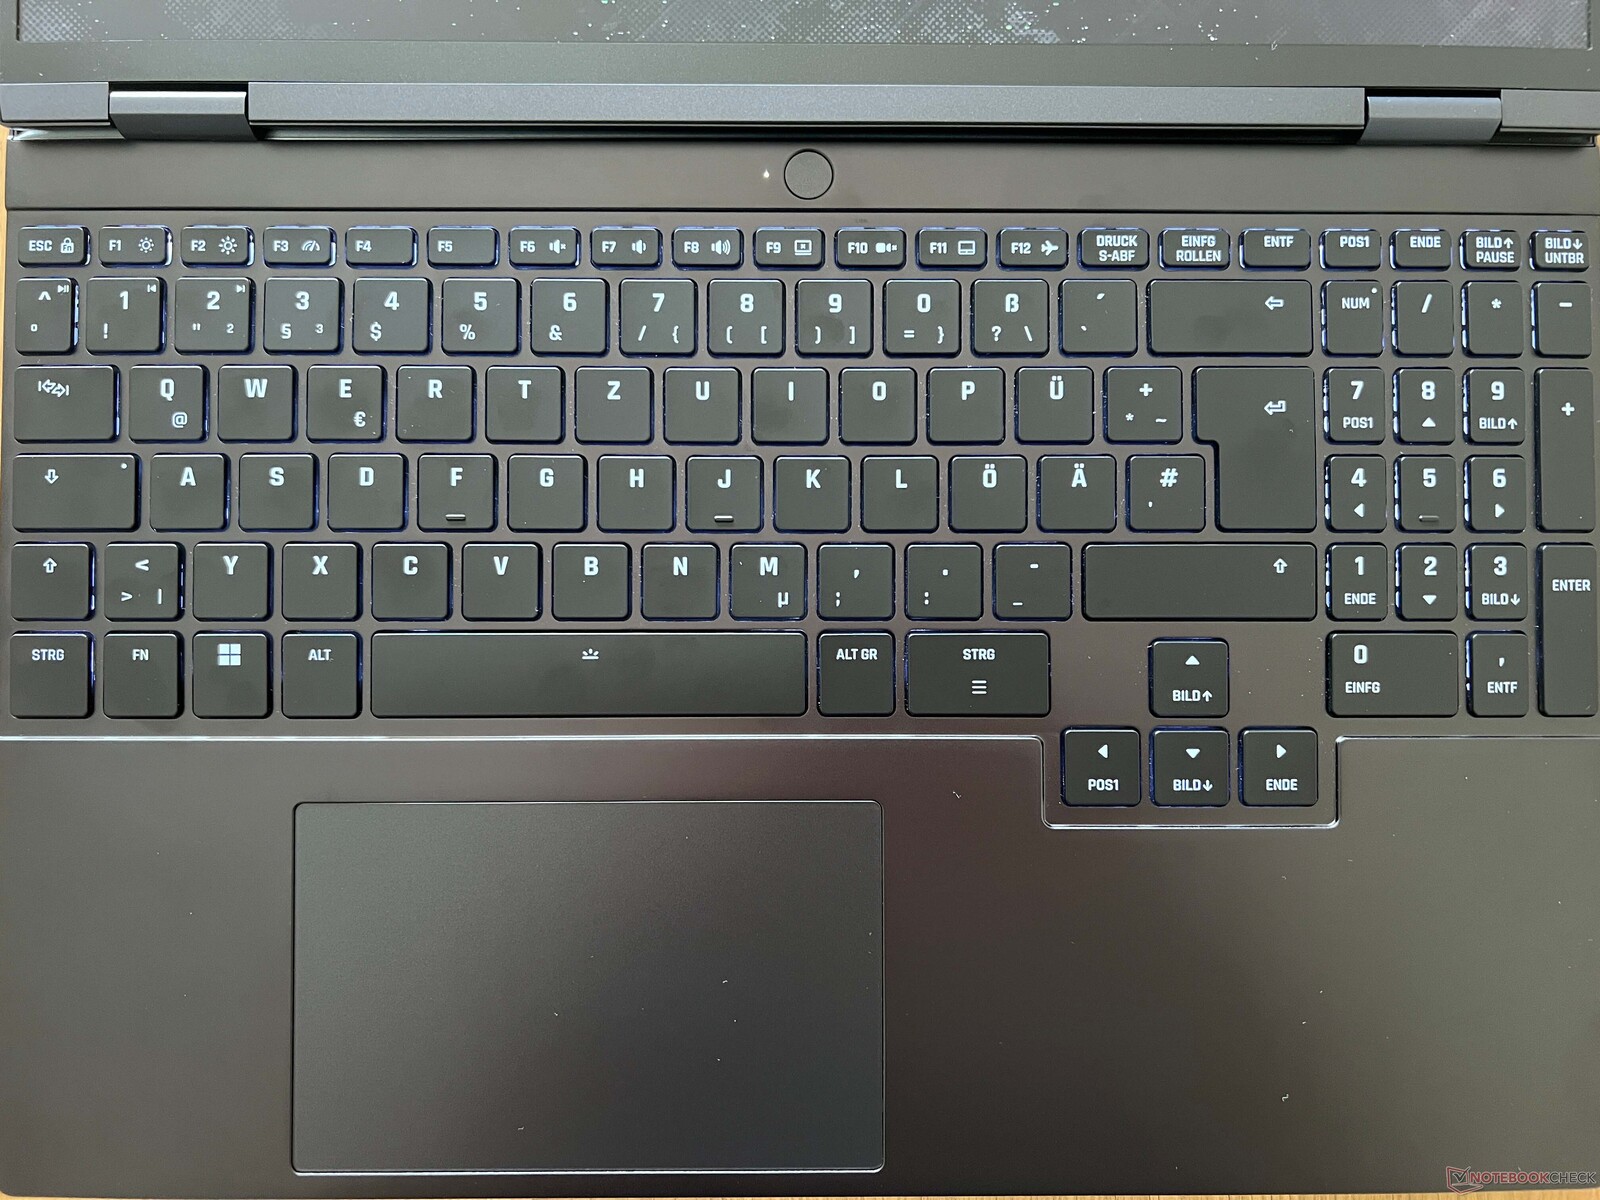
12.3 x 7.7 cm boyutlarındaki ClickPad, girişler ve işaretçi kontrolü için yeterli alan sunuyor, ancak açıkça sola kaydırılmış, bu da alışması biraz zaman alıyor. Pedin alt kısmına tıklanabiliyor ancak bu da yüksek ve ucuz bir ses çıkmasına neden oluyor.
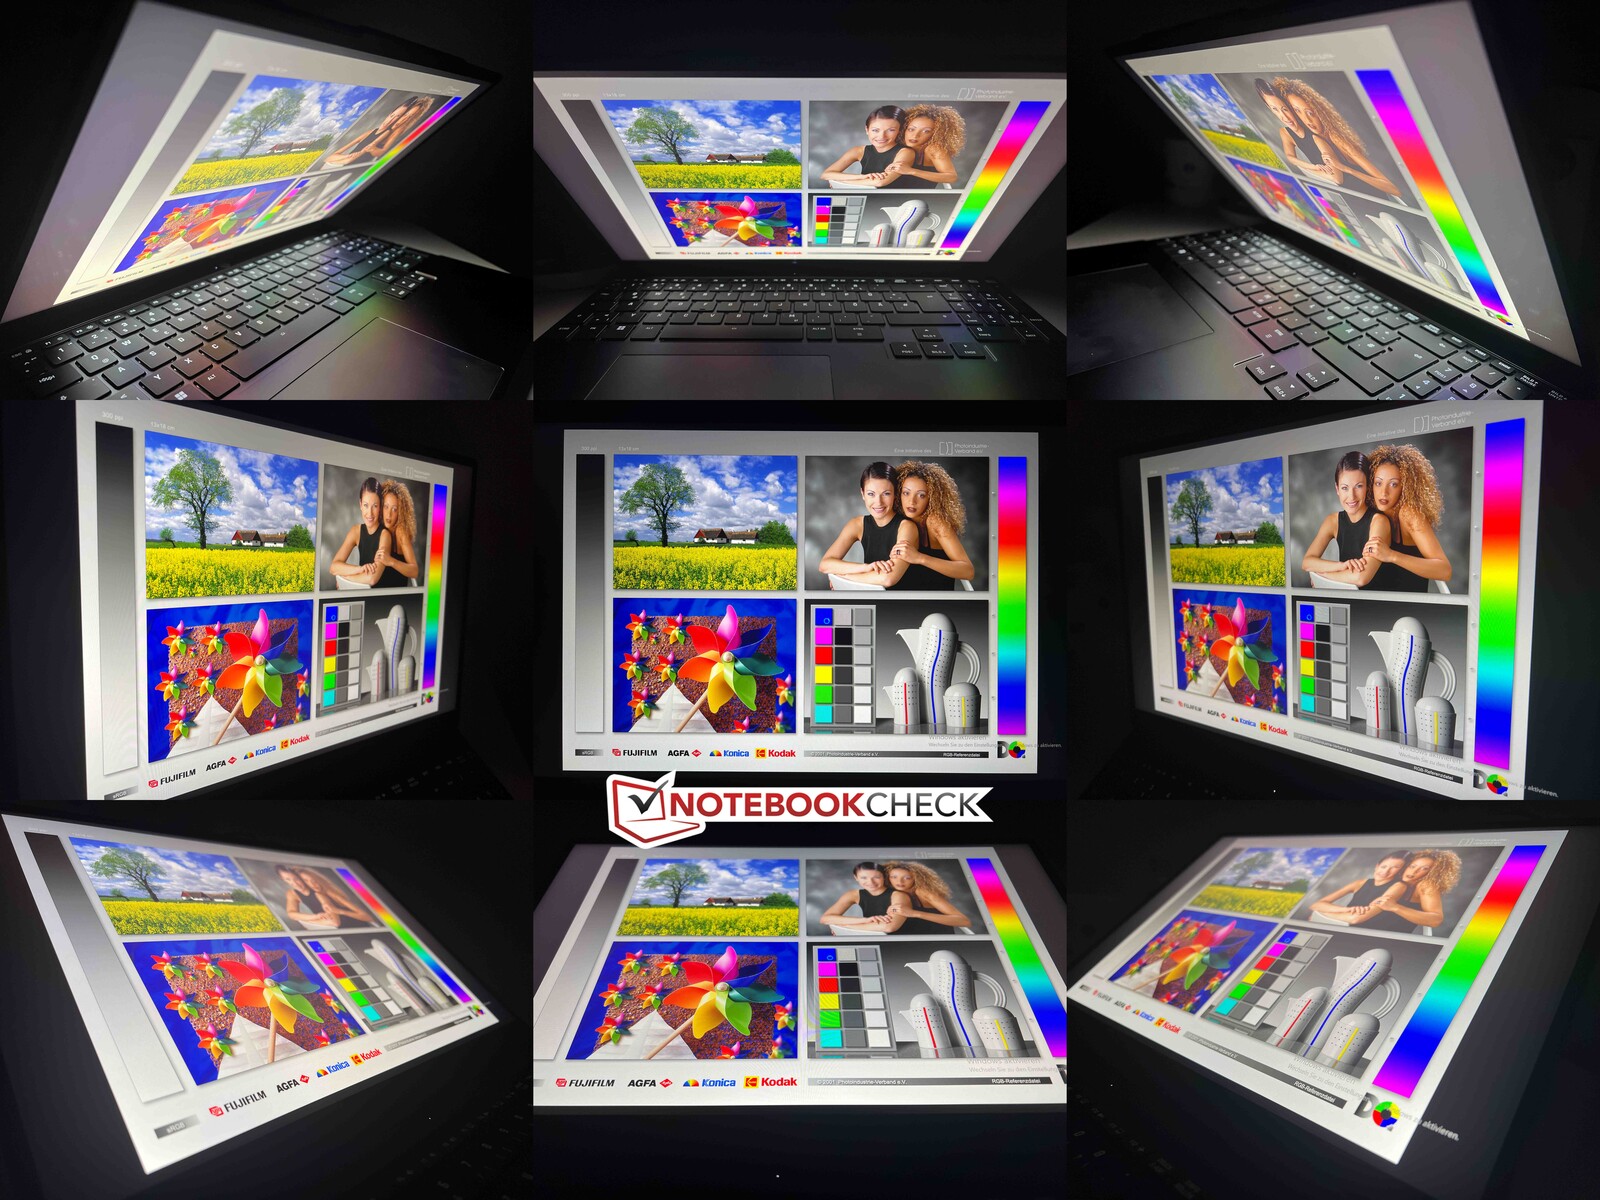
Ekran - 240 Hz ile IPS
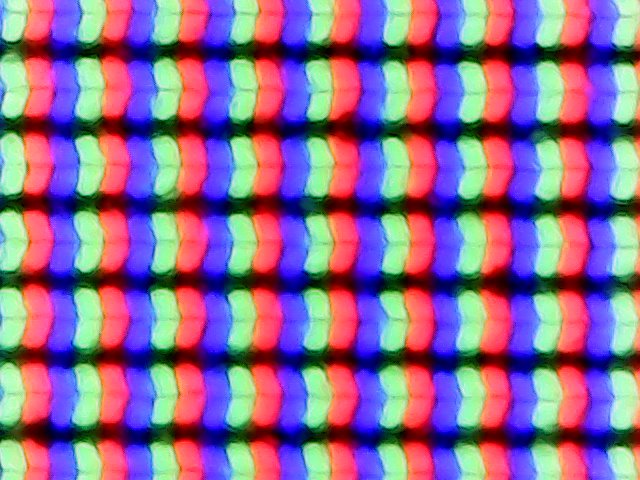
Schenker, Fusion 15'ten 240 Hz ile tanıdık WQHD panelini kullanıyor, bu nedenle 2.560 x 1.600 piksel çözünürlüğe sahip mat bir IPS panel. Öznel görüntü izlenimi mükemmel, çünkü tüm içerikler çok keskin ve renk üretimi de iyi, ancak elbette OLED panellerin parlak renklerini bekleyemezsiniz. Bununla birlikte, PWM titremesi de yok, ancak tepki süreleri hala çok hızlı. Mat yüzeye rağmen, parlak yüzeyler bile grenli görünmüyor ve yüksek frekans sayesinde hareketler çok yumuşak. Adaptive Sync de destekleniyor, ancak bir parlaklık sensörü takılı değil.
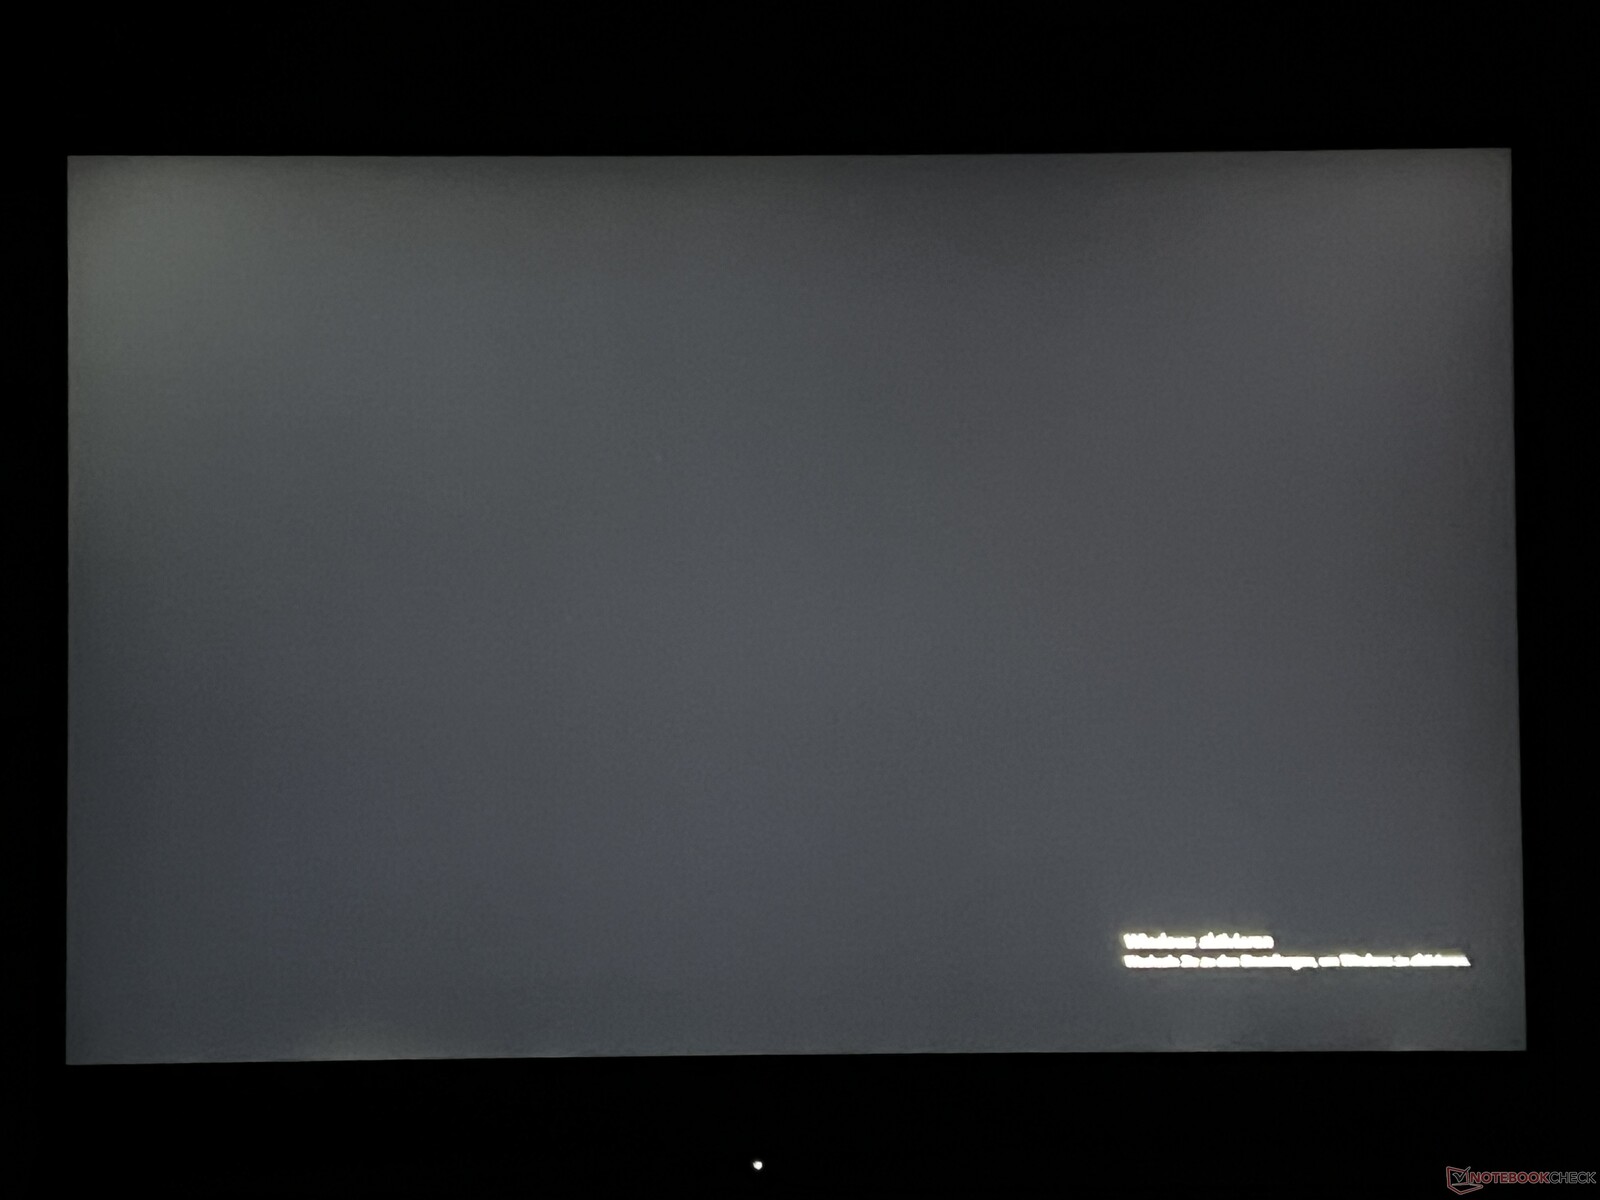
Parlaklık 500 cd/m² olarak belirtilmiş, ancak test cihazımız ortalama 585 cd/m² ile çok daha iyi bir sonuç elde etti. Bununla birlikte, 0,61 cd/m² olan siyah değeri sonuç olarak zarar görüyor ve siyah içeriğin oldukça koyu gri görünmesine neden oluyor. Ayrıca, maksimum kontrast oranı yalnızca ~1.000:1'dir.
| |||||||||||||||||||||||||
Aydınlatma: 93 %
Batarya modunda parlaklık: 608 cd/m²
Kontrast: 997:1 (Siyah: 0.61 cd/m²)
ΔE Color 2.1 | 0.5-29.43 Ø4.87, calibrated: 1.2
ΔE Greyscale 2.7 | 0.5-98 Ø5.1
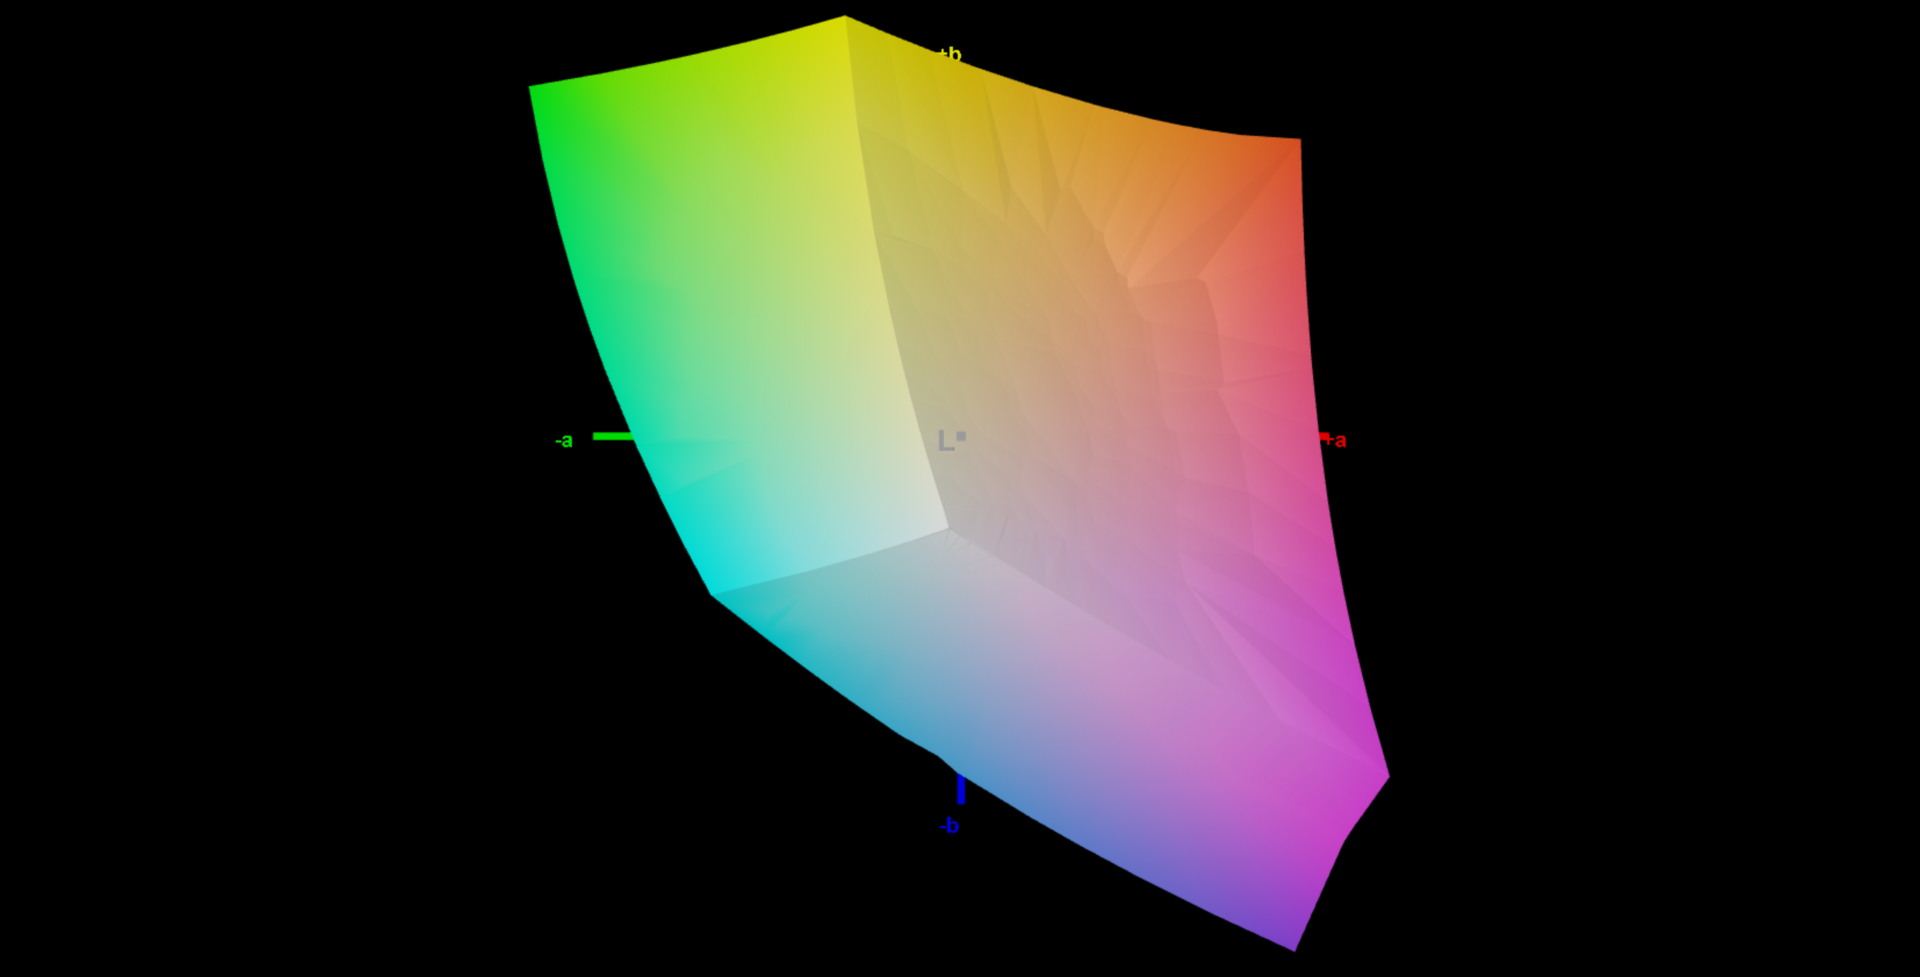
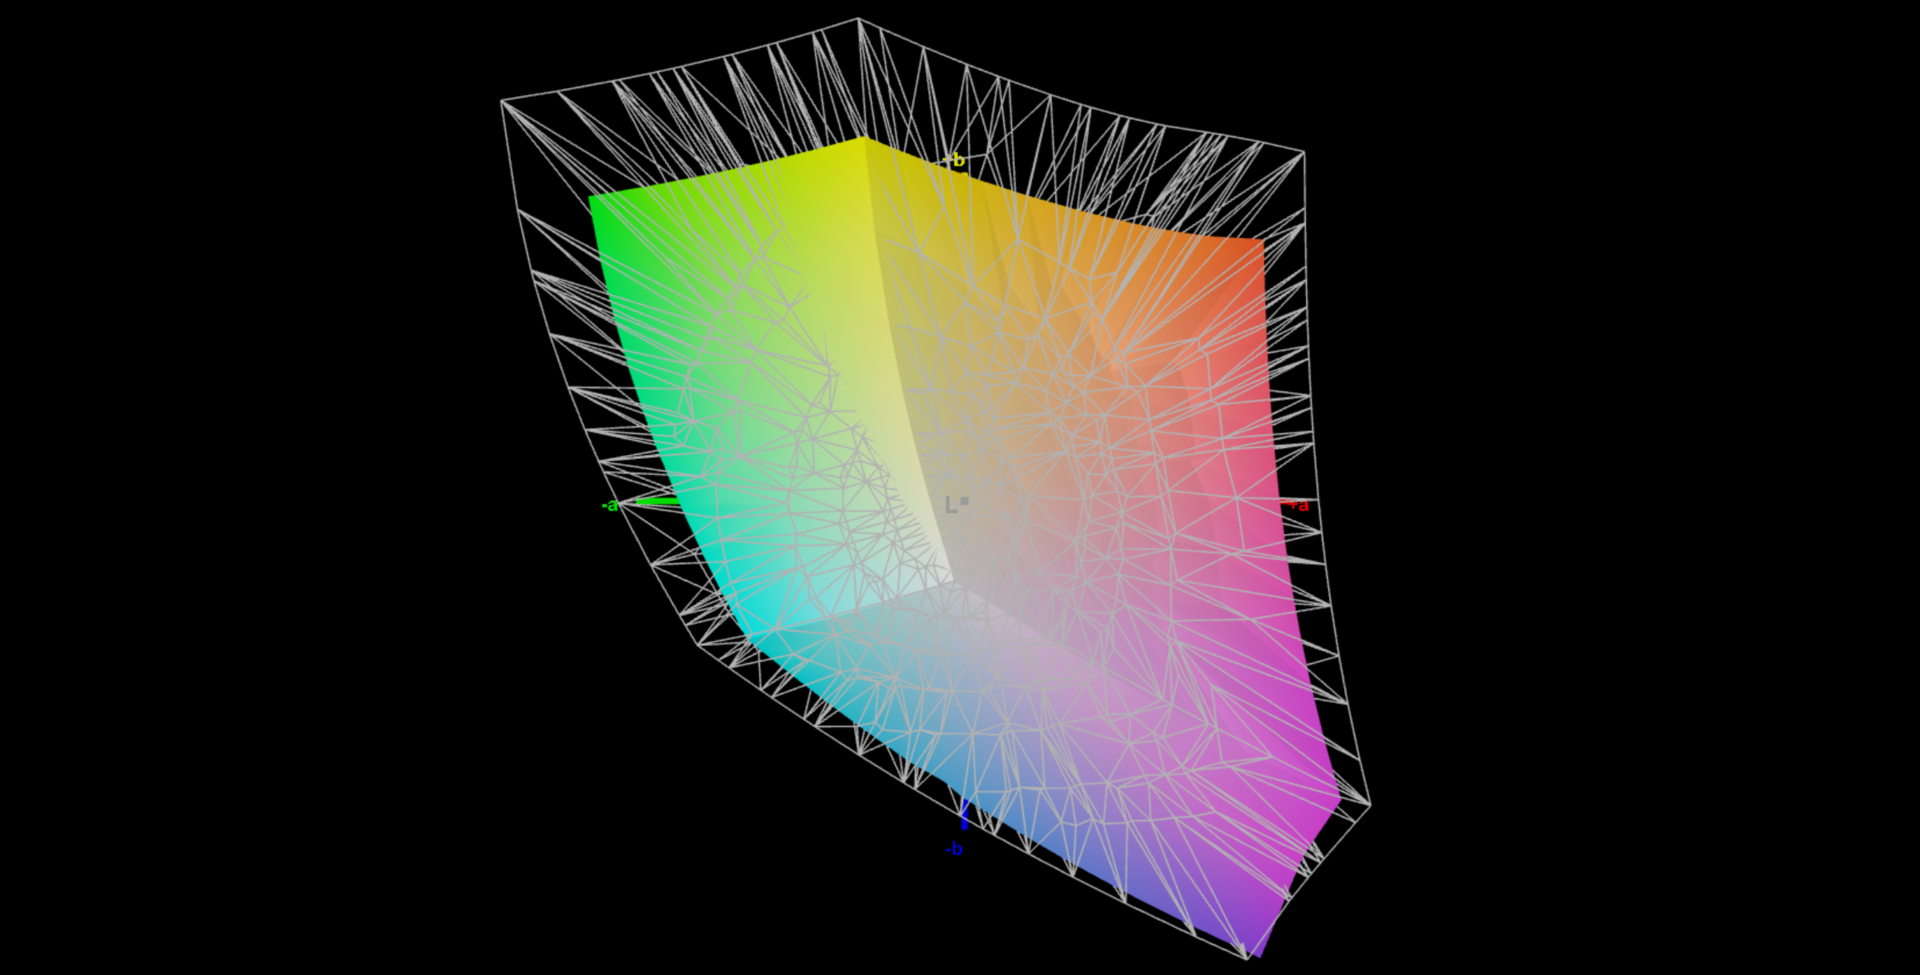
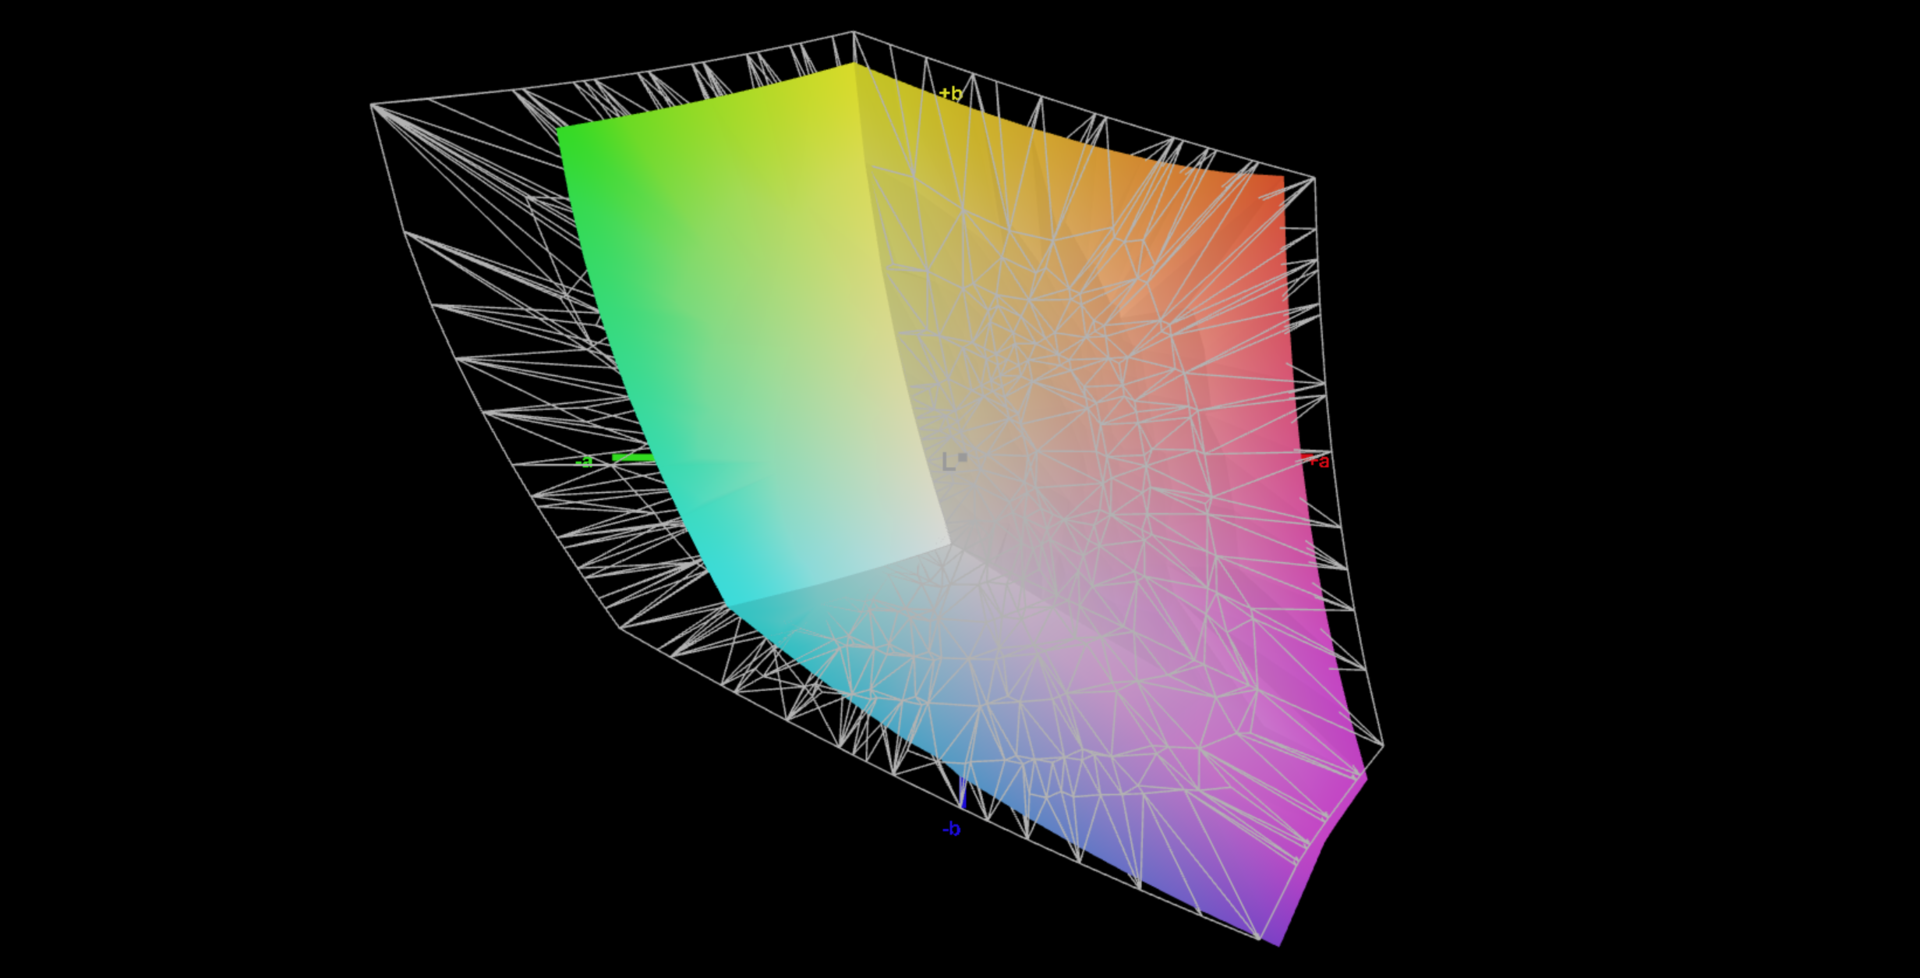
74.2% AdobeRGB 1998 (Argyll 2.2.0 3D)
100% sRGB (Argyll 2.2.0 3D)
73.6% Display P3 (Argyll 2.2.0 3D)
Gamma: 2.2
| SCHENKER XMG Evo 15 (M24) NE153QDM-NZ1, IPS, 2560x1600, 15.3", 240 Hz | Dell Inspiron 16 7640 2-in-1 AU Optronics B160QAT, Mini-LED, 2560x1600, 16", 90 Hz | Medion S10 OLED Samsung SDC4174, OLED, 3840x2400, 16", 60 Hz | Xiaomi RedmiBook Pro 16 2024 TL160MDMP03_0, IPS, 3072x1920, 16", 165 Hz | Lenovo IdeaPad Pro 5 16IMH G9 NE160QDM-NY2, IPS, 2560x1600, 16", 120 Hz | Lenovo ThinkPad T16 G2 21K70035GE B160UAN01.K, IPS LED, 1920x1200, 16", Hz | |
|---|---|---|---|---|---|---|
| Display | 20% | 23% | 18% | -10% | 2% | |
| Display P3 Coverage | 73.6 | 99.4 35% | 99.9 36% | 98.8 34% | 63.3 -14% | 75.9 3% |
| sRGB Coverage | 100 | 100 0% | 100 0% | 100 0% | 95.2 -5% | 98.2 -2% |
| AdobeRGB 1998 Coverage | 74.2 | 92.5 25% | 98.6 33% | 89.9 21% | 65.3 -12% | 77.2 4% |
| Response Times | -527% | 71% | -437% | -141% | -548% | |
| Response Time Grey 50% / Grey 80% * | 4.6 ? | 15.4 ? -235% | 1.7 ? 63% | 39.2 ? -752% | 15 ? -226% | 40.8 ? -787% |
| Response Time Black / White * | 6.6 ? | 60.6 ? -818% | 1.4 ? 79% | 14.6 ? -121% | 10.3 ? -56% | 26.9 ? -308% |
| PWM Frequency | 2753.7 ? | 60 ? | ||||
| Screen | 3% | 329% | -8% | -12% | -31% | |
| Brightness middle | 608 | 413 -32% | 307 -50% | 520 -14% | 368 -39% | 446 -27% |
| Brightness | 585 | 409 -30% | 307 -48% | 510 -13% | 368 -37% | 425 -27% |
| Brightness Distribution | 93 | 97 4% | 96 3% | 93 0% | 91 -2% | 91 -2% |
| Black Level * | 0.61 | 0.14 77% | 0.01 98% | 0.35 43% | 0.31 49% | 0.28 54% |
| Contrast | 997 | 2950 196% | 30700 2979% | 1486 49% | 1187 19% | 1593 60% |
| Colorchecker dE 2000 * | 2.1 | 3.48 -66% | 2.1 -0% | 2.9 -38% | 2.4 -14% | 3.7 -76% |
| Colorchecker dE 2000 max. * | 4.3 | 6.97 -62% | 4.87 -13% | 6.2 -44% | 6.5 -51% | 8.8 -105% |
| Colorchecker dE 2000 calibrated * | 1.2 | 2.08 -73% | 1.1 8% | 0.8 33% | 1.6 -33% | |
| Greyscale dE 2000 * | 2.7 | 4.5 -67% | 0.9 67% | 4.3 -59% | 4.5 -67% | 6 -122% |
| Gamma | 2.2 100% | 2.15 102% | 2.197 100% | 2.19 100% | 2.21 100% | 2.2 100% |
| CCT | 6168 105% | 6446 101% | 6513 100% | 7422 88% | 6324 103% | 6499 100% |
| Toplam Ortalama (Program / Ayarlar) | -168% /
-75% | 141% /
227% | -142% /
-63% | -54% /
-30% | -192% /
-98% |
* ... daha küçük daha iyidir
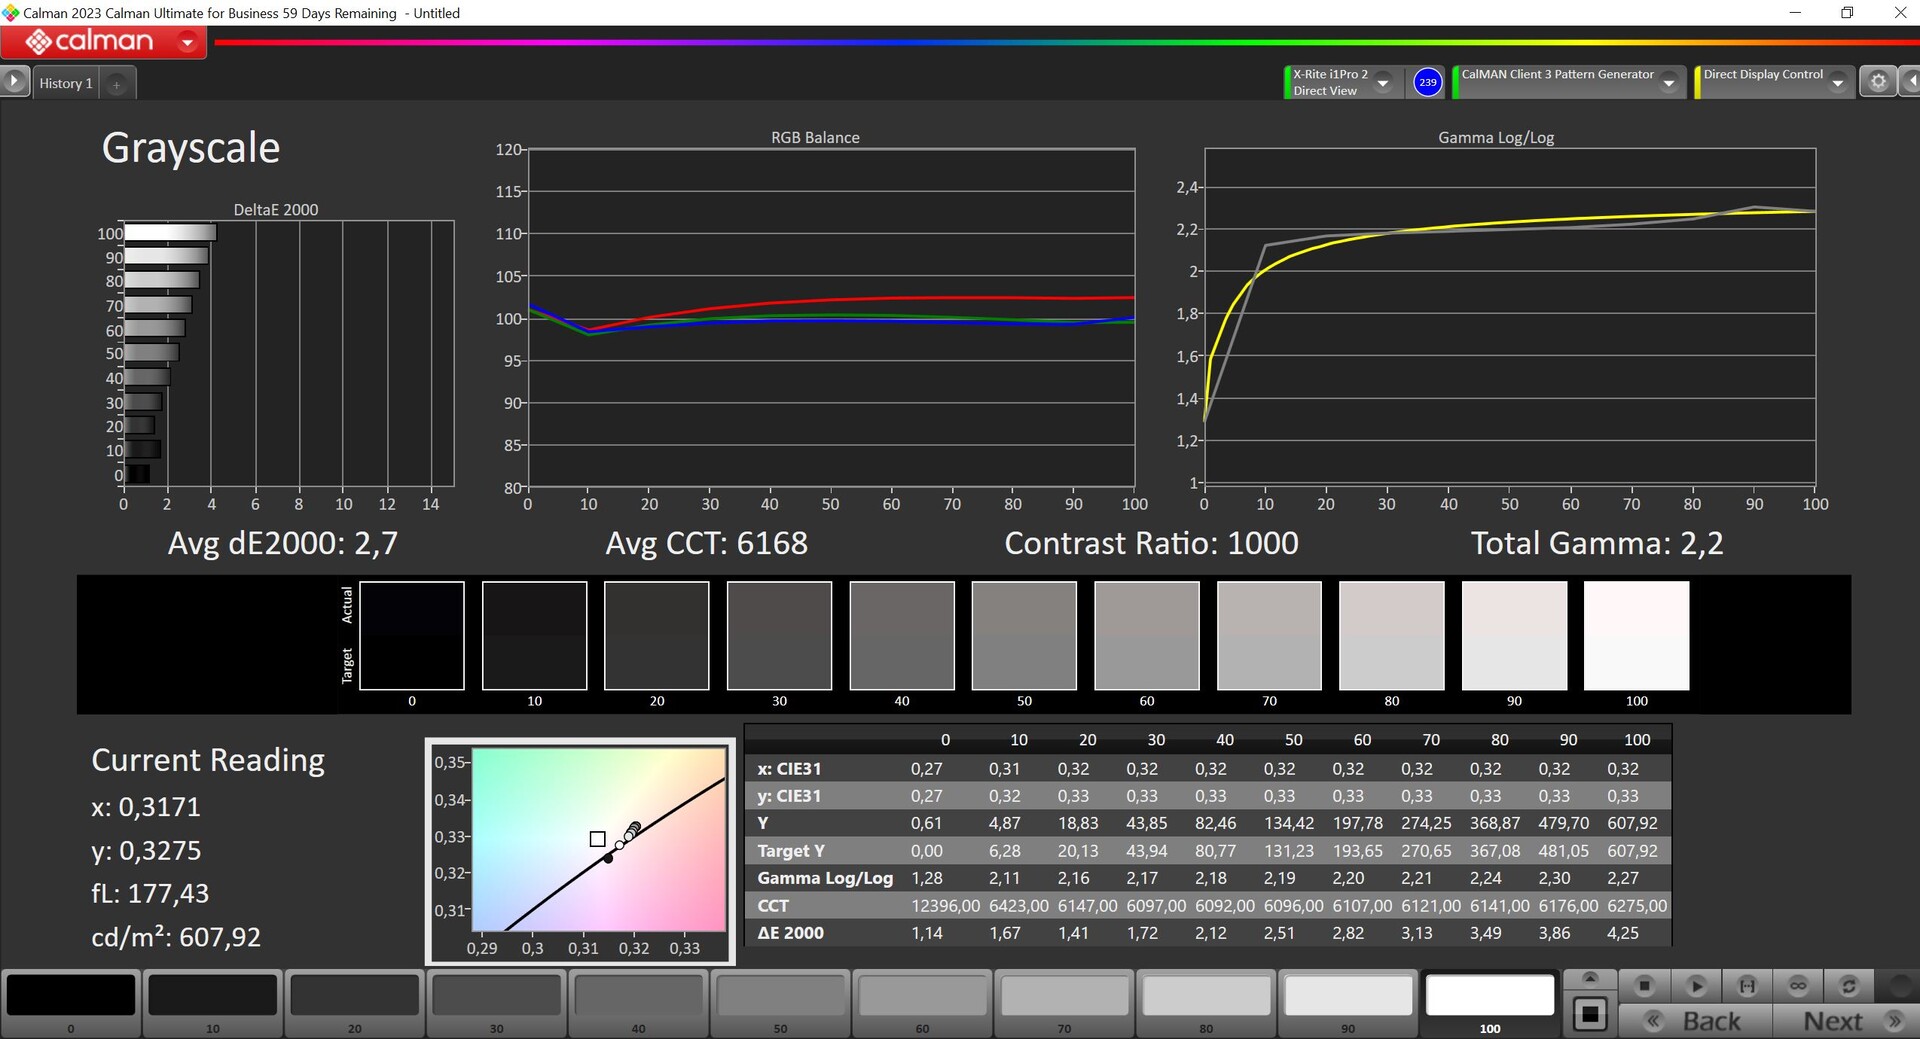
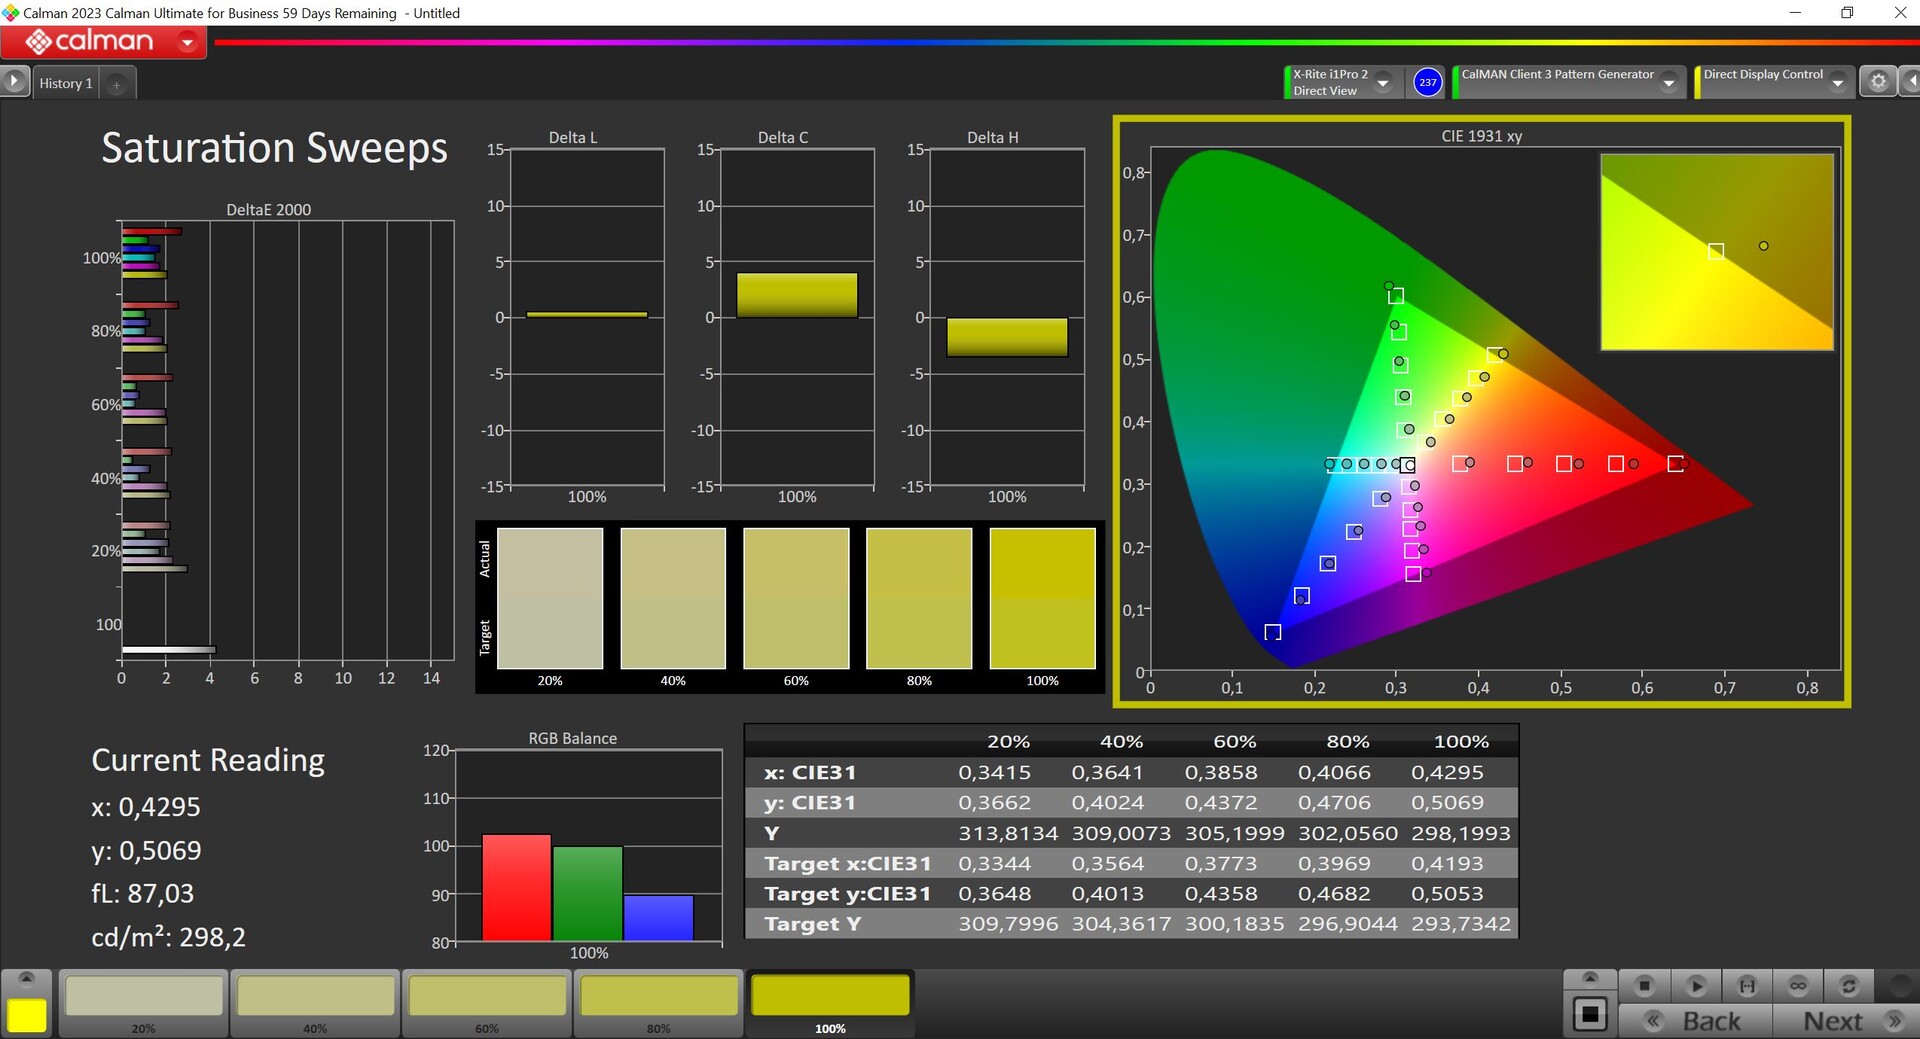
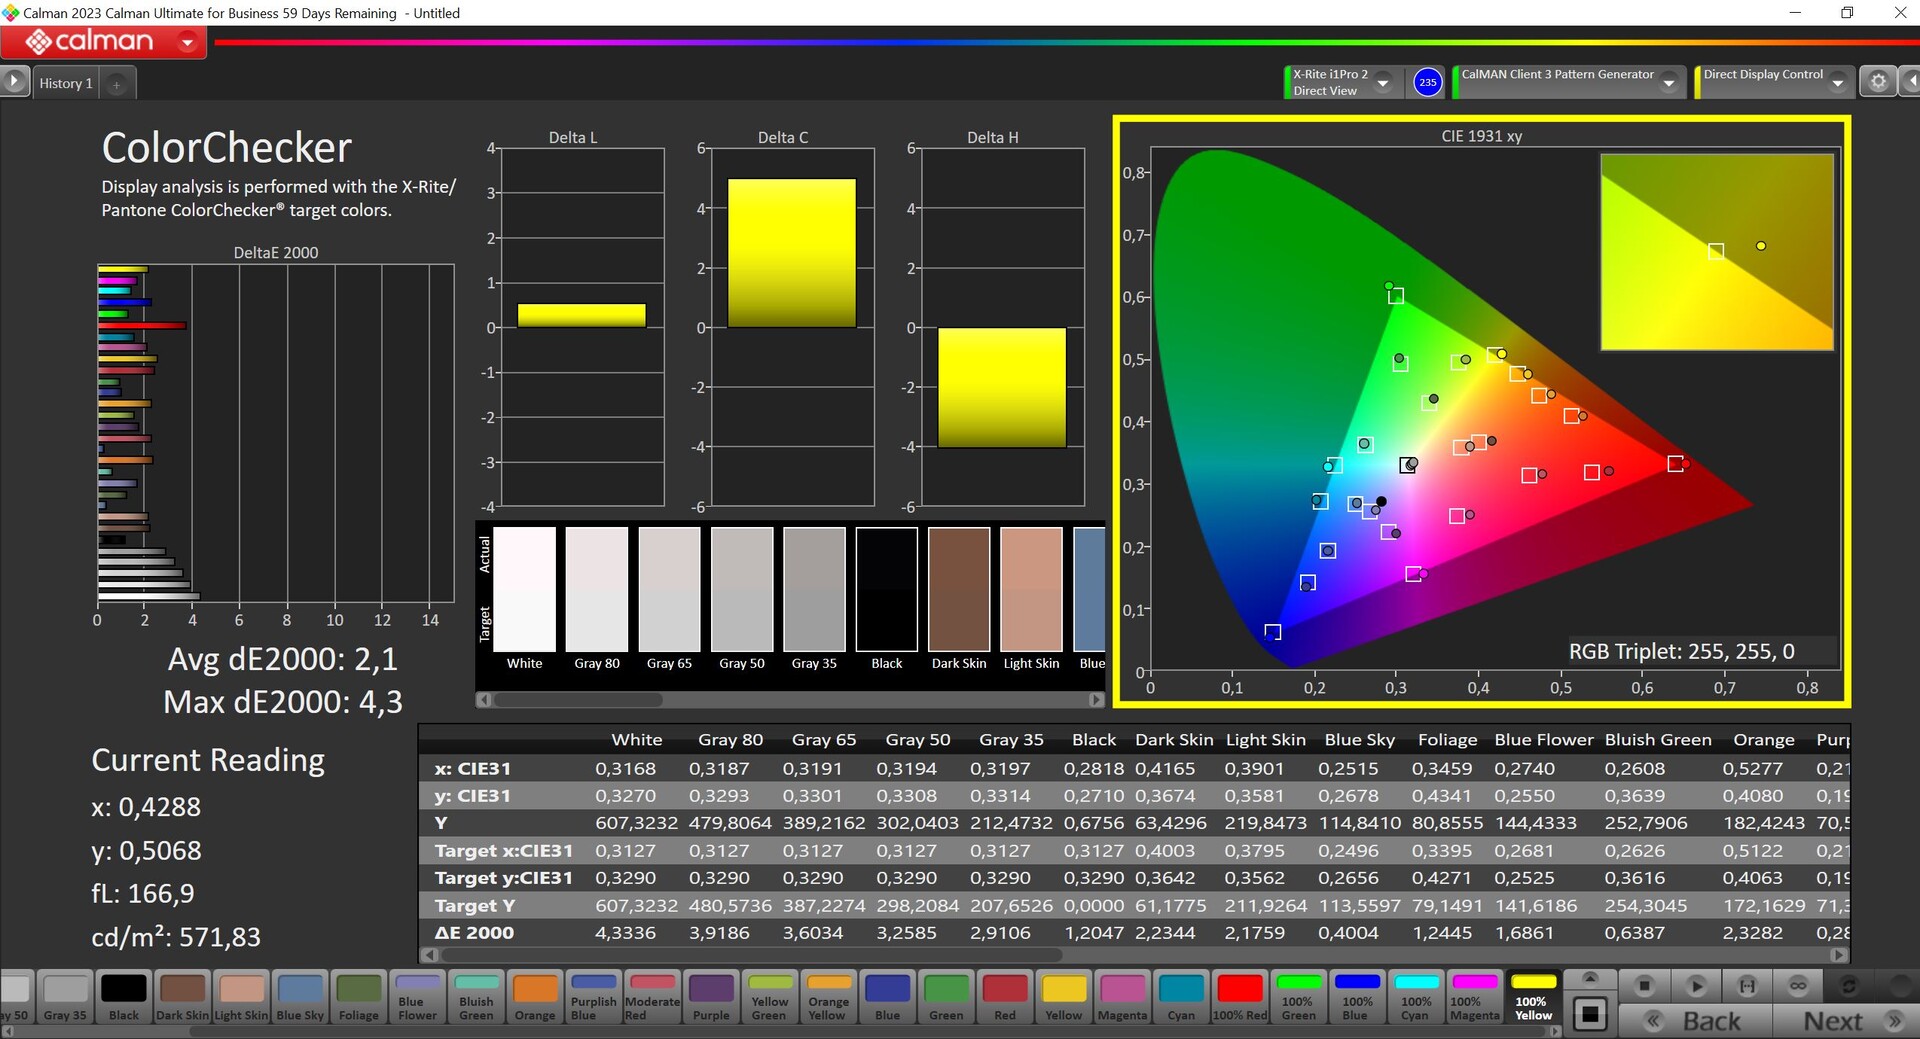
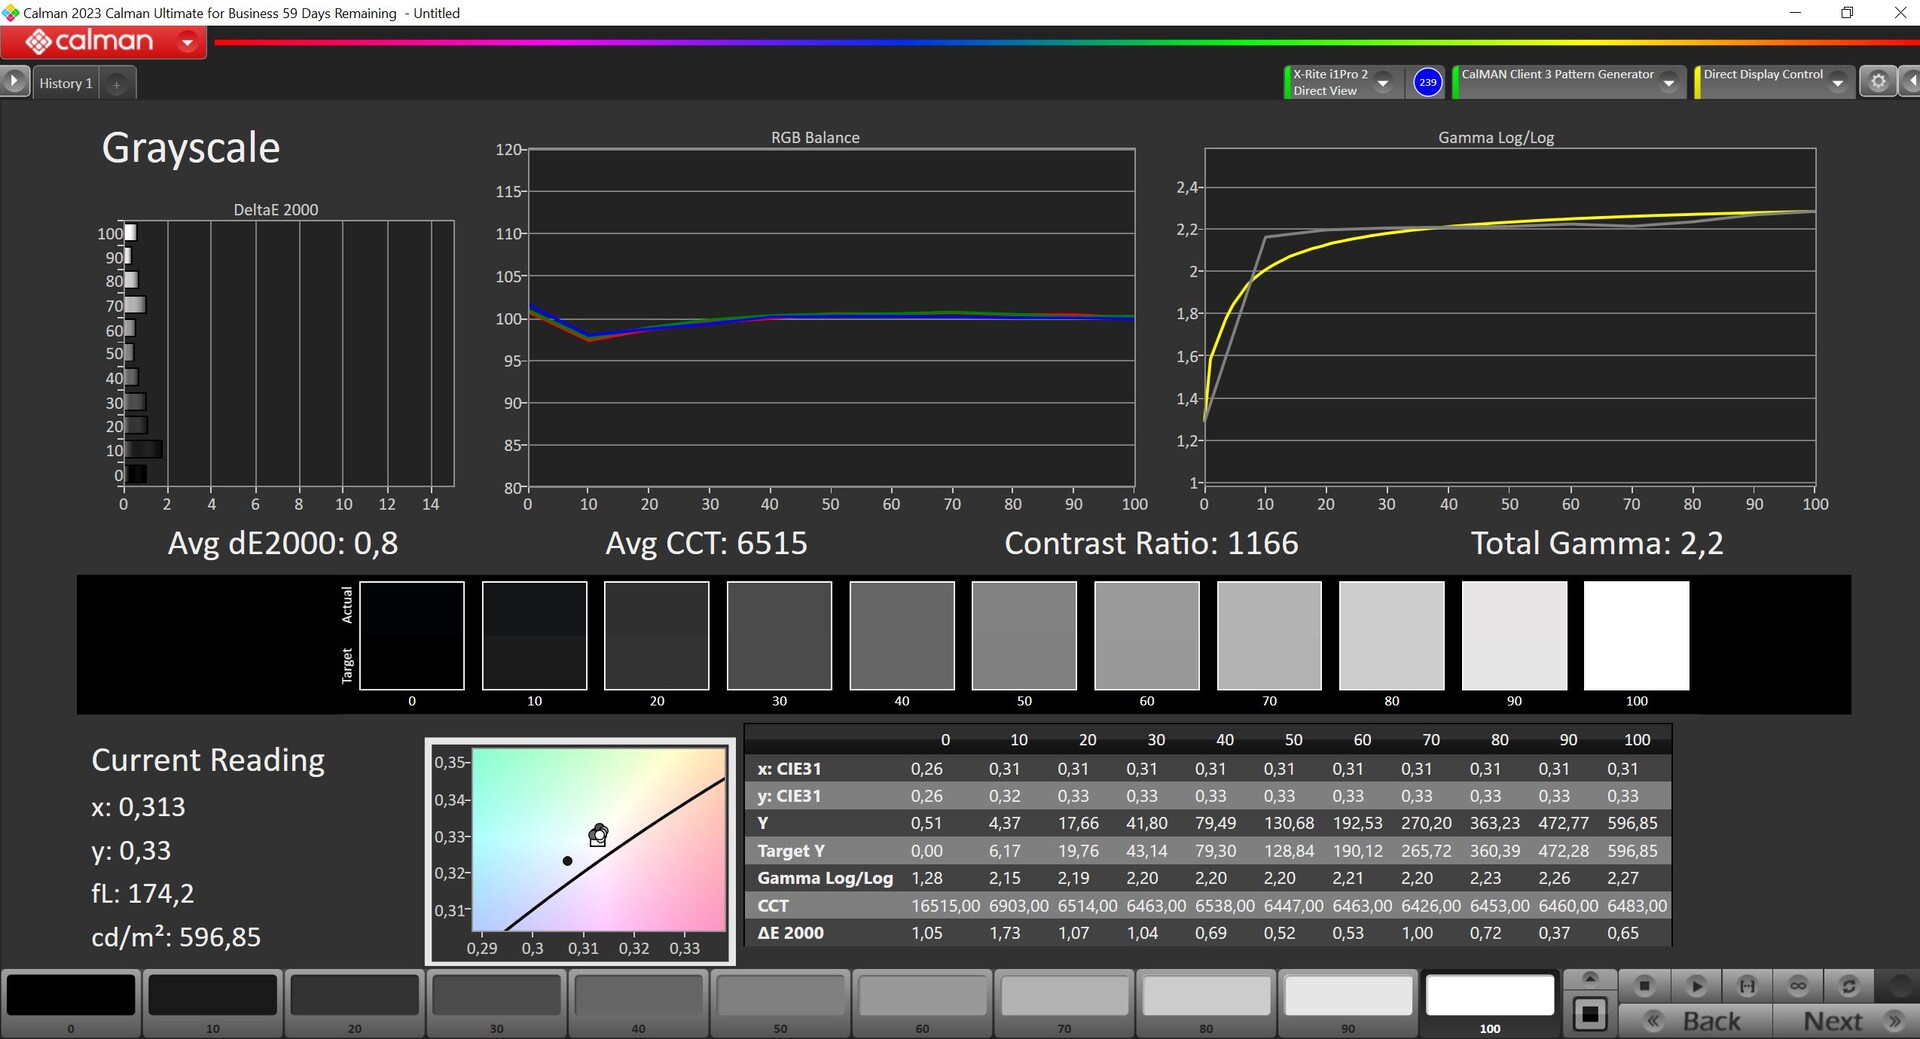
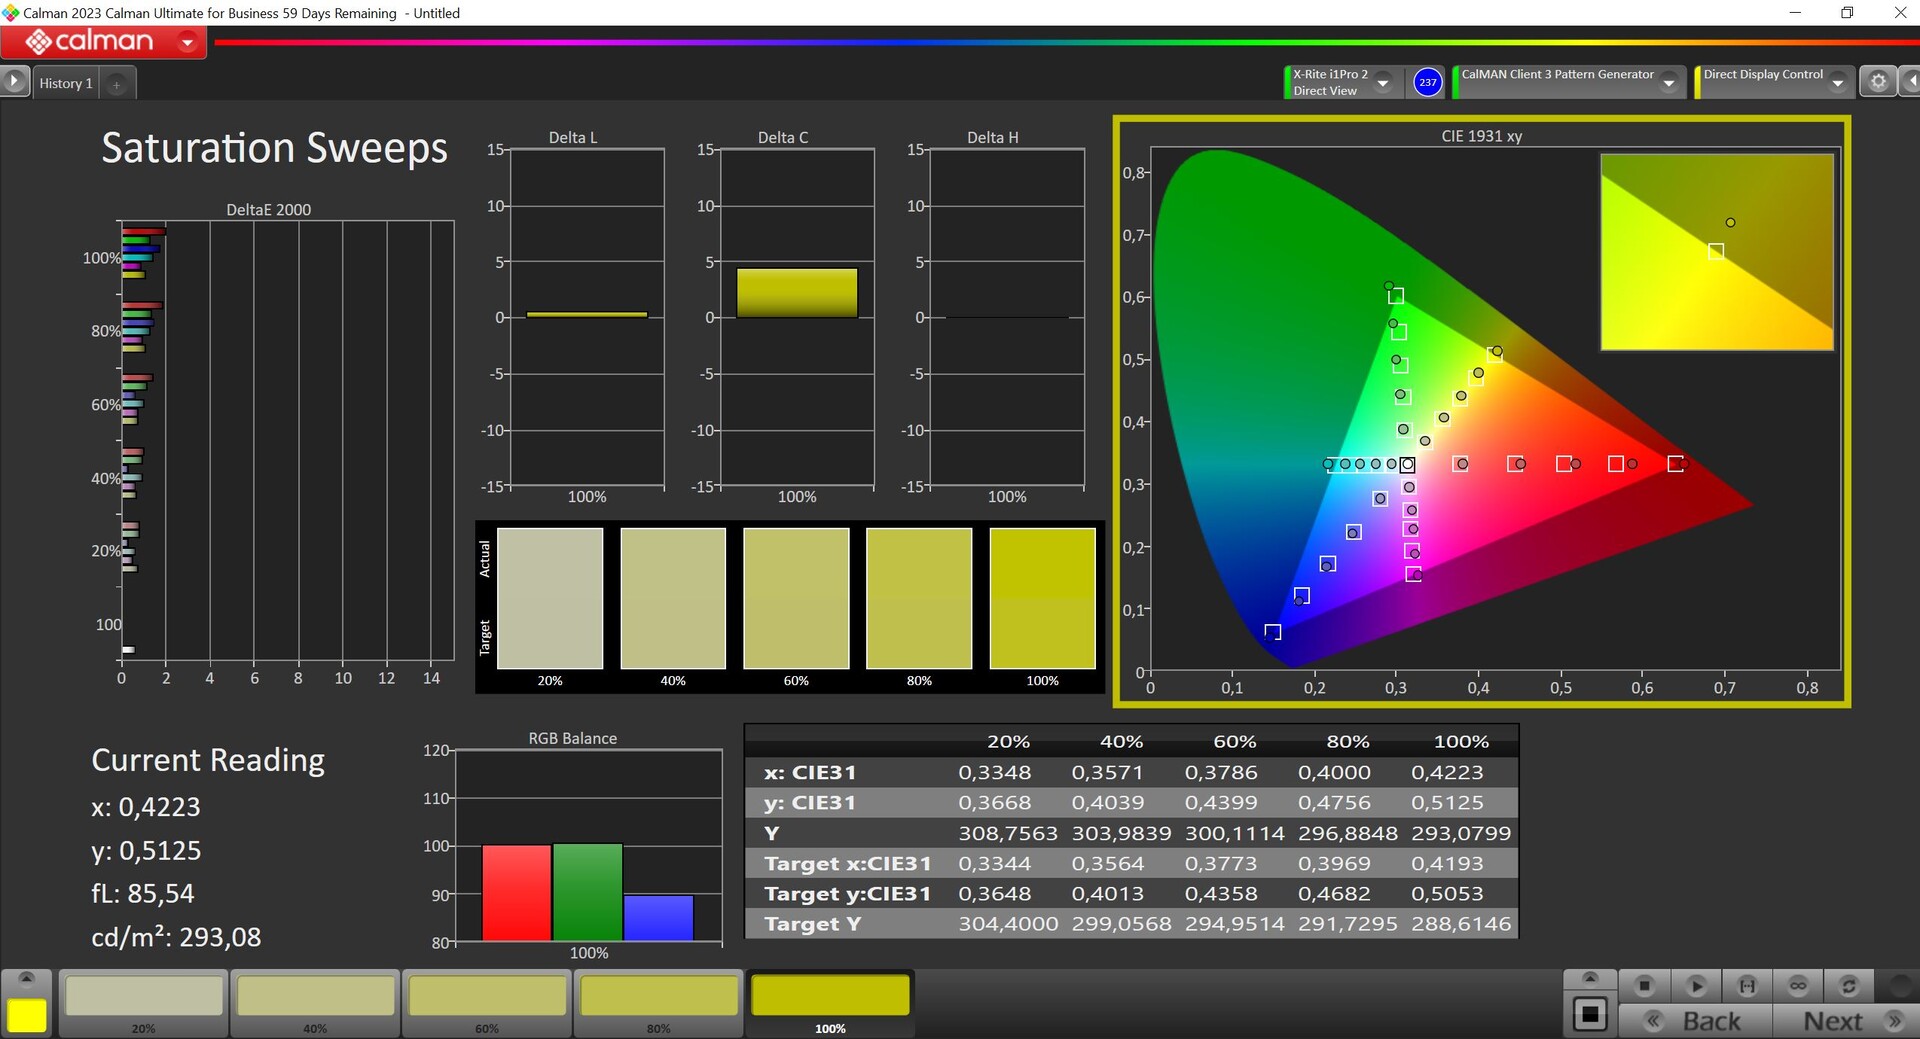
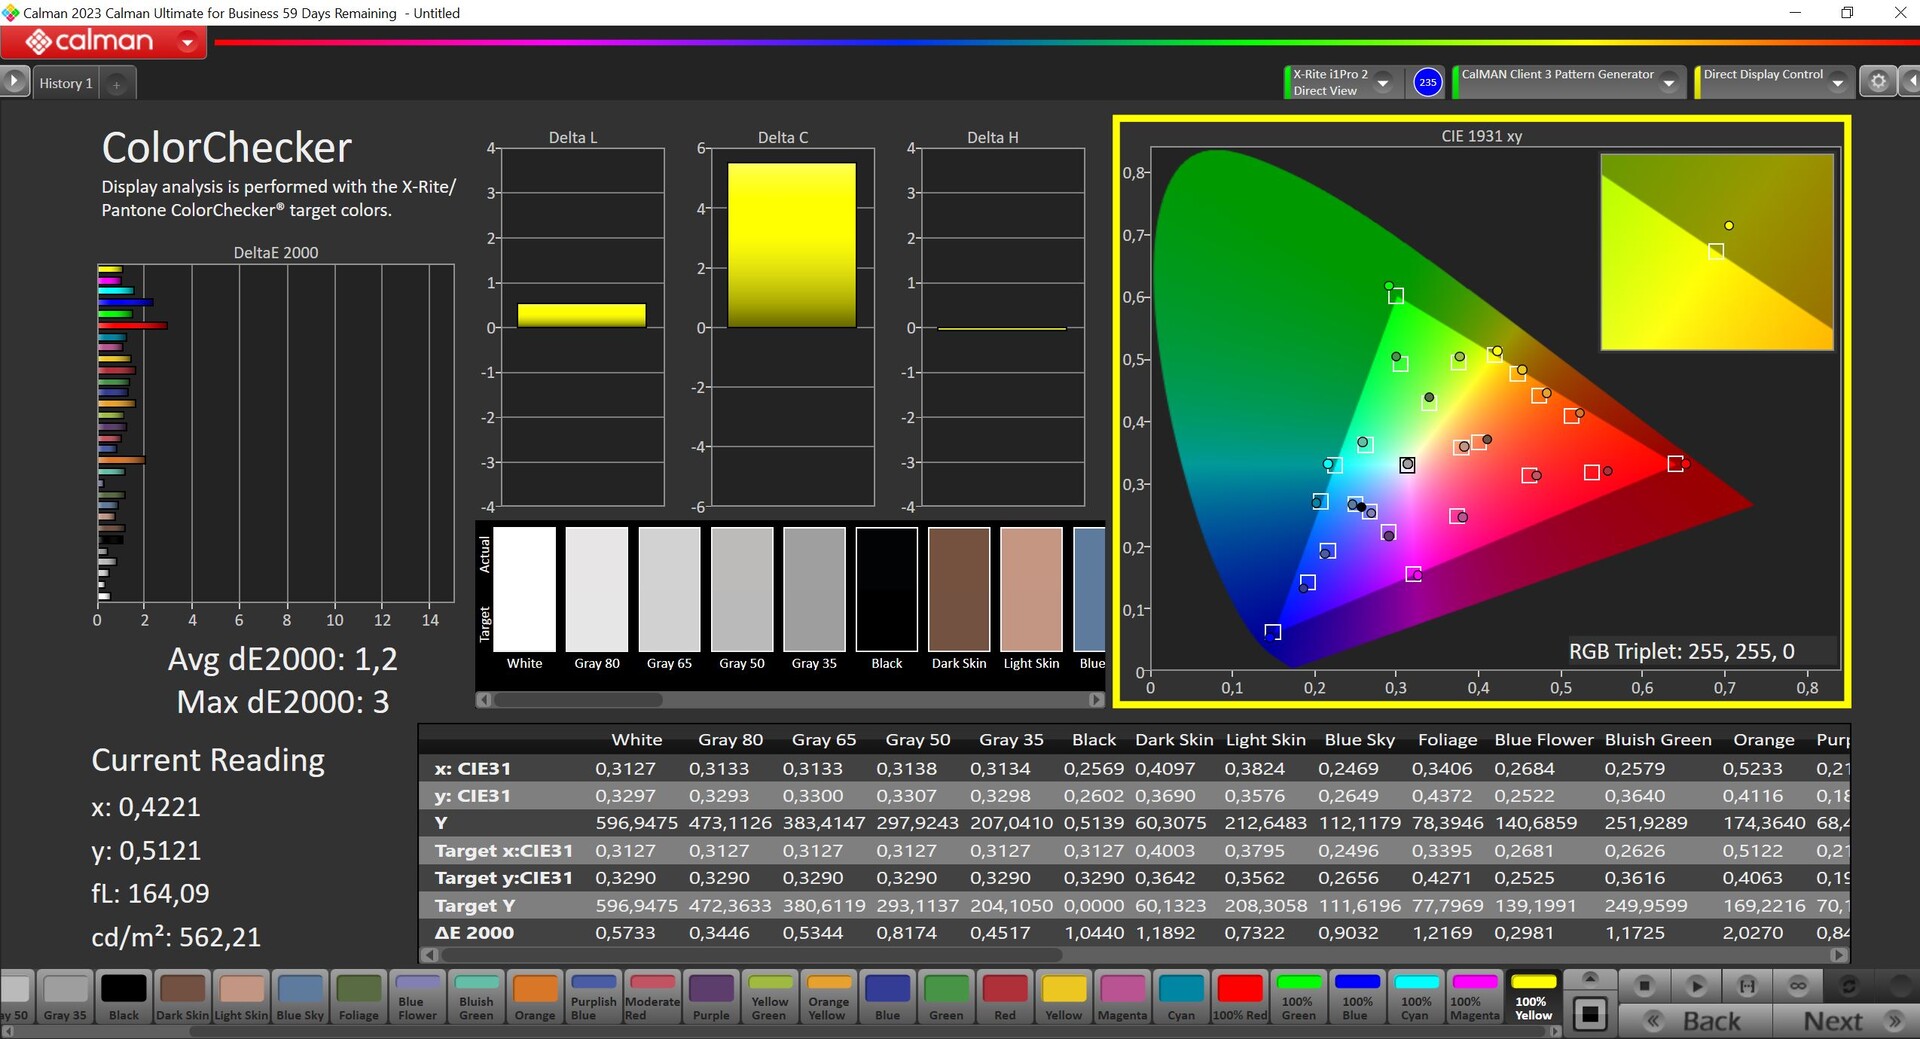
Paneli profesyonel CalMAN yazılımı (X-Rite i1 Pro2) ile ölçtük ve ölçüm için de kullandığımız Kontrol Merkezinden üreticiden önceden kalibre edilmiş bir profil indirebilirsiniz. Ancak, buradaki renk sıcaklığı biraz fazla sıcak ve ayrıca hedef değer olan 3'ü aşan bazı renk ve gri tonlama değerleri var. Kendi kalibrasyonumuzla (profil yukarıda ücretsiz olarak indirilebilir), ekranı önemli ölçüde iyileştirebiliriz ve tüm değerler hedef aralıktadır. Tam sRGB kapsamı ile birlikte Evo 15, bu nedenle, kısıtlama olmaksızın görüntüleri / videoları düzenlemek için de uygundur.
Yanıt Sürelerini Görüntüle
| ↔ Tepki Süresi Siyahtan Beyaza | ||
|---|---|---|
| 6.6 ms ... yükseliş ↗ ve sonbahar↘ birleşimi | ↗ 2.8 ms yükseliş | 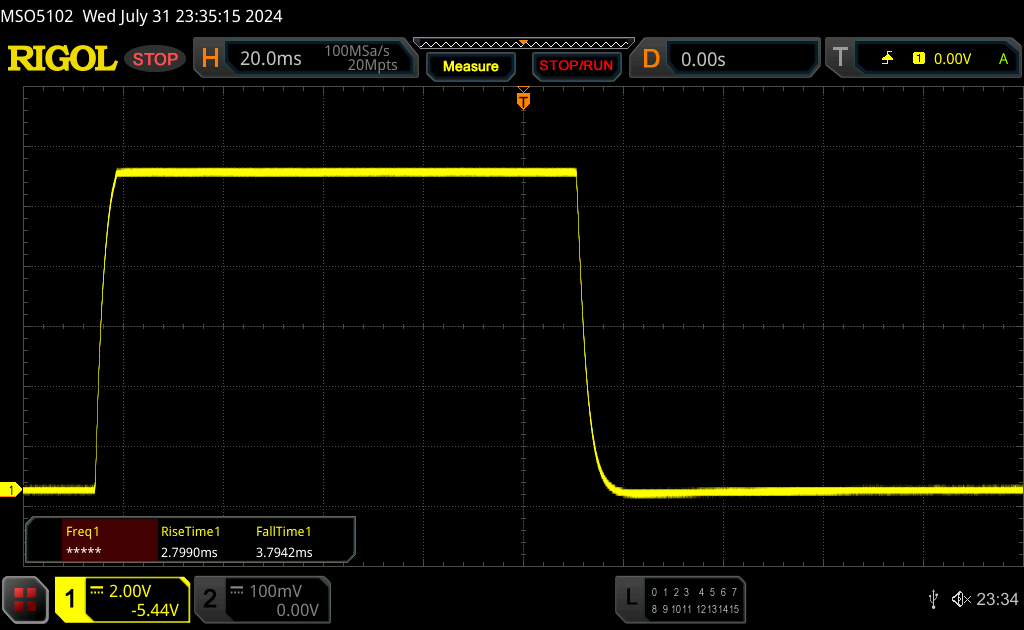 |
| ↘ 3.8 ms sonbahar | ||
| Ekran, testlerimizde çok hızlı yanıt oranları gösteriyor ve hızlı oyun oynamaya çok uygun olmalı. Karşılaştırıldığında, test edilen tüm cihazlar 0.1 (minimum) ile 240 (maksimum) ms arasında değişir. » Tüm cihazların 18 %'si daha iyi. Bu, ölçülen yanıt süresinin test edilen tüm cihazların ortalamasından (20.8 ms) daha iyi olduğu anlamına gelir. | ||
| ↔ Tepki Süresi %50 Griden %80 Griye | ||
| 4.6 ms ... yükseliş ↗ ve sonbahar↘ birleşimi | ↗ 1.3 ms yükseliş | 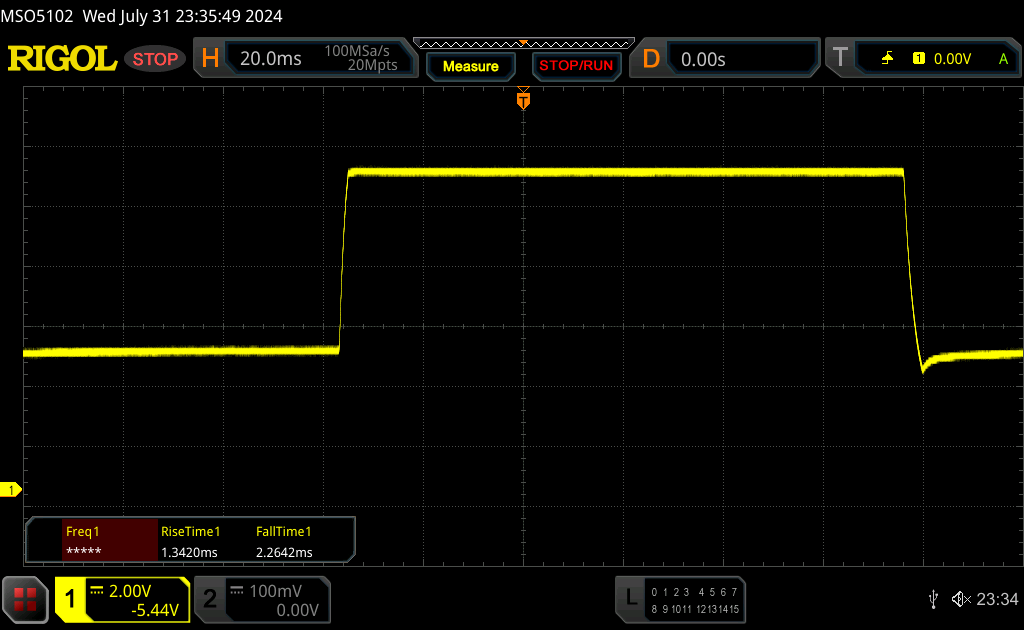 |
| ↘ 2.3 ms sonbahar | ||
| Ekran, testlerimizde çok hızlı yanıt oranları gösteriyor ve hızlı oyun oynamaya çok uygun olmalı. Karşılaştırıldığında, test edilen tüm cihazlar 0.165 (minimum) ile 636 (maksimum) ms arasında değişir. » Tüm cihazların 13 %'si daha iyi. Bu, ölçülen yanıt süresinin test edilen tüm cihazların ortalamasından (32.5 ms) daha iyi olduğu anlamına gelir. | ||
Ekran Titremesi / PWM (Darbe Genişliği Modülasyonu)
| Ekran titriyor / PWM algılanmadı | 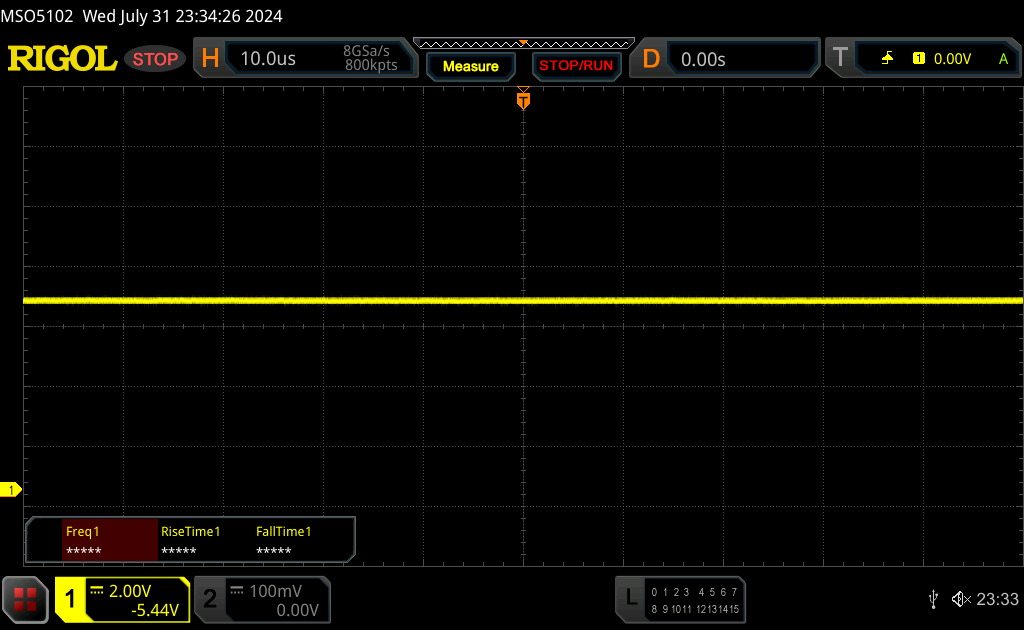 | ||
Karşılaştırıldığında: Test edilen tüm cihazların %53 %'si ekranı karartmak için PWM kullanmıyor. PWM tespit edilirse, ortalama 8516 (minimum: 5 - maksimum: 343500) Hz ölçüldü. | |||
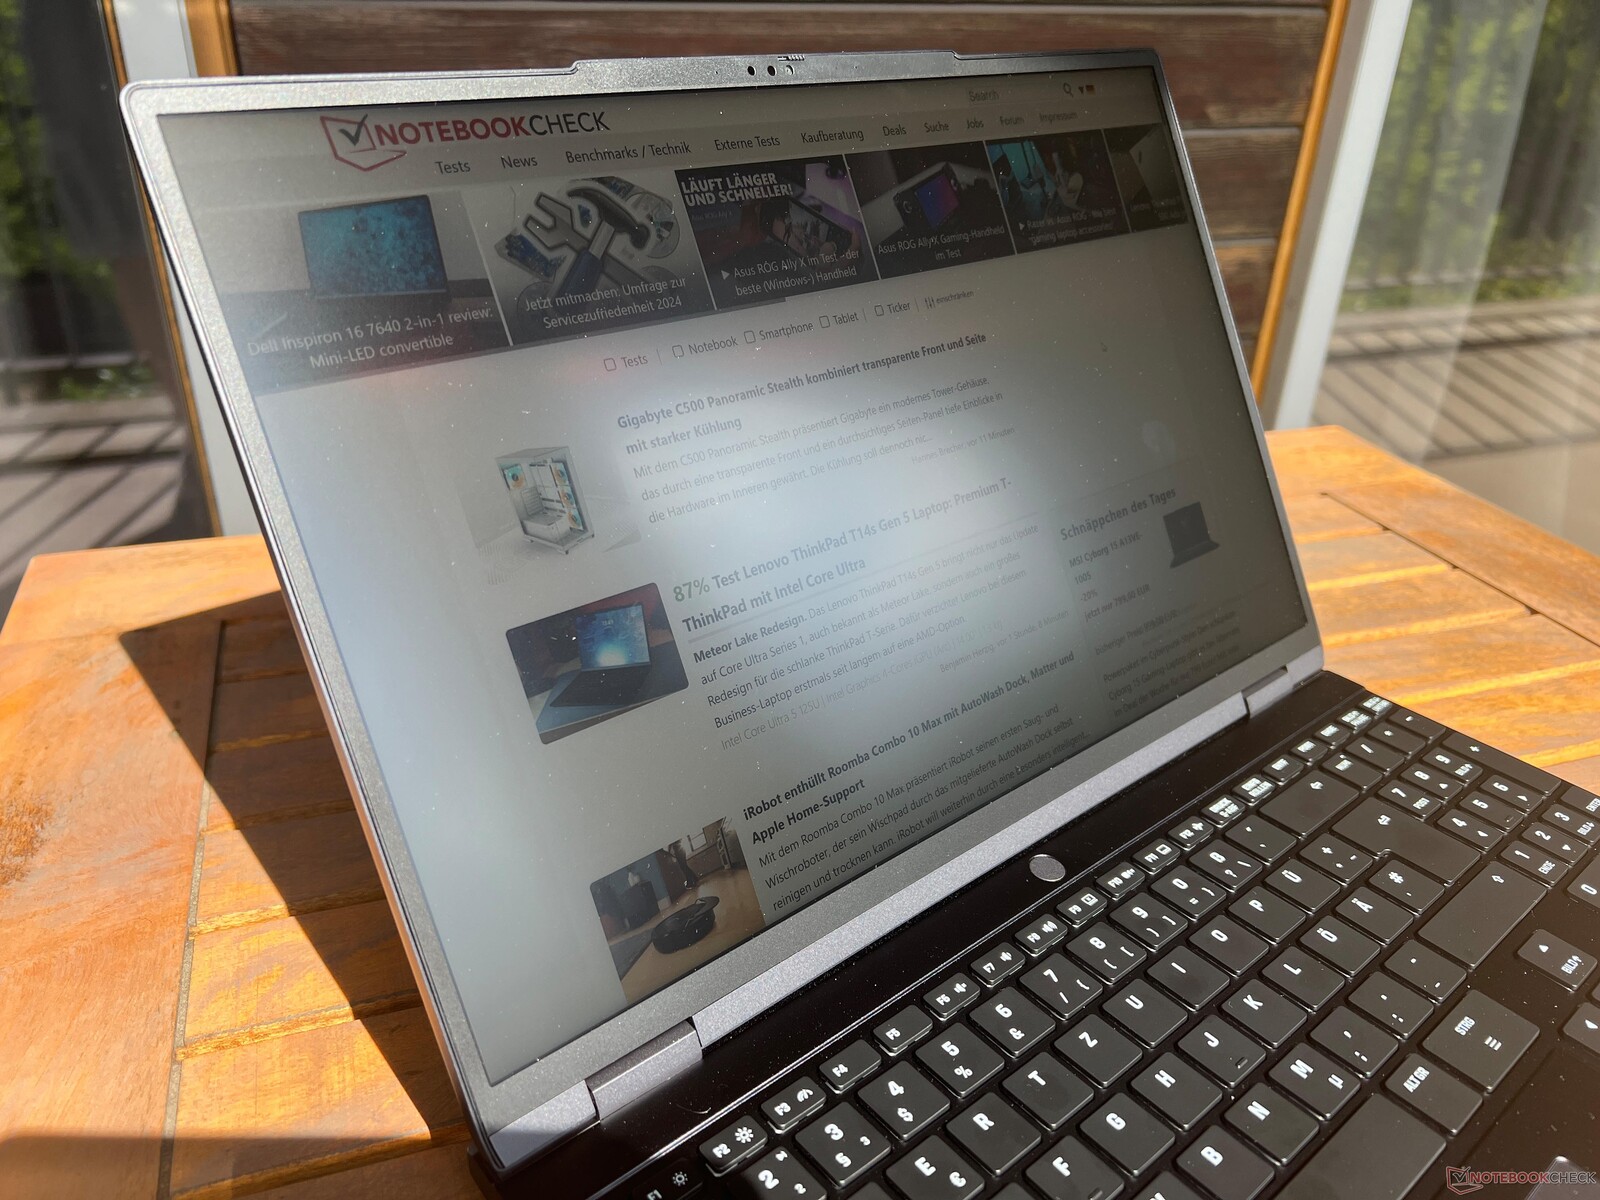

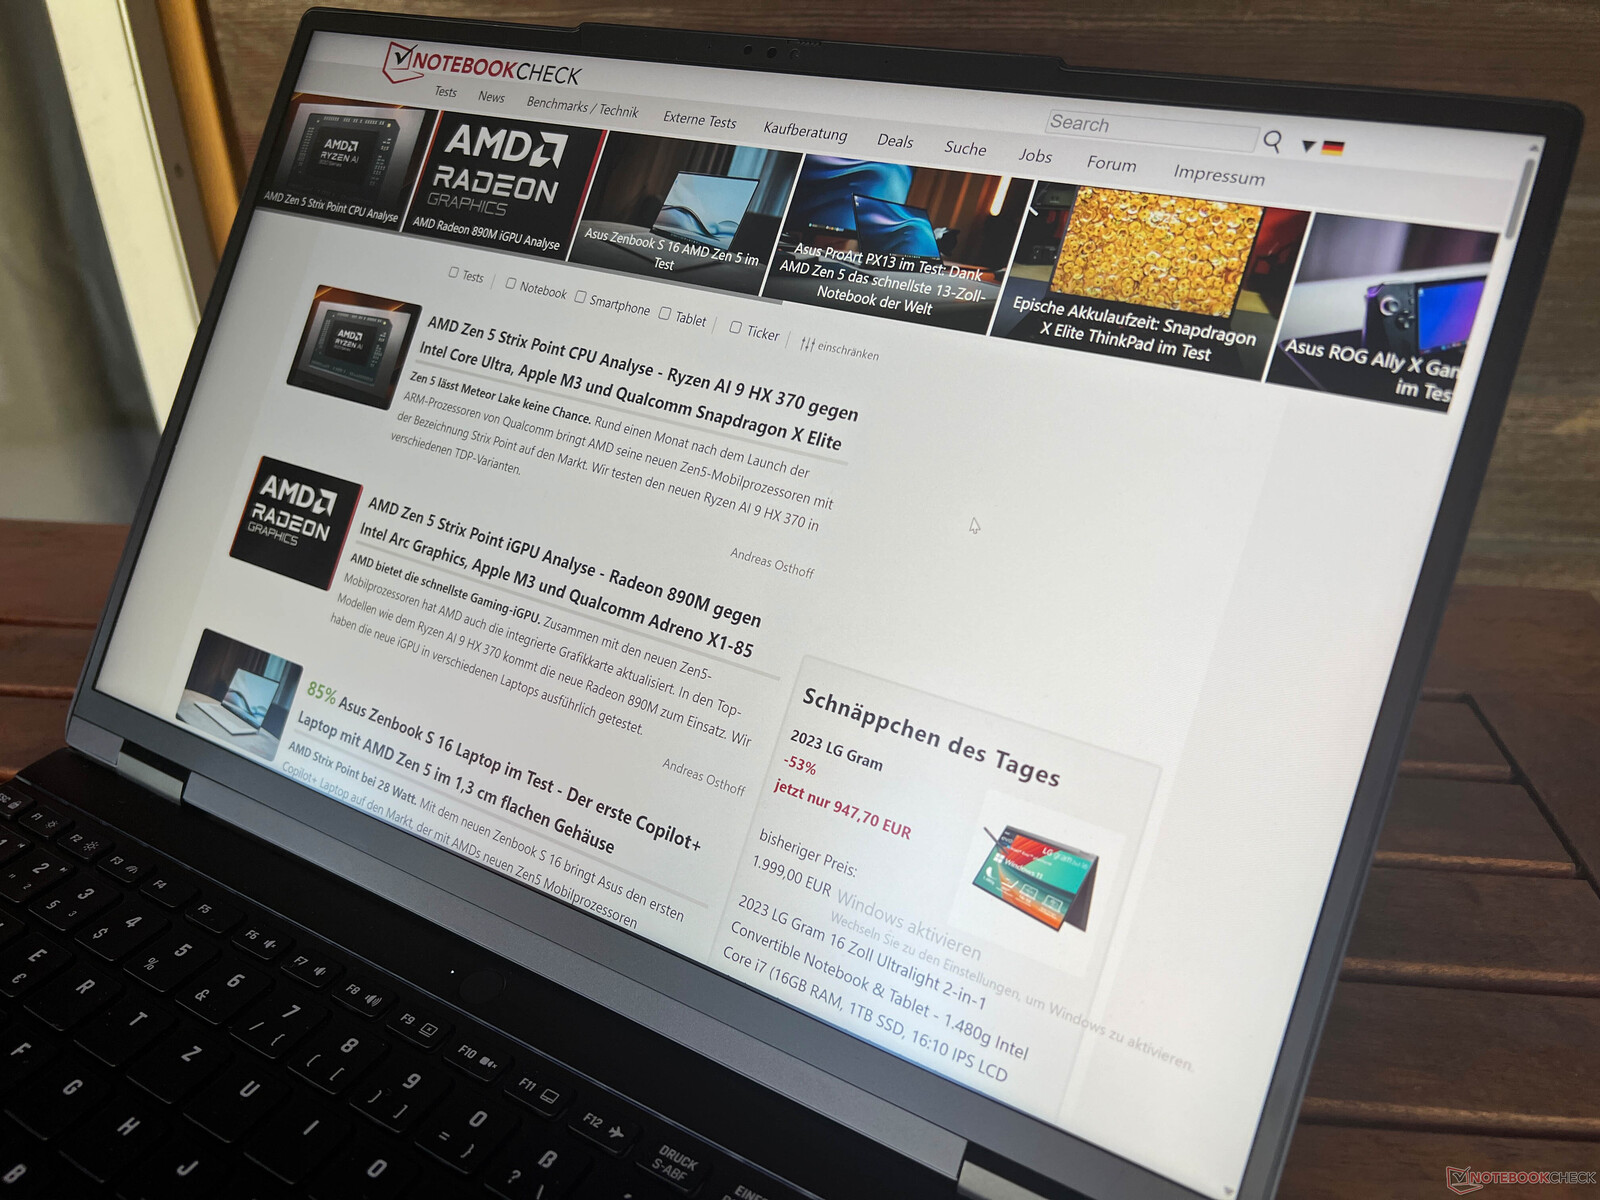
Mat panel, yüksek parlaklık sayesinde dış mekanlarda çok iyi performans gösteriyor ve parlak günlerde bile içeriği net bir şekilde görebiliyorsunuz. IPS panelin görüş açısı kararlılığı çok iyi.
Performans - Meteor Lake ve 96 GB'a kadar RAM
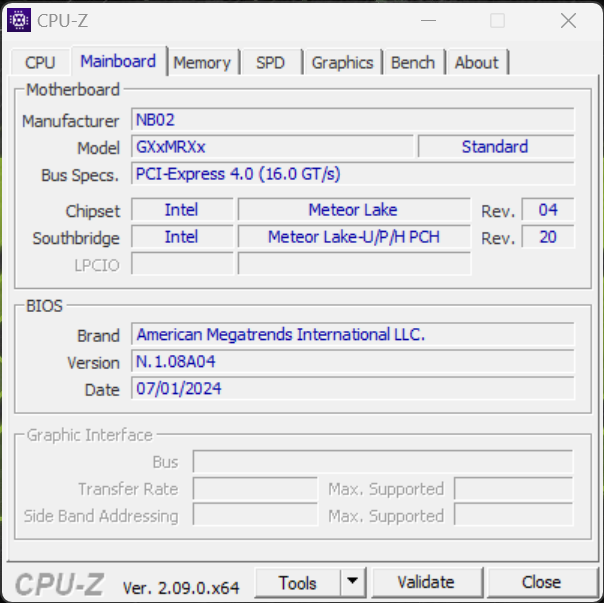
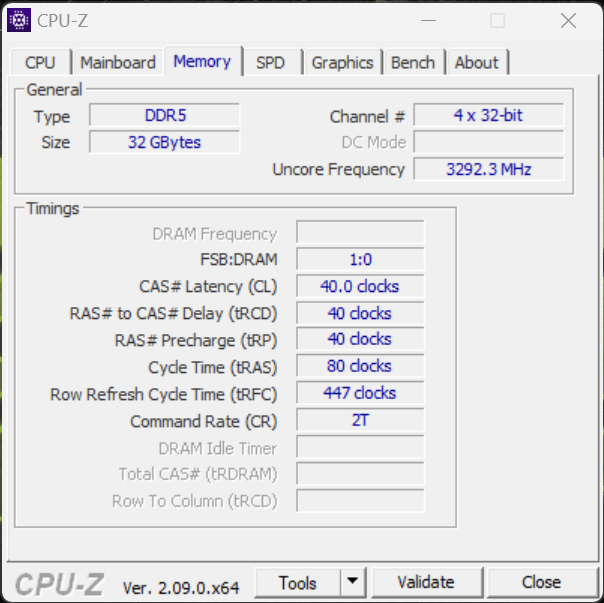
XMG Evo 15 ya şu özelliklerle donatılmıştır AMD Ryzen 7 8845HS ya da Intel Core Ultra 7 155H test cihazımızda. İki RAM yuvası 96 GB'a kadar DDR5 RAM'e izin verir, ancak termal kısıtlamalar nedeniyle 48 GB modüller kullanıldığında frekans 5600'den 4800 MHz'e sınırlanır.
Test koşulları
Önceden yüklenmiş Kontrol Merkezi, Fn+F3 tuş kombinasyonu kullanılarak rahatça değiştirilebilen üç farklı enerji profili (Balanced, Enthusiast & Overboost) sunar. Kıyaslamaları ve ölçümleri standart Enthusiast profili ile gerçekleştirdik. Üç profilin performans değerlerini aşağıdaki tabloda özetledik:
| Enerji profili | CPU TDP | CPU TDP (pil) | CB R23 Multi | Time Spy Grafik | maks. Fan hacmi |
|---|---|---|---|---|---|
| Dengeli | 35 watt | 25 watt | 12.759 puan | 2.623 puan | 35,4 dB(A) |
| Meraklı | 45 watt | 35 watt | 14.957 puan | 3.690 puan | 40,4 dB(A) |
| Overboost | 70 watt | 35 watt | 18.790 puan | 3.633 puan | 48,1 dB(A) |
İşlemci - Core Ultra 7 155H
Bu Intel Core Ultra 7 155H şu anda birçok dizüstü bilgisayarda kullanılmaktadır, ancak XMG Evo 15, artırılmış kısa vadeli güç sınırına sahip olmayan birkaç modelden biridir. Enthusiast modunda tüketim 45 watt ve bu değer sabit tutuluyor (bu aynı zamanda 70 ve 35 watt'lık diğer performans profilleri için de geçerli) ve sürekli yük altında performans kaybı yaşanmıyor. Meraklı modunda performans zaten çok iyi, ancak daha fazla güce ihtiyacınız varsa, overboost modunu (+% 25 çok çekirdekli performans) kolayca kullanabilirsiniz. Pil modunda ise maksimum tüketim 35 watt'a düşüyor ve bu da performansta %15'lik bir düşüşe neden oluyor. Diğer CPU kıyaslamalarını şurada bulabilirsiniz teknoloji̇ bölümümüz.
Cinebench R15 Multi loop
Cinebench R23: Multi Core | Single Core
Cinebench R20: CPU (Multi Core) | CPU (Single Core)
Cinebench R15: CPU Multi 64Bit | CPU Single 64Bit
Blender: v2.79 BMW27 CPU
7-Zip 18.03: 7z b 4 | 7z b 4 -mmt1
Geekbench 6.4: Multi-Core | Single-Core
Geekbench 5.5: Multi-Core | Single-Core
HWBOT x265 Benchmark v2.2: 4k Preset
LibreOffice : 20 Documents To PDF
R Benchmark 2.5: Overall mean
| CPU Performance Rating | |
| Lenovo IdeaPad Pro 5 16IMH G9 | |
| Xiaomi RedmiBook Pro 16 2024 | |
| Sınıf ortalaması Multimedia | |
| Dell Inspiron 16 7640 2-in-1 | |
| SCHENKER XMG Evo 15 (M24) | |
| Medion S10 OLED | |
| Ortalama Intel Core Ultra 7 155H | |
| Lenovo ThinkPad T16 G2 21K70035GE | |
| Cinebench R23 / Multi Core | |
| Lenovo IdeaPad Pro 5 16IMH G9 | |
| Xiaomi RedmiBook Pro 16 2024 | |
| Sınıf ortalaması Multimedia (4861 - 30789, n=96, son 2 yıl) | |
| Dell Inspiron 16 7640 2-in-1 | |
| Medion S10 OLED | |
| Ortalama Intel Core Ultra 7 155H (9769 - 19007, n=52) | |
| SCHENKER XMG Evo 15 (M24) | |
| Lenovo ThinkPad T16 G2 21K70035GE | |
| Cinebench R23 / Single Core | |
| Sınıf ortalaması Multimedia (878 - 2290, n=87, son 2 yıl) | |
| Medion S10 OLED | |
| Lenovo IdeaPad Pro 5 16IMH G9 | |
| Xiaomi RedmiBook Pro 16 2024 | |
| Dell Inspiron 16 7640 2-in-1 | |
| SCHENKER XMG Evo 15 (M24) | |
| Ortalama Intel Core Ultra 7 155H (1496 - 1815, n=52) | |
| Lenovo ThinkPad T16 G2 21K70035GE | |
| Cinebench R20 / CPU (Multi Core) | |
| Lenovo IdeaPad Pro 5 16IMH G9 | |
| Xiaomi RedmiBook Pro 16 2024 | |
| Dell Inspiron 16 7640 2-in-1 | |
| Medion S10 OLED | |
| Sınıf ortalaması Multimedia (1887 - 11924, n=80, son 2 yıl) | |
| Ortalama Intel Core Ultra 7 155H (3798 - 7409, n=50) | |
| SCHENKER XMG Evo 15 (M24) | |
| Lenovo ThinkPad T16 G2 21K70035GE | |
| Cinebench R20 / CPU (Single Core) | |
| Lenovo IdeaPad Pro 5 16IMH G9 | |
| Medion S10 OLED | |
| SCHENKER XMG Evo 15 (M24) | |
| Lenovo ThinkPad T16 G2 21K70035GE | |
| Sınıf ortalaması Multimedia (341 - 853, n=80, son 2 yıl) | |
| Xiaomi RedmiBook Pro 16 2024 | |
| Dell Inspiron 16 7640 2-in-1 | |
| Ortalama Intel Core Ultra 7 155H (601 - 696, n=50) | |
| Cinebench R15 / CPU Multi 64Bit | |
| Xiaomi RedmiBook Pro 16 2024 | |
| Lenovo IdeaPad Pro 5 16IMH G9 | |
| Dell Inspiron 16 7640 2-in-1 | |
| Sınıf ortalaması Multimedia (856 - 5224, n=87, son 2 yıl) | |
| Ortalama Intel Core Ultra 7 155H (1932 - 2880, n=56) | |
| Medion S10 OLED | |
| SCHENKER XMG Evo 15 (M24) | |
| Lenovo ThinkPad T16 G2 21K70035GE | |
| Cinebench R15 / CPU Single 64Bit | |
| Lenovo IdeaPad Pro 5 16IMH G9 | |
| Lenovo ThinkPad T16 G2 21K70035GE | |
| SCHENKER XMG Evo 15 (M24) | |
| Sınıf ortalaması Multimedia (99.6 - 323, n=82, son 2 yıl) | |
| Medion S10 OLED | |
| Xiaomi RedmiBook Pro 16 2024 | |
| Dell Inspiron 16 7640 2-in-1 | |
| Ortalama Intel Core Ultra 7 155H (99.6 - 268, n=52) | |
| Blender / v2.79 BMW27 CPU | |
| Sınıf ortalaması Multimedia (100 - 557, n=80, son 2 yıl) | |
| Lenovo ThinkPad T16 G2 21K70035GE | |
| Ortalama Intel Core Ultra 7 155H (175 - 381, n=47) | |
| Dell Inspiron 16 7640 2-in-1 | |
| SCHENKER XMG Evo 15 (M24) | |
| Medion S10 OLED | |
| Lenovo IdeaPad Pro 5 16IMH G9 | |
| Xiaomi RedmiBook Pro 16 2024 | |
| 7-Zip 18.03 / 7z b 4 | |
| Lenovo IdeaPad Pro 5 16IMH G9 | |
| Xiaomi RedmiBook Pro 16 2024 | |
| Dell Inspiron 16 7640 2-in-1 | |
| SCHENKER XMG Evo 15 (M24) | |
| Sınıf ortalaması Multimedia (29095 - 130368, n=75, son 2 yıl) | |
| Ortalama Intel Core Ultra 7 155H (41739 - 70254, n=50) | |
| Medion S10 OLED | |
| Lenovo ThinkPad T16 G2 21K70035GE | |
| 7-Zip 18.03 / 7z b 4 -mmt1 | |
| Lenovo ThinkPad T16 G2 21K70035GE | |
| Sınıf ortalaması Multimedia (3398 - 7545, n=75, son 2 yıl) | |
| SCHENKER XMG Evo 15 (M24) | |
| Medion S10 OLED | |
| Xiaomi RedmiBook Pro 16 2024 | |
| Lenovo IdeaPad Pro 5 16IMH G9 | |
| Dell Inspiron 16 7640 2-in-1 | |
| Ortalama Intel Core Ultra 7 155H (4594 - 5621, n=50) | |
| Geekbench 6.4 / Multi-Core | |
| Sınıf ortalaması Multimedia (4983 - 25760, n=77, son 2 yıl) | |
| Xiaomi RedmiBook Pro 16 2024 | |
| Lenovo IdeaPad Pro 5 16IMH G9 | |
| SCHENKER XMG Evo 15 (M24) | |
| Ortalama Intel Core Ultra 7 155H (7732 - 13656, n=55) | |
| Dell Inspiron 16 7640 2-in-1 | |
| Medion S10 OLED | |
| Lenovo ThinkPad T16 G2 21K70035GE | |
| Geekbench 6.4 / Single-Core | |
| Sınıf ortalaması Multimedia (1534 - 3927, n=73, son 2 yıl) | |
| Lenovo ThinkPad T16 G2 21K70035GE | |
| SCHENKER XMG Evo 15 (M24) | |
| Medion S10 OLED | |
| Lenovo IdeaPad Pro 5 16IMH G9 | |
| Xiaomi RedmiBook Pro 16 2024 | |
| Ortalama Intel Core Ultra 7 155H (1901 - 2473, n=52) | |
| Dell Inspiron 16 7640 2-in-1 | |
| Geekbench 5.5 / Multi-Core | |
| Xiaomi RedmiBook Pro 16 2024 | |
| Lenovo IdeaPad Pro 5 16IMH G9 | |
| Dell Inspiron 16 7640 2-in-1 | |
| Sınıf ortalaması Multimedia (4652 - 23059, n=79, son 2 yıl) | |
| Ortalama Intel Core Ultra 7 155H (10017 - 13556, n=52) | |
| SCHENKER XMG Evo 15 (M24) | |
| Medion S10 OLED | |
| Lenovo ThinkPad T16 G2 21K70035GE | |
| Geekbench 5.5 / Single-Core | |
| Sınıf ortalaması Multimedia (891 - 2555, n=79, son 2 yıl) | |
| SCHENKER XMG Evo 15 (M24) | |
| Lenovo IdeaPad Pro 5 16IMH G9 | |
| Xiaomi RedmiBook Pro 16 2024 | |
| Medion S10 OLED | |
| Dell Inspiron 16 7640 2-in-1 | |
| Lenovo ThinkPad T16 G2 21K70035GE | |
| Ortalama Intel Core Ultra 7 155H (1462 - 1824, n=52) | |
| HWBOT x265 Benchmark v2.2 / 4k Preset | |
| Lenovo IdeaPad Pro 5 16IMH G9 | |
| Xiaomi RedmiBook Pro 16 2024 | |
| Dell Inspiron 16 7640 2-in-1 | |
| SCHENKER XMG Evo 15 (M24) | |
| Sınıf ortalaması Multimedia (5.26 - 34.3, n=74, son 2 yıl) | |
| Medion S10 OLED | |
| Ortalama Intel Core Ultra 7 155H (9.93 - 21.2, n=50) | |
| Lenovo ThinkPad T16 G2 21K70035GE | |
| LibreOffice / 20 Documents To PDF | |
| Sınıf ortalaması Multimedia (23.9 - 146.7, n=76, son 2 yıl) | |
| Ortalama Intel Core Ultra 7 155H (37.5 - 79.2, n=49) | |
| Medion S10 OLED | |
| Xiaomi RedmiBook Pro 16 2024 | |
| Dell Inspiron 16 7640 2-in-1 | |
| Lenovo ThinkPad T16 G2 21K70035GE | |
| SCHENKER XMG Evo 15 (M24) | |
| Lenovo IdeaPad Pro 5 16IMH G9 | |
| R Benchmark 2.5 / Overall mean | |
| Dell Inspiron 16 7640 2-in-1 | |
| Ortalama Intel Core Ultra 7 155H (0.4457 - 0.53, n=49) | |
| Sınıf ortalaması Multimedia (0.3604 - 0.947, n=74, son 2 yıl) | |
| Lenovo ThinkPad T16 G2 21K70035GE | |
| Xiaomi RedmiBook Pro 16 2024 | |
| Medion S10 OLED | |
| Lenovo IdeaPad Pro 5 16IMH G9 | |
| SCHENKER XMG Evo 15 (M24) | |
* ... daha küçük daha iyidir
AIDA64: FP32 Ray-Trace | FPU Julia | CPU SHA3 | CPU Queen | FPU SinJulia | FPU Mandel | CPU AES | CPU ZLib | FP64 Ray-Trace | CPU PhotoWorxx
| Performance Rating | |
| Lenovo ThinkPad T16 G2 21K70035GE | |
| Lenovo IdeaPad Pro 5 16IMH G9 | |
| Xiaomi RedmiBook Pro 16 2024 | |
| Sınıf ortalaması Multimedia | |
| Dell Inspiron 16 7640 2-in-1 | |
| SCHENKER XMG Evo 15 (M24) | |
| Medion S10 OLED | |
| Ortalama Intel Core Ultra 7 155H | |
| AIDA64 / FP32 Ray-Trace | |
| Lenovo ThinkPad T16 G2 21K70035GE | |
| Lenovo IdeaPad Pro 5 16IMH G9 | |
| Sınıf ortalaması Multimedia (5121 - 50388, n=73, son 2 yıl) | |
| Medion S10 OLED | |
| Dell Inspiron 16 7640 2-in-1 | |
| Xiaomi RedmiBook Pro 16 2024 | |
| Ortalama Intel Core Ultra 7 155H (6670 - 18470, n=50) | |
| SCHENKER XMG Evo 15 (M24) | |
| AIDA64 / FPU Julia | |
| Lenovo ThinkPad T16 G2 21K70035GE | |
| Lenovo IdeaPad Pro 5 16IMH G9 | |
| Xiaomi RedmiBook Pro 16 2024 | |
| Medion S10 OLED | |
| Sınıf ortalaması Multimedia (14528 - 201874, n=74, son 2 yıl) | |
| Dell Inspiron 16 7640 2-in-1 | |
| SCHENKER XMG Evo 15 (M24) | |
| Ortalama Intel Core Ultra 7 155H (40905 - 93181, n=50) | |
| AIDA64 / CPU SHA3 | |
| Lenovo IdeaPad Pro 5 16IMH G9 | |
| Lenovo ThinkPad T16 G2 21K70035GE | |
| Xiaomi RedmiBook Pro 16 2024 | |
| Sınıf ortalaması Multimedia (1188 - 8623, n=74, son 2 yıl) | |
| Medion S10 OLED | |
| Dell Inspiron 16 7640 2-in-1 | |
| SCHENKER XMG Evo 15 (M24) | |
| Ortalama Intel Core Ultra 7 155H (1940 - 4436, n=50) | |
| AIDA64 / CPU Queen | |
| Lenovo ThinkPad T16 G2 21K70035GE | |
| Dell Inspiron 16 7640 2-in-1 | |
| Sınıf ortalaması Multimedia (21547 - 181505, n=74, son 2 yıl) | |
| Xiaomi RedmiBook Pro 16 2024 | |
| Lenovo IdeaPad Pro 5 16IMH G9 | |
| Ortalama Intel Core Ultra 7 155H (64698 - 94181, n=50) | |
| SCHENKER XMG Evo 15 (M24) | |
| Medion S10 OLED | |
| AIDA64 / FPU SinJulia | |
| Lenovo ThinkPad T16 G2 21K70035GE | |
| Lenovo IdeaPad Pro 5 16IMH G9 | |
| Dell Inspiron 16 7640 2-in-1 | |
| Xiaomi RedmiBook Pro 16 2024 | |
| Sınıf ortalaması Multimedia (1240 - 28794, n=74, son 2 yıl) | |
| SCHENKER XMG Evo 15 (M24) | |
| Ortalama Intel Core Ultra 7 155H (5639 - 10647, n=50) | |
| Medion S10 OLED | |
| AIDA64 / FPU Mandel | |
| Lenovo ThinkPad T16 G2 21K70035GE | |
| Lenovo IdeaPad Pro 5 16IMH G9 | |
| Medion S10 OLED | |
| Sınıf ortalaması Multimedia (9903 - 105740, n=73, son 2 yıl) | |
| Xiaomi RedmiBook Pro 16 2024 | |
| Dell Inspiron 16 7640 2-in-1 | |
| SCHENKER XMG Evo 15 (M24) | |
| Ortalama Intel Core Ultra 7 155H (18236 - 47685, n=50) | |
| AIDA64 / CPU AES | |
| SCHENKER XMG Evo 15 (M24) | |
| Lenovo IdeaPad Pro 5 16IMH G9 | |
| Ortalama Intel Core Ultra 7 155H (45713 - 152179, n=50) | |
| Sınıf ortalaması Multimedia (26066 - 169946, n=74, son 2 yıl) | |
| Lenovo ThinkPad T16 G2 21K70035GE | |
| Dell Inspiron 16 7640 2-in-1 | |
| Xiaomi RedmiBook Pro 16 2024 | |
| Medion S10 OLED | |
| AIDA64 / CPU ZLib | |
| Lenovo IdeaPad Pro 5 16IMH G9 | |
| Xiaomi RedmiBook Pro 16 2024 | |
| Dell Inspiron 16 7640 2-in-1 | |
| Medion S10 OLED | |
| Sınıf ortalaması Multimedia (440 - 2022, n=74, son 2 yıl) | |
| Ortalama Intel Core Ultra 7 155H (557 - 1250, n=50) | |
| SCHENKER XMG Evo 15 (M24) | |
| Lenovo ThinkPad T16 G2 21K70035GE | |
| AIDA64 / FP64 Ray-Trace | |
| Lenovo ThinkPad T16 G2 21K70035GE | |
| Lenovo IdeaPad Pro 5 16IMH G9 | |
| Sınıf ortalaması Multimedia (2759 - 26875, n=74, son 2 yıl) | |
| Medion S10 OLED | |
| Dell Inspiron 16 7640 2-in-1 | |
| Xiaomi RedmiBook Pro 16 2024 | |
| SCHENKER XMG Evo 15 (M24) | |
| Ortalama Intel Core Ultra 7 155H (3569 - 9802, n=50) | |
| AIDA64 / CPU PhotoWorxx | |
| Lenovo IdeaPad Pro 5 16IMH G9 | |
| Xiaomi RedmiBook Pro 16 2024 | |
| Ortalama Intel Core Ultra 7 155H (32719 - 54223, n=50) | |
| SCHENKER XMG Evo 15 (M24) | |
| Dell Inspiron 16 7640 2-in-1 | |
| Sınıf ortalaması Multimedia (12860 - 58844, n=74, son 2 yıl) | |
| Medion S10 OLED | |
| Lenovo ThinkPad T16 G2 21K70035GE | |
Sistem performansı
Genel sistem performansı mükemmel ve Evo 15 günlük kullanımda çok hızlı bir sistem. Ayrıca test süremiz boyunca sistem kararlılığı ile ilgili hiçbir sorun yaşamadık.
CrossMark: Overall | Productivity | Creativity | Responsiveness
WebXPRT 3: Overall
WebXPRT 4: Overall
Mozilla Kraken 1.1: Total
| PCMark 10 / Score | |
| SCHENKER XMG Evo 15 (M24) | |
| Lenovo IdeaPad Pro 5 16IMH G9 | |
| Dell Inspiron 16 7640 2-in-1 | |
| Xiaomi RedmiBook Pro 16 2024 | |
| Sınıf ortalaması Multimedia (4325 - 8670, n=70, son 2 yıl) | |
| Ortalama Intel Core Ultra 7 155H, Intel Arc 8-Core iGPU (4809 - 7529, n=34) | |
| Lenovo ThinkPad T16 G2 21K70035GE | |
| Medion S10 OLED | |
| PCMark 10 / Essentials | |
| Lenovo IdeaPad Pro 5 16IMH G9 | |
| SCHENKER XMG Evo 15 (M24) | |
| Dell Inspiron 16 7640 2-in-1 | |
| Xiaomi RedmiBook Pro 16 2024 | |
| Sınıf ortalaması Multimedia (8025 - 12420, n=70, son 2 yıl) | |
| Ortalama Intel Core Ultra 7 155H, Intel Arc 8-Core iGPU (7605 - 11289, n=34) | |
| Lenovo ThinkPad T16 G2 21K70035GE | |
| Medion S10 OLED | |
| PCMark 10 / Productivity | |
| Sınıf ortalaması Multimedia (6089 - 10615, n=70, son 2 yıl) | |
| Lenovo IdeaPad Pro 5 16IMH G9 | |
| Lenovo ThinkPad T16 G2 21K70035GE | |
| SCHENKER XMG Evo 15 (M24) | |
| Dell Inspiron 16 7640 2-in-1 | |
| Ortalama Intel Core Ultra 7 155H, Intel Arc 8-Core iGPU (6042 - 10591, n=34) | |
| Xiaomi RedmiBook Pro 16 2024 | |
| Medion S10 OLED | |
| PCMark 10 / Digital Content Creation | |
| SCHENKER XMG Evo 15 (M24) | |
| Xiaomi RedmiBook Pro 16 2024 | |
| Lenovo IdeaPad Pro 5 16IMH G9 | |
| Dell Inspiron 16 7640 2-in-1 | |
| Sınıf ortalaması Multimedia (3651 - 13548, n=70, son 2 yıl) | |
| Ortalama Intel Core Ultra 7 155H, Intel Arc 8-Core iGPU (4985 - 10709, n=34) | |
| Medion S10 OLED | |
| Lenovo ThinkPad T16 G2 21K70035GE | |
| CrossMark / Overall | |
| SCHENKER XMG Evo 15 (M24) | |
| Xiaomi RedmiBook Pro 16 2024 | |
| Sınıf ortalaması Multimedia (866 - 2255, n=81, son 2 yıl) | |
| Dell Inspiron 16 7640 2-in-1 | |
| Medion S10 OLED | |
| Ortalama Intel Core Ultra 7 155H, Intel Arc 8-Core iGPU (1366 - 1903, n=34) | |
| Lenovo ThinkPad T16 G2 21K70035GE | |
| Lenovo IdeaPad Pro 5 16IMH G9 | |
| CrossMark / Productivity | |
| SCHENKER XMG Evo 15 (M24) | |
| Xiaomi RedmiBook Pro 16 2024 | |
| Medion S10 OLED | |
| Sınıf ortalaması Multimedia (913 - 2050, n=81, son 2 yıl) | |
| Dell Inspiron 16 7640 2-in-1 | |
| Ortalama Intel Core Ultra 7 155H, Intel Arc 8-Core iGPU (1291 - 1798, n=33) | |
| Lenovo ThinkPad T16 G2 21K70035GE | |
| Lenovo IdeaPad Pro 5 16IMH G9 | |
| CrossMark / Creativity | |
| Sınıf ortalaması Multimedia (907 - 2795, n=81, son 2 yıl) | |
| Xiaomi RedmiBook Pro 16 2024 | |
| Dell Inspiron 16 7640 2-in-1 | |
| SCHENKER XMG Evo 15 (M24) | |
| Lenovo IdeaPad Pro 5 16IMH G9 | |
| Ortalama Intel Core Ultra 7 155H, Intel Arc 8-Core iGPU (1519 - 1929, n=33) | |
| Medion S10 OLED | |
| Lenovo ThinkPad T16 G2 21K70035GE | |
| CrossMark / Responsiveness | |
| SCHENKER XMG Evo 15 (M24) | |
| Xiaomi RedmiBook Pro 16 2024 | |
| Medion S10 OLED | |
| Sınıf ortalaması Multimedia (605 - 2094, n=81, son 2 yıl) | |
| Ortalama Intel Core Ultra 7 155H, Intel Arc 8-Core iGPU (939 - 1802, n=33) | |
| Dell Inspiron 16 7640 2-in-1 | |
| Lenovo ThinkPad T16 G2 21K70035GE | |
| Lenovo IdeaPad Pro 5 16IMH G9 | |
| WebXPRT 3 / Overall | |
| Sınıf ortalaması Multimedia (136.4 - 545, n=81, son 2 yıl) | |
| Lenovo IdeaPad Pro 5 16IMH G9 | |
| Dell Inspiron 16 7640 2-in-1 | |
| SCHENKER XMG Evo 15 (M24) | |
| Xiaomi RedmiBook Pro 16 2024 | |
| Ortalama Intel Core Ultra 7 155H, Intel Arc 8-Core iGPU (252 - 299, n=34) | |
| Lenovo ThinkPad T16 G2 21K70035GE | |
| Medion S10 OLED | |
| WebXPRT 4 / Overall | |
| Sınıf ortalaması Multimedia (133.2 - 353, n=75, son 2 yıl) | |
| SCHENKER XMG Evo 15 (M24) | |
| Lenovo IdeaPad Pro 5 16IMH G9 | |
| Dell Inspiron 16 7640 2-in-1 | |
| Xiaomi RedmiBook Pro 16 2024 | |
| Ortalama Intel Core Ultra 7 155H, Intel Arc 8-Core iGPU (166.4 - 309, n=29) | |
| Medion S10 OLED | |
| Lenovo ThinkPad T16 G2 21K70035GE | |
| Mozilla Kraken 1.1 / Total | |
| Medion S10 OLED | |
| Medion S10 OLED | |
| Lenovo ThinkPad T16 G2 21K70035GE | |
| Ortalama Intel Core Ultra 7 155H, Intel Arc 8-Core iGPU (517 - 614, n=35) | |
| SCHENKER XMG Evo 15 (M24) | |
| Dell Inspiron 16 7640 2-in-1 | |
| Xiaomi RedmiBook Pro 16 2024 | |
| Lenovo IdeaPad Pro 5 16IMH G9 | |
| Sınıf ortalaması Multimedia (254 - 1016, n=86, son 2 yıl) | |
* ... daha küçük daha iyidir
| PCMark 10 Score | 7331 puan | |
Yardım | ||
| AIDA64 / Memory Copy | |
| Lenovo IdeaPad Pro 5 16IMH G9 | |
| Xiaomi RedmiBook Pro 16 2024 | |
| Ortalama Intel Core Ultra 7 155H (62397 - 96791, n=50) | |
| Dell Inspiron 16 7640 2-in-1 | |
| Sınıf ortalaması Multimedia (21158 - 104459, n=74, son 2 yıl) | |
| SCHENKER XMG Evo 15 (M24) | |
| Lenovo ThinkPad T16 G2 21K70035GE | |
| Medion S10 OLED | |
| AIDA64 / Memory Read | |
| Lenovo IdeaPad Pro 5 16IMH G9 | |
| Xiaomi RedmiBook Pro 16 2024 | |
| Ortalama Intel Core Ultra 7 155H (60544 - 90647, n=50) | |
| SCHENKER XMG Evo 15 (M24) | |
| Medion S10 OLED | |
| Dell Inspiron 16 7640 2-in-1 | |
| Sınıf ortalaması Multimedia (24312 - 125604, n=74, son 2 yıl) | |
| Lenovo ThinkPad T16 G2 21K70035GE | |
| AIDA64 / Memory Write | |
| Lenovo ThinkPad T16 G2 21K70035GE | |
| Dell Inspiron 16 7640 2-in-1 | |
| Lenovo IdeaPad Pro 5 16IMH G9 | |
| Ortalama Intel Core Ultra 7 155H (58692 - 93451, n=50) | |
| Sınıf ortalaması Multimedia (23679 - 117933, n=74, son 2 yıl) | |
| SCHENKER XMG Evo 15 (M24) | |
| Xiaomi RedmiBook Pro 16 2024 | |
| Medion S10 OLED | |
| AIDA64 / Memory Latency | |
| Dell Inspiron 16 7640 2-in-1 | |
| Ortalama Intel Core Ultra 7 155H (116.2 - 233, n=50) | |
| Medion S10 OLED | |
| Xiaomi RedmiBook Pro 16 2024 | |
| Lenovo IdeaPad Pro 5 16IMH G9 | |
| SCHENKER XMG Evo 15 (M24) | |
| Lenovo ThinkPad T16 G2 21K70035GE | |
| Sınıf ortalaması Multimedia (7 - 346, n=74, son 2 yıl) | |
* ... daha küçük daha iyidir
DPC gecikme süreleri
Standartlaştırılmış gecikme testimizde (internette gezinme, 4K YouTube oynatma, CPU yükü), mevcut BIOS sürümüne sahip test cihazı, gerçek zamanlı ses uygulamalarının kullanımı için küçük sınırlamalar göstermektedir.
| DPC Latencies / LatencyMon - interrupt to process latency (max), Web, Youtube, Prime95 | |
| Medion S10 OLED | |
| SCHENKER XMG Evo 15 (M24) | |
| Dell Inspiron 16 7640 2-in-1 | |
| Lenovo IdeaPad Pro 5 16IMH G9 | |
| Lenovo ThinkPad T16 G2 21K70035GE | |
| Xiaomi RedmiBook Pro 16 2024 | |
* ... daha küçük daha iyidir
Yığın depolama
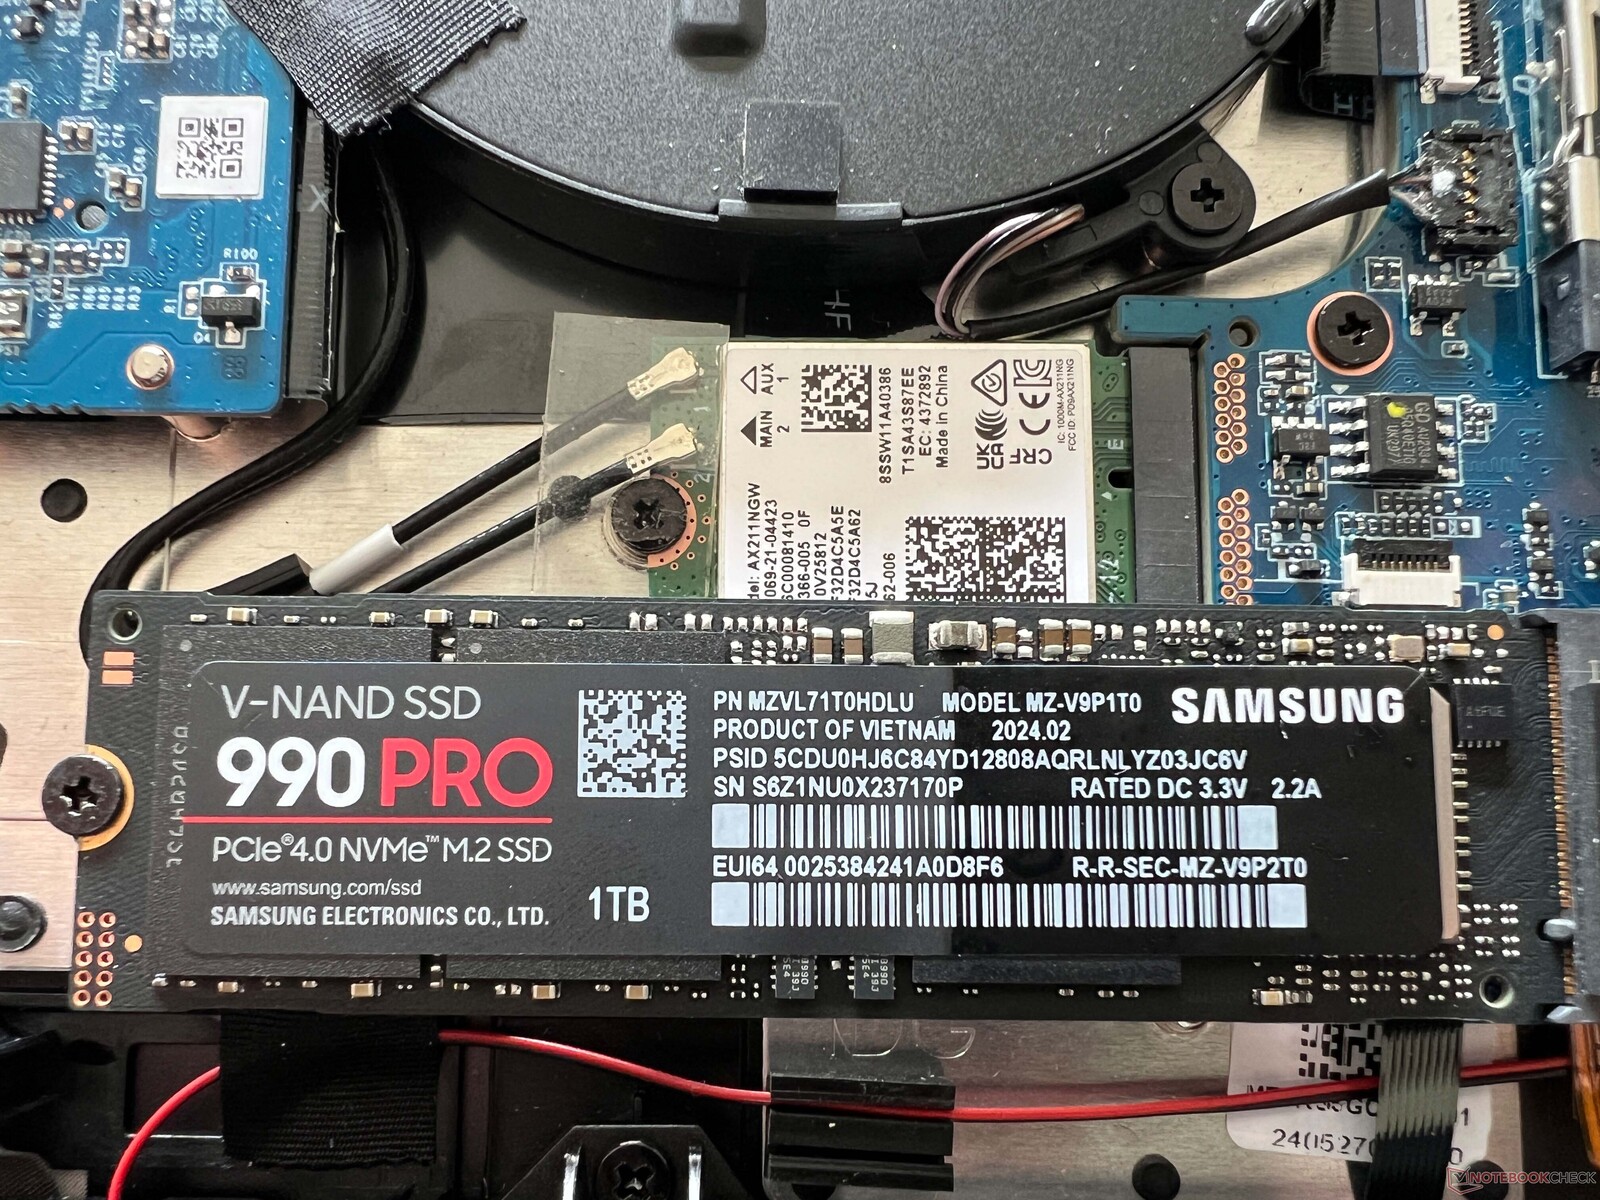
XMG Evo 15 (M24), PCIe 4.0 üzerinden bağlanan ve aynı zamanda bir RAID dizisini (0/1) destekleyen iki adet M.2-2280 yuvası sunmaktadır. Evo standart olarak 500 GB WD Blue SN580 ile donatılmıştır, ancak test cihazımız 7 GB/s'ye kadar aktarım hızlarıyla son derece hızlı bir SSD olan Samsung 990 Pro'nun 1 TB versiyonu ile donatılmıştır. Buna ek olarak, performans uzun süreli yük altında bile tamamen istikrarlı kalmaktadır ki bu elbette söz konusu değildir. İlk çalıştırmadan sonra kullanıcının emrinde 878 GB bulunmaktadır. Diğer SSD kıyaslamalarını bulabilirsiniz burada.

* ... daha küçük daha iyidir
Continuous read: DiskSpd Read Loop, Queue Depth 8
Grafik kartı - Intel Arc Graphics
Evo 15, entegre edilmiş Ark Grafikleri intel işlemcinin 8 Xe çekirdekli hızlı versiyonu olmasına rağmen. IGPU, çift kanallı RAM yapılandırmasından yararlanır ve daha hızlı 7467 RAM'e sahip rakiplerle karşılaştırıldığında (örn. RedmiBook Pro 16 veya IdeaPad Pro 5 16), sentetik kıyaslamalardaki grafik performansı genel olarak sadece marjinal olarak daha düşüktür. Grafik performansı Radeon 780M sadece kıyaslamalarda geride bırakılmıştır. GPU tablolarına ayrıca şu değerleri de dahil ettik Schenker Via 14 Pro radeon 780M ile AMD işlemcili XMG Evo 15 ile karşılaştırılabilir bir performans sunması gerekir.
Mevcut Intel GPU günlük multimedya için iyi bir seçim ve son aylardaki sürücü güncellemeleri de oyun performansını artırdı ve genel olarak burada bir sürpriz yok. Ancak gerçek oyun performansı açısından Arc Graphics liderliğini kaybediyor ve iGPU'lar sonuçta aynı performans seviyesinde.
Grafik performansı sabit yük altında sabit kalıyor, ancak pil modunda performans yaklaşık %26 düşüyor. Diğer GPU kıyaslamalarını şurada bulabilirsiniz teknoloji̇ bölümümüz.
| 3DMark 11 Performance | 13430 puan | |
| 3DMark Fire Strike Score | 7941 puan | |
| 3DMark Time Spy Score | 4067 puan | |
| 3DMark Steel Nomad Score | 757 puan | |
| 3DMark Steel Nomad Light Score | 3248 puan | |
Yardım | ||
| Blender / v3.3 Classroom CPU | |
| Ortalama Intel Arc 8-Core iGPU (294 - 692, n=41) | |
| Sınıf ortalaması Multimedia (160 - 1042, n=80, son 2 yıl) | |
| Lenovo ThinkPad T16 G2 21K70035GE | |
| Dell Inspiron 16 7640 2-in-1 | |
| SCHENKER XMG Evo 15 (M24) | |
| Medion S10 OLED | |
| Xiaomi RedmiBook Pro 16 2024 | |
| Lenovo IdeaPad Pro 5 16IMH G9 | |
| Blender / v3.3 Classroom oneAPI/Intel | |
| Sınıf ortalaması Multimedia (203 - 401, n=5, son 2 yıl) | |
| Ortalama Intel Arc 8-Core iGPU (208 - 309, n=16) | |
| Dell Inspiron 16 7640 2-in-1 | |
* ... daha küçük daha iyidir
| The Witcher 3 - 1920x1080 Ultra Graphics & Postprocessing (HBAO+) | |
| Sınıf ortalaması Multimedia (11 - 143.2, n=62, son 2 yıl) | |
| SCHENKER XMG Evo 15 (M24) | |
| Lenovo IdeaPad Pro 5 16IMH G9 | |
| Xiaomi RedmiBook Pro 16 2024 | |
| Lenovo ThinkPad T16 G2 21K70035GE | |
| Dell Inspiron 16 7640 2-in-1 | |
| GTA V - 1920x1080 Highest Settings possible AA:4xMSAA + FX AF:16x | |
| Sınıf ortalaması Multimedia (9.38 - 141.6, n=77, son 2 yıl) | |
| SCHENKER VIA 14 Pro (M24) | |
| Lenovo ThinkPad T16 G2 21K70035GE | |
| SCHENKER XMG Evo 15 (M24) | |
| Lenovo IdeaPad Pro 5 16IMH G9 | |
| Xiaomi RedmiBook Pro 16 2024 | |
| Medion S10 OLED | |
Cyberpunk 2077 Ultra FPS chart
| düşük | orta | yüksek | ultra | |
|---|---|---|---|---|
| GTA V (2015) | 169.3 | 160.2 | 44.7 | 17.8 |
| The Witcher 3 (2015) | 152 | 93 | 49 | 26 |
| Dota 2 Reborn (2015) | 107.4 | 90.8 | 83.3 | 80.5 |
| Final Fantasy XV Benchmark (2018) | 77 | 40.3 | 29.2 | |
| X-Plane 11.11 (2018) | 54 | 40.4 | 35.8 | |
| Far Cry 5 (2018) | 77 | 43 | 41 | 38 |
| Strange Brigade (2018) | 171 | 73 | 62 | 52 |
| F1 22 (2022) | 96.1 | 87 | 65.2 | 16.9 |
| Baldur's Gate 3 (2023) | 40.3 | 31.1 | 27.5 | 26.2 |
| Cyberpunk 2077 2.2 Phantom Liberty (2023) | 37.9 | 31.4 | 26.7 | 23.7 |
| Total War Pharaoh (2023) | 101.4 | 77.6 | 58.9 | 52 |
Emisyonlar - Günlük yaşamda sessizlik
Gürültü emisyonları
Evo 15'in soğutması genellikle rölantide veya düşük yük altındayken devre dışı bırakılır veya çok sessizdir. Dizüstü bilgisayarı daha fazla yük altına sokarsanız, bu aktif enerji profiline bağlıdır. Enthusiast modunda maksimum 40,4 dB(A), Balanced modunda ve Battery modunda ise maksimum 35,4 dB(A)'dır. Overboost modunda işlemcinin tam gücünü kullanmak isterseniz, soğutma maksimum 48,1 dB(A) ile önemli ölçüde daha yüksek olur. Yük aşaması sona erdiğinde, fanlar hızlarını tekrar çok hızlı bir şekilde düşürür (her profilde). Evo 15 test cihazımızda başka hiçbir elektronik ses yoktu.
Ses yüksekliği
| Boşta |
| 24.7 / 24.7 / 28.9 dB |
| Çalışırken |
| 32.7 / 40.4 dB |
 | ||
30 dB sessiz 40 dB(A) duyulabilirlik 50 dB(A) gürültülü |
||
min: | ||
| SCHENKER XMG Evo 15 (M24) Arc 8-Core, Ultra 7 155H, Samsung 990 Pro 1 TB | Dell Inspiron 16 7640 2-in-1 Arc 8-Core, Ultra 7 155H, Micron 2550 1TB | Medion S10 OLED Arc 8-Core, Ultra 7 155H, Phison PS5019-E19 SSO1TBITC4-E19-V7 | Xiaomi RedmiBook Pro 16 2024 Arc 8-Core, Ultra 7 155H, YMTC PC300-1TB | Lenovo IdeaPad Pro 5 16IMH G9 Arc 8-Core, Ultra 7 155H, Samsung PM9C1a MZAL81T0HDLB | Lenovo ThinkPad T16 G2 21K70035GE Radeon 780M, R7 7840U, SK hynix PC801 HFS001TEJ9X162N | |
|---|---|---|---|---|---|---|
| Noise | -4% | -9% | 4% | -6% | 8% | |
| kapalı / ortam * | 24.7 | 22.9 7% | 25 -1% | 24.4 1% | 24.1 2% | 24.5 1% |
| Idle Minimum * | 24.7 | 22.9 7% | 26 -5% | 24.4 1% | 24.1 2% | 24.5 1% |
| Idle Average * | 24.7 | 22.9 7% | 27 -9% | 24.4 1% | 24.1 2% | 24.5 1% |
| Idle Maximum * | 28.9 | 25 13% | 28 3% | 24.4 16% | 28.2 2% | 24.5 15% |
| Load Average * | 32.7 | 45.1 -38% | 43 -31% | 32 2% | 44.4 -36% | 26.6 19% |
| Cyberpunk 2077 ultra * | 40.4 | 44.9 -11% | 42 -4% | |||
| Load Maximum * | 40.4 | 44.9 -11% | 48 -19% | 39.7 2% | 44.4 -10% | 35.5 12% |
| Witcher 3 ultra * | 30.6 | 36.5 | 37.2 |
* ... daha küçük daha iyidir
Sıcaklık
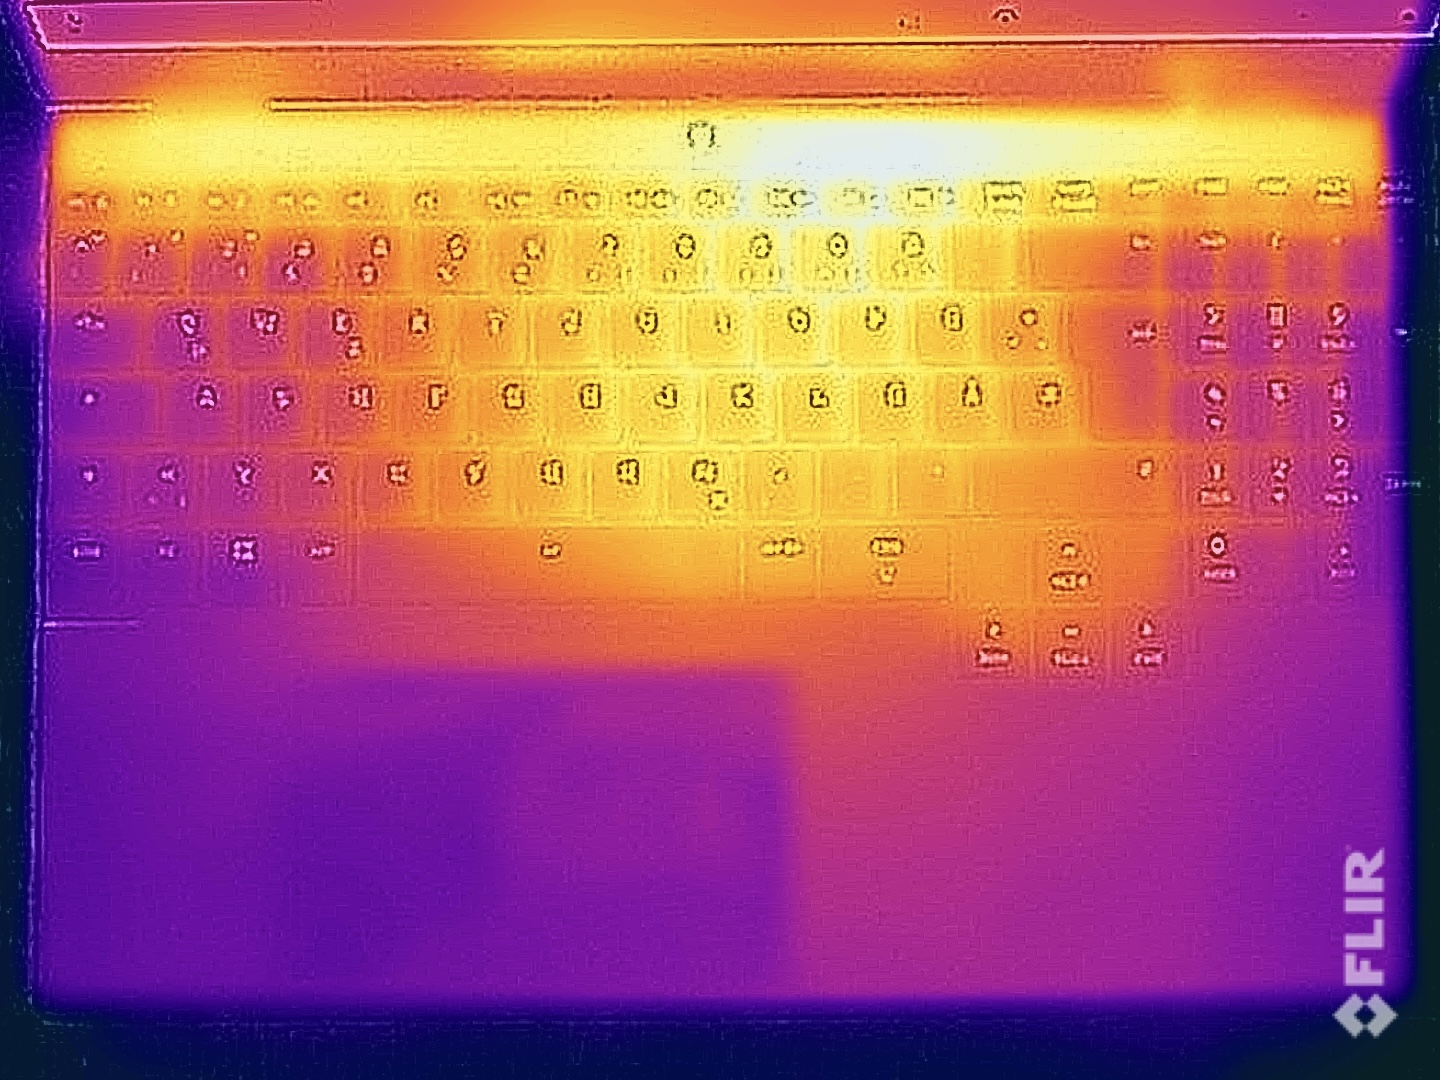
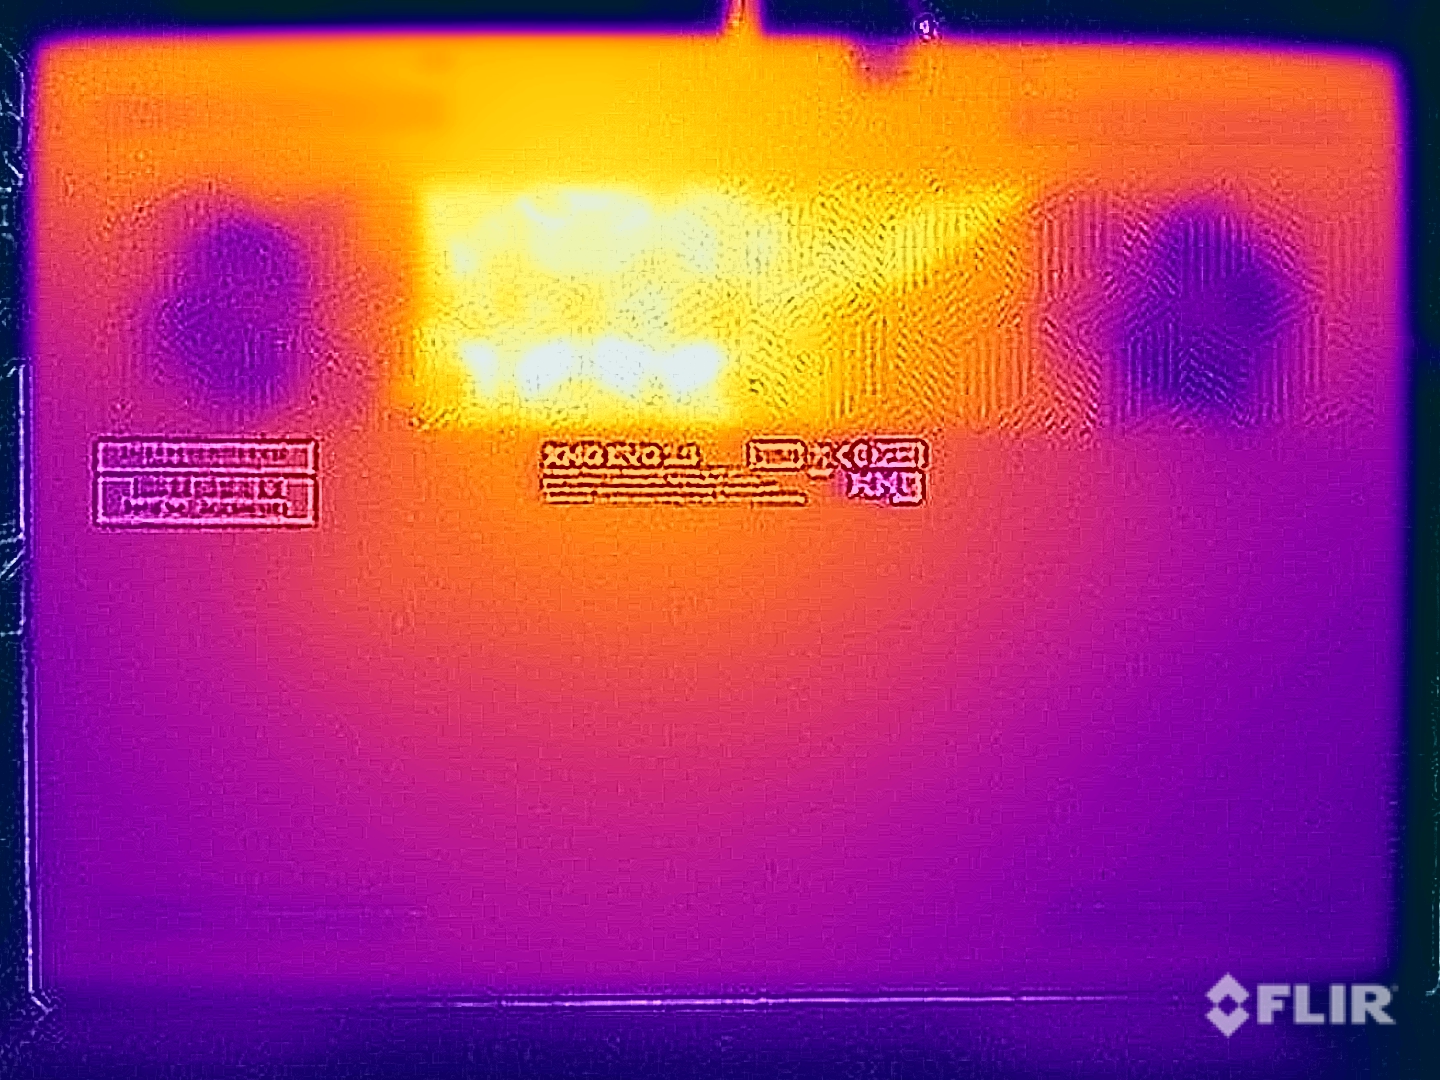
Evo 15'in alüminyum kasası düşük yük altında çok serin kalıyor ve yük altında bile herhangi bir sorun yaşanmıyor. Alt taraf aşırı durumlarda neredeyse 50 °C'ye ulaşabilir, ancak sıcak nokta orta arka bölgedeki alt taraftadır. Cihaz uyluk üzerinde bile kullanılabiliyor. Klavye alanı yük altında bile genel olarak önemli ölçüde daha serin kalıyor ve yazarken herhangi bir kısıtlama olmuyor. Stres testinde işlemci belirtilen TDP değerinde sabit kalıyor.

(±) Üst taraftaki maksimum sıcaklık, 36.9 °C / 98 F ortalamasına kıyasla 41.7 °C / 107 F'dir. , Multimedia sınıfı için 21.1 ile 71 °C arasında değişir.
(-) Alt kısım, 39.2 °C / 103 F ortalamasına kıyasla maksimum 49.6 °C / 121 F'ye kadar ısınır
(+) Boşta kullanımda, üst tarafın ortalama sıcaklığı 29.5 °C / 85 F olup, cihazın 31.3 °C / 88 F.
(±) 3: The average temperature for the upper side is 34.3 °C / 94 F, compared to the average of 31.3 °C / 88 F for the class Multimedia.
(+) Avuç içi dayanakları ve dokunmatik yüzey maksimum (32 °C / 89.6 F) cilt sıcaklığına ulaşıyor ve bu nedenle sıcak değil.
(-) Benzer cihazların avuç içi dayanağı alanının ortalama sıcaklığı 28.8 °C / 83.8 F (-3.2 °C / -5.8 F) idi.
| SCHENKER XMG Evo 15 (M24) Intel Core Ultra 7 155H, Intel Arc 8-Core iGPU | Dell Inspiron 16 7640 2-in-1 Intel Core Ultra 7 155H, Intel Arc 8-Core iGPU | Medion S10 OLED Intel Core Ultra 7 155H, Intel Arc 8-Core iGPU | Xiaomi RedmiBook Pro 16 2024 Intel Core Ultra 7 155H, Intel Arc 8-Core iGPU | Lenovo IdeaPad Pro 5 16IMH G9 Intel Core Ultra 7 155H, Intel Arc 8-Core iGPU | Lenovo ThinkPad T16 G2 21K70035GE AMD Ryzen 7 7840U, AMD Radeon 780M | |
|---|---|---|---|---|---|---|
| Heat | -1% | -12% | 10% | 19% | 4% | |
| Maximum Upper Side * | 41.7 | 46.8 -12% | 55 -32% | 40.3 3% | 36.3 13% | 48.7 -17% |
| Maximum Bottom * | 49.6 | 45.6 8% | 55 -11% | 45.9 7% | 39.1 21% | 52 -5% |
| Idle Upper Side * | 31.1 | 32.2 -4% | 32 -3% | 26.3 15% | 24.9 20% | 26.4 15% |
| Idle Bottom * | 33.1 | 31.4 5% | 33 -0% | 27.9 16% | 26.1 21% | 26.3 21% |
* ... daha küçük daha iyidir
Konuşmacı
Evo 15, iyi bir ses kalitesi sağlayan iki stereo hoparlör sunar. Daha iyi ses sistemlerine sahip multimedya dizüstü bilgisayarlar olmasına rağmen (daha fazla hoparlörü olan), Evo karşılaştırma grubu içinde bu disiplindeki en iyi modellerden biridir. Ses genel olarak net ve belirgin, tek fark edilebilir düşüş baslarda.
SCHENKER XMG Evo 15 (M24) ses analizi
(+) | hoparlörler nispeten yüksek sesle çalabilir (85.6 dB)
Bas 100 - 315Hz
(-) | neredeyse hiç bas yok - ortalama olarak medyandan 17.9% daha düşük
(±) | Bas doğrusallığı ortalamadır (11.6% delta - önceki frekans)
Ortalar 400 - 2000 Hz
(+) | dengeli ortalar - medyandan yalnızca 3.7% uzakta
(+) | orta frekanslar doğrusaldır (4.5% deltadan önceki frekansa)
Yüksekler 2 - 16 kHz
(+) | dengeli yüksekler - medyandan yalnızca 2.2% uzakta
(+) | yüksekler doğrusaldır (6.5% deltadan önceki frekansa)
Toplam 100 - 16.000 Hz
(+) | genel ses doğrusaldır (11.8% ortancaya göre fark)
Aynı sınıfla karşılaştırıldığında
» Bu sınıftaki tüm test edilen cihazların %15%'si daha iyi, 4% benzer, 81% daha kötüydü
» En iyisinin deltası 5% idi, ortalama 18% idi, en kötüsü 45% idi
Test edilen tüm cihazlarla karşılaştırıldığında
» Test edilen tüm cihazların %7'si daha iyi, 2 benzer, % 91 daha kötüydü
» En iyisinin deltası 4% idi, ortalama 24% idi, en kötüsü 134% idi
Dell Inspiron 16 7640 2-in-1 ses analizi
(+) | hoparlörler nispeten yüksek sesle çalabilir (84 dB)
Bas 100 - 315Hz
(±) | azaltılmış bas - ortalama olarak medyandan 13.9% daha düşük
(±) | Bas doğrusallığı ortalamadır (14% delta - önceki frekans)
Ortalar 400 - 2000 Hz
(+) | dengeli ortalar - medyandan yalnızca 3.6% uzakta
(+) | orta frekanslar doğrusaldır (3.6% deltadan önceki frekansa)
Yüksekler 2 - 16 kHz
(+) | dengeli yüksekler - medyandan yalnızca 4.5% uzakta
(+) | yüksekler doğrusaldır (2.8% deltadan önceki frekansa)
Toplam 100 - 16.000 Hz
(+) | genel ses doğrusaldır (12% ortancaya göre fark)
Aynı sınıfla karşılaştırıldığında
» Bu sınıftaki tüm test edilen cihazların %11%'si daha iyi, 4% benzer, 85% daha kötüydü
» En iyisinin deltası 6% idi, ortalama 20% idi, en kötüsü 57% idi
Test edilen tüm cihazlarla karşılaştırıldığında
» Test edilen tüm cihazların %8'si daha iyi, 2 benzer, % 90 daha kötüydü
» En iyisinin deltası 4% idi, ortalama 24% idi, en kötüsü 134% idi
Medion S10 OLED ses analizi
(+) | hoparlörler nispeten yüksek sesle çalabilir (85 dB)
Bas 100 - 315Hz
(-) | neredeyse hiç bas yok - ortalama olarak medyandan 17.3% daha düşük
(±) | Bas doğrusallığı ortalamadır (9.5% delta - önceki frekans)
Ortalar 400 - 2000 Hz
(+) | dengeli ortalar - medyandan yalnızca 4.3% uzakta
(+) | orta frekanslar doğrusaldır (4.3% deltadan önceki frekansa)
Yüksekler 2 - 16 kHz
(+) | dengeli yüksekler - medyandan yalnızca 1.2% uzakta
(+) | yüksekler doğrusaldır (5% deltadan önceki frekansa)
Toplam 100 - 16.000 Hz
(+) | genel ses doğrusaldır (12.9% ortancaya göre fark)
Aynı sınıfla karşılaştırıldığında
» Bu sınıftaki tüm test edilen cihazların %21%'si daha iyi, 4% benzer, 74% daha kötüydü
» En iyisinin deltası 5% idi, ortalama 18% idi, en kötüsü 45% idi
Test edilen tüm cihazlarla karşılaştırıldığında
» Test edilen tüm cihazların %11'si daha iyi, 3 benzer, % 87 daha kötüydü
» En iyisinin deltası 4% idi, ortalama 24% idi, en kötüsü 134% idi
Xiaomi RedmiBook Pro 16 2024 ses analizi
(+) | hoparlörler nispeten yüksek sesle çalabilir (83.8 dB)
Bas 100 - 315Hz
(±) | azaltılmış bas - ortalama olarak medyandan 13.6% daha düşük
(±) | Bas doğrusallığı ortalamadır (7.9% delta - önceki frekans)
Ortalar 400 - 2000 Hz
(±) | daha yüksek ortalar - ortalama olarak medyandan 5.3% daha yüksek
(+) | orta frekanslar doğrusaldır (5% deltadan önceki frekansa)
Yüksekler 2 - 16 kHz
(+) | dengeli yüksekler - medyandan yalnızca 2.8% uzakta
(+) | yüksekler doğrusaldır (5.3% deltadan önceki frekansa)
Toplam 100 - 16.000 Hz
(+) | genel ses doğrusaldır (13% ortancaya göre fark)
Aynı sınıfla karşılaştırıldığında
» Bu sınıftaki tüm test edilen cihazların %22%'si daha iyi, 5% benzer, 74% daha kötüydü
» En iyisinin deltası 5% idi, ortalama 18% idi, en kötüsü 45% idi
Test edilen tüm cihazlarla karşılaştırıldığında
» Test edilen tüm cihazların %11'si daha iyi, 2 benzer, % 86 daha kötüydü
» En iyisinin deltası 4% idi, ortalama 24% idi, en kötüsü 134% idi
Lenovo IdeaPad Pro 5 16IMH G9 ses analizi
(±) | hoparlör ses yüksekliği ortalama ama iyi (81.1 dB)
Bas 100 - 315Hz
(-) | neredeyse hiç bas yok - ortalama olarak medyandan 22.3% daha düşük
(±) | Bas doğrusallığı ortalamadır (10.5% delta - önceki frekans)
Ortalar 400 - 2000 Hz
(+) | dengeli ortalar - medyandan yalnızca 2.6% uzakta
(+) | orta frekanslar doğrusaldır (4.6% deltadan önceki frekansa)
Yüksekler 2 - 16 kHz
(+) | dengeli yüksekler - medyandan yalnızca 1.2% uzakta
(+) | yüksekler doğrusaldır (3.9% deltadan önceki frekansa)
Toplam 100 - 16.000 Hz
(+) | genel ses doğrusaldır (13.9% ortancaya göre fark)
Aynı sınıfla karşılaştırıldığında
» Bu sınıftaki tüm test edilen cihazların %27%'si daha iyi, 4% benzer, 69% daha kötüydü
» En iyisinin deltası 5% idi, ortalama 18% idi, en kötüsü 45% idi
Test edilen tüm cihazlarla karşılaştırıldığında
» Test edilen tüm cihazların %14'si daha iyi, 4 benzer, % 82 daha kötüydü
» En iyisinin deltası 4% idi, ortalama 24% idi, en kötüsü 134% idi
Lenovo ThinkPad T16 G2 21K70035GE ses analizi
(±) | hoparlör ses yüksekliği ortalama ama iyi (75.1 dB)
Bas 100 - 315Hz
(-) | neredeyse hiç bas yok - ortalama olarak medyandan 23.9% daha düşük
(±) | Bas doğrusallığı ortalamadır (13.8% delta - önceki frekans)
Ortalar 400 - 2000 Hz
(+) | dengeli ortalar - medyandan yalnızca 3.9% uzakta
(+) | orta frekanslar doğrusaldır (6.9% deltadan önceki frekansa)
Yüksekler 2 - 16 kHz
(+) | dengeli yüksekler - medyandan yalnızca 2.1% uzakta
(+) | yüksekler doğrusaldır (4.2% deltadan önceki frekansa)
Toplam 100 - 16.000 Hz
(±) | Genel sesin doğrusallığı ortalamadır (19.9% ortancaya göre fark)
Aynı sınıfla karşılaştırıldığında
» Bu sınıftaki tüm test edilen cihazların %39%'si daha iyi, 9% benzer, 52% daha kötüydü
» En iyisinin deltası 7% idi, ortalama 21% idi, en kötüsü 53% idi
Test edilen tüm cihazlarla karşılaştırıldığında
» Test edilen tüm cihazların %48'si daha iyi, 7 benzer, % 44 daha kötüydü
» En iyisinin deltası 4% idi, ortalama 24% idi, en kötüsü 134% idi
Enerji yönetimi
Güç tüketimi
Büyük ve parlak ekranın güç tüketimi üzerinde etkisi vardır ve boşta modunda maksimum 14 watt'ın biraz altında ölçtük. Hem oyun oynarken hem de stres testinde tüketim 76-78 watt'tır ve kesinlikle sabit kalır, bu nedenle 100 watt'lık güç kaynağı tamamen yeterlidir. Overboost profilinde, maksimum 107,9 watt ölçtük, bu nedenle güç kaynağının örneğin pili şarj etmek için daha fazla hareket alanı yok. Ancak burada da bataryaya dokunulmuyor. Daha önce de belirttiğimiz gibi, 1,4 watt'lık bekleme tüketimi çok yüksek.
| Kapalı / Bekleme modu | |
| Boşta | |
| Çalışırken |
|
Key:
min: | |
| SCHENKER XMG Evo 15 (M24) Ultra 7 155H, Arc 8-Core, Samsung 990 Pro 1 TB, IPS, 2560x1600, 15.3" | Dell Inspiron 16 7640 2-in-1 Ultra 7 155H, Arc 8-Core, Micron 2550 1TB, Mini-LED, 2560x1600, 16" | Medion S10 OLED Ultra 7 155H, Arc 8-Core, Phison PS5019-E19 SSO1TBITC4-E19-V7, OLED, 3840x2400, 16" | Xiaomi RedmiBook Pro 16 2024 Ultra 7 155H, Arc 8-Core, YMTC PC300-1TB, IPS, 3072x1920, 16" | Lenovo IdeaPad Pro 5 16IMH G9 Ultra 7 155H, Arc 8-Core, Samsung PM9C1a MZAL81T0HDLB, IPS, 2560x1600, 16" | Lenovo ThinkPad T16 G2 21K70035GE R7 7840U, Radeon 780M, SK hynix PC801 HFS001TEJ9X162N, IPS LED, 1920x1200, 16" | Ortalama Intel Arc 8-Core iGPU | Sınıf ortalaması Multimedia | |
|---|---|---|---|---|---|---|---|---|
| Power Consumption | 3% | 10% | 1% | 20% | 40% | 20% | -4% | |
| Idle Minimum * | 7.7 | 6.1 21% | 7 9% | 4.2 45% | 3.5 55% | 3.7 52% | 5.34 ? 31% | 6.86 ? 11% |
| Idle Average * | 13.2 | 13.5 -2% | 10 24% | 11.6 12% | 9.6 27% | 7.2 45% | 8.54 ? 35% | 11.5 ? 13% |
| Idle Maximum * | 13.7 | 13.8 -1% | 19 -39% | 12.3 10% | 9.9 28% | 8.7 36% | 11.9 ? 13% | 13.5 ? 1% |
| Load Average * | 76.2 | 63.6 17% | 52 32% | 61.9 19% | 62.7 18% | 44.1 42% | 54 ? 29% | 71.4 ? 6% |
| Cyberpunk 2077 ultra * | 76.7 | 67 13% | 53.2 31% | |||||
| Cyberpunk 2077 ultra external monitor * | 72.7 | 64.6 11% | 49.2 32% | |||||
| Load Maximum * | 78.1 | 109.7 -40% | 95 -22% | 140.6 -80% | 101.2 -30% | 58.2 25% | 84.9 ? -9% | 116.6 ? -49% |
| Witcher 3 ultra * | 57 | 55.8 | 50.9 |
* ... daha küçük daha iyidir
Powr consumption Cyberpunk / Stress test
Power consumption with the external monitor
Pil ömrü
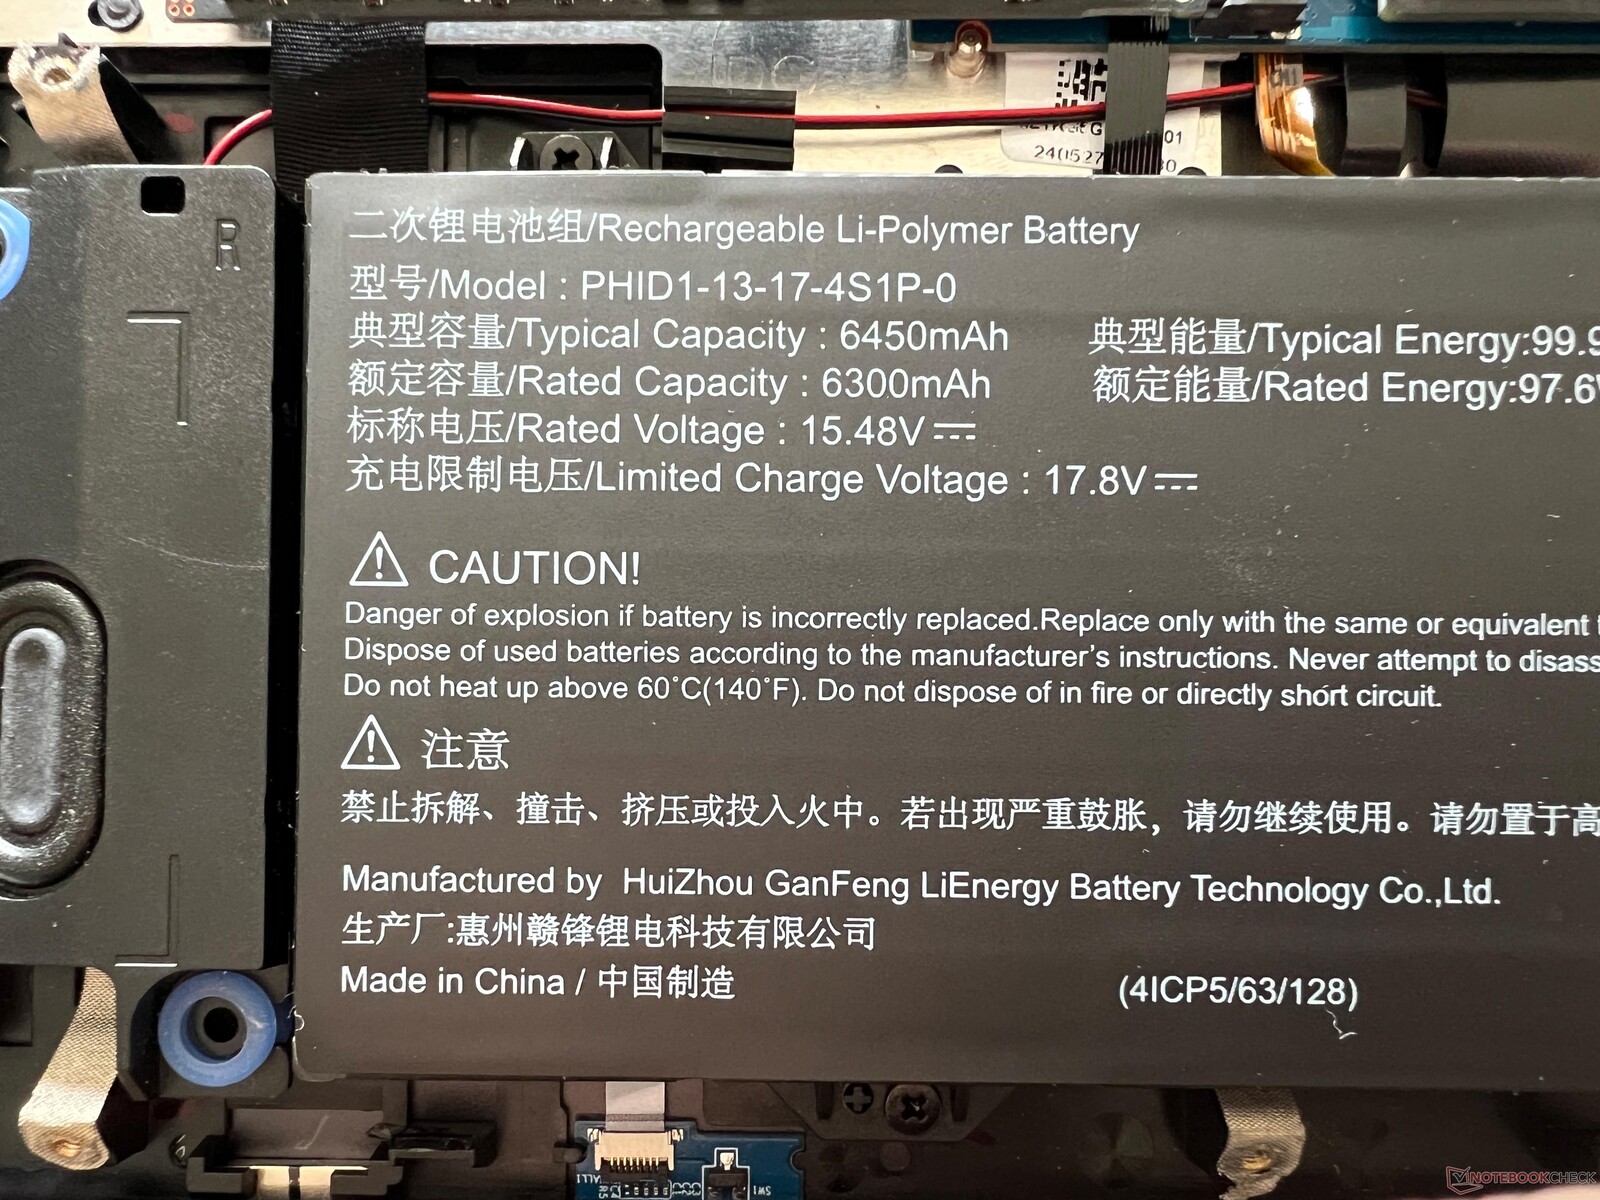
Schenker, Evo 15'e 99,8 Wh'lik devasa bir batarya yerleştiriyor ve bu da enerji tüketen ekrana rağmen genel olarak iyi çalışma süreleri sağlıyor Medion S10 daha da fazla dayanıklılık sunar. WLAN testinde 150 cd/m² (test cihazındaki maksimum parlaklığın %58'ine karşılık gelir) ile 60 Hz'de 10:25 saat ve 240 Hz'de 08:25 saat ölçtük. Tam parlaklıkta, çalışma süresi 8 saate (60 Hz) veya 6:39 saate (240 Hz) düşer, bu nedenle pil modundaki frekansı kesinlikle azaltmalısınız.
Video testi 12 saatin biraz üzerinde çalışıyor ve yük altında en kötü durum senaryosu 2:14 saat. Cihaz açıldığında tam şarj 165 dakika gibi uzun bir süre alıyor (130 dakika sonra %80) ve hızlı şarj fonksiyonu bulunmuyor.
| SCHENKER XMG Evo 15 (M24) Ultra 7 155H, Arc 8-Core, 99.9 Wh | Dell Inspiron 16 7640 2-in-1 Ultra 7 155H, Arc 8-Core, 90 Wh | Medion S10 OLED Ultra 7 155H, Arc 8-Core, 70 Wh | Xiaomi RedmiBook Pro 16 2024 Ultra 7 155H, Arc 8-Core, 99 Wh | Lenovo IdeaPad Pro 5 16IMH G9 Ultra 7 155H, Arc 8-Core, 84 Wh | Lenovo ThinkPad T16 G2 21K70035GE R7 7840U, Radeon 780M, 52.5 Wh | Sınıf ortalaması Multimedia | |
|---|---|---|---|---|---|---|---|
| Pil Çalışma Süresi | -11% | -30% | 43% | 1% | -27% | -1% | |
| H.264 | 729 | 1308 79% | 957 31% | 864 ? 19% | |||
| WiFi v1.3 | 625 | 686 10% | 436 -30% | 983 57% | 756 21% | 658 5% | 645 ? 3% |
| Load | 134 | 93 -31% | 124 -7% | 68 -49% | 56 -58% | 99 ? -26% |
Artılar
Eksiler
Karar - dGPU'su olmayan en iyi multimedya dizüstü bilgisayarlardan biri

Yeni XMG Evo 15 (M24) ile Alman üretici Schenker, özel bir grafik kartı olmadan iyi bir multimedya dizüstü bilgisayar piyasaya sürüyor. Piyasadaki en ince dizüstü bilgisayar değil ama Evo 15'in de öyle bir iddiası yok. Öte yandan, çok iyi bakım seçeneklerine sahipsiniz ve hem RAM (maks. 96 GB) hem de SSD kapasitesi (2 M.2-2280 yuvası) kolayca yükseltilebilir. Eski bir USB 2.0 portunun cihaza nasıl girdiğini merak etsek de yeterli sayıda port da mevcut. Ancak çok sayıda başka hızlı USB bağlantı noktası olduğu için (Thunderbolt 4 ile Intel, USB 4.0 ile AMD) bu çok büyük bir sorun değil. Giriş aygıtları ve hoparlörler söz konusu olduğunda da şikayet edilecek pek bir şey yok.
Ekran söz konusu olduğunda, oyun köklerini ve ekranla olan ilişkisini fark edebilirsiniz XMG Fusion 15 ancak bu bir dezavantaj değildir. Mat IPS panel yüksek çözünürlük ve 240 Hz'lik hızlı bir frekans sunuyor. Ayrıca PWM yoktur ve tepki süreleri de hızlıdır. Parlaklık neredeyse 600 cd/m² ile çok iyi, bu da siyah seviyesini ve dolayısıyla kontrast oranını etkiliyor. OLED panel gibi zengin siyahlar bekleyenler kesinlikle hayal kırıklığına uğrayacaktır. Kalibrasyondan sonra renk doğruluğu mükemmeldir ve tam sRGB kapsamı sayesinde panel görüntü düzenleme için de uygundur. Büyük 99,8 Wh pil, ekranın güç tüketimini iyi bir şekilde telafi edebilir ve genel olarak prizden uzakta dayanıklılık iyidir.
Mükemmel bakım seçenekleri, doğru renklere sahip parlak IPS ekran ve tutarlı enerji profilleri ile iyi performans değerleri: Yeni Schenker XMG Evo 15, hem AMD hem de Intel işlemcilerle kullanılabilen ve gerçek bir zayıf noktası olmayan, özel bir grafik kartı olmayan heyecan verici bir multimedya dizüstü bilgisayardır.
Intel işlemcili Evo 15'in performansı genel olarak çok iyi ve her şeyden önce istikrarlı, çünkü saçma sapan yüksek kısa vadeli güç limitleri yok. Daha yüksek performansa ihtiyacınız varsa, Overboost modunu kullanabilirsiniz, ancak daha yüksek sesli fanlara katlanmanız gerekecektir. Ancak genel olarak Evo 15, özellikle günlük işler için çok sessiz bir arkadaştır.
Tüm bu olumlu yönleriyle yeni Evo 15 piyasada neredeyse rakipsiz. Geriye Intel modelini mi yoksa AMD modelini mi seçmeniz gerektiği sorusu kalıyor. AMD modeli Thunderbolt 4 yerine sadece USB 4.0'a sahip olsa da, üretici performansın (Intel'in biraz daha düşük güç limitlerine rağmen) daha yüksek olduğunu iddia ediyor Ryzen 7 8845HS) karşılaştırılabilir. Pil ömründe de büyük farklar beklemiyoruz, bu da müşterilerin Intel işlemci için neden 150 Euro daha fazla ödemesi gerektiği sorusunu akla getiriyor. AMD'nin 1.049 Euro'dan başlayan modeli kesinlikle daha iyi bir fiyat-performans oranı sunuyor.
Fiyat ve bulunabilirlik
Yeni Schenker XMG Evo 15 (M24) artık Bestware'den sipariş edilebilir. AMD modeli 1.049 Euro'dan, Intel versiyonu ise 1.199 Euro'dan başlıyor.
Not: Derecelendirme sistemimizi yakın zamanda güncelledik ve 8. versiyonun sonuçları 7. versiyonun sonuçları ile karşılaştırılamaz. Daha fazla bilgi için burada.
SCHENKER XMG Evo 15 (M24)
- 07/31/2024 v8
Andreas Osthoff
 Total Sustainability Score:
 Şeffaflık
İncelenecek cihazların seçimi editör ekibimiz tarafından yapılır. Test örneği, bu incelemenin amacı doğrultusunda üretici veya perakendeci tarafından yazara ödünç olarak sağlanmıştır. Borç verenin bu inceleme üzerinde herhangi bir etkisi olmadığı gibi, üretici de yayınlanmadan önce bu incelemenin bir kopyasını almamıştır. Bu incelemeyi yayınlama zorunluluğu yoktu. İncelemelerimiz karşılığında asla tazminat veya ödeme kabul etmiyoruz. Bağımsız bir medya şirketi olarak Notebookcheck, üreticilerin, perakendecilerin veya yayıncıların otoritesine tabi değildir.
Notebookcheck bu şekilde test yapıyor
Notebookcheck, tüm sonuçların karşılaştırılabilir olmasını sağlamak için her yıl yüzlerce dizüstü bilgisayarı ve akıllı telefonu standart prosedürler kullanarak bağımsız olarak inceliyor. Yaklaşık 20 yıldır test yöntemlerimizi sürekli olarak geliştirdik ve bu süreçte endüstri standartlarını belirledik. Test laboratuvarlarımızda deneyimli teknisyenler ve editörler tarafından yüksek kaliteli ölçüm ekipmanları kullanılmaktadır. Bu testler çok aşamalı bir doğrulama sürecini içerir. Karmaşık derecelendirme sistemimiz, nesnelliği koruyan yüzlerce sağlam temellere dayanan ölçüm ve kıyaslamaya dayanmaktadır.Price comparison
