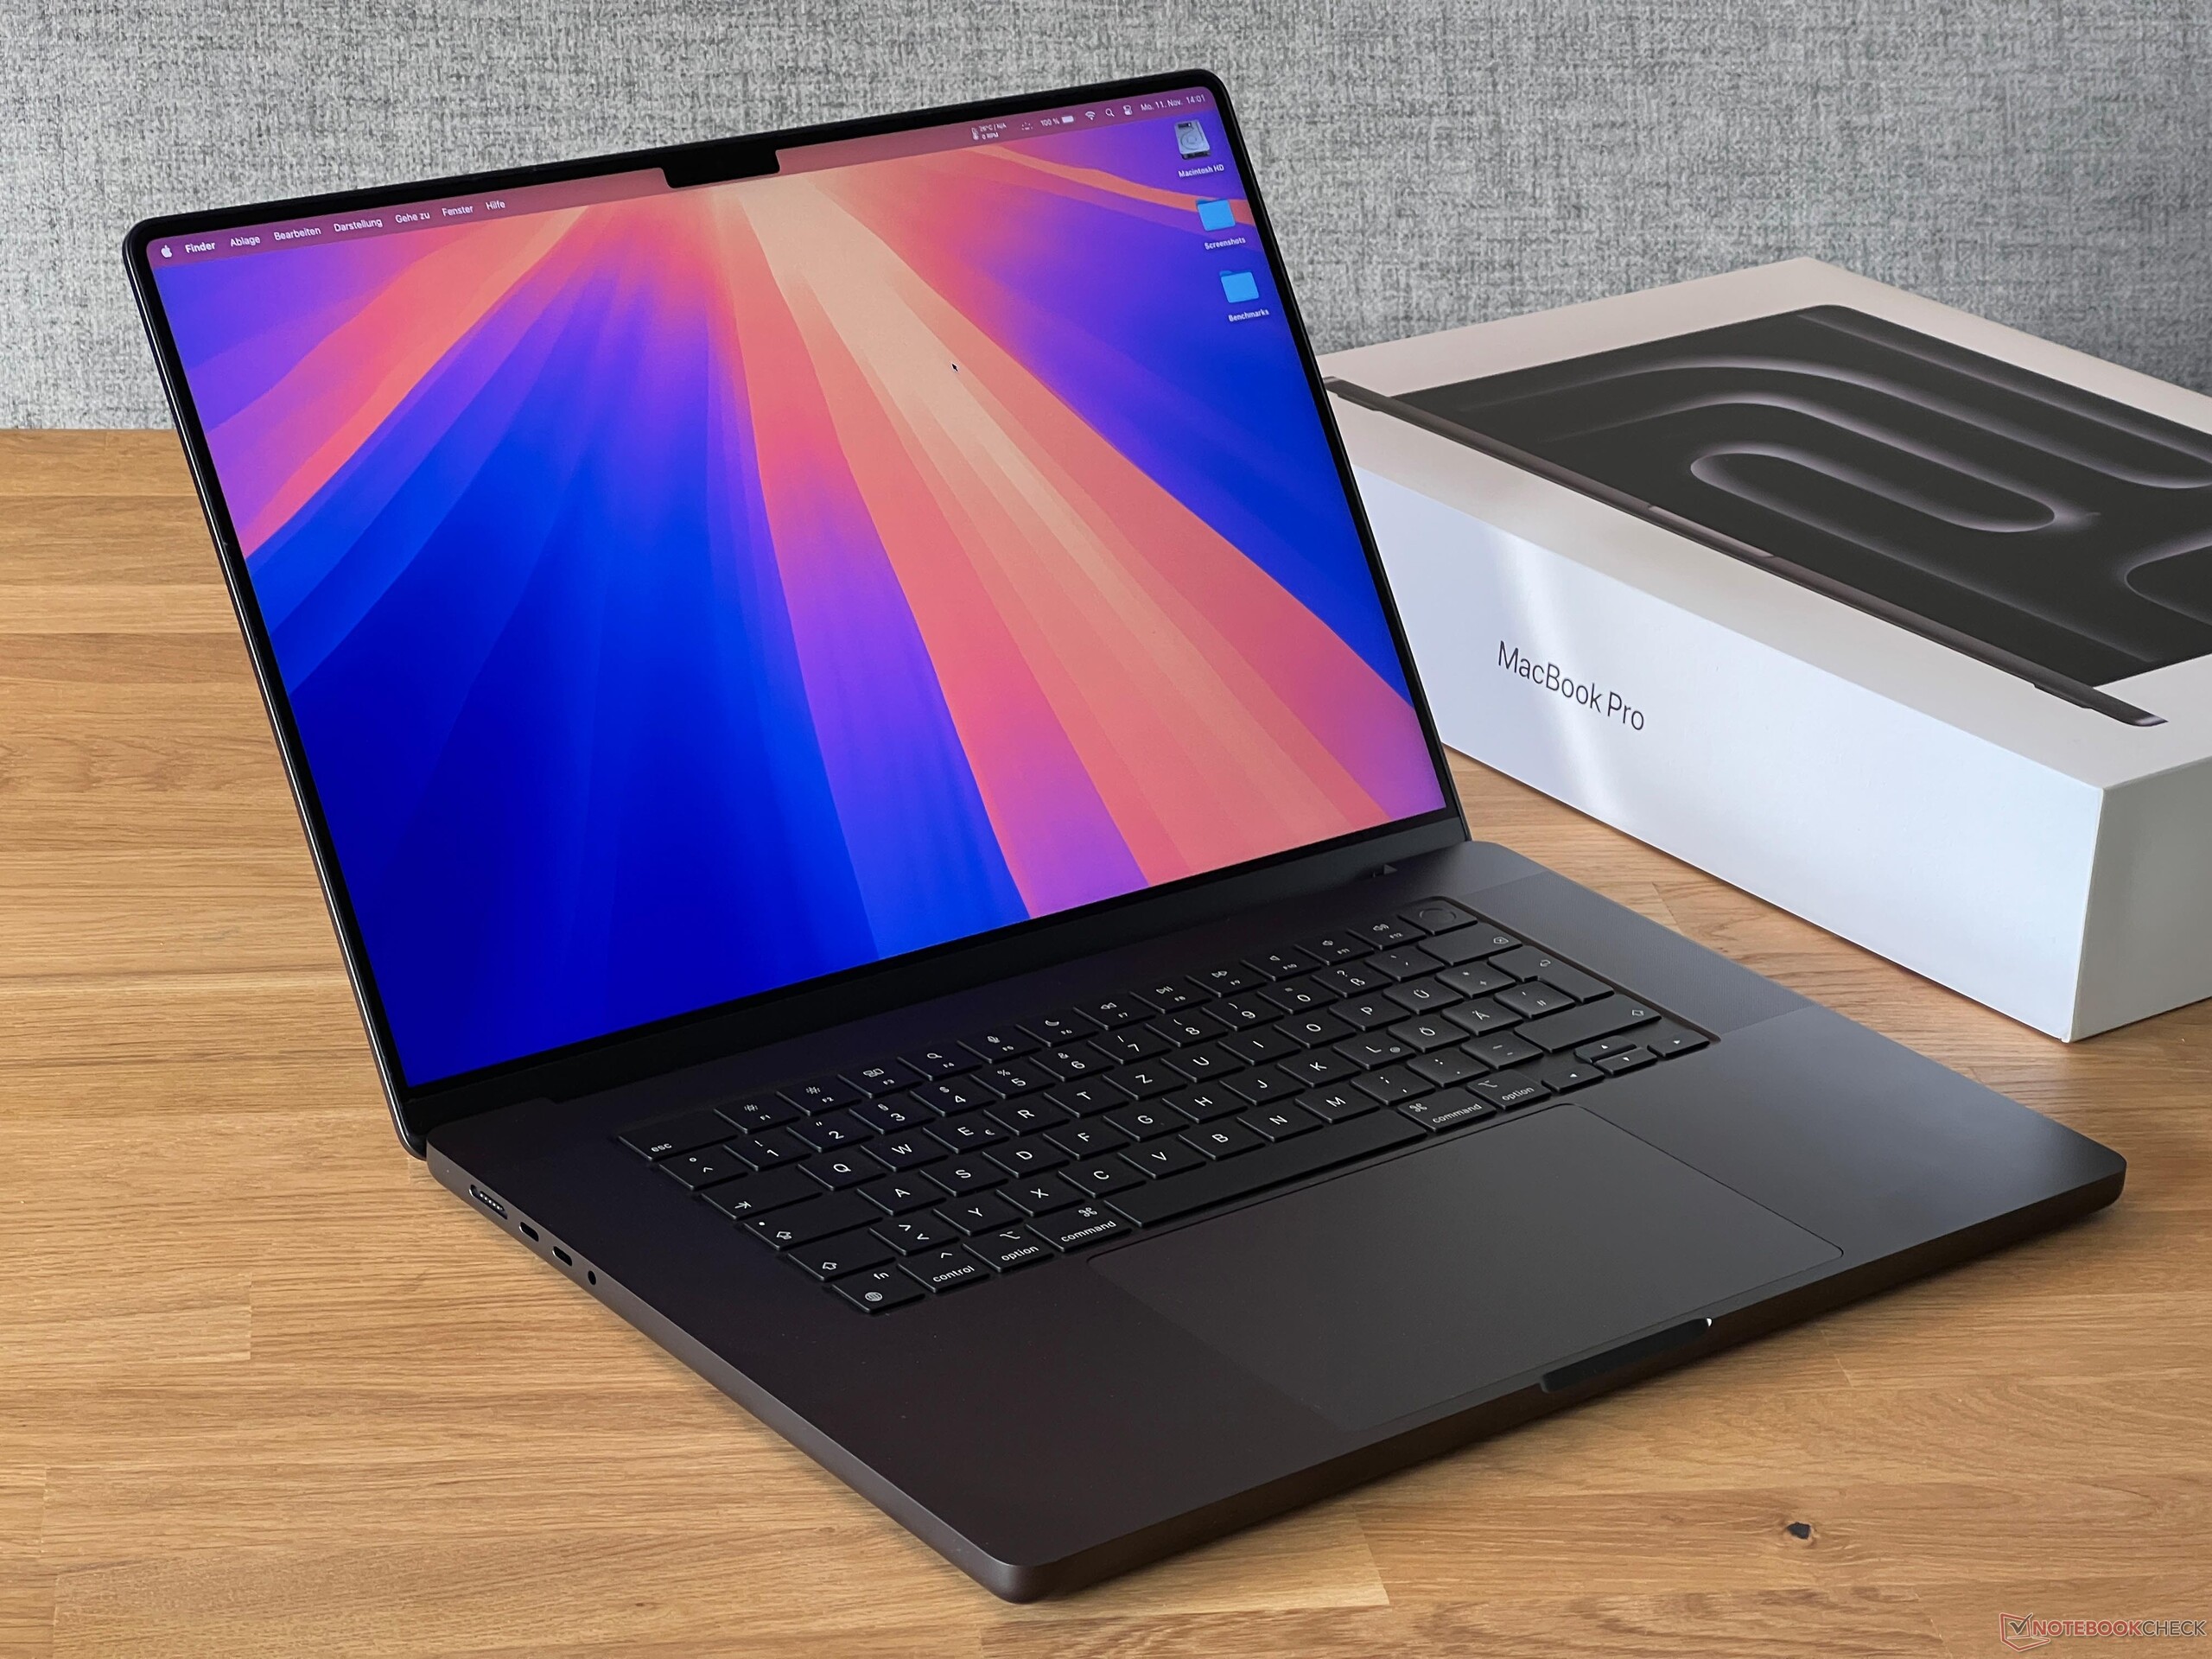
Apple MacBook Pro 16 2024 incelemesi - Muazzam pil ömrü ve M4 Pro'nun daha iyi performansı
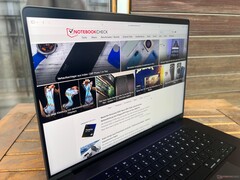
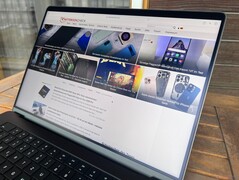
Mat ekran sayesinde daha da çok yönlü.
Büyük MacBook Pro 16, yeni Apple M4 Pro SoC'nin performans potansiyelini daha küçük MacBook Pro 14-plus'a kıyasla daha iyi kullanabiliyor ve pil ömrü daha da iyi. Yine, kendinizi sık sık aydınlık ortamlarda çalışırken buluyorsanız, isteğe bağlı mat paneli gerçek bir avantaj olduğunu kanıtlıyor.Andreas Osthoff, 👁 Andreas Osthoff (Çeviren DeepL / Ninh Duy) Yayınlandı 🇺🇸 🇩🇪 ...
Karar - MacBook Pro 16, M4 Pro ve mat ekran ile daha da iyi bir multimedya dizüstü bilgisayara dönüşüyor
Apple MacBook Pro 16'nın 2024 modeli bir kez daha etkileyici bir multimedya dizüstü bilgisayar. Daha büyük 16 inçlik kasası, daha küçük MacBook Pro 14'e kıyasla yeni M4 Pro SoC'den daha iyi yararlanabilir ve aynı zamanda emisyonları daha düşük kalır. Apple CPU ve GPU performansını önemli ölçüde artırmayı başardı ve özellikle tek çekirdekli alanda, Apple'in M4 nesli şu anda hiçbir rakiple karşılaşmıyor.
Kasanın kendisinde hiçbir değişiklik olmamasına rağmen, genel olarak bir dizi iyileştirme yapıldı. Buna mini LED panelin geliştirilmiş SDR parlaklığının yanı sıra yeni nano-doku kaplaması, yani mat ekran seçeneği de dahil. Bu, MacBook'u süper parlak ortamlarda rahatsız edici yansımalar olmadan kullanabileceğiniz anlamına geliyor. USB-C bağlantı noktaları artık Thunderbolt 5'i destekliyor ve yeni 12 MP kamerası, görüntülü görüşmeler sırasında daha iyi bir görüntünün yanı sıra masaüstü görünümü gibi gelişmiş özellikler sunuyor. Ancak Wi-Fi 7 olmadan idare etmeniz gerekecek. Her zaman olduğu gibi, pil ömrü harika ve doğrudan Windows rakiplerini geride bırakıyor.
Dezavantajları arasında bakım seçeneklerinin olmaması ve daha fazla RAM/SSD depolama için yüksek ek ücretler yer alıyor. Windows dizüstü bilgisayarlarla karşılaştırıldığında, M4 Pro'nun oyun performansı genel olarak çok iyi olmasına ve tüm yerel macOS oyunlarının sorunsuz çalışmasına rağmen, oyun seçenekleri hala sınırlıdır.
Artılar
Eksiler
Fiyat ve bulunabilirlik
Yeni MacBook Pro 16'yı M4 Pro ile doğrudan Apple web sitesinden yapılandırabilirsiniz. M4 Pro, 48 GB RAM ve 512 GB SSD içeren konfigürasyon, şu anda 2.664 dolara mal olduğu Amazon'dan satın alınabilir.
Karşılaştırmalı olarak olası rakipler
Resim | Modeli / incelemeler | Fiyat | Ağırlık | Yükseklik | Ekran |
|---|---|---|---|---|---|
| Apple MacBook Pro 16 2024 M4 Pro Apple M4 Pro (14 cores) ⎘ Apple M4 Pro 20-Core GPU ⎘ 48 GB Bellek, 2048 GB SSD | Amazon: $2,723.00 Liste fiyatı: 4219€ | 2.1 kg | 16.8 mm | 16.20" 3456x2234 254 PPI Mini-LED | |
| Apple MacBook Pro 16 2023 M3 Pro Apple M3 Pro 12-Core ⎘ Apple M3 Pro 18-Core GPU ⎘ 18 GB Bellek, 512 GB SSD | Amazon: 1. $3,199.00 Apple 2023 MacBook Pro Lapto... 2. $1,839.00 Apple 2024 MacBook Pro Lapto... 3. $2,649.00 Apple 2024 MacBook Pro Lapto... Liste fiyatı: 2999€ | 2.1 kg | 16.9 mm | 16.20" 3456x2234 254 PPI Mini-LED | |
| Lenovo ThinkPad P1 Gen 7 21KV001SGE Intel Core Ultra 7 155H ⎘ NVIDIA GeForce RTX 4060 Laptop GPU ⎘ 32 GB Bellek, 1024 GB SSD | Amazon: $2,679.95 Liste fiyatı: 3239 Euro | 2 kg | 20.5 mm | 16.00" 2560x1600 189 PPI IPS LED | |
| Asus ProArt P16 H7606WI AMD Ryzen AI 9 HX 370 ⎘ NVIDIA GeForce RTX 4070 Laptop GPU ⎘ 64 GB Bellek, 1024 GB SSD | Amazon: 1. $3,349.00 HIDevolution [2024] ASUS Pro... 2. $1,999.99 ASUS ProArt P16 AI Creator L... 3. $2,099.99 ASUS ProArt P16 AI Creator L... Liste fiyatı: 4000€ | 1.8 kg | 17.3 mm | 16.00" 3840x2400 283 PPI OLED | |
| Lenovo Yoga Pro 9 16IMH9 RTX 4050 Intel Core Ultra 9 185H ⎘ NVIDIA GeForce RTX 4050 Laptop GPU ⎘ 32 GB Bellek, 1024 GB SSD | Amazon: 1. $2,049.00 Lenovo Yoga Pro 9i 16"" Lapt... 2. $10.99 KEANBOLL 3 Pack Designed for... 3. $13.88 MUBUY-GOL Screen Protector F... Liste fiyatı: 1900 USD | 2.1 kg | 18.3 mm | 16.00" 3200x2000 236 PPI IPS | |
| Dell XPS 16 9640 Intel Core Ultra 7 155H ⎘ NVIDIA GeForce RTX 4070 Laptop GPU ⎘ 32 GB Bellek, 1024 GB SSD | Amazon: 1. $2,499.00 NewDell XPS 16 9640 Powerful... 2. $1,457.99 Dell XPS 9640 Laptop (2024) ... 3. $2,799.00 Dell XPS 16 Business Laptop ... | 2.3 kg | 18.7 mm | 16.30" 3840x2400 139 PPI OLED | |
| Samsung Galaxy Book4 Ultra Intel Core Ultra 7 155H ⎘ NVIDIA GeForce RTX 4050 Laptop GPU ⎘ 16 GB Bellek, 512 GB SSD | Amazon: 1. $1,904.26 SAMSUNG 14" Galaxy Book4 Pro... 2. $1,999.00 SAMSUNG Galaxy Book4 Pro Lig... 3. $712.98 SAMSUNG 15” Galaxy AI Book... Liste fiyatı: 2799€ | 1.8 kg | 17 mm | 16.00" 2880x1800 212 PPI OLED |
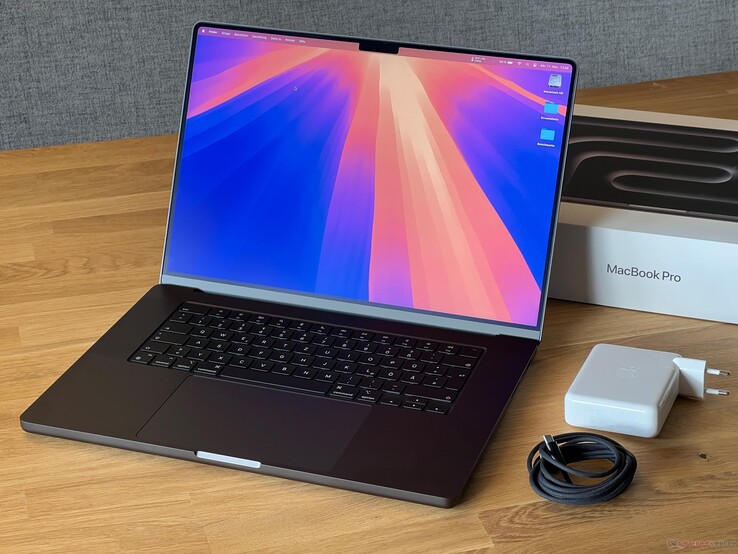
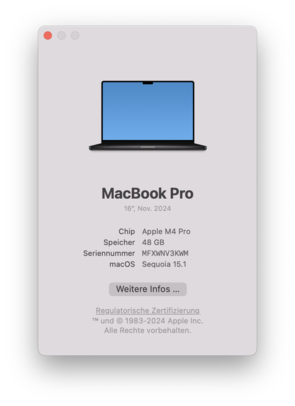
Apple yeni MacBook Pro 16'yı sundu ve temel varyant zaten M4 Pro SoC'nin tam konfigürasyonu ile donatılmıştır. 24 GB RAM ve 512 GB SSD ile birlikte yeni MBP 16'nın fiyatı 2.499 dolar. Test konfigürasyonumuz yeni opsiyonel mat nano-doku panel (150 $ ek ücret), 48 GB RAM ve 2 TB SSD ile birlikte geliyor. RAM/SSD için Apple'un muazzam ek ücretleri nedeniyle fiyatı 3.649 dolara yükseliyor.
Top 10
» Top 10 Multimedia Notebook listesi
» Top 10 oyun notebooku
» Top 10 bütçeye uygun Ofis/İş Notebook Listesi
» Top 10 Premium Ofis/İş notebookları
» Top 10 Çalışma istasyonu laptopları
» Top 10 Subnotebook listesi
» Top 10 Ultrabooklar
» En iyi 10 dönüştürülebilir modeli
» Seçimi en iyi 10 tablet
» Notebookcheck Top 10 Windows Tabletleri
» Top 10 Subnotebook listesi
» NotebookCheck tarafından incelenen en iyi Notebook ekranları
» Notebookcheck'in 500 Euro altındaki en iyi 10 Notebook listesi
» NotebookCheck tarafından seçilen 300 Euro altındaki en iyi 10 Notebook
» Notebookcheck'in 500 Euro altındaki en iyi 10 Notebook listesi
» Notebookcheck'in Top 10 akıllı telefon listesi
» Notebookcheck'in Top 10 hafif oyun notebookları
Teknik Özellikler
Kasa ve bağlantı
Selefiyle karşılaştırıldığında yeni MacBook Pro'nun kasası tamamen aynı. Hiçbir kalite sorunuyla karşılaşmıyor ve istikrar ve yapı söz konusu olduğunda harika bir dizüstü bilgisayar. Ancak, fanları temizleyebilmenin dışında, yine herhangi bir bakım seçeneği sunmuyor. Siyah renk varyantı, gümüş modele göre parmak izi toplama konusunda bir kez daha biraz daha hassas.
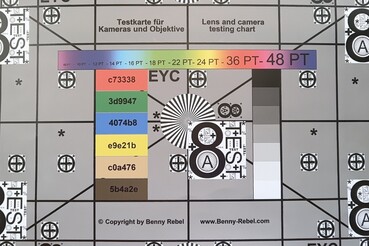
USB-C bağlantı noktalarının üçü de artık Thunderbolt 5'i destekliyor ve web kamerası artık 12 MP sensör kullanıyor. Görüntülü görüşmeler sırasında kalitesi iyi ve web kamerası artık masaüstü görünümünü destekliyor; ancak web kamerası kullanılarak çekilen fotoğraflar düşük çözünürlüğe sahip olmaya devam ediyor (fotoğraflar 1.440 x 900, videolar maks. 1080p) ve FaceID desteklenmiyor. WLAN modülü Wi-Fi 6E'nin yanı sıra Bluetooth 5.3'ü de destekliyor ancak Wi-Fi 7'yi desteklemiyor. Aktarım hızı sorunu yaşamadık. Takılı SD kart okuyucu hızlı, ancak takılan kartlar kasadan 1,6 cm dışarı çıkıyor.
Giriş aygıtları eski modelle aynı. Klavyede yazmak genellikle rahattır, ancak daha yüksek bir tuş hareketinden faydalanabilir. Dokunsal trackpad her zamanki gibi harika çalışıyor.
| SD Card Reader | |
| average JPG Copy Test (av. of 3 runs) | |
| Apple MacBook Pro 16 2024 M4 Pro (Angelbird AV Pro V60) | |
| Dell XPS 16 9640 (Angelbird AV Pro V60) | |
| Asus ProArt P16 H7606WI (Angelbird AV Pro V60) | |
| Sınıf ortalaması Multimedia (18.4 - 201, n=56, son 2 yıl) | |
| Lenovo Yoga Pro 9 16IMH9 RTX 4050 (Angelbird AV Pro V60) | |
| Samsung Galaxy Book4 Ultra (Angelbird AV Pro V60) | |
| Lenovo ThinkPad P1 Gen 7 21KV001SGE (AV Pro V60) | |
| maximum AS SSD Seq Read Test (1GB) | |
| Asus ProArt P16 H7606WI (Angelbird AV Pro V60) | |
| Apple MacBook Pro 16 2024 M4 Pro (Angelbird AV Pro V60) | |
| Dell XPS 16 9640 (Angelbird AV Pro V60) | |
| Sınıf ortalaması Multimedia (25.8 - 266, n=56, son 2 yıl) | |
| Lenovo Yoga Pro 9 16IMH9 RTX 4050 (Angelbird AV Pro V60) | |
| Lenovo ThinkPad P1 Gen 7 21KV001SGE (AV Pro V60) | |
| Samsung Galaxy Book4 Ultra (Angelbird AV Pro V60) | |
| Networking | |
| Apple MacBook Pro 16 2024 M4 Pro | |
| iperf3 transmit AXE11000 | |
| iperf3 receive AXE11000 | |
| Lenovo ThinkPad P1 Gen 7 21KV001SGE | |
| iperf3 transmit AXE11000 | |
| iperf3 receive AXE11000 | |
| iperf3 transmit AXE11000 6GHz | |
| iperf3 receive AXE11000 6GHz | |
| Asus ProArt P16 H7606WI | |
| iperf3 transmit AXE11000 | |
| iperf3 receive AXE11000 | |
| Lenovo Yoga Pro 9 16IMH9 RTX 4050 | |
| iperf3 transmit AXE11000 | |
| iperf3 receive AXE11000 | |
| iperf3 transmit AXE11000 6GHz | |
| iperf3 receive AXE11000 6GHz | |
| Dell XPS 16 9640 | |
| iperf3 transmit AXE11000 | |
| iperf3 receive AXE11000 | |
| Samsung Galaxy Book4 Ultra | |
| iperf3 transmit AXE11000 | |
| iperf3 receive AXE11000 | |

Ekran - Mini-LED şimdi mat yüzeyli
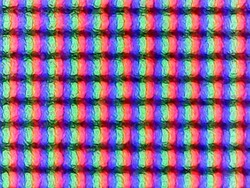
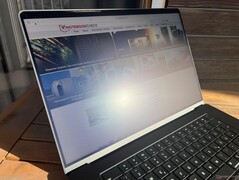
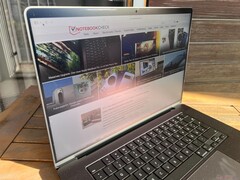
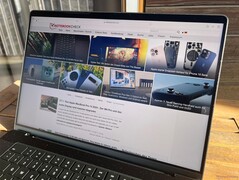
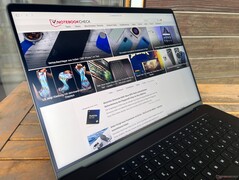
Apple 16,2 inç diyagonal ve 3.456 x 2.234 piksel çözünürlüğe sahip tanıdık mini LED panele güvenmeye devam ediyor. Öte yandan yeni olan, test cihazımızın sahip olduğu nano-doku seçeneğidir. Öznel olarak, hafif alanlar yakından incelendiğinde biraz grenli göründüğü için görüntü bundan sadece biraz olumsuz etkileniyor - ancak normal bir mesafeden hiçbir sorun görmedik ve kesinlikle mat seçeneği tercih ederdik. İkinci gelişme ise ortam ışığı sensörü etkinleştirildiğinde 1.000 cd/m²'nin üzerine çıkabilen (1.063 cd/m²) SDR parlaklığı.
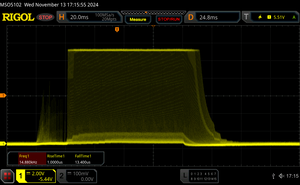
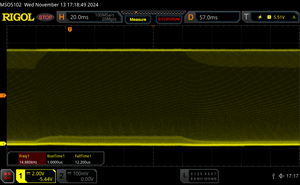
Bunun dışında, MacBook'un ekranı birçok alanda (siyah değeri, neredeyse tamamen beyaz bir ekranı gösterirken 1.620 cd/m² ve 1.214 cd/m²'ye kadar HDR parlaklığı, HDR yetenekleri) pazar referansı olmaya devam ediyor ve bu aşamada incelememize bir göz atmanızı öneririz MacBook Pro 14 M4 Probu konular hakkında daha ayrıntılı olarak konuştuğumuz yer. MBP 16 ayrıca 14,8 kHz'de sabit PWM titreşimi kullanır ve bu çoğu kullanıcı için sorun teşkil etmez. Sabit PWM titreşimi, ekranın tepki sürelerini belirlemeyi son derece zorlaştırır, ancak bu tüm mini LED paneller için geçerlidir (sadece Apple değil). Değerlerimiz çok yüksek görünse bile (özellikle OLED ekranlarla karşılaştırıldığında), abartılmamalıdır. Günlük kullanımda, herhangi bir gecikme etkisi fark etmeyeceksiniz (ayrıca 120 Hz'de ProMotion teknolojisi sayesinde) ve birçok oyunda (örneğin Baldur's Gate 3 veya Resident Evil Village) sorun yok, ancak OLED paneller yine de aşırı hızlı atıcılar için daha iyi bir seçimdir.
| |||||||||||||||||||||||||
Aydınlatma: 95 %
Batarya modunda parlaklık: 632 cd/m²
Kontrast: ∞:1 (Siyah: 0 cd/m²)
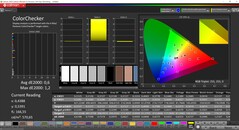
ΔE Color 0.6 | 0.5-29.43 Ø4.87
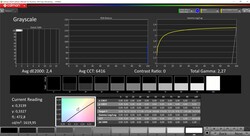
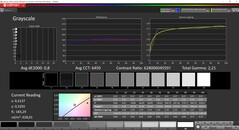
ΔE Greyscale 0.8 | 0.5-98 Ø5.1
88.8% AdobeRGB 1998 (Argyll 2.2.0 3D)
100% sRGB (Argyll 2.2.0 3D)
99.7% Display P3 (Argyll 2.2.0 3D)
Gamma: 2.21
| Apple MacBook Pro 16 2024 M4 Pro Mini-LED, 3456x2234, 16.2", 120 Hz | Lenovo ThinkPad P1 Gen 7 21KV001SGE MNG007DA1-9 , IPS LED, 2560x1600, 16", 165 Hz | Asus ProArt P16 H7606WI ATNA60YV02-0, OLED, 3840x2400, 16", 60 Hz | Lenovo Yoga Pro 9 16IMH9 RTX 4050 LEN160-3.2K, IPS, 3200x2000, 16", 165 Hz | Dell XPS 16 9640 SDC4196, OLED, 3840x2400, 16.3", 90 Hz | Samsung Galaxy Book4 Ultra ATNA60CL07-0, OLED, 2880x1800, 16", 120 Hz | Apple MacBook Pro 16 2023 M3 Max Mini-LED, 3456x2234, 16", 120 Hz | |
|---|---|---|---|---|---|---|---|
| Display | -17% | 4% | -2% | -1% | -0% | -1% | |
| Display P3 Coverage | 99.7 | 69.4 -30% | 99.9 0% | 95.6 -4% | 98.3 -1% | 98.6 -1% | 99.2 -1% |
| sRGB Coverage | 100 | 97.6 -2% | 100 0% | 99.9 0% | 100 0% | 99.9 0% | |
| AdobeRGB 1998 Coverage | 88.8 | 71.8 -19% | 99.1 12% | 86.5 -3% | 87.8 -1% | 88.5 0% | |
| Response Times | 74% | 32% | 75% | 33% | 33% | -21% | |
| Response Time Grey 50% / Grey 80% * | 43 ? | 11.2 ? 74% | 1.58 ? 96% | 12.4 ? 71% | 0.82 ? 98% | 0.54 ? 99% | 66.9 ? -56% |
| Response Time Black / White * | 41.2 ? | 10.6 ? 74% | 1.25 ? 97% | 8.9 ? 78% | 0.85 ? 98% | 0.69 ? 98% | 43.6 ? -6% |
| PWM Frequency | 14880 | 240 ? -98% | 360 ? -98% | 240 ? -98% | 14877 0% | ||
| Screen | -293% | -58% | -118% | -96% | -82% | -62% | |
| Brightness middle | 632 | 516 -18% | 355 -44% | 404.9 -36% | 366 -42% | 390 -38% | 630 0% |
| Brightness | 616 | 505 -18% | 360 -42% | 390 -37% | 367 -40% | 393 -36% | 604 -2% |
| Brightness Distribution | 95 | 89 -6% | 98 3% | 91 -4% | 96 1% | 98 3% | 94 -1% |
| Black Level * | 0.41 | 0.4 | |||||
| Colorchecker dE 2000 * | 0.6 | 3.5 -483% | 1.2 -100% | 2.42 -303% | 1.3 -117% | 1.4 -133% | 1.2 -100% |
| Colorchecker dE 2000 max. * | 1.2 | 8.8 -633% | 2.6 -117% | 4.65 -288% | 3.6 -200% | 2.7 -125% | 2.8 -133% |
| Greyscale dE 2000 * | 0.8 | 5.6 -600% | 1.2 -50% | 1.1 -38% | 2.2 -175% | 2.1 -163% | 1.9 -138% |
| Gamma | 2.21 100% | 2.27 97% | 2.14 103% | 2.22 99% | 2.14 103% | 2.27 97% | 2.29 96% |
| CCT | 6450 101% | 6071 107% | 6526 100% | 6468 100% | 6680 97% | 6431 101% | 6812 95% |
| Contrast | 1259 | 1012 | |||||
| Colorchecker dE 2000 calibrated * | 1.2 | 0.93 | 1 | ||||
| Toplam Ortalama (Program / Ayarlar) | -79% /
-151% | -7% /
-20% | -15% /
-51% | -21% /
-40% | -16% /
-33% | -28% /
-44% |
* ... daha küçük daha iyidir
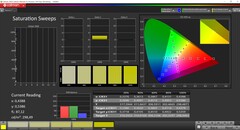
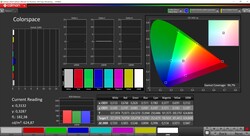
Panelin kutudan çıktığı andaki kalibrasyonu mükemmel. Profesyonel CalMAN yazılımını kullanarak analiz ettik ve P3 referans renk alanıyla karşılaştırıldığında sapmalar hem gri tonlama hem de renkler için minimum düzeydeydi. P3 ve sRGB renk alanları tamamen, AdobeRGB ise %88,8 oranında kapsanıyor.
Yanıt Sürelerini Görüntüle
| ↔ Tepki Süresi Siyahtan Beyaza | ||
|---|---|---|
| 41.2 ms ... yükseliş ↗ ve sonbahar↘ birleşimi | ↗ 24.5 ms yükseliş | |
| ↘ 16.7 ms sonbahar | ||
| Ekran, testlerimizde yavaş yanıt oranları gösteriyor ve oyuncular için yetersiz olacaktır. Karşılaştırıldığında, test edilen tüm cihazlar 0.1 (minimum) ile 240 (maksimum) ms arasında değişir. » Tüm cihazların 98 %'si daha iyi. Bu, ölçülen yanıt süresinin test edilen tüm cihazların ortalamasından (20.8 ms) daha kötü olduğu anlamına gelir. | ||
| ↔ Tepki Süresi %50 Griden %80 Griye | ||
| 43 ms ... yükseliş ↗ ve sonbahar↘ birleşimi | ↗ 9.6 ms yükseliş | |
| ↘ 33.4 ms sonbahar | ||
| Ekran, testlerimizde yavaş yanıt oranları gösteriyor ve oyuncular için yetersiz olacaktır. Karşılaştırıldığında, test edilen tüm cihazlar 0.165 (minimum) ile 636 (maksimum) ms arasında değişir. » Tüm cihazların 69 %'si daha iyi. Bu, ölçülen yanıt süresinin test edilen tüm cihazların ortalamasından (32.5 ms) daha kötü olduğu anlamına gelir. | ||
Ekran Titremesi / PWM (Darbe Genişliği Modülasyonu)
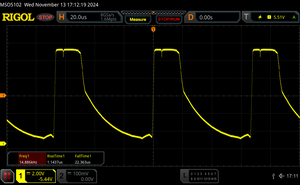
| Ekran titriyor / PWM algılandı | 14880 Hz Amplitude: 90 % | ||
Ekran arka ışığı 14880 Hz'de titriyor (en kötü durum, örneğin PWM kullanılması) . 14880 Hz frekansı oldukça yüksektir, bu nedenle PWM'ye duyarlı çoğu kullanıcı herhangi bir titremeyi fark etmemelidir. Karşılaştırıldığında: Test edilen tüm cihazların %53 %'si ekranı karartmak için PWM kullanmıyor. PWM tespit edilirse, ortalama 8516 (minimum: 5 - maksimum: 343500) Hz ölçüldü. | |||
Performans - MBP 16 ile daha güçlü M4 Pro
Apple macBook Pro 16'yı standart olarak M4 Pro'nun tam konfigürasyonu (14 CPU çekirdeği, 20 GPU çekirdeği) ve 24/48 GB RAM ile donatıyor. İsteğe bağlı olarak 36, 64 veya 128 GB RAM'e sahip iki M4 Max SoC'yi tercih edebilirsiniz.
Test koşulları
MBP 16 üç enerji profili sunar: Düşük Şarj, Otomatik ve Yüksek Performans. İkincisi, birleşik CPU/GPU kullanımında yalnızca küçük bir avantaj sağlar, ancak fanlar da önemli ölçüde daha yüksektir (42,3'e karşı 55,6 dB(A)). Karşılaştırma ve ölçümlerimizi Otomatik modu kullanarak gerçekleştirdik.
İşlemci - 14 CPU çekirdekli M4 Pro
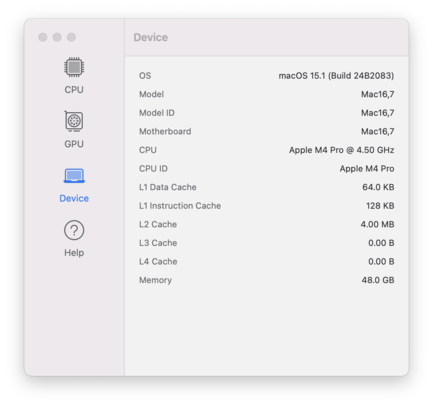
Yeni M4 Pro SoC'ye daha önce detaylı bir bakış atmıştık analiz makalesi. Tam konfigürasyonunda 10 performans ve 4 verimlilik çekirdeği bulunuyor. Daha küçük MacBook Pro'da olduğu gibi, M4 Pro 46 watt'a kadar tüketebilirken, daha büyük MBP 16 bu değeri sürekli yük altında sabit tutabilir. Benchmark sonuçları etkileyiciydi ve çok çekirdekli testlerde, daha küçük MBP 14'ün içinden biraz daha iyi performans gösterdi. Dahası, sonuçları eski M3 Max'inkilerden bile biraz daha iyiydi ve AMD/Intel'in multimedya rekabeti de buna ayak uyduramadı. AMD veya Intel'in ilgili HX yongaları daha da fazla çok çekirdekli performans sunsa da, genellikle yalnızca oyun dizüstü bilgisayarlarına takılırlar ve ayrıca önemli ölçüde daha fazla güç gerektirirler. AMD'nin Ryzen 9 7945HX 55 watt'ta daha hızlıdır ve 45 watt'ta karşılaştırılabilir performans sunmalıdır, ancak hiçbir dizüstü bilgisayarda bu güç sınırlarında çalıştırılmaz. Şu anki Ryzen AI 9 HX 370 içinde ProArt P16 (80 watt) ise daha yavaştır.
Buna karşılık, M4 neslinin tek çekirdek performansı hiçbir rekabetle karşı karşıya değildir ve şu anda piyasada daha hızlı rakip ürünler yoktur (uzun bir farkla). Pil modunda performansı tamamen sabit kalıyor.
| Cinebench 2024 / CPU Multi Core | |
| Apple MacBook Pro 16 2024 M4 Pro | |
| Ortalama Apple M4 Pro (14 cores) (1662 - 1729, n=2) | |
| Apple MacBook Pro 14 2024 M4 Pro | |
| Apple MacBook Pro 16 2023 M3 Max | |
| Asus ProArt P16 H7606WI | |
| Apple MacBook Pro 16 2023 M3 Pro | |
| Dell XPS 16 9640 | |
| Lenovo ThinkPad P1 Gen 7 21KV001SGE | |
| Sınıf ortalaması Multimedia (327 - 2069, n=57, son 2 yıl) | |
| Cinebench 2024 / CPU Single Core | |
| Apple MacBook Pro 16 2024 M4 Pro | |
| Ortalama Apple M4 Pro (14 cores) (177 - 178, n=2) | |
| Apple MacBook Pro 14 2024 M4 Pro | |
| Apple MacBook Pro 16 2023 M3 Pro | |
| Apple MacBook Pro 16 2023 M3 Max | |
| Sınıf ortalaması Multimedia (72.5 - 178, n=38, son 2 yıl) | |
| Asus ProArt P16 H7606WI | |
| Dell XPS 16 9640 | |
| Lenovo ThinkPad P1 Gen 7 21KV001SGE | |
| Geekbench 6.4 / Multi-Core | |
| Apple MacBook Pro 14 2024 M4 Pro | |
| Ortalama Apple M4 Pro (14 cores) (22509 - 22544, n=2) | |
| Apple MacBook Pro 16 2024 M4 Pro | |
| Apple MacBook Pro 16 2023 M3 Max | |
| Apple MacBook Pro 16 2023 M3 Pro | |
| Asus ProArt P16 H7606WI | |
| Lenovo Yoga Pro 9 16IMH9 RTX 4050 | |
| Dell XPS 16 9640 | |
| Sınıf ortalaması Multimedia (4983 - 25760, n=77, son 2 yıl) | |
| Lenovo ThinkPad P1 Gen 7 21KV001SGE | |
| Samsung Galaxy Book4 Ultra | |
| Geekbench 6.4 / Single-Core | |
| Apple MacBook Pro 14 2024 M4 Pro | |
| Ortalama Apple M4 Pro (14 cores) (3836 - 3927, n=2) | |
| Apple MacBook Pro 16 2024 M4 Pro | |
| Apple MacBook Pro 16 2023 M3 Pro | |
| Apple MacBook Pro 16 2023 M3 Max | |
| Asus ProArt P16 H7606WI | |
| Sınıf ortalaması Multimedia (1534 - 3927, n=73, son 2 yıl) | |
| Lenovo Yoga Pro 9 16IMH9 RTX 4050 | |
| Samsung Galaxy Book4 Ultra | |
| Dell XPS 16 9640 | |
| Lenovo ThinkPad P1 Gen 7 21KV001SGE | |
Sistem performansı
WebXPRT 3: Overall
WebXPRT 4: Overall
Mozilla Kraken 1.1: Total
| CrossMark / Overall | |
| Ortalama Apple M4 Pro (14 cores), Apple M4 Pro 20-Core GPU (2148 - 2162, n=2) | |
| Apple MacBook Pro 16 2024 M4 Pro | |
| Apple MacBook Pro 16 2023 M3 Pro | |
| Dell XPS 16 9640 | |
| Lenovo Yoga Pro 9 16IMH9 RTX 4050 | |
| Asus ProArt P16 H7606WI | |
| Sınıf ortalaması Multimedia (866 - 2255, n=81, son 2 yıl) | |
| Samsung Galaxy Book4 Ultra | |
| Lenovo ThinkPad P1 Gen 7 21KV001SGE | |
| CrossMark / Productivity | |
| Ortalama Apple M4 Pro (14 cores), Apple M4 Pro 20-Core GPU (1980 - 2010, n=2) | |
| Apple MacBook Pro 16 2024 M4 Pro | |
| Apple MacBook Pro 16 2023 M3 Pro | |
| Dell XPS 16 9640 | |
| Lenovo Yoga Pro 9 16IMH9 RTX 4050 | |
| Samsung Galaxy Book4 Ultra | |
| Sınıf ortalaması Multimedia (913 - 2050, n=81, son 2 yıl) | |
| Lenovo ThinkPad P1 Gen 7 21KV001SGE | |
| Asus ProArt P16 H7606WI | |
| CrossMark / Creativity | |
| Ortalama Apple M4 Pro (14 cores), Apple M4 Pro 20-Core GPU (2590 - 2594, n=2) | |
| Apple MacBook Pro 16 2024 M4 Pro | |
| Apple MacBook Pro 16 2023 M3 Pro | |
| Asus ProArt P16 H7606WI | |
| Lenovo Yoga Pro 9 16IMH9 RTX 4050 | |
| Dell XPS 16 9640 | |
| Sınıf ortalaması Multimedia (907 - 2795, n=81, son 2 yıl) | |
| Samsung Galaxy Book4 Ultra | |
| Lenovo ThinkPad P1 Gen 7 21KV001SGE | |
| CrossMark / Responsiveness | |
| Dell XPS 16 9640 | |
| Apple MacBook Pro 16 2024 M4 Pro | |
| Ortalama Apple M4 Pro (14 cores), Apple M4 Pro 20-Core GPU (1556 - 1566, n=2) | |
| Lenovo Yoga Pro 9 16IMH9 RTX 4050 | |
| Samsung Galaxy Book4 Ultra | |
| Apple MacBook Pro 16 2023 M3 Pro | |
| Sınıf ortalaması Multimedia (605 - 2094, n=81, son 2 yıl) | |
| Lenovo ThinkPad P1 Gen 7 21KV001SGE | |
| Asus ProArt P16 H7606WI | |
| WebXPRT 3 / Overall | |
| Ortalama Apple M4 Pro (14 cores), Apple M4 Pro 20-Core GPU (525 - 545, n=2) | |
| Apple MacBook Pro 16 2024 M4 Pro | |
| Apple MacBook Pro 16 2023 M3 Pro | |
| Sınıf ortalaması Multimedia (136.4 - 545, n=81, son 2 yıl) | |
| Asus ProArt P16 H7606WI | |
| Lenovo Yoga Pro 9 16IMH9 RTX 4050 | |
| Lenovo ThinkPad P1 Gen 7 21KV001SGE | |
| Dell XPS 16 9640 | |
| Samsung Galaxy Book4 Ultra | |
| WebXPRT 4 / Overall | |
| Ortalama Apple M4 Pro (14 cores), Apple M4 Pro 20-Core GPU (337 - 353, n=2) | |
| Apple MacBook Pro 16 2024 M4 Pro | |
| Sınıf ortalaması Multimedia (133.2 - 353, n=75, son 2 yıl) | |
| Lenovo Yoga Pro 9 16IMH9 RTX 4050 | |
| Samsung Galaxy Book4 Ultra | |
| Lenovo ThinkPad P1 Gen 7 21KV001SGE | |
| Dell XPS 16 9640 | |
| Asus ProArt P16 H7606WI | |
| Mozilla Kraken 1.1 / Total | |
| Lenovo ThinkPad P1 Gen 7 21KV001SGE | |
| Lenovo Yoga Pro 9 16IMH9 RTX 4050 | |
| Sınıf ortalaması Multimedia (254 - 1016, n=86, son 2 yıl) | |
| Asus ProArt P16 H7606WI | |
| Samsung Galaxy Book4 Ultra | |
| Apple MacBook Pro 16 2023 M3 Pro | |
| Apple MacBook Pro 16 2024 M4 Pro | |
| Ortalama Apple M4 Pro (14 cores), Apple M4 Pro 20-Core GPU (254 - 255, n=2) | |
* ... daha küçük daha iyidir
Depolama cihazı
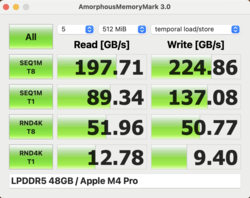
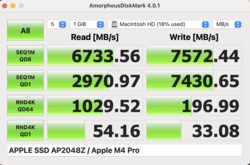
MacBook Pro 16'nın temel modeli 512 GB SSD depolama alanı ile donatılmıştır; test cihazımızda 2 TB AP2048Z varyantı takılıdır (+ 600 $) ve bunun 1,96 TB'ı dizüstü bilgisayar ilk kez başlatıldıktan sonra kullanılabilir. Her biri 512 GB kapasiteye sahip dört NAND modülü takılıdır ve SSD'nin performansı çok iyidir. Diğer SSD kıyaslamaları listelenmiştir burada. M4 Pro en iyi ihtimalle 4 TB'lık bir SSD ile birleştirilebilir; 8 TB ise yalnızca hızlı M4 Max ile birlikte kullanılabilir.
Grafik kartı
Yeni M4 Pro GPU 20 çekirdeğe sahip ve maksimum 32 watt tüketebiliyor ancak bu değeri sabit tutabiliyor. Apple hızlı M3 Pro GPU'ya kıyasla performansını %30'un üzerinde artırmayı başardı. Bununla birlikte, CPU'nun aksine, M4 Pro'nun GPU'su eski M3 Max GPU'su ile arasında hatırı sayılır bir mesafe bırakıyor. Karşılaştırmalarda M4 Pro GPU, Dell XPS 16'nın (60 watt TGP) içindeki GeForce RTX 4070 Dizüstü bilgisayardan bile daha iyi performans gösterdi, ancak ProArt P16'nın 4070 Dizüstü bilgisayarının (105 watt TGP) gerisinde kaldı. En büyük avantajı (özellikle video düzenlerken veya kod yazarken) birleşik belleği. Ancak AMD'nin Strix Halo GPU'sunun gelecekte güçlü bir rakip olması muhtemel.
Öte yandan, oyun söz konusu olduğunda, özel GeForce GPU 'larının Baldur's Gate 3 gibi yerel macOS oyunlarında bile avantaj göstermesiyle tablo tersine dönüyor. Bununla birlikte, M4 Pro GPU hala iyi performans gösterdi ve örneğin 1080p'yi maksimum ayrıntılarla kolayca görüntüleyebildi. Test ettiğimiz diğer tüm oyunlar MacBook Pro'da taklit edildi ve bu da elbette bir miktar performans kaybına neden oldu. Yine de performansı tamamen stabil kaldı ve Cyberpunk 2077 bile sorunsuz çalıştı. Cyberpunk 'ın doğal sürümünün gelecek yıl nasıl bir performans sergileyeceğini görmek için sabırsızlanıyoruz. Yeni BattleEye anti-hile yazılımı bazı sorunlara neden olduğu için GTA V 'i yeni MacBook'larda henüz test edemedik.
| 3DMark Steel Nomad Light Score | 7781 puan | |
Yardım | ||
| Cyberpunk 2077 2.2 Phantom Liberty - 1920x1080 Ultra Preset (FSR off) | |
| Asus ProArt P16 H7606WI | |
| Lenovo ThinkPad P1 Gen 7 21KV001SGE | |
| Dell XPS 16 9640 | |
| Lenovo Yoga Pro 9 16IMH9 RTX 4050 | |
| Apple MacBook Pro 16 2024 M4 Pro | |
| Samsung Galaxy Book4 Ultra | |
| Sınıf ortalaması Multimedia (8.26 - 86, n=63, son 2 yıl) | |
| Apple MacBook Pro 16 2023 M3 Pro | |
| Shadow of the Tomb Raider - 1920x1080 Highest Preset AA:T | |
| Apple MacBook Pro 16 2024 M4 Pro | |
| Sınıf ortalaması Multimedia (23 - 153, n=15, son 2 yıl) | |
| Apple MacBook Pro 16 2023 M3 Pro | |
| Total War Pharaoh - 1920x1080 Ultra Preset | |
| Apple MacBook Pro 16 2023 M3 Pro | |
| Sınıf ortalaması Multimedia (23.4 - 121, n=17, son 2 yıl) | |
| Apple MacBook Pro 16 2024 M4 Pro | |
| düşük | orta | yüksek | ultra | QHD | |
|---|---|---|---|---|---|
| Shadow of the Tomb Raider (2018) | 204 | 111 | 100 | 87 | 57 |
| Baldur's Gate 3 (2023) | 92 | 78 | 64 | 62 | 43 |
| Cyberpunk 2077 2.2 Phantom Liberty (2023) | 50.5 | 48.7 | 44.5 | 39.6 | 24.8 |
| Total War Pharaoh (2023) | 65.8 | 55.4 | 51.7 | 51.2 | 49.3 |
Emisyonlar ve güç
Gürültü emisyonları
M4 Pro'lu daha büyük MacBook Pro 16, fanları daha düşük hızda çalıştığı için genellikle daha küçük MacBook Pro 14'ten daha sessizdir. Testimiz sırasında MBP 16 genellikle çok uzun süre sessiz kaldı ve ölçtüğümüz ~1.400 rpm'lik ilk fan hızı ~25 dB(A) ile neredeyse duyulmuyordu. Oyun oynarken maksimum 33,9 dB(A) (~2.700 rpm) ve stres testi sırasında maksimum 42,3 dB(A) (~3.600 rpm) değerine ulaştı. Yüksek Performans modunda, önemli ölçüde daha yüksek sesle ~5.560 rpm'de 55,6 dB(A)'ya ulaştı; Düşük Şarj modunda, MacBook her zaman son derece sessiz kaldı (~1.400 rpm'de 25,3 dB(A)). Test cihazımızdan başka hiçbir elektronik ses gelmedi.
Ses yüksekliği
| Boşta |
| 24 / 24 / 24 dB |
| Çalışırken |
| 25.3 / 42.3 dB |
 | ||
30 dB sessiz 40 dB(A) duyulabilirlik 50 dB(A) gürültülü |
||
min: | ||
| Apple MacBook Pro 16 2024 M4 Pro M4 Pro 20-Core GPU, M4 Pro (14 cores), Apple SSD AP2048Z | Apple MacBook Pro 16 2023 M3 Pro M3 Pro 18-Core GPU, Apple M3 Pro 12-Core, Apple SSD AP0512Z | Lenovo ThinkPad P1 Gen 7 21KV001SGE NVIDIA GeForce RTX 4060 Laptop GPU, Ultra 7 155H, Kioxia XG8 KXG8AZNV1T02 | Asus ProArt P16 H7606WI NVIDIA GeForce RTX 4070 Laptop GPU, Ryzen AI 9 HX 370, Micron 2400 MTFDKBA1T0QFM | Lenovo Yoga Pro 9 16IMH9 RTX 4050 NVIDIA GeForce RTX 4050 Laptop GPU, Ultra 9 185H, SK Hynix HFS001TEJ9X115N | Dell XPS 16 9640 NVIDIA GeForce RTX 4070 Laptop GPU, Ultra 7 155H, Kioxia XG8 KXG80ZNV1T02 | Samsung Galaxy Book4 Ultra NVIDIA GeForce RTX 4050 Laptop GPU, Ultra 7 155H, Samsung PM9A1 MZVL2512HCJQ | |
|---|---|---|---|---|---|---|---|
| Noise | -6% | -24% | -29% | -18% | -16% | -9% | |
| kapalı / ortam * | 24 | 24.4 -2% | 24.7 -3% | 24.4 -2% | 23.6 2% | 24.5 -2% | 24.2 -1% |
| Idle Minimum * | 24 | 24.4 -2% | 24.7 -3% | 24.4 -2% | 23.6 2% | 24.5 -2% | 24.2 -1% |
| Idle Average * | 24 | 24.4 -2% | 24.7 -3% | 27.7 -15% | 25.4 -6% | 24.5 -2% | 24.2 -1% |
| Idle Maximum * | 24 | 24.4 -2% | 24.7 -3% | 32.3 -35% | 25.4 -6% | 27.5 -15% | 24.2 -1% |
| Load Average * | 25.3 | 26.9 -6% | 43.7 -73% | 42.2 -67% | 44.2 -75% | 39.6 -57% | 37.9 -50% |
| Cyberpunk 2077 ultra * | 33.9 | 53.2 -57% | 53.2 -57% | ||||
| Load Maximum * | 42.3 | 50.4 -19% | 53.3 -26% | 53.2 -26% | 52.6 -24% | 49.7 -17% | 41.7 1% |
| Witcher 3 ultra * | 25.1 | 48.9 | 49.7 | 41.7 |
* ... daha küçük daha iyidir
Sıcaklık
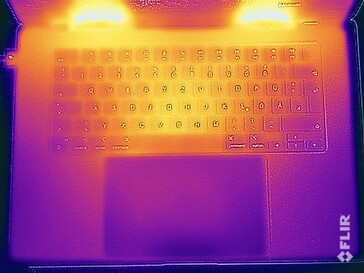
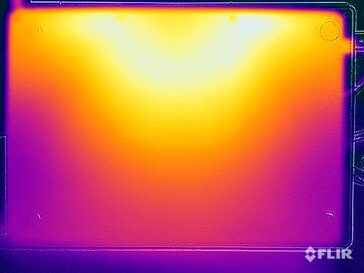
Düşük fan gürültüsüne ek olarak, yüzey sıcaklıkları da daha büyük MBP 16'da daha düşük kalıyor. Metal kasası, daha az zorlu görevler sırasında süper serin kalıyor ve stres testi sırasında bile bazı yerlerde yalnızca maksimum 43 °C ölçtük.
Kombine CPU/GPU yükü ile yapılan stres testinde, büyük MBP 16'nın içindeki M4 Pro, MBP 16'ya göre yine daha iyi performans gösterdi 14 inçlik daha küçük model. M4 Pro SoC maksimum 74 watt tüketmiş ve ardından yaklaşık 60 watt'ta sabitlenmiştir. Yüksek Performans modu bu durumda bir avantaj sağlamıştır çünkü SoC'nin tüketimi sürekli yük altında yaklaşık 66 watt'ta kalmıştır.
(±) Üst taraftaki maksimum sıcaklık, 36.9 °C / 98 F ortalamasına kıyasla 42.7 °C / 109 F'dir. , Multimedia sınıfı için 21.1 ile 71 °C arasında değişir.
(±) Alt kısım, 39.2 °C / 103 F ortalamasına kıyasla maksimum 43.1 °C / 110 F'ye kadar ısınır
(+) Boşta kullanımda, üst tarafın ortalama sıcaklığı 21.3 °C / 70 F olup, cihazın 31.3 °C / 88 F.
(±) 3: The average temperature for the upper side is 37.4 °C / 99 F, compared to the average of 31.3 °C / 88 F for the class Multimedia.
(+) Avuç içi dayanakları ve dokunmatik yüzey maksimum (32.7 °C / 90.9 F) cilt sıcaklığına ulaşıyor ve bu nedenle sıcak değil.
(-) Benzer cihazların avuç içi dayanağı alanının ortalama sıcaklığı 28.8 °C / 83.8 F (-3.9 °C / -7.1 F) idi.
| Apple MacBook Pro 16 2024 M4 Pro Apple M4 Pro (14 cores), Apple M4 Pro 20-Core GPU | Apple MacBook Pro 16 2023 M3 Pro Apple M3 Pro 12-Core, Apple M3 Pro 18-Core GPU | Lenovo ThinkPad P1 Gen 7 21KV001SGE Intel Core Ultra 7 155H, NVIDIA GeForce RTX 4060 Laptop GPU | Asus ProArt P16 H7606WI AMD Ryzen AI 9 HX 370, NVIDIA GeForce RTX 4070 Laptop GPU | Lenovo Yoga Pro 9 16IMH9 RTX 4050 Intel Core Ultra 9 185H, NVIDIA GeForce RTX 4050 Laptop GPU | Dell XPS 16 9640 Intel Core Ultra 7 155H, NVIDIA GeForce RTX 4070 Laptop GPU | Samsung Galaxy Book4 Ultra Intel Core Ultra 7 155H, NVIDIA GeForce RTX 4050 Laptop GPU | |
|---|---|---|---|---|---|---|---|
| Heat | -1% | -16% | -26% | -19% | -9% | -2% | |
| Maximum Upper Side * | 42.7 | 38.1 11% | 50.3 -18% | 46.9 -10% | 41 4% | 39.4 8% | 38.5 10% |
| Maximum Bottom * | 43.1 | 37 14% | 38 12% | 50.9 -18% | 40.6 6% | 36.9 14% | 41.2 4% |
| Idle Upper Side * | 21.5 | 24.2 -13% | 28.3 -32% | 28.9 -34% | 30.2 -40% | 28.2 -31% | 23.5 -9% |
| Idle Bottom * | 21.5 | 24.6 -14% | 27.3 -27% | 30 -40% | 31.4 -46% | 27.4 -27% | 24.1 -12% |
* ... daha küçük daha iyidir
Konuşmacılar
MacBook Pro 16'nın ses sistemi bir kez daha mükemmel ve piyasadaki en iyilerden biri - ancak rakiplerin bu konuda saklanmasına gerek yok, zaman zaman benzer sonuçlar sunuyorlar.
Apple MacBook Pro 16 2024 M4 Pro ses analizi
(+) | hoparlörler nispeten yüksek sesle çalabilir (84.6 dB)
Bas 100 - 315Hz
(±) | azaltılmış bas - ortalama olarak medyandan 5.1% daha düşük
(+) | bas doğrusaldır (5.6% delta ile önceki frekans)
Ortalar 400 - 2000 Hz
(+) | dengeli ortalar - medyandan yalnızca 1.4% uzakta
(+) | orta frekanslar doğrusaldır (2.4% deltadan önceki frekansa)
Yüksekler 2 - 16 kHz
(+) | dengeli yüksekler - medyandan yalnızca 1.7% uzakta
(+) | yüksekler doğrusaldır (3% deltadan önceki frekansa)
Toplam 100 - 16.000 Hz
(+) | genel ses doğrusaldır (4.8% ortancaya göre fark)
Aynı sınıfla karşılaştırıldığında
» Bu sınıftaki tüm test edilen cihazların %0%'si daha iyi, 1% benzer, 99% daha kötüydü
» En iyisinin deltası 5% idi, ortalama 18% idi, en kötüsü 45% idi
Test edilen tüm cihazlarla karşılaştırıldığında
» Test edilen tüm cihazların %0'si daha iyi, 0 benzer, % 100 daha kötüydü
» En iyisinin deltası 4% idi, ortalama 24% idi, en kötüsü 134% idi
Lenovo ThinkPad P1 Gen 7 21KV001SGE ses analizi
(±) | hoparlör ses yüksekliği ortalama ama iyi (81.4 dB)
Bas 100 - 315Hz
(±) | azaltılmış bas - ortalama olarak medyandan 6.8% daha düşük
(±) | Bas doğrusallığı ortalamadır (10.3% delta - önceki frekans)
Ortalar 400 - 2000 Hz
(+) | dengeli ortalar - medyandan yalnızca 3.4% uzakta
(+) | orta frekanslar doğrusaldır (4.7% deltadan önceki frekansa)
Yüksekler 2 - 16 kHz
(+) | dengeli yüksekler - medyandan yalnızca 3.1% uzakta
(+) | yüksekler doğrusaldır (6% deltadan önceki frekansa)
Toplam 100 - 16.000 Hz
(+) | genel ses doğrusaldır (9.2% ortancaya göre fark)
Aynı sınıfla karşılaştırıldığında
» Bu sınıftaki tüm test edilen cihazların %3%'si daha iyi, 2% benzer, 94% daha kötüydü
» En iyisinin deltası 7% idi, ortalama 18% idi, en kötüsü 35% idi
Test edilen tüm cihazlarla karşılaştırıldığında
» Test edilen tüm cihazların %3'si daha iyi, 1 benzer, % 97 daha kötüydü
» En iyisinin deltası 4% idi, ortalama 24% idi, en kötüsü 134% idi
Asus ProArt P16 H7606WI ses analizi
(±) | hoparlör ses yüksekliği ortalama ama iyi (81.4 dB)
Bas 100 - 315Hz
(+) | iyi bas - medyandan yalnızca 3% uzakta
(±) | Bas doğrusallığı ortalamadır (8.3% delta - önceki frekans)
Ortalar 400 - 2000 Hz
(+) | dengeli ortalar - medyandan yalnızca 3.5% uzakta
(+) | orta frekanslar doğrusaldır (2.5% deltadan önceki frekansa)
Yüksekler 2 - 16 kHz
(+) | dengeli yüksekler - medyandan yalnızca 3% uzakta
(+) | yüksekler doğrusaldır (3.6% deltadan önceki frekansa)
Toplam 100 - 16.000 Hz
(+) | genel ses doğrusaldır (8.5% ortancaya göre fark)
Aynı sınıfla karşılaştırıldığında
» Bu sınıftaki tüm test edilen cihazların %6%'si daha iyi, 2% benzer, 92% daha kötüydü
» En iyisinin deltası 5% idi, ortalama 18% idi, en kötüsü 45% idi
Test edilen tüm cihazlarla karşılaştırıldığında
» Test edilen tüm cihazların %2'si daha iyi, 1 benzer, % 98 daha kötüydü
» En iyisinin deltası 4% idi, ortalama 24% idi, en kötüsü 134% idi
Lenovo Yoga Pro 9 16IMH9 RTX 4050 ses analizi
(+) | hoparlörler nispeten yüksek sesle çalabilir (85.5 dB)
Bas 100 - 315Hz
(+) | iyi bas - medyandan yalnızca 2.1% uzakta
(+) | bas doğrusaldır (3.8% delta ile önceki frekans)
Ortalar 400 - 2000 Hz
(+) | dengeli ortalar - medyandan yalnızca 2.6% uzakta
(+) | orta frekanslar doğrusaldır (3.1% deltadan önceki frekansa)
Yüksekler 2 - 16 kHz
(+) | dengeli yüksekler - medyandan yalnızca 3.1% uzakta
(+) | yüksekler doğrusaldır (3% deltadan önceki frekansa)
Toplam 100 - 16.000 Hz
(+) | genel ses doğrusaldır (5.8% ortancaya göre fark)
Aynı sınıfla karşılaştırıldığında
» Bu sınıftaki tüm test edilen cihazların %0%'si daha iyi, 0% benzer, 100% daha kötüydü
» En iyisinin deltası 6% idi, ortalama 18% idi, en kötüsü 132% idi
Test edilen tüm cihazlarla karşılaştırıldığında
» Test edilen tüm cihazların %0'si daha iyi, 0 benzer, % 100 daha kötüydü
» En iyisinin deltası 4% idi, ortalama 24% idi, en kötüsü 134% idi
Dell XPS 16 9640 ses analizi
(+) | hoparlörler nispeten yüksek sesle çalabilir (83.4 dB)
Bas 100 - 315Hz
(±) | azaltılmış bas - ortalama olarak medyandan 11.2% daha düşük
(±) | Bas doğrusallığı ortalamadır (8.9% delta - önceki frekans)
Ortalar 400 - 2000 Hz
(+) | dengeli ortalar - medyandan yalnızca 4.5% uzakta
(+) | orta frekanslar doğrusaldır (3% deltadan önceki frekansa)
Yüksekler 2 - 16 kHz
(+) | dengeli yüksekler - medyandan yalnızca 1.4% uzakta
(+) | yüksekler doğrusaldır (2% deltadan önceki frekansa)
Toplam 100 - 16.000 Hz
(+) | genel ses doğrusaldır (10% ortancaya göre fark)
Aynı sınıfla karşılaştırıldığında
» Bu sınıftaki tüm test edilen cihazların %10%'si daha iyi, 1% benzer, 89% daha kötüydü
» En iyisinin deltası 5% idi, ortalama 18% idi, en kötüsü 45% idi
Test edilen tüm cihazlarla karşılaştırıldığında
» Test edilen tüm cihazların %4'si daha iyi, 1 benzer, % 95 daha kötüydü
» En iyisinin deltası 4% idi, ortalama 24% idi, en kötüsü 134% idi
Samsung Galaxy Book4 Ultra ses analizi
(+) | hoparlörler nispeten yüksek sesle çalabilir (85 dB)
Bas 100 - 315Hz
(±) | azaltılmış bas - ortalama olarak medyandan 14.4% daha düşük
(±) | Bas doğrusallığı ortalamadır (11.3% delta - önceki frekans)
Ortalar 400 - 2000 Hz
(+) | dengeli ortalar - medyandan yalnızca 3.4% uzakta
(+) | orta frekanslar doğrusaldır (3.4% deltadan önceki frekansa)
Yüksekler 2 - 16 kHz
(+) | dengeli yüksekler - medyandan yalnızca 3% uzakta
(+) | yüksekler doğrusaldır (5.6% deltadan önceki frekansa)
Toplam 100 - 16.000 Hz
(+) | genel ses doğrusaldır (11.5% ortancaya göre fark)
Aynı sınıfla karşılaştırıldığında
» Bu sınıftaki tüm test edilen cihazların %13%'si daha iyi, 4% benzer, 82% daha kötüydü
» En iyisinin deltası 5% idi, ortalama 18% idi, en kötüsü 45% idi
Test edilen tüm cihazlarla karşılaştırıldığında
» Test edilen tüm cihazların %6'si daha iyi, 2 benzer, % 92 daha kötüydü
» En iyisinin deltası 4% idi, ortalama 24% idi, en kötüsü 134% idi
Güç tüketimi
Yeni MacBook Pro 16 ile selefi arasında boş modda önemli bir fark görmedik, ancak yeni M4 Pro'nun artan güç tüketimi yük altında açıkça ortaya çıkıyor. Oyun oynarken yaklaşık 75-85 watt ve stres testinde maksimum 138 watt'a kadar ölçüm yaptık. Bu değer daha sonra test sırasında 124 watt'ta sabitlendi, bu nedenle sağlanan 140 watt'lık güç kaynağı ünitesi yeterli boyutta. Bununla birlikte, M4 Max ile işler sorunlu hale gelebilir, ancak bunu yakında test edeceğiz.
| Apple MacBook Pro 16 2024 M4 Pro M4 Pro 20-Core GPU, M4 Pro (14 cores), Apple SSD AP2048Z | Apple MacBook Pro 16 2023 M3 Pro M3 Pro 18-Core GPU, Apple M3 Pro 12-Core, Apple SSD AP0512Z | Lenovo ThinkPad P1 Gen 7 21KV001SGE NVIDIA GeForce RTX 4060 Laptop GPU, Ultra 7 155H, Kioxia XG8 KXG8AZNV1T02 | Asus ProArt P16 H7606WI NVIDIA GeForce RTX 4070 Laptop GPU, Ryzen AI 9 HX 370, Micron 2400 MTFDKBA1T0QFM | Lenovo Yoga Pro 9 16IMH9 RTX 4050 NVIDIA GeForce RTX 4050 Laptop GPU, Ultra 9 185H, SK Hynix HFS001TEJ9X115N | Dell XPS 16 9640 NVIDIA GeForce RTX 4070 Laptop GPU, Ultra 7 155H, Kioxia XG8 KXG80ZNV1T02 | Samsung Galaxy Book4 Ultra NVIDIA GeForce RTX 4050 Laptop GPU, Ultra 7 155H, Samsung PM9A1 MZVL2512HCJQ | |
|---|---|---|---|---|---|---|---|
| Power Consumption | 10% | -22% | -35% | -50% | 2% | 22% | |
| Idle Minimum * | 4.6 | 4.5 2% | 7.3 -59% | 8 -74% | 9.9 -115% | 7.7 -67% | 4.8 -4% |
| Idle Average * | 16.8 | 16.5 2% | 12.3 27% | 9.9 41% | 16.6 1% | 10.3 39% | 7.5 55% |
| Idle Maximum * | 17.1 | 16.7 2% | 17.9 -5% | 11.6 32% | 29.2 -71% | 10.6 38% | 7.9 54% |
| Load Average * | 76.4 | 60.4 21% | 78.2 -2% | 76.9 -1% | 100.9 -32% | 76.5 -0% | 79.3 -4% |
| Cyberpunk 2077 ultra * | 83.4 | 123.5 -48% | 157.7 -89% | ||||
| Cyberpunk 2077 ultra external monitor * | 79.3 | 117.7 -48% | 156.6 -97% | ||||
| Load Maximum * | 138.1 | 102.9 25% | 167.5 -21% | 212.6 -54% | 182.2 -32% | 138.5 -0% | 125 9% |
| Witcher 3 ultra * | 52.1 | 151.8 | 126.4 | 79.2 |
* ... daha küçük daha iyidir
| Kapalı / Bekleme modu | |
| Boşta | |
| Çalışırken |
|
Key:
min: | |
Power consumption Cyberpunk / stress test
Power consumption with external monitor
Çalışma Zamanları
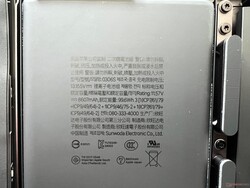
Pil kapasitesi olan 99,6 Wh konusunda değişen bir şey yok ve aynı şey çalışma süreleri için de söylenebilir. MBP'nin sonuçları etkileyiciydi; 150 cd/m²'de WLAN testi sırasında neredeyse 20 saat ve tam SDR parlaklığında neredeyse 7,5 saat boyunca çalışmaya devam etti. MacBook, 150 cd/m²'deki video testi sırasında pili bitmeden önce 24 saatten fazla çalıştı. Tam parlaklıkta bir HDR video oynatırken, 6,5 saat ölçtük. Doğrudan Windows rakiplerinin bu çalışma süreleri karşısında hiç şansı yok.
Cihaz açıkken tam şarj, 140 watt'lık güç kaynağı ünitesi kullanılarak 88 dakika sürüyor. kapasitesinin %50'si 26 dakika sonra, %80'i 49 dakika sonra ve %90'ı 63 dakika sonra tekrar kullanılabilir hale geliyor.
| Apple MacBook Pro 16 2024 M4 Pro M4 Pro (14 cores), M4 Pro 20-Core GPU, 99.6 Wh | Apple MacBook Pro 16 2023 M3 Pro Apple M3 Pro 12-Core, M3 Pro 18-Core GPU, 99.6 Wh | Lenovo ThinkPad P1 Gen 7 21KV001SGE Ultra 7 155H, NVIDIA GeForce RTX 4060 Laptop GPU, 90 Wh | Asus ProArt P16 H7606WI Ryzen AI 9 HX 370, NVIDIA GeForce RTX 4070 Laptop GPU, 90 Wh | Lenovo Yoga Pro 9 16IMH9 RTX 4050 Ultra 9 185H, NVIDIA GeForce RTX 4050 Laptop GPU, 84 Wh | Dell XPS 16 9640 Ultra 7 155H, NVIDIA GeForce RTX 4070 Laptop GPU, 99.5 Wh | Samsung Galaxy Book4 Ultra Ultra 7 155H, NVIDIA GeForce RTX 4050 Laptop GPU, 76 Wh | Sınıf ortalaması Multimedia | |
|---|---|---|---|---|---|---|---|---|
| Pil Çalışma Süresi | 1% | -49% | -37% | -54% | -40% | -36% | -43% | |
| H.264 | 1474 | 1481 0% | 1260 -15% | 988 -33% | 1076 -27% | 864 ? -41% | ||
| WiFi v1.3 | 1178 | 1204 2% | 595 -49% | 499 -58% | 540 -54% | 629 -47% | 656 -44% | 645 ? -45% |
Notebookcheck toplam değerlendirme
MacBook Pro 16 2024, M4 Pro sayesinde önemli bir performans artışı elde etti ve buna ek olarak, 16 inçlik büyük dizüstü bilgisayar, yeni M4 Pro'yu daha küçük MacBook Pro 14'ten daha iyi kullanabiliyor. Mini-LED ekranı mobil sektörde referans olmaya devam ediyor ve ek SDR parlaklığından ve isteğe bağlı mat nano-doku yüzeyinden yararlanıyor. Düşük emisyon ve uzun çalışma süreleri ile birlikte MacBook Pro 16 M4 Pro, piyasadaki en iyi multimedya dizüstü bilgisayarlardan biri.
Apple MacBook Pro 16 2024 M4 Pro
- 11/14/2024 v8
Andreas Osthoff
Şeffaflık
İncelenecek cihazların seçimi editör ekibimiz tarafından yapılır. Test örneği, bu incelemenin amacı doğrultusunda üretici veya perakendeci tarafından yazara ödünç olarak sağlanmıştır. Borç verenin bu inceleme üzerinde herhangi bir etkisi olmadığı gibi, üretici de yayınlanmadan önce bu incelemenin bir kopyasını almamıştır. Bu incelemeyi yayınlama zorunluluğu yoktu. İncelemelerimiz karşılığında asla tazminat veya ödeme kabul etmiyoruz. Bağımsız bir medya şirketi olarak Notebookcheck, üreticilerin, perakendecilerin veya yayıncıların otoritesine tabi değildir.
Notebookcheck bu şekilde test yapıyor
Notebookcheck, tüm sonuçların karşılaştırılabilir olmasını sağlamak için her yıl yüzlerce dizüstü bilgisayarı ve akıllı telefonu standart prosedürler kullanarak bağımsız olarak inceliyor. Yaklaşık 20 yıldır test yöntemlerimizi sürekli olarak geliştirdik ve bu süreçte endüstri standartlarını belirledik. Test laboratuvarlarımızda deneyimli teknisyenler ve editörler tarafından yüksek kaliteli ölçüm ekipmanları kullanılmaktadır. Bu testler çok aşamalı bir doğrulama sürecini içerir. Karmaşık derecelendirme sistemimiz, nesnelliği koruyan yüzlerce sağlam temellere dayanan ölçüm ve kıyaslamaya dayanmaktadır.








 Total Sustainability Score:


