

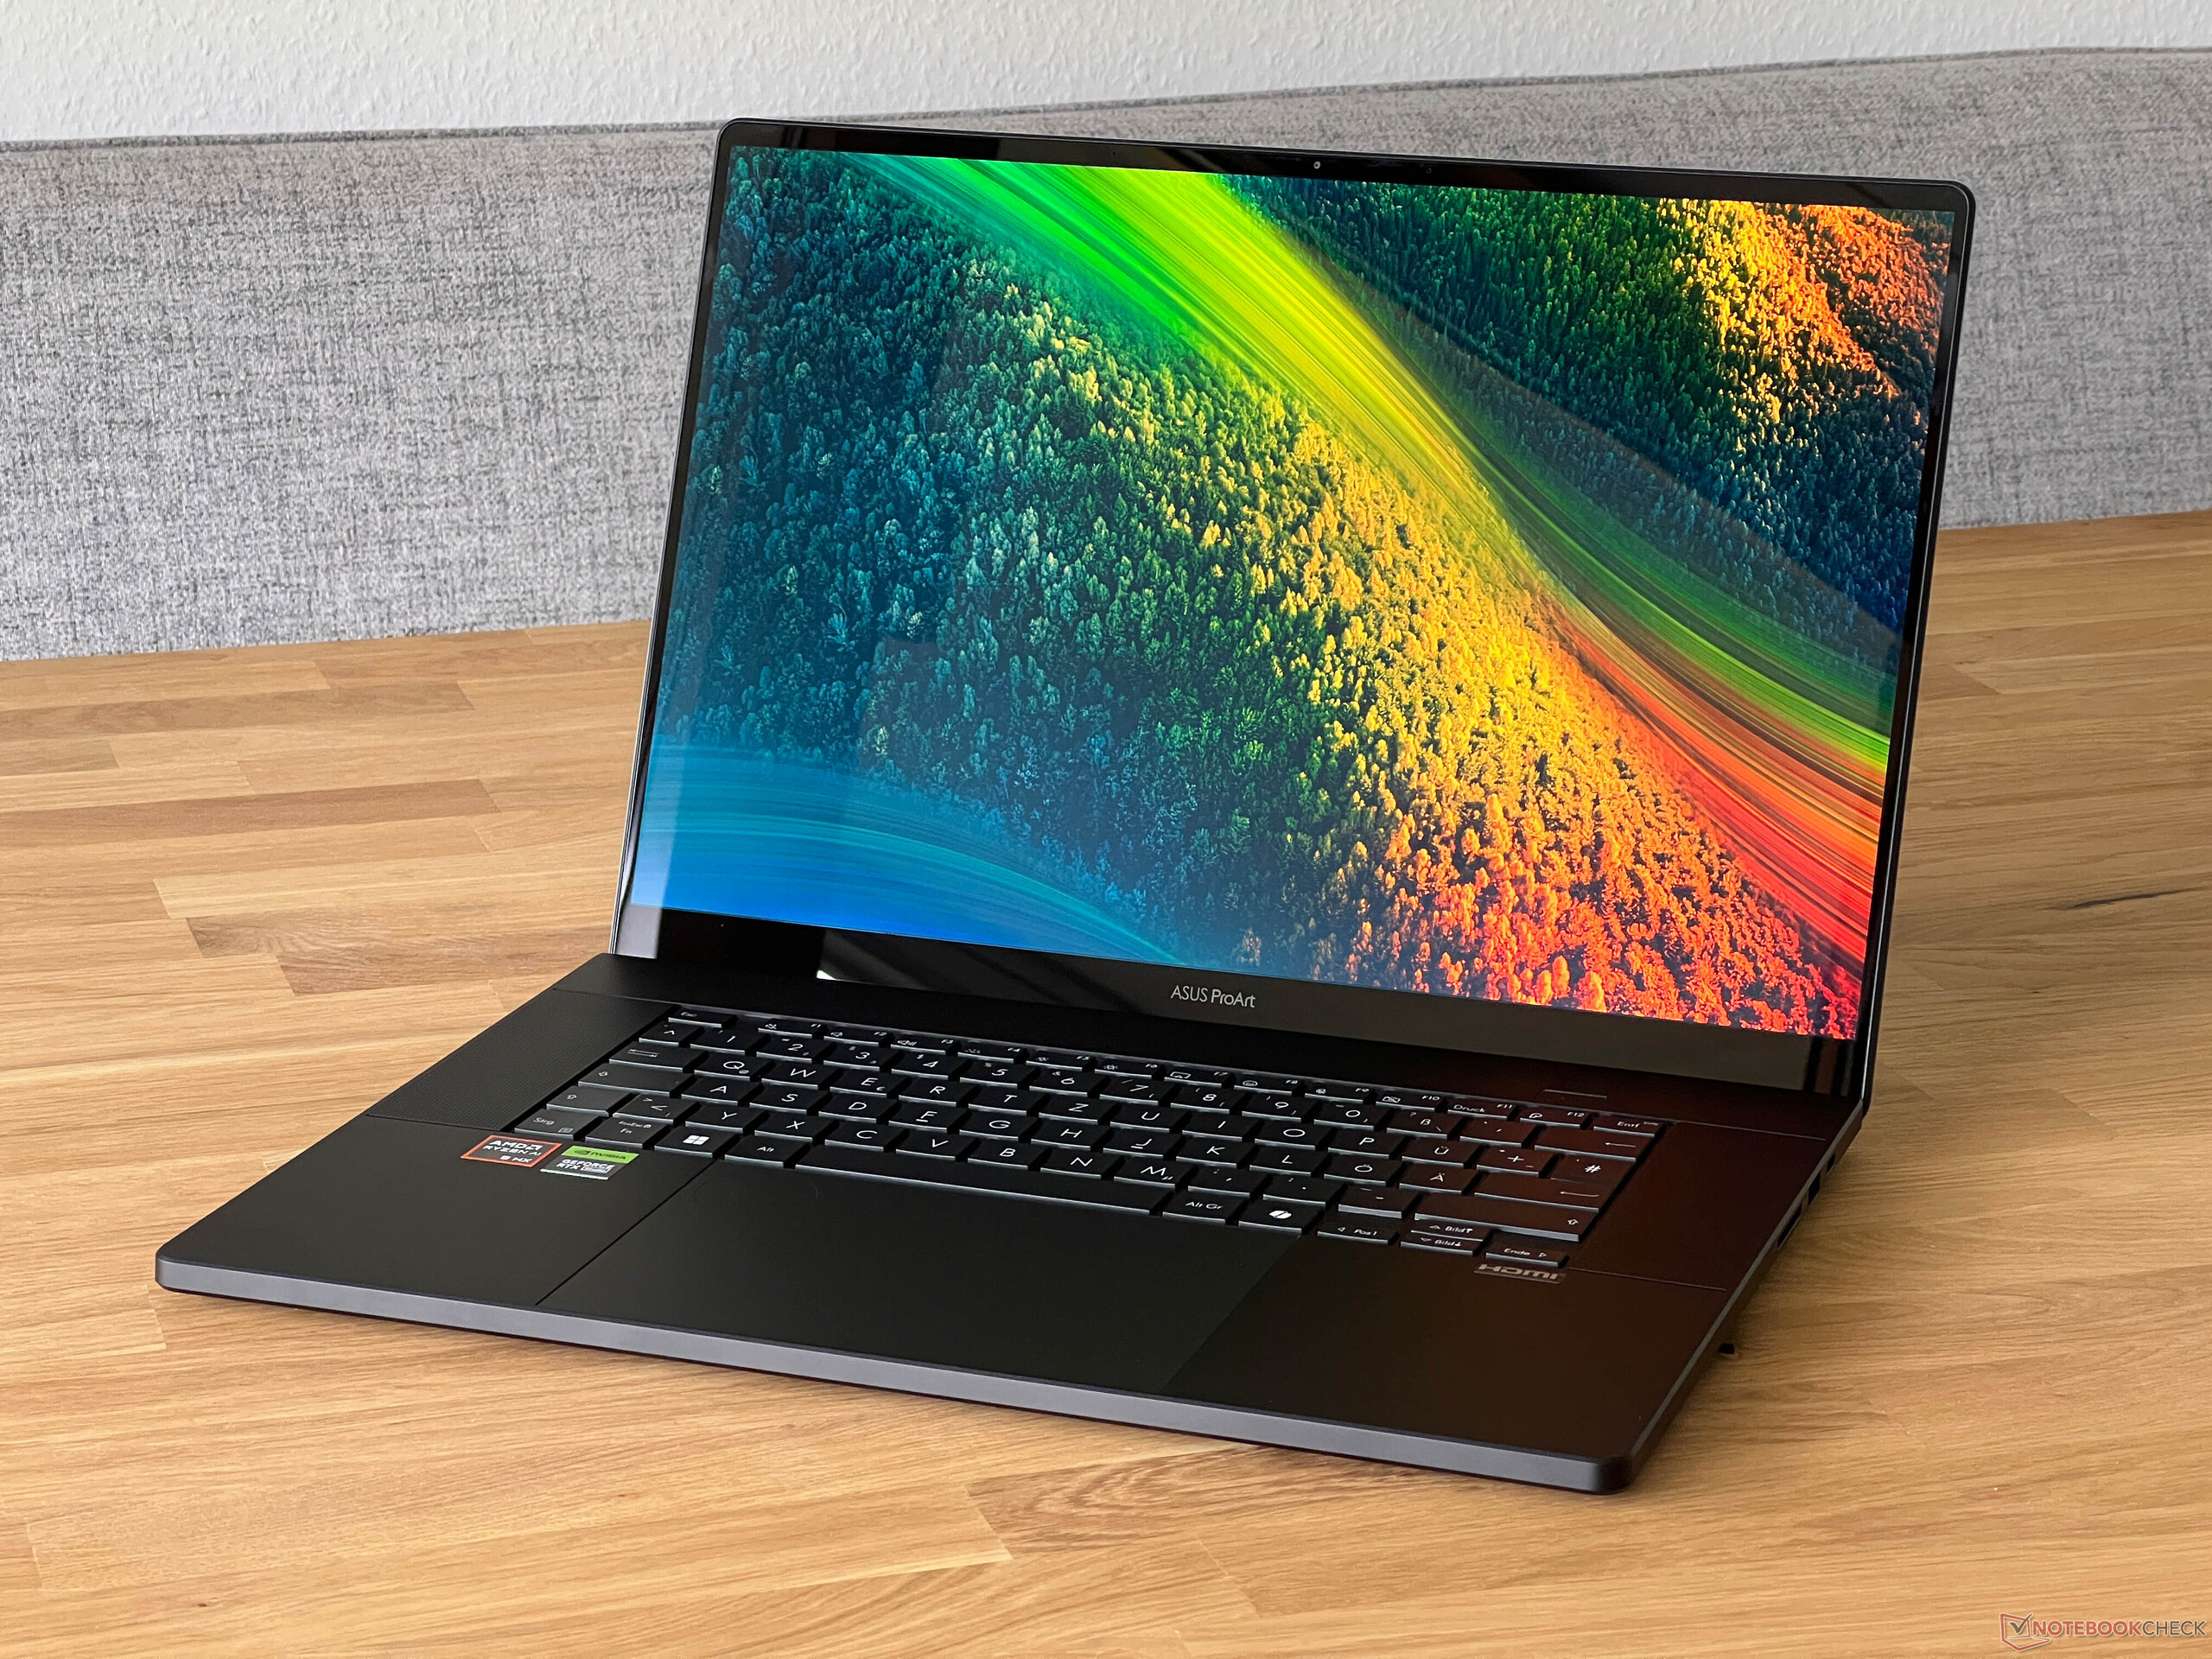
Asus ProArt P16 dizüstü bilgisayar incelemesi - AMD Zen 5, RTX 4070 dizüstü bilgisayar ve 4K OLED ile buluşuyor
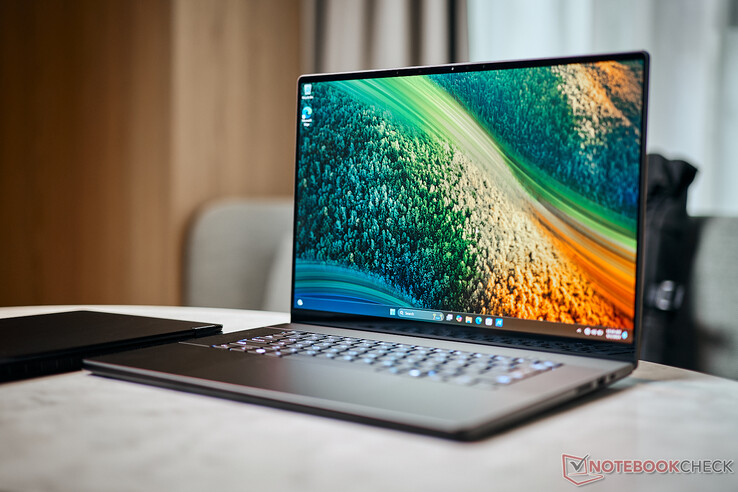
13,3 inç, 2'si 1 arada ProArt PX13'e ek olarak (burada kapsamlı olarak incelenmiştir), Asus ayrıca içerik oluşturucular için ProArt 16 şeklinde 16 inçlik daha büyük bir dizüstü bilgisayar piyasaya sürüyor. Modern AMD Zen 5 işlemciyi özel Nvidia GPU'larla ve yüksek çözünürlüklü 4K OLED dokunmatik ekranla birleştiriyor. Ancak, küçük PX13'ün aksine, yeni P16 benzer özelliklere sahip birçok rakip cihazla karşı karşıya. Yeni ProArt P16, diğer güçlü multimedya dizüstü bilgisayarlardan sıyrılmak için yeterli sayıda özellik sunuyor mu?
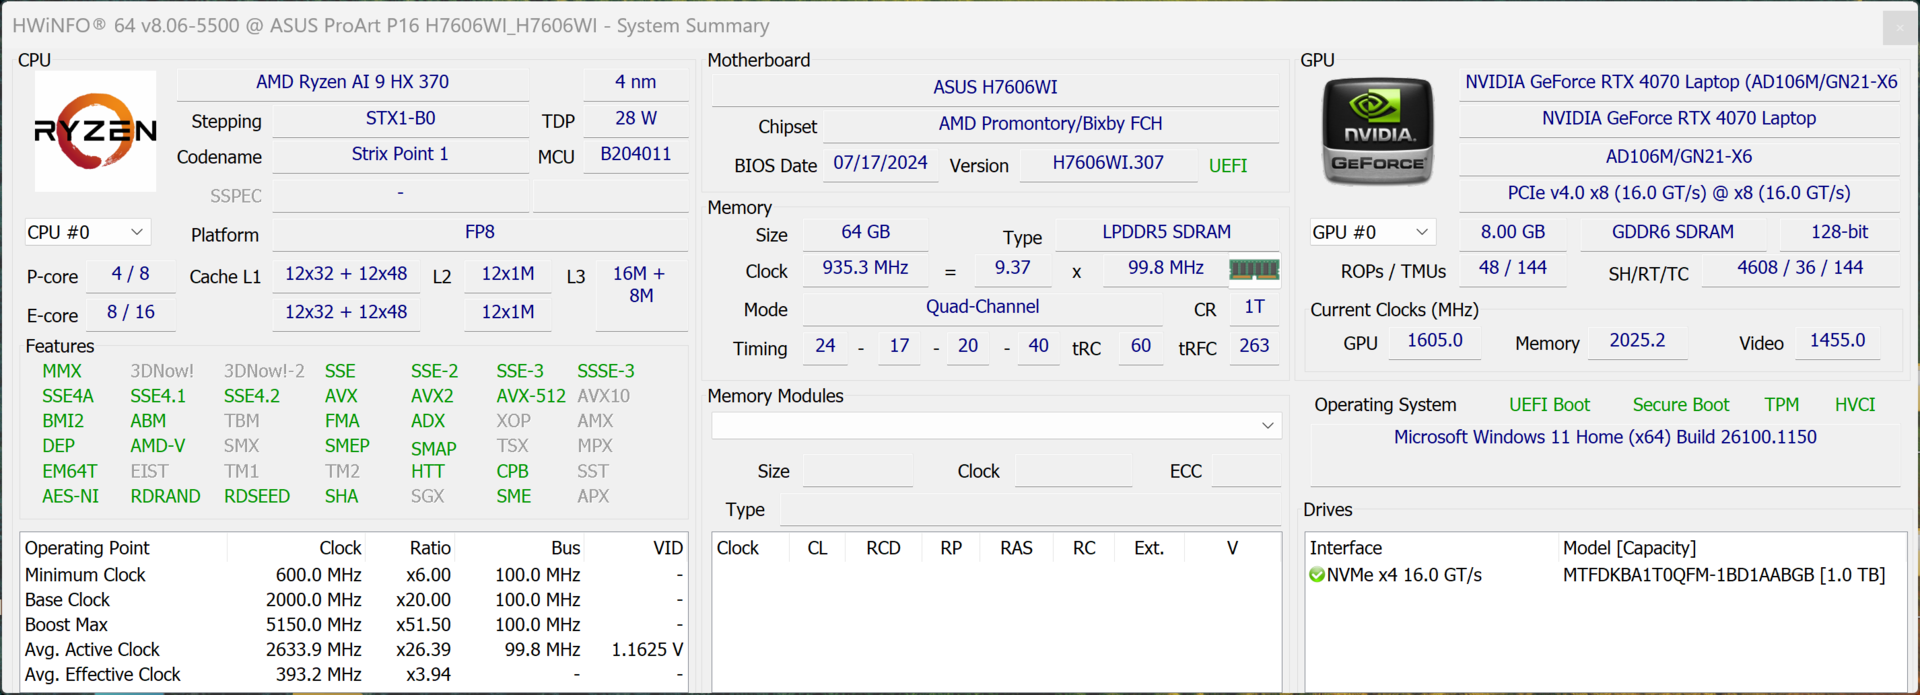
İnceleme cihazımız şu özelliklere sahip üst düzey varyanttır AMD Ryzen AI 9 HX 370, 64 GB RAM, Nvidia GeForce RTX 4070 dizüstü bilgisayar1 TB SSD (2 TB SSD perakende varyantı) ve 4K OLED 2.699 $ RRP karşılığında. 32 GB RAM'den (RRP: 2.299 $) 64 GB RAM'e yükseltme 400 $ gibi devasa bir fiyata denk geliyor. Giriş seviyesi fiyatı ise şu özelliklere sahip versiyon için Ryzen AI 9 365, 24 GB RAM, 1 TB SSD ve GeForce RTX 4050 dizüstü bilgisayar 1.899 dolar.
Karşılaştırmalı olarak olası rakipler
Derecelendirme | Sürüm | Tarih | Modeli | Ağırlık | Yükseklik | Boyut | Çözünürlük | Fiyat |
|---|---|---|---|---|---|---|---|---|
| 87.8 % | v8 | 08/2024 | Asus ProArt P16 H7606WI Ryzen AI 9 HX 370, NVIDIA GeForce RTX 4070 Laptop GPU | 1.8 kg | 17.3 mm | 16.00" | 3840x2400 | |
| 81.2 % | v8 | 07/2024 | SCHENKER XMG Pro 16 Studio (Mid 24) i9-14900HX, NVIDIA GeForce RTX 4070 Laptop GPU | 2.3 kg | 19.9 mm | 16.00" | 2560x1600 | |
| 88.7 % v7 (old) | v7 (old) | 04/2024 | Lenovo Yoga Pro 9 16IMH9 Ultra 9 185H, NVIDIA GeForce RTX 4070 Laptop GPU | 2.1 kg | 18.3 mm | 16.00" | 3200x2000 | |
| 88.6 % v7 (old) | v7 (old) | 04/2024 | Dell XPS 16 9640 Ultra 7 155H, NVIDIA GeForce RTX 4070 Laptop GPU | 2.3 kg | 18.7 mm | 16.30" | 3840x2400 | |
| 92.3 % v7 (old) | v7 (old) | 02/2024 | Asus ROG Zephyrus G16 2024 GU605M Ultra 7 155H, NVIDIA GeForce RTX 4070 Laptop GPU | 1.8 kg | 16.4 mm | 16.00" | 2560x1600 | |
| 93.2 % v7 (old) | v7 (old) | 11/2023 | Apple MacBook Pro 16 2023 M3 Max Apple M3 Max 16-Core, M3 Max 40-Core GPU | 2.1 kg | 16.9 mm | 16.00" | 3456x2234 | |
| 90.5 % v7 (old) | v7 (old) | 11/2023 | Asus Zenbook Pro 16X UX7602BZ-MY005W i9-13905H, NVIDIA GeForce RTX 4080 Laptop GPU | 2.4 kg | 17.8 mm | 16.00" | 3200x2000 |
Not: Derecelendirme sistemimizi yakın zamanda güncelledik ve 8. sürümün sonuçları 7. sürümün sonuçları ile karşılaştırılamaz. Daha fazla bilgi için burada.
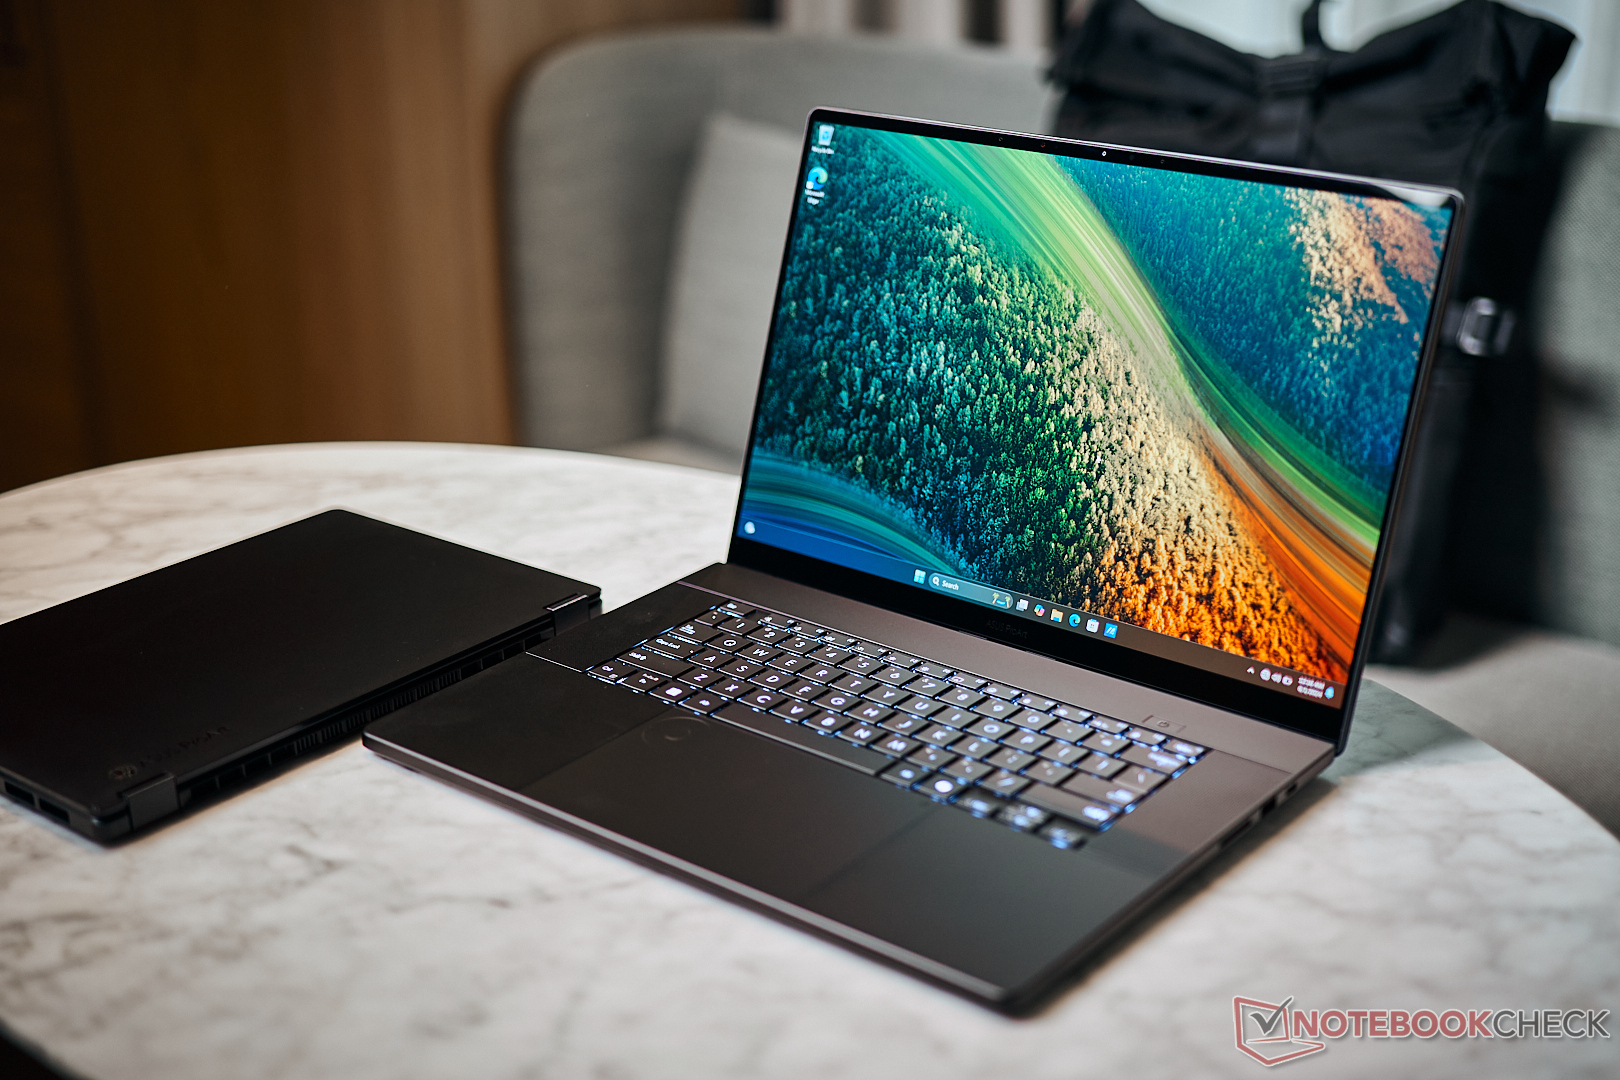
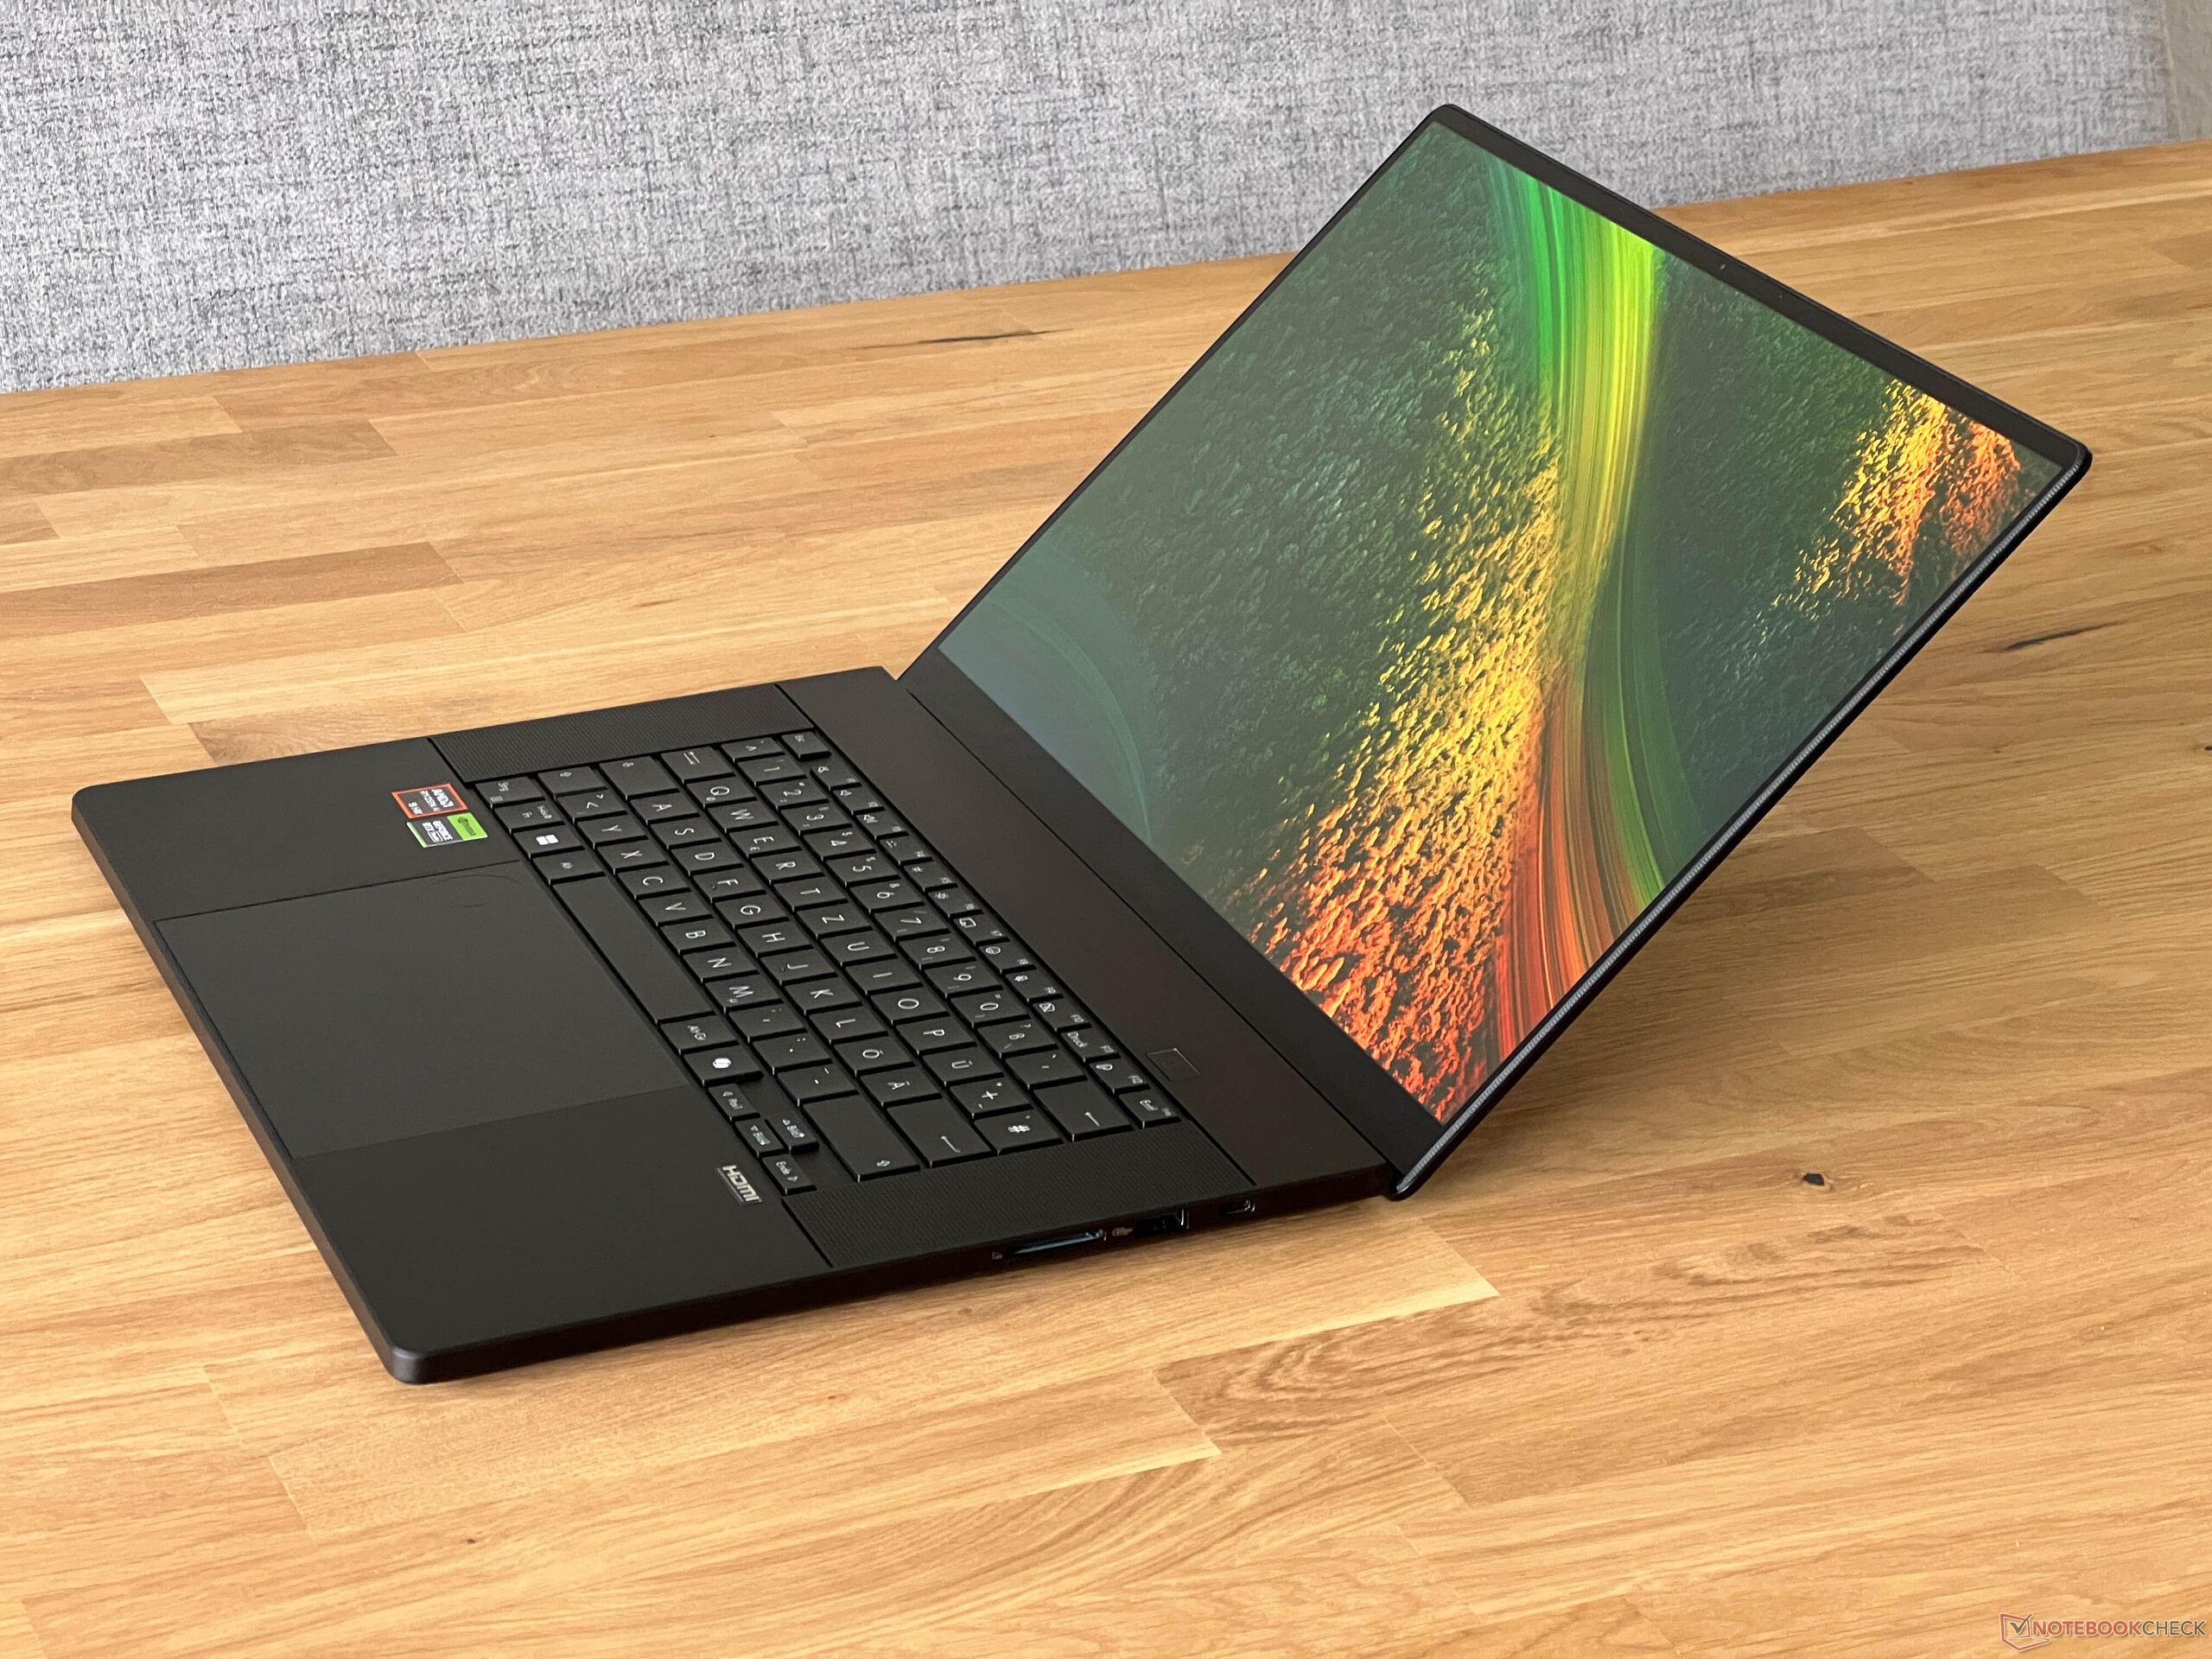
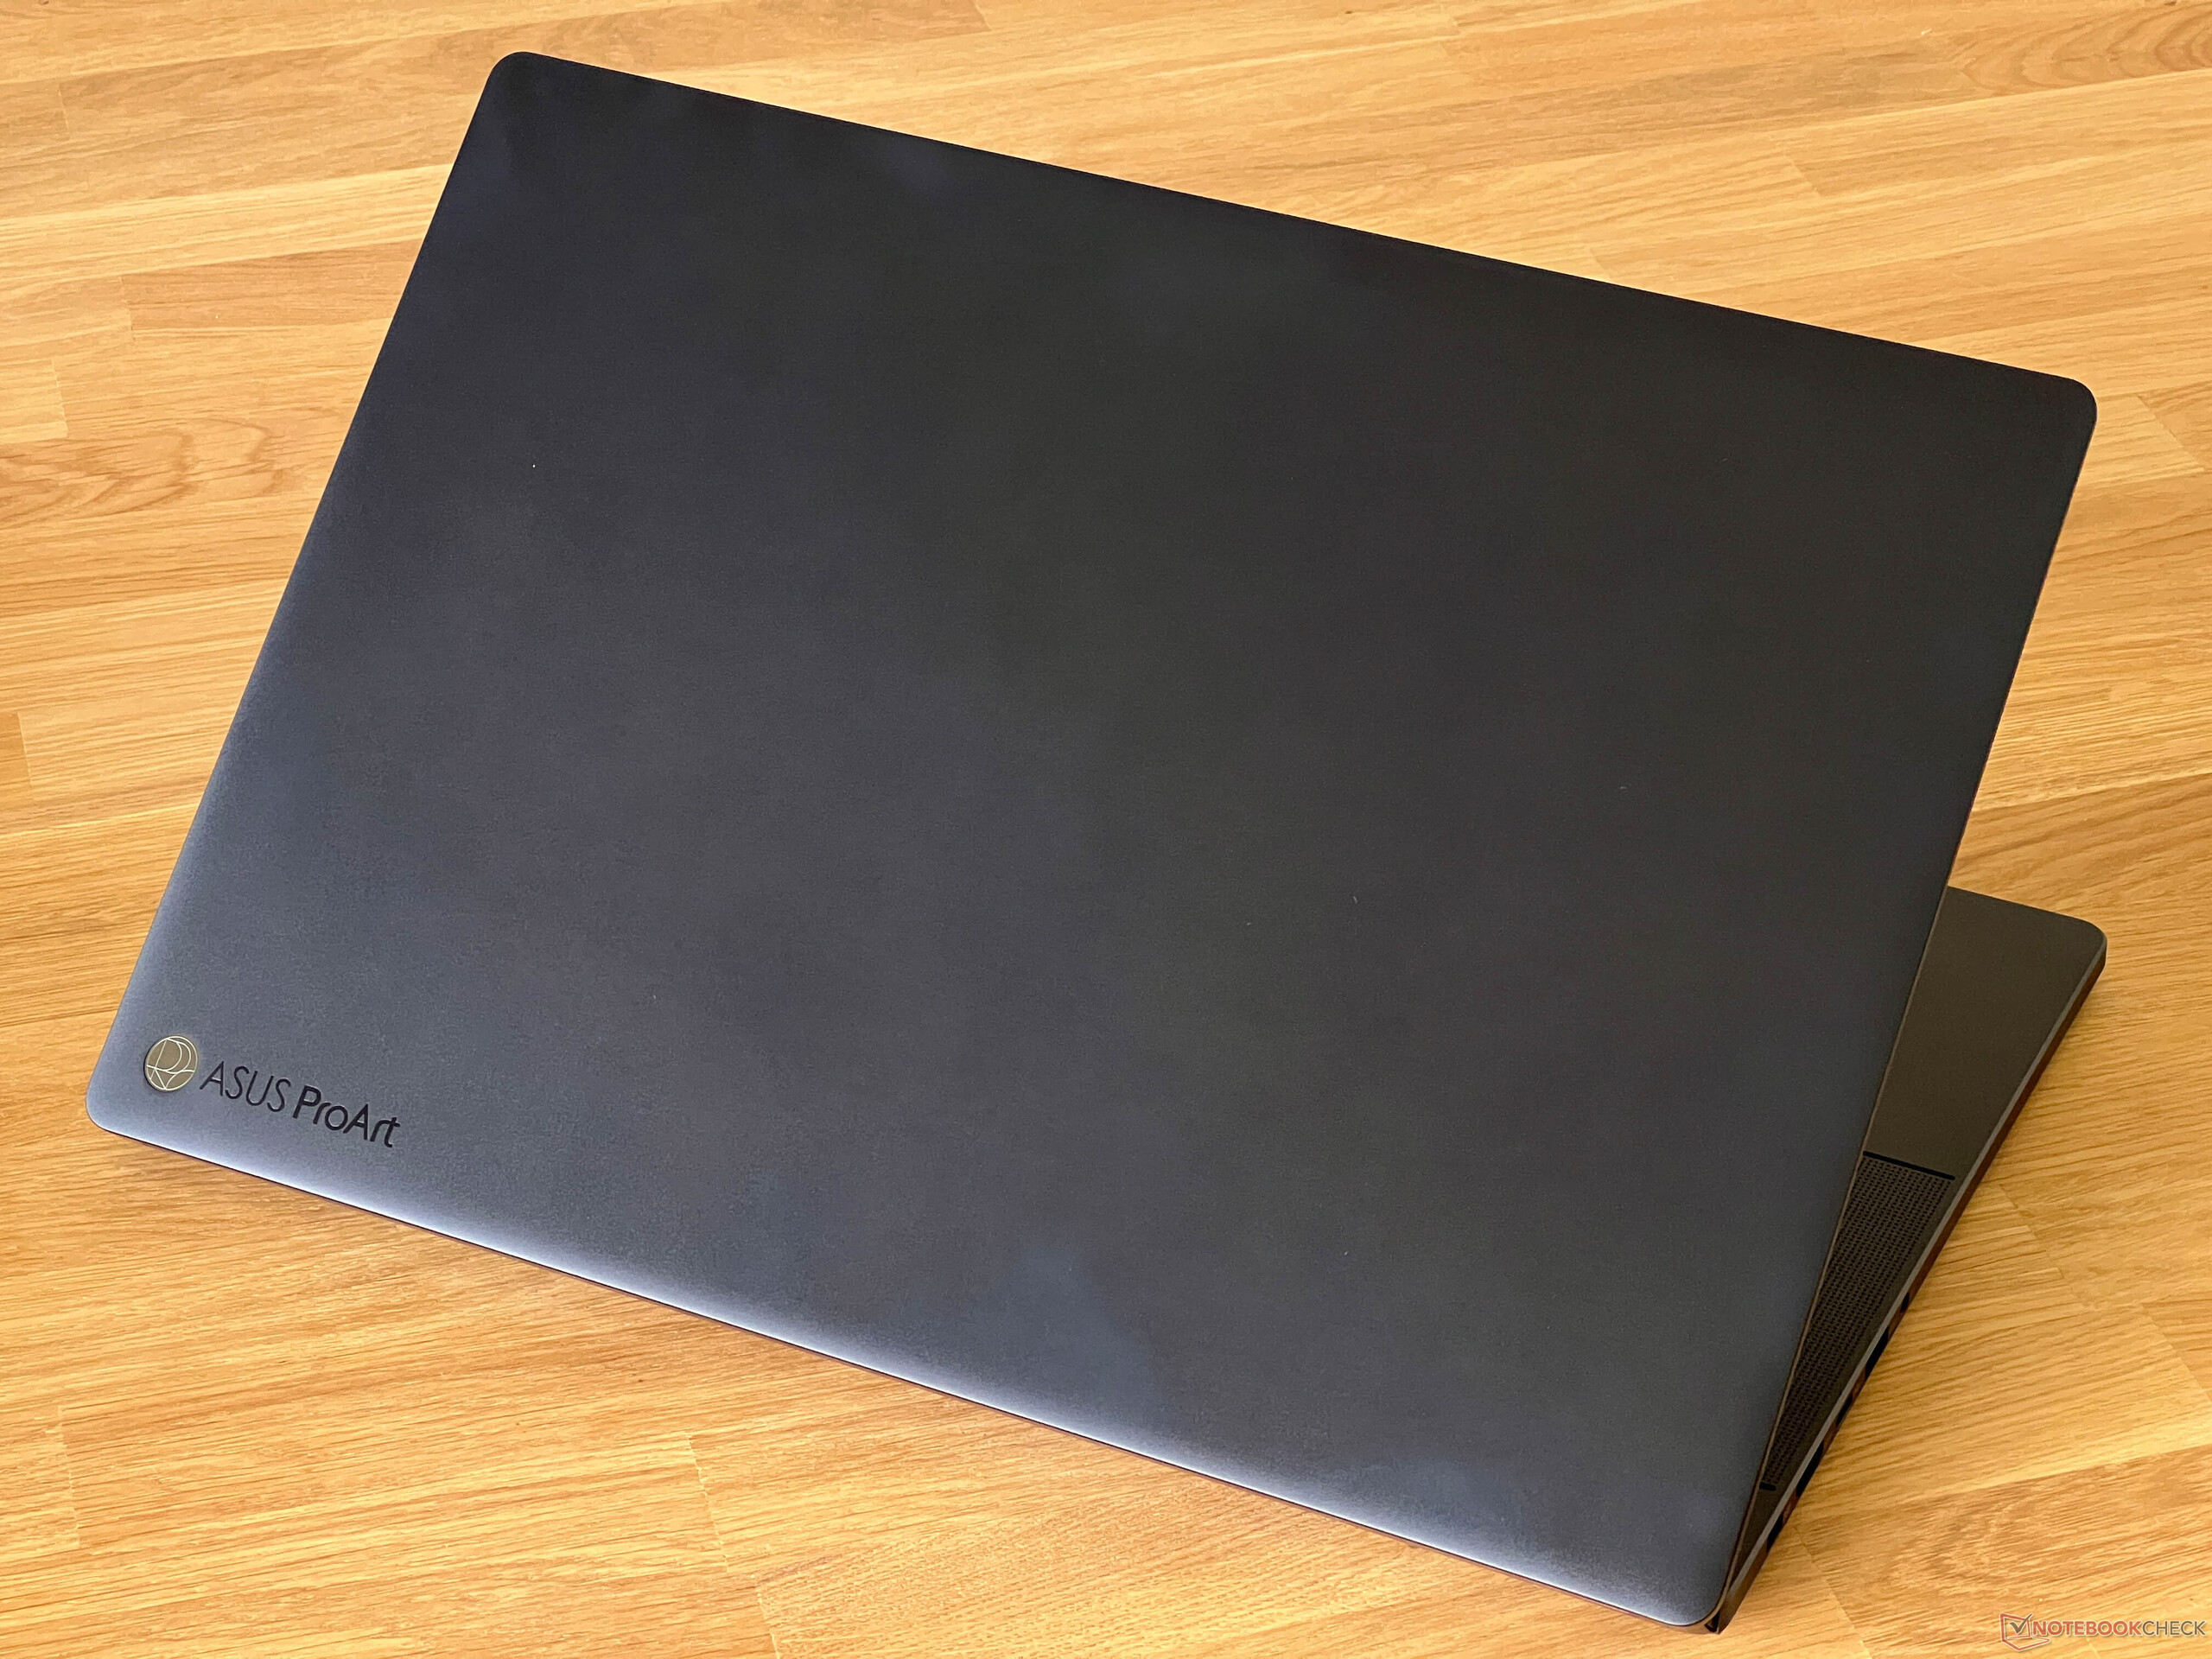
Kasa - Tıpkı ROG Zephyrus G16 gibi alüminyum yekpare gövde
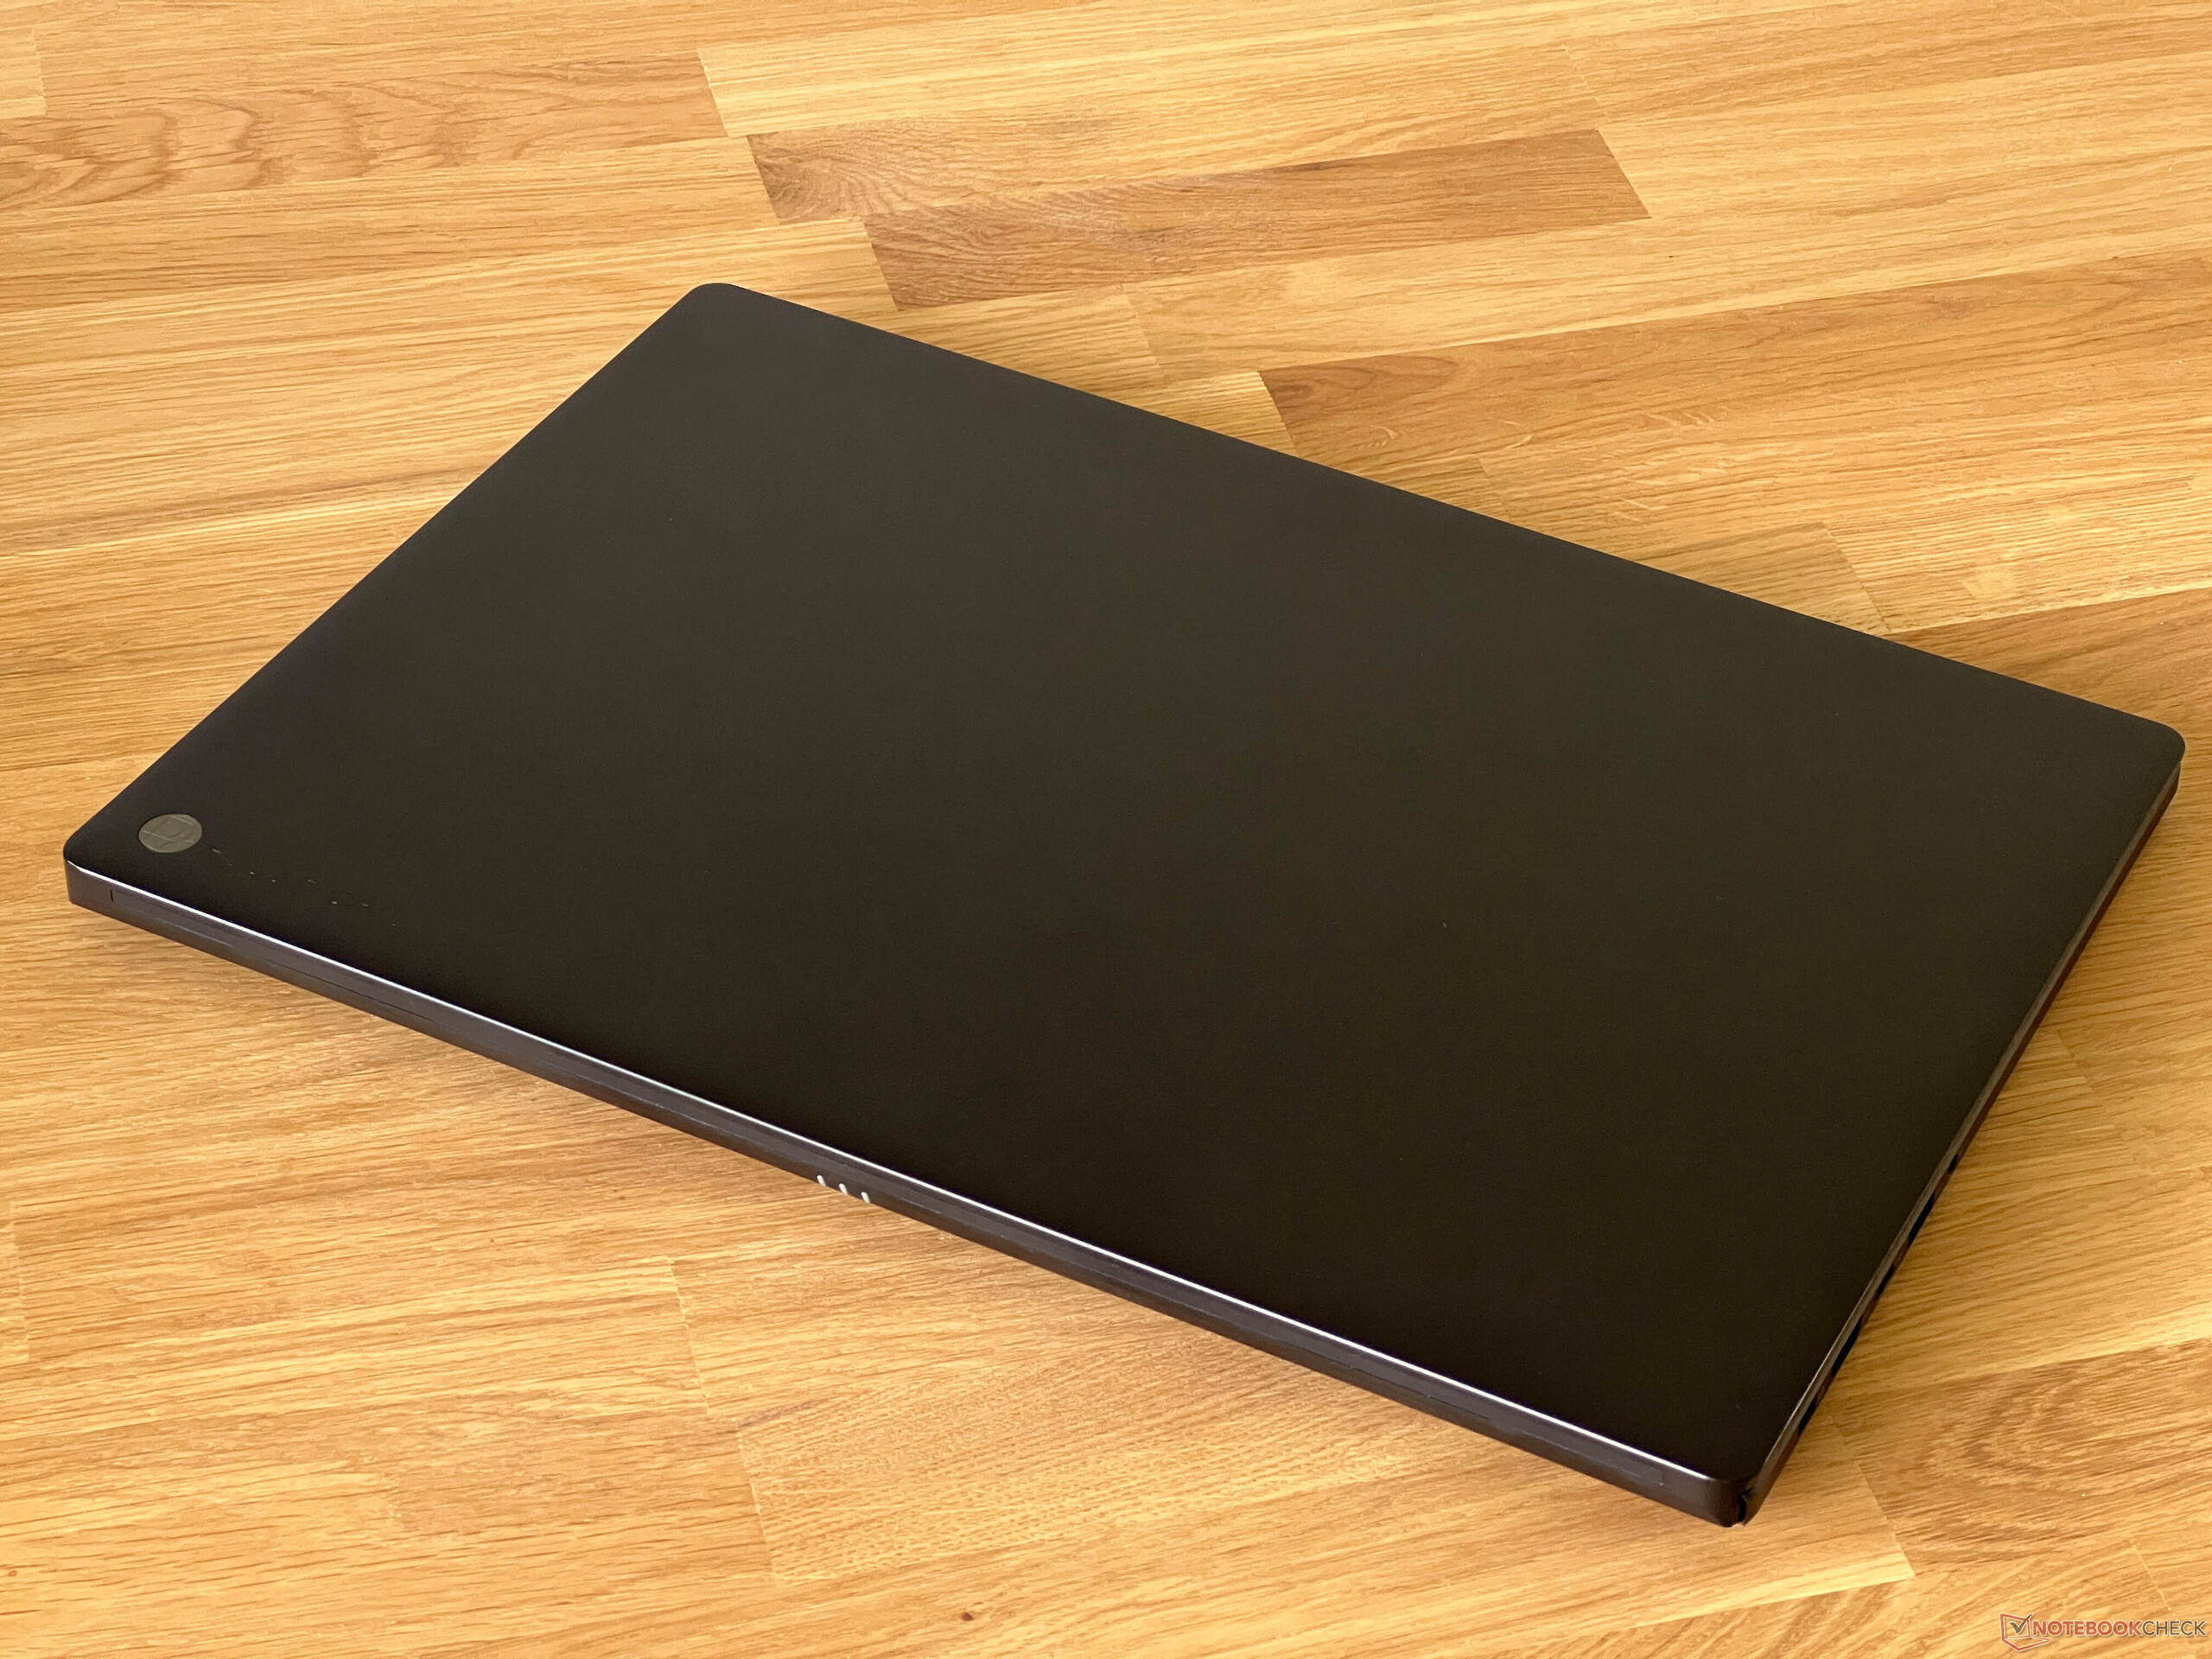
Siyah alüminyum yekpare kasanın ROG Zephyrus G16ancak ProArt'ta kasanın LED aydınlatması bulunmuyor. Ekran kapağını açar açmaz klavye düzeniyle ilgili çok fazla değişiklik olmadığını fark edersiniz (ek özel tuşlar eksiktir ve güç düğmesi farklı bir şekle sahiptir), ancak bunun dışında, hoparlör kapakları ve 4.110 delikleri de dahil olmak üzere neredeyse yalnızca benzerliklerle uğraşıyoruz. ProArt P16 sadece Nano Siyah renk seçeneğiyle geliyor ve bu da parmak izlerini hızla çekmeye yatkın.
Kalite açısından P16, hem olumlu hem de olumsuz nedenlerle Zephyrus G16'dan çok da farklı değil. Olumlu yönler hem mükemmel stabilite hem de yapı kalitesidir, ancak biraz gevşek menteşeler ve bunun sonucunda ortaya çıkan gözle görülür kapak sallantısı olumsuz özellikler olmaya devam etmektedir.
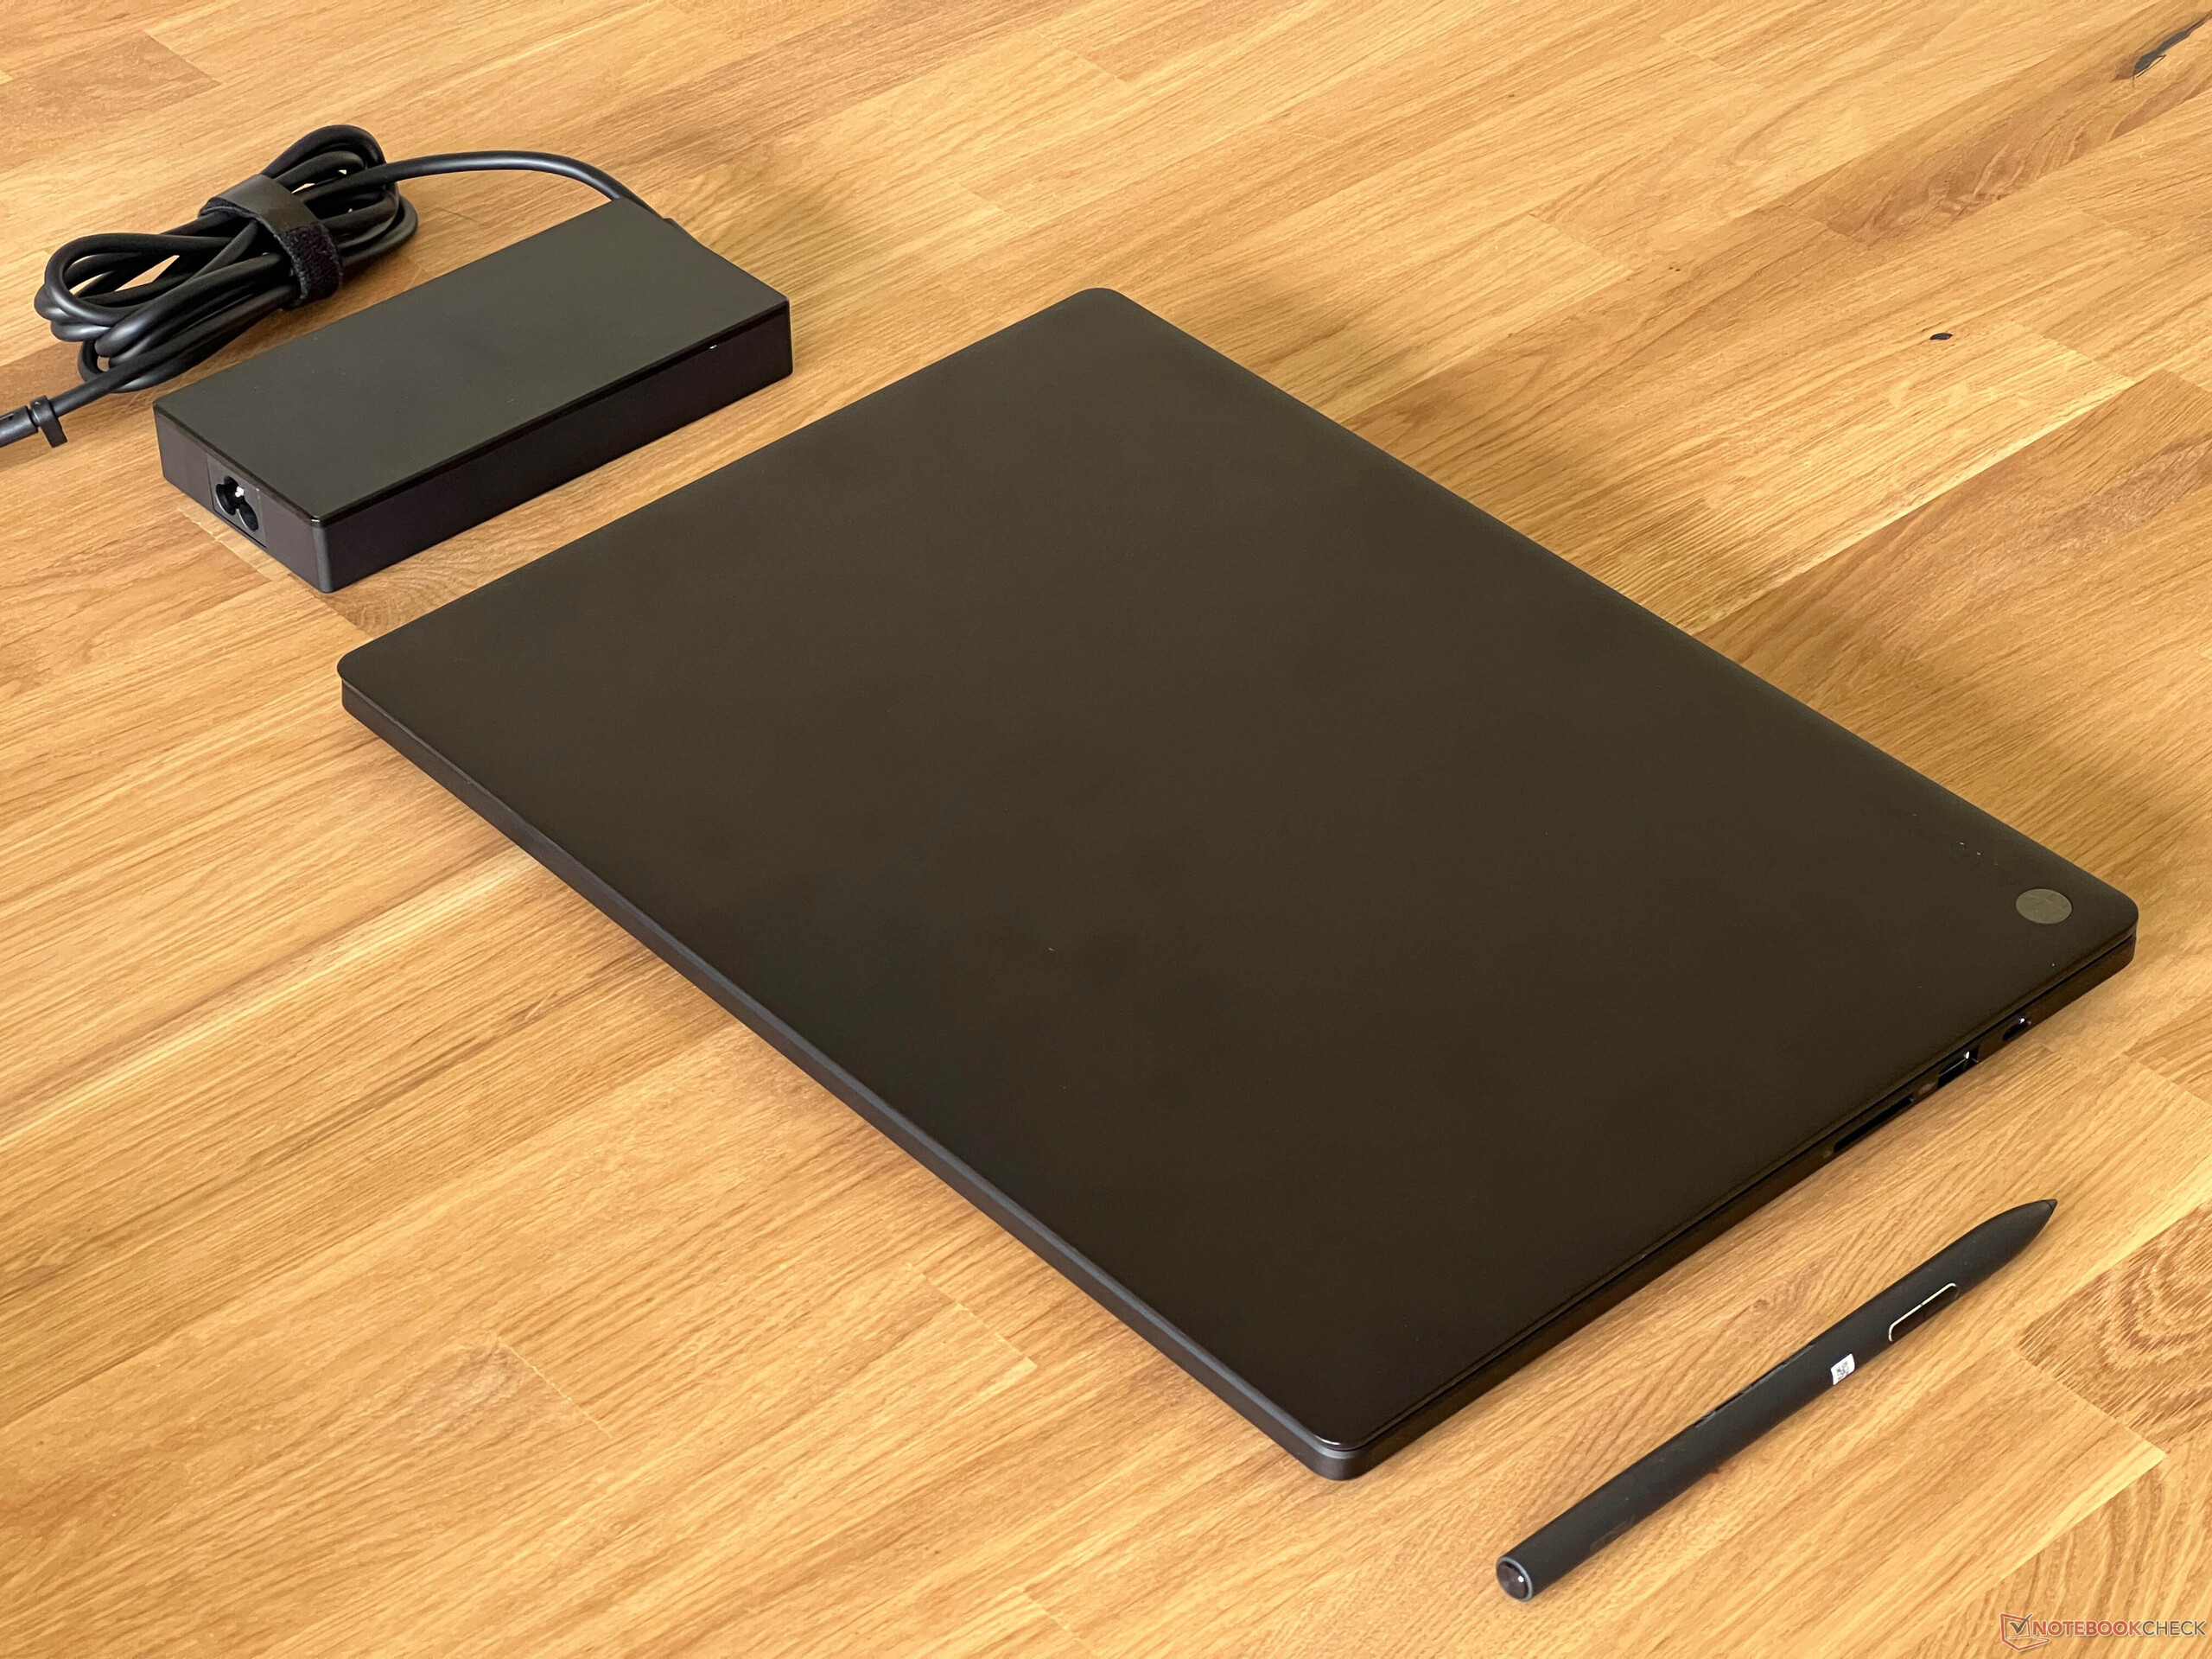
Kapladığı alan açısından ProArt P16 orta sıralarda yer alıyor. Zenbook Pro 16X ile karşılaştırma yapmak da ilginç çünkü bu cihaz sadece biraz daha kalın ancak 2,4 kg ile yeni P16'dan ve 1,8 kg'dan oldukça ağır. Bu aynı zamanda yeni P16'yı karşılaştırma tablomuzdaki en hafif cihaz yapıyor - ve oldukça uzak bir farkla (aynı şekilde inşa edilmiş Zephyrus G16 ile birlikte). 200 watt'lık PSU, tartıya 588 gram daha getiriyor.
Özellikler - USB 4 ve Wi-Fi 7
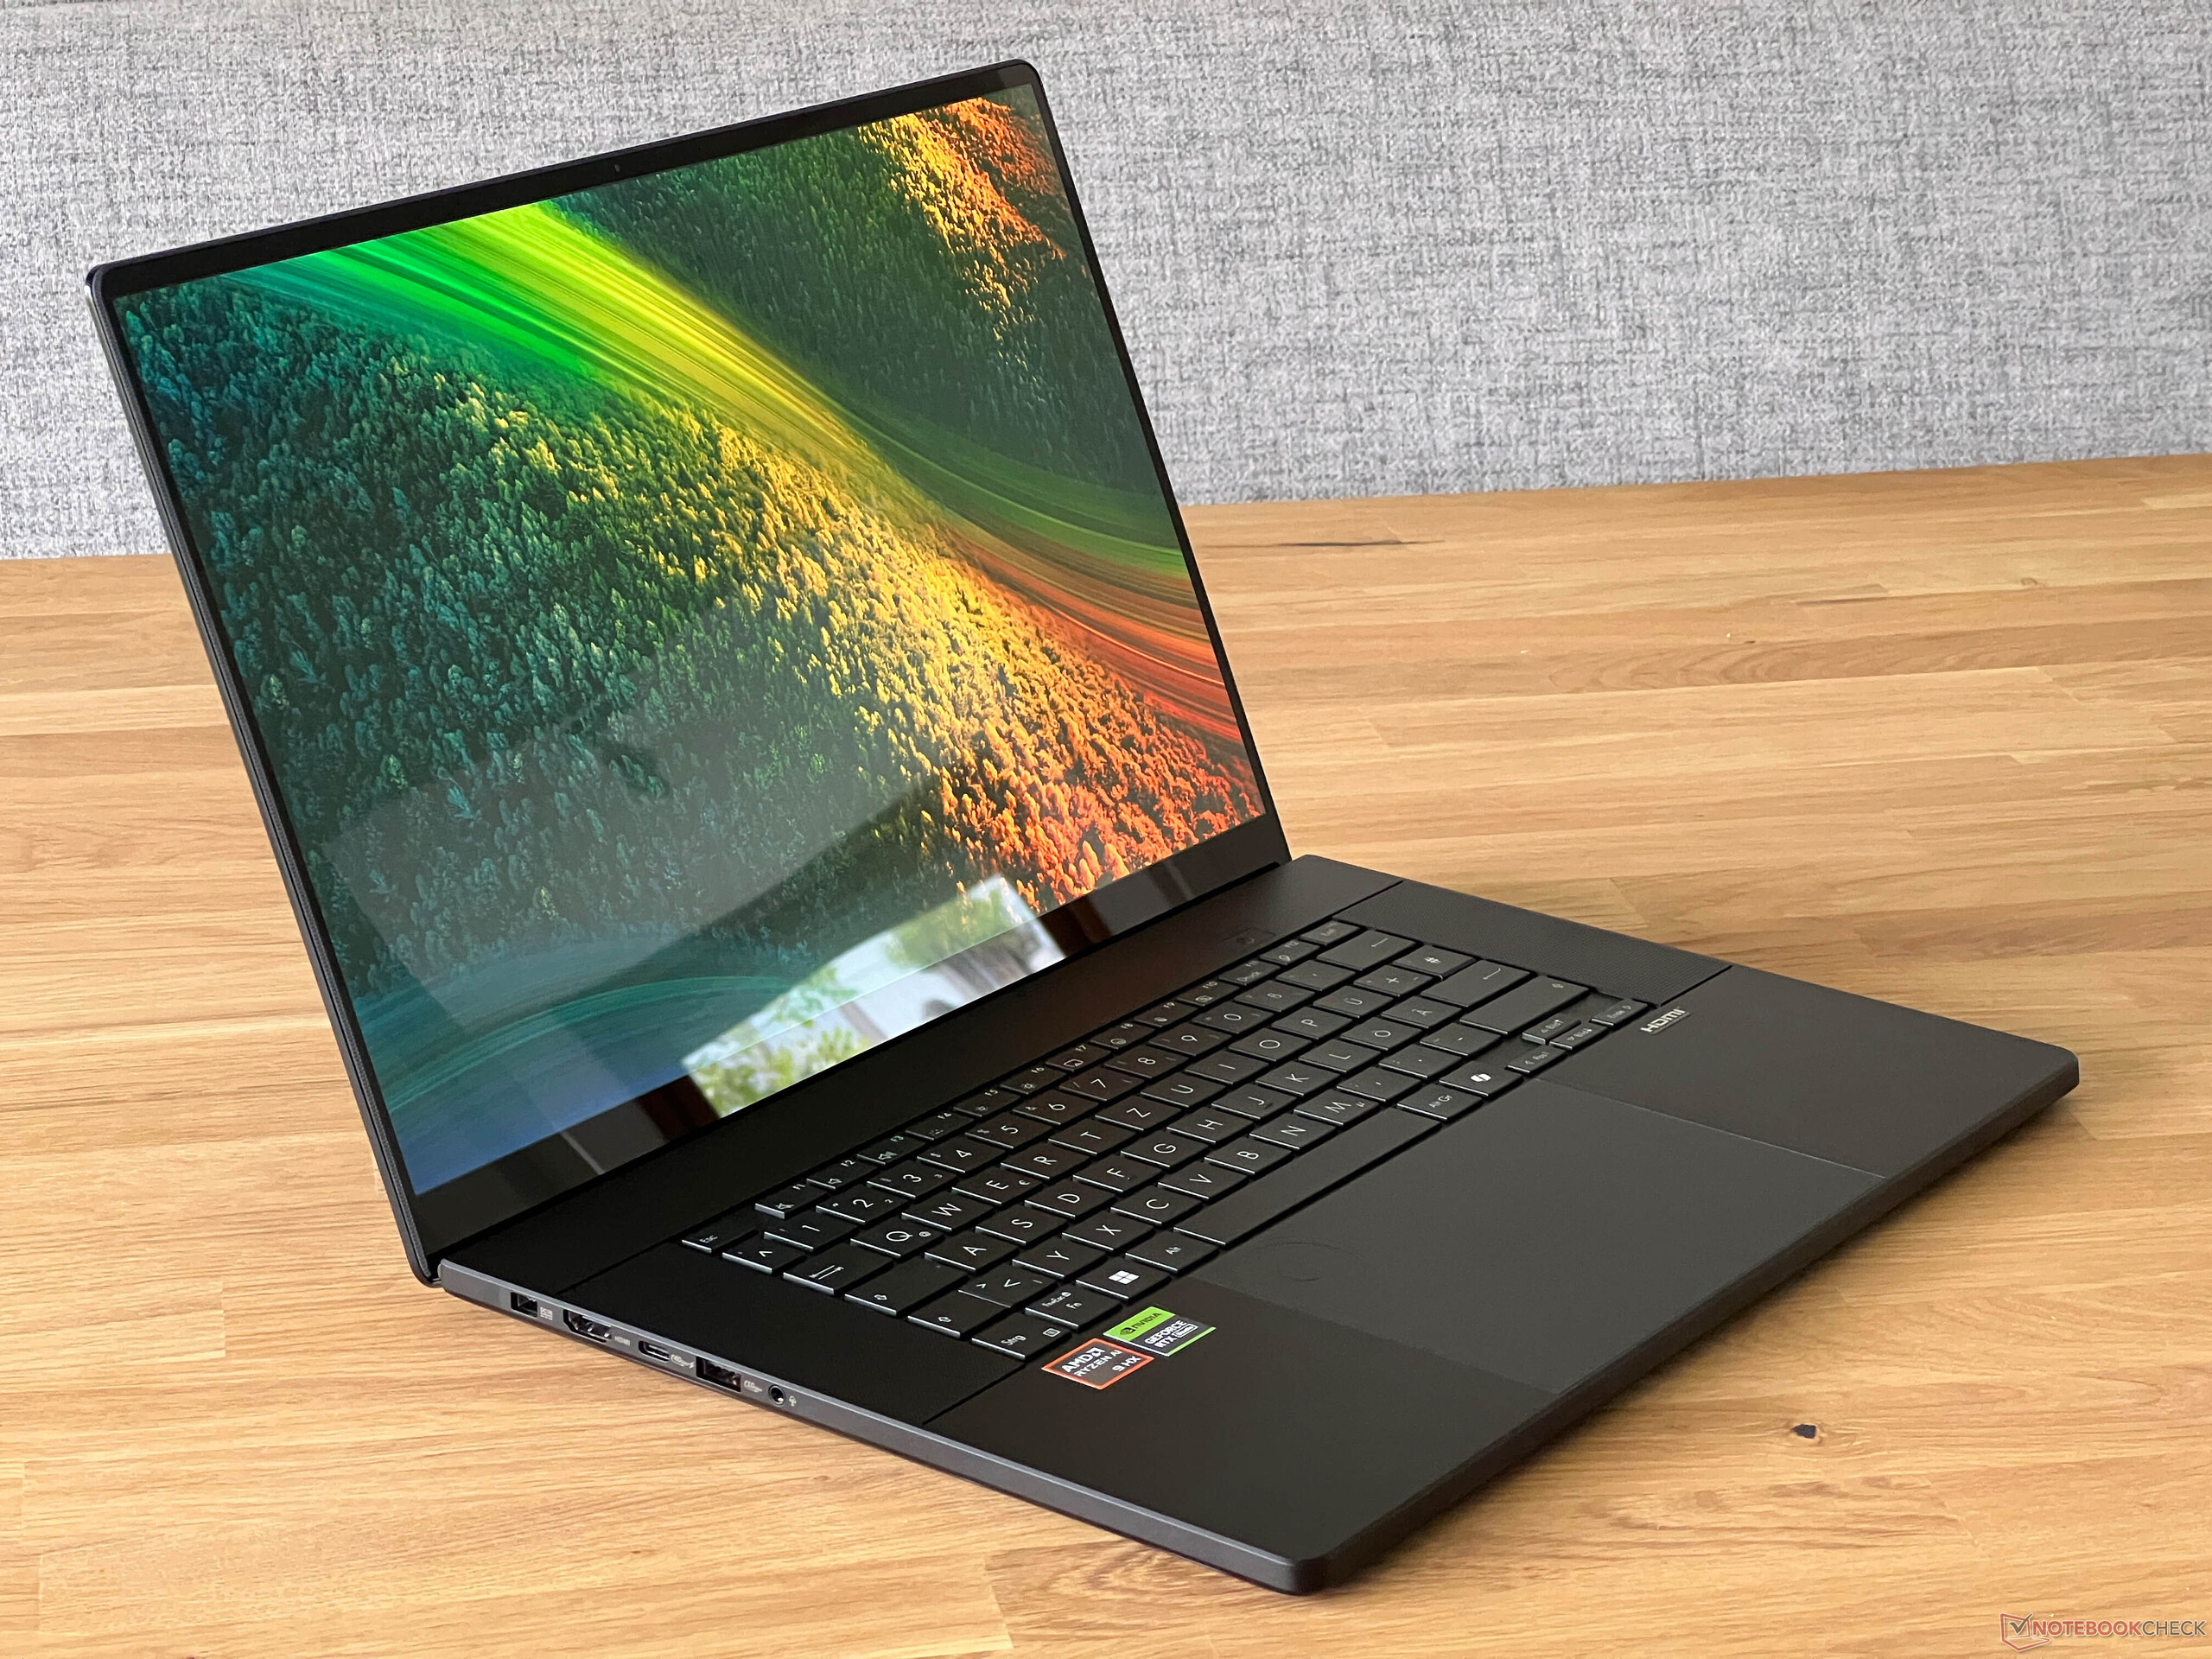
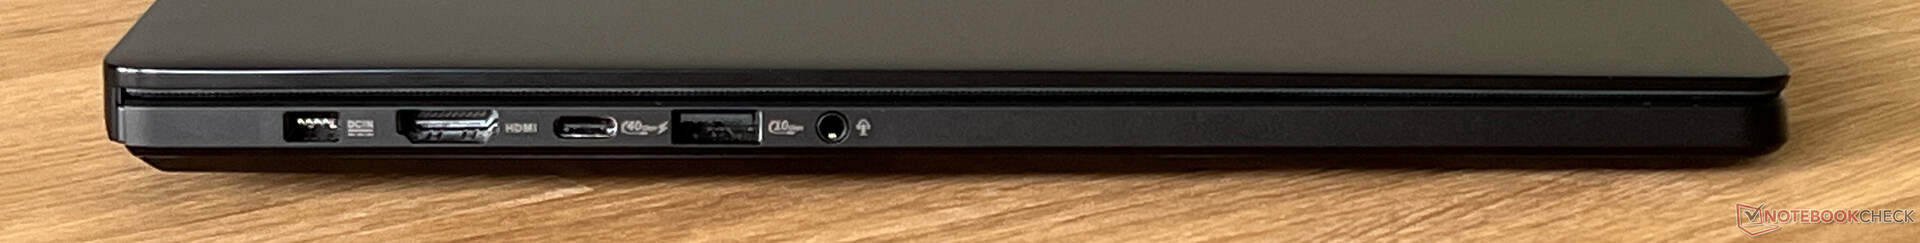
Bağlantı noktası konumu da ROG Zephyrus ile aynıdır, ancak AMD işlemci destekli ProArt P16, USB 4.0 bağlantı noktaları için Thunderbolt 4 desteğine sahip değildir. Bununla birlikte, tüm önemli konektörler yerleşiktir, yani günlük kullanım söz konusu olduğunda herhangi bir sorun olmayacaktır.
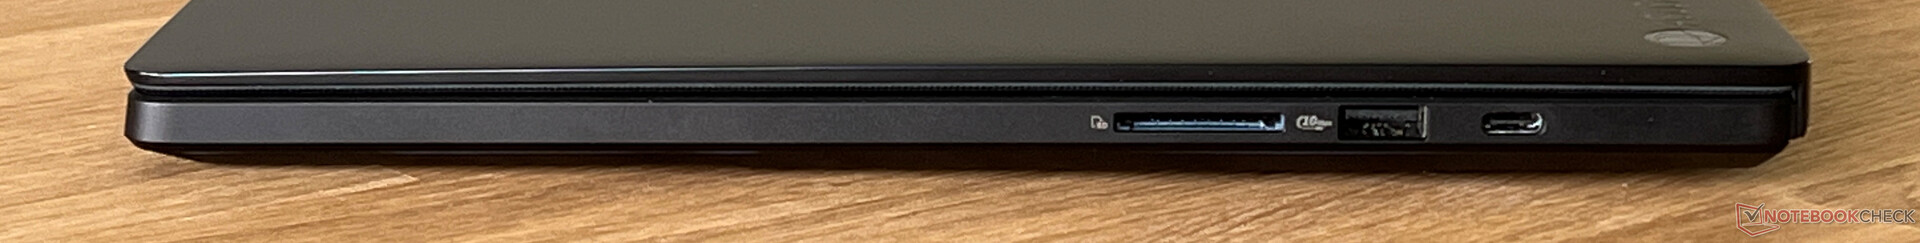
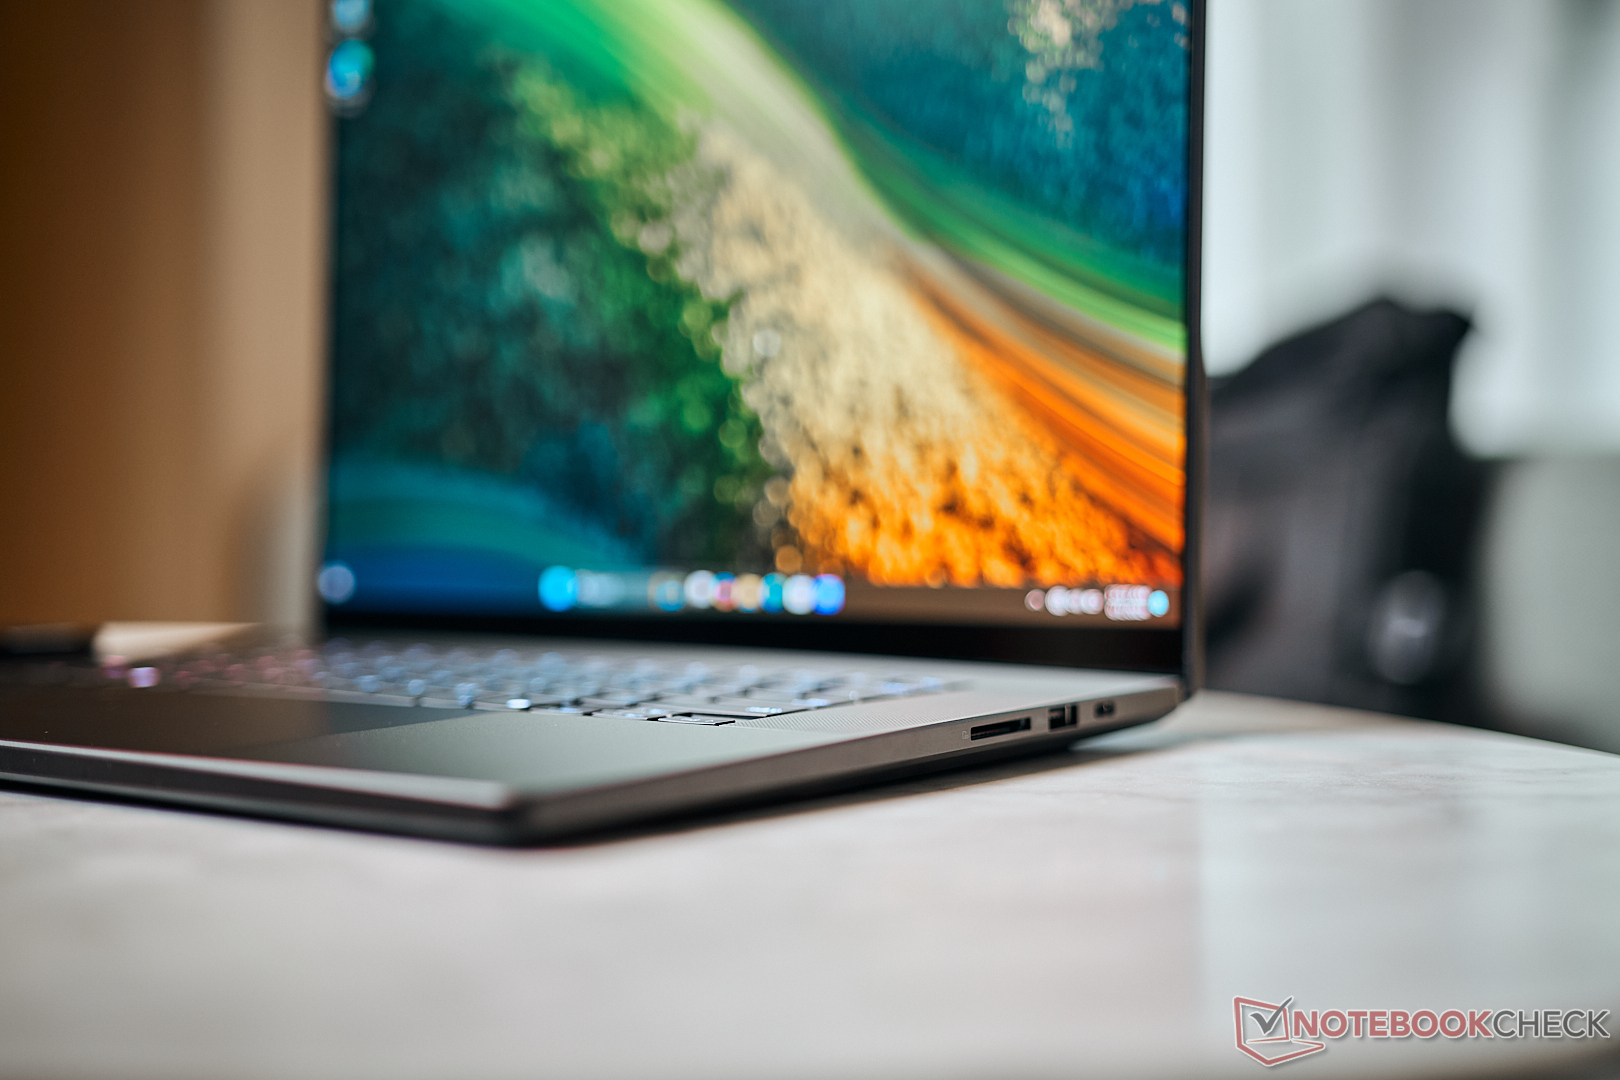
SD kart okuyucu
Sağ taraftaki SD kart okuyucu bellek kartlarını tam olarak barındırmıyor ancak Zephyrus'a kıyasla hızı daha iyi. Referans kartımızla (Angelbird AV Pro V60) eşleştirildiğinde, aktarım hızları 254 MB/sn'ye kadar ve ayrıca veri kopyalarken 127 MB/sn ile önemli ölçüde daha yüksek.
| SD Card Reader | |
| average JPG Copy Test (av. of 3 runs) | |
| Apple MacBook Pro 16 2023 M3 Max (Angelbird AV Pro V60) | |
| Dell XPS 16 9640 (Angelbird AV Pro V60) | |
| Asus ProArt P16 H7606WI (Angelbird AV Pro V60) | |
| Sınıf ortalaması Multimedia (18.4 - 201, n=56, son 2 yıl) | |
| Asus Zenbook Pro 16X UX7602BZ-MY005W | |
| SCHENKER XMG Pro 16 Studio (Mid 24) (AV PRO microSD 128 GB V60) | |
| Asus ROG Zephyrus G16 2024 GU605M | |
| Lenovo Yoga Pro 9 16IMH9 (Angelbird AV Pro V60) | |
| maximum AS SSD Seq Read Test (1GB) | |
| Asus ProArt P16 H7606WI (Angelbird AV Pro V60) | |
| Apple MacBook Pro 16 2023 M3 Max (Angelbird AV Pro V60) | |
| Dell XPS 16 9640 (Angelbird AV Pro V60) | |
| Sınıf ortalaması Multimedia (25.8 - 266, n=56, son 2 yıl) | |
| Asus ROG Zephyrus G16 2024 GU605M | |
| Lenovo Yoga Pro 9 16IMH9 (Angelbird AV Pro V60) | |
| SCHENKER XMG Pro 16 Studio (Mid 24) (AV PRO microSD 128 GB V60) | |
| Asus Zenbook Pro 16X UX7602BZ-MY005W | |
İletişim
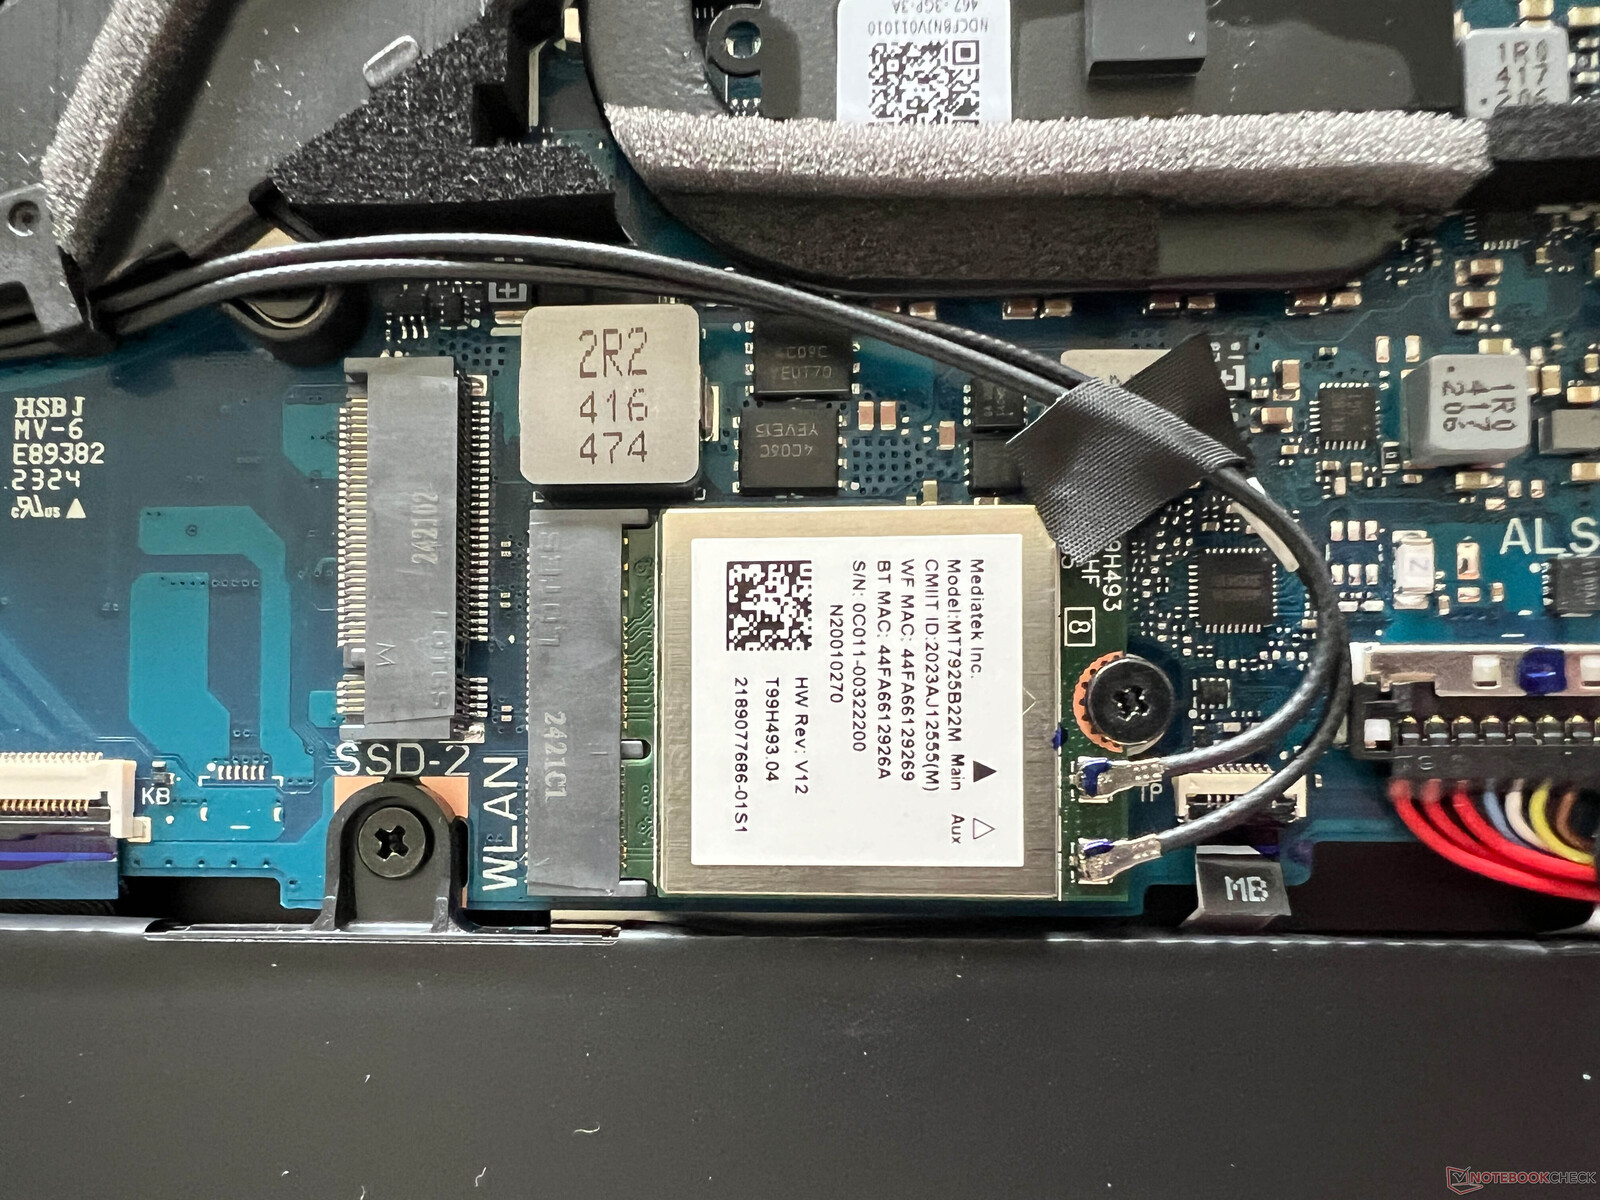
Asus, ProArt P16'yı Bluetooth 5.4'ü de destekleyen modern bir MediaTek (MT7925) Wi-Fi 7 modülü ile donattı. Asus referans yönlendiricimizle birlikte, mevcut dizüstü bilgisayarlarda bulabileceğiniz en iyiler arasında yer alan çok yüksek aktarım hızları kaydettik. Testlerimiz sırasında kablosuz ağ bağlantısında da herhangi bir sorunla karşılaşmadık.
| Networking | |
| Asus ProArt P16 H7606WI | |
| iperf3 transmit AXE11000 | |
| iperf3 receive AXE11000 | |
| SCHENKER XMG Pro 16 Studio (Mid 24) | |
| iperf3 transmit AXE11000 | |
| iperf3 receive AXE11000 | |
| Lenovo Yoga Pro 9 16IMH9 | |
| iperf3 transmit AXE11000 | |
| iperf3 receive AXE11000 | |
| Dell XPS 16 9640 | |
| iperf3 transmit AXE11000 | |
| iperf3 receive AXE11000 | |
| Asus ROG Zephyrus G16 2024 GU605M | |
| iperf3 transmit AXE11000 | |
| iperf3 receive AXE11000 | |
| Apple MacBook Pro 16 2023 M3 Max | |
| iperf3 transmit AXE11000 | |
| iperf3 receive AXE11000 | |
| Asus Zenbook Pro 16X UX7602BZ-MY005W | |
| iperf3 transmit AXE11000 | |
| iperf3 receive AXE11000 | |
| iperf3 transmit AXE11000 6GHz | |
| iperf3 receive AXE11000 6GHz | |
Web kamerası
1080p web kamerası mevcut Windows Studio Efektlerini destekliyor ancak görüntü kalitesi çok iyi değil. Ayrıca, Windows Hello aracılığıyla yüz tanımaya olanak sağlayan bir IR modülü takılmıştır.


Bakım
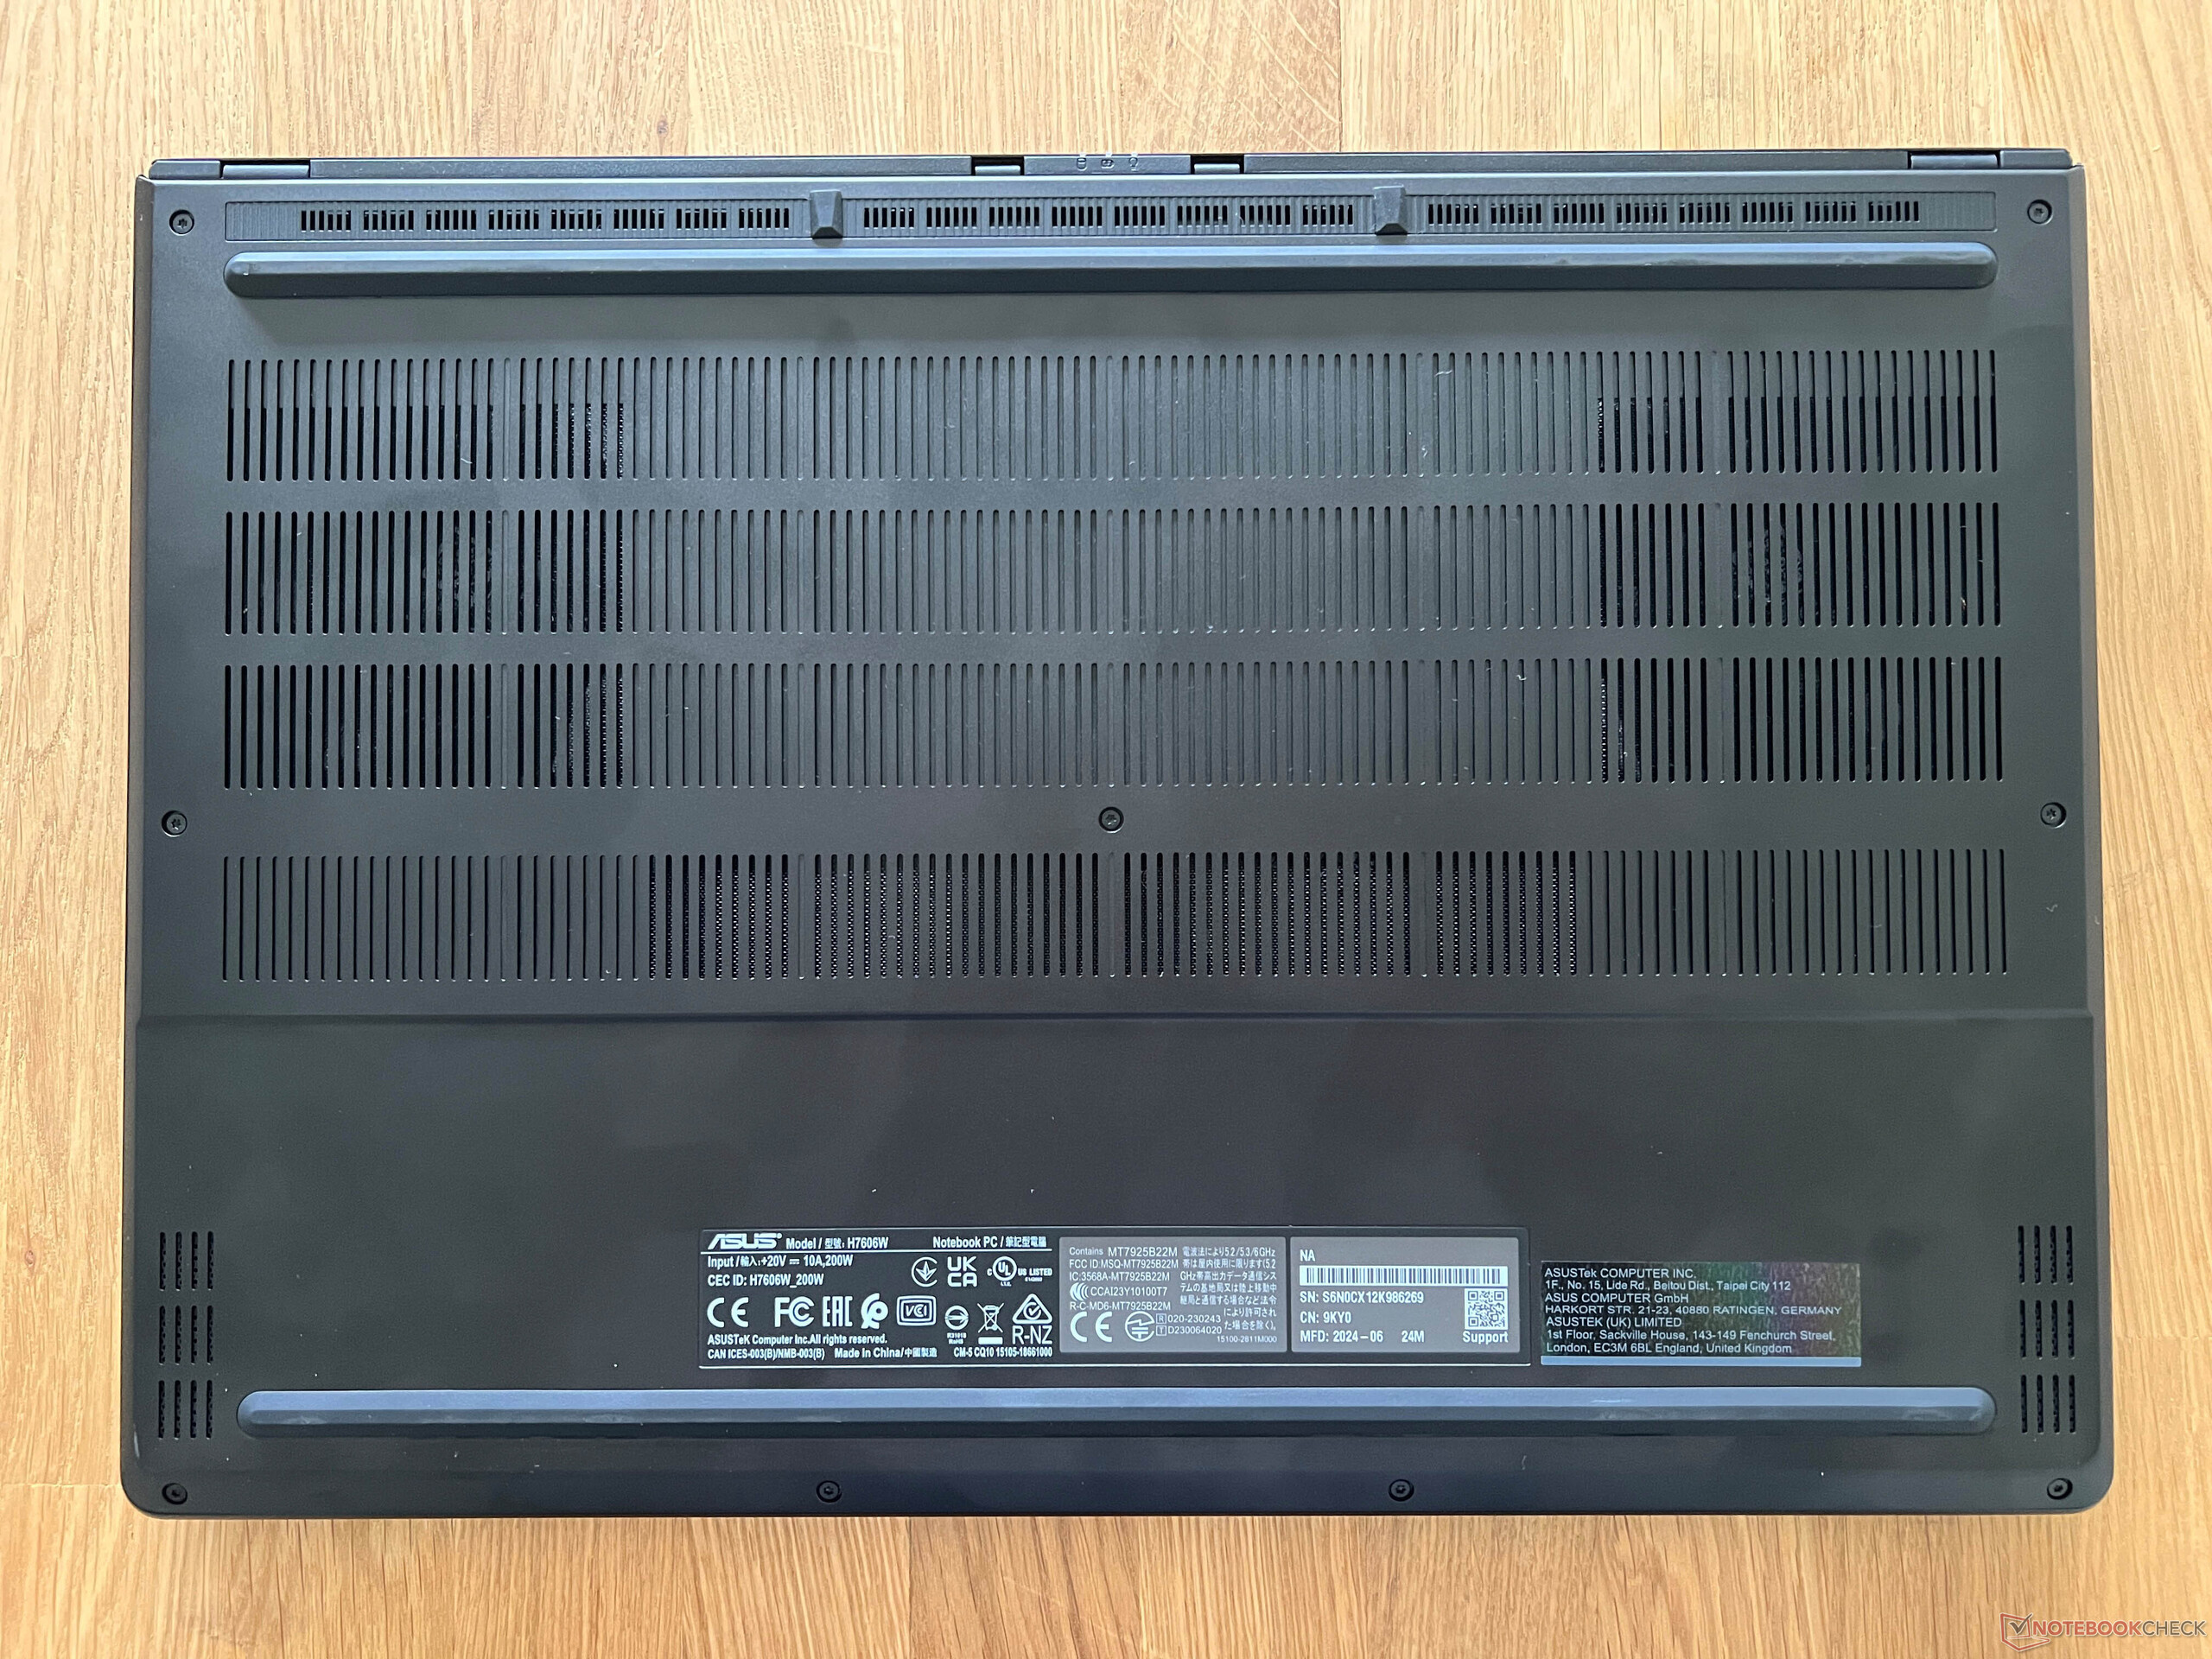
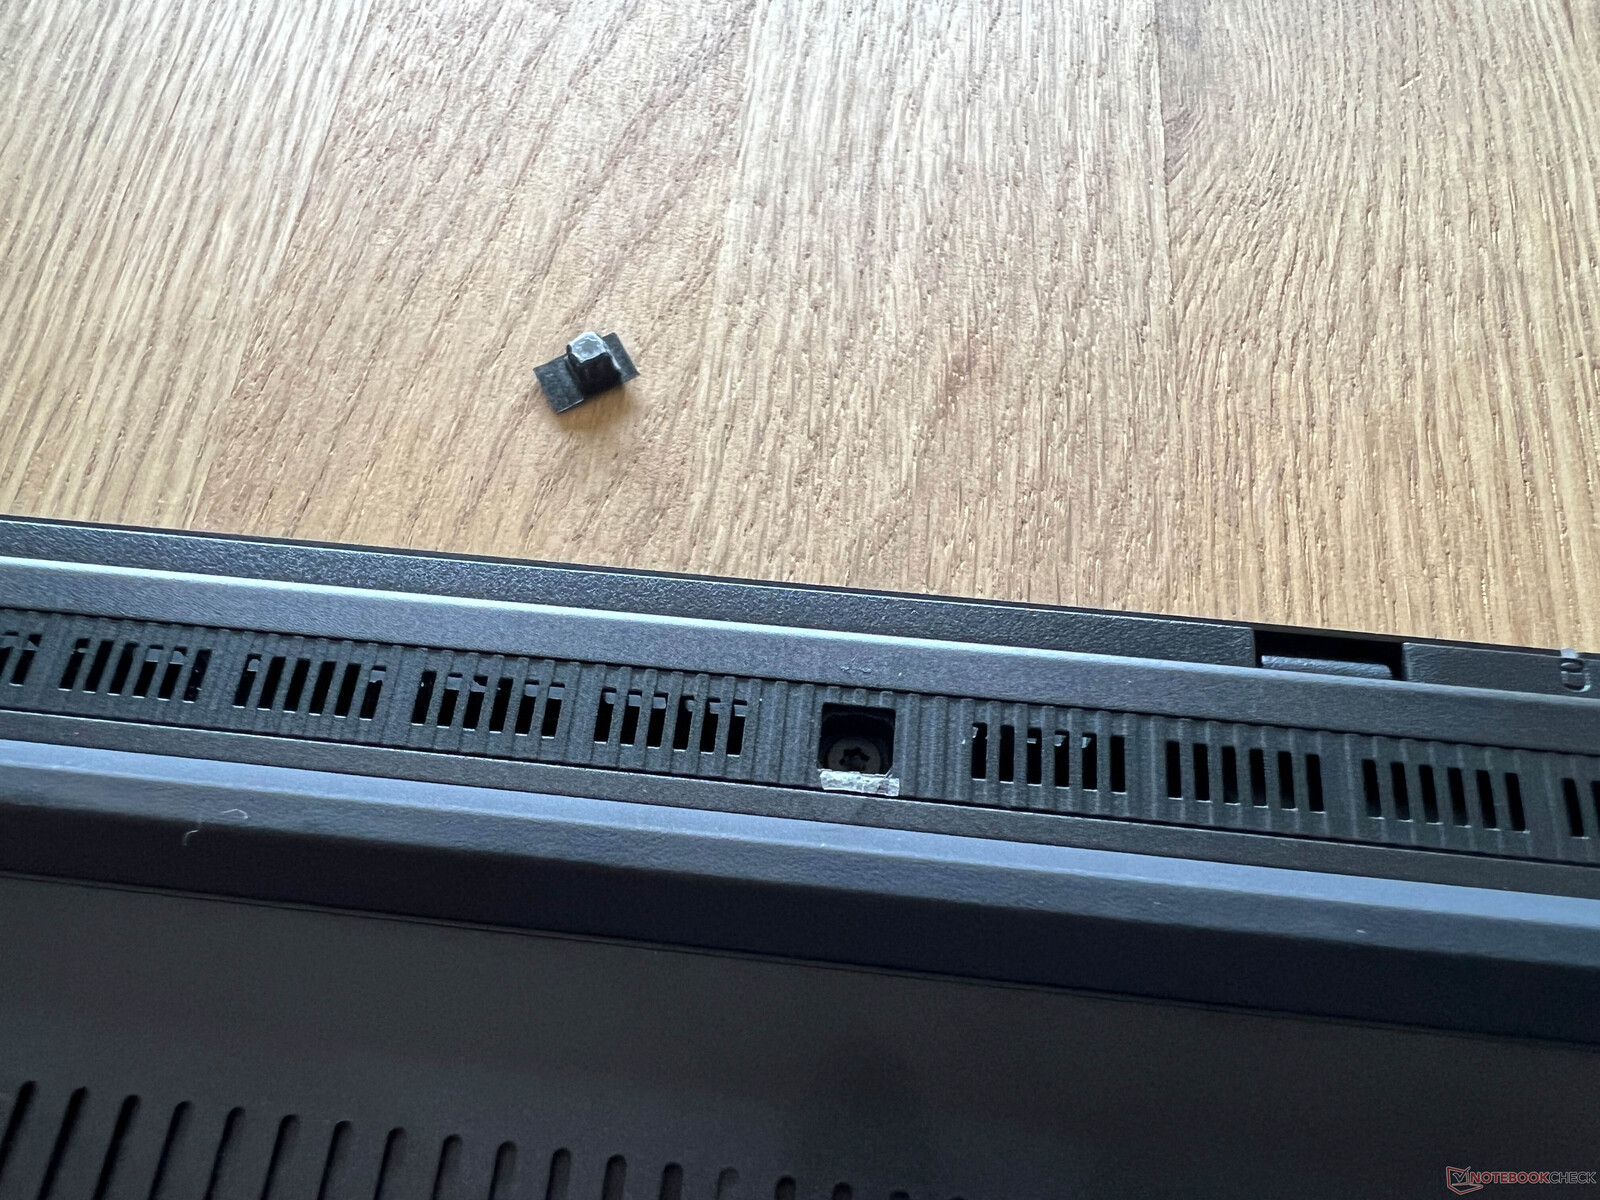
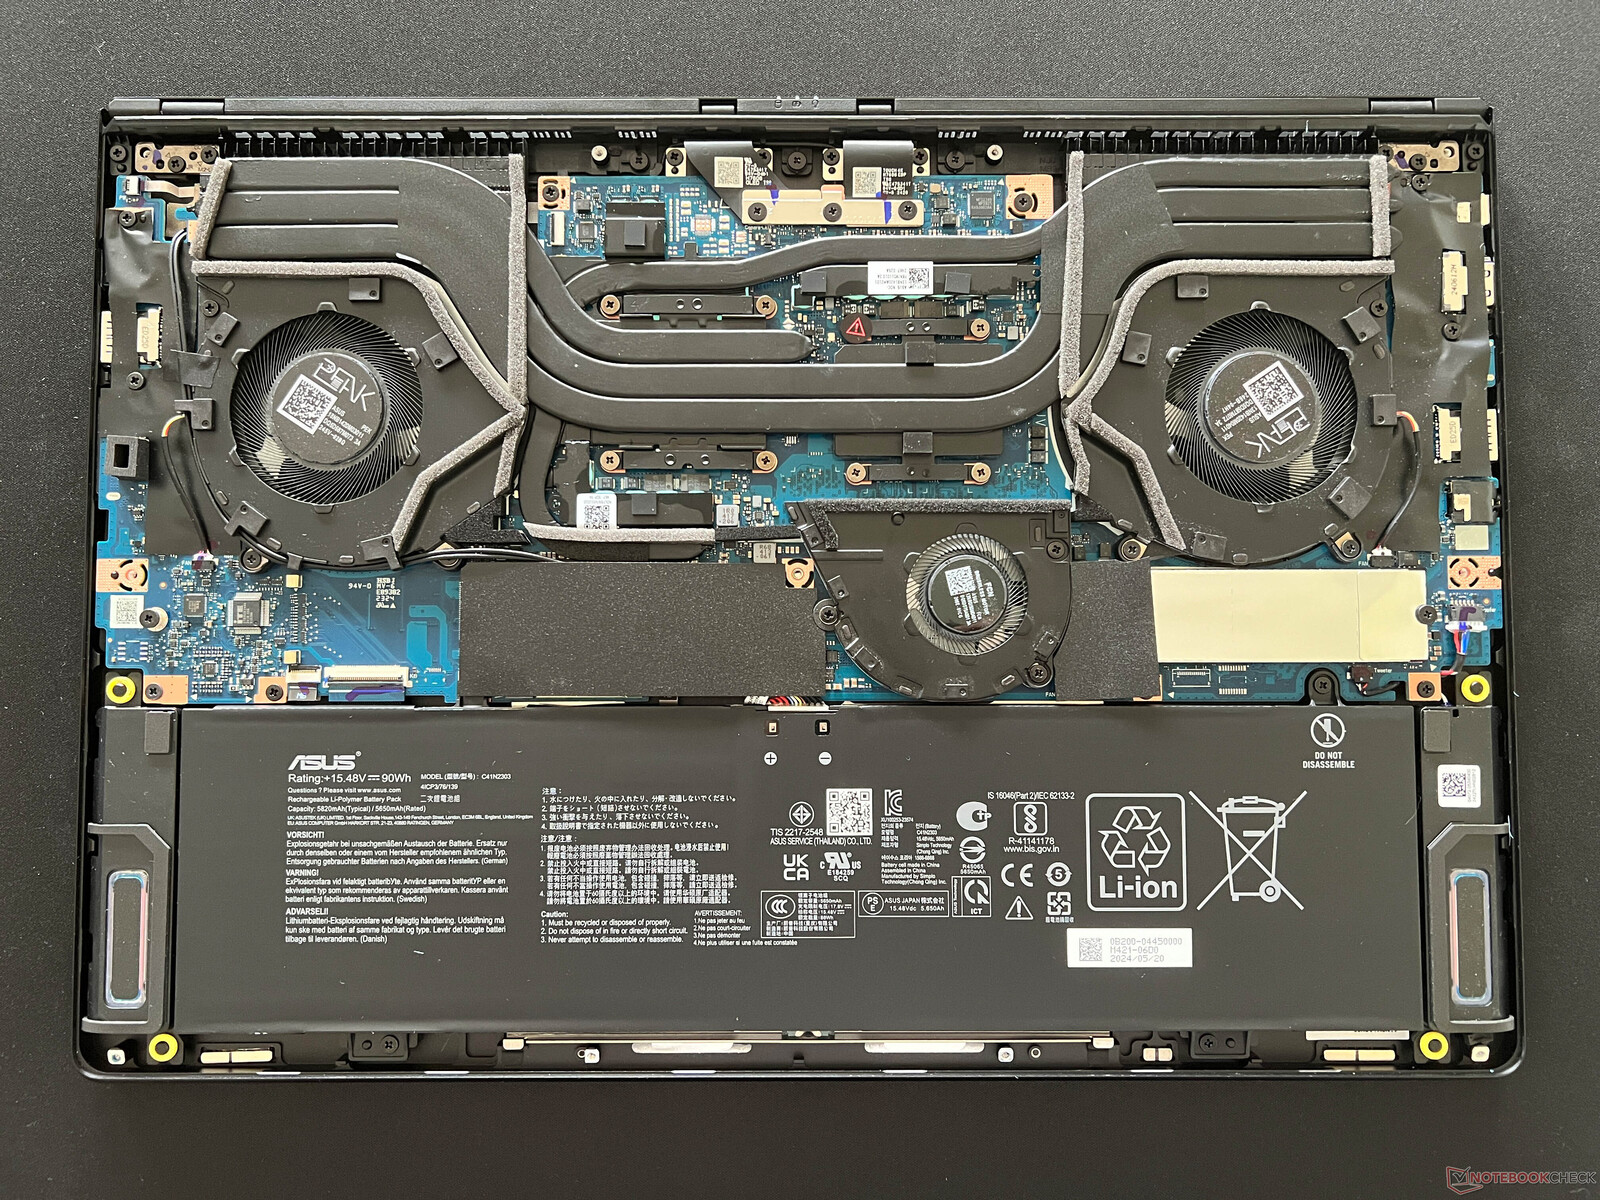
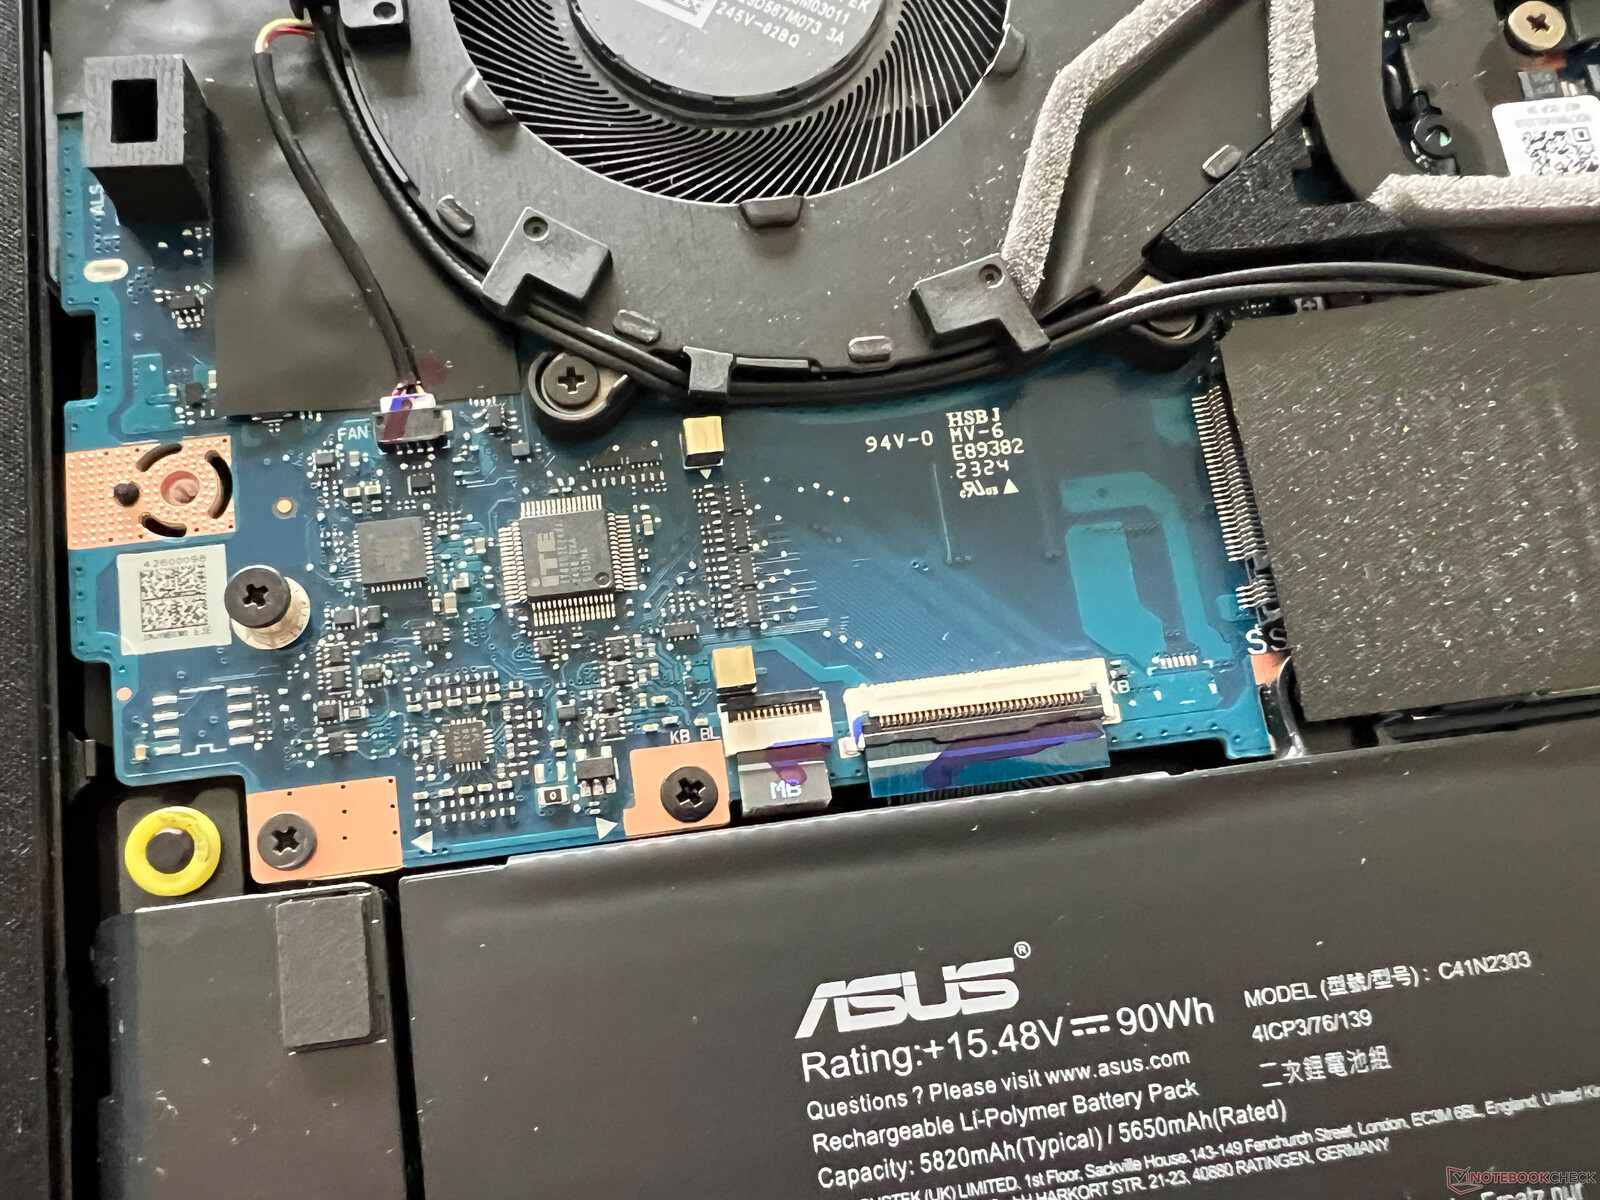
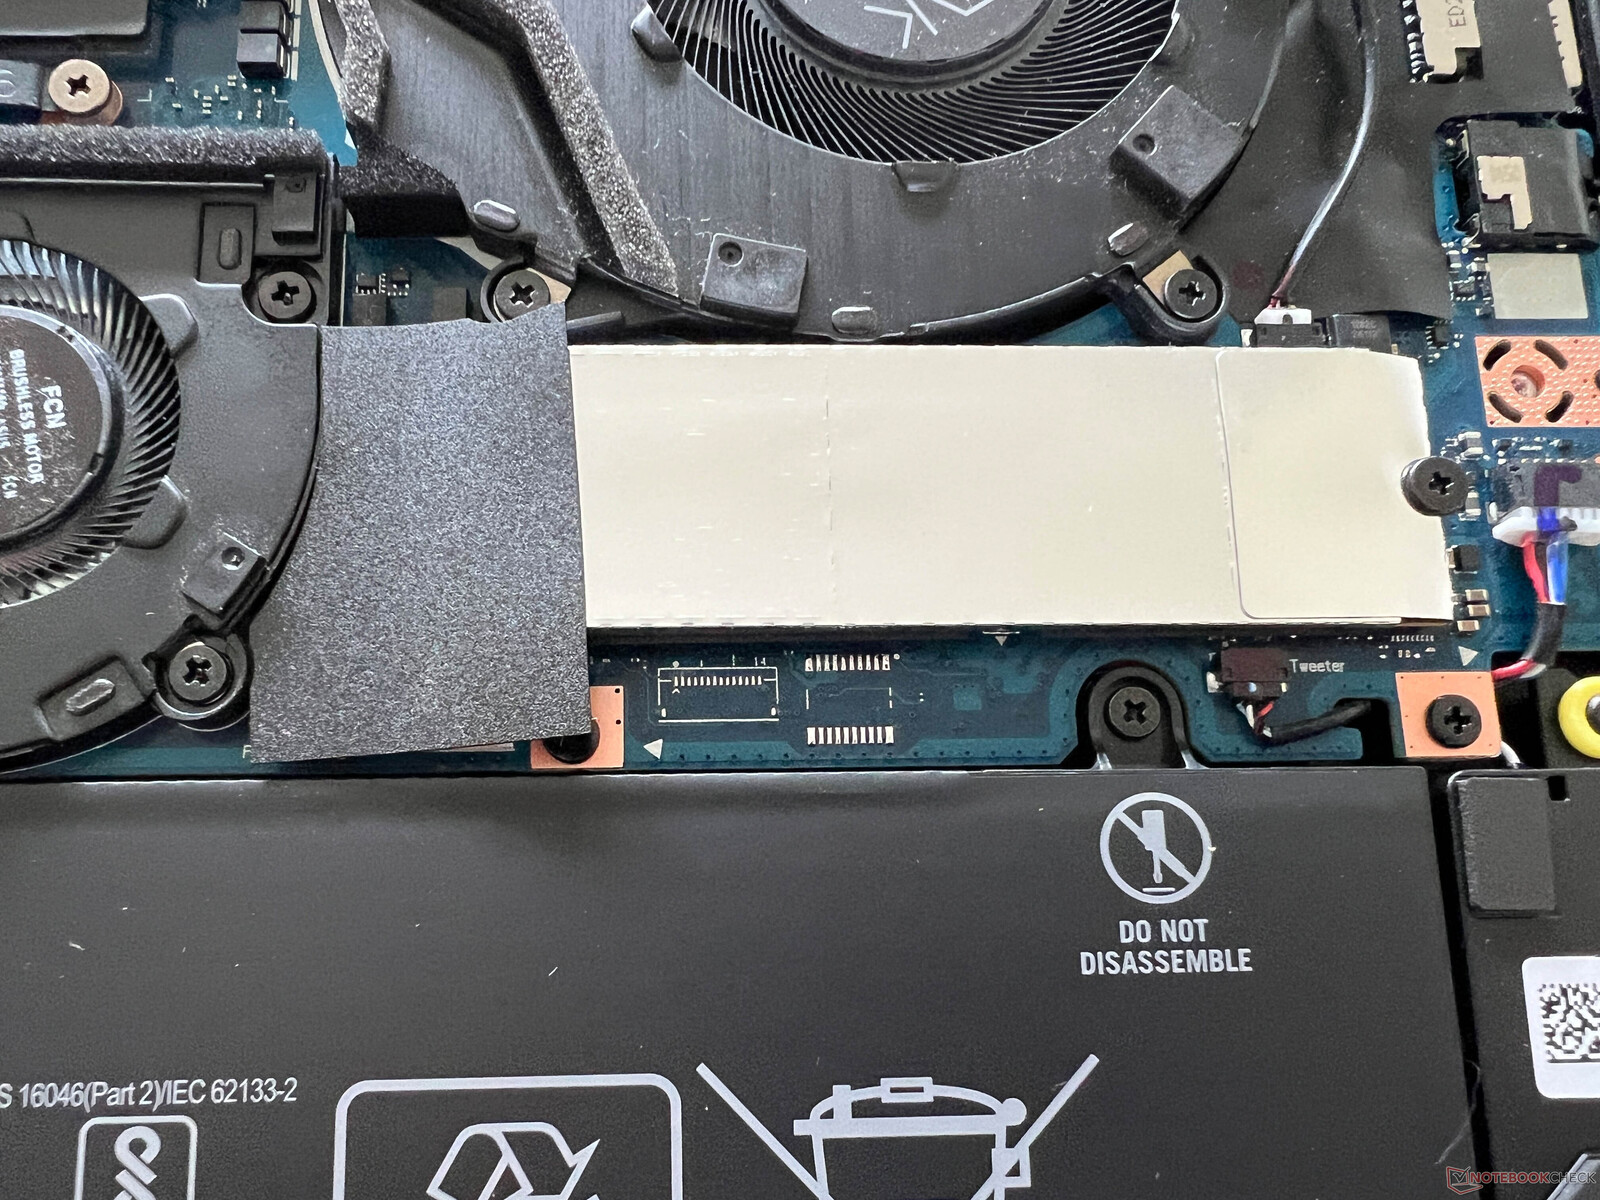
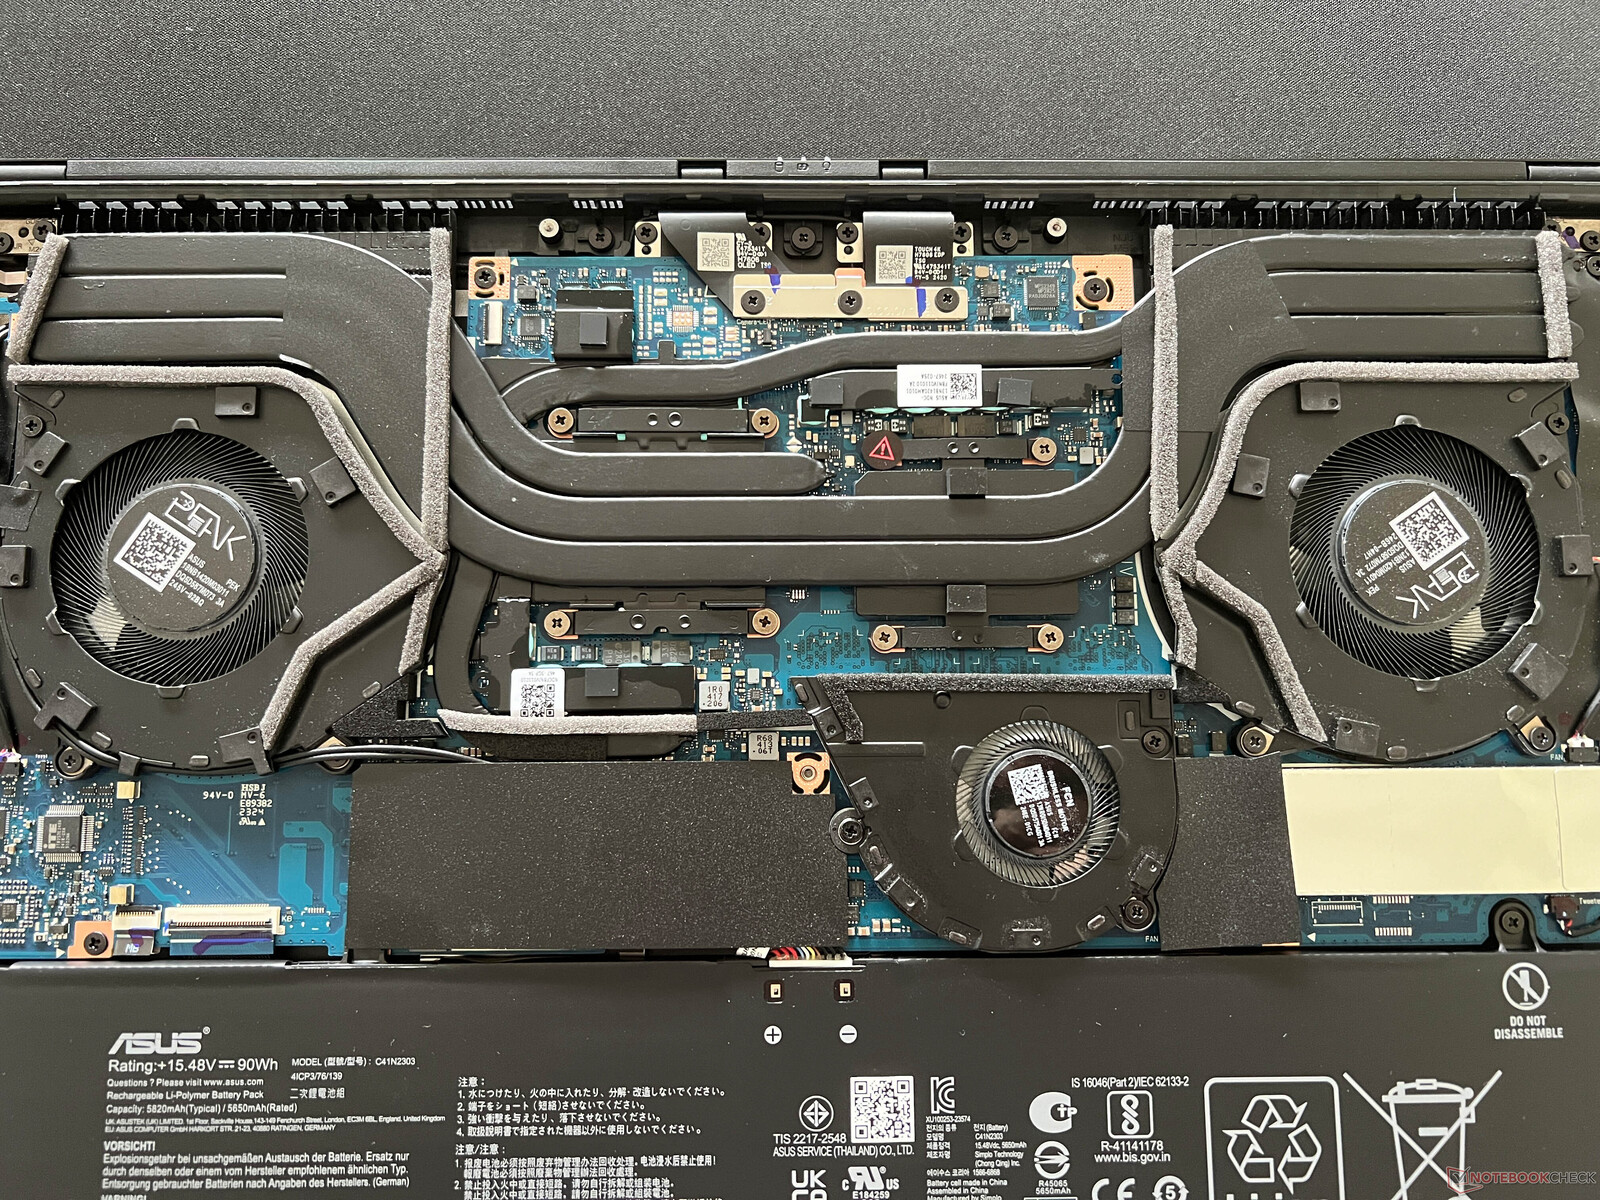
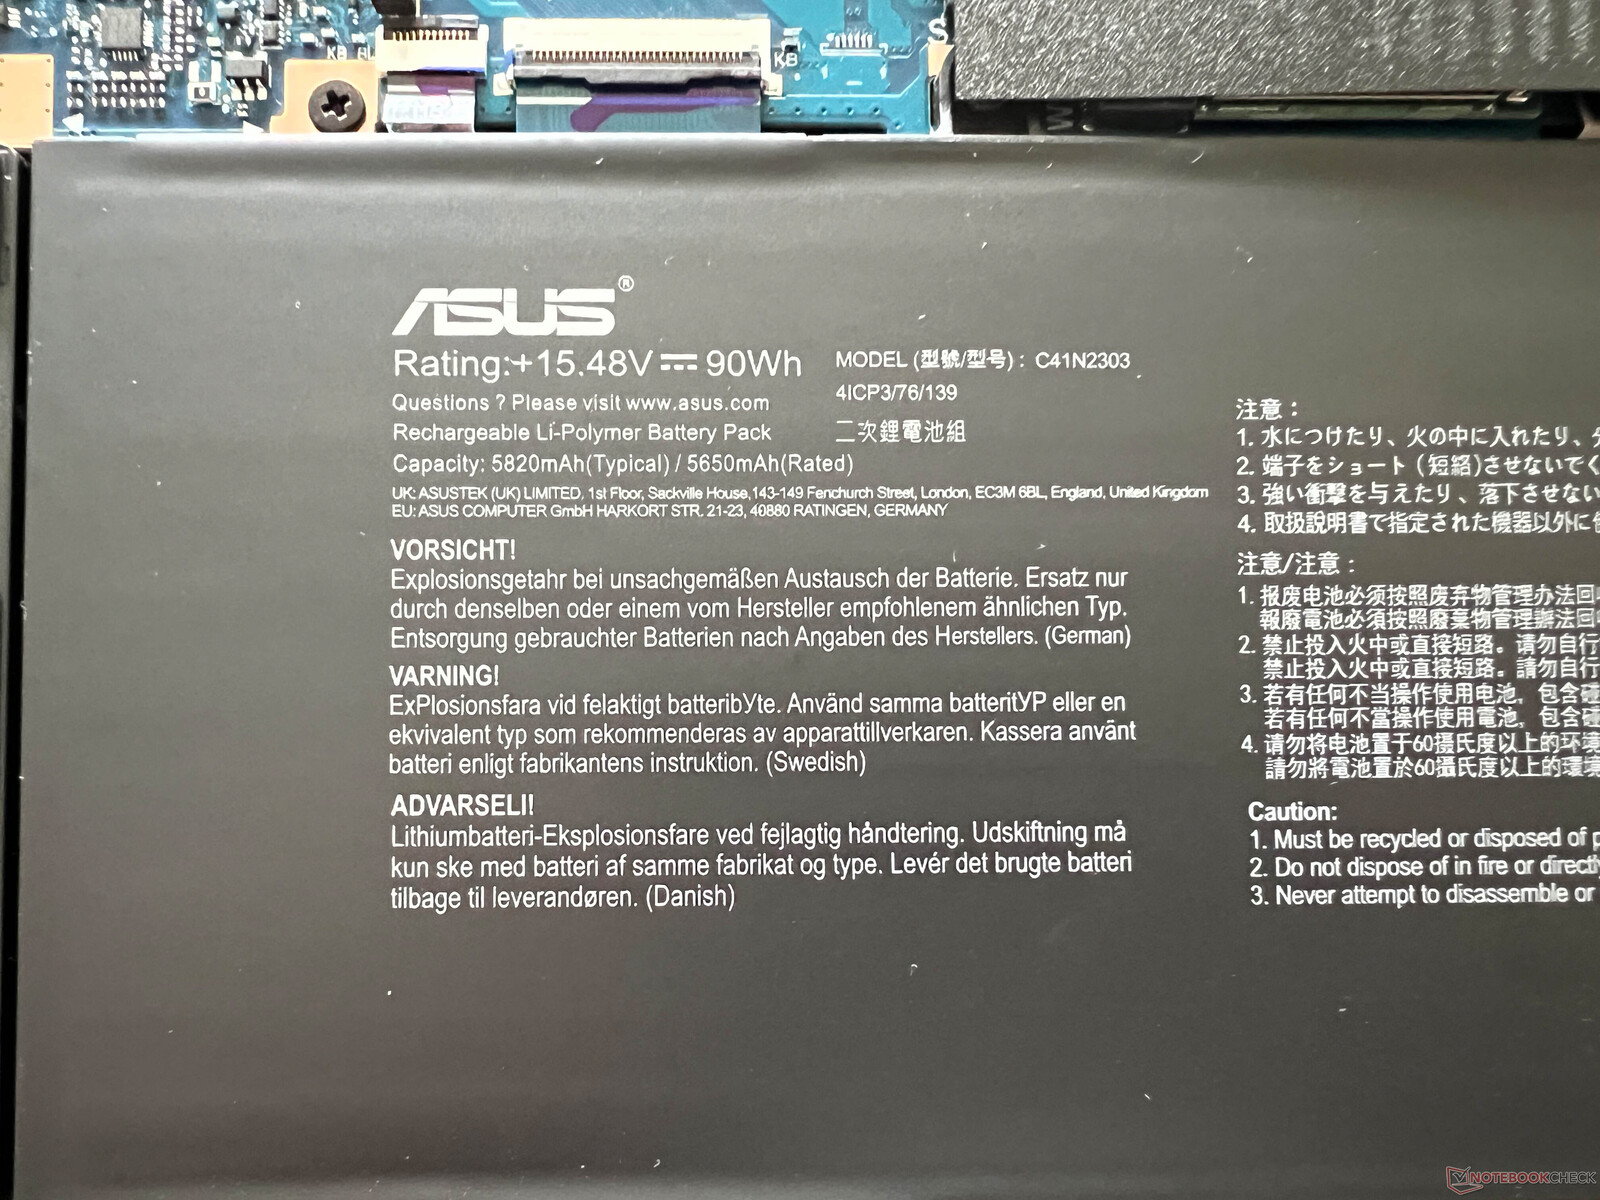
Bileşenlere erişim, yapıştırılmış kauçuk kapakların altında bulunan iki gizli vida ile daha da zorlaştırılmıştır. Daha zayıf Zephyrus G16 modellerinde (RTX 4070 dizüstü bilgisayara kadar) görüldüğü gibi, cihaz üçüncü bir küçük ek fan ile geleneksel bir soğutma sistemine sahiptir. RAM lehimlenmiş ancak iki adet M.2 2280 SSD yuvasının yanı sıra her ikisi de değiştirilebilen bir Wi-Fi modülü var. Pil vidalıdır ve gerektiğinde değiştirilebilir.
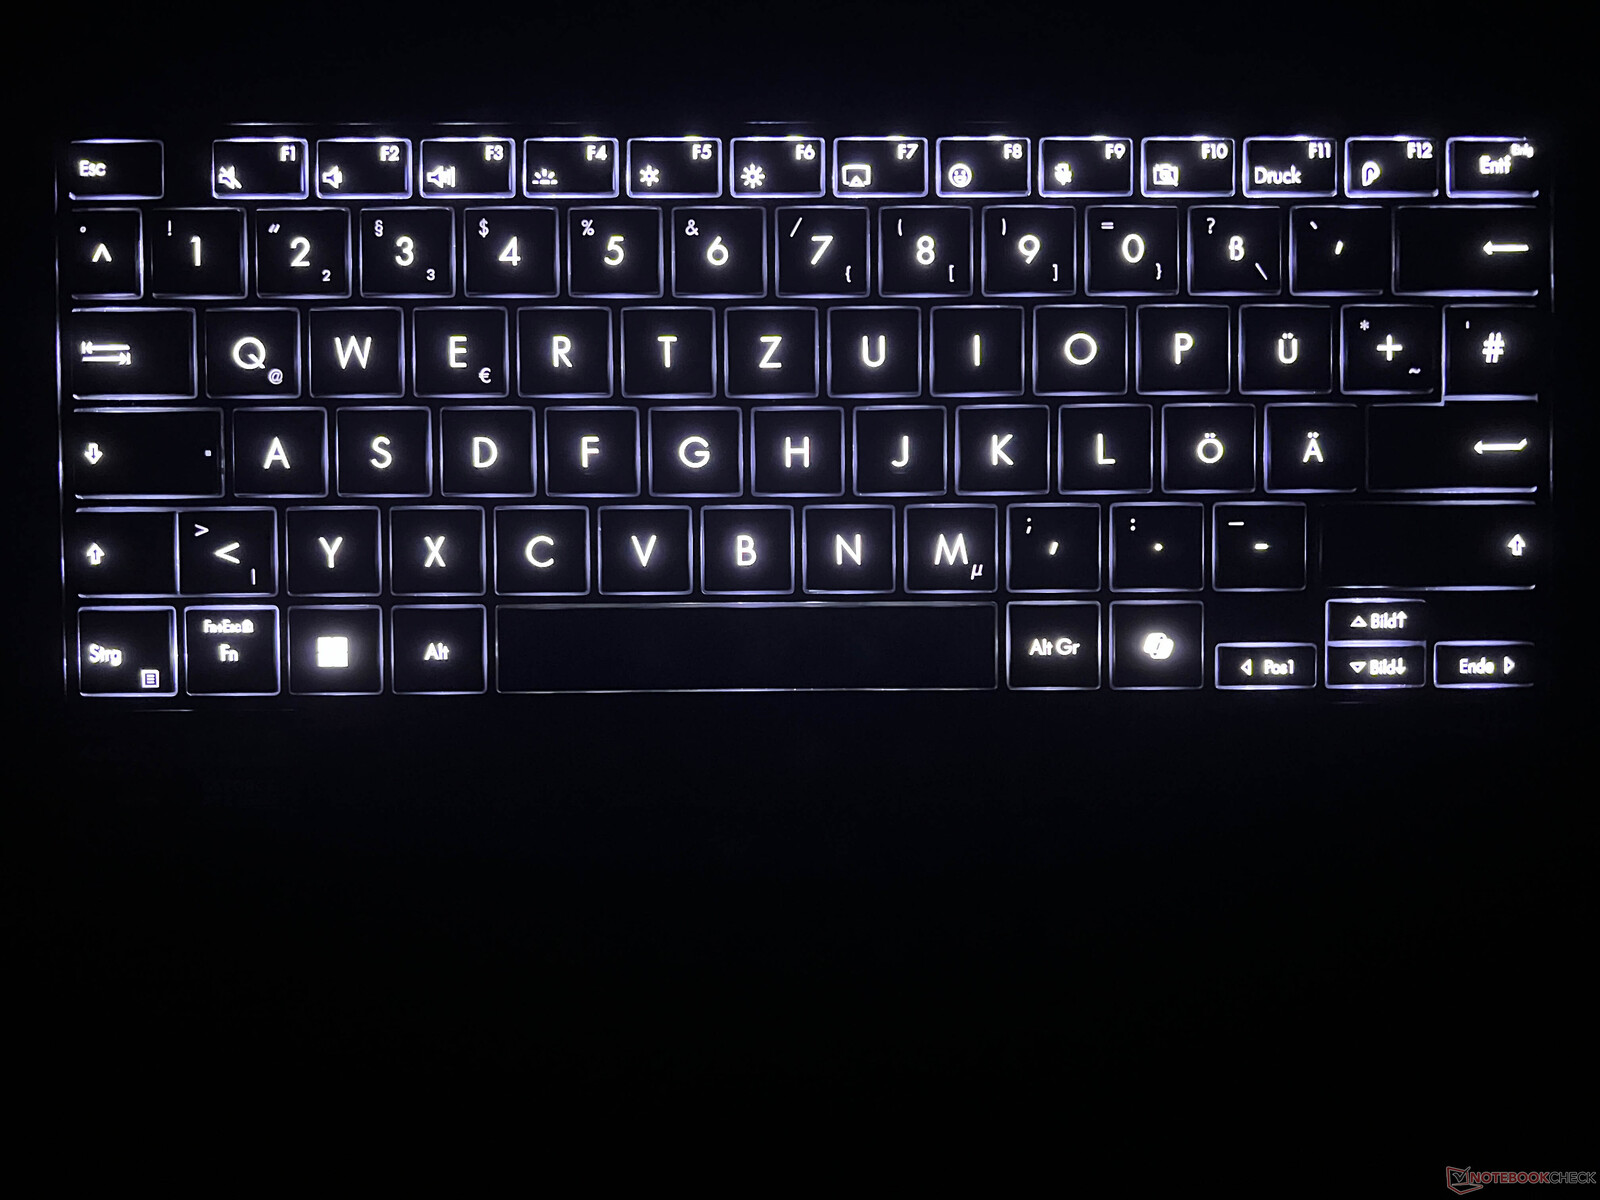
Giriş cihazları - 1,7 mm tuş hareketi ve DialPad
Ek fonksiyon tuşlarının olmaması dışında klavye Zephyrus G16'dan farklı değildir ve 1,7 mm tuş hareketi sayesinde dizüstü bilgisayar segmentindeki en rahat klavyelerden birine sahip olursunuz. RGB aydınlatma da eksik ancak beyaz aydınlatma bir sensör aracılığıyla otomatik olarak ayarlanabiliyor. Tek satırlı enter tuşu ve küçük ok tuşları ideal olmadığı için düzen mükemmel değil.
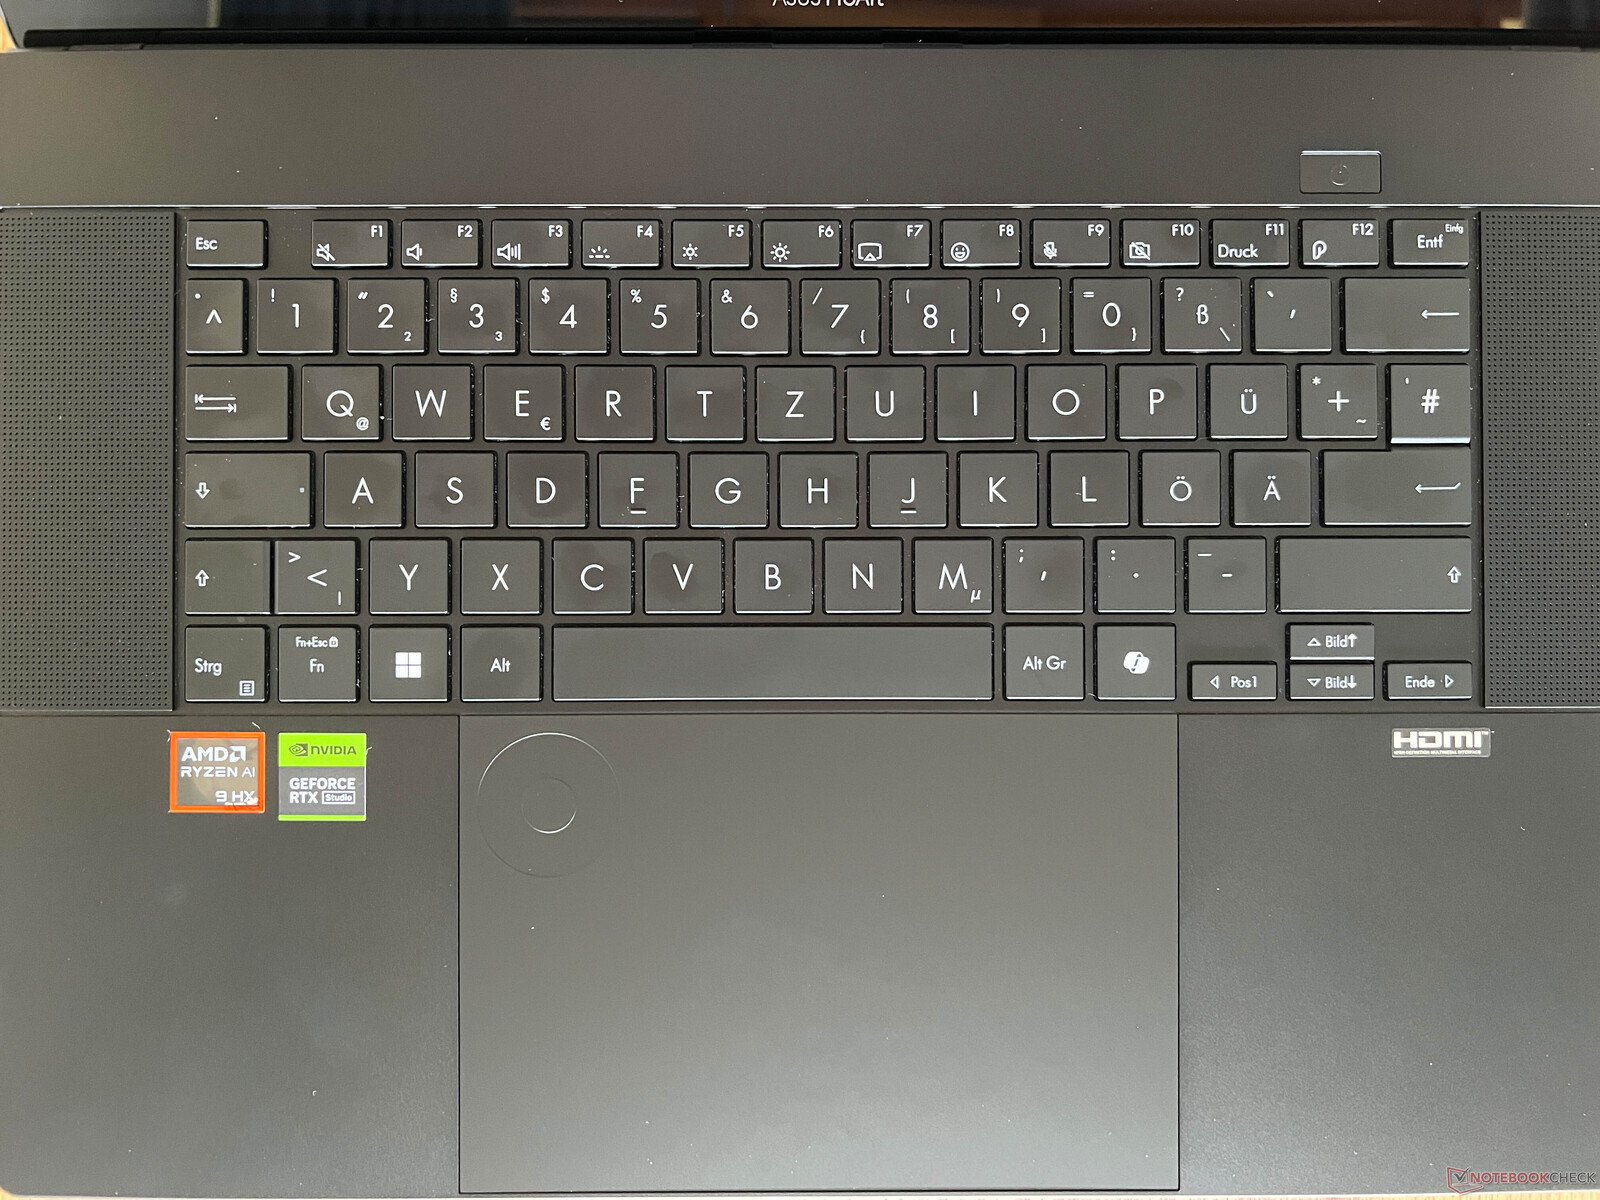
15 x 9,8 cm boyutlarındaki clickpad çok büyük ve imleç üzerinde gezinmek çok iyi çalışıyor. Buna ek olarak, mekanik tıklamalar hoş bir şekilde sessiz ve cihaza birinci sınıf bir his veriyor. DialPad dokunmatik yüzeyin sol üst kısmına entegre edilmiş ve bu da çok iyi çalışıyor. Ne kadar kullanışlı olduğu, büyük ölçüde kadranı kullanmada ne kadar yetenekli olduğunuza bağlıdır. Büyük ped sayesinde DialPad bizi küçük ped kadar rahatsız etmedi ProArt PX13gerçek yaşam koşullarında.
Elbette, ProArt'ın girişler için kapasitif bir dokunmatik ekranı da var ve bu da sorunsuz çalıştı. Birlikte verilen Asus Pen 2.0 sorunsuz çalıştı ancak kalemi kasaya takmak için bir yer yok.
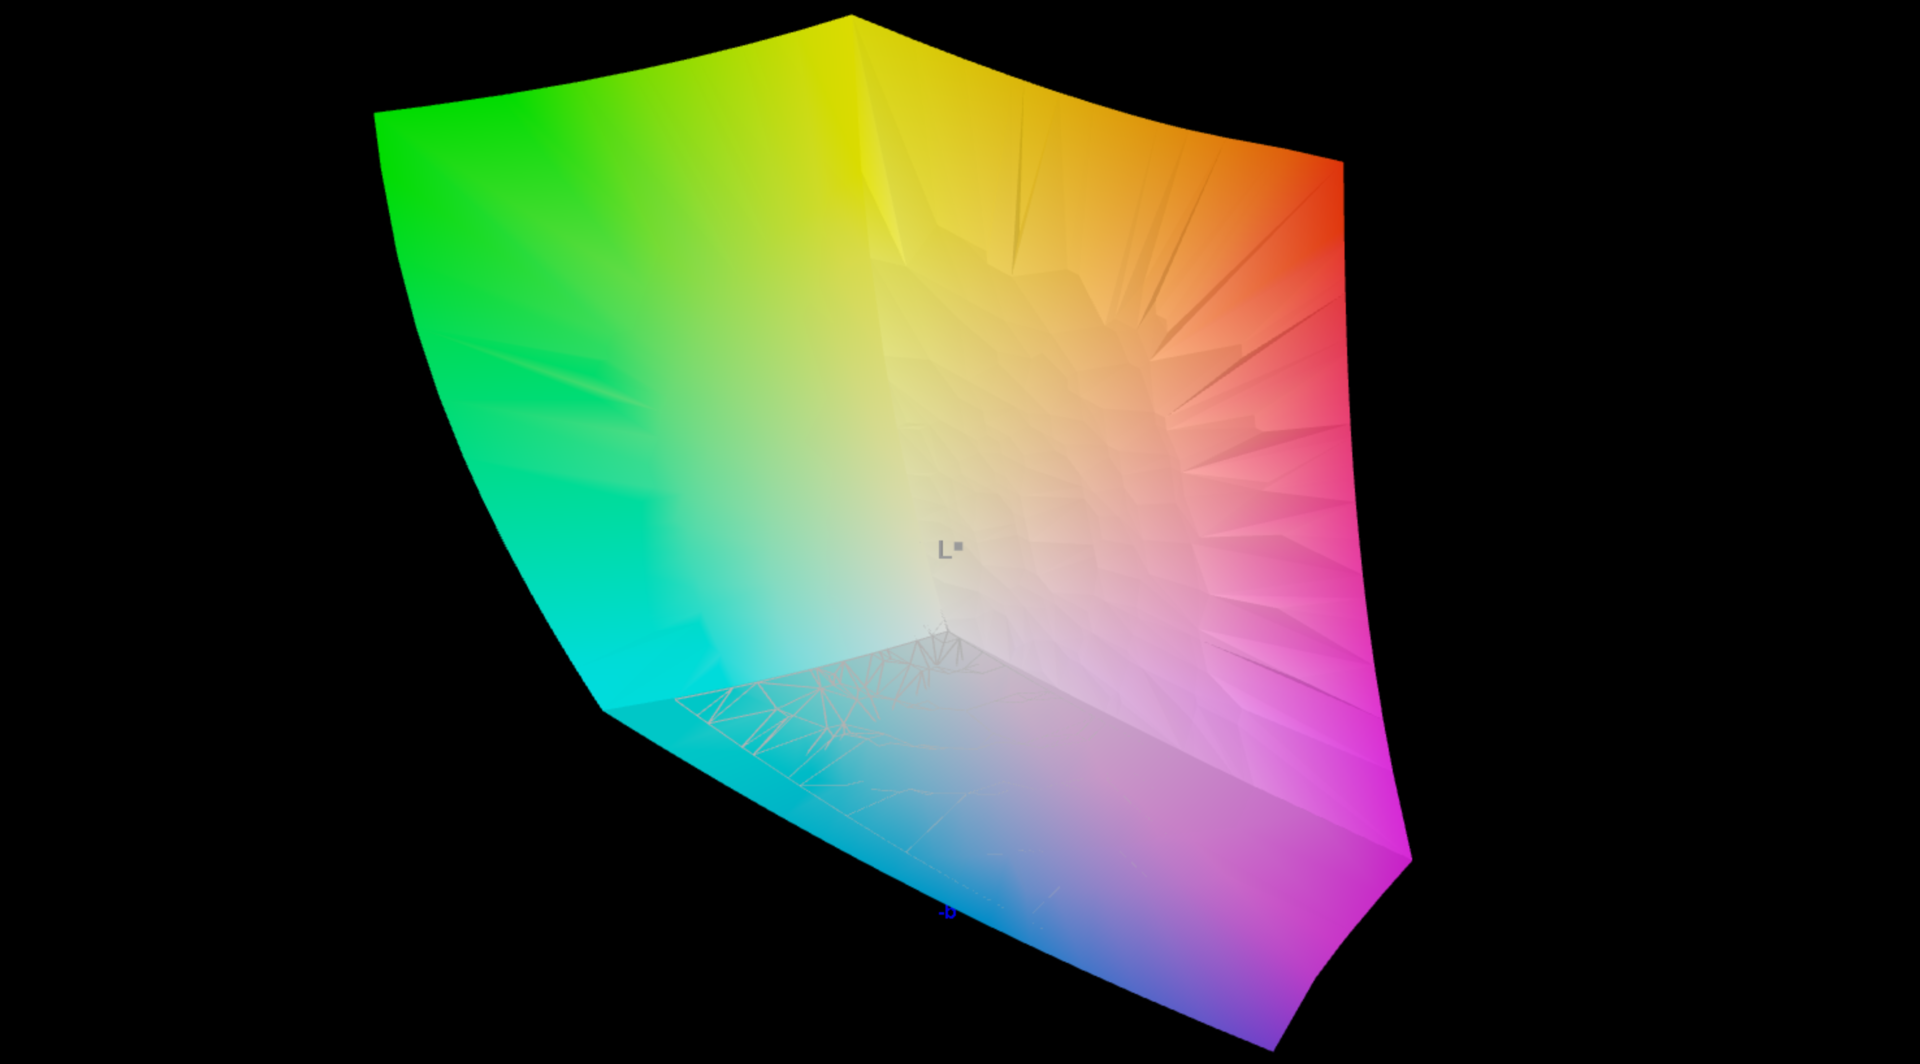
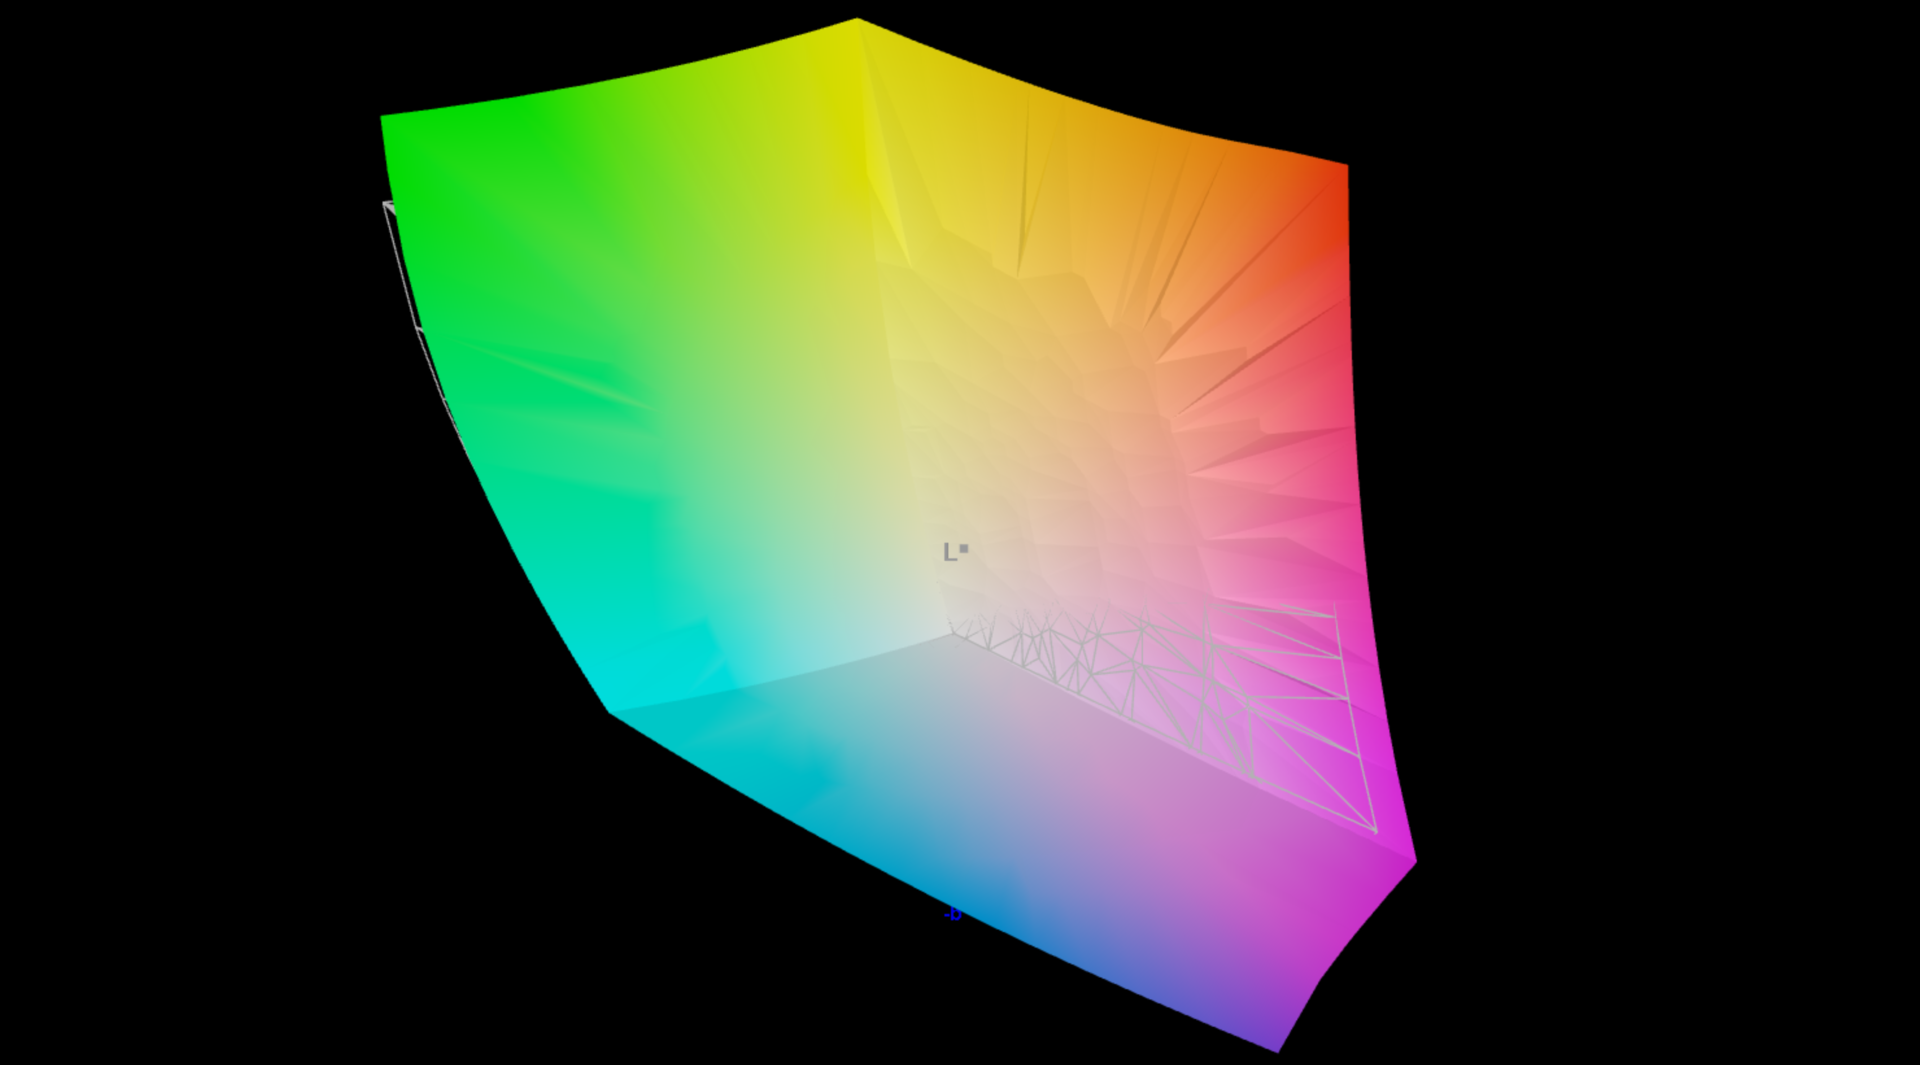
Ekran - 60 Hz'de 4K OLED
Asus, ProArt P16'yı 3.840 x 2.400 piksel çözünürlüğe ve 16:10 en boy oranına sahip bir OLED dokunmatik ekranla donattı. XPS 16 ile birlikte bu, karşılaştırma alanındaki en yüksek çözünürlük ve tüm içerikler çok keskin görünüyor. Bununla birlikte, parlak alanlar biraz grenli görünüyor (ekranın nemli olduğu izlenimine kapılıyorsunuz) ancak sorun, örneğin Dell XPS 16. En büyük sorun sadece 60 Hz'de kalan frekans. Bu, hareket halinde fark edilir ve biraz daha yüksek çözünürlüğe rağmen, bu eski modele kıyasla geri bir adımdır Zenbook Pro 16X 120 Hz OLED (3.200 x 2.000 piksel) ile geldi.
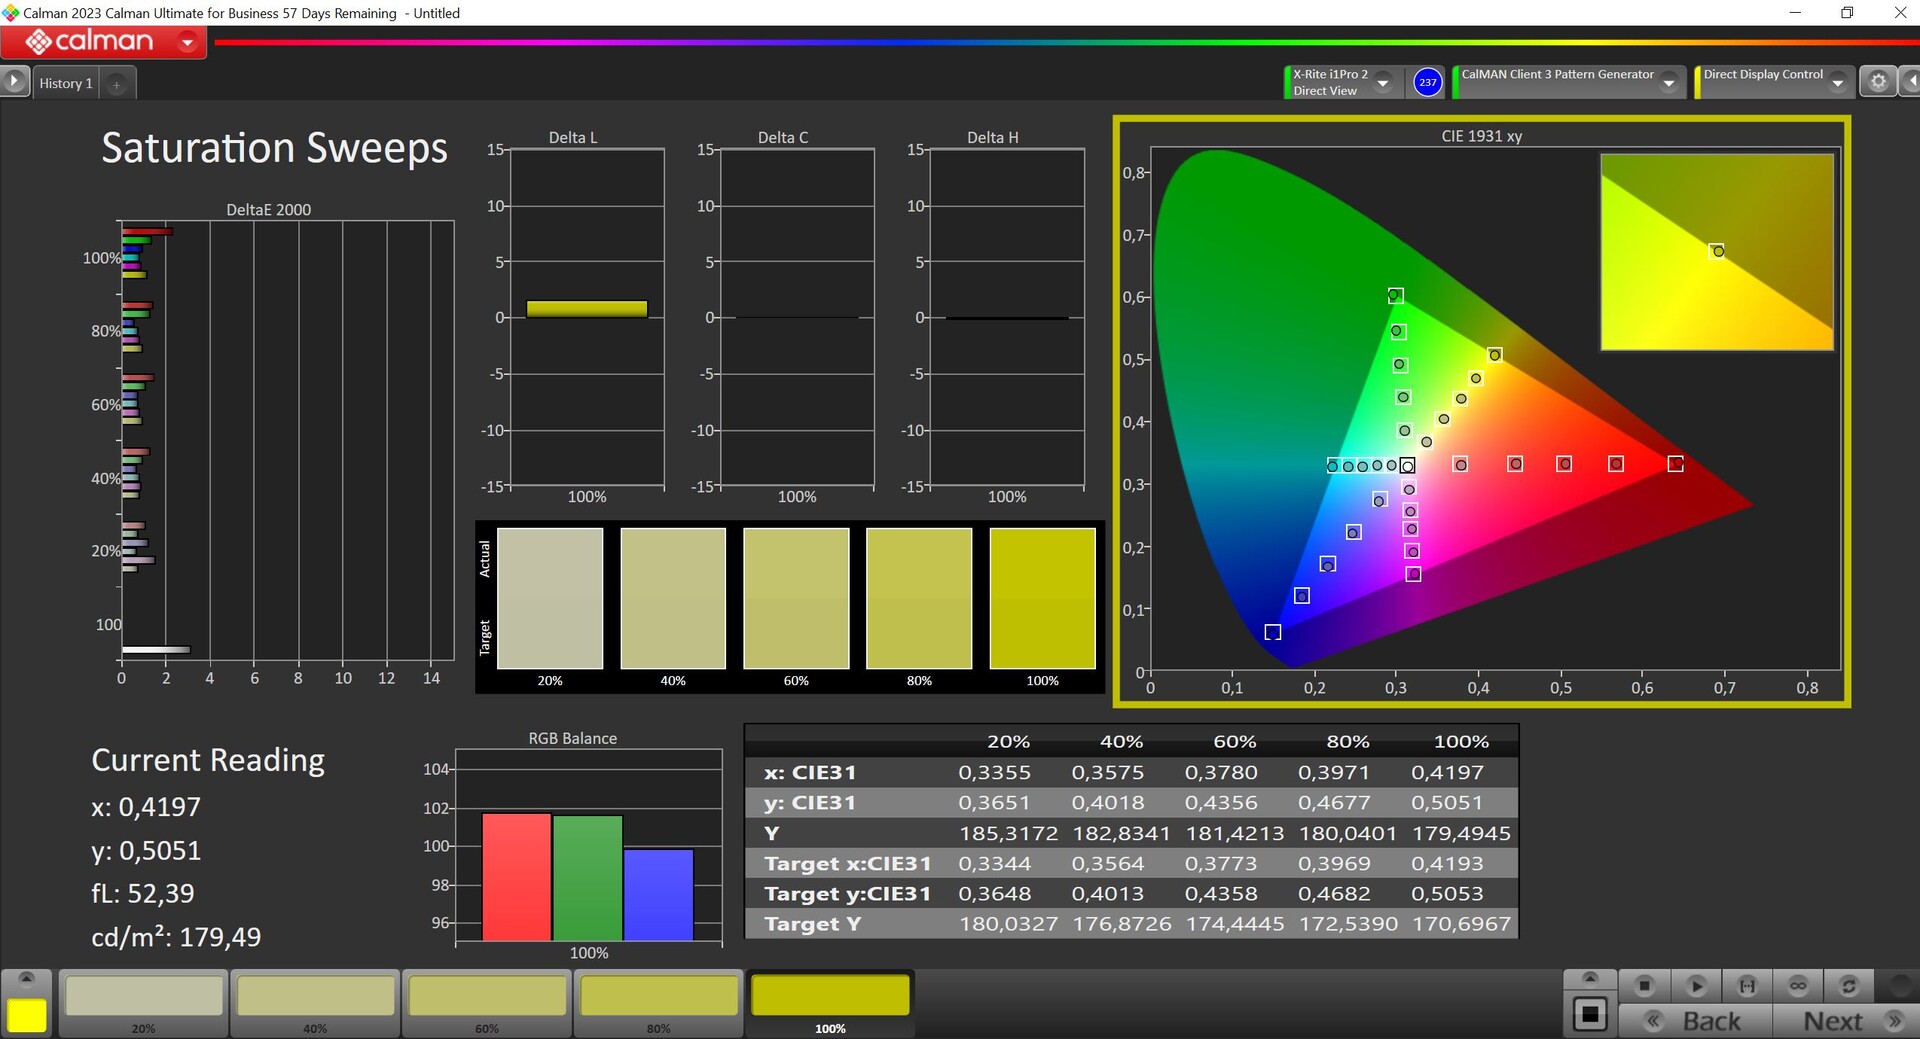
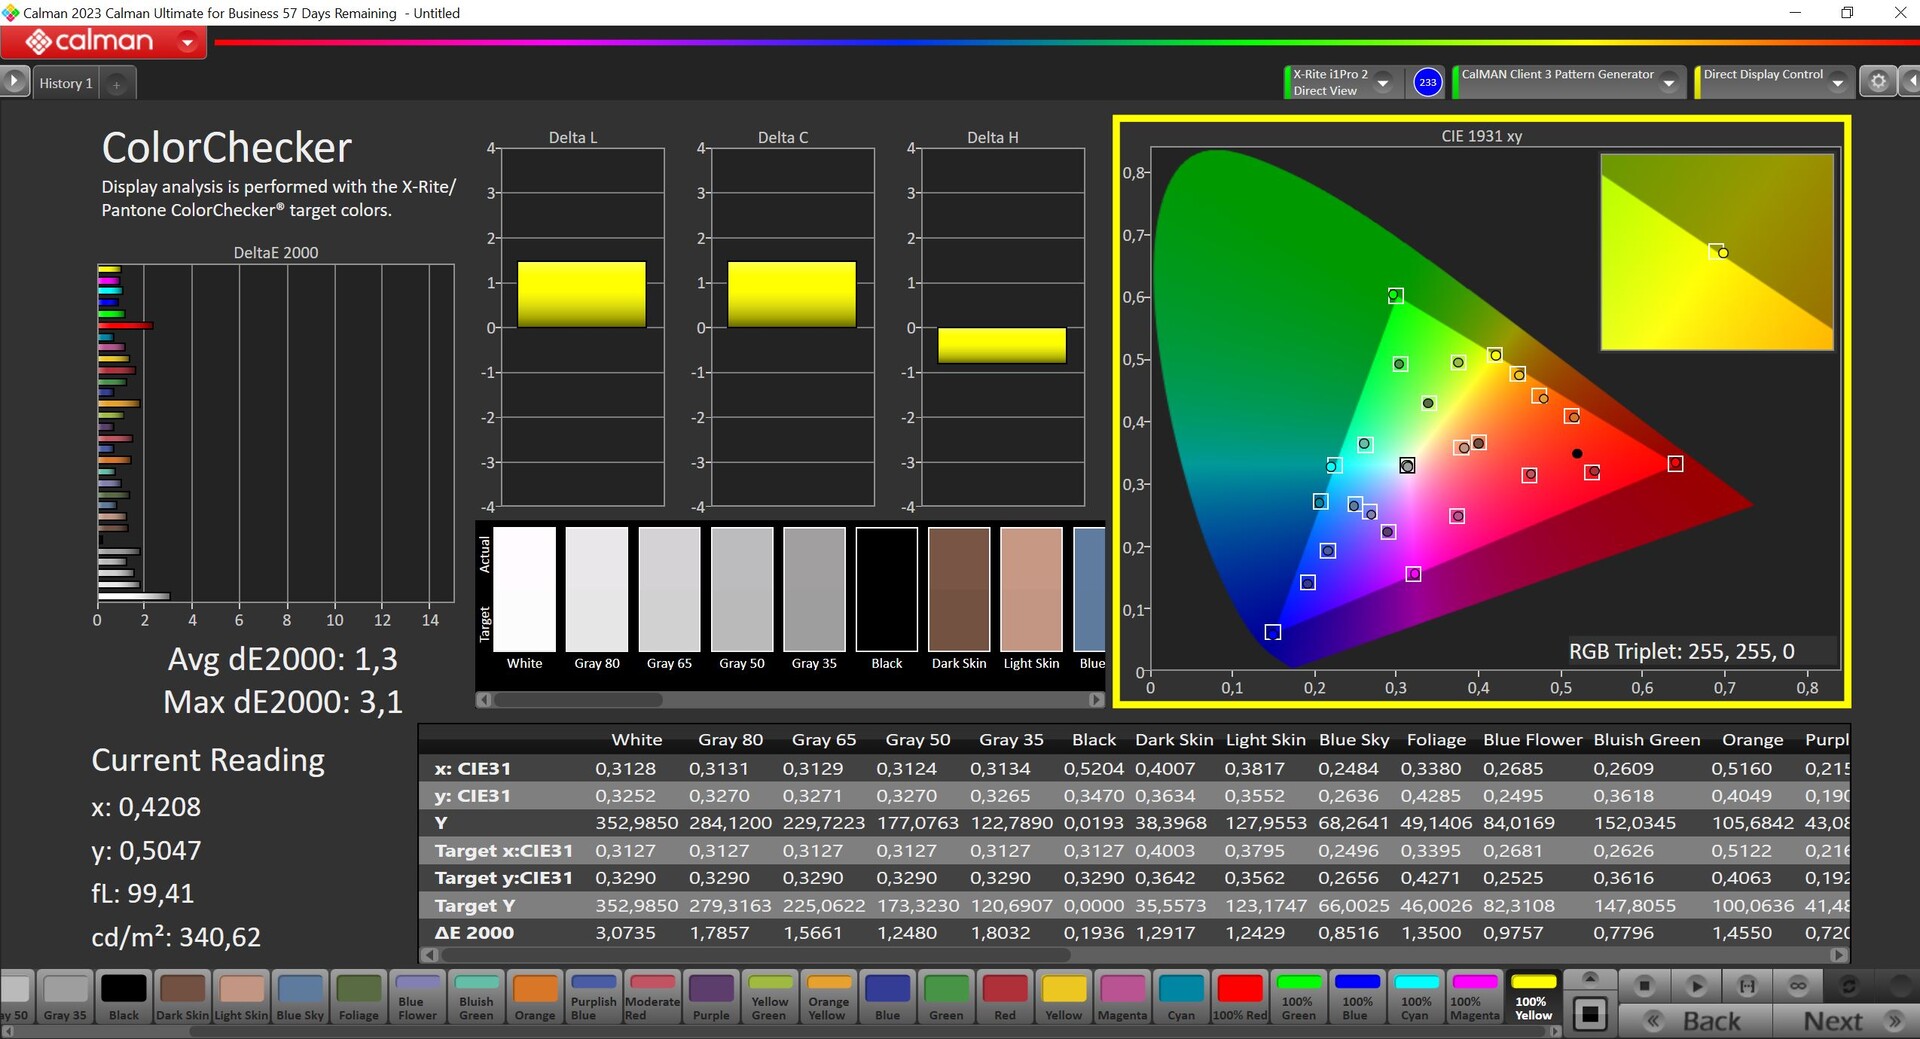
SDR modunda panel ortalama 360 cd/m² parlaklığa sahip ve düşük siyah seviyesiyle birlikte bu harika bir kontrast oranıyla sonuçlanıyor. HDR modunda (bunun hala Windows'ta manuel olarak etkinleştirilmesi gerekiyor ve renk profilleri artık çalışmıyor), ekranın küçük bir alanında maksimum 605 cd/m² ve neredeyse tamamen beyaz bir görüntü ile sadece 420 cd/m² ölçtük - oldukça düşük bir rakam.
| |||||||||||||||||||||||||
Aydınlatma: 98 %
Batarya modunda parlaklık: 355 cd/m²
Kontrast: ∞:1 (Siyah: 0 cd/m²)
ΔE Color 1.2 | 0.5-29.43 Ø4.87
ΔE Greyscale 1.2 | 0.5-98 Ø5.1
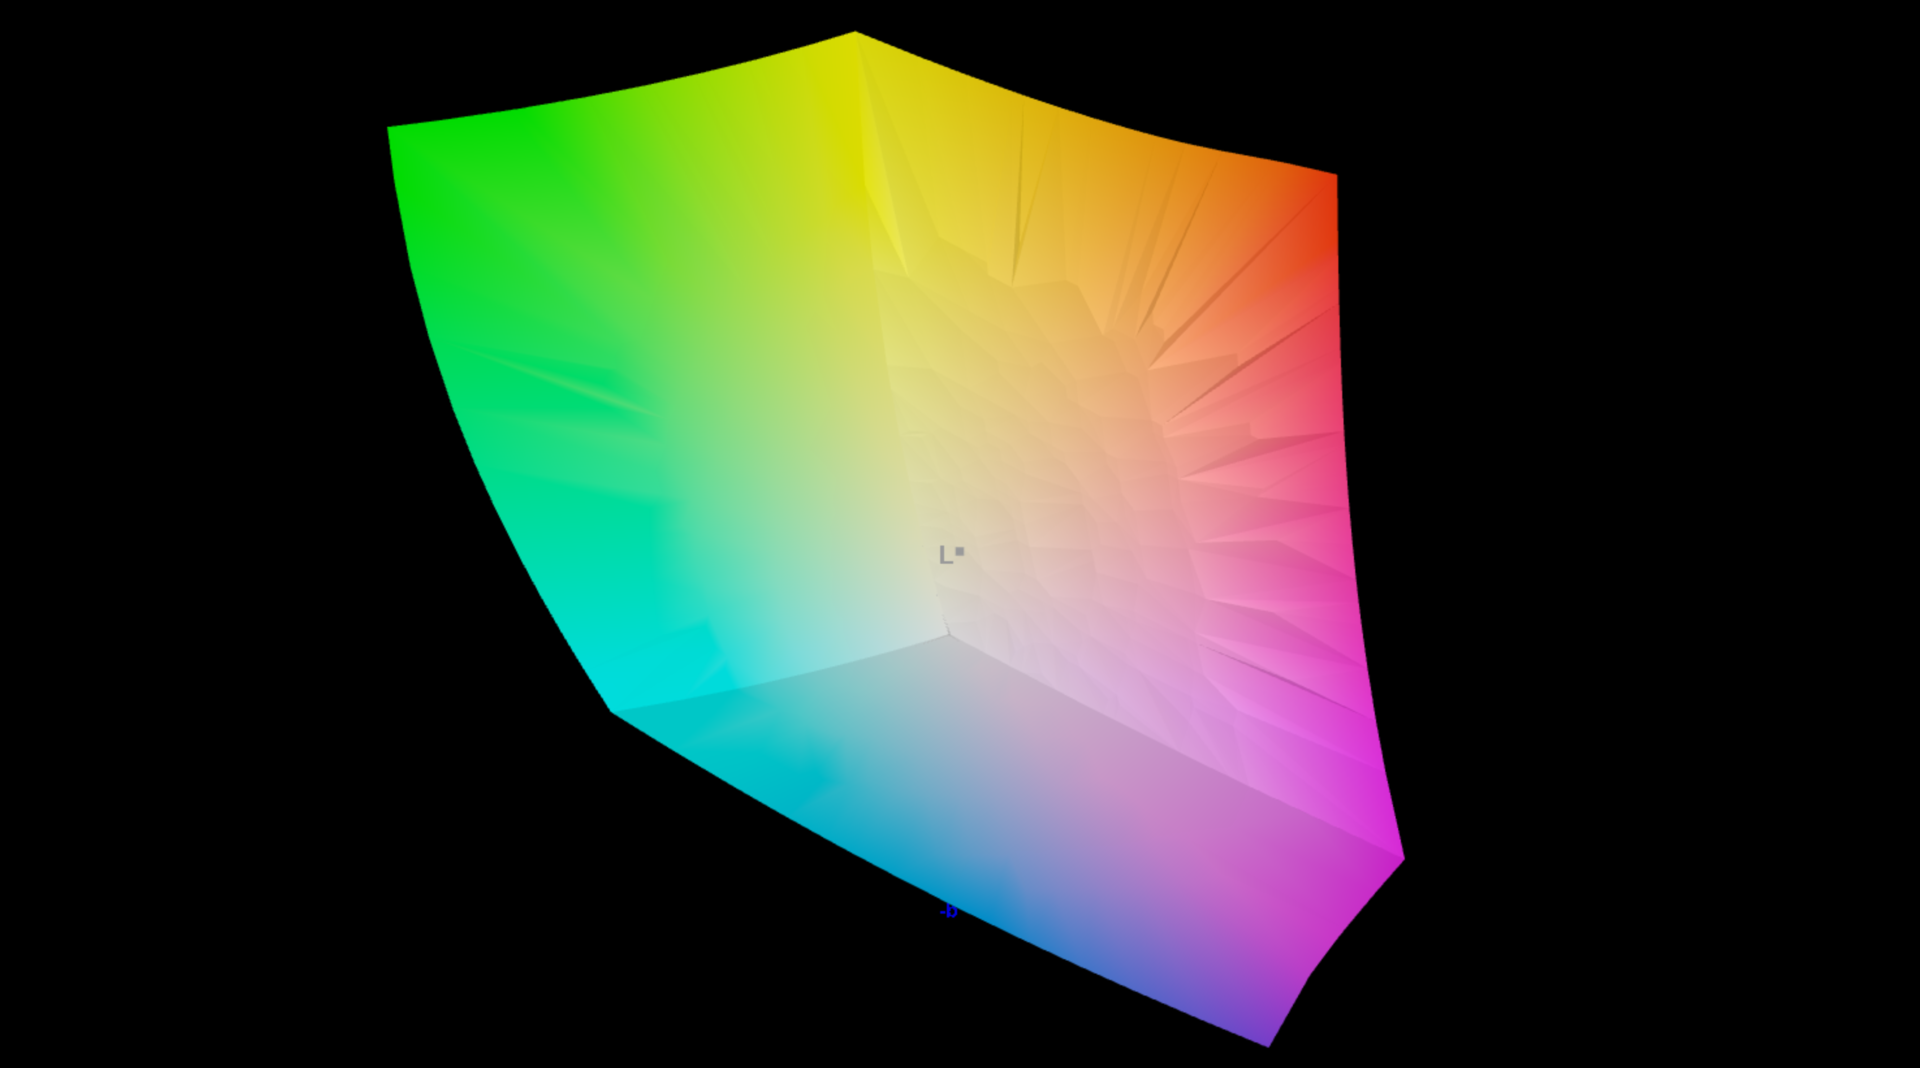
99.1% AdobeRGB 1998 (Argyll 2.2.0 3D)
100% sRGB (Argyll 2.2.0 3D)
99.9% Display P3 (Argyll 2.2.0 3D)
Gamma: 2.14
| Asus ProArt P16 H7606WI ATNA60YV02-0, OLED, 3840x2400, 16", 60 Hz | SCHENKER XMG Pro 16 Studio (Mid 24) BOE CQ NE160QDM-NZ1, IPS, 2560x1600, 16", 240 Hz | Lenovo Yoga Pro 9 16IMH9 LEN160-3.2K, Mini-LED, 3200x2000, 16", 165 Hz | Dell XPS 16 9640 SDC4196, OLED, 3840x2400, 16.3", 90 Hz | Asus ROG Zephyrus G16 2024 GU605M ATNA60DL01-0, OLED, 2560x1600, 16", 240 Hz | Apple MacBook Pro 16 2023 M3 Max Mini-LED, 3456x2234, 16", 120 Hz | Asus Zenbook Pro 16X UX7602BZ-MY005W ATNA60BX01-1, OLED, 3200x2000, 16", 120 Hz | |
|---|---|---|---|---|---|---|---|
| Display | -20% | -5% | -4% | -1% | -1% | -1% | |
| Display P3 Coverage | 99.9 | 68.8 -31% | 97 -3% | 98.3 -2% | 99.9 0% | 99.2 -1% | 99.93 0% |
| sRGB Coverage | 100 | 99.5 0% | 99.9 0% | 100 0% | 100 0% | 100 0% | |
| AdobeRGB 1998 Coverage | 99.1 | 70.8 -29% | 86.6 -13% | 87.8 -11% | 96.9 -2% | 97.48 -2% | |
| Response Times | -554% | -216% | 43% | 155% | -474% | -15% | |
| Response Time Grey 50% / Grey 80% * | 1.58 ? | 12.7 ? -704% | 22.2 ? -1305% | 0.82 ? 48% | 0.22 ? 86% | 66.9 ? -4134% | 1.4 ? 11% |
| Response Time Black / White * | 1.25 ? | 6.3 ? -404% | 17 ? -1260% | 0.85 ? 32% | 0.25 ? 80% | 43.6 ? -3388% | 2 ? -60% |
| PWM Frequency | 240 ? | 4840 ? 1917% | 360 ? 50% | 960 ? 300% | 14877 6099% | 250 ? 4% | |
| Screen | -70% | -18% | -21% | -18% | 13% | -61% | |
| Brightness middle | 355 | 416 17% | 651 83% | 366 3% | 416 17% | 630 77% | 331.8 -7% |
| Brightness | 360 | 392 9% | 673 87% | 367 2% | 418 16% | 604 68% | 334 -7% |
| Brightness Distribution | 98 | 86 -12% | 93 -5% | 96 -2% | 96 -2% | 94 -4% | 98 0% |
| Black Level * | 0.38 | 0.22 | 0.07 | ||||
| Colorchecker dE 2000 * | 1.2 | 2.33 -94% | 1.9 -58% | 1.3 -8% | 1.6 -33% | 1.2 -0% | 1.58 -32% |
| Colorchecker dE 2000 max. * | 2.6 | 6.07 -133% | 4.2 -62% | 3.6 -38% | 2.1 19% | 2.8 -8% | 4.23 -63% |
| Greyscale dE 2000 * | 1.2 | 3.7 -208% | 3 -150% | 2.2 -83% | 2.7 -125% | 1.9 -58% | 4.25 -254% |
| Gamma | 2.14 103% | 2.161 102% | 2.18 101% | 2.14 103% | 2.16 102% | 2.29 96% | 2.206 100% |
| CCT | 6526 100% | 7102 92% | 6738 96% | 6680 97% | 6331 103% | 6812 95% | 6249 104% |
| Contrast | 1095 | 2959 | 4740 | ||||
| Colorchecker dE 2000 calibrated * | 1.02 | 0.6 | 1 | 6.66 | |||
| Toplam Ortalama (Program / Ayarlar) | -215% /
-144% | -80% /
-64% | 6% /
-1% | 45% /
30% | -154% /
-135% | -26% /
-34% |
* ... daha küçük daha iyidir
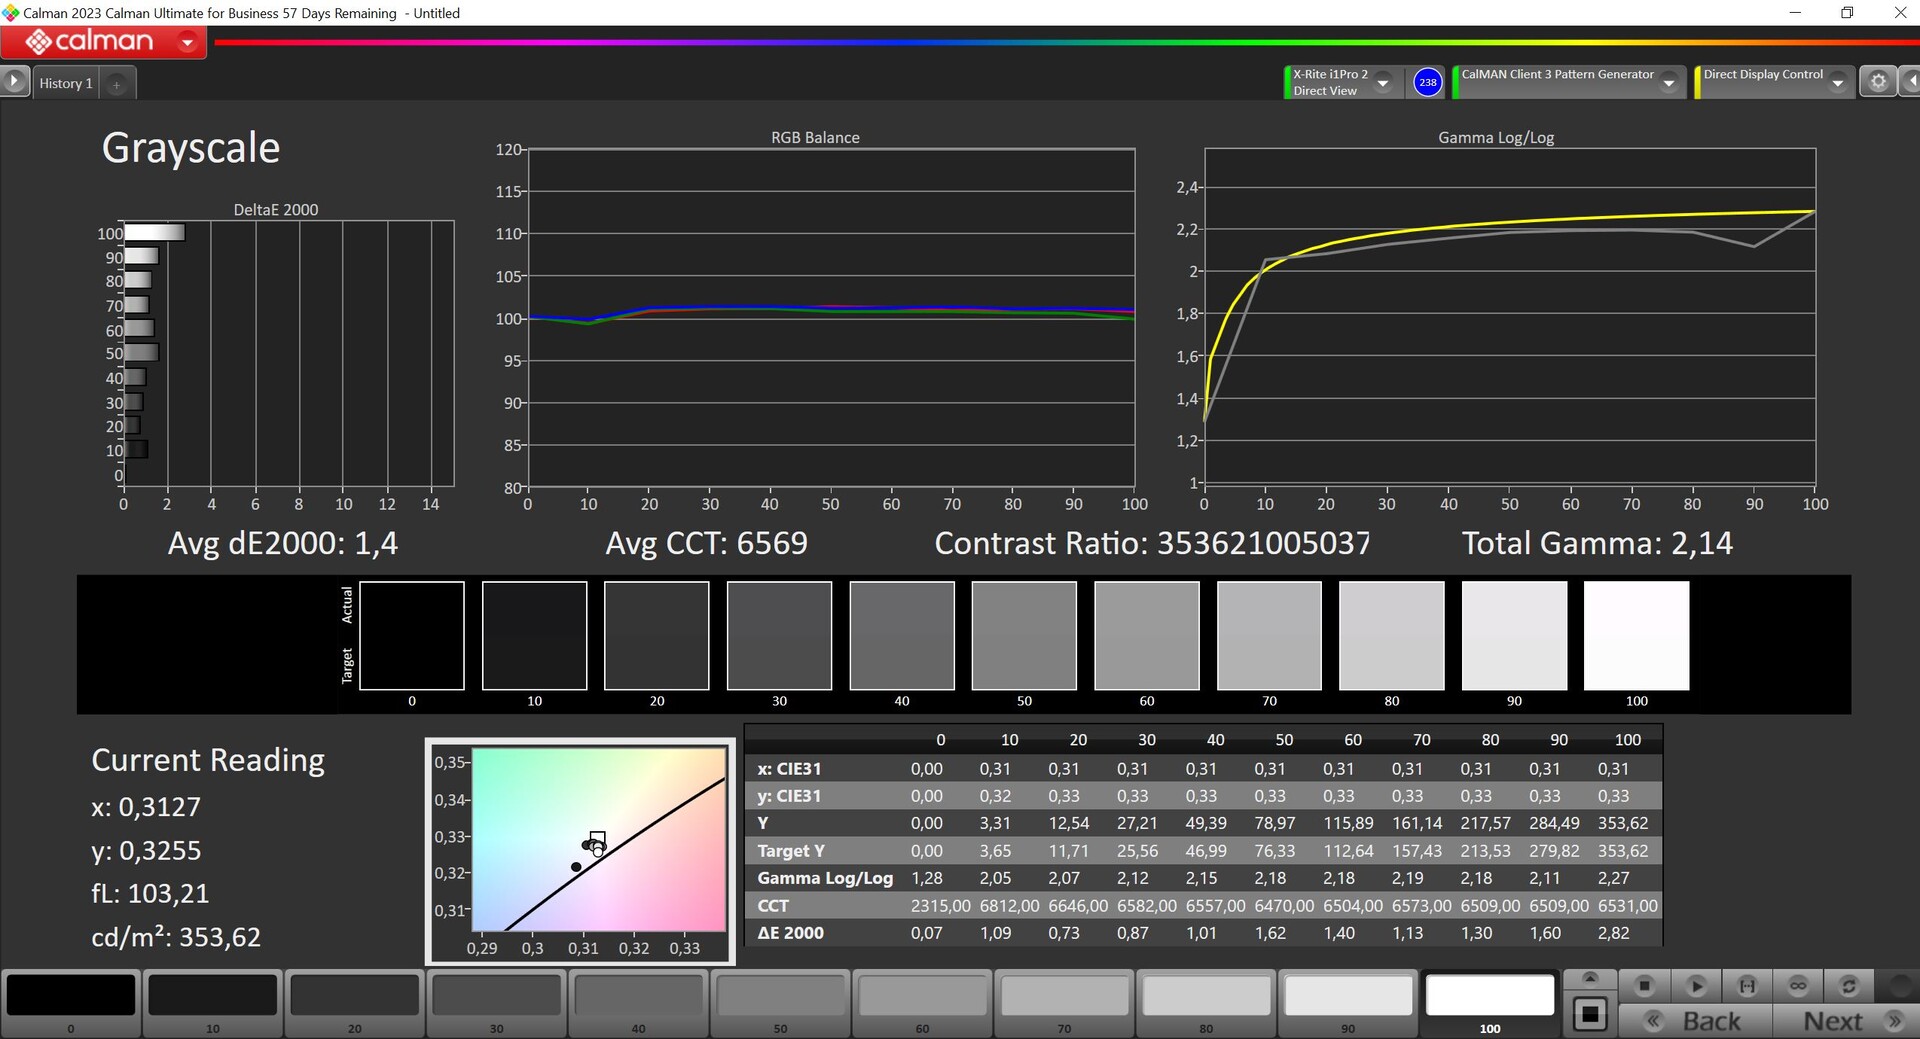
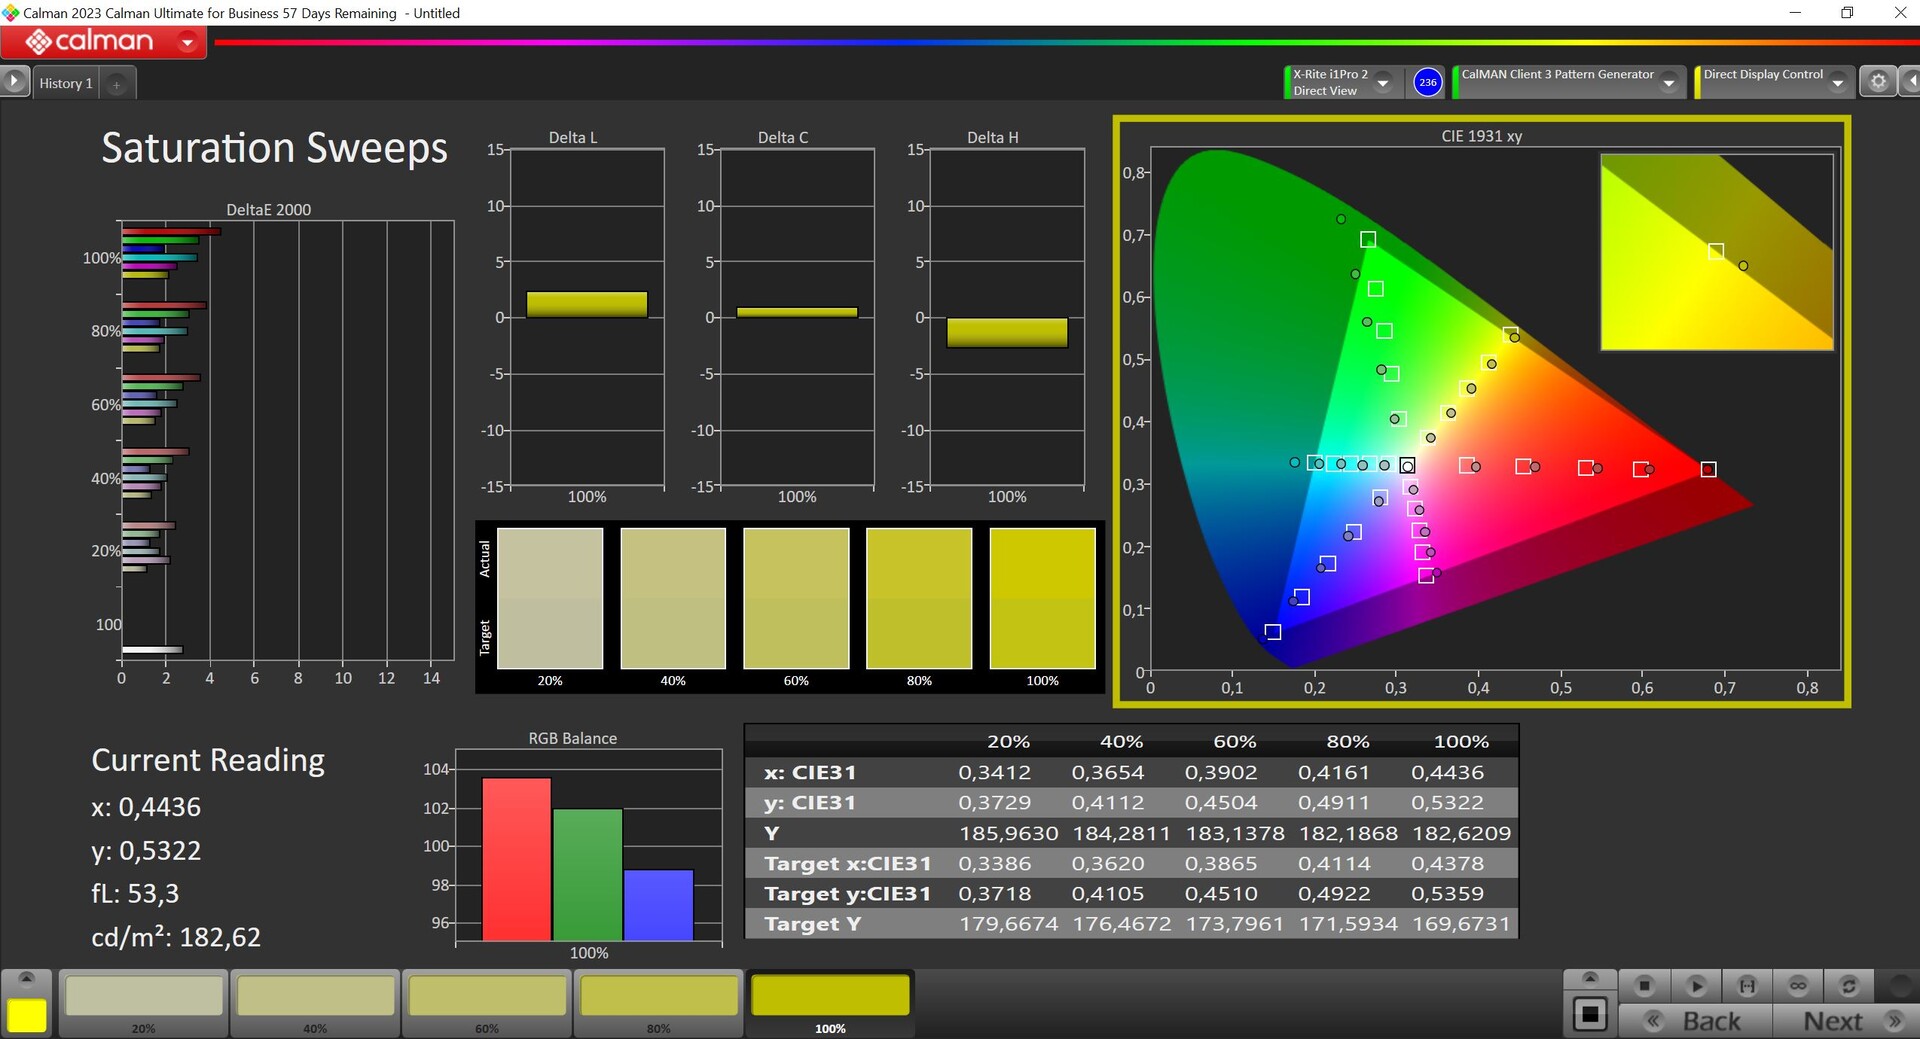
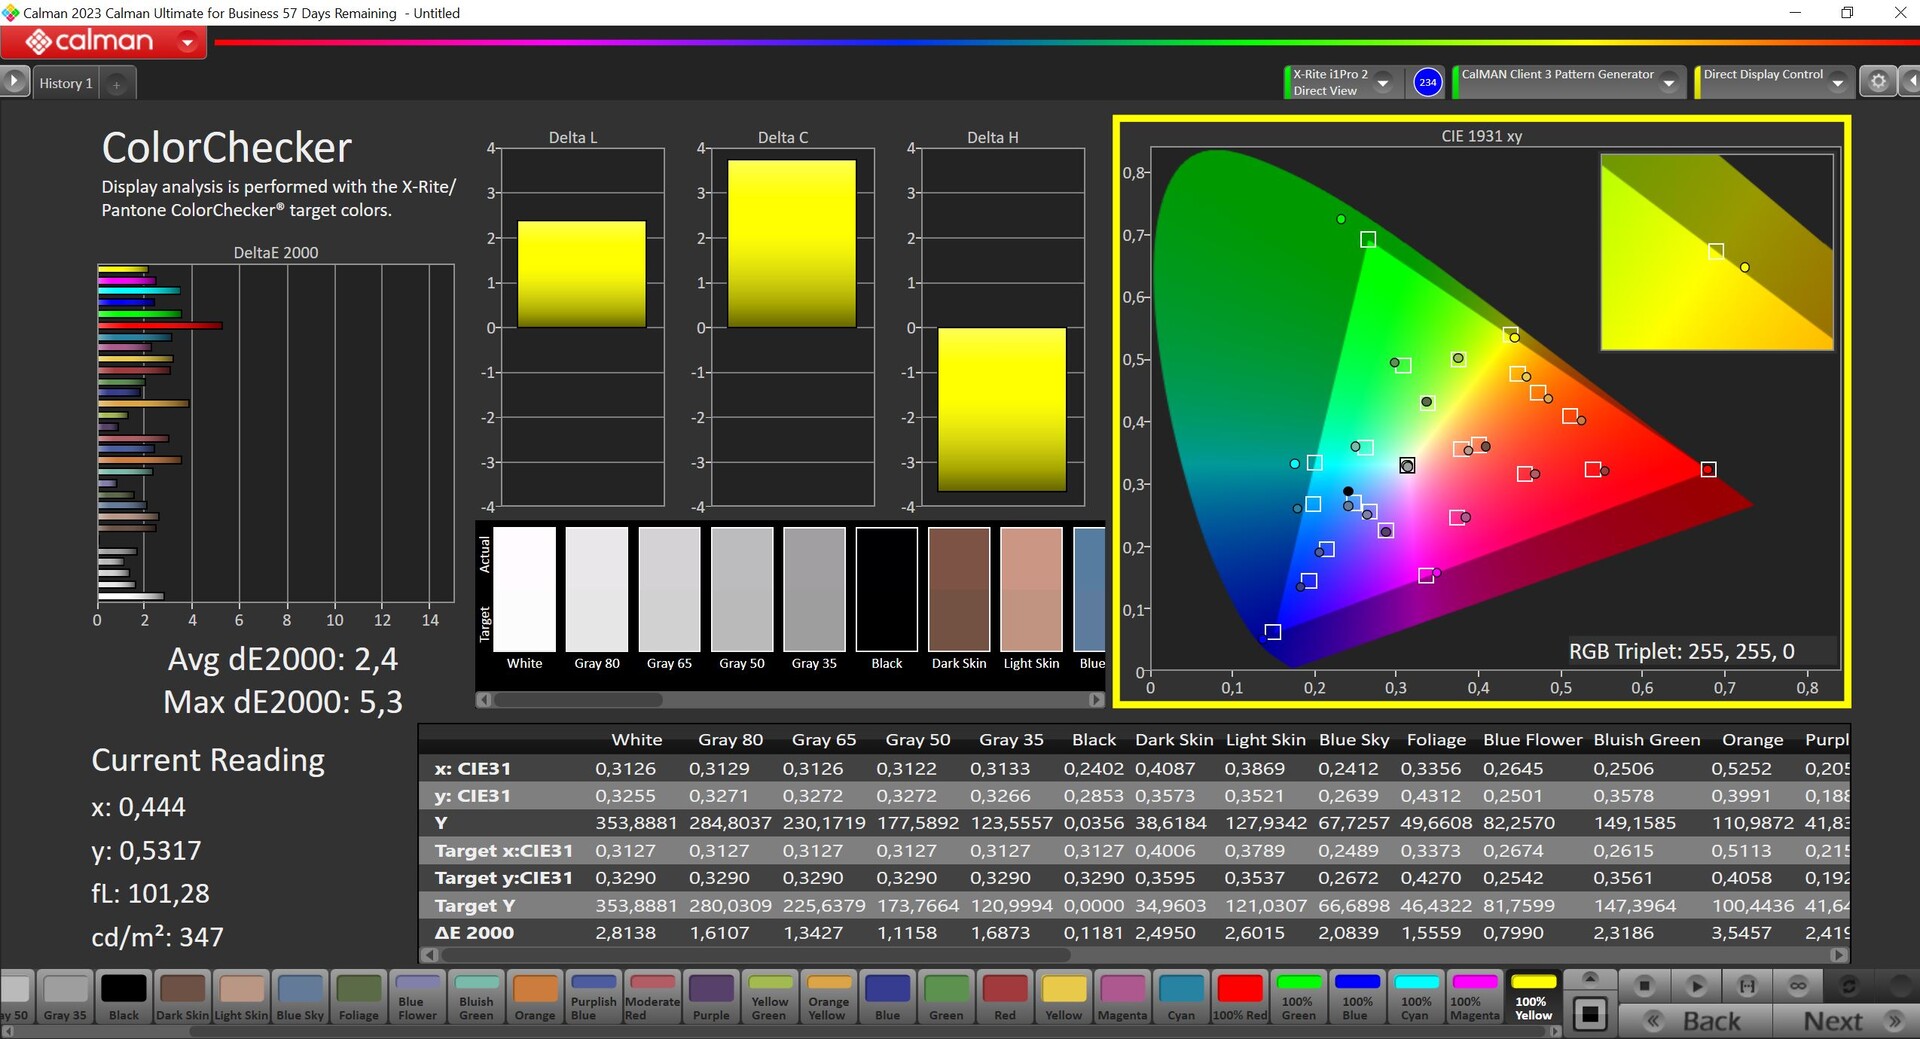

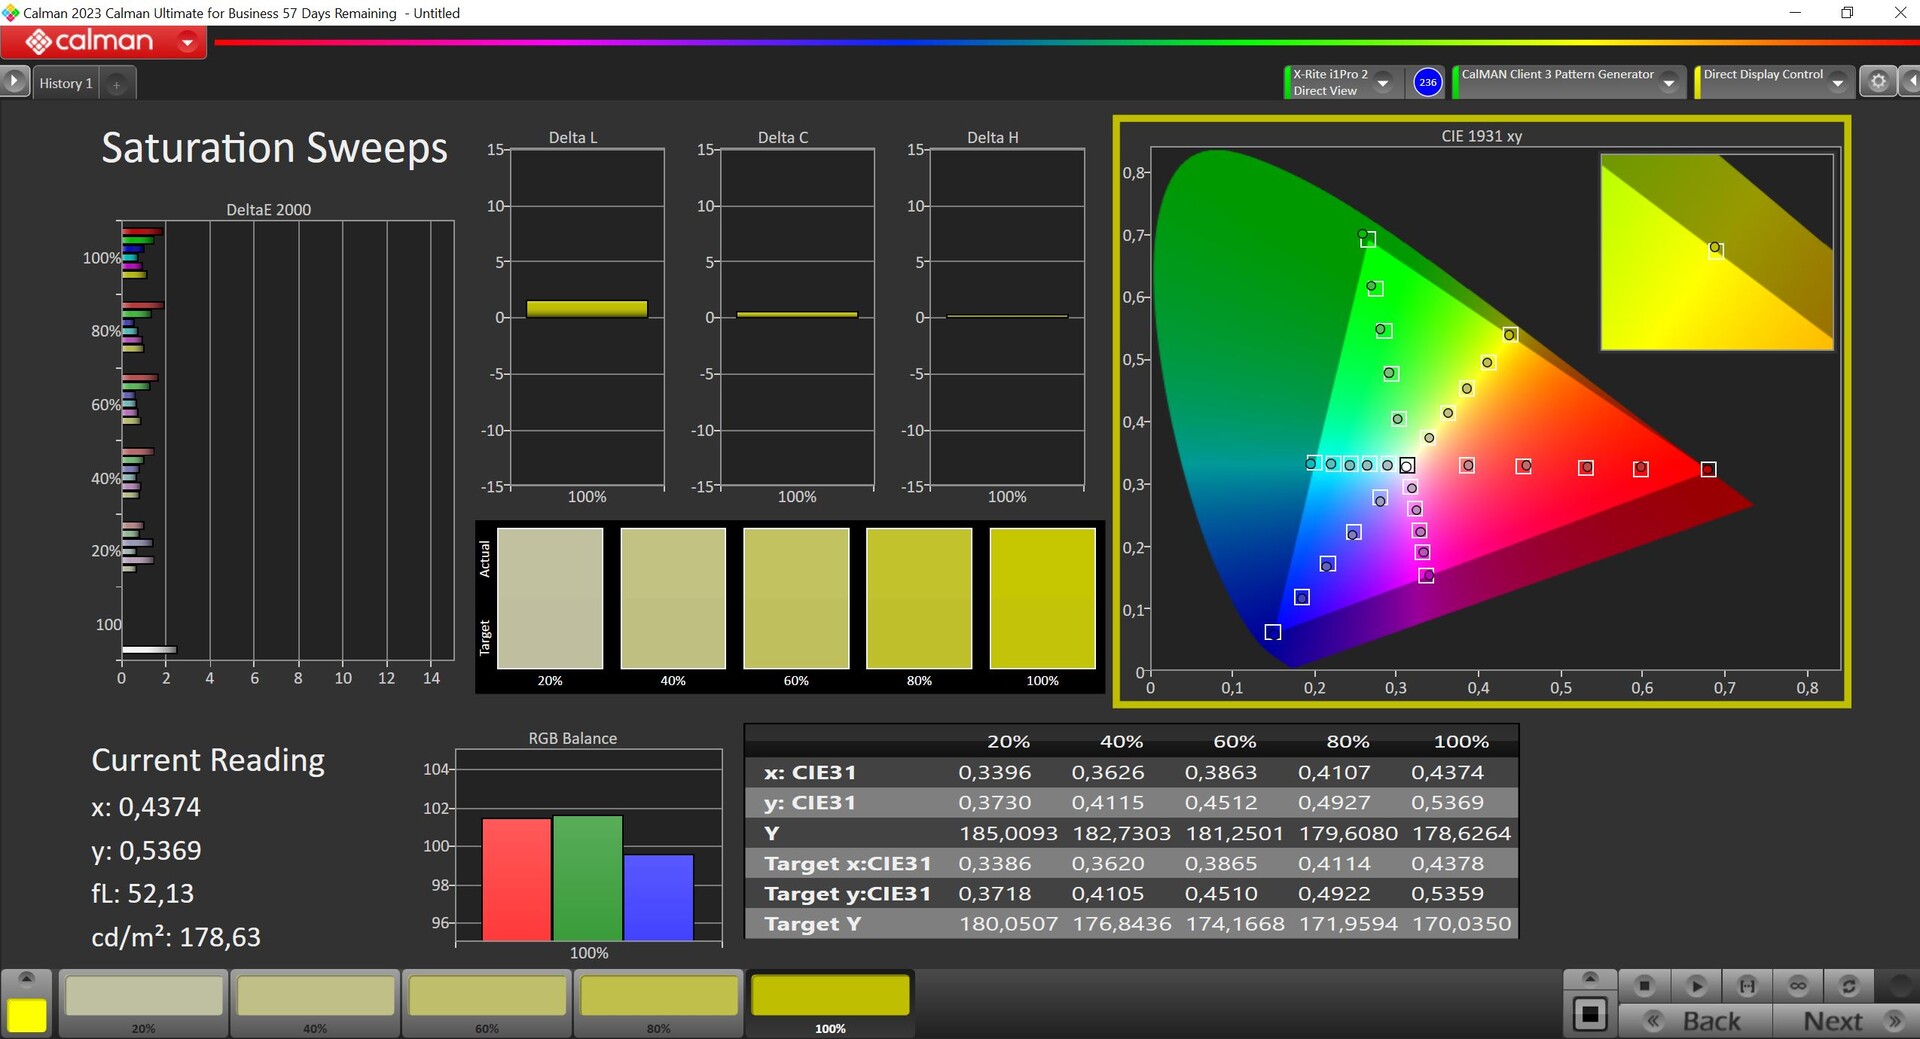
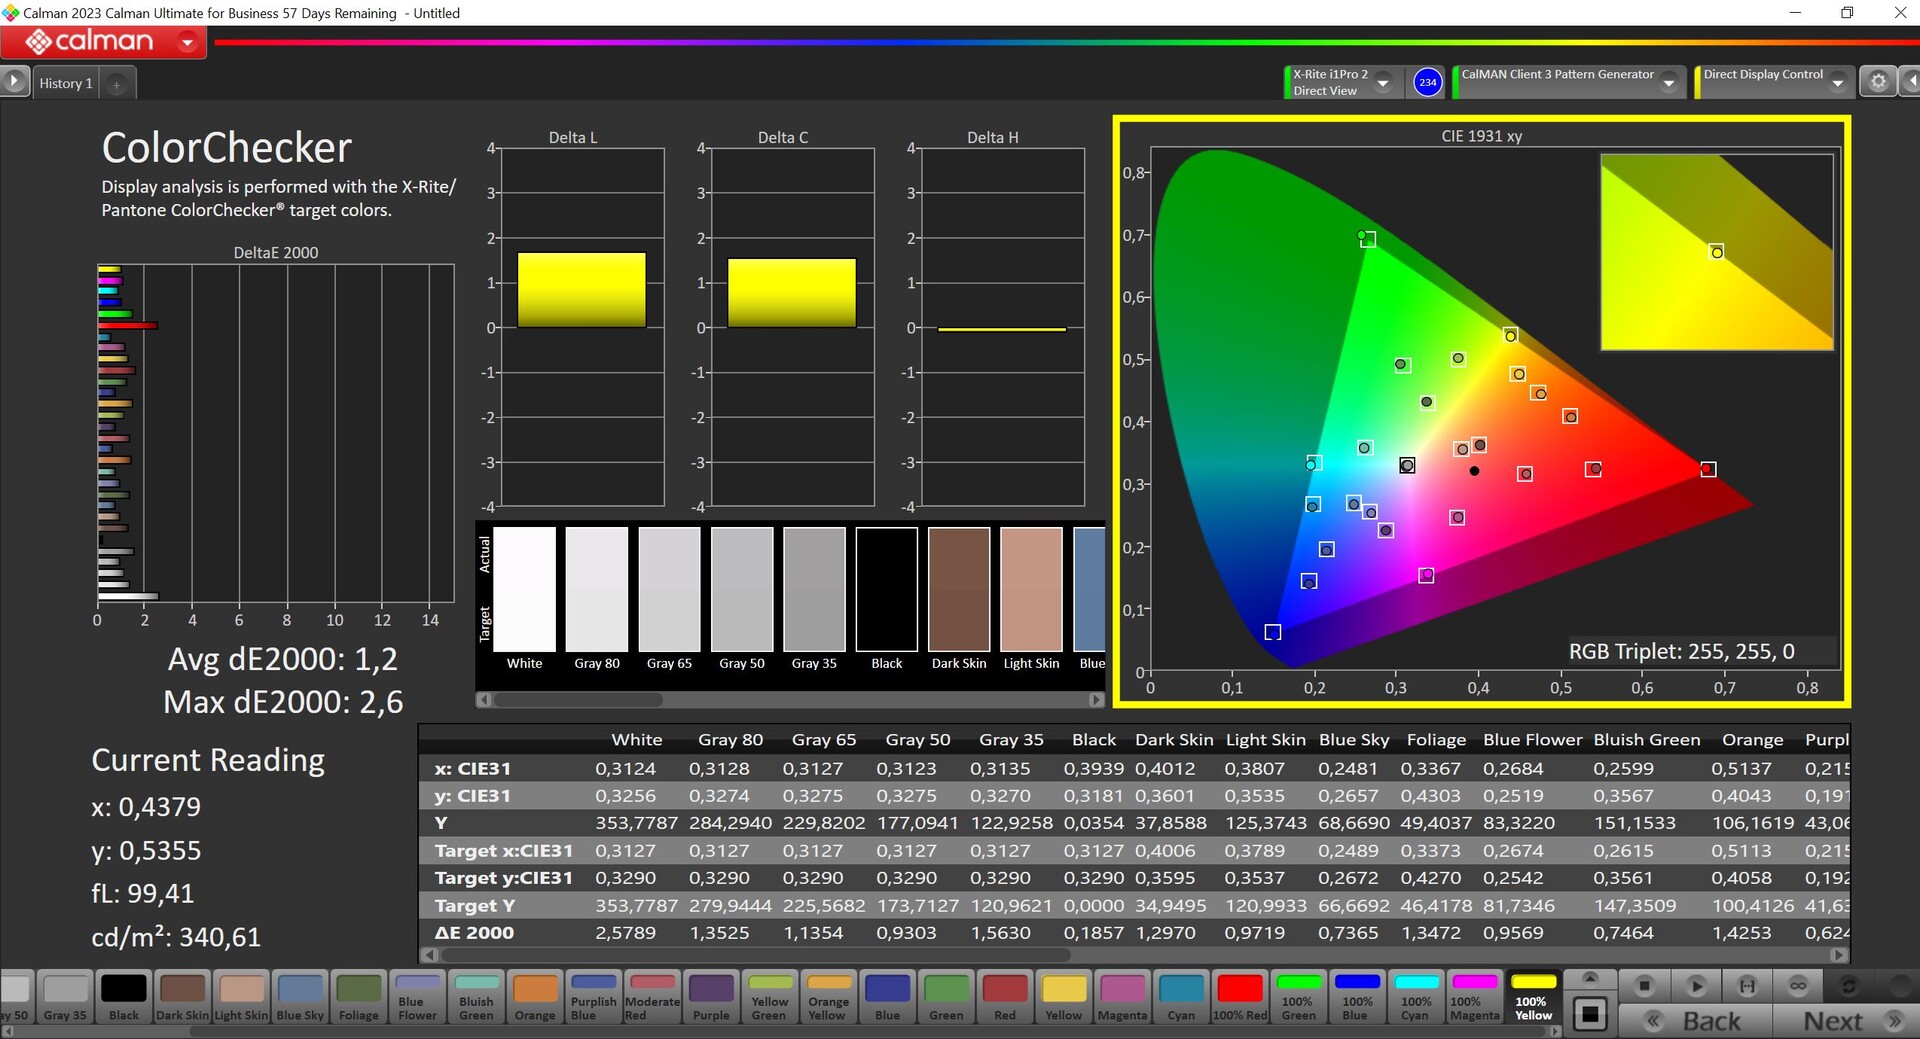
Paneli profesyonel CalMAN yazılımını (X-Rite i1 Pro 2) kullanarak analiz ettik ve normalde olduğu gibi Asus çeşitli renk profilleri sağlıyor. Önceden yüklenmiş mod günlük işler için iyi bir görüntü sunuyor ancak renkler biraz aşırı doygun. P3 ekran modunda hem gri ölçekler hem de renk sapmaları önemli bir işaret olan 3'ün altında kaldığından işler önemli ölçüde daha doğru. Aynı şekilde, sRGB modu da doğru sonuçlar veriyor ve tam sRGB ve P3 renk alanı kapsamı sayesinde ProArt P16, görüntüleri ve videoları düzenlemek için mükemmel şekilde uygun. Kendi kalibrasyonumuzla gri ölçek reprodüksiyonunu iyileştirebildik ancak renk sapmaları arttı ve bu nedenle indirilebilir bir profil sağlamıyoruz.

Yanıt Sürelerini Görüntüle
| ↔ Tepki Süresi Siyahtan Beyaza | ||
|---|---|---|
| 1.25 ms ... yükseliş ↗ ve sonbahar↘ birleşimi | ↗ 0.67 ms yükseliş | 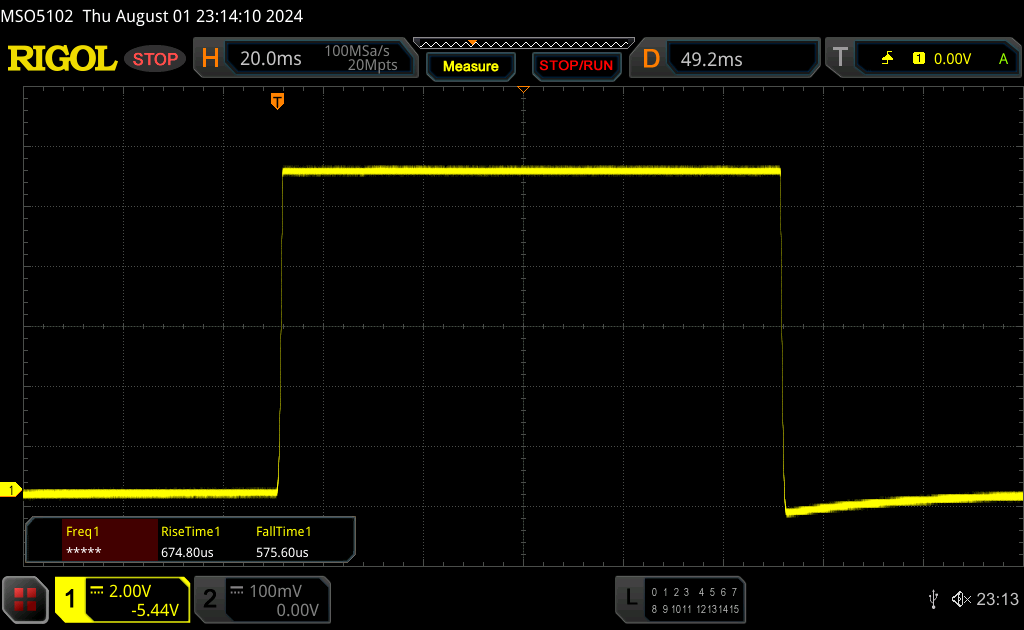 |
| ↘ 0.58 ms sonbahar | ||
| Ekran, testlerimizde çok hızlı yanıt oranları gösteriyor ve hızlı oyun oynamaya çok uygun olmalı. Karşılaştırıldığında, test edilen tüm cihazlar 0.1 (minimum) ile 240 (maksimum) ms arasında değişir. » Tüm cihazların 5 %'si daha iyi. Bu, ölçülen yanıt süresinin test edilen tüm cihazların ortalamasından (20.8 ms) daha iyi olduğu anlamına gelir. | ||
| ↔ Tepki Süresi %50 Griden %80 Griye | ||
| 1.58 ms ... yükseliş ↗ ve sonbahar↘ birleşimi | ↗ 0.84 ms yükseliş | 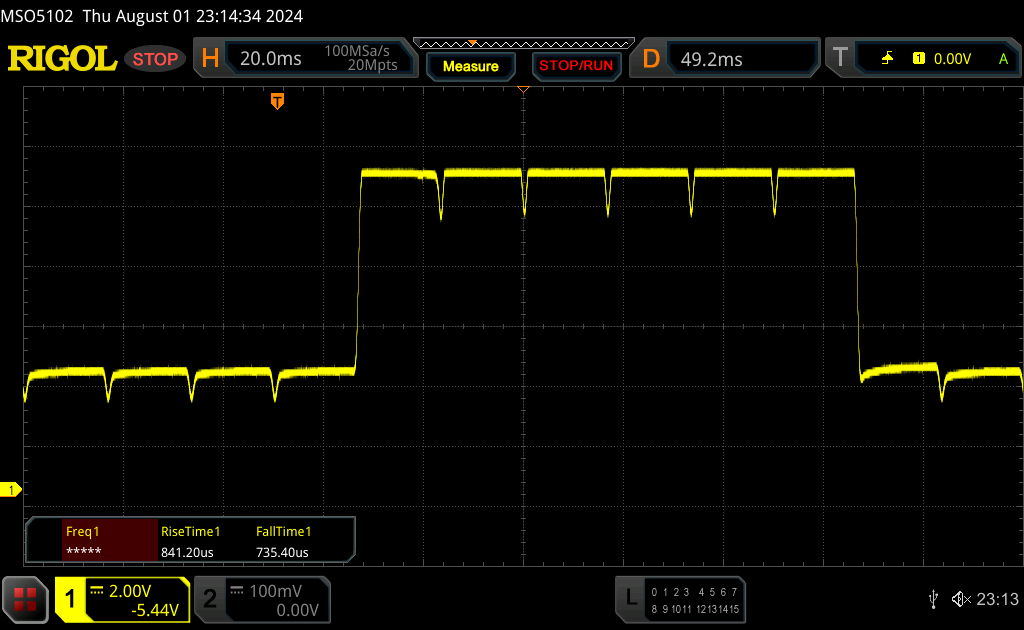 |
| ↘ 0.74 ms sonbahar | ||
| Ekran, testlerimizde çok hızlı yanıt oranları gösteriyor ve hızlı oyun oynamaya çok uygun olmalı. Karşılaştırıldığında, test edilen tüm cihazlar 0.165 (minimum) ile 636 (maksimum) ms arasında değişir. » Tüm cihazların 5 %'si daha iyi. Bu, ölçülen yanıt süresinin test edilen tüm cihazların ortalamasından (32.5 ms) daha iyi olduğu anlamına gelir. | ||
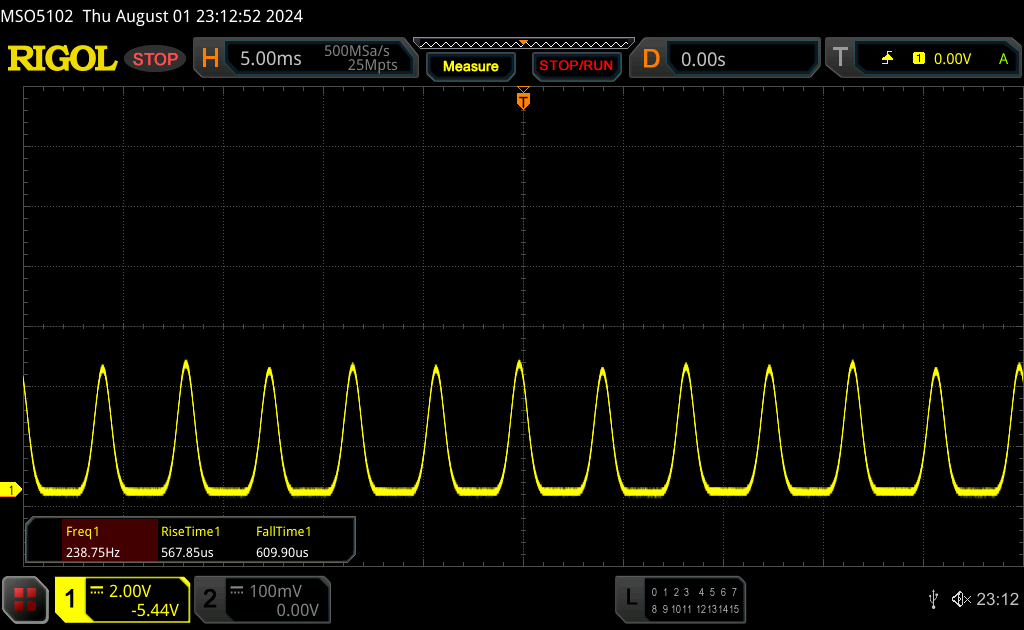
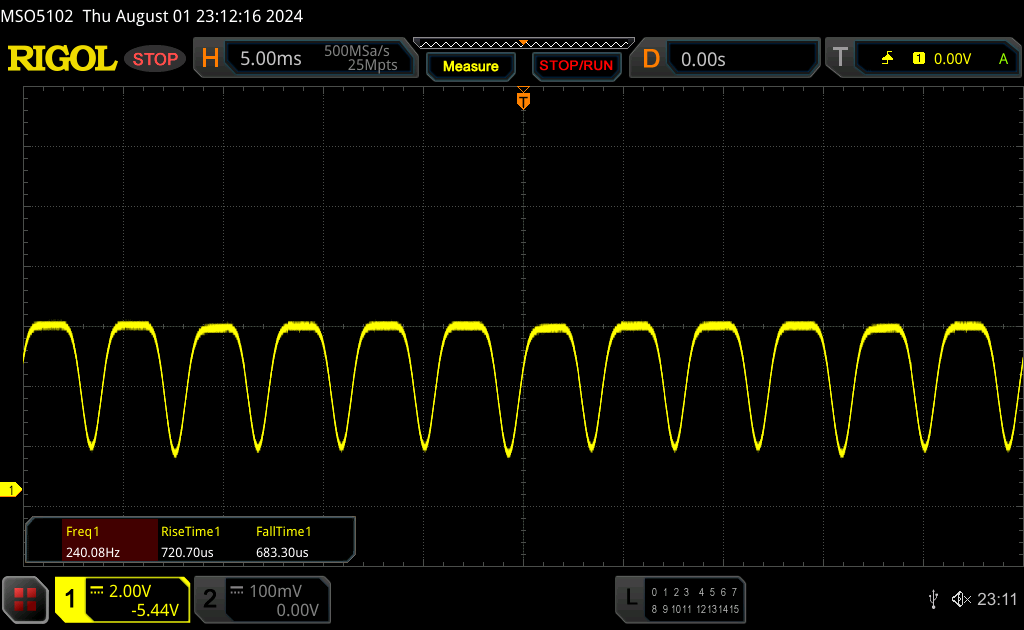
Ekran Titremesi / PWM (Darbe Genişliği Modülasyonu)
| Ekran titriyor / PWM algılandı | 240 Hz Amplitude: 36 % | ≤ 52 % parlaklık ayarı | 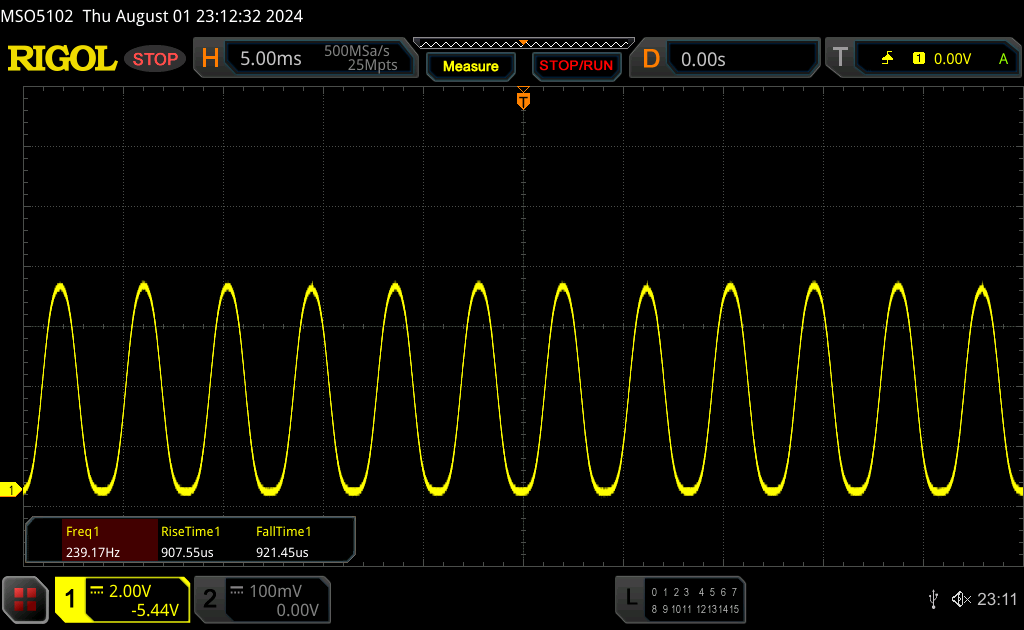 |
| ≤ 93 cd/m² parlaklık | |||
Ekran arka ışığı 240 Hz'de titriyor (en kötü durum, örneğin PWM kullanılması) 52 % (93 cd/m²) ve altındaki parlaklık ayarında titreme algılandı. Bu parlaklık ayarının üzerinde titreme veya PWM olmamalıdır. 240 Hz frekansı nispeten düşüktür, bu nedenle hassas kullanıcılar belirtilen parlaklık ayarında ve altında muhtemelen titremeyi fark edecek ve göz yorgunluğu yaşayacaktır. Nispeten düşük parlaklık ayarlarında titreme meydana gelir, bu nedenle bu parlaklık ayarında veya daha düşük bir değerde uzun süreli kullanım göz yorgunluğuna neden olabilir. Karşılaştırıldığında: Test edilen tüm cihazların %53 %'si ekranı karartmak için PWM kullanmıyor. PWM tespit edilirse, ortalama 8516 (minimum: 5 - maksimum: 343500) Hz ölçüldü. | |||

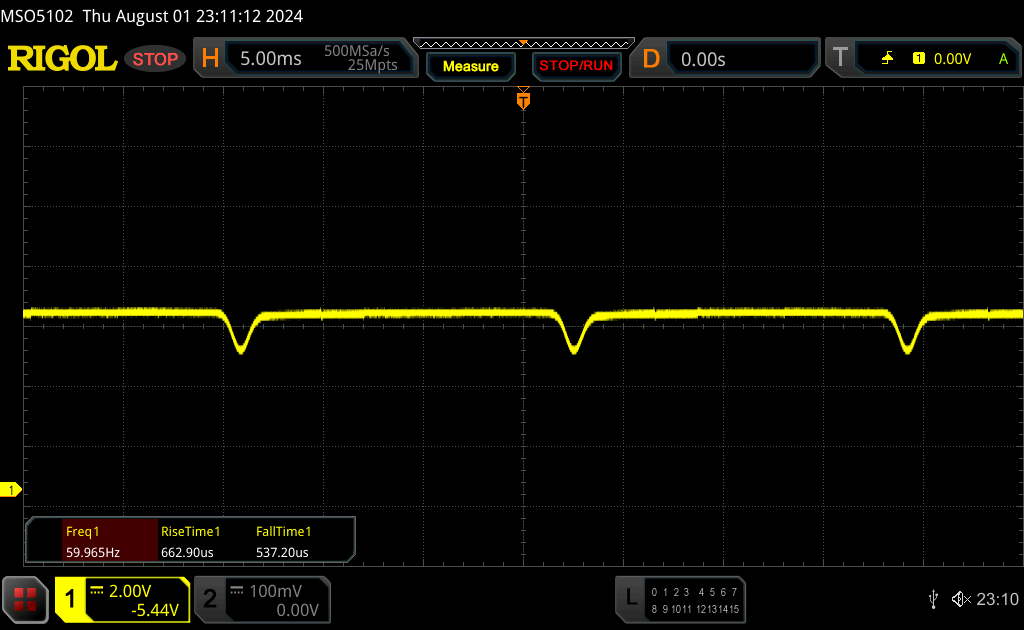
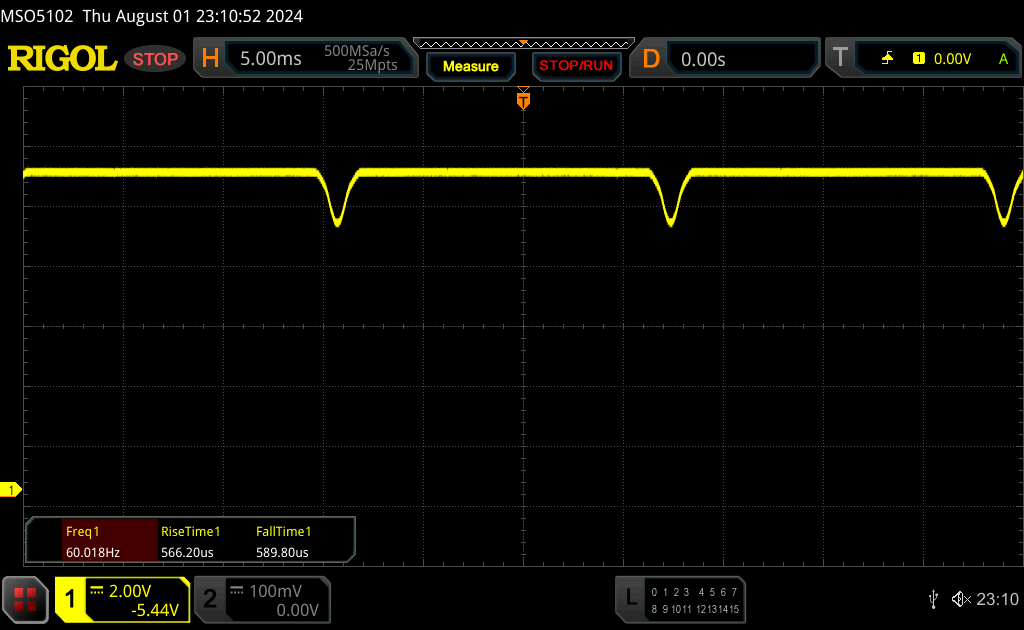
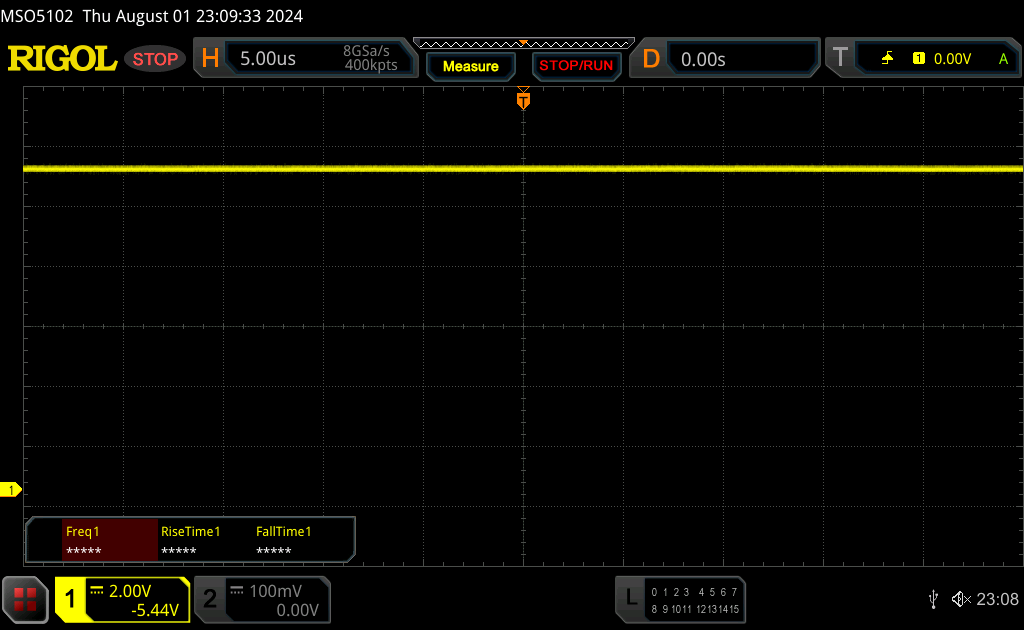
DC karartma 60 Hz frekansta %53'e kadar parlaklıkta devreye giriyor ve bunun altında 240 Hz'de titreme oluyor. Bu zararlı bölgeye girmekten kaçınmak için Asus, MyAsus uygulamasında titreşimsiz OLED karartma sunuyor.
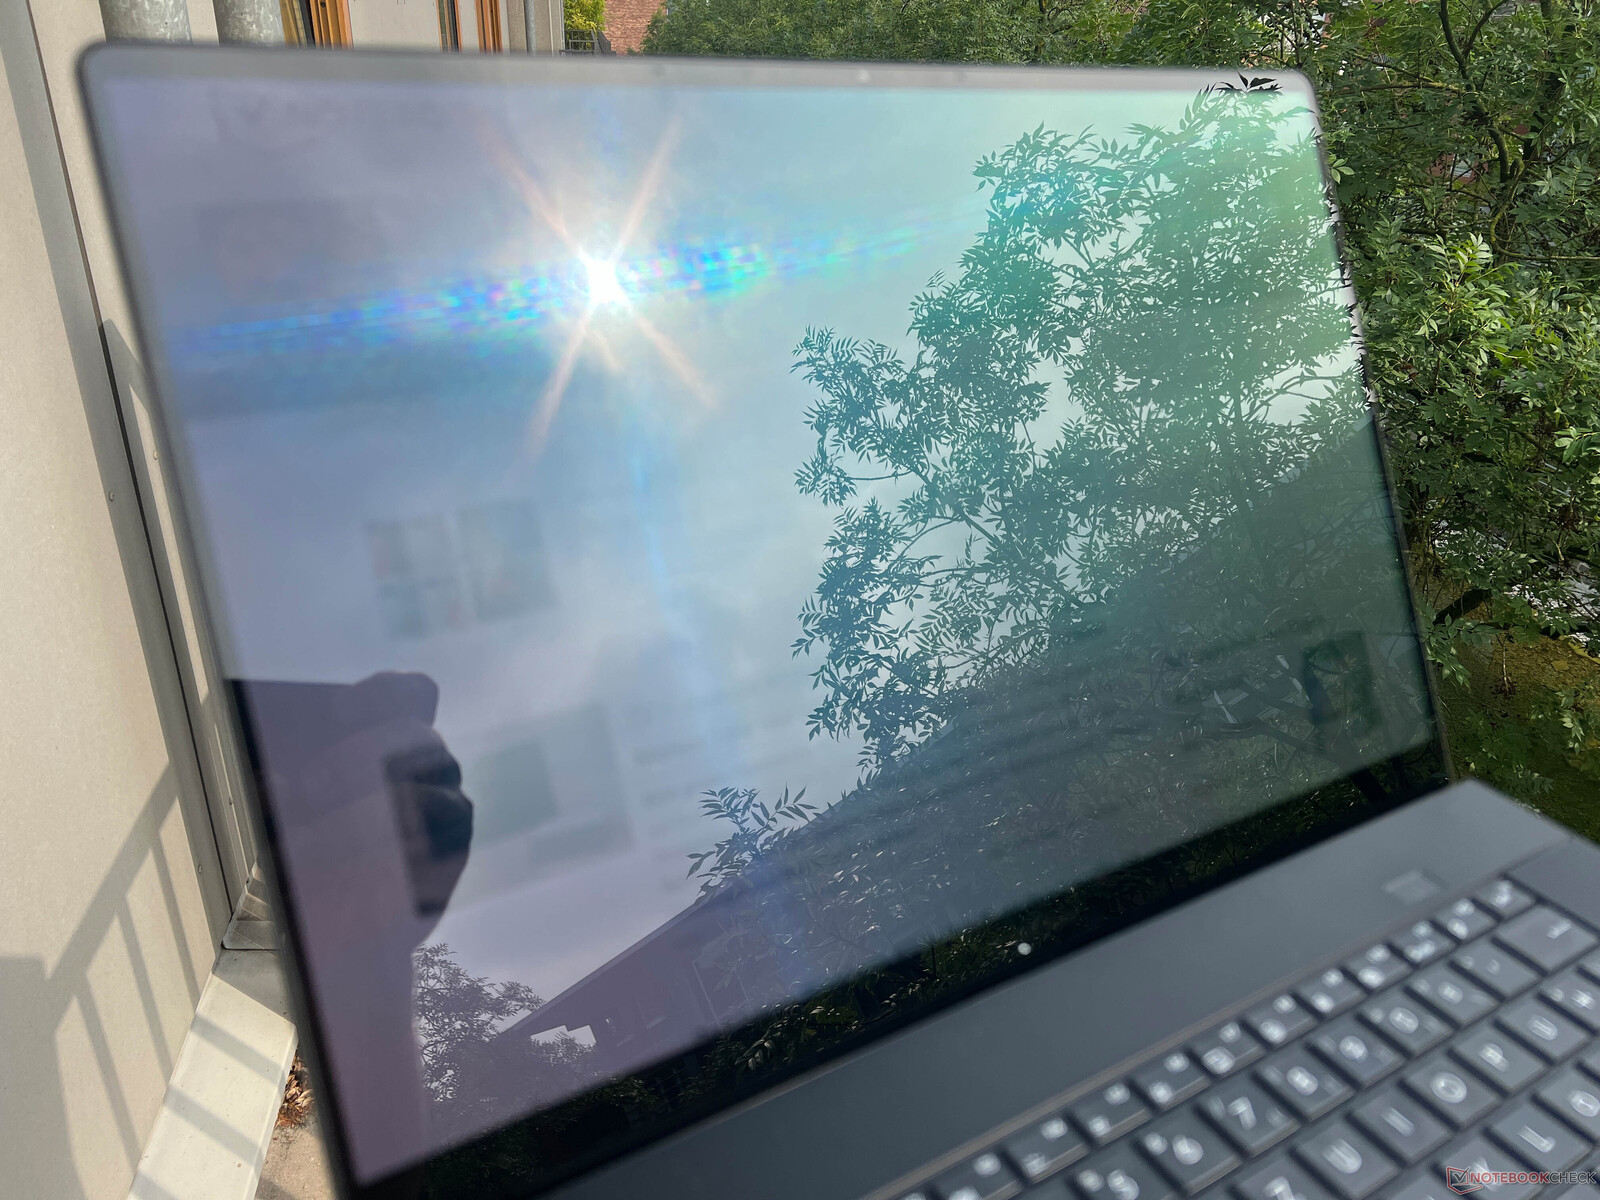

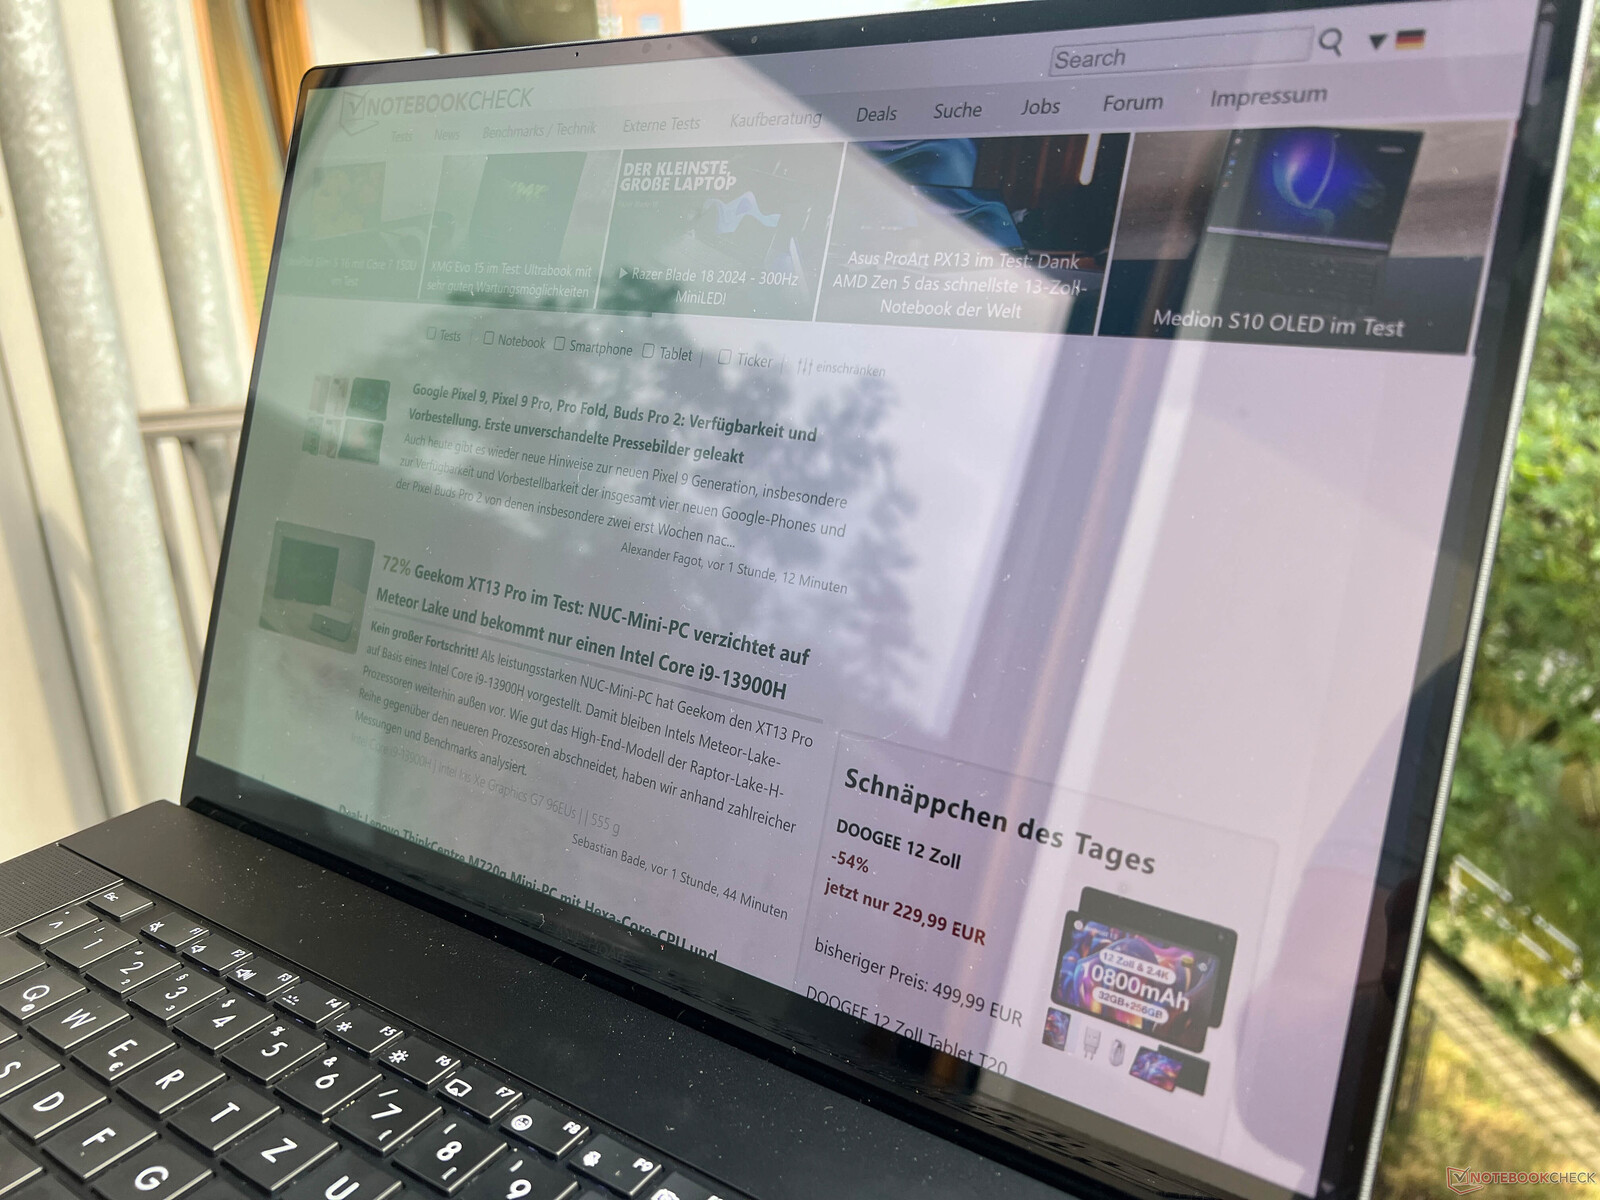
Dışarıda, özellikle de çok parlak dokunmatik ekranda yansımalar bir sorundur. Bu nedenle gölgede uygun bir yer bulmanızı öneririz. Görüş açısı stabilitesi çok iyi.

Performans - GeForce GPU ve 64 GB RAM ile Zen 5
Asus, yeni ProArt P16'yı her iki yeni modelle birlikte sunuyor Ryzen AI 300 mobil işlemciler bunların her biri lehimli LPDDR5x 7500 RAM (24, 32 veya 64 GB) ile birleştirilmiştir. Ek olarak, mevcut Nvidia'nın Ada Lovelace GPU'larına (RTX 4050/4060/4070 dizüstü bilgisayar) sahibiz.
Test koşulları
Her zamanki gibi Asus üç farklı enerji profili sunuyor: Whisper, Standart ve Performans. Aşağıdaki tabloda, ilgili TDP/TGP ve performans değerlerinin bir özetini derledik. Standart olarak, aşağıdaki kıyaslamaları ve ölçümleri yalnızca şebekeye bağlıyken kullanılabilen Performans modunu kullanarak gerçekleştirdik.
| Enerji profili | TDP | CB R23 Multi | TGP | Time Spy Grafik | CP 2077 QHD/Ultra | Stres testi | maksimum fan hızı |
|---|---|---|---|---|---|---|---|
| Whisper | 60/55W | 21,046 puan | 60W | 8,749 puan | 34 FPS | CPU: 30W GPU: 42W |
42,2 dB(A) |
| Standart | 70/65W | 22.651 puan | 80W | 10.526 puan | 44,2 FPS | CPU: 30W GPU: 65W |
47,1 dB(A) |
| Performans | 80W | 23.795 puan | 105W | 11.941 puan | 49,4 FPS | CPU: 37W GPU: 85W |
53,2 dB(A) |
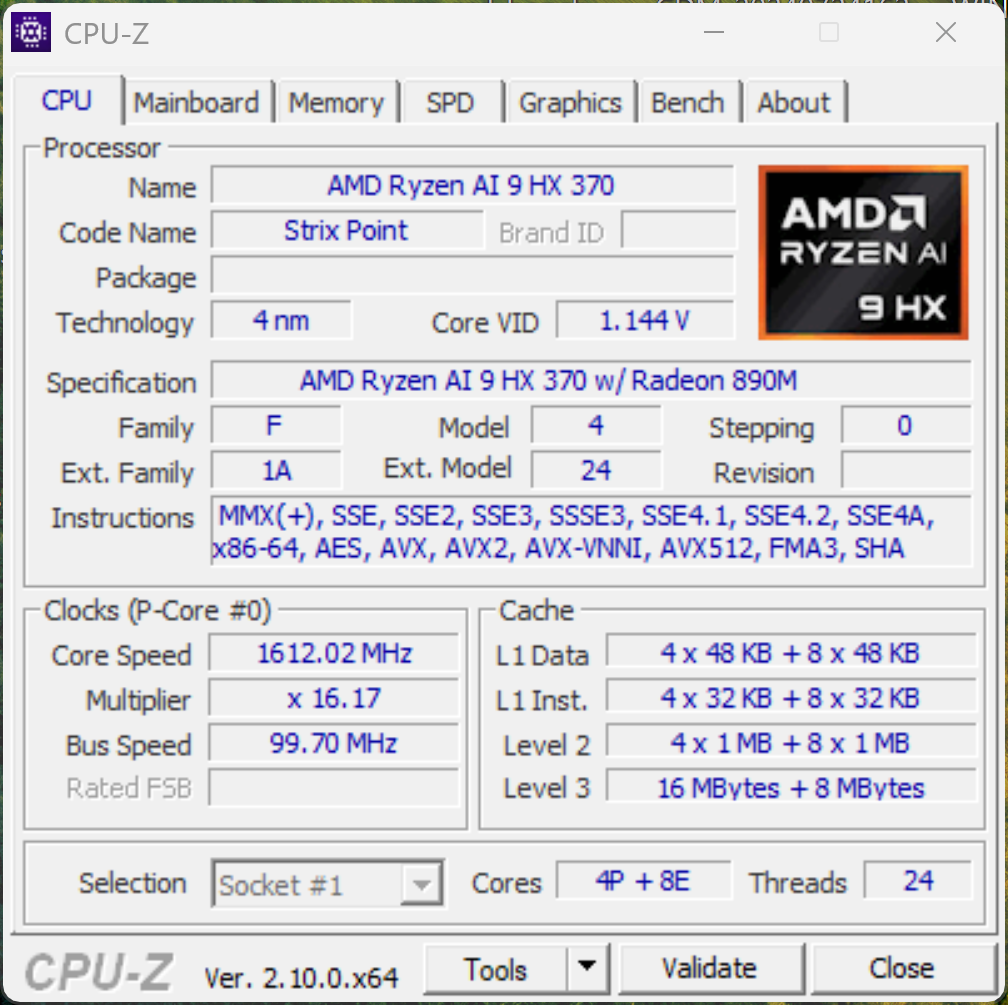
İşlemci - Ryzen AI 9 HX 370
Yeni AMD Ryzen AI 9 HX 370 maksimum 5,1 GHz hıza ulaşabilen 12 Zen 5 çekirdeği (24 iş parçacığı) sunar. Daha fazla teknik analiz için bkz cPU analizimiz. ProArt P16'nın işlemcisinin tutarlı bir şekilde 80 watt tüketmesine izin veriliyor ve bu da çok yüksek ve özellikle istikrarlı bir performansa yansıyor. Sadece rakipleri Core i9 14900HX ve Apple M3 Maks meteor Lake yongaları ile daha da fazla performans sunarken Zenbook Pro 16X ile Core i9 13905H geride bırakılıyor. Pil modunda, işlemcinin maksimum 70/65 watt çekmesine izin verilir ve bu sadece küçük bir performans düşüşüne (-%7) yol açar. Ek CPU kıyaslamaları bulunabilir burada.
Cinebench R15 Multi Continuous Test
Cinebench R23: Multi Core | Single Core
Cinebench R20: CPU (Multi Core) | CPU (Single Core)
Cinebench R15: CPU Multi 64Bit | CPU Single 64Bit
Blender: v2.79 BMW27 CPU
7-Zip 18.03: 7z b 4 | 7z b 4 -mmt1
Geekbench 6.4: Multi-Core | Single-Core
Geekbench 5.5: Multi-Core | Single-Core
HWBOT x265 Benchmark v2.2: 4k Preset
LibreOffice : 20 Documents To PDF
R Benchmark 2.5: Overall mean
| Cinebench 2024 / CPU Multi Core | |
| Apple MacBook Pro 16 2023 M3 Max | |
| SCHENKER XMG Pro 16 Studio (Mid 24) | |
| Asus ProArt P16 H7606WI | |
| Ortalama AMD Ryzen AI 9 HX 370 (621 - 1284, n=24) | |
| Dell XPS 16 9640 | |
| Sınıf ortalaması Multimedia (327 - 2069, n=57, son 2 yıl) | |
| Asus ROG Zephyrus G16 2024 GU605M | |
| Cinebench 2024 / CPU Single Core | |
| Apple MacBook Pro 16 2023 M3 Max | |
| Sınıf ortalaması Multimedia (72.5 - 178, n=38, son 2 yıl) | |
| SCHENKER XMG Pro 16 Studio (Mid 24) | |
| Ortalama AMD Ryzen AI 9 HX 370 (113.6 - 121, n=14) | |
| Asus ProArt P16 H7606WI | |
| Dell XPS 16 9640 | |
| Asus ROG Zephyrus G16 2024 GU605M | |
| Cinebench R23 / Multi Core | |
| SCHENKER XMG Pro 16 Studio (Mid 24) | |
| Apple MacBook Pro 16 2023 M3 Max | |
| Asus ProArt P16 H7606WI | |
| Asus Zenbook Pro 16X UX7602BZ-MY005W | |
| Ortalama AMD Ryzen AI 9 HX 370 (10435 - 23805, n=24) | |
| Lenovo Yoga Pro 9 16IMH9 | |
| Dell XPS 16 9640 | |
| Asus ROG Zephyrus G16 2024 GU605M | |
| Sınıf ortalaması Multimedia (4861 - 30789, n=96, son 2 yıl) | |
| Cinebench R23 / Single Core | |
| SCHENKER XMG Pro 16 Studio (Mid 24) | |
| Asus ProArt P16 H7606WI | |
| Asus Zenbook Pro 16X UX7602BZ-MY005W | |
| Ortalama AMD Ryzen AI 9 HX 370 (1921 - 2049, n=17) | |
| Apple MacBook Pro 16 2023 M3 Max | |
| Lenovo Yoga Pro 9 16IMH9 | |
| Sınıf ortalaması Multimedia (878 - 2290, n=87, son 2 yıl) | |
| Dell XPS 16 9640 | |
| Asus ROG Zephyrus G16 2024 GU605M | |
| Cinebench R20 / CPU (Multi Core) | |
| SCHENKER XMG Pro 16 Studio (Mid 24) | |
| Asus ProArt P16 H7606WI | |
| Ortalama AMD Ryzen AI 9 HX 370 (6449 - 9250, n=16) | |
| Lenovo Yoga Pro 9 16IMH9 | |
| Asus Zenbook Pro 16X UX7602BZ-MY005W | |
| Dell XPS 16 9640 | |
| Asus ROG Zephyrus G16 2024 GU605M | |
| Apple MacBook Pro 16 2023 M3 Max | |
| Sınıf ortalaması Multimedia (1887 - 11924, n=80, son 2 yıl) | |
| Cinebench R20 / CPU (Single Core) | |
| Asus ProArt P16 H7606WI | |
| SCHENKER XMG Pro 16 Studio (Mid 24) | |
| Ortalama AMD Ryzen AI 9 HX 370 (753 - 804, n=16) | |
| Lenovo Yoga Pro 9 16IMH9 | |
| Asus ROG Zephyrus G16 2024 GU605M | |
| Sınıf ortalaması Multimedia (341 - 853, n=80, son 2 yıl) | |
| Dell XPS 16 9640 | |
| Asus Zenbook Pro 16X UX7602BZ-MY005W | |
| Apple MacBook Pro 16 2023 M3 Max | |
| Cinebench R15 / CPU Multi 64Bit | |
| SCHENKER XMG Pro 16 Studio (Mid 24) | |
| Asus ProArt P16 H7606WI | |
| Apple MacBook Pro 16 2023 M3 Max | |
| Ortalama AMD Ryzen AI 9 HX 370 (2498 - 3505, n=16) | |
| Lenovo Yoga Pro 9 16IMH9 | |
| Asus Zenbook Pro 16X UX7602BZ-MY005W | |
| Dell XPS 16 9640 | |
| Asus ROG Zephyrus G16 2024 GU605M | |
| Sınıf ortalaması Multimedia (856 - 5224, n=87, son 2 yıl) | |
| Cinebench R15 / CPU Single 64Bit | |
| Asus ProArt P16 H7606WI | |
| Ortalama AMD Ryzen AI 9 HX 370 (293 - 315, n=16) | |
| SCHENKER XMG Pro 16 Studio (Mid 24) | |
| Lenovo Yoga Pro 9 16IMH9 | |
| Apple MacBook Pro 16 2023 M3 Max | |
| Asus ROG Zephyrus G16 2024 GU605M | |
| Sınıf ortalaması Multimedia (99.6 - 323, n=82, son 2 yıl) | |
| Dell XPS 16 9640 | |
| Asus Zenbook Pro 16X UX7602BZ-MY005W | |
| Blender / v2.79 BMW27 CPU | |
| Sınıf ortalaması Multimedia (100 - 557, n=80, son 2 yıl) | |
| Apple MacBook Pro 16 2023 M3 Max | |
| Asus ROG Zephyrus G16 2024 GU605M | |
| Dell XPS 16 9640 | |
| Asus Zenbook Pro 16X UX7602BZ-MY005W | |
| Lenovo Yoga Pro 9 16IMH9 | |
| Ortalama AMD Ryzen AI 9 HX 370 (140 - 192, n=16) | |
| Asus ProArt P16 H7606WI | |
| SCHENKER XMG Pro 16 Studio (Mid 24) | |
| 7-Zip 18.03 / 7z b 4 | |
| SCHENKER XMG Pro 16 Studio (Mid 24) | |
| Asus ProArt P16 H7606WI | |
| Ortalama AMD Ryzen AI 9 HX 370 (66154 - 83714, n=16) | |
| Lenovo Yoga Pro 9 16IMH9 | |
| Dell XPS 16 9640 | |
| Asus Zenbook Pro 16X UX7602BZ-MY005W | |
| Asus ROG Zephyrus G16 2024 GU605M | |
| Sınıf ortalaması Multimedia (29095 - 130368, n=75, son 2 yıl) | |
| 7-Zip 18.03 / 7z b 4 -mmt1 | |
| SCHENKER XMG Pro 16 Studio (Mid 24) | |
| Asus ProArt P16 H7606WI | |
| Ortalama AMD Ryzen AI 9 HX 370 (5859 - 6497, n=16) | |
| Sınıf ortalaması Multimedia (3398 - 7545, n=75, son 2 yıl) | |
| Lenovo Yoga Pro 9 16IMH9 | |
| Asus Zenbook Pro 16X UX7602BZ-MY005W | |
| Dell XPS 16 9640 | |
| Asus ROG Zephyrus G16 2024 GU605M | |
| Geekbench 6.4 / Multi-Core | |
| Apple MacBook Pro 16 2023 M3 Max | |
| SCHENKER XMG Pro 16 Studio (Mid 24) | |
| Asus ProArt P16 H7606WI | |
| Ortalama AMD Ryzen AI 9 HX 370 (11973 - 15671, n=18) | |
| Asus Zenbook Pro 16X UX7602BZ-MY005W | |
| Lenovo Yoga Pro 9 16IMH9 | |
| Dell XPS 16 9640 | |
| Sınıf ortalaması Multimedia (4983 - 25760, n=77, son 2 yıl) | |
| Asus ROG Zephyrus G16 2024 GU605M | |
| Geekbench 6.4 / Single-Core | |
| Apple MacBook Pro 16 2023 M3 Max | |
| Asus ProArt P16 H7606WI | |
| Ortalama AMD Ryzen AI 9 HX 370 (2780 - 2965, n=18) | |
| SCHENKER XMG Pro 16 Studio (Mid 24) | |
| Sınıf ortalaması Multimedia (1534 - 3927, n=73, son 2 yıl) | |
| Lenovo Yoga Pro 9 16IMH9 | |
| Dell XPS 16 9640 | |
| Asus ROG Zephyrus G16 2024 GU605M | |
| Asus Zenbook Pro 16X UX7602BZ-MY005W | |
| Geekbench 5.5 / Multi-Core | |
| Apple MacBook Pro 16 2023 M3 Max | |
| SCHENKER XMG Pro 16 Studio (Mid 24) | |
| Asus ProArt P16 H7606WI | |
| Lenovo Yoga Pro 9 16IMH9 | |
| Ortalama AMD Ryzen AI 9 HX 370 (11394 - 15407, n=17) | |
| Asus Zenbook Pro 16X UX7602BZ-MY005W | |
| Dell XPS 16 9640 | |
| Asus ROG Zephyrus G16 2024 GU605M | |
| Sınıf ortalaması Multimedia (4652 - 23059, n=79, son 2 yıl) | |
| Geekbench 5.5 / Single-Core | |
| Apple MacBook Pro 16 2023 M3 Max | |
| Ortalama AMD Ryzen AI 9 HX 370 (1957 - 2136, n=17) | |
| Asus ProArt P16 H7606WI | |
| SCHENKER XMG Pro 16 Studio (Mid 24) | |
| Lenovo Yoga Pro 9 16IMH9 | |
| Sınıf ortalaması Multimedia (891 - 2555, n=79, son 2 yıl) | |
| Dell XPS 16 9640 | |
| Asus ROG Zephyrus G16 2024 GU605M | |
| Asus Zenbook Pro 16X UX7602BZ-MY005W | |
| HWBOT x265 Benchmark v2.2 / 4k Preset | |
| SCHENKER XMG Pro 16 Studio (Mid 24) | |
| Ortalama AMD Ryzen AI 9 HX 370 (20.3 - 28.7, n=16) | |
| Asus ProArt P16 H7606WI | |
| Lenovo Yoga Pro 9 16IMH9 | |
| Asus Zenbook Pro 16X UX7602BZ-MY005W | |
| Dell XPS 16 9640 | |
| Asus ROG Zephyrus G16 2024 GU605M | |
| Sınıf ortalaması Multimedia (5.26 - 34.3, n=74, son 2 yıl) | |
| LibreOffice / 20 Documents To PDF | |
| Asus ProArt P16 H7606WI | |
| Ortalama AMD Ryzen AI 9 HX 370 (46.8 - 66.6, n=16) | |
| Sınıf ortalaması Multimedia (23.9 - 146.7, n=76, son 2 yıl) | |
| Asus ROG Zephyrus G16 2024 GU605M | |
| Asus Zenbook Pro 16X UX7602BZ-MY005W | |
| SCHENKER XMG Pro 16 Studio (Mid 24) | |
| Dell XPS 16 9640 | |
| Lenovo Yoga Pro 9 16IMH9 | |
| R Benchmark 2.5 / Overall mean | |
| Dell XPS 16 9640 | |
| Asus Zenbook Pro 16X UX7602BZ-MY005W | |
| Sınıf ortalaması Multimedia (0.3604 - 0.947, n=74, son 2 yıl) | |
| Asus ROG Zephyrus G16 2024 GU605M | |
| Lenovo Yoga Pro 9 16IMH9 | |
| Ortalama AMD Ryzen AI 9 HX 370 (0.3892 - 0.529, n=16) | |
| SCHENKER XMG Pro 16 Studio (Mid 24) | |
| Asus ProArt P16 H7606WI | |
* ... daha küçük daha iyidir
AIDA64: FP32 Ray-Trace | FPU Julia | CPU SHA3 | CPU Queen | FPU SinJulia | FPU Mandel | CPU AES | CPU ZLib | FP64 Ray-Trace | CPU PhotoWorxx
| Performance Rating | |
| Asus ProArt P16 H7606WI -2! | |
| Ortalama AMD Ryzen AI 9 HX 370 | |
| SCHENKER XMG Pro 16 Studio (Mid 24) | |
| Lenovo Yoga Pro 9 16IMH9 | |
| Asus Zenbook Pro 16X UX7602BZ-MY005W | |
| Dell XPS 16 9640 | |
| Asus ROG Zephyrus G16 2024 GU605M | |
| Sınıf ortalaması Multimedia | |
| AIDA64 / FP32 Ray-Trace | |
| Ortalama AMD Ryzen AI 9 HX 370 (24673 - 37654, n=15) | |
| SCHENKER XMG Pro 16 Studio (Mid 24) | |
| Asus Zenbook Pro 16X UX7602BZ-MY005W | |
| Lenovo Yoga Pro 9 16IMH9 | |
| Dell XPS 16 9640 | |
| Asus ROG Zephyrus G16 2024 GU605M | |
| Sınıf ortalaması Multimedia (5121 - 50388, n=73, son 2 yıl) | |
| AIDA64 / FPU Julia | |
| Asus ProArt P16 H7606WI | |
| Ortalama AMD Ryzen AI 9 HX 370 (95655 - 147937, n=16) | |
| SCHENKER XMG Pro 16 Studio (Mid 24) | |
| Lenovo Yoga Pro 9 16IMH9 | |
| Asus Zenbook Pro 16X UX7602BZ-MY005W | |
| Dell XPS 16 9640 | |
| Asus ROG Zephyrus G16 2024 GU605M | |
| Sınıf ortalaması Multimedia (14528 - 201874, n=74, son 2 yıl) | |
| AIDA64 / CPU SHA3 | |
| Asus ProArt P16 H7606WI | |
| SCHENKER XMG Pro 16 Studio (Mid 24) | |
| Ortalama AMD Ryzen AI 9 HX 370 (4421 - 5843, n=16) | |
| Lenovo Yoga Pro 9 16IMH9 | |
| Asus Zenbook Pro 16X UX7602BZ-MY005W | |
| Dell XPS 16 9640 | |
| Asus ROG Zephyrus G16 2024 GU605M | |
| Sınıf ortalaması Multimedia (1188 - 8623, n=74, son 2 yıl) | |
| AIDA64 / CPU Queen | |
| SCHENKER XMG Pro 16 Studio (Mid 24) | |
| Asus ProArt P16 H7606WI | |
| Asus Zenbook Pro 16X UX7602BZ-MY005W | |
| Lenovo Yoga Pro 9 16IMH9 | |
| Asus ROG Zephyrus G16 2024 GU605M | |
| Dell XPS 16 9640 | |
| Sınıf ortalaması Multimedia (21547 - 181505, n=74, son 2 yıl) | |
| Ortalama AMD Ryzen AI 9 HX 370 (41744 - 99088, n=16) | |
| AIDA64 / FPU SinJulia | |
| Asus ProArt P16 H7606WI | |
| Ortalama AMD Ryzen AI 9 HX 370 (16445 - 19115, n=16) | |
| SCHENKER XMG Pro 16 Studio (Mid 24) | |
| Lenovo Yoga Pro 9 16IMH9 | |
| Asus ROG Zephyrus G16 2024 GU605M | |
| Dell XPS 16 9640 | |
| Asus Zenbook Pro 16X UX7602BZ-MY005W | |
| Sınıf ortalaması Multimedia (1240 - 28794, n=74, son 2 yıl) | |
| AIDA64 / FPU Mandel | |
| Ortalama AMD Ryzen AI 9 HX 370 (50357 - 79251, n=15) | |
| SCHENKER XMG Pro 16 Studio (Mid 24) | |
| Asus Zenbook Pro 16X UX7602BZ-MY005W | |
| Lenovo Yoga Pro 9 16IMH9 | |
| Dell XPS 16 9640 | |
| Asus ROG Zephyrus G16 2024 GU605M | |
| Sınıf ortalaması Multimedia (9903 - 105740, n=73, son 2 yıl) | |
| AIDA64 / CPU AES | |
| SCHENKER XMG Pro 16 Studio (Mid 24) | |
| Lenovo Yoga Pro 9 16IMH9 | |
| Dell XPS 16 9640 | |
| Asus ProArt P16 H7606WI | |
| Asus Zenbook Pro 16X UX7602BZ-MY005W | |
| Asus ROG Zephyrus G16 2024 GU605M | |
| Ortalama AMD Ryzen AI 9 HX 370 (67015 - 96781, n=16) | |
| Sınıf ortalaması Multimedia (26066 - 169946, n=74, son 2 yıl) | |
| AIDA64 / CPU ZLib | |
| SCHENKER XMG Pro 16 Studio (Mid 24) | |
| Asus ProArt P16 H7606WI | |
| Ortalama AMD Ryzen AI 9 HX 370 (1077 - 1530, n=16) | |
| Lenovo Yoga Pro 9 16IMH9 | |
| Dell XPS 16 9640 | |
| Asus Zenbook Pro 16X UX7602BZ-MY005W | |
| Asus ROG Zephyrus G16 2024 GU605M | |
| Sınıf ortalaması Multimedia (440 - 2022, n=74, son 2 yıl) | |
| AIDA64 / FP64 Ray-Trace | |
| Asus ProArt P16 H7606WI | |
| Ortalama AMD Ryzen AI 9 HX 370 (13665 - 20608, n=16) | |
| SCHENKER XMG Pro 16 Studio (Mid 24) | |
| Asus Zenbook Pro 16X UX7602BZ-MY005W | |
| Lenovo Yoga Pro 9 16IMH9 | |
| Dell XPS 16 9640 | |
| Asus ROG Zephyrus G16 2024 GU605M | |
| Sınıf ortalaması Multimedia (2759 - 26875, n=74, son 2 yıl) | |
| AIDA64 / CPU PhotoWorxx | |
| Asus Zenbook Pro 16X UX7602BZ-MY005W | |
| Lenovo Yoga Pro 9 16IMH9 | |
| Dell XPS 16 9640 | |
| Asus ROG Zephyrus G16 2024 GU605M | |
| SCHENKER XMG Pro 16 Studio (Mid 24) | |
| Asus ProArt P16 H7606WI | |
| Ortalama AMD Ryzen AI 9 HX 370 (36752 - 51727, n=16) | |
| Sınıf ortalaması Multimedia (12860 - 58844, n=74, son 2 yıl) | |
Sistem performansı
Hem günlük durumlarda hem de sentetik kıyaslamalarda ProArt P16 çok hızlı ve duyarlı bir sistemdir ve zorlu görevler için yeterli rezervler sunar. Küçük PX13'ün aksine 64 GB RAM opsiyonel olarak sunuluyor. Testler sırasında LatencyMon'u başlatamadık ve F1 24'te tekrarlanabilir mavi ekranlar vardı. Ancak, bunun bir sürücü sorunu olduğunu varsayıyoruz ve AMD ile zaten iletişim halindeyiz.
CrossMark: Overall | Productivity | Creativity | Responsiveness
WebXPRT 3: Overall
WebXPRT 4: Overall
Mozilla Kraken 1.1: Total
| PCMark 10 / Score | |
| SCHENKER XMG Pro 16 Studio (Mid 24) | |
| Asus Zenbook Pro 16X UX7602BZ-MY005W | |
| Asus ProArt P16 H7606WI | |
| Ortalama AMD Ryzen AI 9 HX 370, NVIDIA GeForce RTX 4070 Laptop GPU (7696 - 7752, n=3) | |
| Lenovo Yoga Pro 9 16IMH9 | |
| Asus ROG Zephyrus G16 2024 GU605M | |
| Dell XPS 16 9640 | |
| Sınıf ortalaması Multimedia (4325 - 8670, n=70, son 2 yıl) | |
| PCMark 10 / Essentials | |
| Asus Zenbook Pro 16X UX7602BZ-MY005W | |
| Lenovo Yoga Pro 9 16IMH9 | |
| SCHENKER XMG Pro 16 Studio (Mid 24) | |
| Sınıf ortalaması Multimedia (8025 - 12420, n=70, son 2 yıl) | |
| Dell XPS 16 9640 | |
| Asus ROG Zephyrus G16 2024 GU605M | |
| Asus ProArt P16 H7606WI | |
| Ortalama AMD Ryzen AI 9 HX 370, NVIDIA GeForce RTX 4070 Laptop GPU (9856 - 10144, n=3) | |
| PCMark 10 / Productivity | |
| SCHENKER XMG Pro 16 Studio (Mid 24) | |
| Asus Zenbook Pro 16X UX7602BZ-MY005W | |
| Asus ProArt P16 H7606WI | |
| Ortalama AMD Ryzen AI 9 HX 370, NVIDIA GeForce RTX 4070 Laptop GPU (9713 - 10027, n=3) | |
| Asus ROG Zephyrus G16 2024 GU605M | |
| Dell XPS 16 9640 | |
| Lenovo Yoga Pro 9 16IMH9 | |
| Sınıf ortalaması Multimedia (6089 - 10615, n=70, son 2 yıl) | |
| PCMark 10 / Digital Content Creation | |
| Asus ProArt P16 H7606WI | |
| Ortalama AMD Ryzen AI 9 HX 370, NVIDIA GeForce RTX 4070 Laptop GPU (12165 - 13205, n=3) | |
| SCHENKER XMG Pro 16 Studio (Mid 24) | |
| Asus Zenbook Pro 16X UX7602BZ-MY005W | |
| Lenovo Yoga Pro 9 16IMH9 | |
| Asus ROG Zephyrus G16 2024 GU605M | |
| Dell XPS 16 9640 | |
| Sınıf ortalaması Multimedia (3651 - 13548, n=70, son 2 yıl) | |
| CrossMark / Overall | |
| SCHENKER XMG Pro 16 Studio (Mid 24) | |
| Apple MacBook Pro 16 2023 M3 Max | |
| Asus Zenbook Pro 16X UX7602BZ-MY005W | |
| Dell XPS 16 9640 | |
| Asus ProArt P16 H7606WI | |
| Ortalama AMD Ryzen AI 9 HX 370, NVIDIA GeForce RTX 4070 Laptop GPU (1785 - 1794, n=2) | |
| Sınıf ortalaması Multimedia (866 - 2255, n=81, son 2 yıl) | |
| Asus ROG Zephyrus G16 2024 GU605M | |
| Lenovo Yoga Pro 9 16IMH9 | |
| CrossMark / Productivity | |
| SCHENKER XMG Pro 16 Studio (Mid 24) | |
| Asus Zenbook Pro 16X UX7602BZ-MY005W | |
| Apple MacBook Pro 16 2023 M3 Max | |
| Dell XPS 16 9640 | |
| Sınıf ortalaması Multimedia (913 - 2050, n=81, son 2 yıl) | |
| Asus ROG Zephyrus G16 2024 GU605M | |
| Lenovo Yoga Pro 9 16IMH9 | |
| Asus ProArt P16 H7606WI | |
| Ortalama AMD Ryzen AI 9 HX 370, NVIDIA GeForce RTX 4070 Laptop GPU (1611 - 1611, n=2) | |
| CrossMark / Creativity | |
| Apple MacBook Pro 16 2023 M3 Max | |
| SCHENKER XMG Pro 16 Studio (Mid 24) | |
| Asus Zenbook Pro 16X UX7602BZ-MY005W | |
| Asus ProArt P16 H7606WI | |
| Ortalama AMD Ryzen AI 9 HX 370, NVIDIA GeForce RTX 4070 Laptop GPU (2212 - 2270, n=2) | |
| Dell XPS 16 9640 | |
| Lenovo Yoga Pro 9 16IMH9 | |
| Sınıf ortalaması Multimedia (907 - 2795, n=81, son 2 yıl) | |
| Asus ROG Zephyrus G16 2024 GU605M | |
| CrossMark / Responsiveness | |
| SCHENKER XMG Pro 16 Studio (Mid 24) | |
| Dell XPS 16 9640 | |
| Asus Zenbook Pro 16X UX7602BZ-MY005W | |
| Apple MacBook Pro 16 2023 M3 Max | |
| Sınıf ortalaması Multimedia (605 - 2094, n=81, son 2 yıl) | |
| Asus ROG Zephyrus G16 2024 GU605M | |
| Lenovo Yoga Pro 9 16IMH9 | |
| Ortalama AMD Ryzen AI 9 HX 370, NVIDIA GeForce RTX 4070 Laptop GPU (1225 - 1274, n=2) | |
| Asus ProArt P16 H7606WI | |
| WebXPRT 3 / Overall | |
| Apple MacBook Pro 16 2023 M3 Max | |
| Sınıf ortalaması Multimedia (136.4 - 545, n=81, son 2 yıl) | |
| SCHENKER XMG Pro 16 Studio (Mid 24) | |
| Asus ProArt P16 H7606WI | |
| Lenovo Yoga Pro 9 16IMH9 | |
| Ortalama AMD Ryzen AI 9 HX 370, NVIDIA GeForce RTX 4070 Laptop GPU (282 - 298, n=2) | |
| Asus ROG Zephyrus G16 2024 GU605M | |
| Dell XPS 16 9640 | |
| WebXPRT 4 / Overall | |
| SCHENKER XMG Pro 16 Studio (Mid 24) | |
| Sınıf ortalaması Multimedia (133.2 - 353, n=75, son 2 yıl) | |
| Lenovo Yoga Pro 9 16IMH9 | |
| Asus ROG Zephyrus G16 2024 GU605M | |
| Dell XPS 16 9640 | |
| Ortalama AMD Ryzen AI 9 HX 370, NVIDIA GeForce RTX 4070 Laptop GPU (244 - 247, n=2) | |
| Asus ProArt P16 H7606WI | |
| Asus Zenbook Pro 16X UX7602BZ-MY005W | |
| Mozilla Kraken 1.1 / Total | |
| Asus ROG Zephyrus G16 2024 GU605M | |
| Asus Zenbook Pro 16X UX7602BZ-MY005W | |
| Lenovo Yoga Pro 9 16IMH9 | |
| Sınıf ortalaması Multimedia (254 - 1016, n=86, son 2 yıl) | |
| SCHENKER XMG Pro 16 Studio (Mid 24) | |
| Ortalama AMD Ryzen AI 9 HX 370, NVIDIA GeForce RTX 4070 Laptop GPU (439 - 460, n=2) | |
| Asus ProArt P16 H7606WI | |
| Apple MacBook Pro 16 2023 M3 Max | |
* ... daha küçük daha iyidir
| PCMark 10 Score | 7752 puan | |
Yardım | ||
| AIDA64 / Memory Copy | |
| Lenovo Yoga Pro 9 16IMH9 | |
| Dell XPS 16 9640 | |
| Asus ProArt P16 H7606WI | |
| Asus ROG Zephyrus G16 2024 GU605M | |
| Asus Zenbook Pro 16X UX7602BZ-MY005W | |
| Ortalama AMD Ryzen AI 9 HX 370 (72702 - 93640, n=16) | |
| SCHENKER XMG Pro 16 Studio (Mid 24) | |
| Sınıf ortalaması Multimedia (21158 - 104459, n=74, son 2 yıl) | |
| AIDA64 / Memory Read | |
| Asus ProArt P16 H7606WI | |
| Ortalama AMD Ryzen AI 9 HX 370 (84635 - 102937, n=16) | |
| Lenovo Yoga Pro 9 16IMH9 | |
| Asus ROG Zephyrus G16 2024 GU605M | |
| SCHENKER XMG Pro 16 Studio (Mid 24) | |
| Dell XPS 16 9640 | |
| Asus Zenbook Pro 16X UX7602BZ-MY005W | |
| Sınıf ortalaması Multimedia (24312 - 125604, n=74, son 2 yıl) | |
| AIDA64 / Memory Write | |
| Asus Zenbook Pro 16X UX7602BZ-MY005W | |
| Asus ProArt P16 H7606WI | |
| Ortalama AMD Ryzen AI 9 HX 370 (83907 - 108954, n=16) | |
| Lenovo Yoga Pro 9 16IMH9 | |
| Dell XPS 16 9640 | |
| Asus ROG Zephyrus G16 2024 GU605M | |
| SCHENKER XMG Pro 16 Studio (Mid 24) | |
| Sınıf ortalaması Multimedia (23679 - 117933, n=74, son 2 yıl) | |
| AIDA64 / Memory Latency | |
| Asus ROG Zephyrus G16 2024 GU605M | |
| Dell XPS 16 9640 | |
| Lenovo Yoga Pro 9 16IMH9 | |
| Asus ProArt P16 H7606WI | |
| Sınıf ortalaması Multimedia (7 - 346, n=74, son 2 yıl) | |
| Ortalama AMD Ryzen AI 9 HX 370 (87.2 - 119.4, n=16) | |
| Asus Zenbook Pro 16X UX7602BZ-MY005W | |
| SCHENKER XMG Pro 16 Studio (Mid 24) | |
* ... daha küçük daha iyidir
DPC gecikme süreleri
Daha önce de belirttiğimiz gibi, inceleme cihazımızla LatencyMon'u başlatamadık. Bununla birlikte, en azından 4K video oynatmada (YouTube) düşen kareler açısından herhangi bir sorun yoktu.
Yığın depolama
İnceleme cihazımız 1 TB Micron 2400 varyantı ile donatılmıştır, ancak ilk kurulumdan sonra kullanıcıya 879 GB sunulmaktadır. Birincil M.2 2280 SSD, hızlı bir PCIe 4.0 x4 arayüzü ile bağlanmıştır, ancak rakipleriyle karşılaştırıldığında SSD performansı özellikle iyi değildir. Bununla birlikte, performans uzun süreli yüklerde sabit kalmaktadır. ProArt P16 ayrıca ikinci bir M.2 2280 yuvası sunar, bu da depolama biriminin kolayca yükseltilebileceği anlamına gelir. Ancak ikinci yuva yalnızca Pcie 4.0 x2 ile bağlanır ve bu da maksimum 4 GB/s hız ile sınırlıdır. Ek SSD kıyaslamalarını aşağıda bulabilirsiniz burada.

* ... daha küçük daha iyidir
Continuous Performance Read: DiskSpd Read Loop, Queue Depth 8
Grafik kartı - GeForce RTX 4070 dizüstü bilgisayar
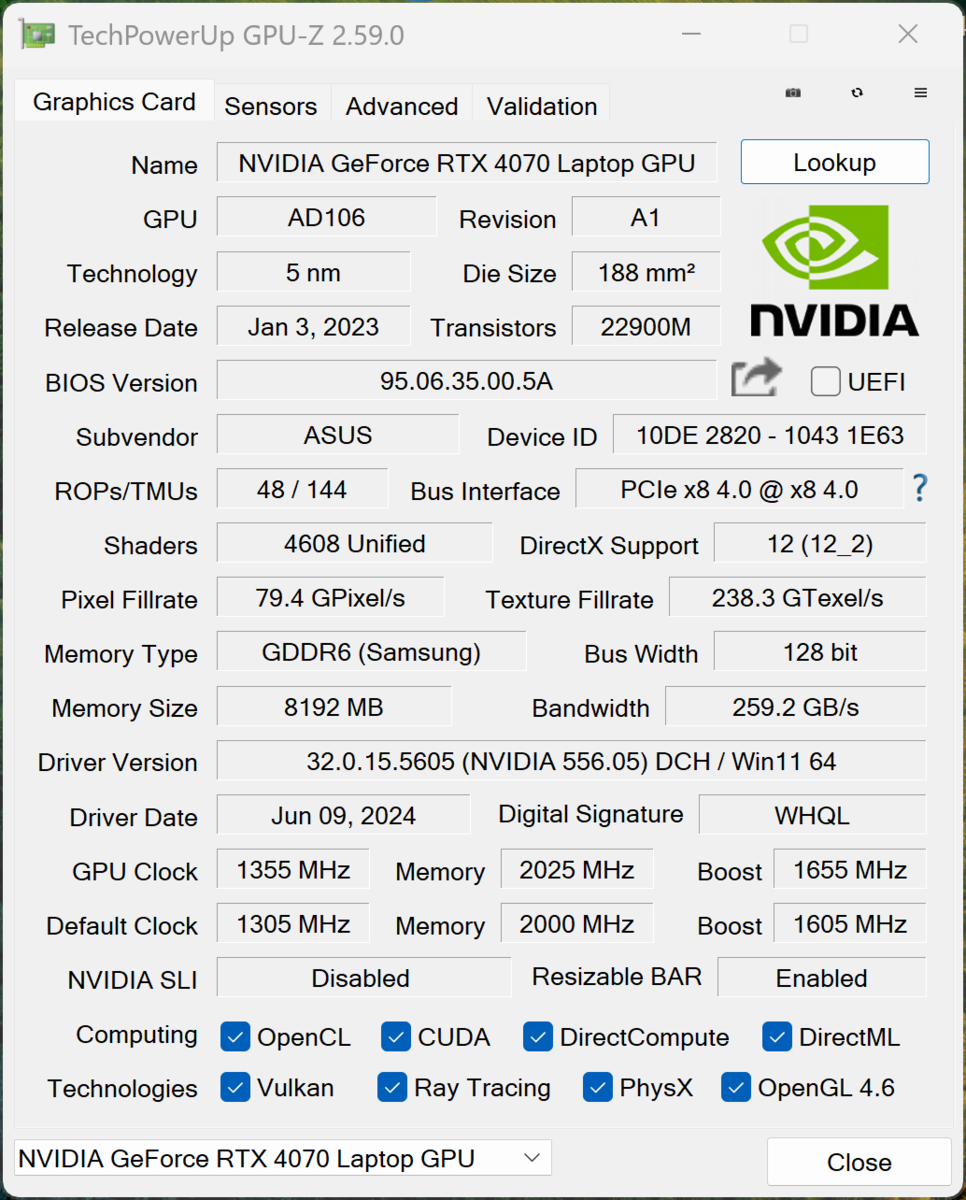
En üst modelimiz olan ProArt P16, özel olarak tasarlanmış bir GeForce RTX 4070 dizüstü bilgisayar. Maksimum güç tüketimi 105 watt'tır (85 watt TGP + 20 watt Dynamic Boost) ve grafik anahtarlama standart Optimus teknolojisi ile yapılır. Daha az zorlu görevlerde, grafik hesaplamaları entegre Optimus teknolojisi tarafından gerçekleştirilir Radeon 890M.
GPU kıyaslamalarında, performans diğer RTX 4070 rakipleriyle aynı seviyede ancak RTX 4080 dizüstü bilgisayar içinde bulunan Zenbook Pro 16X (maks. 140 watt) anlaşılabilir (ve fark edilebilir) şekilde daha hızlıdır. Apple's M3 Max GPU ayrıca, RTX 4070 dizüstü bilgisayarın 8 GB VRAM'i özellikle video düzenlerken hızla darboğaz haline gelebilirken, RTX 4070 dizüstü bilgisayar önemli ölçüde daha hızlıdır ve tüm RAM'e erişme avantajına sahiptir.
Sürekli yük altında GPU tamamen stabil kalıyor. Pil modunda, RTX 4070'in maksimum 42 watt çekmesine izin verilir, bu nedenle GPU performansı bu durumda önemli ölçüde düşüktür (-% 35). Ek grafik kıyaslamaları bulunabilir burada.
| GFXBench | |
| 3840x2160 4K Aztec Ruins High Tier Offscreen | |
| Apple MacBook Pro 16 2023 M3 Max | |
| Ortalama NVIDIA GeForce RTX 4070 Laptop GPU (123.9 - 127.6, n=2) | |
| Asus ProArt P16 H7606WI | |
| Sınıf ortalaması Multimedia (36.4 - 232, n=16, son 2 yıl) | |
| 2560x1440 Aztec Ruins High Tier Offscreen | |
| Apple MacBook Pro 16 2023 M3 Max | |
| Ortalama NVIDIA GeForce RTX 4070 Laptop GPU (282 - 289, n=2) | |
| Asus ProArt P16 H7606WI | |
| Sınıf ortalaması Multimedia (73.3 - 516, n=16, son 2 yıl) | |
| 1920x1080 Aztec Ruins Normal Tier Offscreen | |
| Apple MacBook Pro 16 2023 M3 Max | |
| Ortalama NVIDIA GeForce RTX 4070 Laptop GPU (696 - 736, n=2) | |
| Asus ProArt P16 H7606WI | |
| Sınıf ortalaması Multimedia (178.3 - 1302, n=15, son 2 yıl) | |
| 3DMark 11 Performance | 33231 puan | |
| 3DMark Fire Strike Score | 26198 puan | |
| 3DMark Time Spy Score | 11790 puan | |
| 3DMark Steel Nomad Score | 2637 puan | |
| 3DMark Steel Nomad Light Score | 12189 puan | |
Yardım | ||
| Blender / v3.3 Classroom OPTIX/RTX | |
| Sınıf ortalaması Multimedia (19 - 105, n=39, son 2 yıl) | |
| SCHENKER XMG Pro 16 Studio (Mid 24) | |
| Asus ROG Zephyrus G16 2024 GU605M | |
| Asus ProArt P16 H7606WI | |
| Ortalama NVIDIA GeForce RTX 4070 Laptop GPU (18 - 30, n=67) | |
| Dell XPS 16 9640 | |
| Lenovo Yoga Pro 9 16IMH9 | |
| Asus Zenbook Pro 16X UX7602BZ-MY005W | |
| Blender / v3.3 Classroom CUDA | |
| Sınıf ortalaması Multimedia (32 - 164, n=39, son 2 yıl) | |
| Dell XPS 16 9640 | |
| Ortalama NVIDIA GeForce RTX 4070 Laptop GPU (32 - 50, n=66) | |
| Asus ROG Zephyrus G16 2024 GU605M | |
| SCHENKER XMG Pro 16 Studio (Mid 24) | |
| Asus ProArt P16 H7606WI | |
| Lenovo Yoga Pro 9 16IMH9 | |
| Asus Zenbook Pro 16X UX7602BZ-MY005W | |
| Blender / v3.3 Classroom CPU | |
| Sınıf ortalaması Multimedia (160 - 1042, n=80, son 2 yıl) | |
| Asus ROG Zephyrus G16 2024 GU605M | |
| Dell XPS 16 9640 | |
| Ortalama NVIDIA GeForce RTX 4070 Laptop GPU (158 - 440, n=66) | |
| Lenovo Yoga Pro 9 16IMH9 | |
| Asus Zenbook Pro 16X UX7602BZ-MY005W | |
| SCHENKER XMG Pro 16 Studio (Mid 24) | |
| Asus ProArt P16 H7606WI | |
| Apple MacBook Pro 16 2023 M3 Max | |
| Blender / v3.3 Classroom METAL | |
| Sınıf ortalaması Multimedia (17.8 - 121, n=7, son 2 yıl) | |
| Apple MacBook Pro 16 2023 M3 Max | |
* ... daha küçük daha iyidir
Oyun performansı
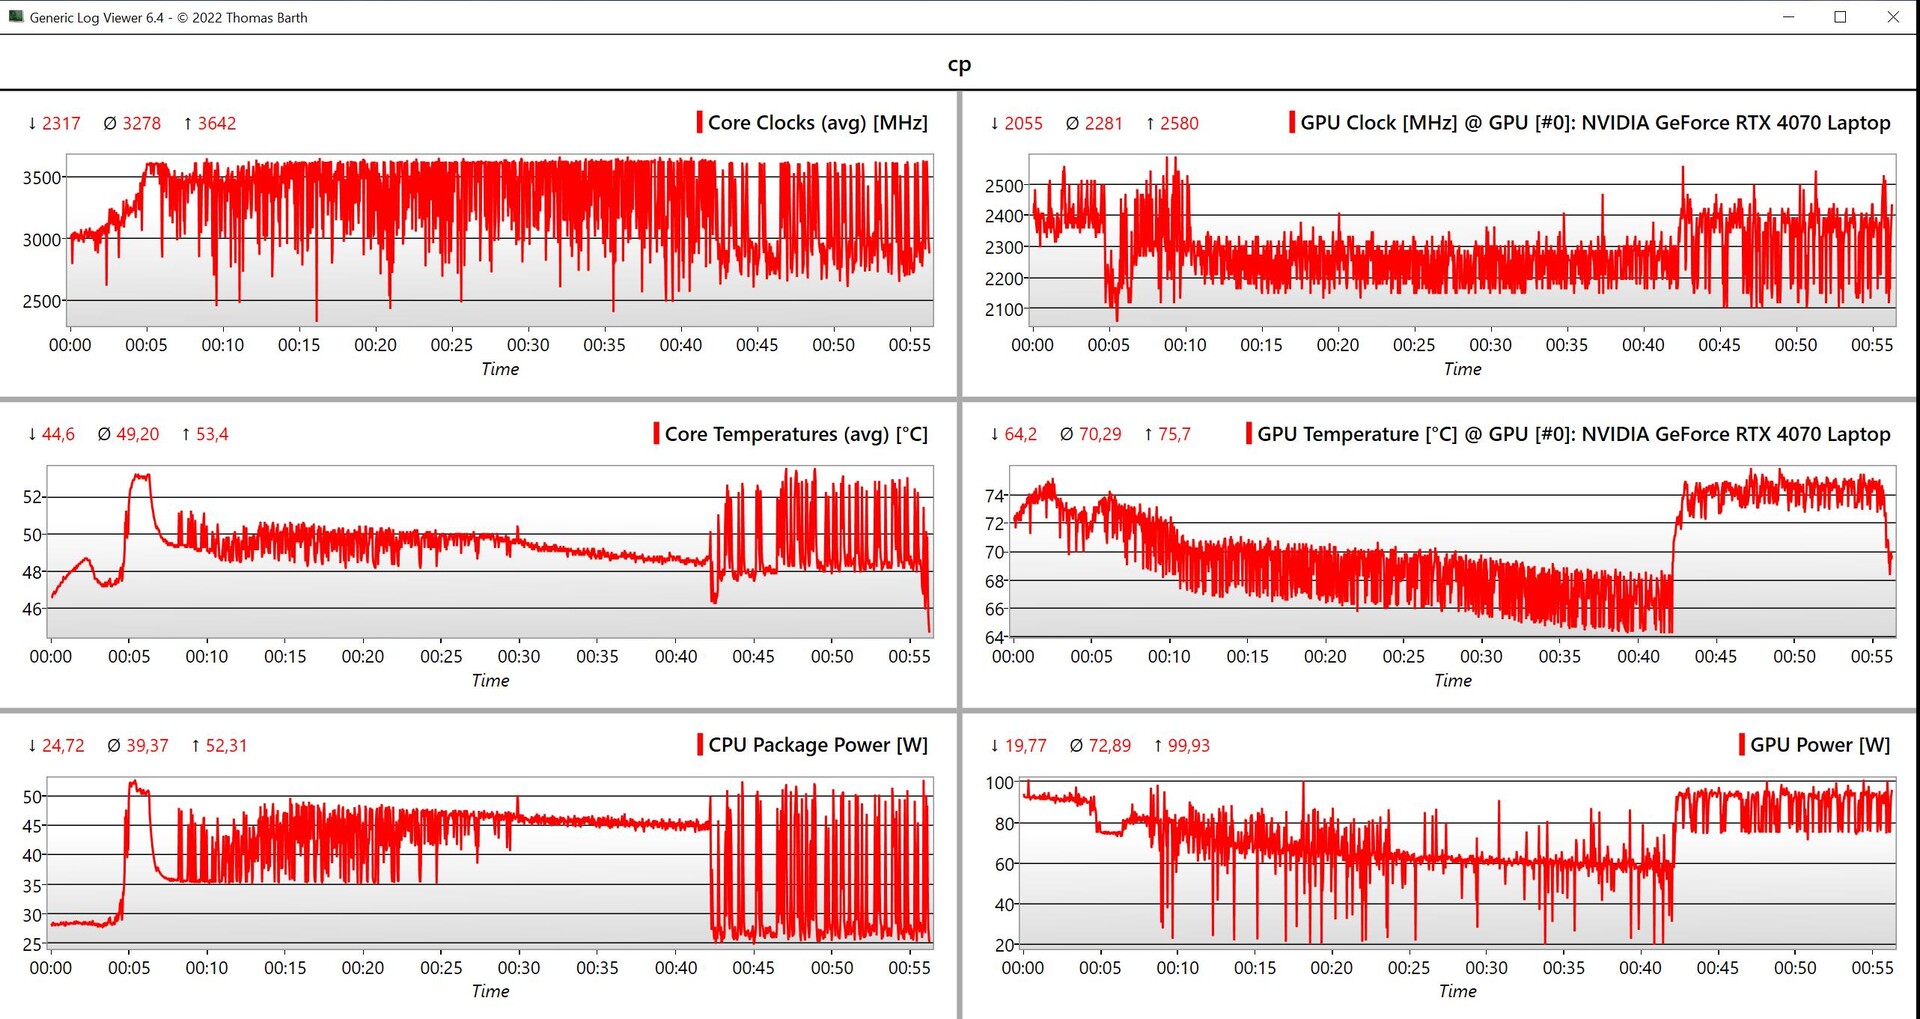
Sonuç olarak, ProArt P16'nın oyun performansı çok iyi ve sonuçlar bir RTX 4070 dizüstü bilgisayardan bekleyeceğiniz düzeyde. Güncel oyunlar bile QHD çözünürlükte zahmetsizce çalışıyor. Buna karşılık, doğal 4K çözünürlük için, zorlu oyunlar için Nvidia'nın DLSS teknolojisi gibi üst örneklemeye başvurmanız gerekir. Cyberpunk döngümüzde ilginç ve tekrarlanabilir bir sorunla karşılaştık. Grafik performansı ve stres testindeki genel performans (sıcaklık bölümüne bakın) tamamen sabit kalmasına rağmen, ilk 42 dakikada Cyberpunk'taki oyun performansı sürekli olarak bir miktar düştü. Bu durum CPU/GPU verileri değerlendirilirken açıkça görülebilir, ancak 42 dakika sonra performans başlangıç seviyesine döndü ve bu seviyede sabit kaldı. Şu anda bu davranışı açıklayamıyoruz ve testlerimizde bu sadece Cyberpunk'ta meydana geldi.
| The Witcher 3 - 1920x1080 Ultra Graphics & Postprocessing (HBAO+) | |
| Asus Zenbook Pro 16X UX7602BZ-MY005W | |
| Asus ProArt P16 H7606WI | |
| Lenovo Yoga Pro 9 16IMH9 | |
| Asus ROG Zephyrus G16 2024 GU605M | |
| Dell XPS 16 9640 | |
| Sınıf ortalaması Multimedia (11 - 143.2, n=62, son 2 yıl) | |
| GTA V - 1920x1080 Highest Settings possible AA:4xMSAA + FX AF:16x | |
| Asus Zenbook Pro 16X UX7602BZ-MY005W | |
| SCHENKER XMG Pro 16 Studio (Mid 24) | |
| Asus ProArt P16 H7606WI | |
| Lenovo Yoga Pro 9 16IMH9 | |
| Dell XPS 16 9640 | |
| Asus ROG Zephyrus G16 2024 GU605M | |
| Sınıf ortalaması Multimedia (9.38 - 141.6, n=77, son 2 yıl) | |
| Call of Duty Modern Warfare 3 2023 | |
| 1920x1080 Extreme Preset | |
| Asus ProArt P16 H7606WI | |
| Ortalama NVIDIA GeForce RTX 4070 Laptop GPU (92 - 120, n=7) | |
| Asus ROG Zephyrus G16 2024 GU605M | |
| Sınıf ortalaması Multimedia (27 - 120, n=6, son 2 yıl) | |
| 2560x1440 Extreme Preset | |
| Asus ProArt P16 H7606WI | |
| Ortalama NVIDIA GeForce RTX 4070 Laptop GPU (64 - 83, n=6) | |
| Asus ROG Zephyrus G16 2024 GU605M | |
| Sınıf ortalaması Multimedia (29 - 83, n=3, son 2 yıl) | |
| Horizon Forbidden West | |
| 1920x1080 Very High Preset AA:T | |
| Lenovo Yoga Pro 9 16IMH9 | |
| Asus ProArt P16 H7606WI | |
| Ortalama NVIDIA GeForce RTX 4070 Laptop GPU (53.2 - 76.7, n=10) | |
| Dell XPS 16 9640 | |
| Sınıf ortalaması Multimedia (12.4 - 65.4, n=5, son 2 yıl) | |
| 2560x1440 Very High Preset AA:T | |
| Lenovo Yoga Pro 9 16IMH9 | |
| Ortalama NVIDIA GeForce RTX 4070 Laptop GPU (40.3 - 59.1, n=9) | |
| Asus ProArt P16 H7606WI | |
| Sınıf ortalaması Multimedia (40.3 - 56.1, n=3, son 2 yıl) | |
| Dell XPS 16 9640 | |
Cyberpunk 2077 ultra FPS diagram
| düşük | orta | yüksek | ultra | QHD | 4K | |
|---|---|---|---|---|---|---|
| GTA V (2015) | 168 | 111.2 | 86.6 | 83.7 | ||
| The Witcher 3 (2015) | 224 | 121 | 88 | 71 | ||
| Dota 2 Reborn (2015) | 165.7 | 151.4 | 148.1 | 141.6 | 129.9 | |
| Final Fantasy XV Benchmark (2018) | 189.3 | 152.9 | 115.3 | 85.3 | 47.2 | |
| X-Plane 11.11 (2018) | 95.2 | 88.7 | 72.3 | 63.4 | ||
| Far Cry 5 (2018) | 147 | 130 | 124 | 115 | 102 | 59 |
| Strange Brigade (2018) | 333 | 270 | 164.5 | 206 | 130 | 68.4 |
| F1 23 (2023) | 192.9 | 197.3 | 188.8 | 70.3 | 41 | 19.6 |
| Baldur's Gate 3 (2023) | 150 | 125.6 | 82.8 | 82.5 | 59.9 | 33.4 |
| Cyberpunk 2077 2.2 Phantom Liberty (2023) | 119.4 | 110 | 94.1 | 80.7 | 49.4 | 20.2 |
| Call of Duty Modern Warfare 3 2023 (2023) | 182 | 164 | 127 | 120 | 83 | 49 |
| Horizon Forbidden West (2024) | 100.2 | 91.5 | 71.8 | 64.4 | 49.9 | 30.4 |
Emisyonlar - Mükemmel hoparlörler
Gürültü emisyonları
Soğutma sistemi üç fandan oluşuyor ve ROG Zephyrus G16 ile yaptığımız testlerde üçüncü fanı kontrol etmekte sorun yaşamamıza rağmen bu sorun çözüldü. Performans modunda, neredeyse her zaman var olan sessiz bir gürültü var, ancak diğer iki modda, fanlar hem boşta çalışırken hem de zorlu görevleri yerine getirirken genellikle devre dışı kalıyor. Yük altında, hem Standart hem de Performans oldukça gürültülü olmasına rağmen üç profil belirgin şekilde farklılık gösterir.
| Enerji profili | 3DMark 06 | Cyberpunk 2077Stres testi |
|---|---|---|
| Fısıltı | 34 dB(A) | 42,2 dB(A) |
| Standart | 42,2 dB(A) | 47,1 dB(A) |
| Performans | 51,3 dB(A) | 53,2 dB(A) |
Ses yüksekliği
| Boşta |
| 24.4 / 27.7 / 32.3 dB |
| Çalışırken |
| 42.2 / 53.2 dB |
 | ||
30 dB sessiz 40 dB(A) duyulabilirlik 50 dB(A) gürültülü |
||
min: | ||
| Asus ProArt P16 H7606WI NVIDIA GeForce RTX 4070 Laptop GPU, Ryzen AI 9 HX 370, Micron 2400 MTFDKBA1T0QFM | SCHENKER XMG Pro 16 Studio (Mid 24) NVIDIA GeForce RTX 4070 Laptop GPU, i9-14900HX, Samsung 990 Pro 1 TB | Lenovo Yoga Pro 9 16IMH9 NVIDIA GeForce RTX 4070 Laptop GPU, Ultra 9 185H, SK Hynix HFS001TEJ9X115N | Dell XPS 16 9640 NVIDIA GeForce RTX 4070 Laptop GPU, Ultra 7 155H, Kioxia XG8 KXG80ZNV1T02 | Asus ROG Zephyrus G16 2024 GU605M NVIDIA GeForce RTX 4070 Laptop GPU, Ultra 7 155H, WD PC SN560 SDDPNQE-1T00 | Apple MacBook Pro 16 2023 M3 Max M3 Max 40-Core GPU, Apple M3 Max 16-Core, Apple SSD AP8192Z | Asus Zenbook Pro 16X UX7602BZ-MY005W NVIDIA GeForce RTX 4080 Laptop GPU, i9-13905H, Samsung PM9A1 MZVL22T0HBLB | |
|---|---|---|---|---|---|---|---|
| Noise | -8% | 3% | 7% | 7% | 12% | 7% | |
| kapalı / ortam * | 24.4 | 25 -2% | 24.3 -0% | 24.5 -0% | 23.9 2% | 23.7 3% | 24.9 -2% |
| Idle Minimum * | 24.4 | 28 -15% | 24.3 -0% | 24.5 -0% | 23.9 2% | 23.7 3% | 24.9 -2% |
| Idle Average * | 27.7 | 31 -12% | 24.3 12% | 24.5 12% | 27.8 -0% | 23.7 14% | 24.9 10% |
| Idle Maximum * | 32.3 | 35 -8% | 25.8 20% | 27.5 15% | 30.1 7% | 23.7 27% | 24.9 23% |
| Load Average * | 42.2 | 52 -23% | 48.1 -14% | 39.6 6% | 34.2 19% | 40.8 3% | 38 10% |
| Cyberpunk 2077 ultra * | 53.2 | 53 -0% | |||||
| Load Maximum * | 53.2 | 52 2% | 53.9 -1% | 49.7 7% | 46.4 13% | 42.8 20% | 51 4% |
| Witcher 3 ultra * | 49.7 | 49.7 | 46.4 | 42.8 |
* ... daha küçük daha iyidir
Sıcaklık
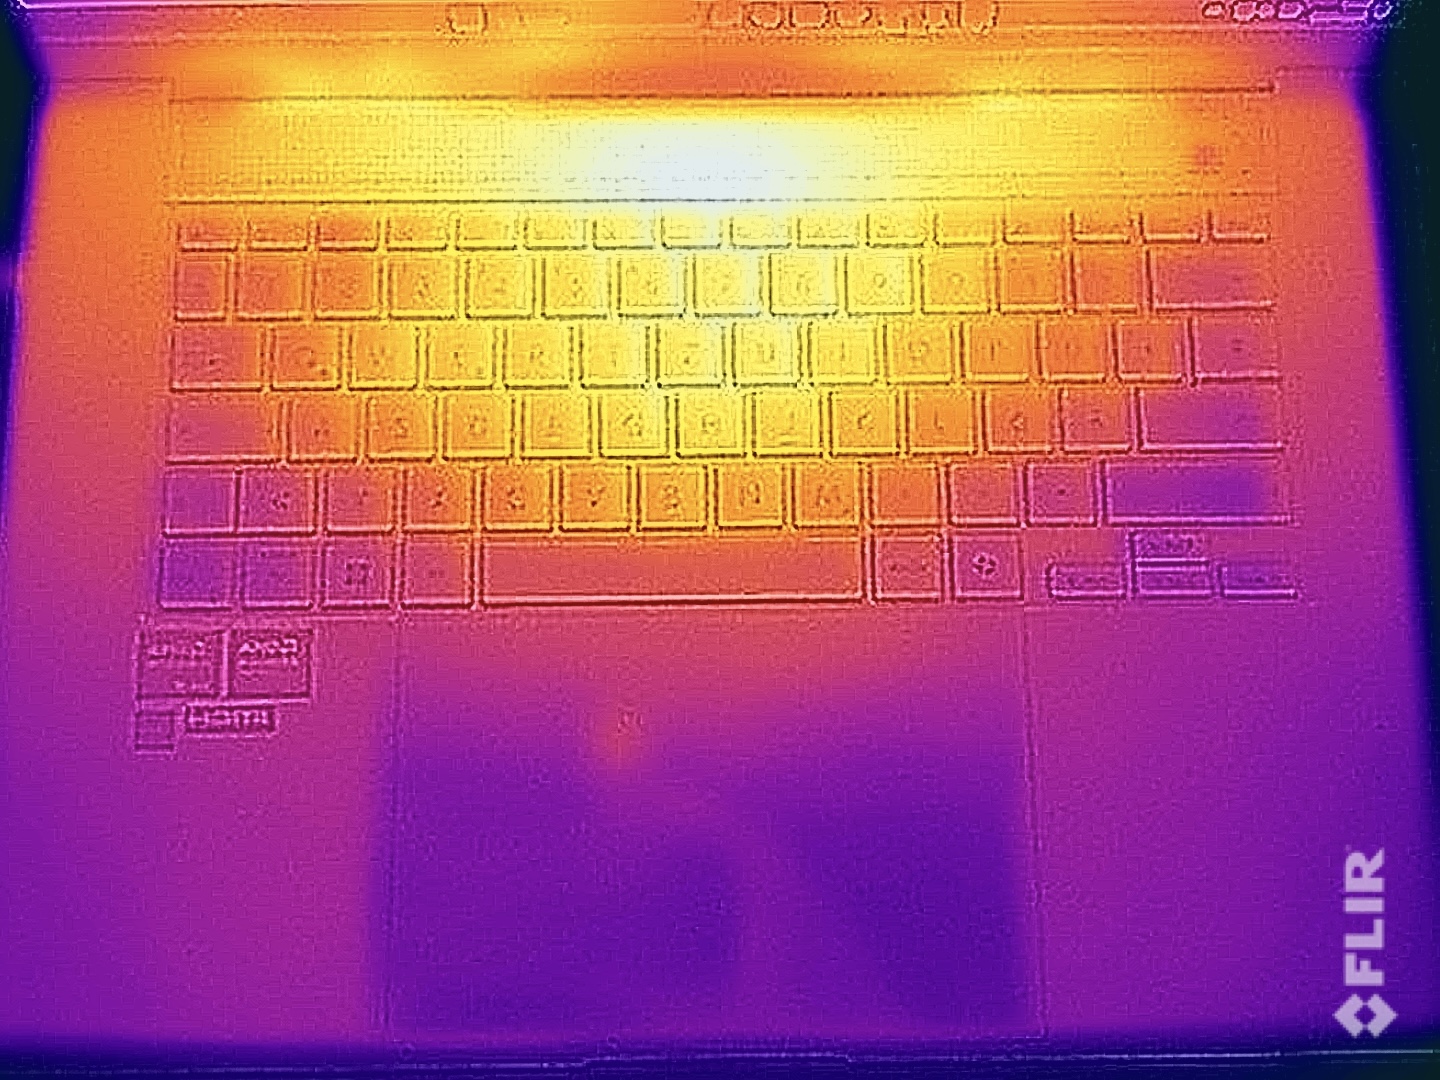
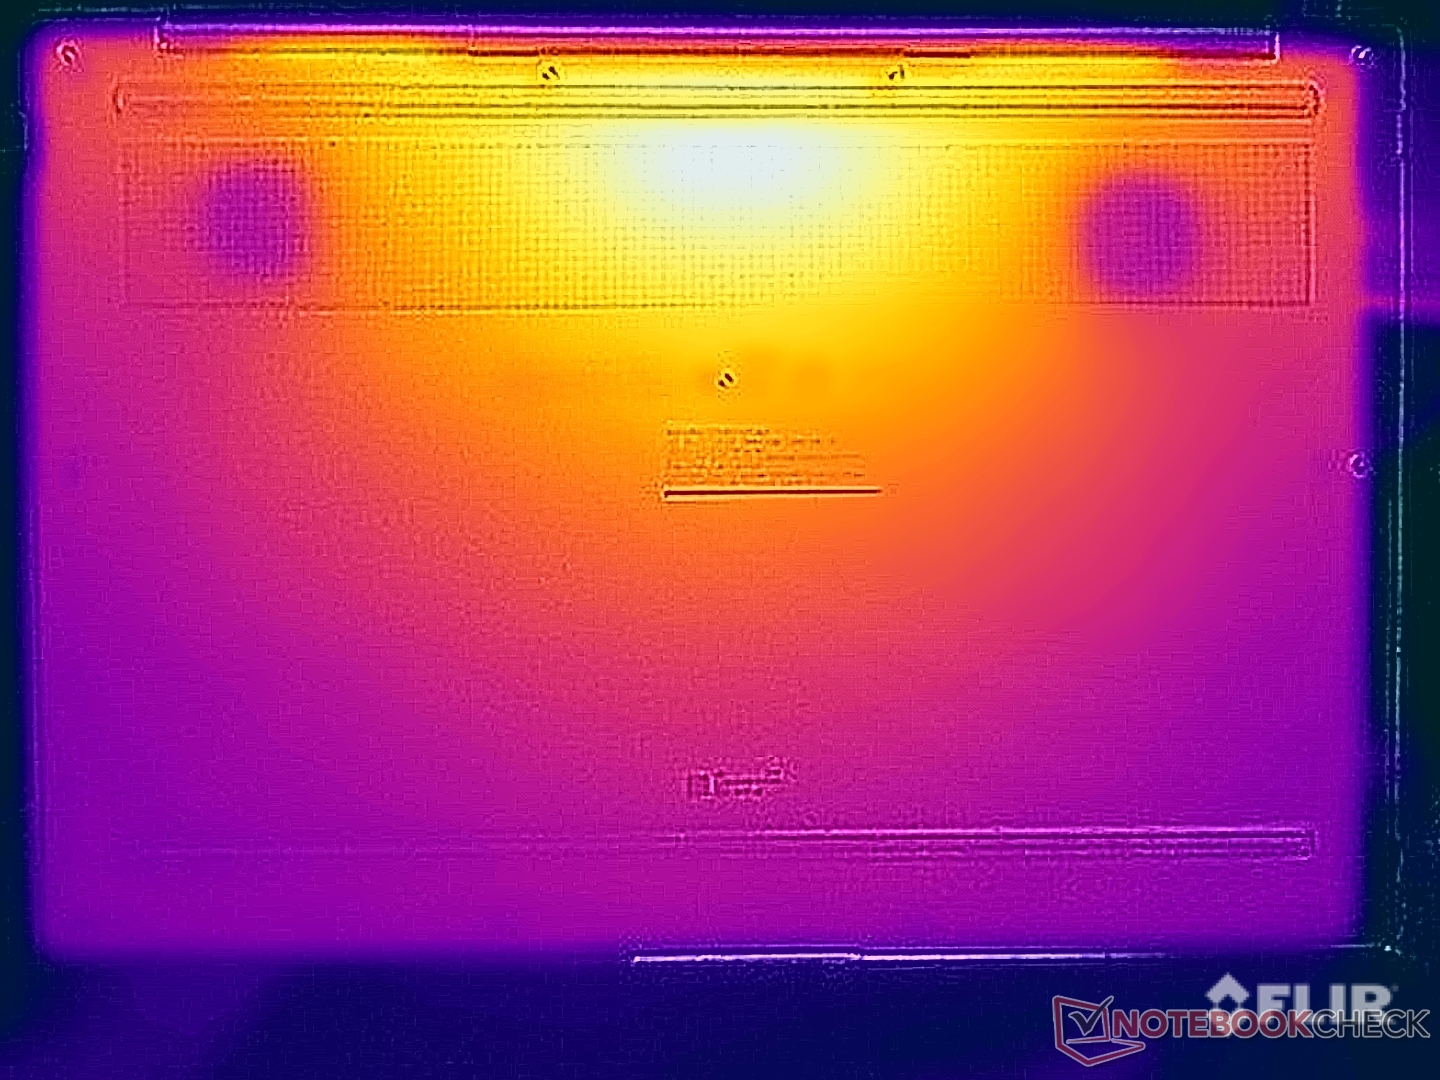
En hızlı konfigürasyonunda ProArt P16 aslında nispeten sıcak bir dizüstü bilgisayar ve boşta kullanımda çoğu yerde neredeyse 30 °C ölçtük. Ancak, bu bir sorun değil ve günlük durumlarda herhangi bir sınırlamadan korkmaya gerek yok. Yük altında, ana ünitenin hem üstünde hem de altında orta arka alanda bir sıcak nokta vardır. Bu senaryoda, cihazı kucağınıza koymaktan kaçınmalısınız, ancak normal klavye kullanımı herhangi bir sorun yaratmayacaktır.
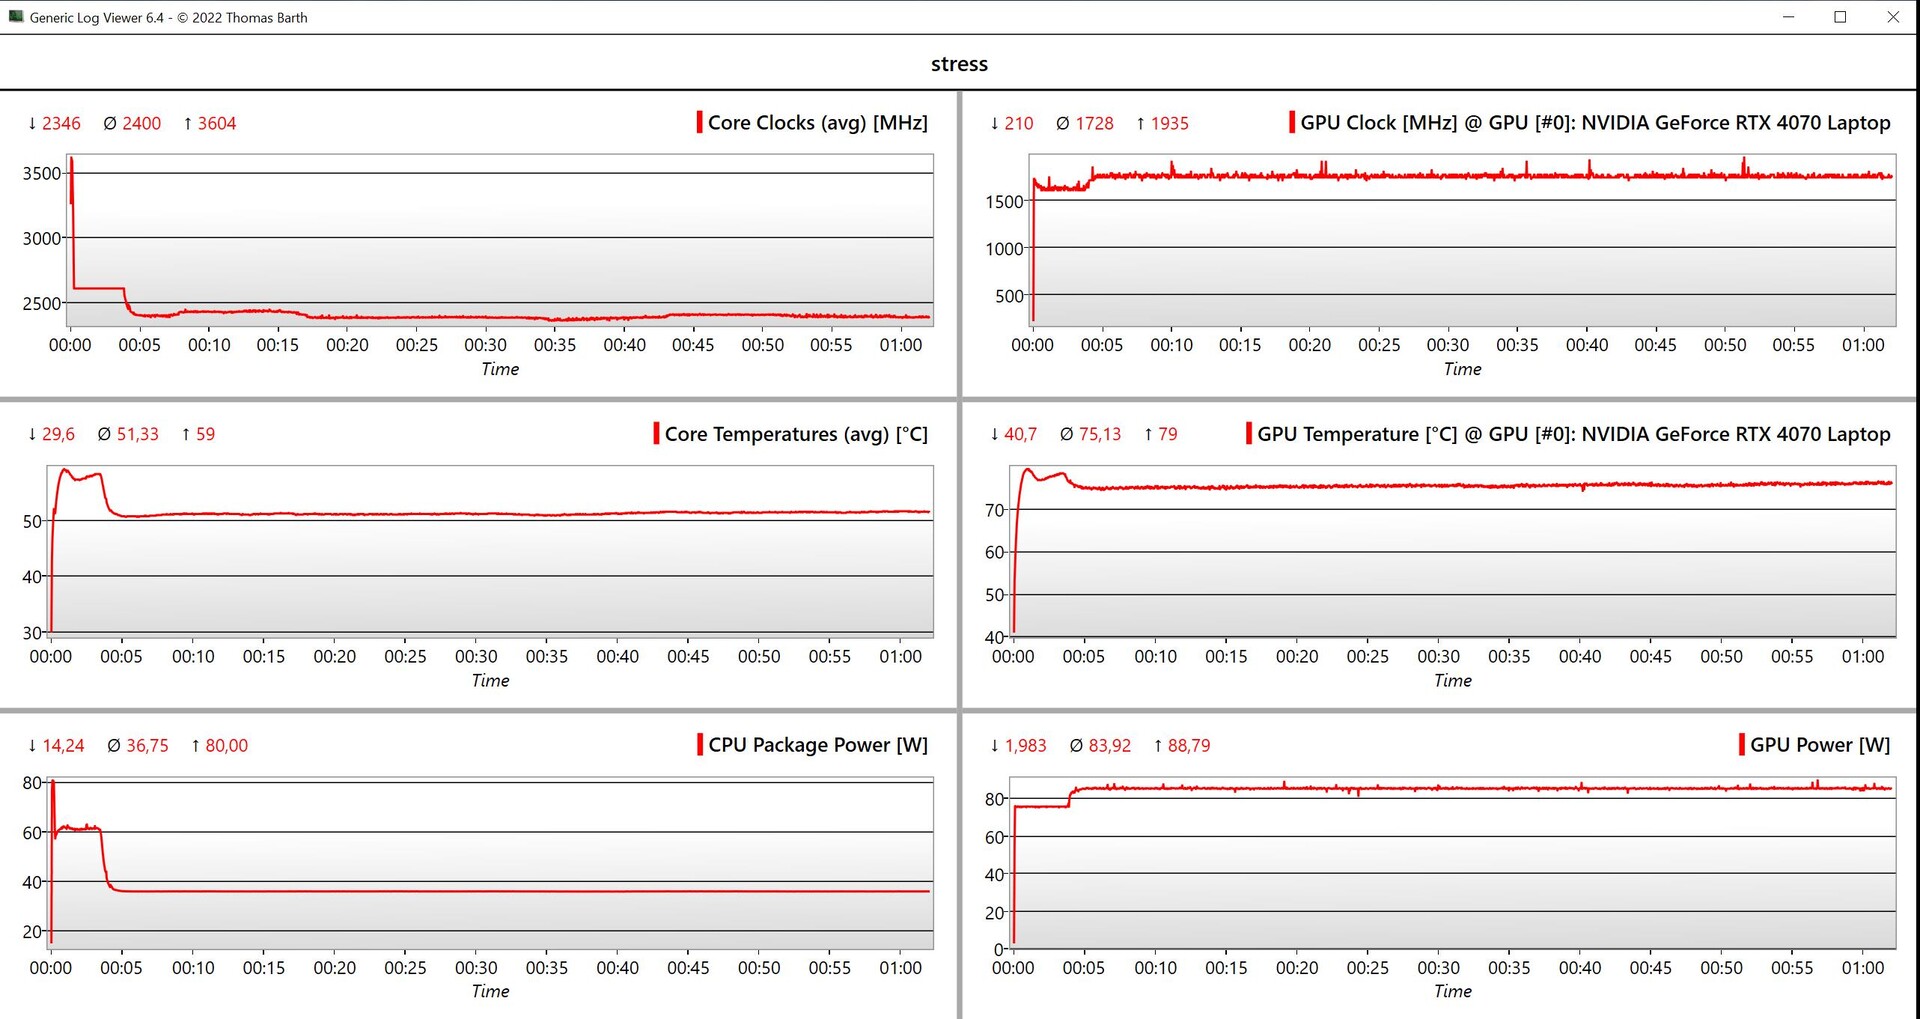
Kombine CPU/GPU yükü ile yapılan stres testinde, işlemci ilk dakika 60 watt'ta çalışırken GPU 75 watt'ta kalıyor. Yaklaşık 4 dakika sonra işlemci 37 watt'a düşüyor ve grafik kartı 85 watt'ta sabitleniyor. Genel olarak iyi bir sonuç ve Zenbook Pro 16X (45/80 watt) ile aynı seviyede.
(-) Üst taraftaki maksimum sıcaklık, 36.9 °C / 98 F ortalamasına kıyasla 46.9 °C / 116 F'dir. , Multimedia sınıfı için 21.1 ile 71 °C arasında değişir.
(-) Alt kısım, 39.2 °C / 103 F ortalamasına kıyasla maksimum 50.9 °C / 124 F'ye kadar ısınır
(+) Boşta kullanımda, üst tarafın ortalama sıcaklığı 27.5 °C / 82 F olup, cihazın 31.3 °C / 88 F.
(±) 3: The average temperature for the upper side is 37 °C / 99 F, compared to the average of 31.3 °C / 88 F for the class Multimedia.
(+) Avuç içi dayanakları ve dokunmatik yüzey maksimum (34 °C / 93.2 F) cilt sıcaklığına ulaşıyor ve bu nedenle sıcak değil.
(-) Benzer cihazların avuç içi dayanağı alanının ortalama sıcaklığı 28.8 °C / 83.8 F (-5.2 °C / -9.4 F) idi.
| Asus ProArt P16 H7606WI AMD Ryzen AI 9 HX 370, NVIDIA GeForce RTX 4070 Laptop GPU | SCHENKER XMG Pro 16 Studio (Mid 24) Intel Core i9-14900HX, NVIDIA GeForce RTX 4070 Laptop GPU | Lenovo Yoga Pro 9 16IMH9 Intel Core Ultra 9 185H, NVIDIA GeForce RTX 4070 Laptop GPU | Dell XPS 16 9640 Intel Core Ultra 7 155H, NVIDIA GeForce RTX 4070 Laptop GPU | Asus ROG Zephyrus G16 2024 GU605M Intel Core Ultra 7 155H, NVIDIA GeForce RTX 4070 Laptop GPU | Apple MacBook Pro 16 2023 M3 Max Apple M3 Max 16-Core, Apple M3 Max 40-Core GPU | Asus Zenbook Pro 16X UX7602BZ-MY005W Intel Core i9-13905H, NVIDIA GeForce RTX 4080 Laptop GPU | |
|---|---|---|---|---|---|---|---|
| Heat | -23% | 10% | 14% | 0% | 18% | 22% | |
| Maximum Upper Side * | 46.9 | 51 -9% | 41.7 11% | 39.4 16% | 50.3 -7% | 42.3 10% | 28.2 40% |
| Maximum Bottom * | 50.9 | 66 -30% | 46.3 9% | 36.9 28% | 48 6% | 42 17% | 35.1 31% |
| Idle Upper Side * | 28.9 | 35 -21% | 26.2 9% | 28.2 2% | 28.8 -0% | 22.5 22% | 24.6 15% |
| Idle Bottom * | 30 | 39 -30% | 27.2 9% | 27.4 9% | 29.8 1% | 22.9 24% | 29.4 2% |
* ... daha küçük daha iyidir
Konuşmacılar
Ses sistemi 6 modülden oluşuyor (4x woofer, her biri 2 watt + 2x tweeter, her biri 2 watt). Sistem zaten harikaydı ROG Zephyrus G16 ve o zamandan beri pek bir şey değişmedi. Ölçümlerimize göre sadece maksimum ses seviyesi biraz daha düşük. Bu bakımdan ProArt P16 piyasadaki en iyi dizüstü bilgisayarlardan biri.
Asus ProArt P16 H7606WI ses analizi
(±) | hoparlör ses yüksekliği ortalama ama iyi (81.4 dB)
Bas 100 - 315Hz
(+) | iyi bas - medyandan yalnızca 3% uzakta
(±) | Bas doğrusallığı ortalamadır (8.3% delta - önceki frekans)
Ortalar 400 - 2000 Hz
(+) | dengeli ortalar - medyandan yalnızca 3.5% uzakta
(+) | orta frekanslar doğrusaldır (2.5% deltadan önceki frekansa)
Yüksekler 2 - 16 kHz
(+) | dengeli yüksekler - medyandan yalnızca 3% uzakta
(+) | yüksekler doğrusaldır (3.6% deltadan önceki frekansa)
Toplam 100 - 16.000 Hz
(+) | genel ses doğrusaldır (8.5% ortancaya göre fark)
Aynı sınıfla karşılaştırıldığında
» Bu sınıftaki tüm test edilen cihazların %6%'si daha iyi, 2% benzer, 92% daha kötüydü
» En iyisinin deltası 5% idi, ortalama 18% idi, en kötüsü 45% idi
Test edilen tüm cihazlarla karşılaştırıldığında
» Test edilen tüm cihazların %2'si daha iyi, 1 benzer, % 98 daha kötüydü
» En iyisinin deltası 4% idi, ortalama 24% idi, en kötüsü 134% idi
SCHENKER XMG Pro 16 Studio (Mid 24) ses analizi
(±) | hoparlör ses yüksekliği ortalama ama iyi (79 dB)
Bas 100 - 315Hz
(-) | neredeyse hiç bas yok - ortalama olarak medyandan 15.1% daha düşük
(±) | Bas doğrusallığı ortalamadır (13.6% delta - önceki frekans)
Ortalar 400 - 2000 Hz
(±) | daha yüksek ortalar - ortalama olarak medyandan 5.3% daha yüksek
(+) | orta frekanslar doğrusaldır (4.4% deltadan önceki frekansa)
Yüksekler 2 - 16 kHz
(+) | dengeli yüksekler - medyandan yalnızca 4.4% uzakta
(+) | yüksekler doğrusaldır (4.9% deltadan önceki frekansa)
Toplam 100 - 16.000 Hz
(±) | Genel sesin doğrusallığı ortalamadır (17.7% ortancaya göre fark)
Aynı sınıfla karşılaştırıldığında
» Bu sınıftaki tüm test edilen cihazların %50%'si daha iyi, 10% benzer, 40% daha kötüydü
» En iyisinin deltası 6% idi, ortalama 18% idi, en kötüsü 132% idi
Test edilen tüm cihazlarla karşılaştırıldığında
» Test edilen tüm cihazların %33'si daha iyi, 8 benzer, % 59 daha kötüydü
» En iyisinin deltası 4% idi, ortalama 24% idi, en kötüsü 134% idi
Lenovo Yoga Pro 9 16IMH9 ses analizi
(+) | hoparlörler nispeten yüksek sesle çalabilir (84.5 dB)
Bas 100 - 315Hz
(±) | azaltılmış bas - ortalama olarak medyandan 7% daha düşük
(±) | Bas doğrusallığı ortalamadır (7.2% delta - önceki frekans)
Ortalar 400 - 2000 Hz
(+) | dengeli ortalar - medyandan yalnızca 3.9% uzakta
(+) | orta frekanslar doğrusaldır (4.5% deltadan önceki frekansa)
Yüksekler 2 - 16 kHz
(+) | dengeli yüksekler - medyandan yalnızca 2.8% uzakta
(+) | yüksekler doğrusaldır (3.2% deltadan önceki frekansa)
Toplam 100 - 16.000 Hz
(+) | genel ses doğrusaldır (8.8% ortancaya göre fark)
Aynı sınıfla karşılaştırıldığında
» Bu sınıftaki tüm test edilen cihazların %8%'si daha iyi, 2% benzer, 91% daha kötüydü
» En iyisinin deltası 5% idi, ortalama 18% idi, en kötüsü 45% idi
Test edilen tüm cihazlarla karşılaştırıldığında
» Test edilen tüm cihazların %2'si daha iyi, 1 benzer, % 97 daha kötüydü
» En iyisinin deltası 4% idi, ortalama 24% idi, en kötüsü 134% idi
Dell XPS 16 9640 ses analizi
(+) | hoparlörler nispeten yüksek sesle çalabilir (83.4 dB)
Bas 100 - 315Hz
(±) | azaltılmış bas - ortalama olarak medyandan 11.2% daha düşük
(±) | Bas doğrusallığı ortalamadır (8.9% delta - önceki frekans)
Ortalar 400 - 2000 Hz
(+) | dengeli ortalar - medyandan yalnızca 4.5% uzakta
(+) | orta frekanslar doğrusaldır (3% deltadan önceki frekansa)
Yüksekler 2 - 16 kHz
(+) | dengeli yüksekler - medyandan yalnızca 1.4% uzakta
(+) | yüksekler doğrusaldır (2% deltadan önceki frekansa)
Toplam 100 - 16.000 Hz
(+) | genel ses doğrusaldır (10% ortancaya göre fark)
Aynı sınıfla karşılaştırıldığında
» Bu sınıftaki tüm test edilen cihazların %10%'si daha iyi, 1% benzer, 89% daha kötüydü
» En iyisinin deltası 5% idi, ortalama 18% idi, en kötüsü 45% idi
Test edilen tüm cihazlarla karşılaştırıldığında
» Test edilen tüm cihazların %4'si daha iyi, 1 benzer, % 95 daha kötüydü
» En iyisinin deltası 4% idi, ortalama 24% idi, en kötüsü 134% idi
Asus ROG Zephyrus G16 2024 GU605M ses analizi
(+) | hoparlörler nispeten yüksek sesle çalabilir (83.3 dB)
Bas 100 - 315Hz
(+) | iyi bas - medyandan yalnızca 3.8% uzakta
(±) | Bas doğrusallığı ortalamadır (8.1% delta - önceki frekans)
Ortalar 400 - 2000 Hz
(+) | dengeli ortalar - medyandan yalnızca 3.5% uzakta
(+) | orta frekanslar doğrusaldır (2.4% deltadan önceki frekansa)
Yüksekler 2 - 16 kHz
(+) | dengeli yüksekler - medyandan yalnızca 2.2% uzakta
(+) | yüksekler doğrusaldır (3.7% deltadan önceki frekansa)
Toplam 100 - 16.000 Hz
(+) | genel ses doğrusaldır (7.3% ortancaya göre fark)
Aynı sınıfla karşılaştırıldığında
» Bu sınıftaki tüm test edilen cihazların %1%'si daha iyi, 0% benzer, 99% daha kötüydü
» En iyisinin deltası 6% idi, ortalama 18% idi, en kötüsü 132% idi
Test edilen tüm cihazlarla karşılaştırıldığında
» Test edilen tüm cihazların %1'si daha iyi, 0 benzer, % 99 daha kötüydü
» En iyisinin deltası 4% idi, ortalama 24% idi, en kötüsü 134% idi
Apple MacBook Pro 16 2023 M3 Max ses analizi
(+) | hoparlörler nispeten yüksek sesle çalabilir (84.3 dB)
Bas 100 - 315Hz
(±) | azaltılmış bas - ortalama olarak medyandan 5% daha düşük
(+) | bas doğrusaldır (5.6% delta ile önceki frekans)
Ortalar 400 - 2000 Hz
(+) | dengeli ortalar - medyandan yalnızca 1.2% uzakta
(+) | orta frekanslar doğrusaldır (3.1% deltadan önceki frekansa)
Yüksekler 2 - 16 kHz
(+) | dengeli yüksekler - medyandan yalnızca 2.4% uzakta
(+) | yüksekler doğrusaldır (2.4% deltadan önceki frekansa)
Toplam 100 - 16.000 Hz
(+) | genel ses doğrusaldır (5.3% ortancaya göre fark)
Aynı sınıfla karşılaştırıldığında
» Bu sınıftaki tüm test edilen cihazların %1%'si daha iyi, 1% benzer, 98% daha kötüydü
» En iyisinin deltası 5% idi, ortalama 18% idi, en kötüsü 45% idi
Test edilen tüm cihazlarla karşılaştırıldığında
» Test edilen tüm cihazların %0'si daha iyi, 0 benzer, % 100 daha kötüydü
» En iyisinin deltası 4% idi, ortalama 24% idi, en kötüsü 134% idi
Asus Zenbook Pro 16X UX7602BZ-MY005W ses analizi
(+) | hoparlörler nispeten yüksek sesle çalabilir (88.5 dB)
Bas 100 - 315Hz
(±) | azaltılmış bas - ortalama olarak medyandan 9.8% daha düşük
(±) | Bas doğrusallığı ortalamadır (7.7% delta - önceki frekans)
Ortalar 400 - 2000 Hz
(+) | dengeli ortalar - medyandan yalnızca 1.6% uzakta
(+) | orta frekanslar doğrusaldır (4.5% deltadan önceki frekansa)
Yüksekler 2 - 16 kHz
(+) | dengeli yüksekler - medyandan yalnızca 2.1% uzakta
(+) | yüksekler doğrusaldır (3.3% deltadan önceki frekansa)
Toplam 100 - 16.000 Hz
(+) | genel ses doğrusaldır (8.1% ortancaya göre fark)
Aynı sınıfla karşılaştırıldığında
» Bu sınıftaki tüm test edilen cihazların %1%'si daha iyi, 1% benzer, 98% daha kötüydü
» En iyisinin deltası 6% idi, ortalama 18% idi, en kötüsü 132% idi
Test edilen tüm cihazlarla karşılaştırıldığında
» Test edilen tüm cihazların %1'si daha iyi, 1 benzer, % 98 daha kötüydü
» En iyisinin deltası 4% idi, ortalama 24% idi, en kötüsü 134% idi
Enerji yönetimi - ROG Zephyrus G16'dan daha fazla dayanıklılık
Güç tüketimi
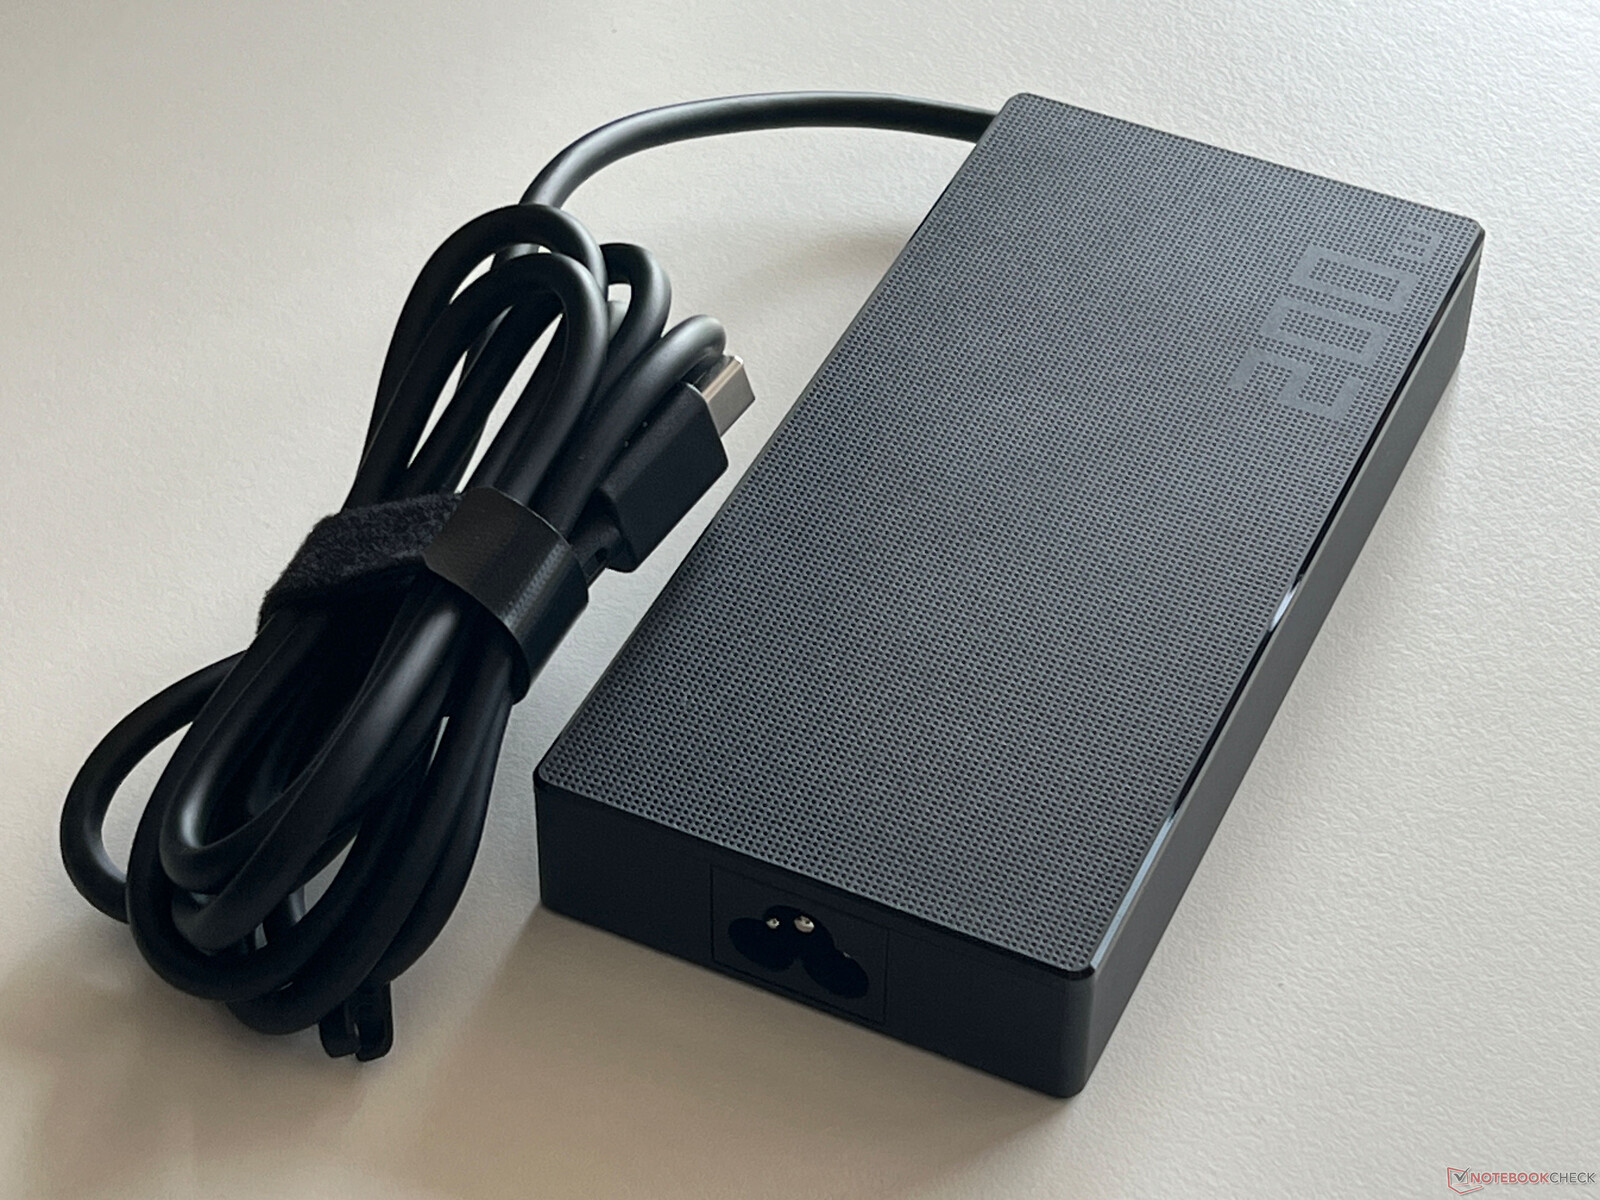
OLED paneline rağmen ProArt P16 oldukça verimli. Boşta ve maksimum SDR parlaklığında çalışırken, nispeten parlak duvar kağıdına rağmen yalnızca maksimum 11,6 watt kaydettik. Oyun oynarken bu değer 160 watt civarında ve stres testinde kısa bir süre için 212,6 watt. Ancak, birkaç dakika sonra bu hızla düşüyor ve 160 watt'a yerleşiyor. Bu, birlikte verilen 200 watt PSU'nun uygun boyutta olduğu anlamına gelir.
| Kapalı / Bekleme modu | |
| Boşta | |
| Çalışırken |
|
Key:
min: | |
| Asus ProArt P16 H7606WI Ryzen AI 9 HX 370, NVIDIA GeForce RTX 4070 Laptop GPU, Micron 2400 MTFDKBA1T0QFM, OLED, 3840x2400, 16" | SCHENKER XMG Pro 16 Studio (Mid 24) i9-14900HX, NVIDIA GeForce RTX 4070 Laptop GPU, Samsung 990 Pro 1 TB, IPS, 2560x1600, 16" | Lenovo Yoga Pro 9 16IMH9 Ultra 9 185H, NVIDIA GeForce RTX 4070 Laptop GPU, SK Hynix HFS001TEJ9X115N, Mini-LED, 3200x2000, 16" | Dell XPS 16 9640 Ultra 7 155H, NVIDIA GeForce RTX 4070 Laptop GPU, Kioxia XG8 KXG80ZNV1T02, OLED, 3840x2400, 16.3" | Asus ROG Zephyrus G16 2024 GU605M Ultra 7 155H, NVIDIA GeForce RTX 4070 Laptop GPU, WD PC SN560 SDDPNQE-1T00, OLED, 2560x1600, 16" | Apple MacBook Pro 16 2023 M3 Max Apple M3 Max 16-Core, M3 Max 40-Core GPU, Apple SSD AP8192Z, Mini-LED, 3456x2234, 16" | Asus Zenbook Pro 16X UX7602BZ-MY005W i9-13905H, NVIDIA GeForce RTX 4080 Laptop GPU, Samsung PM9A1 MZVL22T0HBLB, OLED, 3200x2000, 16" | Ortalama NVIDIA GeForce RTX 4070 Laptop GPU | Sınıf ortalaması Multimedia | |
|---|---|---|---|---|---|---|---|---|---|
| Power Consumption | -129% | -50% | 9% | -3% | -14% | -32% | -56% | 7% | |
| Idle Minimum * | 8 | 31 -288% | 10.3 -29% | 7.7 4% | 8.3 -4% | 5.2 35% | 9 -13% | 12.8 ? -60% | 6.86 ? 14% |
| Idle Average * | 9.9 | 33 -233% | 21.9 -121% | 10.3 -4% | 12.5 -26% | 16.9 -71% | 11.9 -20% | 17.8 ? -80% | 11.5 ? -16% |
| Idle Maximum * | 11.6 | 41 -253% | 22.4 -93% | 10.6 9% | 12.8 -10% | 17.2 -48% | 20.5 -77% | 24.3 ? -109% | 13.5 ? -16% |
| Load Average * | 76.9 | 114 -48% | 96.9 -26% | 76.5 1% | 71.3 7% | 90.5 -18% | 93.5 -22% | 96.9 ? -26% | 71.4 ? 7% |
| Cyberpunk 2077 ultra * | 157.7 | 218 -38% | |||||||
| Cyberpunk 2077 ultra external monitor * | 156.6 | 196.8 -26% | |||||||
| Load Maximum * | 212.6 | 250 -18% | 173.8 18% | 138.5 35% | 169.1 20% | 145.2 32% | 267 -26% | 221 ? -4% | 116.6 ? 45% |
| Witcher 3 ultra * | 159.6 | 126.4 | 127.5 | 109 | 195.7 |
* ... daha küçük daha iyidir
Power consumption Cyberpunk / stress test
Power consumption with an external monitor
Pil ömrü
Wi-Fi testlerimizde, 90 Wh pil, benzer yapıdaki Zephyrus G16'dan biraz daha iyi olan ortalama çalışma sürelerinden sorumluydu. Wi-Fi testinde 150 cd/m²'de (maksimum SDR parlaklığının %70'ini temsil eder) 8 saat 18 dakika ve tam parlaklıkta yaklaşık 2 saat daha az (6 saat 23 dakika) kaydettik. Buna karşın, video testinde son derece şaşırdık çünkü 150 cd/m²'de çalışma süresi 21 saat gibi muazzam bir süreydi ki bu dizüstü bilgisayarın 16 inçlik büyük paneli düşünüldüğünde muazzam bir performans. Tam parlaklıkta bir HDR video 5 saat boyunca çalışabilir.
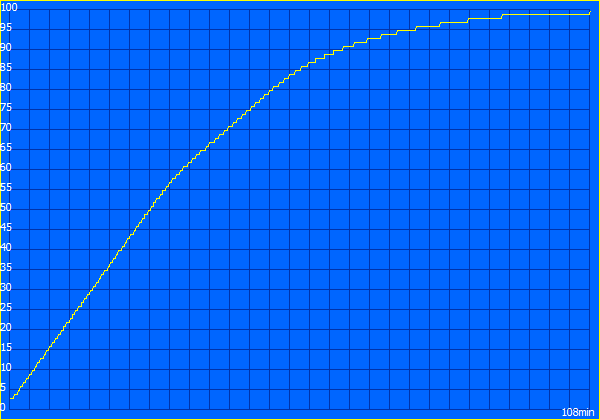
Cihaz açıkken, tam şarj döngüsü sadece 108 dakika sürüyor ve 48 dakika sonra kapasitenin %80'i kullanılabilir hale geliyor.
| Asus ProArt P16 H7606WI Ryzen AI 9 HX 370, NVIDIA GeForce RTX 4070 Laptop GPU, 90 Wh | SCHENKER XMG Pro 16 Studio (Mid 24) i9-14900HX, NVIDIA GeForce RTX 4070 Laptop GPU, 73 Wh | Lenovo Yoga Pro 9 16IMH9 Ultra 9 185H, NVIDIA GeForce RTX 4070 Laptop GPU, 84 Wh | Dell XPS 16 9640 Ultra 7 155H, NVIDIA GeForce RTX 4070 Laptop GPU, 99.5 Wh | Asus ROG Zephyrus G16 2024 GU605M Ultra 7 155H, NVIDIA GeForce RTX 4070 Laptop GPU, 90 Wh | Apple MacBook Pro 16 2023 M3 Max Apple M3 Max 16-Core, M3 Max 40-Core GPU, 99.6 Wh | Asus Zenbook Pro 16X UX7602BZ-MY005W i9-13905H, NVIDIA GeForce RTX 4080 Laptop GPU, 96 Wh | Sınıf ortalaması Multimedia | |
|---|---|---|---|---|---|---|---|---|
| Pil Çalışma Süresi | -32% | -26% | -7% | -33% | 19% | 10% | -6% | |
| H.264 | 1260 | 692 -45% | 988 -22% | 671 -47% | 1221 -3% | 864 ? -31% | ||
| WiFi v1.3 | 499 | 337 -32% | 526 5% | 629 26% | 435 -13% | 999 100% | 472.8 -5% | 645 ? 29% |
| Load | 116 | 73 -37% | 87 -25% | 71 -39% | 71 -39% | 144 24% | 99 ? -15% |
Artılar
Eksiler
Karar - ProArt P16 ödünler veren kompakt bir güç merkezi
Yeni Asus ProArt P16, tanıdık bir oyun/multimedya dizüstü bilgisayarı olan ROG Zephyrus G16 ayrıca yeni AMD Zen 5 mobil işlemciler sayesinde tonlarca performans sunuyor ve bunların hepsi kompakt ve oldukça hafif bir pakette, 1,8 kg ağırlığında. Ryzen AI 9 HX 370, Zephyrus G16'da bulunan Meteor Lake işlemciden önemli ölçüde daha fazla CPU performansı sunuyor, ancak yaratıcı kullanıcılar için bir dizüstü bilgisayar olarak P16 daha çok Zenbook Pro 16X core i9 13905H o kadar da yavaş değil ama RTX 4080 dizüstü bilgisayardan çok daha hızlı RTX 4070 dizüstü bilgisayar proArt'ta. Bu, GPU performansı söz konusu olduğunda, iki dizüstü bilgisayardan daha hafif olanı tercih ederseniz geriye doğru bir adımı kabul etmeniz gerektiği anlamına gelir.
Ekran açısından, yeni 60 Hz, 4K OLED dokunmatik ekranın Zenbook Pro 16X'in 120 Hz, 3.2K OLED paneline kıyasla bir gelişme olup olmadığı da tartışılabilir. Daha yüksek çözünürlük bir avantaj ve renk doğruluğu da çok iyi ancak 2024 yılında bu kadar pahalı bir cihazla uğraşırken sadece 60 Hz'lik bir frekans artık güncel olarak kabul edilemez.
ProArt P16 ile Asus, dokunmatik ekrana ihtiyaç duyan ve daha yüksek bir frekans olmadan yapmaya hazır olan yaratıcı kullanıcılar için nispeten hafif ve kompakt bir güç merkezi sunuyor. Özellikle 64 GB'lık üst versiyon son derece pahalı.
Bununla birlikte, performanstan ödün vererek yaşayabilirseniz, yeterli bağlantı noktalarına, birinci sınıf bir kasaya, çok iyi giriş cihazlarına ve mükemmel bir ses sistemine sahip nispeten hafif ve performanslı 16 inçlik bir dizüstü bilgisayar elde edersiniz. Bununla birlikte, ROG Zephyrus G16 ile bunu da elde edersiniz ve bu, daha yüksek frekanslı bir OLED yerine dokunmatik bir ekranı tercih edip etmeyeceğinize karar vermeniz gereken yerdir. ProArt'a iki adet M.2 2280 SSD takılabilir ancak RAM lehimlidir. 64 GB'lık bir seçenek de var ancak 32 GB'a göre fiyat artışı 400 dolar gibi muazzam bir rakam. ProArt P16'nın nispeten küçük bir hedef kitlesi var ve aradığınız kombinasyon buysa, burada gerçekten yanlış gidemezsiniz.
Fiyat ve bulunabilirlik
Yeni ProArt P16 adresinden doğrudan Asus'tan sipariş edilebilir.
Not: Derecelendirme sistemimizi yakın zamanda güncelledik ve 8. sürümün sonuçları 7. sürümün sonuçları ile karşılaştırılamaz. Daha fazla bilgi için burada.
Asus ProArt P16 H7606WI
- 08/04/2024 v8
Andreas Osthoff
 Total Sustainability Score:
 Şeffaflık
İncelenecek cihazların seçimi editör ekibimiz tarafından yapılır. Test örneği, bu incelemenin amacı doğrultusunda üretici veya perakendeci tarafından yazara ödünç olarak sağlanmıştır. Borç verenin bu inceleme üzerinde herhangi bir etkisi olmadığı gibi, üretici de yayınlanmadan önce bu incelemenin bir kopyasını almamıştır. Bu incelemeyi yayınlama zorunluluğu yoktu. İncelemelerimiz karşılığında asla tazminat veya ödeme kabul etmiyoruz. Bağımsız bir medya şirketi olarak Notebookcheck, üreticilerin, perakendecilerin veya yayıncıların otoritesine tabi değildir.
Notebookcheck bu şekilde test yapıyor
Notebookcheck, tüm sonuçların karşılaştırılabilir olmasını sağlamak için her yıl yüzlerce dizüstü bilgisayarı ve akıllı telefonu standart prosedürler kullanarak bağımsız olarak inceliyor. Yaklaşık 20 yıldır test yöntemlerimizi sürekli olarak geliştirdik ve bu süreçte endüstri standartlarını belirledik. Test laboratuvarlarımızda deneyimli teknisyenler ve editörler tarafından yüksek kaliteli ölçüm ekipmanları kullanılmaktadır. Bu testler çok aşamalı bir doğrulama sürecini içerir. Karmaşık derecelendirme sistemimiz, nesnelliği koruyan yüzlerce sağlam temellere dayanan ölçüm ve kıyaslamaya dayanmaktadır.Price comparison

