

HP ZBook Power 16 G11 A incelemesi: AMD Zen 4 ile güçlü iş istasyonu

ZBook Power 16 G11, hem yeni dahili işlemciler hem de yeni harici değişikliklerle eski ZBook Power 15 G10'un yerini alıyor. Adından da anlaşılacağı gibi, ZBook Power 16 G11, 16 inçlik bir tasarım için eski 15,6 inç form faktörünü bırakarak seriyi modernleştiriyor. Performans söz konusu olduğunda alt uç ZBook Firefly ile üst uç ZBook Fury arasında yer alıyor. Kullanıcılar Meteor Lake Intel Core Ultra CPU'lar veya AMD Ryzen Zen 4 CPU'lar ve Nvidia RTX grafiklerle yapılandırabilirler.
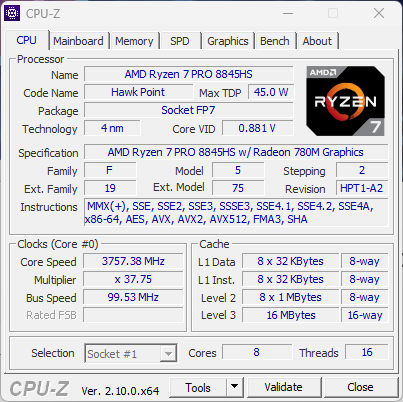
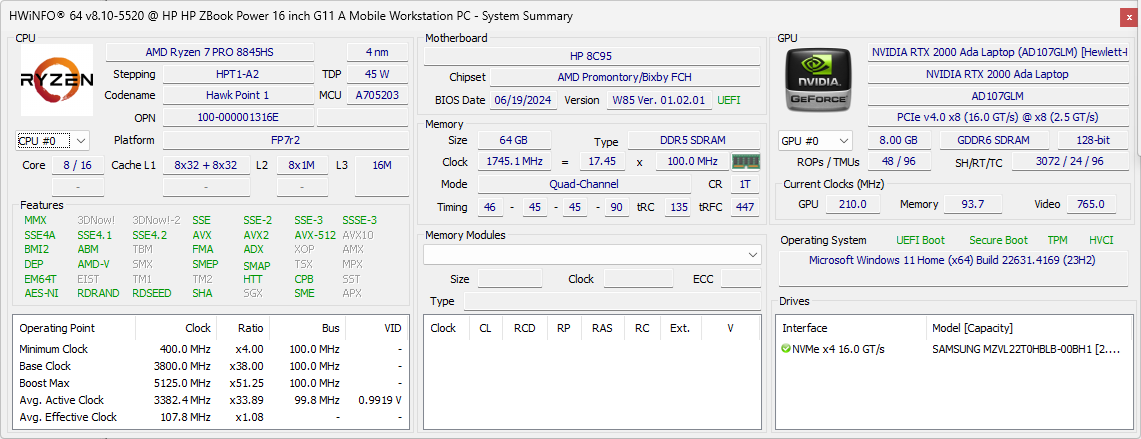
İnceleme birimimiz, Ryzen 7 8845HS CPU, RTX 2000 Ada GPU ve 120Hz 2560 x 1600p IPS ekran ile yaklaşık 2100 $ karşılığında üst düzey bir AMD yapılandırmasıdır (ZBook Power 16 G11 A). Seçenekler Ryzen 5 8645HS'den 1200p ekranlı ve RTX 1000, RTX 2000 veya RTX 3000 grafikli Ryzen 9 8945HS'ye kadar çok geniştir. Kullanıcılar ayrıca hiç ayrı grafik kullanmamayı da tercih edebilirler.
Bu alandaki rakipler arasında aşağıdakiler gibi diğer 16 inç iş istasyonları yer alıyor Dell Precision 5690, MSI CreatorPro Z16Pveya Lenovo ThinkPad P16s G2.
Daha fazla HP incelemesi:
Karşılaştırmalı olarak olası rakipler
Derecelendirme | Sürüm | Tarih | Modeli | Ağırlık | Yükseklik | Boyut | Çözünürlük | Fiyat |
|---|---|---|---|---|---|---|---|---|
| 85.4 % | v8 | 10/2024 | HP ZBook Power 16 G11 A R7 8845HS, NVIDIA RTX 2000 Ada Generation Laptop GPU | 2.2 kg | 22.9 mm | 16.00" | 2560x1600 | |
| 88.9 % v7 (old) | v7 (old) | 12/2023 | HP ZBook Power 15 G10 R7 PRO 7840HS, NVIDIA RTX 2000 Ada Generation Laptop GPU | 2 kg | 22.9 mm | 15.60" | 2560x1440 | |
| 85.9 % | v8 | 08/2024 | HP ZBook Fury 16 G11 i9-14900HX, NVIDIA RTX 3500 Ada Generation Laptop GPU | 2.6 kg | 28.5 mm | 16.00" | 3840x2400 | |
| 83.5 % | v8 | 10/2024 | Lenovo ThinkPad P1 Gen 7 21KV001SGE Ultra 7 155H, NVIDIA GeForce RTX 4060 Laptop GPU | 2 kg | 20.5 mm | 16.00" | 2560x1600 | |
| 88.6 % v7 (old) | v7 (old) | 01/2024 | Lenovo ThinkPad P16s G2 21K9000CGE R7 PRO 7840U, Radeon 780M | 1.8 kg | 24.4 mm | 16.00" | 3840x2400 | |
| 88.3 % v7 (old) | v7 (old) | 05/2024 | Dell Precision 5690 Ultra 9 185H, NVIDIA RTX 5000 Ada Generation Laptop GPU | 2.3 kg | 22.17 mm | 16.00" | 3840x2400 |
Not: Derecelendirme sistemimizi yakın zamanda güncelledik ve 8. sürümün sonuçları 7. sürümün sonuçları ile karşılaştırılamaz. Daha fazla bilgi için burada .
Kasa - MIL-STD 810 Sertifikalı
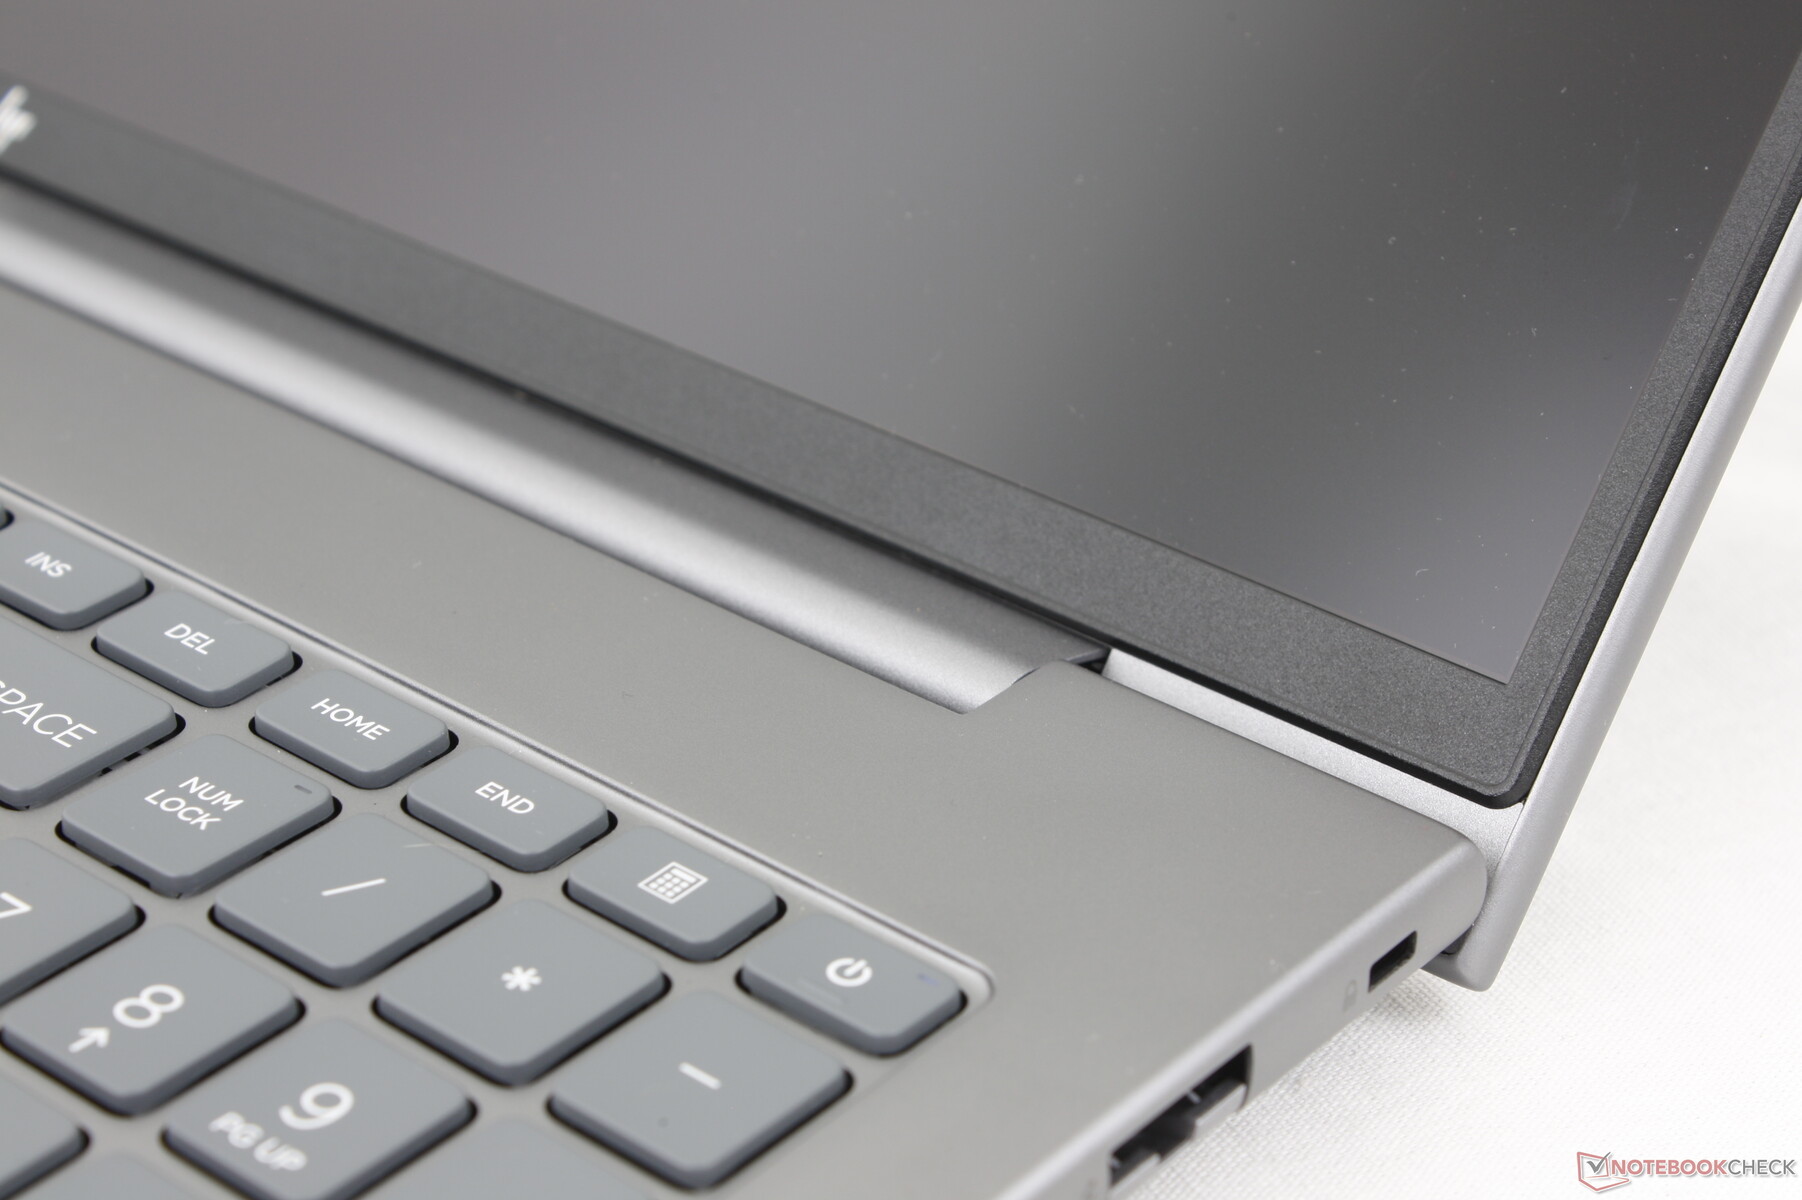
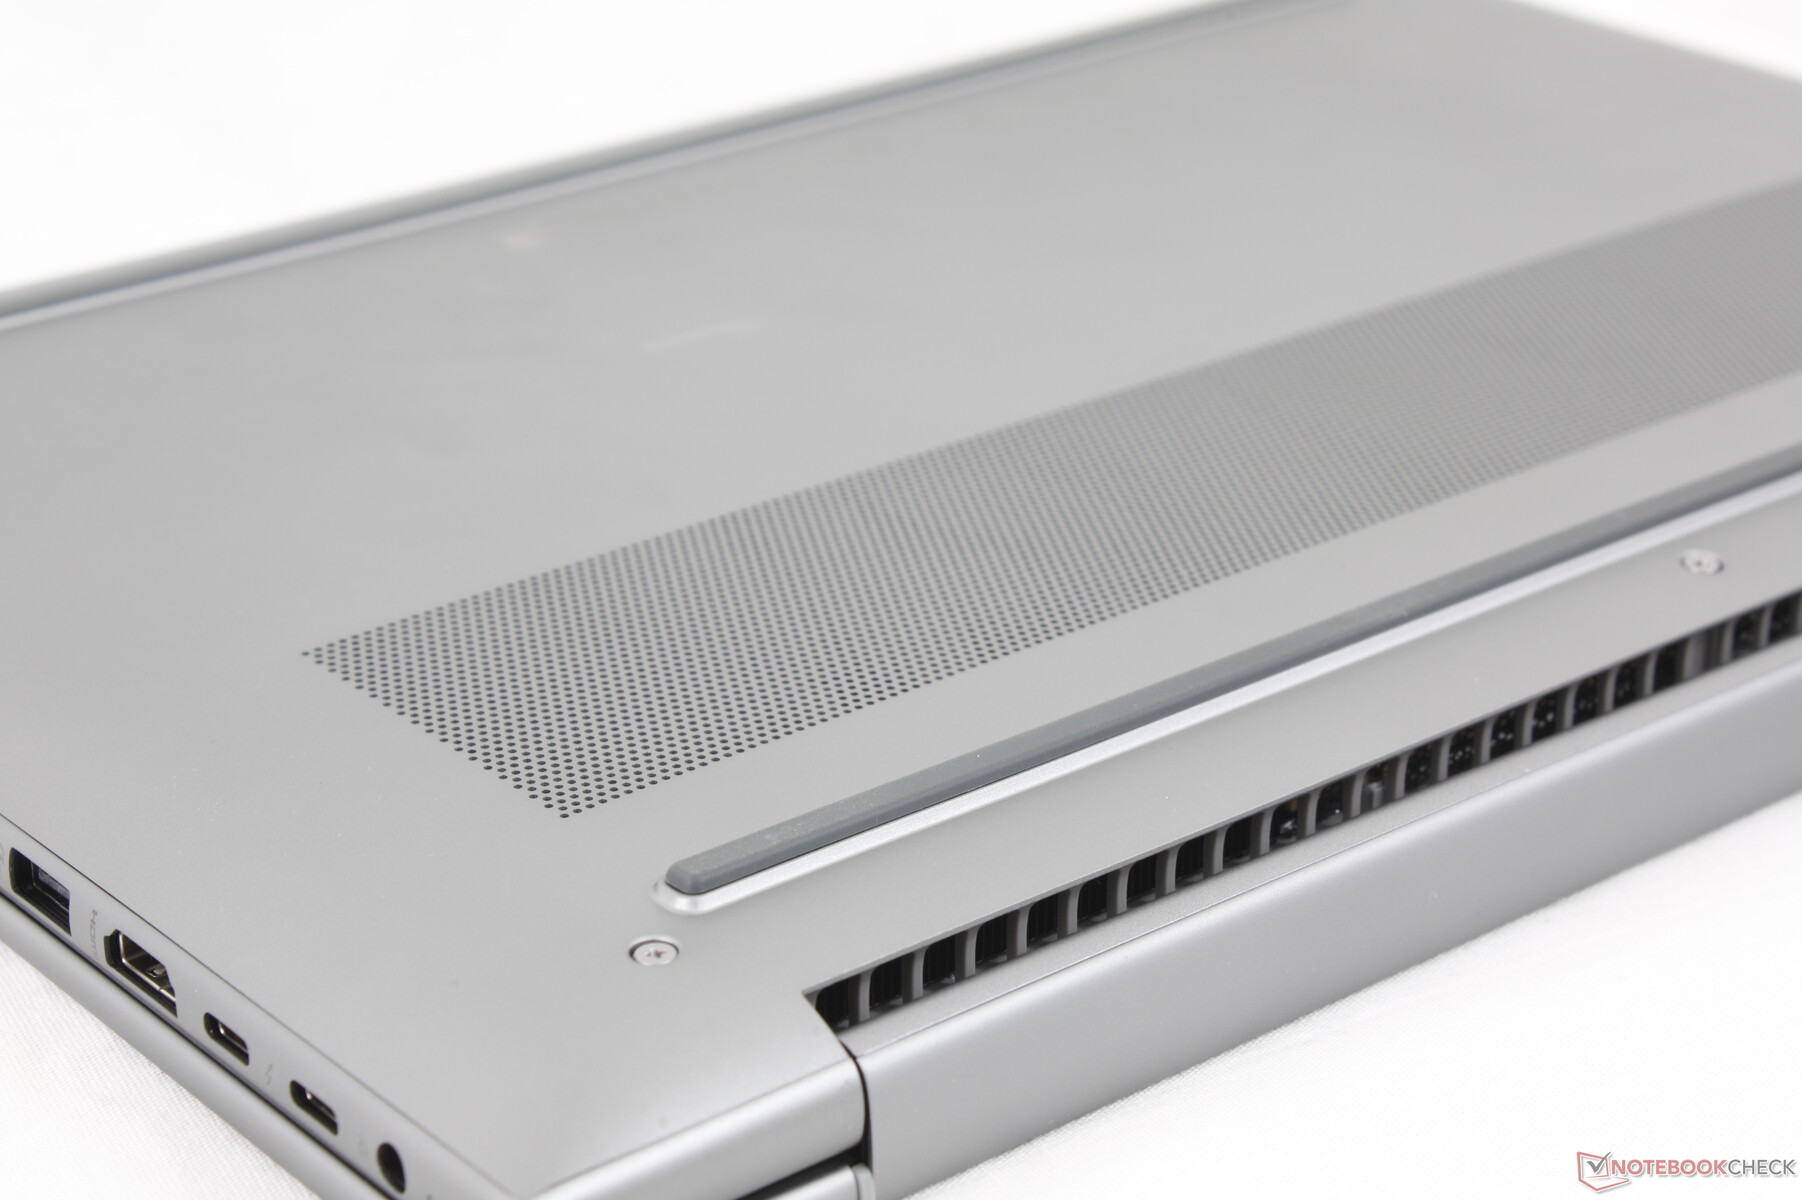
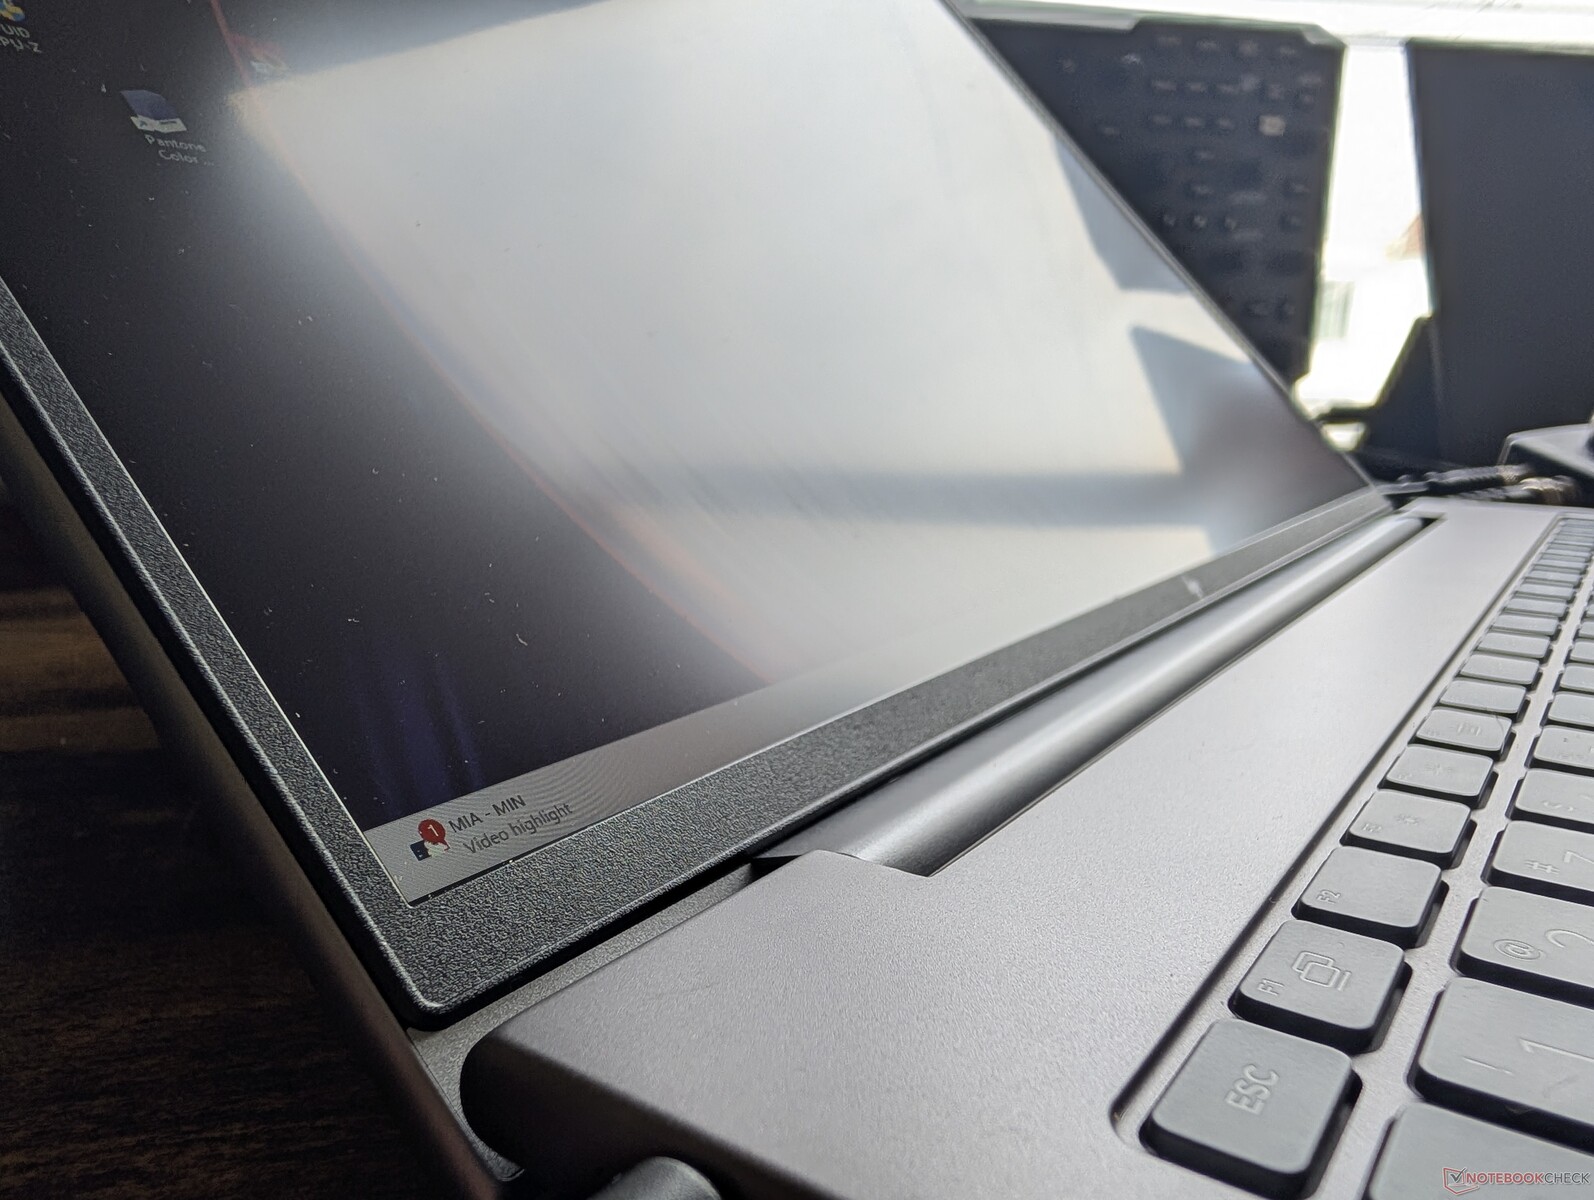
HP, aile genelinde bir tutarlılık duygusu için neredeyse tüm ZBook modellerinde benzer gri alüminyum alaşımlı malzemeler kullanıyor. Bu durumda, ZBook Power 16 G11, ZBook Power 15 G10 ile aynı pürüzsüz mat metal dokuya sahiptir, ancak klavye kenarlıklarında, dış kapak kaplamasında ve alt panelde yüzeysel değişiklikler vardır.
Kasa sertliği, tabanı bükmeye çalışırken minimum bükülme ve çöküntü ile mükemmeldir. Bununla birlikte, menteşeler ve kapak daha sert olabilirdi, özellikle de kapak ZBook Power 15 G10'dan farklı olarak neredeyse 180 derece açılabildiği için Precision 5690.
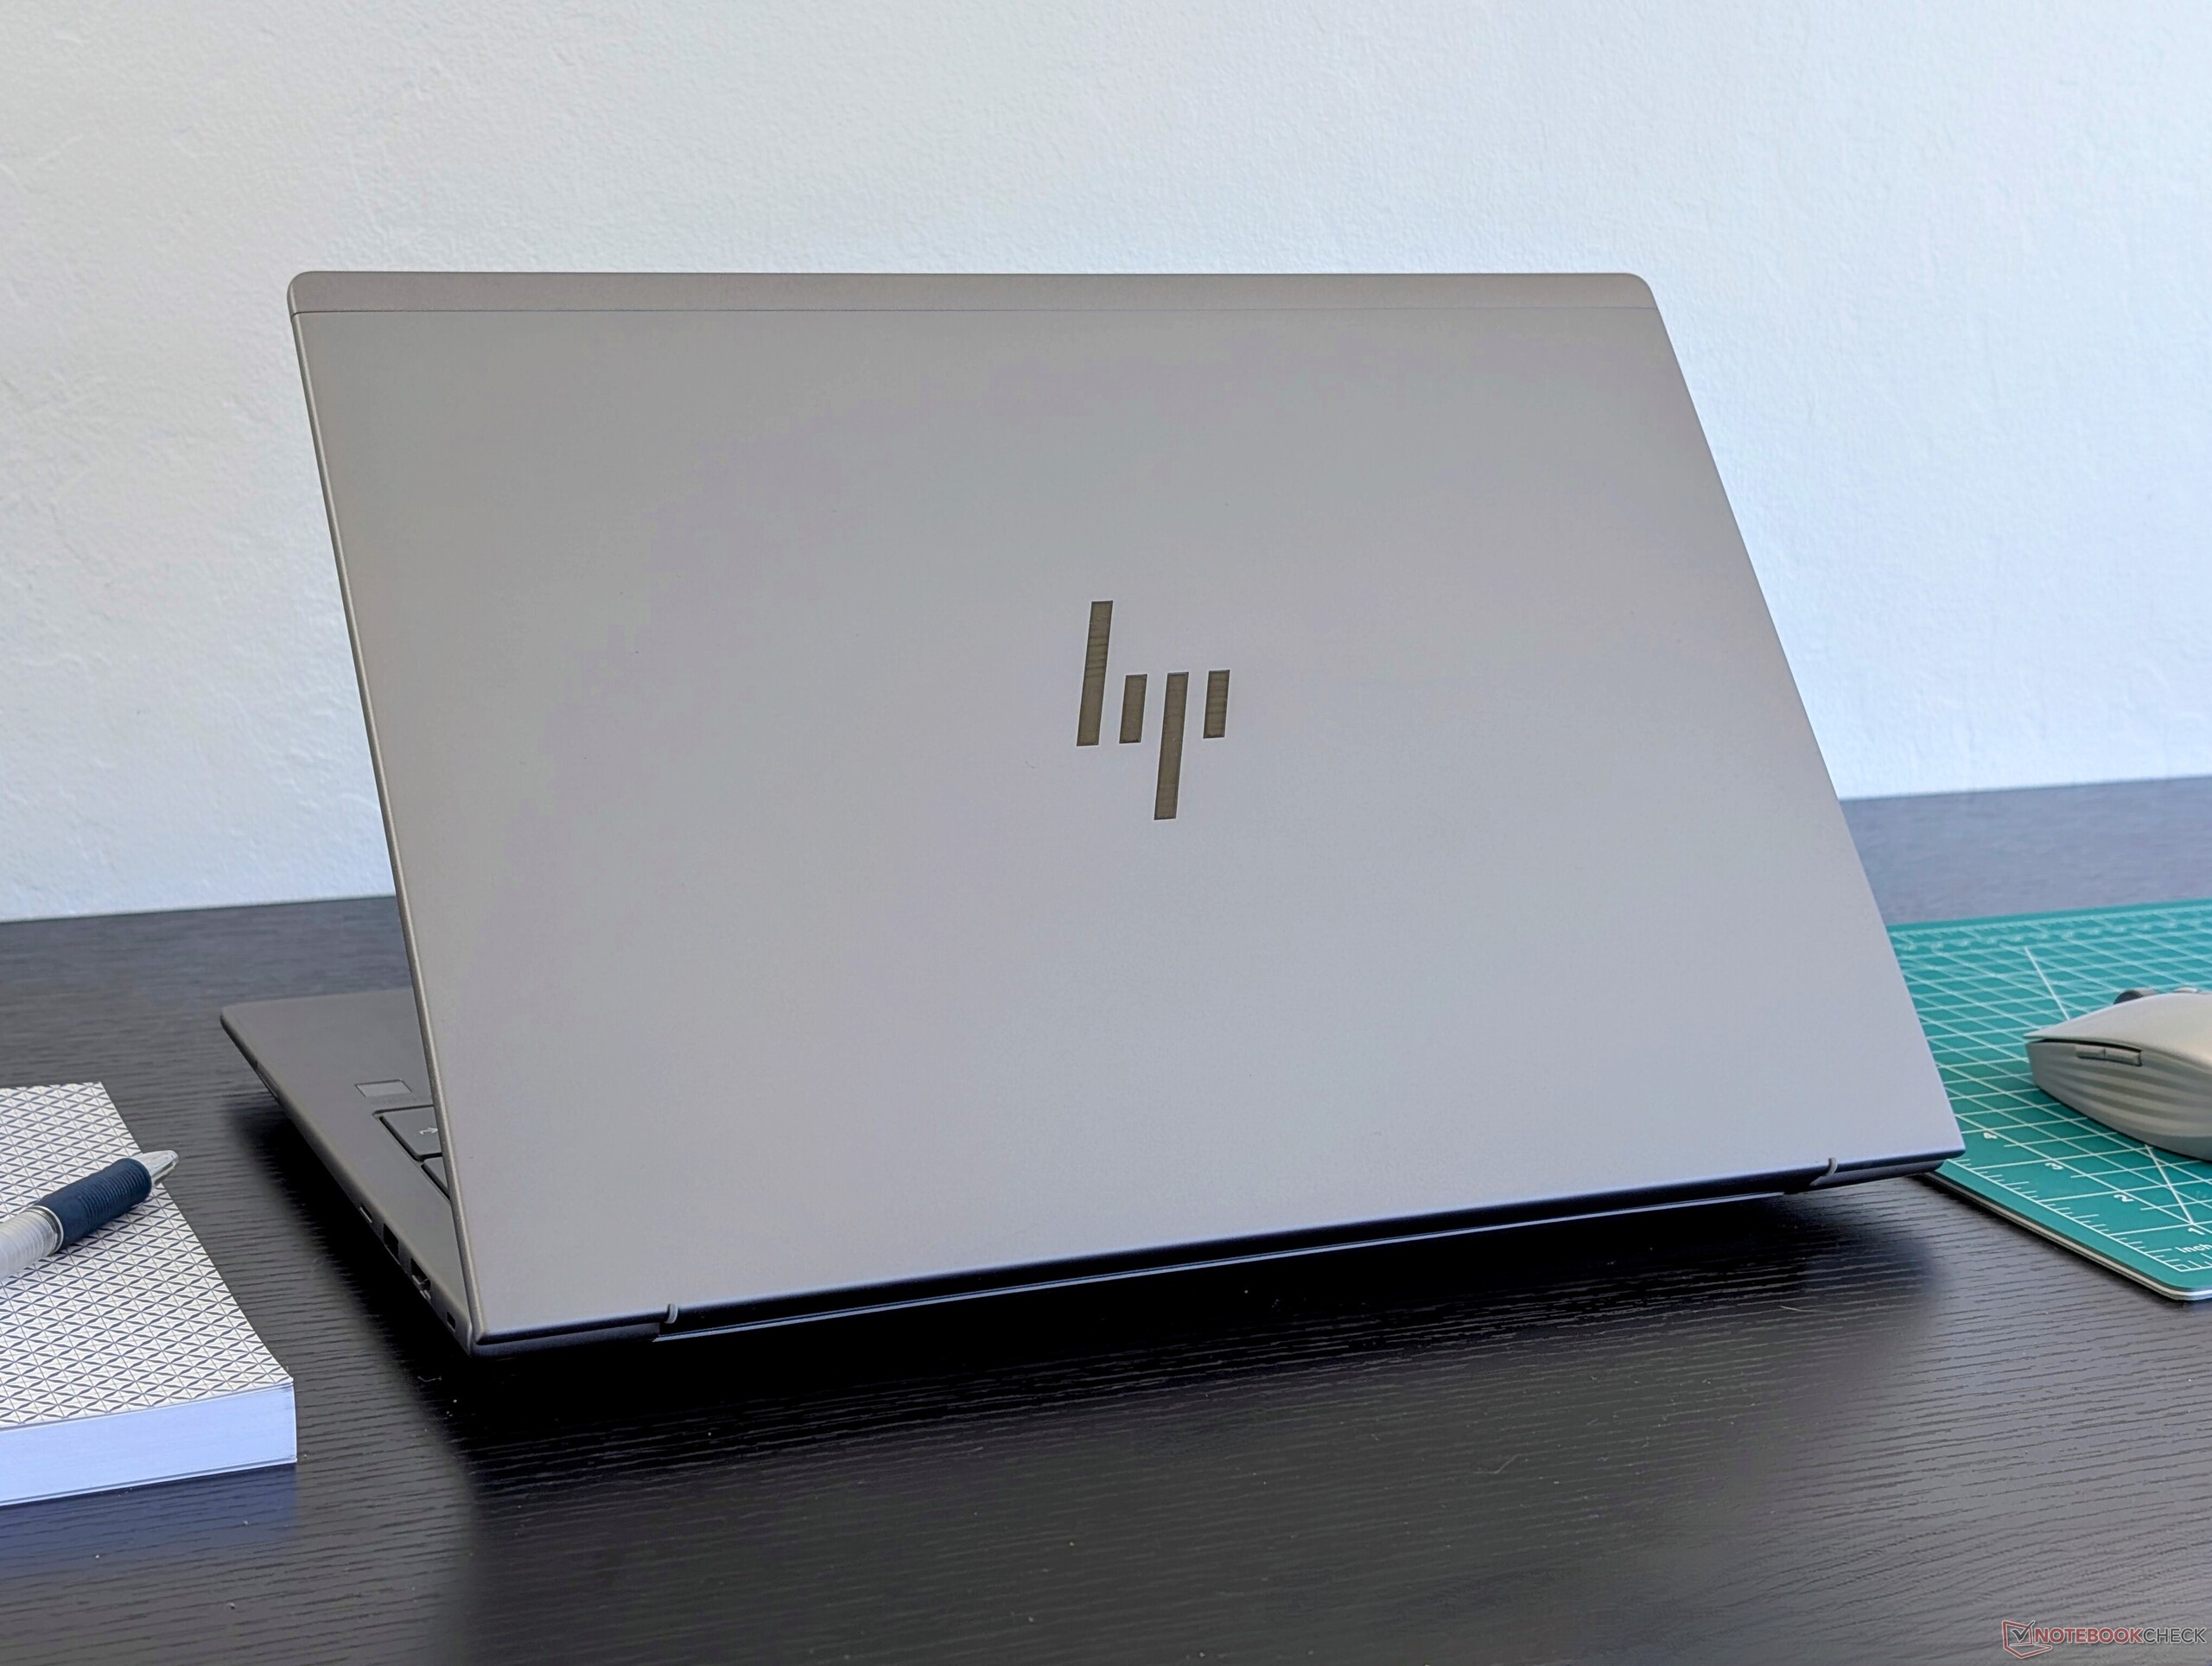
Yeni 16 inçlik tasarım, önceki 15 inçlik modelden yaklaşık yüzde 10 daha ağır ve yüzde 7 daha büyük. ThinkPad P1 Gen 7 gibi bazı rakiplerinden zaten daha kalın olduğu için daha ince olmaması da üzücü. Ürün ZBook Fury 16 G11 daha da ağır ve kalın ancak bunu telafi etmek için daha hızlı CPU ve GPU seçeneklerine sahip. HP daha ince olanı sunuyor ZBook Firefly 16 serisi, kullanıcıların daha taşınabilir bir seçenek istemesi durumunda.
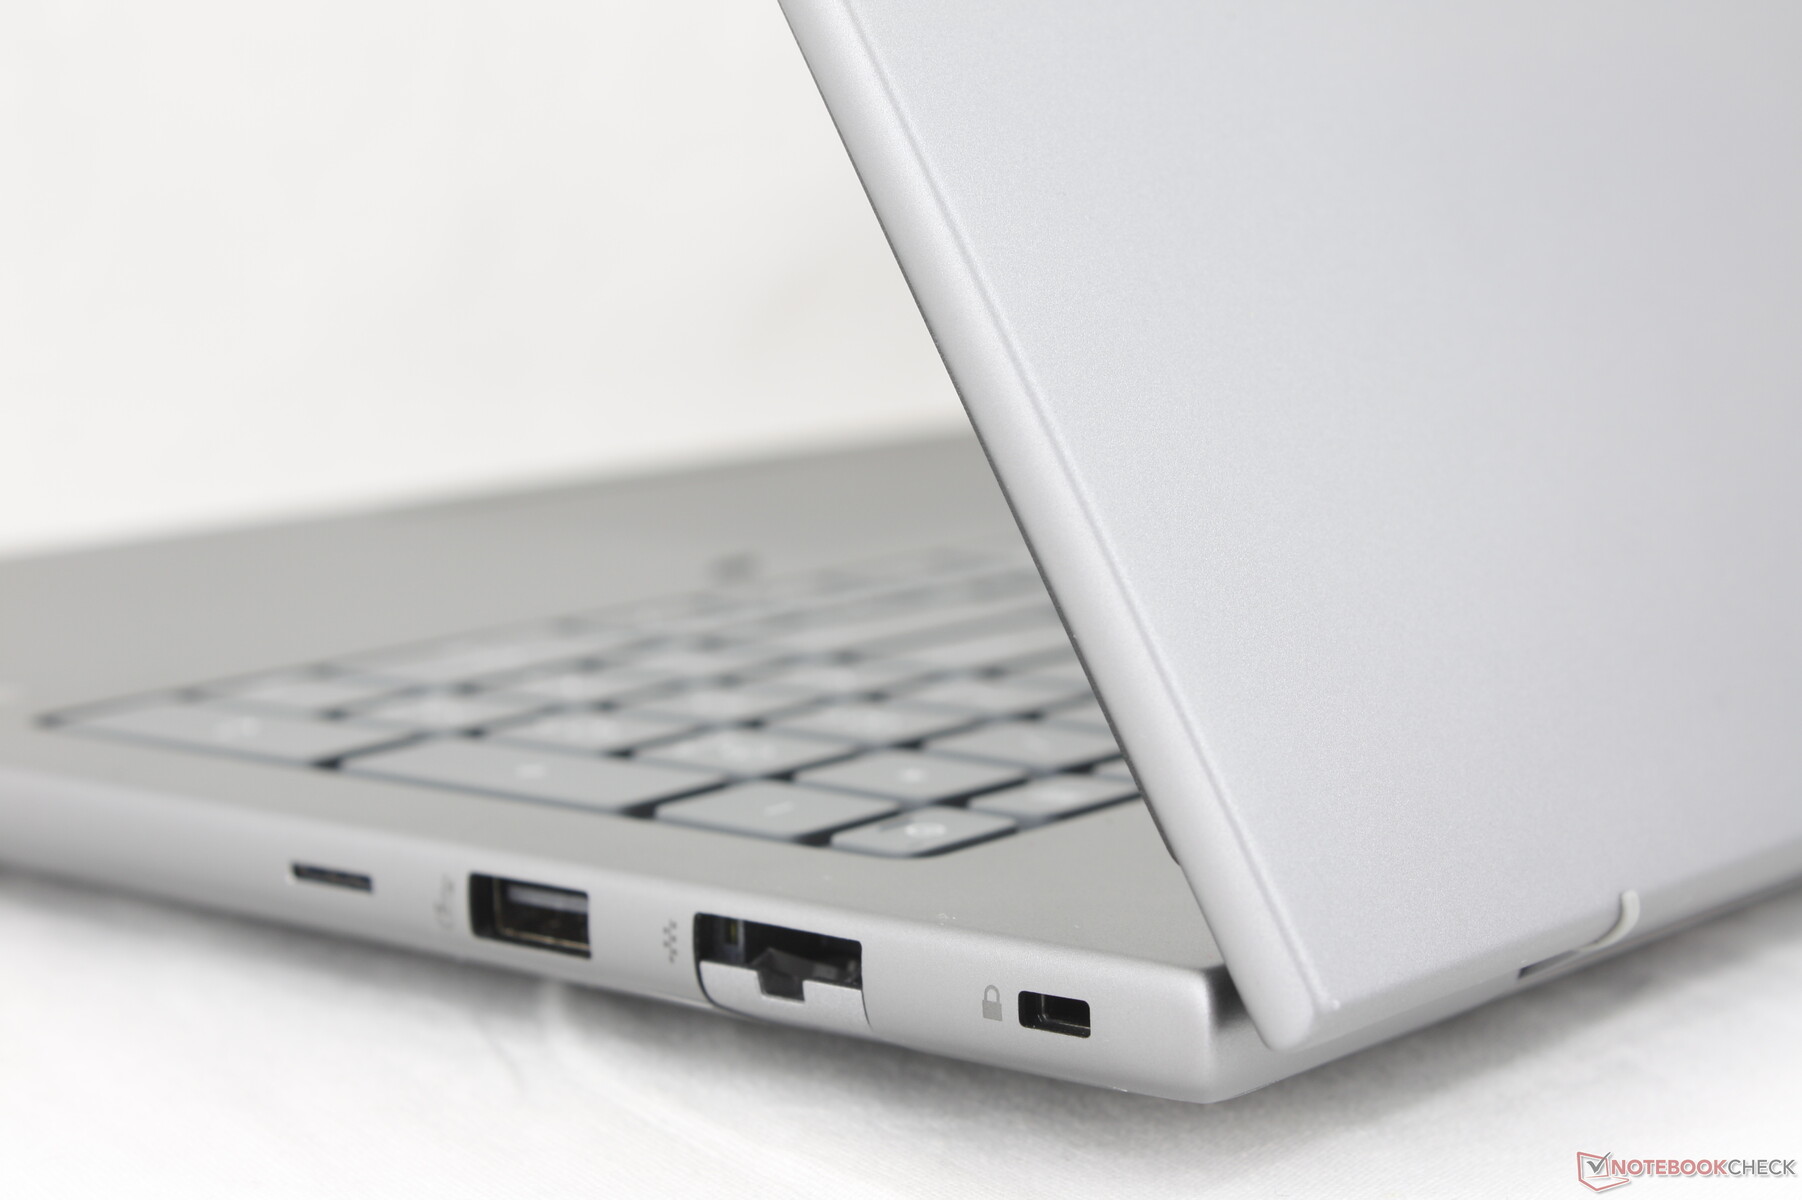
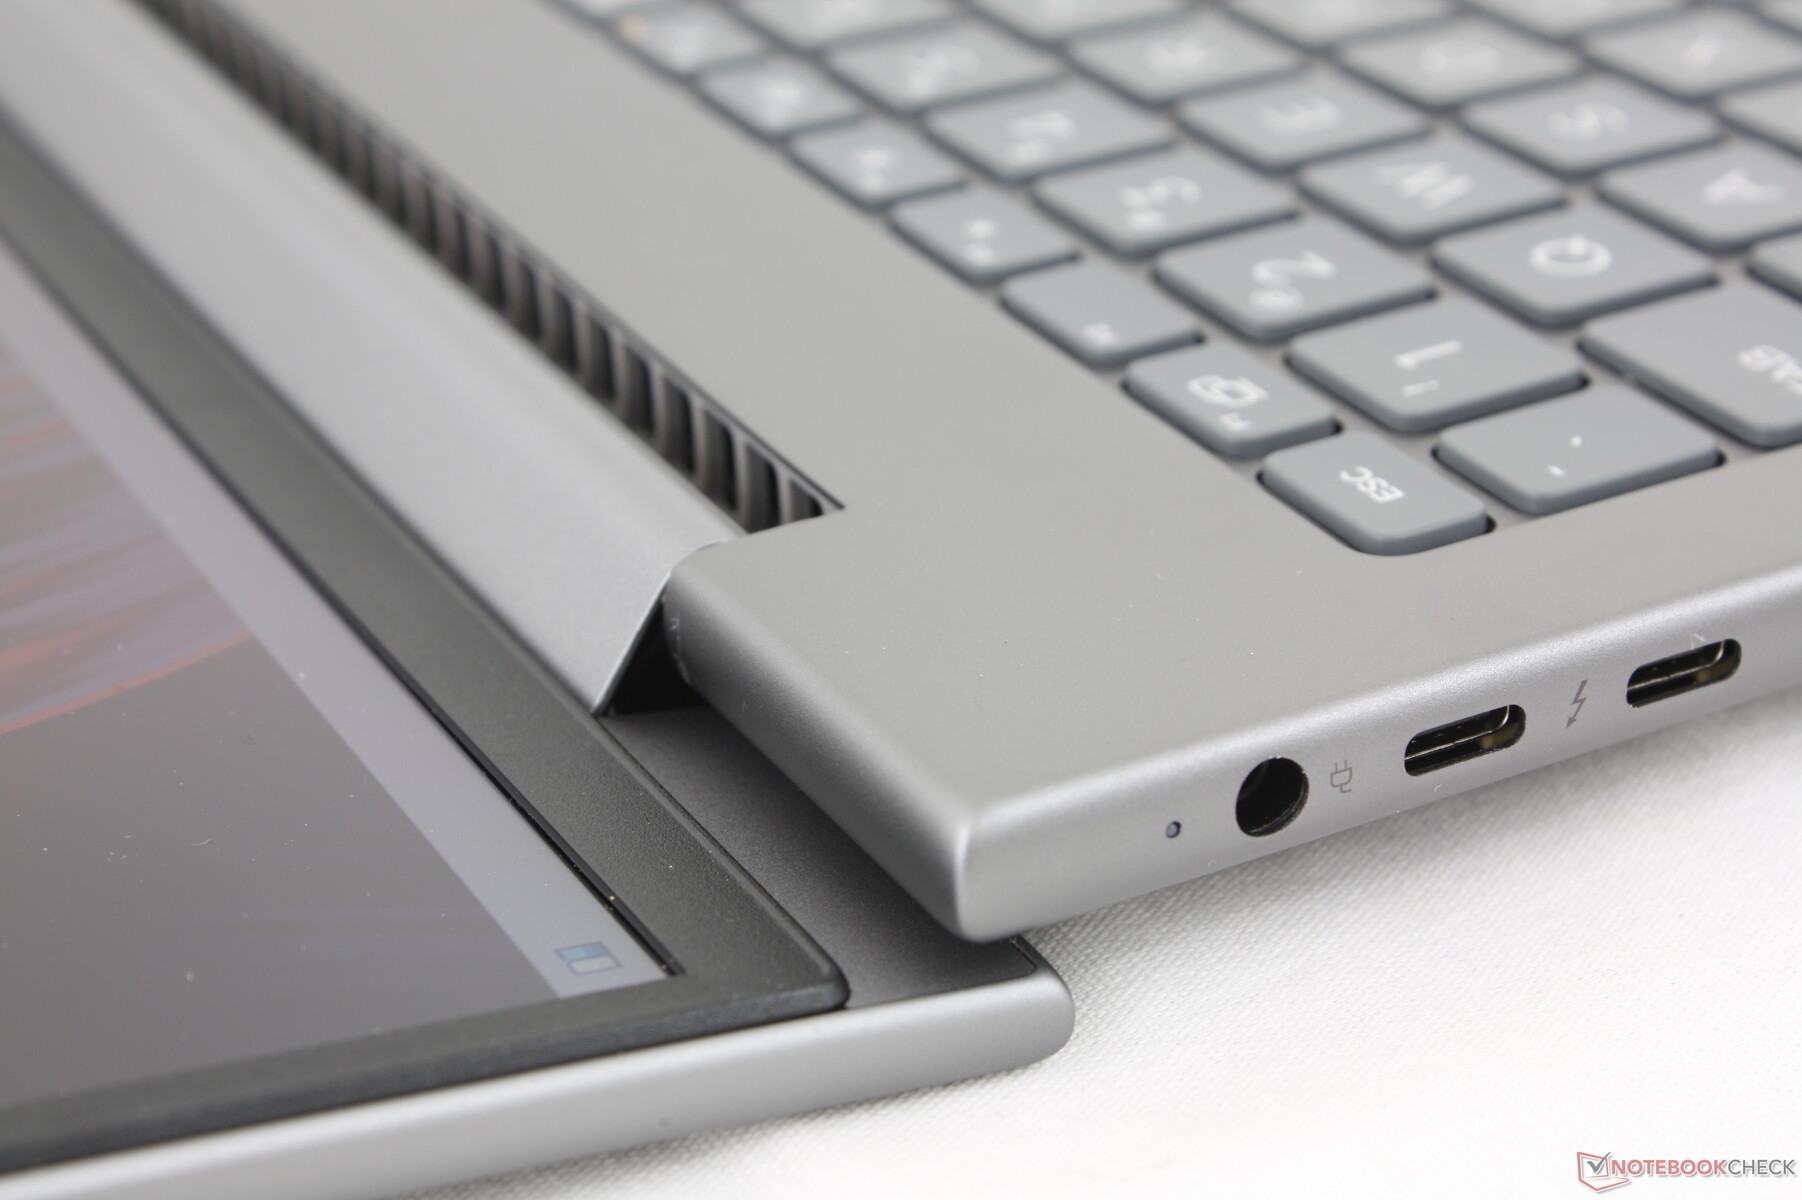
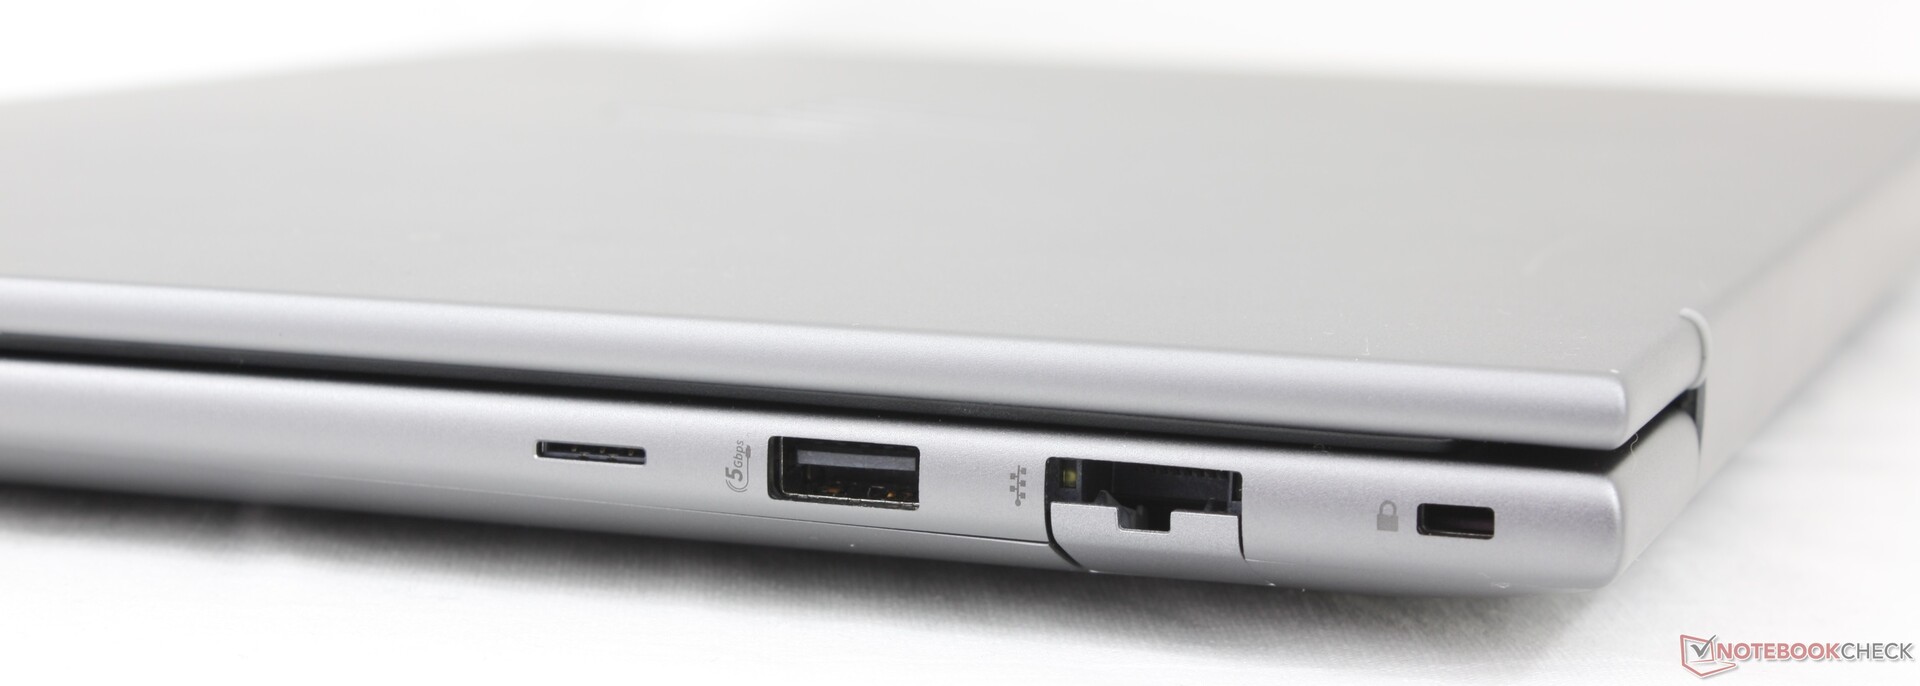
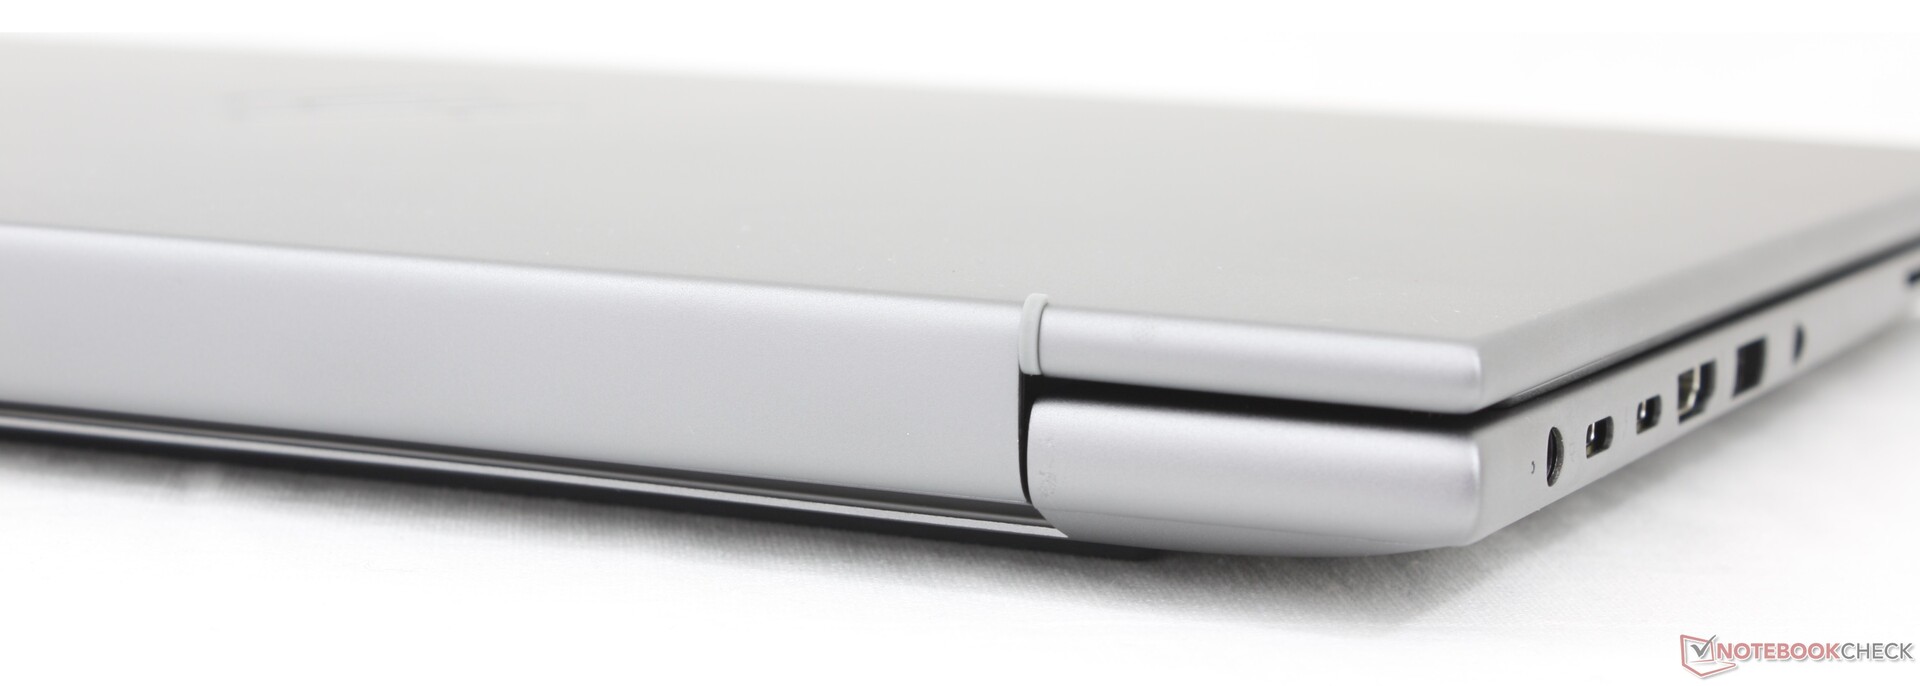
Bağlanabilirlik - Thunderbolt 4 Bağlantı Noktaları
Model, geçen yılki ZBook Power 15 G10'a göre daha az USB-A bağlantı noktası içeriyor. Akıllı Kart okuyucu ve yeniden düzenlenmiş olsa da çift USB-C Thunderbolt 4 bağlantı noktaları dahil olmak üzere diğer her şey geri döndü. Özellikle sol kenardaki bağlantı noktaları çok kalabalık ve biraz daha fazla yayılabilirdi.
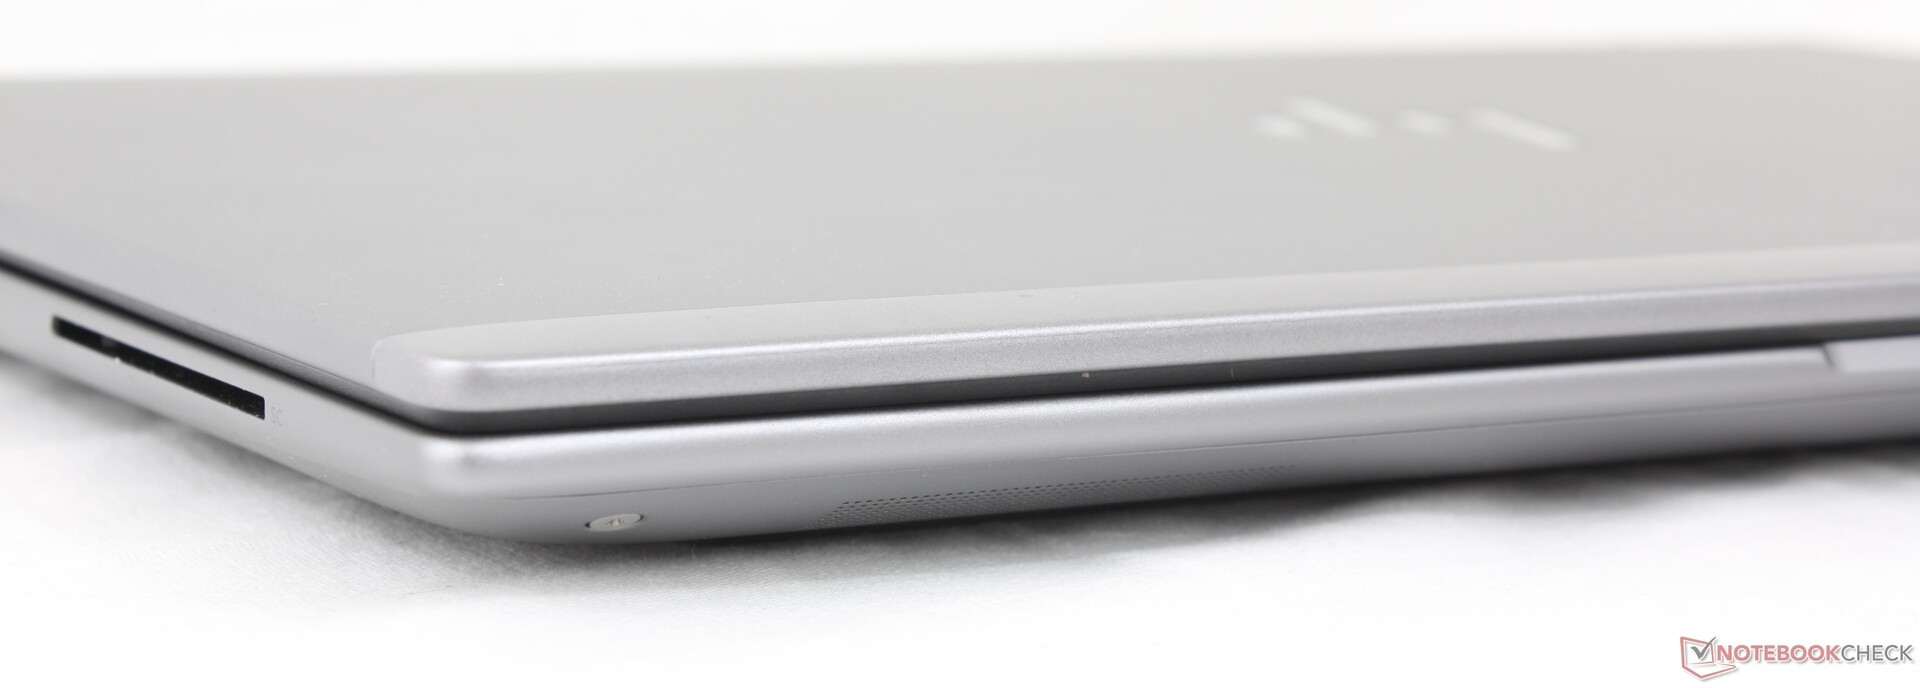

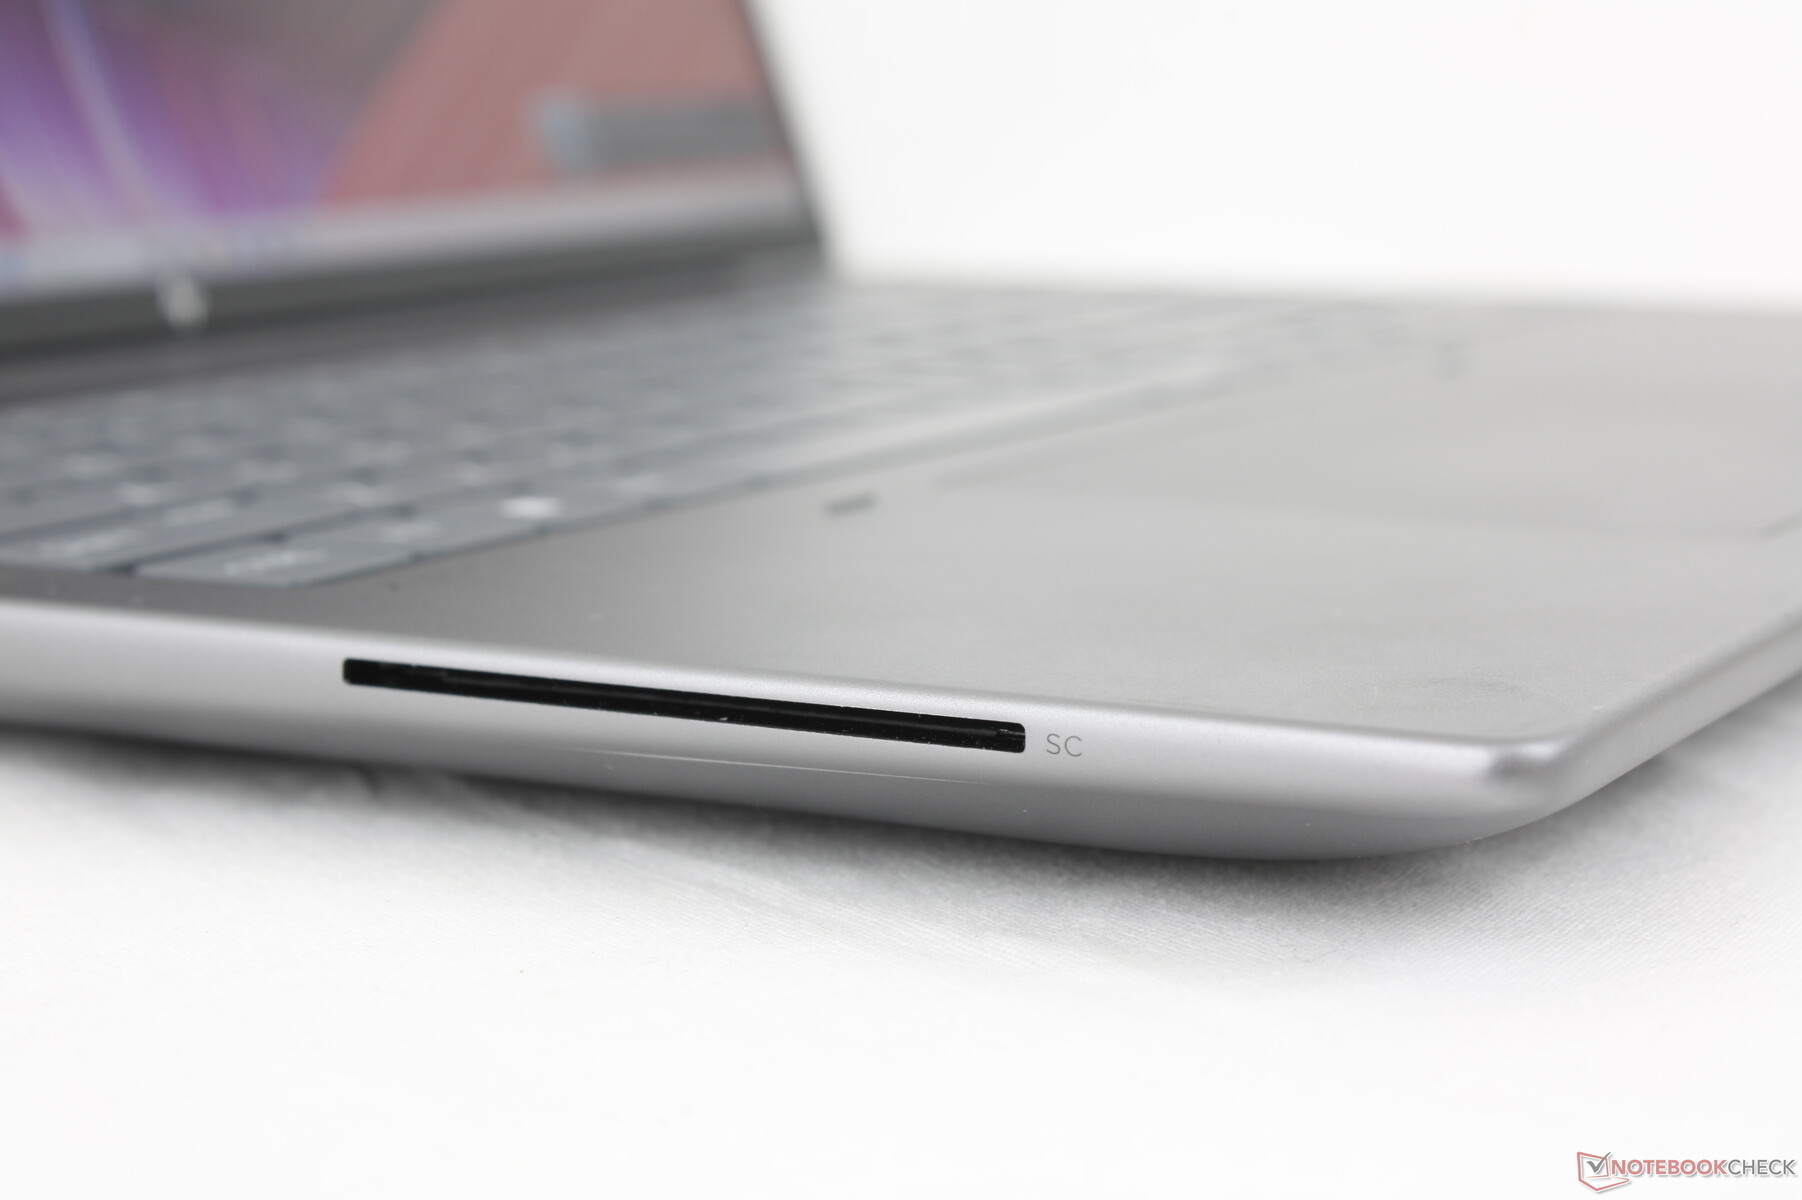
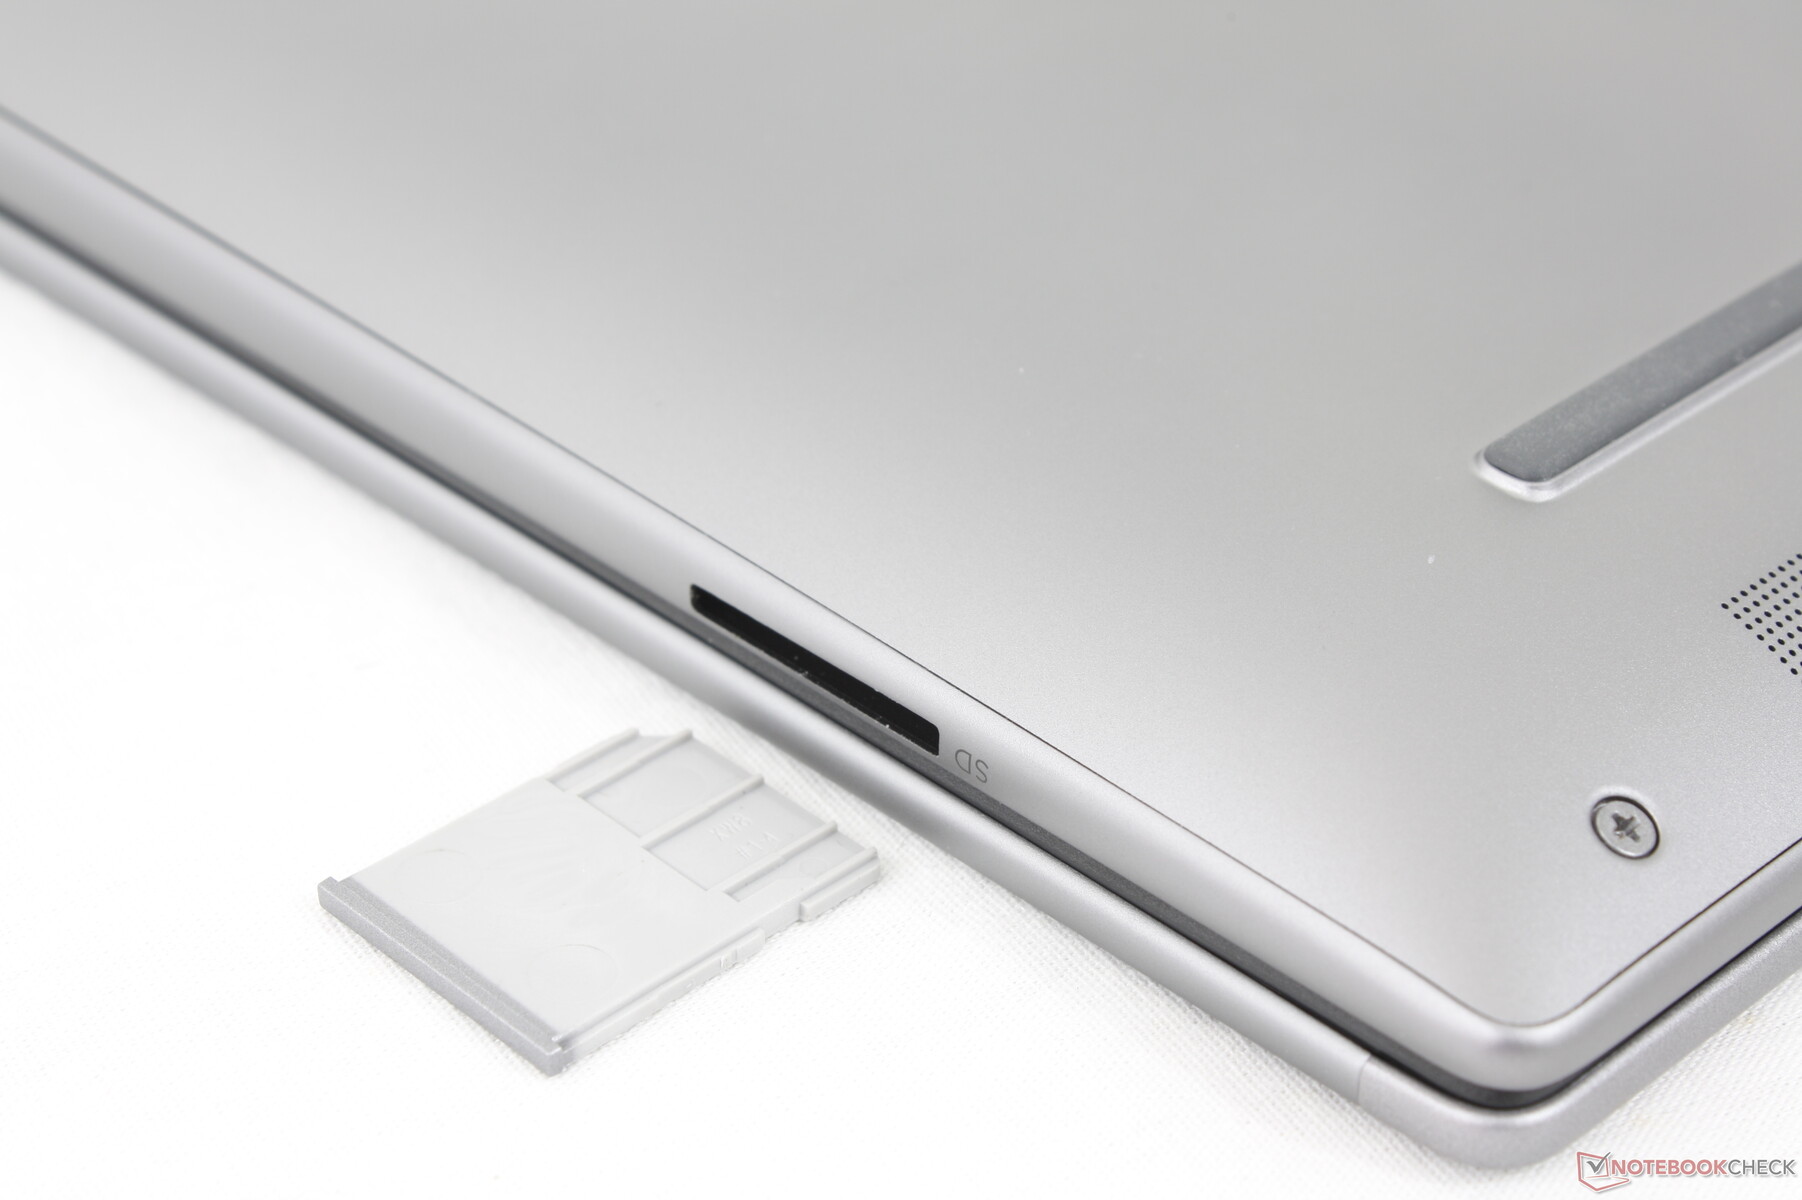
SD Kart Okuyucu
ZBook Power 15 G10'da bu özellik yokken, model bir MicroSD kart okuyucu içeriyor. Aktarım hızları çok hızlıdır; UHS-II test kartımızdan 1 GB fotoğrafı taşımak, ZBook Fury 16 G11 veya ThinkPad P1 Gen 7'deki 12 saniyeye kıyasla 6 saniyeden az sürer.
| SD Card Reader | |
| average JPG Copy Test (av. of 3 runs) | |
| HP ZBook Power 16 G11 A (Toshiba Exceria Pro SDXC 64 GB UHS-II) | |
| HP ZBook Fury 16 G11 (Toshiba Exceria Pro SDXC 64 GB UHS-II) | |
| Lenovo ThinkPad P1 Gen 7 21KV001SGE (AV Pro V60) | |
| maximum AS SSD Seq Read Test (1GB) | |
| HP ZBook Power 16 G11 A (Toshiba Exceria Pro SDXC 64 GB UHS-II) | |
| HP ZBook Fury 16 G11 (Toshiba Exceria Pro SDXC 64 GB UHS-II) | |
| Lenovo ThinkPad P1 Gen 7 21KV001SGE (AV Pro V60) | |
İletişim
MediaTek MT7922, Wi-Fi 6E ve Bluetooth 5.2 bağlantısı için standart olarak geliyor. WAN bağlantısı için HP 4000 veya Qualcomm 9205'in yanı sıra Realtek seçenekleri de mevcuttur.
Web kamerası
5 MP web kamerası, IR ve ThinkPad P16s G2'ye benzer fiziksel bir deklanşör kaydırıcısının yanı sıra standart olarak gelir. Telefon Precision 5690 çok daha düşük çözünürlüklü 2 MP web kamerası ile birlikte gelir.


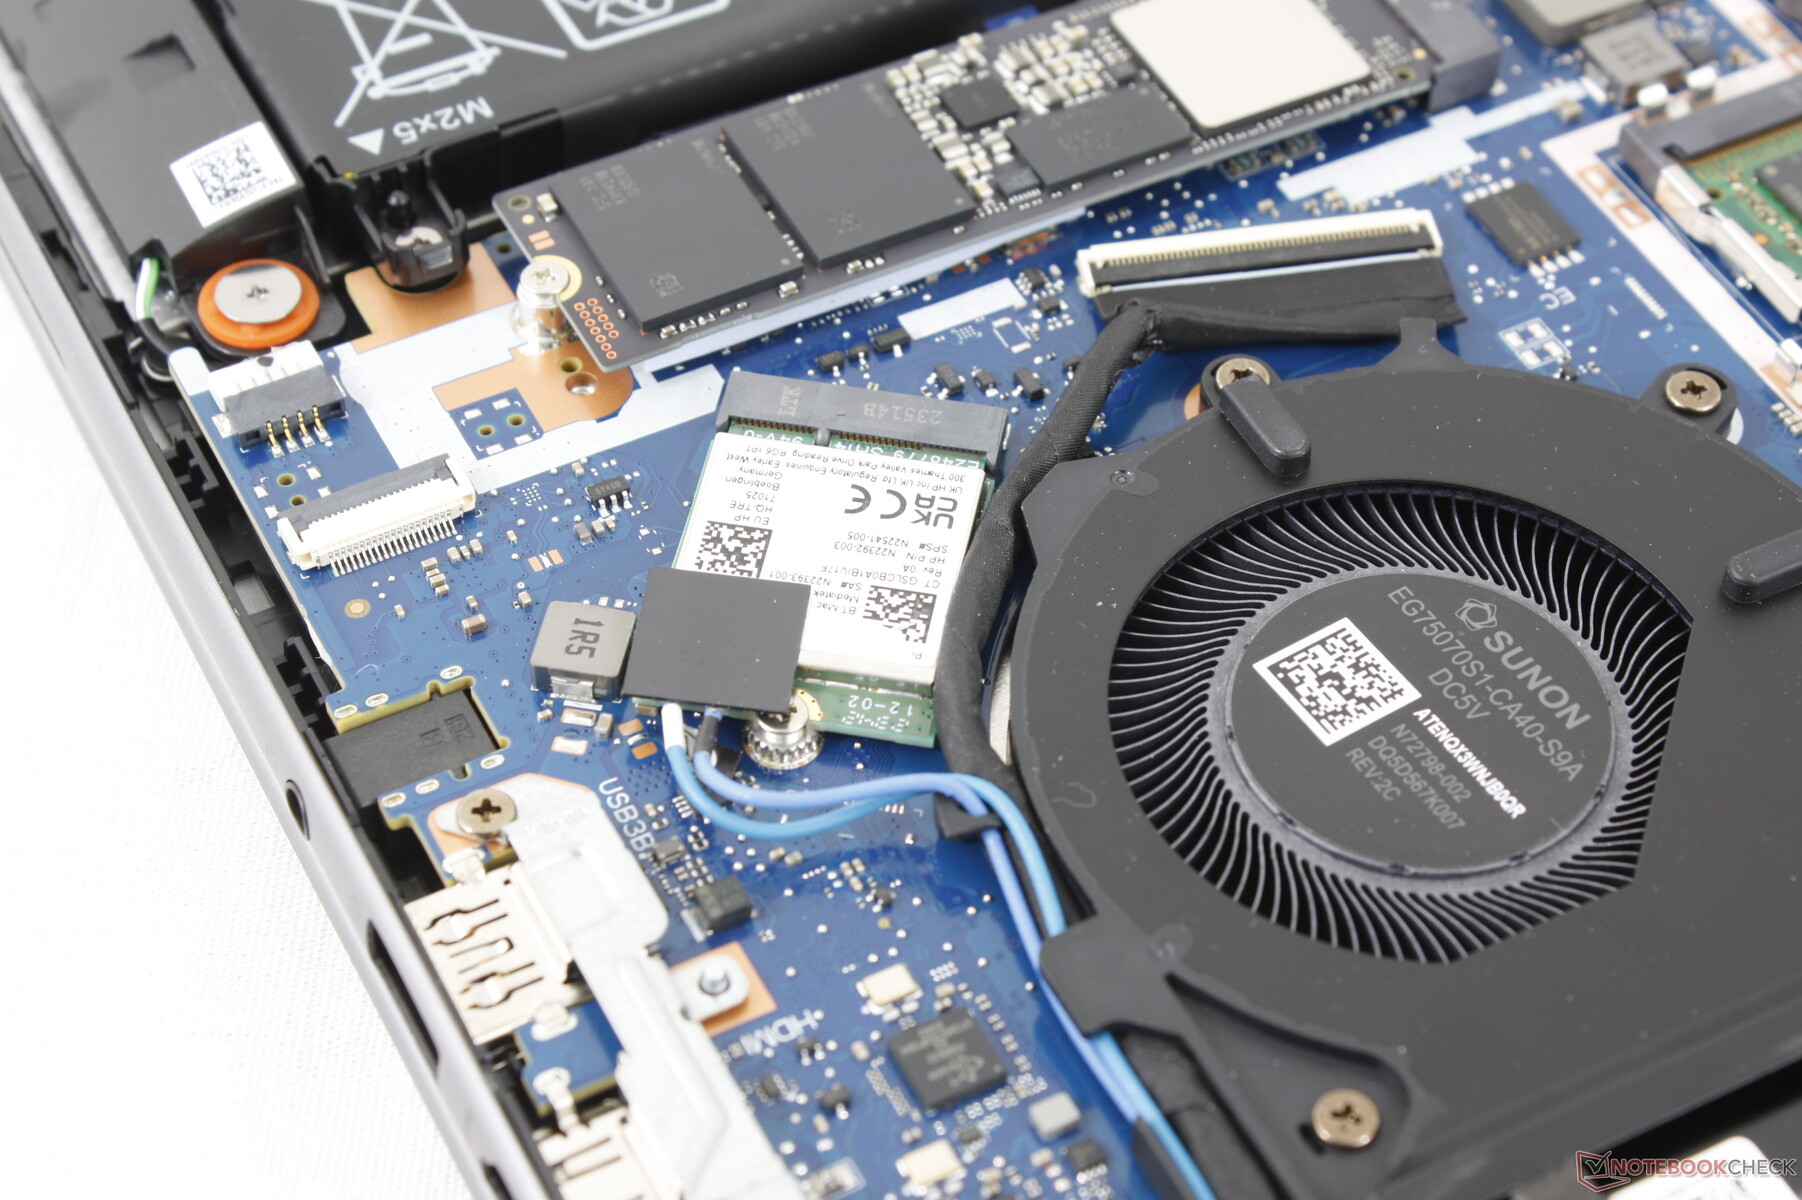
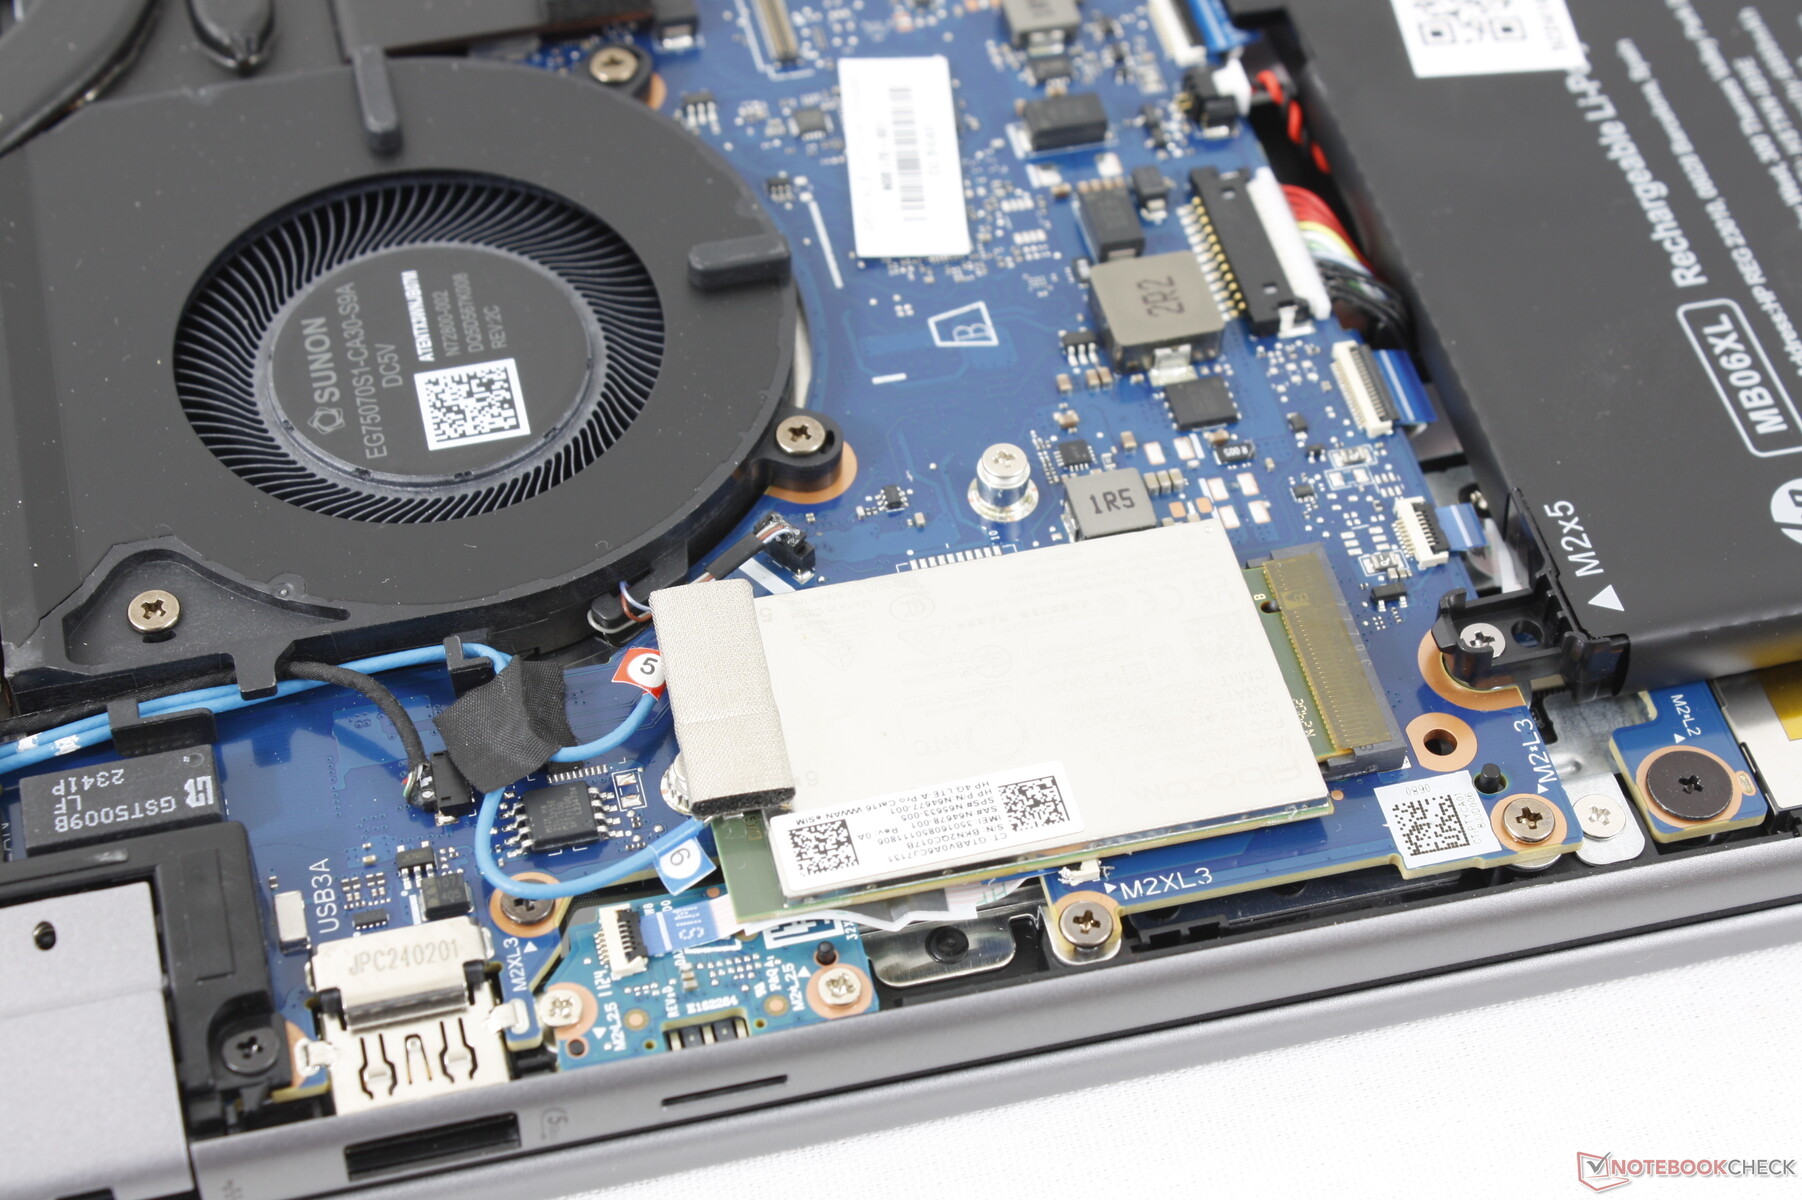
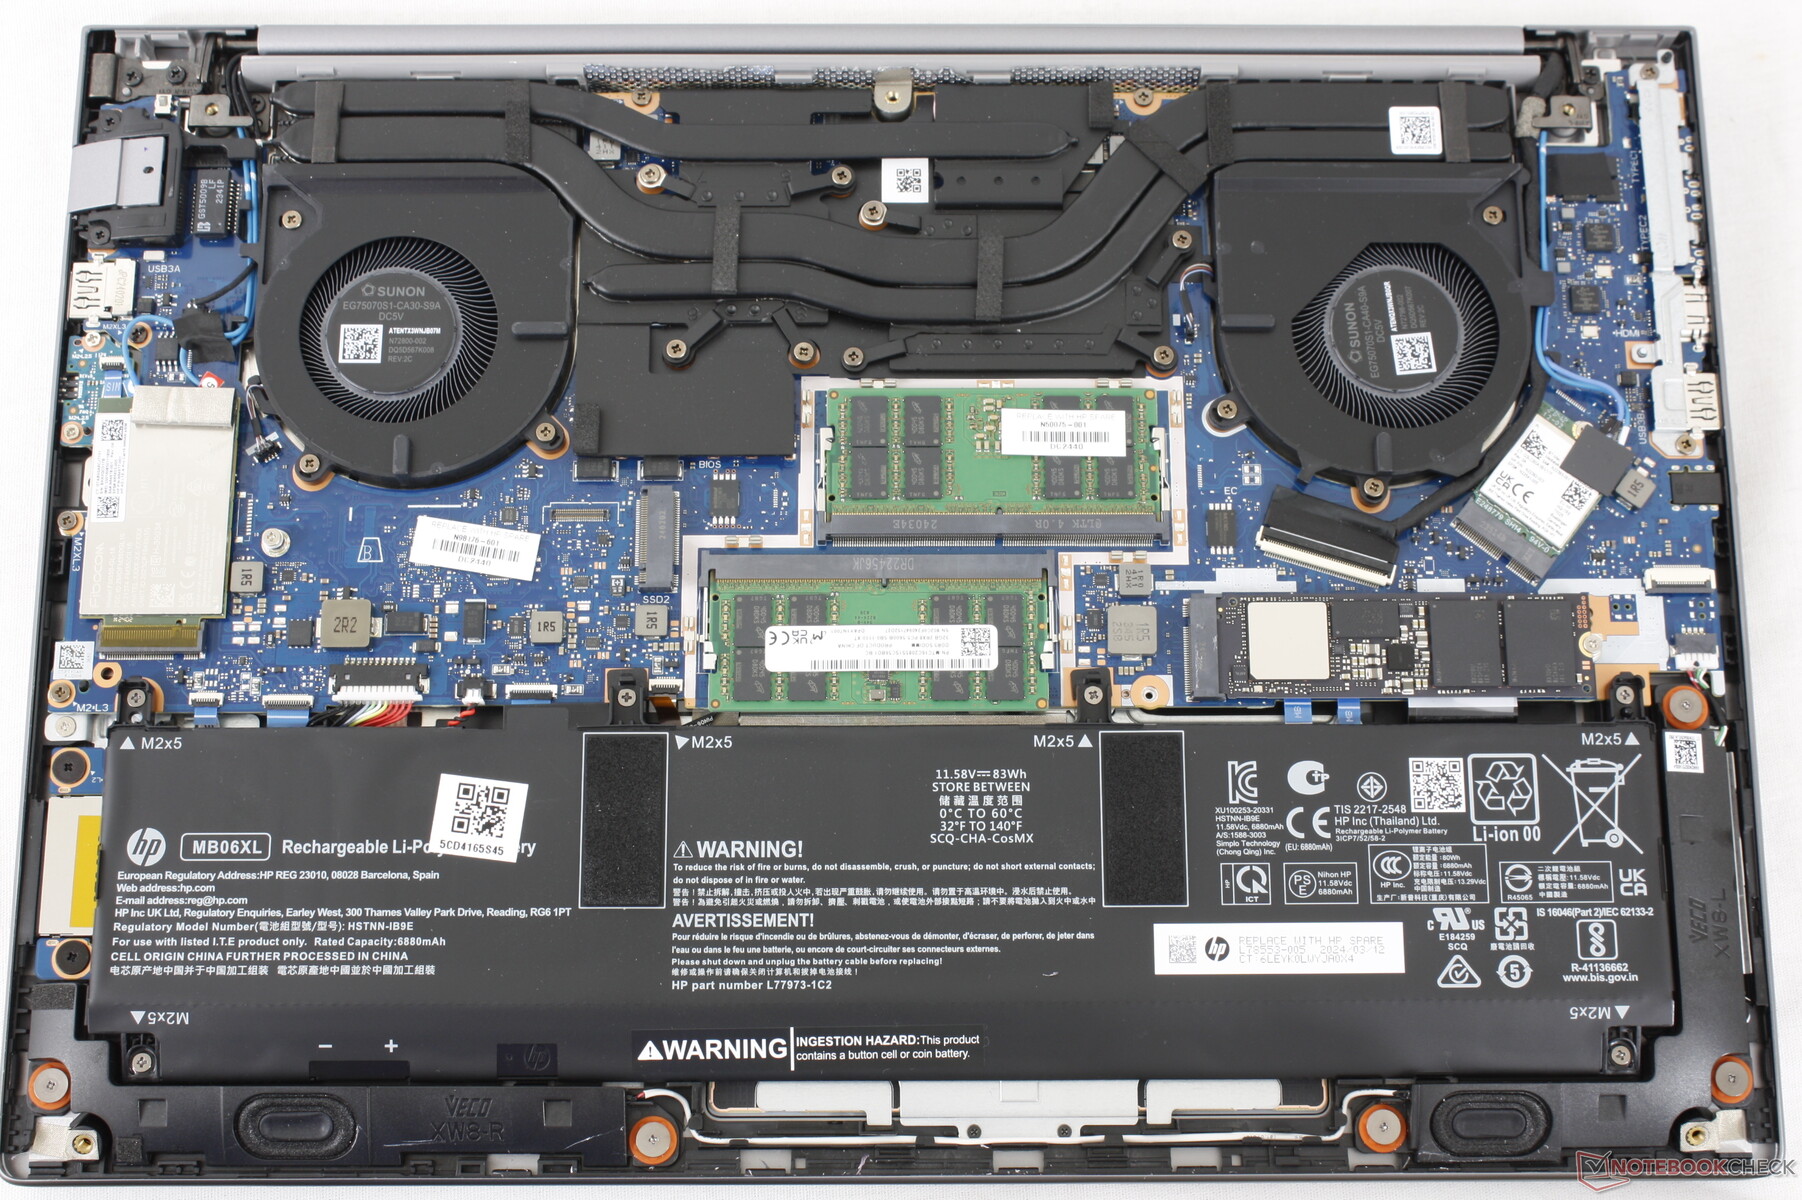
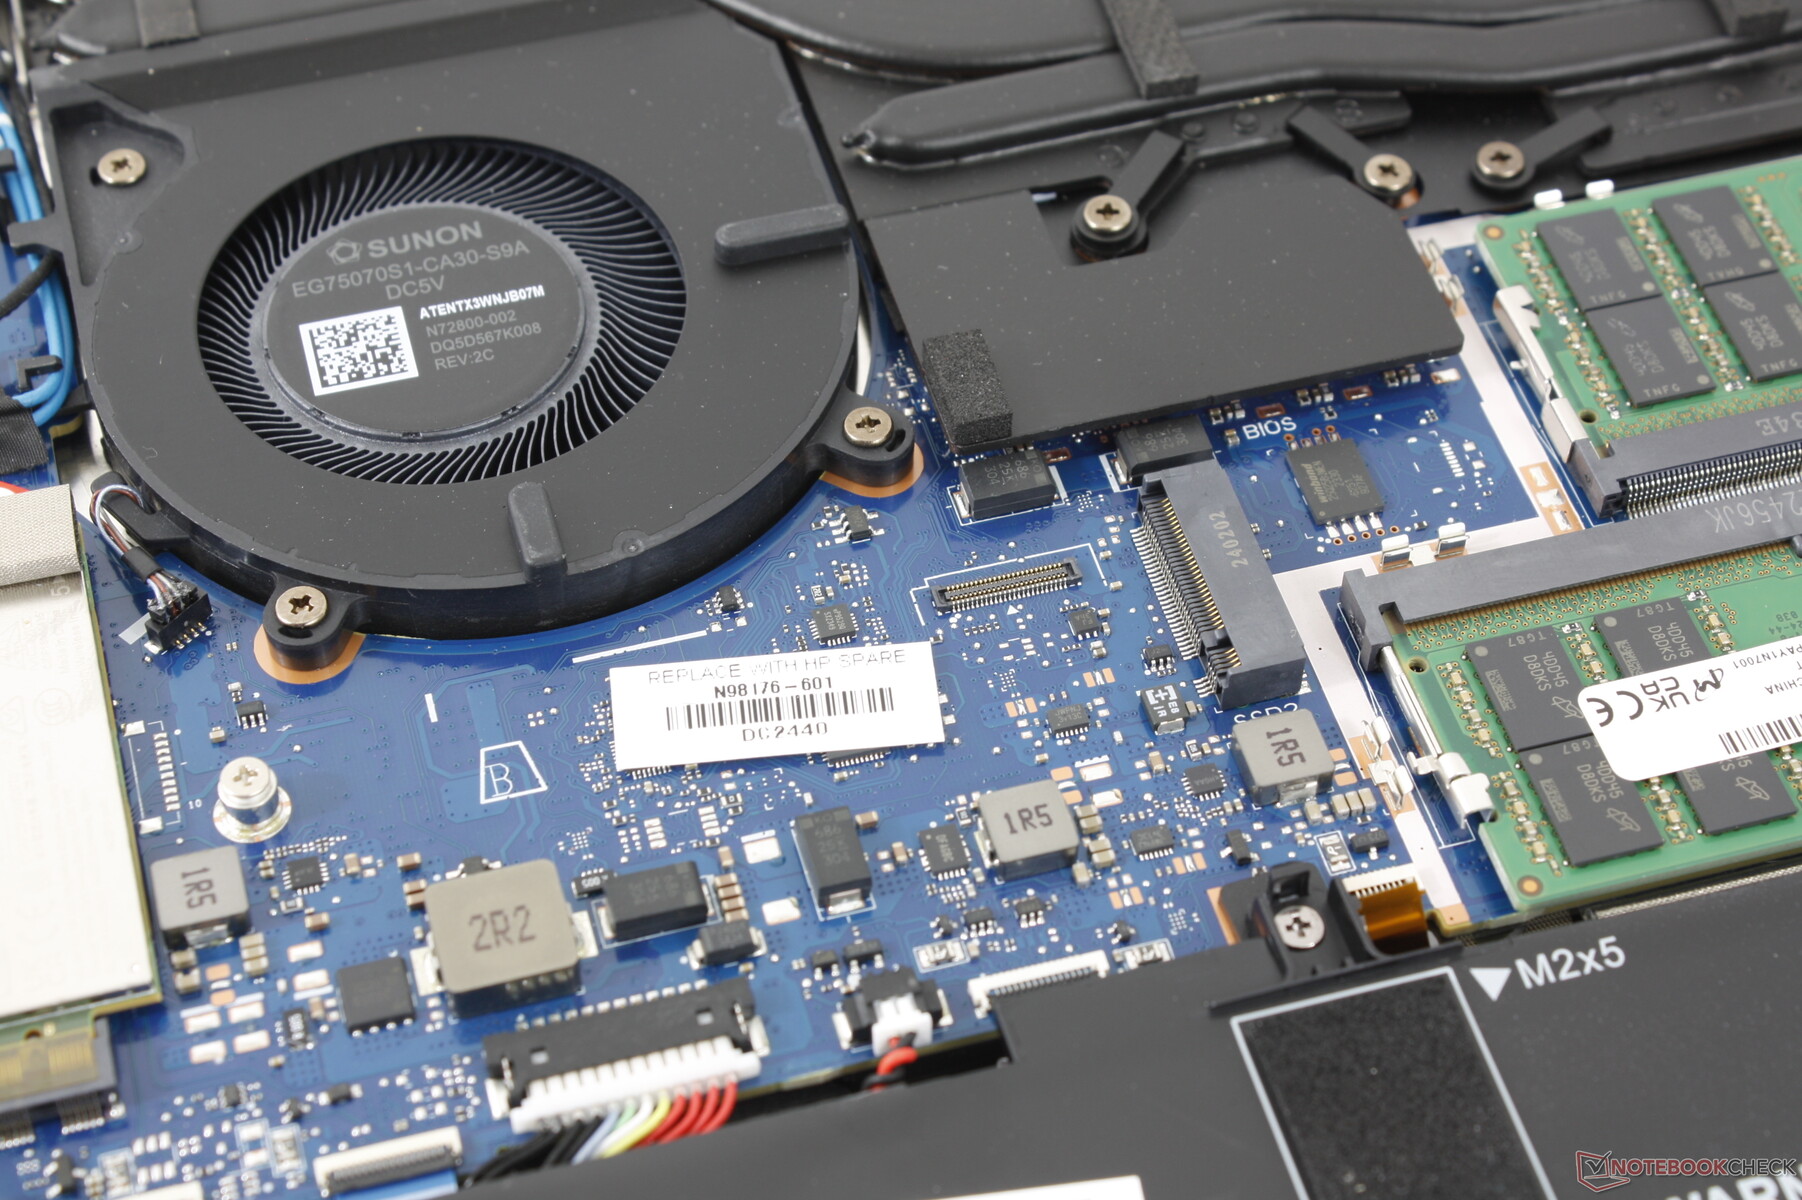
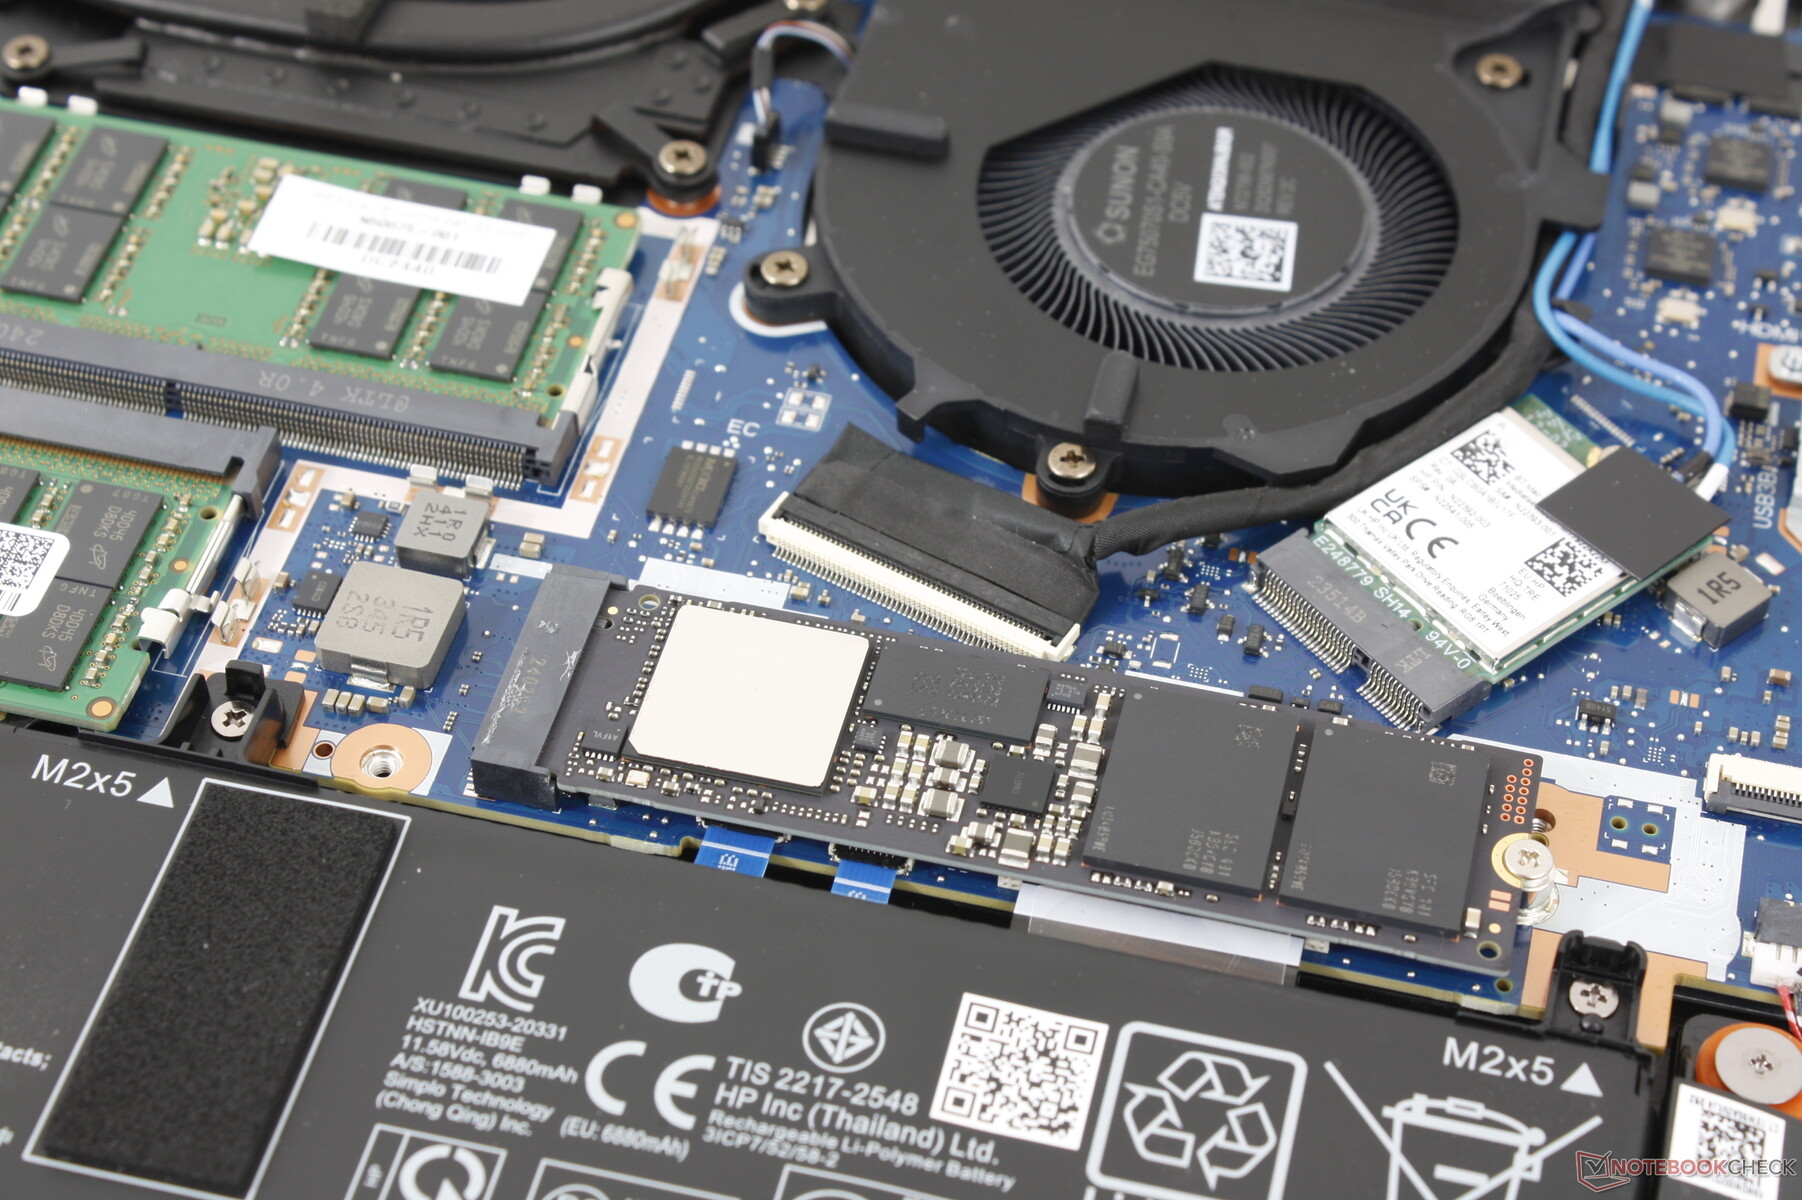
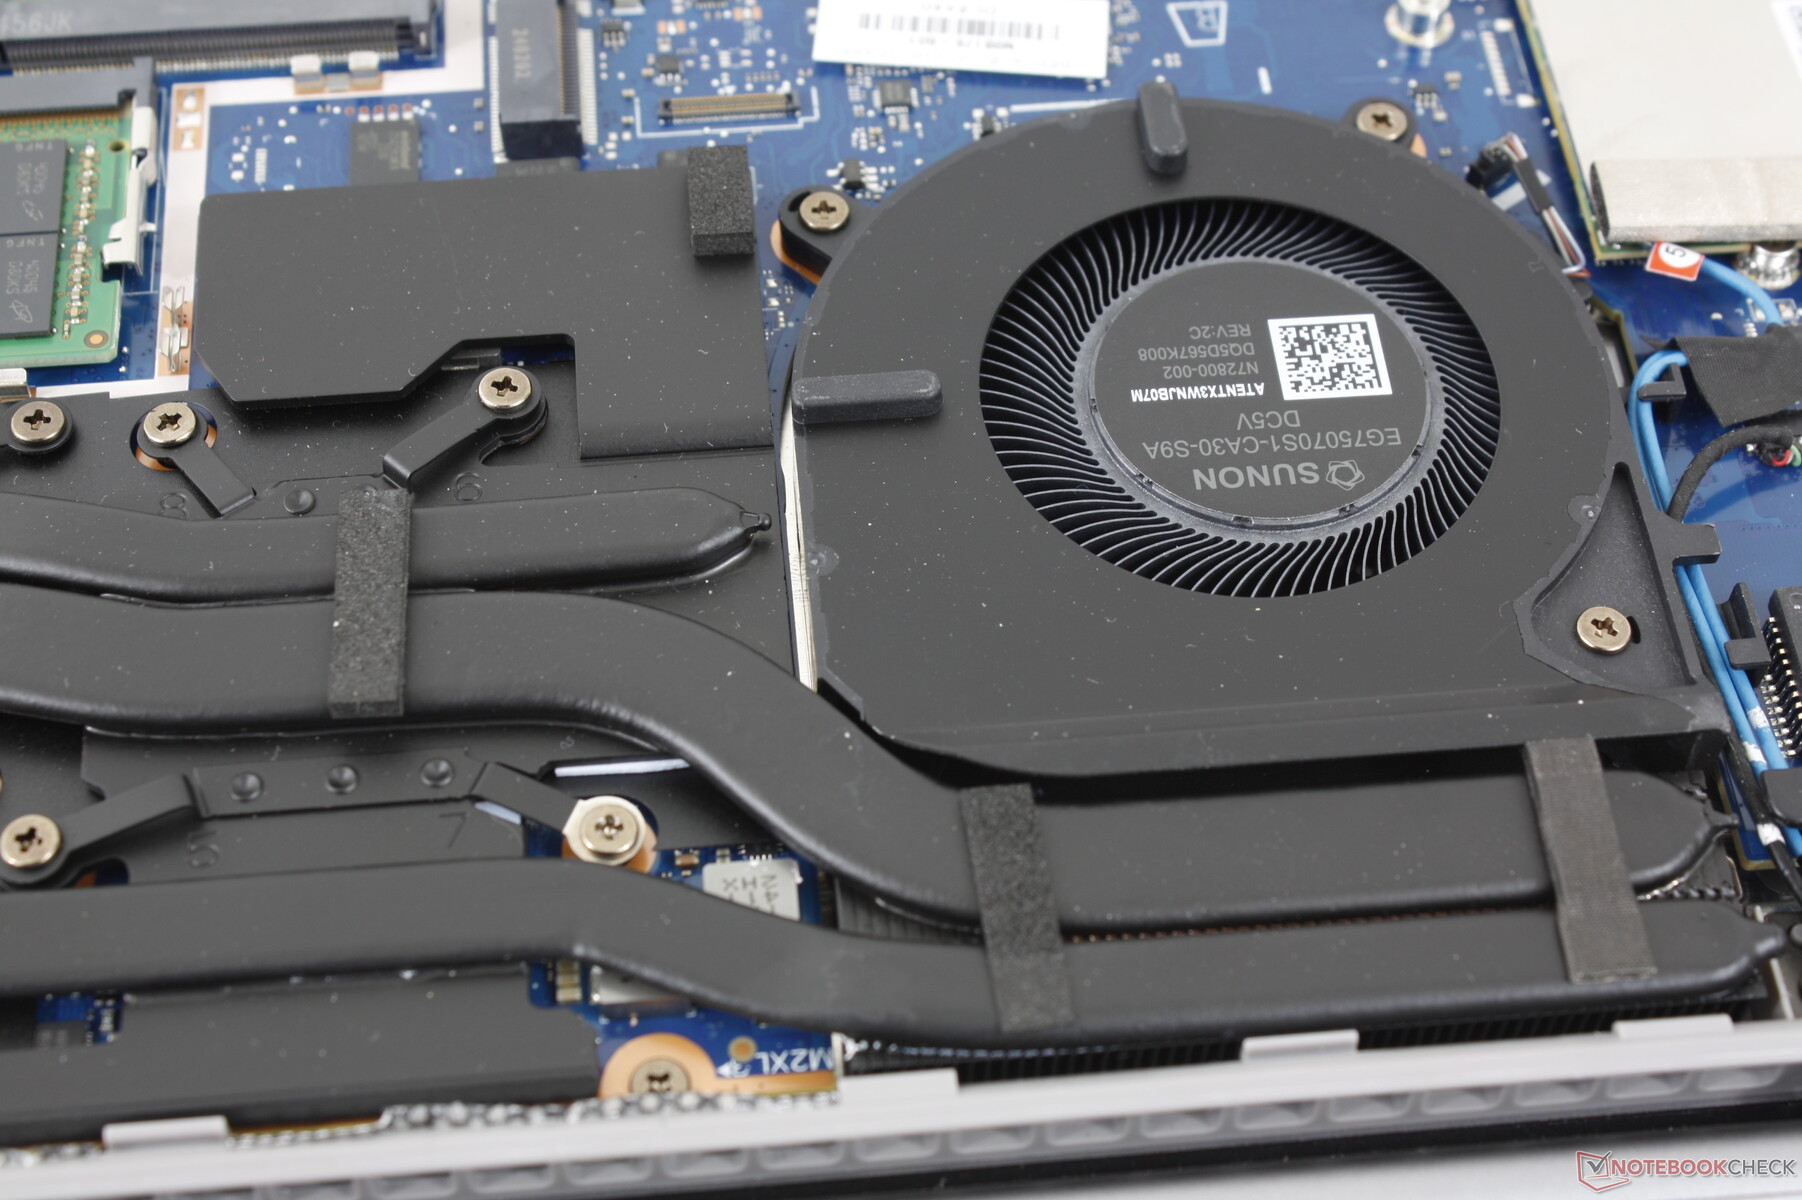
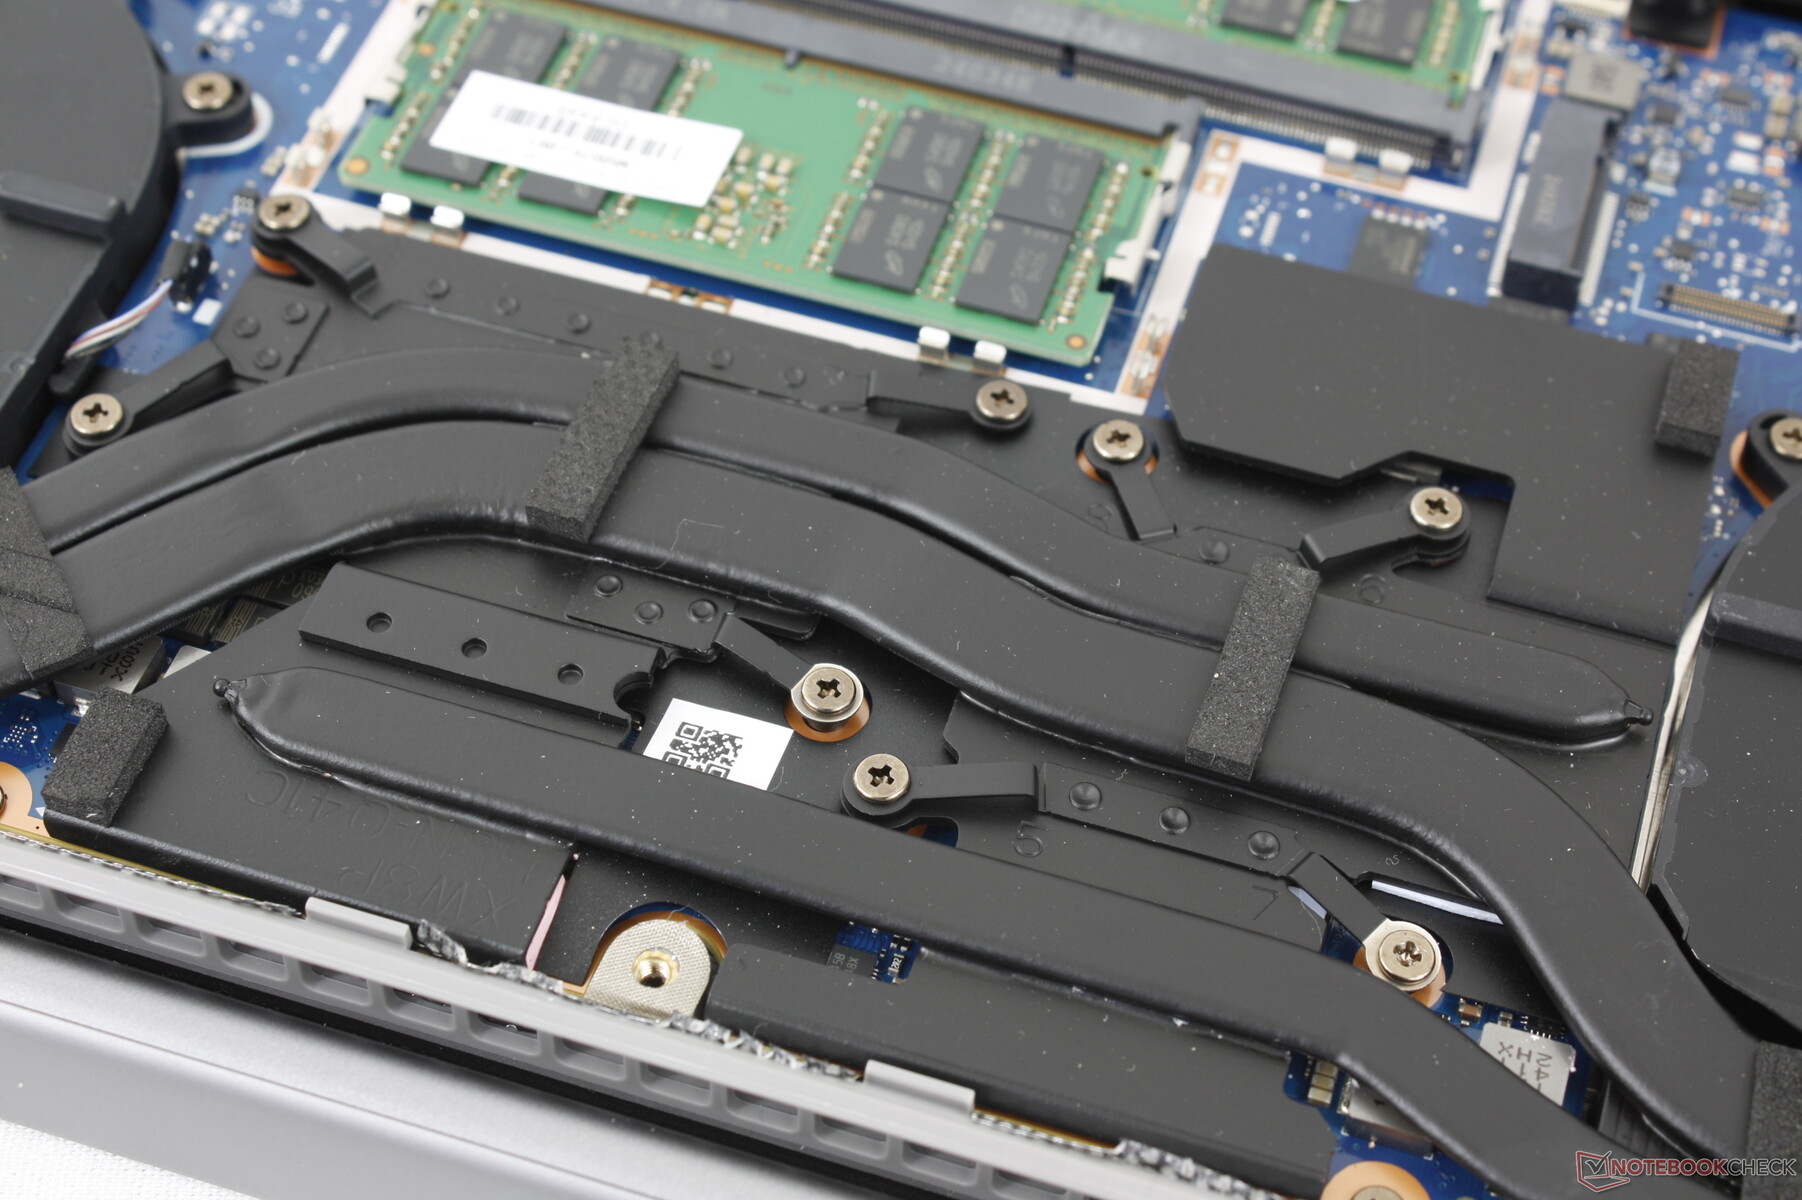
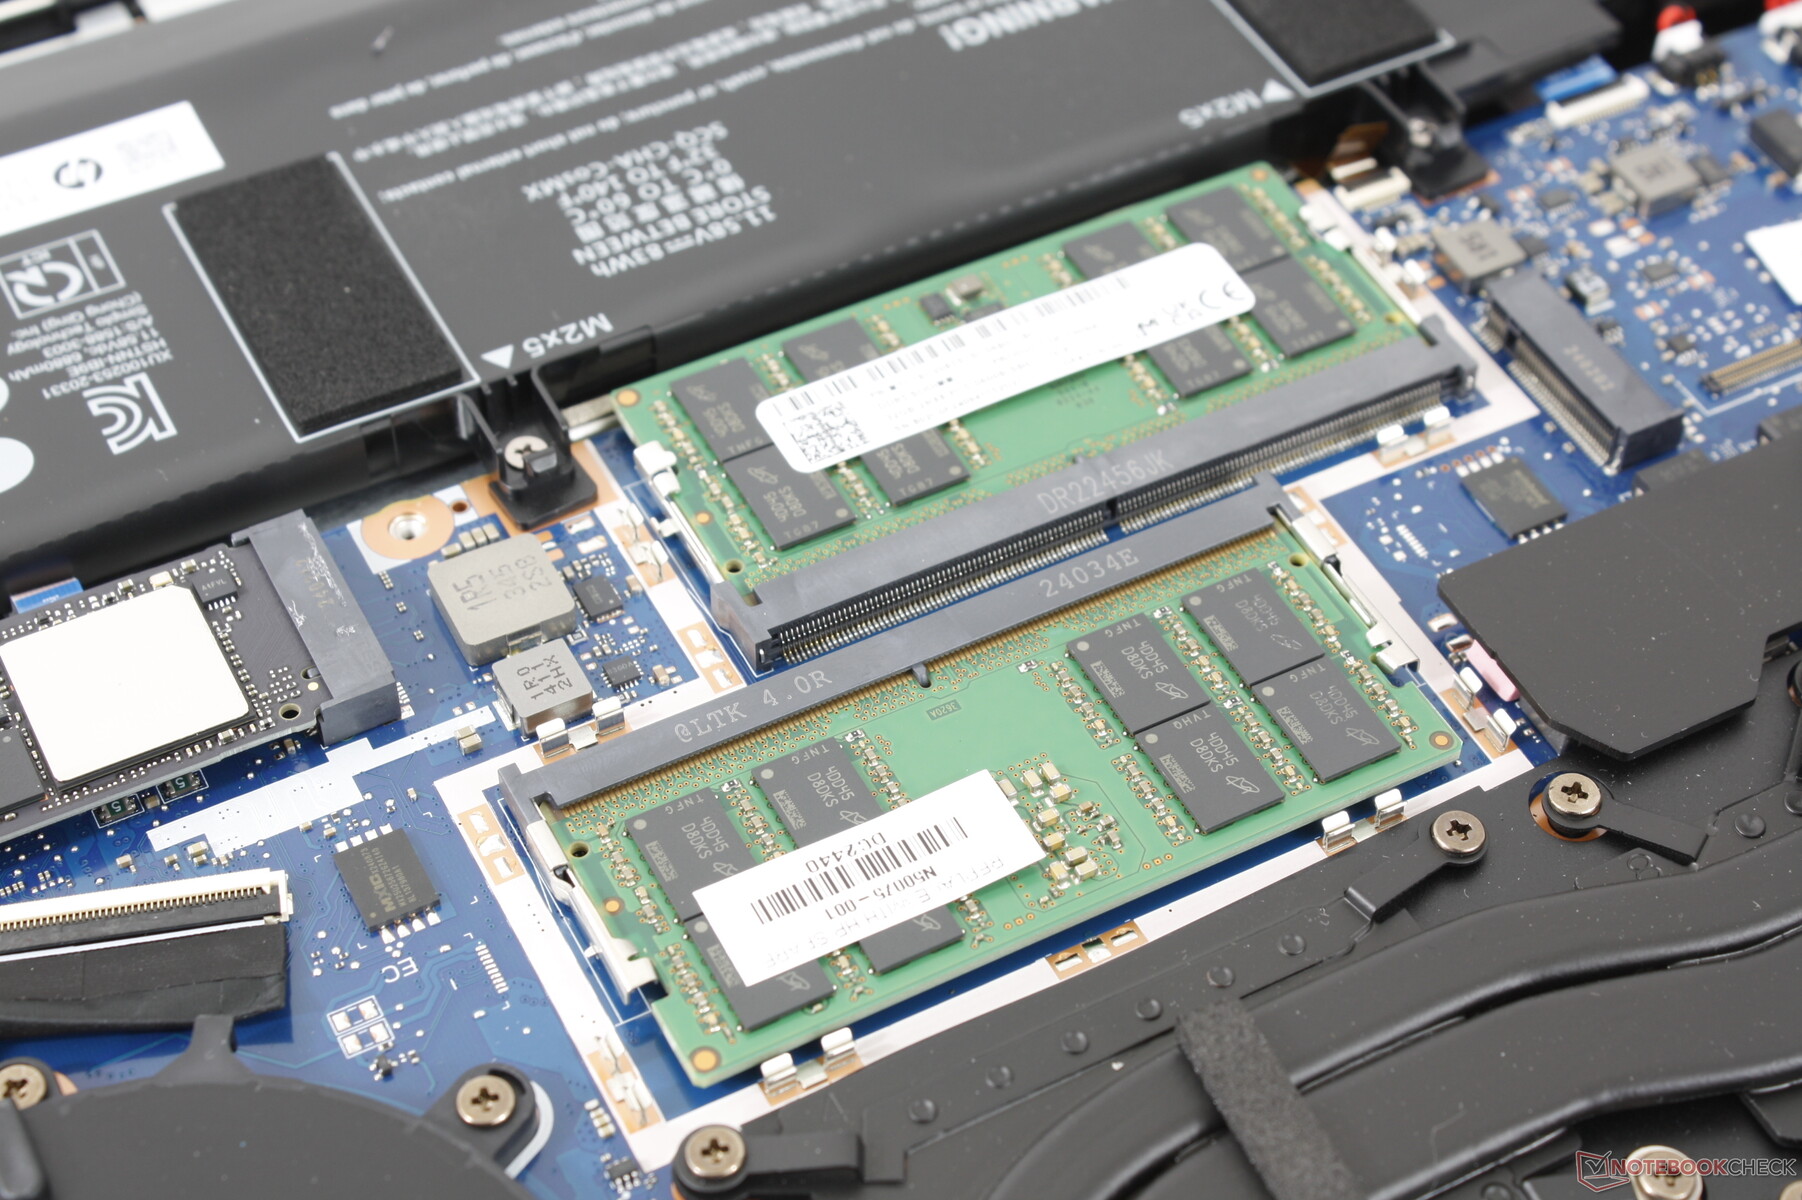
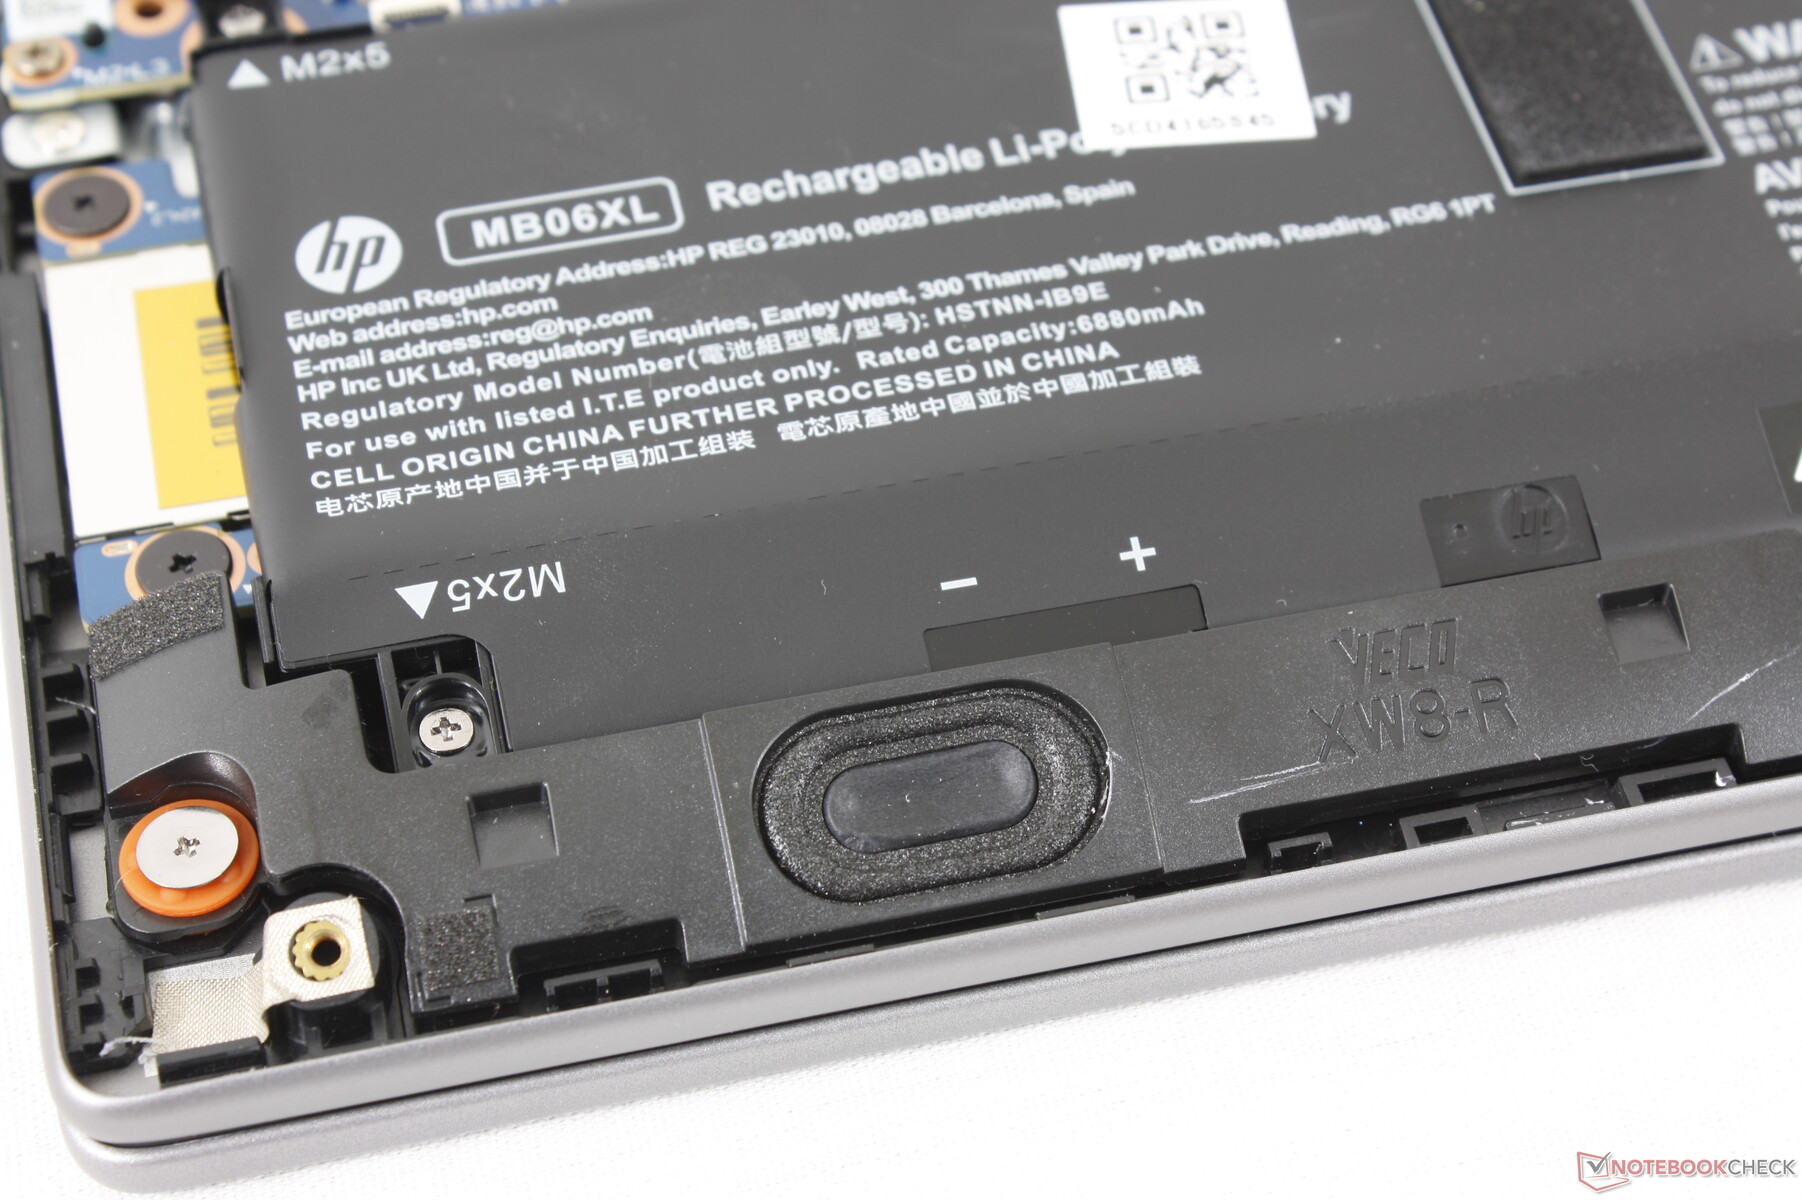
Bakım
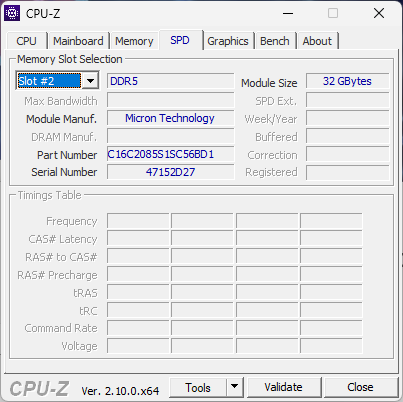
Alt panel, sadece bir Phillips tornavida ve keskin bir kenar ile nispeten kolay bir şekilde açılır. Dahili parçalar ZBook Power 15 G10 ile karşılaştırıldığında tamamen yeniden tasarlanırken, 2x SODIMM yuvası, 2x PCIe4 x4 NVMe SSD yuvası ve çıkarılabilir WLAN modülü gibi aynı yükseltilebilir seçenekler korunmuştur. WAN bu sefer eklenen bir seçenektir.
Sürdürülebilirlik
Üretimde düşük halojen kullanılırken, ambalajlar sırasıyla yüzde 100 sürdürülebilir kaynaklardan ve yüzde 60 tüketici sonrası kaynaklardan elde edilen kalıplanmış kağıt hamuru ve geri dönüştürülmüş plastiklerden oluşmaktadır.
Aksesuarlar ve Garanti
Kutuda AC adaptörü ve evraklara eşlik edecek herhangi bir ekstra yoktur. Hayal kırıklığı yaratan bir şekilde, standart sınırlı garanti ABD'de satın alındığında yalnızca bir yıl iken ZBook Fury standart olarak üç yıl ile birlikte gelir.
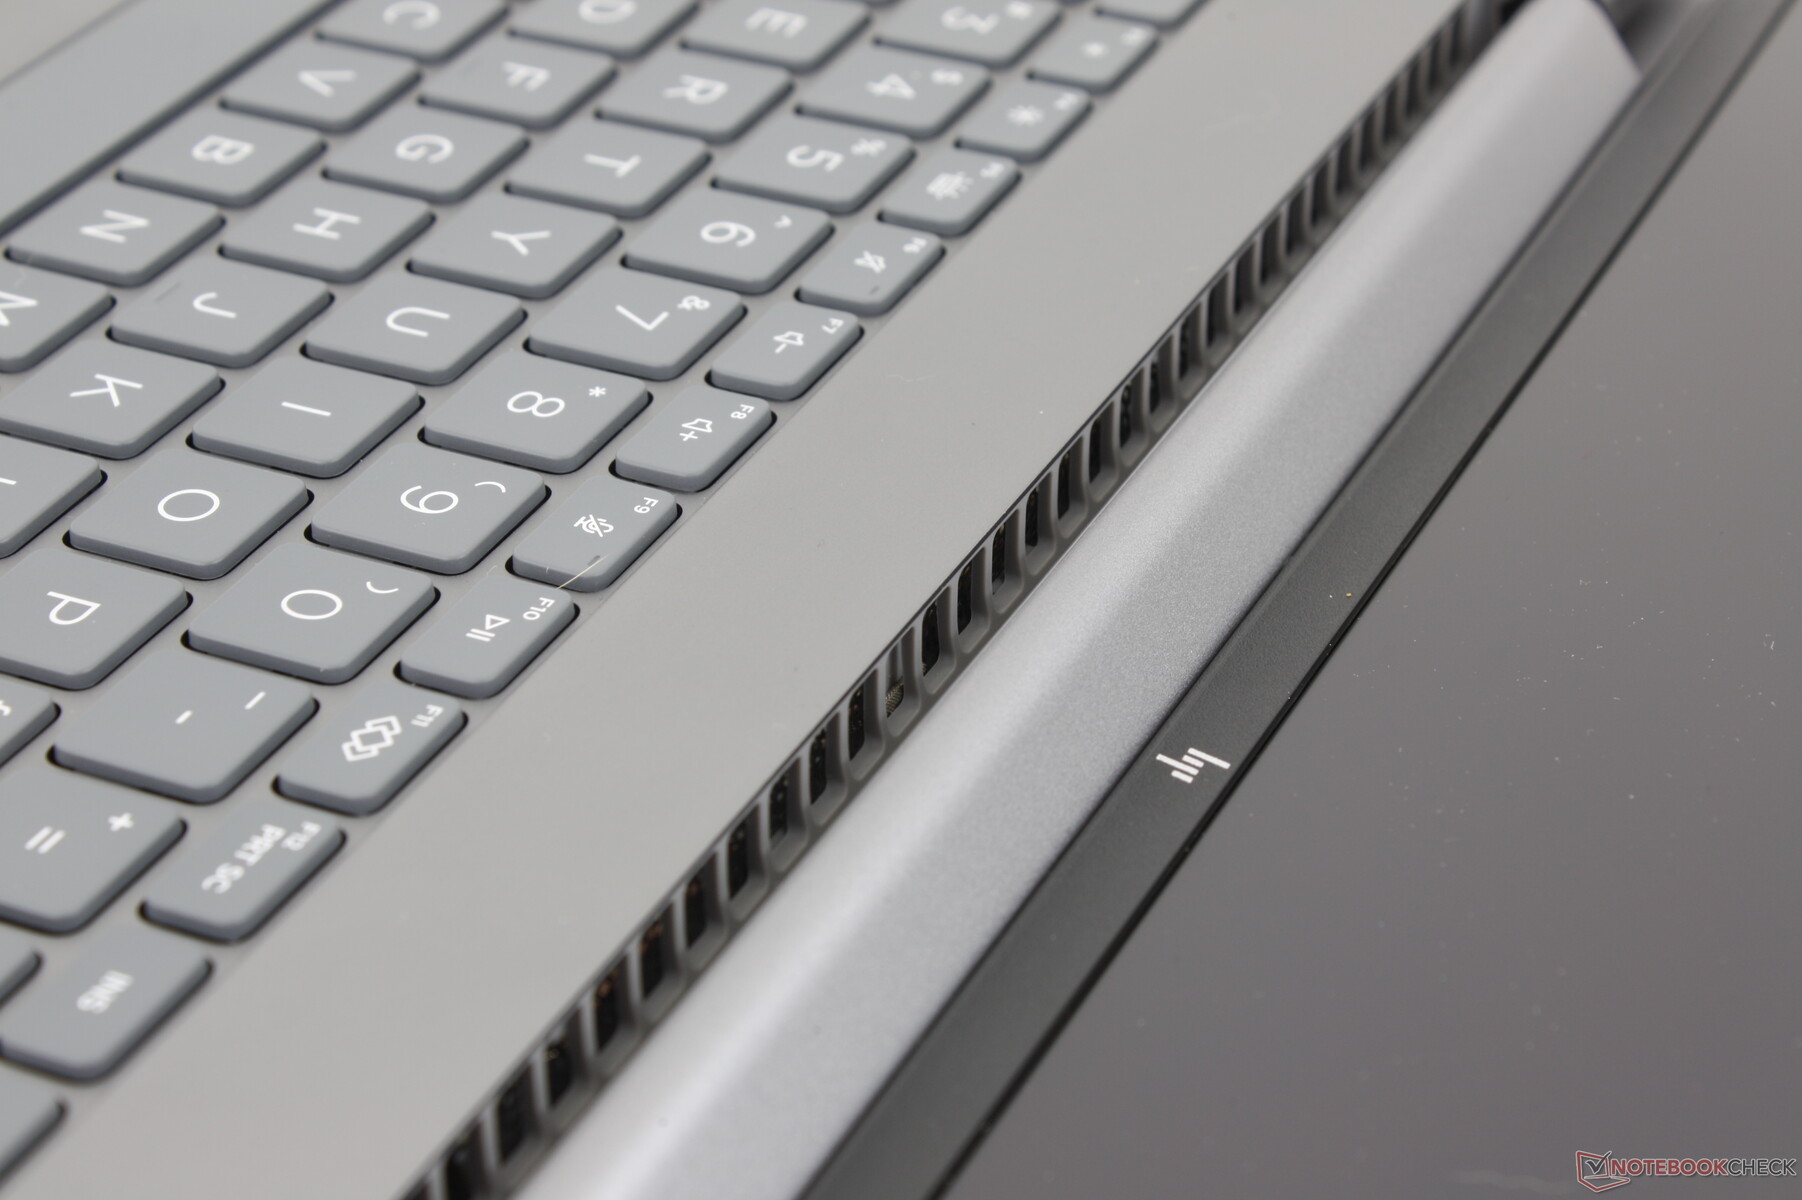
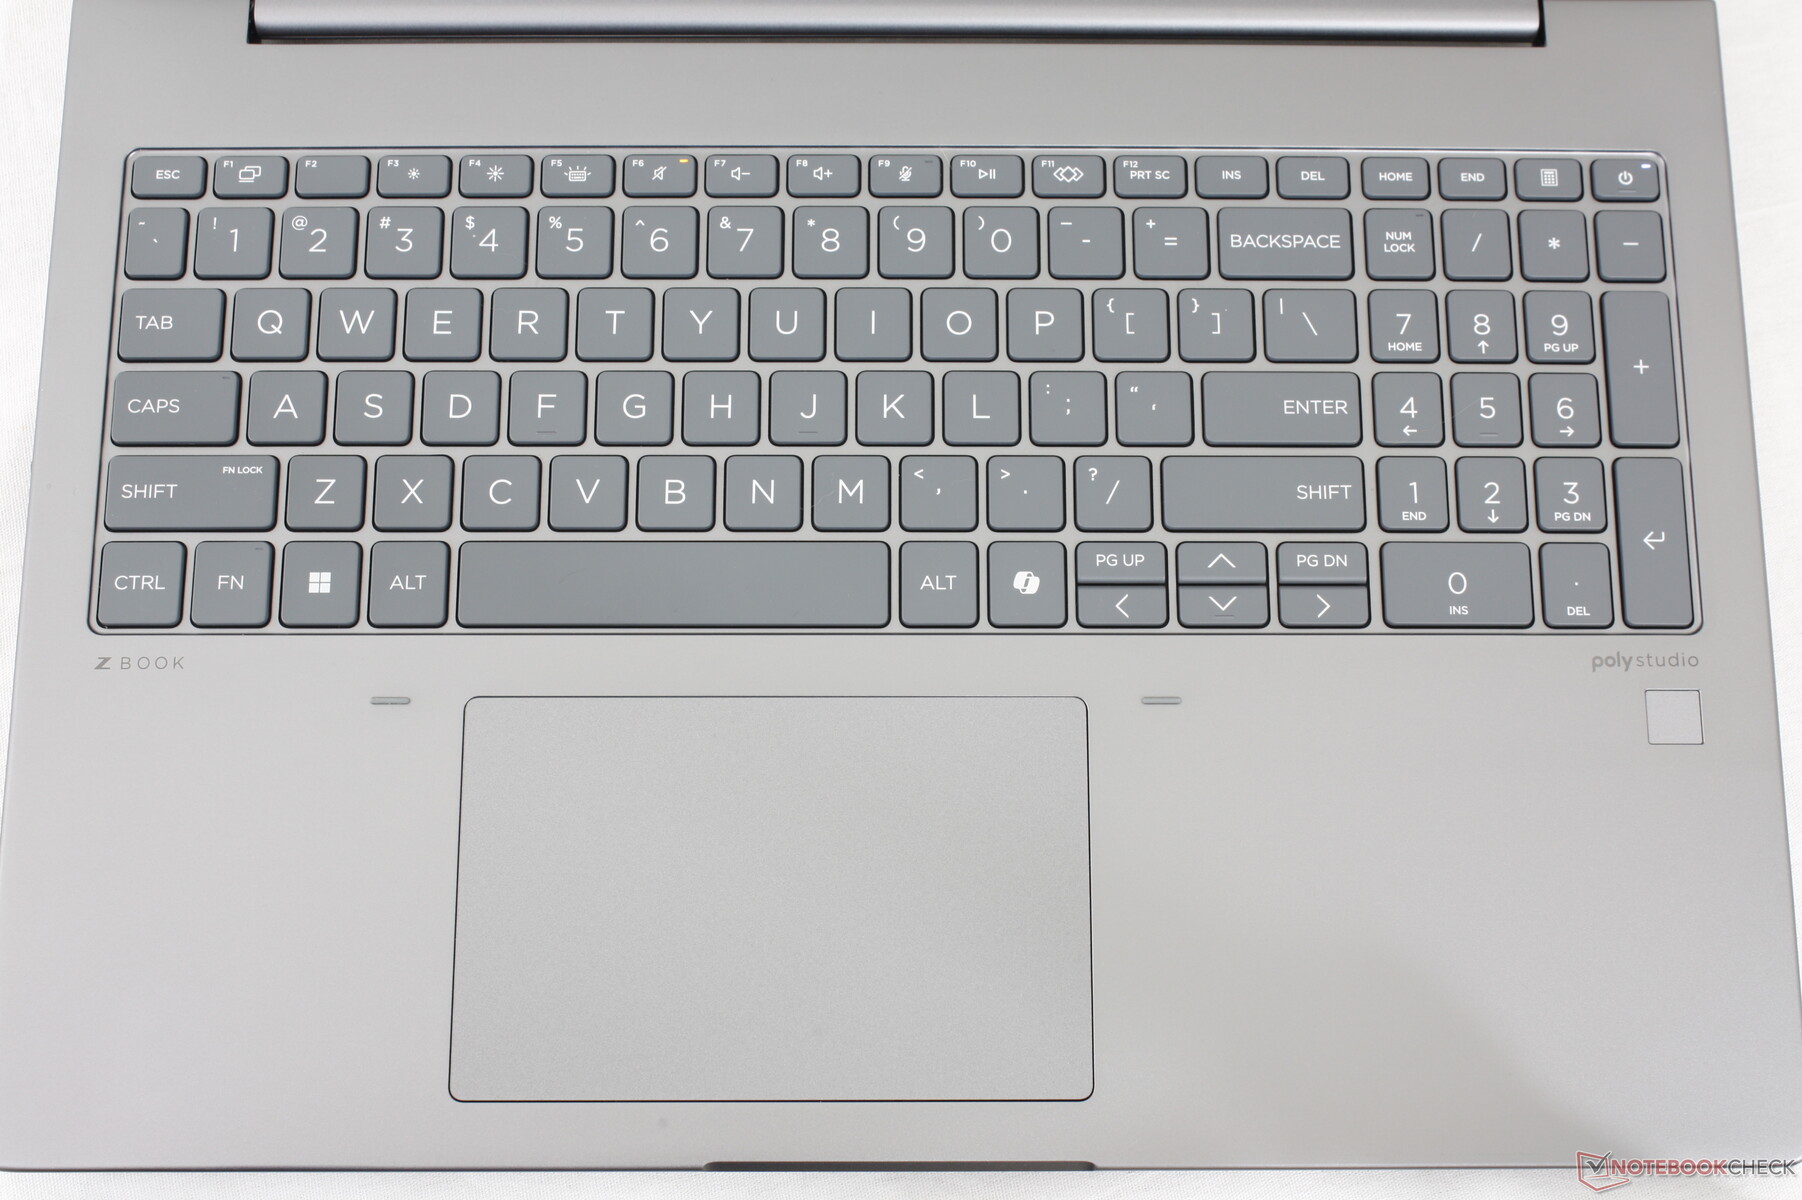
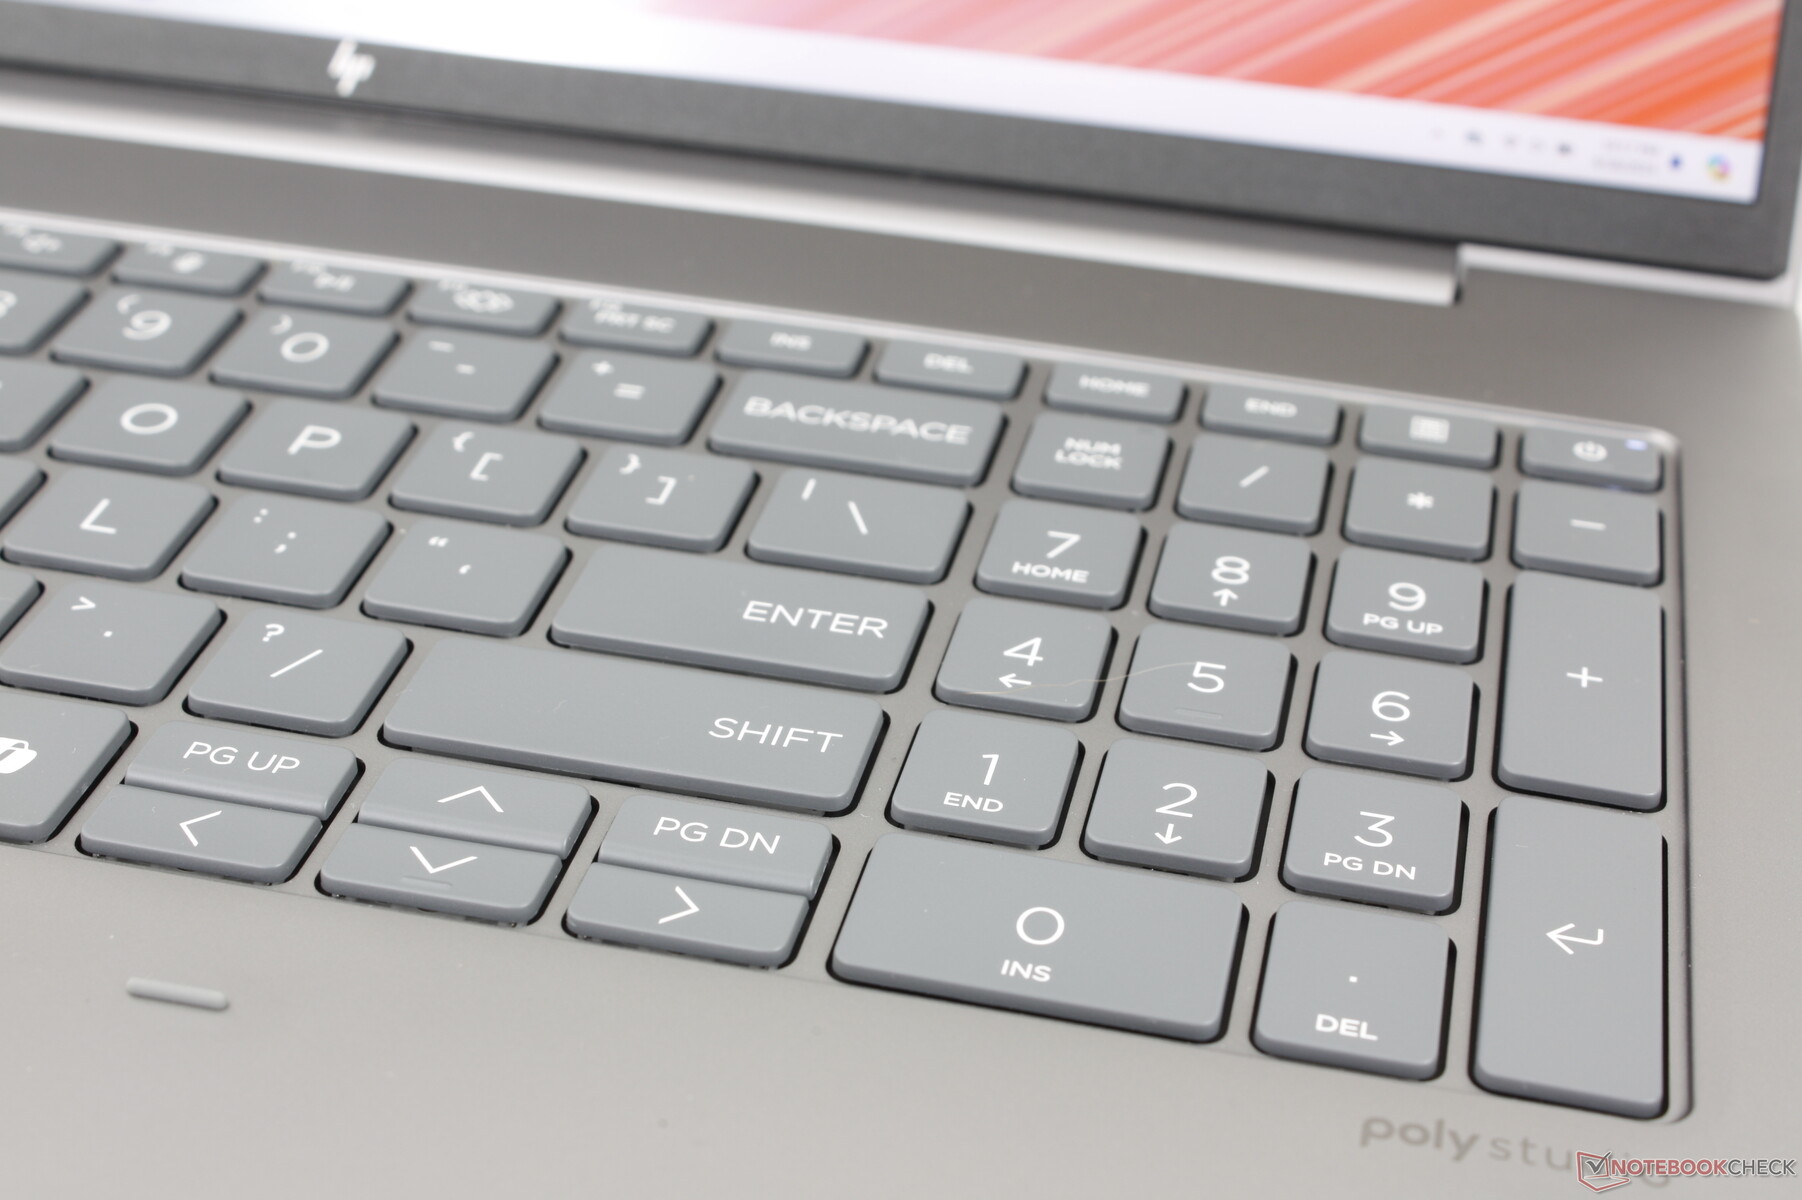
Giriş Aygıtları - Geniş Tuşlar
Klavye
Yazma deneyimi bir bilgisayarın Spectre x360 16 tuşlar, yazarken rahatlık sağlamak için nispeten keskin bir geri bildirim ile sağlamdır. Özellikle tuş hareketi, tipik sığ veya süngerimsi geribildirimden kaçınmak için çoğu Ultrabook'tan daha derin hissedilir.
Rakiplerde eksik olan numpad geri döndü Precision 5690. Bununla birlikte, tuşları ana QWERTY tuşlarından biraz daha dardır ve bu nedenle basıldığında geri bildirim belirgin şekilde daha yumuşaktır.
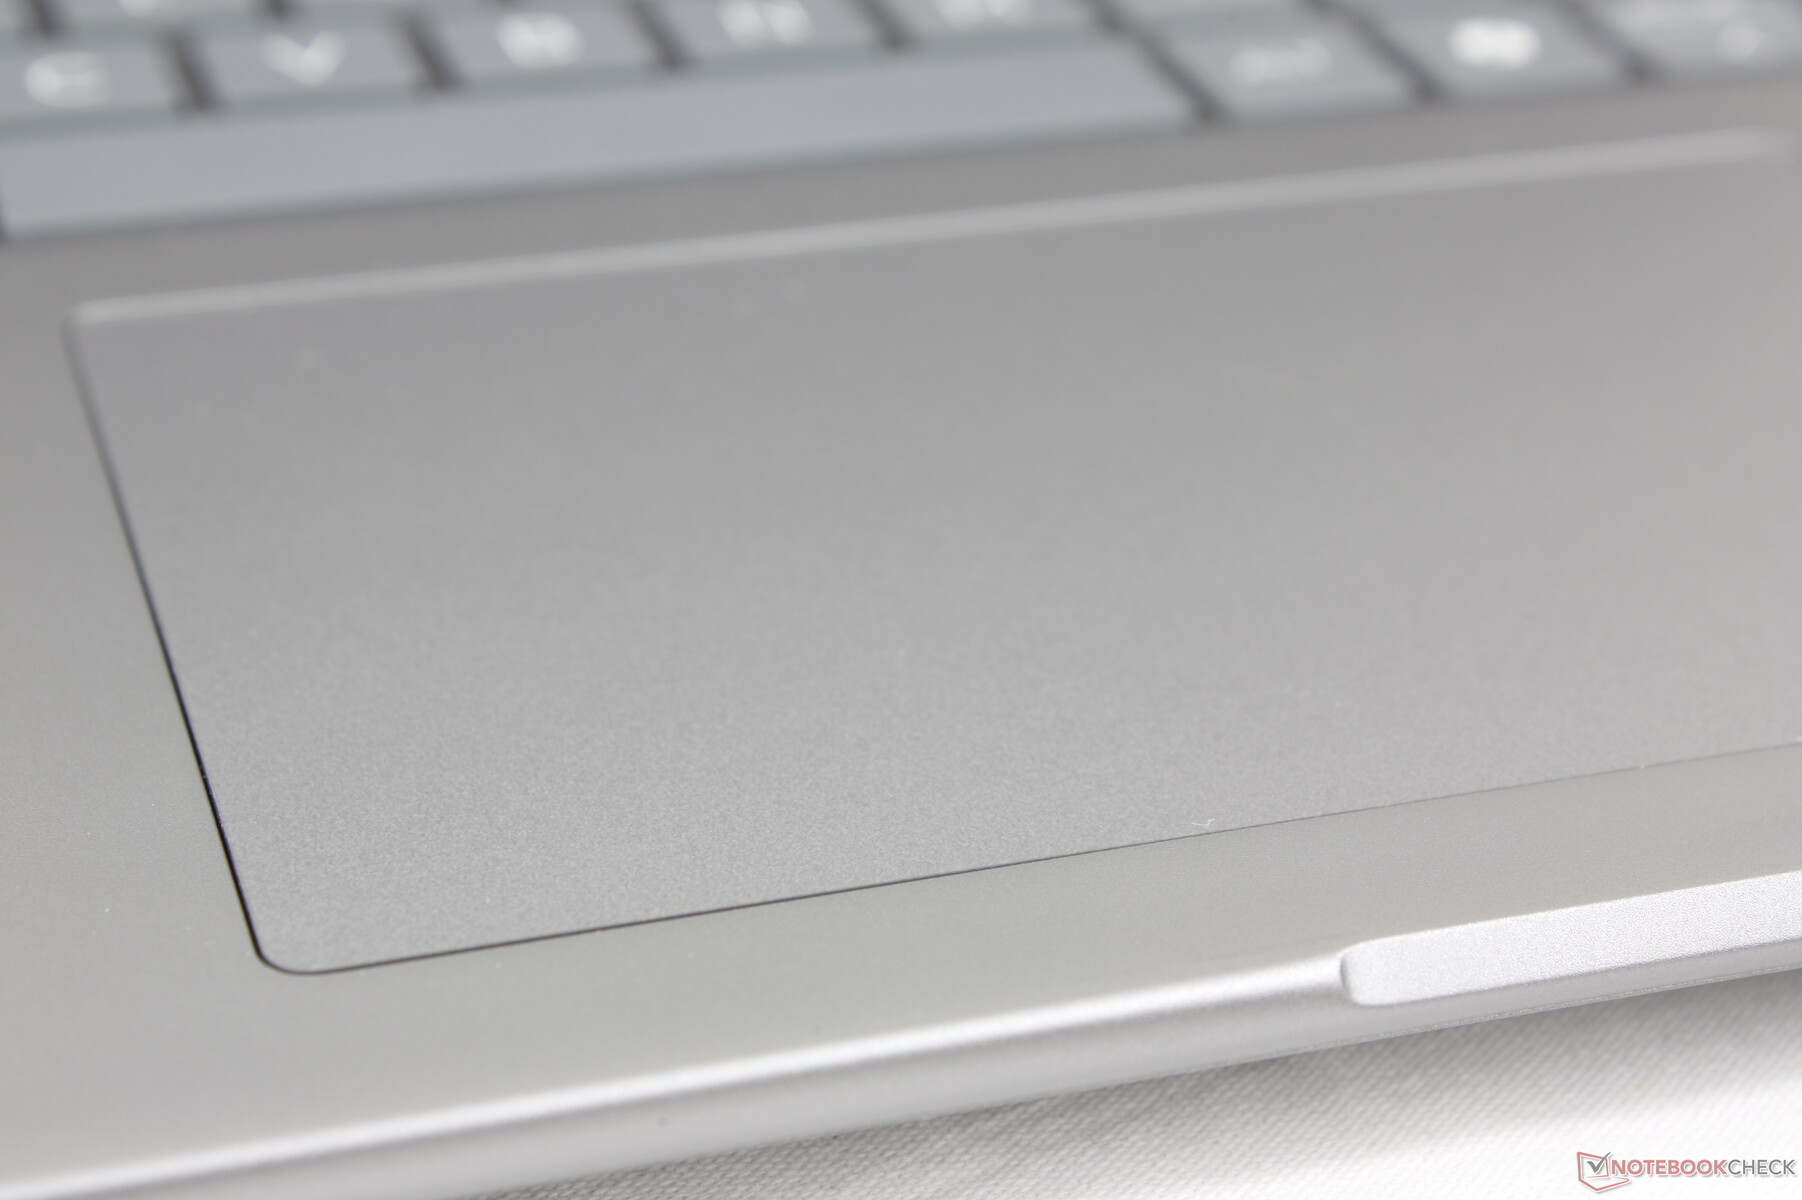
Dokunmatik yüzey
Daha büyük 16 inç form faktöründen yararlanmak için clickpad eskisinden daha büyüktür (12,5 x 8 cm'ye karşı 11,5 × 7 cm). Özel tuşlar hala eksik ve bunun yerine daha pahalı olan ZBook Fury serisinde mevcut. Bununla birlikte, çekiş ve geri bildirim, çoğu tüketici dizüstü bilgisayarındaki normalde daha süngerimsi olan tıklama pedlerinden daha güvenilir olmak için sırasıyla pürüzsüz ve tıklamalı.

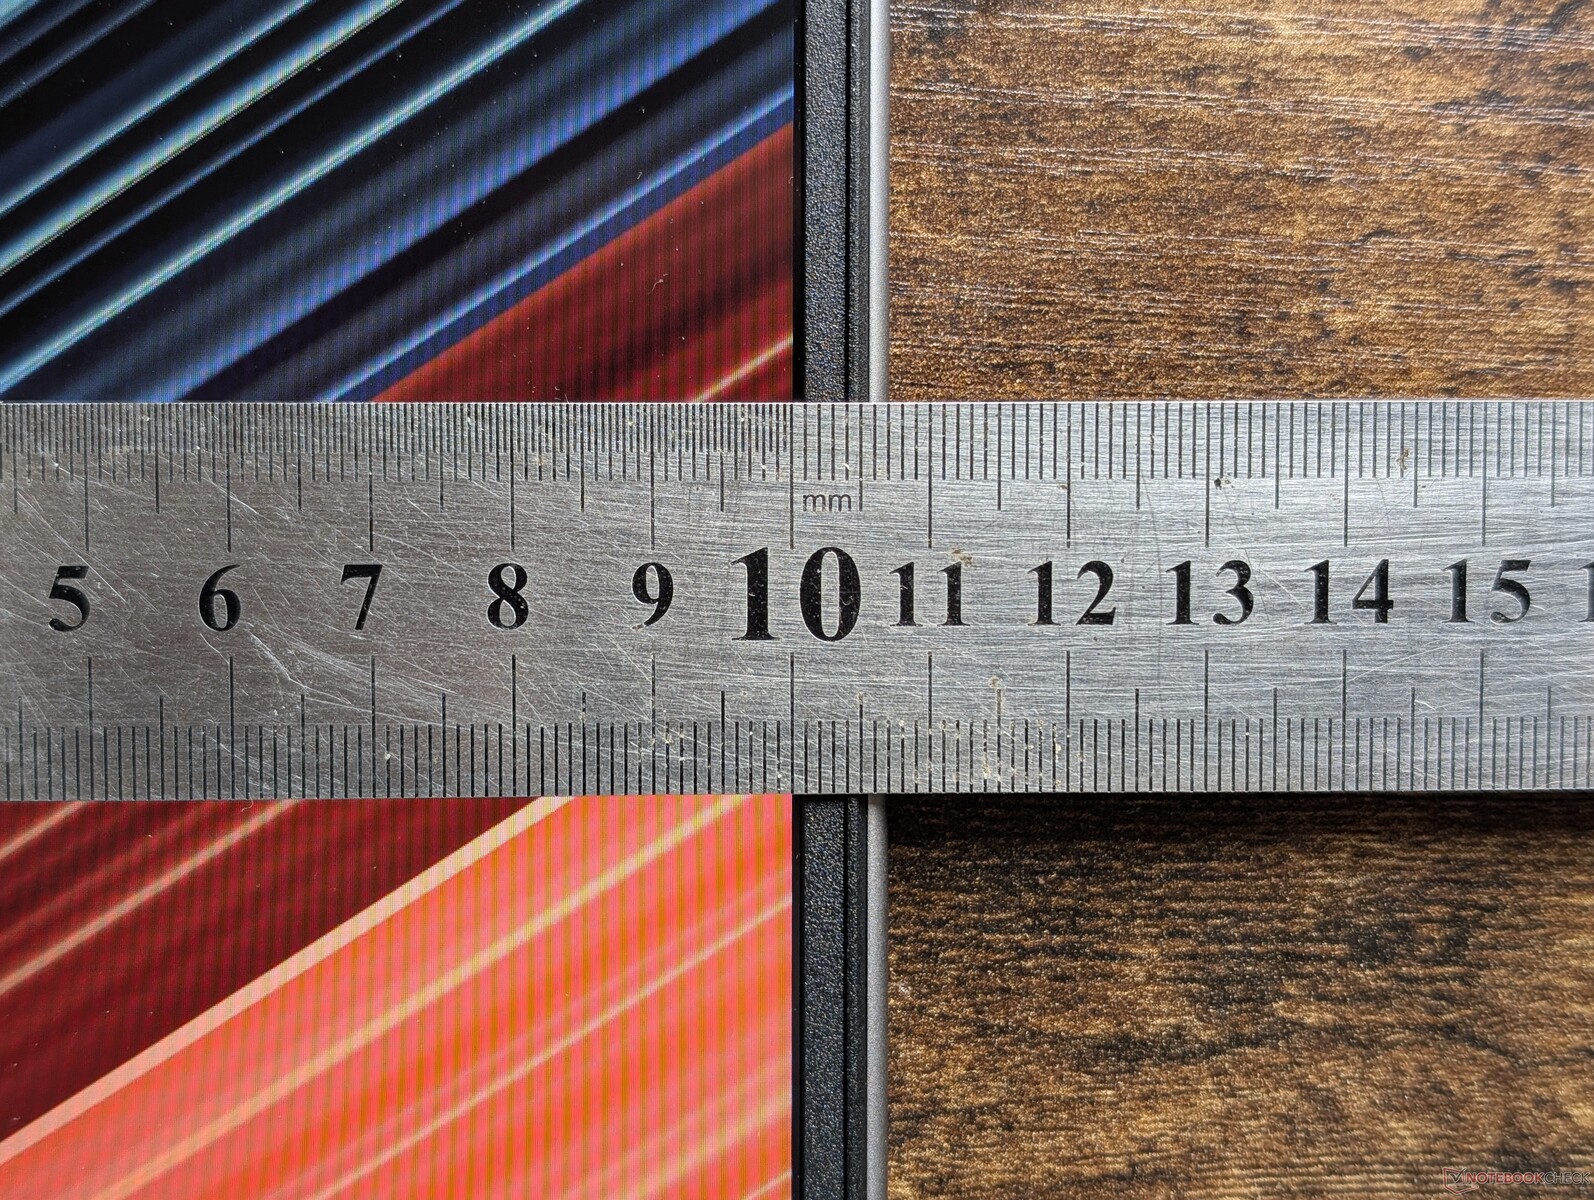
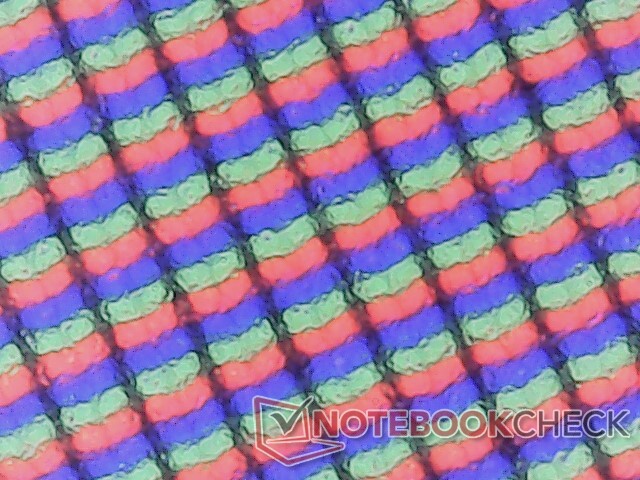
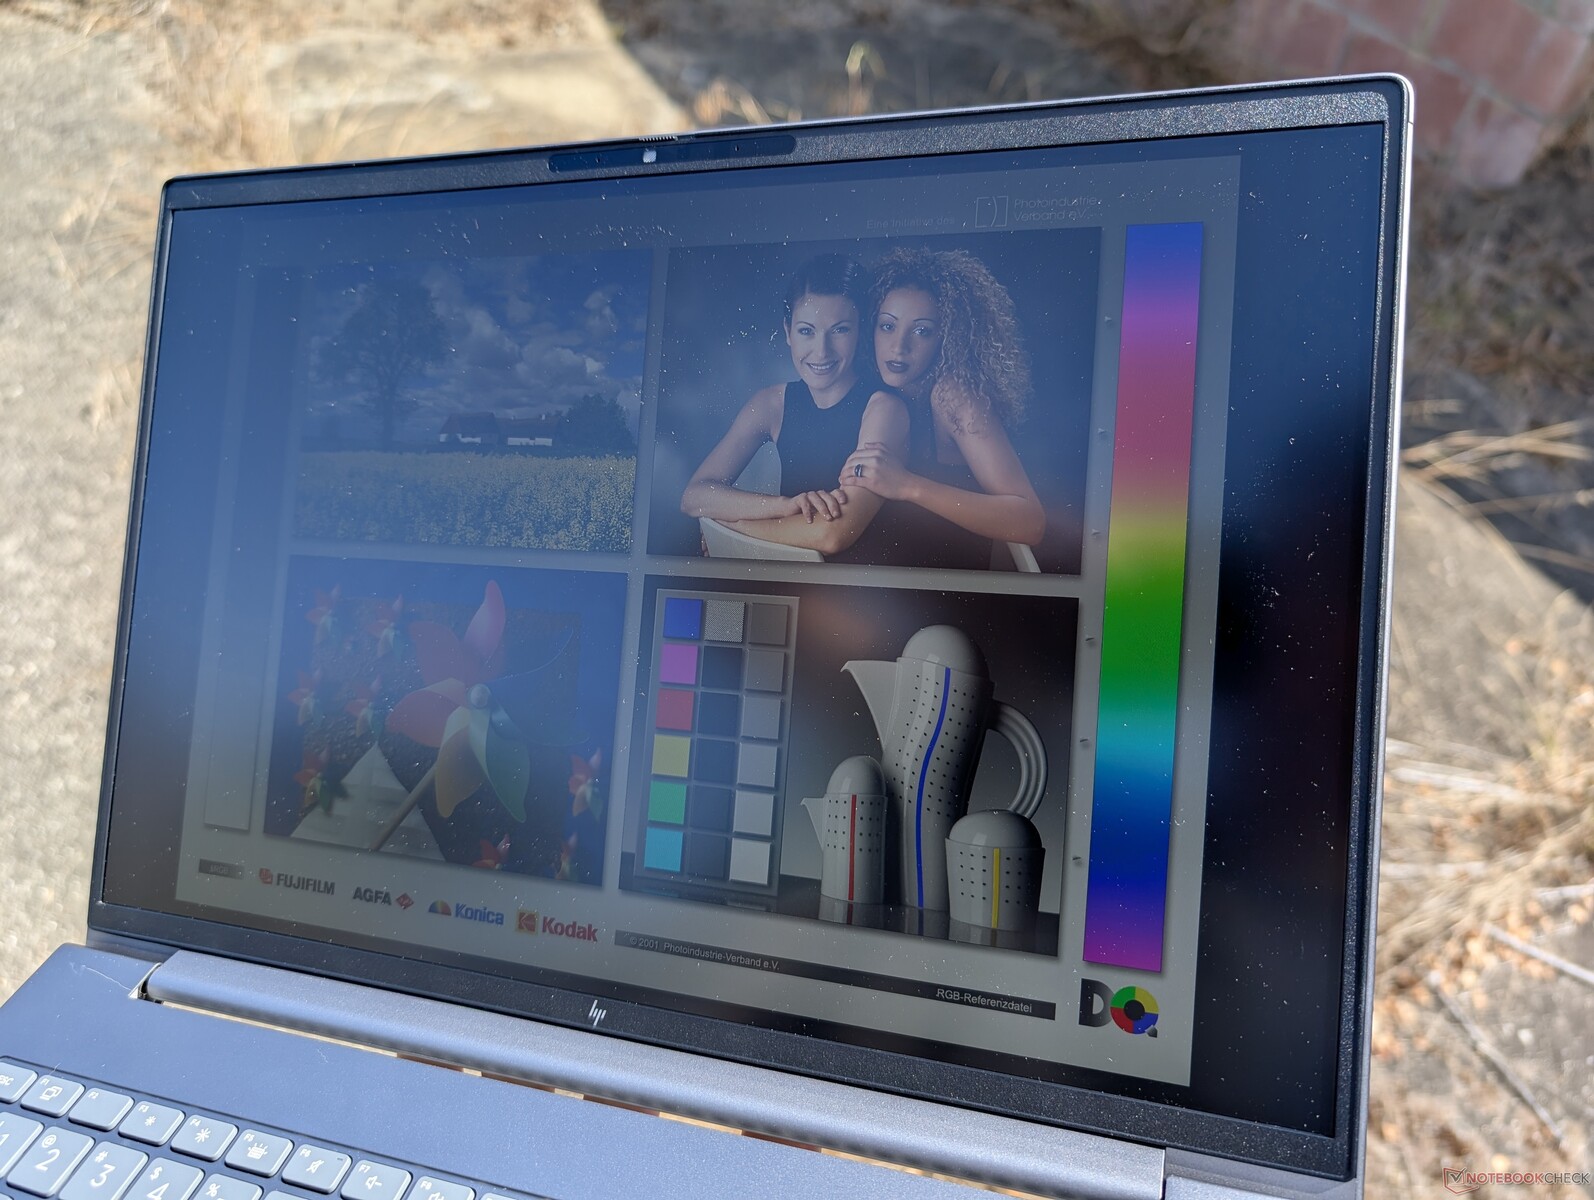
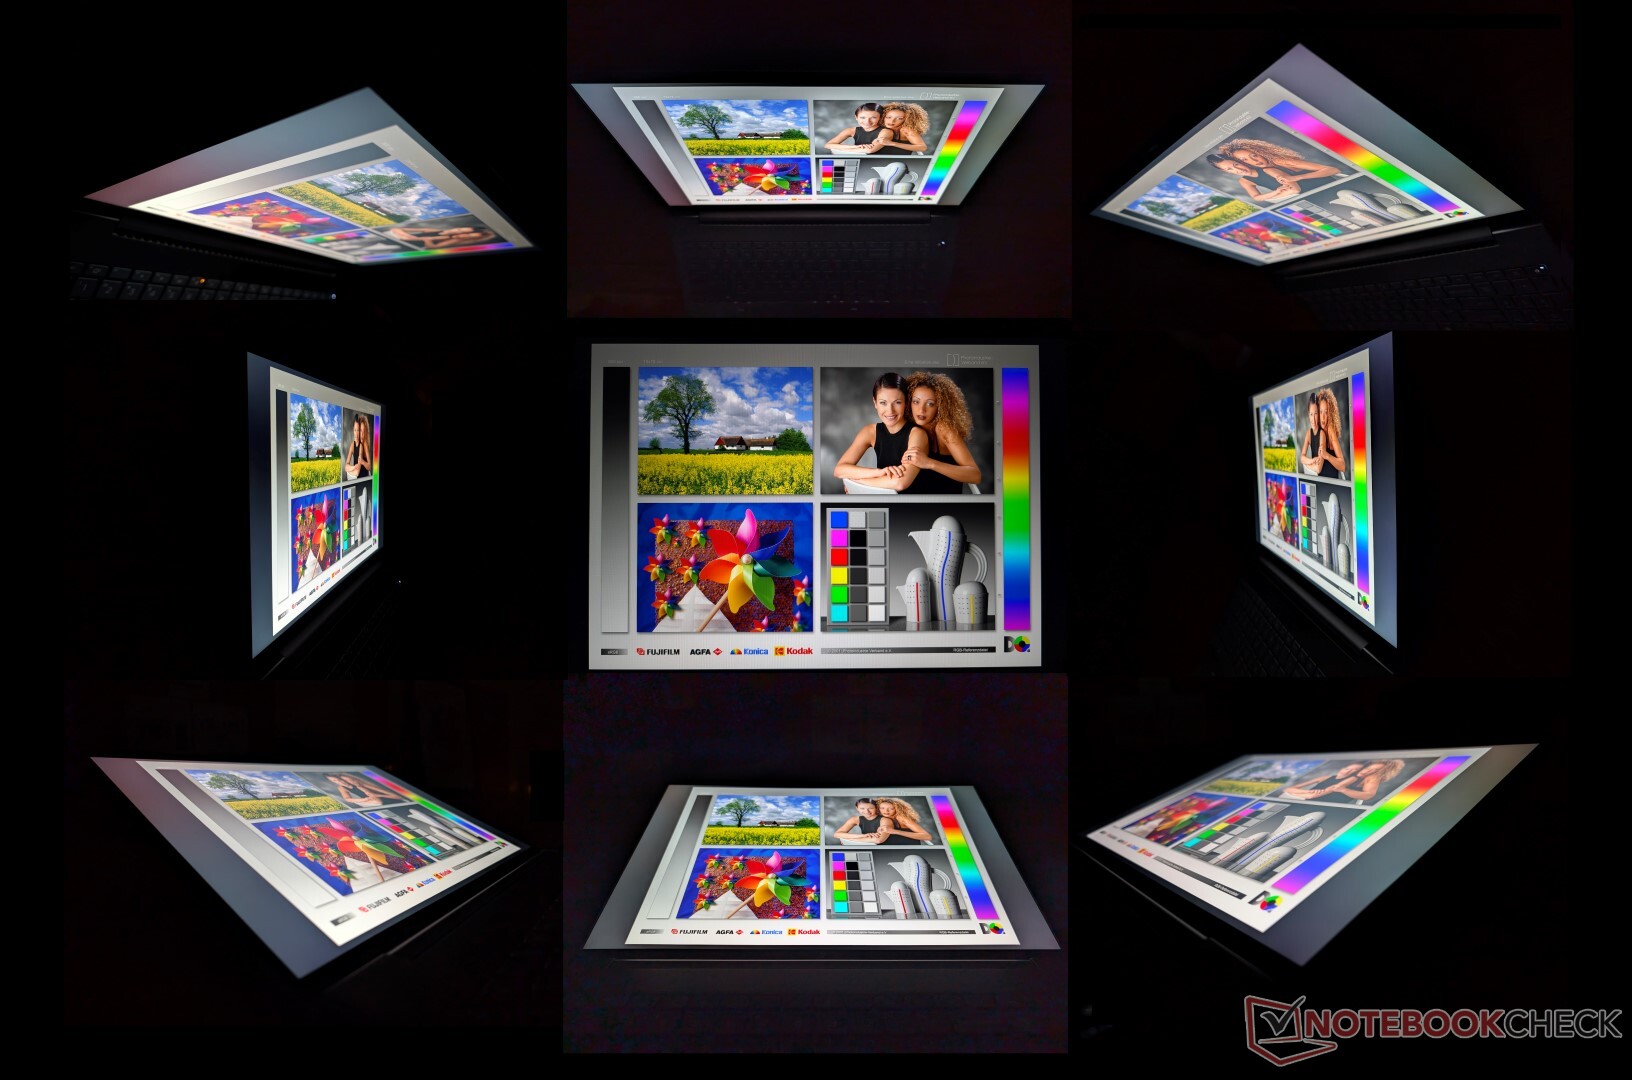
Ekran - Her Yerde IPS
Aşağıdaki gibi toplam beş ekran seçeneği mevcuttur ve bunların hepsi yalnızca IPS'dir. Bizim konfigürasyonumuz kalınlaştırılmış seçenekle birlikte gönderilir.
- 1920 x 1200, dokunmatik olmayan, mat, 250 nit, yüzde 45 NTSC, 60 Hz
- 1920 x 1200, dokunmatik, mat, 250 nit, yüzde 45 NTSC, 60 Hz
- 1920 x 1200, dokunmatik olmayan, mat, 400 nit, yüzde 100 sRGB, 60 Hz
- 1920 x 1200, dokunmatik olmayan, mat, 1000 nit, yüzde 100 sRGB, HP Sure View, 60 Hz
- 2560 x 1600, dokunmatik olmayan, mat, 400 nit, yüzde 100 sRGB, 120 Hz
Görüntü kalitesi önemliyse, renk kapsamı sRGB'nin yalnızca yüzde 60'ı kadar olacağından kullanıcılar alt uçtaki ilk iki seçeneği atlamalıdır. Süper parlak 1000 nit panel, diğer birçok iş istasyonu bu özelliği sunmadığı için dikkate değerdir, ancak bu seçenek ne yazık ki daha fazla gizlilik için görüş açılarını ciddi şekilde sınırlayan Sure View'a bağlıdır. Bir performans iş istasyonu için biraz hayal kırıklığı yaratan OLED, HDR veya P3 seçeneklerinden söz etmek mümkün değil. Kullanıcıların HP ZBook Fury 16 G11'e yükseltmeleri veya ThinkPad P16s G2 bu tür özellikler için.

| |||||||||||||||||||||||||
Aydınlatma: 88 %
Batarya modunda parlaklık: 470.7 cd/m²
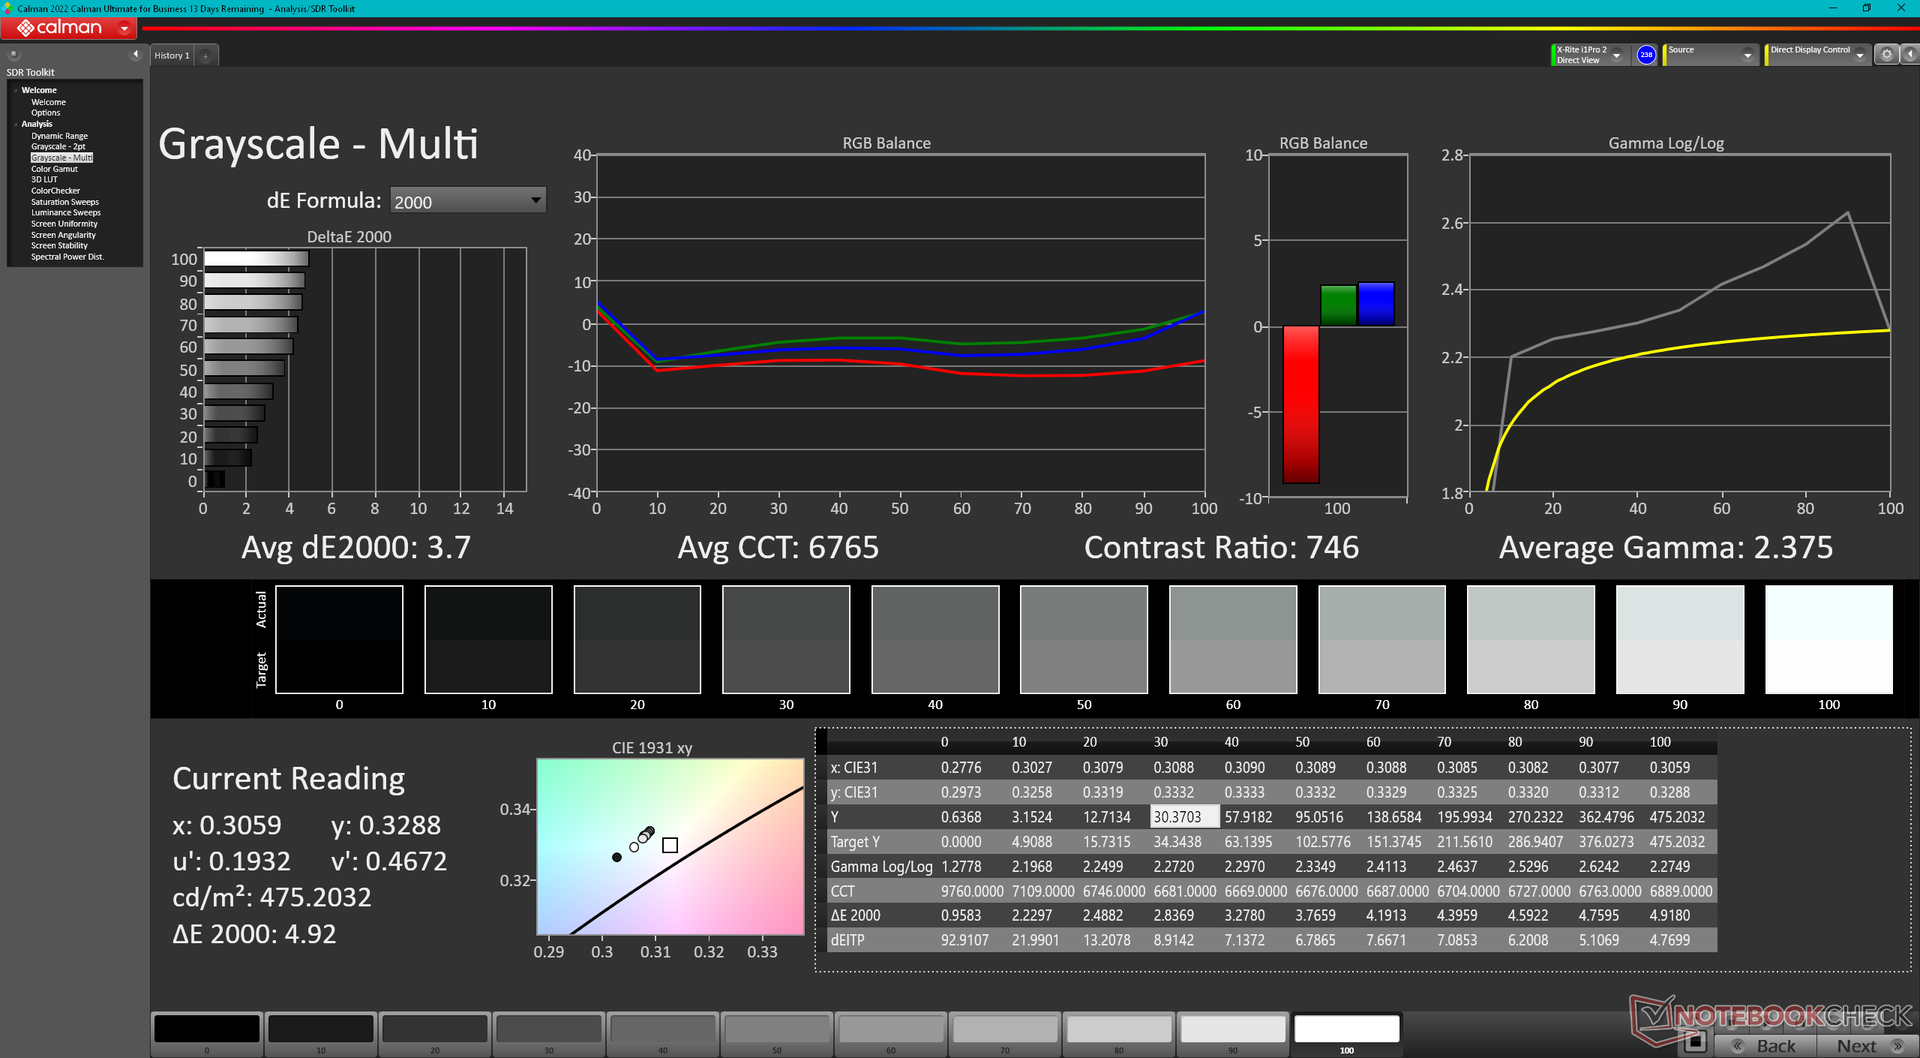
Kontrast: 826:1 (Siyah: 0.57 cd/m²)
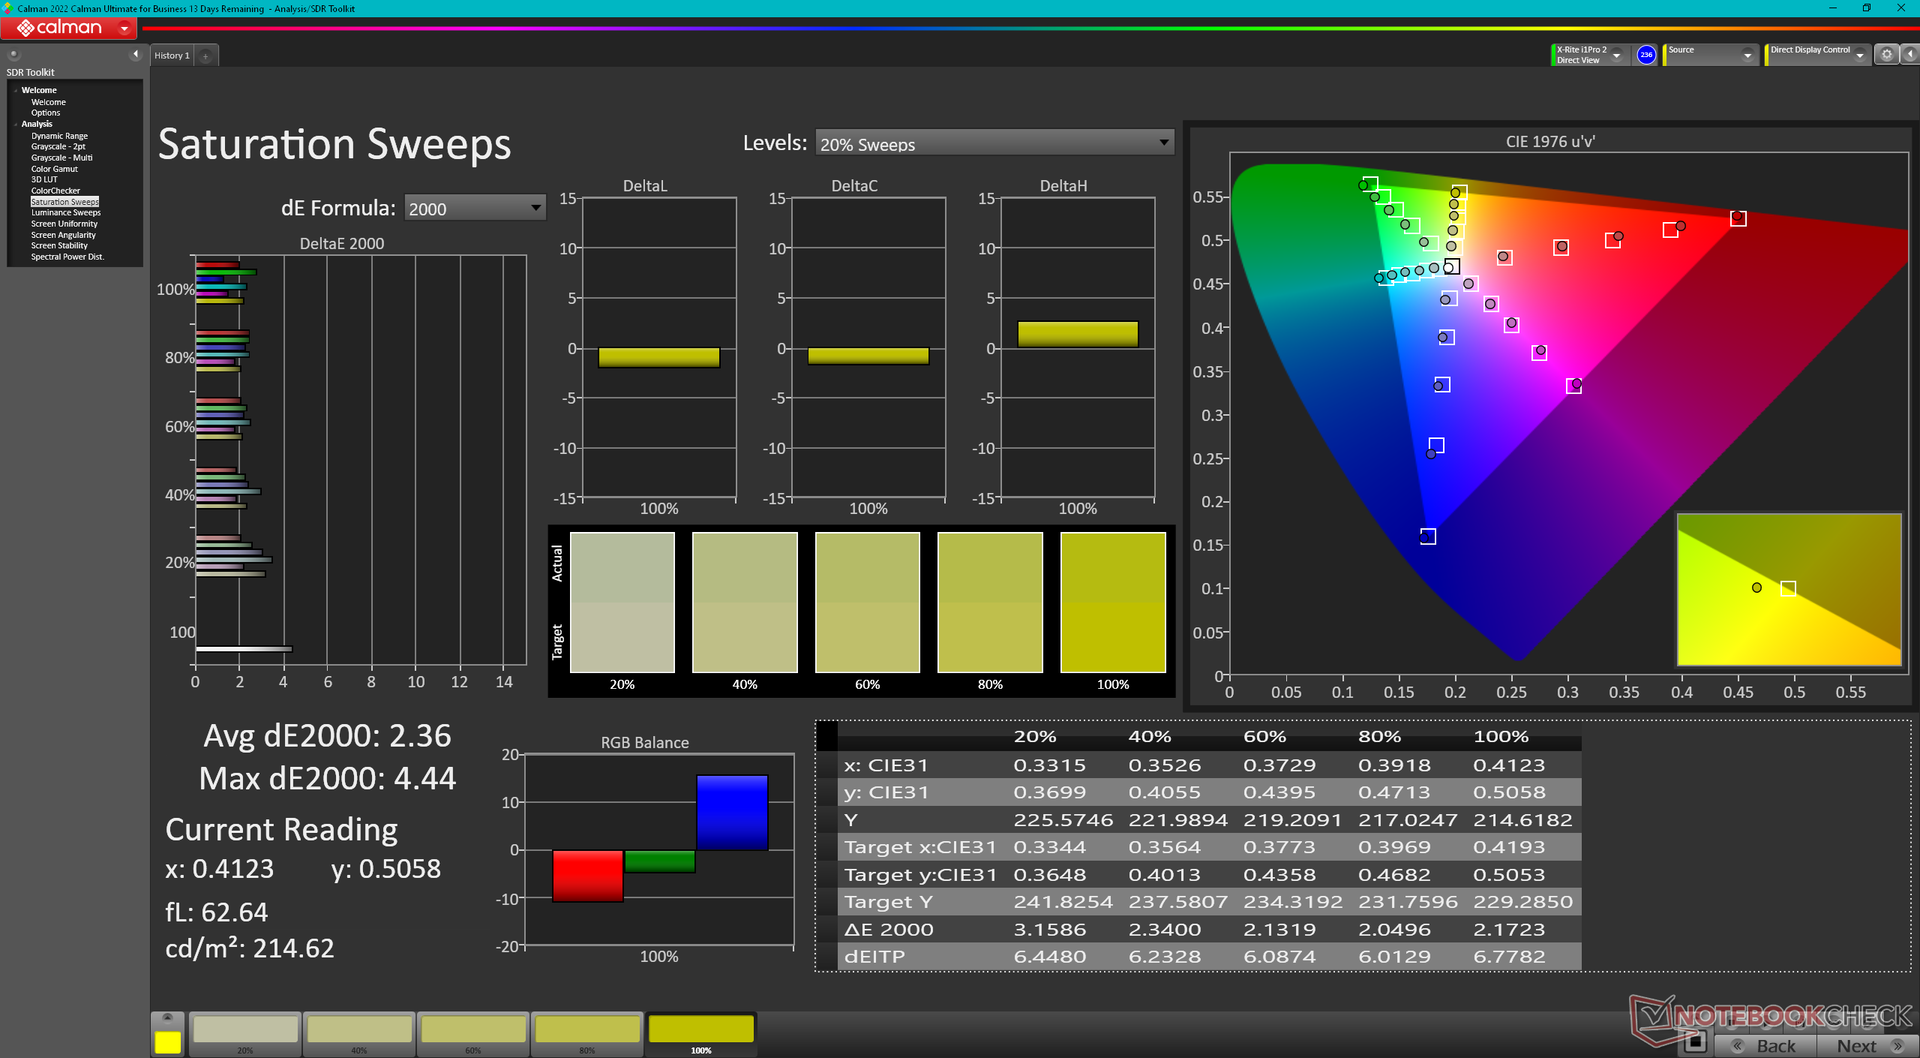
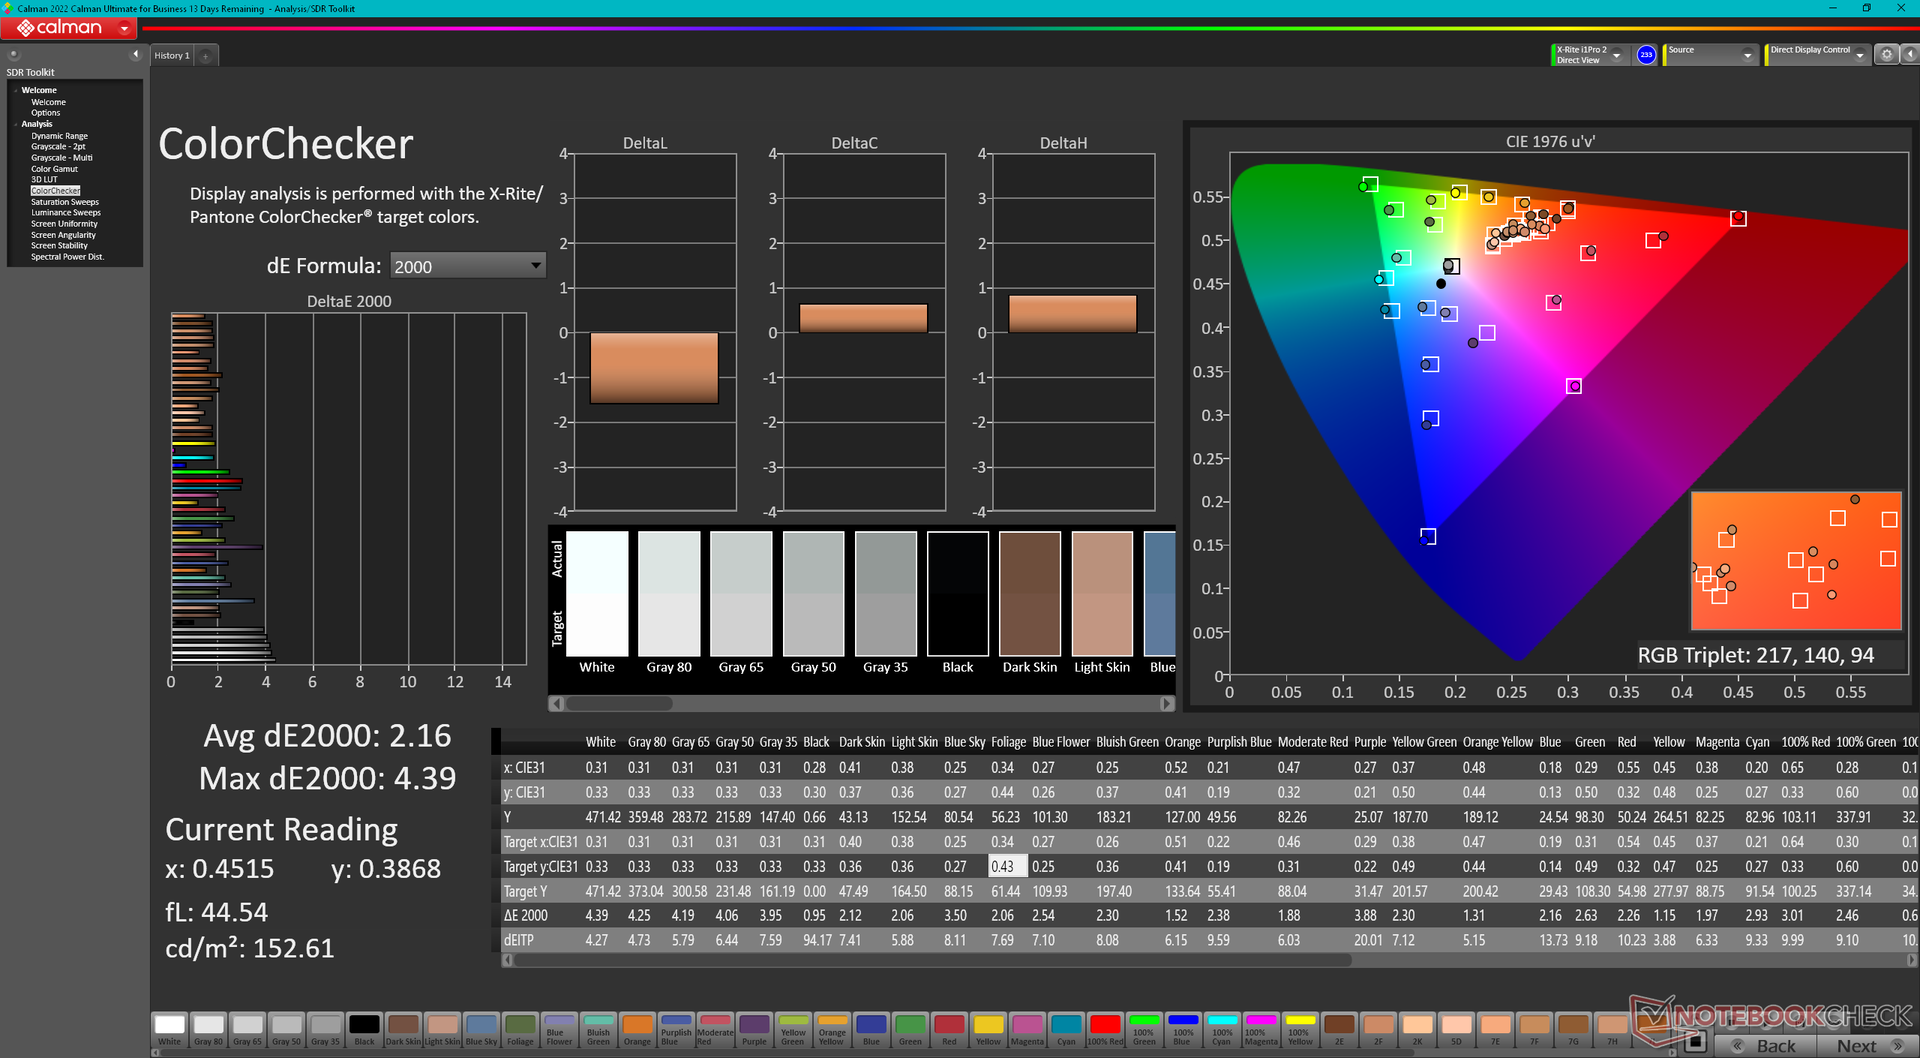
ΔE Color 2.16 | 0.5-29.43 Ø4.87, calibrated: 1.37
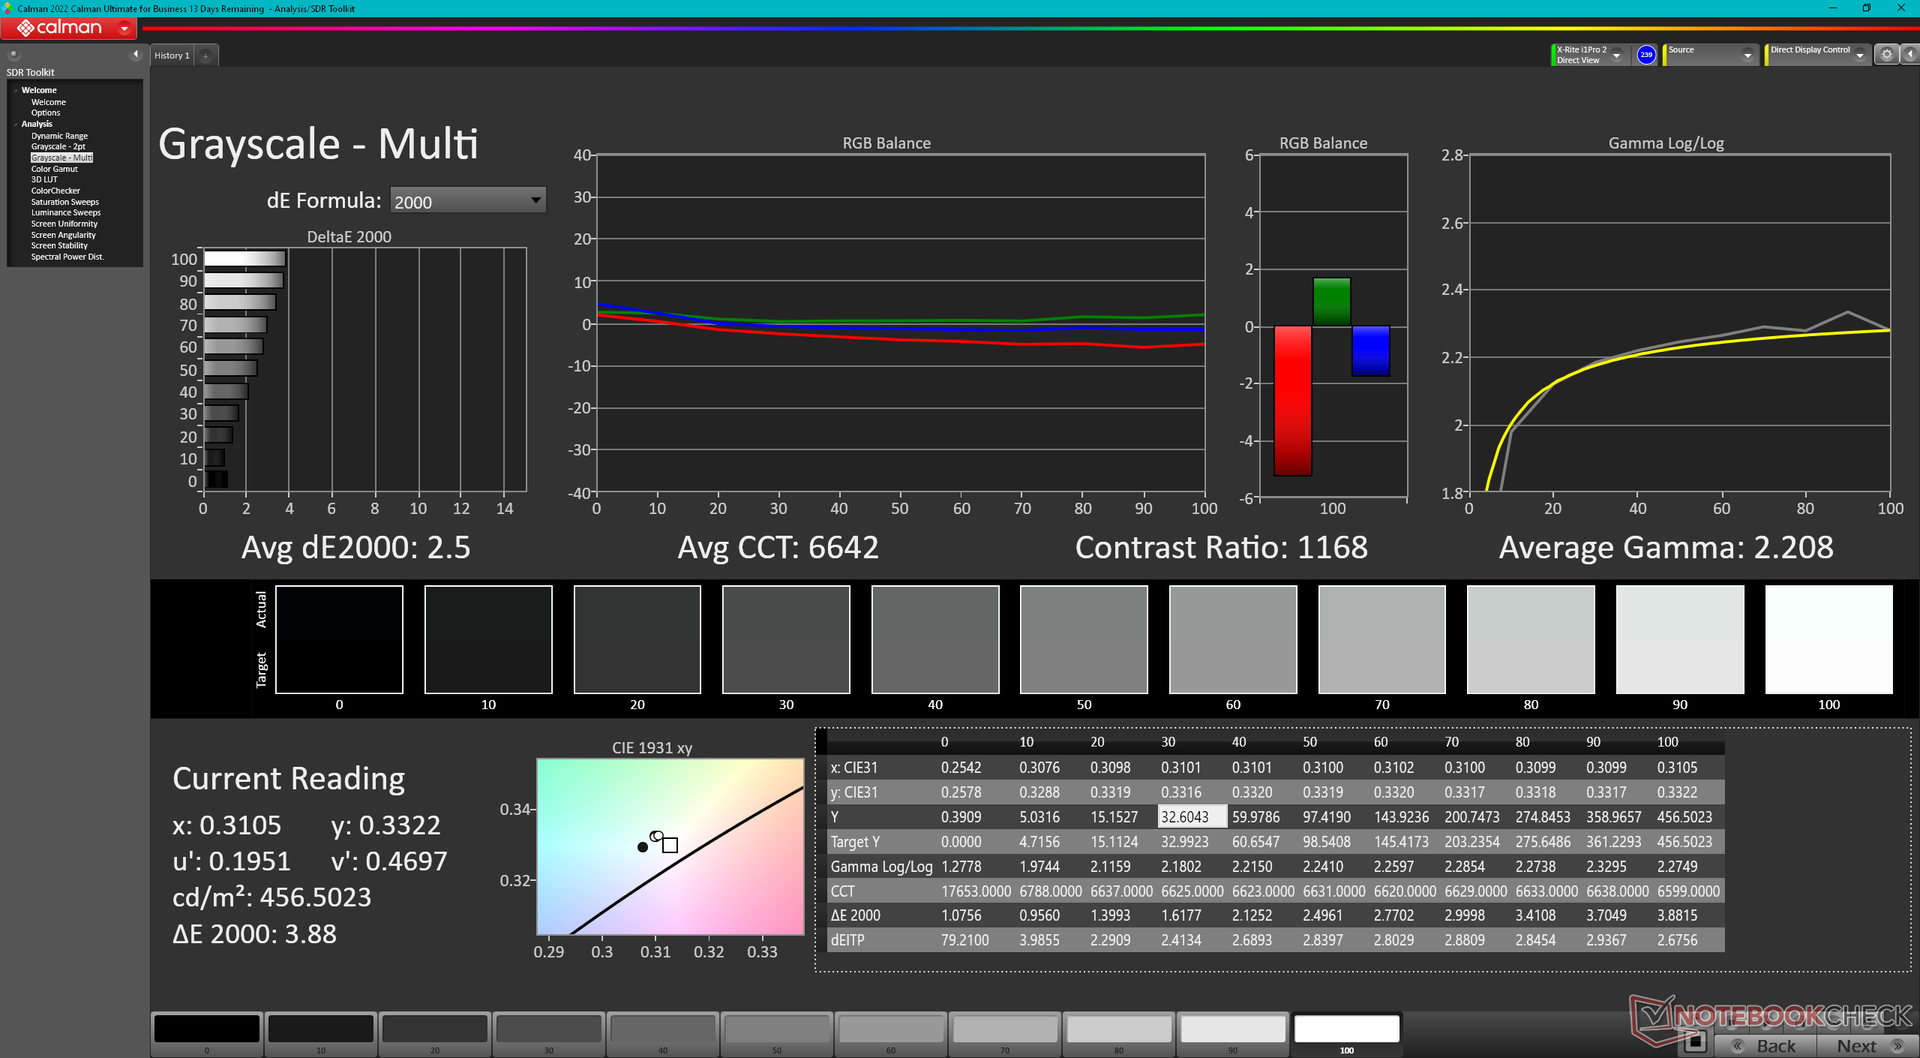
ΔE Greyscale 3.7 | 0.5-98 Ø5.1
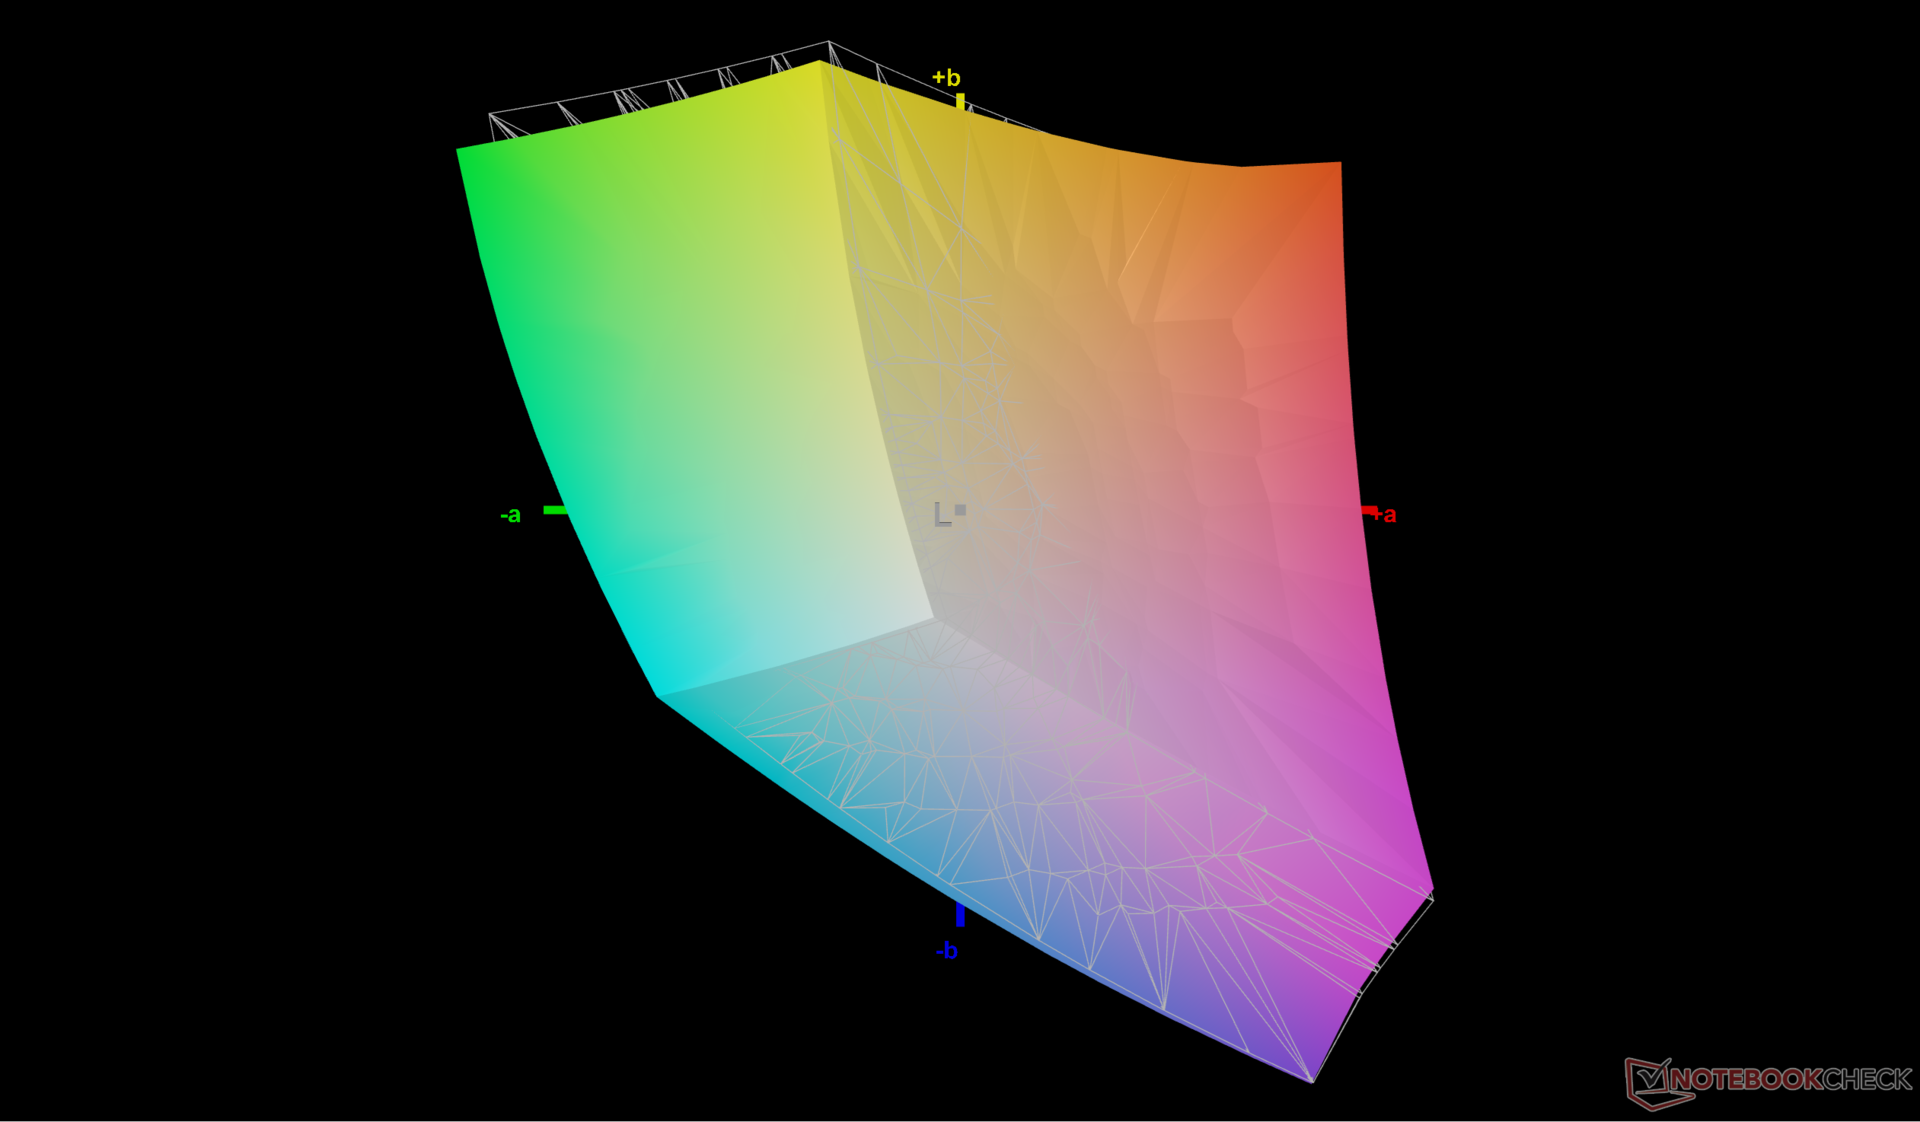
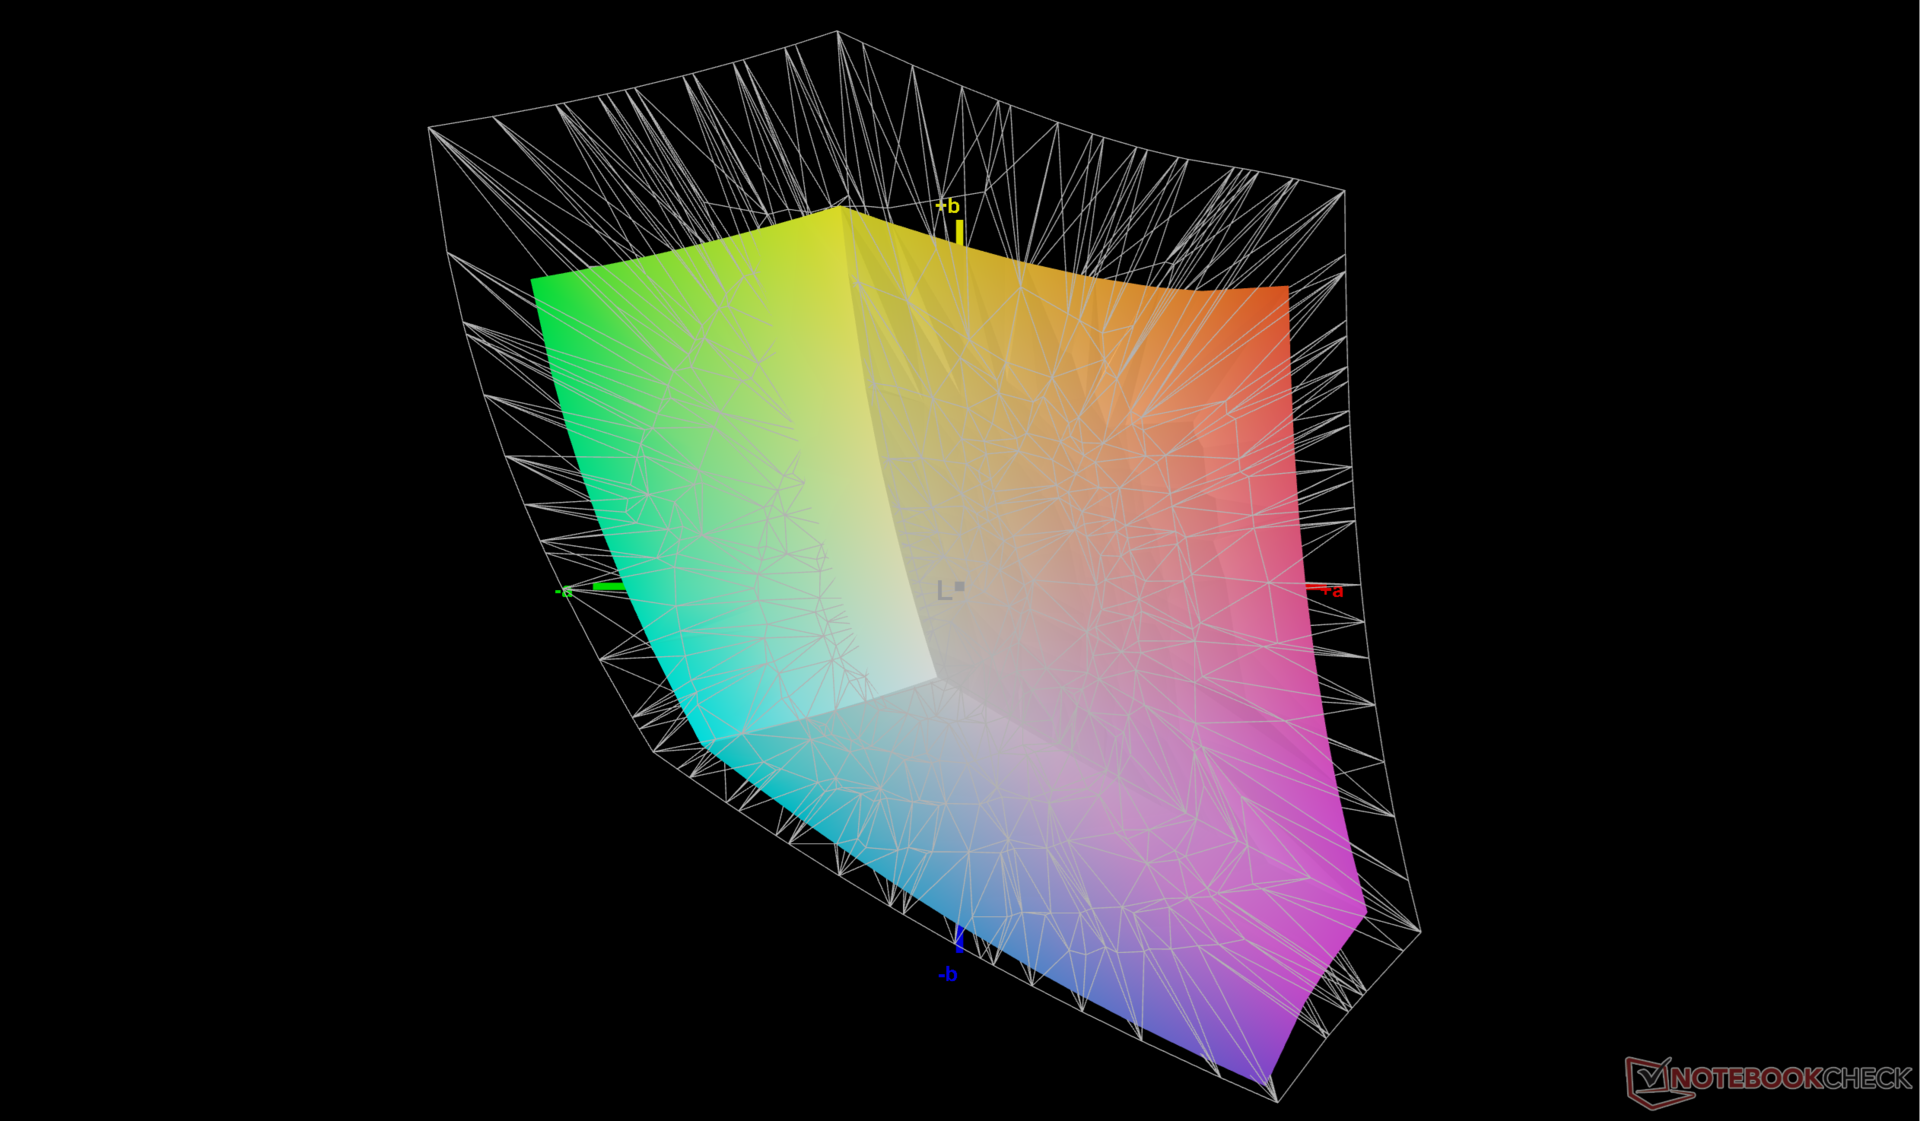
71% AdobeRGB 1998 (Argyll 2.2.0 3D)
97.7% sRGB (Argyll 2.2.0 3D)
69.1% Display P3 (Argyll 2.2.0 3D)
Gamma: 2.38
| HP ZBook Power 16 G11 A AUOA0A9, IPS, 2560x1600, 16", 120 Hz | HP ZBook Power 15 G10 BOE0B6A, IPS, 2560x1440, 15.6", 120 Hz | HP ZBook Fury 16 G11 AUO87A8, IPS, 3840x2400, 16", 120 Hz | Lenovo ThinkPad P1 Gen 7 21KV001SGE MNG007DA1-9 , IPS LED, 2560x1600, 16", 165 Hz | Lenovo ThinkPad P16s G2 21K9000CGE ATNA60YV04-0, OLED, 3840x2400, 16", 60 Hz | Dell Precision 5690 Samsung 160YV03, OLED, 3840x2400, 16", 60 Hz | |
|---|---|---|---|---|---|---|
| Display | -1% | 22% | 0% | 28% | 27% | |
| Display P3 Coverage | 69.1 | 68.2 -1% | 98.4 42% | 69.4 0% | 99.9 45% | 99.8 44% |
| sRGB Coverage | 97.7 | 95.6 -2% | 99.9 2% | 97.6 0% | 100 2% | 100 2% |
| AdobeRGB 1998 Coverage | 71 | 70.5 -1% | 86 21% | 71.8 1% | 96.9 36% | 96.6 36% |
| Response Times | -10% | 8% | -4% | 87% | 84% | |
| Response Time Grey 50% / Grey 80% * | 13.6 ? | 13 ? 4% | 11.4 ? 16% | 11.2 ? 18% | 1.5 ? 89% | 1.7 ? 87% |
| Response Time Black / White * | 8.4 ? | 10.4 ? -24% | 8.4 ? -0% | 10.6 ? -26% | 1.3 ? 85% | 1.7 ? 80% |
| PWM Frequency | 60 | 60 ? | ||||
| Screen | -13% | 5% | -10% | 2% | -14% | |
| Brightness middle | 470.7 | 313.8 -33% | 457.6 -3% | 516 10% | 416 -12% | 348.1 -26% |
| Brightness | 431 | 302 -30% | 466 8% | 505 17% | 421 -2% | 351 -19% |
| Brightness Distribution | 88 | 83 -6% | 83 -6% | 89 1% | 98 11% | 97 10% |
| Black Level * | 0.57 | 0.29 49% | 0.43 25% | 0.41 28% | ||
| Contrast | 826 | 1082 31% | 1064 29% | 1259 52% | ||
| Colorchecker dE 2000 * | 2.16 | 3.27 -51% | 2.78 -29% | 3.5 -62% | 1.3 40% | 4.18 -94% |
| Colorchecker dE 2000 max. * | 4.39 | 7.81 -78% | 5.53 -26% | 8.8 -100% | 2.8 36% | 6.68 -52% |
| Colorchecker dE 2000 calibrated * | 1.37 | 0.56 59% | 1.37 -0% | 1.2 12% | 2.9 -112% | 0.97 29% |
| Greyscale dE 2000 * | 3.7 | 5.9 -59% | 2 46% | 5.6 -51% | 1.8 51% | 1.7 54% |
| Gamma | 2.38 92% | 2.18 101% | 2.28 96% | 2.27 97% | 2.25 98% | 2.2 100% |
| CCT | 6765 96% | 6323 103% | 6806 96% | 6071 107% | 6574 99% | 6198 105% |
| Toplam Ortalama (Program / Ayarlar) | -8% /
-10% | 12% /
9% | -5% /
-7% | 39% /
22% | 32% /
13% |
* ... daha küçük daha iyidir
Ekran, kutudan çıktığı haliyle sRGB standardına göre iyi bir şekilde kalibre edilmiştir. Panelin X-Rite renk ölçerimizle kalibre edilmesi, ortalama gri tonlama ve renk deltaE değerlerini sırasıyla 3,7 ve 2,16'dan sadece 2,5 ve 1,37'ye daha da iyileştirecektir. Kalibre edilmiş ICM profilimiz yukarıda ücretsiz olarak indirilebilir.

Yanıt Sürelerini Görüntüle
| ↔ Tepki Süresi Siyahtan Beyaza | ||
|---|---|---|
| 8.4 ms ... yükseliş ↗ ve sonbahar↘ birleşimi | ↗ 4.5 ms yükseliş | 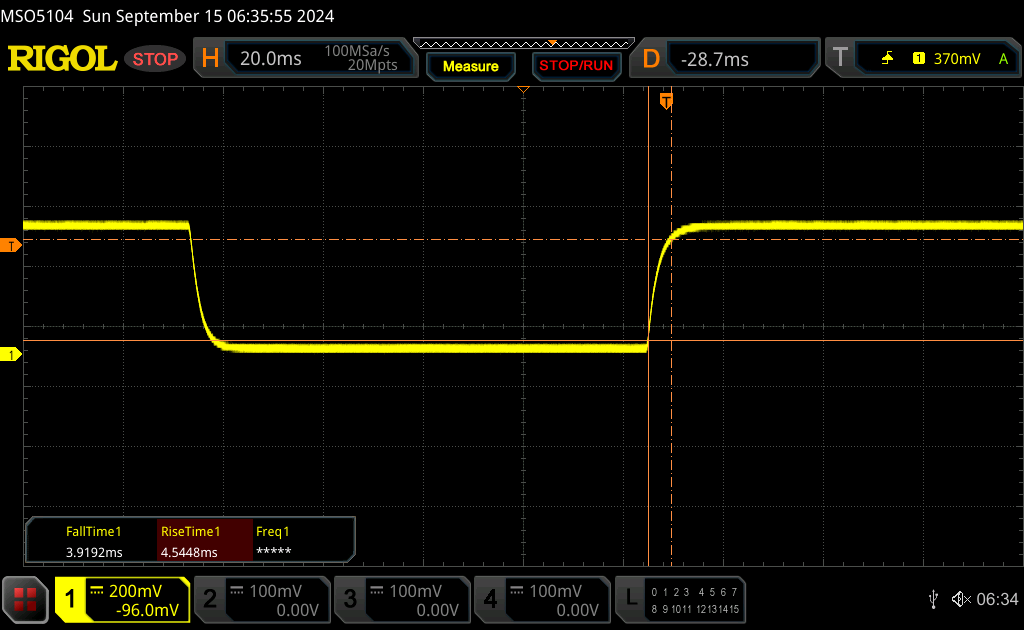 |
| ↘ 3.9 ms sonbahar | ||
| Ekran, testlerimizde hızlı yanıt oranları gösteriyor ve oyun oynamaya uygun olmalı. Karşılaştırıldığında, test edilen tüm cihazlar 0.1 (minimum) ile 240 (maksimum) ms arasında değişir. » Tüm cihazların 21 %'si daha iyi. Bu, ölçülen yanıt süresinin test edilen tüm cihazların ortalamasından (20.8 ms) daha iyi olduğu anlamına gelir. | ||
| ↔ Tepki Süresi %50 Griden %80 Griye | ||
| 13.6 ms ... yükseliş ↗ ve sonbahar↘ birleşimi | ↗ 7.2 ms yükseliş | 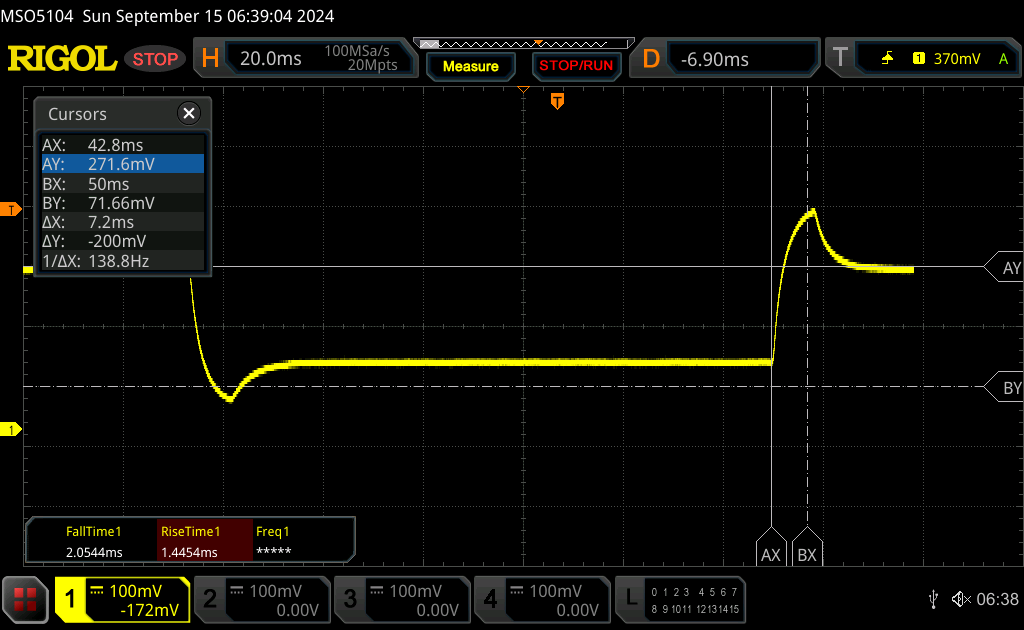 |
| ↘ 6.4 ms sonbahar | ||
| Ekran, testlerimizde iyi yanıt oranları gösteriyor ancak rekabetçi oyuncular için çok yavaş olabilir. Karşılaştırıldığında, test edilen tüm cihazlar 0.165 (minimum) ile 636 (maksimum) ms arasında değişir. » Tüm cihazların 24 %'si daha iyi. Bu, ölçülen yanıt süresinin test edilen tüm cihazların ortalamasından (32.5 ms) daha iyi olduğu anlamına gelir. | ||
Ekran Titremesi / PWM (Darbe Genişliği Modülasyonu)
| Ekran titriyor / PWM algılanmadı | 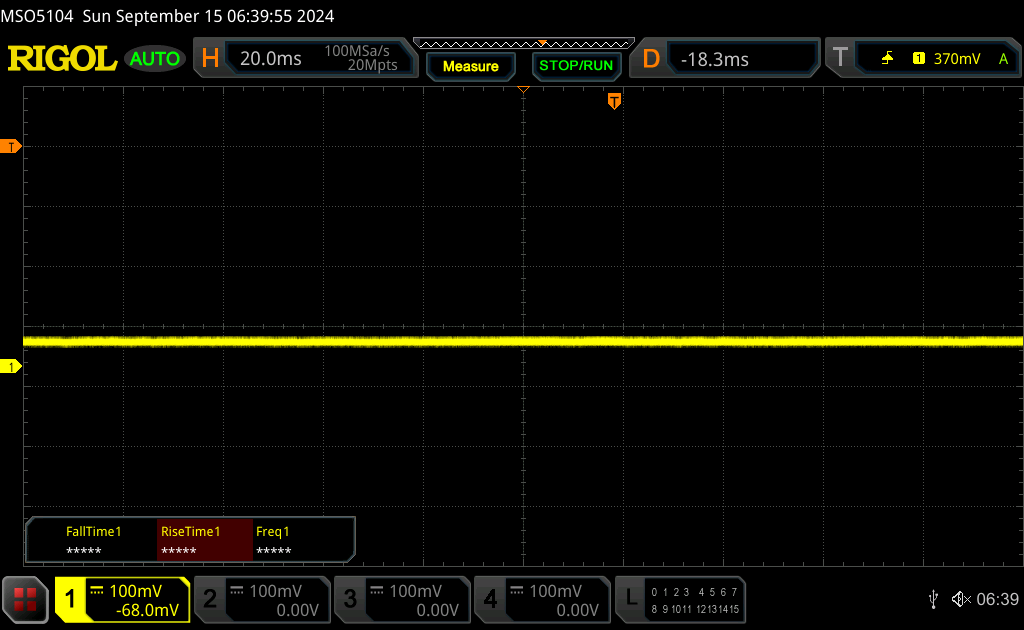 | ||
Karşılaştırıldığında: Test edilen tüm cihazların %53 %'si ekranı karartmak için PWM kullanmıyor. PWM tespit edilirse, ortalama 8516 (minimum: 5 - maksimum: 343500) Hz ölçüldü. | |||
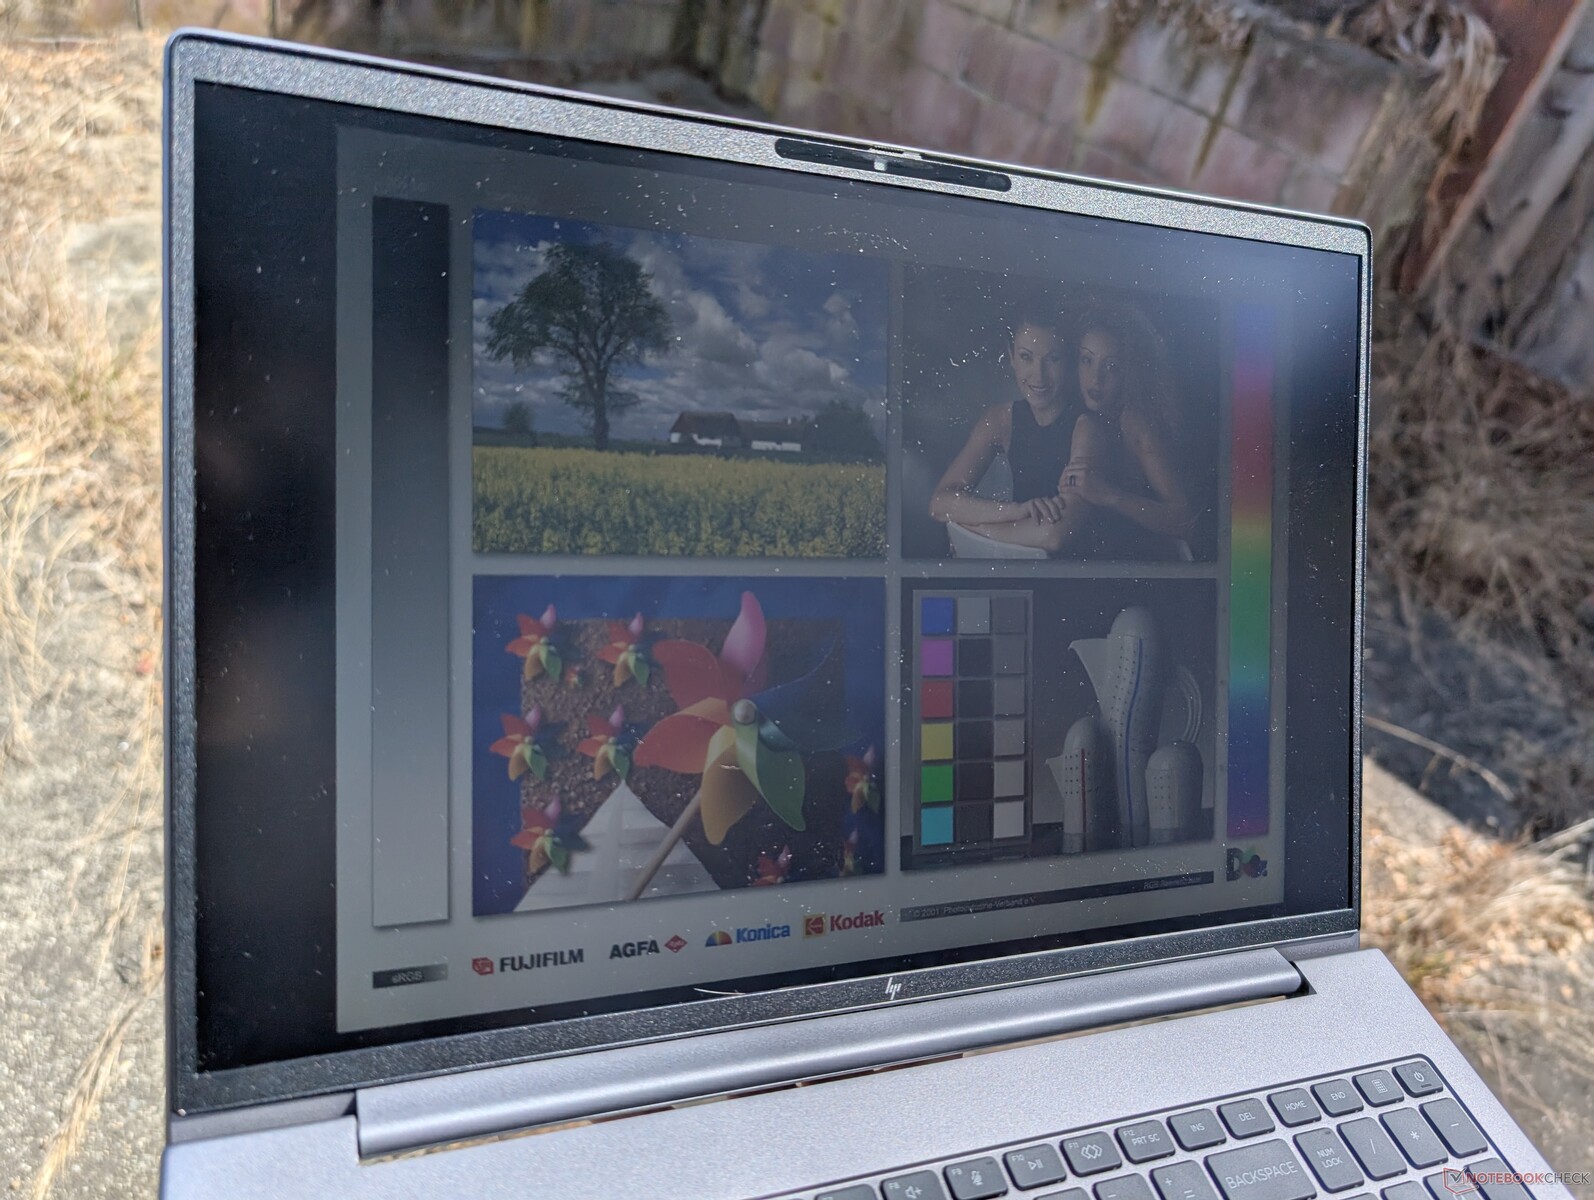
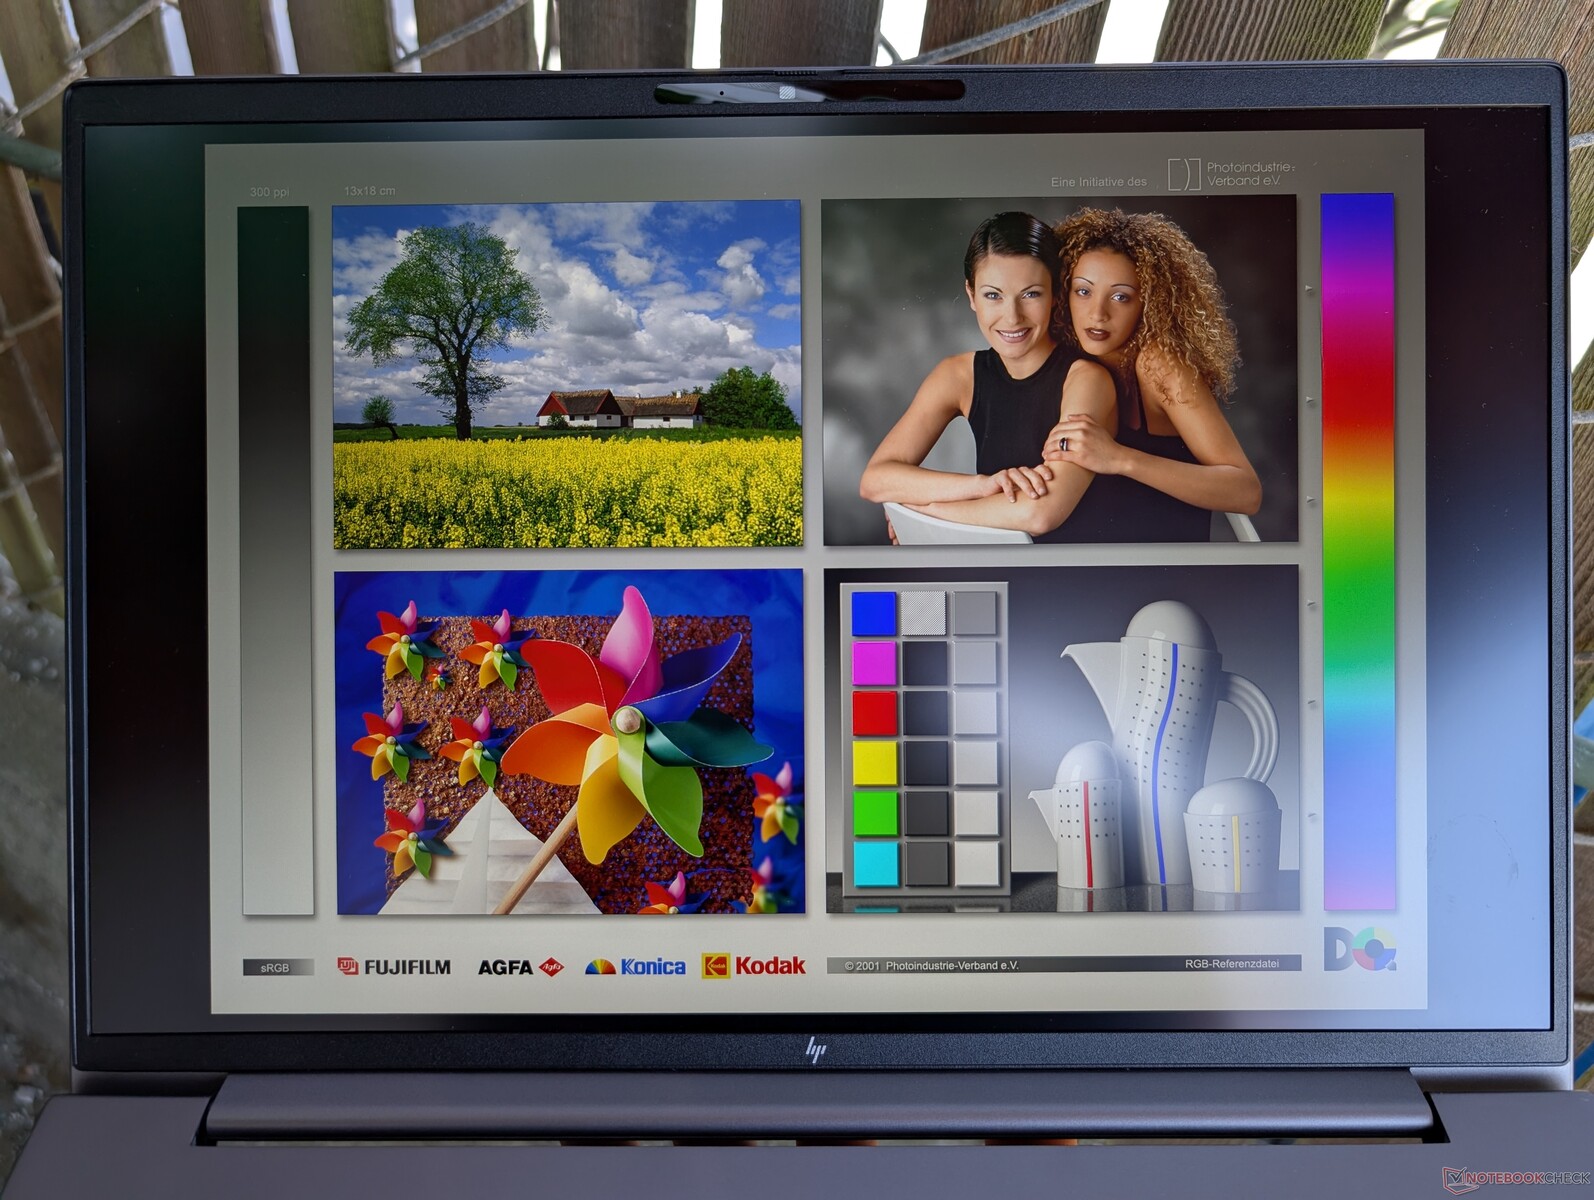
1600p panelimizle gölge altındayken dış mekan görünürlüğü iyidir, ancak daha düşük kaliteli seçenekler daha sönük ve parlamaya daha yatkın olacaktır. Sık sık dış mekandaysanız 1000 nit seçeneği göz önünde bulundurulmalıdır.
Performans - Yeni Zen 4, Aynı Zen 4 Performansı
Test Koşulları
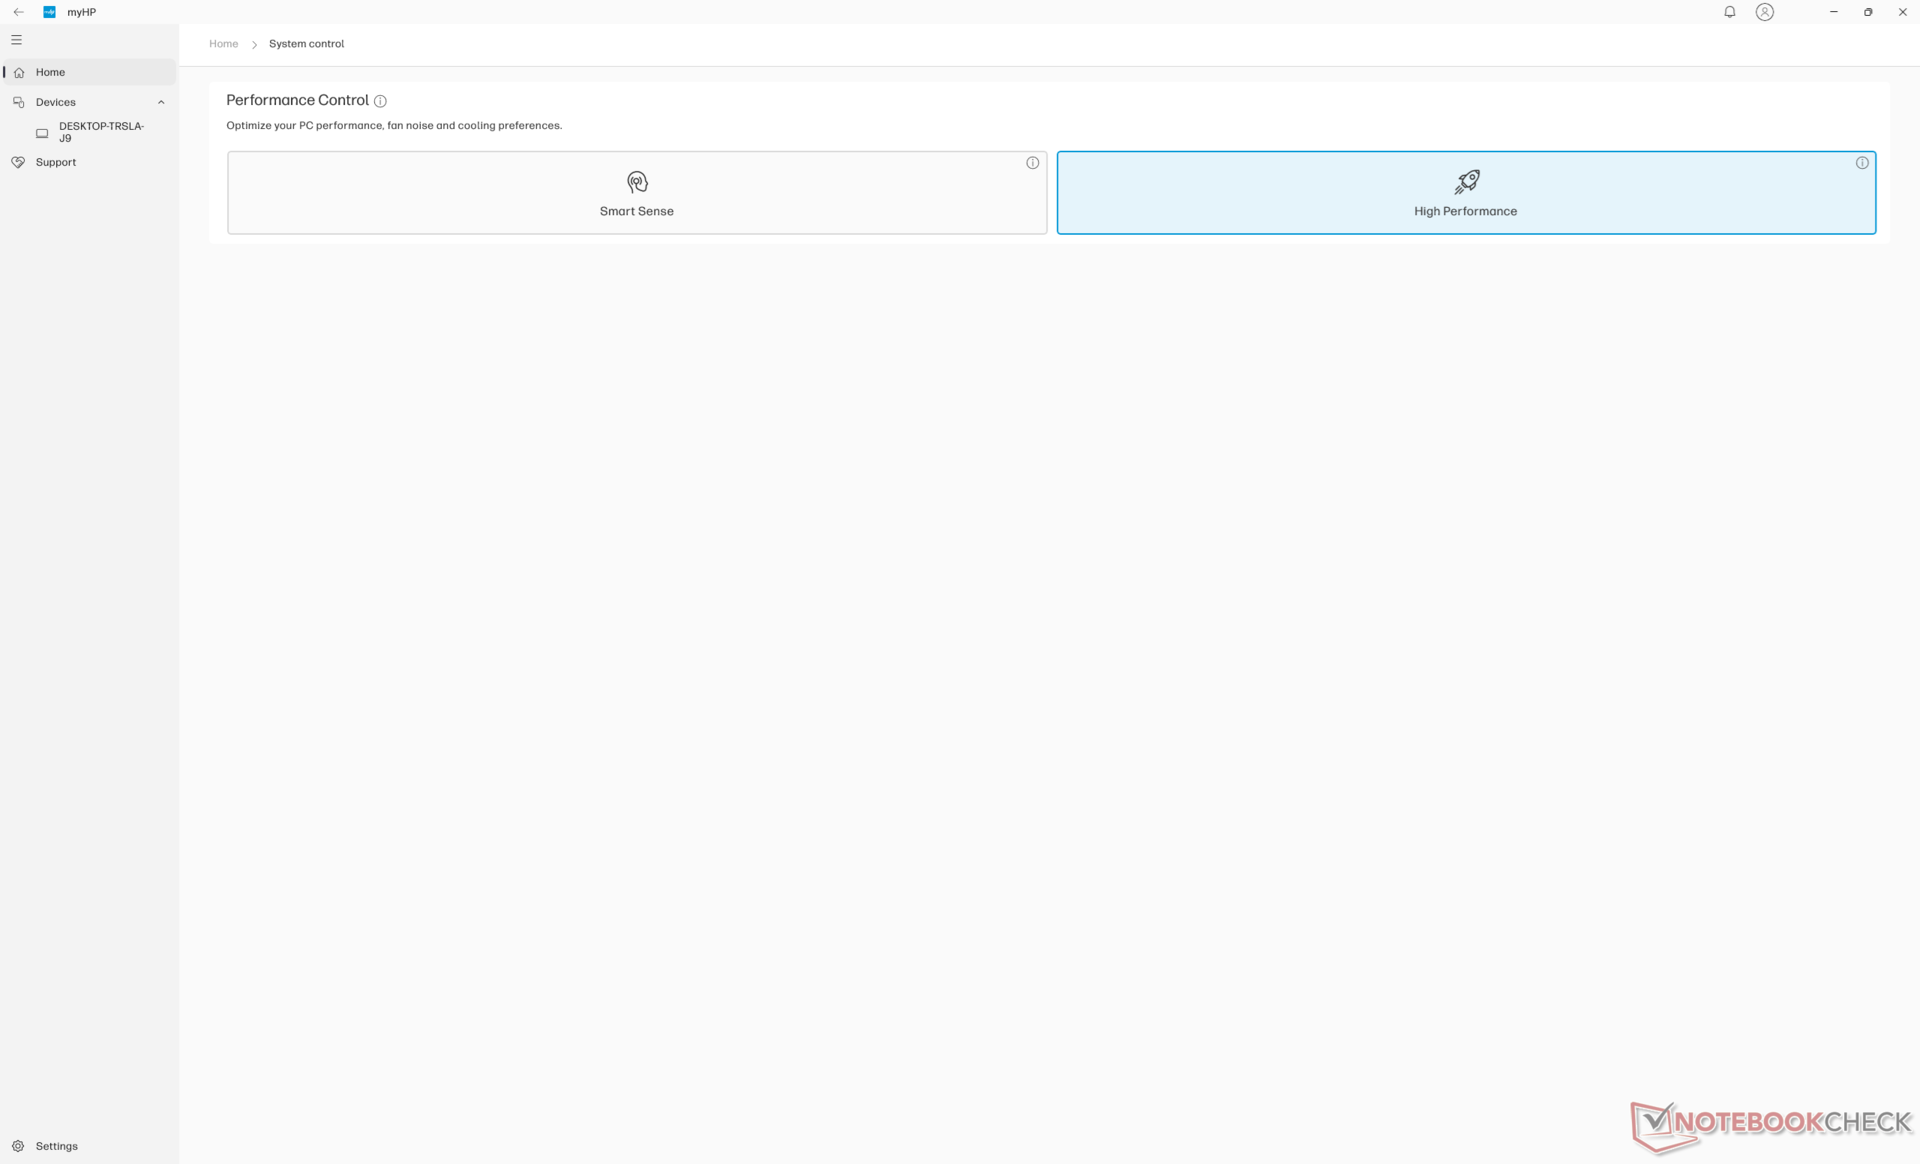
Aşağıdaki kıyaslamaları çalıştırmadan önce hem Windows'u hem de MyHP'yi Performans moduna ayarladık. Optimus 1.0 desteklenmektedir.
İşlemci
Bu Ryzen 7 8845HS fazla bir şey sunmuyor Ryzen 7 7840HS geçen yılki ZBook Power 15 G10. Aslında, kıyaslamalar her iki işlemcinin de sadece birkaç puan farkla neredeyse aynı olduğunu gösteriyor. Bu, 15 inçten 16 inçe geçişte daha önemli performans yükseltmeleri bekleyen güçlü kullanıcılar için hayal kırıklığı yaratabilir. Daha hızlı Raptor Lake-HX seçenekleri yalnızca HP'nin daha kalın ZBook Fury serisinde mevcut.
Ryzen 7 8845HS'nin Ryzen 7 7840HS'ye göre sahip olduğu ana avantaj, entegre NPU'su sayesinde yapay zeka hızlandırmasıdır. Ancak Co-Pilot+, Hawk Point CPU'larla uyumlu değildir ve bu nedenle NPU'nun pratikliği bu makinede çok sınırlıdır.
Bir alt modele geçmek Ryzen 5 8645HS 'ye yükseltirken performansı yüzde 25 ila 30 oranında düşürmesi bekleniyor Ryzen 9 8945HS performansı sadece yüzde 5 oranında artırması beklenmektedir.
Cinebench R15 Multi Loop
Cinebench R23: Multi Core | Single Core
Cinebench R20: CPU (Multi Core) | CPU (Single Core)
Cinebench R15: CPU Multi 64Bit | CPU Single 64Bit
Blender: v2.79 BMW27 CPU
7-Zip 18.03: 7z b 4 | 7z b 4 -mmt1
Geekbench 6.4: Multi-Core | Single-Core
Geekbench 5.5: Multi-Core | Single-Core
HWBOT x265 Benchmark v2.2: 4k Preset
LibreOffice : 20 Documents To PDF
R Benchmark 2.5: Overall mean
| CPU Performance Rating | |
| HP ZBook Fury 16 G11 | |
| Asus ExpertBook B6 Flip B6602FC2 -2! | |
| Dell Precision 5690 | |
| HP ZBook Fury 16 G9 -2! | |
| HP ZBook Power 15 G10 | |
| Ortalama AMD Ryzen 7 8845HS | |
| HP ZBook Power 16 G11 A | |
| Dell Precision 5000 5490 | |
| MSI CreatorPro Z16P B12UKST -2! | |
| Lenovo ThinkPad P16v G1 AMD | |
| Lenovo ThinkPad P16s G2 21K9000CGE | |
| Lenovo ThinkPad P1 G4-20Y4Z9DVUS -2! | |
| HP ZBook Firefly 16 G9-6B897EA -2! | |
| Cinebench R23 / Multi Core | |
| HP ZBook Fury 16 G11 | |
| Asus ExpertBook B6 Flip B6602FC2 | |
| Dell Precision 5690 | |
| HP ZBook Fury 16 G9 | |
| MSI CreatorPro Z16P B12UKST | |
| Dell Precision 5000 5490 | |
| Ortalama AMD Ryzen 7 8845HS (14895 - 18037, n=12) | |
| HP ZBook Power 16 G11 A | |
| HP ZBook Power 15 G10 | |
| Lenovo ThinkPad P16s G2 21K9000CGE | |
| Lenovo ThinkPad P16v G1 AMD | |
| Lenovo ThinkPad P1 G4-20Y4Z9DVUS | |
| HP ZBook Firefly 16 G9-6B897EA | |
| Cinebench R23 / Single Core | |
| HP ZBook Fury 16 G11 | |
| HP ZBook Fury 16 G9 | |
| Asus ExpertBook B6 Flip B6602FC2 | |
| Dell Precision 5690 | |
| HP ZBook Power 15 G10 | |
| Dell Precision 5000 5490 | |
| HP ZBook Power 16 G11 A | |
| Ortalama AMD Ryzen 7 8845HS (1623 - 1783, n=12) | |
| MSI CreatorPro Z16P B12UKST | |
| Lenovo ThinkPad P16s G2 21K9000CGE | |
| Lenovo ThinkPad P16v G1 AMD | |
| Lenovo ThinkPad P1 G4-20Y4Z9DVUS | |
| HP ZBook Firefly 16 G9-6B897EA | |
| Cinebench R20 / CPU (Multi Core) | |
| HP ZBook Fury 16 G11 | |
| Asus ExpertBook B6 Flip B6602FC2 | |
| Dell Precision 5690 | |
| HP ZBook Fury 16 G9 | |
| MSI CreatorPro Z16P B12UKST | |
| Dell Precision 5000 5490 | |
| HP ZBook Power 16 G11 A | |
| Ortalama AMD Ryzen 7 8845HS (5808 - 7026, n=12) | |
| HP ZBook Power 15 G10 | |
| Lenovo ThinkPad P16s G2 21K9000CGE | |
| Lenovo ThinkPad P16v G1 AMD | |
| Lenovo ThinkPad P1 G4-20Y4Z9DVUS | |
| HP ZBook Firefly 16 G9-6B897EA | |
| Cinebench R20 / CPU (Single Core) | |
| HP ZBook Fury 16 G11 | |
| HP ZBook Fury 16 G9 | |
| Asus ExpertBook B6 Flip B6602FC2 | |
| Dell Precision 5690 | |
| HP ZBook Power 15 G10 | |
| Ortalama AMD Ryzen 7 8845HS (673 - 698, n=12) | |
| HP ZBook Power 16 G11 A | |
| Dell Precision 5000 5490 | |
| MSI CreatorPro Z16P B12UKST | |
| Lenovo ThinkPad P16s G2 21K9000CGE | |
| Lenovo ThinkPad P16v G1 AMD | |
| Lenovo ThinkPad P1 G4-20Y4Z9DVUS | |
| HP ZBook Firefly 16 G9-6B897EA | |
| Cinebench R15 / CPU Multi 64Bit | |
| HP ZBook Fury 16 G11 | |
| Asus ExpertBook B6 Flip B6602FC2 | |
| Dell Precision 5690 | |
| Dell Precision 5000 5490 | |
| HP ZBook Power 16 G11 A | |
| Ortalama AMD Ryzen 7 8845HS (2342 - 2908, n=12) | |
| HP ZBook Power 15 G10 | |
| HP ZBook Fury 16 G9 | |
| Lenovo ThinkPad P16s G2 21K9000CGE | |
| Lenovo ThinkPad P16v G1 AMD | |
| MSI CreatorPro Z16P B12UKST | |
| Lenovo ThinkPad P1 G4-20Y4Z9DVUS | |
| HP ZBook Firefly 16 G9-6B897EA | |
| Cinebench R15 / CPU Single 64Bit | |
| HP ZBook Fury 16 G11 | |
| HP ZBook Power 15 G10 | |
| Ortalama AMD Ryzen 7 8845HS (269 - 283, n=12) | |
| HP ZBook Power 16 G11 A | |
| Asus ExpertBook B6 Flip B6602FC2 | |
| Dell Precision 5690 | |
| Lenovo ThinkPad P16s G2 21K9000CGE | |
| Lenovo ThinkPad P16v G1 AMD | |
| Dell Precision 5000 5490 | |
| MSI CreatorPro Z16P B12UKST | |
| Lenovo ThinkPad P1 G4-20Y4Z9DVUS | |
| HP ZBook Firefly 16 G9-6B897EA | |
| HP ZBook Fury 16 G9 | |
| Blender / v2.79 BMW27 CPU | |
| HP ZBook Firefly 16 G9-6B897EA | |
| Lenovo ThinkPad P1 G4-20Y4Z9DVUS | |
| Lenovo ThinkPad P16s G2 21K9000CGE | |
| Dell Precision 5690 | |
| HP ZBook Power 16 G11 A | |
| Lenovo ThinkPad P16v G1 AMD | |
| Dell Precision 5000 5490 | |
| Ortalama AMD Ryzen 7 8845HS (179 - 216, n=12) | |
| MSI CreatorPro Z16P B12UKST | |
| HP ZBook Power 15 G10 | |
| Asus ExpertBook B6 Flip B6602FC2 | |
| HP ZBook Fury 16 G9 | |
| HP ZBook Fury 16 G11 | |
| 7-Zip 18.03 / 7z b 4 | |
| HP ZBook Fury 16 G11 | |
| HP ZBook Fury 16 G9 | |
| Dell Precision 5690 | |
| Asus ExpertBook B6 Flip B6602FC2 | |
| HP ZBook Power 15 G10 | |
| Ortalama AMD Ryzen 7 8845HS (62669 - 74664, n=12) | |
| Dell Precision 5000 5490 | |
| HP ZBook Power 16 G11 A | |
| MSI CreatorPro Z16P B12UKST | |
| Lenovo ThinkPad P16v G1 AMD | |
| Lenovo ThinkPad P16s G2 21K9000CGE | |
| Lenovo ThinkPad P1 G4-20Y4Z9DVUS | |
| HP ZBook Firefly 16 G9-6B897EA | |
| 7-Zip 18.03 / 7z b 4 -mmt1 | |
| HP ZBook Fury 16 G11 | |
| Lenovo ThinkPad P16v G1 AMD | |
| HP ZBook Power 15 G10 | |
| HP ZBook Power 16 G11 A | |
| Ortalama AMD Ryzen 7 8845HS (5197 - 6714, n=12) | |
| Asus ExpertBook B6 Flip B6602FC2 | |
| HP ZBook Fury 16 G9 | |
| Lenovo ThinkPad P16s G2 21K9000CGE | |
| MSI CreatorPro Z16P B12UKST | |
| Lenovo ThinkPad P1 G4-20Y4Z9DVUS | |
| Dell Precision 5000 5490 | |
| Dell Precision 5690 | |
| HP ZBook Firefly 16 G9-6B897EA | |
| Geekbench 6.4 / Multi-Core | |
| HP ZBook Fury 16 G11 | |
| Dell Precision 5690 | |
| Dell Precision 5000 5490 | |
| HP ZBook Power 15 G10 | |
| Ortalama AMD Ryzen 7 8845HS (11073 - 14014, n=16) | |
| HP ZBook Power 16 G11 A | |
| Lenovo ThinkPad P16s G2 21K9000CGE | |
| Lenovo ThinkPad P16v G1 AMD | |
| Geekbench 6.4 / Single-Core | |
| HP ZBook Fury 16 G11 | |
| HP ZBook Power 15 G10 | |
| Ortalama AMD Ryzen 7 8845HS (2510 - 2698, n=14) | |
| HP ZBook Power 16 G11 A | |
| Lenovo ThinkPad P16v G1 AMD | |
| Dell Precision 5690 | |
| Lenovo ThinkPad P16s G2 21K9000CGE | |
| Dell Precision 5000 5490 | |
| Geekbench 5.5 / Multi-Core | |
| HP ZBook Fury 16 G11 | |
| Asus ExpertBook B6 Flip B6602FC2 | |
| Dell Precision 5690 | |
| HP ZBook Fury 16 G9 | |
| Dell Precision 5000 5490 | |
| MSI CreatorPro Z16P B12UKST | |
| HP ZBook Power 15 G10 | |
| Ortalama AMD Ryzen 7 8845HS (11256 - 12726, n=13) | |
| HP ZBook Power 16 G11 A | |
| Lenovo ThinkPad P16s G2 21K9000CGE | |
| Lenovo ThinkPad P16v G1 AMD | |
| Lenovo ThinkPad P1 G4-20Y4Z9DVUS | |
| HP ZBook Firefly 16 G9-6B897EA | |
| Geekbench 5.5 / Single-Core | |
| HP ZBook Fury 16 G11 | |
| HP ZBook Power 15 G10 | |
| HP ZBook Fury 16 G9 | |
| Ortalama AMD Ryzen 7 8845HS (1765 - 2004, n=13) | |
| HP ZBook Power 16 G11 A | |
| Asus ExpertBook B6 Flip B6602FC2 | |
| Dell Precision 5690 | |
| Lenovo ThinkPad P16v G1 AMD | |
| HP ZBook Firefly 16 G9-6B897EA | |
| MSI CreatorPro Z16P B12UKST | |
| Dell Precision 5000 5490 | |
| Lenovo ThinkPad P16s G2 21K9000CGE | |
| Lenovo ThinkPad P1 G4-20Y4Z9DVUS | |
| HWBOT x265 Benchmark v2.2 / 4k Preset | |
| HP ZBook Fury 16 G11 | |
| Dell Precision 5690 | |
| Asus ExpertBook B6 Flip B6602FC2 | |
| Ortalama AMD Ryzen 7 8845HS (18.6 - 22.7, n=12) | |
| HP ZBook Power 15 G10 | |
| HP ZBook Fury 16 G9 | |
| HP ZBook Power 16 G11 A | |
| MSI CreatorPro Z16P B12UKST | |
| Lenovo ThinkPad P16v G1 AMD | |
| Lenovo ThinkPad P16s G2 21K9000CGE | |
| Dell Precision 5000 5490 | |
| Lenovo ThinkPad P1 G4-20Y4Z9DVUS | |
| HP ZBook Firefly 16 G9-6B897EA | |
| LibreOffice / 20 Documents To PDF | |
| HP ZBook Power 15 G10 | |
| HP ZBook Firefly 16 G9-6B897EA | |
| Lenovo ThinkPad P16s G2 21K9000CGE | |
| HP ZBook Power 16 G11 A | |
| Ortalama AMD Ryzen 7 8845HS (44.4 - 77, n=12) | |
| Lenovo ThinkPad P1 G4-20Y4Z9DVUS | |
| HP ZBook Fury 16 G11 | |
| Lenovo ThinkPad P16v G1 AMD | |
| Dell Precision 5000 5490 | |
| Asus ExpertBook B6 Flip B6602FC2 | |
| Dell Precision 5690 | |
| MSI CreatorPro Z16P B12UKST | |
| HP ZBook Fury 16 G9 | |
| R Benchmark 2.5 / Overall mean | |
| Lenovo ThinkPad P1 G4-20Y4Z9DVUS | |
| HP ZBook Firefly 16 G9-6B897EA | |
| Dell Precision 5000 5490 | |
| Lenovo ThinkPad P16s G2 21K9000CGE | |
| Dell Precision 5690 | |
| MSI CreatorPro Z16P B12UKST | |
| Ortalama AMD Ryzen 7 8845HS (0.4304 - 0.4935, n=12) | |
| Asus ExpertBook B6 Flip B6602FC2 | |
| HP ZBook Power 15 G10 | |
| HP ZBook Power 16 G11 A | |
| Lenovo ThinkPad P16v G1 AMD | |
| HP ZBook Fury 16 G9 | |
| HP ZBook Fury 16 G11 | |
Cinebench R23: Multi Core | Single Core
Cinebench R20: CPU (Multi Core) | CPU (Single Core)
Cinebench R15: CPU Multi 64Bit | CPU Single 64Bit
Blender: v2.79 BMW27 CPU
7-Zip 18.03: 7z b 4 | 7z b 4 -mmt1
Geekbench 6.4: Multi-Core | Single-Core
Geekbench 5.5: Multi-Core | Single-Core
HWBOT x265 Benchmark v2.2: 4k Preset
LibreOffice : 20 Documents To PDF
R Benchmark 2.5: Overall mean
* ... daha küçük daha iyidir
AIDA64: FP32 Ray-Trace | FPU Julia | CPU SHA3 | CPU Queen | FPU SinJulia | FPU Mandel | CPU AES | CPU ZLib | FP64 Ray-Trace | CPU PhotoWorxx
| Performance Rating | |
| Ortalama AMD Ryzen 7 8845HS | |
| HP ZBook Power 15 G10 | |
| HP ZBook Power 16 G11 A | |
| HP ZBook Fury 16 G11 | |
| Lenovo ThinkPad P16s G2 21K9000CGE | |
| Dell Precision 5690 | |
| Lenovo ThinkPad P1 Gen 7 21KV001SGE | |
| AIDA64 / FP32 Ray-Trace | |
| Ortalama AMD Ryzen 7 8845HS (23708 - 29544, n=12) | |
| HP ZBook Power 15 G10 | |
| HP ZBook Power 16 G11 A | |
| Lenovo ThinkPad P16s G2 21K9000CGE | |
| HP ZBook Fury 16 G11 | |
| Dell Precision 5690 | |
| Lenovo ThinkPad P1 Gen 7 21KV001SGE | |
| AIDA64 / FPU Julia | |
| HP ZBook Power 16 G11 A | |
| Ortalama AMD Ryzen 7 8845HS (99659 - 125873, n=12) | |
| HP ZBook Power 15 G10 | |
| HP ZBook Fury 16 G11 | |
| Lenovo ThinkPad P16s G2 21K9000CGE | |
| Dell Precision 5690 | |
| Lenovo ThinkPad P1 Gen 7 21KV001SGE | |
| AIDA64 / CPU SHA3 | |
| HP ZBook Fury 16 G11 | |
| HP ZBook Power 16 G11 A | |
| Ortalama AMD Ryzen 7 8845HS (4332 - 5180, n=12) | |
| HP ZBook Power 15 G10 | |
| Lenovo ThinkPad P16s G2 21K9000CGE | |
| Dell Precision 5690 | |
| Lenovo ThinkPad P1 Gen 7 21KV001SGE | |
| AIDA64 / CPU Queen | |
| HP ZBook Fury 16 G11 | |
| HP ZBook Power 16 G11 A | |
| Ortalama AMD Ryzen 7 8845HS (109458 - 124695, n=12) | |
| HP ZBook Power 15 G10 | |
| Lenovo ThinkPad P16s G2 21K9000CGE | |
| Dell Precision 5690 | |
| Lenovo ThinkPad P1 Gen 7 21KV001SGE | |
| AIDA64 / FPU SinJulia | |
| Ortalama AMD Ryzen 7 8845HS (14062 - 15519, n=12) | |
| HP ZBook Power 15 G10 | |
| HP ZBook Power 16 G11 A | |
| Lenovo ThinkPad P16s G2 21K9000CGE | |
| HP ZBook Fury 16 G11 | |
| Dell Precision 5690 | |
| Lenovo ThinkPad P1 Gen 7 21KV001SGE | |
| AIDA64 / FPU Mandel | |
| Ortalama AMD Ryzen 7 8845HS (53436 - 67367, n=12) | |
| HP ZBook Power 15 G10 | |
| HP ZBook Power 16 G11 A | |
| Lenovo ThinkPad P16s G2 21K9000CGE | |
| HP ZBook Fury 16 G11 | |
| Dell Precision 5690 | |
| Lenovo ThinkPad P1 Gen 7 21KV001SGE | |
| AIDA64 / CPU AES | |
| HP ZBook Fury 16 G11 | |
| Ortalama AMD Ryzen 7 8845HS (64515 - 172642, n=12) | |
| Dell Precision 5690 | |
| HP ZBook Power 15 G10 | |
| Lenovo ThinkPad P1 Gen 7 21KV001SGE | |
| HP ZBook Power 16 G11 A | |
| Lenovo ThinkPad P16s G2 21K9000CGE | |
| AIDA64 / CPU ZLib | |
| HP ZBook Fury 16 G11 | |
| Dell Precision 5690 | |
| Lenovo ThinkPad P1 Gen 7 21KV001SGE | |
| HP ZBook Power 16 G11 A | |
| HP ZBook Power 15 G10 | |
| Lenovo ThinkPad P16s G2 21K9000CGE | |
| Ortalama AMD Ryzen 7 8845HS (627 - 1080, n=12) | |
| AIDA64 / FP64 Ray-Trace | |
| HP ZBook Power 15 G10 | |
| Ortalama AMD Ryzen 7 8845HS (12361 - 15911, n=12) | |
| HP ZBook Power 16 G11 A | |
| Lenovo ThinkPad P16s G2 21K9000CGE | |
| HP ZBook Fury 16 G11 | |
| Dell Precision 5690 | |
| Lenovo ThinkPad P1 Gen 7 21KV001SGE | |
| AIDA64 / CPU PhotoWorxx | |
| Dell Precision 5690 | |
| HP ZBook Power 15 G10 | |
| Lenovo ThinkPad P1 Gen 7 21KV001SGE | |
| HP ZBook Power 16 G11 A | |
| Ortalama AMD Ryzen 7 8845HS (33192 - 41668, n=12) | |
| Lenovo ThinkPad P16s G2 21K9000CGE | |
| HP ZBook Fury 16 G11 | |
Stres Testi
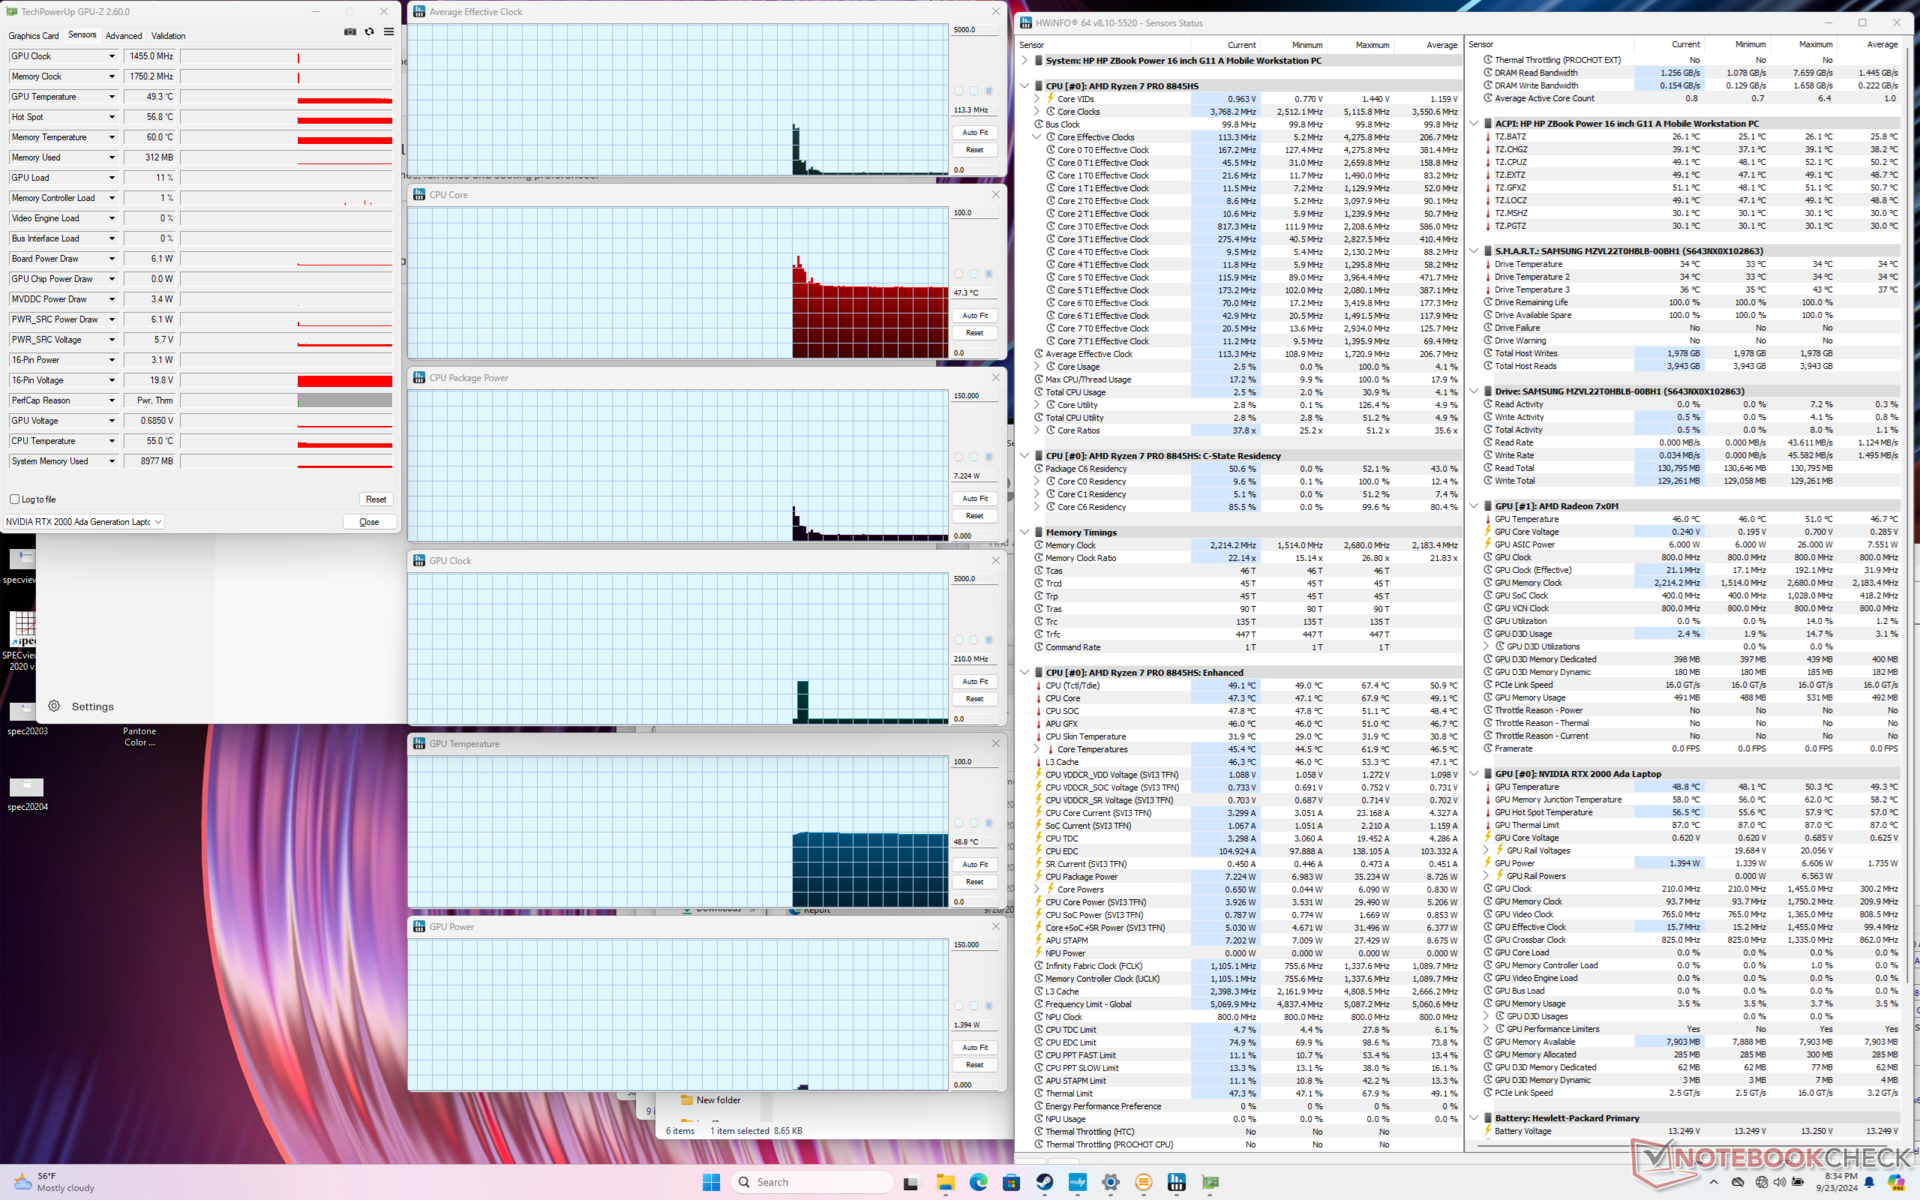
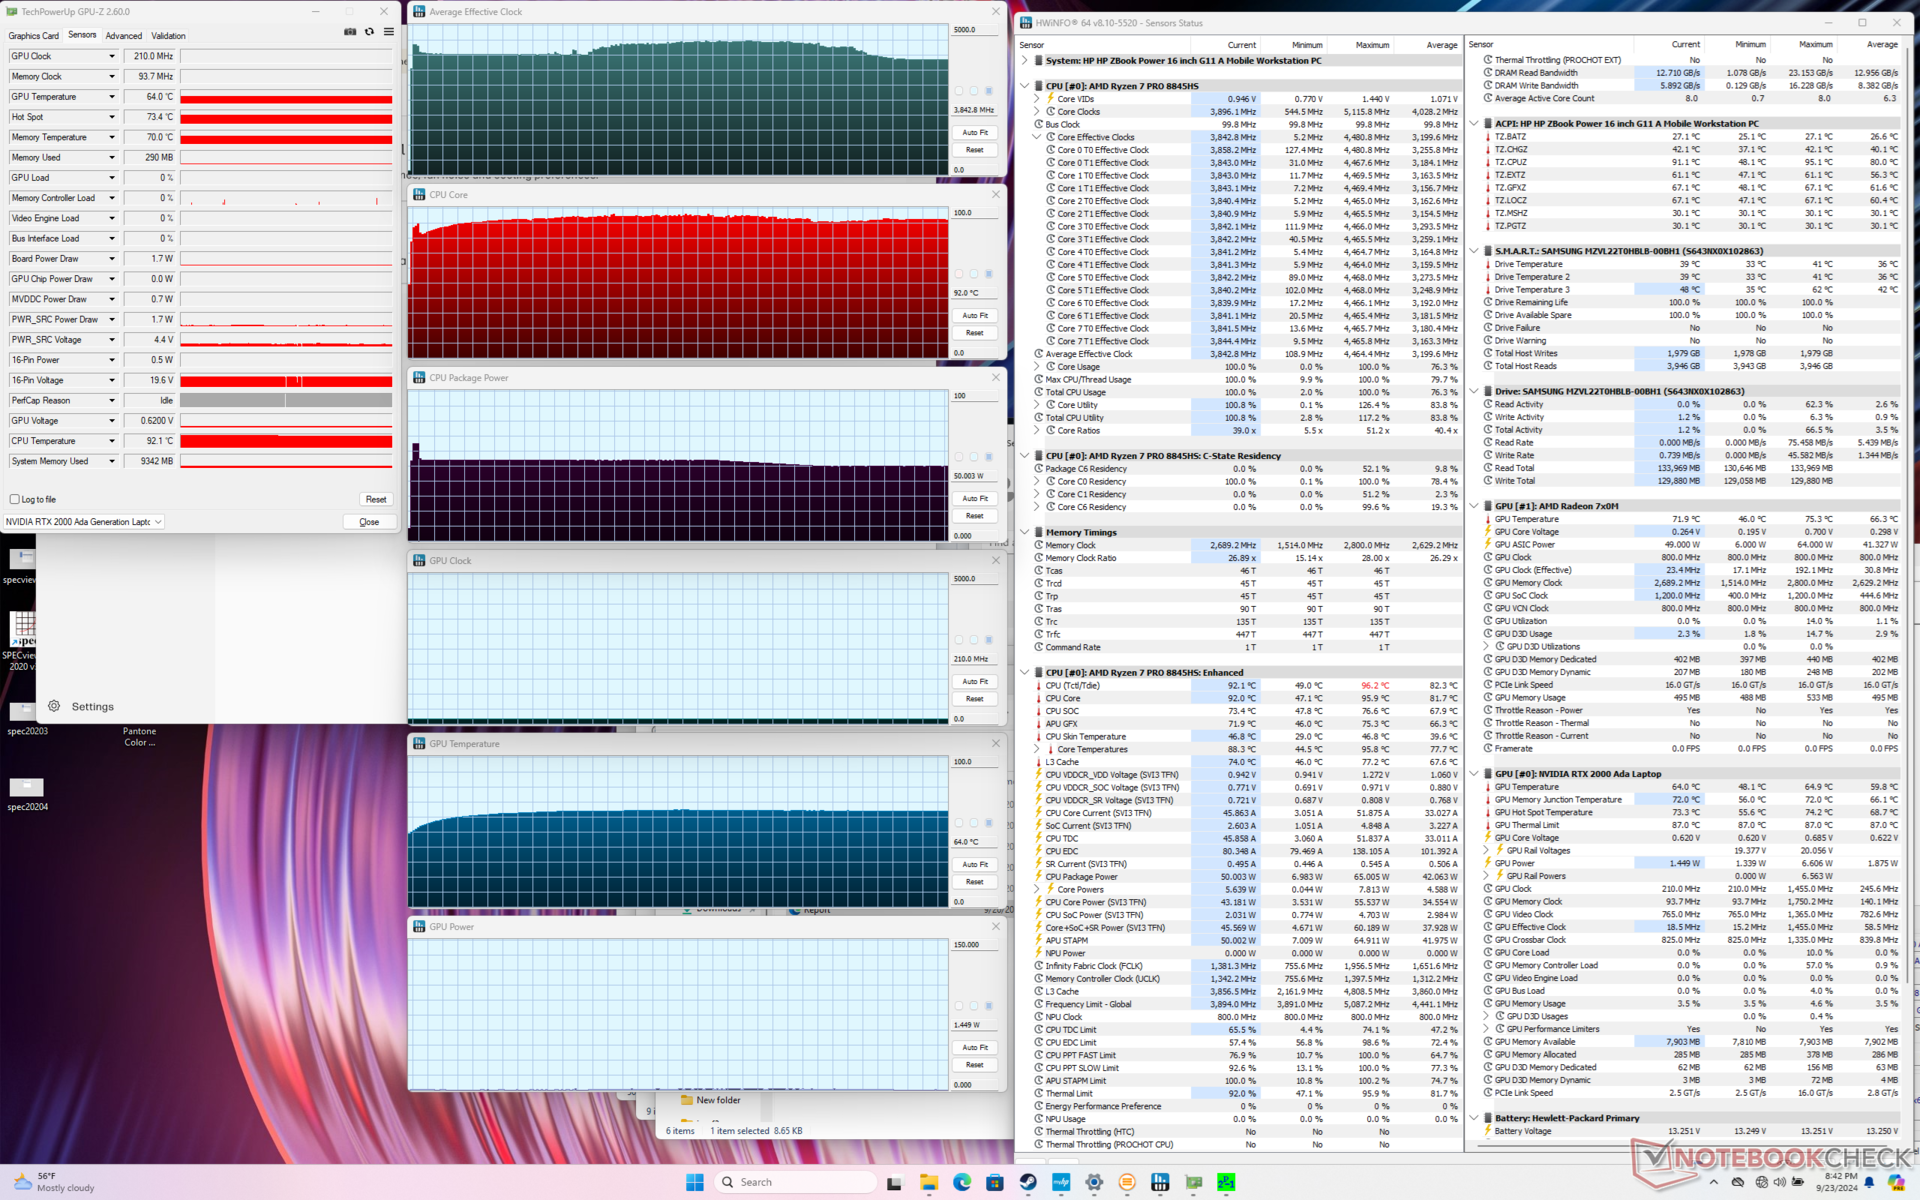
CPU, Prime95 stresini başlatırken 4,3 GHz, 65 W ve 90 C'ye yükseliyor, ardından hızla düşüyor ve daha yüksek çekirdek sıcaklıklarını önlemek için 3,8 GHz ve 50 W'de sabitleniyordu. Sonuçlar, birkaç derece daha sıcak olmasa da ZBook Power 15 G10'da gözlemlediklerimize yakındır.
İlginç bir şekilde, CPU hem Prime95 hem de FurMark'ı aynı anda çalıştırırken geçen yılki modelde olduğu gibi 3,8 GHz yerine sadece 2,8 GHz'e düşüyor. Bu değişiklik muhtemelen çekirdek sıcaklıklarını iyileştirmek içindi; CPU artık ZBook Power 15 G10'daki 99 C yerine daha rahat bir 66 C'de stabilize oluyor.
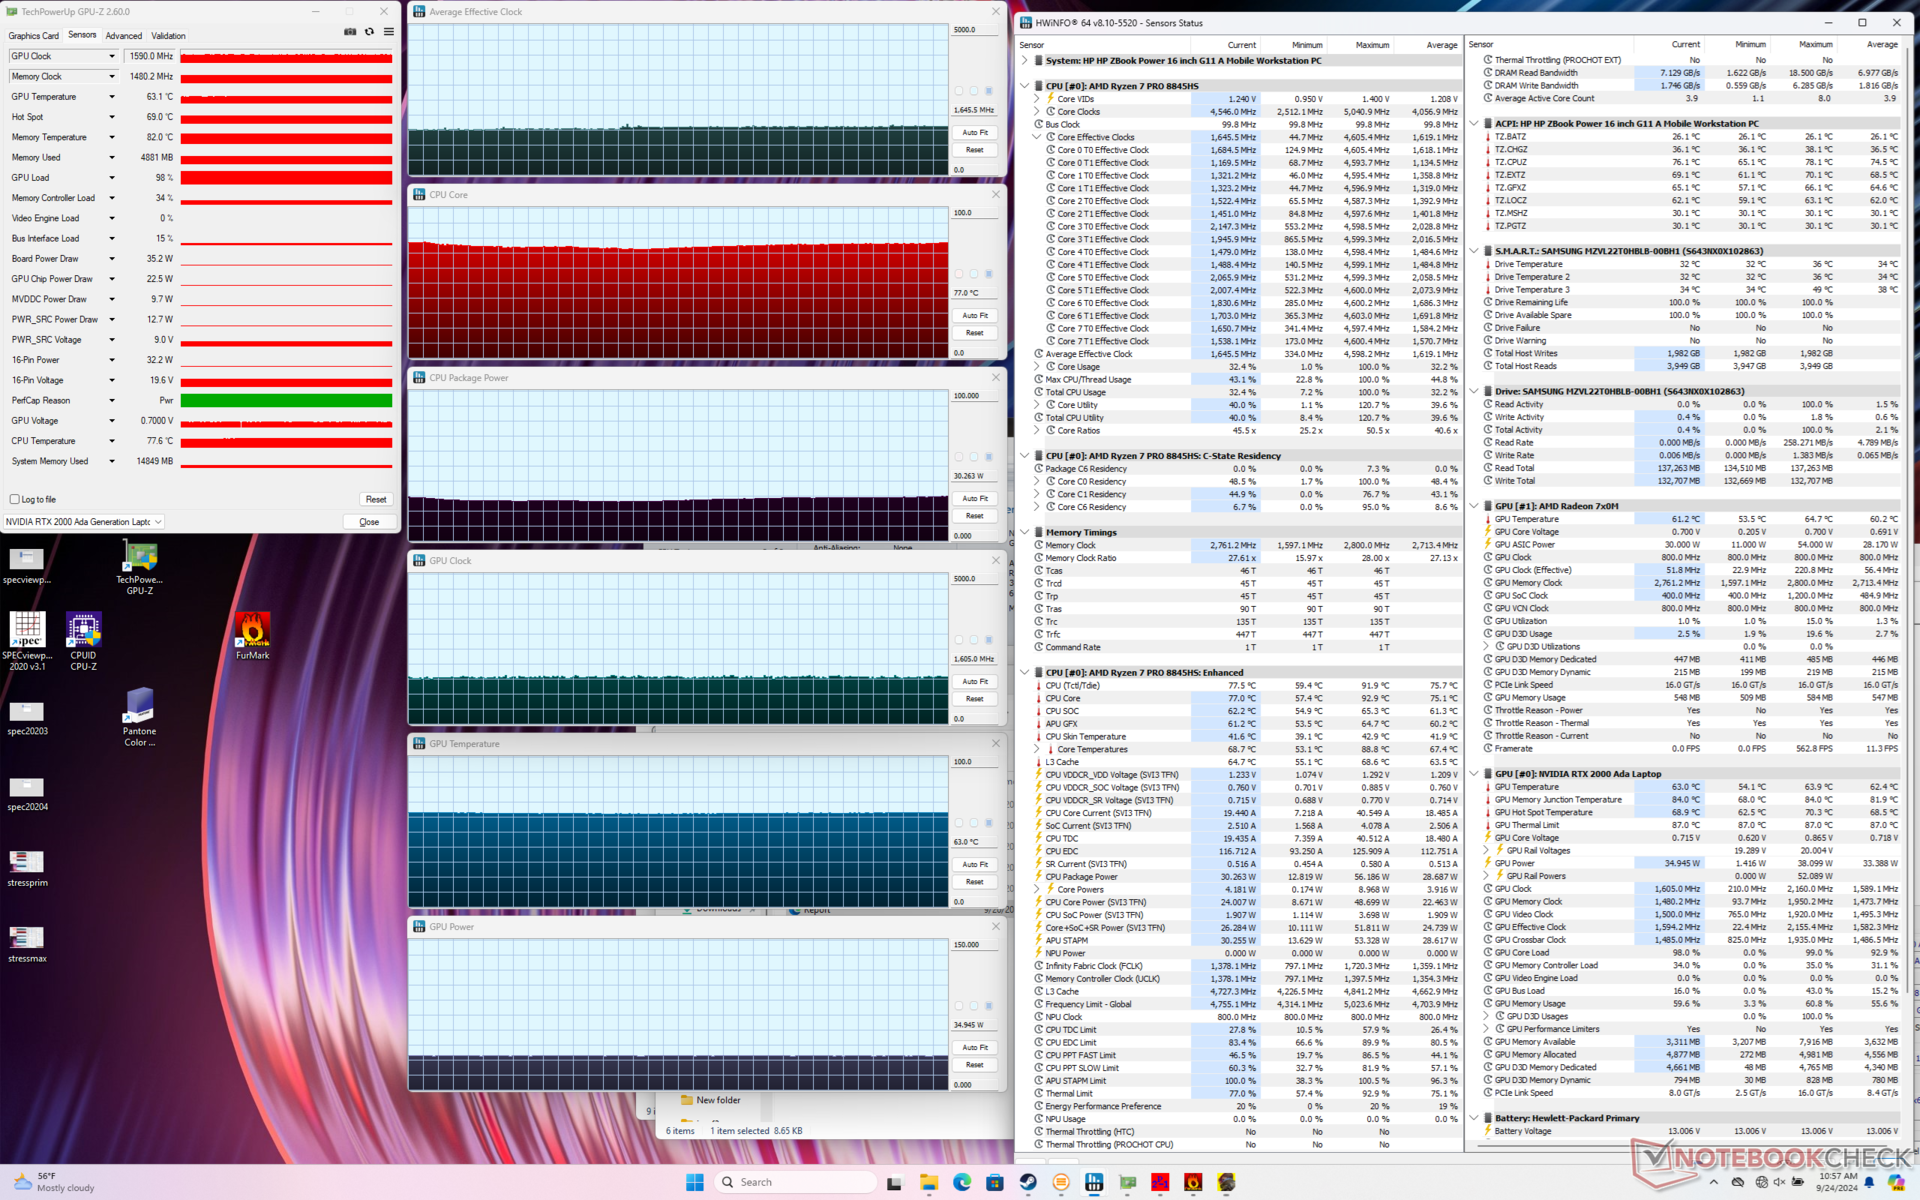
Cyberpunk 2077 'yi Performans modu yerine Dengeli modda çalıştırmak, aşağıda gösterildiği gibi hem biraz daha düşük çekirdek sıcaklıkları hem de biraz daha yavaş ortalama saat hızları ile sonuçlanır. GPU kartı güç çekişi de reklamı yapılan maksimum 50 W'a karşı 35 W'tan 30 W'a düşecektir.
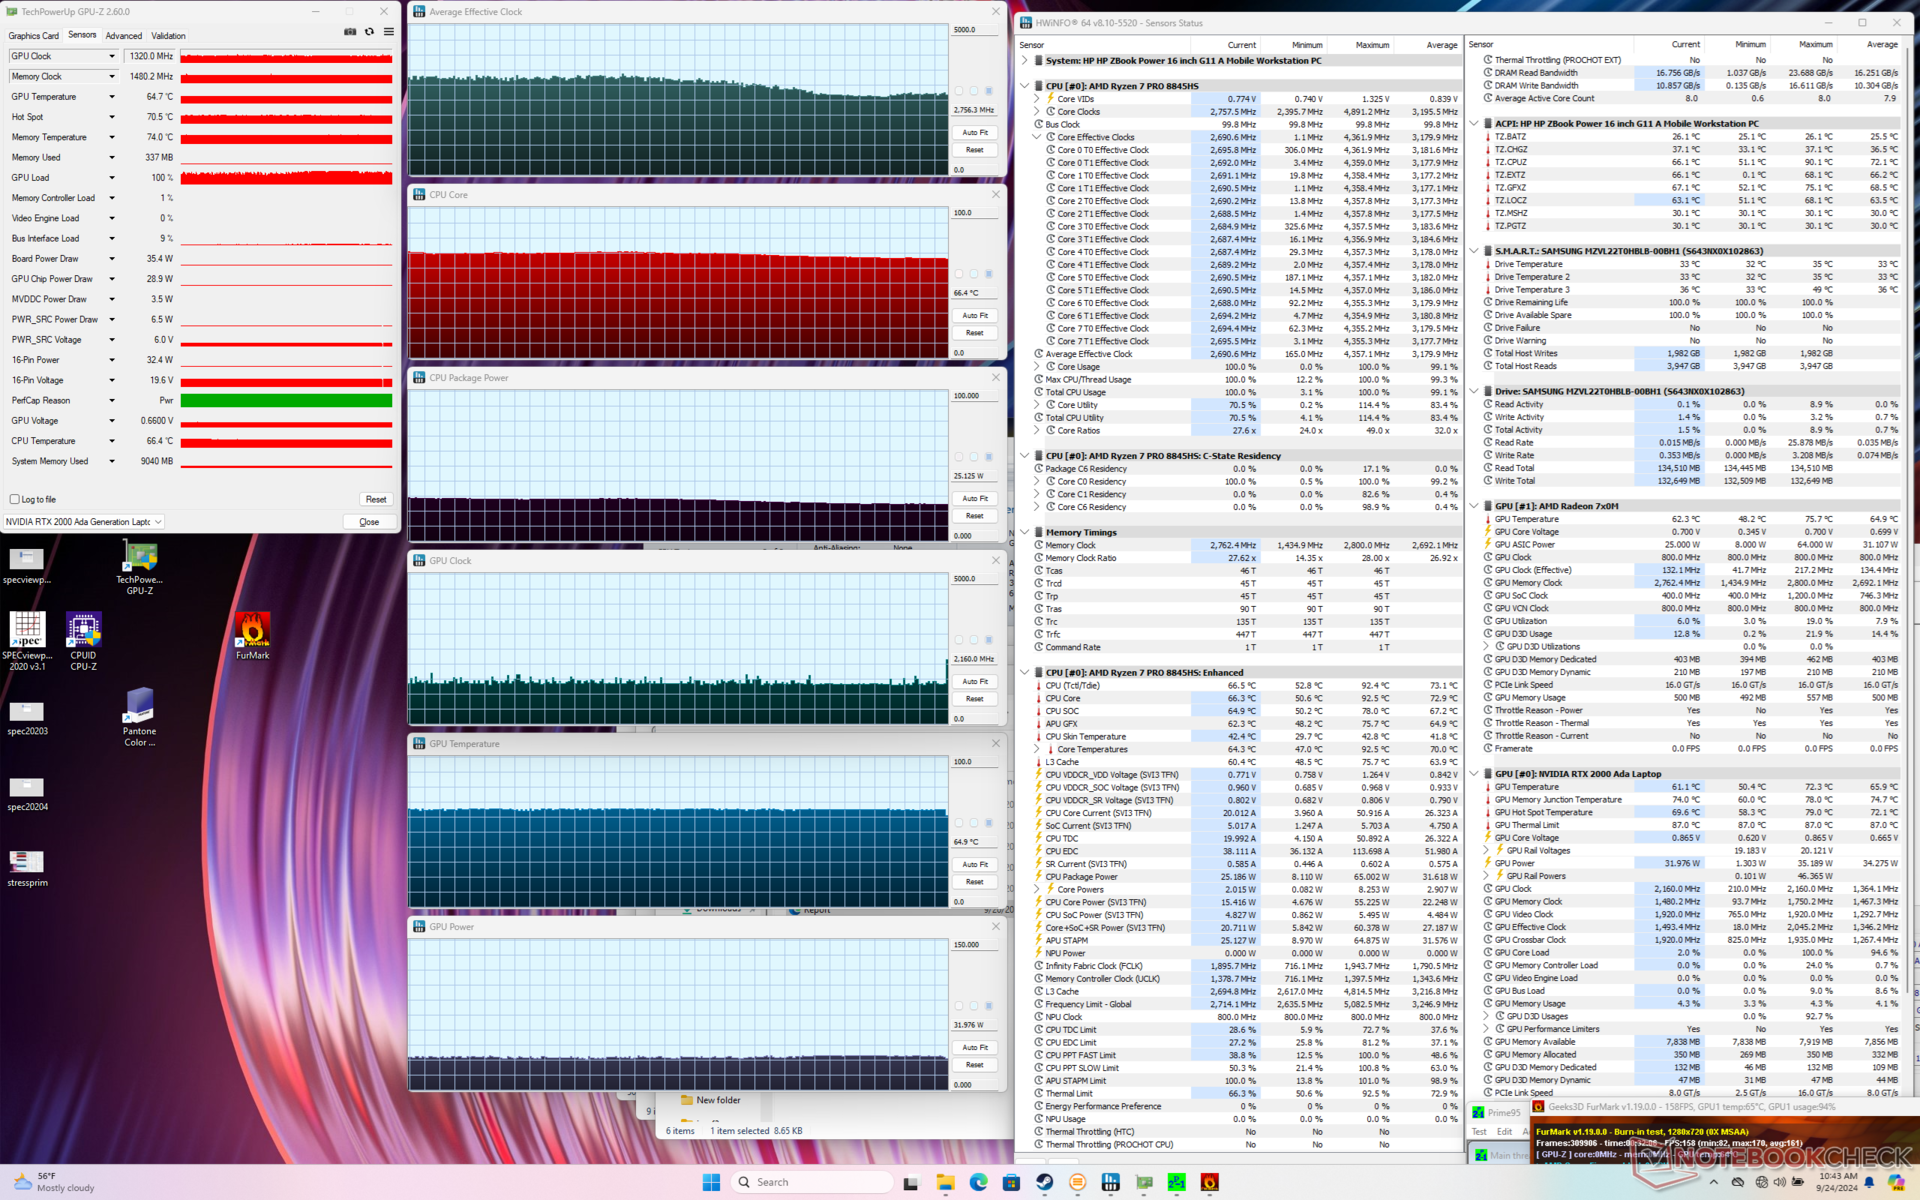
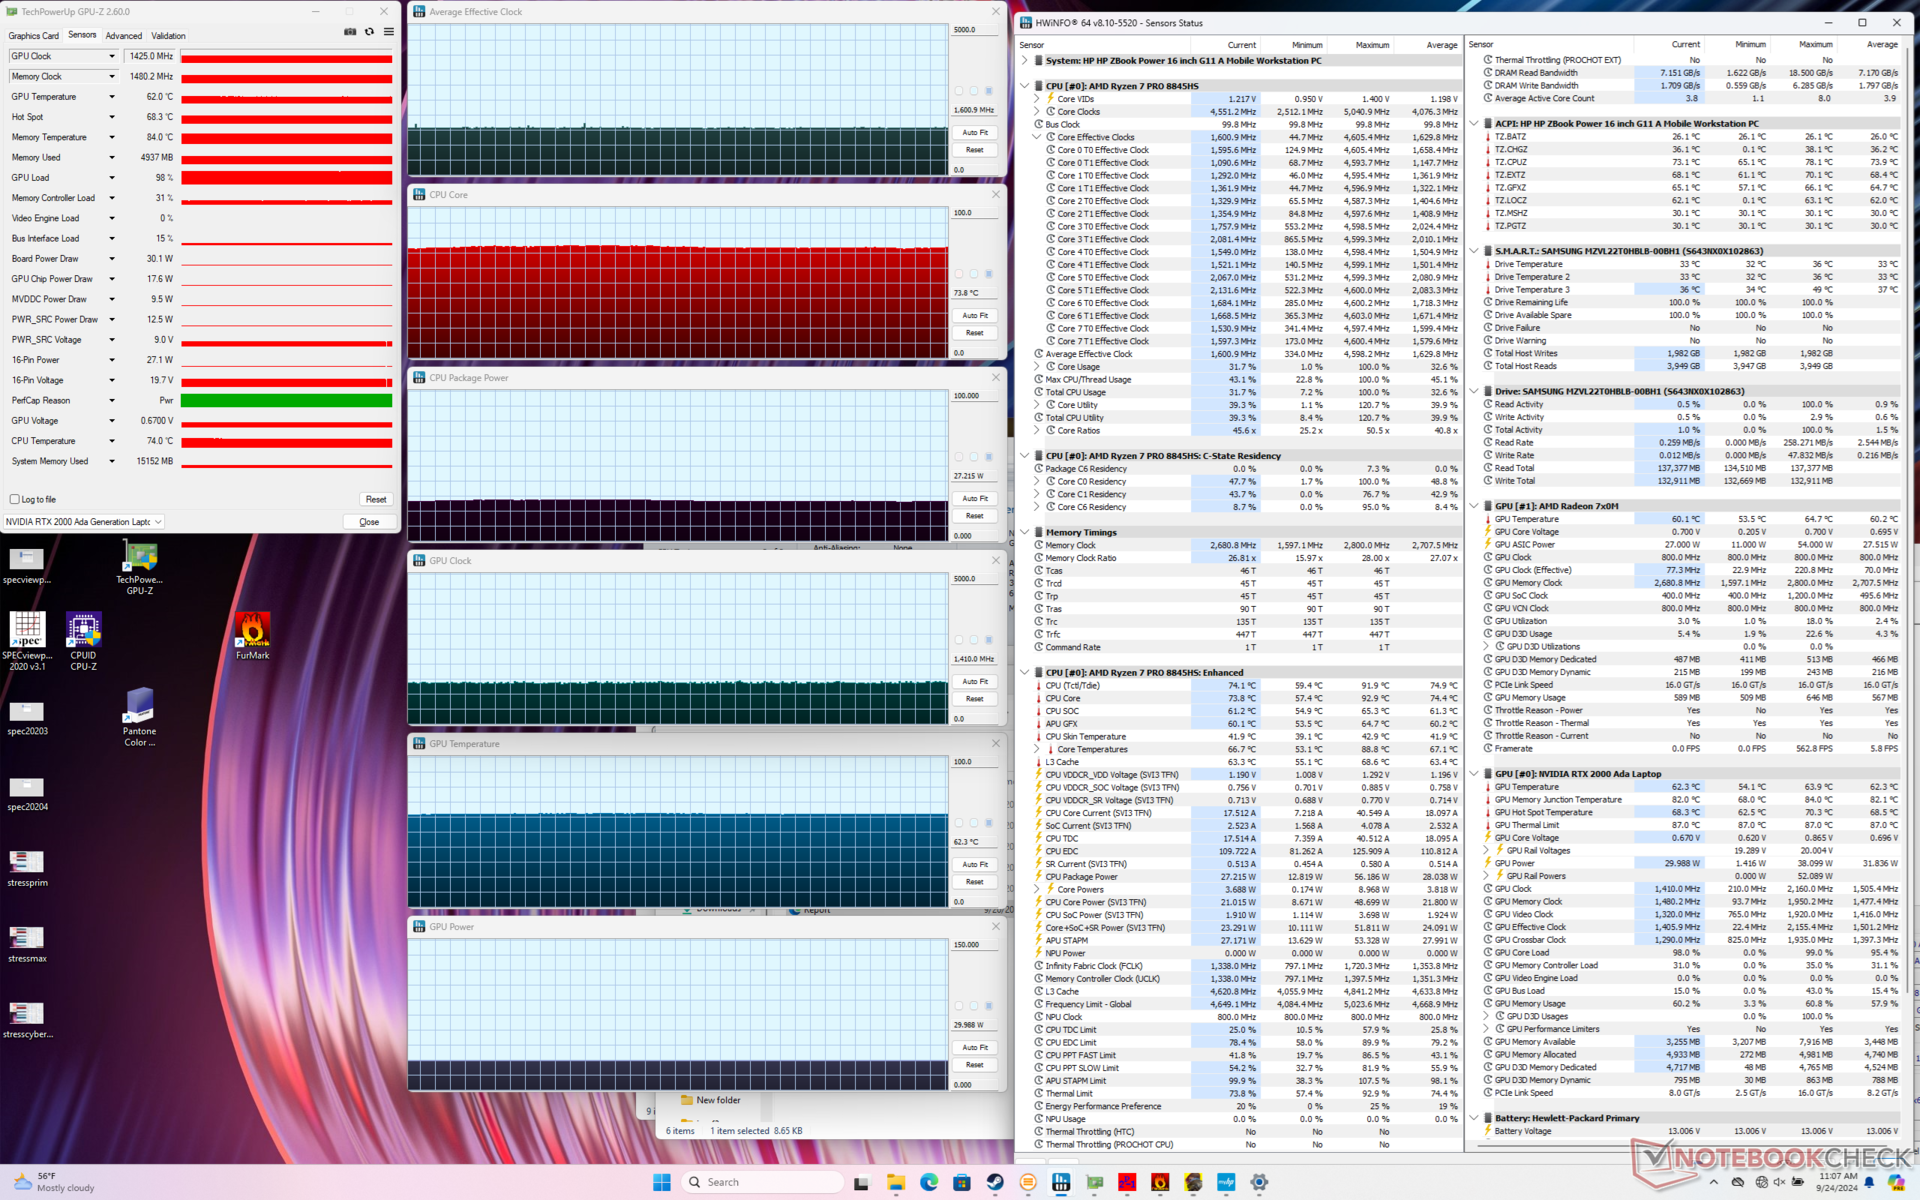
| Ortalama CPU Saati (GHz) | GPU Saati (MHz) | Ortalama CPU Sıcaklığı(°C) | Ortalama GPU Sıcaklığı (°C) | |
| Sistem Boşta | -- | -- | 47 | 49 |
| Prime95 Stres | 3,9 | -- | 92 | 64 |
| Prime95 + FurMark Stres | 2.8 | 1320 | 66 | 65 |
| Cyberpunk 2077 Stres (Dengeli mod) | 1.6 | 1425 | 74 | 62 |
| Cyberpunk 2077 Stres (Performans modu) | 1.7 | 1590 | 77 | 63 |
Sistem Performansı
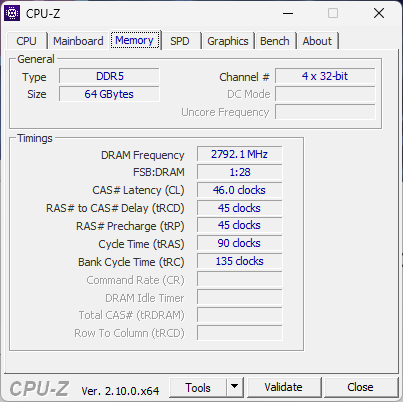
PCMark sonuçları, geçen yılki ZBook Power 15 G10'da kaydettiklerimizle neredeyse aynı. Bu, tarama veya düzenleme gibi geleneksel günlük yüklerin yeni modelimizde fark edilir derecede daha hızlı olmadığı anlamına geliyor. RAM performansı da iyileşmedi.
Windows'a dönmek için sert bir kapatma gerektiren bir uykudan uyanma sorunu yaşadık. Sorunu güvenilir bir şekilde tekrarlayamadık, ancak mobil bir iş istasyonunda yaşanmış olması yine de dikkate değer.

CrossMark: Overall | Productivity | Creativity | Responsiveness
WebXPRT 3: Overall
WebXPRT 4: Overall
Mozilla Kraken 1.1: Total
| PCMark 10 / Score | |
| Dell Precision 5690 | |
| HP ZBook Fury 16 G11 | |
| HP ZBook Power 15 G10 | |
| HP ZBook Power 16 G11 A | |
| Ortalama AMD Ryzen 7 8845HS, NVIDIA RTX 2000 Ada Generation Laptop GPU (n=1) | |
| Lenovo ThinkPad P1 Gen 7 21KV001SGE | |
| Lenovo ThinkPad P16s G2 21K9000CGE | |
| PCMark 10 / Essentials | |
| Dell Precision 5690 | |
| HP ZBook Power 15 G10 | |
| HP ZBook Power 16 G11 A | |
| Ortalama AMD Ryzen 7 8845HS, NVIDIA RTX 2000 Ada Generation Laptop GPU (n=1) | |
| Lenovo ThinkPad P1 Gen 7 21KV001SGE | |
| Lenovo ThinkPad P16s G2 21K9000CGE | |
| HP ZBook Fury 16 G11 | |
| PCMark 10 / Productivity | |
| Dell Precision 5690 | |
| HP ZBook Power 15 G10 | |
| HP ZBook Power 16 G11 A | |
| Ortalama AMD Ryzen 7 8845HS, NVIDIA RTX 2000 Ada Generation Laptop GPU (n=1) | |
| HP ZBook Fury 16 G11 | |
| Lenovo ThinkPad P1 Gen 7 21KV001SGE | |
| Lenovo ThinkPad P16s G2 21K9000CGE | |
| PCMark 10 / Digital Content Creation | |
| HP ZBook Fury 16 G11 | |
| Dell Precision 5690 | |
| Lenovo ThinkPad P1 Gen 7 21KV001SGE | |
| HP ZBook Power 15 G10 | |
| HP ZBook Power 16 G11 A | |
| Ortalama AMD Ryzen 7 8845HS, NVIDIA RTX 2000 Ada Generation Laptop GPU (n=1) | |
| Lenovo ThinkPad P16s G2 21K9000CGE | |
| CrossMark / Overall | |
| HP ZBook Fury 16 G11 | |
| Dell Precision 5690 | |
| HP ZBook Power 16 G11 A | |
| Ortalama AMD Ryzen 7 8845HS, NVIDIA RTX 2000 Ada Generation Laptop GPU (n=1) | |
| Lenovo ThinkPad P1 Gen 7 21KV001SGE | |
| HP ZBook Power 15 G10 | |
| Lenovo ThinkPad P16s G2 21K9000CGE | |
| CrossMark / Productivity | |
| HP ZBook Fury 16 G11 | |
| Dell Precision 5690 | |
| HP ZBook Power 16 G11 A | |
| Ortalama AMD Ryzen 7 8845HS, NVIDIA RTX 2000 Ada Generation Laptop GPU (n=1) | |
| Lenovo ThinkPad P1 Gen 7 21KV001SGE | |
| HP ZBook Power 15 G10 | |
| Lenovo ThinkPad P16s G2 21K9000CGE | |
| CrossMark / Creativity | |
| HP ZBook Fury 16 G11 | |
| HP ZBook Power 16 G11 A | |
| Ortalama AMD Ryzen 7 8845HS, NVIDIA RTX 2000 Ada Generation Laptop GPU (n=1) | |
| Dell Precision 5690 | |
| Lenovo ThinkPad P1 Gen 7 21KV001SGE | |
| HP ZBook Power 15 G10 | |
| Lenovo ThinkPad P16s G2 21K9000CGE | |
| CrossMark / Responsiveness | |
| HP ZBook Fury 16 G11 | |
| Dell Precision 5690 | |
| HP ZBook Power 16 G11 A | |
| Ortalama AMD Ryzen 7 8845HS, NVIDIA RTX 2000 Ada Generation Laptop GPU (n=1) | |
| Lenovo ThinkPad P1 Gen 7 21KV001SGE | |
| Lenovo ThinkPad P16s G2 21K9000CGE | |
| HP ZBook Power 15 G10 | |
| WebXPRT 3 / Overall | |
| HP ZBook Fury 16 G11 | |
| HP ZBook Power 15 G10 | |
| HP ZBook Power 16 G11 A | |
| Ortalama AMD Ryzen 7 8845HS, NVIDIA RTX 2000 Ada Generation Laptop GPU (n=1) | |
| Dell Precision 5690 | |
| Lenovo ThinkPad P1 Gen 7 21KV001SGE | |
| Lenovo ThinkPad P16s G2 21K9000CGE | |
| WebXPRT 4 / Overall | |
| HP ZBook Fury 16 G11 | |
| Dell Precision 5690 | |
| Lenovo ThinkPad P1 Gen 7 21KV001SGE | |
| HP ZBook Power 16 G11 A | |
| Ortalama AMD Ryzen 7 8845HS, NVIDIA RTX 2000 Ada Generation Laptop GPU (n=1) | |
| HP ZBook Power 15 G10 | |
| Mozilla Kraken 1.1 / Total | |
| Lenovo ThinkPad P16s G2 21K9000CGE | |
| HP ZBook Power 15 G10 | |
| HP ZBook Power 16 G11 A | |
| Ortalama AMD Ryzen 7 8845HS, NVIDIA RTX 2000 Ada Generation Laptop GPU (n=1) | |
| Lenovo ThinkPad P1 Gen 7 21KV001SGE | |
| Dell Precision 5690 | |
| HP ZBook Fury 16 G11 | |
* ... daha küçük daha iyidir
| PCMark 10 Score | 7376 puan | |
Yardım | ||
| AIDA64 / Memory Copy | |
| Dell Precision 5690 | |
| HP ZBook Power 15 G10 | |
| Ortalama AMD Ryzen 7 8845HS (61459 - 71873, n=12) | |
| Lenovo ThinkPad P16s G2 21K9000CGE | |
| Lenovo ThinkPad P1 Gen 7 21KV001SGE | |
| HP ZBook Power 16 G11 A | |
| HP ZBook Fury 16 G11 | |
| AIDA64 / Memory Read | |
| Dell Precision 5690 | |
| Lenovo ThinkPad P1 Gen 7 21KV001SGE | |
| HP ZBook Power 15 G10 | |
| HP ZBook Power 16 G11 A | |
| HP ZBook Fury 16 G11 | |
| Ortalama AMD Ryzen 7 8845HS (49866 - 61976, n=12) | |
| Lenovo ThinkPad P16s G2 21K9000CGE | |
| AIDA64 / Memory Write | |
| Lenovo ThinkPad P16s G2 21K9000CGE | |
| Ortalama AMD Ryzen 7 8845HS (68425 - 93239, n=12) | |
| HP ZBook Power 15 G10 | |
| HP ZBook Power 16 G11 A | |
| Dell Precision 5690 | |
| Lenovo ThinkPad P1 Gen 7 21KV001SGE | |
| HP ZBook Fury 16 G11 | |
| AIDA64 / Memory Latency | |
| Dell Precision 5690 | |
| Lenovo ThinkPad P1 Gen 7 21KV001SGE | |
| Lenovo ThinkPad P16s G2 21K9000CGE | |
| HP ZBook Power 15 G10 | |
| HP ZBook Power 16 G11 A | |
| Ortalama AMD Ryzen 7 8845HS (82.5 - 117, n=12) | |
| HP ZBook Fury 16 G11 | |
* ... daha küçük daha iyidir
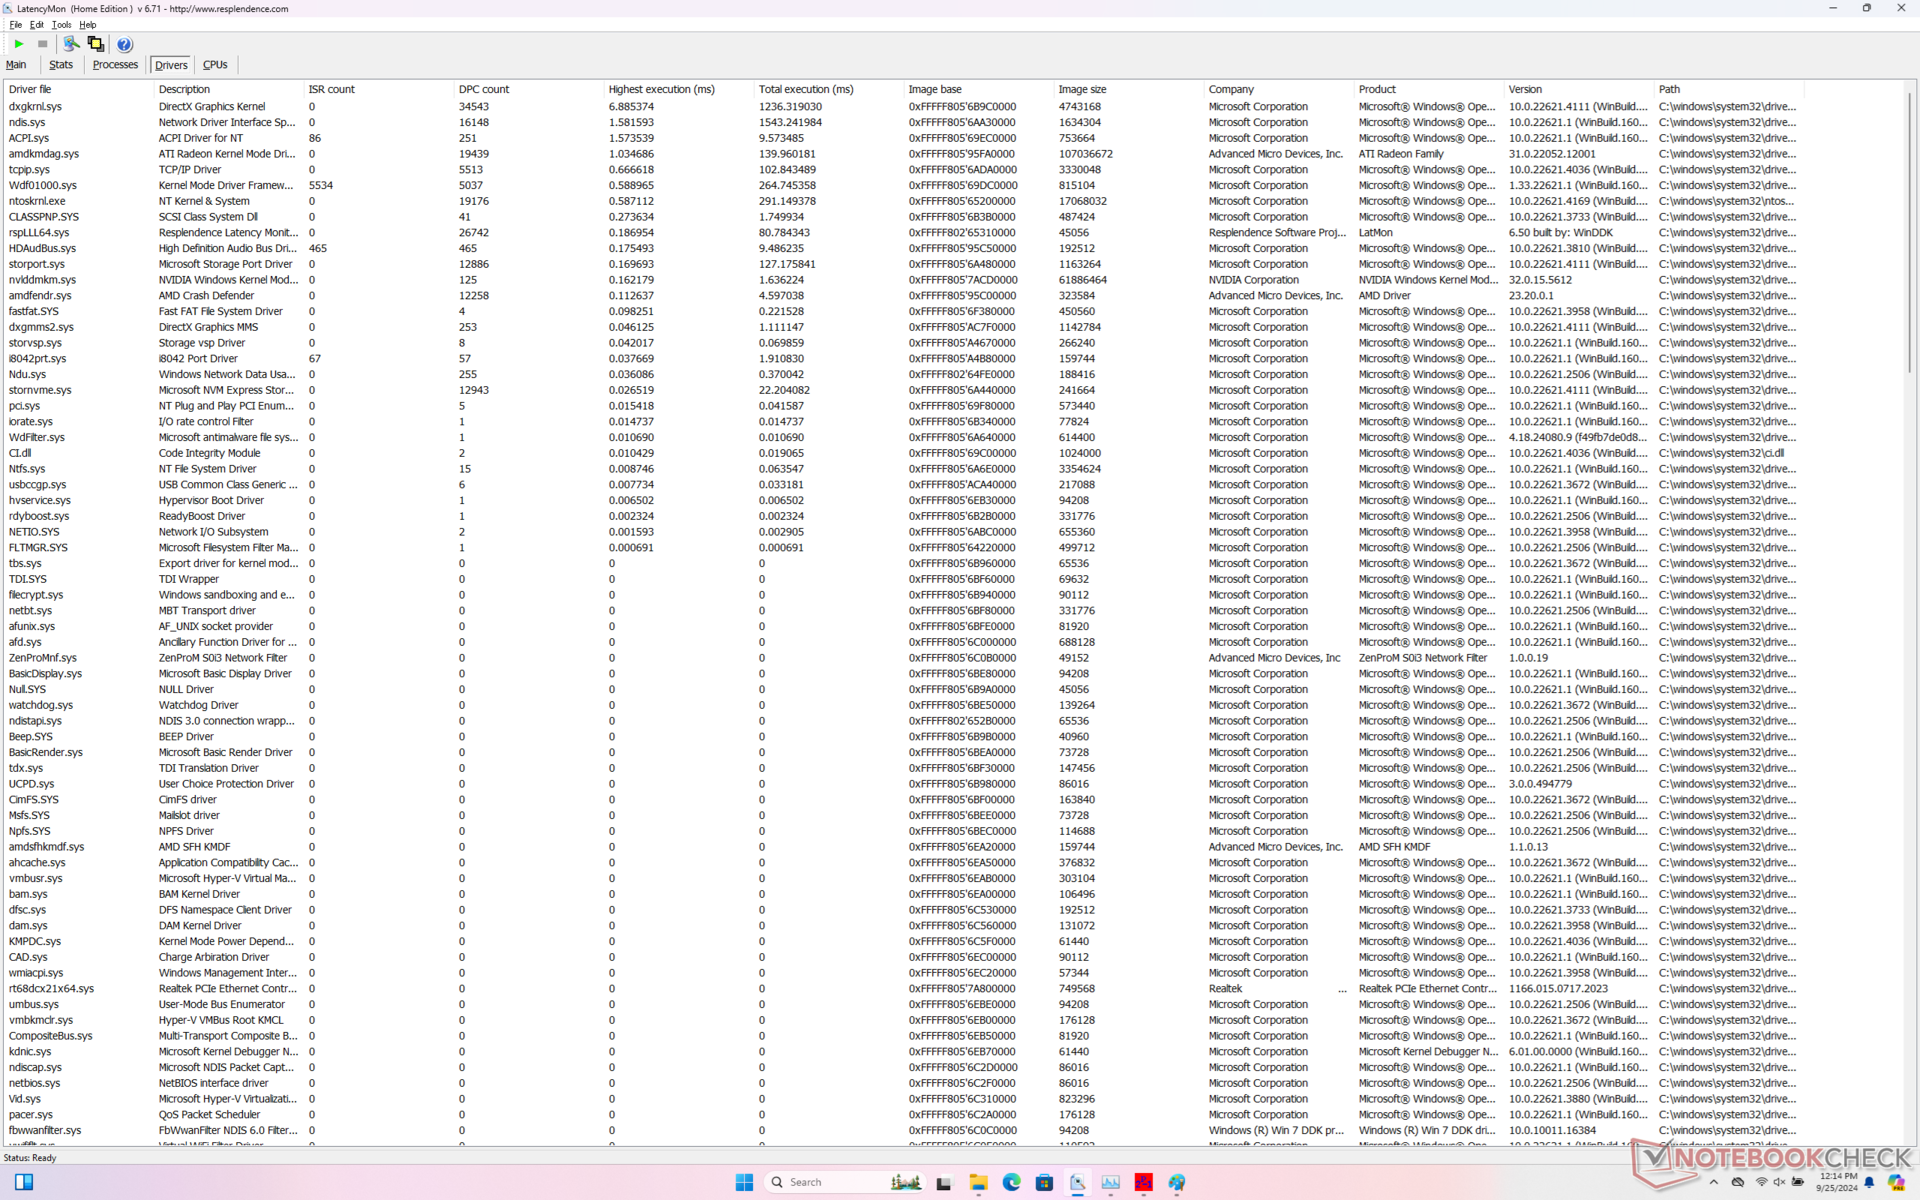
DPC Gecikme Süresi
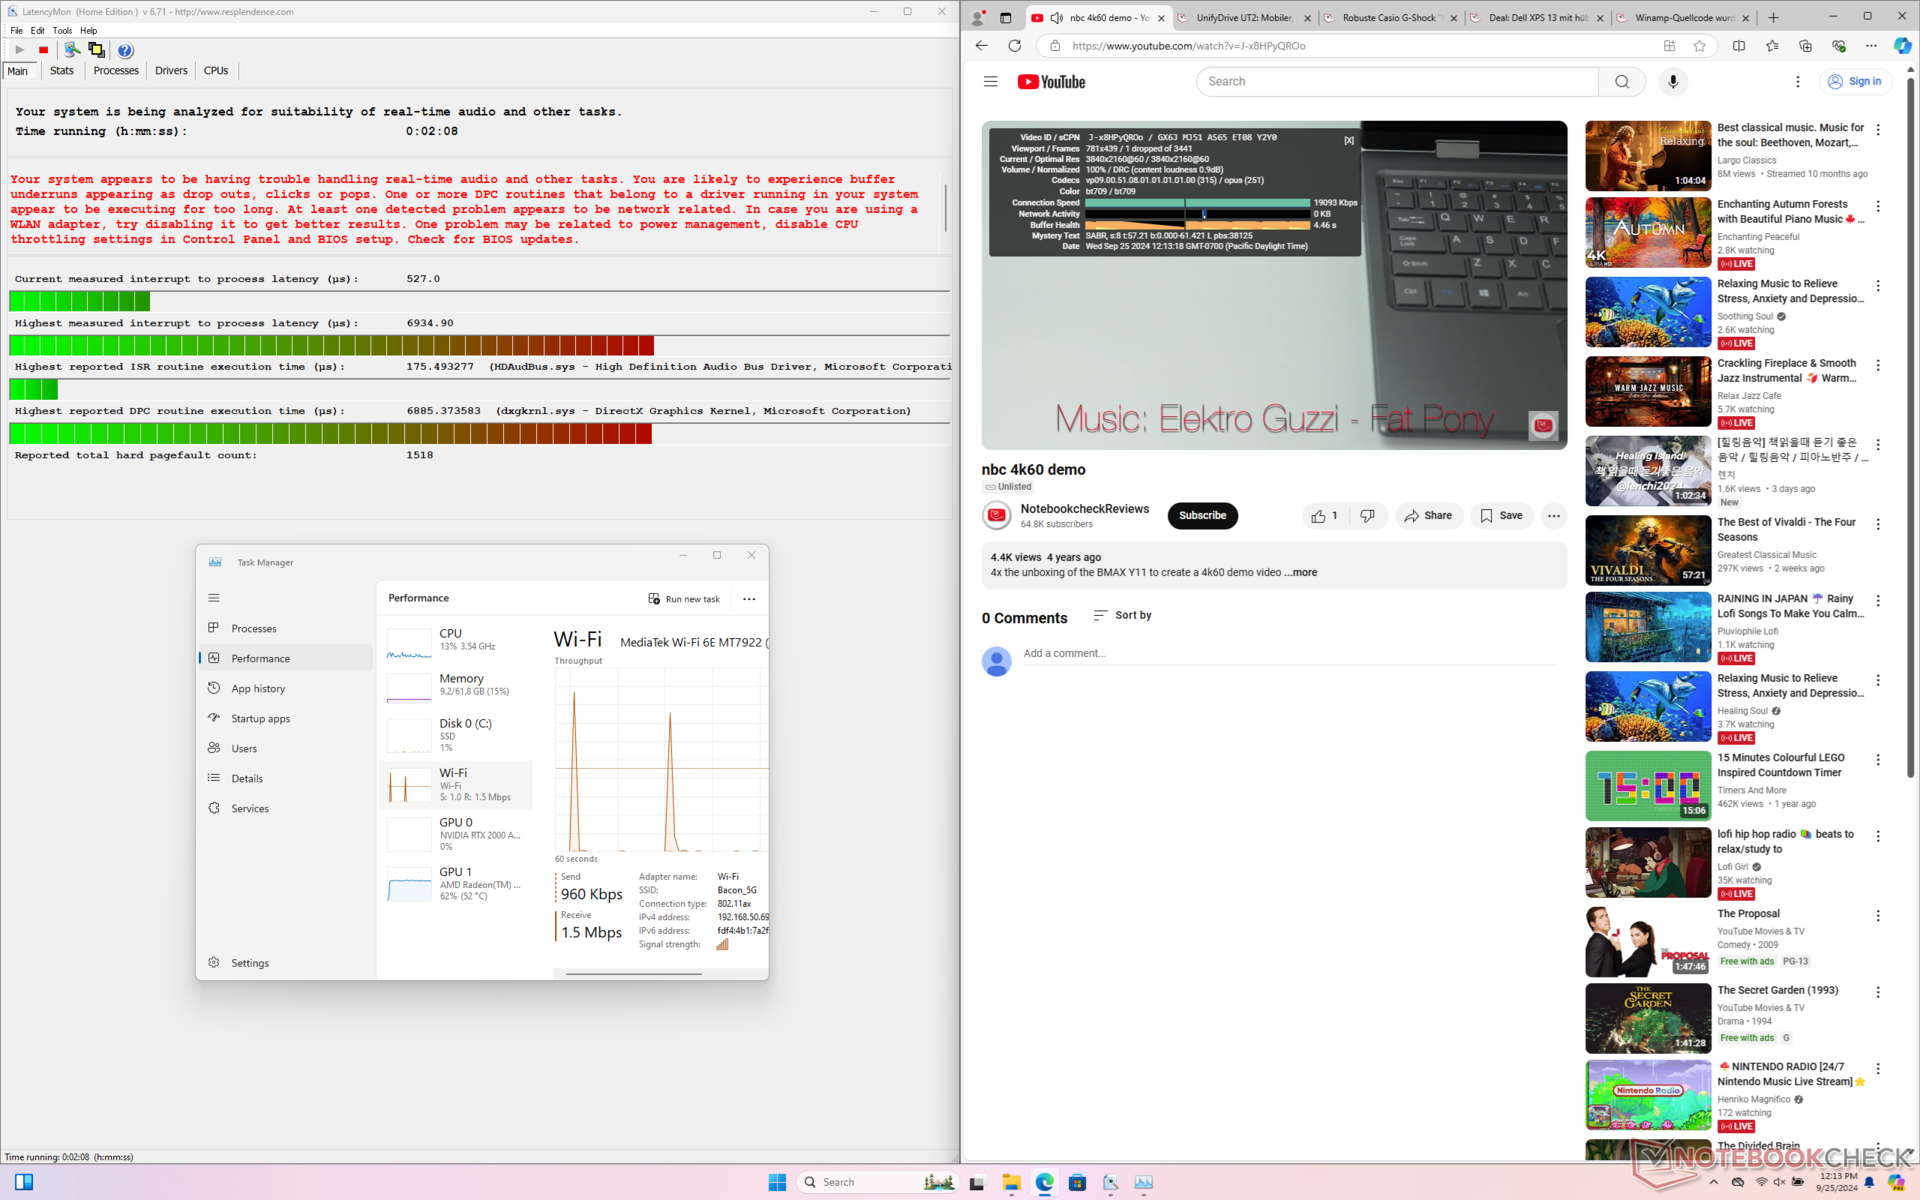
LatencyMon, birden fazla tekrar testten sonra bile HDAudBus.sys ile ilgili DPC sorunlarını ortaya çıkarıyor. 60 FPS'de 4K video oynatma, 60 saniyelik bir pencere boyunca kaydedilen tek bir düşen kare ile mükemmeldir.
| DPC Latencies / LatencyMon - interrupt to process latency (max), Web, Youtube, Prime95 | |
| HP ZBook Fury 16 G11 | |
| HP ZBook Power 16 G11 A | |
| HP ZBook Power 15 G10 | |
| Lenovo ThinkPad P1 Gen 7 21KV001SGE | |
| Lenovo ThinkPad P16s G2 21K9000CGE | |
| Dell Precision 5690 | |
* ... daha küçük daha iyidir
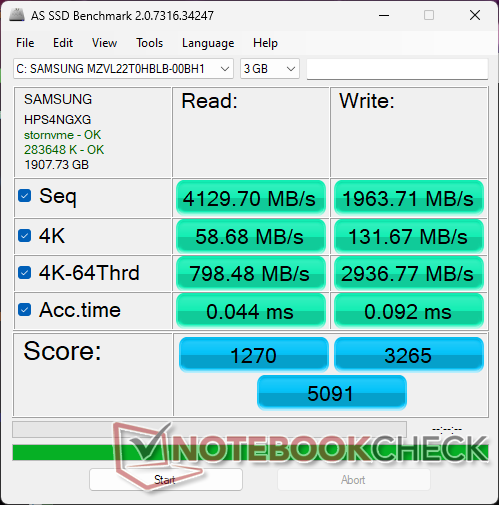
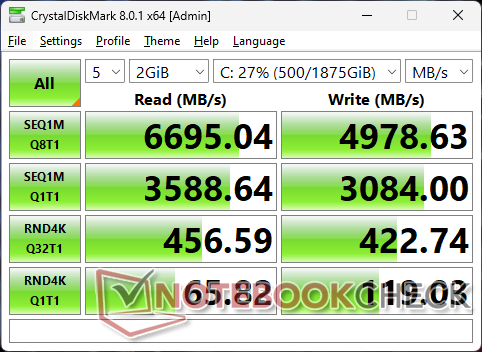
Depolama Cihazları
Test ünitemiz 2 TB'lık bir Samsung PM9A1 PCIe4 x4 NVMe SSD, 6700 MB/sn'ye kadar yüksek sıralı okuma hızlarına ulaşmıştır. Ne yazık ki sürücü, aşağıdaki DiskSpd döngü testi sonuçlarımızda gösterildiği gibi sadece birkaç dakikalık stresin ardından hızla düşük 2000 MB/s aralığına düşüyordu. Testi tekrarladık ve sonuçlarda bir iyileşme olmadı. Eski ZBook Power 15 G10'daki WD sürücüsü herhangi bir yavaşlama sorunu sergilemediği için bu hayal kırıklığı yarattı. Bir ısı dağıtıcı muhtemelen performans artırabilirdi.

| Drive Performance Rating - Percent | |
| HP ZBook Fury 16 G11 | |
| Dell Precision 5690 | |
| Lenovo ThinkPad P16s G2 21K9000CGE | |
| HP ZBook Power 15 G10 | |
| HP ZBook Power 16 G11 A | |
| Lenovo ThinkPad P1 Gen 7 21KV001SGE | |
* ... daha küçük daha iyidir
Disk Throttling: DiskSpd Read Loop, Queue Depth 8
GPU Performansı
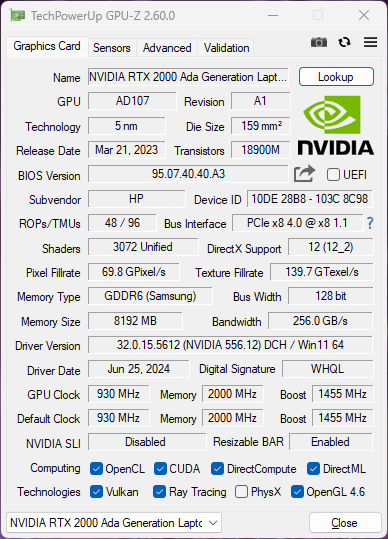
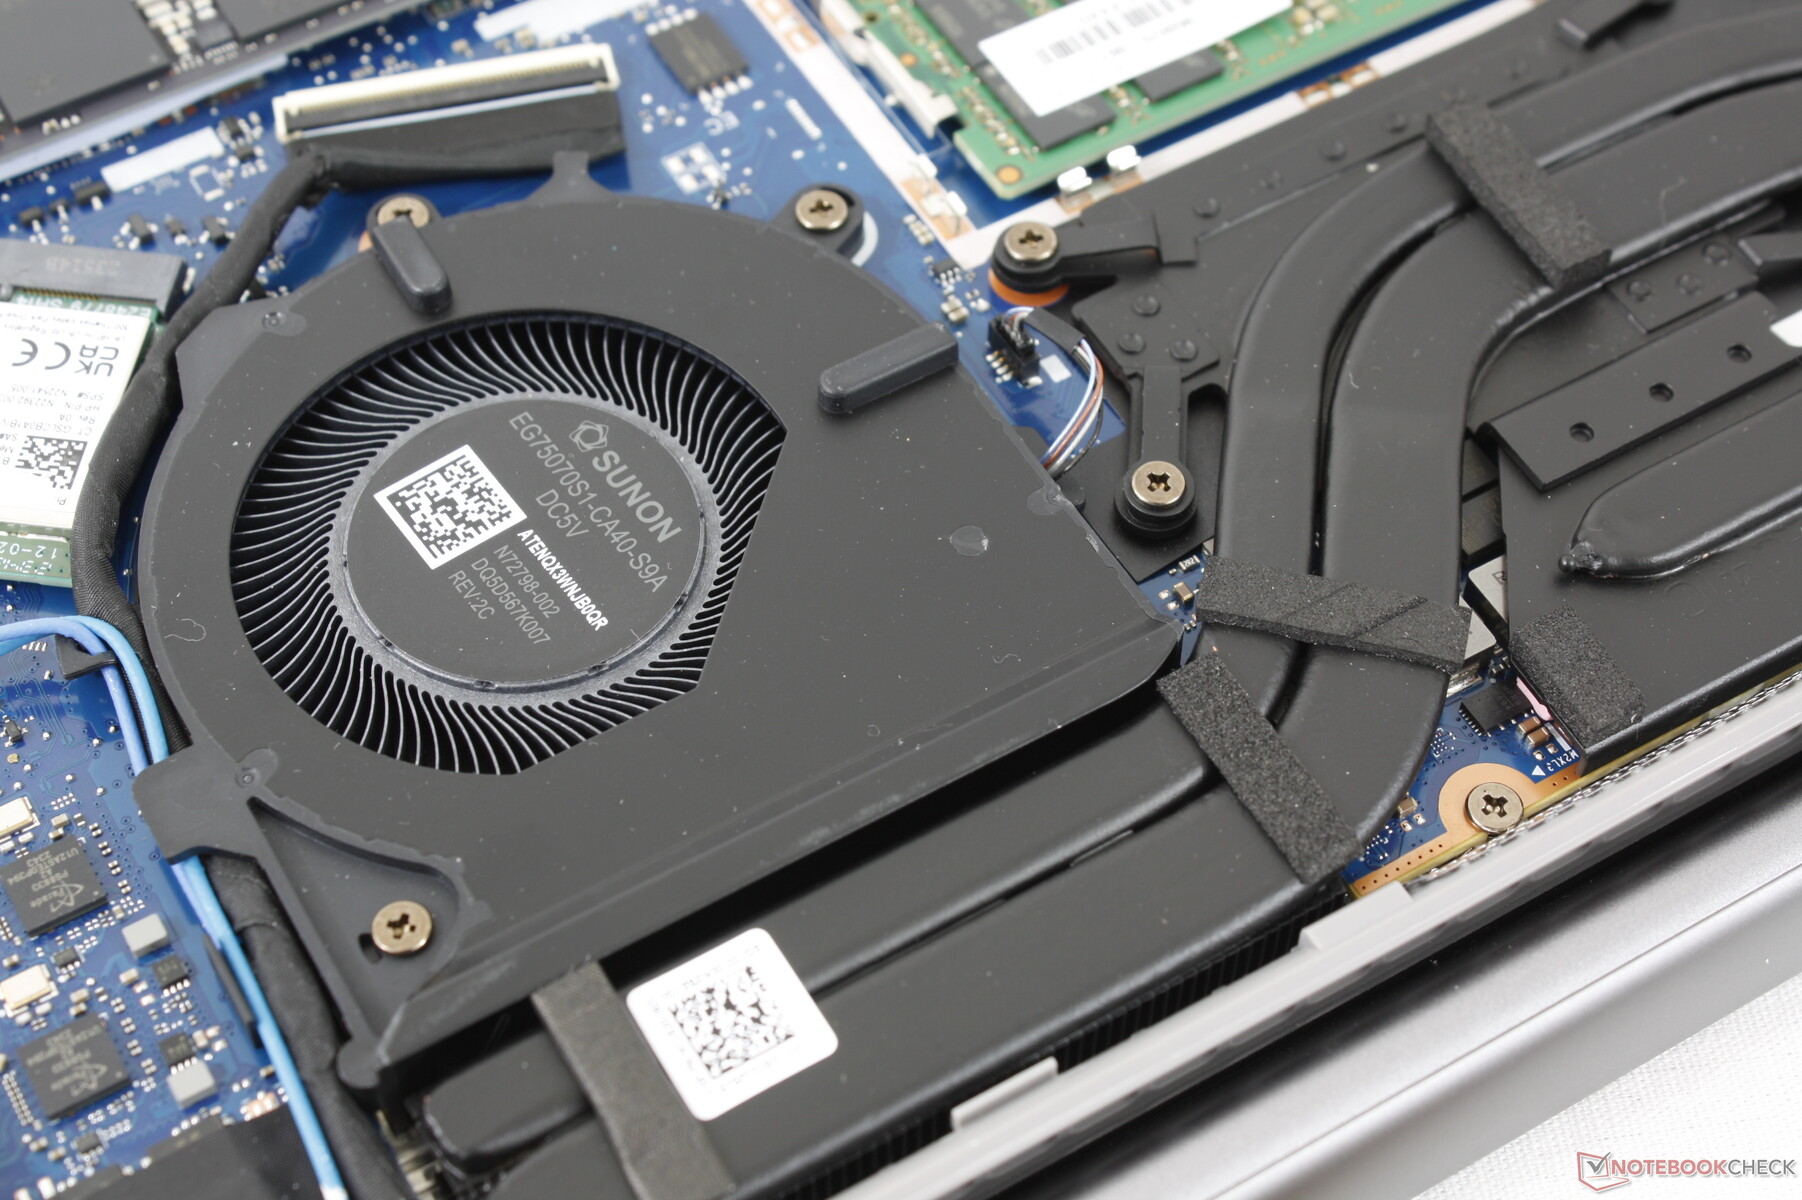
Nvidia henüz mobil Ada Lovelace serisinin halefini piyasaya sürmediği için ayrık GPU seçenekleri 15 inç ZBook Power 15 G10 ile aynı kalıyor. Ayrıca, 16 inç form faktörüne geçiş sırasında soğutma çözümü büyük ölçüde geliştirilmemiştir, yani ZBook Power 16 G11 hala aynı 50 W TGP tavan ve RTX 1000 Ada, RTX 2000 Adave RTX 3000 Ada grafik seçenekleri eskisi gibi. Kullanıcıların daha üst düzey RTX Ada seçenekleri için daha kalın ZBook Fury 16 serisini düşünmeleri gerekecek.
RTX 3000 Ada'ya yükseltme, ZBook Fury 16 ile olan deneyimlerimize dayanarak en iyi ihtimalle marjinal performans artışlarını getiriyor Dell Precision 5490.
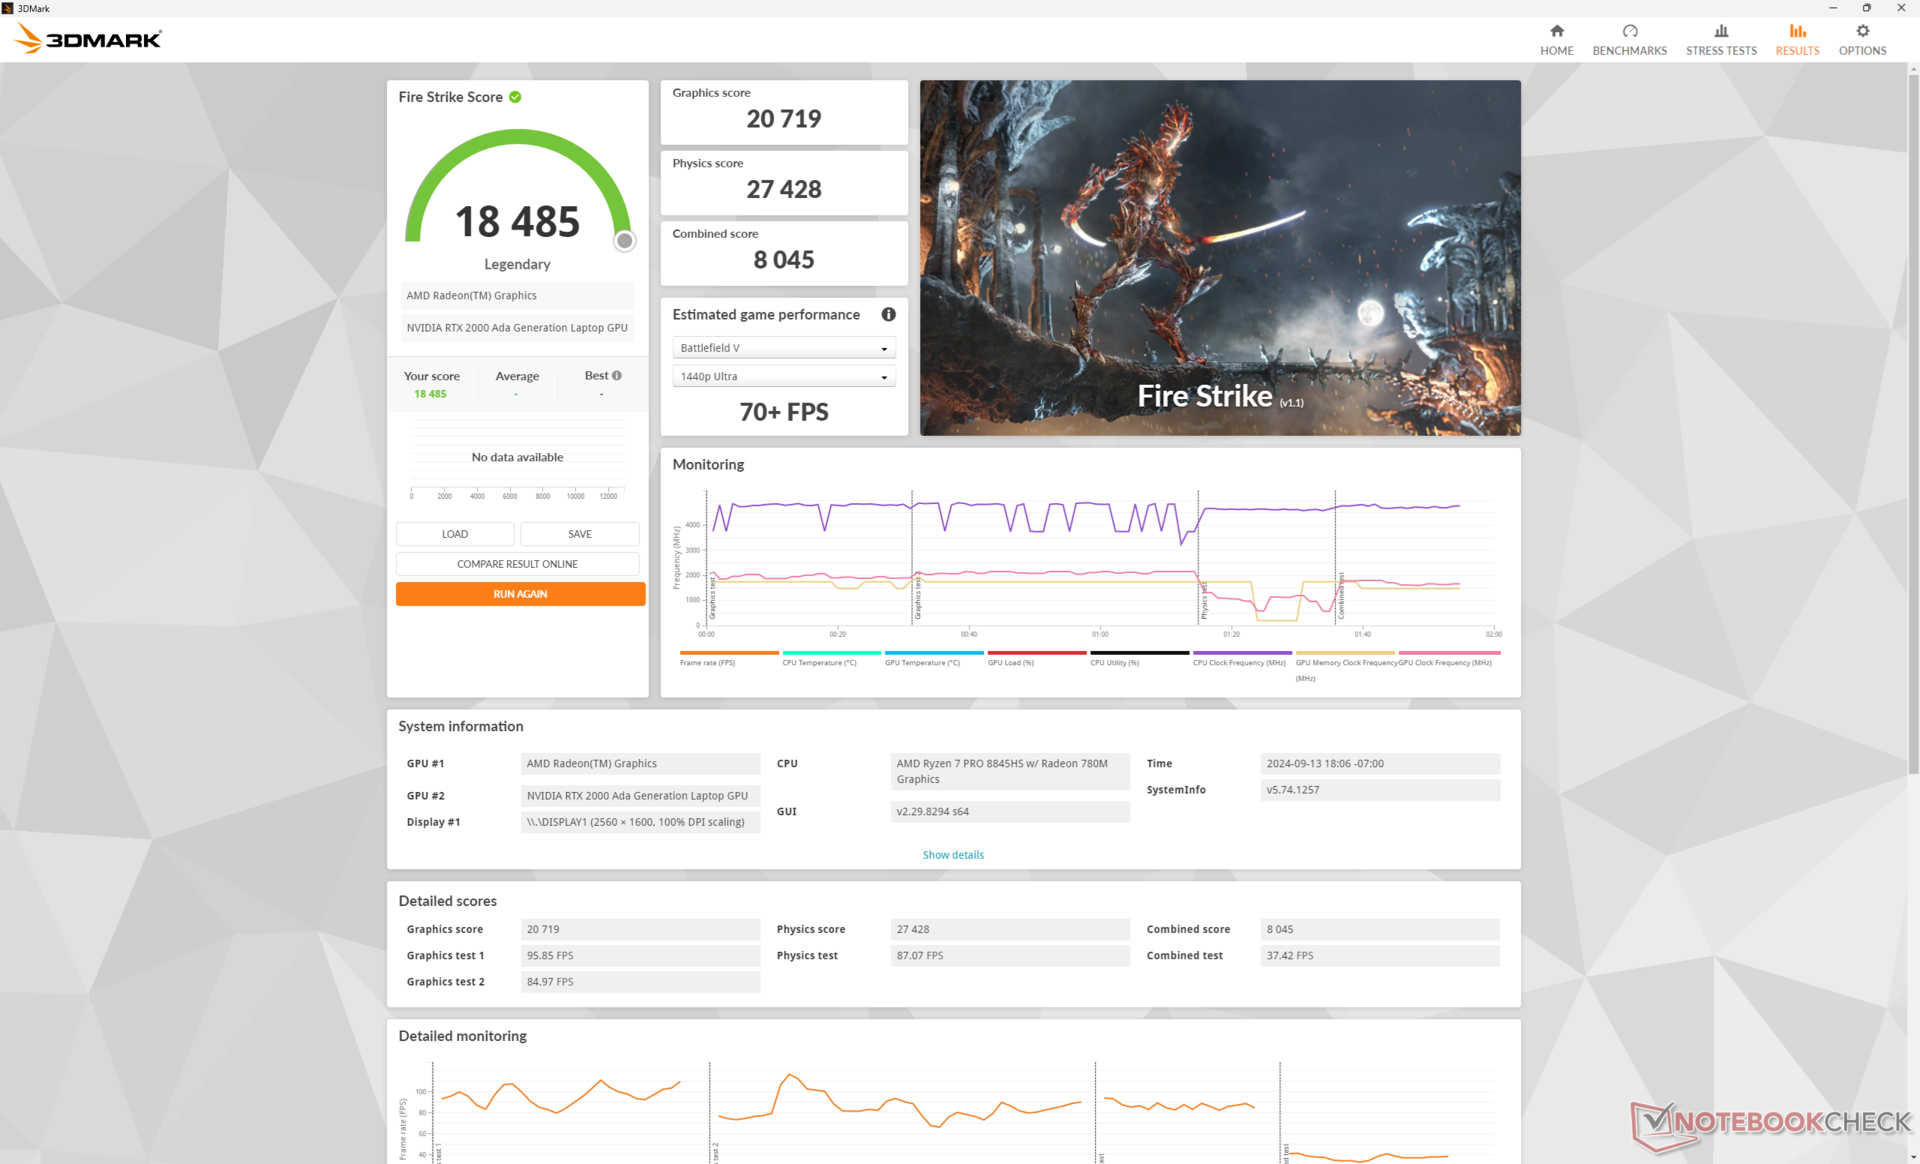
| Güç Profili | Grafik Puanı | Fizik Puanı | Birleşik Puan |
| Performans modu | 20719 | 27428 | 8045 |
| Dengeli mod | 19961 (-4%) | 26363 (-4%) | 7633 (-5%) |
| Pil gücü | 8108 (-61%) | 6149 (-78%) | 1727 (-79%) |
Performans modu yerine Dengeli modda çalıştırmak, yukarıdaki Fire Strike sonuç tablomuzda gösterildiği gibi performansı biraz etkiler. Ancak, pillerle çalıştırıldığında hem CPU hem de GPU performansı önemli ölçüde azalır.
| 3DMark Performance Rating - Percent | |
| Dell Precision 5690 -3! | |
| HP ZBook Fury 16 G11 | |
| HP ZBook Fury 16 G9 -3! | |
| HP ZBook Power 16 G11 A | |
| Ortalama NVIDIA RTX 2000 Ada Generation Laptop GPU | |
| Dell Precision 5000 5490 -3! | |
| MSI CreatorPro Z16P B12UKST -19! | |
| HP ZBook Power 15 G10 -11! | |
| Asus ExpertBook B6 Flip B6602FC2 -19! | |
| Lenovo ThinkPad P16v G1 AMD -18! | |
| Lenovo ThinkPad P1 G4-20Y4Z9DVUS -19! | |
| Lenovo ThinkPad P16s G2 21K9000CGE -19! | |
| HP ZBook Firefly 16 G9-6B897EA -19! | |
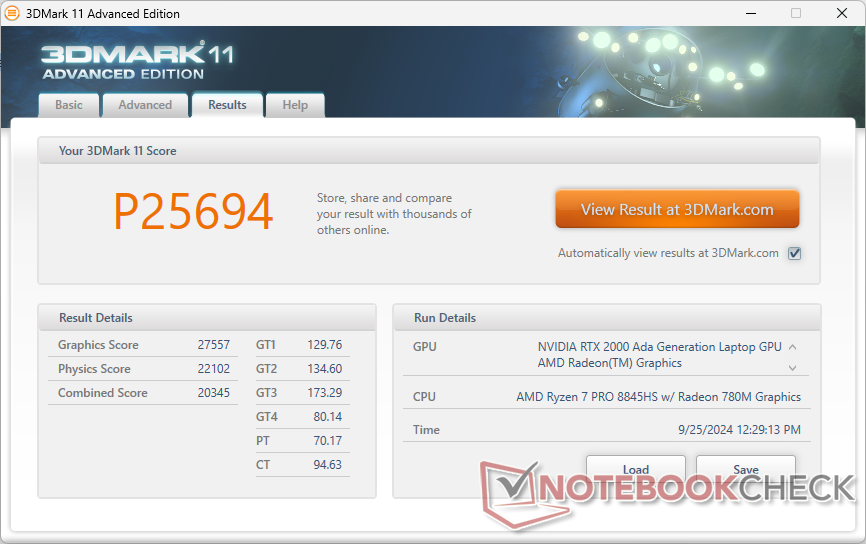
| 3DMark 11 - 1280x720 Performance GPU | |
| Dell Precision 5690 | |
| HP ZBook Fury 16 G11 | |
| HP ZBook Fury 16 G9 | |
| Ortalama NVIDIA RTX 2000 Ada Generation Laptop GPU (26968 - 33001, n=4) | |
| Dell Precision 5000 5490 | |
| HP ZBook Power 16 G11 A | |
| HP ZBook Power 15 G10 | |
| MSI CreatorPro Z16P B12UKST | |
| Asus ExpertBook B6 Flip B6602FC2 | |
| Lenovo ThinkPad P16v G1 AMD | |
| Lenovo ThinkPad P1 G4-20Y4Z9DVUS | |
| Lenovo ThinkPad P16s G2 21K9000CGE | |
| HP ZBook Firefly 16 G9-6B897EA | |
| 3DMark 11 Performance | 25694 puan | |
| 3DMark Cloud Gate Standard Score | 51846 puan | |
| 3DMark Fire Strike Score | 18485 puan | |
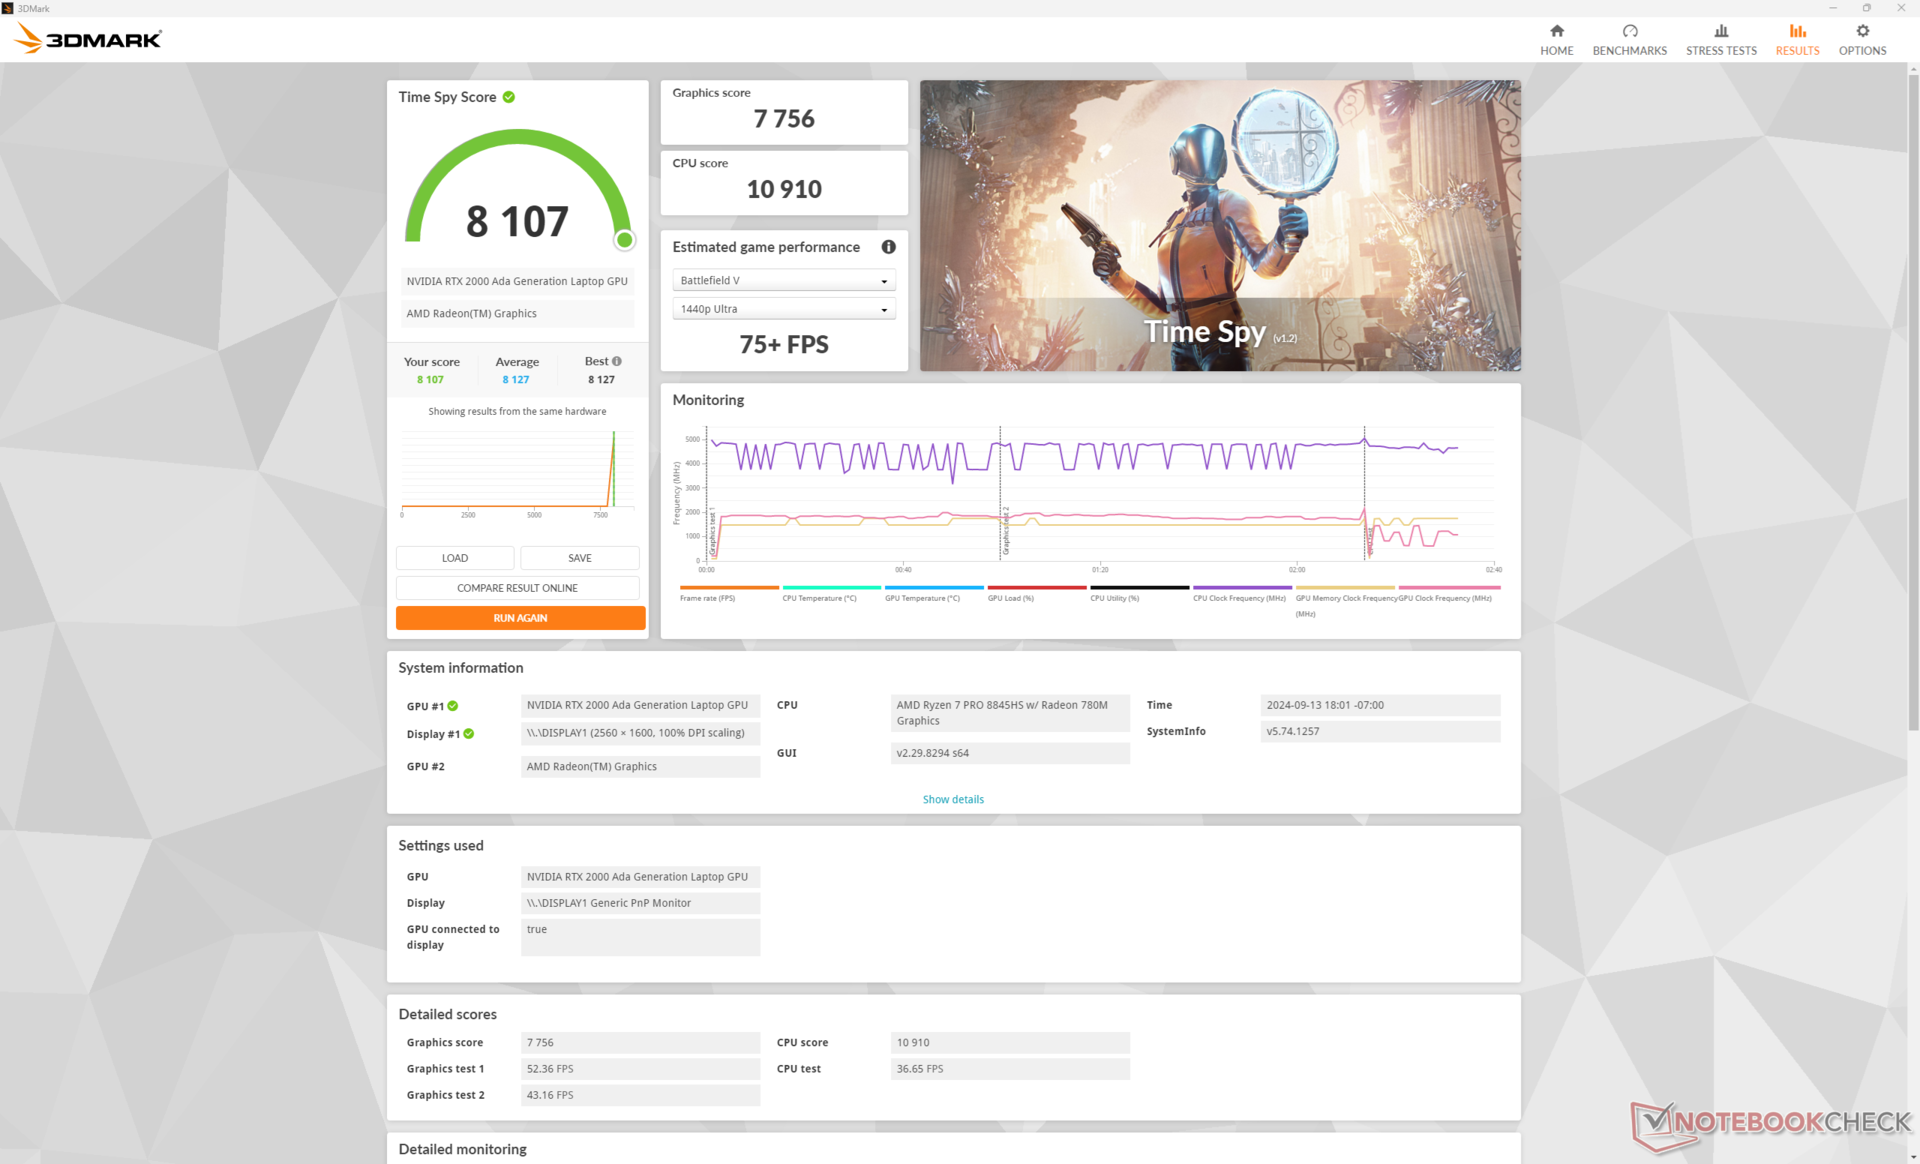
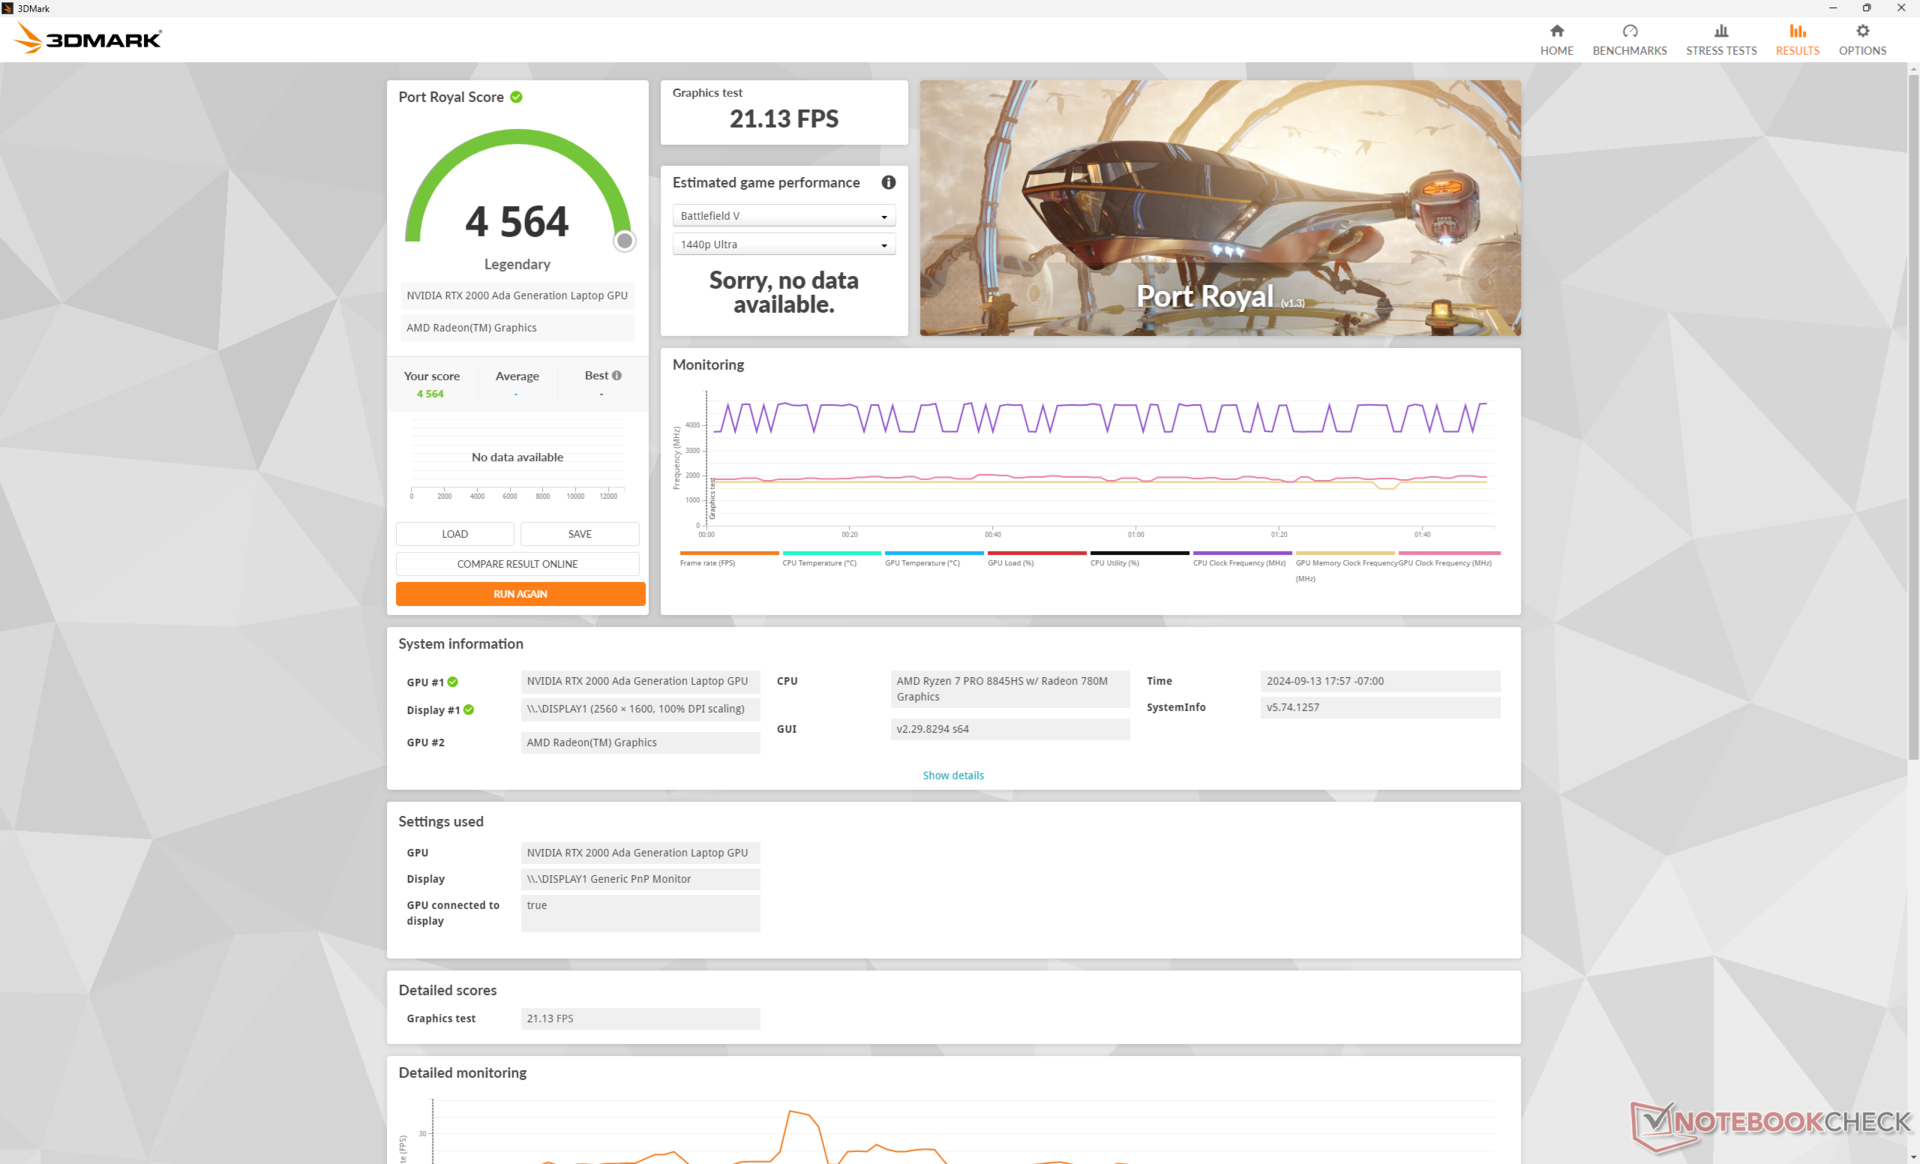
| 3DMark Time Spy Score | 8107 puan | |
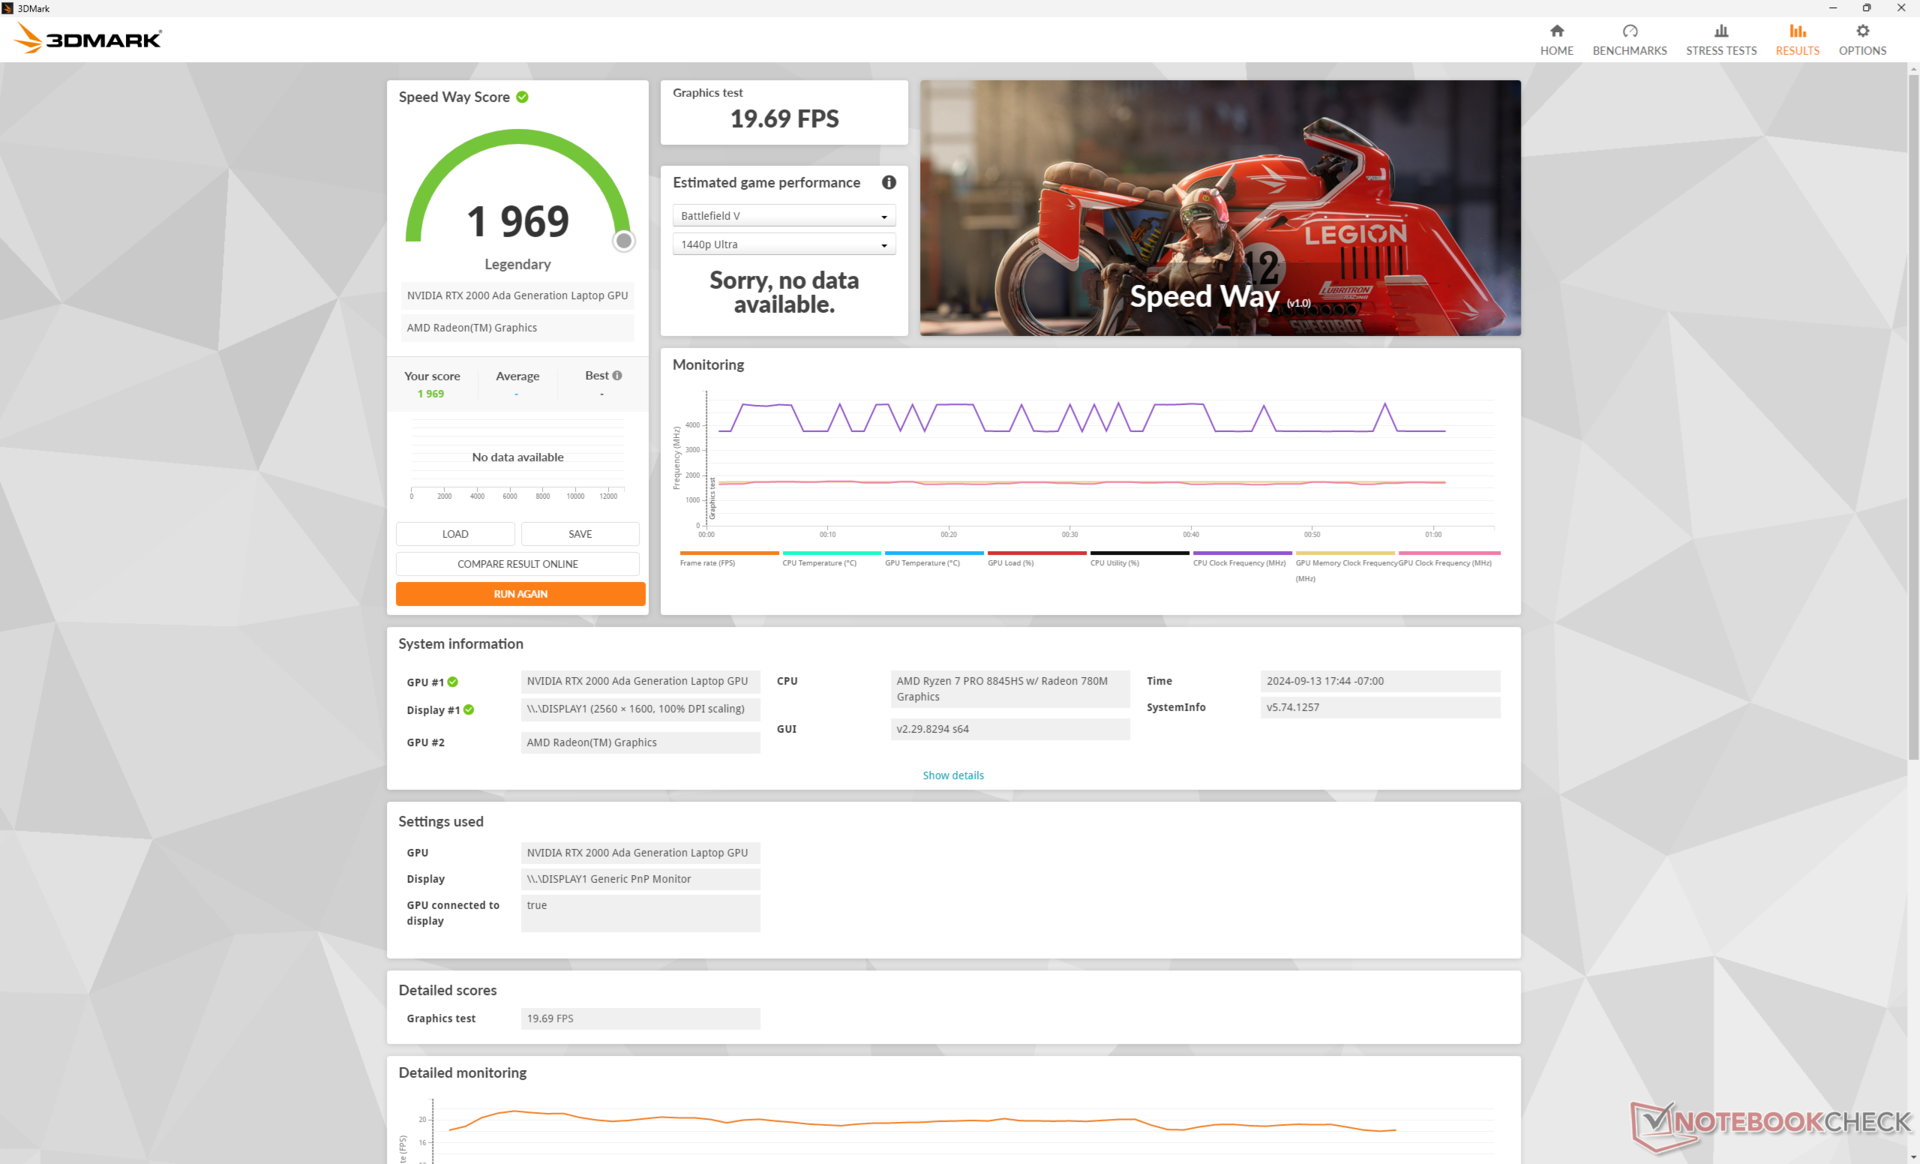
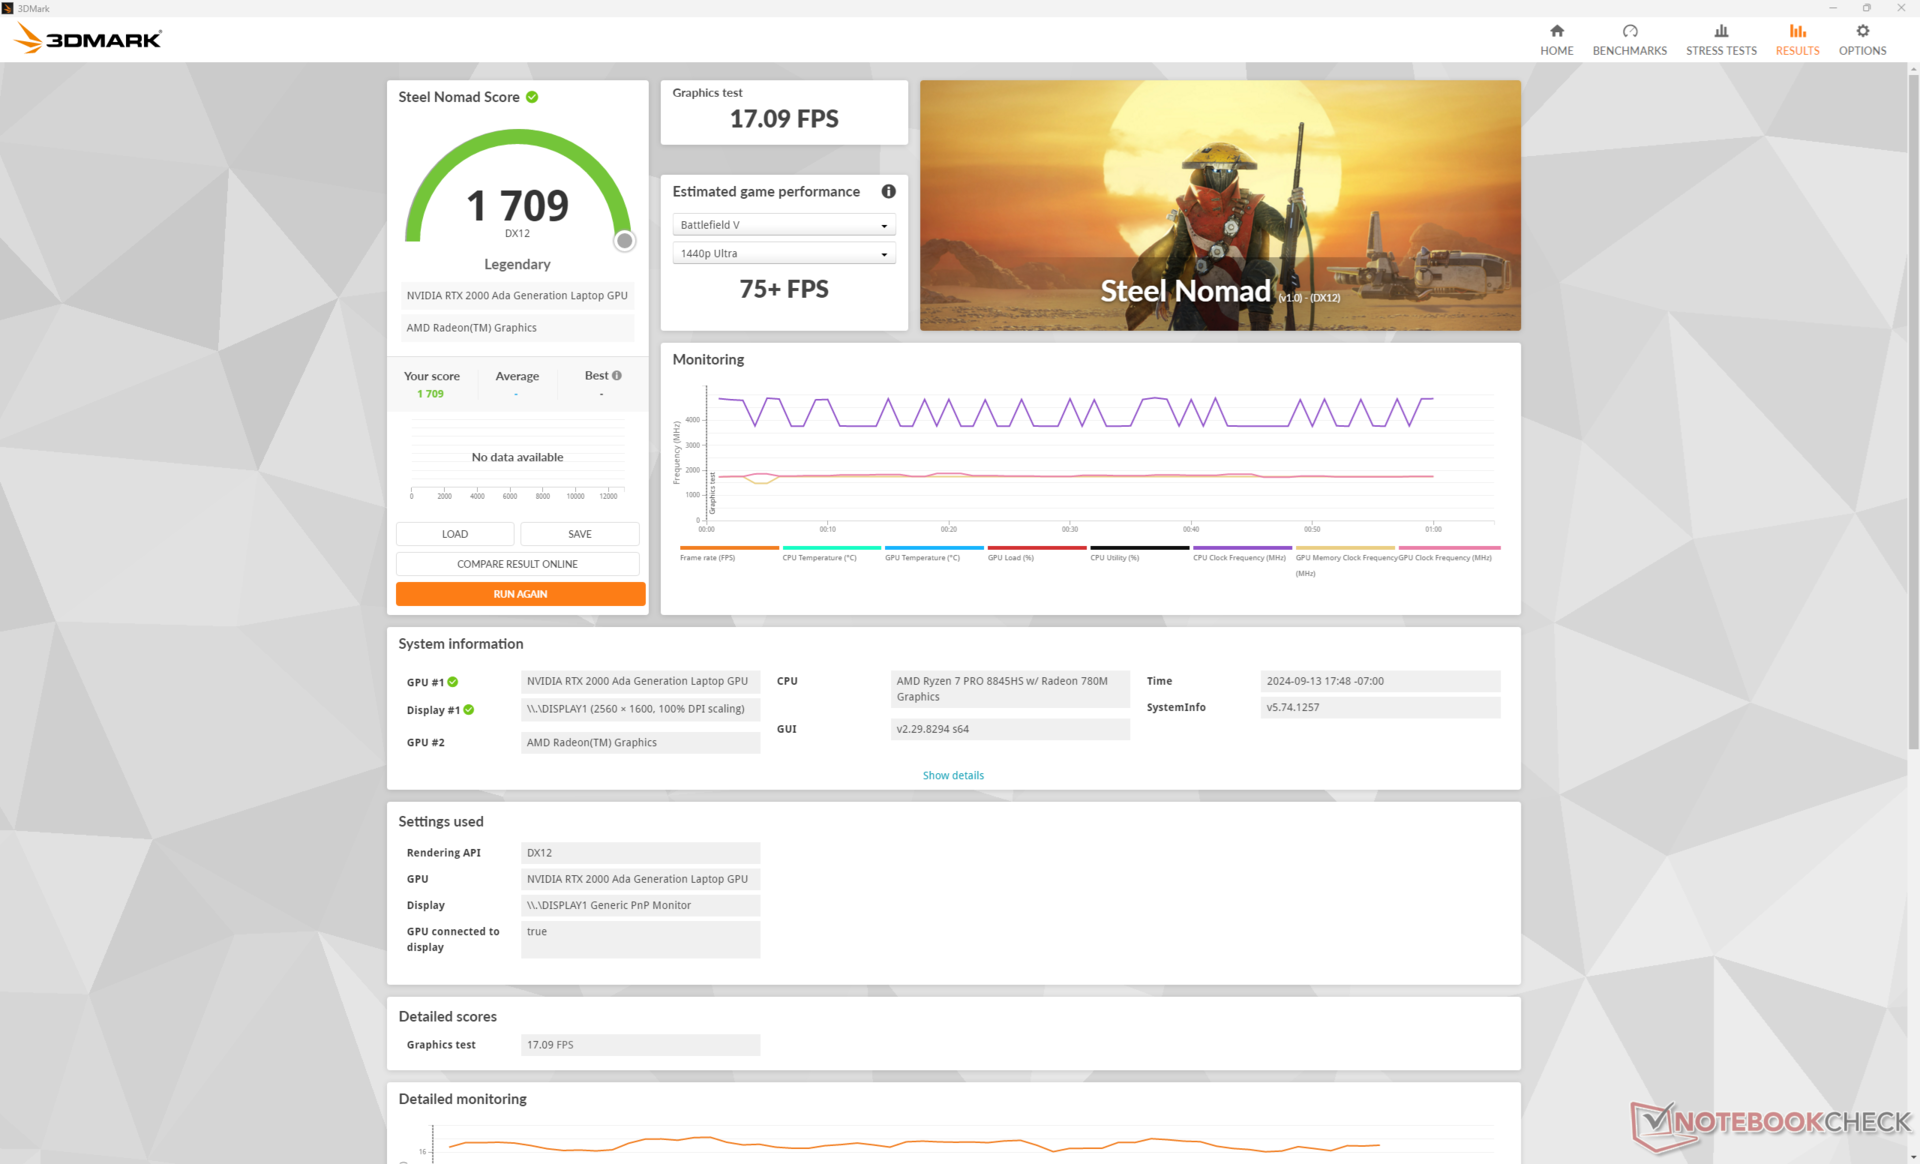
| 3DMark Steel Nomad Score | 1709 puan | |
Yardım | ||
| Blender | |
| v3.3 Classroom OPTIX/RTX | |
| HP ZBook Firefly 16 G9-6B897EA | |
| Lenovo ThinkPad P16v G1 AMD | |
| Asus ExpertBook B6 Flip B6602FC2 | |
| MSI CreatorPro Z16P B12UKST | |
| HP ZBook Power 16 G11 A | |
| Ortalama NVIDIA RTX 2000 Ada Generation Laptop GPU (25 - 31, n=4) | |
| Dell Precision 5000 5490 | |
| HP ZBook Fury 16 G9 | |
| HP ZBook Fury 16 G11 | |
| Dell Precision 5690 | |
| v3.3 Classroom CUDA | |
| HP ZBook Firefly 16 G9-6B897EA | |
| Lenovo ThinkPad P16v G1 AMD | |
| Asus ExpertBook B6 Flip B6602FC2 | |
| Ortalama NVIDIA RTX 2000 Ada Generation Laptop GPU (51 - 155, n=4) | |
| MSI CreatorPro Z16P B12UKST | |
| HP ZBook Power 16 G11 A | |
| Dell Precision 5000 5490 | |
| HP ZBook Fury 16 G9 | |
| HP ZBook Fury 16 G11 | |
| Dell Precision 5690 | |
| v3.3 Classroom CPU | |
| HP ZBook Firefly 16 G9-6B897EA | |
| Dell Precision 5690 | |
| Lenovo ThinkPad P16s G2 21K9000CGE | |
| Dell Precision 5000 5490 | |
| HP ZBook Power 16 G11 A | |
| MSI CreatorPro Z16P B12UKST | |
| Lenovo ThinkPad P16v G1 AMD | |
| Asus ExpertBook B6 Flip B6602FC2 | |
| Ortalama NVIDIA RTX 2000 Ada Generation Laptop GPU (291 - 347, n=4) | |
| HP ZBook Fury 16 G9 | |
| HP ZBook Fury 16 G11 | |
* ... daha küçük daha iyidir
Oyun Performansı
Oyun oynamak için optimize edilmemiş olsa da, RTX 2000 Ada en çok dizüstü bilgisayarlara benzer GeForce RTX 3060 veya RTX 4060.
| Performance Rating - Percent | |
| HP ZBook Fury 16 G11 | |
| Dell Precision 5690 -1! | |
| HP ZBook Fury 16 G9 -1! | |
| MSI CreatorPro Z16P B12UKST | |
| Asus ExpertBook B6 Flip B6602FC2 | |
| Dell Precision 5000 5490 -1! | |
| HP ZBook Power 16 G11 A | |
| HP ZBook Power 15 G10 | |
| Lenovo ThinkPad P1 G4-20Y4Z9DVUS -3! | |
| Lenovo ThinkPad P16v G1 AMD | |
| HP ZBook Firefly 16 G9-6B897EA | |
| Lenovo ThinkPad P16s G2 21K9000CGE | |
| GTA V - 1920x1080 Highest Settings possible AA:4xMSAA + FX AF:16x | |
| HP ZBook Fury 16 G9 | |
| HP ZBook Fury 16 G11 | |
| MSI CreatorPro Z16P B12UKST | |
| HP ZBook Power 16 G11 A | |
| HP ZBook Power 15 G10 | |
| Asus ExpertBook B6 Flip B6602FC2 | |
| Lenovo ThinkPad P16v G1 AMD | |
| HP ZBook Firefly 16 G9-6B897EA | |
| Lenovo ThinkPad P16s G2 21K9000CGE | |
| Final Fantasy XV Benchmark - 1920x1080 High Quality | |
| Dell Precision 5690 | |
| HP ZBook Fury 16 G11 | |
| HP ZBook Fury 16 G9 | |
| Dell Precision 5000 5490 | |
| HP ZBook Power 15 G10 | |
| HP ZBook Power 16 G11 A | |
| MSI CreatorPro Z16P B12UKST | |
| Asus ExpertBook B6 Flip B6602FC2 | |
| Lenovo ThinkPad P16v G1 AMD | |
| Lenovo ThinkPad P1 G4-20Y4Z9DVUS | |
| Lenovo ThinkPad P16s G2 21K9000CGE | |
| HP ZBook Firefly 16 G9-6B897EA | |
| Strange Brigade - 1920x1080 ultra AA:ultra AF:16 | |
| Dell Precision 5690 | |
| HP ZBook Fury 16 G11 | |
| HP ZBook Fury 16 G9 | |
| HP ZBook Power 16 G11 A | |
| HP ZBook Power 15 G10 | |
| Dell Precision 5000 5490 | |
| Asus ExpertBook B6 Flip B6602FC2 | |
| MSI CreatorPro Z16P B12UKST | |
| Lenovo ThinkPad P16v G1 AMD | |
| Lenovo ThinkPad P16s G2 21K9000CGE | |
| HP ZBook Firefly 16 G9-6B897EA | |
| Dota 2 Reborn - 1920x1080 ultra (3/3) best looking | |
| HP ZBook Fury 16 G11 | |
| HP ZBook Fury 16 G9 | |
| MSI CreatorPro Z16P B12UKST | |
| Asus ExpertBook B6 Flip B6602FC2 | |
| Dell Precision 5690 | |
| HP ZBook Power 15 G10 | |
| Dell Precision 5000 5490 | |
| HP ZBook Power 16 G11 A | |
| Lenovo ThinkPad P16v G1 AMD | |
| Lenovo ThinkPad P1 G4-20Y4Z9DVUS | |
| HP ZBook Firefly 16 G9-6B897EA | |
| Lenovo ThinkPad P16s G2 21K9000CGE | |
| X-Plane 11.11 - 1920x1080 high (fps_test=3) | |
| HP ZBook Fury 16 G11 | |
| Asus ExpertBook B6 Flip B6602FC2 | |
| HP ZBook Fury 16 G9 | |
| MSI CreatorPro Z16P B12UKST | |
| Dell Precision 5690 | |
| Dell Precision 5000 5490 | |
| Lenovo ThinkPad P1 G4-20Y4Z9DVUS | |
| Lenovo ThinkPad P16v G1 AMD | |
| HP ZBook Power 16 G11 A | |
| HP ZBook Firefly 16 G9-6B897EA | |
| HP ZBook Power 15 G10 | |
| Lenovo ThinkPad P16s G2 21K9000CGE | |
| Lenovo ThinkPad P16s G2 21K9000CGE | |
| Far Cry 5 - 1920x1080 Ultra Preset AA:T | |
| HP ZBook Fury 16 G11 | |
| Dell Precision 5690 | |
| MSI CreatorPro Z16P B12UKST | |
| HP ZBook Power 16 G11 A | |
| Asus ExpertBook B6 Flip B6602FC2 | |
| Dell Precision 5000 5490 | |
| HP ZBook Power 15 G10 | |
| Lenovo ThinkPad P16v G1 AMD | |
| Lenovo ThinkPad P16s G2 21K9000CGE | |
| HP ZBook Firefly 16 G9-6B897EA | |
| X-Plane 11.11 | |
| 1920x1080 med (fps_test=2) | |
| HP ZBook Fury 16 G11 | |
| Asus ExpertBook B6 Flip B6602FC2 | |
| HP ZBook Fury 16 G9 | |
| MSI CreatorPro Z16P B12UKST | |
| Dell Precision 5690 | |
| Ortalama NVIDIA RTX 2000 Ada Generation Laptop GPU (72.1 - 133.5, n=4) | |
| Dell Precision 5000 5490 | |
| Lenovo ThinkPad P1 G4-20Y4Z9DVUS | |
| Lenovo ThinkPad P16v G1 AMD | |
| HP ZBook Power 15 G10 | |
| HP ZBook Power 16 G11 A | |
| HP ZBook Firefly 16 G9-6B897EA | |
| Lenovo ThinkPad P16s G2 21K9000CGE | |
| Lenovo ThinkPad P16s G2 21K9000CGE | |
| 1920x1080 high (fps_test=3) | |
| HP ZBook Fury 16 G11 | |
| Asus ExpertBook B6 Flip B6602FC2 | |
| HP ZBook Fury 16 G9 | |
| MSI CreatorPro Z16P B12UKST | |
| Dell Precision 5690 | |
| Ortalama NVIDIA RTX 2000 Ada Generation Laptop GPU (52.5 - 108.9, n=4) | |
| Dell Precision 5000 5490 | |
| Lenovo ThinkPad P1 G4-20Y4Z9DVUS | |
| Lenovo ThinkPad P16v G1 AMD | |
| HP ZBook Power 16 G11 A | |
| HP ZBook Firefly 16 G9-6B897EA | |
| HP ZBook Power 15 G10 | |
| Lenovo ThinkPad P16s G2 21K9000CGE | |
| Lenovo ThinkPad P16s G2 21K9000CGE | |
Cyberpunk 2077 ultra FPS Chart
| düşük | orta | yüksek | ultra | QHD | |
|---|---|---|---|---|---|
| GTA V (2015) | 180.6 | 162.7 | 90.3 | 63.4 | |
| Dota 2 Reborn (2015) | 145.2 | 142 | 126.1 | 119.9 | |
| Final Fantasy XV Benchmark (2018) | 166.1 | 89.3 | 66.3 | 49.4 | |
| X-Plane 11.11 (2018) | 83.2 | 72.1 | 60.6 | ||
| Far Cry 5 (2018) | 138 | 111 | 104 | 98 | 67 |
| Strange Brigade (2018) | 329 | 187.8 | 158.1 | 138.5 | 99.5 |
| Tiny Tina's Wonderlands (2022) | 139.1 | 115.1 | 80 | 64.4 | 46.3 |
| F1 22 (2022) | 186.6 | 171.1 | 129.1 | 46.2 | 29.8 |
| Baldur's Gate 3 (2023) | 87.1 | 75.7 | 67.6 | 66.1 | 45.6 |
| Cyberpunk 2077 2.2 Phantom Liberty (2023) | 81.1 | 61.4 | 51.7 | 44.8 | 29.7 |
Emisyonlar
Sistem Gürültüsü
Fan gürültü seviyeleri ve davranışları geçen yılki modelde gözlemlediklerimize benzer. Sistem, 3DMark 06 'nın ilk benchmark sahnesini çalıştırdıktan sonra bile sadece 25,4 dB(A) ile sessiz kalıyor ve bu da rakip modellerden çok daha sessiz ThinkPad P16s G2 veya benzer koşullar altında Precision 5690.
Fan gürültüsünün Dengeli modda belirgin şekilde daha sessiz olduğunu unutmayın; Cyberpunk 2077 'yi Performans modunda çalıştırmak 43 dB(A) kadar yüksek olabilirken, Dengeli modda yalnızca 37,5 dB(A) olabilir.
Ses yüksekliği
| Boşta |
| 23.8 / 24.2 / 24.2 dB |
| Çalışırken |
| 25.4 / 45 dB |
 | ||
30 dB sessiz 40 dB(A) duyulabilirlik 50 dB(A) gürültülü |
||
min: | ||
| HP ZBook Power 16 G11 A NVIDIA RTX 2000 Ada Generation Laptop GPU, R7 8845HS, Samsung PM9A1 MZVL22T0HBLB | HP ZBook Power 15 G10 NVIDIA RTX 2000 Ada Generation Laptop GPU, R7 PRO 7840HS, WDC PC SN810 2TB | HP ZBook Fury 16 G11 NVIDIA RTX 3500 Ada Generation Laptop GPU, i9-14900HX, SK hynix PC801 HFS001TEJ9X101N | Lenovo ThinkPad P1 Gen 7 21KV001SGE NVIDIA GeForce RTX 4060 Laptop GPU, Ultra 7 155H, Kioxia XG8 KXG8AZNV1T02 | Lenovo ThinkPad P16s G2 21K9000CGE Radeon 780M, R7 PRO 7840U, SK hynix PC801 HFS001TEJ9X162N | Dell Precision 5690 NVIDIA RTX 5000 Ada Generation Laptop GPU, Ultra 9 185H, 2x Samsung PM9A1 1TB (RAID 0) | |
|---|---|---|---|---|---|---|
| Noise | -3% | -15% | -18% | -3% | -17% | |
| kapalı / ortam * | 23.5 | 24.2 -3% | 23.2 1% | 24.7 -5% | 22.6 4% | 23.4 -0% |
| Idle Minimum * | 23.8 | 24.4 -3% | 23.2 3% | 24.7 -4% | 22.6 5% | 23.6 1% |
| Idle Average * | 24.2 | 24.4 -1% | 23.2 4% | 24.7 -2% | 22.6 7% | 24.9 -3% |
| Idle Maximum * | 24.2 | 24.4 -1% | 29.5 -22% | 24.7 -2% | 22.6 7% | 30.9 -28% |
| Load Average * | 25.4 | 27.4 -8% | 43 -69% | 43.7 -72% | 37.8 -49% | 40.4 -59% |
| Cyberpunk 2077 ultra * | 43 | 48.2 -12% | 53.2 -24% | |||
| Load Maximum * | 45 | 46.8 -4% | 48.2 -7% | 53.3 -18% | 40.5 10% | 51.9 -15% |
| Witcher 3 ultra * | 43.3 | 40.3 | 48.3 |
* ... daha küçük daha iyidir
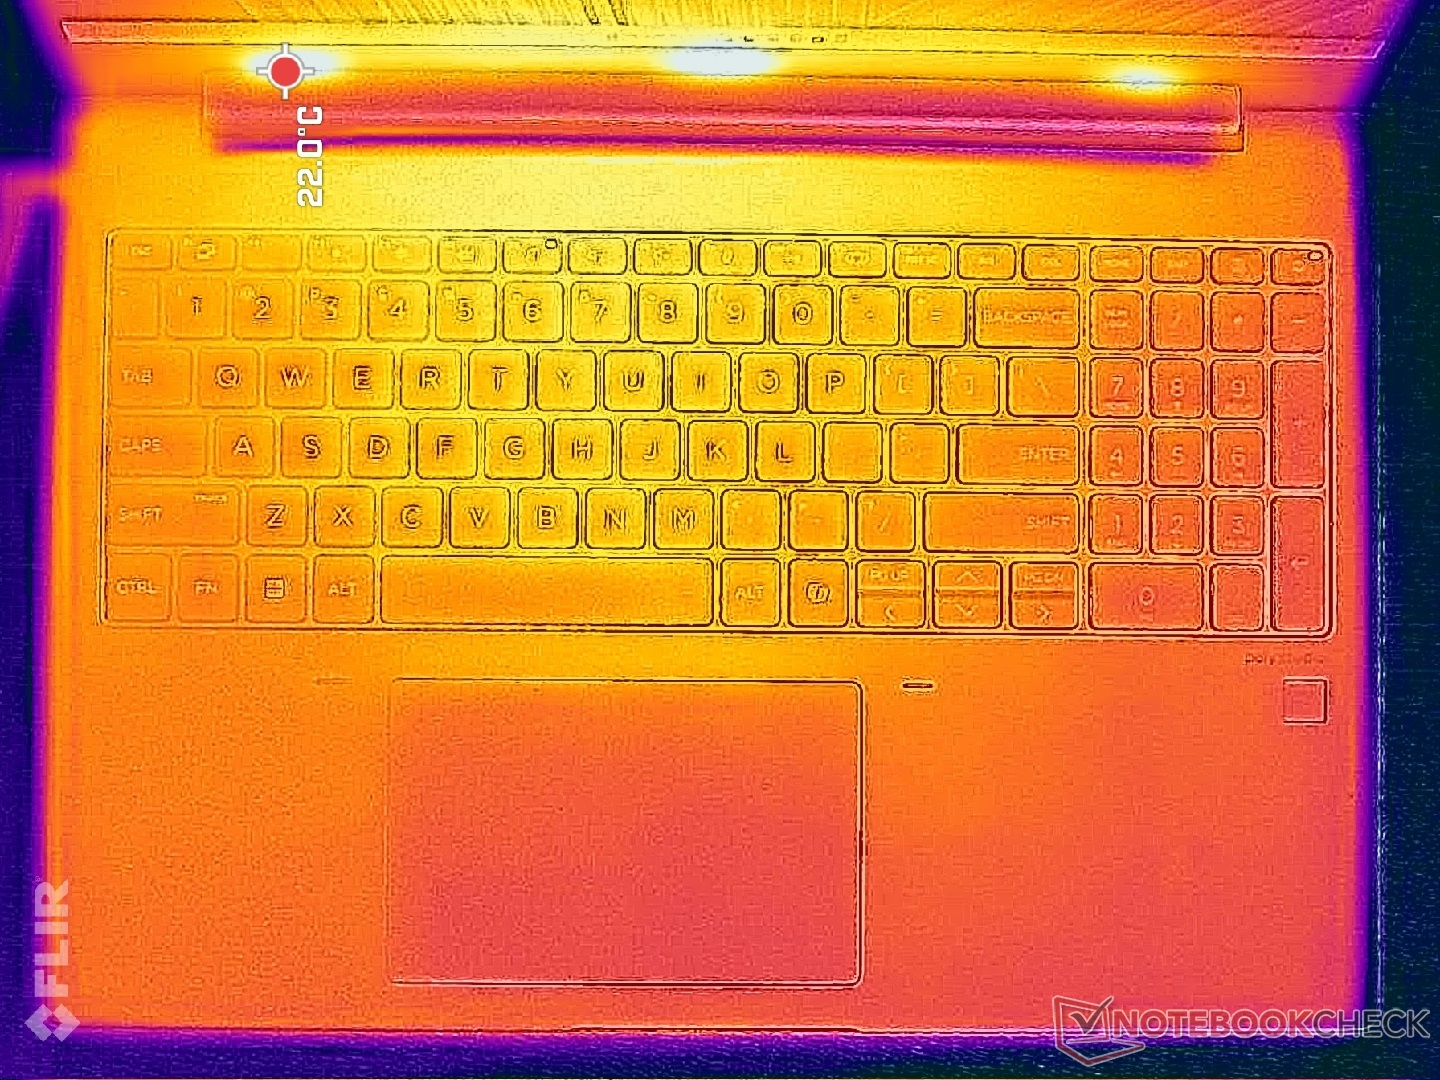
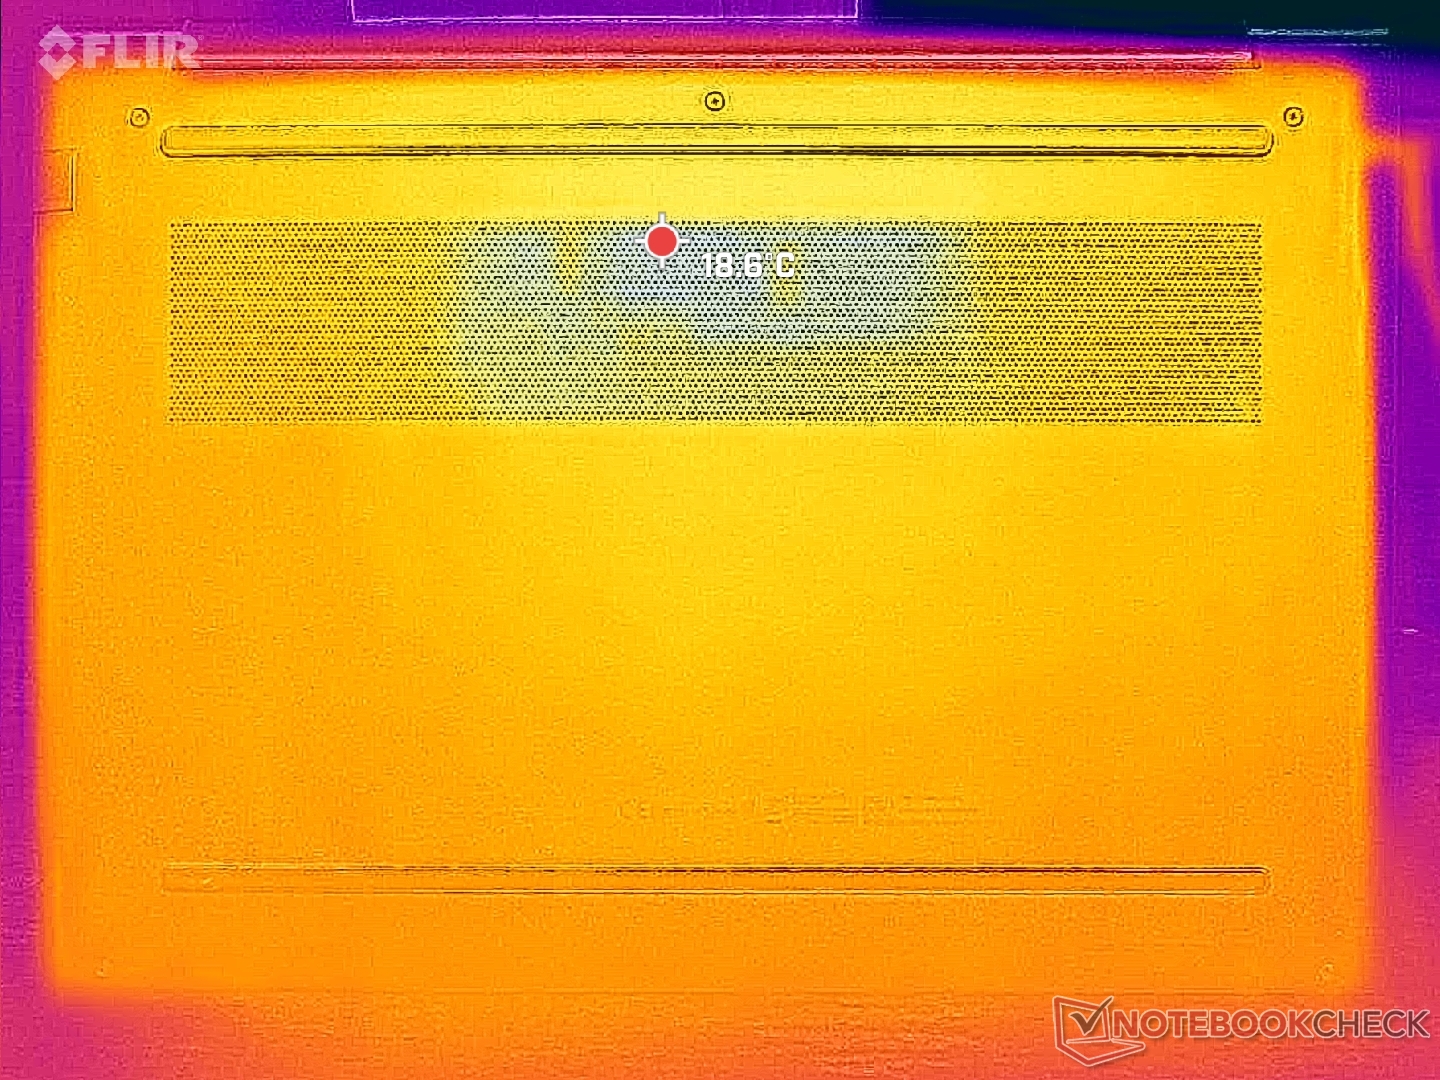
Sıcaklık
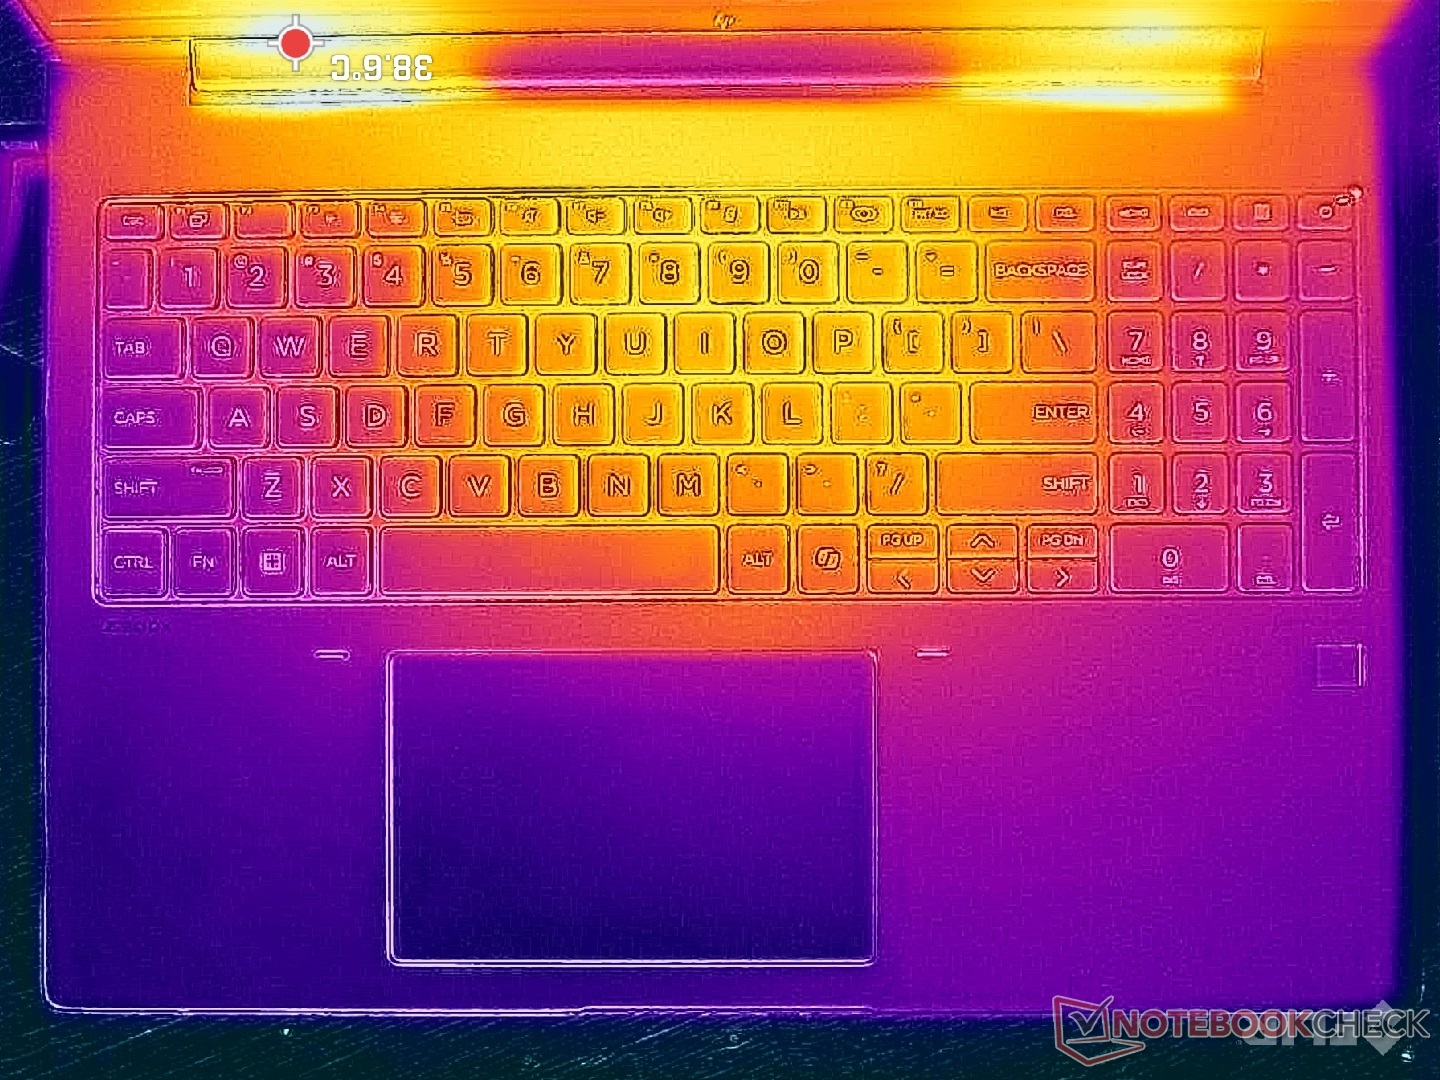
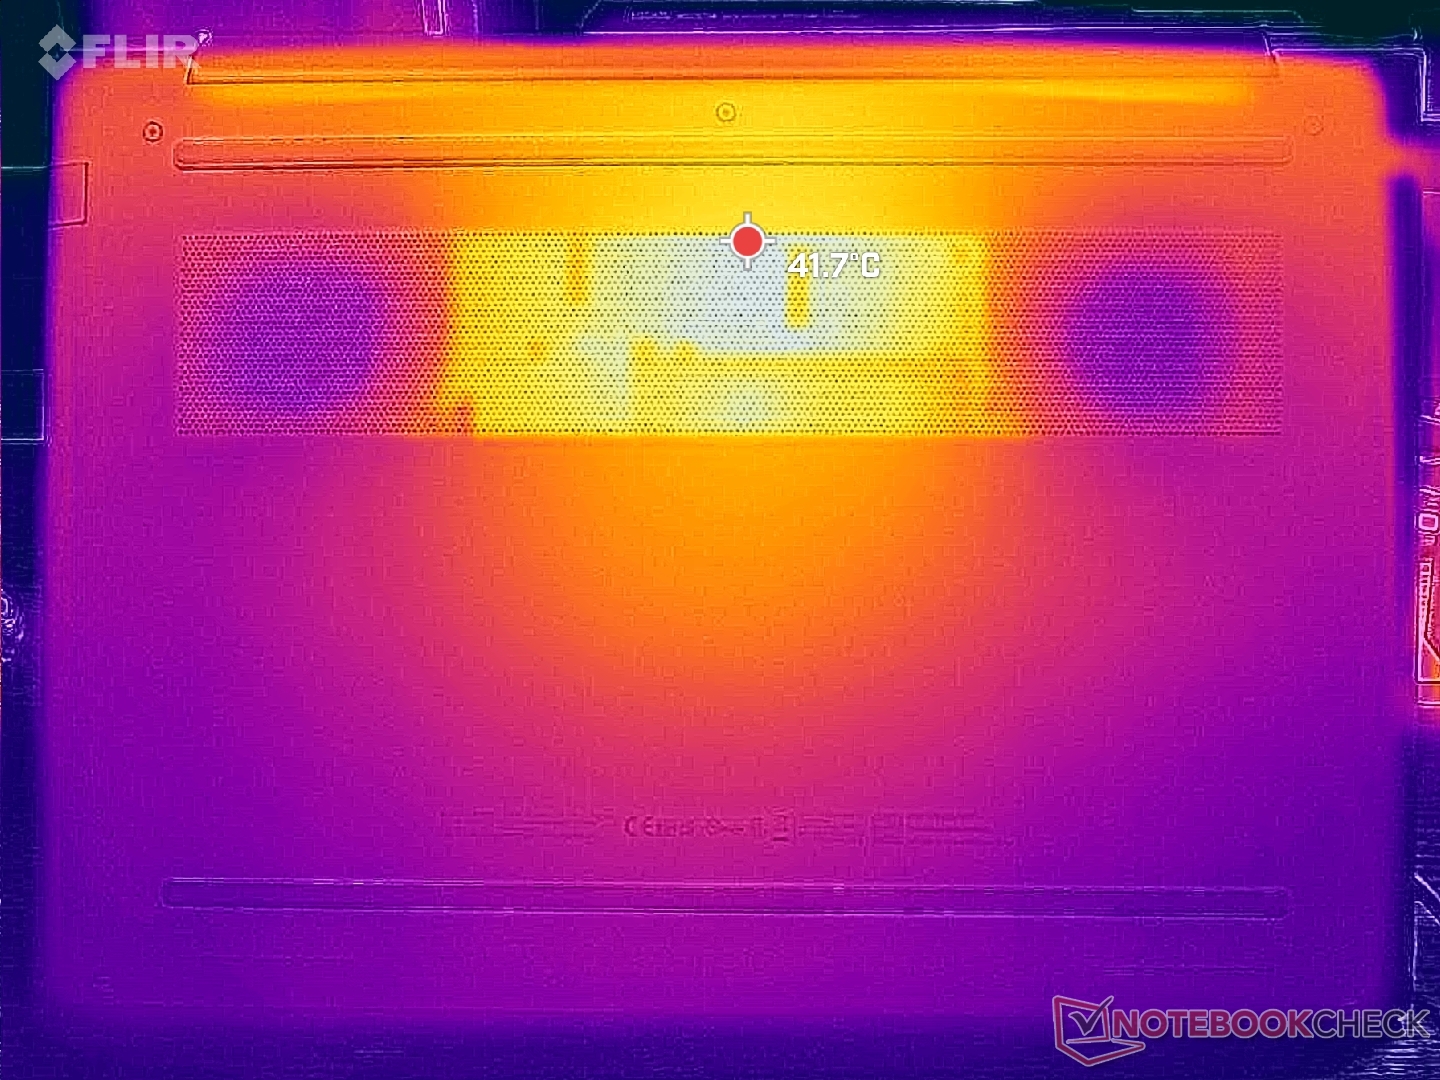
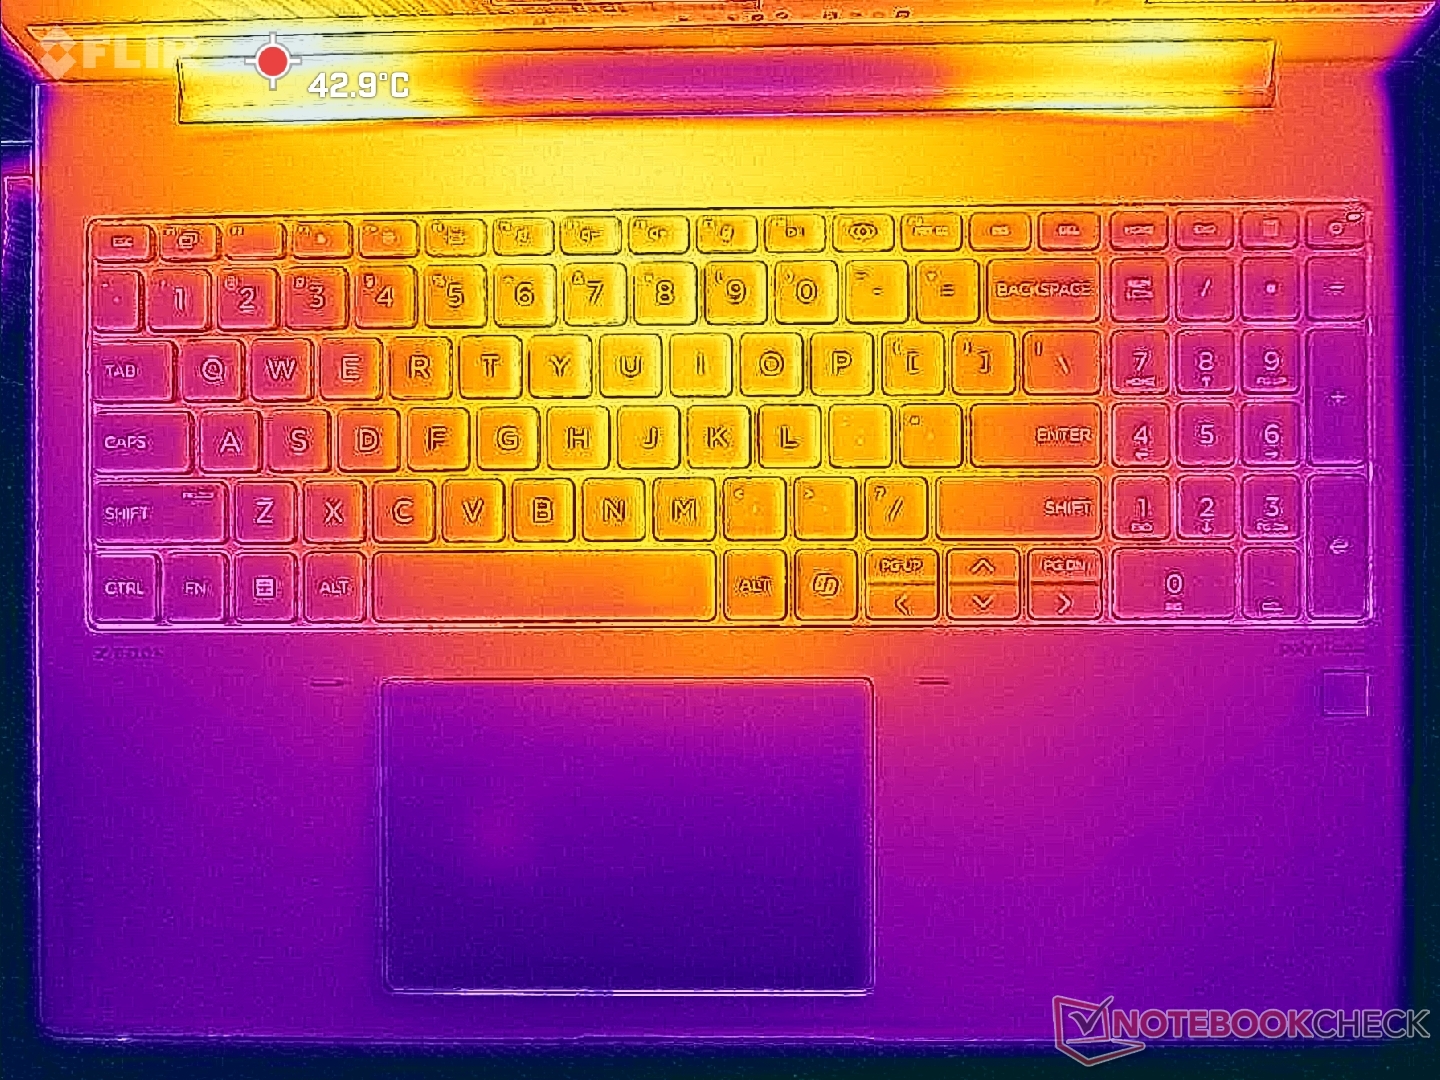
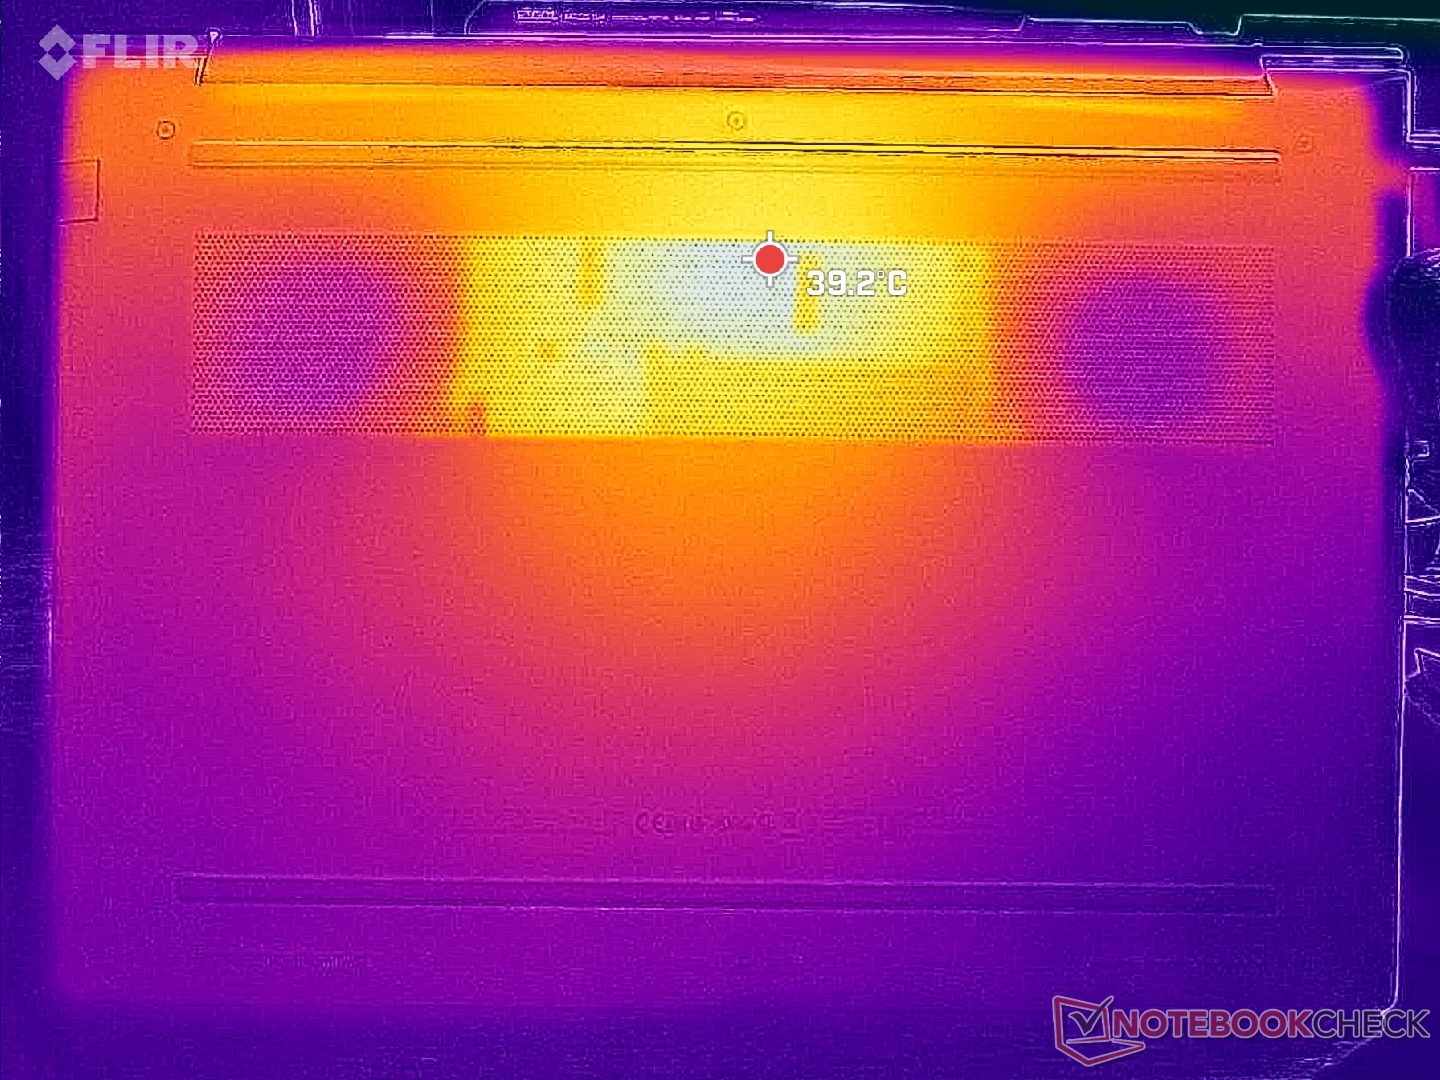
Yüzey sıcaklıkları yeni 16 inç form faktörümüzde özellikle alt kapak açısından genellikle daha düşüktür. Alt kısımdaki sıcak noktalar, eski ZBook Power 15 G10'daki 48 C'ye kıyasla zorlu yükleri çalıştırırken sadece 41 C'ye ulaşıyor. Klavye ortasındaki sıcak nokta da 41 C'ye ulaşırken, avuç içi dayanakları ve yanları daha serin ve avuç içi ve parmaklar için daha rahat kalıyor.
Daha güçlü olanlarla karşılaştırıldığında Precision 5690dell ünitesi alt yüzeyde daha soğukken klavye üzerinde daha da sıcaktır.
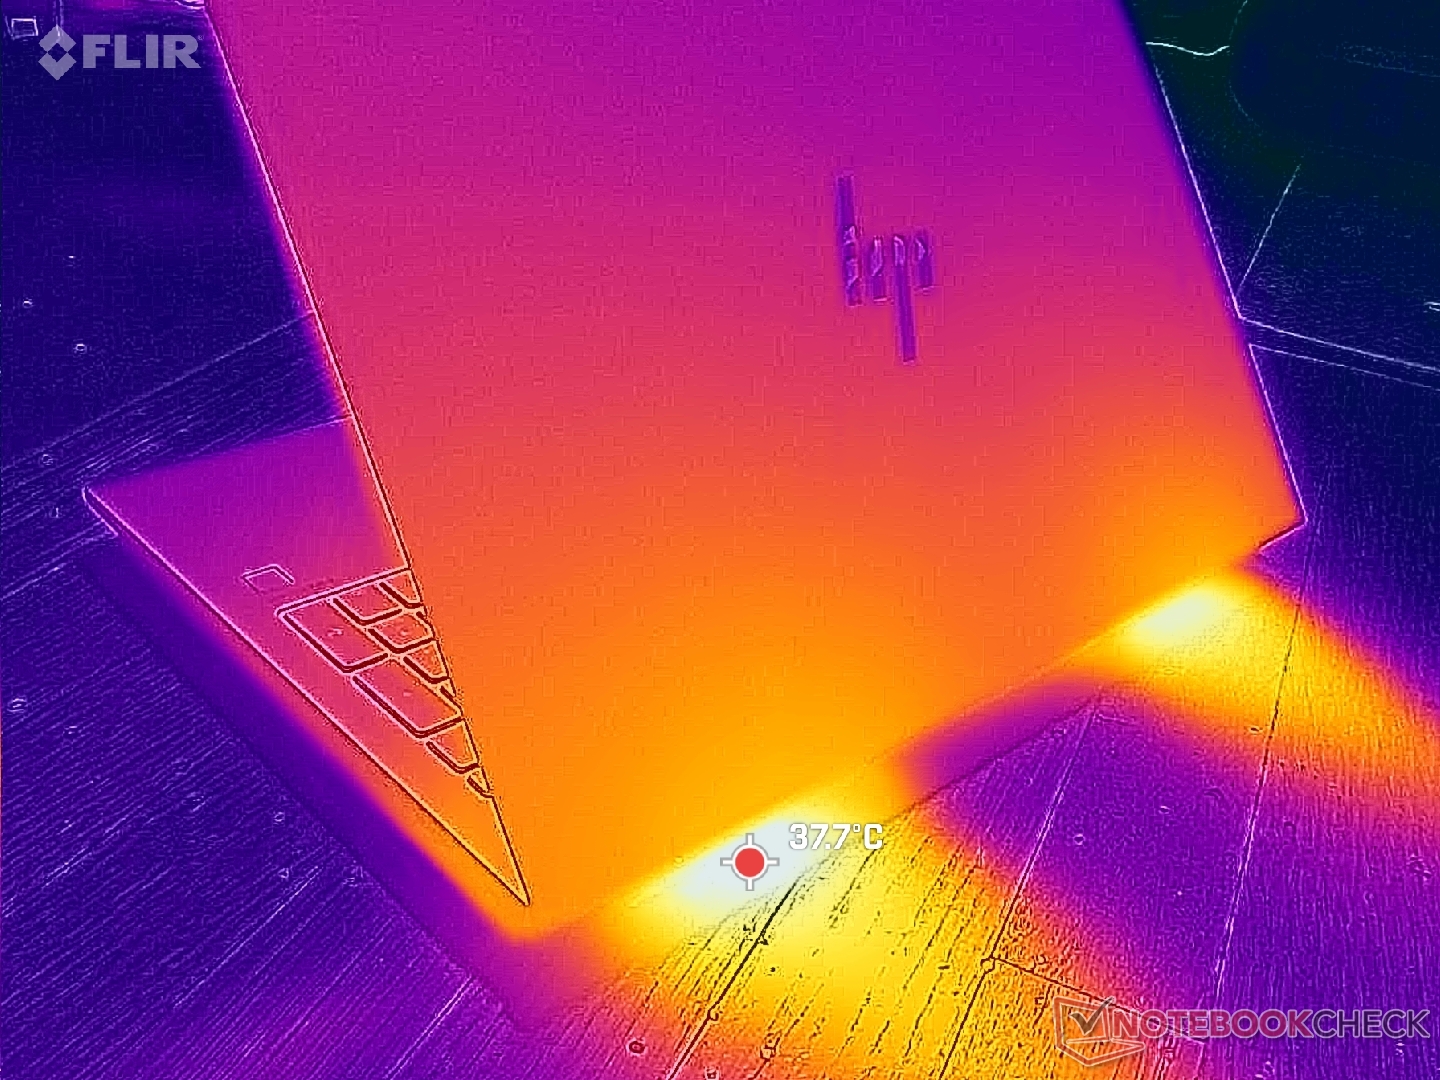
(±) Üst taraftaki maksimum sıcaklık, 38.2 °C / 101 F ortalamasına kıyasla 40.6 °C / 105 F'dir. , Workstation sınıfı için 22.2 ile 69.8 °C arasında değişir.
(±) Alt kısım, 41.2 °C / 106 F ortalamasına kıyasla maksimum 40.6 °C / 105 F'ye kadar ısınır
(+) Boşta kullanımda, üst tarafın ortalama sıcaklığı 24.6 °C / 76 F olup, cihazın 32 °C / 90 F.
(+) 3: The average temperature for the upper side is 30.1 °C / 86 F, compared to the average of 32 °C / 90 F for the class Workstation.
(+) Avuç içi dayanakları ve dokunmatik yüzey, maksimum 27.2 °C / 81 F ile cilt sıcaklığından daha soğuktur ve bu nedenle dokunulduğunda soğuktur.
(±) Benzer cihazların avuç içi dayanağı alanının ortalama sıcaklığı 27.8 °C / 82 F (+0.6 °C / 1 F) idi.
| HP ZBook Power 16 G11 A AMD Ryzen 7 8845HS, NVIDIA RTX 2000 Ada Generation Laptop GPU | HP ZBook Power 15 G10 AMD Ryzen 7 PRO 7840HS, NVIDIA RTX 2000 Ada Generation Laptop GPU | HP ZBook Fury 16 G11 Intel Core i9-14900HX, NVIDIA RTX 3500 Ada Generation Laptop GPU | Lenovo ThinkPad P1 Gen 7 21KV001SGE Intel Core Ultra 7 155H, NVIDIA GeForce RTX 4060 Laptop GPU | Lenovo ThinkPad P16s G2 21K9000CGE AMD Ryzen 7 PRO 7840U, AMD Radeon 780M | Dell Precision 5690 Intel Core Ultra 9 185H, Nvidia RTX 5000 Ada Generation Laptop GPU | |
|---|---|---|---|---|---|---|
| Heat | -7% | -26% | -8% | -9% | -8% | |
| Maximum Upper Side * | 40.6 | 42.4 -4% | 42.2 -4% | 50.3 -24% | 42.7 -5% | 46.6 -15% |
| Maximum Bottom * | 40.6 | 47.8 -18% | 48 -18% | 38 6% | 47.2 -16% | 33 19% |
| Idle Upper Side * | 26 | 26.8 -3% | 37 -42% | 28.3 -9% | 27.8 -7% | 32.4 -25% |
| Idle Bottom * | 26.6 | 27.2 -2% | 36.8 -38% | 27.3 -3% | 28.4 -7% | 29.4 -11% |
* ... daha küçük daha iyidir
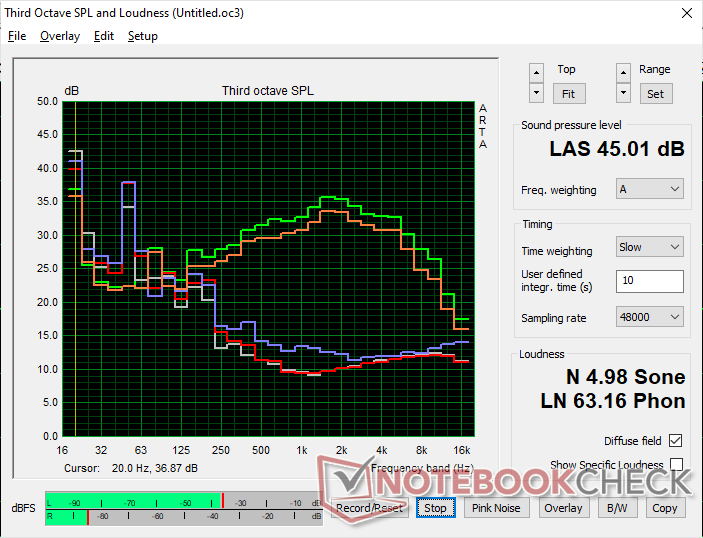
Konuşmacılar
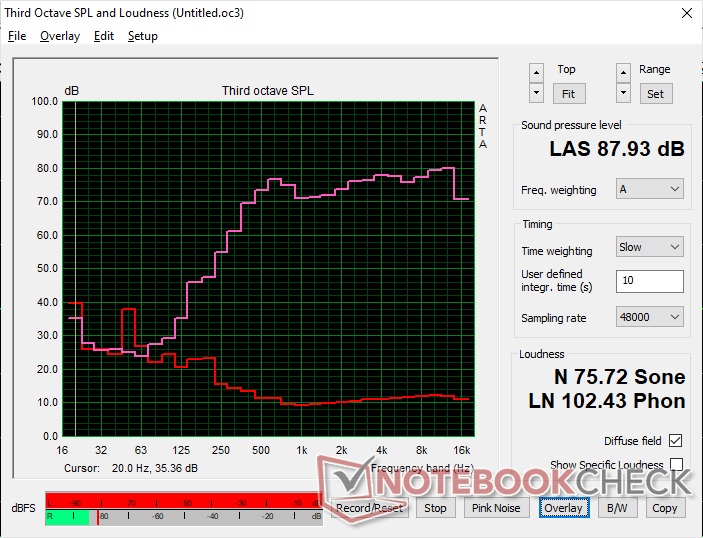
HP ZBook Power 16 G11 A ses analizi
(+) | hoparlörler nispeten yüksek sesle çalabilir (87.9 dB)
Bas 100 - 315Hz
(-) | neredeyse hiç bas yok - ortalama olarak medyandan 28.1% daha düşük
(±) | Bas doğrusallığı ortalamadır (9% delta - önceki frekans)
Ortalar 400 - 2000 Hz
(+) | dengeli ortalar - medyandan yalnızca 1.9% uzakta
(+) | orta frekanslar doğrusaldır (4.8% deltadan önceki frekansa)
Yüksekler 2 - 16 kHz
(+) | dengeli yüksekler - medyandan yalnızca 3.6% uzakta
(+) | yüksekler doğrusaldır (2.4% deltadan önceki frekansa)
Toplam 100 - 16.000 Hz
(±) | Genel sesin doğrusallığı ortalamadır (15.1% ortancaya göre fark)
Aynı sınıfla karşılaştırıldığında
» Bu sınıftaki tüm test edilen cihazların %29%'si daha iyi, 7% benzer, 63% daha kötüydü
» En iyisinin deltası 7% idi, ortalama 18% idi, en kötüsü 35% idi
Test edilen tüm cihazlarla karşılaştırıldığında
» Test edilen tüm cihazların %19'si daha iyi, 4 benzer, % 77 daha kötüydü
» En iyisinin deltası 4% idi, ortalama 24% idi, en kötüsü 134% idi
Apple MacBook Pro 16 2021 M1 Pro ses analizi
(+) | hoparlörler nispeten yüksek sesle çalabilir (84.7 dB)
Bas 100 - 315Hz
(+) | iyi bas - medyandan yalnızca 3.8% uzakta
(+) | bas doğrusaldır (5.2% delta ile önceki frekans)
Ortalar 400 - 2000 Hz
(+) | dengeli ortalar - medyandan yalnızca 1.3% uzakta
(+) | orta frekanslar doğrusaldır (2.1% deltadan önceki frekansa)
Yüksekler 2 - 16 kHz
(+) | dengeli yüksekler - medyandan yalnızca 1.9% uzakta
(+) | yüksekler doğrusaldır (2.7% deltadan önceki frekansa)
Toplam 100 - 16.000 Hz
(+) | genel ses doğrusaldır (4.6% ortancaya göre fark)
Aynı sınıfla karşılaştırıldığında
» Bu sınıftaki tüm test edilen cihazların %0%'si daha iyi, 0% benzer, 100% daha kötüydü
» En iyisinin deltası 5% idi, ortalama 18% idi, en kötüsü 45% idi
Test edilen tüm cihazlarla karşılaştırıldığında
» Test edilen tüm cihazların %0'si daha iyi, 0 benzer, % 100 daha kötüydü
» En iyisinin deltası 4% idi, ortalama 24% idi, en kötüsü 134% idi
Enerji Yönetimi
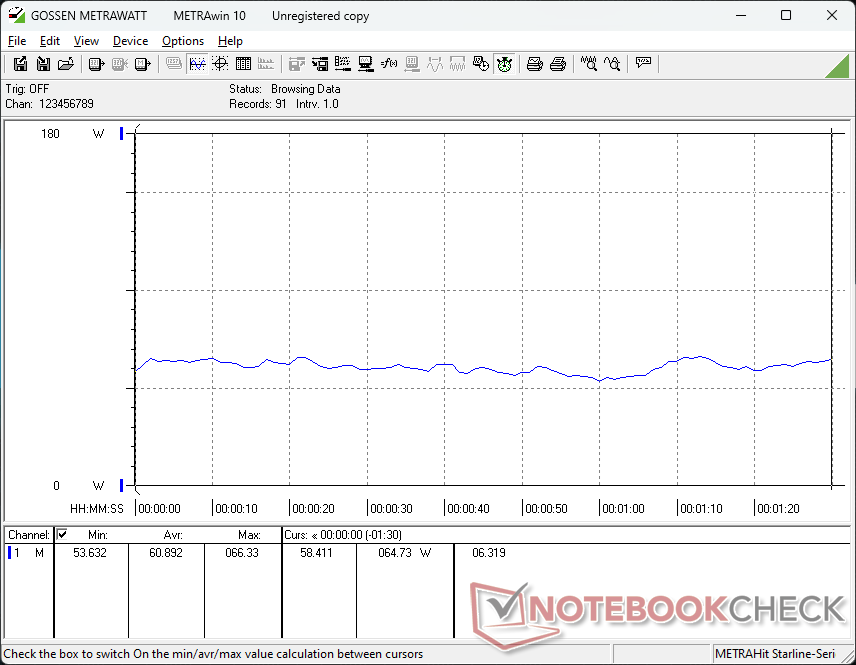
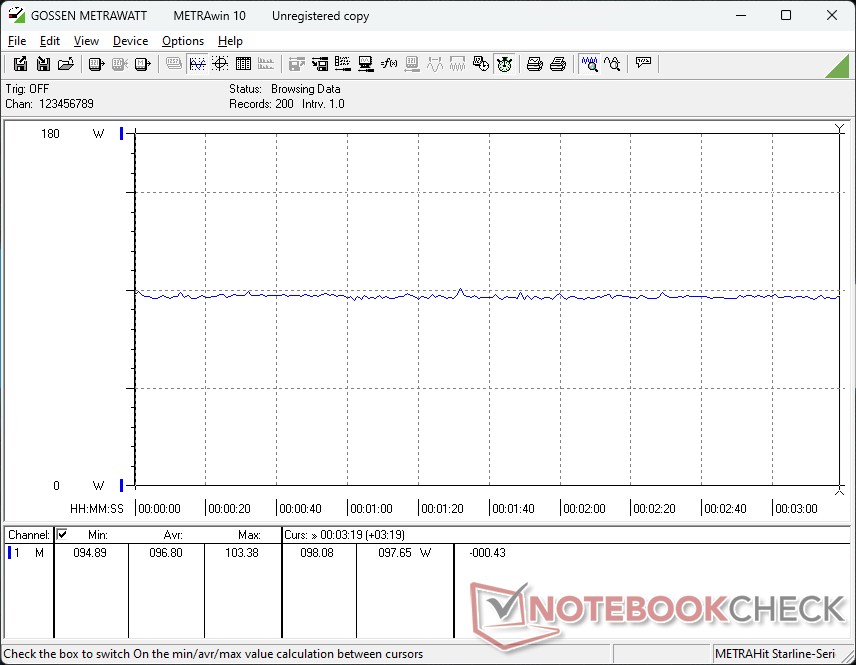
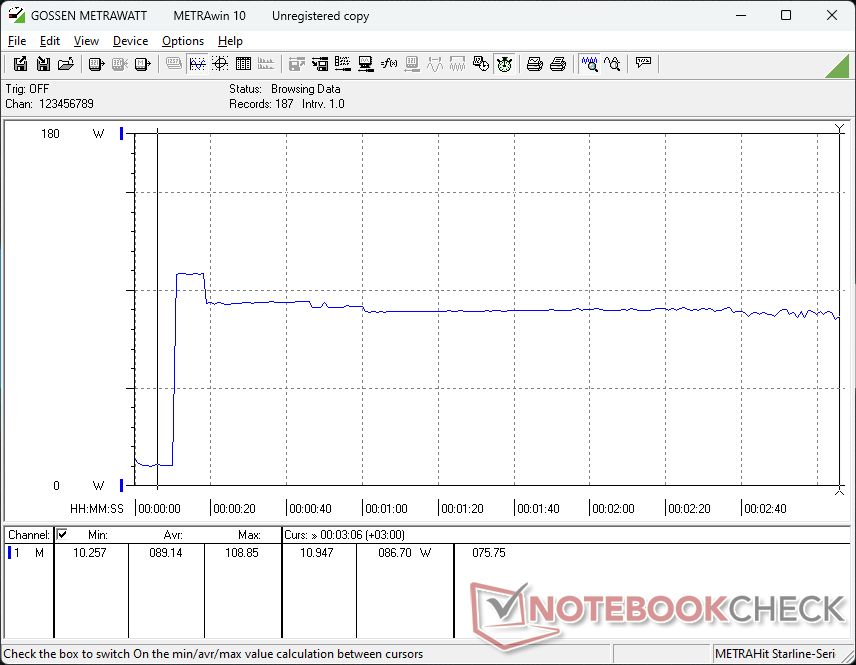
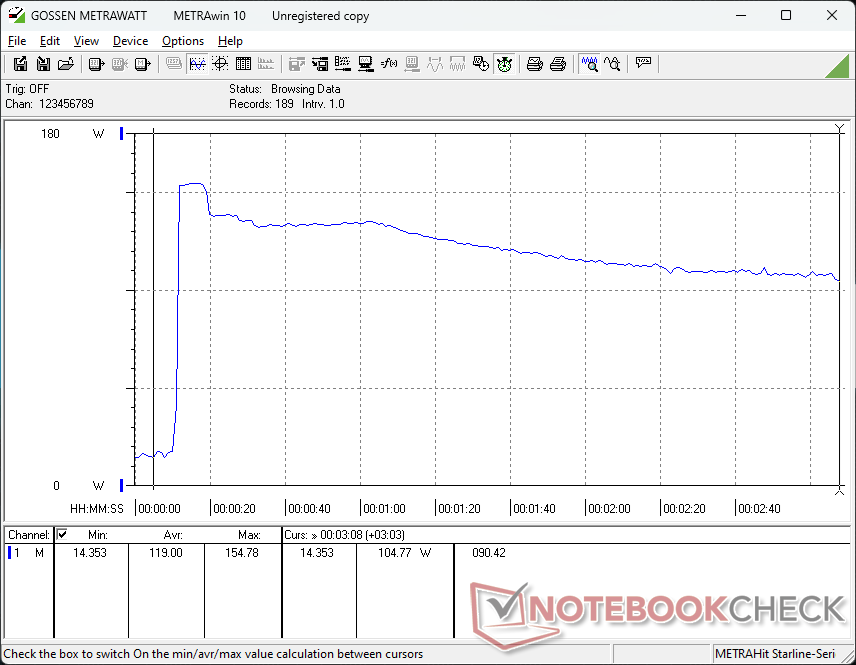
Güç Tüketimi
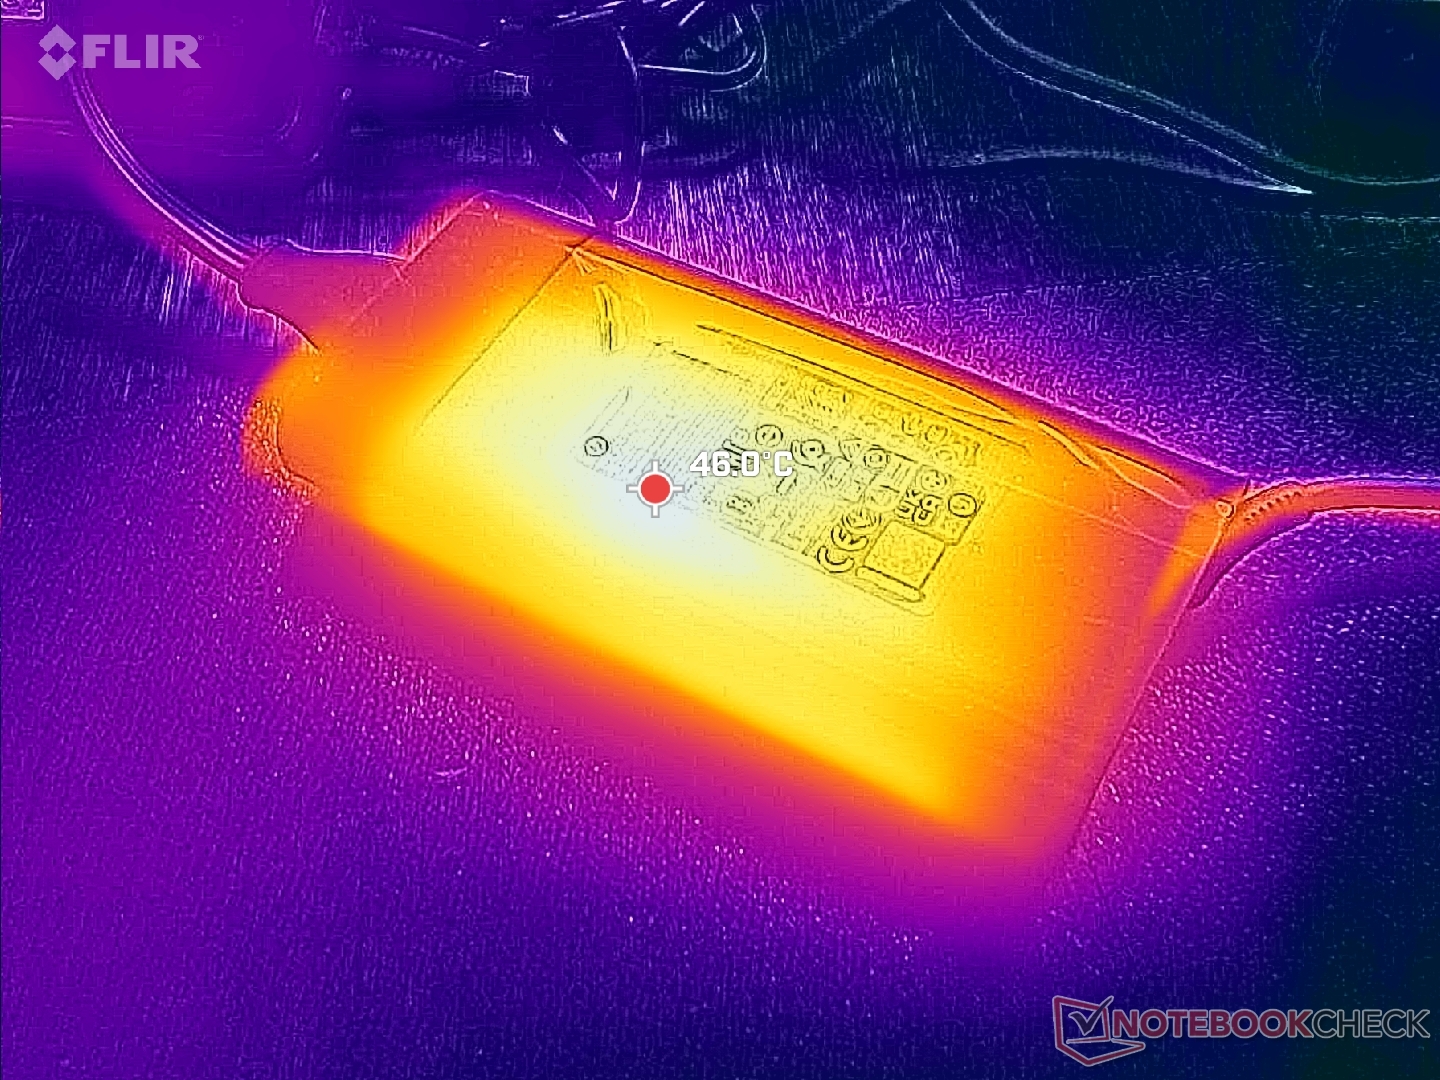
Tüketim seviyeleri ve davranışları ZBook Power 15 G10'da gözlemlediklerimize benzerdir, bu da güç zarfının aralarında aynı kaldığı göz önüne alındığında şaşırtıcı değildir. Belki de en dikkat çekici fark, Prime95 ve FurMark'ı aynı anda çalıştırırken yaklaşık 25 W'lık daha düşük tüketimle ilgilidir. Bu, yukarıdaki Stres Testi bölümünde belirtildiği gibi bu tür yükleri çalıştırırken çekirdek sıcaklıklarını soğutmak için daha ağır kısmaya bağlanabilir.
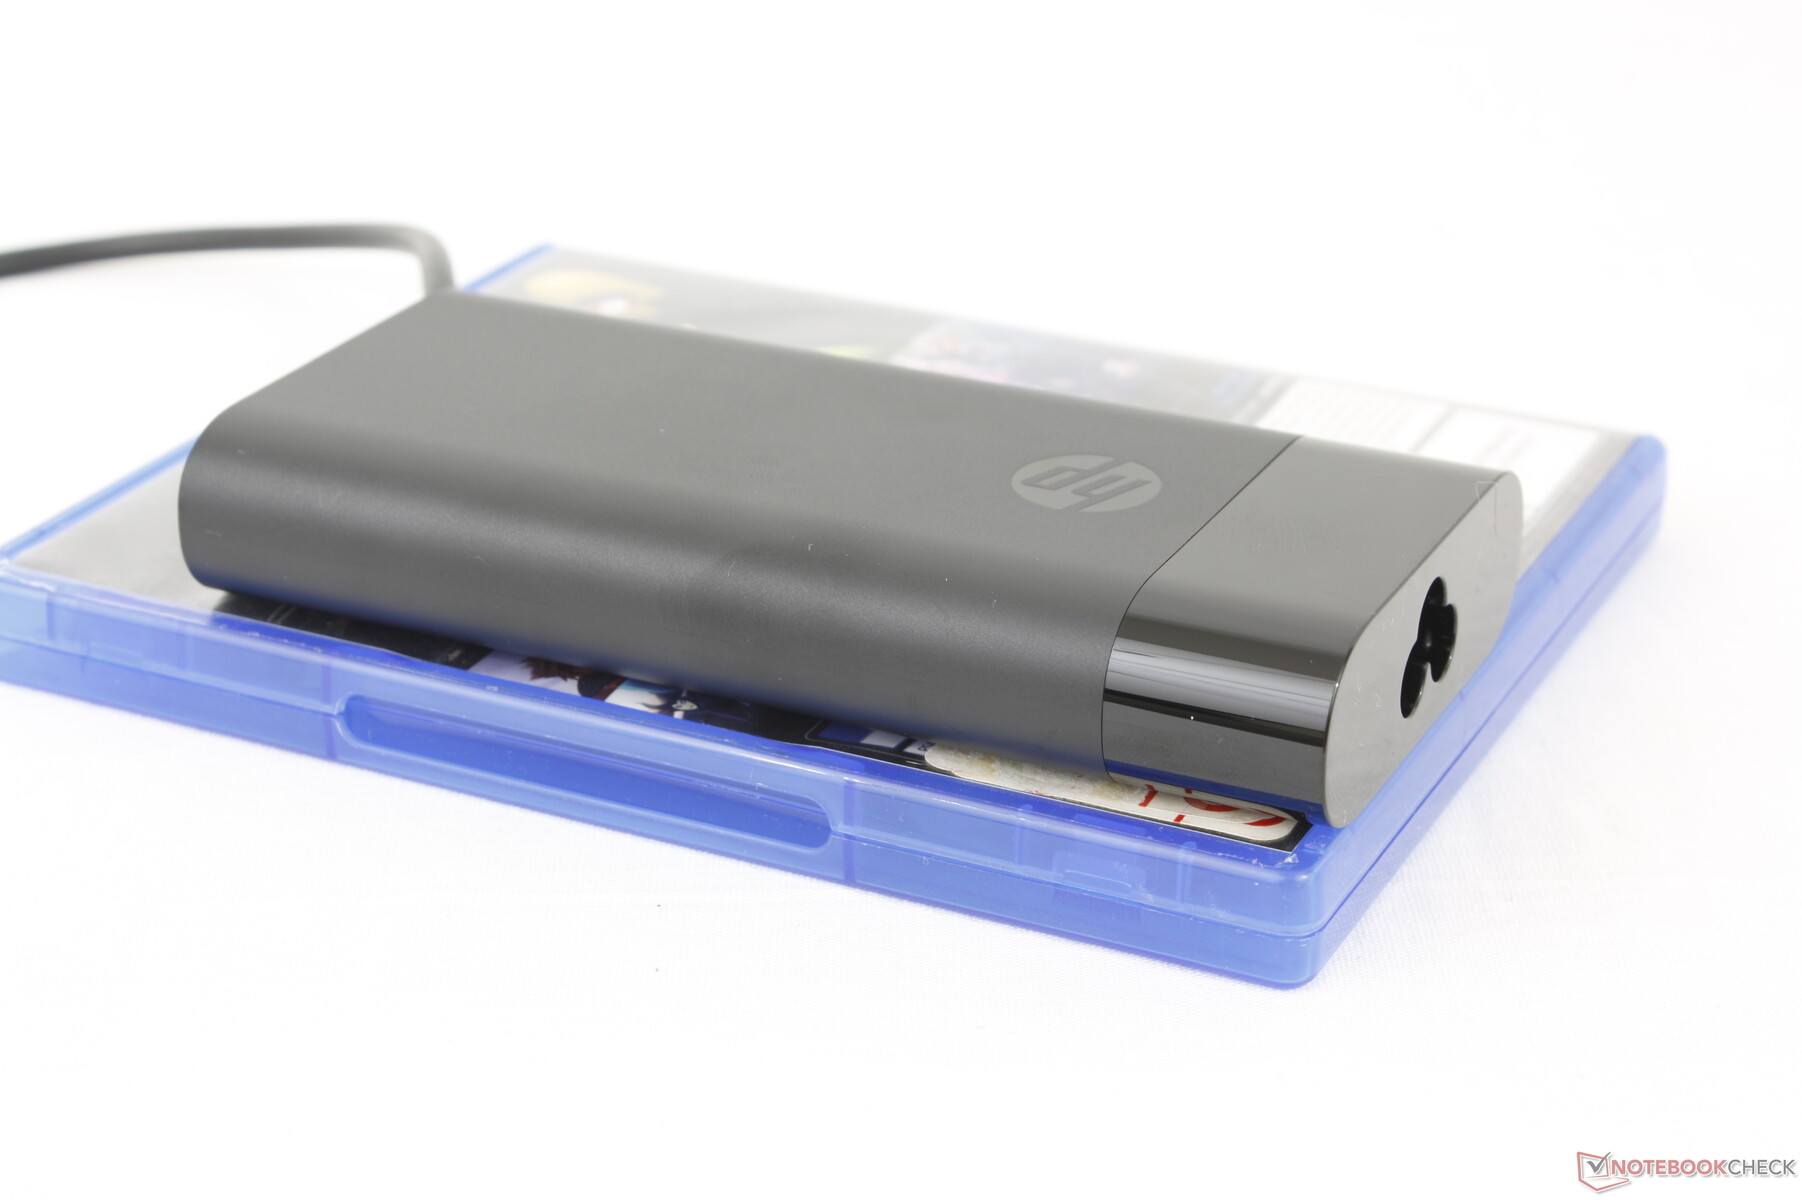
Orta büyüklükteki (~13,8 x 6,5 x 2,2 cm) 150 W AC adaptörden 155 W'lık geçici bir maksimum çekim kaydedebildik.
| Kapalı / Bekleme modu | |
| Boşta | |
| Çalışırken |
|
Key:
min: | |
| HP ZBook Power 16 G11 A R7 8845HS, NVIDIA RTX 2000 Ada Generation Laptop GPU, Samsung PM9A1 MZVL22T0HBLB, IPS, 2560x1600, 16" | HP ZBook Power 15 G10 R7 PRO 7840HS, NVIDIA RTX 2000 Ada Generation Laptop GPU, WDC PC SN810 2TB, IPS, 2560x1440, 15.6" | HP ZBook Fury 16 G11 i9-14900HX, NVIDIA RTX 3500 Ada Generation Laptop GPU, SK hynix PC801 HFS001TEJ9X101N, IPS, 3840x2400, 16" | Lenovo ThinkPad P1 Gen 7 21KV001SGE Ultra 7 155H, NVIDIA GeForce RTX 4060 Laptop GPU, Kioxia XG8 KXG8AZNV1T02, IPS LED, 2560x1600, 16" | Lenovo ThinkPad P16s G2 21K9000CGE R7 PRO 7840U, Radeon 780M, SK hynix PC801 HFS001TEJ9X162N, OLED, 3840x2400, 16" | Dell Precision 5690 Ultra 9 185H, NVIDIA RTX 5000 Ada Generation Laptop GPU, 2x Samsung PM9A1 1TB (RAID 0), OLED, 3840x2400, 16" | |
|---|---|---|---|---|---|---|
| Power Consumption | -13% | -80% | -35% | 20% | -67% | |
| Idle Minimum * | 4.6 | 5.3 -15% | 8.6 -87% | 7.3 -59% | 6.1 -33% | 7.9 -72% |
| Idle Average * | 10 | 9.9 1% | 14.8 -48% | 12.3 -23% | 6.5 35% | 12 -20% |
| Idle Maximum * | 10.6 | 16.7 -58% | 15.7 -48% | 17.9 -69% | 7 34% | 28.6 -170% |
| Load Average * | 60.9 | 61.3 -1% | 129.4 -112% | 78.2 -28% | 56.6 7% | 98.8 -62% |
| Cyberpunk 2077 ultra external monitor * | 92.8 | 192.6 -108% | 117.7 -27% | |||
| Cyberpunk 2077 ultra * | 96.8 | 199.4 -106% | 123.5 -28% | |||
| Load Maximum * | 154.8 | 145.3 6% | 236.1 -53% | 167.5 -8% | 68.3 56% | 174.8 -13% |
| Witcher 3 ultra * | 87.9 | 61.2 | 144.5 |
* ... daha küçük daha iyidir
Power Consumption Cyberpunk / Stress Test
Power Consumption external Monitor
Pil Ömrü
Form faktörü güncellemelerine rağmen pil kapasitesi geçen yılki ZBook Power 15 G10'a göre değişmedi. Belki de tesadüfen, çalışma süreleri otomatik kapanmadan önce 9,5 saatin biraz üzerinde gerçek dünya WLAN taramasıyla neredeyse aynı kalıyor.
Boş kapasiteden tam kapasiteye şarj etme 70 dakikanın altında nispeten hızlıdır. USB-C üzerinden şarj, daha düşük hızlarda da olsa desteklenmektedir.
| HP ZBook Power 16 G11 A R7 8845HS, NVIDIA RTX 2000 Ada Generation Laptop GPU, 83 Wh | HP ZBook Power 15 G10 R7 PRO 7840HS, NVIDIA RTX 2000 Ada Generation Laptop GPU, 83 Wh | HP ZBook Fury 16 G11 i9-14900HX, NVIDIA RTX 3500 Ada Generation Laptop GPU, 95 Wh | Lenovo ThinkPad P1 Gen 7 21KV001SGE Ultra 7 155H, NVIDIA GeForce RTX 4060 Laptop GPU, 90 Wh | Lenovo ThinkPad P16s G2 21K9000CGE R7 PRO 7840U, Radeon 780M, 84 Wh | Dell Precision 5690 Ultra 9 185H, NVIDIA RTX 5000 Ada Generation Laptop GPU, 98 Wh | |
|---|---|---|---|---|---|---|
| Pil Çalışma Süresi | 3% | -31% | 7% | -1% | -6% | |
| Reader / Idle | 1566 | |||||
| WiFi v1.3 | 582 | 601 3% | 402 -31% | 595 2% | 635 9% | 549 -6% |
| Load | 103 | 114 11% | 92 -11% | |||
| H.264 | 797 |
Artılar
Eksiler
Karar - Daha Büyük Ekran Ama Aynı Performans
ZBook Power 16 G11, ZBook Power 15 serisini 16 inçlik daha büyük ve daha ağır bir tasarımla değiştiriyor. Daha büyük form faktörünün daha hızlı performansa yol açtığı varsayılabilir, ancak maalesef durum böyle değil. Yeni Hawk Point CPU'lar geçen yılın Phoenix seçeneklerine kıyasla pek bir şey sunmazken, GPU seçenekleri TGP tavanlarına kadar tamamen aynı. Kasanın yeniden tasarlanması HP'nin soğutma çözümünü yükseltme ve işlemcilerden daha fazla performans alma şansıydı, ancak üreticinin üst düzey ZBook Fury bölgesine çok fazla tecavüz etmek istemediğini düşünüyoruz.
Ekran seçenekleri de bir iş istasyonu için biraz hayal kırıklığı yaratıyor. Benzersiz 1000 nit seçeneği dışında OLED, P3 renkler veya 4K çözünürlük gibi kayda değer özellikler yok. Bu tür paneller, 15,6 inçlik versiyona kıyasla daha büyük ekran boyutunu çok daha çekici hale getirebilirdi. Bunun yerine kullanıcılar 2K ve IPS ile sınırlıdır.
ZBook Power 16 G11, 16 inçlik daha büyük ekran boyutu dışında selefine göre çok fazla şey sunmuyor. Performans ve özellikler iki model arasında neredeyse aynı.
HP, performans yükseltmeleri ve yeni özelliklerin eksikliğine rağmen hala güçlü bir orta seviye iş istasyonudur. CPU performansı hala HP'den belirgin şekilde daha hızlı ThinkPad P16s G2 ryzen-U serisi CPU'larla sınırlı olan ve popüler CPU'lardan daha ucuz olan Dell Precision 5690 aynı GPU ile yapılandırıldığında. Bununla birlikte, zaten bir ZBook Power 15 G10'a sahipseniz, daha ağır olan 16 inçlik sürüm bir yan adım gibi hissedilebilir.
Fiyat ve Bulunabilirlik
HP şimdi ZBook Power 16 G11 A'yı temel Ryzen 5 ve iGPU yapılandırmasında 1140 $ 'dan başlayan fiyatlarla gönderiyor. Ryzen 7 CPU, RTX 2000 Ada GPU ve 1600p ekrana sahip inceleme yapılandırmamız yaklaşık 2000 dolara satılıyor.
Not: Derecelendirme sistemimizi yakın zamanda güncelledik ve 8. sürümün sonuçları 7. sürümün sonuçları ile karşılaştırılamaz. Daha fazla bilgi için burada .
HP ZBook Power 16 G11 A
- 09/30/2024 v8
Allen Ngo
 Total Sustainability Score:
 Şeffaflık
İncelenecek cihazların seçimi editör ekibimiz tarafından yapılır. Test örneği, bu incelemenin amacı doğrultusunda üretici veya perakendeci tarafından yazara ödünç olarak sağlanmıştır. Borç verenin bu inceleme üzerinde herhangi bir etkisi olmadığı gibi, üretici de yayınlanmadan önce bu incelemenin bir kopyasını almamıştır. Bu incelemeyi yayınlama zorunluluğu yoktu. İncelemelerimiz karşılığında asla tazminat veya ödeme kabul etmiyoruz. Bağımsız bir medya şirketi olarak Notebookcheck, üreticilerin, perakendecilerin veya yayıncıların otoritesine tabi değildir.
Notebookcheck bu şekilde test yapıyor
Notebookcheck, tüm sonuçların karşılaştırılabilir olmasını sağlamak için her yıl yüzlerce dizüstü bilgisayarı ve akıllı telefonu standart prosedürler kullanarak bağımsız olarak inceliyor. Yaklaşık 20 yıldır test yöntemlerimizi sürekli olarak geliştirdik ve bu süreçte endüstri standartlarını belirledik. Test laboratuvarlarımızda deneyimli teknisyenler ve editörler tarafından yüksek kaliteli ölçüm ekipmanları kullanılmaktadır. Bu testler çok aşamalı bir doğrulama sürecini içerir. Karmaşık derecelendirme sistemimiz, nesnelliği koruyan yüzlerce sağlam temellere dayanan ölçüm ve kıyaslamaya dayanmaktadır.Price comparison

