

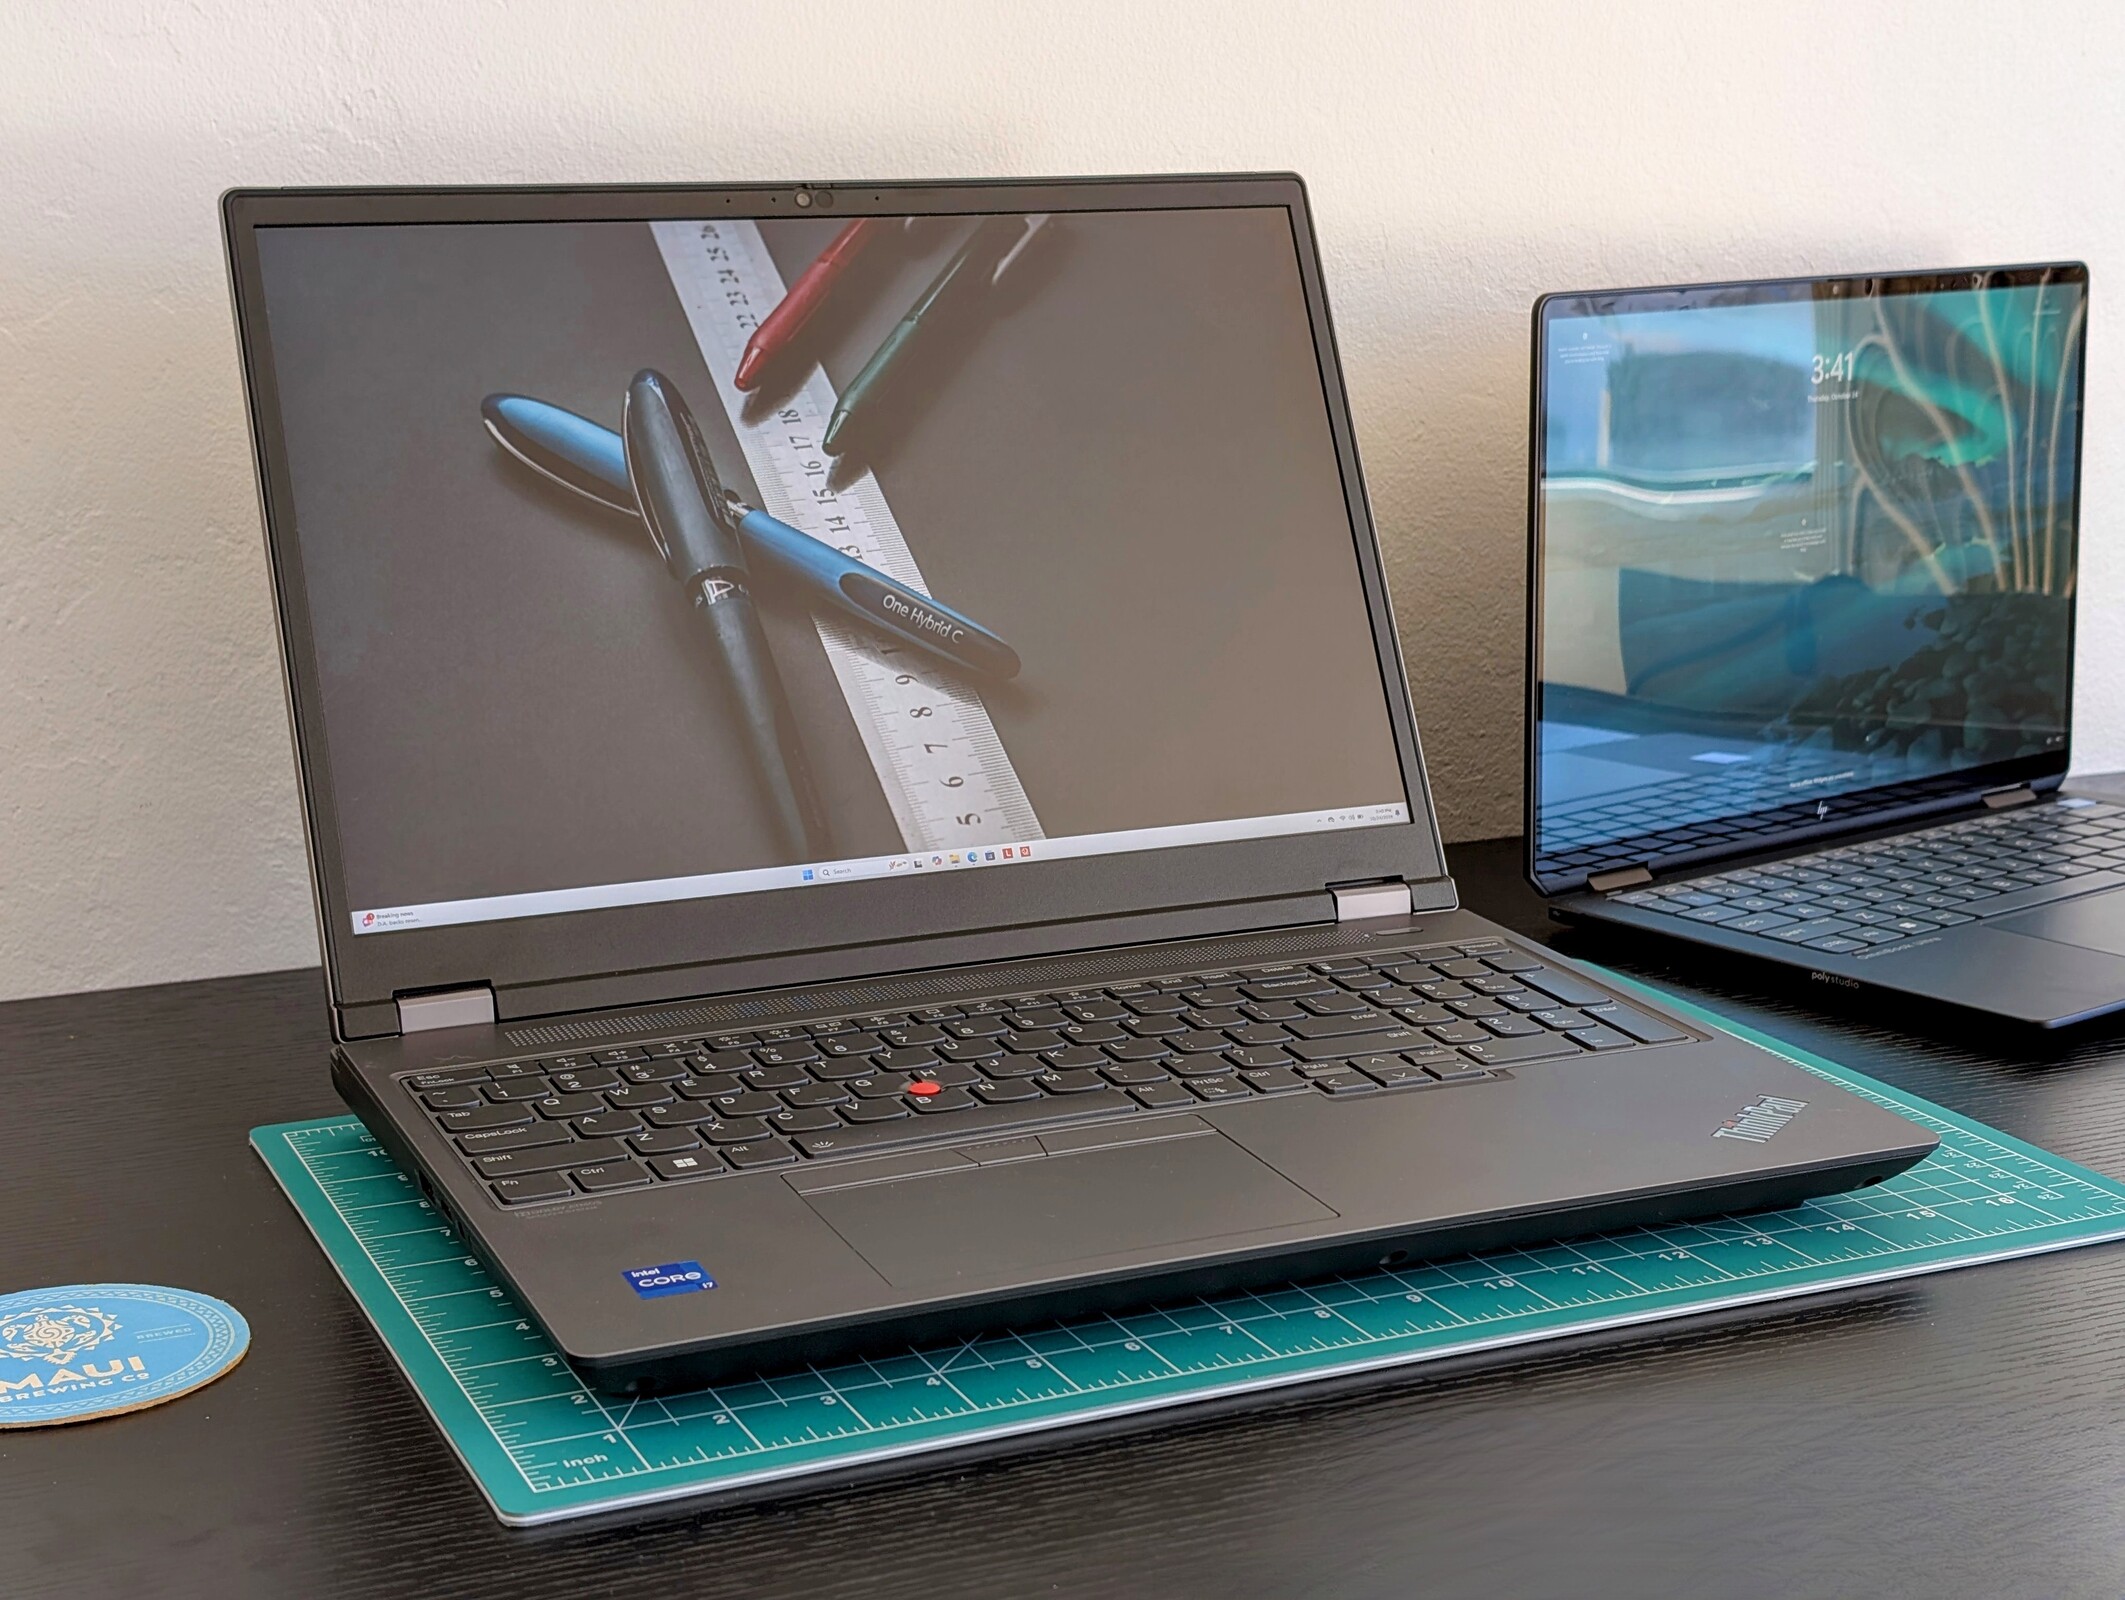
Lenovo ThinkPad P16 Gen 2 iş istasyonu incelemesi: Süper güçlendirilmiş grafiklerle ağır
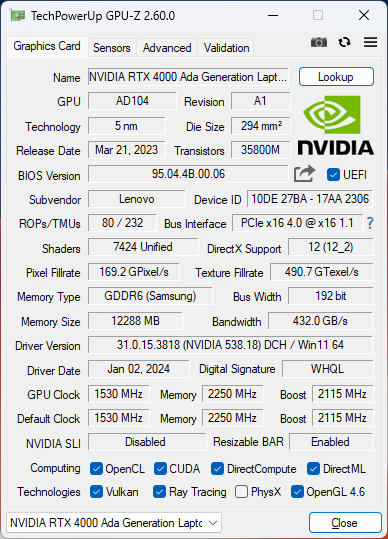
Nvidia RTX 4000 Ada etkileyici rakamlarla görücüye çıkıyor.
130 W TGP grafik seçeneği, bunu Lenovo'nun portföyündeki en hızlı 16 inç iş istasyonlarından biri haline getiriyor. Bununla birlikte, zorlu GPU'nun bir sonucu olarak sıcaklık ve fan gürültüsü gibi hususlar sırasıyla ortalamadan daha sıcak ve gürültülüdür.Allen Ngo (Çeviren DeepL / Ninh Duy) Yayınlandı 🇺🇸 🇫🇷 ...
Karar - Gücün Bir Bedeli Vardır
ThinkPad P16 Gen 2, daha büyük, daha ağır, daha gürültülü ve daha sıcak bir sistem anlamına gelse bile performansa öncelik verir. Dezavantajlarla başa çıkabilirseniz, 130 W RTX 4000 Ada'nın bir mobil iş istasyonu canavarı olduğunu göreceksiniz.
ThinkPad P16 Gen 2, zorlu iş yüklerinin üstesinden 130 W TGP grafikleri ile gelerek diğer 16 inç iş istasyonlarından ayrılır.
Belki de en önemli dezavantaj, GPU'nun birkaç dakikalık stresin ardından yaklaşık yüzde 10 oranında kısılabilmesidir, bu da soğutma çözümünün GPU'nun tüm taleplerini süresiz olarak karşılayamayacağını göstermektedir. Pil ömrü de en fazla birkaç saat gibi çok kısa bir süredir. Buna rağmen ThinkPad P16 Gen 2, 16 inç boyut sınıfındaki en hızlı iş istasyonlarından biri.
Artılar
Eksiler
Fiyat ve Bulunabilirlik
Lenovo şimdi ThinkPad P16 Gen 2'yi doğrudan çevrimiçi mağazasından 1850 $ veya RTX 4000 ile yapılandırılmışsa 3770 USD'den başlayan fiyatlarla gönderiyor. Az sayıda SKU da Amazon üzerinden temin edilebilir.
Price comparison
Karşılaştırmalı olarak olası rakipler
Resim | Modeli / incelemeler | Geizhals | Ağırlık | Yükseklik | Ekran |
|---|---|---|---|---|---|
1. 85.9%  | Lenovo ThinkPad P16 Gen 2 Intel Core i7-14700HX ⎘ NVIDIA RTX 4000 Ada Generation Laptop GPU ⎘ 32 GB Bellek, 1024 GB SSD | 3.1 kg | 30.23 mm | 16.00" 2560x1600 189 PPI IPS | |
2. 90.2% v7 (old)  | Lenovo ThinkPad P16 G2 21FA000FGE Intel Core i7-13700HX ⎘ NVIDIA RTX 2000 Ada Generation Laptop GPU ⎘ 32 GB Bellek, 1024 GB SSD | 3 kg | 30.23 mm | 16.00" 2560x1600 189 PPI IPS LED | |
3. 88.6% v7 (old)  | Lenovo ThinkPad P16s G2 21K9000CGE AMD Ryzen 7 PRO 7840U ⎘ AMD Radeon 780M ⎘ 32 GB Bellek, 1024 GB SSD | 1.8 kg | 24.4 mm | 16.00" 3840x2400 283 PPI OLED | |
4. 91% v7 (old)  | Lenovo ThinkPad P16 G1 RTX A5500 Intel Core i9-12950HX ⎘ NVIDIA RTX A5500 Laptop GPU ⎘ 64 GB Bellek, 2048 GB SSD | Listenpreis 9000 USD | 3 kg | 30.23 mm | 16.00" 3840x2400 283 PPI IPS |
5. 85.4%  | HP ZBook Power 16 G11 A AMD Ryzen 7 8845HS ⎘ NVIDIA RTX 2000 Ada Generation Laptop GPU ⎘ 64 GB Bellek, 2048 GB SSD | 2.2 kg | 22.9 mm | 16.00" 2560x1600 189 PPI IPS | |
6. 88.3% v7 (old)  | Dell Precision 5690 Intel Core Ultra 9 185H ⎘ Nvidia RTX 5000 Ada Generation Laptop GPU ⎘ 32 GB Bellek, 2048 GB SSD | 2.3 kg | 22.17 mm | 16.00" 3840x2400 283 PPI OLED |
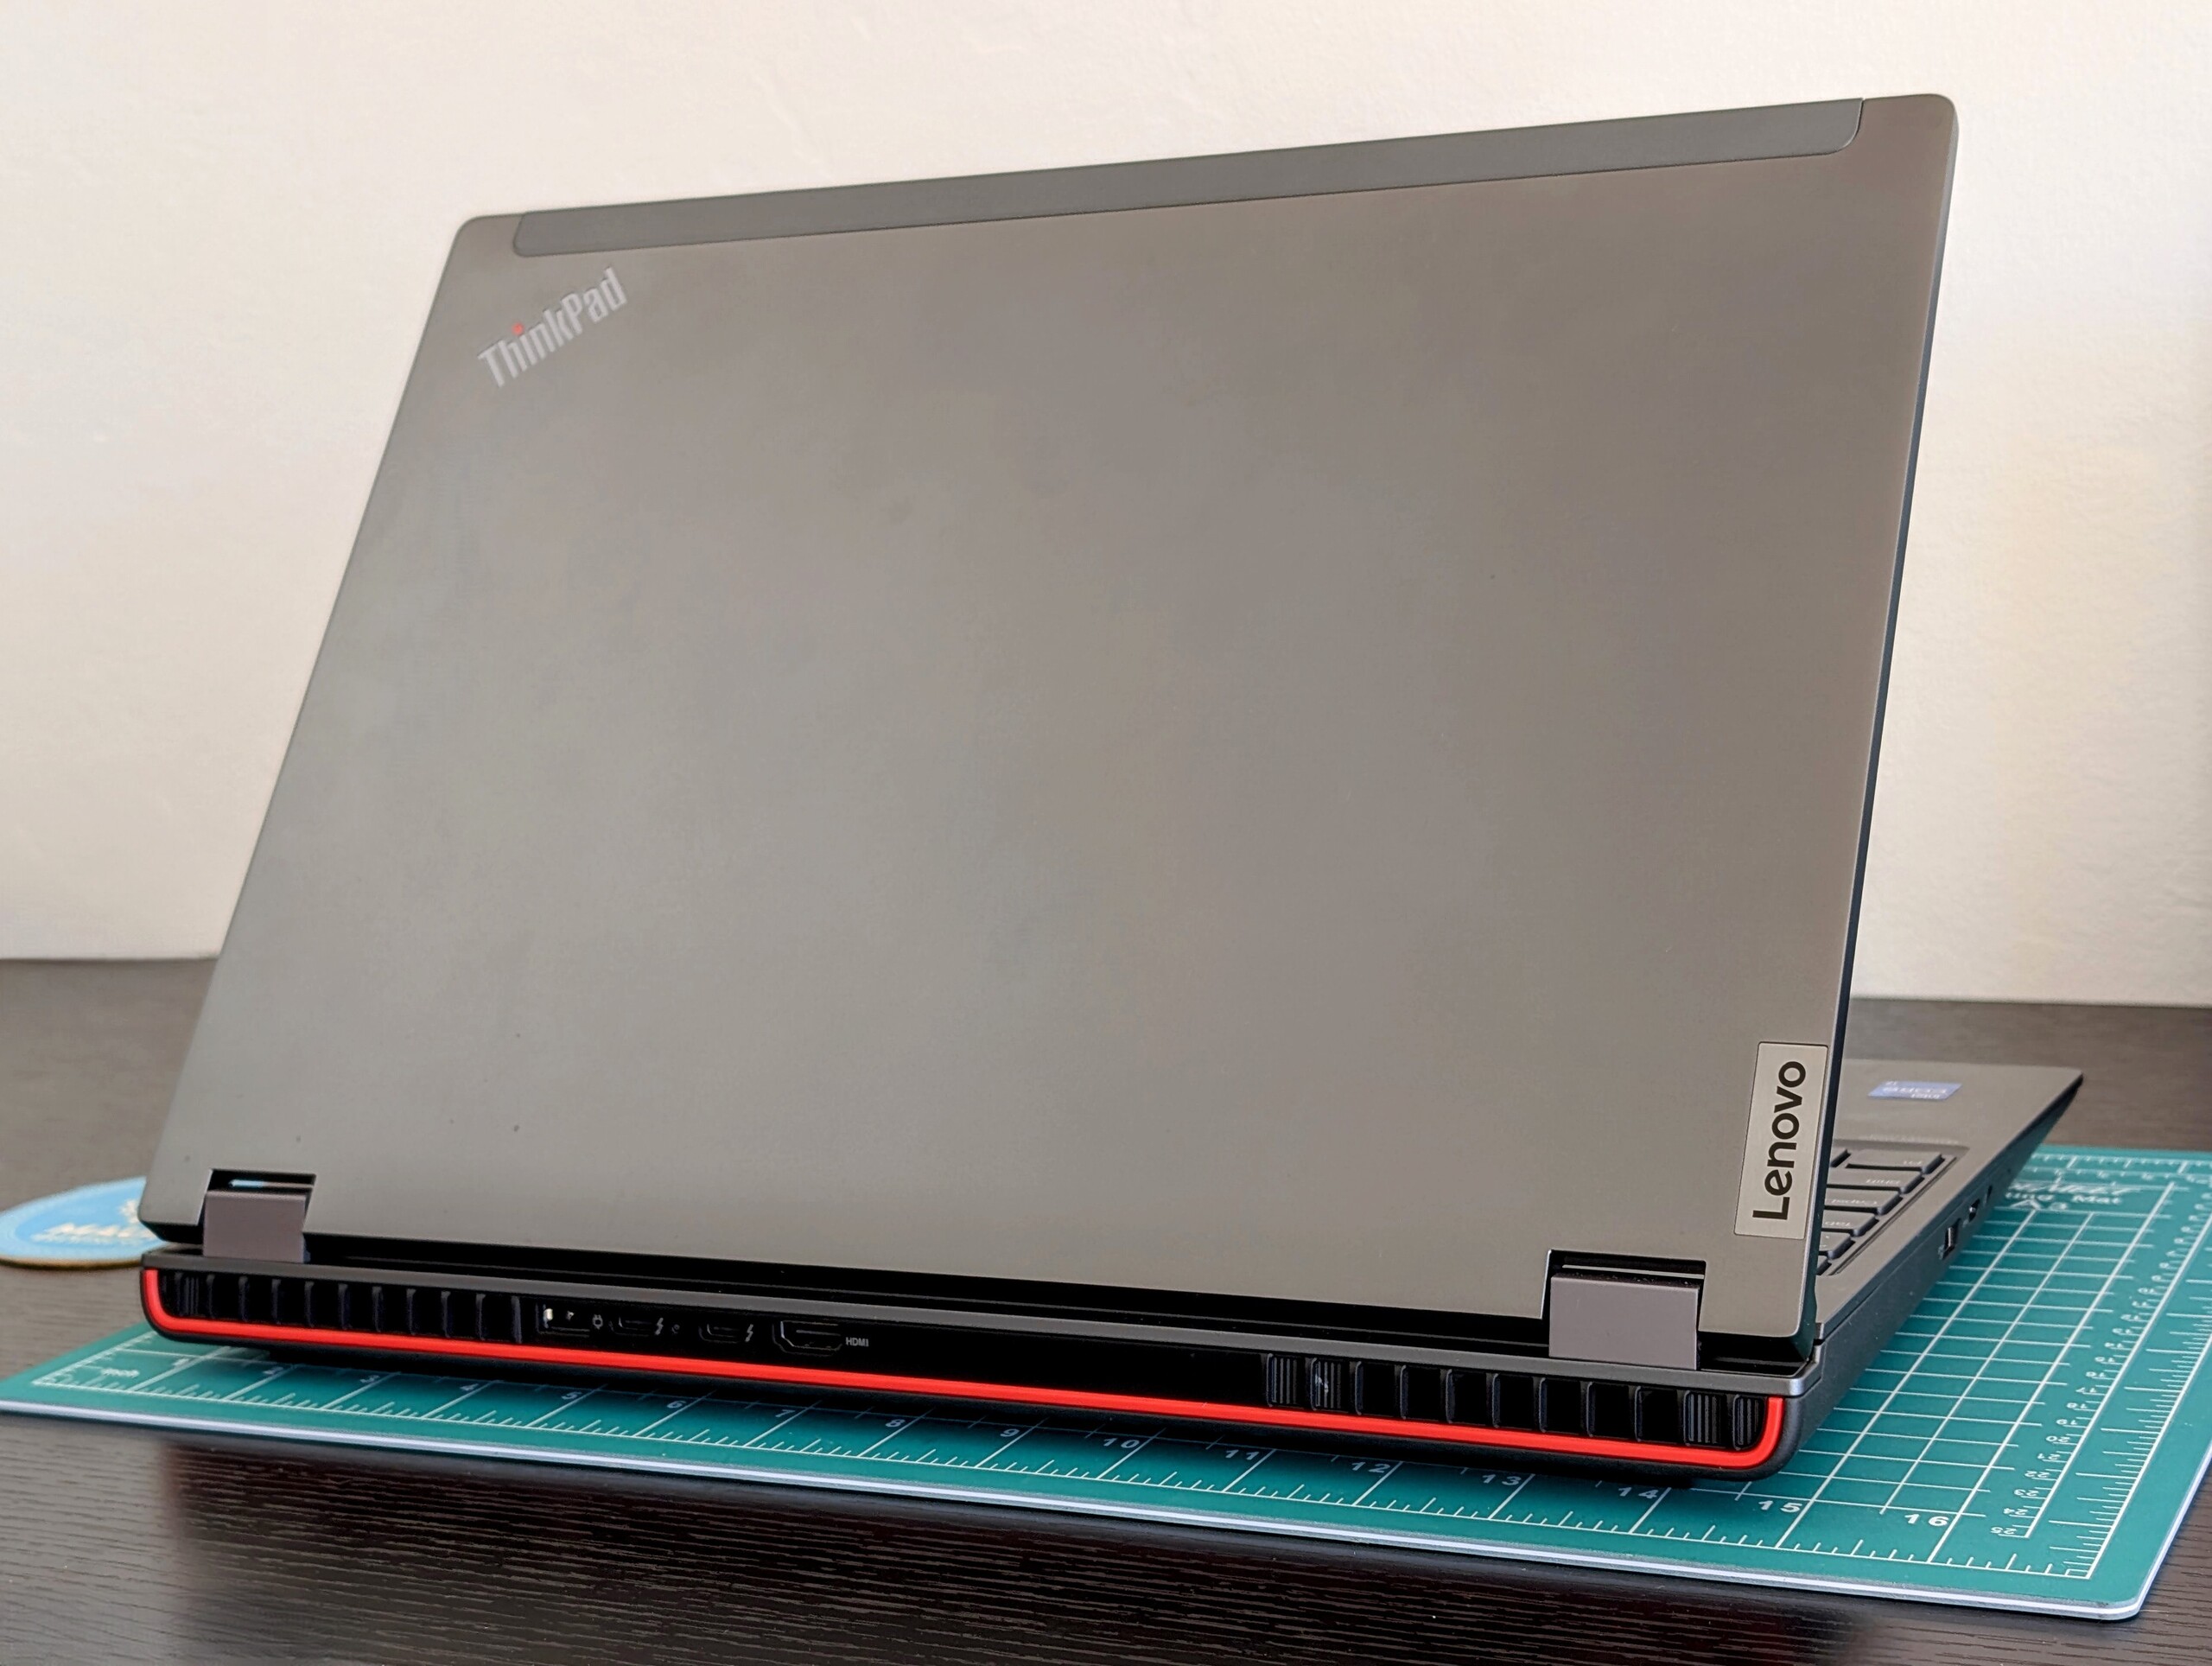
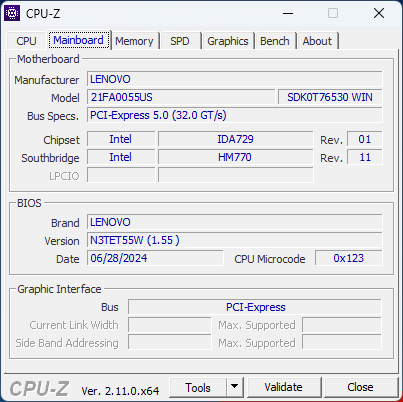
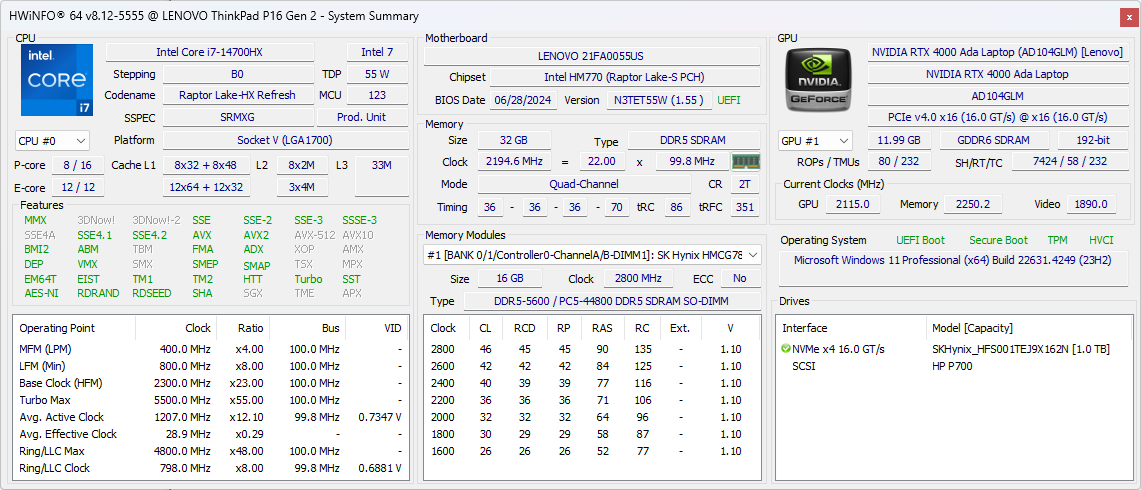
Lenovo, birinci sınıf ThinkPad P16 Gen 2 serisini, bu yılın başlarında piyasaya sürülen orijinal Raptor Lake-HX seçeneklerinin yerini almak üzere 2024 yılının 4. çeyreği için daha yeni Raptor Lake-HX Refresh CPU'larla güncelliyor. Kasa tasarımı aksi takdirde değişmeden kalır ve bu nedenle tüm izlenimlerimiz orijinal ThinkPad P16 Gen 2 incelemesi portlar da dahil olmak üzere burada da geçerlidir.
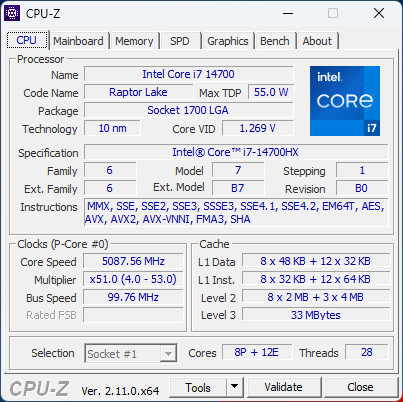
Test ünitemiz, ilk ThinkPad P16 Gen 2 incelememizdeki Core i7-13700HX ve 80 W RTX 2000'e kıyasla Core i7-14700HX CPU ve 130 W Nvidia RTX 4000 Ada GPU ile donatılmıştır. Aşağıdaki verilerimizin de göstereceği gibi performans artışı önemli.
ThinkPad P16 Gen 2'nin rakipleri arasında diğer yüksek performanslı 16 inç mobil iş istasyonları yer alıyor HP ZBook Power 16 G11 A veya Dell Precision 5690.
Daha fazla Lenovo incelemesi:
Teknik Özellikler
Dava
SD Kart Okuyucu
| SD Card Reader | |
| average JPG Copy Test (av. of 3 runs) | |
| HP ZBook Power 16 G11 A (Toshiba Exceria Pro SDXC 64 GB UHS-II) | |
| Lenovo ThinkPad P16 Gen 2 (Toshiba Exceria Pro SDXC 64 GB UHS-II) | |
| Lenovo ThinkPad P16 G1 RTX A5500 (Toshiba Exceria Pro SDXC 64 GB UHS-II) | |
| Lenovo ThinkPad P16 G2 21FA000FGE | |
| maximum AS SSD Seq Read Test (1GB) | |
| HP ZBook Power 16 G11 A (Toshiba Exceria Pro SDXC 64 GB UHS-II) | |
| Lenovo ThinkPad P16 Gen 2 (Toshiba Exceria Pro SDXC 64 GB UHS-II) | |
| Lenovo ThinkPad P16 G2 21FA000FGE | |
| Lenovo ThinkPad P16 G1 RTX A5500 (Toshiba Exceria Pro SDXC 64 GB UHS-II) | |
İletişim
Web kamerası


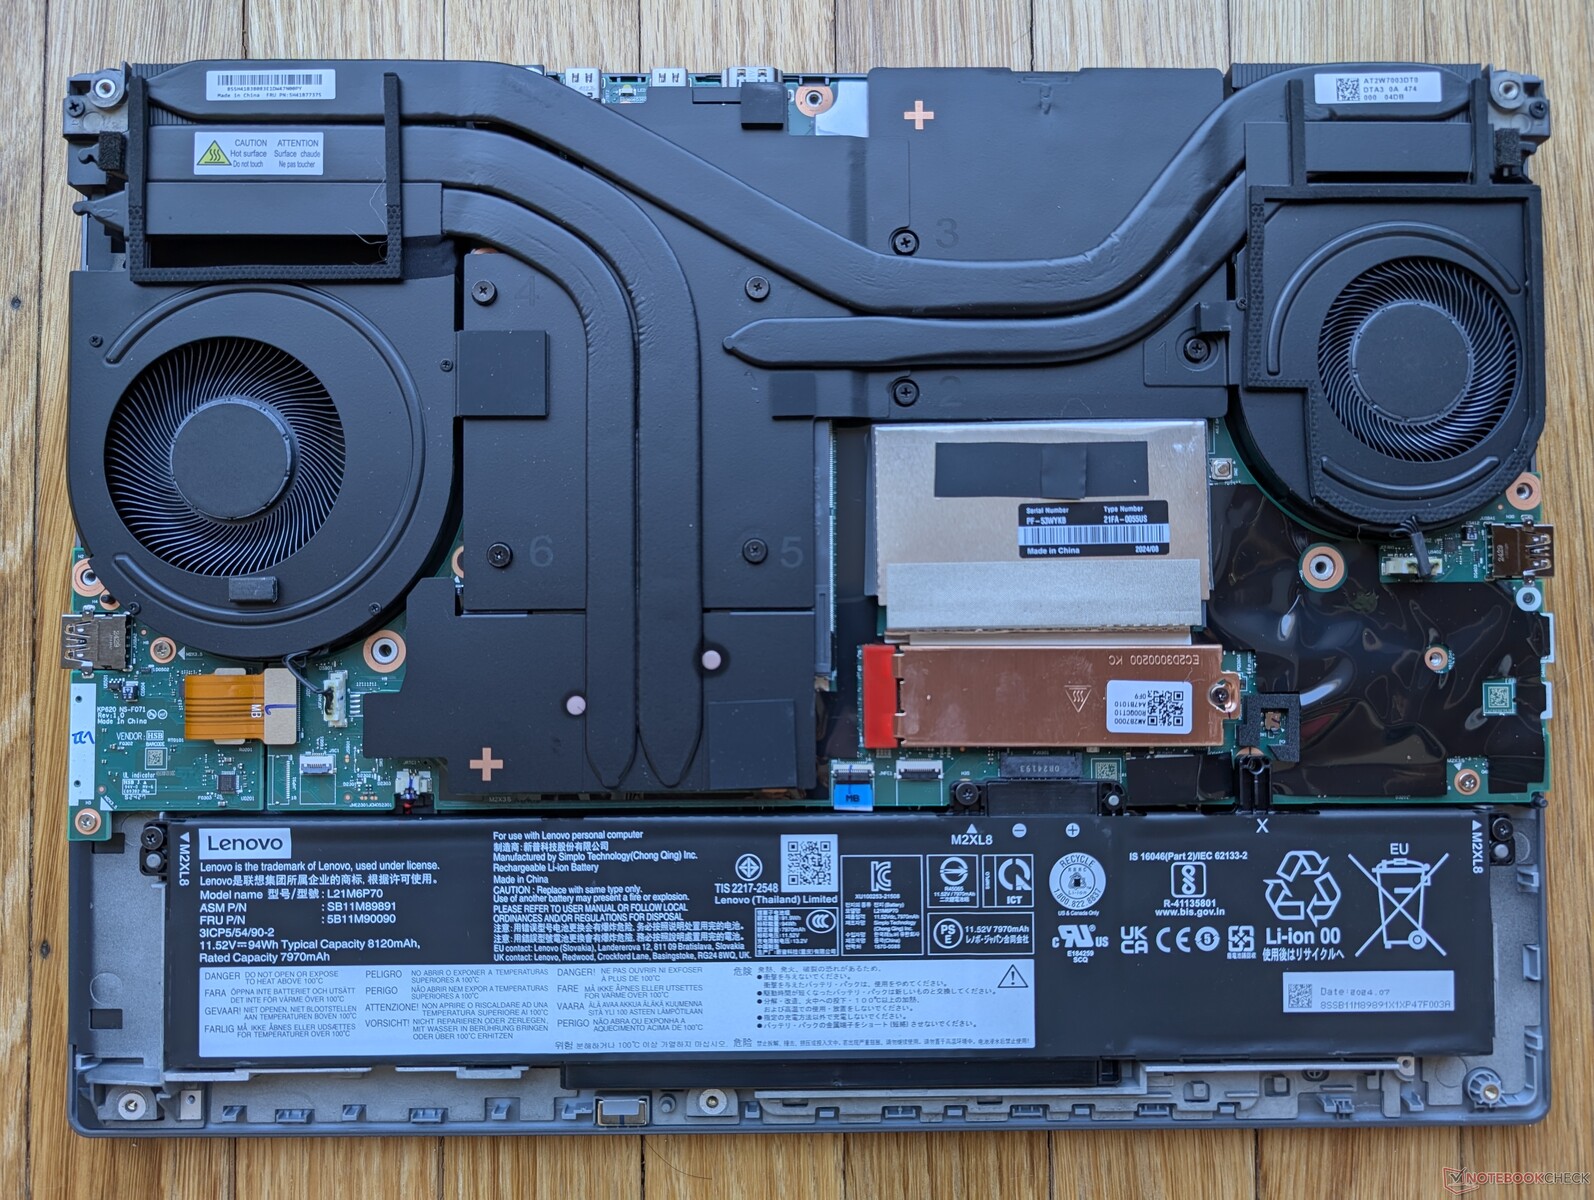
Bakım
Sürdürülebilirlik
Lenovo, üretim sırasında dış kapak (A kapağı) için yüzde 50 geri dönüştürülmüş alüminyum, klavye güvertesi (C kapağı) için yüzde 90 magnezyum ve tuş kapakları, pil takımı ve hoparlörler için yüzde 85'ten fazla tüketici sonrası içerikli plastik dahil olmak üzere önemli miktarda geri dönüştürülmüş malzeme kullanmaktadır.
Ambalaj plastik içermez ve tamamen geri dönüştürülebilir.
Aksesuarlar ve Garanti
Kutuda AC adaptörü ve evraklar dışında ekstra bir şey yok. Bununla birlikte, daha zorlu RTX 4000 Ada GPU'muz nedeniyle ünitemizin ilk ThinkPad P16 Gen 2'deki 170 W adaptör yerine daha büyük bir 230 W AC adaptörle birlikte gönderildiğini belirtmek gerekir.
Üç yıllık üretici garantisi standart olarak geçerlidir.
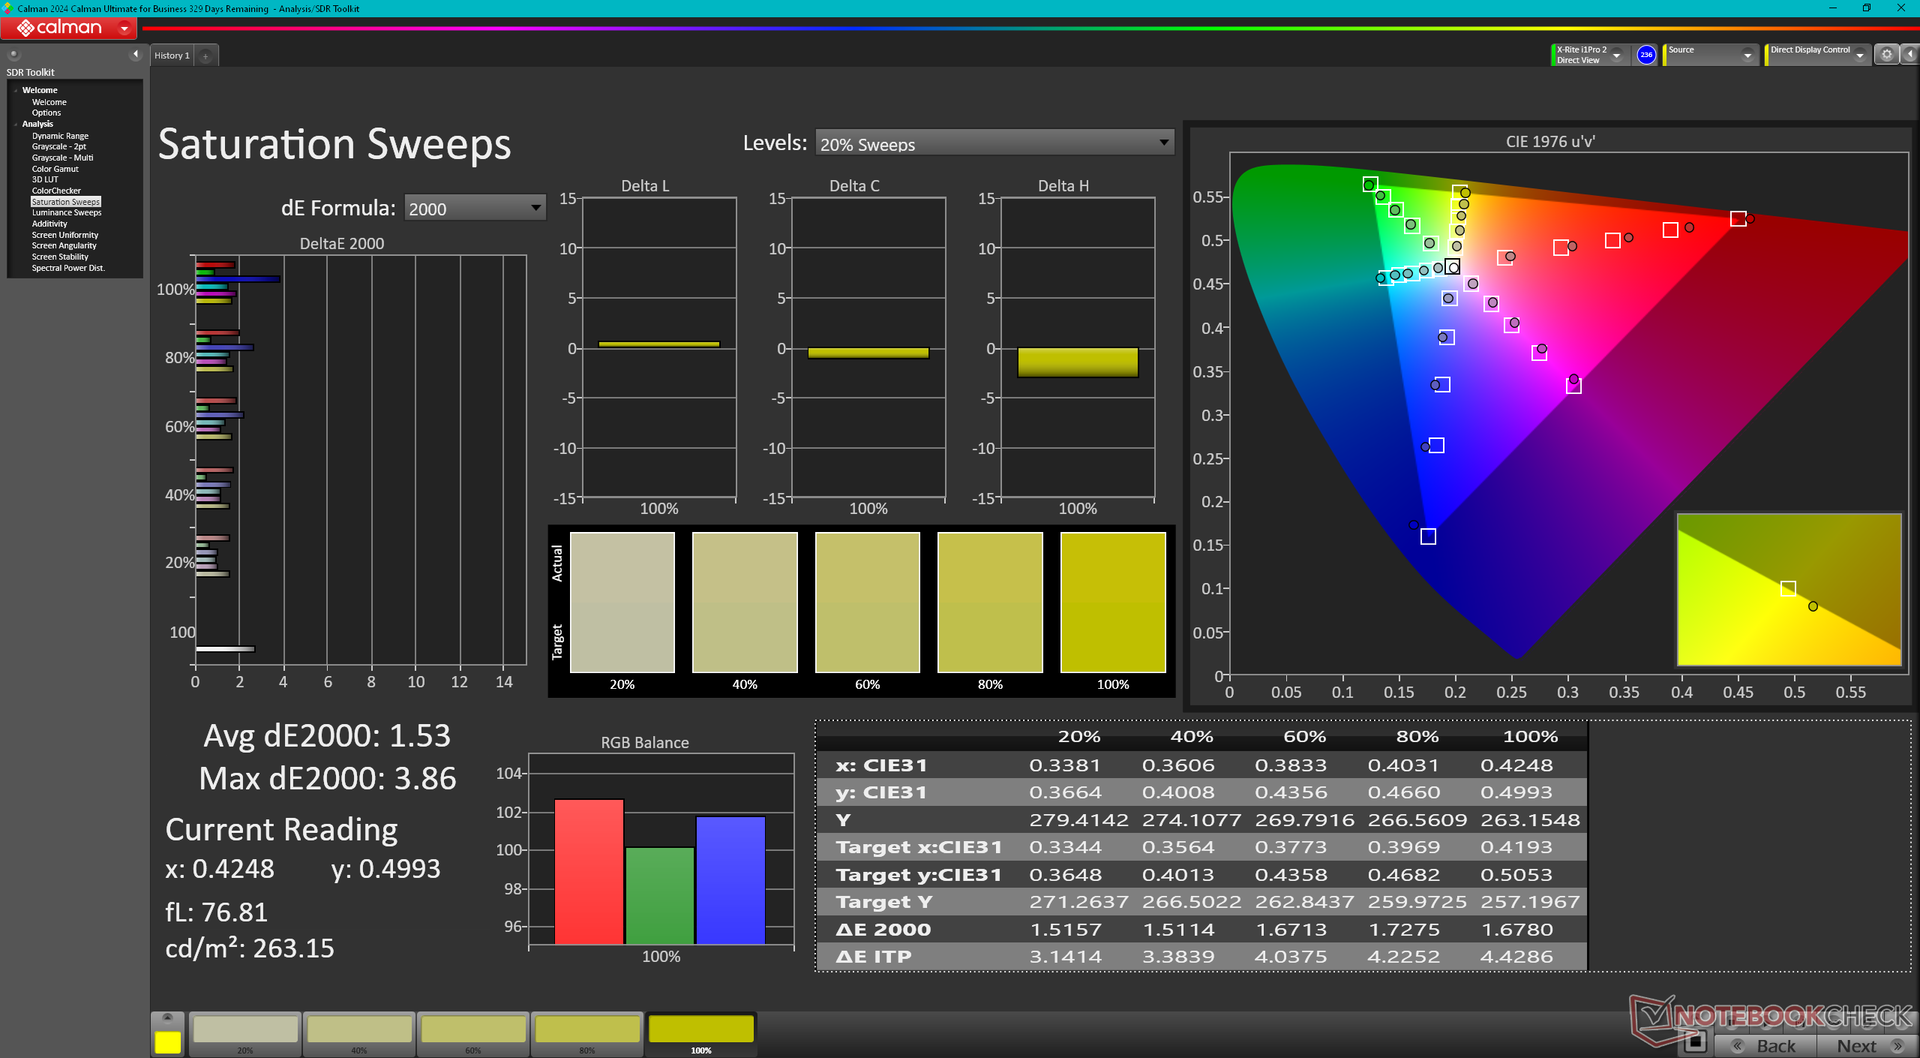
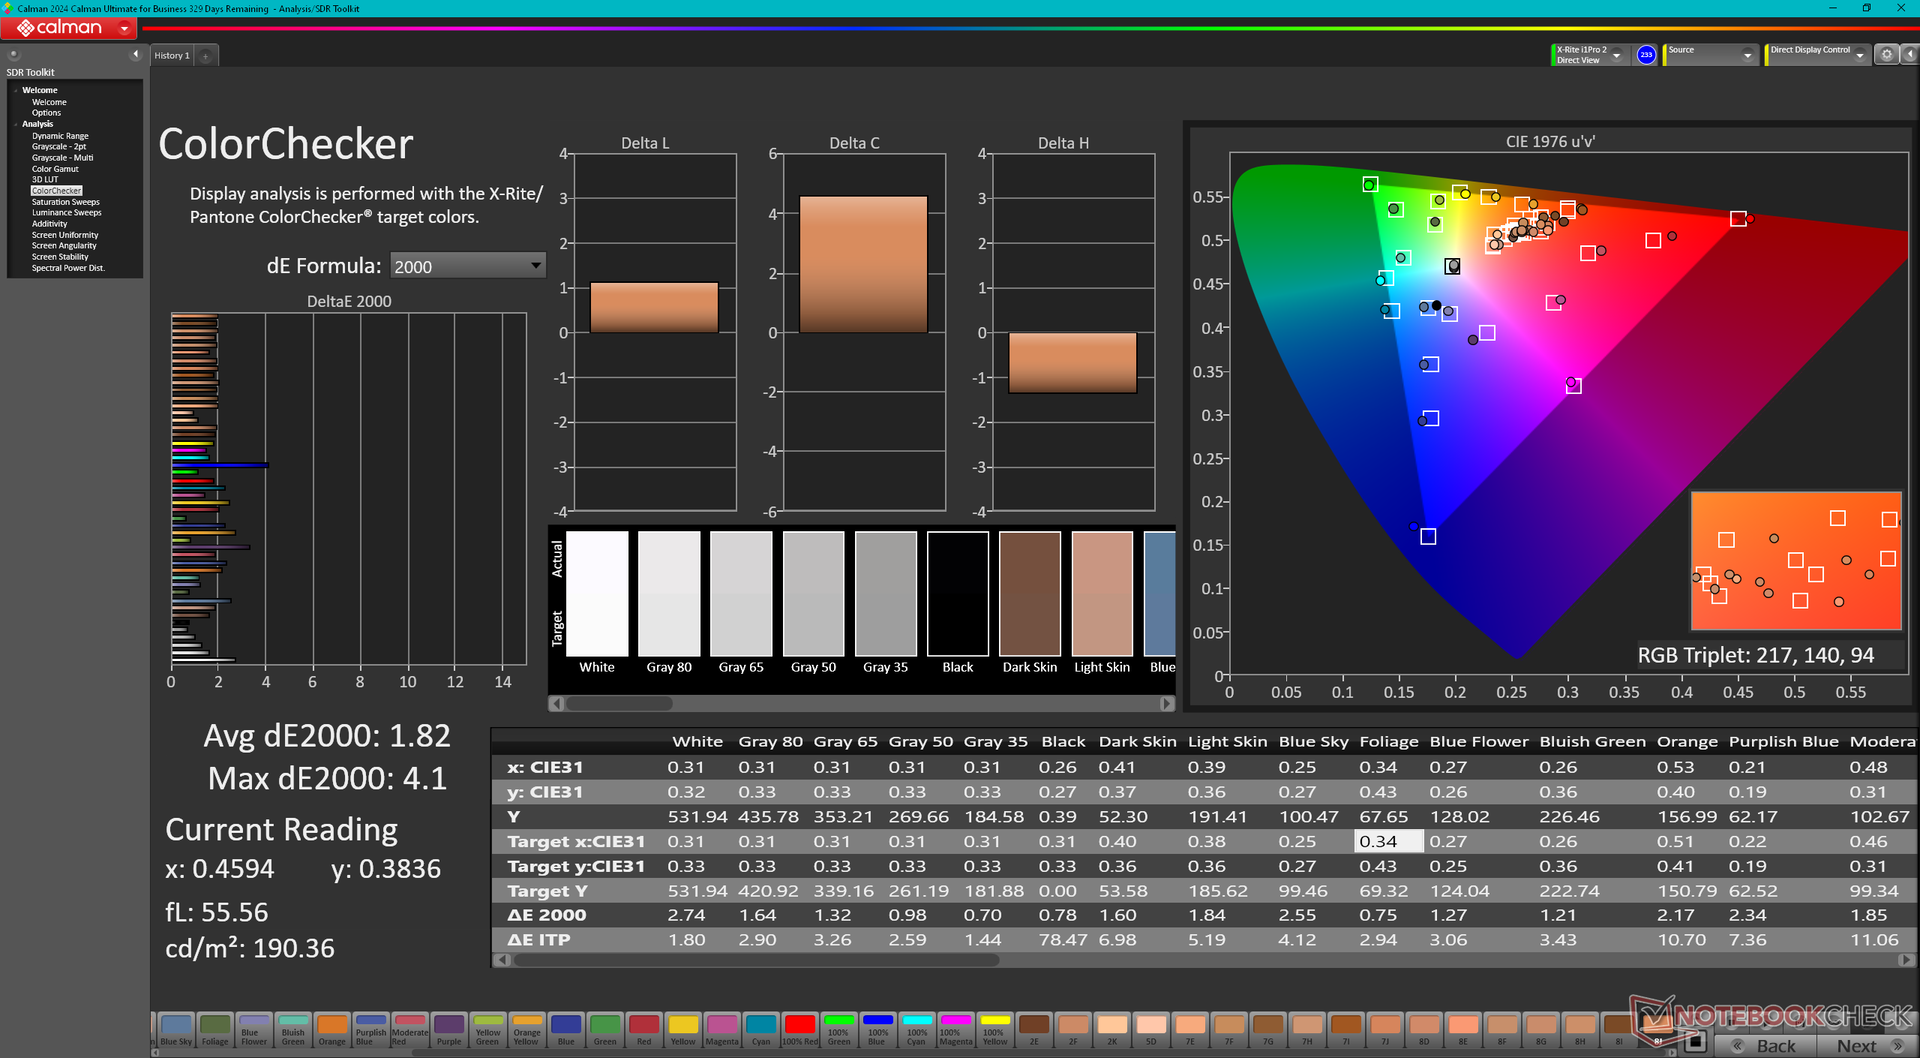
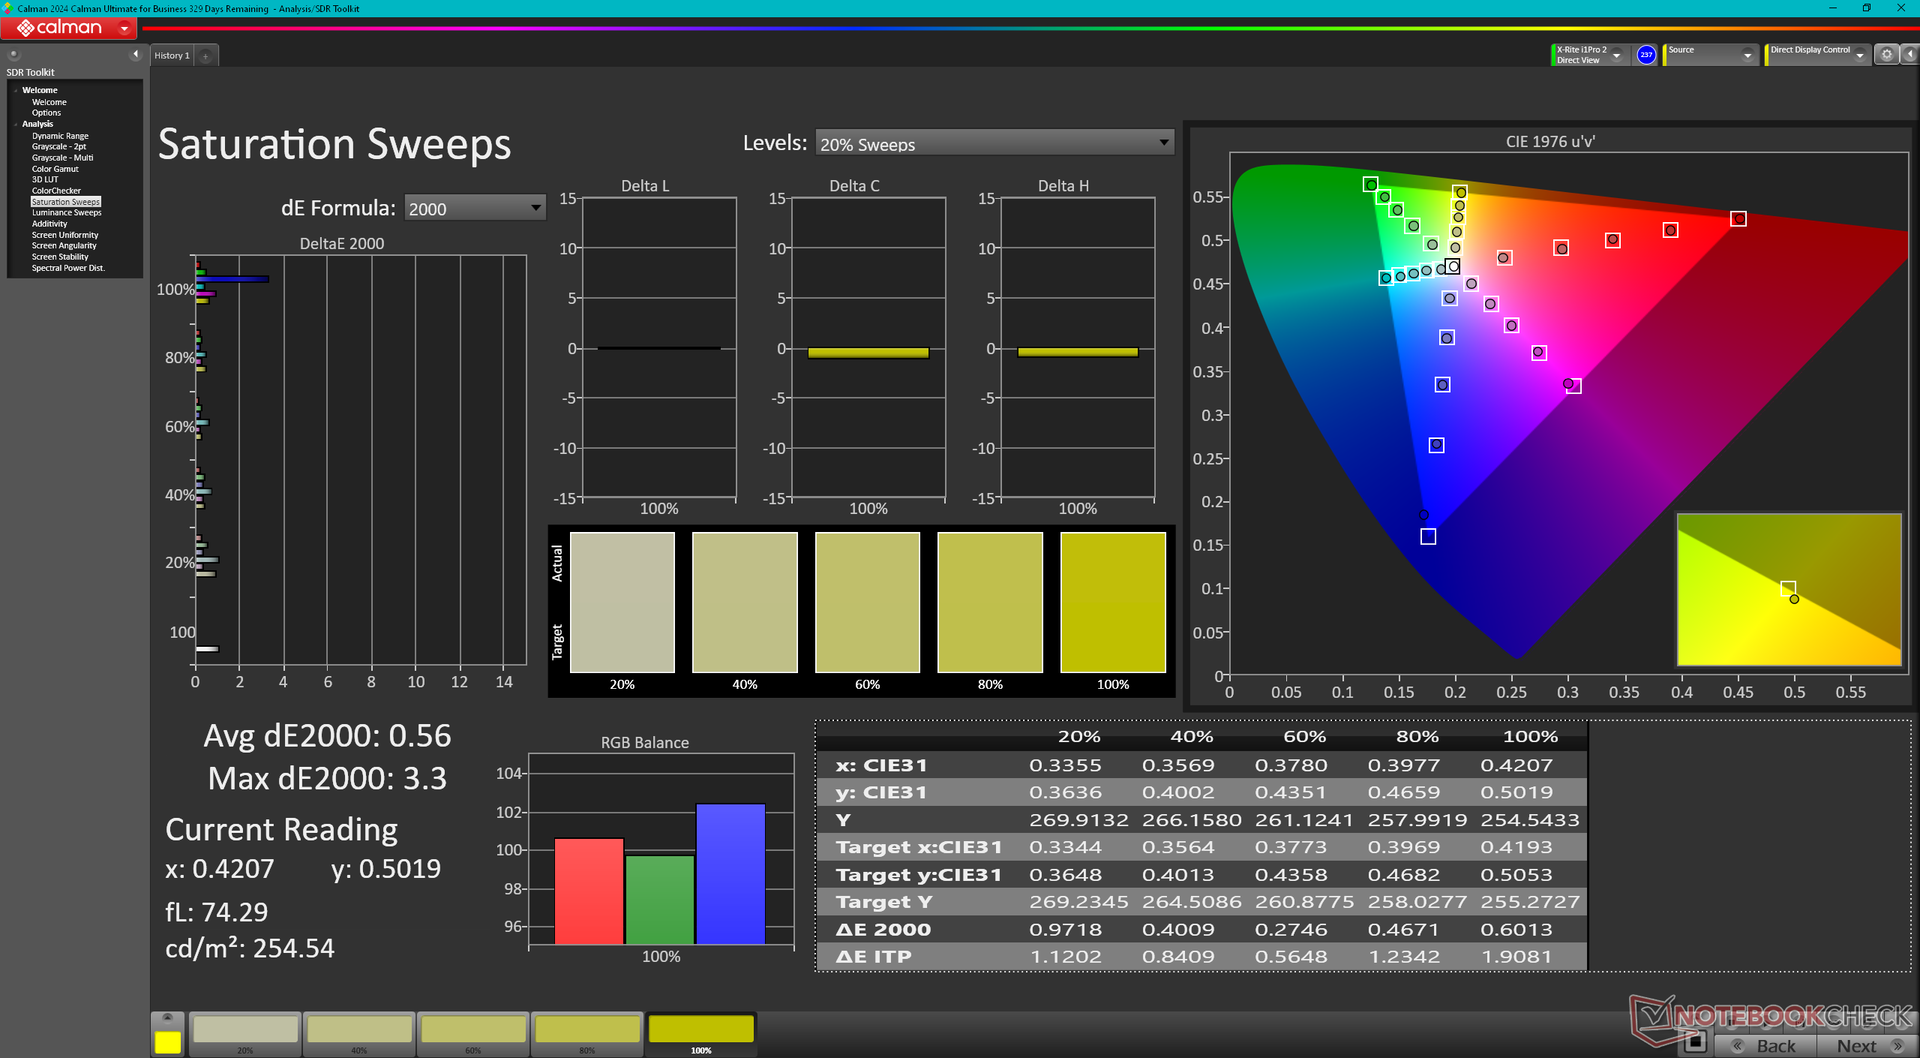
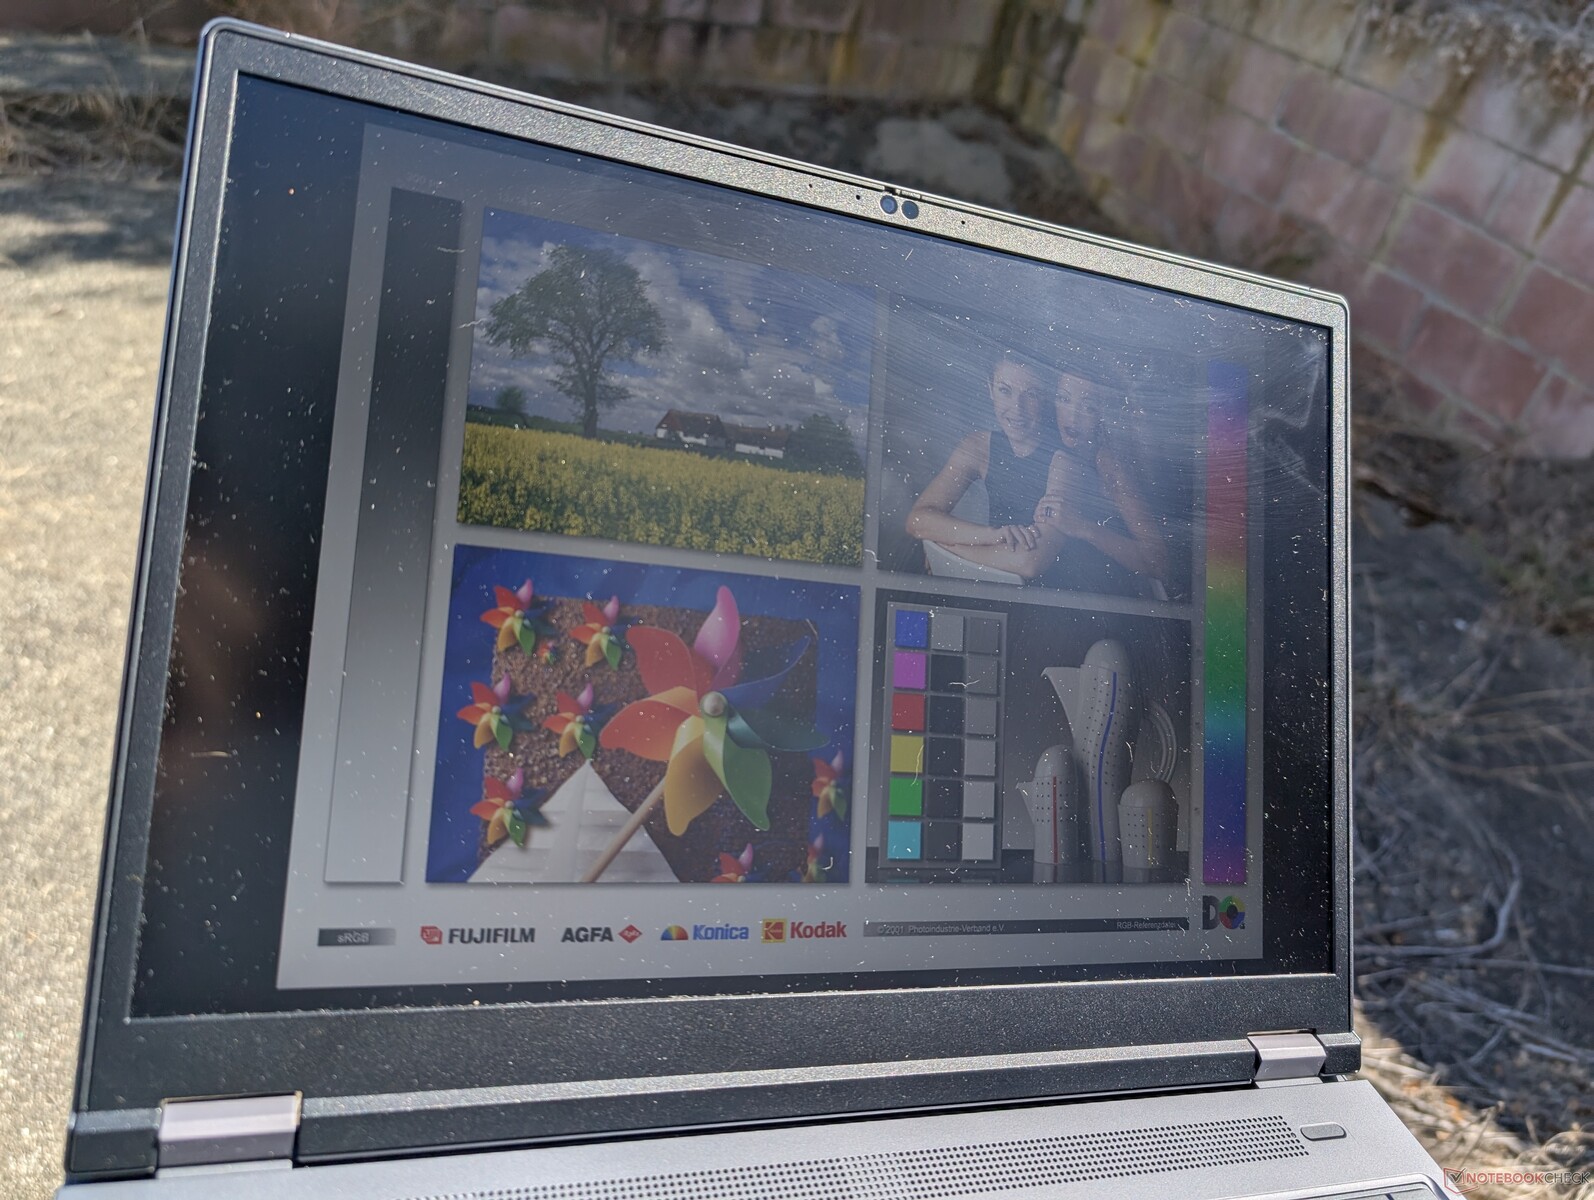
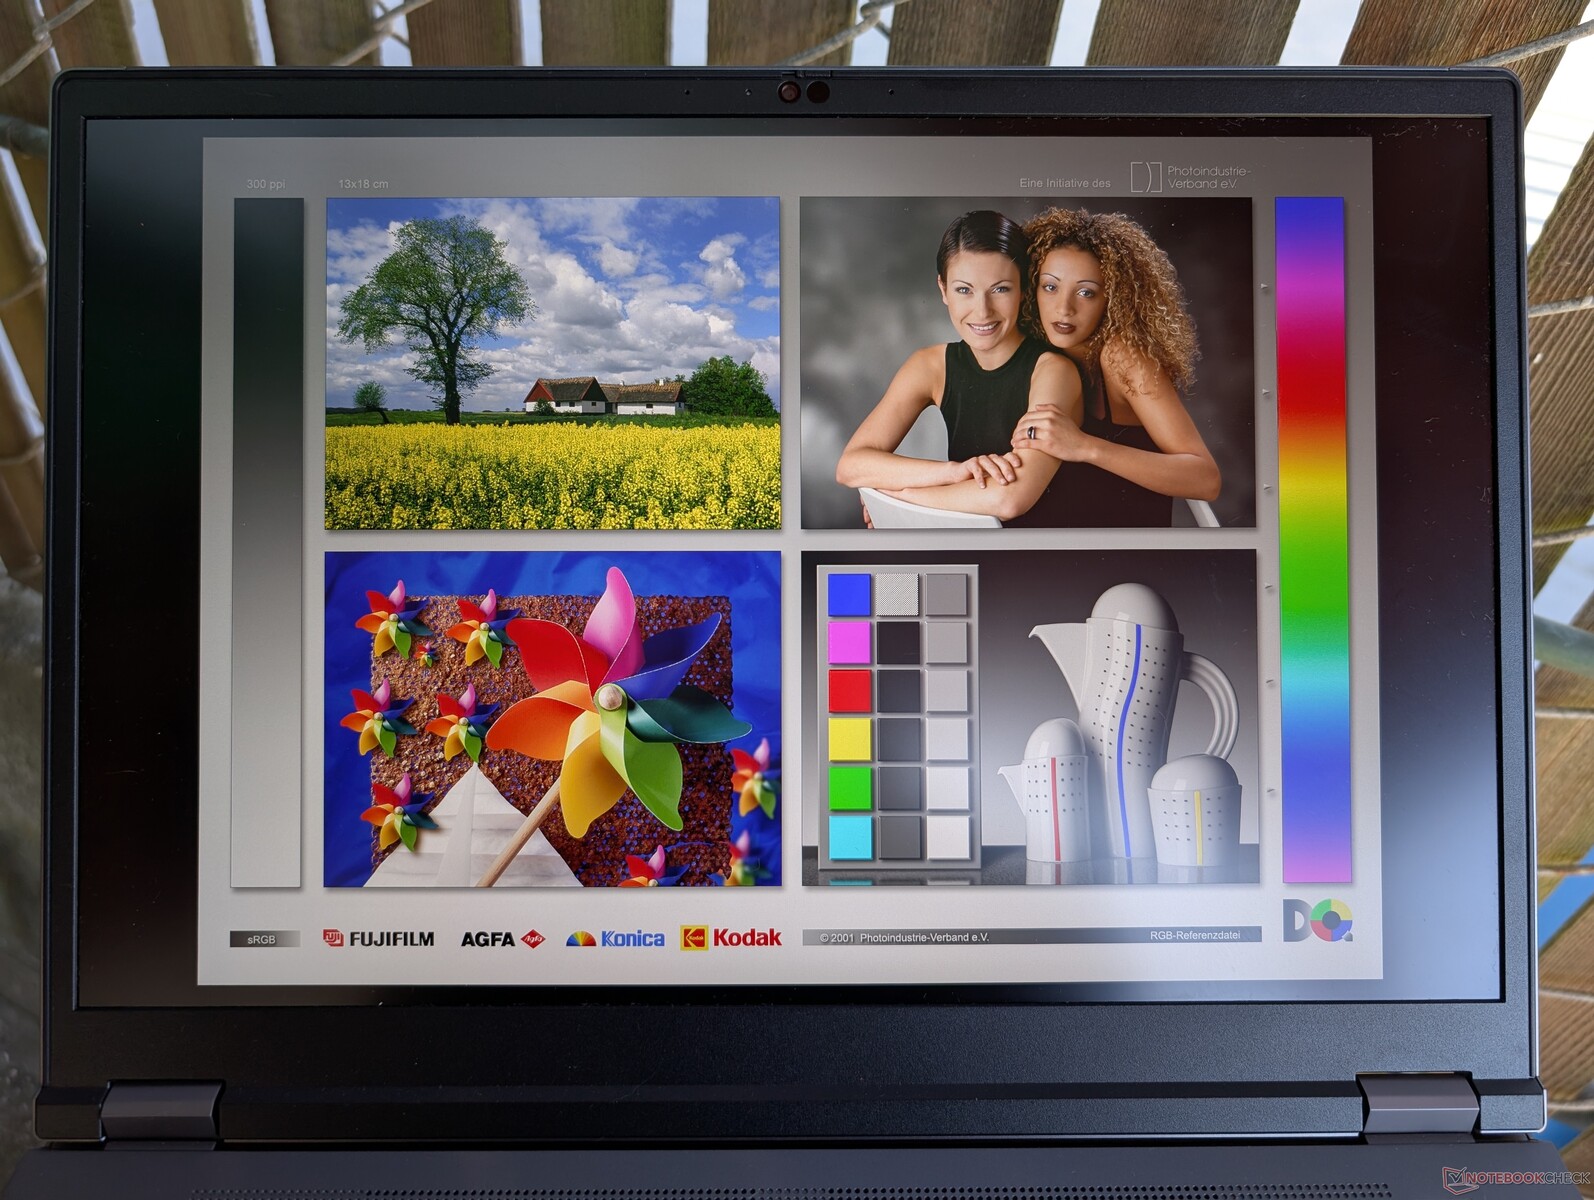
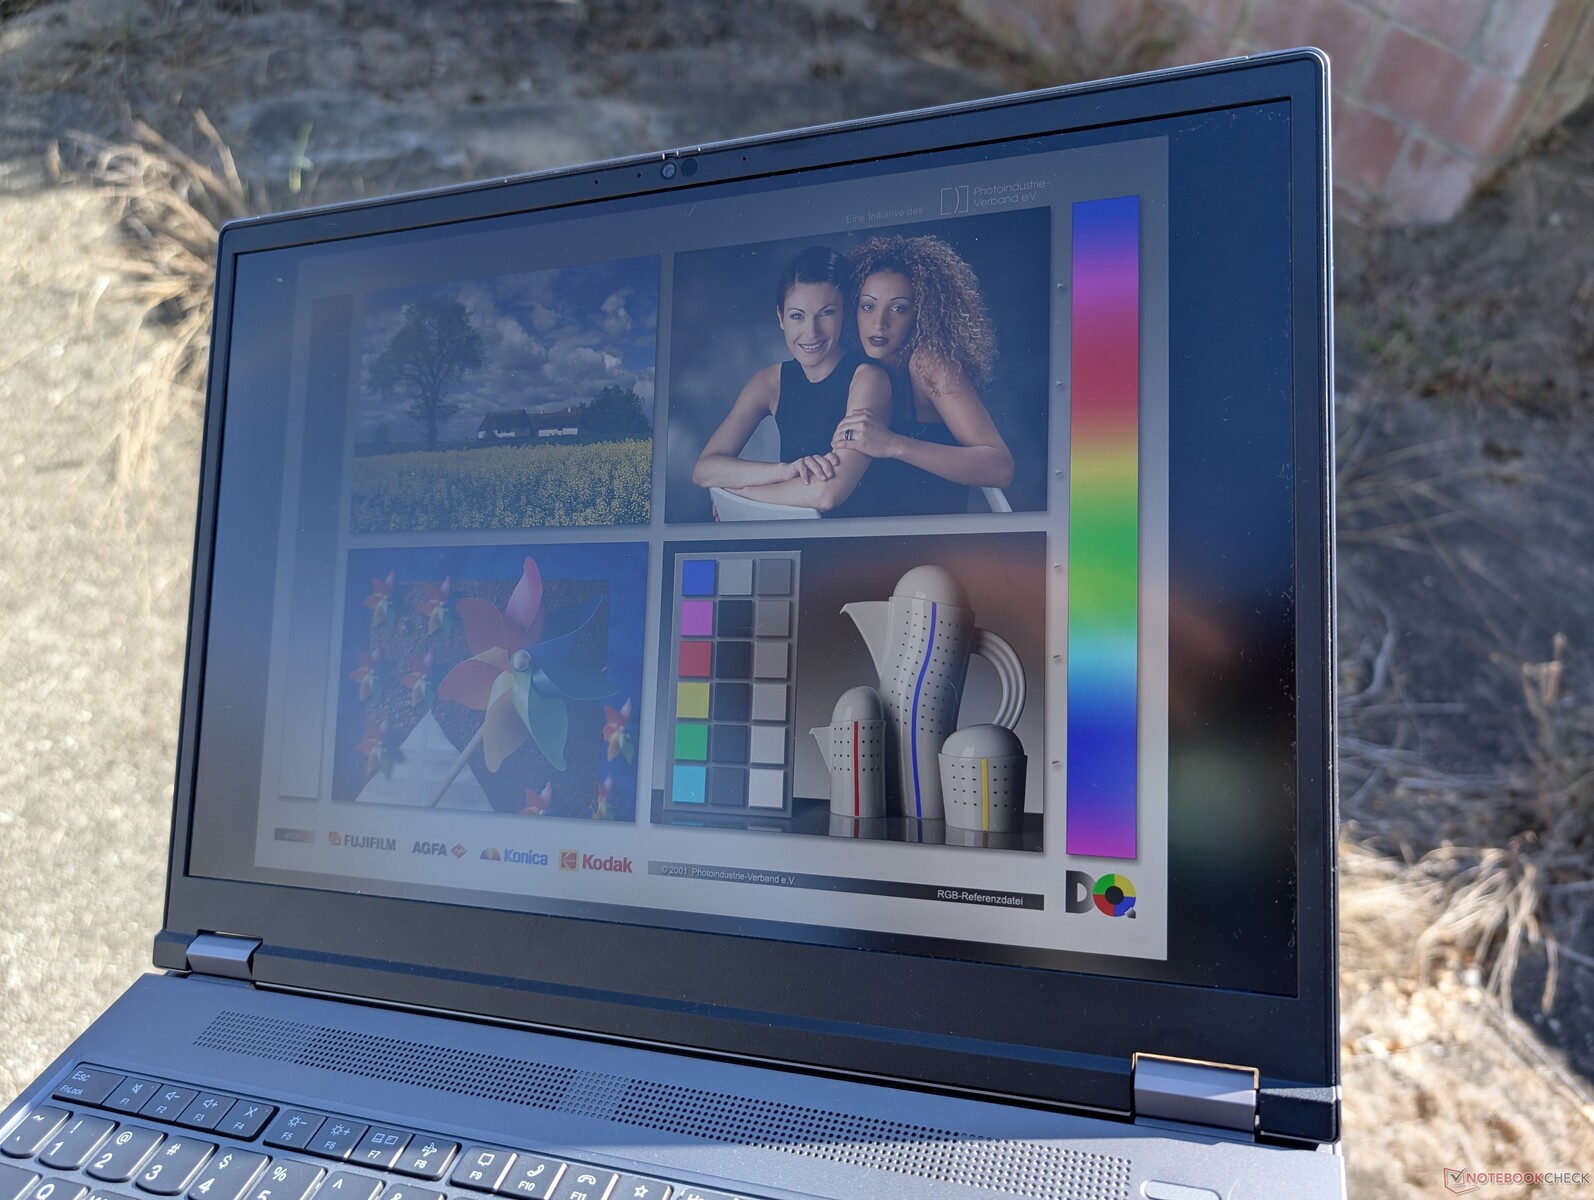
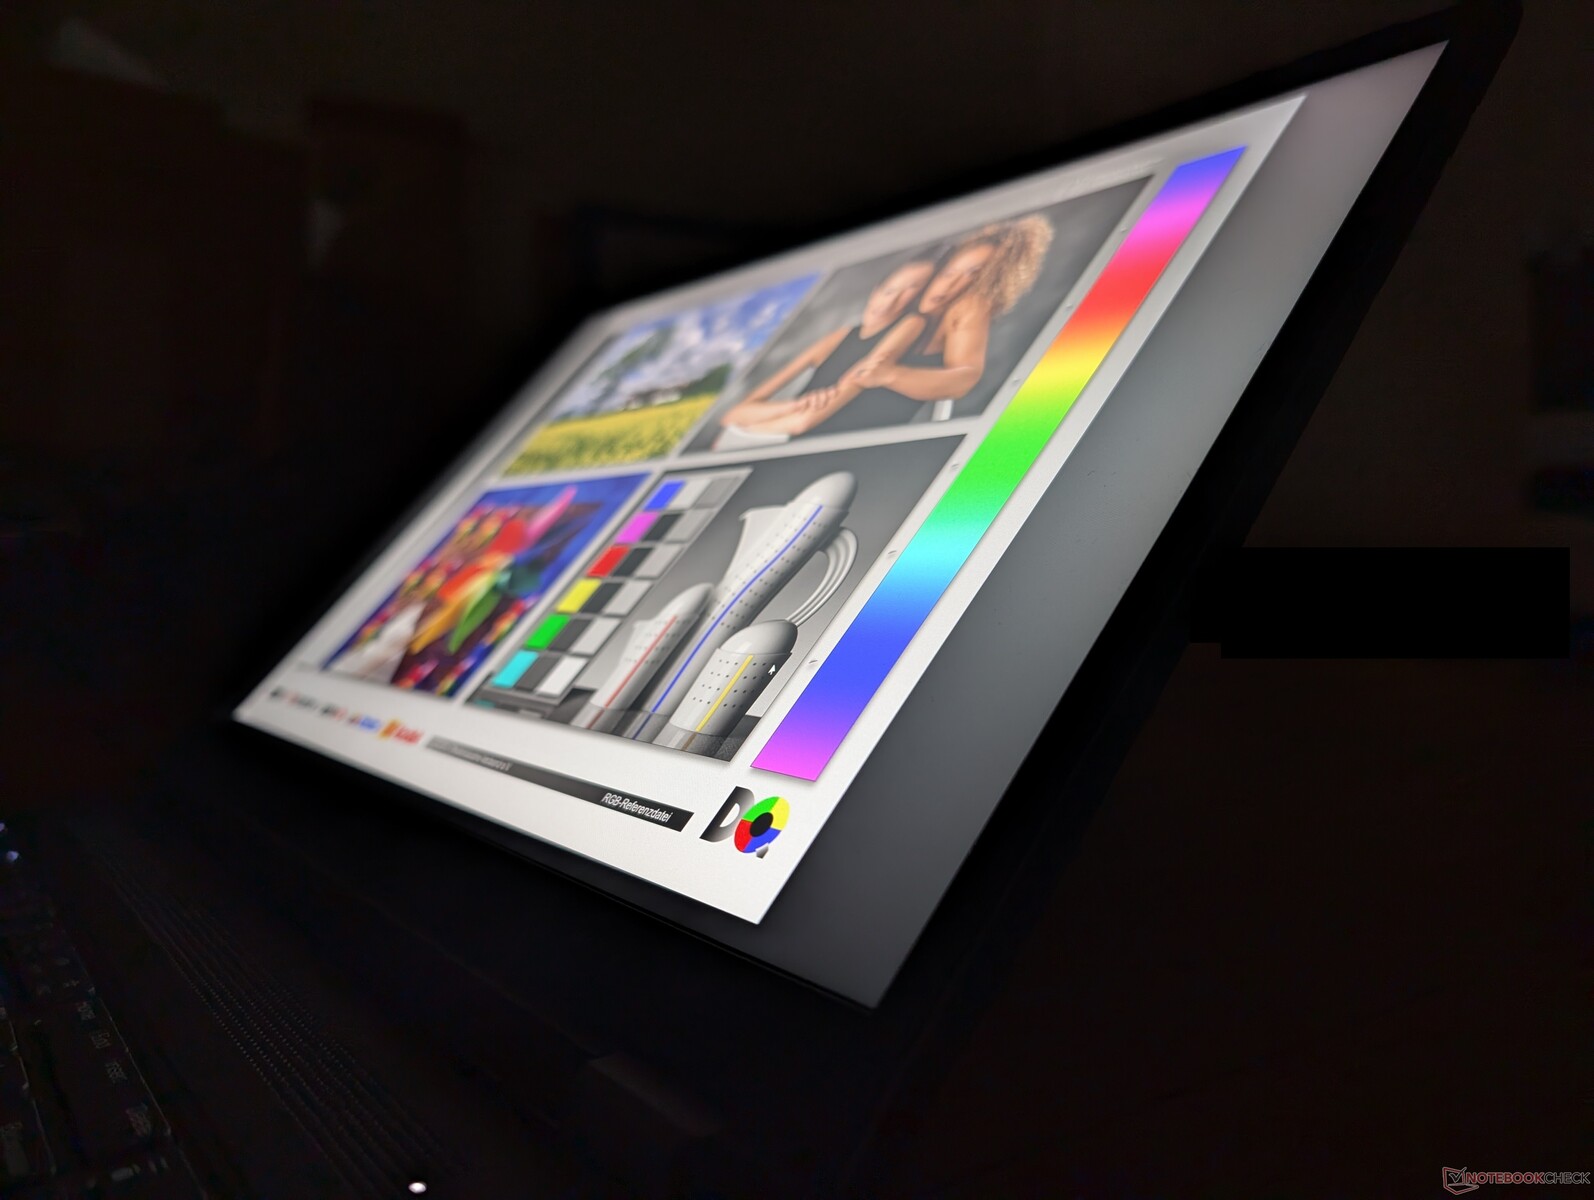
Ekran
İlginç bir şekilde, 1600p165 IPS panelimiz, ilk ThinkPad P16 Gen 2 ünitemizdeki 1600p165 IPS panel ile karşılaştırıldığında farklı bir üreticiye ait (NE160QDM-NY1 vs. MNG007DA1-9). Bunun dışında çekirdek özellikleri ve parlaklık aralarında neredeyse aynıdır. 2400p OLED ve 1200p IPS dahil olmak üzere diğer ekran seçenekleri mevcuttur.


| |||||||||||||||||||||||||
Aydınlatma: 89 %
Batarya modunda parlaklık: 531.5 cd/m²
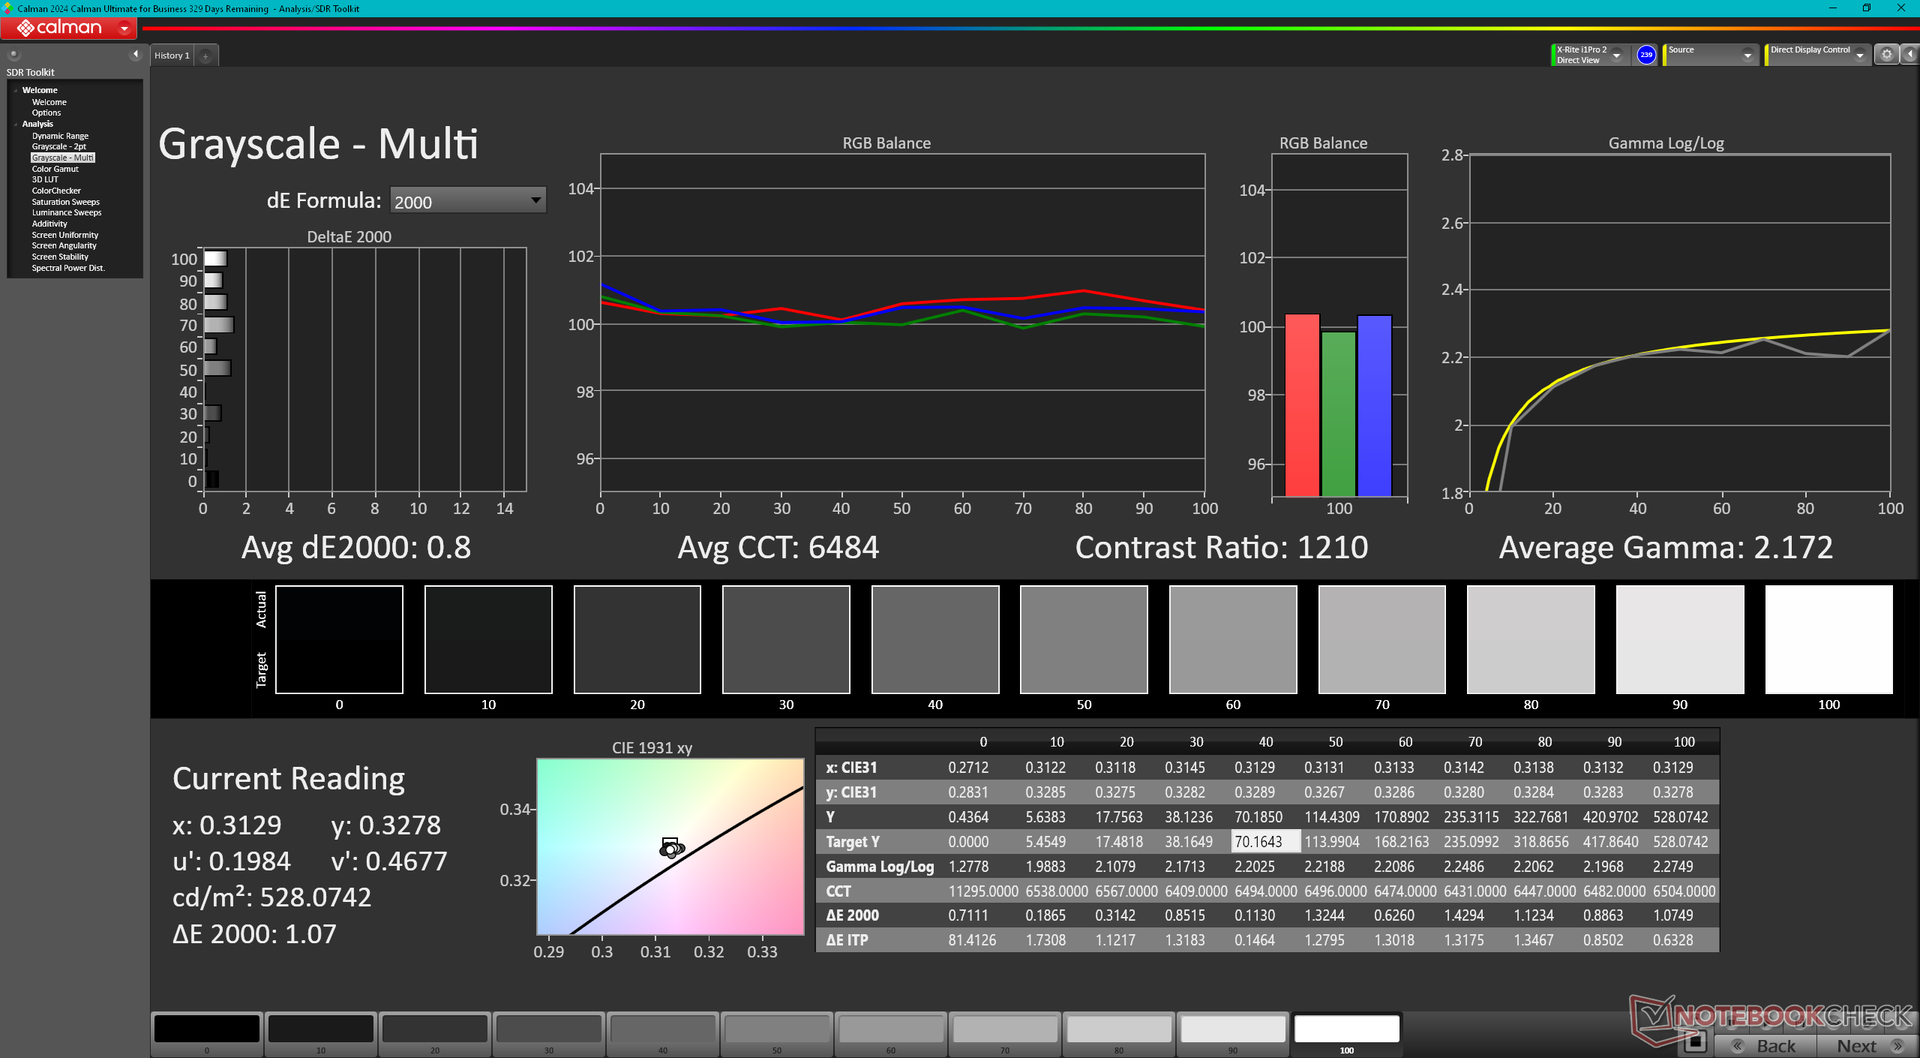
Kontrast: 1399:1 (Siyah: 0.38 cd/m²)
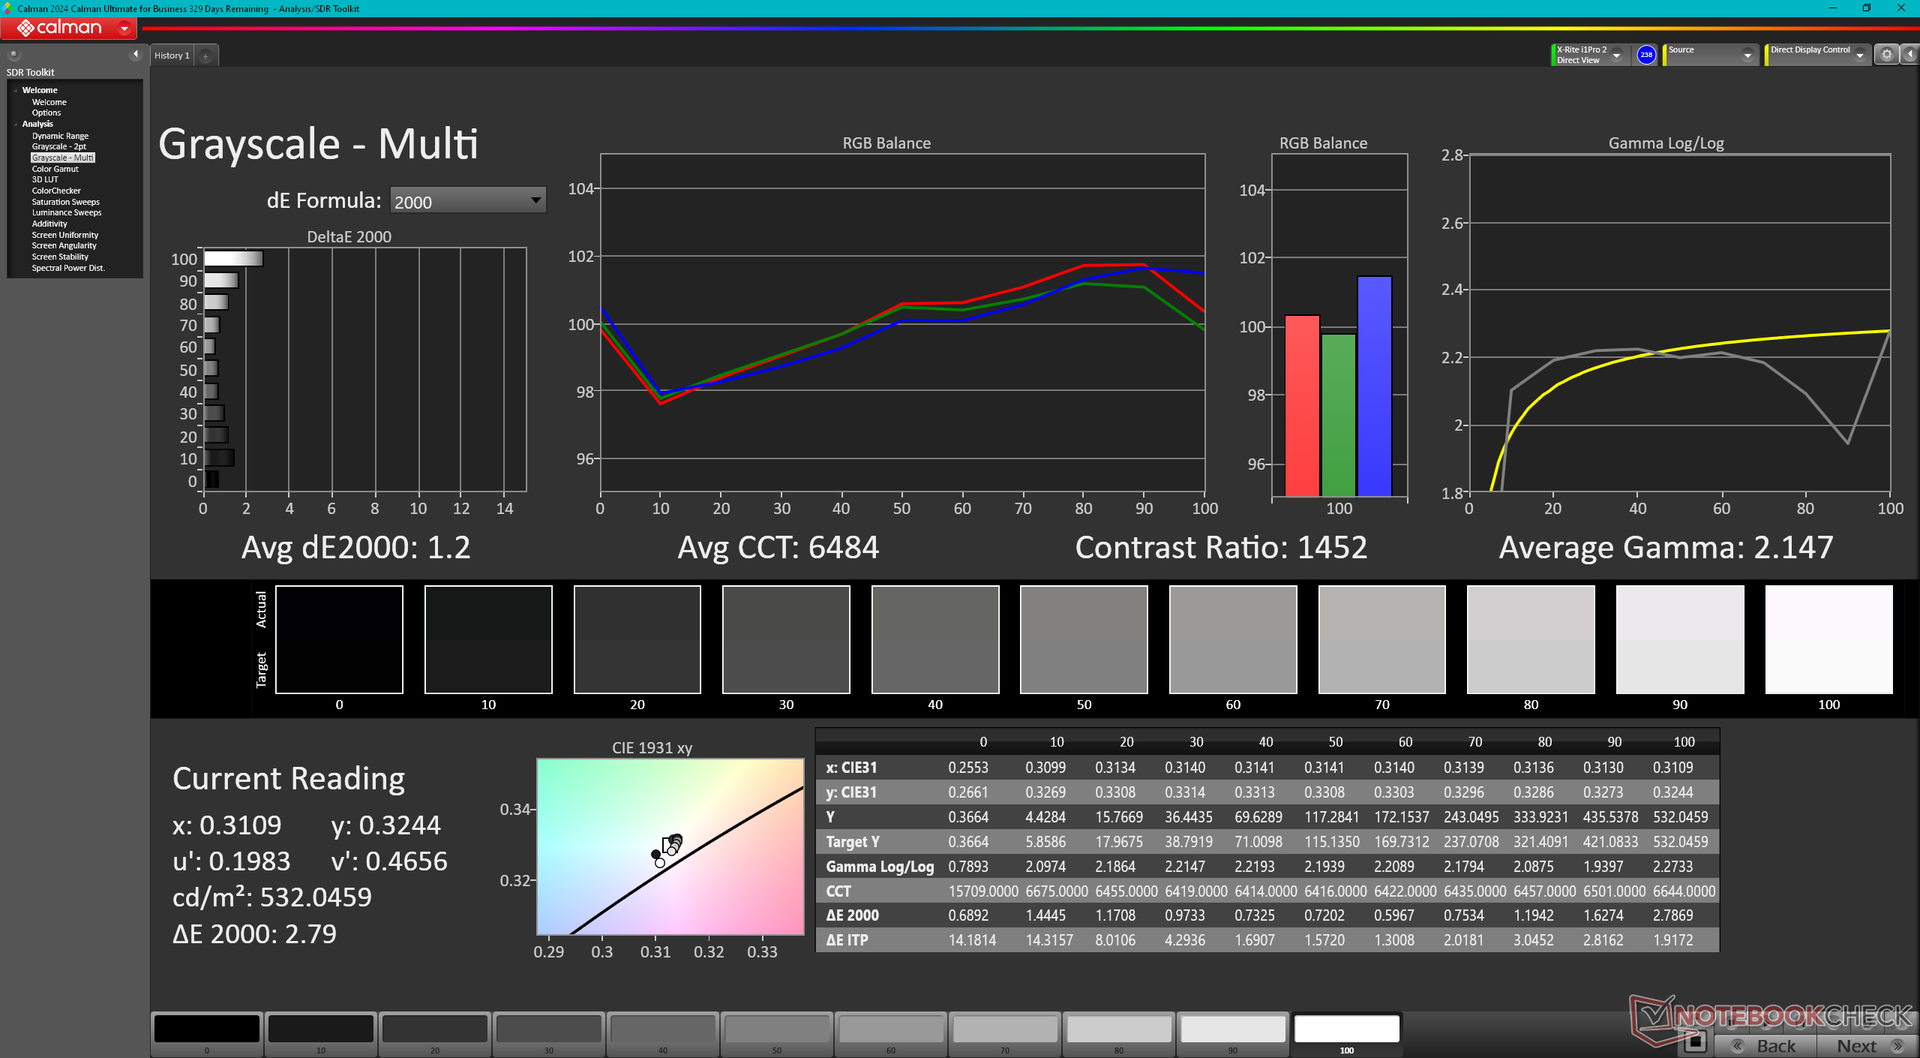
ΔE Color 1.82 | 0.5-29.43 Ø4.87, calibrated: 0.63
ΔE Greyscale 1.2 | 0.5-98 Ø5.1
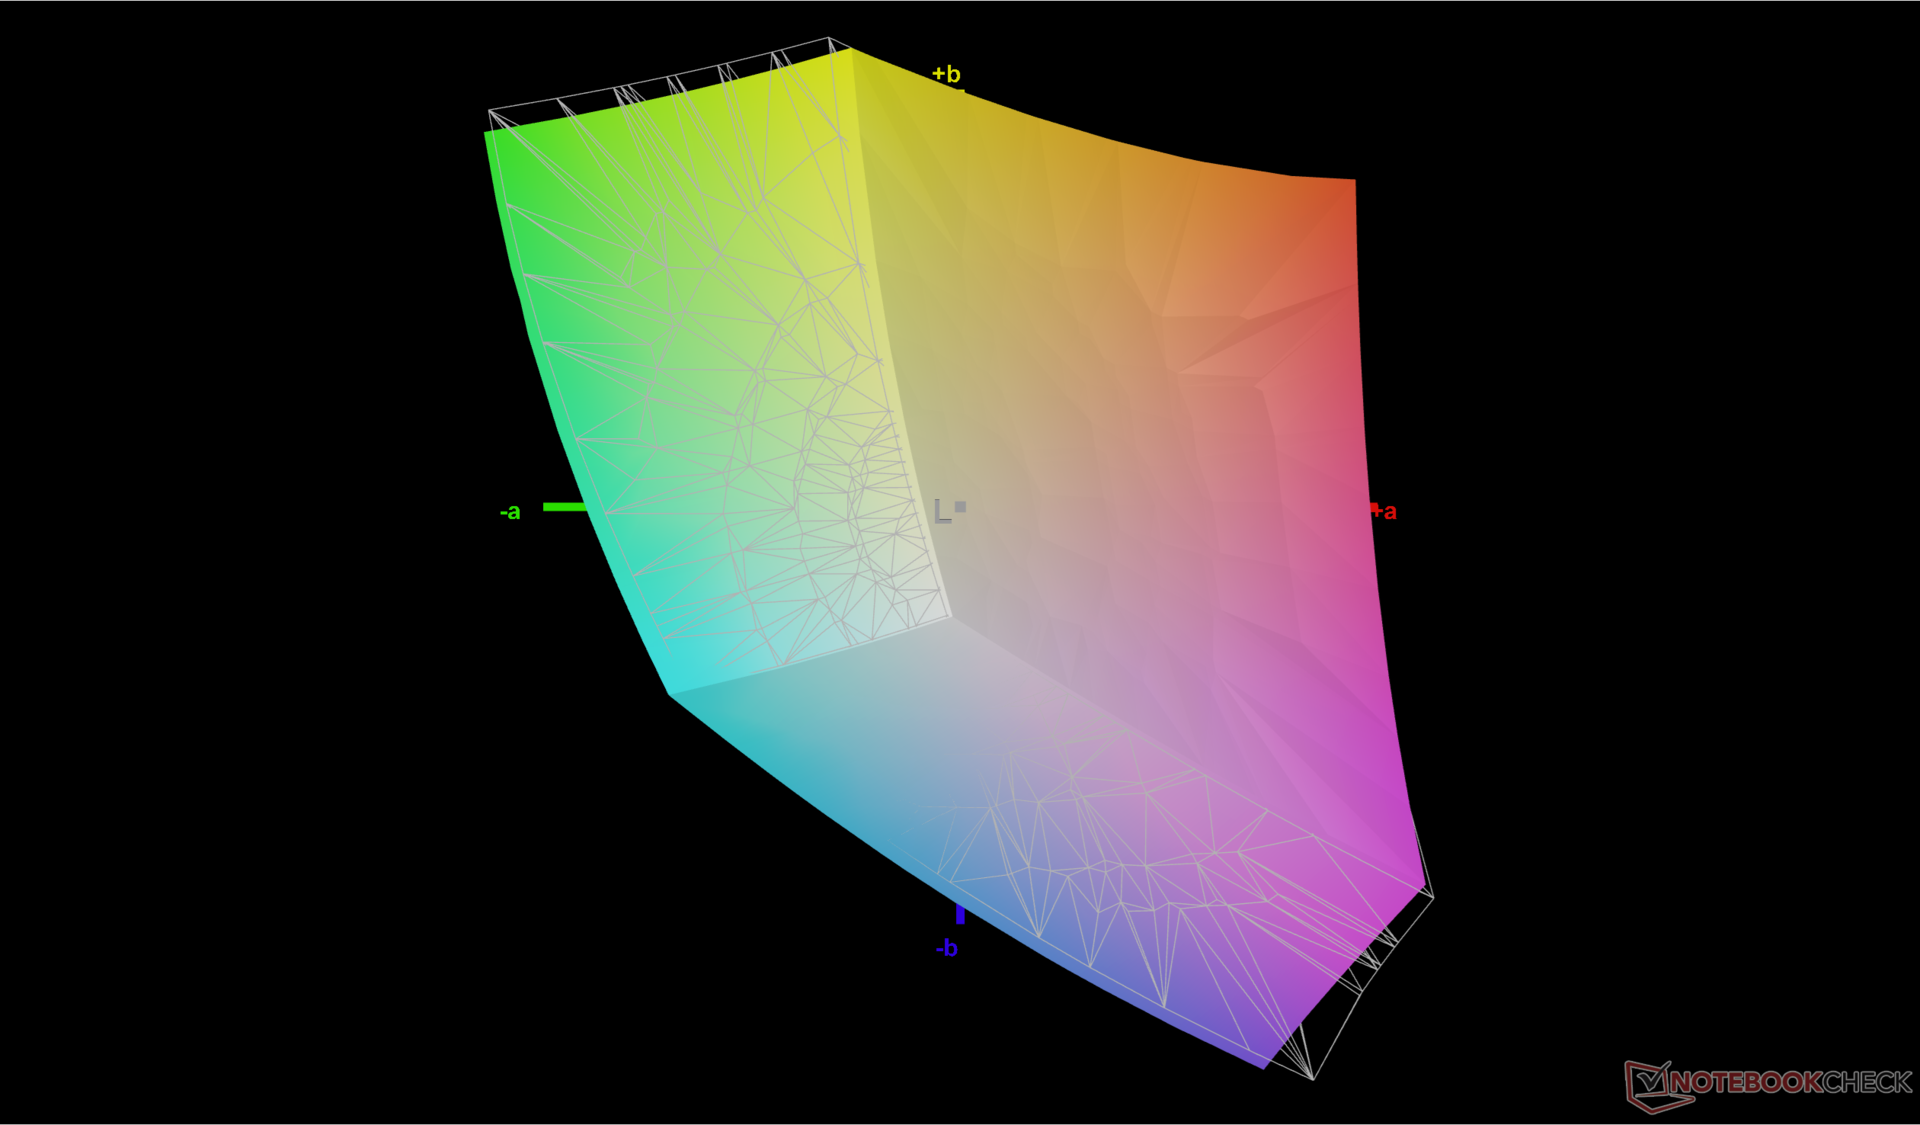
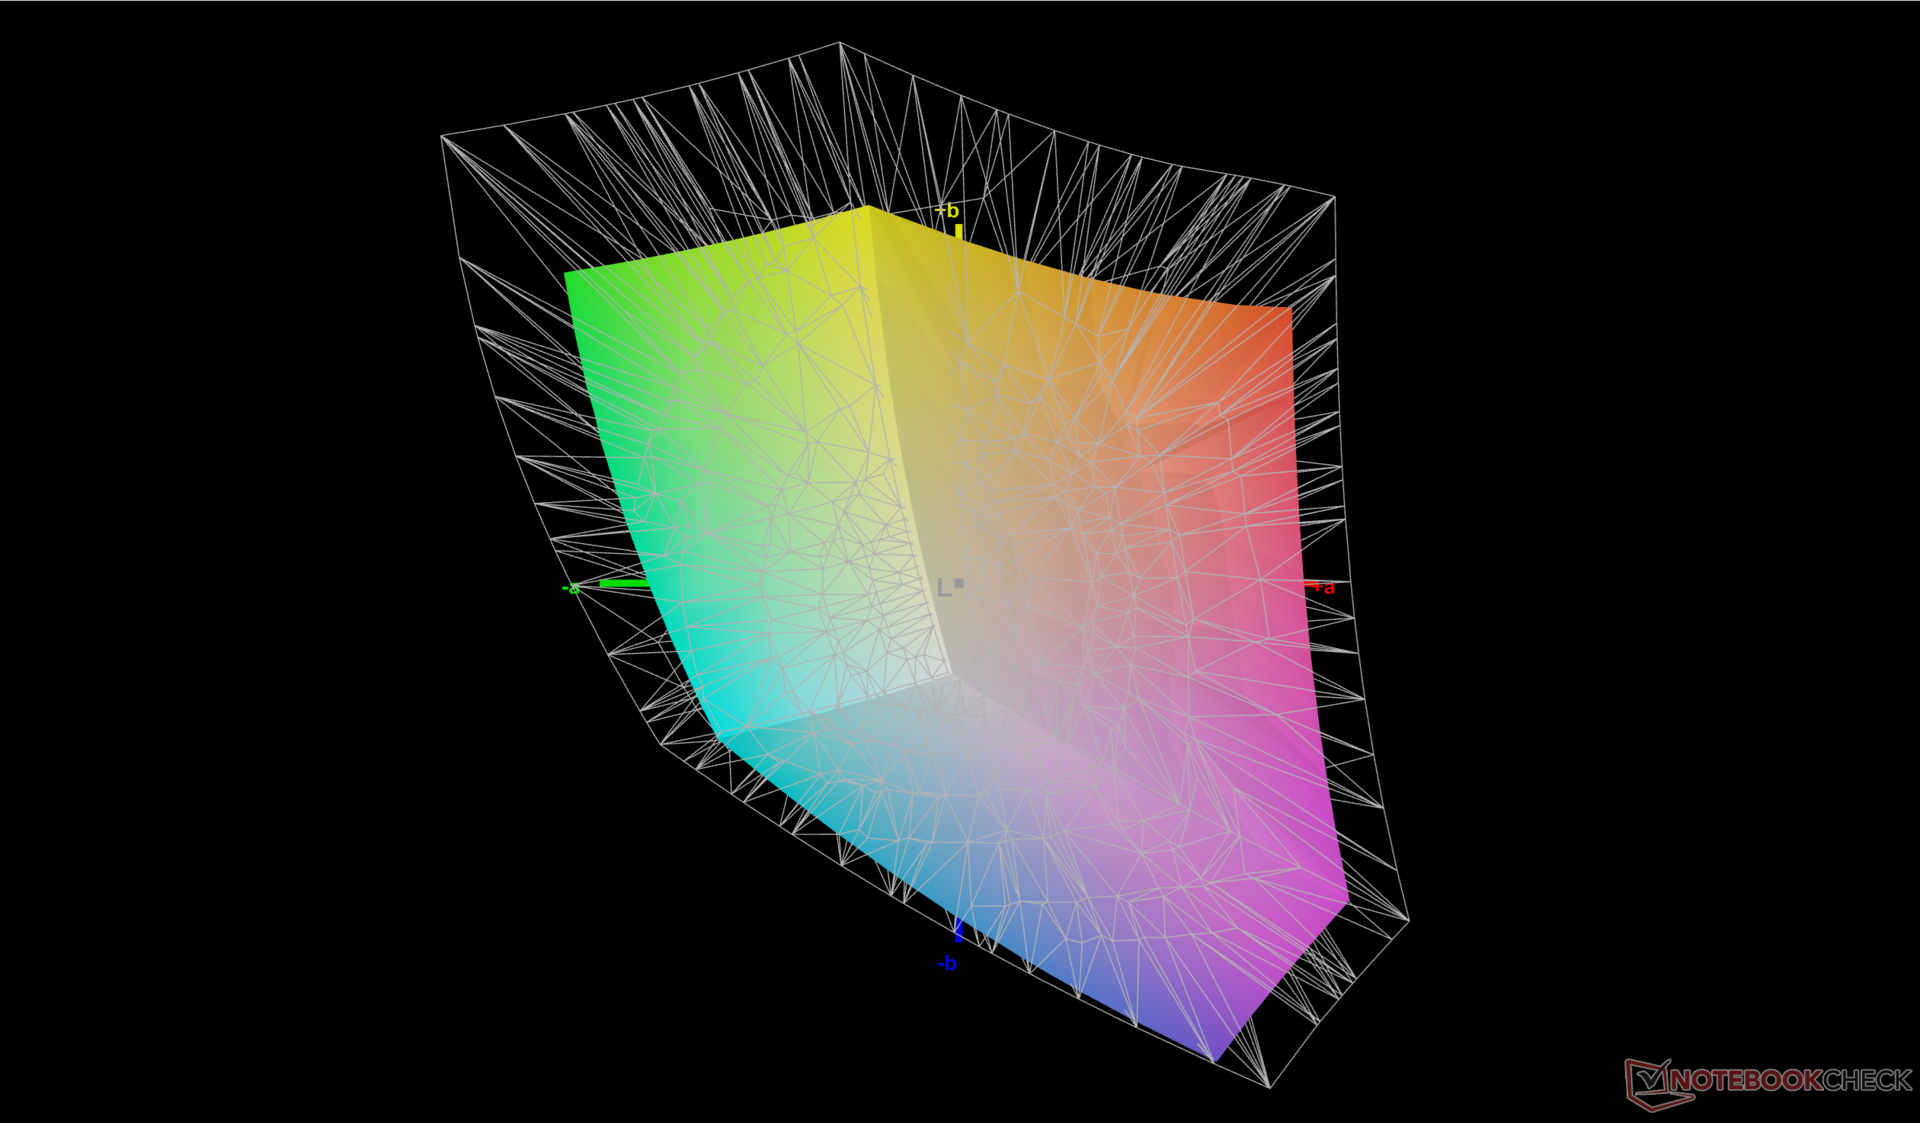
70.6% AdobeRGB 1998 (Argyll 2.2.0 3D)
96.9% sRGB (Argyll 2.2.0 3D)
68.4% Display P3 (Argyll 2.2.0 3D)
Gamma: 2.15
| Lenovo ThinkPad P16 Gen 2 NE160QDM-NY1, IPS, 2560x1600, 16", 165 Hz | Lenovo ThinkPad P16 G2 21FA000FGE MNG007DA1-9, IPS LED, 2560x1600, 16", 165 Hz | Lenovo ThinkPad P16s G2 21K9000CGE ATNA60YV04-0, OLED, 3840x2400, 16", 60 Hz | Lenovo ThinkPad P16 G1 RTX A5500 LP160UQ1-SPB1, IPS, 3840x2400, 16", 60 Hz | HP ZBook Power 16 G11 A AUOA0A9, IPS, 2560x1600, 16", 120 Hz | Dell Precision 5690 Samsung 160YV03, OLED, 3840x2400, 16", 60 Hz | |
|---|---|---|---|---|---|---|
| Display | 3% | 29% | 20% | 1% | 29% | |
| Display P3 Coverage | 68.4 | 71 4% | 99.9 46% | 82.9 21% | 69.1 1% | 99.8 46% |
| sRGB Coverage | 96.9 | 99.2 2% | 100 3% | 98.9 2% | 97.7 1% | 100 3% |
| AdobeRGB 1998 Coverage | 70.6 | 73.2 4% | 96.9 37% | 95.9 36% | 71 1% | 96.6 37% |
| Response Times | 4% | 88% | -248% | 10% | 86% | |
| Response Time Grey 50% / Grey 80% * | 14.1 ? | 12.8 ? 9% | 1.5 ? 89% | 45.6 ? -223% | 13.6 ? 4% | 1.7 ? 88% |
| Response Time Black / White * | 9.9 ? | 10.1 ? -2% | 1.3 ? 87% | 36.8 ? -272% | 8.4 ? 15% | 1.7 ? 83% |
| PWM Frequency | 60 | 60 ? | ||||
| Screen | -59% | -54% | -22% | -52% | -49% | |
| Brightness middle | 531.5 | 510 -4% | 416 -22% | 601.9 13% | 470.7 -11% | 348.1 -35% |
| Brightness | 499 | 517 4% | 421 -16% | 569 14% | 431 -14% | 351 -30% |
| Brightness Distribution | 89 | 89 0% | 98 10% | 77 -13% | 88 -1% | 97 9% |
| Black Level * | 0.38 | 0.37 3% | 0.47 -24% | 0.57 -50% | ||
| Contrast | 1399 | 1378 -2% | 1281 -8% | 826 -41% | ||
| Colorchecker dE 2000 * | 1.82 | 2.6 -43% | 1.3 29% | 2.45 -35% | 2.16 -19% | 4.18 -130% |
| Colorchecker dE 2000 max. * | 4.1 | 5.2 -27% | 2.8 32% | 4.46 -9% | 4.39 -7% | 6.68 -63% |
| Colorchecker dE 2000 calibrated * | 0.63 | 2.3 -265% | 2.9 -360% | 1.37 -117% | 0.97 -54% | |
| Greyscale dE 2000 * | 1.2 | 3.6 -200% | 1.8 -50% | 2.6 -117% | 3.7 -208% | 1.7 -42% |
| Gamma | 2.15 102% | 2.26 97% | 2.25 98% | 2.3 96% | 2.38 92% | 2.2 100% |
| CCT | 6484 100% | 5969 109% | 6574 99% | 6805 96% | 6765 96% | 6198 105% |
| Toplam Ortalama (Program / Ayarlar) | -17% /
-37% | 21% /
-10% | -83% /
-47% | -14% /
-32% | 22% /
-7% |
* ... daha küçük daha iyidir
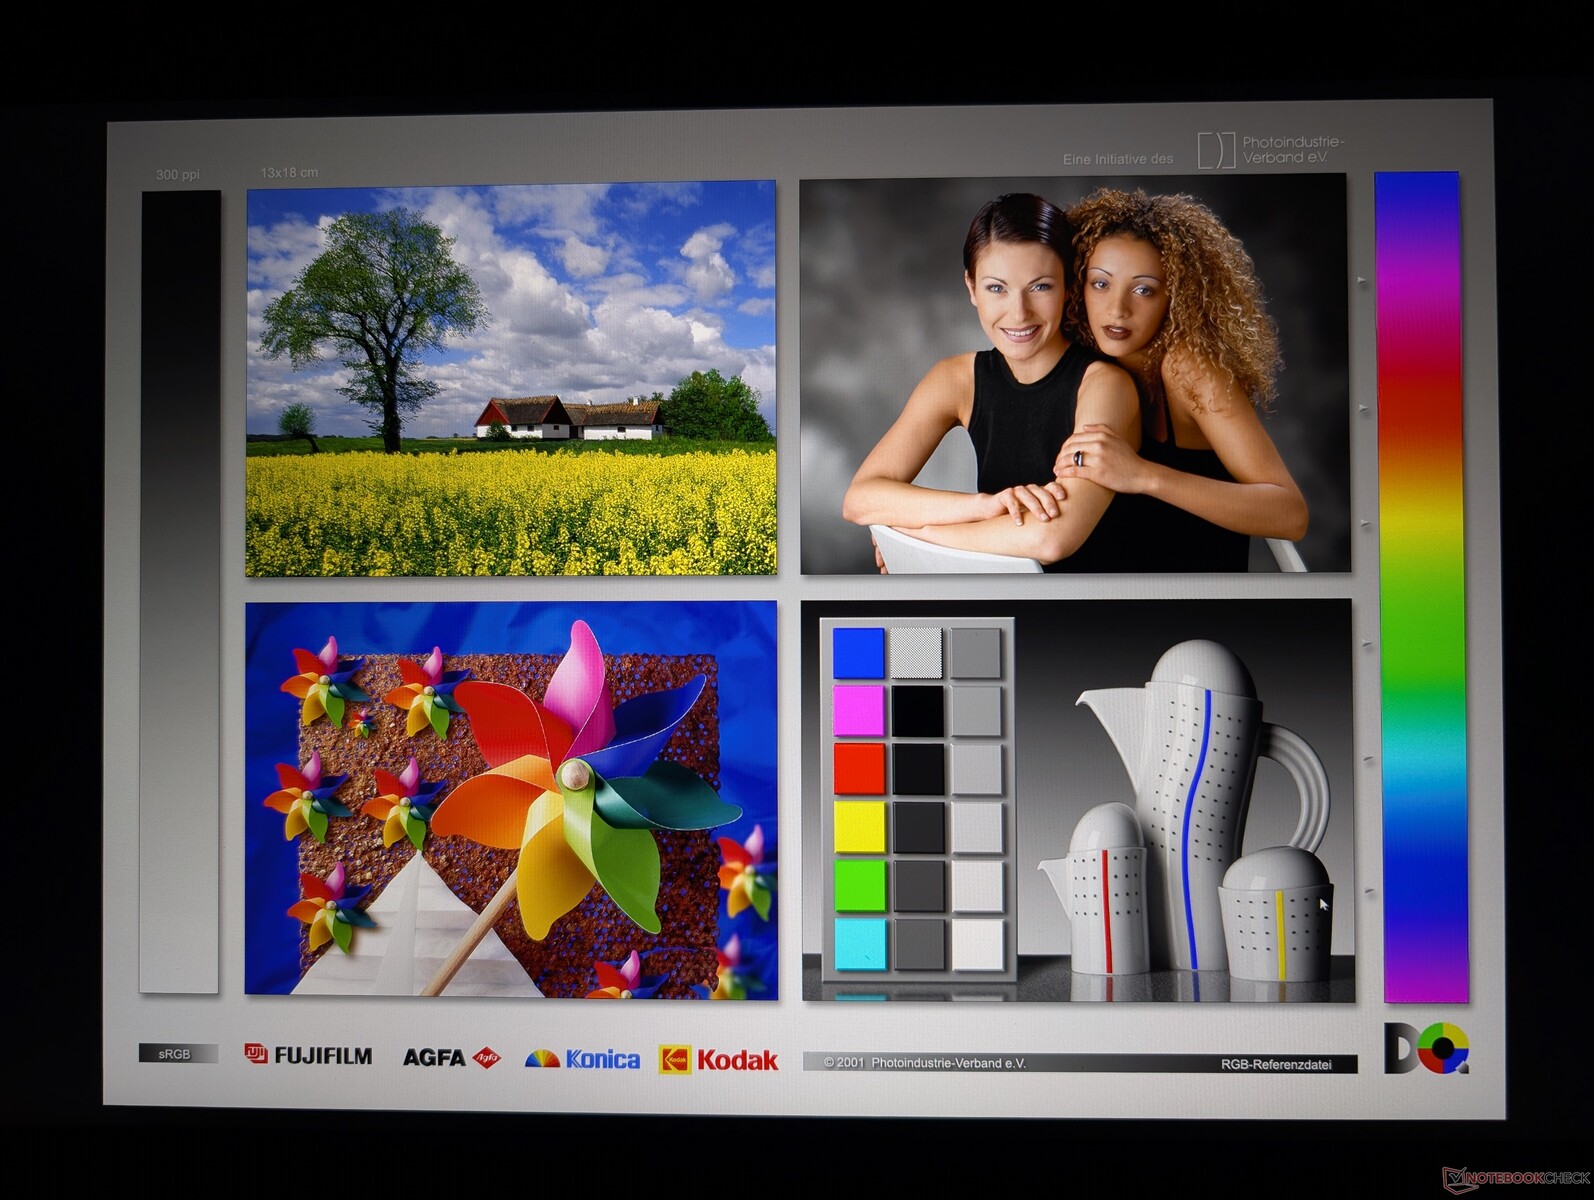
Ekran, sırasıyla sadece 1,2 ve 1,82 ortalama gri tonlama deltaE değerleriyle sRGB standardına göre önceden kalibre edilmiş olarak gelir. Bu nedenle çoğu kişi için son kullanıcı kalibrasyonu gerekli değildir.

Yanıt Sürelerini Görüntüle
| ↔ Tepki Süresi Siyahtan Beyaza | ||
|---|---|---|
| 9.9 ms ... yükseliş ↗ ve sonbahar↘ birleşimi | ↗ 5 ms yükseliş | 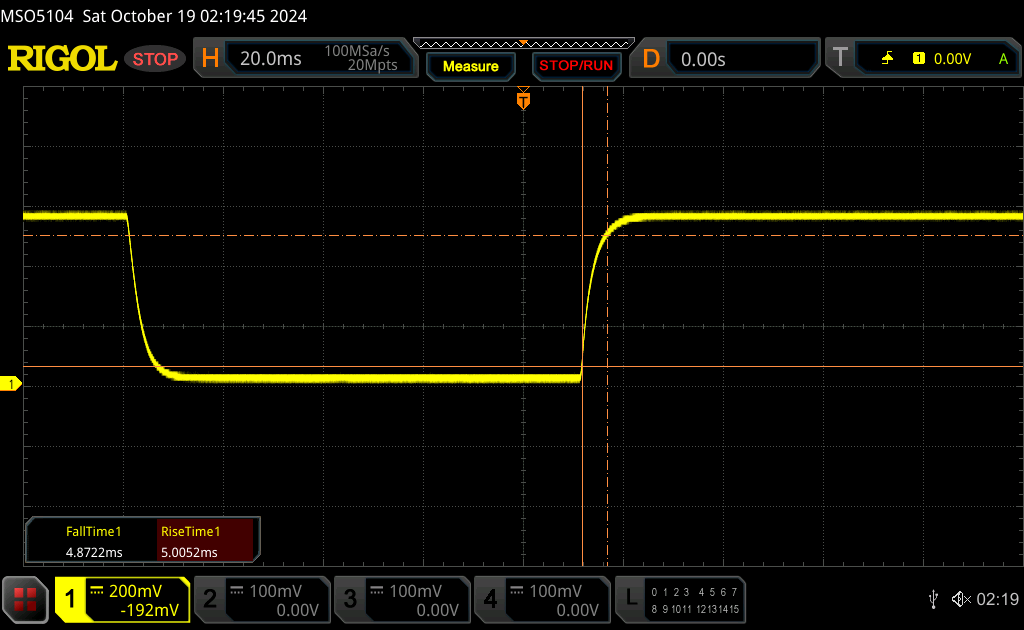 |
| ↘ 4.9 ms sonbahar | ||
| Ekran, testlerimizde hızlı yanıt oranları gösteriyor ve oyun oynamaya uygun olmalı. Karşılaştırıldığında, test edilen tüm cihazlar 0.1 (minimum) ile 240 (maksimum) ms arasında değişir. » Tüm cihazların 24 %'si daha iyi. Bu, ölçülen yanıt süresinin test edilen tüm cihazların ortalamasından (20.8 ms) daha iyi olduğu anlamına gelir. | ||
| ↔ Tepki Süresi %50 Griden %80 Griye | ||
| 14.1 ms ... yükseliş ↗ ve sonbahar↘ birleşimi | ↗ 6.7 ms yükseliş | 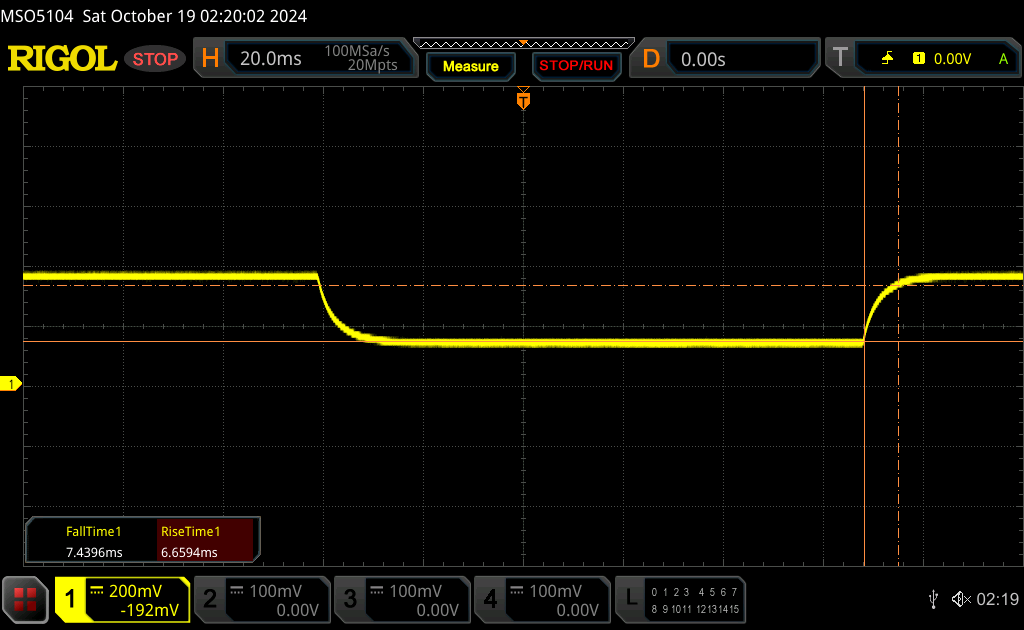 |
| ↘ 7.4 ms sonbahar | ||
| Ekran, testlerimizde iyi yanıt oranları gösteriyor ancak rekabetçi oyuncular için çok yavaş olabilir. Karşılaştırıldığında, test edilen tüm cihazlar 0.165 (minimum) ile 636 (maksimum) ms arasında değişir. » Tüm cihazların 25 %'si daha iyi. Bu, ölçülen yanıt süresinin test edilen tüm cihazların ortalamasından (32.5 ms) daha iyi olduğu anlamına gelir. | ||
Ekran Titremesi / PWM (Darbe Genişliği Modülasyonu)
| Ekran titriyor / PWM algılanmadı | 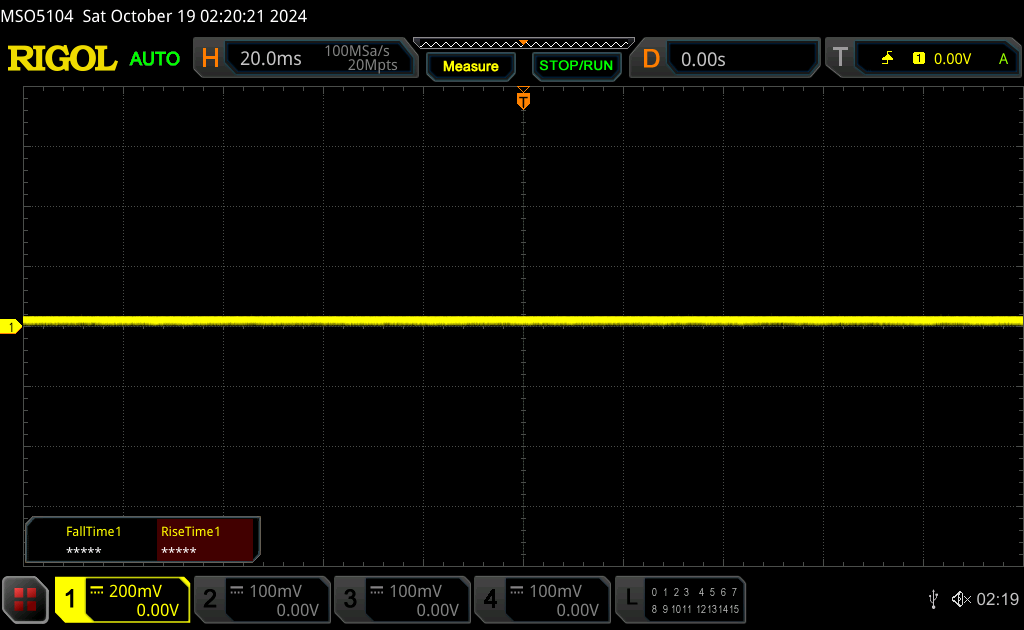 | ||
Karşılaştırıldığında: Test edilen tüm cihazların %53 %'si ekranı karartmak için PWM kullanmıyor. PWM tespit edilirse, ortalama 8516 (minimum: 5 - maksimum: 343500) Hz ölçüldü. | |||
Performans
Test Koşulları
Aşağıdaki kıyaslamaları çalıştırmadan önce Windows'u Performans moduna ve GPU'yu ayrı moda ayarladık. Nvidia Denetim Masası'na göre sistem Advanced Optimus'u desteklemiyor.
İşlemci
Bu Core i7-14700HX üzerinde sağlıklı bir destektir Core i7-13700HX çoklu iş parçacığı performansında yüzde 20 ila 25 artış. SKU'lar ile Core i9-13980HX daha eski bir işlemci olmasına rağmen Core I7-14700HX'ten bile daha hızlı performans sağlayabilen işlemciler hala mevcuttur.
Performans sürdürülebilirliği iyi ancak daha iyi olabilirdi. Örneğin, CineBench R15 xT'yi bir döngüde çalıştırırken, 3930 puanlık ilk puanımız sadece birkaç döngüden sonra yüzde 10 düşüyordu.
Cinebench R15 Multi Loop
Cinebench R23: Multi Core | Single Core
Cinebench R20: CPU (Multi Core) | CPU (Single Core)
Cinebench R15: CPU Multi 64Bit | CPU Single 64Bit
Blender: v2.79 BMW27 CPU
7-Zip 18.03: 7z b 4 | 7z b 4 -mmt1
Geekbench 6.4: Multi-Core | Single-Core
Geekbench 5.5: Multi-Core | Single-Core
HWBOT x265 Benchmark v2.2: 4k Preset
LibreOffice : 20 Documents To PDF
R Benchmark 2.5: Overall mean
| CPU Performance Rating | |
| HP ZBook Fury 16 G11 | |
| Lenovo ThinkPad P16 Gen 2 | |
| Ortalama Intel Core i7-14700HX | |
| Lenovo ThinkPad P16 G1 RTX A5500 -2! | |
| Lenovo ThinkPad P1 G6 21FV001KUS | |
| Lenovo ThinkPad P16 G2 21FA000FGE -2! | |
| Dell Precision 5690 | |
| Lenovo ThinkPad P1 G6-21FV000DGE | |
| Sınıf ortalaması Workstation | |
| Lenovo ThinkPad P1 Gen 7 21KV001SGE | |
| HP ZBook Fury 16 G9 -2! | |
| HP ZBook Power 16 G11 A | |
| MSI CreatorPro Z16P B12UKST -2! | |
| Lenovo ThinkPad P16v G1 AMD | |
| Lenovo ThinkPad P16s G2 21K9000CGE | |
| HP ZBook Firefly 16 G9-6B897EA -2! | |
| Cinebench R23 / Multi Core | |
| HP ZBook Fury 16 G11 | |
| Lenovo ThinkPad P16 Gen 2 | |
| Ortalama Intel Core i7-14700HX (22313 - 28122, n=7) | |
| Lenovo ThinkPad P16 G2 21FA000FGE | |
| Lenovo ThinkPad P16 G1 RTX A5500 | |
| Dell Precision 5690 | |
| HP ZBook Fury 16 G9 | |
| Lenovo ThinkPad P1 Gen 7 21KV001SGE | |
| Sınıf ortalaması Workstation (11507 - 30706, n=25, son 2 yıl) | |
| Lenovo ThinkPad P1 G6-21FV000DGE | |
| Lenovo ThinkPad P1 G6 21FV001KUS | |
| MSI CreatorPro Z16P B12UKST | |
| HP ZBook Power 16 G11 A | |
| Lenovo ThinkPad P16s G2 21K9000CGE | |
| Lenovo ThinkPad P16v G1 AMD | |
| HP ZBook Firefly 16 G9-6B897EA | |
| Cinebench R23 / Single Core | |
| HP ZBook Fury 16 G11 | |
| Lenovo ThinkPad P16 Gen 2 | |
| Lenovo ThinkPad P1 G6-21FV000DGE | |
| Lenovo ThinkPad P1 G6 21FV001KUS | |
| Ortalama Intel Core i7-14700HX (1702 - 2144, n=7) | |
| HP ZBook Fury 16 G9 | |
| Lenovo ThinkPad P16 G2 21FA000FGE | |
| Lenovo ThinkPad P16 G1 RTX A5500 | |
| Sınıf ortalaması Workstation (1581 - 2178, n=25, son 2 yıl) | |
| Dell Precision 5690 | |
| Lenovo ThinkPad P1 Gen 7 21KV001SGE | |
| HP ZBook Power 16 G11 A | |
| MSI CreatorPro Z16P B12UKST | |
| Lenovo ThinkPad P16s G2 21K9000CGE | |
| Lenovo ThinkPad P16v G1 AMD | |
| HP ZBook Firefly 16 G9-6B897EA | |
| Cinebench R20 / CPU (Multi Core) | |
| HP ZBook Fury 16 G11 | |
| Lenovo ThinkPad P16 Gen 2 | |
| Ortalama Intel Core i7-14700HX (8361 - 10498, n=7) | |
| Lenovo ThinkPad P16 G2 21FA000FGE | |
| Lenovo ThinkPad P16 G1 RTX A5500 | |
| Dell Precision 5690 | |
| HP ZBook Fury 16 G9 | |
| Lenovo ThinkPad P1 Gen 7 21KV001SGE | |
| Sınıf ortalaması Workstation (4530 - 11816, n=25, son 2 yıl) | |
| Lenovo ThinkPad P1 G6-21FV000DGE | |
| MSI CreatorPro Z16P B12UKST | |
| Lenovo ThinkPad P1 G6 21FV001KUS | |
| HP ZBook Power 16 G11 A | |
| Lenovo ThinkPad P16s G2 21K9000CGE | |
| Lenovo ThinkPad P16v G1 AMD | |
| HP ZBook Firefly 16 G9-6B897EA | |
| Cinebench R20 / CPU (Single Core) | |
| HP ZBook Fury 16 G11 | |
| Lenovo ThinkPad P16 Gen 2 | |
| Lenovo ThinkPad P1 G6-21FV000DGE | |
| Lenovo ThinkPad P1 G6 21FV001KUS | |
| Ortalama Intel Core i7-14700HX (651 - 821, n=7) | |
| HP ZBook Fury 16 G9 | |
| Lenovo ThinkPad P16 G2 21FA000FGE | |
| Lenovo ThinkPad P16 G1 RTX A5500 | |
| Sınıf ortalaması Workstation (612 - 827, n=25, son 2 yıl) | |
| Dell Precision 5690 | |
| Lenovo ThinkPad P1 Gen 7 21KV001SGE | |
| HP ZBook Power 16 G11 A | |
| MSI CreatorPro Z16P B12UKST | |
| Lenovo ThinkPad P16s G2 21K9000CGE | |
| Lenovo ThinkPad P16v G1 AMD | |
| HP ZBook Firefly 16 G9-6B897EA | |
| Cinebench R15 / CPU Multi 64Bit | |
| HP ZBook Fury 16 G11 | |
| Lenovo ThinkPad P16 Gen 2 | |
| Ortalama Intel Core i7-14700HX (3328 - 4137, n=7) | |
| Dell Precision 5690 | |
| Lenovo ThinkPad P16 G1 RTX A5500 | |
| Lenovo ThinkPad P16 G2 21FA000FGE | |
| Sınıf ortalaması Workstation (1863 - 4784, n=25, son 2 yıl) | |
| Lenovo ThinkPad P1 Gen 7 21KV001SGE | |
| Lenovo ThinkPad P1 G6 21FV001KUS | |
| Lenovo ThinkPad P1 G6-21FV000DGE | |
| HP ZBook Power 16 G11 A | |
| HP ZBook Fury 16 G9 | |
| Lenovo ThinkPad P16s G2 21K9000CGE | |
| Lenovo ThinkPad P16v G1 AMD | |
| MSI CreatorPro Z16P B12UKST | |
| HP ZBook Firefly 16 G9-6B897EA | |
| Cinebench R15 / CPU Single 64Bit | |
| HP ZBook Fury 16 G11 | |
| Lenovo ThinkPad P16 Gen 2 | |
| Lenovo ThinkPad P1 G6-21FV000DGE | |
| Lenovo ThinkPad P1 G6 21FV001KUS | |
| Ortalama Intel Core i7-14700HX (238 - 304, n=7) | |
| Lenovo ThinkPad P16 G2 21FA000FGE | |
| HP ZBook Power 16 G11 A | |
| Lenovo ThinkPad P16 G1 RTX A5500 | |
| Sınıf ortalaması Workstation (167 - 307, n=25, son 2 yıl) | |
| Dell Precision 5690 | |
| Lenovo ThinkPad P1 Gen 7 21KV001SGE | |
| Lenovo ThinkPad P16s G2 21K9000CGE | |
| Lenovo ThinkPad P16v G1 AMD | |
| MSI CreatorPro Z16P B12UKST | |
| HP ZBook Firefly 16 G9-6B897EA | |
| HP ZBook Fury 16 G9 | |
| Blender / v2.79 BMW27 CPU | |
| HP ZBook Firefly 16 G9-6B897EA | |
| Lenovo ThinkPad P16s G2 21K9000CGE | |
| Dell Precision 5690 | |
| HP ZBook Power 16 G11 A | |
| Lenovo ThinkPad P16v G1 AMD | |
| MSI CreatorPro Z16P B12UKST | |
| Lenovo ThinkPad P1 G6-21FV000DGE | |
| Sınıf ortalaması Workstation (102 - 270, n=25, son 2 yıl) | |
| Lenovo ThinkPad P1 G6 21FV001KUS | |
| HP ZBook Fury 16 G9 | |
| Lenovo ThinkPad P1 Gen 7 21KV001SGE | |
| Lenovo ThinkPad P16 G2 21FA000FGE | |
| Lenovo ThinkPad P16 G1 RTX A5500 | |
| Ortalama Intel Core i7-14700HX (126 - 184, n=7) | |
| Lenovo ThinkPad P16 Gen 2 | |
| HP ZBook Fury 16 G11 | |
| 7-Zip 18.03 / 7z b 4 | |
| HP ZBook Fury 16 G11 | |
| Lenovo ThinkPad P16 Gen 2 | |
| Ortalama Intel Core i7-14700HX (84799 - 104730, n=7) | |
| Lenovo ThinkPad P16 G1 RTX A5500 | |
| Lenovo ThinkPad P16 G2 21FA000FGE | |
| HP ZBook Fury 16 G9 | |
| Dell Precision 5690 | |
| Sınıf ortalaması Workstation (51096 - 109760, n=25, son 2 yıl) | |
| Lenovo ThinkPad P1 G6-21FV000DGE | |
| Lenovo ThinkPad P1 G6 21FV001KUS | |
| Lenovo ThinkPad P1 Gen 7 21KV001SGE | |
| HP ZBook Power 16 G11 A | |
| MSI CreatorPro Z16P B12UKST | |
| Lenovo ThinkPad P16v G1 AMD | |
| Lenovo ThinkPad P16s G2 21K9000CGE | |
| HP ZBook Firefly 16 G9-6B897EA | |
| 7-Zip 18.03 / 7z b 4 -mmt1 | |
| HP ZBook Fury 16 G11 | |
| Lenovo ThinkPad P16 Gen 2 | |
| Ortalama Intel Core i7-14700HX (5641 - 7041, n=7) | |
| Lenovo ThinkPad P1 G6-21FV000DGE | |
| Lenovo ThinkPad P16v G1 AMD | |
| Lenovo ThinkPad P16 G2 21FA000FGE | |
| Lenovo ThinkPad P1 G6 21FV001KUS | |
| HP ZBook Power 16 G11 A | |
| Lenovo ThinkPad P16 G1 RTX A5500 | |
| Sınıf ortalaması Workstation (4981 - 6960, n=25, son 2 yıl) | |
| HP ZBook Fury 16 G9 | |
| Lenovo ThinkPad P16s G2 21K9000CGE | |
| MSI CreatorPro Z16P B12UKST | |
| Lenovo ThinkPad P1 Gen 7 21KV001SGE | |
| Dell Precision 5690 | |
| HP ZBook Firefly 16 G9-6B897EA | |
| Geekbench 6.4 / Multi-Core | |
| Lenovo ThinkPad P16 Gen 2 | |
| Ortalama Intel Core i7-14700HX (14807 - 17562, n=7) | |
| HP ZBook Fury 16 G11 | |
| Dell Precision 5690 | |
| Sınıf ortalaması Workstation (10200 - 16855, n=23, son 2 yıl) | |
| Lenovo ThinkPad P1 Gen 7 21KV001SGE | |
| Lenovo ThinkPad P1 G6 21FV001KUS | |
| HP ZBook Power 16 G11 A | |
| Lenovo ThinkPad P1 G6-21FV000DGE | |
| Lenovo ThinkPad P16s G2 21K9000CGE | |
| Lenovo ThinkPad P16v G1 AMD | |
| Geekbench 6.4 / Single-Core | |
| HP ZBook Fury 16 G11 | |
| Lenovo ThinkPad P16 Gen 2 | |
| Lenovo ThinkPad P1 G6 21FV001KUS | |
| Ortalama Intel Core i7-14700HX (2378 - 2975, n=7) | |
| Lenovo ThinkPad P1 G6-21FV000DGE | |
| HP ZBook Power 16 G11 A | |
| Sınıf ortalaması Workstation (2352 - 2949, n=23, son 2 yıl) | |
| Lenovo ThinkPad P16v G1 AMD | |
| Dell Precision 5690 | |
| Lenovo ThinkPad P16s G2 21K9000CGE | |
| Lenovo ThinkPad P1 Gen 7 21KV001SGE | |
| Geekbench 5.5 / Multi-Core | |
| HP ZBook Fury 16 G11 | |
| Lenovo ThinkPad P16 Gen 2 | |
| Ortalama Intel Core i7-14700HX (15705 - 19597, n=7) | |
| Lenovo ThinkPad P16 G1 RTX A5500 | |
| Lenovo ThinkPad P16 G2 21FA000FGE | |
| Dell Precision 5690 | |
| HP ZBook Fury 16 G9 | |
| Sınıf ortalaması Workstation (8863 - 19316, n=25, son 2 yıl) | |
| Lenovo ThinkPad P1 Gen 7 21KV001SGE | |
| Lenovo ThinkPad P1 G6 21FV001KUS | |
| MSI CreatorPro Z16P B12UKST | |
| HP ZBook Power 16 G11 A | |
| Lenovo ThinkPad P1 G6-21FV000DGE | |
| Lenovo ThinkPad P16s G2 21K9000CGE | |
| Lenovo ThinkPad P16v G1 AMD | |
| HP ZBook Firefly 16 G9-6B897EA | |
| Geekbench 5.5 / Single-Core | |
| HP ZBook Fury 16 G11 | |
| Lenovo ThinkPad P16 Gen 2 | |
| Ortalama Intel Core i7-14700HX (1700 - 2133, n=7) | |
| Lenovo ThinkPad P1 G6 21FV001KUS | |
| Lenovo ThinkPad P1 G6-21FV000DGE | |
| HP ZBook Fury 16 G9 | |
| Lenovo ThinkPad P16 G1 RTX A5500 | |
| HP ZBook Power 16 G11 A | |
| Sınıf ortalaması Workstation (1740 - 2095, n=25, son 2 yıl) | |
| Lenovo ThinkPad P16 G2 21FA000FGE | |
| Dell Precision 5690 | |
| Lenovo ThinkPad P16v G1 AMD | |
| HP ZBook Firefly 16 G9-6B897EA | |
| MSI CreatorPro Z16P B12UKST | |
| Lenovo ThinkPad P1 Gen 7 21KV001SGE | |
| Lenovo ThinkPad P16s G2 21K9000CGE | |
| HWBOT x265 Benchmark v2.2 / 4k Preset | |
| HP ZBook Fury 16 G11 | |
| Lenovo ThinkPad P16 Gen 2 | |
| Ortalama Intel Core i7-14700HX (22 - 27.4, n=7) | |
| Lenovo ThinkPad P16 G1 RTX A5500 | |
| Lenovo ThinkPad P16 G2 21FA000FGE | |
| Dell Precision 5690 | |
| Lenovo ThinkPad P1 Gen 7 21KV001SGE | |
| Sınıf ortalaması Workstation (14.4 - 33, n=25, son 2 yıl) | |
| Lenovo ThinkPad P1 G6 21FV001KUS | |
| HP ZBook Fury 16 G9 | |
| HP ZBook Power 16 G11 A | |
| MSI CreatorPro Z16P B12UKST | |
| Lenovo ThinkPad P1 G6-21FV000DGE | |
| Lenovo ThinkPad P16v G1 AMD | |
| Lenovo ThinkPad P16s G2 21K9000CGE | |
| HP ZBook Firefly 16 G9-6B897EA | |
| LibreOffice / 20 Documents To PDF | |
| HP ZBook Firefly 16 G9-6B897EA | |
| Lenovo ThinkPad P16s G2 21K9000CGE | |
| HP ZBook Power 16 G11 A | |
| Lenovo ThinkPad P16 G2 21FA000FGE | |
| HP ZBook Fury 16 G11 | |
| Lenovo ThinkPad P1 G6-21FV000DGE | |
| Sınıf ortalaması Workstation (36.5 - 56.9, n=25, son 2 yıl) | |
| Ortalama Intel Core i7-14700HX (41.9 - 55.3, n=7) | |
| Lenovo ThinkPad P16v G1 AMD | |
| Lenovo ThinkPad P16 Gen 2 | |
| Lenovo ThinkPad P1 G6 21FV001KUS | |
| Lenovo ThinkPad P1 Gen 7 21KV001SGE | |
| Dell Precision 5690 | |
| Lenovo ThinkPad P16 G1 RTX A5500 | |
| MSI CreatorPro Z16P B12UKST | |
| HP ZBook Fury 16 G9 | |
| R Benchmark 2.5 / Overall mean | |
| HP ZBook Firefly 16 G9-6B897EA | |
| Lenovo ThinkPad P16s G2 21K9000CGE | |
| Lenovo ThinkPad P1 Gen 7 21KV001SGE | |
| Dell Precision 5690 | |
| MSI CreatorPro Z16P B12UKST | |
| HP ZBook Power 16 G11 A | |
| Lenovo ThinkPad P16 G1 RTX A5500 | |
| Lenovo ThinkPad P16 G2 21FA000FGE | |
| Sınıf ortalaması Workstation (0.3825 - 0.4888, n=25, son 2 yıl) | |
| Lenovo ThinkPad P16v G1 AMD | |
| HP ZBook Fury 16 G9 | |
| Ortalama Intel Core i7-14700HX (0.3821 - 0.4896, n=7) | |
| Lenovo ThinkPad P1 G6-21FV000DGE | |
| Lenovo ThinkPad P1 G6 21FV001KUS | |
| Lenovo ThinkPad P16 Gen 2 | |
| HP ZBook Fury 16 G11 | |
Cinebench R23: Multi Core | Single Core
Cinebench R20: CPU (Multi Core) | CPU (Single Core)
Cinebench R15: CPU Multi 64Bit | CPU Single 64Bit
Blender: v2.79 BMW27 CPU
7-Zip 18.03: 7z b 4 | 7z b 4 -mmt1
Geekbench 6.4: Multi-Core | Single-Core
Geekbench 5.5: Multi-Core | Single-Core
HWBOT x265 Benchmark v2.2: 4k Preset
LibreOffice : 20 Documents To PDF
R Benchmark 2.5: Overall mean
* ... daha küçük daha iyidir
AIDA64: FP32 Ray-Trace | FPU Julia | CPU SHA3 | CPU Queen | FPU SinJulia | FPU Mandel | CPU AES | CPU ZLib | FP64 Ray-Trace | CPU PhotoWorxx
| Performance Rating | |
| Lenovo ThinkPad P16 Gen 2 | |
| Ortalama Intel Core i7-14700HX | |
| HP ZBook Power 16 G11 A | |
| Lenovo ThinkPad P16s G2 21K9000CGE | |
| Dell Precision 5690 | |
| Lenovo ThinkPad P16 G1 RTX A5500 | |
| Lenovo ThinkPad P16 G2 21FA000FGE | |
| AIDA64 / FP32 Ray-Trace | |
| HP ZBook Power 16 G11 A | |
| Lenovo ThinkPad P16s G2 21K9000CGE | |
| Ortalama Intel Core i7-14700HX (16932 - 23676, n=7) | |
| Lenovo ThinkPad P16 Gen 2 | |
| Dell Precision 5690 | |
| Lenovo ThinkPad P16 G2 21FA000FGE | |
| Lenovo ThinkPad P16 G1 RTX A5500 | |
| AIDA64 / FPU Julia | |
| HP ZBook Power 16 G11 A | |
| Lenovo ThinkPad P16 Gen 2 | |
| Ortalama Intel Core i7-14700HX (86338 - 116556, n=7) | |
| Lenovo ThinkPad P16s G2 21K9000CGE | |
| Dell Precision 5690 | |
| Lenovo ThinkPad P16 G2 21FA000FGE | |
| Lenovo ThinkPad P16 G1 RTX A5500 | |
| AIDA64 / CPU SHA3 | |
| Lenovo ThinkPad P16 Gen 2 | |
| Ortalama Intel Core i7-14700HX (4008 - 5567, n=7) | |
| HP ZBook Power 16 G11 A | |
| Lenovo ThinkPad P16s G2 21K9000CGE | |
| Dell Precision 5690 | |
| Lenovo ThinkPad P16 G2 21FA000FGE | |
| Lenovo ThinkPad P16 G1 RTX A5500 | |
| AIDA64 / CPU Queen | |
| Lenovo ThinkPad P16 Gen 2 | |
| Ortalama Intel Core i7-14700HX (129836 - 152200, n=7) | |
| HP ZBook Power 16 G11 A | |
| Lenovo ThinkPad P16 G2 21FA000FGE | |
| Lenovo ThinkPad P16 G1 RTX A5500 | |
| Lenovo ThinkPad P16s G2 21K9000CGE | |
| Dell Precision 5690 | |
| AIDA64 / FPU SinJulia | |
| HP ZBook Power 16 G11 A | |
| Lenovo ThinkPad P16s G2 21K9000CGE | |
| Lenovo ThinkPad P16 Gen 2 | |
| Ortalama Intel Core i7-14700HX (11704 - 14434, n=7) | |
| Lenovo ThinkPad P16 G1 RTX A5500 | |
| Lenovo ThinkPad P16 G2 21FA000FGE | |
| Dell Precision 5690 | |
| AIDA64 / FPU Mandel | |
| HP ZBook Power 16 G11 A | |
| Lenovo ThinkPad P16s G2 21K9000CGE | |
| Lenovo ThinkPad P16 Gen 2 | |
| Ortalama Intel Core i7-14700HX (42125 - 58380, n=7) | |
| Dell Precision 5690 | |
| Lenovo ThinkPad P16 G1 RTX A5500 | |
| Lenovo ThinkPad P16 G2 21FA000FGE | |
| AIDA64 / CPU AES | |
| Lenovo ThinkPad P16 Gen 2 | |
| Ortalama Intel Core i7-14700HX (82161 - 113157, n=7) | |
| Dell Precision 5690 | |
| Lenovo ThinkPad P16 G2 21FA000FGE | |
| Lenovo ThinkPad P16 G1 RTX A5500 | |
| HP ZBook Power 16 G11 A | |
| Lenovo ThinkPad P16s G2 21K9000CGE | |
| AIDA64 / CPU ZLib | |
| Lenovo ThinkPad P16 Gen 2 | |
| Ortalama Intel Core i7-14700HX (1177 - 1682, n=7) | |
| Dell Precision 5690 | |
| Lenovo ThinkPad P16 G1 RTX A5500 | |
| Lenovo ThinkPad P16 G2 21FA000FGE | |
| HP ZBook Power 16 G11 A | |
| Lenovo ThinkPad P16s G2 21K9000CGE | |
| AIDA64 / FP64 Ray-Trace | |
| HP ZBook Power 16 G11 A | |
| Lenovo ThinkPad P16s G2 21K9000CGE | |
| Ortalama Intel Core i7-14700HX (9029 - 12928, n=7) | |
| Lenovo ThinkPad P16 Gen 2 | |
| Lenovo ThinkPad P16 G1 RTX A5500 | |
| Lenovo ThinkPad P16 G2 21FA000FGE | |
| Dell Precision 5690 | |
| AIDA64 / CPU PhotoWorxx | |
| Dell Precision 5690 | |
| Ortalama Intel Core i7-14700HX (39151 - 49671, n=7) | |
| Lenovo ThinkPad P16 G1 RTX A5500 | |
| HP ZBook Power 16 G11 A | |
| Lenovo ThinkPad P16 Gen 2 | |
| Lenovo ThinkPad P16s G2 21K9000CGE | |
| Lenovo ThinkPad P16 G2 21FA000FGE | |
Stres Testi
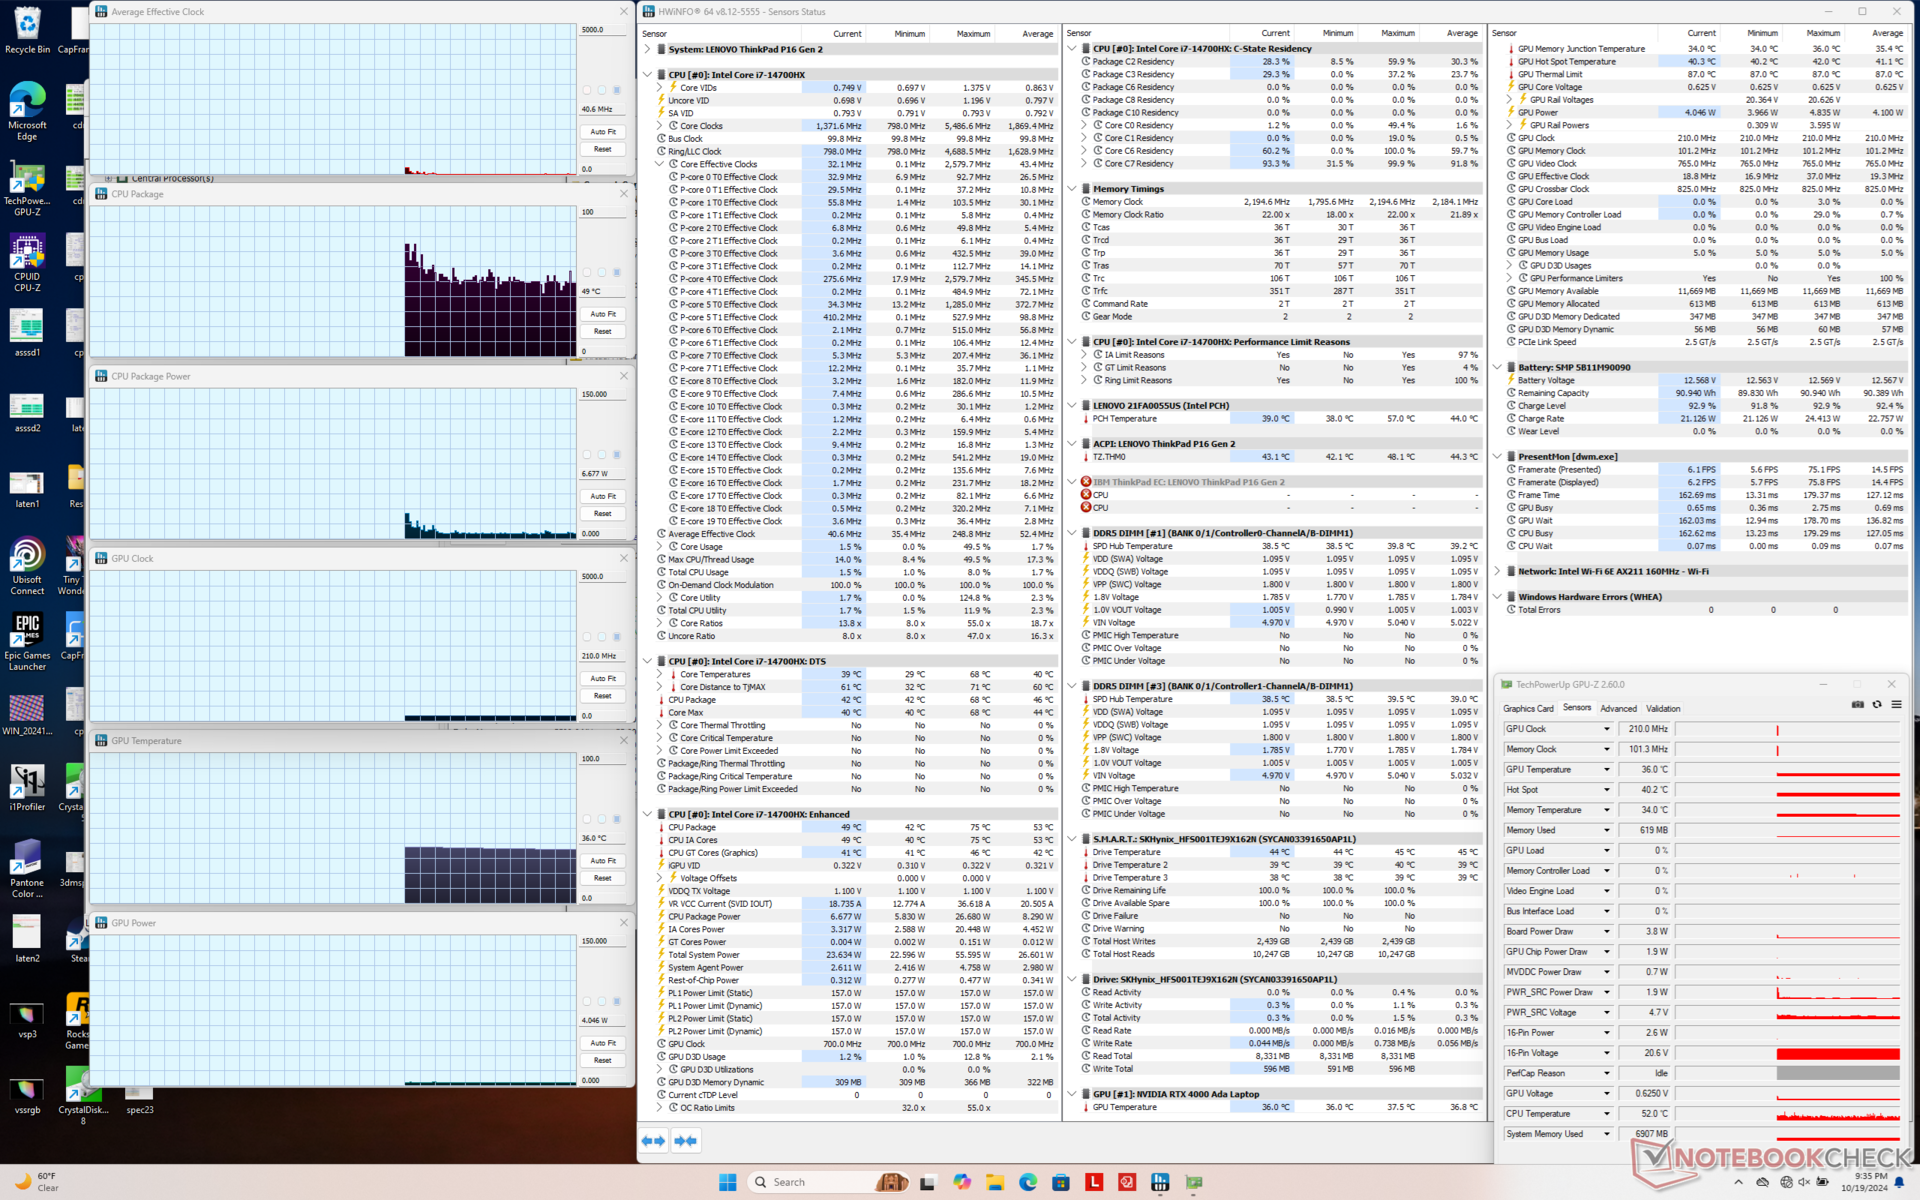
Sistem zorlandığında çekirdek sıcaklıkları oldukça yüksektir ve bu da aşağıdaki Sıcaklık bölümünde belirtildiği gibi çok sıcak yüzey sıcaklıklarına yol açar. Örneğin Prime95 veya Cyberpunk 2077'yi çalıştırırken CPU 80 C'nin üzerine ve hatta bazen 100 C'ye ulaşabilir. Aşağıdaki ekran görüntülerimizde gösterildiği gibi sıcaklıkları kontrol altında tutmak için paket güç çekişi ve dolayısıyla saat hızı 66 W ile 90 W arasında dalgalanacaktır.
GPU kartı güç çekişi, Cyberpunk 2077 'yi Performans modunda çalıştırırken ilan edildiği gibi tam 130 W'a ulaşabilir. Bununla birlikte, GPU sıcaklığı 85 C'nin üzerinde nispeten yüksek olacaktır ve bu nedenle GPU Performansı bölümümüzde belirtildiği gibi kare hızları sonunda düşecektir. Bunun yerine Dengeli modda oyun oynanırsa çekirdek saati, bellek saati ve kart güç çekişi daha da düşecektir.
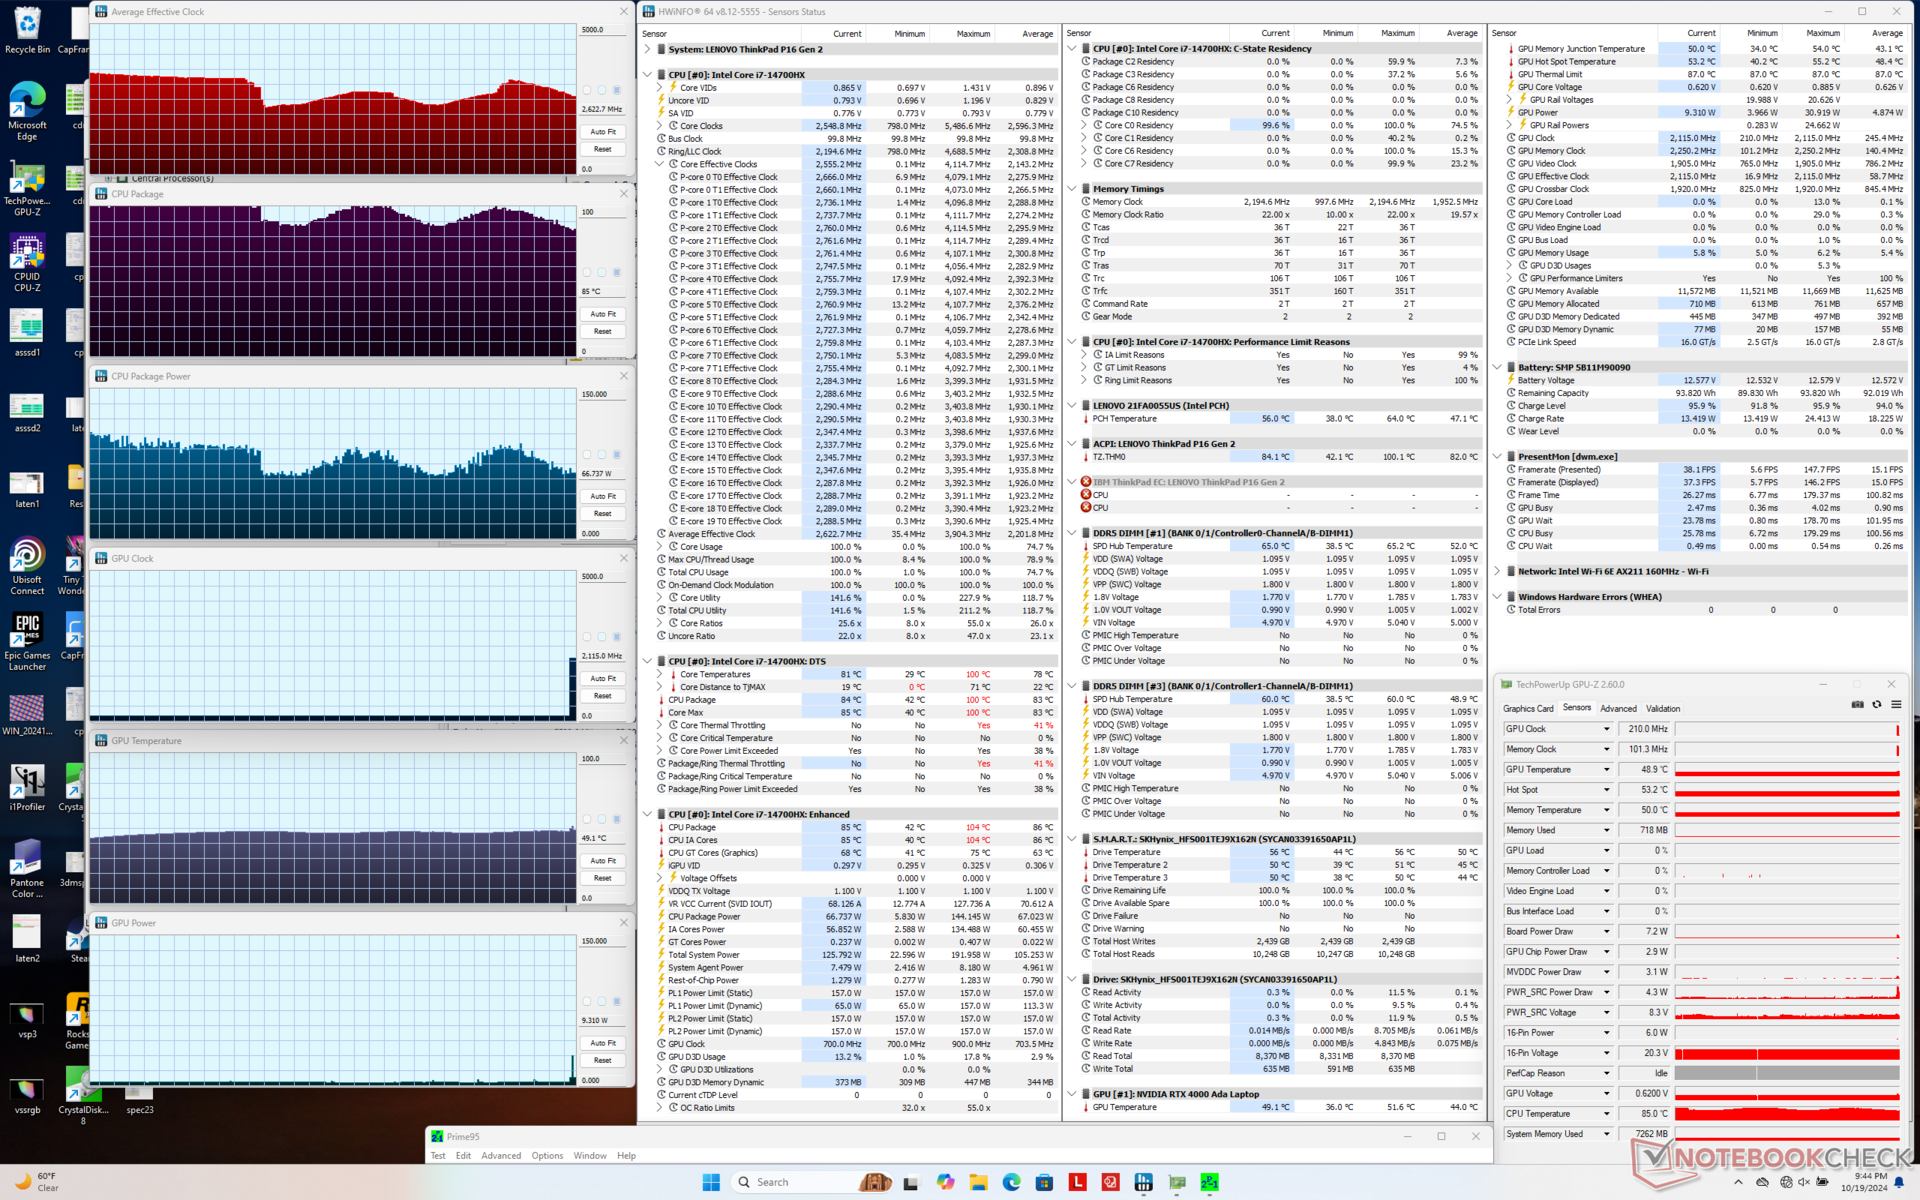
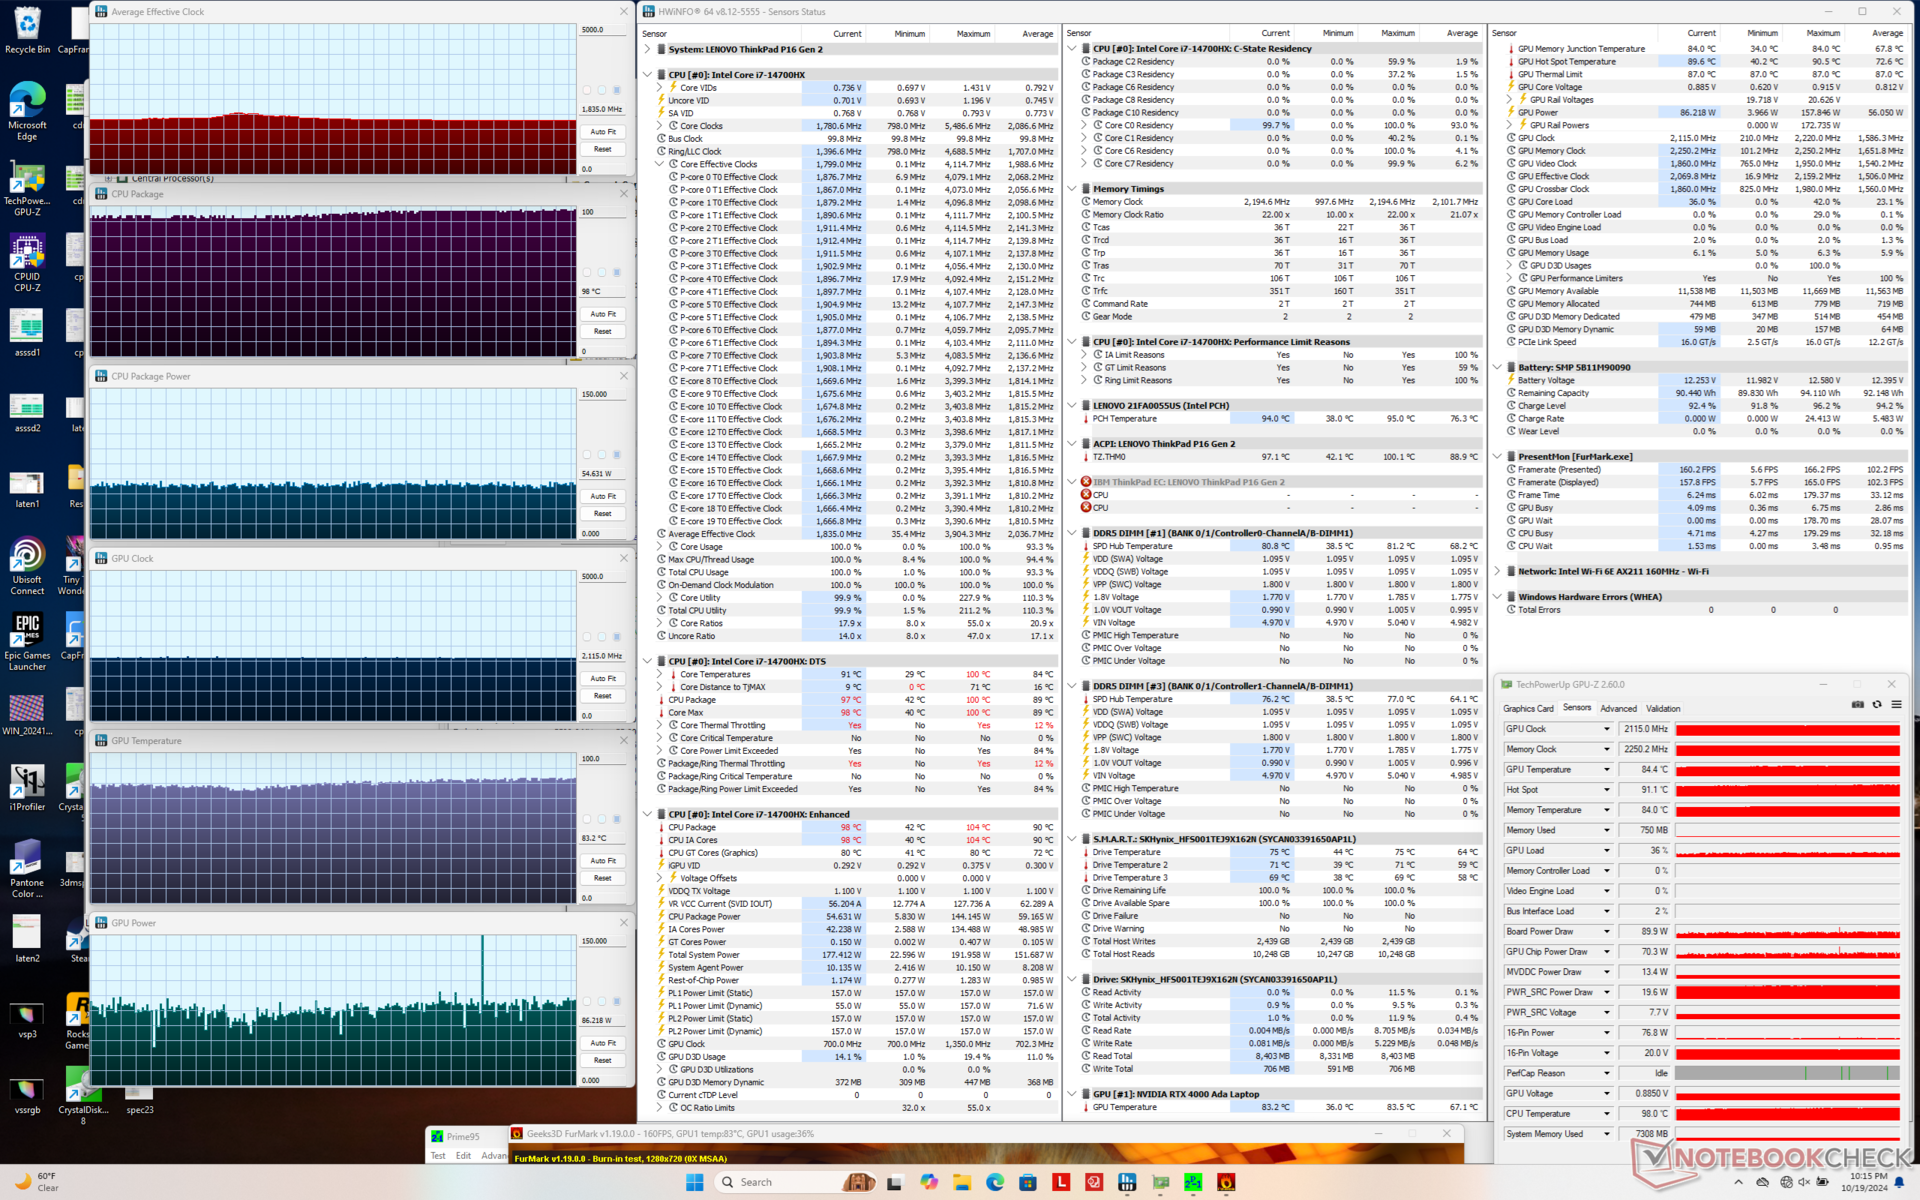
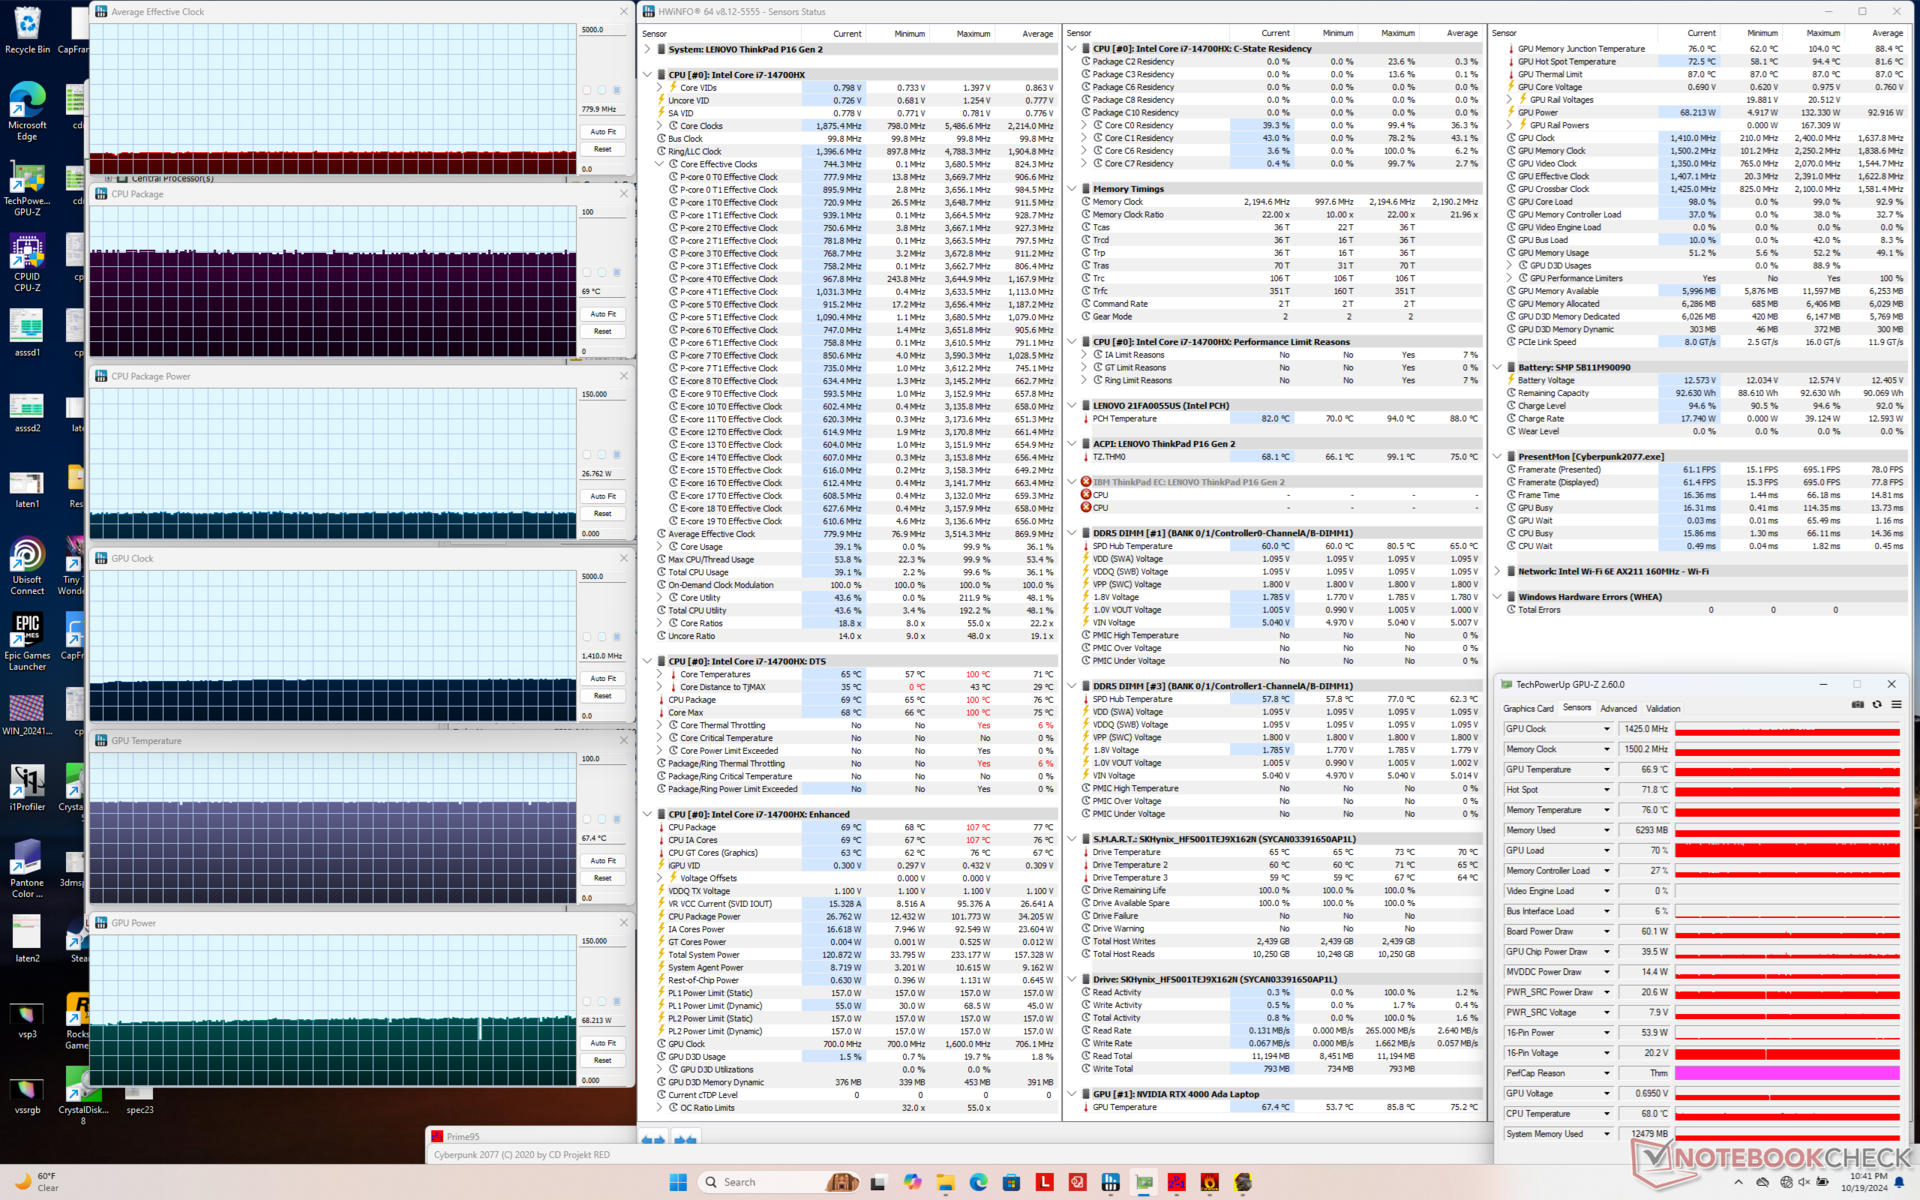
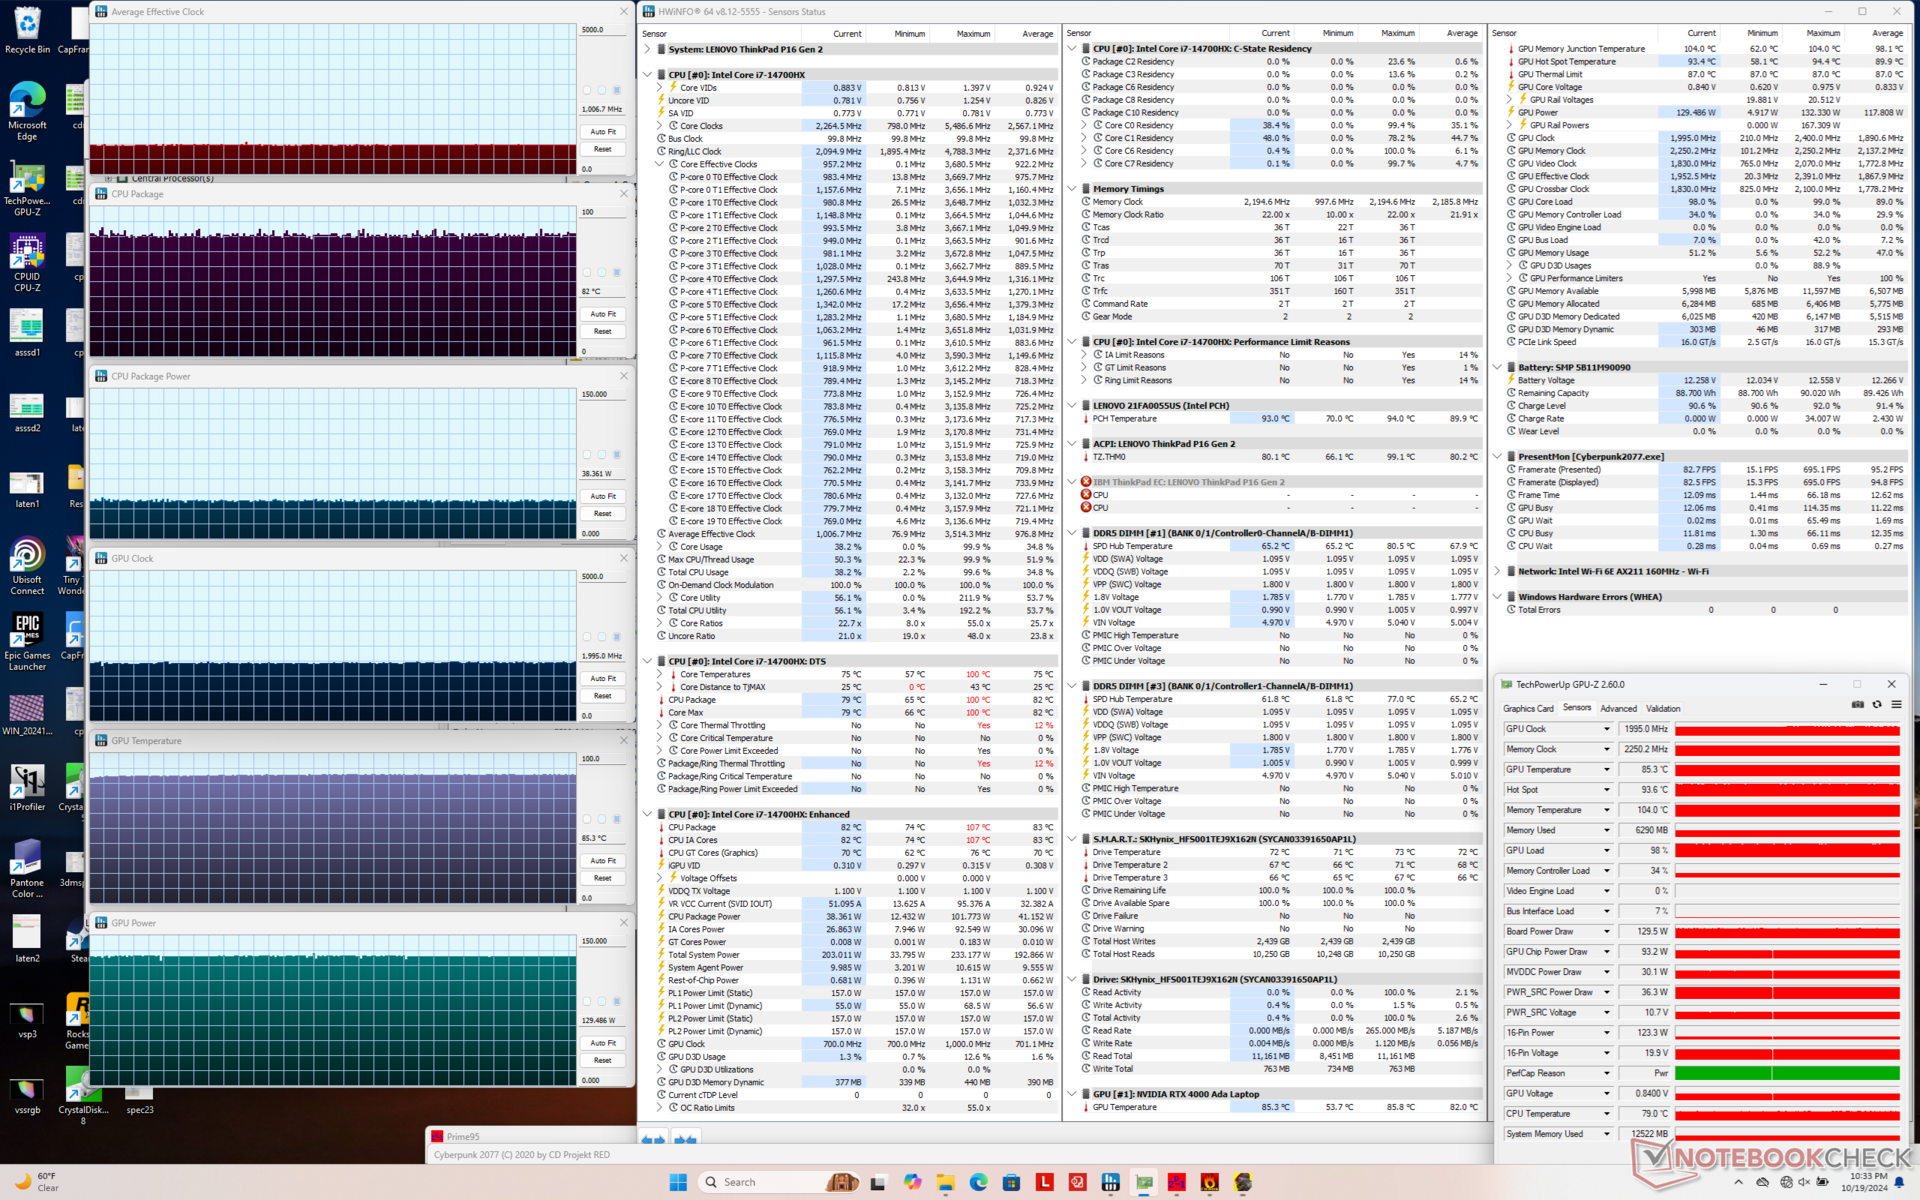
| CPU Saati (GHz) | GPU Saati (MHz) | Ortalama CPU Sıcaklığı (°C) | Ortalama GPU Sıcaklığı (°C) | |
| Sistem Boşta | -- | -- | 49 | 36 |
| Prime95 Stres | 2,6 - 3,1 | -- | 85 - 100 | 49 |
| Prime95 + FurMark Stres | 1.8 | 2115 | 98 | 83 |
| Cyberpunk 2077 Stres (Dengeli mod) | 0.8 | 1425 | 69 | 67 |
| Cyberpunk 2077 Stres (Performans modu) | 1.0 | 1995 | 82 | 85 |
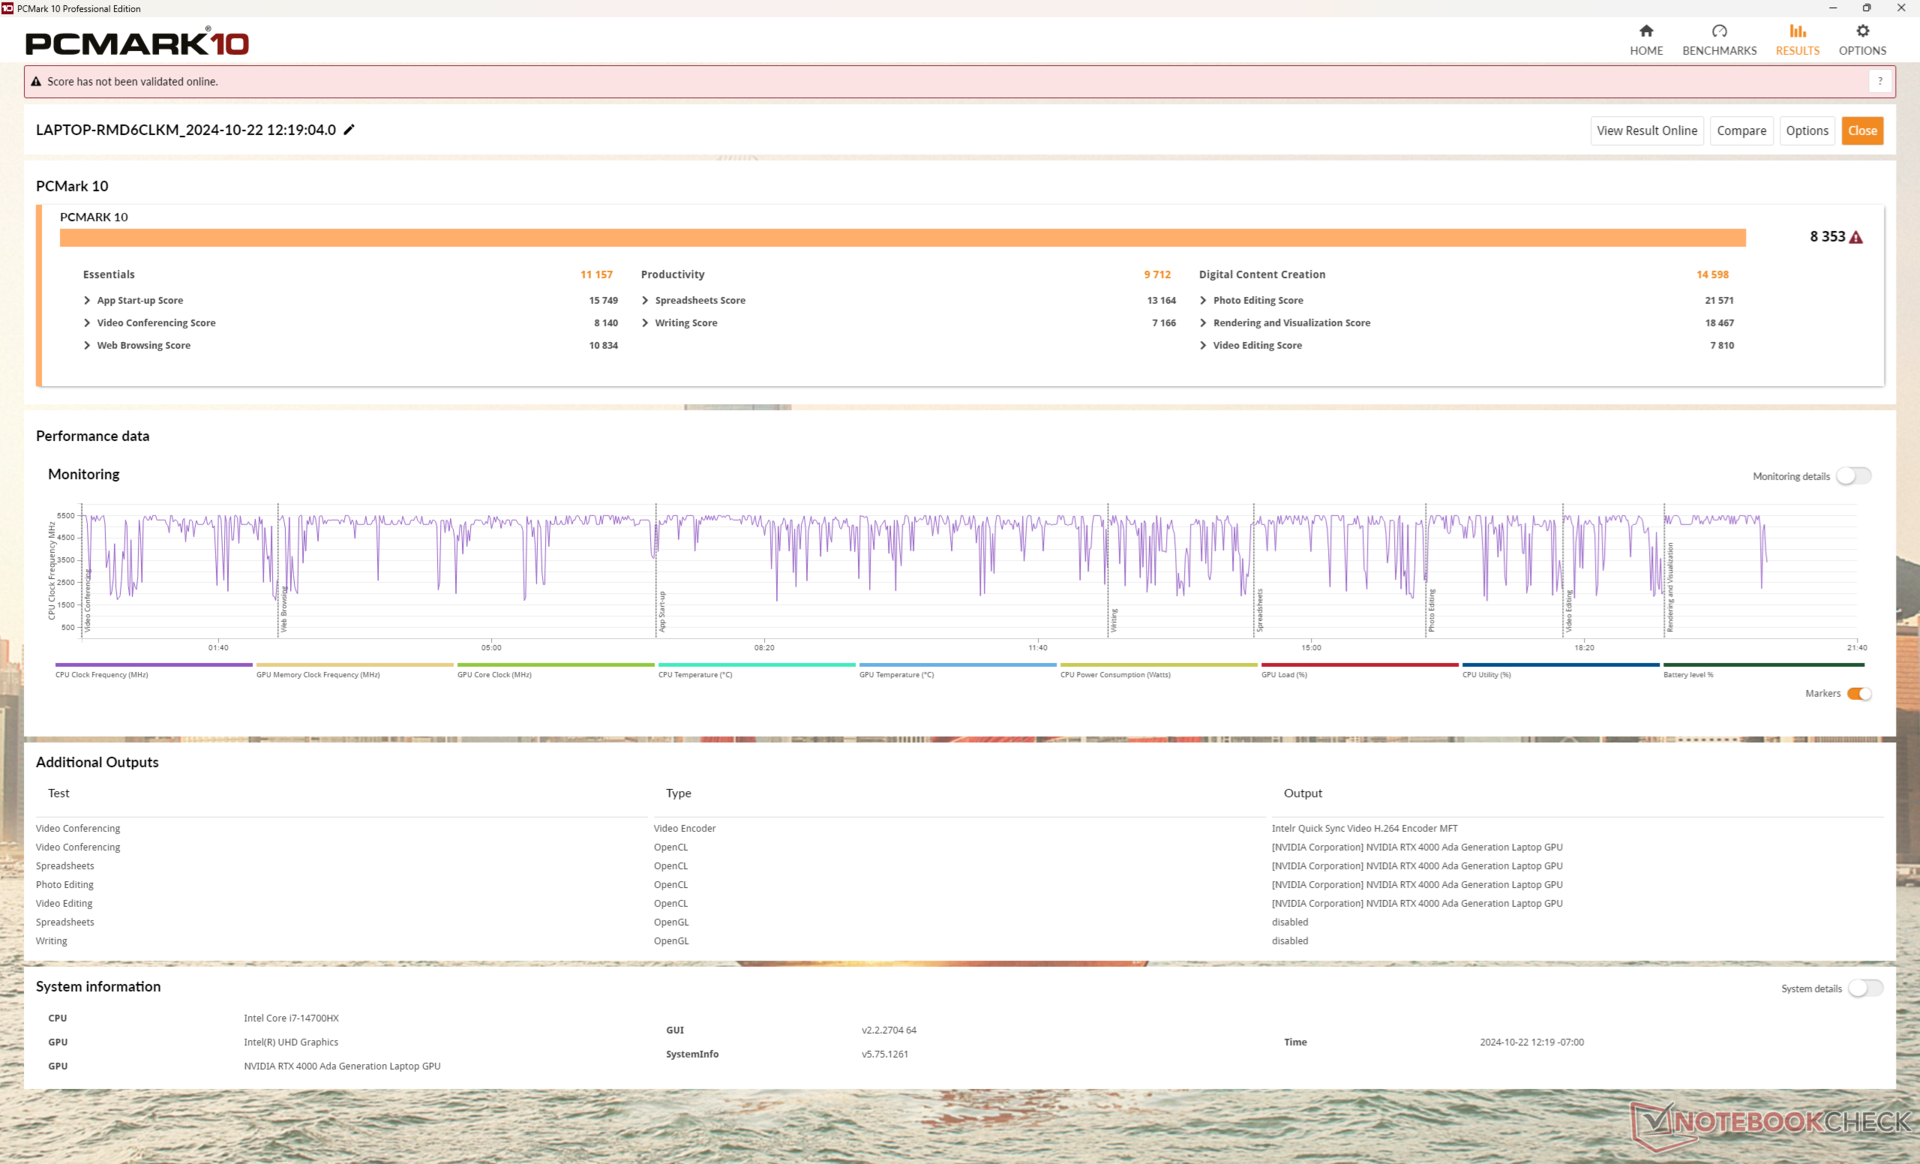
Sistem Performansı
CrossMark: Overall | Productivity | Creativity | Responsiveness
WebXPRT 3: Overall
WebXPRT 4: Overall
Mozilla Kraken 1.1: Total
| PCMark 10 / Score | |
| Lenovo ThinkPad P16 Gen 2 | |
| Ortalama Intel Core i7-14700HX, NVIDIA RTX 4000 Ada Generation Laptop GPU (n=1) | |
| Dell Precision 5690 | |
| HP ZBook Power 16 G11 A | |
| Lenovo ThinkPad P16 G1 RTX A5500 | |
| Lenovo ThinkPad P16 G2 21FA000FGE | |
| Lenovo ThinkPad P16s G2 21K9000CGE | |
| PCMark 10 / Essentials | |
| Lenovo ThinkPad P16 Gen 2 | |
| Ortalama Intel Core i7-14700HX, NVIDIA RTX 4000 Ada Generation Laptop GPU (n=1) | |
| Dell Precision 5690 | |
| Lenovo ThinkPad P16 G2 21FA000FGE | |
| Lenovo ThinkPad P16 G1 RTX A5500 | |
| HP ZBook Power 16 G11 A | |
| Lenovo ThinkPad P16s G2 21K9000CGE | |
| PCMark 10 / Productivity | |
| Dell Precision 5690 | |
| Lenovo ThinkPad P16 Gen 2 | |
| Ortalama Intel Core i7-14700HX, NVIDIA RTX 4000 Ada Generation Laptop GPU (n=1) | |
| HP ZBook Power 16 G11 A | |
| Lenovo ThinkPad P16 G1 RTX A5500 | |
| Lenovo ThinkPad P16 G2 21FA000FGE | |
| Lenovo ThinkPad P16s G2 21K9000CGE | |
| PCMark 10 / Digital Content Creation | |
| Lenovo ThinkPad P16 Gen 2 | |
| Ortalama Intel Core i7-14700HX, NVIDIA RTX 4000 Ada Generation Laptop GPU (n=1) | |
| Dell Precision 5690 | |
| HP ZBook Power 16 G11 A | |
| Lenovo ThinkPad P16 G1 RTX A5500 | |
| Lenovo ThinkPad P16 G2 21FA000FGE | |
| Lenovo ThinkPad P16s G2 21K9000CGE | |
| CrossMark / Overall | |
| Lenovo ThinkPad P16 Gen 2 | |
| Ortalama Intel Core i7-14700HX, NVIDIA RTX 4000 Ada Generation Laptop GPU (n=1) | |
| Lenovo ThinkPad P16 G1 RTX A5500 | |
| Lenovo ThinkPad P16 G2 21FA000FGE | |
| Dell Precision 5690 | |
| HP ZBook Power 16 G11 A | |
| Lenovo ThinkPad P16s G2 21K9000CGE | |
| CrossMark / Productivity | |
| Lenovo ThinkPad P16 Gen 2 | |
| Ortalama Intel Core i7-14700HX, NVIDIA RTX 4000 Ada Generation Laptop GPU (n=1) | |
| Lenovo ThinkPad P16 G1 RTX A5500 | |
| Dell Precision 5690 | |
| Lenovo ThinkPad P16 G2 21FA000FGE | |
| HP ZBook Power 16 G11 A | |
| Lenovo ThinkPad P16s G2 21K9000CGE | |
| CrossMark / Creativity | |
| Lenovo ThinkPad P16 Gen 2 | |
| Ortalama Intel Core i7-14700HX, NVIDIA RTX 4000 Ada Generation Laptop GPU (n=1) | |
| Lenovo ThinkPad P16 G1 RTX A5500 | |
| Lenovo ThinkPad P16 G2 21FA000FGE | |
| HP ZBook Power 16 G11 A | |
| Dell Precision 5690 | |
| Lenovo ThinkPad P16s G2 21K9000CGE | |
| CrossMark / Responsiveness | |
| Lenovo ThinkPad P16 Gen 2 | |
| Ortalama Intel Core i7-14700HX, NVIDIA RTX 4000 Ada Generation Laptop GPU (n=1) | |
| Dell Precision 5690 | |
| Lenovo ThinkPad P16 G1 RTX A5500 | |
| Lenovo ThinkPad P16 G2 21FA000FGE | |
| HP ZBook Power 16 G11 A | |
| Lenovo ThinkPad P16s G2 21K9000CGE | |
| WebXPRT 3 / Overall | |
| Lenovo ThinkPad P16 Gen 2 | |
| Ortalama Intel Core i7-14700HX, NVIDIA RTX 4000 Ada Generation Laptop GPU (n=1) | |
| Lenovo ThinkPad P16 G2 21FA000FGE | |
| Lenovo ThinkPad P16 G1 RTX A5500 | |
| HP ZBook Power 16 G11 A | |
| Dell Precision 5690 | |
| Lenovo ThinkPad P16s G2 21K9000CGE | |
| WebXPRT 4 / Overall | |
| Lenovo ThinkPad P16 Gen 2 | |
| Ortalama Intel Core i7-14700HX, NVIDIA RTX 4000 Ada Generation Laptop GPU (n=1) | |
| Lenovo ThinkPad P16 G1 RTX A5500 | |
| Dell Precision 5690 | |
| HP ZBook Power 16 G11 A | |
| Mozilla Kraken 1.1 / Total | |
| Lenovo ThinkPad P16s G2 21K9000CGE | |
| HP ZBook Power 16 G11 A | |
| Dell Precision 5690 | |
| Lenovo ThinkPad P16 G1 RTX A5500 | |
| Lenovo ThinkPad P16 G2 21FA000FGE | |
| Lenovo ThinkPad P16 Gen 2 | |
| Ortalama Intel Core i7-14700HX, NVIDIA RTX 4000 Ada Generation Laptop GPU (n=1) | |
* ... daha küçük daha iyidir
| PCMark 10 Score | 8353 puan | |
Yardım | ||
| AIDA64 / Memory Copy | |
| Dell Precision 5690 | |
| Ortalama Intel Core i7-14700HX (63949 - 78742, n=7) | |
| Lenovo ThinkPad P16s G2 21K9000CGE | |
| Lenovo ThinkPad P16 Gen 2 | |
| Lenovo ThinkPad P16 G1 RTX A5500 | |
| HP ZBook Power 16 G11 A | |
| Lenovo ThinkPad P16 G2 21FA000FGE | |
| AIDA64 / Memory Read | |
| Dell Precision 5690 | |
| Ortalama Intel Core i7-14700HX (68593 - 86175, n=7) | |
| Lenovo ThinkPad P16 Gen 2 | |
| Lenovo ThinkPad P16 G1 RTX A5500 | |
| HP ZBook Power 16 G11 A | |
| Lenovo ThinkPad P16 G2 21FA000FGE | |
| Lenovo ThinkPad P16s G2 21K9000CGE | |
| AIDA64 / Memory Write | |
| Lenovo ThinkPad P16s G2 21K9000CGE | |
| HP ZBook Power 16 G11 A | |
| Dell Precision 5690 | |
| Ortalama Intel Core i7-14700HX (64033 - 76689, n=7) | |
| Lenovo ThinkPad P16 Gen 2 | |
| Lenovo ThinkPad P16 G1 RTX A5500 | |
| Lenovo ThinkPad P16 G2 21FA000FGE | |
| AIDA64 / Memory Latency | |
| Dell Precision 5690 | |
| Lenovo ThinkPad P16s G2 21K9000CGE | |
| Lenovo ThinkPad P16 G2 21FA000FGE | |
| HP ZBook Power 16 G11 A | |
| Lenovo ThinkPad P16 Gen 2 | |
| Lenovo ThinkPad P16 G1 RTX A5500 | |
| Ortalama Intel Core i7-14700HX (82.7 - 96.4, n=7) | |
* ... daha küçük daha iyidir
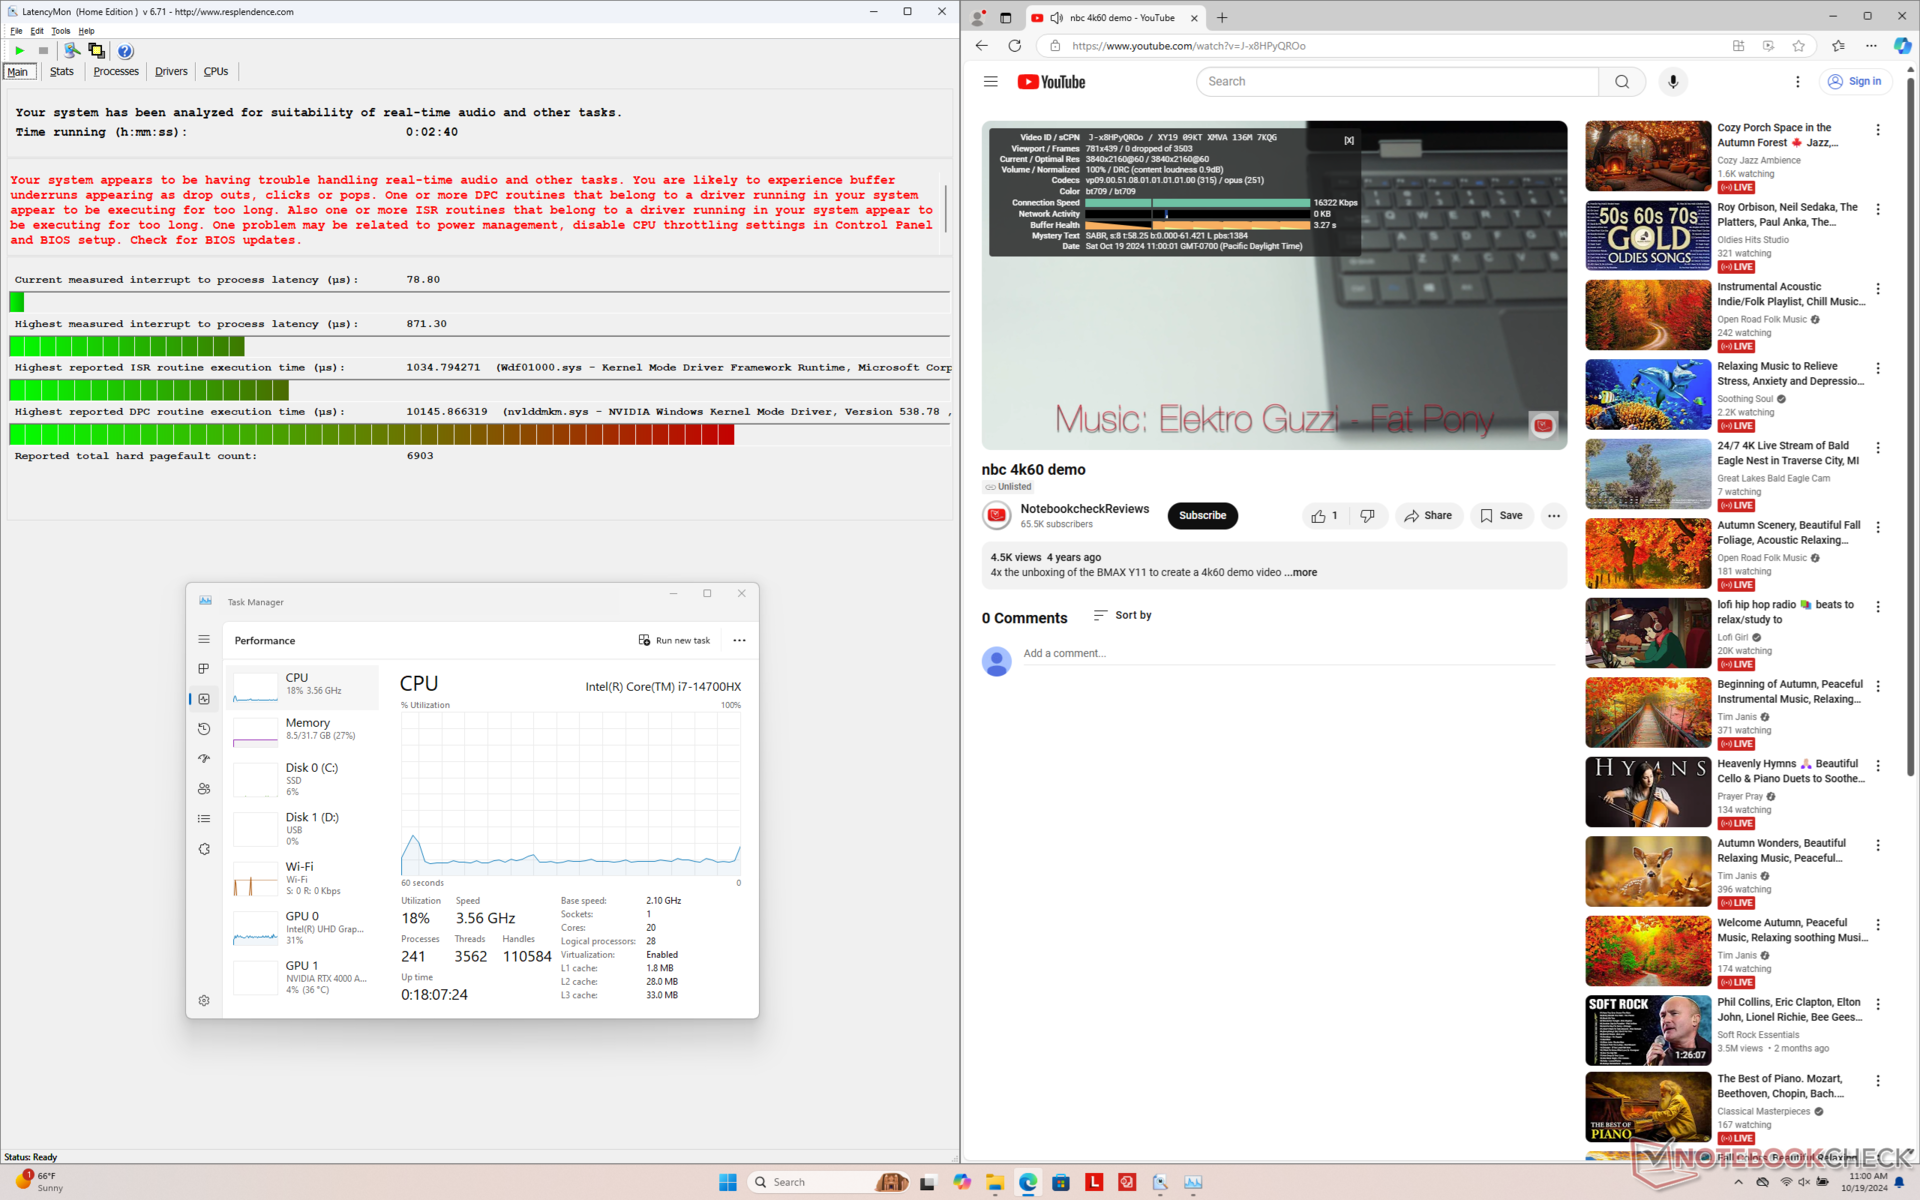
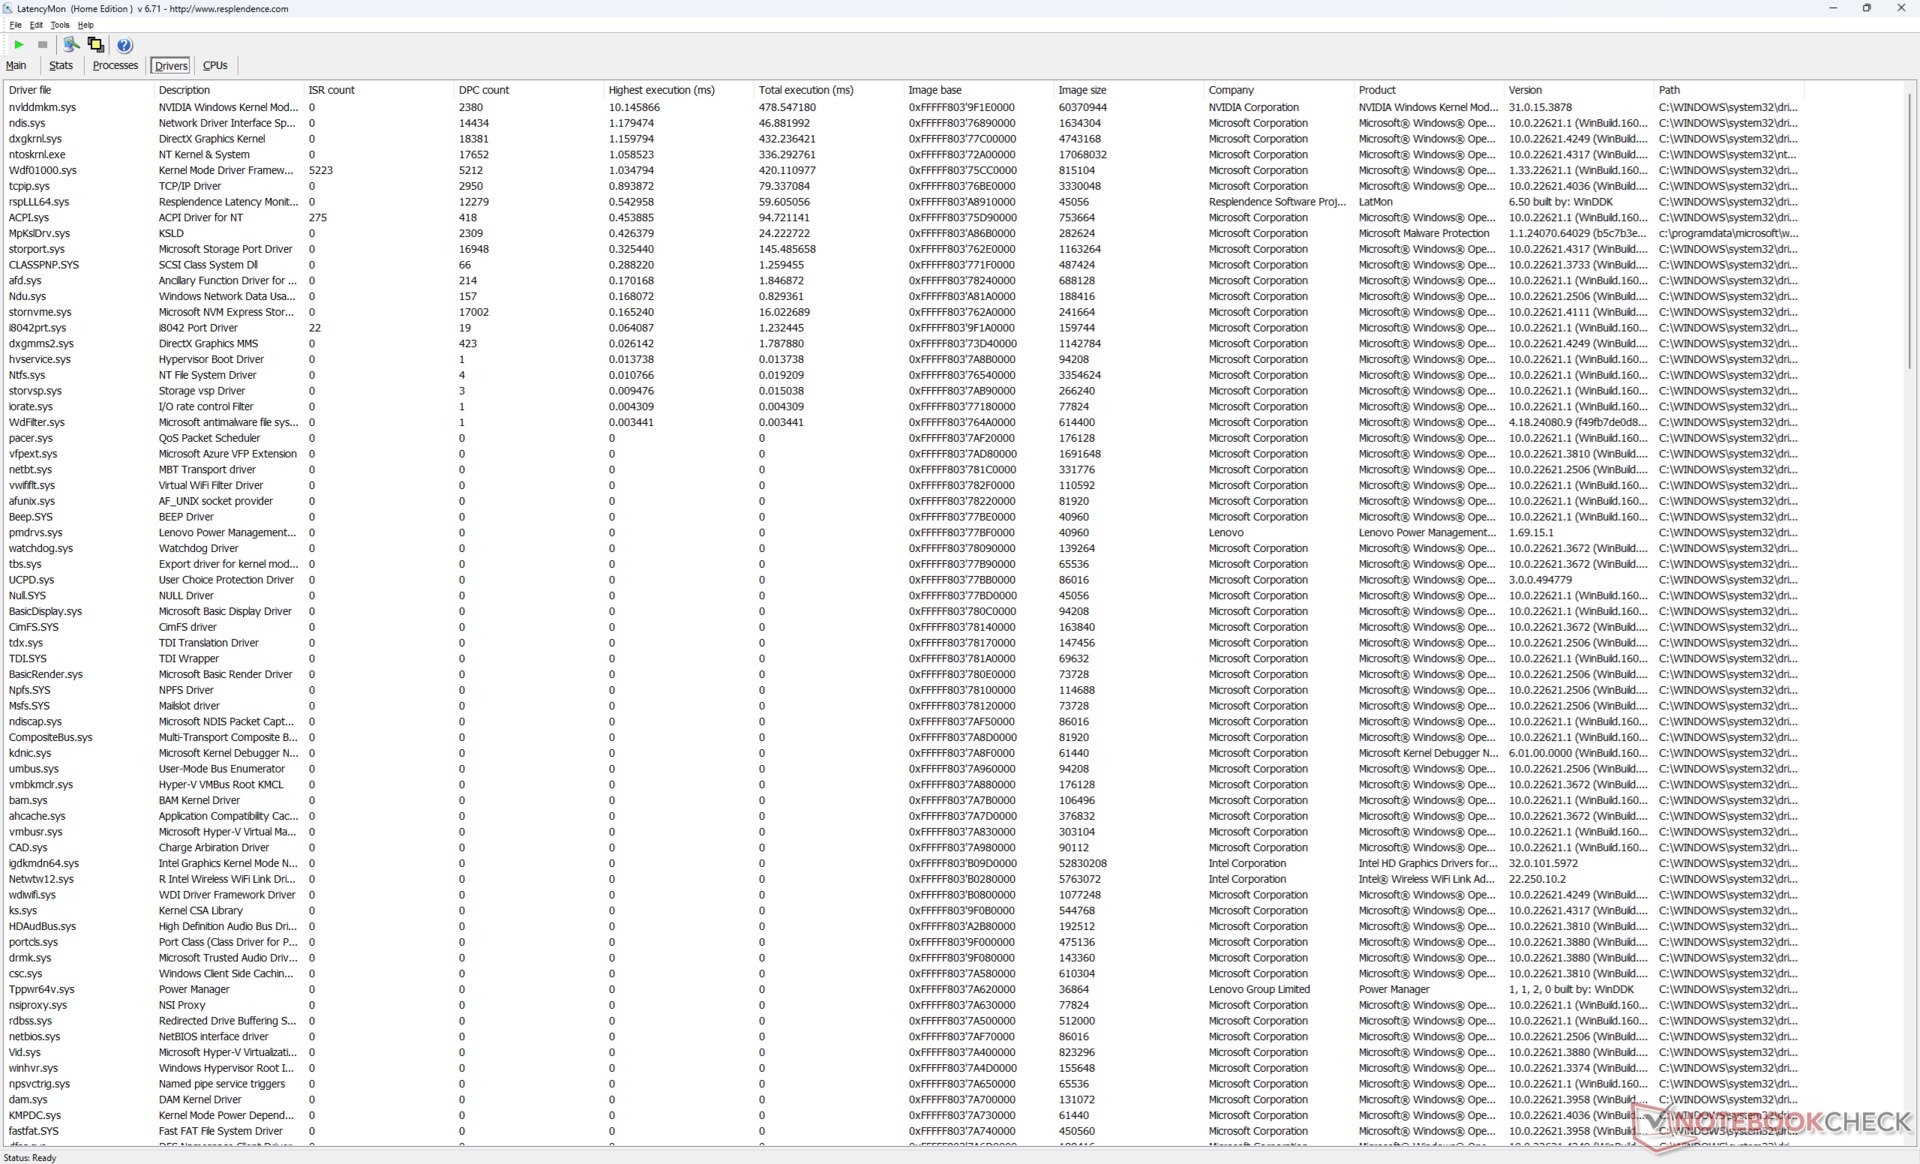
DPC Gecikme Süresi
LatencyMon, ana sayfamızın birden fazla tarayıcı sekmesini açarken hafif DPC sorunları ortaya çıkarıyor. 60 FPS'de 4K video oynatma, kaydedilen hiçbir kare düşmesi olmadan mükemmeldir.
| DPC Latencies / LatencyMon - interrupt to process latency (max), Web, Youtube, Prime95 | |
| HP ZBook Power 16 G11 A | |
| Lenovo ThinkPad P16 G1 RTX A5500 | |
| Lenovo ThinkPad P16s G2 21K9000CGE | |
| Lenovo ThinkPad P16 G2 21FA000FGE | |
| Lenovo ThinkPad P16 Gen 2 | |
| Dell Precision 5690 | |
* ... daha küçük daha iyidir
Depolama Cihazları
İki ThinkPad P16 Gen 2 test ünitemiz arasında depolama seçeneklerinde veya SSD performansında herhangi bir değişiklik gözlenmemiştir.
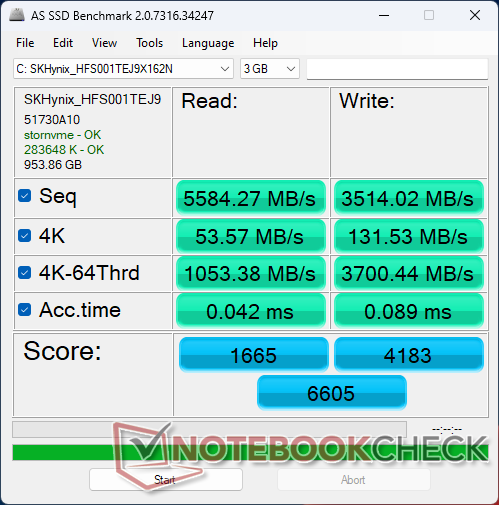
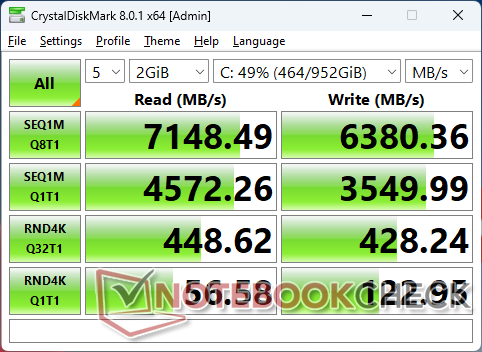

* ... daha küçük daha iyidir
Disk Throttling: DiskSpd Read Loop, Queue Depth 8
GPU Performansı
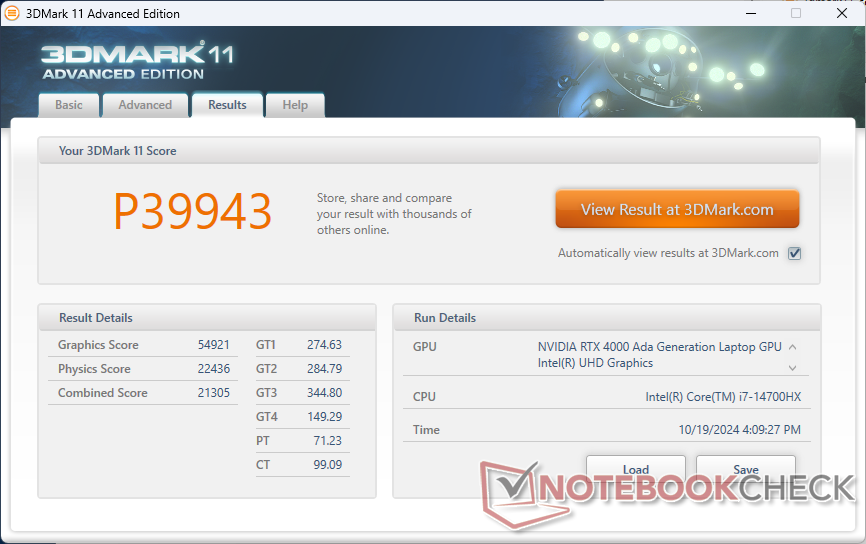
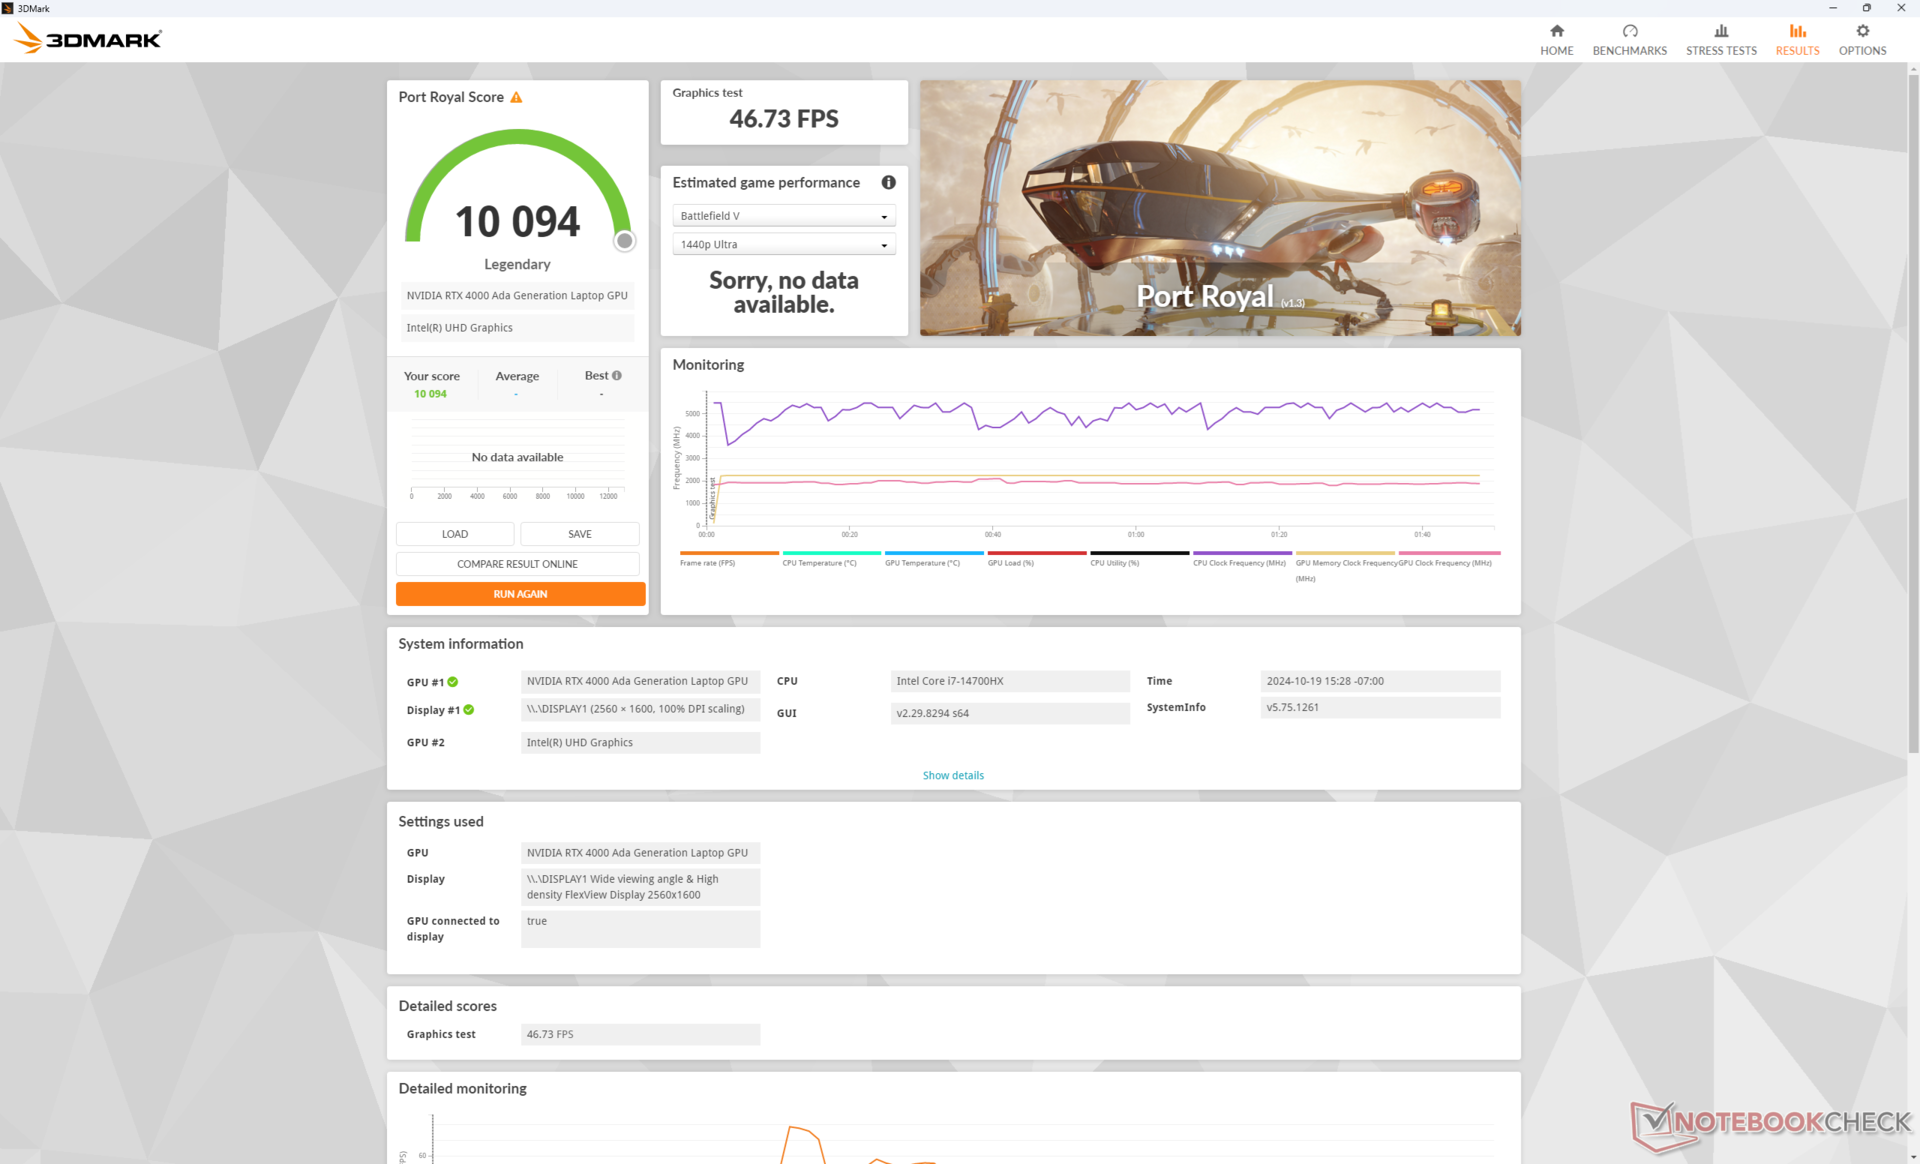
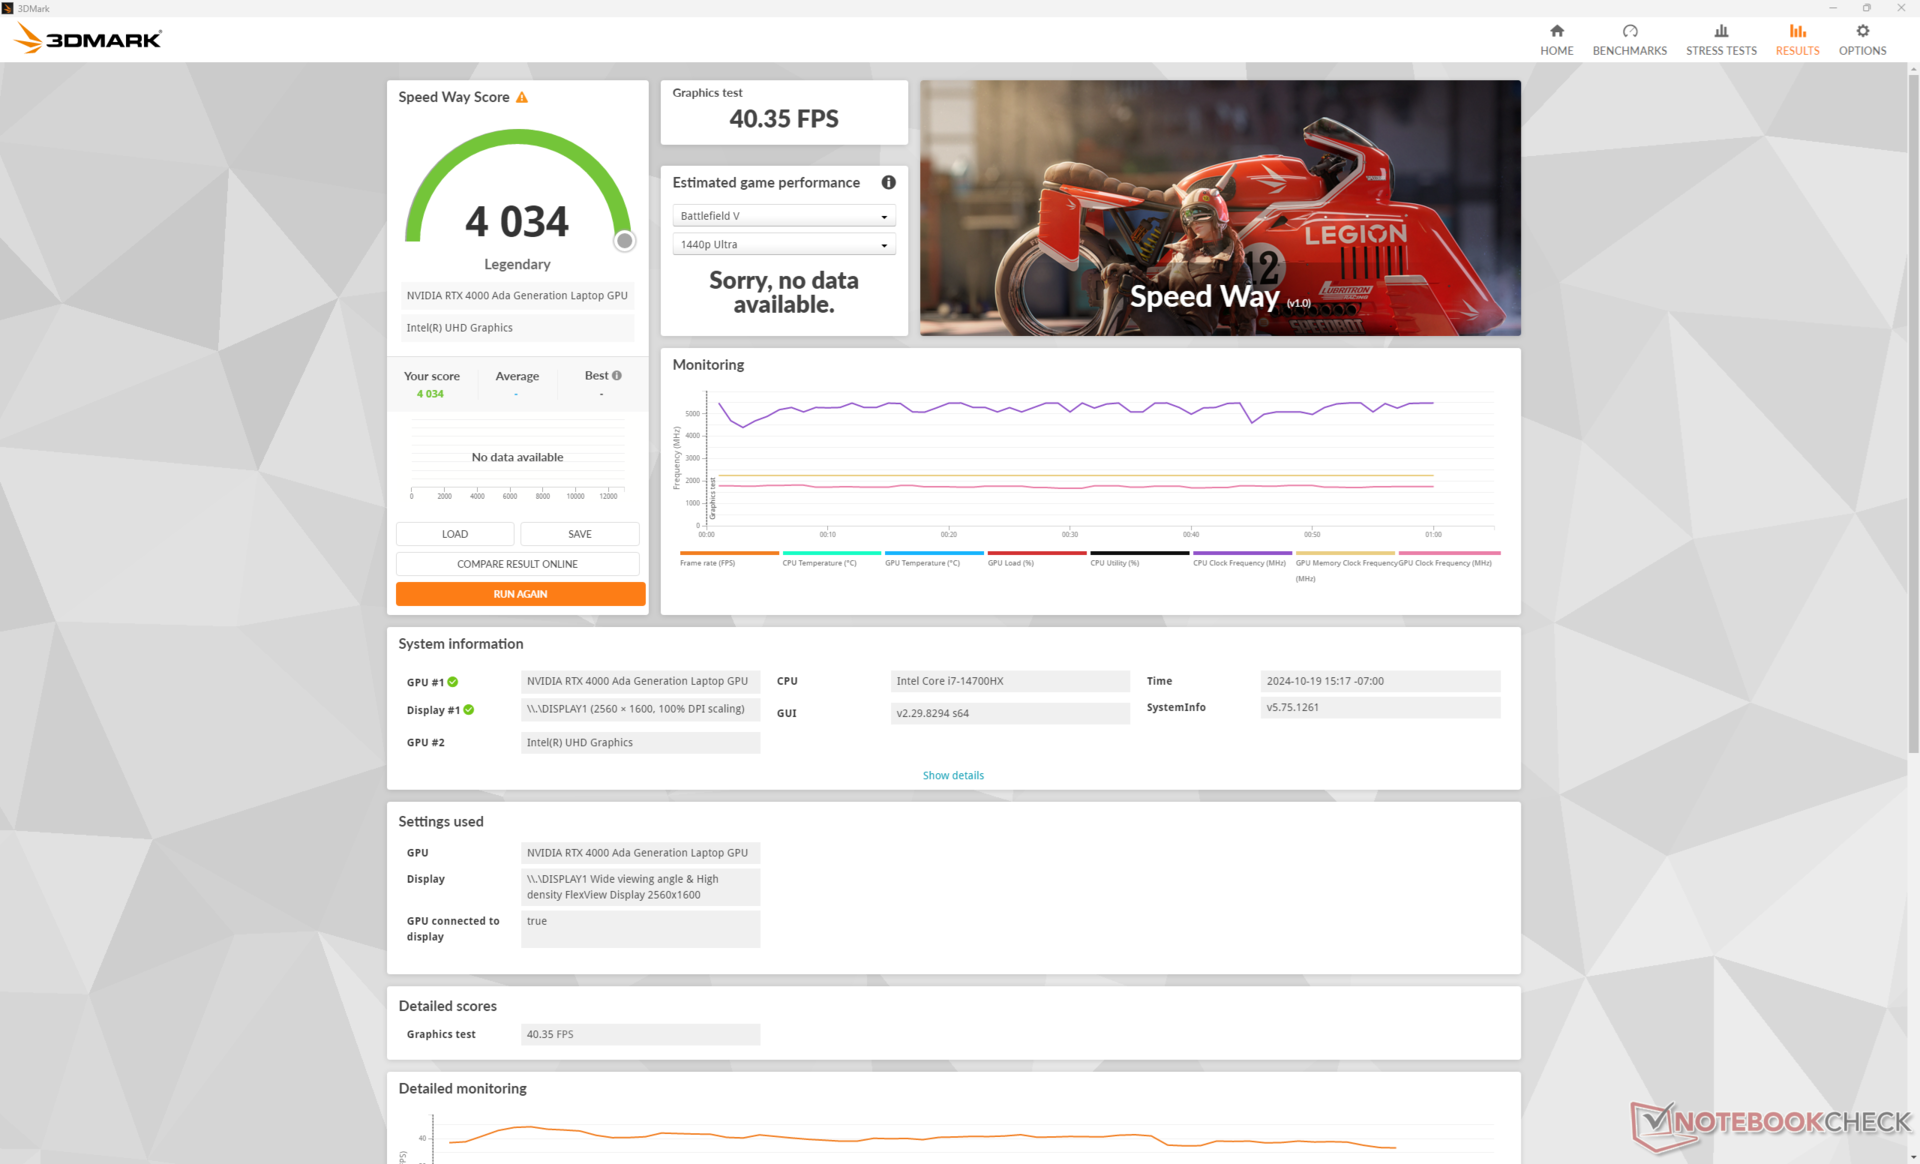
130 W RTX 4000 Ada lenovo'muzdaki mobil GPU, 95 Watt'ı bile geride bırakarak çok güçlü RTX 5000 AdaPrecision 5690'da sağlıklı marjlarla. örneğin 3DMark sonuçları yüzde 10 ila 40 arasında daha yüksektir ve SpecViewPerf çalıştırıldığında da benzer sonuçlar elde edilebilir.
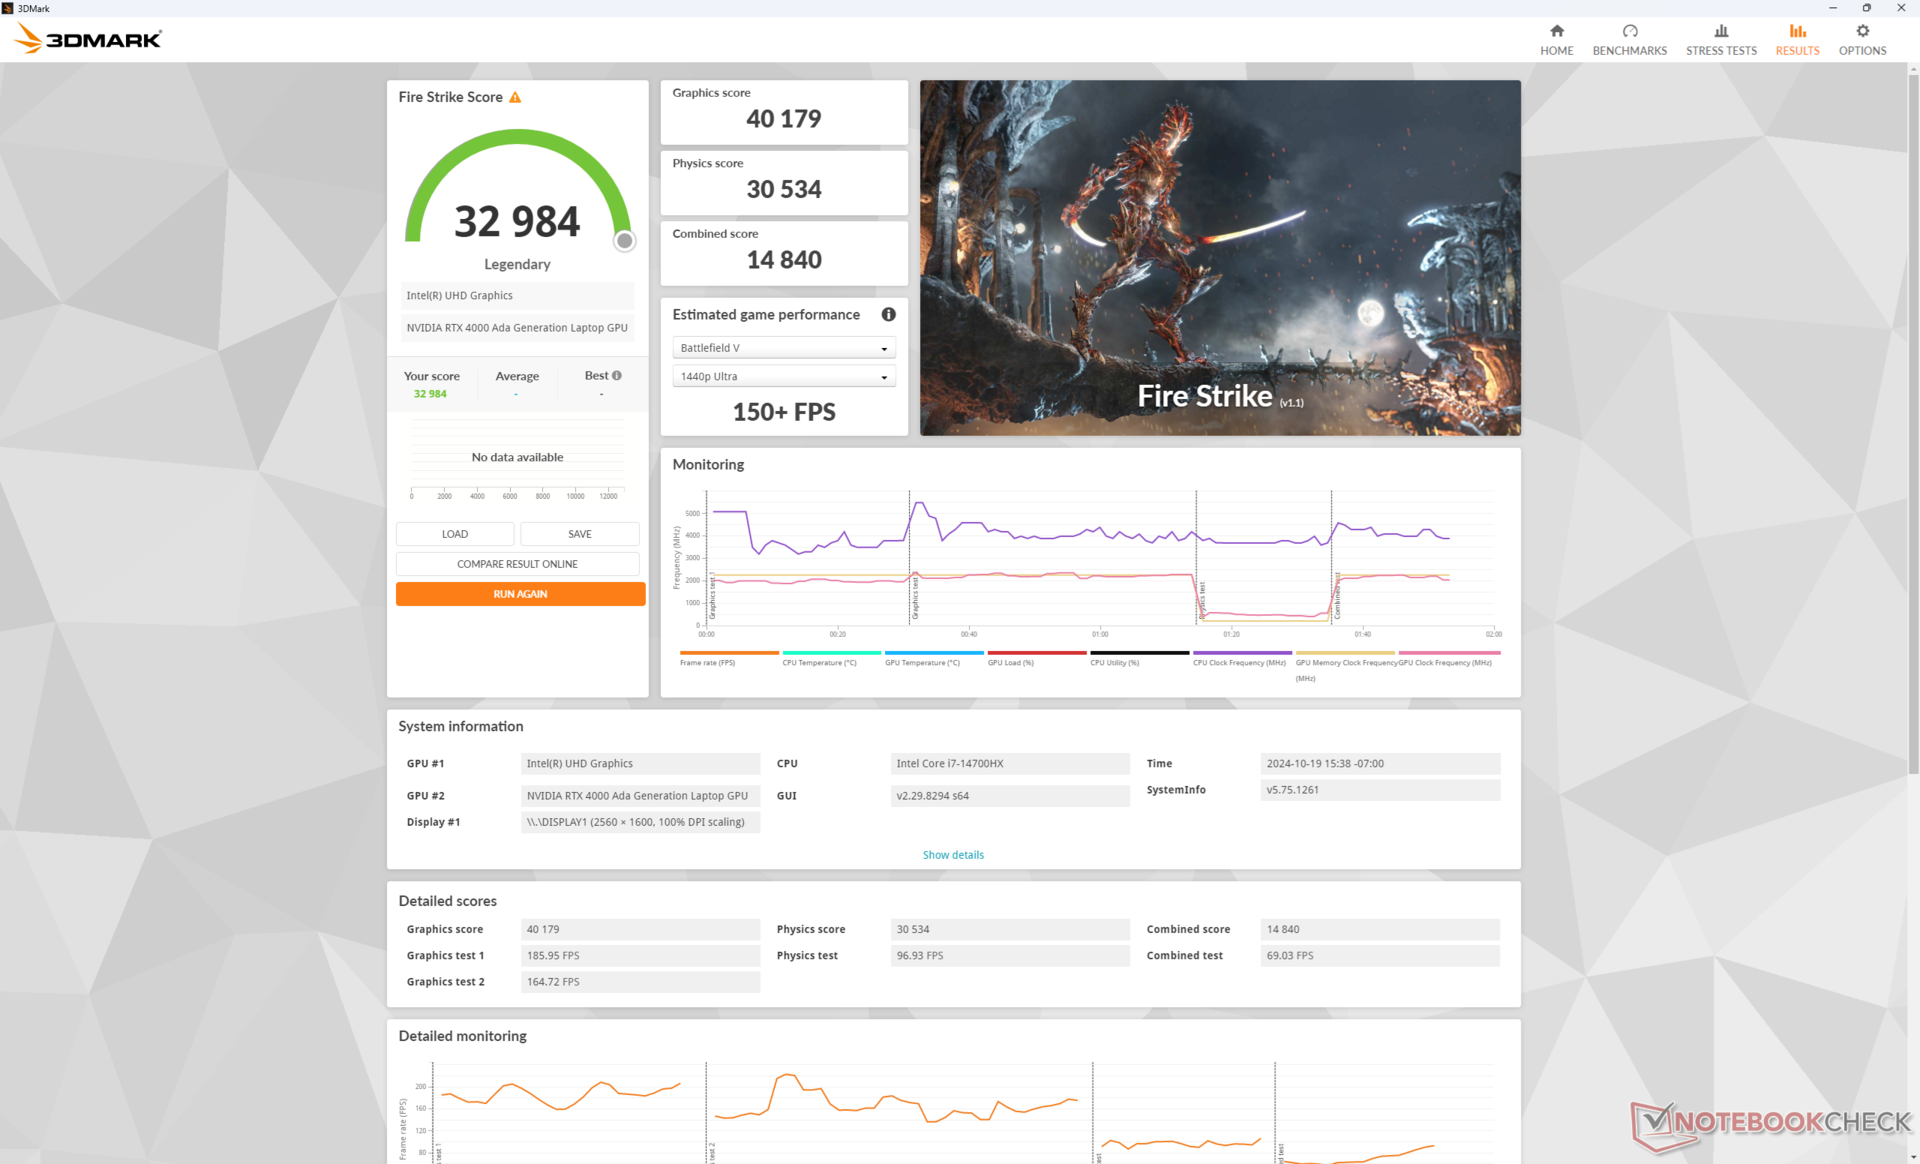
| Güç Profili | Grafik Puanı | Fizik Puanı | Birleşik Puan |
| Performans Modu | 40179 | 30534 | 14840 |
| Dengeli Mod | 32889 (-18%) | 29923 (-2%) | 13007 (-12%) |
| Pil Modu | 23401 (-42%) | 27793 (-9%) | 8510 (-42%) |
Performans modundan Dengeli moda düşmek, yukarıdaki Fire Strike sonuç tablomuzda gösterildiği gibi grafik performansını biraz önemli ölçüde etkiler.
| 3DMark Performance Rating - Percent | |
| Lenovo ThinkPad P16 Gen 2 -3! | |
| Ortalama NVIDIA RTX 4000 Ada Generation Laptop GPU -3! | |
| Dell Precision 5690 -3! | |
| HP ZBook Fury 16 G11 | |
| HP ZBook Fury 16 G9 -3! | |
| Dell Precision 5000 5490 -3! | |
| MSI CreatorPro Z16P B12UKST -19! | |
| HP ZBook Power 15 G10 -11! | |
| Asus ExpertBook B6 Flip B6602FC2 -19! | |
| Lenovo ThinkPad P16v G1 AMD -18! | |
| Lenovo ThinkPad P1 G4-20Y4Z9DVUS -19! | |
| Lenovo ThinkPad P16s G2 21K9000CGE -19! | |
| HP ZBook Firefly 16 G9-6B897EA -19! | |
| 3DMark 11 - 1280x720 Performance GPU | |
| Lenovo ThinkPad P16 Gen 2 | |
| Ortalama NVIDIA RTX 4000 Ada Generation Laptop GPU (n=1) | |
| Dell Precision 5690 | |
| HP ZBook Fury 16 G11 | |
| HP ZBook Fury 16 G9 | |
| Dell Precision 5000 5490 | |
| HP ZBook Power 15 G10 | |
| MSI CreatorPro Z16P B12UKST | |
| Asus ExpertBook B6 Flip B6602FC2 | |
| Lenovo ThinkPad P16v G1 AMD | |
| Lenovo ThinkPad P1 G4-20Y4Z9DVUS | |
| Lenovo ThinkPad P16s G2 21K9000CGE | |
| HP ZBook Firefly 16 G9-6B897EA | |
| 3DMark 11 Performance | 39943 puan | |
| 3DMark Cloud Gate Standard Score | 61459 puan | |
| 3DMark Fire Strike Score | 32984 puan | |
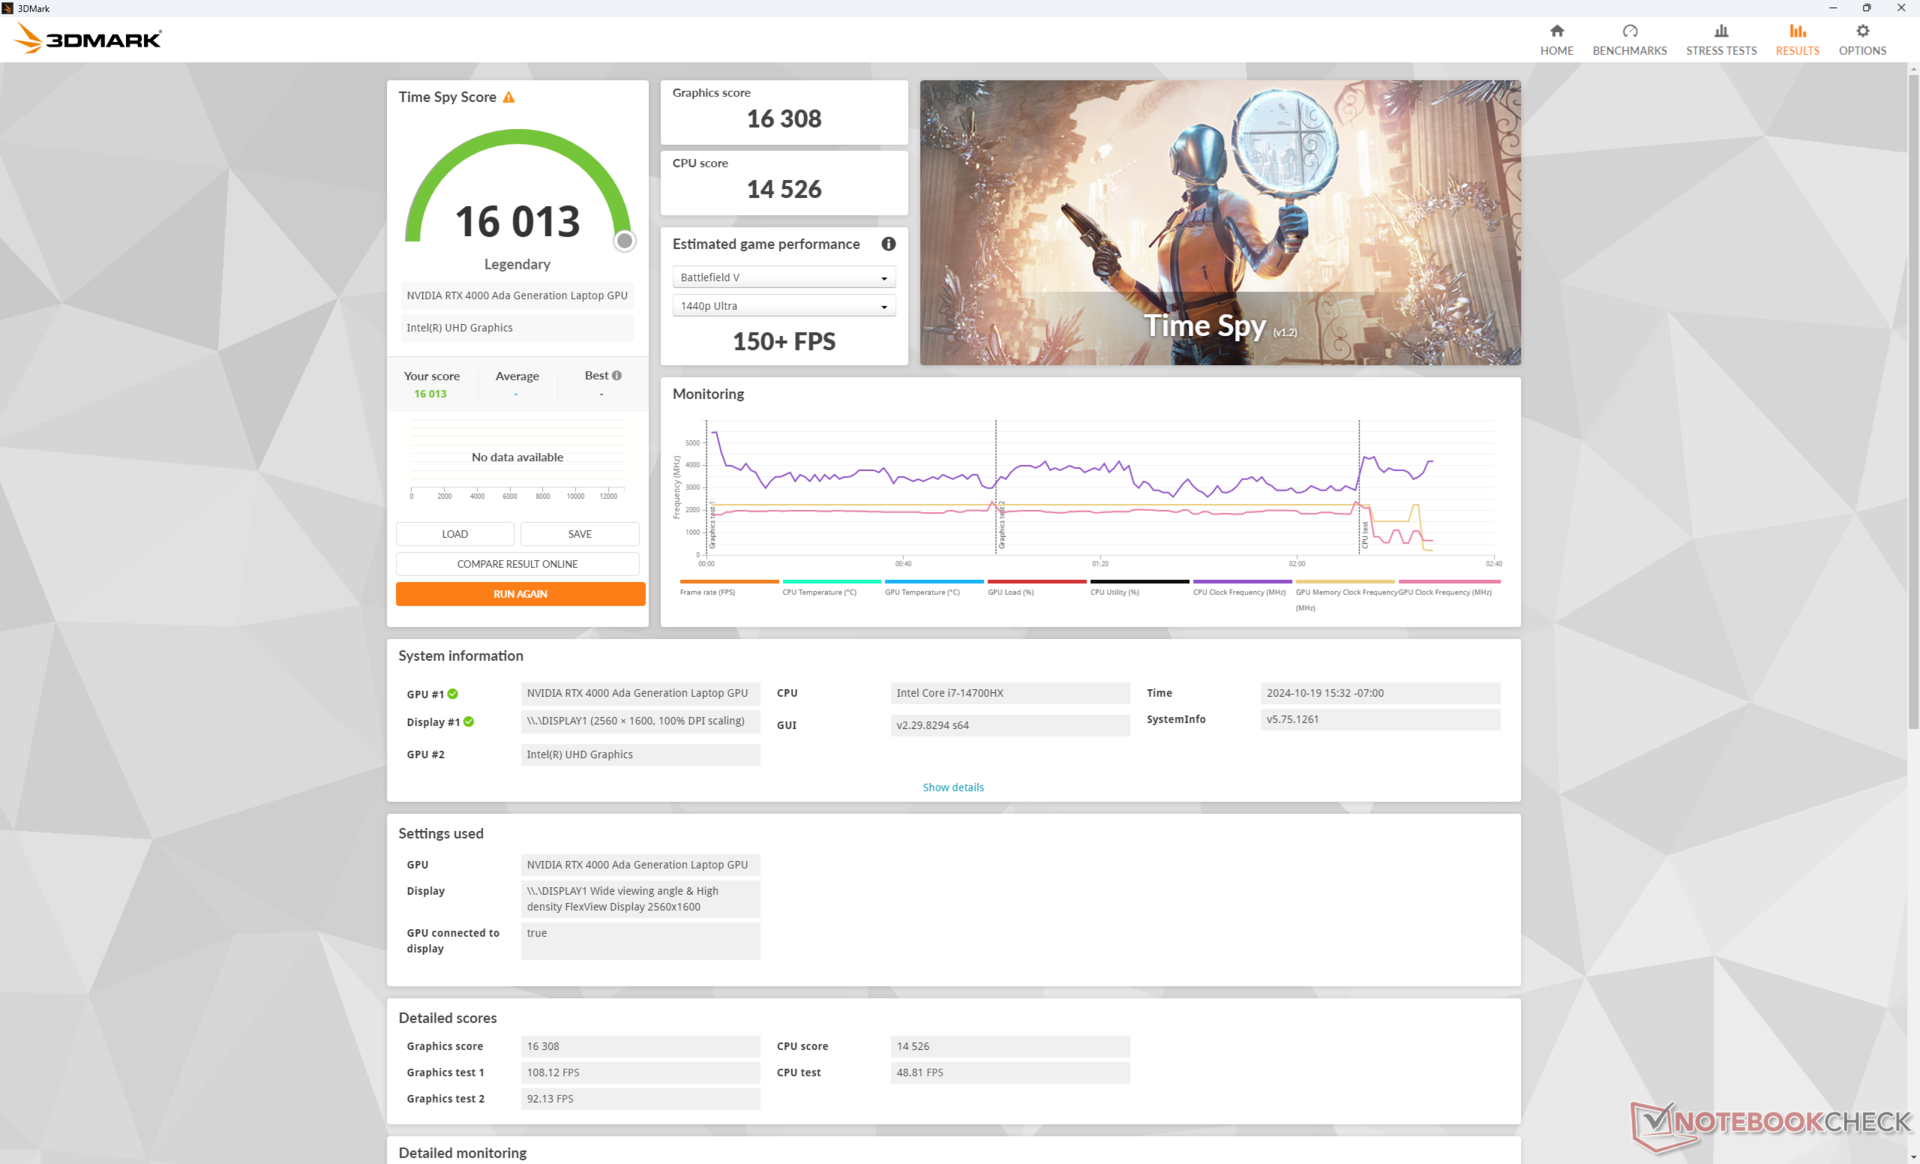
| 3DMark Time Spy Score | 16013 puan | |
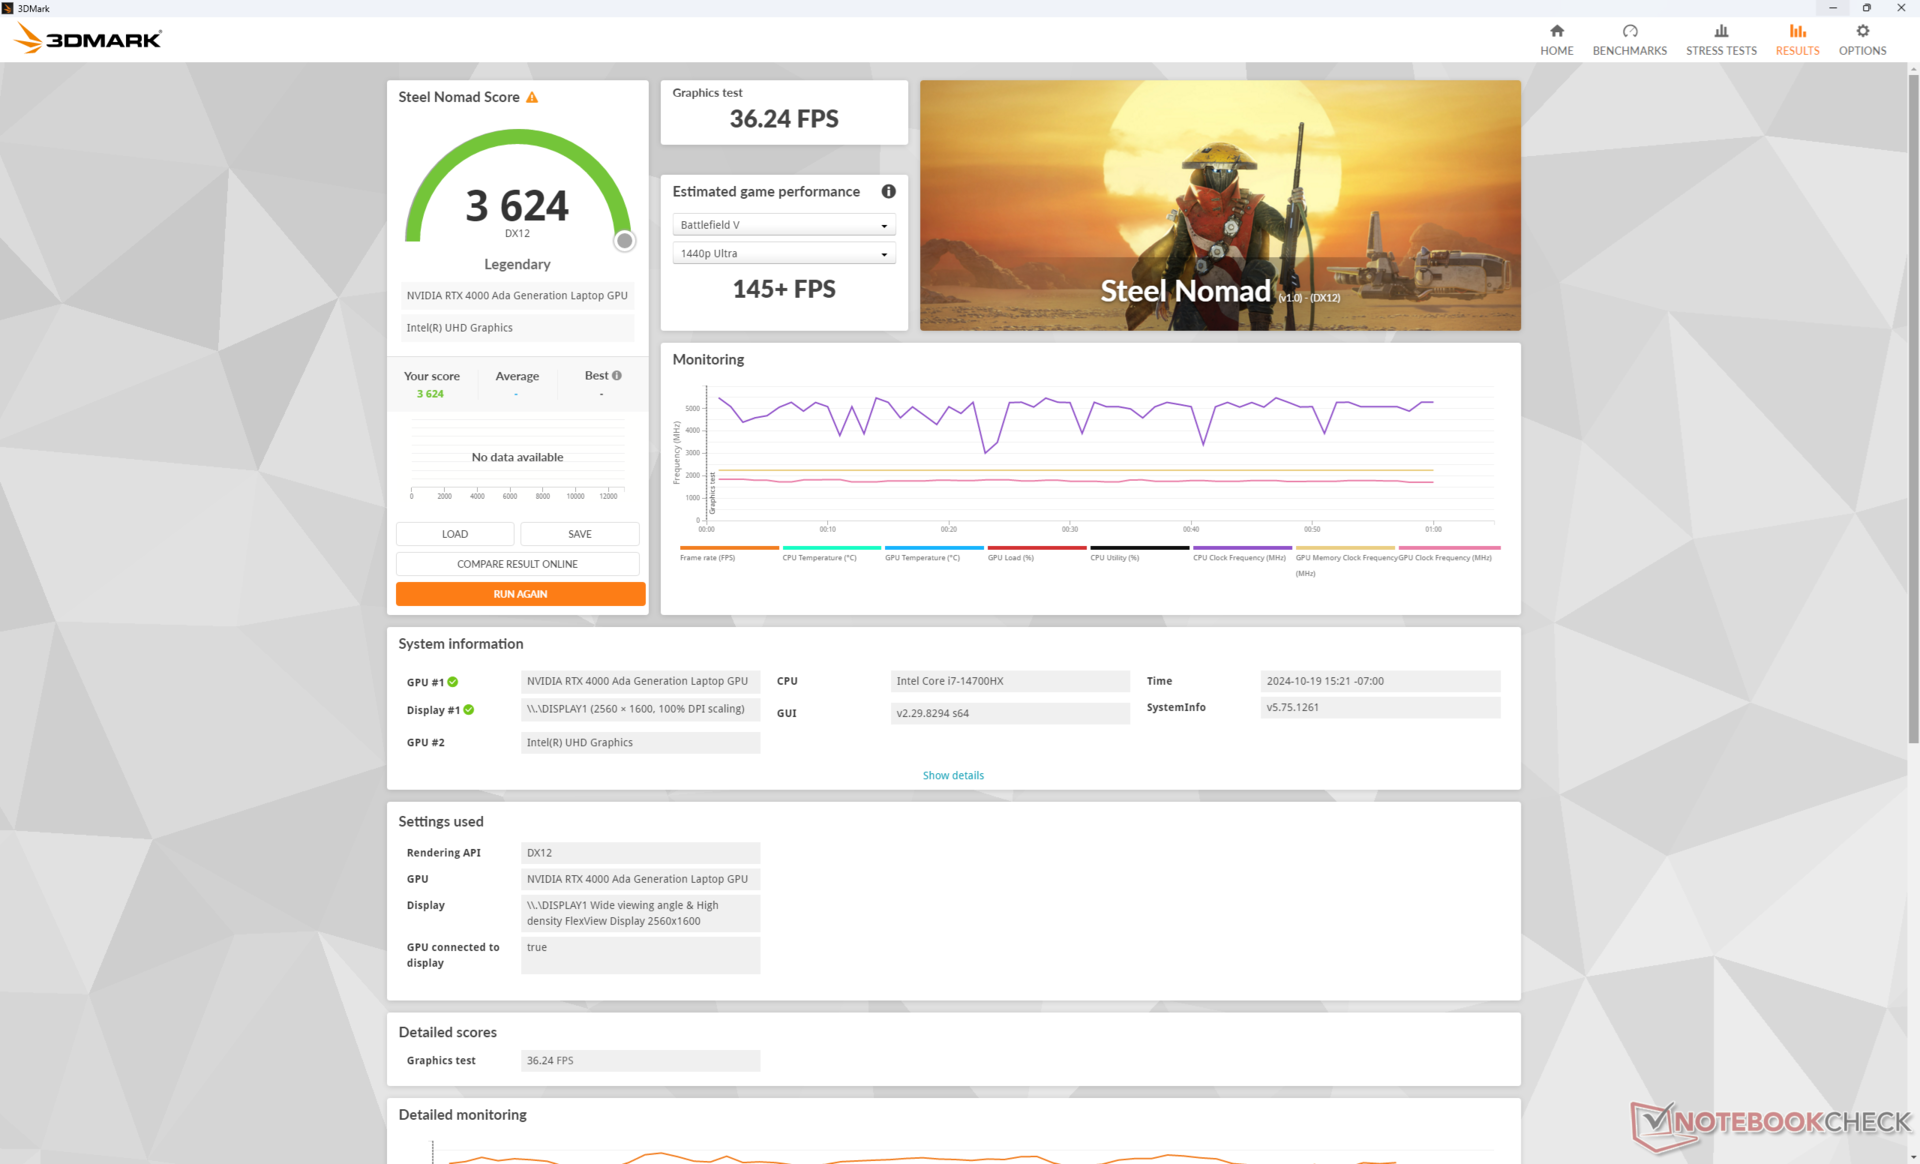
| 3DMark Steel Nomad Score | 3624 puan | |
Yardım | ||
* ... daha küçük daha iyidir
Oyun Performansı
Oyun için optimize edilmemiş olsa da RTX 4000 Ada, özellikle 130 W TGP tavanı düşünüldüğünde hala bir güç merkezi. Oyun performansı en çok mobil cihazlarda çalışan üst düzey bir oyun dizüstü bilgisayarına benzer GeForce RTX 4080.
| Performance Rating - Percent | |
| Lenovo ThinkPad P16 Gen 2 | |
| Dell Precision 5690 -1! | |
| Lenovo ThinkPad P16 G1 RTX A5500 -1! | |
| Lenovo ThinkPad P16 G2 21FA000FGE -1! | |
| HP ZBook Power 16 G11 A | |
| Lenovo ThinkPad P16s G2 21K9000CGE -1! | |
| Baldur's Gate 3 - 1920x1080 Ultra Preset | |
| Lenovo ThinkPad P16 Gen 2 | |
| Dell Precision 5690 | |
| HP ZBook Power 16 G11 A | |
| GTA V - 1920x1080 Highest Settings possible AA:4xMSAA + FX AF:16x | |
| Lenovo ThinkPad P16 Gen 2 | |
| Lenovo ThinkPad P16 G1 RTX A5500 | |
| Lenovo ThinkPad P16 G2 21FA000FGE | |
| HP ZBook Power 16 G11 A | |
| Lenovo ThinkPad P16s G2 21K9000CGE | |
| Final Fantasy XV Benchmark - 1920x1080 High Quality | |
| Lenovo ThinkPad P16 Gen 2 | |
| Dell Precision 5690 | |
| Lenovo ThinkPad P16 G1 RTX A5500 | |
| Lenovo ThinkPad P16 G2 21FA000FGE | |
| HP ZBook Power 16 G11 A | |
| Lenovo ThinkPad P16s G2 21K9000CGE | |
| Strange Brigade - 1920x1080 ultra AA:ultra AF:16 | |
| Lenovo ThinkPad P16 Gen 2 | |
| Dell Precision 5690 | |
| Lenovo ThinkPad P16 G1 RTX A5500 | |
| Lenovo ThinkPad P16 G2 21FA000FGE | |
| HP ZBook Power 16 G11 A | |
| Lenovo ThinkPad P16s G2 21K9000CGE | |
| Dota 2 Reborn - 1920x1080 ultra (3/3) best looking | |
| Lenovo ThinkPad P16 Gen 2 | |
| Lenovo ThinkPad P16 G1 RTX A5500 | |
| Lenovo ThinkPad P16 G2 21FA000FGE | |
| Dell Precision 5690 | |
| HP ZBook Power 16 G11 A | |
| Lenovo ThinkPad P16s G2 21K9000CGE | |
| GTA V | |
| 1920x1080 Highest Settings possible AA:4xMSAA + FX AF:16x | |
| Lenovo ThinkPad P16 Gen 2 | |
| Ortalama NVIDIA RTX 4000 Ada Generation Laptop GPU (n=1) | |
| HP ZBook Fury 16 G9 | |
| HP ZBook Fury 16 G11 | |
| MSI CreatorPro Z16P B12UKST | |
| HP ZBook Power 15 G10 | |
| Asus ExpertBook B6 Flip B6602FC2 | |
| Lenovo ThinkPad P16v G1 AMD | |
| HP ZBook Firefly 16 G9-6B897EA | |
| Lenovo ThinkPad P16s G2 21K9000CGE | |
| 2560x1440 Highest Settings possible AA:4xMSAA + FX AF:16x | |
| Lenovo ThinkPad P16 Gen 2 | |
| Ortalama NVIDIA RTX 4000 Ada Generation Laptop GPU (n=1) | |
| HP ZBook Fury 16 G11 | |
| HP ZBook Fury 16 G11 | |
| HP ZBook Fury 16 G9 | |
| MSI CreatorPro Z16P B12UKST | |
| HP ZBook Power 15 G10 | |
| Lenovo ThinkPad P16s G2 21K9000CGE | |
| 1920x1080 High/On (Advanced Graphics Off) AA:2xMSAA + FX AF:8x | |
| Lenovo ThinkPad P16 Gen 2 | |
| Ortalama NVIDIA RTX 4000 Ada Generation Laptop GPU (n=1) | |
| HP ZBook Fury 16 G9 | |
| HP ZBook Fury 16 G11 | |
| MSI CreatorPro Z16P B12UKST | |
| Asus ExpertBook B6 Flip B6602FC2 | |
| HP ZBook Power 15 G10 | |
| Lenovo ThinkPad P16v G1 AMD | |
| Lenovo ThinkPad P16s G2 21K9000CGE | |
| HP ZBook Firefly 16 G9-6B897EA | |
| Dota 2 Reborn | |
| 1920x1080 high (2/3) | |
| Lenovo ThinkPad P16 Gen 2 | |
| Ortalama NVIDIA RTX 4000 Ada Generation Laptop GPU (n=1) | |
| HP ZBook Fury 16 G9 | |
| HP ZBook Fury 16 G11 | |
| MSI CreatorPro Z16P B12UKST | |
| Asus ExpertBook B6 Flip B6602FC2 | |
| Dell Precision 5690 | |
| HP ZBook Power 15 G10 | |
| Dell Precision 5000 5490 | |
| Lenovo ThinkPad P1 G4-20Y4Z9DVUS | |
| Lenovo ThinkPad P16v G1 AMD | |
| HP ZBook Firefly 16 G9-6B897EA | |
| Lenovo ThinkPad P16s G2 21K9000CGE | |
| 1920x1080 ultra (3/3) best looking | |
| Lenovo ThinkPad P16 Gen 2 | |
| Ortalama NVIDIA RTX 4000 Ada Generation Laptop GPU (n=1) | |
| HP ZBook Fury 16 G11 | |
| HP ZBook Fury 16 G9 | |
| MSI CreatorPro Z16P B12UKST | |
| Asus ExpertBook B6 Flip B6602FC2 | |
| Dell Precision 5690 | |
| HP ZBook Power 15 G10 | |
| Dell Precision 5000 5490 | |
| Lenovo ThinkPad P16v G1 AMD | |
| Lenovo ThinkPad P1 G4-20Y4Z9DVUS | |
| HP ZBook Firefly 16 G9-6B897EA | |
| Lenovo ThinkPad P16s G2 21K9000CGE | |
| X-Plane 11.11 | |
| 1920x1080 med (fps_test=2) | |
| Lenovo ThinkPad P16 Gen 2 | |
| Ortalama NVIDIA RTX 4000 Ada Generation Laptop GPU (n=1) | |
| HP ZBook Fury 16 G11 | |
| Asus ExpertBook B6 Flip B6602FC2 | |
| HP ZBook Fury 16 G9 | |
| MSI CreatorPro Z16P B12UKST | |
| Dell Precision 5690 | |
| Dell Precision 5000 5490 | |
| Lenovo ThinkPad P1 G4-20Y4Z9DVUS | |
| Lenovo ThinkPad P16v G1 AMD | |
| HP ZBook Power 15 G10 | |
| HP ZBook Firefly 16 G9-6B897EA | |
| Lenovo ThinkPad P16s G2 21K9000CGE | |
| Lenovo ThinkPad P16s G2 21K9000CGE | |
| 1920x1080 high (fps_test=3) | |
| Lenovo ThinkPad P16 Gen 2 | |
| Ortalama NVIDIA RTX 4000 Ada Generation Laptop GPU (n=1) | |
| HP ZBook Fury 16 G11 | |
| Asus ExpertBook B6 Flip B6602FC2 | |
| HP ZBook Fury 16 G9 | |
| MSI CreatorPro Z16P B12UKST | |
| Dell Precision 5690 | |
| Dell Precision 5000 5490 | |
| Lenovo ThinkPad P1 G4-20Y4Z9DVUS | |
| Lenovo ThinkPad P16v G1 AMD | |
| HP ZBook Firefly 16 G9-6B897EA | |
| HP ZBook Power 15 G10 | |
| Lenovo ThinkPad P16s G2 21K9000CGE | |
| Lenovo ThinkPad P16s G2 21K9000CGE | |
| Strange Brigade | |
| 1920x1080 high AA:high AF:8 | |
| Lenovo ThinkPad P16 Gen 2 | |
| Ortalama NVIDIA RTX 4000 Ada Generation Laptop GPU (n=1) | |
| Dell Precision 5690 | |
| HP ZBook Fury 16 G11 | |
| HP ZBook Fury 16 G9 | |
| Dell Precision 5000 5490 | |
| HP ZBook Power 15 G10 | |
| Asus ExpertBook B6 Flip B6602FC2 | |
| MSI CreatorPro Z16P B12UKST | |
| Lenovo ThinkPad P16v G1 AMD | |
| Lenovo ThinkPad P16s G2 21K9000CGE | |
| HP ZBook Firefly 16 G9-6B897EA | |
| 1920x1080 ultra AA:ultra AF:16 | |
| Lenovo ThinkPad P16 Gen 2 | |
| Ortalama NVIDIA RTX 4000 Ada Generation Laptop GPU (n=1) | |
| Dell Precision 5690 | |
| HP ZBook Fury 16 G11 | |
| HP ZBook Fury 16 G9 | |
| HP ZBook Power 15 G10 | |
| Dell Precision 5000 5490 | |
| Asus ExpertBook B6 Flip B6602FC2 | |
| MSI CreatorPro Z16P B12UKST | |
| Lenovo ThinkPad P16v G1 AMD | |
| Lenovo ThinkPad P16s G2 21K9000CGE | |
| HP ZBook Firefly 16 G9-6B897EA | |
| 2560x1440 ultra AA:ultra AF:16 | |
| Lenovo ThinkPad P16 Gen 2 | |
| Ortalama NVIDIA RTX 4000 Ada Generation Laptop GPU (n=1) | |
| Dell Precision 5690 | |
| HP ZBook Fury 16 G11 | |
| HP ZBook Fury 16 G9 | |
| HP ZBook Power 15 G10 | |
| MSI CreatorPro Z16P B12UKST | |
| Lenovo ThinkPad P16s G2 21K9000CGE | |
| Tiny Tina's Wonderlands | |
| 1920x1080 High Preset (DX12) | |
| Lenovo ThinkPad P16 Gen 2 | |
| Ortalama NVIDIA RTX 4000 Ada Generation Laptop GPU (n=1) | |
| Dell Precision 5690 | |
| HP ZBook Fury 16 G11 | |
| HP ZBook Fury 16 G9 | |
| Dell Precision 5000 5490 | |
| HP ZBook Power 15 G10 | |
| Asus ExpertBook B6 Flip B6602FC2 | |
| 1920x1080 Badass Preset (DX12) | |
| Lenovo ThinkPad P16 Gen 2 | |
| Ortalama NVIDIA RTX 4000 Ada Generation Laptop GPU (n=1) | |
| Dell Precision 5690 | |
| HP ZBook Fury 16 G11 | |
| HP ZBook Fury 16 G9 | |
| Dell Precision 5000 5490 | |
| HP ZBook Power 15 G10 | |
| Asus ExpertBook B6 Flip B6602FC2 | |
| 2560x1440 Badass Preset (DX12) | |
| Lenovo ThinkPad P16 Gen 2 | |
| Ortalama NVIDIA RTX 4000 Ada Generation Laptop GPU (n=1) | |
| Dell Precision 5690 | |
| HP ZBook Fury 16 G11 | |
| HP ZBook Fury 16 G9 | |
| HP ZBook Power 15 G10 | |
| Asus ExpertBook B6 Flip B6602FC2 | |
| F1 22 | |
| 1920x1080 High Preset AA:T AF:16x | |
| Lenovo ThinkPad P16 Gen 2 | |
| Ortalama NVIDIA RTX 4000 Ada Generation Laptop GPU (n=1) | |
| Dell Precision 5690 | |
| HP ZBook Fury 16 G11 | |
| HP ZBook Fury 16 G9 | |
| Dell Precision 5000 5490 | |
| Asus ExpertBook B6 Flip B6602FC2 | |
| MSI CreatorPro Z16P B12UKST | |
| HP ZBook Power 15 G10 | |
| Lenovo ThinkPad P16v G1 AMD | |
| HP ZBook Firefly 16 G9-6B897EA | |
| 1920x1080 Ultra High Preset AA:T AF:16x | |
| Lenovo ThinkPad P16 Gen 2 | |
| Ortalama NVIDIA RTX 4000 Ada Generation Laptop GPU (n=1) | |
| Dell Precision 5690 | |
| HP ZBook Fury 16 G11 | |
| HP ZBook Fury 16 G9 | |
| Dell Precision 5000 5490 | |
| HP ZBook Power 15 G10 | |
| Asus ExpertBook B6 Flip B6602FC2 | |
| MSI CreatorPro Z16P B12UKST | |
| HP ZBook Firefly 16 G9-6B897EA | |
| Lenovo ThinkPad P16v G1 AMD | |
| 2560x1440 Ultra High Preset AA:T AF:16x | |
| Lenovo ThinkPad P16 Gen 2 | |
| Ortalama NVIDIA RTX 4000 Ada Generation Laptop GPU (n=1) | |
| Dell Precision 5690 | |
| HP ZBook Fury 16 G11 | |
| HP ZBook Fury 16 G9 | |
| HP ZBook Power 15 G10 | |
| MSI CreatorPro Z16P B12UKST | |
| Cyberpunk 2077 2.2 Phantom Liberty | |
| 1920x1080 High Preset (FSR off) | |
| Lenovo ThinkPad P16 Gen 2 | |
| Ortalama NVIDIA RTX 4000 Ada Generation Laptop GPU (n=1) | |
| HP ZBook Fury 16 G11 | |
| Dell Precision 5690 | |
| Dell Precision 5000 5490 | |
| HP ZBook Power 15 G10 | |
| Lenovo ThinkPad P16v G1 AMD | |
| 1920x1080 Ultra Preset (FSR off) | |
| Dell Precision 5690 | |
| Lenovo ThinkPad P16 Gen 2 | |
| Ortalama NVIDIA RTX 4000 Ada Generation Laptop GPU (n=1) | |
| HP ZBook Fury 16 G11 | |
| Dell Precision 5000 5490 | |
| HP ZBook Power 15 G10 | |
| Lenovo ThinkPad P16v G1 AMD | |
| 2560x1440 Ultra Preset (FSR off) | |
| Lenovo ThinkPad P16 Gen 2 | |
| Ortalama NVIDIA RTX 4000 Ada Generation Laptop GPU (n=1) | |
| Dell Precision 5690 | |
| HP ZBook Fury 16 G11 | |
| HP ZBook Power 15 G10 | |
Ne yazık ki, Cyberpunk 2077'yi çalıştırırken hafif bir performans kaybı var. Oyunda sadece birkaç dakika boşta kaldıktan sonra kare hızları ~103'ten ~96'ya düşüyor ve tekrarlanan testlerden sonra sonuçlar iyileşmiyor. Bu da GPU'nun daha yetenekli bir soğutma çözümünden potansiyel olarak faydalanabileceğini gösteriyor.
Cyberpunk 2077 ultra FPS Chart
| düşük | orta | yüksek | ultra | QHD | |
|---|---|---|---|---|---|
| GTA V (2015) | 185.8 | 183.9 | 179.4 | 125.6 | 118.7 |
| Dota 2 Reborn (2015) | 215.4 | 189.7 | 185.2 | 164.4 | |
| Final Fantasy XV Benchmark (2018) | 207 | 185.3 | 150 | 119.5 | |
| X-Plane 11.11 (2018) | 166.8 | 144 | 113.1 | ||
| Far Cry 5 (2018) | 168 | 148 | 138 | 128 | 125 |
| Strange Brigade (2018) | 452 | 372 | 323 | 292 | 210 |
| Tiny Tina's Wonderlands (2022) | 275.4 | 232.6 | 171.4 | 137.1 | 92 |
| F1 22 (2022) | 275 | 264 | 238 | 95.5 | 65.7 |
| Baldur's Gate 3 (2023) | 178.3 | 160.6 | 141.6 | 137 | 90.7 |
| Cyberpunk 2077 2.2 Phantom Liberty (2023) | 129.3 | 115.1 | 108.4 | 98.3 | 68.5 |
Emisyonlar - Yüksek Sesli ve Görevli
Sistem Gürültüsü
Ünitemizdeki fanlar, daha düşük RTX 2000 Ada yapılandırmamıza kıyasla RPM ve gürültüyü daha kolay artırma eğilimindedir. Bu nedenle, cihaz sahipleri farklı yük türlerini çalıştırırken daha fazla fan titreşimi ve fan gürültüsü değişikliği bekleyebilirler. Oyunlar gibi zorlu yükler, test ettiğimiz en gürültülü 16 inç iş istasyonlarından biri olarak 53 dB(A) fan gürültüsüne neden olur.
Cyberpunk 2077 'yi Performans modu yerine Dengeli modda çalıştırmak fan gürültüsünü belirgin bir şekilde 52,8 dB(A)'dan 47,9 dB(A)'ya düşürür. Ancak bu, yukarıdaki GPU Performansı bölümümüzde de belirtildiği gibi performanstan ödün vermek anlamına geliyor.
Ses yüksekliği
| Boşta |
| 29.1 / 29.1 / 29.1 dB |
| Çalışırken |
| 41 / 52.9 dB |
 | ||
30 dB sessiz 40 dB(A) duyulabilirlik 50 dB(A) gürültülü |
||
min: | ||
| Lenovo ThinkPad P16 Gen 2 NVIDIA RTX 4000 Ada Generation Laptop GPU, i7-14700HX, SK hynix PC801 HFS001TEJ9X162N | Lenovo ThinkPad P16 G2 21FA000FGE NVIDIA RTX 2000 Ada Generation Laptop GPU, i7-13700HX, SK hynix PC801 HFS001TEJ9X162N | Lenovo ThinkPad P16s G2 21K9000CGE Radeon 780M, R7 PRO 7840U, SK hynix PC801 HFS001TEJ9X162N | Lenovo ThinkPad P16 G1 RTX A5500 RTX A5500 Laptop GPU, i9-12950HX, WDC PC SN810 2TB | HP ZBook Power 16 G11 A NVIDIA RTX 2000 Ada Generation Laptop GPU, R7 8845HS, Samsung PM9A1 MZVL22T0HBLB | Dell Precision 5690 NVIDIA RTX 5000 Ada Generation Laptop GPU, Ultra 9 185H, 2x Samsung PM9A1 1TB (RAID 0) | |
|---|---|---|---|---|---|---|
| Noise | 6% | 17% | 17% | 18% | 5% | |
| kapalı / ortam * | 23.9 | 23.5 2% | 22.6 5% | 23.1 3% | 23.5 2% | 23.4 2% |
| Idle Minimum * | 29.1 | 23.5 19% | 22.6 22% | 23.1 21% | 23.8 18% | 23.6 19% |
| Idle Average * | 29.1 | 29.2 -0% | 22.6 22% | 23.1 21% | 24.2 17% | 24.9 14% |
| Idle Maximum * | 29.1 | 29.5 -1% | 22.6 22% | 23.1 21% | 24.2 17% | 30.9 -6% |
| Load Average * | 41 | 32.7 20% | 37.8 8% | 28.9 30% | 25.4 38% | 40.4 1% |
| Cyberpunk 2077 ultra * | 52.8 | 43 19% | ||||
| Load Maximum * | 52.9 | 56.6 -7% | 40.5 23% | 51.4 3% | 45 15% | 51.9 2% |
| Witcher 3 ultra * | 50.6 | 40.3 | 51.6 | 48.3 |
* ... daha küçük daha iyidir
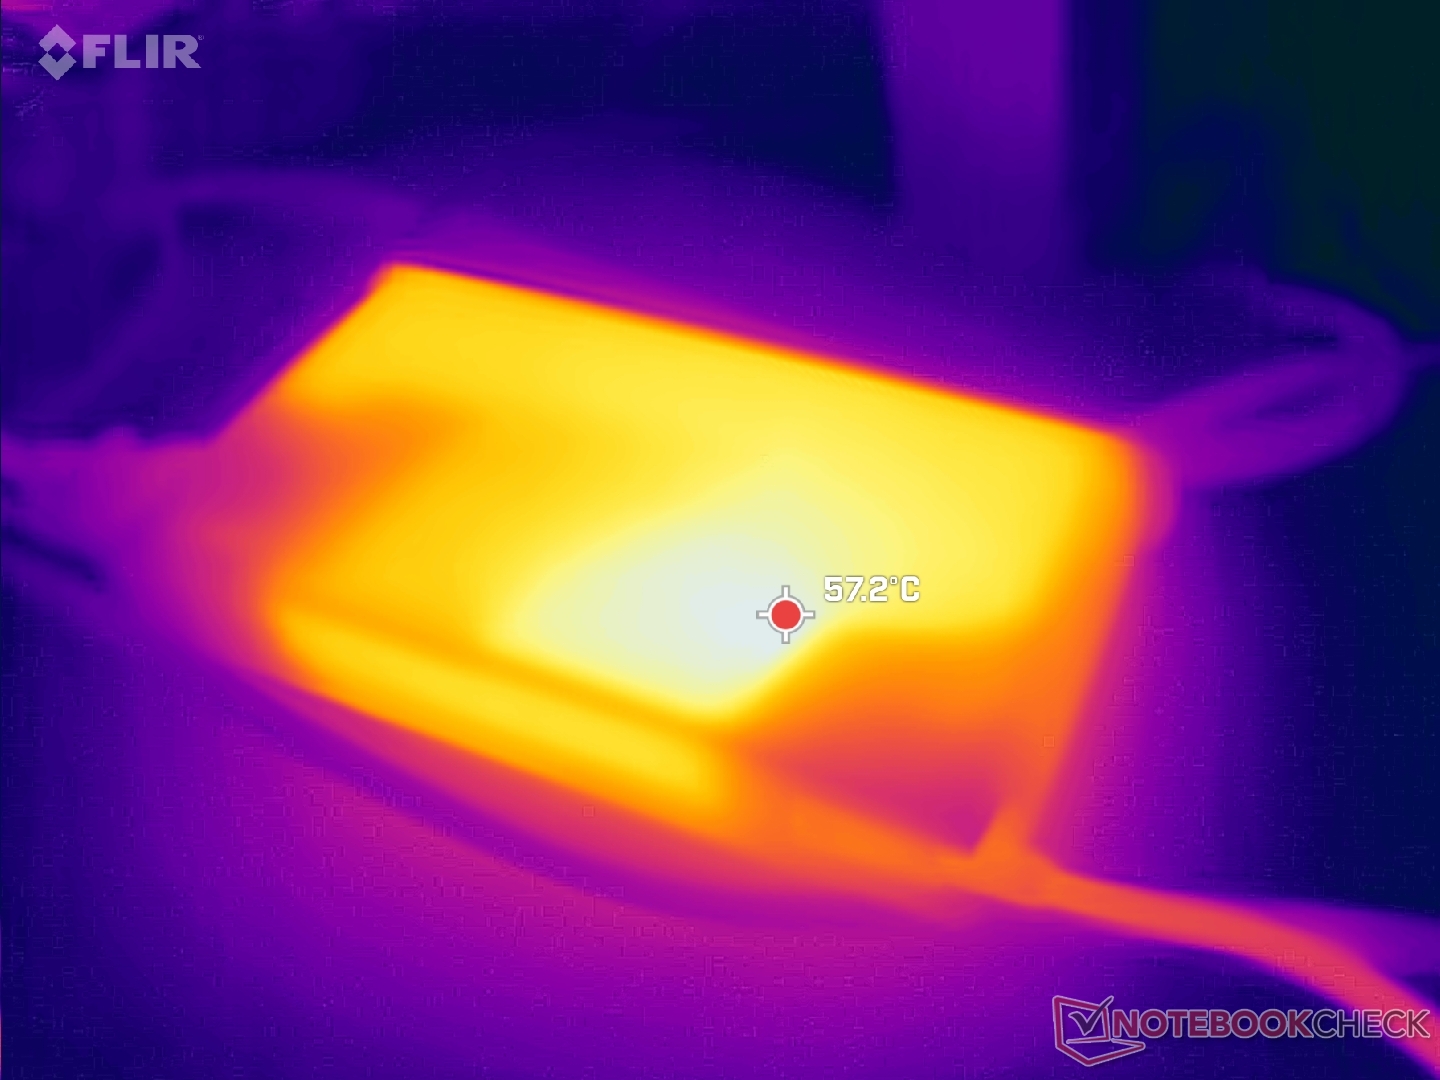
Sıcaklık
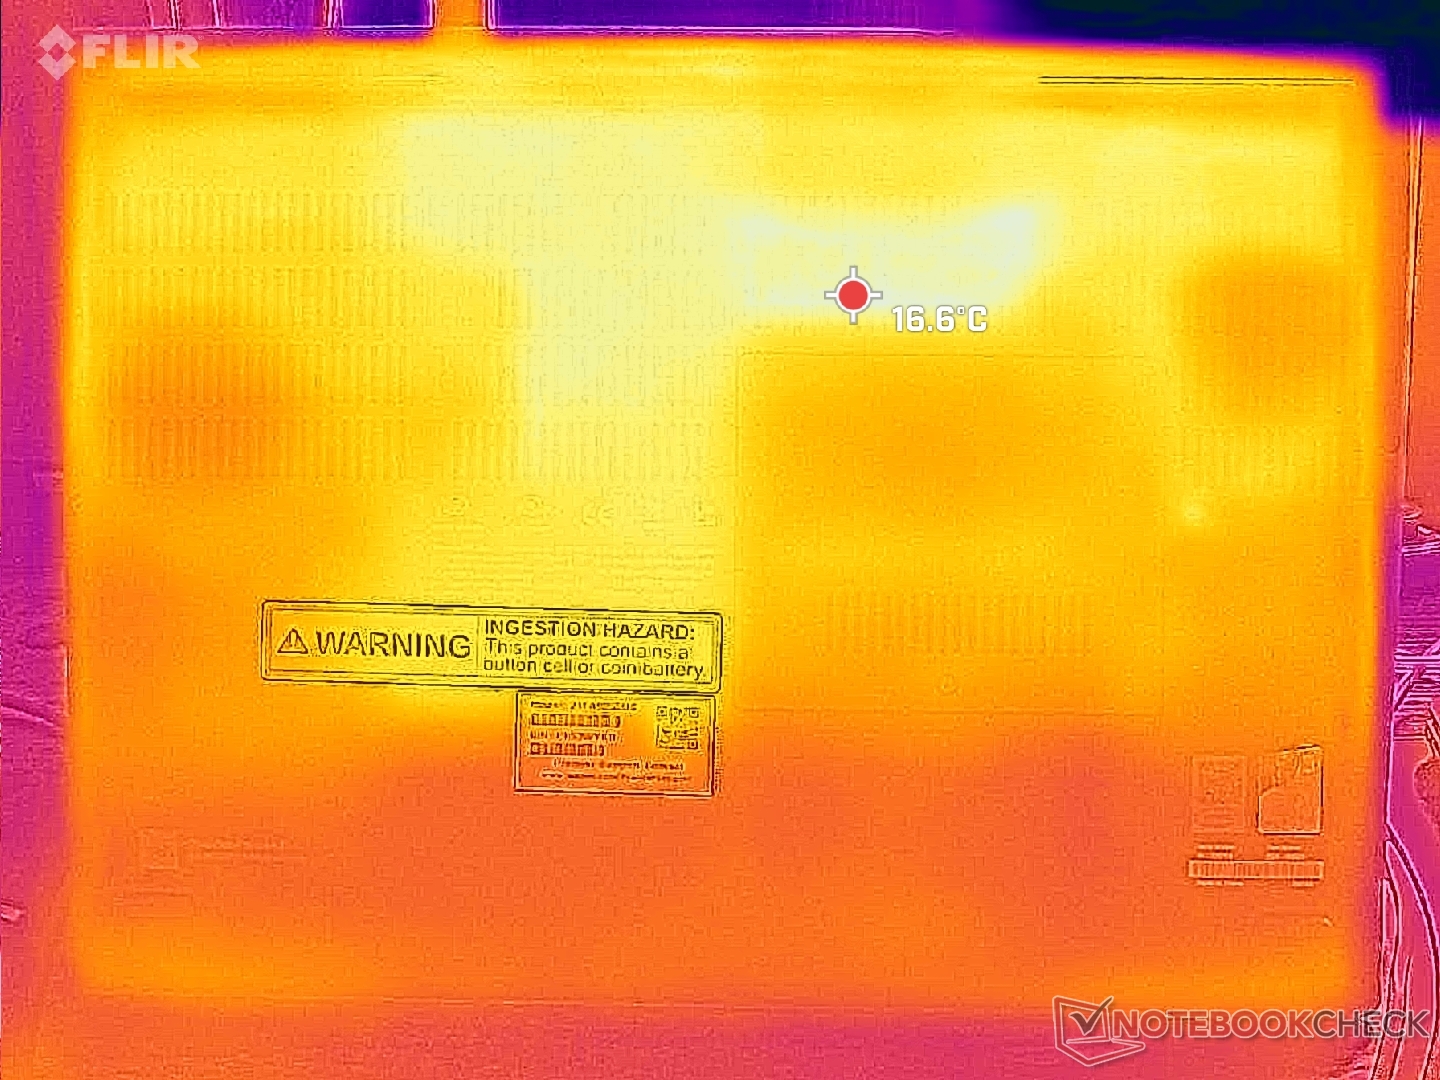
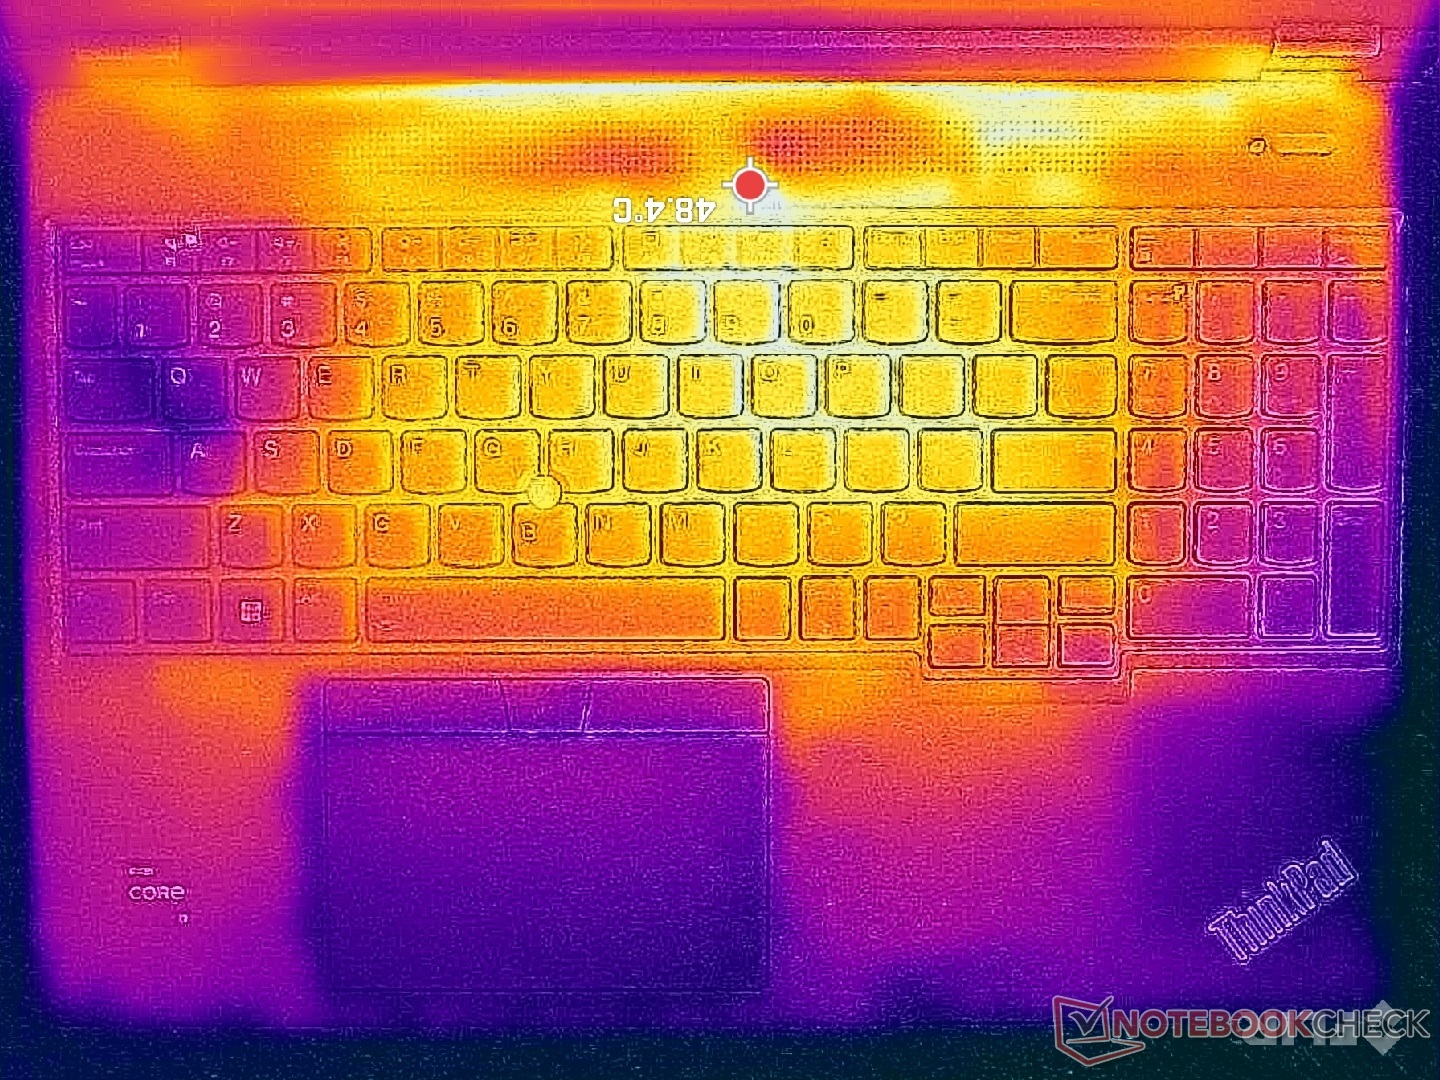
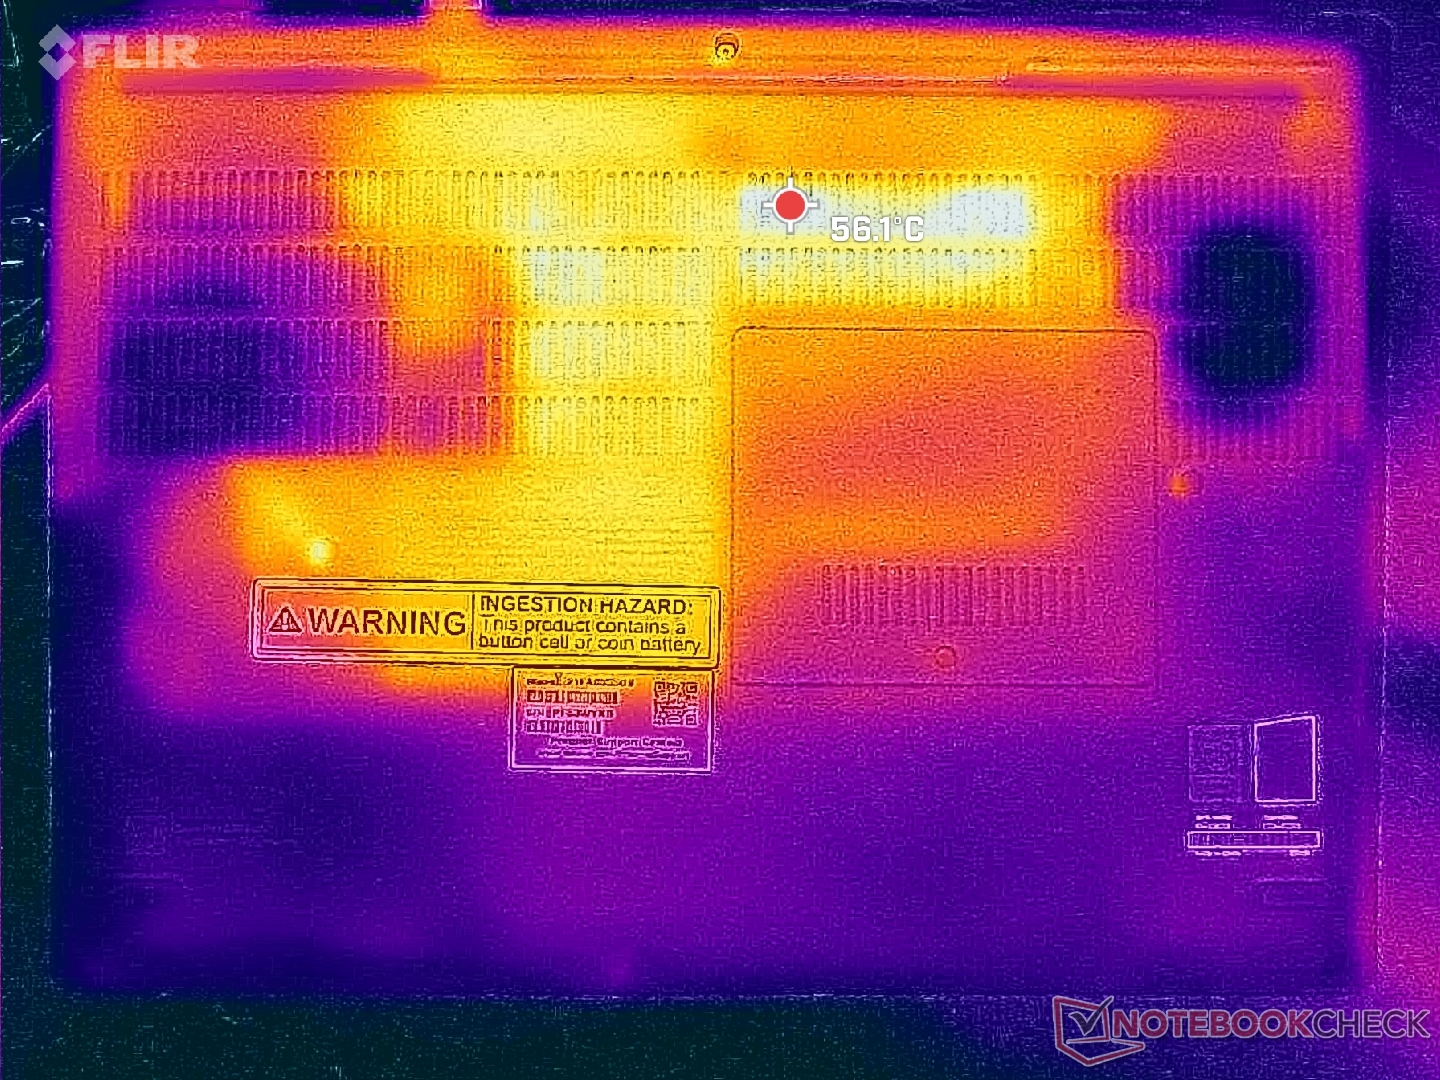
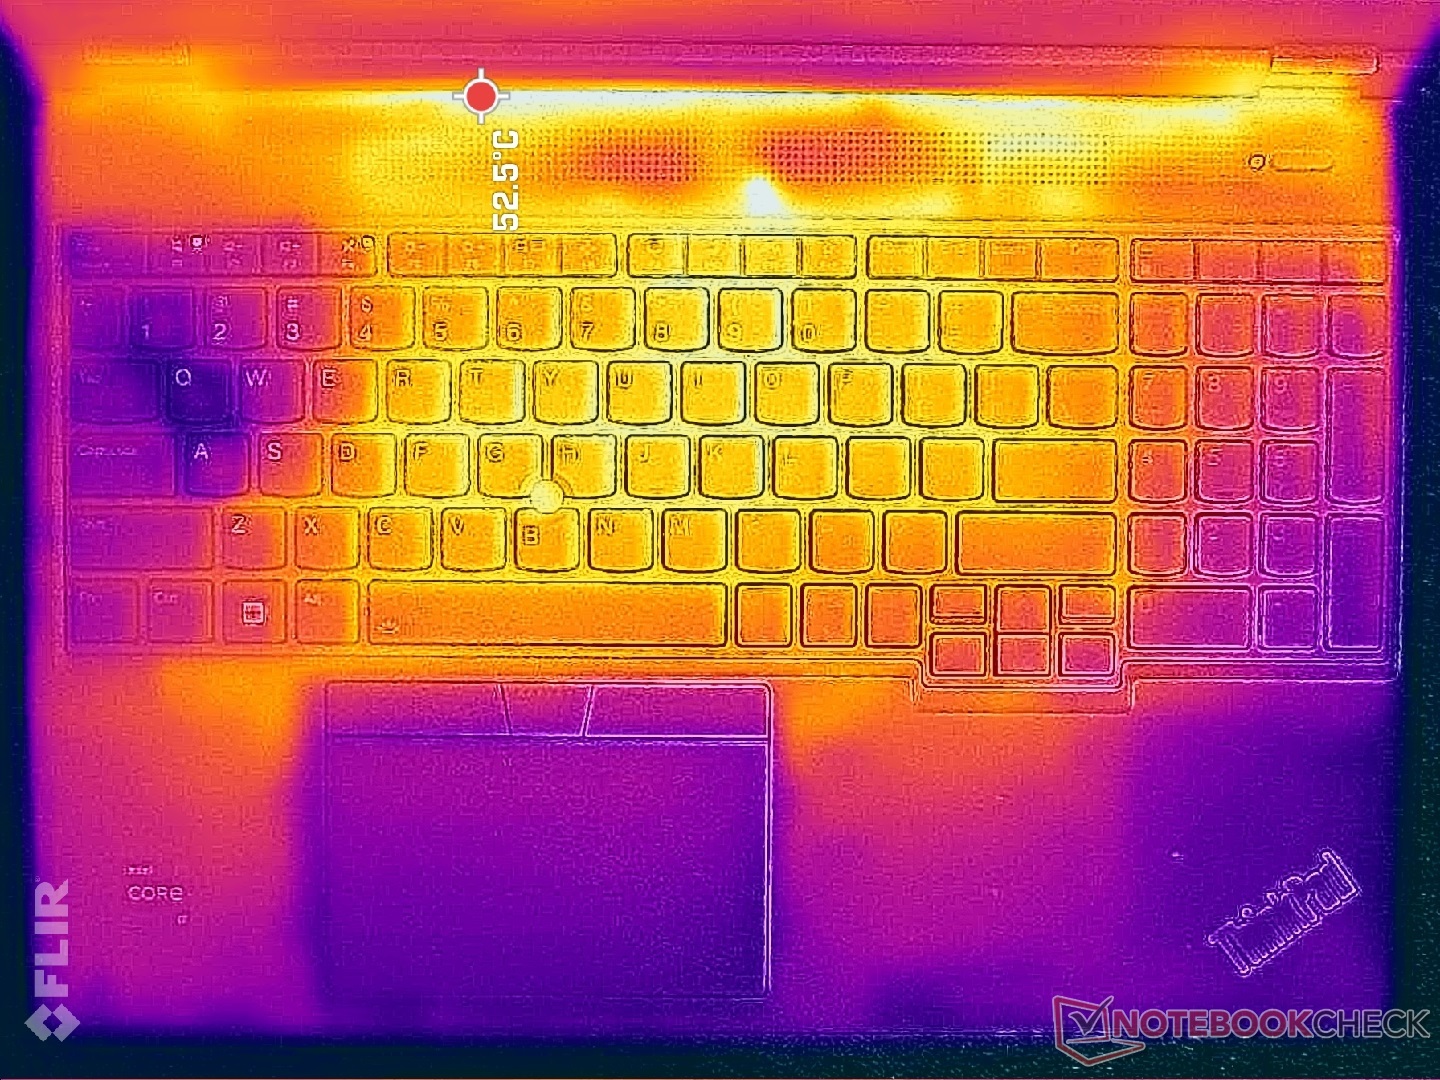
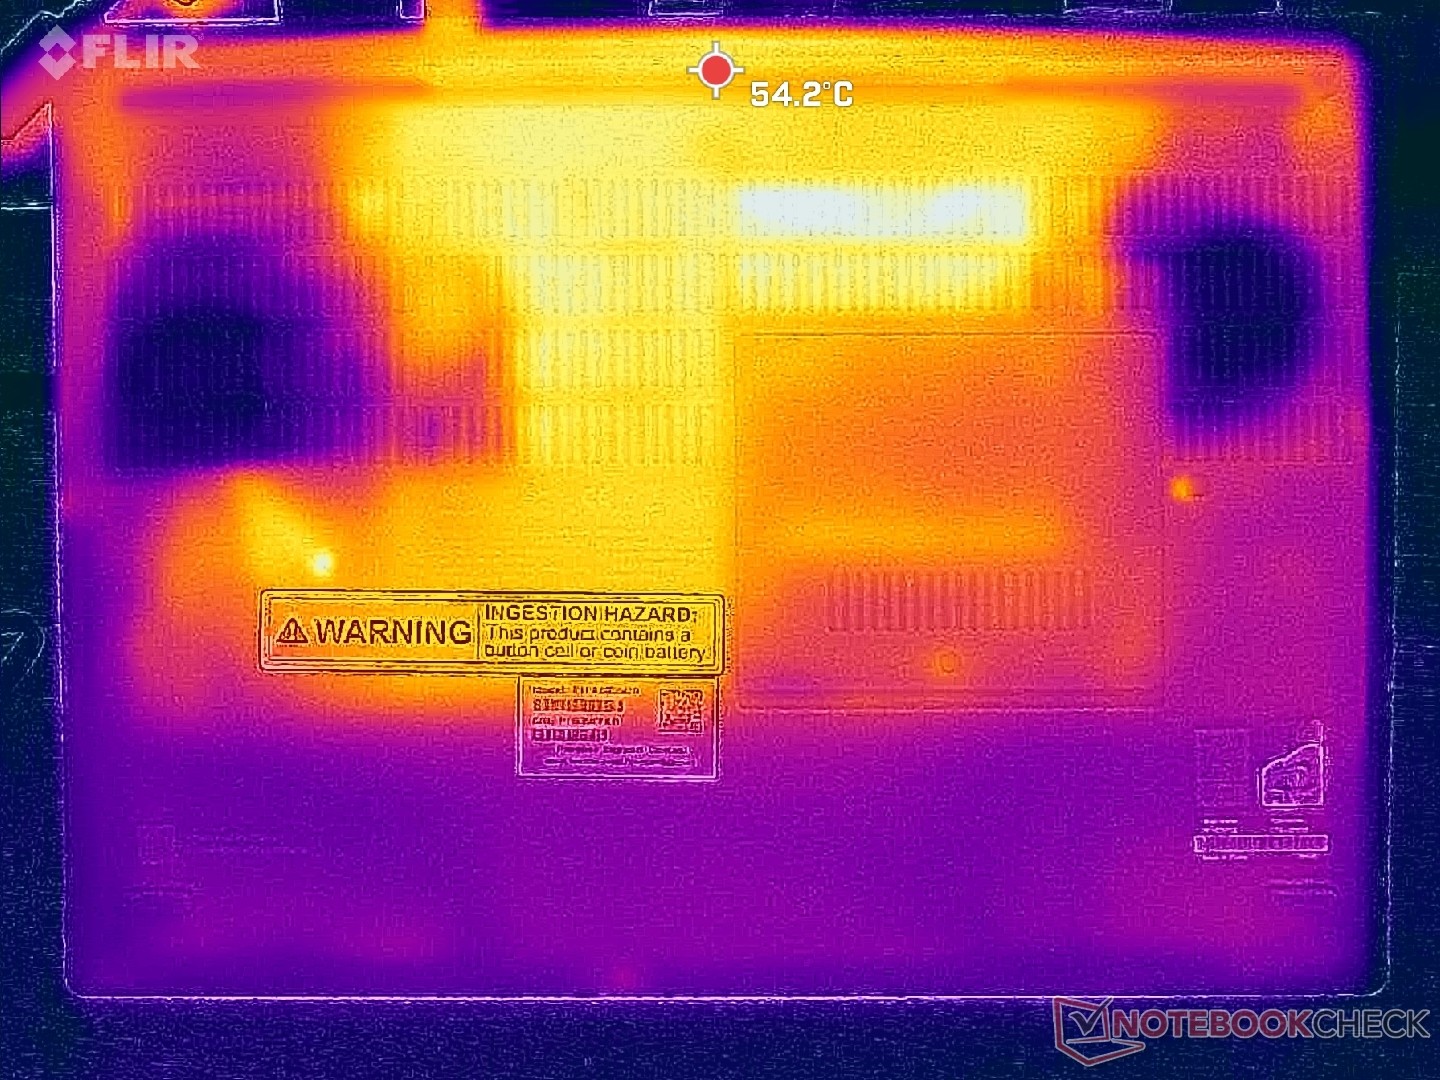
Daha zorlu 130 W RTX 4000 Ada GPU'muz nedeniyle yüzey sıcaklıklarının ilk ThinkPad P16 Gen 2 test ünitemizden daha yüksek olması bekleniyor, ancak fark beklenenden daha büyük. C ve D kapaklarındaki ortalama sıcaklık, zorlu yükleri çalıştırırken daha az donanımlı yapılandırmamızda yalnızca 32 C'ye kıyasla 43 C'ye ulaşabilir.
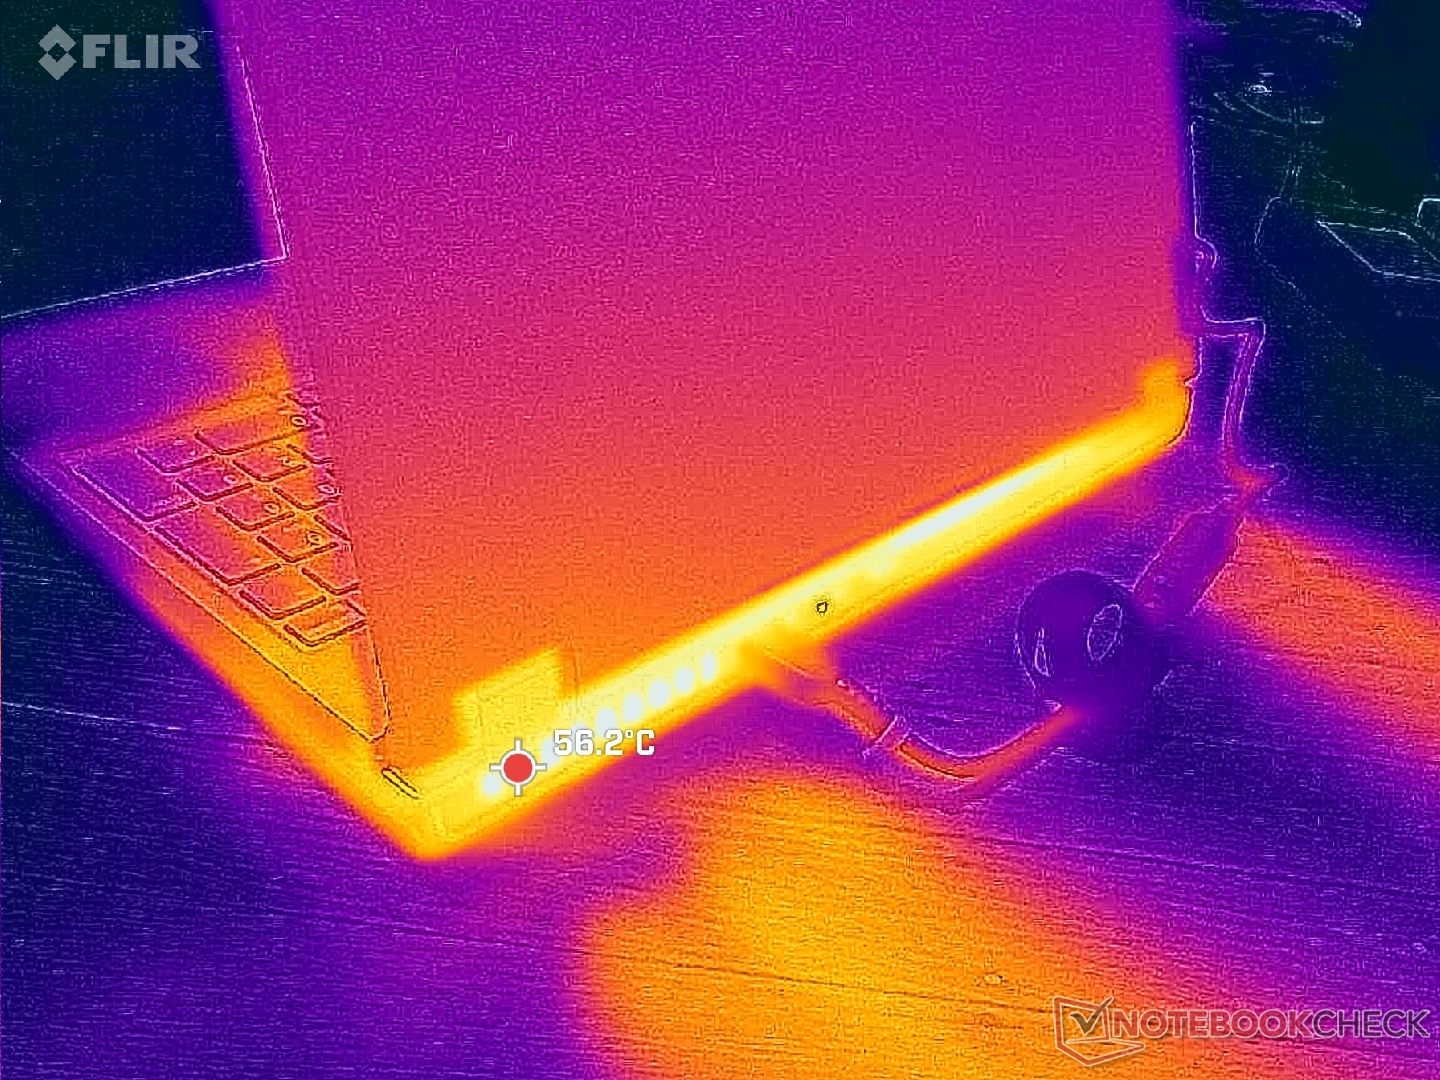
(-) Üst taraftaki maksimum sıcaklık, 38.2 °C / 101 F ortalamasına kıyasla 46.6 °C / 116 F'dir. , Workstation sınıfı için 22.2 ile 69.8 °C arasında değişir.
(-) Alt kısım, 41.2 °C / 106 F ortalamasına kıyasla maksimum 51 °C / 124 F'ye kadar ısınır
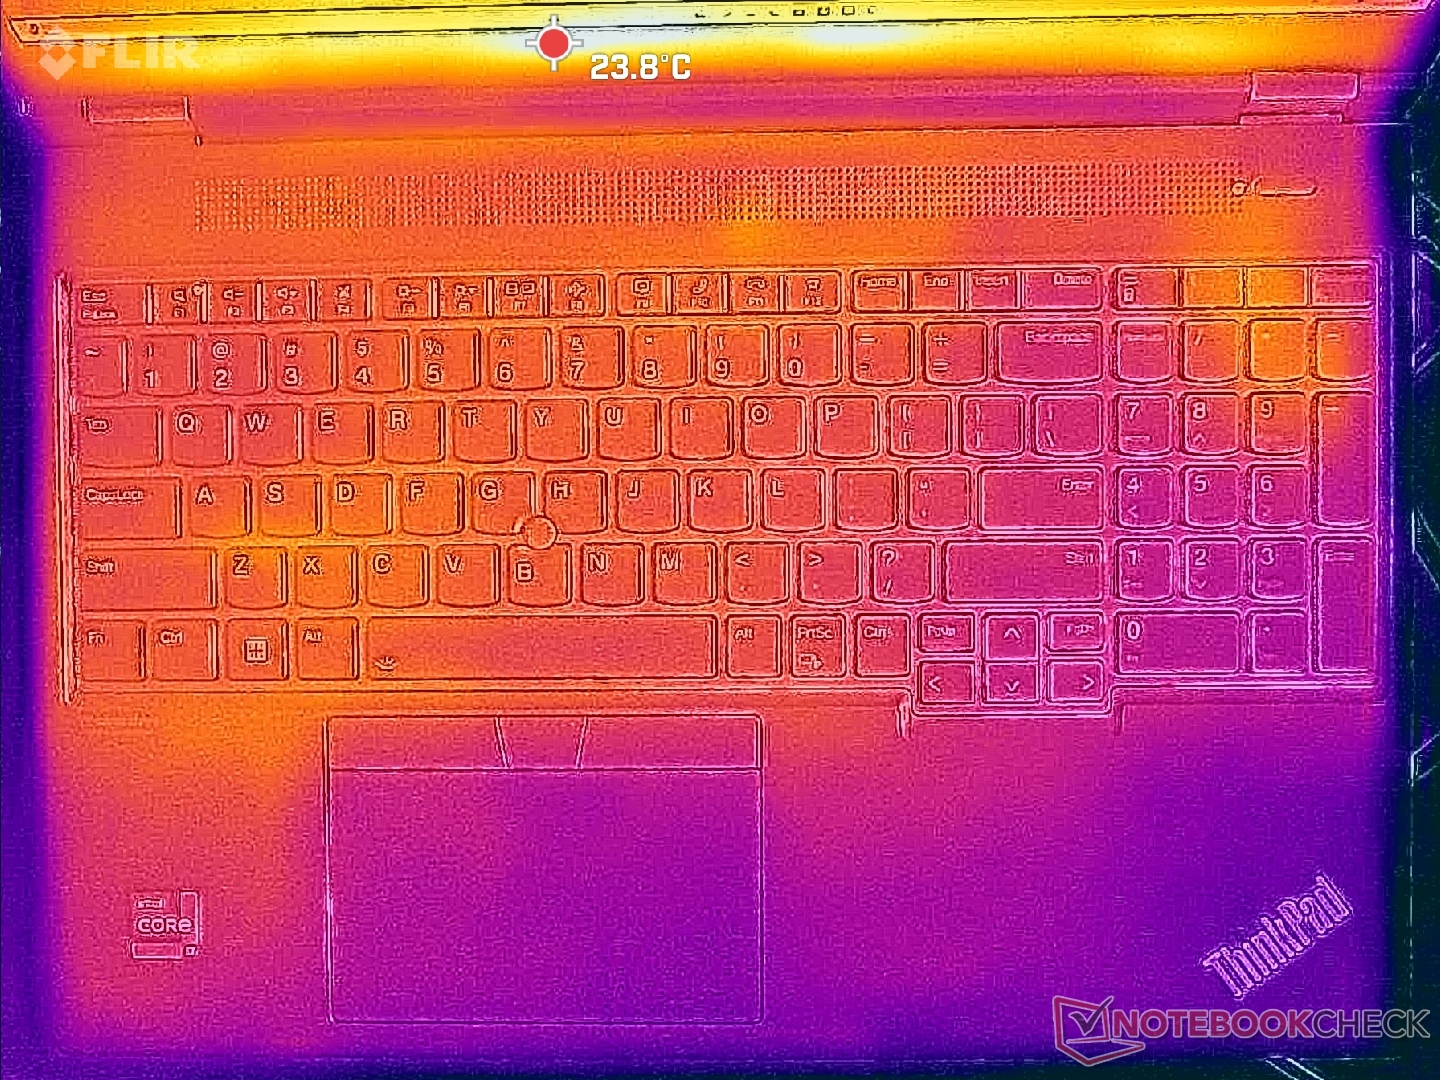
(+) Boşta kullanımda, üst tarafın ortalama sıcaklığı 23.9 °C / 75 F olup, cihazın 32 °C / 90 F.
(-) 3: The average temperature for the upper side is 39.6 °C / 103 F, compared to the average of 32 °C / 90 F for the class Workstation.
(+) Avuç içi dayanakları ve dokunmatik yüzey maksimum (35.6 °C / 96.1 F) cilt sıcaklığına ulaşıyor ve bu nedenle sıcak değil.
(-) Benzer cihazların avuç içi dayanağı alanının ortalama sıcaklığı 27.8 °C / 82 F (-7.8 °C / -14.1 F) idi.
| Lenovo ThinkPad P16 Gen 2 Intel Core i7-14700HX, NVIDIA RTX 4000 Ada Generation Laptop GPU | Lenovo ThinkPad P16 G2 21FA000FGE Intel Core i7-13700HX, NVIDIA RTX 2000 Ada Generation Laptop GPU | Lenovo ThinkPad P16s G2 21K9000CGE AMD Ryzen 7 PRO 7840U, AMD Radeon 780M | Lenovo ThinkPad P16 G1 RTX A5500 Intel Core i9-12950HX, NVIDIA RTX A5500 Laptop GPU | HP ZBook Power 16 G11 A AMD Ryzen 7 8845HS, NVIDIA RTX 2000 Ada Generation Laptop GPU | Dell Precision 5690 Intel Core Ultra 9 185H, Nvidia RTX 5000 Ada Generation Laptop GPU | |
|---|---|---|---|---|---|---|
| Heat | 3% | -2% | -17% | 6% | -3% | |
| Maximum Upper Side * | 46.6 | 47.2 -1% | 42.7 8% | 44.8 4% | 40.6 13% | 46.6 -0% |
| Maximum Bottom * | 51 | 39.5 23% | 47.2 7% | 49.8 2% | 40.6 20% | 33 35% |
| Idle Upper Side * | 24.8 | 28.1 -13% | 27.8 -12% | 30.6 -23% | 26 -5% | 32.4 -31% |
| Idle Bottom * | 25.6 | 25.3 1% | 28.4 -11% | 38.6 -51% | 26.6 -4% | 29.4 -15% |
* ... daha küçük daha iyidir
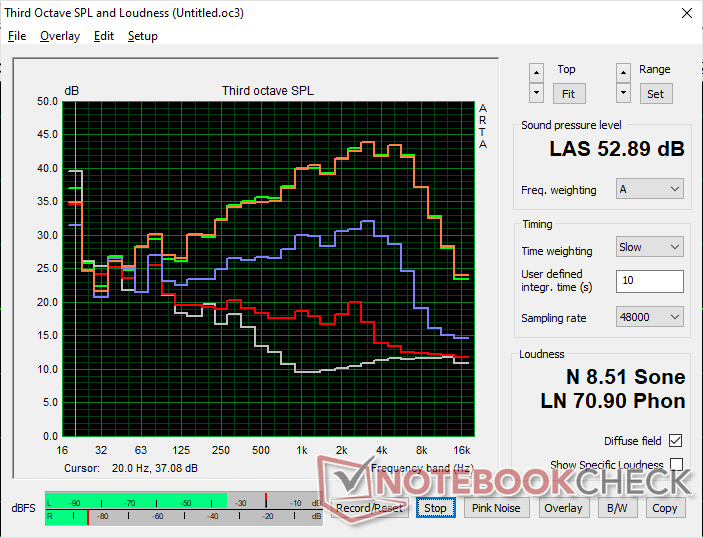
Konuşmacılar
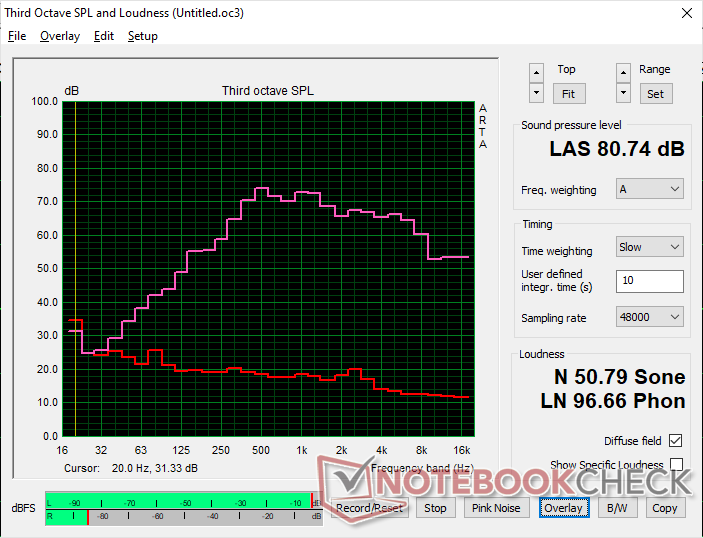
Lenovo ThinkPad P16 Gen 2 ses analizi
(±) | hoparlör ses yüksekliği ortalama ama iyi (80.7 dB)
Bas 100 - 315Hz
(±) | azaltılmış bas - ortalama olarak medyandan 10.8% daha düşük
(±) | Bas doğrusallığı ortalamadır (8% delta - önceki frekans)
Ortalar 400 - 2000 Hz
(±) | daha yüksek ortalar - ortalama olarak medyandan 5.4% daha yüksek
(+) | orta frekanslar doğrusaldır (6.2% deltadan önceki frekansa)
Yüksekler 2 - 16 kHz
(+) | dengeli yüksekler - medyandan yalnızca 3.3% uzakta
(+) | yüksekler doğrusaldır (5.5% deltadan önceki frekansa)
Toplam 100 - 16.000 Hz
(±) | Genel sesin doğrusallığı ortalamadır (15.6% ortancaya göre fark)
Aynı sınıfla karşılaştırıldığında
» Bu sınıftaki tüm test edilen cihazların %32%'si daha iyi, 10% benzer, 59% daha kötüydü
» En iyisinin deltası 7% idi, ortalama 18% idi, en kötüsü 35% idi
Test edilen tüm cihazlarla karşılaştırıldığında
» Test edilen tüm cihazların %21'si daha iyi, 4 benzer, % 74 daha kötüydü
» En iyisinin deltası 4% idi, ortalama 24% idi, en kötüsü 134% idi
Apple MacBook Pro 16 2021 M1 Pro ses analizi
(+) | hoparlörler nispeten yüksek sesle çalabilir (84.7 dB)
Bas 100 - 315Hz
(+) | iyi bas - medyandan yalnızca 3.8% uzakta
(+) | bas doğrusaldır (5.2% delta ile önceki frekans)
Ortalar 400 - 2000 Hz
(+) | dengeli ortalar - medyandan yalnızca 1.3% uzakta
(+) | orta frekanslar doğrusaldır (2.1% deltadan önceki frekansa)
Yüksekler 2 - 16 kHz
(+) | dengeli yüksekler - medyandan yalnızca 1.9% uzakta
(+) | yüksekler doğrusaldır (2.7% deltadan önceki frekansa)
Toplam 100 - 16.000 Hz
(+) | genel ses doğrusaldır (4.6% ortancaya göre fark)
Aynı sınıfla karşılaştırıldığında
» Bu sınıftaki tüm test edilen cihazların %0%'si daha iyi, 0% benzer, 100% daha kötüydü
» En iyisinin deltası 5% idi, ortalama 18% idi, en kötüsü 45% idi
Test edilen tüm cihazlarla karşılaştırıldığında
» Test edilen tüm cihazların %0'si daha iyi, 0 benzer, % 100 daha kötüydü
» En iyisinin deltası 4% idi, ortalama 24% idi, en kötüsü 134% idi
Enerji Yönetimi
Güç Tüketimi
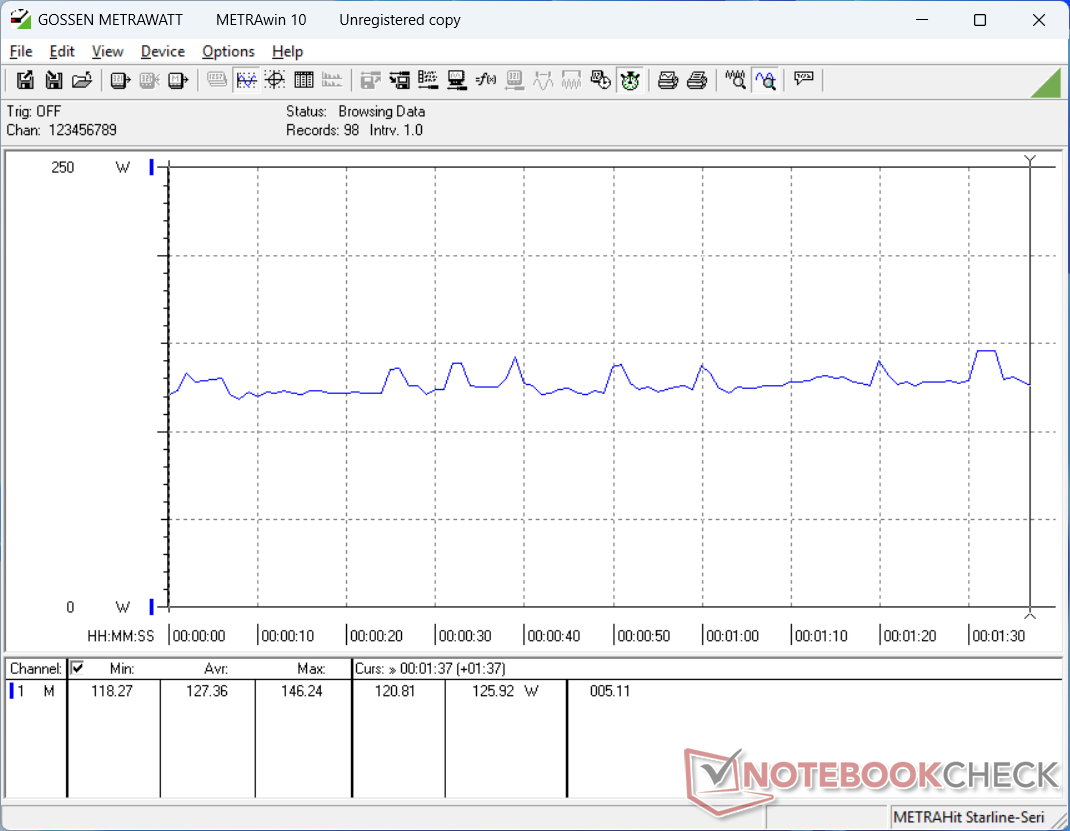
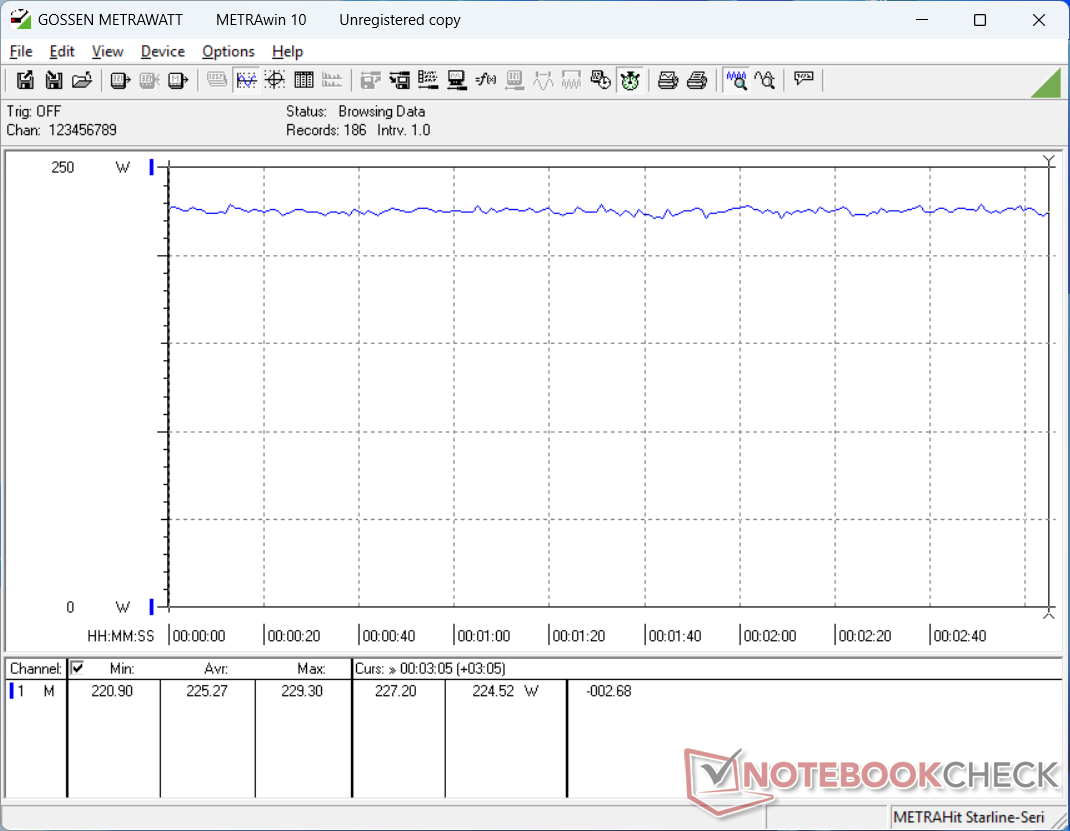
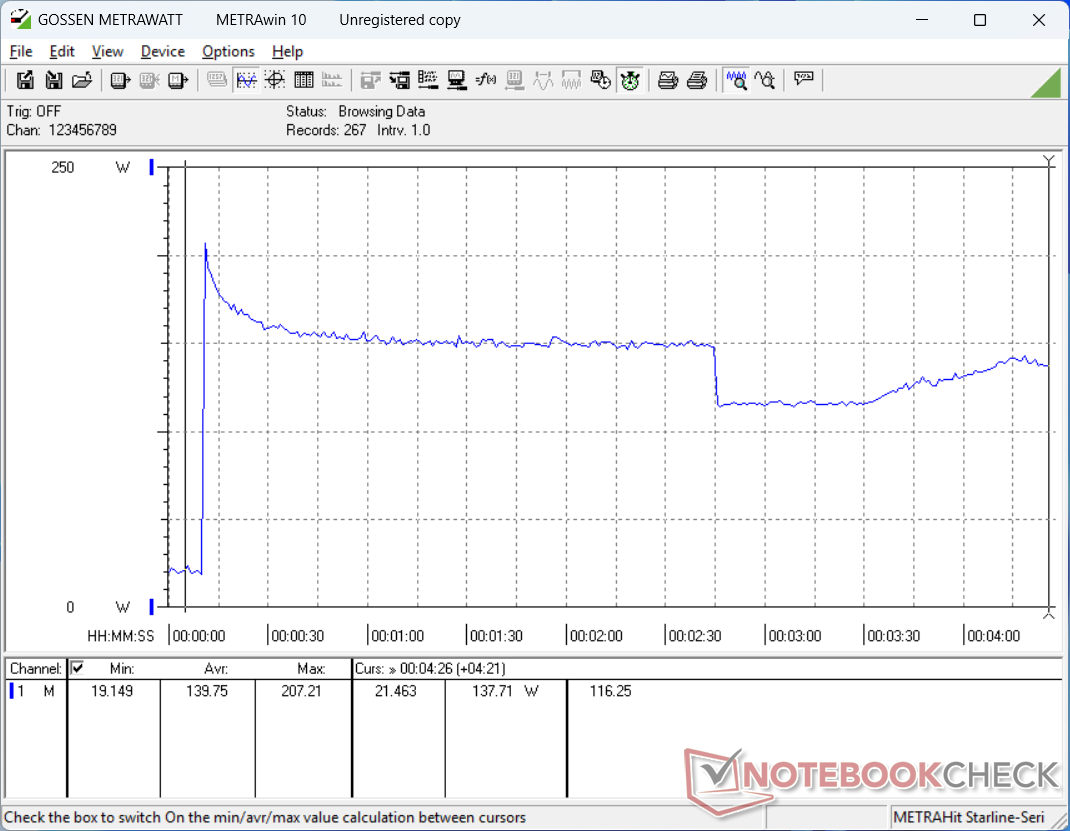
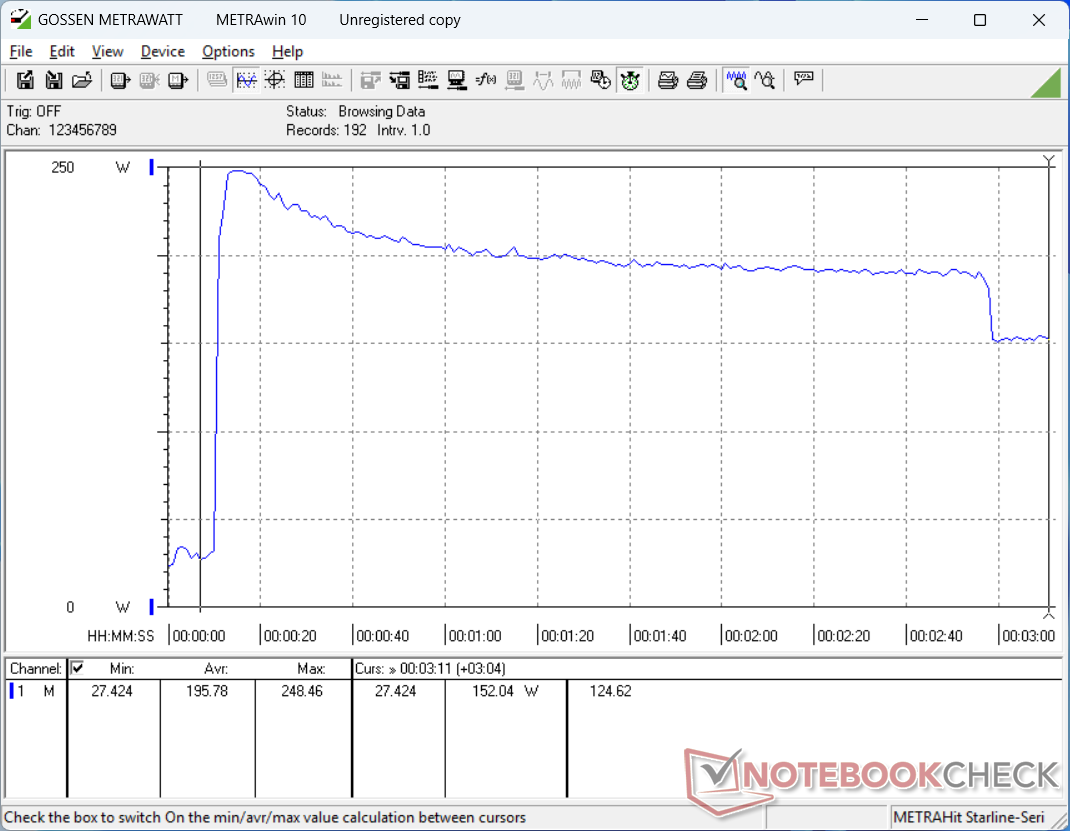
Masaüstünde rölantide çalışma, daha düşük donanımlı RTX 2000 yapılandırmasında yalnızca 16 W'a kıyasla 25 W'a kadar talep edebilir. Oyunlar gibi zorlu yükleri çalıştırırken, tüketimde yüzde 55'lik bir artış için delta 80 W'a kadar çıkabilir. RTX 4000 yapılandırmasından en iyi şekilde yararlanmak için daha yetenekli 230 W AC adaptörü kullandığınızdan emin olun.
| Kapalı / Bekleme modu | |
| Boşta | |
| Çalışırken |
|
Key:
min: | |
| Lenovo ThinkPad P16 Gen 2 i7-14700HX, NVIDIA RTX 4000 Ada Generation Laptop GPU, SK hynix PC801 HFS001TEJ9X162N, IPS, 2560x1600, 16" | Lenovo ThinkPad P16 G2 21FA000FGE i7-13700HX, NVIDIA RTX 2000 Ada Generation Laptop GPU, SK hynix PC801 HFS001TEJ9X162N, IPS LED, 2560x1600, 16" | Lenovo ThinkPad P16s G2 21K9000CGE R7 PRO 7840U, Radeon 780M, SK hynix PC801 HFS001TEJ9X162N, OLED, 3840x2400, 16" | Lenovo ThinkPad P16 G1 RTX A5500 i9-12950HX, RTX A5500 Laptop GPU, WDC PC SN810 2TB, IPS, 3840x2400, 16" | HP ZBook Power 16 G11 A R7 8845HS, NVIDIA RTX 2000 Ada Generation Laptop GPU, Samsung PM9A1 MZVL22T0HBLB, IPS, 2560x1600, 16" | Dell Precision 5690 Ultra 9 185H, NVIDIA RTX 5000 Ada Generation Laptop GPU, 2x Samsung PM9A1 1TB (RAID 0), OLED, 3840x2400, 16" | |
|---|---|---|---|---|---|---|
| Power Consumption | 7% | 55% | -27% | 47% | 8% | |
| Idle Minimum * | 7.9 | 9.3 -18% | 6.1 23% | 7.5 5% | 4.6 42% | 7.9 -0% |
| Idle Average * | 13.1 | 14.1 -8% | 6.5 50% | 20.1 -53% | 10 24% | 12 8% |
| Idle Maximum * | 24.2 | 15.5 36% | 7 71% | 40 -65% | 10.6 56% | 28.6 -18% |
| Load Average * | 127.4 | 133.6 -5% | 56.6 56% | 137 -8% | 60.9 52% | 98.8 22% |
| Cyberpunk 2077 ultra external monitor * | 219 | 92.8 58% | ||||
| Cyberpunk 2077 ultra * | 225 | 96.8 57% | ||||
| Load Maximum * | 248.5 | 179.6 28% | 68.3 73% | 285.9 -15% | 154.8 38% | 174.8 30% |
| Witcher 3 ultra * | 144.9 | 61.2 | 208 | 144.5 |
* ... daha küçük daha iyidir
Power Consumption Cyberpunk / Stress Test
Power Consumption external Monitor
Pil Ömrü
Çalışma süreleri, Dengeli moda ve 150 nit parlaklığa ayarlandığında bile daha düşük ThinkPad P16 Gen 2 yapılandırmasında kaydettiğimizden yarıdan fazla daha düşük. Aradaki fark çoğunlukla RTX 4000 Ada ünitemizde Advanced Optimus desteğinin olmamasına ve bu nedenle ayrı GPU'nun hiçbir zaman tam olarak devre dışı bırakılmamasına bağlanabilir.
Lenovo Quick Charge etkin olsa bile boştan tam kapasiteye şarj etmek yaklaşık 130 dakika sürüyor.
| Lenovo ThinkPad P16 Gen 2 i7-14700HX, NVIDIA RTX 4000 Ada Generation Laptop GPU, 94 Wh | Lenovo ThinkPad P16 G2 21FA000FGE i7-13700HX, NVIDIA RTX 2000 Ada Generation Laptop GPU, 94 Wh | Lenovo ThinkPad P16s G2 21K9000CGE R7 PRO 7840U, Radeon 780M, 84 Wh | Lenovo ThinkPad P16 G1 RTX A5500 i9-12950HX, RTX A5500 Laptop GPU, 94 Wh | HP ZBook Power 16 G11 A R7 8845HS, NVIDIA RTX 2000 Ada Generation Laptop GPU, 83 Wh | Dell Precision 5690 Ultra 9 185H, NVIDIA RTX 5000 Ada Generation Laptop GPU, 98 Wh | |
|---|---|---|---|---|---|---|
| Pil Çalışma Süresi | 248% | 329% | 136% | 293% | 271% | |
| WiFi v1.3 | 148 | 515 248% | 635 329% | 350 136% | 582 293% | 549 271% |
| H.264 | 797 | |||||
| Load | 92 | 103 | ||||
| Reader / Idle | 1566 |
Notebookcheck Rating
Lenovo ThinkPad P16 Gen 2
- 10/25/2024 v8
Allen Ngo
 Total Sustainability Score:
Lenovo ThinkPad P16 Gen 2
- 10/25/2024 v8
Allen Ngo
Total Sustainability Score: Şeffaflık
İncelenecek cihazların seçimi editör ekibimiz tarafından yapılır. Test örneği, bu incelemenin amacı doğrultusunda üretici veya perakendeci tarafından yazara ödünç olarak sağlanmıştır. Borç verenin bu inceleme üzerinde herhangi bir etkisi olmadığı gibi, üretici de yayınlanmadan önce bu incelemenin bir kopyasını almamıştır. Bu incelemeyi yayınlama zorunluluğu yoktu. İncelemelerimiz karşılığında asla tazminat veya ödeme kabul etmiyoruz. Bağımsız bir medya şirketi olarak Notebookcheck, üreticilerin, perakendecilerin veya yayıncıların otoritesine tabi değildir.
Notebookcheck bu şekilde test yapıyor
Notebookcheck, tüm sonuçların karşılaştırılabilir olmasını sağlamak için her yıl yüzlerce dizüstü bilgisayarı ve akıllı telefonu standart prosedürler kullanarak bağımsız olarak inceliyor. Yaklaşık 20 yıldır test yöntemlerimizi sürekli olarak geliştirdik ve bu süreçte endüstri standartlarını belirledik. Test laboratuvarlarımızda deneyimli teknisyenler ve editörler tarafından yüksek kaliteli ölçüm ekipmanları kullanılmaktadır. Bu testler çok aşamalı bir doğrulama sürecini içerir. Karmaşık derecelendirme sistemimiz, nesnelliği koruyan yüzlerce sağlam temellere dayanan ölçüm ve kıyaslamaya dayanmaktadır.
